UNITED STATES
SECURITIES AND EXCHANGE COMMISSION
Washington, D.C. 20549
FORM N-CSR
CERTIFIED SHAREHOLDER REPORT OF REGISTERED MANAGEMENT
INVESTMENT COMPANIES
Investment Company Act file number: 811-08629
HARTFORD SERIES FUND, INC.
(Exact name of registrant as specified in charter)
5 Radnor Corporate Center, Suite 300, 100 Matsonford Road, Radnor, Pennsylvania 19087
(Address of Principal Executive Offices) (Zip Code)
Edward P. Macdonald, Esquire
Hartford Funds Management Company, LLC
5 Radnor Corporate Center, Suite 300
100 Matsonford Road
Radnor, Pennsylvania 19087
(Name and Address of Agent for Service)
Registrant’s telephone number, including area code: (610) 386-4068
Date of fiscal year end: December 31
Date of reporting period: December 31, 2013
Form N-CSR is to be used by management investment companies to file reports with the Commission not later than 10 days after the transmission to stockholders of any report that is required to be transmitted to stockholders under Rule 30e-1 under the Investment Company Act of 1940 (17 CFR 270.30e-1). The Commission may use the information provided on Form N-CSR in its regulatory, disclosure review, inspection, and policymaking roles.
A registrant is required to disclose the information specified by Form N-CSR, and the Commission will make this information public. A registrant is not required to respond to the collection of information contained in Form N-CSR unless the Form displays a currently valid Office of Management and Budget ("OMB") control number. Please direct comments concerning the accuracy of the information collection burden estimate and any suggestions for reducing the burden to Secretary, Securities and Exchange Commission, 100 F. Street, NE, Washington, DC 20549. The OMB has reviewed this collection of information under the clearance requirements of 44 U.S.C. § 3507.
Item 1. Reports to Stockholders.
HARTFORDFUNDS
 | HARTFORD SERIES FUND, INC.
2013 Annual Report
|

A MESSAGE FROM THE PRESIDENT
Dear Fellow Shareholders:
Thank you for investing in Hartford HLS Funds.
Market Review
U.S. equities (as represented by the S&P 500 Index) generated their strongest year since 1997 in 2013, rising 32.39% for the year. During the fourth quarter, equities rose without looking back, pushing the S&P 500 Index and the Dow Jones Industrial Average to new all-time highs. Despite previously cheering delays to quantitative-easing tapering, the stock market received an additional boost at the end of the year following the U.S. Federal Reserve’s (Fed) announcement of a $10-billion-a-month reduction in bond purchases beginning in January.
The Fed’s decision to begin tapering its bond purchases is generally considered a vote of confidence in the recovering U.S. economy. Consumer spending has stabilized, the housing market is showing steady improvement, the unemployment rate is slowly declining and economic growth clocked in at a healthy 4.1% in the third quarter. Equities have also recovered since the market low in March 2009: The S&P 500 Index has gained 173% from the market low through December 31, 2013.
Signs of improvement are also visible outside the U.S. Europe appears to have begun its own economic recovery, and emerging markets have reversed their recent lackluster performance. Fiscal policy continues to wield significant influence in today’s economy and central banks across the globe are maintaining their accommodative stances, including the appointment of Janet Yellen, who is widely expected to continue current monetary policies, to succeed Ben Bernanke as U.S. Federal Reserve chairman.
It’s important to stay abreast of domestic and international economic developments while balancing your individual investment goals. Meeting with your financial advisor on a regular basis to examine your current investment strategy can help you determine whether you are on the right track:
| • | Is your portfolio fully diversified with an appropriate mix of stocks and bonds? |
| • | Is your portfolio incorporating both domestic and international holdings to take advantage of the global economic recovery? |
| • | Are your investments still in line with your risk tolerance and investment time horizon? |
Your financial advisor can help you choose options within our fund family to navigate today’s markets with confidence.
Thank you again for investing with Hartford HLS Funds.

James Davey
President
Hartford HLS Funds
1The S&P 500 Index is a market capitalization-weighted price index composed of 500 widely held common stocks.
2The Dow Jones Industrial Average is an unmanaged, price-weighted index of 30 of the largest, most widely held stocks traded on the New York Stock Exchange.
Table of Contents
This report is prepared for the general information of contract owners and is not an offer of contracts. It should not be used in connection with any offer, except in conjunction with the appropriate product prospectus which contains all pertinent product information including the applicable sales, administrative and other charges.
| American Funds Asset Allocation HLS Fund inception 4/30/2008 | |
| (advised by Hartford Funds Management Company, LLC) | |
| Investment Goal: Seeks high total return (including income and capital gains) consistent with preservation of capital over the long term. | |
Performance Overview 4/30/08 - 12/31/13

The chart above represents the hypothetical growth of a $10,000 investment in Class 1B.
| Average Annual Total Returns (as of 12/31/13) |
| 1 Year | 5 Years | Since Inception▲ | ||||||||||
| American Funds Asset Allocation HLS Fund IB | 23.40 | % | 14.88 | % | 6.94 | % | ||||||
| Barclays U.S. Aggregate Bond Index | -2.02 | % | 4.44 | % | 4.49 | % | ||||||
| S&P 500 Index | 32.39 | % | 17.94 | % | 7.59 | % | ||||||
| ▲ | Inception: 04/30/2008 |
PERFORMANCE DATA QUOTED REPRESENTS PAST PERFORMANCE AND DOES NOT GUARANTEE FUTURE RESULTS. The investment return and principal value of the investment will fluctuate so that investors’ shares, when redeemed, may be worth more or less than their original cost. Current performance may be lower or higher than the performance data quoted. To obtain performance data current to the most recent month-end, please visit our website at www.hartfordfunds.com.
Total returns presented above were calculated using the Fund’s net asset value available to shareholders for sale or redemption of Fund shares on December 31, 2013, which may exclude investment transactions as of this date. All share class returns assume the reinvestment of all distributions at net asset value and the deduction of all fund expenses.
Barclays U.S. Aggregate Bond Index represents the U.S. investment-grade fixed-rate bond market. This index is unmanaged, and its results include reinvested dividends and/or distributions, but do not reflect the effect of sales charges, commissions, expenses or taxes.
S&P 500 Index is a market capitalization-weighted price index composed of 500 widely held common stocks.
You cannot invest directly in an index.
As of the Fund's current prospectus dated May 1, 2013, the net total annual operating expense ratio for Class IB shares was 0.86% and the gross total annual operating expense ratio for Class IB shares was 1.26%. Actual expenses may be higher. Please see the accompanying Financial Highlights for expense ratios for the year ended December 31, 2013.
Net operating expenses are the expenses paid to own the Fund. If the net operating expenses shown are lower than the gross operating expenses, then the net operating expenses reflect contractual fee waivers and expense reimbursements that may not be renewed. Contractual waivers or reimbursements remain in effect for as long as the Fund is a part of a master-feeder fund structure unless terminated or changed by the Fund or its Board of Directors if the fund structure changes. For more information about the fee arrangement and expiration dates, please see the expense table in the prospectus.
Gross operating expenses shown are before management fee waivers or expense caps. Performance information may reflect historical or current expense waivers or reimbursements, without which, performance would have been lower. For more information on fee waivers and/or expense reimbursements, please see the expense table in the prospectus.
The chart and table do not reflect the deductions of taxes, sales charges or other fees which may be applied at the variable life insurance, variable annuity or qualified retirement plan product level. Any such additional sales charges or other fees or expenses would lower the contract’s or plan’s performance.
All investments are subject to risk including the possible loss of principal. For a discussion of the Fund’s risks, please see the Main Risks section of this report. For more detailed information on the risks associated with an investment in the Fund, please see the prospectus.
How did the Fund perform?
The Class IB shares of the American Funds Asset Allocation HLS Fund returned 23.40% for the twelve-month period ended December 31, 2013, versus the returns of 32.39% for the S&P 500 Index and -2.02% for the Barclays U.S. Aggregate Bond Index. The Fund outperformed the 19.17% average return of the Variable Products-Underlying Funds Lipper Mixed-Asset Target Allocation Growth Funds peer group, a group of funds with investment strategies similar to those of the Fund.
The performance of the American Funds Asset Allocation HLS Fund is directly related to the performance of the American Funds Insurance Series – Asset Allocation Fund Class 1, in which the Fund invests. The financial statements of the American Funds Insurance Series – Asset Allocation Fund Class 1, including the Schedule of Investments, are provided in the accompanying report and should be read in conjunction with the American Funds Asset Allocation HLS Fund’s financial statements.
| 2 |
| American Funds Blue Chip Income and Growth HLS Fund inception 4/30/2008 | |
| (advised by Hartford Funds Management Company, LLC) | |
| Investment Goal: Seeks to produce income exceeding the average yield on U.S. stocks generally and to provide an opportunity for growth of principal consistent with sound common stock investing. | |
Performance Overview 4/30/08 - 12/31/13

The chart above represents the hypothetical growth of a $10,000 investment in Class 1B.
| Average Annual Total Returns (as of 12/31/13) |
| 1 Year | 5 Years | Since Inception▲ | ||||||||||
| American Funds Blue Chip Income and Growth HLS Fund IB | 32.55 | % | 16.24 | % | 6.50 | % | ||||||
| S&P 500 Index | 32.39 | % | 17.94 | % | 7.59 | % | ||||||
| ▲ | Inception: 04/30/2008 |
PERFORMANCE DATA QUOTED REPRESENTS PAST PERFORMANCE AND DOES NOT GUARANTEE FUTURE RESULTS. The investment return and principal value of the investment will fluctuate so that investors’ shares, when redeemed, may be worth more or less than their original cost. Current performance may be lower or higher than the performance data quoted. To obtain performance data current to the most recent month-end, please visit our website at www.hartfordfunds.com.
Total returns presented above were calculated using the Fund’s net asset value available to shareholders for sale or redemption of Fund shares on December 31, 2013, which may exclude investment transactions as of this date. All share class returns assume the reinvestment of all distributions at net asset value and the deduction of all fund expenses.
S&P 500 Index is a market capitalization-weighted price index composed of 500 widely held common stocks.
You cannot invest directly in an index.
As of the Fund's current prospectus dated May 1, 2013, the net total annual operating expense ratio for Class IB shares was 1.00% and the gross total annual operating expense ratio for Class IB shares was 1.50%. Actual expenses may be higher. Please see the accompanying Financial Highlights for expense ratios for the year ended December 31, 2013.
Net operating expenses are the expenses paid to own the Fund. If the net operating expenses shown are lower than the gross operating expenses, then the net operating expenses reflect contractual fee waivers and expense reimbursements that may not be renewed. Contractual waivers or reimbursements remain in effect for as long as the Fund is a part of a master-feeder fund structure unless terminated or changed by the Fund or its Board of Directors if the fund structure changes. For more information about the fee arrangement and expiration dates, please see the expense table in the prospectus.
Gross operating expenses shown are before management fee waivers or expense caps. Performance information may reflect historical or current expense waivers or reimbursements, without which, performance would have been lower. For more information on fee waivers and/or expense reimbursements, please see the expense table in the prospectus.
The chart and table do not reflect the deductions of taxes, sales charges or other fees which may be applied at the variable life insurance, variable annuity or qualified retirement plan product level. Any such additional sales charges or other fees or expenses would lower the contract’s or plan’s performance.
All investments are subject to risk including the possible loss of principal. For a discussion of the Fund’s risks, please see the Main Risks section of this report. For more detailed information on the risks associated with an investment in the Fund, please see the prospectus.
How did the Fund perform?
The Class IB shares of the American Funds Blue Chip Income and Growth HLS Fund returned 32.55% for the twelve-month period ended December 31, 2013, versus the return of 32.39% for the S&P 500 Index. The Fund outperformed the 31.34% average return of the Variable Products-Underlying Funds Lipper Large-Cap Core Funds peer group, a group of funds with investment strategies similar to those of the Fund.
The performance of the American Funds Blue Chip Income and Growth HLS Fund is directly related to the performance of the American Funds Insurance Series – Blue Chip Income and Growth Fund Class 1, in which the Fund invests. The financial statements of the American Funds Insurance Series – Blue Chip Income and Growth Fund Class 1, including the Schedule of Investments, are provided in the accompanying report and should be read in conjunction with the American Funds Blue Chip Income and Growth HLS Fund’s financial statements.
| 3 |
| American Funds Bond HLS Fund inception 4/30/2008 | |
| (advised by Hartford Funds Management Company, LLC) | |
| Investment Goal: Seeks to maximize current income and preservation of capital. | |
Performance Overview 4/30/08 - 12/31/13

The chart above represents the hypothetical growth of a $10,000 investment in Class 1B.
| Average Annual Total Returns (as of 12/31/13) |
| 1 Year | 5 Years | Since Inception▲ | ||||||||||
| American Funds Bond HLS Fund IB | -2.37 | % | 5.27 | % | 2.66 | % | ||||||
| Barclays U.S. Aggregate Bond Index | -2.02 | % | 4.44 | % | 4.49 | % | ||||||
| ▲ | Inception: 04/30/2008 |
PERFORMANCE DATA QUOTED REPRESENTS PAST PERFORMANCE AND DOES NOT GUARANTEE FUTURE RESULTS. The investment return and principal value of the investment will fluctuate so that investors’ shares, when redeemed, may be worth more or less than their original cost. Current performance may be lower or higher than the performance data quoted. To obtain performance data current to the most recent month-end, please visit our website at www.hartfordfunds.com.
Total returns presented above were calculated using the Fund’s net asset value available to shareholders for sale or redemption of Fund shares on December 31, 2013, which may exclude investment transactions as of this date. All share class returns assume the reinvestment of all distributions at net asset value and the deduction of all fund expenses.
Barclays U.S. Aggregate Bond Index represents the U.S. investment-grade fixed-rate bond market. This index is unmanaged, and its results include reinvested dividends and/or distributions, but do not reflect the effect of sales charges, commissions, expenses or taxes.
You cannot invest directly in an index.
As of the Fund's current prospectus dated May 1, 2013, the net total annual operating expense ratio for Class IB shares was 0.93% and the gross total annual operating expense ratio for Class IB shares was 1.18%. Actual expenses may be higher. Please see the accompanying Financial Highlights for expense ratios for the year ended December 31, 2013.
Net operating expenses are the expenses paid to own the Fund. If the net operating expenses shown are lower than the gross operating expenses, then the net operating expenses reflect contractual fee waivers and expense reimbursements that may not be renewed. Contractual waivers or reimbursements remain in effect for as long as the Fund is a part of a master-feeder fund structure unless terminated or changed by the Fund or its Board of Directors if the fund structure changes. For more information about the fee arrangement and expiration dates, please see the expense table in the prospectus.
Gross operating expenses shown are before management fee waivers or expense caps. Performance information may reflect historical or current expense waivers or reimbursements, without which, performance would have been lower. For more information on fee waivers and/or expense reimbursements, please see the expense table in the prospectus.
The chart and table do not reflect the deductions of taxes, sales charges or other fees which may be applied at the variable life insurance, variable annuity or qualified retirement plan product level. Any such additional sales charges or other fees or expenses would lower the contract’s or plan’s performance.
All investments are subject to risk including the possible loss of principal. For a discussion of the Fund’s risks, please see the Main Risks section of this report. For more detailed information on the risks associated with an investment in the Fund, please see the prospectus.
How did the Fund perform?
The Class IB shares of the American Funds Bond HLS Fund returned -2.37% for the twelve-month period ended December 31, 2013, versus the return of -2.02% for the Barclays U.S. Aggregate Bond Index. The Fund underperformed the -1.87% average return of the Variable Products-Underlying Funds Lipper Intermediate Investment Grade Debt Funds peer group, a group of funds with investment strategies similar to those of the Fund.
The performance of the American Funds Bond HLS Fund is directly related to the performance of the American Funds Insurance Series – Bond Fund Class 1, in which the Fund invests. The financial statements of the American Funds Insurance Series – Bond Fund Class 1, including the Schedule of Investments, are provided in the accompanying report and should be read in conjunction with the American Funds Bond HLS Fund’s financial statements.
| 4 |
American Funds Global Bond HLS Fund inception 4/30/2008
(advised by Hartford Funds Management Company, LLC)
| Investment Goal: Seeks a high level of total return over the long term. |
Performance Overview 4/30/08 - 12/31/13

The chart above represents the hypothetical growth of a $10,000 investment in Class 1B.
| Average Annual Total Returns (as of 12/31/13) |
| 1 Year | 5 Years | Since Inception▲ | ||||||||||
| American Funds Global Bond HLS Fund IB | -3.03 | % | 4.19 | % | 3.41 | % | ||||||
| Barclays Global Aggregate Index | -2.60 | % | 3.91 | % | 3.47 | % | ||||||
| ▲ | Inception: 04/30/2008 |
PERFORMANCE DATA QUOTED REPRESENTS PAST PERFORMANCE AND DOES NOT GUARANTEE FUTURE RESULTS. The investment return and principal value of the investment will fluctuate so that investors’ shares, when redeemed, may be worth more or less than their original cost. Current performance may be lower or higher than the performance data quoted. To obtain performance data current to the most recent month-end, please visit our website at www.hartfordfunds.com.
Total returns presented above were calculated using the Fund’s net asset value available to shareholders for sale or redemption of Fund shares on December 31, 2013, which may exclude investment transactions as of this date. All share class returns assume the reinvestment of all distributions at net asset value and the deduction of all fund expenses.
Barclays Global Aggregate Index represents the global investment-grade fixed-income markets. This index is unmanaged and its results include reinvested dividends and/or distributions, but do not reflect the effect of sales charges, commissions, expenses or taxes.
You cannot invest directly in an index.
As of the Fund's current prospectus dated May 1, 2013, the net total annual operating expense ratio for Class IB shares was 1.13% and the gross total annual operating expense ratio for Class IB shares was 1.63%. Actual expenses may be higher. Please see the accompanying Financial Highlights for expense ratios for the year ended December 31, 2013.
Net operating expenses are the expenses paid to own the Fund. If the net operating expenses shown are lower than the gross operating expenses, then the net operating expenses reflect contractual fee waivers and expense reimbursements that may not be renewed. Contractual waivers or reimbursements remain in effect for as long as the Fund is a part of a master-feeder fund structure unless terminated or changed by the Fund or its Board of Directors if the fund structure changes. For more information about the fee arrangement and expiration dates, please see the expense table in the prospectus.
Gross operating expenses shown are before management fee waivers or expense caps. Performance information may reflect historical or current expense waivers or reimbursements, without which, performance would have been lower. For more information on fee waivers and/or expense reimbursements, please see the expense table in the prospectus.
The chart and table do not reflect the deductions of taxes, sales charges or other fees which may be applied at the variable life insurance, variable annuity or qualified retirement plan product level. Any such additional sales charges or other fees or expenses would lower the contract’s or plan’s performance.
All investments are subject to risk including the possible loss of principal. For a discussion of the Fund’s risks, please see the Main Risks section of this report. For more detailed information on the risks associated with an investment in the Fund, please see the prospectus.
How did the Fund perform?
The Class IB shares of the American Funds Global Bond HLS Fund returned -3.03% for the twelve-month period ended December 31, 2013, versus the return of -2.60% for the Barclays Global Aggregate Index. The Fund underperformed the -2.05% average return of the Variable Products-Underlying Funds Lipper Global Income Funds peer group, a group of funds with investment strategies similar to those of the Fund.
The performance of the American Funds Global Bond HLS Fund is directly related to the performance of the American Funds Insurance Series – Global Bond Fund Class 1, in which the Fund invests. The financial statements of the American Funds Insurance Series – Global Bond Fund Class 1, including the Schedule of Investments, are provided in the accompanying report and should be read in conjunction with the American Funds Global Bond HLS Fund’s financial statements.
| 5 |
| American Funds Global Growth and Income HLS Fund inception 4/30/2008 | |
| (advised by Hartford Funds Management Company, LLC) | |
| Investment Goal: Seeks growth of capital over time and current income. | |
Performance Overview 4/30/08 - 12/31/13

The chart above represents the hypothetical growth of a $10,000 investment in Class 1B.
| Average Annual Total Returns (as of 12/31/13) |
| 1 Year | 5 Years | Since Inception▲ | ||||||||||
| American Funds Global Growth and Income HLS Fund IB | 22.16 | % | 16.10 | % | 4.41 | % | ||||||
| MSCI All Country World Index | 23.44 | % | 15.53 | % | 3.98 | % | ||||||
| ▲ | Inception: 04/30/2008 |
PERFORMANCE DATA QUOTED REPRESENTS PAST PERFORMANCE AND DOES NOT GUARANTEE FUTURE RESULTS. The investment return and principal value of the investment will fluctuate so that investors’ shares, when redeemed, may be worth more or less than their original cost. Current performance may be lower or higher than the performance data quoted. To obtain performance data current to the most recent month-end, please visit our website at www.hartfordfunds.com.
Total returns presented above were calculated using the Fund’s net asset value available to shareholders for sale or redemption of Fund shares on December 31, 2013, which may exclude investment transactions as of this date. All share class returns assume the reinvestment of all distributions at net asset value and the deduction of all fund expenses.
MSCI All Country World Index is a free float-adjusted market capitalization index that is designed to measure equity market performance in the global developed and emerging markets, consisting of more than 40 developed and emerging market country indices. This index is unmanaged, and its results include reinvested dividends and/or distributions, but do not reflect the effect of sales charges, commissions, expenses or taxes.
You cannot invest directly in an index.
As of the Fund's current prospectus dated May 1, 2013, the net total annual operating expense ratio for Class IB shares was 1.17% and the gross total annual operating expense ratio for Class IB shares was 1.72%. Actual expenses may be higher. Please see the accompanying Financial Highlights for expense ratios for the year ended December 31, 2013.
Net operating expenses are the expenses paid to own the Fund. If the net operating expenses shown are lower than the gross operating expenses, then the net operating expenses reflect contractual fee waivers and expense reimbursements that may not be renewed. Contractual waivers or reimbursements remain in effect for as long as the Fund is a part of a master-feeder fund structure unless terminated or changed by the Fund or its Board of Directors if the fund structure changes. For more information about the fee arrangement and expiration dates, please see the expense table in the prospectus.
Gross operating expenses shown are before management fee waivers or expense caps. Performance information may reflect historical or current expense waivers or reimbursements, without which, performance would have been lower. For more information on fee waivers and/or expense reimbursements, please see the expense table in the prospectus.
The chart and table do not reflect the deductions of taxes, sales charges or other fees which may be applied at the variable life insurance, variable annuity or qualified retirement plan product level. Any such additional sales charges or other fees or expenses would lower the contract’s or plan’s performance.
All investments are subject to risk including the possible loss of principal. For a discussion of the Fund’s risks, please see the Main Risks section of this report. For more detailed information on the risks associated with an investment in the Fund, please see the prospectus.
How did the Fund perform?
The Class IB shares of the American Funds Global Growth and Income HLS Fund returned 22.16% for the twelve-month period ended December 31, 2013, versus the return of 23.44% for the MSCI All Country World Index. The Fund underperformed the 26.58% average return of the Variable Products-Underlying Funds Lipper Global Multi-Cap Growth Funds peer group, a group of funds with investment strategies similar to those of the Fund.
The performance of the American Funds Global Growth and Income HLS Fund is directly related to the performance of the American Funds Insurance Series – Global Growth and Income Fund Class 1, in which the Fund invests. The financial statements of the American Funds Insurance Series – Global Growth and Income Fund Class 1, including the Schedule of Investments, are provided in the accompanying report and should be read in conjunction with the American Funds Global Growth and Income HLS Fund’s financial statements.
| 6 |
American Funds Global Growth HLS Fund inception 4/30/2008
(advised by Hartford Funds Management Company, LLC)
Investment Goal: Seeks long-term growth of capital.
Performance Overview 4/30/08 - 12/31/13

The chart above represents the hypothetical growth of a $10,000 investment in Class 1B.
| Average Annual Total Returns (as of 12/31/13) |
| 1 Year | 5 Years | Since Inception▲ | ||||||||||
| American Funds Global Growth HLS Fund IB | 28.77 | % | 17.68 | % | 6.71 | % | ||||||
| MSCI All Country World Index | 23.44 | % | 15.53 | % | 3.98 | % | ||||||
| ▲ | Inception: 04/30/2008 |
PERFORMANCE DATA QUOTED REPRESENTS PAST PERFORMANCE AND DOES NOT GUARANTEE FUTURE RESULTS. The investment return and principal value of the investment will fluctuate so that investors’ shares, when redeemed, may be worth more or less than their original cost. Current performance may be lower or higher than the performance data quoted. To obtain performance data current to the most recent month-end, please visit our website at www.hartfordfunds.com.
Total returns presented above were calculated using the Fund’s net asset value available to shareholders for sale or redemption of Fund shares on December 31, 2013, which may exclude investment transactions as of this date. All share class returns assume the reinvestment of all distributions at net asset value and the deduction of all fund expenses.
MSCI All Country World Index is a free float-adjusted market capitalization index that is designed to measure equity market performance in the global developed and emerging markets, consisting of more than 40 developed and emerging market country indices. This index is unmanaged, and its results include reinvested dividends and/or distributions, but do not reflect the effect of sales charges, commissions, expenses or taxes.
You cannot invest directly in an index.
As of the Fund's current prospectus dated May 1, 2013, the net total annual operating expense ratio for Class IB shares was 1.14% and the gross total annual operating expense ratio for Class IB shares was 1.89%. Actual expenses may be higher. Please see the accompanying Financial Highlights for expense ratios for the year ended December 31, 2013.
Net operating expenses are the expenses paid to own the Fund. If the net operating expenses shown are lower than the gross operating expenses, then the net operating expenses reflect contractual fee waivers and expense reimbursements that may not be renewed. Contractual waivers or reimbursements remain in effect for as long as the Fund is a part of a master-feeder fund structure unless terminated or changed by the Fund or its Board of Directors if the fund structure changes. For more information about the fee arrangement and expiration dates, please see the expense table in the prospectus.
Gross operating expenses shown are before management fee waivers or expense caps. Performance information may reflect historical or current expense waivers or reimbursements, without which, performance would have been lower. For more information on fee waivers and/or expense reimbursements, please see the expense table in the prospectus.
The chart and table do not reflect the deductions of taxes, sales charges or other fees which may be applied at the variable life insurance, variable annuity or qualified retirement plan product level. Any such additional sales charges or other fees or expenses would lower the contract’s or plan’s performance.
All investments are subject to risk including the possible loss of principal. For a discussion of the Fund’s risks, please see the Main Risks section of this report. For more detailed information on the risks associated with an investment in the Fund, please see the prospectus.
How did the Fund perform?
The Class IB shares of the American Funds Global Growth HLS Fund returned 28.77% for the twelve-month period ended December 31, 2013, versus the return of 23.44% for the MSCI All Country World Index. The Fund outperformed the 22.86% average return of the Variable Products-Underlying Funds Lipper Global Multi-Cap Core Funds peer group, a group of funds with investment strategies similar to those of the Fund.
The performance of the American Funds Global Growth HLS Fund is directly related to the performance of the American Funds Insurance Series – Global Growth Fund Class 1, in which the Fund invests. The financial statements of the American Funds Insurance Series – Global Growth Fund Class 1, including the Schedule of Investments, are provided in the accompanying report and should be read in conjunction with the American Funds Global Growth HLS Fund’s financial statements.
| 7 |
American Funds Global Small Capitalization HLS Fund inception 4/30/2008
(advised by Hartford Funds Management Company, LLC)
Investment Goal: Seeks growth of capital over time.
Performance Overview 4/30/08 - 12/31/13

The chart above represents the hypothetical growth of a $10,000 investment in Class 1B.
| Average Annual Total Returns (as of 12/31/13) |
| 1 Year | 5 Years | Since Inception▲ | ||||||||||
| American Funds Global Small Capitalization HLS Fund IB | 27.89 | % | 18.97 | % | 3.49 | % | ||||||
| MSCI All Country World Small Cap Index | 29.18 | % | 21.20 | % | 8.06 | % | ||||||
| ▲ | Inception: 04/30/2008 |
PERFORMANCE DATA QUOTED REPRESENTS PAST PERFORMANCE AND DOES NOT GUARANTEE FUTURE RESULTS. The investment return and principal value of the investment will fluctuate so that investors’ shares, when redeemed, may be worth more or less than their original cost. Current performance may be lower or higher than the performance data quoted. To obtain performance data current to the most recent month-end, please visit our website at www.hartfordfunds.com.
Total returns presented above were calculated using the Fund’s net asset value available to shareholders for sale or redemption of Fund shares on December 31, 2013, which may exclude investment transactions as of this date. All share class returns assume the reinvestment of all distributions at net asset value and the deduction of all fund expenses.
MSCI All Country World Small Cap Index is a free float-adjusted market capitalization-weighted index that is designed to measure equity market performance of smaller capitalization companies in both developed and emerging markets. This index is unmanaged and its results include reinvested dividends and/or distributions, but do not reflect the effect of sales charges, commissions, expenses or taxes.
You cannot invest directly in an index.
As of the Fund's current prospectus dated May 1, 2013, the net total annual operating expense ratio for Class IB shares was 1.31% and the gross total annual operating expense ratio for Class IB shares was 1.86%. Actual expenses may be higher. Please see the accompanying Financial Highlights for expense ratios for the year ended December 31, 2013.
Net operating expenses are the expenses paid to own the Fund. If the net operating expenses shown are lower than the gross operating expenses, then the net operating expenses reflect contractual fee waivers and expense reimbursements that may not be renewed. Contractual waivers or reimbursements remain in effect for as long as the Fund is a part of a master-feeder fund structure unless terminated or changed by the Fund or its Board of Directors if the fund structure changes. For more information about the fee arrangement and expiration dates, please see the expense table in the prospectus.
Gross operating expenses shown are before management fee waivers or expense caps. Performance information may reflect historical or current expense waivers or reimbursements, without which, performance would have been lower. For more information on fee waivers and/or expense reimbursements, please see the expense table in the prospectus.
The chart and table do not reflect the deductions of taxes, sales charges or other fees which may be applied at the variable life insurance, variable annuity or qualified retirement plan product level. Any such additional sales charges or other fees or expenses would lower the contract’s or plan’s performance.
All investments are subject to risk including the possible loss of principal. For a discussion of the Fund’s risks, please see the Main Risks section of this report. For more detailed information on the risks associated with an investment in the Fund, please see the prospectus.
How did the Fund perform?
The Class IB shares of the American Funds Global Small Capitalization HLS Fund returned 27.89% for the twelve-month period ended December 31, 2013, versus the return of 29.18% for the MSCI All Country World Small Cap Index. The Fund underperformed the 29.41% average return of the Variable Products-Underlying Funds Lipper Global Small/Mid-Cap Funds peer group, a group of funds with investment strategies similar to those of the Fund.
The performance of the American Funds Global Small Capitalization HLS Fund is directly related to the performance of the American Funds Insurance Series – Global Small Capitalization Fund Class 1, in which the Fund invests. The financial statements of the American Funds Insurance Series – Global Small Capitalization Fund Class 1, including the Schedule of Investments, are provided in the accompanying report and should be read in conjunction with the American Funds Global Small Capitalization HLS Fund’s financial statements.
| 8 |
American Funds Growth HLS Fund inception 4/30/2008
(advised by Hartford Funds Management Company, LLC)
Investment Goal: Seeks growth of capital.
Performance Overview 4/30/08 - 12/31/13

The chart above represents the hypothetical growth of a $10,000 investment in Class 1B.
Average Annual Total Returns (as of 12/31/13)
| 1 Year | 5 Years | Since Inception▲ | ||||||||||
| American Funds Growth HLS Fund IB | 29.78 | % | 19.09 | % | 6.23 | % | ||||||
| S&P 500 Index | 32.39 | % | 17.94 | % | 7.59 | % | ||||||
| ▲ | Inception: 04/30/2008 |
PERFORMANCE DATA QUOTED REPRESENTS PAST PERFORMANCE AND DOES NOT GUARANTEE FUTURE RESULTS. The investment return and principal value of the investment will fluctuate so that investors’ shares, when redeemed, may be worth more or less than their original cost. Current performance may be lower or higher than the performance data quoted. To obtain performance data current to the most recent month-end, please visit our website at www.hartfordfunds.com.
Total returns presented above were calculated using the Fund’s net asset value available to shareholders for sale or redemption of Fund shares on December 31, 2013, which may exclude investment transactions as of this date. All share class returns assume the reinvestment of all distributions at net asset value and the deduction of all fund expenses.
S&P 500 Index is a market capitalization-weighted price index composed of 500 widely held common stocks.
You cannot invest directly in an index.
As of the Fund's current prospectus dated May 1, 2013, the net total annual operating expense ratio for Class IB shares was 0.89% and the gross total annual operating expense ratio for Class IB shares was 1.39%. Actual expenses may be higher. Please see the accompanying Financial Highlights for expense ratios for the year ended December 31, 2013.
Net operating expenses are the expenses paid to own the Fund. If the net operating expenses shown are lower than the gross operating expenses, then the net operating expenses reflect contractual fee waivers and expense reimbursements that may not be renewed. Contractual waivers or reimbursements remain in effect for as long as the Fund is a part of a master-feeder fund structure unless terminated or changed by the Fund or its Board of Directors if the fund structure changes. For more information about the fee arrangement and expiration dates, please see the expense table in the prospectus.
Gross operating expenses shown are before management fee waivers or expense caps. Performance information may reflect historical or current expense waivers or reimbursements, without which, performance would have been lower. For more information on fee waivers and/or expense reimbursements, please see the expense table in the prospectus.
The chart and table do not reflect the deductions of taxes, sales charges or other fees which may be applied at the variable life insurance, variable annuity or qualified retirement plan product level. Any such additional sales charges or other fees or expenses would lower the contract’s or plan’s performance.
All investments are subject to risk including the possible loss of principal. For a discussion of the Fund’s risks, please see the Main Risks section of this report. For more detailed information on the risks associated with an investment in the Fund, please see the prospectus.
How did the Fund perform?
The Class IB shares of the American Funds Growth HLS Fund returned 29.78% for the twelve-month period ended December 31, 2013, versus the return of 32.39% for the S&P 500 Index. The Fund underperformed the 34.00% average return of the Variable Products-Underlying Funds Lipper Large-Cap Growth Funds peer group, a group of funds with investment strategies similar to those of the Fund.
The performance of the American Funds Growth HLS Fund is directly related to the performance of the American Funds Insurance Series – Growth Fund Class 1, in which the Fund invests. The financial statements of the American Funds Insurance Series – Growth Fund Class 1, including the Schedule of Investments, are provided in the accompanying report and should be read in conjunction with the American Funds Growth HLS Fund’s financial statements.
| 9 |
American Funds Growth-Income HLS Fund inception 4/30/2008
(advised by Hartford Funds Management Company, LLC)
Investment Goal: Seeks long-term growth of capital and income over time.
Performance Overview 4/30/08 - 12/31/13

The chart above represents the hypothetical growth of a $10,000 investment in Class 1B.
Average Annual Total Returns (as of 12/31/13)
| 1 Year | 5 Years | Since Inception▲ | ||||||||||
| American Funds Growth-Income HLS Fund IB | 33.14 | % | 17.29 | % | 6.69 | % | ||||||
| S&P 500 Index | 32.39 | % | 17.94 | % | 7.59 | % | ||||||
| ▲ | Inception: 04/30/2008 |
PERFORMANCE DATA QUOTED REPRESENTS PAST PERFORMANCE AND DOES NOT GUARANTEE FUTURE RESULTS. The investment return and principal value of the investment will fluctuate so that investors’ shares, when redeemed, may be worth more or less than their original cost. Current performance may be lower or higher than the performance data quoted. To obtain performance data current to the most recent month-end, please visit our website at www.hartfordfunds.com.
Total returns presented above were calculated using the Fund’s net asset value available to shareholders for sale or redemption of Fund shares on December 31, 2013, which may exclude investment transactions as of this date. All share class returns assume the reinvestment of all distributions at net asset value and the deduction of all fund expenses.
S&P 500 Index is a market capitalization-weighted price index composed of 500 widely held common stocks.
You cannot invest directly in an index.
As of the Fund's current prospectus dated May 1, 2013, the net total annual operating expense ratio for Class IB shares was 0.83% and the gross total annual operating expense ratio for Class IB shares was 1.28%. Actual expenses may be higher. Please see the accompanying Financial Highlights for expense ratios for the year ended December 31, 2013.
Net operating expenses are the expenses paid to own the Fund. If the net operating expenses shown are lower than the gross operating expenses, then the net operating expenses reflect contractual fee waivers and expense reimbursements that may not be renewed. Contractual waivers or reimbursements remain in effect for as long as the Fund is a part of a master-feeder fund structure unless terminated or changed by the Fund or its Board of Directors if the fund structure changes. For more information about the fee arrangement and expiration dates, please see the expense table in the prospectus.
Gross operating expenses shown are before management fee waivers or expense caps. Performance information may reflect historical or current expense waivers or reimbursements, without which, performance would have been lower. For more information on fee waivers and/or expense reimbursements, please see the expense table in the prospectus.
The chart and table do not reflect the deductions of taxes, sales charges or other fees which may be applied at the variable life insurance, variable annuity or qualified retirement plan product level. Any such additional sales charges or other fees or expenses would lower the contract’s or plan’s performance.
All investments are subject to risk including the possible loss of principal. For a discussion of the Fund’s risks, please see the Main Risks section of this report. For more detailed information on the risks associated with an investment in the Fund, please see the prospectus.
How did the Fund perform?
The Class IB shares of the American Funds Growth-Income HLS Fund returned 33.14% for the twelve-month period ended December 31, 2013, versus the return of 32.39% for the S&P 500 Index. The Fund outperformed the 31.34% average return of the Variable Products-Underlying Funds Lipper Large-Cap Core Funds peer group, a group of funds with investment strategies similar to those of the Fund.
The performance of the American Funds Growth-Income HLS Fund is directly related to the performance of the American Funds Insurance Series – Growth-Income Fund Class 1, in which the Fund invests. The financial statements of the American Funds Insurance Series – Growth-Income Fund Class 1, including the Schedule of Investments, are provided in the accompanying report and should be read in conjunction with the American Funds Growth-Income HLS Fund’s financial statements.
| 10 |
American Funds International HLS Fund inception 4/30/2008
(advised by Hartford Funds Management Company, LLC)
Investment Goal: Seeks long-term growth of capital over time.
Performance Overview 4/30/08 - 12/31/13

The chart above represents the hypothetical growth of a $10,000 investment in Class 1B.
Average Annual Total Returns (as of 12/31/13)
| 1 Year | 5 Years | Since Inception▲ | ||||||||||
| American Funds International HLS Fund IB | 21.23 | % | 13.29 | % | 2.28 | % | ||||||
| MSCI All Country World ex USA Index | 15.78 | % | 13.32 | % | 1.03 | % | ||||||
| ▲ | Inception: 04/30/2008 |
PERFORMANCE DATA QUOTED REPRESENTS PAST PERFORMANCE AND DOES NOT GUARANTEE FUTURE RESULTS. The investment return and principal value of the investment will fluctuate so that investors’ shares, when redeemed, may be worth more or less than their original cost. Current performance may be lower or higher than the performance data quoted. To obtain performance data current to the most recent month-end, please visit our website at www.hartfordfunds.com.
Total returns presented above were calculated using the Fund’s net asset value available to shareholders for sale or redemption of Fund shares on December 31, 2013, which may exclude investment transactions as of this date. All share class returns assume the reinvestment of all distributions at net asset value and the deduction of all fund expenses.
MSCI All Country World ex USA Index is a broad-based, unmanaged, market capitalization weighted, total return index that measures the performance of both developed and emerging stock markets, excluding the U.S. The index is calculated to exclude companies and share classes which cannot be freely purchased by foreigners.
You cannot invest directly in an index.
As of the Fund's current prospectus dated May 1, 2013, the net total annual operating expense ratio for Class IB shares was 1.08% and the gross total annual operating expense ratio for Class IB shares was 1.68%. Actual expenses may be higher. Please see the accompanying Financial Highlights for expense ratios for the year ended December 31, 2013.
Net operating expenses are the expenses paid to own the Fund. If the net operating expenses shown are lower than the gross operating expenses, then the net operating expenses reflect contractual fee waivers and expense reimbursements that may not be renewed. Contractual waivers or reimbursements remain in effect for as long as the Fund is a part of a master-feeder fund structure unless terminated or changed by the Fund or its Board of Directors if the fund structure changes. For more information about the fee arrangement and expiration dates, please see the expense table in the prospectus.
Gross operating expenses shown are before management fee waivers or expense caps. Performance information may reflect historical or current expense waivers or reimbursements, without which, performance would have been lower. For more information on fee waivers and/or expense reimbursements, please see the expense table in the prospectus.
The chart and table do not reflect the deductions of taxes, sales charges or other fees which may be applied at the variable life insurance, variable annuity or qualified retirement plan product level. Any such additional sales charges or other fees or expenses would lower the contract’s or plan’s performance.
All investments are subject to risk including the possible loss of principal. For a discussion of the Fund’s risks, please see the Main Risks section of this report. For more detailed information on the risks associated with an investment in the Fund, please see the prospectus.
How did the Fund perform?
The Class IB shares of the American Funds International HLS Fund returned 21.23% for the twelve-month period ended December 31, 2013, versus the return of 15.78% for the MSCI All Country World ex USA Index. The Fund outperformed the 19.87% average return of the Variable Products-Underlying Funds Lipper International Multi-Cap Core Funds peer group, a group of funds with investment strategies similar to those of the Fund.
The performance of the American Funds International HLS Fund is directly related to the performance of the American Funds Insurance Series – International Fund Class 1, in which the Fund invests. The financial statements of the American Funds Insurance Series – International Fund Class 1, including the Schedule of Investments, are provided in the accompanying report and should be read in conjunction with the American Funds International HLS Fund’s financial statements.
| 11 |
American Funds New World HLS Fund inception 4/30/2008
(advised by Hartford Funds Management Company, LLC)
Investment Goal: Seeks long-term capital appreciation.
Performance Overview 4/30/08 - 12/31/13

The chart above represents the hypothetical growth of a $10,000 investment in Class 1B.
Average Annual Total Returns (as of 12/31/13)
| 1 Year | 5 Years | Since Inception▲ | ||||||||||
| American Funds New World HLS Fund IB | 11.06 | % | 14.43 | % | 2.93 | % | ||||||
| MSCI All Country World Index | 23.44 | % | 15.53 | % | 3.98 | % | ||||||
| MSCI Emerging Markets Index | -2.27 | % | 15.15 | % | -0.28 | % | ||||||
| ▲ | Inception: 04/30/2008 |
PERFORMANCE DATA QUOTED REPRESENTS PAST PERFORMANCE AND DOES NOT GUARANTEE FUTURE RESULTS. The investment return and principal value of the investment will fluctuate so that investors’ shares, when redeemed, may be worth more or less than their original cost. Current performance may be lower or higher than the performance data quoted. To obtain performance data current to the most recent month-end, please visit our website at www.hartfordfunds.com.
Total returns presented above were calculated using the Fund’s net asset value available to shareholders for sale or redemption of Fund shares on December 31, 2013, which may exclude investment transactions as of this date. All share class returns assume the reinvestment of all distributions at net asset value and the deduction of all fund expenses.
MSCI All Country World Index is a free float-adjusted market capitalization index that is designed to measure equity market performance in the global developed and emerging markets, consisting of more than 40 developed and emerging market country indices. This index is unmanaged, and its results include reinvested dividends and/or distributions, but do not reflect the effect of sales charges, commissions, expenses or taxes.
MSCI Emerging Markets Index is a free float-adjusted market capitalization-weighted index that is designed to measure equity market performance in the global emerging markets, consisting of 24 emerging market country indices. This index is unmanaged and its results include reinvested dividends and/or distributions, but do not reflect the effect of sales charges, commissions, expenses or taxes.
You cannot invest directly in an index.
As of the Fund's current prospectus dated May 1, 2013, the net total annual operating expense ratio for Class IB shares was 1.35% and the gross total annual operating expense ratio for Class IB shares was 2.20%. Actual expenses may be higher. Please see the accompanying Financial Highlights for expense ratios for the year ended December 31, 2013.
Net operating expenses are the expenses paid to own the Fund. If the net operating expenses shown are lower than the gross operating expenses, then the net operating expenses reflect contractual fee waivers and expense reimbursements that may not be renewed. Contractual waivers or reimbursements remain in effect for as long as the Fund is a part of a master-feeder fund structure unless terminated or changed by the Fund or its Board of Directors if the fund structure changes. For more information about the fee arrangement and expiration dates, please see the expense table in the prospectus.
Gross operating expenses shown are before management fee waivers or expense caps. Performance information may reflect historical or current expense waivers or reimbursements, without which, performance would have been lower. For more information on fee waivers and/or expense reimbursements, please see the expense table in the prospectus.
The chart and table do not reflect the deductions of taxes, sales charges or other fees which may be applied at the variable life insurance, variable annuity or qualified retirement plan product level. Any such additional sales charges or other fees or expenses would lower the contract’s or plan’s performance.
All investments are subject to risk including the possible loss of principal. For a discussion of the Fund’s risks, please see the Main Risks section of this report. For more detailed information on the risks associated with an investment in the Fund, please see the prospectus.
How did the Fund perform?
The Class IB shares of the American Funds New World HLS Fund returned 11.06% for the twelve-month period ended December 31, 2013, versus the returns of 23.44% for the MSCI All Country World Index and -2.27% for the MSCI Emerging Markets Index. The Fund outperformed the -0.14% average return of the Variable Products-Underlying Funds Lipper Emerging Markets Funds peer group, a group of funds with investment strategies similar to those of the Fund.
The performance of the American Funds New World HLS Fund is directly related to the performance of the American Funds Insurance Series – New World Fund Class 1, in which the Fund invests. The financial statements of the American Funds Insurance Series – New World Fund Class 1, including the Schedule of Investments, are provided in the accompanying report and should be read in conjunction with the American Funds New World HLS Fund’s financial statements.
| 12 |
| American Funds Asset Allocation HLS Fund |
| Schedule of Investments |
| December 31, 2013 |
| (000’s Omitted) |
| Shares | Market Value ╪ | |||||||||||
| INVESTMENT COMPANIES - 100.0% | ||||||||||||
| 2,800 | American Funds Insurance Series - Asset Allocation Fund Class 1 | $ | 62,981 | |||||||||
| Total investment companies | ||||||||||||
| (cost $50,114) | $ | 62,981 | ||||||||||
| Total investments | ||||||||||||
| (cost $50,114) ▲ | 100.0 | % | $ | 62,981 | ||||||||
| Other assets and liabilities | — | % | (20 | ) | ||||||||
| Total net assets | 100.0 | % | $ | 62,961 | ||||||||
| Note: | Percentage of investments as shown is the ratio of the total market value to total net assets. |
| ▲ | At December 31, 2013, the cost of securities for federal income tax purposes was $50,435 and the aggregate gross unrealized appreciation and depreciation based on that cost were: |
| Unrealized Appreciation | $ | 12,546 | ||
| Unrealized Depreciation | — | |||
| Net Unrealized Appreciation | $ | 12,546 |
| ╪ | See Significant Accounting Policies of accompanying Notes to Financial Statements regarding valuation of securities. |
At December 31, 2013, the investment valuation hierarchy levels were:
| Assets: | ||||
| Investment in Securities - Level 1 | $ | 62,981 | ||
| Total | $ | 62,981 |
| American Funds Blue Chip Income and Growth HLS Fund |
| Schedule of Investments |
| December 31, 2013 |
| (000’s Omitted) |
| Shares | Market Value ╪ | |||||||||||
| INVESTMENT COMPANIES - 100.0% | ||||||||||||
| 3,317 | American Funds Insurance Series - Blue Chip Income and Growth Fund Class 1 | $ | 43,521 | |||||||||
| Total investment companies | ||||||||||||
| (cost $31,861) | $ | 43,521 | ||||||||||
| Total investments | ||||||||||||
| (cost $31,861) ▲ | 100.0 | % | $ | 43,521 | ||||||||
| Other assets and liabilities | — | % | (19 | ) | ||||||||
| Total net assets | 100.0 | % | $ | 43,502 | ||||||||
| Note: | Percentage of investments as shown is the ratio of the total market value to total net assets. |
| ▲ | At December 31, 2013, the cost of securities for federal income tax purposes was $32,455 and the aggregate gross unrealized appreciation and depreciation based on that cost were: |
| Unrealized Appreciation | $ | 11,066 | ||
| Unrealized Depreciation | — | |||
| Net Unrealized Appreciation | $ | 11,066 |
| ╪ | See Significant Accounting Policies of accompanying Notes to Financial Statements regarding valuation of securities. |
At December 31, 2013, the investment valuation hierarchy levels were:
| Assets: | ||||
| Investment in Securities - Level 1 | $ | 43,521 | ||
| Total | $ | 43,521 |
The accompanying notes are an integral part of these financial statements.
| 13 |
| American Funds Bond HLS Fund |
| Schedule of Investments |
| December 31, 2013 |
| (000’s Omitted) |
| Shares | Market Value ╪ | |||||||||||
| INVESTMENT COMPANIES - 100.0% | ||||||||||||
| 22,078 | American Funds Insurance Series - Bond Fund Class 1 | $ | 236,895 | |||||||||
| Total investment companies | ||||||||||||
| (cost $238,447) | $ | 236,895 | ||||||||||
| Total investments | ||||||||||||
| (cost $238,447) ▲ | 100.0 | % | $ | 236,895 | ||||||||
| Other assets and liabilities | — | % | (49 | ) | ||||||||
| Total net assets | 100.0 | % | $ | 236,846 | ||||||||
| Note: | Percentage of investments as shown is the ratio of the total market value to total net assets. |
| ▲ | At December 31, 2013, the cost of securities for federal income tax purposes was $239,186 and the aggregate gross unrealized appreciation and depreciation based on that cost were: |
| Unrealized Appreciation | $ | — | ||
| Unrealized Depreciation | (2,291 | ) | ||
| Net Unrealized Depreciation | $ | (2,291 | ) |
| ╪ | See Significant Accounting Policies of accompanying Notes to Financial Statements regarding valuation of securities. |
At December 31, 2013, the investment valuation hierarchy levels were:
| Assets: | ||||
| Investment in Securities - Level 1 | $ | 236,895 | ||
| Total | $ | 236,895 |
| American Funds Global Bond HLS Fund |
| Schedule of Investments |
| December 31, 2013 |
| (000’s Omitted) |
| Shares | Market Value ╪ | |||||||||||
| INVESTMENT COMPANIES - 100.1% | ||||||||||||
| 1,433 | American Funds Insurance Series - Global Bond Fund Class 1 | $ | 17,021 | |||||||||
| Total investment companies | ||||||||||||
| (cost $17,560) | $ | 17,021 | ||||||||||
| Total investments | ||||||||||||
| (cost $17,560) ▲ | 100.1 | % | $ | 17,021 | ||||||||
| Other assets and liabilities | (0.1 | )% | (14 | ) | ||||||||
| Total net assets | 100.0 | % | $ | 17,007 | ||||||||
| Note: | Percentage of investments as shown is the ratio of the total market value to total net assets. |
| ▲ | At December 31, 2013, the cost of securities for federal income tax purposes was $17,571 and the aggregate gross unrealized appreciation and depreciation based on that cost were: |
| Unrealized Appreciation | $ | — | ||
| Unrealized Depreciation | (550 | ) | ||
| Net Unrealized Depreciation | $ | (550 | ) |
| ╪ | See Significant Accounting Policies of accompanying Notes to Financial Statements regarding valuation of securities. |
At December 31, 2013, the investment valuation hierarchy levels were:
| Assets: | ||||
| Investment in Securities - Level 1 | $ | 17,021 | ||
| Total | $ | 17,021 |
The accompanying notes are an integral part of these financial statements.
| 14 |
| American Funds Global Growth and Income HLS Fund |
| Schedule of Investments |
| December 31, 2013 |
| (000’s Omitted) |
| Shares | Market Value ╪ | |||||||||||
| INVESTMENT COMPANIES - 100.0% | ||||||||||||
| 4,208 | American Funds Insurance Series - Global Growth and Income Fund Class 1 | $ | 52,731 | |||||||||
| Total investment companies | ||||||||||||
| (cost $35,301) | $ | 52,731 | ||||||||||
| Total investments | ||||||||||||
| (cost $35,301) ▲ | 100.0 | % | $ | 52,731 | ||||||||
| Other assets and liabilities | — | % | (19 | ) | ||||||||
| Total net assets | 100.0 | % | $ | 52,712 | ||||||||
| Note: | Percentage of investments as shown is the ratio of the total market value to total net assets. |
| ▲ | At December 31, 2013, the cost of securities for federal income tax purposes was $36,974 and the aggregate gross unrealized appreciation and depreciation based on that cost were: |
| Unrealized Appreciation | $ | 15,757 | ||
| Unrealized Depreciation | — | |||
| Net Unrealized Appreciation | $ | 15,757 |
| ╪ | See Significant Accounting Policies of accompanying Notes to Financial Statements regarding valuation of securities. |
At December 31, 2013, the investment valuation hierarchy levels were:
| Assets: | ||||
| Investment in Securities - Level 1 | $ | 52,731 | ||
| Total | $ | 52,731 |
| American Funds Global Growth HLS Fund |
| Schedule of Investments |
December 31, 2013 (000’s Omitted) |
| Shares | Market Value ╪ | |||||||||||
| INVESTMENT COMPANIES - 100.1% | ||||||||||||
| 814 | American Funds Insurance Series - Global Growth Fund Class 1 | $ | 24,524 | |||||||||
| Total investment companies | ||||||||||||
| (cost $16,229) | $ | 24,524 | ||||||||||
| Total investments | ||||||||||||
| (cost $16,229) ▲ | 100.1 | % | $ | 24,524 | ||||||||
| Other assets and liabilities | (0.1 | )% | (15 | ) | ||||||||
| Total net assets | 100.0 | % | $ | 24,509 | ||||||||
| Note: | Percentage of investments as shown is the ratio of the total market value to total net assets. |
| ▲ | At December 31, 2013, the cost of securities for federal income tax purposes was $17,424 and the aggregate gross unrealized appreciation and depreciation based on that cost were: |
| Unrealized Appreciation. | $ | 7,100 | ||
| Unrealized Depreciation | — | |||
| Net Unrealized Appreciation | $ | 7,100 |
| ╪ | See Significant Accounting Policies of accompanying Notes to Financial Statements regarding valuation of securities. |
At December 31, 2013, the investment valuation hierarchy levels were:
| Assets: | ||||
| Investment in Securities - Level 1 | $ | 24,524 | ||
| Total | $ | 24,524 |
The accompanying notes are an integral part of these financial statements.
| 15 |
| American Funds Global Small Capitalization HLS Fund |
| Schedule of Investments |
| December 31, 2013 |
| (000’s Omitted) |
| Shares | Market Value ╪ | |||||||||||
| INVESTMENT COMPANIES - 100.0% | ||||||||||||
| 2,384 | American Funds Insurance Series - Global Small Capitalization Fund Class 1 | $ | 61,247 | |||||||||
| Total investment companies | ||||||||||||
| (cost $43,306) | $ | 61,247 | ||||||||||
| Total investments | ||||||||||||
| (cost $43,306) ▲ | 100.0 | % | $ | 61,247 | ||||||||
| Other assets and liabilities | — | % | (23 | ) | ||||||||
| Total net assets | 100.0 | % | $ | 61,224 | ||||||||
| Note: | Percentage of investments as shown is the ratio of the total market value to total net assets. |
| ▲ | At December 31, 2013, the cost of securities for federal income tax purposes was $45,340 and the aggregate gross unrealized appreciation and depreciation based on that cost were: |
| Unrealized Appreciation | $ | 15,907 | ||
| Unrealized Depreciation | — | |||
| Net Unrealized Appreciation | $ | 15,907 |
| ╪ | See Significant Accounting Policies of accompanying Notes to Financial Statements regarding valuation of securities. |
At December 31, 2013, the investment valuation hierarchy levels were:
| Assets: | ||||
| Investment in Securities - Level 1 | $ | 61,247 | ||
| Total | $ | 61,247 |
| American Funds Growth HLS Fund |
| Schedule of Investments |
| December 31, 2013 |
| (000’s Omitted) |
| Shares | Market Value ╪ | |||||||||||
| INVESTMENT COMPANIES - 100.0% | ||||||||||||
| 4,470 | American Funds Insurance Series - Growth Fund Class 1 | $ | 351,084 | |||||||||
| Total investment companies | ||||||||||||
| (cost $184,643) | $ | 351,084 | ||||||||||
| Total investments | ||||||||||||
| (cost $184,643) ▲ | 100.0 | % | $ | 351,084 | ||||||||
| Other assets and liabilities | — | % | (66 | ) | ||||||||
| Total net assets | 100.0 | % | $ | 351,018 | ||||||||
| Note: | Percentage of investments as shown is the ratio of the total market value to total net assets. |
| ▲ | At December 31, 2013, the cost of securities for federal income tax purposes was $193,787 and the aggregate gross unrealized appreciation and depreciation based on that cost were: |
| Unrealized Appreciation | $ | 157,297 | ||
| Unrealized Depreciation | — | |||
| Net Unrealized Appreciation | $ | 157,297 |
| ╪ | See Significant Accounting Policies of accompanying Notes to Financial Statements regarding valuation of securities. |
At December 31, 2013, the investment valuation hierarchy levels were:
| Assets: | ||||
| Investment in Securities - Level 1 | $ | 351,084 | ||
| Total | $ | 351,084 |
The accompanying notes are an integral part of these financial statements.
| 16 |
| American Funds Growth-Income HLS Fund |
| Schedule of Investments |
| December 31, 2013 |
| (000’s Omitted) |
| Shares | Market Value ╪ | |||||||||||
| INVESTMENT COMPANIES - 100.0% | ||||||||||||
| 3,898 | American Funds Insurance Series - Growth-Income Fund Class 1 | $ | 197,730 | |||||||||
| Total investment companies | ||||||||||||
| (cost $113,342) | $ | 197,730 | ||||||||||
| Total investments | ||||||||||||
| (cost $113,342) ▲ | 100.0 | % | $ | 197,730 | ||||||||
| Other assets and liabilities | — | % | (41 | ) | ||||||||
| Total net assets | 100.0 | % | $ | 197,689 | ||||||||
| Note: | Percentage of investments as shown is the ratio of the total market value to total net assets. |
| ▲ | At December 31, 2013, the cost of securities for federal income tax purposes was $117,212 and the aggregate gross unrealized appreciation and depreciation based on that cost were: |
| Unrealized Appreciation | $ | 80,518 | ||
| Unrealized Depreciation | — | |||
| Net Unrealized Appreciation | $ | 80,518 |
| ╪ | See Significant Accounting Policies of accompanying Notes to Financial Statements regarding valuation of securities. |
At December 31, 2013, the investment valuation hierarchy levels were:
| Assets: | ||||
| Investment in Securities - Level 1 | $ | 197,730 | ||
| Total | $ | 197,730 |
| American Funds International HLS Fund |
| Schedule of Investments |
| December 31, 2013 |
| (000’s Omitted) |
| Shares | Market Value ╪ | |||||||||||
| INVESTMENT COMPANIES - 100.0% | ||||||||||||
| 10,671 | American Funds Insurance Series - International Fund Class 1 | $ | 226,448 | |||||||||
| Total investment companies | ||||||||||||
| (cost $165,370) | $ | 226,448 | ||||||||||
| Total investments | ||||||||||||
| (cost $165,370) ▲ | 100.0 | % | $ | 226,448 | ||||||||
| Other assets and liabilities | — | % | (48 | ) | ||||||||
| Total net assets | 100.0 | % | $ | 226,400 | ||||||||
| Note: | Percentage of investments as shown is the ratio of the total market value to total net assets. |
| ▲ | At December 31, 2013, the cost of securities for federal income tax purposes was $171,216 and the aggregate gross unrealized appreciation and depreciation based on that cost were: |
| Unrealized Appreciation | $ | 55,232 | ||
| Unrealized Depreciation | — | |||
| Net Unrealized Appreciation | $ | 55,232 |
| ╪ | See Significant Accounting Policies of accompanying Notes to Financial Statements regarding valuation of securities. |
At December 31, 2013, the investment valuation hierarchy levels were:
| Assets: | ||||
| Investment in Securities - Level 1 | $ | 226,448 | ||
| Total | $ | 226,448 |
The accompanying notes are an integral part of these financial statements.
| 17 |
| American Funds New World HLS Fund |
| Schedule of Investments |
| December 31, 2013 |
| (000’s Omitted) |
| Shares | Market Value ╪ | |||||||||||
| INVESTMENT COMPANIES - 100.0% | ||||||||||||
| 1,368 | American Funds Insurance Series - New World Fund Class 1 | $ | 34,321 | |||||||||
| Total investment companies | ||||||||||||
| (cost $29,306) | $ | 34,321 | ||||||||||
| Total investments | ||||||||||||
| (cost $29,306) ▲ | 100.0 | % | $ | 34,321 | ||||||||
| Other assets and liabilities | — | % | (17 | ) | ||||||||
| Total net assets | 100.0 | % | $ | 34,304 | ||||||||
| Note: | Percentage of investments as shown is the ratio of the total market value to total net assets. |
| ▲ | At December 31, 2013, the cost of securities for federal income tax purposes was $29,851 and the aggregate gross unrealized appreciation and depreciation based on that cost were: |
| Unrealized Appreciation | $ | 4,470 | ||
| Unrealized Depreciation | — | |||
| Net Unrealized Appreciation | $ | 4,470 |
| ╪ | See Significant Accounting Policies of accompanying Notes to Financial Statements regarding valuation of securities. |
At December 31, 2013, the investment valuation hierarchy levels were:
| Assets: | ||||
| Investment in Securities - Level 1 | $ | 34,321 | ||
| Total | $ | 34,321 |
The accompanying notes are an integral part of these financial statements.
| 18 |
[This page is intentionally left blank]
| 19 |
| Hartford Series Fund, Inc. |
| Statements of Assets and Liabilities |
| December 31, 2013 |
| (000’s Omitted) |
|
| American Funds Asset Allocation HLS Fund | American Funds Blue Chip Income and Growth HLS Fund | American Funds Bond HLS Fund | ||||||||||
| Assets: | ||||||||||||
| Investments in underlying funds, at market value @ | $ | 62,981 | $ | 43,521 | $ | 236,895 | ||||||
| Receivables: | ||||||||||||
| Investment securities sold | 8 | 5 | 166 | |||||||||
| Fund shares sold | — | — | — | |||||||||
| Other assets | 6 | 5 | 13 | |||||||||
| Total assets | 62,995 | 43,531 | 237,074 | |||||||||
| Liabilities: | ||||||||||||
| Payables: | ||||||||||||
| Investment securities purchased | — | — | — | |||||||||
| Fund shares redeemed | 8 | 6 | 165 | |||||||||
| Investment management fees | 9 | 7 | 26 | |||||||||
| Distribution fees | 4 | 2 | 13 | |||||||||
| Accrued expenses | 13 | 14 | 24 | |||||||||
| Total liabilities | 34 | 29 | 228 | |||||||||
| Net assets | $ | 62,961 | $ | 43,502 | $ | 236,846 | ||||||
| Summary of Net Assets: | ||||||||||||
| Capital stock and paid-in-capital | $ | 37,382 | $ | 25,120 | $ | 230,028 | ||||||
| Undistributed net investment income | 672 | 648 | 3,495 | |||||||||
| Accumulated net realized gain | 12,040 | 6,074 | 4,875 | |||||||||
| Unrealized appreciation (depreciation) of investments | 12,867 | 11,660 | (1,552 | ) | ||||||||
| Net assets | $ | 62,961 | $ | 43,502 | $ | 236,846 | ||||||
| Shares authorized | 200,000 | 200,000 | 200,000 | |||||||||
| Par value | $ | 0.001 | $ | 0.001 | $ | 0.001 | ||||||
| Class IB: Net asset value per share | $ | 12.63 | $ | 12.31 | $ | 9.75 | ||||||
| Shares outstanding | 4,986 | 3,535 | 24,304 | |||||||||
| Net assets | $ | 62,961 | $ | 43,502 | $ | 236,846 | ||||||
| @ Cost of investments in underlying funds | $ | 50,114 | $ | 31,861 | $ | 238,447 | ||||||
The accompanying notes are an integral part of these financial statements.
| 20 |
| American Funds Global Bond HLS Fund | American Funds Global Growth and Income HLS Fund | American Funds Global Growth HLS Fund | American Funds Global Small Capitalization HLS Fund | American Funds Growth HLS Fund | American Funds Growth-Income HLS Fund | American Funds International HLS Fund | American Funds New World HLS Fund | |||||||||||||||||||||||
| $ | 17,021 | $ | 52,731 | $ | 24,524 | $ | 61,247 | $ | 351,084 | $ | 197,730 | $ | 226,448 | $ | 34,321 | |||||||||||||||
| 2 | 30 | 9 | 35 | 197 | 110 | 176 | — | |||||||||||||||||||||||
| — | — | — | — | — | — | — | 3 | |||||||||||||||||||||||
| 2 | 6 | 4 | 7 | 39 | 20 | 30 | 6 | |||||||||||||||||||||||
| 17,025 | 52,767 | 24,537 | 61,289 | 351,320 | 197,860 | 226,654 | 34,330 | |||||||||||||||||||||||
| — | — | — | — | — | — | — | 3 | |||||||||||||||||||||||
| 2 | 30 | 9 | 35 | 197 | 110 | 176 | — | |||||||||||||||||||||||
| 3 | 9 | 6 | 11 | 58 | 30 | 42 | 8 | |||||||||||||||||||||||
| 1 | 3 | 1 | 3 | 19 | 11 | 12 | 2 | |||||||||||||||||||||||
| 12 | 13 | 12 | 16 | 28 | 20 | 24 | 13 | |||||||||||||||||||||||
| 18 | 55 | 28 | 65 | 302 | 171 | 254 | 26 | |||||||||||||||||||||||
| $ | 17,007 | $ | 52,712 | $ | 24,509 | $ | 61,224 | $ | 351,018 | $ | 197,689 | $ | 226,400 | $ | 34,304 | |||||||||||||||
| $ | 16,304 | $ | 19,617 | $ | 11,184 | $ | 39,058 | $ | 148,924 | $ | 92,128 | $ | 149,536 | $ | 22,922 | |||||||||||||||
| 13 | 1,526 | 196 | 171 | 2,087 | 1,910 | 2,228 | 330 | |||||||||||||||||||||||
| 1,229 | 14,139 | 4,834 | 4,054 | 33,566 | 19,263 | 13,558 | 6,037 | |||||||||||||||||||||||
| (539 | ) | 17,430 | 8,295 | 17,941 | 166,441 | 84,388 | 61,078 | 5,015 | ||||||||||||||||||||||
| $ | 17,007 | $ | 52,712 | $ | 24,509 | $ | 61,224 | $ | 351,018 | $ | 197,689 | $ | 226,400 | $ | 34,304 | |||||||||||||||
| 200,000 | 200,000 | 200,000 | 200,000 | 200,000 | 200,000 | 200,000 | 200,000 | |||||||||||||||||||||||
| $ | 0.001 | $ | 0.001 | $ | 0.001 | $ | 0.001 | $ | 0.001 | $ | 0.001 | $ | 0.001 | $ | 0.001 | |||||||||||||||
| $ | 9.66 | $ | 11.24 | $ | 12.56 | $ | 9.47 | $ | 13.09 | $ | 13.26 | $ | 10.27 | $ | 9.17 | |||||||||||||||
| 1,760 | 4,691 | 1,951 | 6,465 | 26,824 | 14,913 | 22,042 | 3,742 | |||||||||||||||||||||||
| $ | 17,007 | $ | 52,712 | $ | 24,509 | $ | 61,224 | $ | 351,018 | $ | 197,689 | $ | 226,400 | $ | 34,304 | |||||||||||||||
| $ | 17,560 | $ | 35,301 | $ | 16,229 | $ | 43,306 | $ | 184,643 | $ | 113,342 | $ | 165,370 | $ | 29,306 | |||||||||||||||
The accompanying notes are an integral part of these financial statements.
| 21 |
| Hartford Series Fund, Inc. |
| Statements of Operations |
| For the Year Ended December 31, 2013 |
| (000’s Omitted) |
|
| American Funds Asset Allocation HLS Fund | American Funds Blue Chip Income and Growth HLS Fund | American Funds Bond HLS Fund | ||||||||||
| Investment Income: | ||||||||||||
| Dividends from underlying funds | $ | 1,054 | $ | 893 | $ | 4,636 | ||||||
| Total investment income | 1,054 | 893 | 4,636 | |||||||||
| Expenses: | ||||||||||||
| Investment management fees | 451 | 323 | 1,047 | |||||||||
| Transfer agent fees | — | — | — | |||||||||
| Distribution fees - Class IB | 173 | 108 | 523 | |||||||||
| Custodian fees | — | — | — | |||||||||
| Accounting services fees | 7 | 4 | 21 | |||||||||
| Board of Directors' fees | 2 | 2 | 6 | |||||||||
| Audit fees | 11 | 10 | 12 | |||||||||
| Other expenses | 15 | 13 | 55 | |||||||||
| Total expenses (before waivers) | 659 | 460 | 1,664 | |||||||||
| Expense waivers | (277 | ) | (215 | ) | (523 | ) | ||||||
| Total waivers | (277 | ) | (215 | ) | (523 | ) | ||||||
| Total expenses, net | 382 | 245 | 1,141 | |||||||||
| Net Investment Income (Loss) | 672 | 648 | 3,495 | |||||||||
| Net Realized Gain on Investments: | ||||||||||||
| Capital gain distribution received from underlying funds | — | — | 2,111 | |||||||||
| Net realized gain on investments in underlying funds | 13,871 | 7,073 | 3,601 | |||||||||
| Net Realized Gain on Investments | 13,871 | 7,073 | 5,712 | |||||||||
| Net Changes in Unrealized Appreciation of Investments: | ||||||||||||
| Net unrealized appreciation (depreciation) of investments in underlying funds | (131 | ) | 4,336 | (13,611 | ) | |||||||
| Net Gain (Loss) on Investments | 13,740 | 11,409 | (7,899 | ) | ||||||||
| Net Increase (Decrease) in Net Assets Resulting from Operations | $ | 14,412 | $ | 12,057 | $ | (4,404 | ) | |||||
The accompanying notes are an integral part of these financial statements.
| 22 |
| American Funds Global Bond HLS Fund | American Funds Global Growth and Income HLS Fund | American Funds Global Growth HLS Fund | American Funds Global Small Capitalization HLS Fund | American Funds Growth HLS Fund | American Funds Growth-Income HLS Fund | American Funds International HLS Fund | American Funds New World HLS Fund | |||||||||||||||||||||||
| $ | — | $ | 1,901 | $ | 358 | $ | 503 | $ | 3,979 | $ | 2,969 | $ | 3,469 | $ | 581 | |||||||||||||||
| — | 1,901 | 358 | 503 | 3,979 | 2,969 | 3,469 | 581 | |||||||||||||||||||||||
| 214 | 537 | 275 | 460 | 2,623 | 1,373 | 1,918 | 476 | |||||||||||||||||||||||
| — | — | — | — | — | — | — | — | |||||||||||||||||||||||
| 72 | 168 | 69 | 144 | 874 | 490 | 564 | 108 | |||||||||||||||||||||||
| — | — | — | — | — | — | — | — | |||||||||||||||||||||||
| 3 | 7 | 3 | 6 | 35 | 20 | 23 | 4 | |||||||||||||||||||||||
| 2 | 3 | 2 | 2 | 11 | 6 | 6 | 2 | |||||||||||||||||||||||
| 10 | 11 | 10 | 11 | 13 | 12 | 12 | 11 | |||||||||||||||||||||||
| 10 | 17 | 10 | 25 | 85 | 41 | 72 | 18 | |||||||||||||||||||||||
| 311 | 743 | 369 | 648 | 3,641 | 1,942 | 2,595 | 619 | |||||||||||||||||||||||
| (143 | ) | (369 | ) | (207 | ) | (316 | ) | (1,749 | ) | (883 | ) | (1,354 | ) | (368 | ) | |||||||||||||||
| (143 | ) | (369 | ) | (207 | ) | (316 | ) | (1,749 | ) | (883 | ) | (1,354 | ) | (368 | ) | |||||||||||||||
| 168 | 374 | 162 | 332 | 1,892 | 1,059 | 1,241 | 251 | |||||||||||||||||||||||
| (168 | ) | 1,527 | 196 | 171 | 2,087 | 1,910 | 2,228 | 330 | ||||||||||||||||||||||
| 397 | — | — | — | — | — | — | 214 | |||||||||||||||||||||||
| 1,066 | 16,033 | 6,426 | 6,456 | 42,711 | 23,134 | 19,588 | 7,849 | |||||||||||||||||||||||
| 1,463 | 16,033 | 6,426 | 6,456 | 42,711 | 23,134 | 19,588 | 8,063 | |||||||||||||||||||||||
| (2,614 | ) | (4,586 | ) | 199 | 7,590 | 45,996 | 30,844 | 21,768 | (4,486 | ) | ||||||||||||||||||||
| (1,151 | ) | 11,447 | 6,625 | 14,046 | 88,707 | 53,978 | 41,356 | 3,577 | ||||||||||||||||||||||
| $ | (1,319 | ) | $ | 12,974 | $ | 6,821 | $ | 14,217 | $ | 90,794 | $ | 55,888 | $ | 43,584 | $ | 3,907 | ||||||||||||||
The accompanying notes are an integral part of these financial statements.
| 23 |
| Hartford Series Fund, Inc. |
| Statements of Changes in Net Assets |
| (000’s Omitted) |
| American Funds Asset Allocation HLS Fund | American Funds Blue Chip Income and Growth HLS Fund | |||||||||||||||
| For the Year Ended December 31, 2013 | For the Year Ended December 31, 2012 | For the Year Ended December 31, 2013 | For the Year Ended December 31, 2012 | |||||||||||||
| Operations: | ||||||||||||||||
| Net investment income (loss) | $ | 672 | $ | 1,042 | $ | 648 | $ | 628 | ||||||||
| Net realized gain on investments | 13,871 | 4,503 | 7,073 | 2,809 | ||||||||||||
| Net unrealized appreciation (depreciation) of investments | (131 | ) | 4,256 | 4,336 | 1,230 | |||||||||||
| Net Increase (Decrease) in Net assets Resulting from Operations | 14,412 | 9,801 | 12,057 | 4,667 | ||||||||||||
| Distributions to Shareholders: | ||||||||||||||||
| From net investment income | ||||||||||||||||
| Class IB | (1,042 | ) | (1,026 | ) | (628 | ) | (467 | ) | ||||||||
| From net realized gain on investments | ||||||||||||||||
| Class IB | (4,503 | ) | (140 | ) | (2,802 | ) | (266 | ) | ||||||||
| Total distributions | (5,545 | ) | (1,166 | ) | (3,430 | ) | (733 | ) | ||||||||
| Capital Share Transactions: | ||||||||||||||||
| Class IB | ||||||||||||||||
| Sold | 24,495 | 10,741 | 12,319 | 14,324 | ||||||||||||
| Issued on reinvestment of distributions | 5,545 | 1,166 | 3,430 | 733 | ||||||||||||
| Redeemed | (40,562 | ) | (20,282 | ) | (20,794 | ) | (11,496 | ) | ||||||||
| Net increase (decrease) from capital share transactions | (10,522 | ) | (8,375 | ) | (5,045 | ) | 3,561 | |||||||||
| Net increase (decrease) in net assets | (1,655 | ) | 260 | 3,582 | 7,495 | |||||||||||
| Net Assets: | ||||||||||||||||
| Beginning of period | 64,616 | 64,356 | 39,920 | 32,425 | ||||||||||||
| End of period | $ | 62,961 | $ | 64,616 | $ | 43,502 | $ | 39,920 | ||||||||
| Undistributed (distribution in excess of) | ||||||||||||||||
| net investment income | $ | 672 | $ | 1,042 | $ | 648 | $ | 628 | ||||||||
| Shares: | ||||||||||||||||
| Class IB | ||||||||||||||||
| Sold | 2,034 | 1,021 | 1,090 | 1,460 | ||||||||||||
| Issued on reinvestment of distributions | 475 | 109 | 307 | 73 | ||||||||||||
| Redeemed | (3,375 | ) | (1,912 | ) | (1,811 | ) | (1,160 | ) | ||||||||
| Total share activity | (866 | ) | (782 | ) | (414 | ) | 373 | |||||||||
The accompanying notes are an integral part of these financial statements.
| 24 |
| American Funds Bond HLS Fund | American Funds Global Bond HLS Fund | American Funds Global Growth and Income HLS Fund | American Funds Global Growth HLS Fund | |||||||||||||||||||||||||||
| For the Year Ended December 31, 2013 | For the Year Ended December 31, 2012 | For the Year Ended December 31, 2013 | For the Year Ended December 31, 2012 | For the Year Ended December 31, 2013 | For the Year Ended December 31, 2012 | For the Year Ended December 31, 2013 | For the Year Ended December 31, 2012 | |||||||||||||||||||||||
| $ | 3,495 | $ | 4,314 | $ | (168 | ) | $ | 706 | $ | 1,527 | $ | 1,598 | $ | 196 | $ | 147 | ||||||||||||||
| 5,712 | 6,087 | 1,463 | 2,000 | 16,033 | 2,782 | 6,426 | 1,741 | |||||||||||||||||||||||
| (13,611 | ) | (428 | ) | (2,614 | ) | (311 | ) | (4,586 | ) | 7,964 | 199 | 4,172 | ||||||||||||||||||
| (4,404 | ) | 9,973 | (1,319 | ) | 2,395 | 12,974 | 12,344 | 6,821 | 6,060 | |||||||||||||||||||||
| (4,314 | ) | (5,360 | ) | (888 | ) | (1,092 | ) | (1,598 | ) | (1,976 | ) | (147 | ) | (313 | ) | |||||||||||||||
| (5,996 | ) | (4,400 | ) | (1,720 | ) | (825 | ) | (986 | ) | — | (1,740 | ) | (324 | ) | ||||||||||||||||
| (10,310 | ) | (9,760 | ) | (2,608 | ) | (1,917 | ) | (2,584 | ) | (1,976 | ) | (1,887 | ) | (637 | ) | |||||||||||||||
| 90,232 | 33,978 | 4,223 | 3,834 | 4,966 | 4,117 | 4,045 | 2,125 | |||||||||||||||||||||||
| 10,310 | 9,760 | 2,608 | 1,917 | 2,584 | 1,976 | 1,887 | 637 | |||||||||||||||||||||||
| (47,990 | ) | (43,146 | ) | (24,090 | ) | (12,388 | ) | (40,155 | ) | (20,173 | ) | (15,412 | ) | (8,449 | ) | |||||||||||||||
| 52,552 | 592 | (17,259 | ) | (6,637 | ) | (32,605 | ) | (14,080 | ) | (9,480 | ) | (5,687 | ) | |||||||||||||||||
| 37,838 | 805 | (21,186 | ) | (6,159 | ) | (22,215 | ) | (3,712 | ) | (4,546 | ) | (264 | ) | |||||||||||||||||
| 199,008 | 198,203 | 38,193 | 44,352 | 74,927 | 78,639 | 29,055 | 29,319 | |||||||||||||||||||||||
| $ | 236,846 | $ | 199,008 | $ | 17,007 | $ | 38,193 | $ | 52,712 | $ | 74,927 | $ | 24,509 | $ | 29,055 | |||||||||||||||
| $ | 3,495 | $ | 4,314 | $ | 13 | $ | 887 | $ | 1,526 | $ | 1,597 | $ | 196 | $ | 147 | |||||||||||||||
| 9,050 | 3,188 | 409 | 342 | 481 | 452 | 356 | 219 | |||||||||||||||||||||||
| 1,064 | 943 | 273 | 177 | 252 | 221 | 168 | 65 | |||||||||||||||||||||||
| (4,730 | ) | (4,046 | ) | (2,362 | ) | (1,105 | ) | (3,865 | ) | (2,235 | ) | (1,352 | ) | (861 | ) | |||||||||||||||
| 5,384 | 85 | (1,680 | ) | (586 | ) | (3,132 | ) | (1,562 | ) | (828 | ) | (577 | ) | |||||||||||||||||
The accompanying notes are an integral part of these financial statements.
| 25 |
| Hartford Series Fund, Inc. |
| Statements of Changes in Net Assets – (continued) |
| (000’s Omitted) |
| American Funds Global Small Capitalization HLS Fund | American Funds Growth HLS Fund | |||||||||||||||
| For the Year Ended December 31, 2013 | For the Year Ended December 31, 2012 | For the Year Ended December 31, 2013 | For the Year Ended December 31, 2012 | |||||||||||||
| Operations: | ||||||||||||||||
| Net investment income | $ | 171 | $ | 560 | $ | 2,087 | $ | 1,686 | ||||||||
| Net realized gain on investments | 6,456 | 5,606 | 42,711 | 10,749 | ||||||||||||
| Net unrealized appreciation (depreciation) of investments | 7,590 | 3,066 | 45,996 | 41,625 | ||||||||||||
| Net Increase in Net assets Resulting from Operations | 14,217 | 9,232 | 90,794 | 54,060 | ||||||||||||
| Distributions to Shareholders: | ||||||||||||||||
| From net investment income | ||||||||||||||||
| Class IB | (560 | ) | (648 | ) | (1,685 | ) | (1,117 | ) | ||||||||
| From net realized gain on investments | ||||||||||||||||
| Class IB | (5,594 | ) | (4,957 | ) | (10,749 | ) | (975 | ) | ||||||||
| Total distributions | (6,154 | ) | (5,605 | ) | (12,434 | ) | (2,092 | ) | ||||||||
| Capital Share Transactions: | ||||||||||||||||
| Class IB | ||||||||||||||||
| Sold | 11,979 | 3,154 | 31,235 | 33,586 | ||||||||||||
| Issued on reinvestment of distributions | 6,154 | 5,605 | 12,434 | 2,092 | ||||||||||||
| Redeemed | (18,853 | ) | (14,163 | ) | (104,900 | ) | (71,725 | ) | ||||||||
| Net decrease from capital share transactions | (720 | ) | (5,404 | ) | (61,231 | ) | (36,047 | ) | ||||||||
| Net increase (decrease) in net assets | 7,343 | (1,777 | ) | 17,129 | 15,921 | |||||||||||
| Net Assets: | ||||||||||||||||
| Beginning of period | 53,881 | 55,658 | 333,889 | 317,968 | ||||||||||||
| End of period | $ | 61,224 | $ | 53,881 | $ | 351,018 | $ | 333,889 | ||||||||
| Undistributed (distribution in excess of) | ||||||||||||||||
| net investment income | $ | 171 | $ | 560 | $ | 2,087 | $ | 1,685 | ||||||||
| Shares: | ||||||||||||||||
| Class IB | ||||||||||||||||
| Sold | 1,336 | 379 | 2,713 | 3,394 | ||||||||||||
| Issued on reinvestment of distributions | 707 | 731 | 1,060 | 210 | ||||||||||||
| Redeemed | (2,081 | ) | (1,717 | ) | (8,886 | ) | (7,202 | ) | ||||||||
| Total share activity | (38 | ) | (607 | ) | (5,113 | ) | (3,598 | ) | ||||||||
The accompanying notes are an integral part of these financial statements.
| 26 |
| American Funds Growth-Income HLS Fund | American Funds International HLS Fund | American Funds New World HLS Fund | ||||||||||||||||||||
| For the Year Ended December 31, 2013 | For the Year Ended December 31, 2012 | For the Year Ended December 31, 2013 | For the Year Ended December 31, 2012 | For the Year Ended December 31, 2013 | For the Year Ended December 31, 2012 | |||||||||||||||||
| $ | 1,910 | $ | 2,338 | $ | 2,228 | $ | 2,543 | $ | 330 | $ | 325 | |||||||||||
| 23,134 | 3,072 | 19,588 | 4,308 | 8,063 | 4,944 | |||||||||||||||||
| 30,844 | 22,943 | 21,768 | 28,881 | (4,486 | ) | 3,202 | ||||||||||||||||
| 55,888 | 28,353 | 43,584 | 35,732 | 3,907 | 8,471 | |||||||||||||||||
| (2,338 | ) | (2,243 | ) | (2,543 | ) | (3,474 | ) | (325 | ) | (835 | ) | |||||||||||
| (2,361 | ) | — | (4,233 | ) | — | (4,907 | ) | (2,795 | ) | |||||||||||||
| (4,699 | ) | (2,243 | ) | (6,776 | ) | (3,474 | ) | (5,232 | ) | (3,630 | ) | |||||||||||
| 27,350 | 25,921 | 19,705 | 20,802 | 5,406 | 6,030 | |||||||||||||||||
| 4,699 | 2,243 | 6,776 | 3,474 | 5,232 | 3,630 | |||||||||||||||||
| (68,769 | ) | (41,113 | ) | (62,187 | ) | (39,635 | ) | (26,706 | ) | (15,373 | ) | |||||||||||
| (36,720 | ) | (12,949 | ) | (35,706 | ) | (15,359 | ) | (16,068 | ) | (5,713 | ) | |||||||||||
| 14,469 | 13,161 | 1,102 | 16,899 | (17,393 | ) | (872 | ) | |||||||||||||||
| 183,220 | 170,059 | 225,298 | 208,399 | 51,697 | 52,569 | |||||||||||||||||
| $ | 197,689 | $ | 183,220 | $ | 226,400 | $ | 225,298 | $ | 34,304 | $ | 51,697 | |||||||||||
| $ | 1,910 | $ | 2,338 | $ | 2,228 | $ | 2,543 | $ | 330 | $ | 325 | |||||||||||
| 2,387 | 2,678 | 2,147 | 2,601 | 591 | 658 | |||||||||||||||||
| 397 | 226 | �� | 733 | 432 | 610 | 417 | ||||||||||||||||
| (5,833 | ) | (4,240 | ) | (6,641 | ) | (4,853 | ) | (2,923 | ) | (1,684 | ) | |||||||||||
| (3,049 | ) | (1,336 | ) | (3,761 | ) | (1,820 | ) | (1,722 | ) | (609 | ) | |||||||||||
The accompanying notes are an integral part of these financial statements.
| 27 |
| Hartford Series Fund, Inc. |
| Notes to Financial Statements |
| December 31, 2013 |
| (000’s Omitted) |
| 1. | Organization: |
The Hartford HLS Funds serve as underlying investment options for certain variable annuity and variable life insurance separate accounts of Hartford Life Insurance Company (“HLIC”) and its affiliates and certain qualified retirement plans. Certain Hartford HLS Funds may also serve as underlying investment options for certain variable annuity and variable life separate accounts of other insurance companies. Owners of variable annuity contracts and policyholders of variable life insurance contracts may choose the funds permitted in the variable insurance contract prospectus. In addition, participants in certain qualified retirement plans may choose the funds if permitted by their plans.
Hartford Series Fund, Inc. (the “Company”) is an open-end management investment company comprised of thirty portfolios, eleven portfolios of which are included in these financial statements (each a “Fund” or together the “Funds”). These eleven portfolios of the Company are Hartford Series Fund, Inc. (the “Company”) is an open-end management investment company comprised of thirty portfolios, eleven portfolios of which are included in these financial statements (each a “Fund” or together the “Funds”). These eleven portfolios of the Company are American Funds Asset Allocation HLS Fund, American Funds Blue Chip Income and Growth HLS Fund, American Funds Bond HLS Fund, American Funds Global Bond HLS Fund, American Funds Global Growth and Income HLS Fund, American Funds Global Growth HLS Fund, American Funds Global Small Capitalization HLS Fund, American Funds Growth HLS Fund, American Funds Growth-Income HLS Fund, American Funds International HLS Fund and American Funds New World HLS Fund.
The Company is organized under the laws of the State of Maryland and is registered with the Securities and Exchange Commission (“SEC”) under the Investment Company Act of 1940, as amended (“1940 Act”). Each Fund is organized as a diversified open-end management investment The Company is organized under the laws of the State of Maryland and is registered with the Securities and Exchange Commission (“SEC”) under the Investment Company Act of 1940, as amended (“1940 Act”). Each Fund is organized as a diversified open-end management investment company, except for American Funds Global Bond HLS Fund, which is non-diversified.
Each Fund operates in the manner of a fund of funds, investing in shares of underlying mutual funds (the “Underlying Funds”). Each Underlying Fund is offered by American Funds Insurance Series, and is a registered open-end investment company. The Funds and their related Underlying Funds are listed below:
| Fund | Underlying Fund | |
| American Funds Asset Allocation HLS Fund | Asset Allocation Fund Class 1 | |
| American Funds Blue Chip Income and Growth HLS Fund | Blue Chip Income and Growth Fund Class 1 | |
| American Funds Bond HLS Fund | Bond Fund Class 1 | |
| American Funds Global Bond HLS Fund | Global Bond Fund Class 1 | |
| American Funds Global Growth and Income HLS Fund | Global Growth and Income Fund Class 1 | |
| American Funds Global Growth HLS Fund | Global Growth Fund Class 1 | |
| American Funds Global Small Capitalization HLS Fund | Global Small Capitalization Fund Class 1 | |
| American Funds Growth HLS Fund | Growth Fund Class 1 | |
| American Funds Growth-Income HLS Fund | Growth-Income Fund Class 1 | |
| American Funds International HLS Fund | International Fund Class 1 | |
| American Funds New World HLS Fund | New World Fund Class 1 |
The Underlying Funds’ accounting policies are outlined in the Underlying Funds’ shareholder report, which accompanies this report.
Class IB shares of the Funds are offered at the per share net asset value (“NAV”) without a sales charge and are subject to distribution fees charged pursuant to a Distribution and Service Plan. The Distribution and Service Plan has been adopted in accordance with Rule 12b-1 under the 1940 Act.
| 2. | Significant Accounting Policies: |
The following is a summary of significant accounting policies of the Funds in the preparation of their financial statements, which are in accordance with United States Generally Accepted Accounting Principles (“U.S. GAAP”). The preparation of financial statements in accordance with U.S. GAAP may require management to make estimates and assumptions that affect
| 28 |
the reported amounts of assets and liabilities and disclosure of contingent assets and liabilities at the date of the financial statements and the reported amounts of increases and decreases in net assets from operations during the reporting period. Actual results could differ from those estimates.
| a) | Determination of Net Asset Value – The NAV of the Funds’ shares is determined as of the close of regular trading (normally 4:00 p.m. Eastern Time) (the “NYSE Close”) on each day that the New York Stock Exchange (the “Exchange”) is open (“Valuation Date”). Information that becomes known to the Funds after the NAV has been calculated on a particular day will not generally be used to retroactively adjust the NAV determined earlier that day. |
| b) | Investment Valuation – Investments in the Underlying Funds are valued at the respective NAV of each Underlying Fund as determined as of the NYSE Close on the Valuation Date. Valuation of investments held by the Underlying Funds is discussed in Notes to Financial Statements of the Underlying Funds, which are included in the Underlying Funds’ shareholder report, accompanying this report. |
U.S. GAAP defines fair value as the price that the Fund would receive to sell an asset or pay to transfer a liability in an orderly transaction between market participants. The U.S. GAAP fair value measurement standards require disclosure of a fair value hierarchy for each major category of assets and liabilities. Various inputs are used in determining the fair value of each Fund’s investments. These inputs are summarized into three broad hierarchy levels. This hierarchy is based on whether the valuation inputs are observable or unobservable. These levels are:
| · | Level 1 – Quoted prices in active markets for identical investments. |
| · | Level 2 – Observable inputs other than Level 1 prices, such as quoted prices for similar investments; quoted prices in markets that are not active; or other inputs that are observable or can be corroborated by observable market data. |
| · | Level 3 – Significant unobservable inputs that are supported by limited or no market activity. Level 3 may include financial instruments whose values are determined using indicative market quotes or require significant management judgment or estimation. |
Valuation levels are not necessarily indicative of the risk associated with investing in such investments. Individual investments within any of the above mentioned asset classes may be assigned a different hierarchical level than those presented above, as individual circumstances dictate.
During the year ended December 31, 2013, the Funds held no Level 3 securities, and therefore, no reconciliations of Level 3 securities are presented.
For additional information, refer to the investment valuation hierarchy level summary which follows the Schedule of Investments for each Fund.
For purposes of reporting transfers between different hierarchy levels, both transfers in and out of each level, as applicable, are shown as if they occurred at the beginning of the period. During the year ended December 31, 2013, there were no transfers between different hierarchy levels.
| c) | Investment Transactions and Investment Income – Investment transactions are recorded as of the trade date (the date the order to buy or sell is executed) for financial reporting purposes. Realized gains and losses are determined on the basis of identified cost. |
Income and capital gain distributions from the Underlying Funds are accrued on the ex-dividend date.
| d) | Fund Share Valuation and Dividend Distributions to Shareholders – Orders for the Funds’ shares are executed in accordance with the investment instructions of the contract holders. The NAV of each Fund’s shares is determined as of |
| 29 |
| Hartford Series Fund, Inc. |
| Notes to Financial Statements – (continued) |
| December 31, 2013 |
| (000’s Omitted) |
the close of each business day of the Exchange. The NAV is determined for each Fund by dividing the Fund’s net assets by the number of shares outstanding. Orders for the purchase of a Fund’s shares received by an insurance company prior to the close of the Exchange on any day on which the Exchange is open for business are priced at the NAV determined as of the close of the Exchange. Orders received by an insurance company after the close of the Exchange, or on a day on which the Exchange and/or the Fund is not open for business, are priced at the next determined NAV.
Dividends are declared pursuant to a policy adopted by the Company’s Board of Directors based upon the investment performance of the Funds. The policy of all the Funds is to pay dividends from net investment income and realized capital gains, if any, at least once a year.
Distributions from net investment income, realized capital gains and capital are determined in accordance with federal income tax regulations, which may differ from U.S. GAAP with respect to character and timing. These differences may include, but are not limited to, losses deferred due to wash sale adjustments and short-term capital gain adjustments. Permanent book and federal income tax basis differences relating to shareholder distributions will result in reclassifications to certain of the Funds’ capital accounts (see Federal Income Taxes: Reclassification of Capital Accounts note).
| 3. | Principal Risks: |
The Funds are exposed to the risks of the Underlying Funds in direct proportion to the amount of assets each Fund allocates to each Underlying Fund. The market values of the Underlying Funds may decline due to general market conditions which are not specifically related to a particular fund, such as real or perceived adverse economic conditions or adverse investor sentiment generally.
| 4. | Federal Income Taxes: |
| a) | Federal Income Taxes – For federal income tax purposes, the Funds intend to continue to qualify as Regulated Investment Companies (“RIC”) under Subchapter M of the Internal Revenue Code (“IRC”) by distributing substantially all of their taxable net investment income and net realized capital gains to their shareholders and otherwise complying with the requirements of the IRC. The Funds have distributed substantially all of their income and capital gains in the prior year and each Fund intends to distribute substantially all of its income and gains prior to the next fiscal year end. Accordingly, no provision for federal income or excise taxes has been made in the accompanying financial statements. Distributions from short-term capital gains are treated as ordinary income distributions for federal income tax purposes. |
| b) | Net Investment Income (Loss), Net Realized Gains (Losses) and Distributions – Net investment income (loss) and net realized gains (losses) may differ for financial statement and tax purposes primarily because of losses deferred due to wash sale adjustments and short-term capital gain adjustments. The character of distributions made during the year from net investment income or net realized gains may differ from their ultimate characterization for federal income tax purposes. Also, due to the timing of dividend distributions, the fiscal year in which amounts are distributed may differ from the year that the net investment income (loss) or net realized gains (losses) were recorded by a Fund. |
| 30 |
| c) | Distributions and Components of Distributable Earnings – The tax character of distributions paid by the Funds for the periods indicated is as follows (as adjusted for dividends payable, if applicable): |
| For the Year Ended December 31, 2013 | For the Year Ended December 31, 2012 | |||||||||||||||||||||||
| Ordinary Income | Long- Term Capital Gains(a) | Tax return of capital | Ordinary Income | Long- Term Capital Gains(a) | Tax | |||||||||||||||||||
| American Funds Asset Allocation HLS Fund | $ | 1,042 | $ | 4,503 | $ | — | $ | 1,026 | $ | 140 | $ | — | ||||||||||||
| American Funds Blue Chip Income and Growth HLS Fund | 628 | 2,802 | — | 467 | 266 | — | ||||||||||||||||||
| American Funds Bond HLS Fund | 4,314 | 5,996 | — | 5,360 | 4,400 | — | ||||||||||||||||||
| American Funds Global Bond HLS Fund | 888 | 1,720 | — | 1,092 | 825 | — | ||||||||||||||||||
| American Funds Global Growth and Income HLS Fund | 1,598 | 986 | — | 1,976 | — | — | ||||||||||||||||||
| American Funds Global Growth HLS Fund | 147 | 1,740 | — | 313 | 324 | — | ||||||||||||||||||
| American Funds Global Small Capitalization HLS Fund | 560 | 5,594 | — | 648 | 4,957 | — | ||||||||||||||||||
| American Funds Growth HLS Fund | 1,685 | 10,749 | — | 1,117 | 975 | — | ||||||||||||||||||
| American Funds Growth-Income HLS Fund | 2,338 | 2,361 | — | 2,243 | — | — | ||||||||||||||||||
| American Funds International HLS Fund | 2,543 | 4,233 | — | 3,474 | — | — | ||||||||||||||||||
| American Funds New World HLS Fund | 325 | 4,907 | — | 835 | 2,795 | — | ||||||||||||||||||
| (a) | The Funds designate these distributions as long-term capital dividends per IRC code Sec. 852(b) (3) (C). |
As of December 31, 2013, the components of distributable earnings (deficit) on a tax basis were as follows:
| Undistributed Ordinary Income | Undistributed Long-Term Capital Gain | Accumulated Capital and Other Losses | Unrealized Appreciation (Depreciation)@ | Total Accumulated Earnings (Deficit) | ||||||||||||||||
| American Funds Asset Allocation HLS Fund | $ | 672 | $ | 12,361 | $ | – | $ | 12,546 | $ | 25,579 | ||||||||||
| American Funds Blue Chip Income and Growth HLS Fund | 648 | 6,668 | – | 11,066 | 18,382 | |||||||||||||||
| American Funds Bond HLS Fund | 3,495 | 5,614 | – | (2,291 | ) | 6,818 | ||||||||||||||
| American Funds Global Bond HLS Fund | 13 | 1,240 | – | (550 | ) | 703 | ||||||||||||||
| American Funds Global Growth and Income HLS Fund | 1,526 | 15,812 | – | 15,757 | 33,095 | |||||||||||||||
| American Funds Global Growth HLS Fund | 196 | 6,029 | – | 7,100 | 13,325 | |||||||||||||||
| American Funds Global Small Capitalization HLS Fund | 171 | 6,088 | – | 15,907 | 22,166 | |||||||||||||||
| American Funds Growth HLS Fund | 2,087 | 42,710 | – | 157,297 | 202,094 | |||||||||||||||
| American Funds Growth-Income HLS Fund | �� | 1,910 | 23,133 | – | 80,518 | 105,561 | ||||||||||||||
| American Funds International HLS Fund | 2,228 | 19,404 | – | 55,232 | 76,864 | |||||||||||||||
| American Funds New World HLS Fund | 330 | 6,582 | – | 4,470 | 11,382 | |||||||||||||||
| @ | The difference between book-basis and tax-basis unrealized appreciation (depreciation) is attributable primarily to the tax deferral of wash sale losses. |
| 31 |
| Hartford Series Fund, Inc. |
| Notes to Financial Statements – (continued) |
| December 31, 2013 |
| (000’s Omitted) |
| d) | Reclassification of Capital Accounts – The Funds may record reclassifications in their capital accounts. These reclassifications have no impact on the total net assets of the Funds. The reclassifications are a result of permanent differences between U.S. GAAP and tax accounting for items such as net operating losses that reduce distribution requirements. Adjustments are made to reflect the impact these items have on current and future distributions to shareholders. Therefore, the source of a Fund’s distributable income may be shown in the accompanying Statement of Assets and Liabilities as from net investment income, from net realized gains on investments or from capital depending on the type of book and tax differences that exist. For the year ended December 31, 2013, the Funds recorded the following reclassifications to increase (decrease) the accounts listed below. |
| Net Investment Income (Loss) | Net Realized Gain (Loss) | Paid-in- Capital | ||||||||||
| American Funds Global Bond HLS Fund | $ | 182 | $ | (182 | ) | $ | – | |||||
| e) | Capital Loss Carryforward – On December 22, 2010, the Regulated Investment Company Modernization Act of 2010 (the “Act”) was enacted, which made changes to the capital loss carryforward rules. The changes are effective for taxable years beginning after the date of enactment. Under the Act, funds are permitted to carry forward capital losses for an unlimited period. However, any losses incurred during those future taxable years will be required to be utilized prior to the losses incurred in pre-enactment taxable years, which carry an expiration date. As a result of this ordering rule, pre-enactment capital loss carryforwards may be more likely to expire unused. Additionally, post-enactment capital loss carryforwards retain their character as either short-term or long-term capital losses rather than being considered all short-term as permitted under prior regulation. |
The Funds had no capital loss carryforward for U.S. federal income tax purposes as of December 31, 2013.
| f) | Accounting for Uncertainty in Income Taxes – The Funds have adopted financial reporting rules that require the Funds to analyze all open tax years, as defined by the Statute of Limitations, for all major jurisdictions. Generally, tax authorities can examine all tax returns filed for the last three years. The Funds do not have an examination in progress. |
The Funds have reviewed all open tax years and major jurisdictions and concluded that these financial reporting rules have no effect on the Funds’ financial positions or results of operations. There is no tax liability resulting from unrecognized tax benefits relating to uncertain income tax positions taken or expected to be taken on the tax returns for the fiscal year-end December 31, 2013. The Funds are also not aware of any tax positions for which it is reasonably possible that the total amounts of unrecognized tax benefits will significantly change in the next twelve months.
| 5. | Expenses: |
| a) | Investment Management Agreement – Hartford Funds Management Company, LLC (“HFMC”), an indirect wholly owned subsidiary of The Hartford Financial Services Group, Inc. (“The Hartford”), serves as investment manager to the Funds pursuant to an Investment Management Agreement with the Company. The investment manager has overall investment supervisory responsibility for each Fund. In addition, the investment manager provides administrative personnel, services, equipment, facilities and office space for proper operation of the Funds. |
| 32 |
The schedule below reflects the rates of compensation as a percentage of each Fund’s average daily net assets paid to the investment manager for investment management services rendered during the year ended December 31, 2013. The rates are accrued daily and paid monthly:
| Fund | Annual Rate* | |||
| American Funds Asset Allocation HLS Fund | 0.65 | % | ||
| American Funds Blue Chip Income and Growth HLS Fund | 0.75 | % | ||
| American Funds Bond HLS Fund | 0.50 | % | ||
| American Funds Global Bond HLS Fund | 0.75 | % | ||
| American Funds Global Growth and Income HLS Fund | 0.80 | % | ||
| American Funds Global Growth HLS Fund | 1.00 | % | ||
| American Funds Global Small Capitalization HLS Fund | 0.80 | % | ||
| American Funds Growth HLS Fund | 0.75 | % | ||
| American Funds Growth-Income HLS Fund | 0.70 | % | ||
| American Funds International HLS Fund | 0.85 | % | ||
| American Funds New World HLS Fund | 1.10 | % | ||
| * | The investment manager has entered into an agreement under which it will waive a portion of its investment management fee with respect to each Fund for as long as that Fund is invested in its corresponding Underlying Fund. The net investment management fee under the agreement with the investment manager, after giving effect to the waiver, is 0.25% of the average daily net assets for each Fund. |
| b) | Accounting Services Agreement – Pursuant to the Fund Accounting Agreement between HFMC and the Company, on behalf of the Funds, HFMC provides accounting services to the Funds and receives monthly compensation of 0.01% of each Fund’s average daily net assets. These fees are accrued daily and paid monthly. |
| c) | Other Related Party Transactions – Certain officers of the Funds are directors and/or officers of the investment manager and/or The Hartford or its subsidiaries. For the year ended December 31, 2013, a portion of the Funds’ Chief Compliance Officer’s salary was paid by all the investment companies in the Hartford fund complex. The portion allocated to the Funds was in the amount of $1. Hartford Administrative Services Company (“HASCO”), an indirect wholly owned subsidiary of The Hartford, provides transfer agent services to the Fund. HASCO was compensated on a per account basis for providing such services. The amount paid to HASCO can be found in the Statement of Operations. These fees are accrued daily and paid monthly. |
| d) | Operating Expenses – Allocable expenses incurred by the Company are allocated to each Fund in proportion to the average daily net assets of each Fund, except where allocation of certain expenses is more fairly made directly to the Fund. |
| e) | Distribution Plan for Class IB shares – Effective June 14, 2013, Hartford Investment Financial Services, LLC was renamed Hartford Funds Distributors, LLC (“HFD”). HFD, a wholly owned, ultimate subsidiary of The Hartford, serves as the Funds’ principal underwriter and distributor. The Company, on behalf of the Funds, has adopted a Distribution Plan pursuant to Rule 12b-1 of the 1940 Act to compensate the distributor, HFD, from assets attributable to the Class IB shares for services rendered and expenses borne in connection with activities primarily intended to result in the sale of the Class IB shares, subject to the review and approval of the Company’s Board of Directors. |
The Distribution Plan provides that each Fund may pay annually up to 0.25% of the average daily net assets of each Fund attributable to its Class IB shares for activities primarily intended to result in the sale of Class IB shares. The Board has the authority to suspend or reduce these payments at any point in time. Under the terms of the Distribution Plan and the principal underwriting agreement, each Fund is authorized to make payments monthly to the distributor that may be used to pay or compensate entities providing distribution and shareholder servicing with respect to the Class IB shares for such entities’ fees or expenses incurred or paid in that regard. These fees are accrued daily and paid monthly.
| 33 |
| Hartford Series Fund, Inc. |
| Notes to Financial Statements – (continued) |
| December 31, 2013 |
| (000’s Omitted) |
| 6. | Investment Transactions: |
For the year ended December 31, 2013, aggregate purchases and sales of investments in Underlying Funds (excluding short-term investments) were as follows:
| Cost of Purchases Excluding U.S. Government Obligations | Sales Proceeds Excluding U.S. Government Obligations | |||||||
| American Funds Asset Allocation HLS Fund | $ | 20,181 | $ | 35,567 | ||||
| American Funds Blue Chip Income and Growth HLS Fund | 7,006 | 14,822 | ||||||
| American Funds Bond HLS Fund | 80,132 | 32,263 | ||||||
| American Funds Global Bond HLS Fund | 2,719 | 22,351 | ||||||
| American Funds Global Growth and Income HLS Fund | 2,616 | 36,272 | ||||||
| American Funds Global Growth HLS Fund | 1,792 | 12,955 | ||||||
| American Funds Global Small Capitalization HLS Fund | 6,325 | 13,015 | ||||||
| American Funds Growth HLS Fund | 9,436 | 80,992 | ||||||
| American Funds Growth-Income HLS Fund | 10,743 | 50,236 | ||||||
| American Funds International HLS Fund | 10,090 | 50,327 | ||||||
| American Funds New World HLS Fund | 2,722 | 23,470 | ||||||
| 7. | Line of Credit: |
The Funds, along with several other Hartford funds, participate in a $500 million committed revolving line of credit facility. The facility is to be used for temporary or emergency purposes. Under the arrangement, a fund is required to own securities having a market value in excess of 300% of the total bank borrowings. The interest rate on borrowings varies depending on the nature of the loan. The facility also requires a fee to be paid based on the amount of the commitment. This commitment fee is allocated to all the funds participating in the line of credit based on the average net assets of the funds. During the year ended December 31, 2013, the Funds did not have any borrowings under this facility.
| 8. | Indemnifications: |
Under the Company’s organizational documents, the Company shall indemnify its officers and directors to the full extent required or permitted under Maryland General Corporation Law and the federal securities laws. In addition, the Company, on behalf of the Funds, may enter into contracts that contain a variety of indemnifications. The Company’s maximum exposure under these arrangements is unknown. However, as of the date of these financial statements the Company has not had prior claims or losses pursuant to these contracts and expects the risk of loss to be remote.
| 34 |
| 9. | Pending Legal Proceedings: |
On February 25, 2011, Jennifer L. Kasilag, Louis Mellinger, Judith M. Menendez, Jacqueline M. Robinson, and Linda A. Russell filed a derivative lawsuit against Hartford Investment Financial Services, LLC (“HIFSCO”)(now known as Hartford Funds Distributors, LLC) on behalf of six Hartford retail mutual funds in the United States District Court for the District of New Jersey, alleging that HIFSCO received excessive advisory and distribution fees in violation of its statutory fiduciary duty under Section 36(b) of the 1940 Act when serving as investment manager and principal underwriter, respectively, to the Hartford retail mutual funds. HIFSCO moved to dismiss and, in September 2011, the motion was granted in part and denied in part, with leave to amend the complaint. In November 2011, plaintiffs filed an amended complaint on behalf of certain Hartford retail mutual funds, The Hartford Global Health Fund (now known as The Hartford Healthcare Fund), The Hartford Conservative Allocation Fund, The Hartford Growth Opportunities Fund, The Hartford Inflation Plus Fund, The Hartford Advisers Fund (now known as The Hartford Balanced Fund), and The Hartford Capital Appreciation Fund. Plaintiffs seek to rescind the investment management agreements and distribution plans between HIFSCO and these funds and to recover the total fees charged thereunder or, in the alternative, to recover any improper compensation HIFSCO received, in addition to lost earnings. HIFSCO filed a partial motion to dismiss the amended complaint and, in December 2012, the court dismissed without prejudice the claims regarding distribution fees and denied the motion with respect to the advisory fees claims. HIFSCO disputes the allegations and intends to defend the advisory fee claims vigorously.
This action concerns the activities of HIFSCO in its capacity as investment manager and principal underwriter to the Hartford retail mutual funds and does not concern HIFSCO’s activities in its capacity as principal underwriter to the HLS funds. For this reason, no accrual for litigation relating to this matter has been recorded in the financial statements of the Fund.
| 35 |
| Hartford Series Fund, Inc. |
| Financial Highlights |
| ~ Selected Per-Share Data(A) ~ | ~ Ratios and Supplemental Data ~ | |||||||||||||||||||||||||||||||||||||||||||||||||||
| Class | Net Asset Value at Beginning of Period | Net Invest- ment Income (Loss) | Net Realized and Un- realized Gain (Loss) on Invest- ments | Total from Investment Operations | Dividends from Net Invest- ment Income | Distribu- tions from Realized Capital Gains | Total Dividends and Distributions | Net Asset Value at End of Period (000s) | Total Return(B) | Net Assets at End of Period (000s) | Ratio of Expenses to Average Net Assets Before Waivers(C) | Ratio of Expenses to Average Net Assets After Waivers(C) | Ratio of Net Investment Income (Loss) to Average Net Assets(C) | |||||||||||||||||||||||||||||||||||||||
| American Funds Asset Allocation HLS Fund | ||||||||||||||||||||||||||||||||||||||||||||||||||||
| For the Year Ended December 31, 2013 | ||||||||||||||||||||||||||||||||||||||||||||||||||||
| IB | $ | 11.04 | $ | 0.12 | $ | 2.39 | $ | 2.51 | $ | (0.17 | ) | $ | (0.75 | ) | $ | (0.92 | ) | $ | 12.63 | 23.40 | % | $ | 62,961 | 0.95 | % | 0.55 | % | 0.97 | % | |||||||||||||||||||||||
| For the Year Ended December 31, 2012(D) | ||||||||||||||||||||||||||||||||||||||||||||||||||||
| IB | 9.70 | 0.19 | 1.34 | 1.53 | (0.17 | ) | (0.02 | ) | (0.19 | ) | 11.04 | 15.80 | 64,616 | 0.95 | 0.55 | 1.56 | ||||||||||||||||||||||||||||||||||||
| For the Year Ended December 31, 2011(D) | ||||||||||||||||||||||||||||||||||||||||||||||||||||
| IB | 9.74 | 0.14 | (0.05 | ) | 0.09 | (0.13 | ) | – | (0.13 | ) | 9.70 | 1.02 | 64,356 | 0.95 | 0.55 | 1.61 | ||||||||||||||||||||||||||||||||||||
| For the Year Ended December 31, 2010(D) | ||||||||||||||||||||||||||||||||||||||||||||||||||||
| IB | 8.85 | 0.14 | 0.91 | 1.05 | (0.16 | ) | – | (0.16 | ) | 9.74 | 12.13 | 58,326 | 0.95 | 0.55 | 1.73 | |||||||||||||||||||||||||||||||||||||
| For the Year Ended December 31, 2009 | ||||||||||||||||||||||||||||||||||||||||||||||||||||
| IB | 7.31 | 0.18 | 1.53 | 1.71 | (0.14 | ) | (0.03 | ) | (0.17 | ) | 8.85 | 23.59 | 48,568 | 0.95 | 0.55 | 2.33 | ||||||||||||||||||||||||||||||||||||
| American Funds Blue Chip Income and Growth HLS Fund | ||||||||||||||||||||||||||||||||||||||||||||||||||||
| For the Year Ended December 31, 2013 | ||||||||||||||||||||||||||||||||||||||||||||||||||||
| IB | 10.11 | 0.17 | 3.02 | 3.19 | (0.18 | ) | (0.81 | ) | (0.99 | ) | 12.31 | 32.55 | 43,502 | 1.07 | 0.57 | 1.51 | ||||||||||||||||||||||||||||||||||||
| For the Year Ended December 31, 2012(D) | ||||||||||||||||||||||||||||||||||||||||||||||||||||
| IB | 9.07 | 0.15 | 1.07 | 1.22 | (0.12 | ) | (0.06 | ) | (0.18 | ) | 10.11 | 13.53 | 39,920 | 1.07 | 0.57 | 1.67 | ||||||||||||||||||||||||||||||||||||
| For the Year Ended December 31, 2011(D) | ||||||||||||||||||||||||||||||||||||||||||||||||||||
| IB | 9.18 | 0.13 | (0.24 | ) | (0.11 | ) | – | – | – | 9.07 | (1.19 | ) | 32,425 | 1.07 | 0.57 | 1.44 | ||||||||||||||||||||||||||||||||||||
| For the Year Ended December 31, 2010(D) | ||||||||||||||||||||||||||||||||||||||||||||||||||||
| IB | 8.44 | 0.12 | 0.86 | 0.98 | (0.24 | ) | – | (0.24 | ) | 9.18 | 11.98 | 34,030 | 1.07 | 0.57 | 1.48 | |||||||||||||||||||||||||||||||||||||
| For the Year Ended December 31, 2009 | ||||||||||||||||||||||||||||||||||||||||||||||||||||
| IB | 6.74 | 0.15 | 1.68 | 1.83 | (0.09 | ) | (0.04 | ) | (0.13 | ) | 8.44 | 27.46 | 29,030 | 1.07 | 0.57 | 2.06 | ||||||||||||||||||||||||||||||||||||
| American Funds Bond HLS Fund | ||||||||||||||||||||||||||||||||||||||||||||||||||||
| For the Year Ended December 31, 2013 | ||||||||||||||||||||||||||||||||||||||||||||||||||||
| IB | 10.52 | 0.17 | (0.42 | ) | (0.25 | ) | (0.22 | ) | (0.30 | ) | (0.52 | ) | 9.75 | (2.37 | ) | 236,846 | 0.79 | 0.54 | 1.67 | |||||||||||||||||||||||||||||||||
| For the Year Ended December 31, 2012(D) | ||||||||||||||||||||||||||||||||||||||||||||||||||||
| IB | 10.52 | 0.23 | 0.29 | 0.52 | (0.29 | ) | (0.23 | ) | (0.52 | ) | 10.52 | 5.01 | 199,008 | 0.79 | 0.54 | 2.13 | ||||||||||||||||||||||||||||||||||||
| For the Year Ended December 31, 2011(D) | ||||||||||||||||||||||||||||||||||||||||||||||||||||
| IB | 10.21 | 0.29 | 0.30 | 0.59 | (0.28 | ) | – | (0.28 | ) | 10.52 | 5.84 | 198,203 | 0.79 | 0.54 | 2.57 | |||||||||||||||||||||||||||||||||||||
| For the Year Ended December 31, 2010(D) | ||||||||||||||||||||||||||||||||||||||||||||||||||||
| IB | 9.84 | 0.26 | 0.35 | 0.61 | (0.24 | ) | – | (0.24 | ) | 10.21 | 6.15 | 206,360 | 0.80 | 0.55 | 2.75 | |||||||||||||||||||||||||||||||||||||
| For the Year Ended December 31, 2009 | ||||||||||||||||||||||||||||||||||||||||||||||||||||
| IB | 8.98 | 0.35 | 0.74 | 1.09 | (0.23 | ) | – | (0.23 | ) | 9.84 | 12.23 | 181,550 | 0.78 | 0.53 | 3.75 | |||||||||||||||||||||||||||||||||||||
See Portfolio Turnover information at the conclusion of Financial Highlights.
| 36 |
| ~ Selected Per-Share Data(A) ~ | ~ Ratios and Supplemental Data ~ | |||||||||||||||||||||||||||||||||||||||||||||||||||
| Class | Net Asset Value at Beginning of Period | Net Invest- ment Income (Loss) | Net Realized and Un- realized Gain (Loss) on Invest- ments | Total from Investment Operations | Dividends from Net Invest- ment Income | Distribu- tions from Realized Capital Gains | Total Dividends and Distributions | Net Asset Value at End of Period (000s) | Total Return(B) | Net Assets at End of Period (000s) | Ratio of Expenses to Average Net Assets Before Waivers(C) | Ratio of Expenses to Average Net Assets After Waivers(C) | Ratio of Net Investment Income (Loss) to Average Net Assets(C) | |||||||||||||||||||||||||||||||||||||||
| American Funds Global Bond HLS Fund | ||||||||||||||||||||||||||||||||||||||||||||||||||||
| For the Year Ended December 31, 2013 | ||||||||||||||||||||||||||||||||||||||||||||||||||||
| IB | $ | 11.10 | $ | (0.06 | ) | $ | (0.29 | ) | $ | (0.35 | ) | $ | (0.37 | ) | $ | (0.72 | ) | $ | (1.09 | ) | $ | 9.66 | (3.03 | )% | $ | 17,007 | 1.09 | % | 0.59 | % | (0.59 | )% | ||||||||||||||||||||
| For the Year Ended December 31, 2012(D) | ||||||||||||||||||||||||||||||||||||||||||||||||||||
| IB | 11.02 | 0.24 | 0.38 | 0.62 | (0.31 | ) | (0.23 | ) | (0.54 | ) | 11.10 | 5.83 | 38,193 | 1.07 | 0.57 | 1.69 | ||||||||||||||||||||||||||||||||||||
| For the Year Ended December 31, 2011(D) | ||||||||||||||||||||||||||||||||||||||||||||||||||||
| IB | 10.86 | 0.23 | 0.24 | 0.47 | (0.23 | ) | (0.08 | ) | (0.31 | ) | 11.02 | 4.28 | 44,352 | 1.06 | 0.56 | 2.56 | ||||||||||||||||||||||||||||||||||||
| For the Year Ended December 31, 2010(D) | ||||||||||||||||||||||||||||||||||||||||||||||||||||
| IB | 10.47 | 0.27 | 0.24 | 0.51 | (0.11 | ) | (0.01 | ) | (0.12 | ) | 10.86 | 4.85 | 38,654 | 1.07 | 0.57 | 2.49 | ||||||||||||||||||||||||||||||||||||
| For the Year Ended December 31, 2009 | ||||||||||||||||||||||||||||||||||||||||||||||||||||
| IB | 9.85 | 0.13 | 0.79 | 0.92 | (0.30 | ) | – | (0.30 | ) | 10.47 | 9.43 | 38,533 | 1.06 | 0.56 | 1.29 | |||||||||||||||||||||||||||||||||||||
| American Funds Global Growth and Income HLS Fund | ||||||||||||||||||||||||||||||||||||||||||||||||||||
| For the Year Ended December 31, 2013 | ||||||||||||||||||||||||||||||||||||||||||||||||||||
| IB | 9.58 | 0.24 | 1.84 | 2.08 | (0.26 | ) | (0.16 | ) | (0.42 | ) | 11.24 | 22.16 | 52,712 | 1.11 | 0.56 | 2.28 | ||||||||||||||||||||||||||||||||||||
| For the Year Ended December 31, 2012(D) | ||||||||||||||||||||||||||||||||||||||||||||||||||||
| IB | 8.38 | 0.23 | 1.20 | 1.43 | (0.23 | ) | – | (0.23 | ) | 9.58 | 17.30 | 74,927 | 1.10 | 0.55 | 2.05 | |||||||||||||||||||||||||||||||||||||
| For the Year Ended December 31, 2011(D) | ||||||||||||||||||||||||||||||||||||||||||||||||||||
| IB | 9.06 | 0.22 | (0.70 | ) | (0.48 | ) | (0.20 | ) | – | (0.20 | ) | 8.38 | (5.19 | ) | 78,639 | 1.09 | 0.54 | 2.30 | ||||||||||||||||||||||||||||||||||
| For the Year Ended December 31, 2010(D) | ||||||||||||||||||||||||||||||||||||||||||||||||||||
| IB | 8.30 | 0.20 | 0.72 | 0.92 | (0.16 | ) | – | (0.16 | ) | 9.06 | 11.41 | 91,254 | 1.10 | 0.55 | 2.25 | |||||||||||||||||||||||||||||||||||||
| For the Year Ended December 31, 2009 | ||||||||||||||||||||||||||||||||||||||||||||||||||||
| IB | 6.06 | 0.16 | 2.21 | 2.37 | (0.13 | ) | – | (0.13 | ) | 8.30 | 39.37 | 88,762 | 1.09 | 0.54 | 2.39 | |||||||||||||||||||||||||||||||||||||
| American Funds Global Growth HLS Fund | ||||||||||||||||||||||||||||||||||||||||||||||||||||
| For the Year Ended December 31, 2013 | ||||||||||||||||||||||||||||||||||||||||||||||||||||
| IB | 10.45 | 0.08 | 2.83 | 2.91 | (0.06 | ) | (0.74 | ) | (0.80 | ) | 12.56 | 28.77 | 24,509 | 1.34 | 0.59 | 0.71 | ||||||||||||||||||||||||||||||||||||
| For the Year Ended December 31, 2012(D) | ||||||||||||||||||||||||||||||||||||||||||||||||||||
| IB | 8.74 | 0.06 | 1.86 | 1.92 | (0.10 | ) | (0.11 | ) | (0.21 | ) | 10.45 | 22.19 | 29,055 | 1.33 | 0.58 | 0.48 | ||||||||||||||||||||||||||||||||||||
| For the Year Ended December 31, 2011(D) | ||||||||||||||||||||||||||||||||||||||||||||||||||||
| IB | 9.74 | 0.10 | (0.99 | ) | (0.89 | ) | (0.11 | ) | – | (0.11 | ) | 8.74 | (9.18 | ) | 29,319 | 1.32 | 0.57 | 0.95 | ||||||||||||||||||||||||||||||||||
| For the Year Ended December 31, 2010(D) | ||||||||||||||||||||||||||||||||||||||||||||||||||||
| IB | 8.83 | 0.10 | 0.89 | 0.99 | (0.08 | ) | – | (0.08 | ) | 9.74 | 11.41 | 34,245 | 1.32 | 0.57 | 1.17 | |||||||||||||||||||||||||||||||||||||
| For the Year Ended December 31, 2009 | ||||||||||||||||||||||||||||||||||||||||||||||||||||
| IB | 6.40 | 0.09 | 2.57 | 2.66 | (0.12 | ) | (0.11 | ) | (0.23 | ) | 8.83 | 41.78 | 30,457 | 1.32 | 0.57 | 1.24 | ||||||||||||||||||||||||||||||||||||
See Portfolio Turnover information at the conclusion of Financial Highlights.
| 37 |
| Hartford Series Fund, Inc. |
| Financial Highlights – (continued) |
~ Selected Per-Share Data(A) ~ | ~ Ratios and Supplemental Data ~ | |||||||||||||||||||||||||||||||||||||||||||||||||||
Class | Net Asset | Net | Net | Total from | Dividends | Distribu- | Total | Net Asset | Total | Net | Ratio of | Ratio of | Ratio of | |||||||||||||||||||||||||||||||||||||||
| American Funds Global Small Capitalization HLS Fund | ||||||||||||||||||||||||||||||||||||||||||||||||||||
| For the Year Ended December 31, 2013 | ||||||||||||||||||||||||||||||||||||||||||||||||||||
| IB | $ | 8.29 | $ | 0.03 | $ | 2.18 | $ | 2.21 | $ | (0.09 | ) | $ | (0.94 | ) | $ | (1.03 | ) | $ | 9.47 | 27.89 | % | $ | 61,224 | 1.13 | % | 0.58 | % | 0.30 | % | |||||||||||||||||||||||
| For the Year Ended December 31, 2012(D) | ||||||||||||||||||||||||||||||||||||||||||||||||||||
| IB | 7.83 | 0.10 | 1.23 | 1.33 | (0.10 | ) | (0.77 | ) | (0.87 | ) | 8.29 | 17.85 | 53,881 | 1.11 | 0.56 | 0.99 | ||||||||||||||||||||||||||||||||||||
| For the Year Ended December 31, 2011(D) | ||||||||||||||||||||||||||||||||||||||||||||||||||||
| IB | 9.92 | 0.10 | (2.01 | ) | (1.91 | ) | (0.13 | ) | (0.05 | ) | (0.18 | ) | 7.83 | (19.40 | ) | 55,658 | 1.11 | 0.56 | 0.98 | |||||||||||||||||||||||||||||||||
| For the Year Ended December 31, 2010(D) | ||||||||||||||||||||||||||||||||||||||||||||||||||||
| IB | 8.13 | 0.11 | 1.68 | 1.79 | – | – | – | 9.92 | 22.06 | 74,999 | 1.12 | 0.57 | 1.35 | |||||||||||||||||||||||||||||||||||||||
| For the Year Ended December 31, 2009 | ||||||||||||||||||||||||||||||||||||||||||||||||||||
| IB | 5.10 | – | 3.08 | 3.08 | – | (0.05 | ) | (0.05 | ) | 8.13 | 60.77 | 61,519 | 1.10 | 0.55 | 0.02 | |||||||||||||||||||||||||||||||||||||
| American Funds Growth HLS Fund | ||||||||||||||||||||||||||||||||||||||||||||||||||||
| For the Year Ended December 31, 2013 | ||||||||||||||||||||||||||||||||||||||||||||||||||||
| IB | 10.45 | 0.07 | 3.00 | 3.07 | (0.06 | ) | (0.37 | ) | (0.43 | ) | 13.09 | 29.78 | 351,018 | 1.04 | 0.54 | 0.60 | ||||||||||||||||||||||||||||||||||||
| For the Year Ended December 31, 2012(D) | ||||||||||||||||||||||||||||||||||||||||||||||||||||
| IB | 8.95 | 0.05 | 1.51 | 1.56 | (0.03 | ) | (0.03 | ) | (0.06 | ) | 10.45 | 17.56 | 333,889 | 1.04 | 0.54 | 0.50 | ||||||||||||||||||||||||||||||||||||
| For the Year Ended December 31, 2011(D) | ||||||||||||||||||||||||||||||||||||||||||||||||||||
| IB | 9.38 | 0.03 | (0.46 | ) | (0.43 | ) | – | – | – | 8.95 | (4.57 | ) | 317,968 | 1.04 | 0.54 | 0.33 | ||||||||||||||||||||||||||||||||||||
| For the Year Ended December 31, 2010(D) | ||||||||||||||||||||||||||||||||||||||||||||||||||||
| IB | 7.96 | 0.04 | 1.42 | 1.46 | (0.04 | ) | – | (0.04 | ) | 9.38 | 18.36 | 356,162 | 1.05 | 0.55 | 0.43 | |||||||||||||||||||||||||||||||||||||
| For the Year Ended December 31, 2009 | ||||||||||||||||||||||||||||||||||||||||||||||||||||
| IB | 5.81 | 0.03 | 2.22 | 2.25 | (0.03 | ) | (0.07 | ) | (0.10 | ) | 7.96 | 39.02 | 296,659 | 1.03 | 0.53 | 0.47 | ||||||||||||||||||||||||||||||||||||
| American Funds Growth-Income HLS Fund | ||||||||||||||||||||||||||||||||||||||||||||||||||||
| For the Year Ended December 31, 2013 | ||||||||||||||||||||||||||||||||||||||||||||||||||||
| IB | 10.20 | 0.11 | 3.23 | 3.34 | (0.14 | ) | (0.14 | ) | (0.28 | ) | 13.26 | 33.14 | 197,689 | 0.99 | 0.54 | 0.97 | ||||||||||||||||||||||||||||||||||||
| For the Year Ended December 31, 2012(D) | ||||||||||||||||||||||||||||||||||||||||||||||||||||
| IB | 8.81 | 0.13 | 1.38 | 1.51 | (0.12 | ) | – | (0.12 | ) | 10.20 | 17.16 | 183,220 | 0.99 | 0.54 | 1.29 | |||||||||||||||||||||||||||||||||||||
| For the Year Ended December 31, 2011(D) | ||||||||||||||||||||||||||||||||||||||||||||||||||||
| IB | 9.00 | 0.12 | (0.31 | ) | (0.19 | ) | – | – | – | 8.81 | (2.12 | ) | 170,059 | 0.98 | 0.53 | 1.26 | ||||||||||||||||||||||||||||||||||||
| For the Year Ended December 31, 2010(D) | ||||||||||||||||||||||||||||||||||||||||||||||||||||
| IB | 8.20 | 0.10 | 0.81 | 0.91 | (0.11 | ) | – | (0.11 | ) | 9.00 | 11.11 | 185,836 | 0.99 | 0.54 | 1.19 | |||||||||||||||||||||||||||||||||||||
| For the Year Ended December 31, 2009 | ||||||||||||||||||||||||||||||||||||||||||||||||||||
| IB | 6.39 | 0.11 | 1.86 | 1.97 | (0.11 | ) | (0.05 | ) | (0.16 | ) | 8.20 | 30.85 | 168,690 | 0.98 | 0.53 | 1.56 | ||||||||||||||||||||||||||||||||||||
See Portfolio Turnover information at the conclusion of Financial Highlights.
| 38 |
~ Selected Per-Share Data(A) ~ | ~ Ratios and Supplemental Data ~ | |||||||||||||||||||||||||||||||||||||||||||||||||||
Class | Net Asset | Net | Net | Total from | Dividends | Distribu- | Total | Net Asset | Total | Net | Ratio of | Ratio of | Ratio of | |||||||||||||||||||||||||||||||||||||||
| American Funds International HLS Fund | ||||||||||||||||||||||||||||||||||||||||||||||||||||
| For the Year Ended December 31, 2013 | ||||||||||||||||||||||||||||||||||||||||||||||||||||
| IB | $ | 8.73 | $ | 0.09 | $ | 1.74 | $ | 1.83 | $ | (0.11 | ) | $ | (0.18 | ) | $ | (0.29 | ) | $ | 10.27 | 21.23 | % | $ | 226,400 | 1.15 | % | 0.55 | % | 0.99 | % | |||||||||||||||||||||||
| For the Year Ended December 31, 2012(D) | ||||||||||||||||||||||||||||||||||||||||||||||||||||
| IB | 7.54 | 0.10 | 1.22 | 1.32 | (0.13 | ) | – | (0.13 | ) | 8.73 | 17.58 | 225,298 | 1.14 | 0.54 | 1.15 | |||||||||||||||||||||||||||||||||||||
| For the Year Ended December 31, 2011(D) | ||||||||||||||||||||||||||||||||||||||||||||||||||||
| IB | 8.96 | 0.13 | (1.40 | ) | (1.27 | ) | (0.15 | ) | – | (0.15 | ) | 7.54 | (14.23 | ) | 208,399 | 1.14 | 0.54 | 1.52 | ||||||||||||||||||||||||||||||||||
| For the Year Ended December 31, 2010(D) | ||||||||||||||||||||||||||||||||||||||||||||||||||||
| IB | 8.50 | 0.13 | 0.44 | 0.57 | (0.08 | ) | (0.03 | ) | (0.11 | ) | 8.96 | 6.92 | 235,702 | 1.16 | 0.56 | 1.78 | ||||||||||||||||||||||||||||||||||||
| For the Year Ended December 31, 2009 | ||||||||||||||||||||||||||||||||||||||||||||||||||||
| IB | 6.09 | 0.11 | 2.48 | 2.59 | (0.11 | ) | (0.07 | ) | (0.18 | ) | 8.50 | 42.75 | 197,258 | 1.13 | 0.53 | 1.53 | ||||||||||||||||||||||||||||||||||||
| American Funds New World HLS Fund | ||||||||||||||||||||||||||||||||||||||||||||||||||||
| For the Year Ended December 31, 2013 | ||||||||||||||||||||||||||||||||||||||||||||||||||||
| IB | 9.46 | 0.07 | 0.89 | 0.96 | (0.08 | ) | (1.17 | ) | (1.25 | ) | 9.17 | 11.06 | 34,304 | 1.43 | 0.58 | 0.77 | ||||||||||||||||||||||||||||||||||||
| For the Year Ended December 31, 2012(D) | ||||||||||||||||||||||||||||||||||||||||||||||||||||
| IB | 8.66 | 0.07 | 1.38 | 1.45 | (0.15 | ) | (0.50 | ) | (0.65 | ) | 9.46 | 17.47 | 51,697 | 1.41 | 0.56 | 0.61 | ||||||||||||||||||||||||||||||||||||
| For the Year Ended December 31, 2011(D) | ||||||||||||||||||||||||||||||||||||||||||||||||||||
| IB | 10.24 | 0.15 | (1.60 | ) | (1.45 | ) | (0.13 | ) | – | (0.13 | ) | 8.66 | (14.23 | ) | 52,569 | 1.41 | 0.56 | 1.33 | ||||||||||||||||||||||||||||||||||
| For the Year Ended December 31, 2010(D) | ||||||||||||||||||||||||||||||||||||||||||||||||||||
| IB | 8.80 | 0.11 | 1.42 | 1.53 | (0.09 | ) | – | (0.09 | ) | 10.24 | 17.54 | 72,257 | 1.42 | 0.57 | 1.30 | |||||||||||||||||||||||||||||||||||||
| For the Year Ended December 31, 2009 | ||||||||||||||||||||||||||||||||||||||||||||||||||||
| IB | 6.00 | 0.10 | 2.84 | 2.94 | (0.08 | ) | (0.06 | ) | (0.14 | ) | 8.80 | 49.14 | 58,578 | 1.40 | 0.55 | 1.44 | ||||||||||||||||||||||||||||||||||||
| (A) | Information presented relates to a share outstanding throughout the indicated period. Net investment income (loss) per share amounts are calculated based on average shares outstanding unless otherwise noted. |
| (B) | The figures do not include sales charges or other fees which may be applied at the variable life insurance, variable annuity or qualified retirement plan product level. Any such additional sales charges or other fees would lower the Fund's performance. |
| (C) | Ratios do not include expenses of the Underlying Funds. |
| (D) | Net investment income (loss) per share amounts have been calculated using the SEC method. |
See Portfolio Turnover information at the conclusion of Financial Highlights.
| 39 |
| Hartford Series Fund, Inc. |
| Financial Highlights – (continued) |
| Portfolio Turnover Rate | ||||||||||||||||||||
| For the Year Ended | ||||||||||||||||||||
| December 31, 2013 | December 31, 2012 | December 31, 2011 | December 31, 2010 | December 31, 2009 | ||||||||||||||||
| American Funds Asset Allocation HLS Fund | 29 | % | 14 | % | 9 | % | 11 | % | 8 | % | ||||||||||
| American Funds Blue Chip Income and Growth HLS Fund | 16 | 23 | 14 | 11 | 6 | |||||||||||||||
| American Funds Bond HLS Fund | 15 | 15 | 15 | 13 | 2 | |||||||||||||||
| American Funds Global Bond HLS Fund | 10 | 8 | 16 | 17 | 5 | |||||||||||||||
| American Funds Global Growth and Income HLS Fund | 4 | 5 | 5 | 8 | 3 | |||||||||||||||
| American Funds Global Growth HLS Fund | 7 | 4 | 11 | 11 | 12 | |||||||||||||||
| American Funds Global Small Capitalization HLS Fund | 11 | 4 | 11 | 16 | 10 | |||||||||||||||
| American Funds Growth HLS Fund | 3 | 4 | 5 | 7 | 3 | |||||||||||||||
| American Funds Growth-Income HLS Fund | 6 | 9 | 5 | 8 | 1 | |||||||||||||||
| American Funds International HLS Fund | 4 | 7 | 9 | 7 | 7 | |||||||||||||||
| American Funds New World HLS Fund | 6 | 8 | 9 | 12 | 8 | |||||||||||||||
| 40 |
| Report of Independent Registered Public Accounting Firm |
The Board of Directors and Shareholders of Hartford Series Fund, Inc. |
We have audited the accompanying statements of assets and liabilities, including the schedules of investments, of American Funds Asset Allocation HLS Fund, American Funds Blue Chip Income and Growth HLS Fund, American Funds Bond HLS Fund, American Funds Global Bond HLS Fund, American Funds Global Growth and Income HLS Fund, American Funds Global Growth HLS Fund, American Funds Global Small Capitalization HLS Fund, American Funds Growth HLS Fund, American Funds Growth-Income HLS Fund, American Funds International HLS Fund and American Funds New World HLS Fund (eleven of the thirty portfolios constituting the Hartford Series Fund, Inc. (the Funds)) as of December 31, 2013, and the related statements of operations for the year then ended, the statements of changes in net assets for each of the two years in the period then ended, and the financial highlights for each of the five years in the period then ended. These financial statements and financial highlights are the responsibility of the Funds’ management. Our responsibility is to express an opinion on these financial statements and financial highlights based on our audits.
We conducted our audits in accordance with the standards of the Public Company Accounting Oversight Board (United States). Those standards require that we plan and perform the audit to obtain reasonable assurance about whether the financial statements and financial highlights are free of material misstatement. We were not engaged to perform an audit of the Funds’ internal control over financial reporting. Our audits included consideration of internal control over financial reporting as a basis for designing audit procedures that are appropriate in the circumstances, but not for the purpose of expressing an opinion on the effectiveness of the Funds’ internal control over financial reporting. Accordingly, we express no such opinion. An audit also includes examining, on a test basis, evidence supporting the amounts and disclosures in the financial statements and financial highlights, assessing the accounting principles used and significant estimates made by management, and evaluating the overall financial statement presentation. Our procedures included confirmation of securities owned as of December 31, 2013, by correspondence with the custodian and brokers or by other appropriate auditing procedures where replies from brokers were not received. We believe that our audits provide a reasonable basis for our opinion.
In our opinion, the financial statements and financial highlights referred to above present fairly, in all material respects, the financial position of each of the portfolios listed above of the Hartford Series Fund, Inc. at December 31, 2013, the results of their operations for the year then ended, the changes in their net assets for each of the two years in the period then ended, and the financial highlights for each of the five years in the period then ended, in conformity with U.S. generally accepted accounting principles.
 |
Minneapolis, MN
February 17, 2014
| 41 |
| Hartford Series Fund, Inc. |
| Directors and Officers (Unaudited) |
The Board of Directors of the Company appoints officers who are responsible for the day-to-day operations of the Funds and who execute policies formulated by the directors. Each director serves until his or her death, resignation, or retirement or until the next annual meeting of shareholders is held or until his or her successor is elected and qualifies.
Directors and officers who are employed by or who have a financial interest in The Hartford are considered “interested” persons of the Funds pursuant to the 1940 Act. Each officer and two of the Company’s directors, as noted in the chart below, are “interested” persons of the Funds. Each director serves as a director for The Hartford Mutual Funds, Inc., The Hartford Mutual Funds II, Inc., Hartford Series Fund, Inc., Hartford HLS Series Fund II, Inc., and as a trustee for The Hartford Alternative Strategies Fund, which, as of December 31, 2013, collectively consist of 91 funds. Correspondence may be sent to directors and officers c/o Hartford Funds, 5 Radnor Corporate Center, Suite 300, 100 Matsonford Road, Radnor, Pennsylvania 19087, except that correspondence to Mr. Annoni, Mr. Dressen and Ms. Quade may be sent to 500 Bielenberg Drive, Woodbury, Minnesota 55125.
The table below sets forth, for each director and officer, his or her name, year of birth, current position with the Company and date first elected or appointed to Hartford Series Fund, Inc. (“HSF”), and Hartford HLS Series Fund II, Inc. (“HSF2”), principal occupation, and, for directors, other directorships held. The Funds’ Statement of Additional Information contains further information on the directors and is available free of charge by calling 1-800-862-6668 or writing to Hartford HLS Funds, c/o Hartford Life Insurance Company, Hartford Life and Annuity Insurance Company, P.O. Box 14293, Lexington, KY 40512-4293.
Information on the aggregate remuneration paid to the directors of the Company can be found in the Statement of Operations herein. The Funds pay to The Hartford a portion of the Chief Compliance Officer’s compensation, but do not pay salaries or compensation to any of their other officers or directors who are employed by The Hartford.
Non-Interested Directors
Lynn S. Birdsong (1946) Director since 2003, Co-Chairman of the Investment Committee since 2005
Mr. Birdsong is a private investor. Mr. Birdsong currently serves as a Director of the Sovereign High Yield Investment Company (April 2010 to current). Mr. Birdsong currently serves as an Independent Director of Nomura Partners Funds, Inc. (formerly, The Japan Fund) (April 2003 to current). From 2003 to March 2005, Mr. Birdsong was an Independent Director of the Atlantic Whitehall Funds. From 1979 to 2002, Mr. Birdsong was a Managing Director of Zurich Scudder Investments, an investment management firm. During his employment with Scudder, Mr. Birdsong was an Interested Director of The Japan Fund. From January 1981 through December 2013, Mr. Birdsong was a partner in Birdsong Company, an advertising specialty firm.
Robert M. Gavin, Jr. (1940) Director since 2002 (HSF) and 1986 (HSF2), Chairman of the Board since 2004
Dr. Gavin is an educational consultant. Prior to September 1, 2001, he was President of Cranbrook Education Community and prior to July 1996, he was President of Macalester College, St. Paul, Minnesota.
Duane E. Hill (1945) Director since 2001 (HSF) and 2002 (HSF2), Chairman of the Nominating Committee since 2003
Mr. Hill is a Partner of TSG Ventures L.P., a private equity investment company. Mr. Hill is a former partner of TSG Capital Group, a private equity investment firm that served as sponsor and lead investor in leveraged buyouts of middle market companies.
Sandra S. Jaffee (1941) Director since 2005
Ms. Jaffee is the founder and Chief Executive Officer of a private company, Homeworks Concierge, LLC, which provides residential property management services in Westchester County, New York (January 2012 to present). Ms. Jaffee served as Chairman (2008 to 2009) and Chief Executive Officer of Fortent (formerly Searchspace Group), a leading provider of compliance/regulatory technology to financial institutions from August 2005 to August 2009. Ms. Jaffee currently serves as a member of the Board of Directors of Broadridge Financial Solutions as well as a Trustee of Muhlenberg College.
| 42 |
William P. Johnston (1944) Director since 2005, Chairman of the Compliance Committee since 2005
In June 2006, Mr. Johnston was appointed as Senior Advisor to The Carlyle Group, a global private equity and alternative asset investment firm and currently serves as an Operating Executive. In July 2006, Mr. Johnston was elected to the Board of Directors of MultiPlan, Inc. and served as a Director (July 2006 to August 2010). In August 2007, Mr. Johnston was elected to the Board of Directors of LifeCare Holdings, Inc. and served as a Director (August 2007 to June 2013). In February 2008, Mr. Johnston was elected to the Board of Directors of HCR-ManorCare, Inc. In May 2006, Mr. Johnston was elected to the Supervisory Board of Fresenius Medical Care AG & Co. KGaA, after its acquisition of Renal Care Group, Inc. in March 2006. Mr. Johnston joined Renal Care Group in November 2002 as a member of the Board of Directors and served as Chairman of the Board from March 2003 through March 2006. From 2002 through 2013, Mr. Johnston served as a Board member of the Georgia O’Keefe Museum. From September 1987 to December 2002, Mr. Johnston was with Equitable Securities Corporation (and its successors, SunTrust Equitable Securities and SunTrust Robinson Humphrey) serving in various investment banking and managerial positions, including Managing Director and Head of Investment Banking, Chief Executive Officer and Vice Chairman.
Phillip O. Peterson (1944) Director since 2002 (HSF) and 2000 (HSF2), Chairman of the Audit Committee since 2002
Mr. Peterson is a mutual fund industry consultant. He was a partner of KPMG LLP (an accounting firm) until July 1999. Mr. Peterson joined William Blair Funds in February 2007 as a member of the Board of Trustees. Mr. Peterson also joined the Board of Trustees of Symetra Variable Mutual Funds Trust as a trustee in February 2012.
Lemma W. Senbet (1946) Director since 2005
Dr. Senbet is the William E. Mayer Chair Professor of Finance and Founding Director, Center for Financial Policy, at the University of Maryland, Robert H. Smith School of Business. He was chair of the Finance Department of the University of Maryland, Robert H. Smith School of Business from 1998 to 2006. Since June 2013, he has been on leave from the University to serve as Executive Director of African Economic Research Consortium which focuses on economic policy research and training. Previously, he was a chaired professor of finance at the University of Wisconsin-Madison. Also, he was a Director of the Fortis Funds from March 2000 to July 2002. Dr. Senbet served as Director of the American Finance Association and President of the Western Finance Association. In 2006, Dr. Senbet was inducted Fellow of Financial Management Association International for his career-long distinguished scholarship and professional service.
Interested Directors and Officers
James E. Davey (1964) Director since 2012, President and Chief Executive Officer since 2010
Mr. Davey serves as Executive Vice President of Hartford Life Insurance Company (“HLIC”) and The Hartford Financial Services Group, Inc. Additionally, Mr. Davey serves as Chairman of the Board, Manager and Senior Managing Director of Hartford Funds Distributors, LLC (“HFD”). He also currently serves as Director, Chairman of the Board, President and Senior Managing Director of Hartford Administrative Services Company (“HASCO”). Mr. Davey also serves as Manager, Chairman of the Board and Senior Managing Director for Hartford Funds Management Company, LLC (“HFMC”). Mr. Davey joined The Hartford in 2002.
Lowndes A. Smith (1939) Director since 1996 (HSF) and 2002 (HSF2), Co-Chairman of the Investment Committee since 2005
Mr. Smith served as Vice Chairman of The Hartford from February 1997 to January 2002, as President and Chief Executive Officer of Hartford Life, Inc. from February 1997 to January 2002, and as President and Chief Operating Officer of The Hartford Life Insurance Companies from January 1989 to January 2002. Mr. Smith serves as a Director of White Mountains Insurance Group Ltd. (October 2003 to current); One Beacon Insurance (October 2006 to current); Symetra Financial (August 2007 to current) and is a Managing Director of Whittington Gray Associates (January 2007 to current).
Other Officers
Mark A. Annoni (1964) Vice President, Controller and Treasurer since 2012
Mr. Annoni currently serves as the Assistant Vice President of HLIC (February 2004 to present).
| 43 |
| Hartford Series Fund, Inc. |
| Directors and Officers (Unaudited) – (continued) |
Michael R. Dressen (1963) AML Compliance Officer since 2011
Mr. Dressen currently serves as Assistant Vice President of HLIC. He also serves as Chief Compliance Officer and AML Compliance Officer of HASCO and as AML Officer of HFD. Mr. Dressen has served in various positions within The Hartford and its subsidiaries in connection with the operation of the Hartford Funds.
Edward P. Macdonald (1967) Vice President, Secretary and Chief Legal Officer since 2005
Mr. Macdonald currently serves as Assistant Secretary, Executive Vice President and Deputy General Counsel of HFD, HASCO and HFMC. He also serves as Vice President of HLIC. Mr. Macdonald has served in various positions within The Hartford and its subsidiaries in connection with the operation of the Hartford Funds. Mr. Macdonald joined The Hartford in 2005.
Joseph G. Melcher (1973) Vice President and Chief Compliance Officer since 2013
Mr. Melcher currently serves as Executive Vice President of HASCO and HFD. Mr. Melcher also currently serves as Executive Vice President and Chief Compliance Officer of HFMC. Mr. Melcher has served in various positions within The Hartford and its subsidiaries in connection with the operation of the Hartford Funds since joining The Hartford in 2012. Prior to joining The Hartford, Mr. Melcher worked at Touchstone Investments, a member of the Western & Southern Financial Group, where he held the position of Vice President and Chief Compliance Officer from 2010 through 2012 and Assistant Vice President, Compliance from 2005 to 2010.
Vernon J. Meyer (1964) Vice President since 2006
Mr. Meyer currently serves as Senior Vice President of HLIC. He also currently serves as Managing Director and Chief Investment Officer of HFMC. Mr. Meyer has served in various positions within The Hartford and its subsidiaries in connection with the operation of the Hartford Funds. Mr. Meyer joined The Hartford in 2004.
Laura S. Quade (1969) Vice President since 2012
Ms. Quade currently serves as Vice President of HASCO and HFD. She is the Head of Operations of HASCO and also serves as Director, Enterprise Operations of HLIC. Ms. Quade has served in various positions within The Hartford and its subsidiaries in connection with the operation of the Hartford Funds.
Martin A. Swanson (1962) Vice President since 2010
Mr. Swanson currently serves as Vice President of HLIC. Mr. Swanson also serves as Managing Director, Chief Marketing Officer and Principal of HFD. Mr. Swanson has served in various positions within The Hartford and its subsidiaries in connection with the operation of the Hartford Funds.
HOW TO OBTAIN A COPY OF THE FUND’S PROXY VOTING POLICIES AND VOTING RECORDS (UNAUDITED)
A description of the policies and procedures that the Funds use to determine how to vote proxies relating to portfolio securities and information about how the Funds voted proxies relating to portfolio securities during the most recent twelve-month period ended June 30 are available (1) without charge, upon request, by calling 800-862-6668 and (2) on the SEC’s website at http://www.sec.gov.
QUARTERLY PORTFOLIO HOLDINGS INFORMATION (UNAUDITED)
The Funds file a complete schedule of portfolio holdings with the SEC for the first and third quarters of each fiscal year on Form N-Q. The Funds’ Forms N-Q are available (1) without charge, upon request, by calling 800-862-6668 and (2) on the SEC’s website at http://www.sec.gov. The Form N-Q may be reviewed and copied at the SEC’s Public Reference Room in Washington, DC. Information on the operation of the Public Reference Room may be obtained by calling 1-800-SEC-0330.
| 44 |
| Hartford Series Fund, Inc. |
| Expense Example (Unaudited) |
Your Fund's Expenses
As a shareholder of a Fund, you incur two types of costs: (1) transaction costs and (2) ongoing costs, including investment management fees, distribution and/or service (12b-1) fees, and other fund expenses. This example is intended to help you understand your ongoing costs (in dollars) of investing in a Fund and to compare these costs with the ongoing costs of investing in other mutual funds. The example is based on an investment of $1,000 invested at the beginning of the period and held for the period of June 30, 2013 through December 31, 2013.
Actual Expenses
The first set of columns of the table below provides information about actual account values and actual expenses. You may use the information in this column, together with the amount you invested, to estimate the expenses that you paid over the period. Simply divide your account value by $1,000 (for example, an $8,600 account value divided by $1,000 = 8.6), then multiply the result by the number in the line under the heading entitled “Expenses Paid During Period” to estimate the expenses you paid on your account during this period.
Hypothetical Example for Comparison Purposes
The second set of columns of the table below provides information about hypothetical account values and hypothetical expenses based on a Fund’s actual expense ratio and an assumed rate of return of 5% per year before expenses, which is not the Fund’s actual return. The hypothetical account values and expenses may not be used to estimate the actual ending account balance or expenses you paid for the period. You may use this information to compare the ongoing costs of investing in a Fund and other funds. To do so, compare this 5% hypothetical example with the 5% hypothetical examples that appear in the shareholder reports of the other funds.
Please note that the expenses shown in the table are meant to highlight your ongoing costs only and do not reflect any transactional costs, such as sales charges (loads) and CDSC. Therefore, the second set of columns of the table is useful in comparing ongoing costs only, and will not help you determine the relative total costs of owning different funds. In addition, if these transactional costs were included, your costs would be higher. Expenses are equal to the Fund's annualized expense ratios multiplied by average account value over the period, multiplied by 184/365 (to reflect the one-half year period).
Beginning | Ending | Expenses paid | Beginning | Ending | Expenses paid | Annualized | Days in | Days | ||||||||||||||||||||||||||||
| American Funds Asset Allocation HLS Fund | ||||||||||||||||||||||||||||||||||||
| Class IB | $ | 1,000.00 | $ | 1,120.70 | $ | 2.96 | $ | 1,000.00 | $ | 1,022.41 | $ | 2.83 | 0.55 | % | 184 | 365 | ||||||||||||||||||||
| American Funds Blue Chip Income and Growth HLS Fund | ||||||||||||||||||||||||||||||||||||
| Class IB | $ | 1,000.00 | $ | 1,159.70 | $ | 3.13 | $ | 1,000.00 | $ | 1,022.30 | $ | 2.93 | 0.58 | % | 184 | 365 | ||||||||||||||||||||
| American Funds Bond HLS Fund | ||||||||||||||||||||||||||||||||||||
| Class IB | $ | 1,000.00 | $ | 1,003.80 | $ | 2.77 | $ | 1,000.00 | $ | 1,022.44 | $ | 2.80 | 0.55 | % | 184 | 365 | ||||||||||||||||||||
| American Funds Global Bond HLS Fund | ||||||||||||||||||||||||||||||||||||
| Class IB | $ | 1,000.00 | $ | 1,023.10 | $ | 3.15 | $ | 1,000.00 | $ | 1,022.09 | $ | 3.15 | 0.62 | % | 184 | 365 | ||||||||||||||||||||
| American Funds Global Growth and Income HLS Fund | ||||||||||||||||||||||||||||||||||||
| Class IB | $ | 1,000.00 | $ | 1,139.50 | $ | 3.06 | $ | 1,000.00 | $ | 1,022.34 | $ | 2.90 | 0.57 | % | 184 | 365 | ||||||||||||||||||||
| American Funds Global Growth HLS Fund | ||||||||||||||||||||||||||||||||||||
| Class IB | $ | 1,000.00 | $ | 1,200.20 | $ | 3.32 | $ | 1,000.00 | $ | 1,022.19 | $ | 3.05 | 0.60 | % | 184 | 365 | ||||||||||||||||||||
| American Funds Global Small Capitalization HLS Fund | ||||||||||||||||||||||||||||||||||||
| Class IB | $ | 1,000.00 | $ | 1,175.60 | $ | 3.21 | $ | 1,000.00 | $ | 1,022.26 | $ | 2.98 | 0.58 | % | 184 | 365 | ||||||||||||||||||||
| American Funds Growth HLS Fund | ||||||||||||||||||||||||||||||||||||
| Class IB | $ | 1,000.00 | $ | 1,179.50 | $ | 3.00 | $ | 1,000.00 | $ | 1,022.45 | $ | 2.78 | 0.55 | % | 184 | 365 | ||||||||||||||||||||
| American Funds Growth-Income HLS Fund | ||||||||||||||||||||||||||||||||||||
| Class IB | $ | 1,000.00 | $ | 1,193.20 | $ | 3.02 | $ | 1,000.00 | $ | 1,022.46 | $ | 2.78 | 0.55 | % | 184 | 365 | ||||||||||||||||||||
| American Funds International HLS Fund | ||||||||||||||||||||||||||||||||||||
| Class IB | $ | 1,000.00 | $ | 1,175.40 | $ | 3.06 | $ | 1,000.00 | $ | 1,022.39 | $ | 2.85 | 0.56 | % | 184 | 365 | ||||||||||||||||||||
| American Funds New World HLS Fund | ||||||||||||||||||||||||||||||||||||
| Class IB | $ | 1,000.00 | $ | 1,139.60 | $ | 3.21 | $ | 1,000.00 | $ | 1,022.20 | $ | 3.04 | 0.60 | % | 184 | 365 | ||||||||||||||||||||
| 45 |
| Hartford Series Fund, Inc. |
| Approval of Investment Management and Investment Sub-Advisory Agreements (Unaudited) |
Section 15(c) of the Investment Company Act of 1940, as amended (the “1940 Act”), requires that each mutual fund’s board of directors, including a majority of those directors who are not “interested persons” of the mutual fund, as defined in the 1940 Act (the “Independent Directors”), annually review and consider the continuation of the mutual fund’s investment advisory agreement. At its meeting held on August 6-7, 2013, the Board of Directors (the “Board”) of Hartford Series Fund, Inc., including each of the Independent Directors, unanimously voted to approve the continuation of the investment management agreement for the Funds with Hartford Funds Management Company, LLC (“HFMC”) (the “Agreement”). Each Fund invests all of its assets directly in a corresponding portfolio of the American Funds Insurance Series (each a “Master Fund,” and collectively, the “Master Funds”) that is advised by Capital Research and Management Company (“CRMC”).
In the months preceding the August 6-7, 2013 meeting, the Board requested, received, and reviewed written responses from HFMC to questions posed to it on behalf of the Independent Directors and supporting materials relating to those questions and responses. The Board considered information furnished to the Board at its meetings throughout the year, as well as information specifically prepared in connection with the annual approval of the Agreement at the Board’s meetings held on June 18-19, 2013 and August 6-7, 2013. Information provided to the Board at its meetings throughout the year included, among other things, reports on Fund performance, legal and compliance matters, sales and marketing activity, shareholder services, and the other services provided to the Funds by HFMC and its affiliates. The Board also received in-person presentations by Fund officers and representatives of HFMC at the Board’s meetings on June 18-19, 2013 and August 6-7, 2013 concerning the Agreement.
The Independent Directors, advised by independent legal counsel, engaged two service providers to assist them with evaluating the Agreement with respect to each Fund. Lipper Inc. (“Lipper”), an independent provider of investment company data, was retained to provide the Board with reports on how the Funds’ contractual management fees, actual management fees, other non-management fees, overall expense ratios and investment performance compared to those of mutual funds with similar investment objectives. The Independent Directors also engaged an independent financial services consulting firm (the “Consultant”) to assist them in evaluating the Funds’ management fees, other non-management fees, overall expense ratios and investment performance. In addition, the Consultant reviewed the profitability calculations utilized by HFMC in connection with the continuation of the Agreement.
In determining whether to continue the Agreement for the Funds, the members of the Board reviewed and evaluated information and factors they believed to be relevant and appropriate in light of the information that the Board deemed necessary and appropriate through the exercise of its reasonable business judgment. While individual members of the Board may have weighed certain factors differently, the Board’s determination to continue the Agreement was based on a comprehensive consideration of all information provided to the Board throughout the year and specifically with respect to the continuation of the Agreement. A more detailed discussion of the factors the Board considered with respect to its approval of the Agreement is provided below.
Nature, Extent, and Quality of Services Provided by HFMC
The Board requested and considered information concerning the nature, extent, and quality of the services provided to the Funds by HFMC. The Board considered, among other things, the terms of the Agreement and the range of services provided by HFMC. In this regard, the Board considered that because of the master-feeder structure, the portfolio management services provided by HFMC to each Fund are limited to selecting one of the Master Funds, investing a Fund’s assets in that Master Fund, and monitoring the Master Fund’s performance as an investment for each Fund. The Board also considered that certain administrative services, such as oversight of service providers, production of Fund registration statements and shareholder reports, and provision of information to the Board, are also provided by HFMC under the Agreement. The Board considered HFMC’s reputation and overall financial strength, as well as its willingness to consider and implement organizational and operational changes designed to improve services to each Fund. In addition, the Board considered the quality of HFMC’s communications with the Board and responsiveness to Board inquiries.
The Board also requested and evaluated information concerning HFMC’s regulatory and compliance environment. In this regard, the Board requested and reviewed information on HFMC’s compliance policies and procedures, compliance history, and a report from the Funds’ Chief Compliance Officer on HFMC’s compliance with applicable laws and regulations, including responses to regulatory developments and compliance issues raised by regulators. The Board also noted HFMC’s support of the Funds’ compliance control structure, particularly the resources devoted by HFMC in support of the Funds’ obligations pursuant to
| 46 |
Rule 38a-1 under the 1940 Act. The Board considered that HFMC or its affiliates are responsible for providing the Funds’ officers. In addition, the Board considered the nature and quality of the services provided to the Funds and their shareholders by HFMC’s affiliates. Further, the Board considered the possibility that at some point in the future, HFMC may recommend the withdrawal of one or more of the Funds from the master-feeder structure and the management of the Funds’ assets directly or through a sub-adviser.
Based on these considerations, the Board concluded that it was satisfied with the nature, extent and quality of the services provided to the Funds by HFMC.
Performance of the Funds
The Board considered the investment performance of the Funds. In this regard, the Board reviewed the performance of each Fund over different time periods presented in the materials and evaluated HFMC’s analysis of each Fund’s performance for these time periods. The Board considered information and materials provided to the Board by HFMC concerning Fund performance, as well as information from Lipper comparing the investment performance of each Fund to an appropriate benchmark and universe of peer funds. The Board reviewed the performance of each Fund in light of each Fund’s objective of providing access to the corresponding Master Fund.
The Board noted that the performance of each Fund is based on the performance of the Fund’s corresponding Master Fund. The Board noted that CRMC uses a system of multiple portfolio counselors in managing the Master Funds’ assets. Under this approach, the portfolio of a Master Fund is divided into segments managed by individual portfolio counselors who decide how their respective segment will be invested within the limits provided by a Master Fund’s investment objective, policies and restrictions and subject to the oversight of CRMC’s investment committee.
In light of all the considerations noted above, the Board concluded that while there could be no guarantee of future results, the overall performance of the Funds and their corresponding Master Funds was satisfactory.
Costs of the Services and Profitability of HFMC
The Board reviewed information regarding HFMC’s costs to provide administrative services and certain advisory services to the Funds and the profitability to it and its affiliates from managing the Funds. The Board considered that HFMC offers a contractual management fee waiver on each of the Funds for as long as each Fund remains invested in a Master Fund. Under the waiver, HFMC retains a net contractual management fee of 0.25% of each Fund’s average daily net assets in order to compensate it for the administrative services and certain advisory services that HFMC provides each Fund under the Agreement. The Board noted that the future profitability of each Fund to HFMC would depend on the growth of assets under management. The Board considered the Consultant’s review of the profitability calculations utilized by HFMC in connection with the continuation of the Agreement, noting the Consultant’s view that Hartford Funds’ process for calculating and reporting Fund profitability is reasonable. In this regard, the Board noted that the Consultant had previously performed a full review of this process and reported that such process is sound and well within common industry practice.
Based on these considerations, the Board concluded that the profits anticipated to be realized by HFMC and its affiliates from their relationships with the Funds would not be excessive.
Comparison of Fees and Expenses
The Board considered comparative information with respect to the management fees to be paid by each Fund to HFMC and the total expense ratios of each Fund. The Board noted that each Fund and its shareholders bears the fees and expenses of the Fund and the Master Fund in which it invests, with the result that each Fund’s expenses are generally higher than those of other mutual funds that invest directly in securities. The Board also considered that each Master Fund may have other shareholders, each of whom will pay their proportionate share of the Master Fund’s expenses.
The Board reviewed written materials from Lipper providing comparative information about each Fund’s management fees and overall expense ratios relative to those of peer groups. While the Board recognized that comparisons between the Funds and peer
| 47 |
| Hartford Series Fund, Inc. |
| Approval of Investment Management and Investment Sub-Advisory Agreements (Unaudited) – (continued) |
funds are imprecise, given the differing service levels and characteristics of mutual funds and the different business model and cost structure of HFMC, the comparative information provided by Lipper assisted the Board in evaluating the reasonableness of each Fund’s management fees and total operating expenses. In addition, the Board considered the analysis and recommendations of the Consultant relating to each Fund’s management fees and total operating expenses.
Based on these considerations, the Board concluded that each Fund’s fees and total operating expenses, in conjunction with the information about quality of services, profitability, economies of scale, and other matters discussed, were reasonable in light of the services provided.
Economies of Scale
The Board requested and considered information regarding HFMC’s realization of economies of scale with respect to the Funds and whether the fee levels reflect these economies of scale for the benefit of the Funds’ shareholders. In this regard, the Board took note that the management fee schedule for each Master Fund includes breakpoints that are designed to reduce the management fee rates as the Master Fund’s average daily net assets increase. Therefore, shareholders of the Funds are expected to receive an indirect benefit from economies of scale at the Master Fund level since the amount of the advisory fee a Fund pays CRMC should decrease as the corresponding Master Fund’s average daily net assets increase. The Board also took note that even if the amount of the advisory fee paid by a Fund decreases as a result of economies of scale at the Master Fund level, the amount of the Fund’s advisory fee retained by HFMC as a percentage of the Fund’s average daily net assets will not increase. Therefore, HFMC will not benefit from any economies of scale realized at the Master Fund level. Instead, any economies of scale at the Master Fund level will be passed on to the shareholders of the relevant Fund.
After considering all of the information available to it, the Board concluded that it was satisfied with the extent to which economies of scale would be shared for the benefit of the Funds’ shareholders.
Other Benefits
The Board considered other benefits to HFMC and its affiliates from its relationships with the Funds, including the role of the Funds in supporting the variable life insurance and variable annuity products offered by The Hartford.
The Board reviewed information noting that HFMC receives fees for providing fund accounting and related services from the Funds. The Board considered information on profits to HFMC for such services. The Board also considered that Hartford Administrative Services Company (“HASCO”), the Funds’ transfer agent and an affiliate of HFMC, receives transfer agency compensation from the Funds, and the Board reviewed information on the profitability of the Funds’ transfer agency function to HASCO. The Board considered information provided by HASCO indicating that the transfer agent fees charged by HASCO to the Funds were fair and reasonable based on publicly available information.
The Board also considered that Hartford Funds Distributors, LLC (“HFD”), an affiliate of HFMC, serves as principal underwriter of the Funds. As principal underwriter, HFD receives 12b-1 fees from the Fund. The Board also noted that certain affiliates of HFD distribute shares of the Funds and receive compensation in that connection.
The Board considered the benefits to shareholders of being part of the Hartford Funds family of funds. The Board considered HFMC’s efforts to provide investors in the family with a broad range of investment styles and asset classes.
* * * *
Based upon its review of these various factors, among others, the Board concluded that it is in the best interests of each Fund and its shareholders for the Board to approve the Agreement for an additional year. In reaching this decision, the Board did not assign relative weights to the factors discussed above or deem any one or group of them to be controlling in and of themselves. In connection with their deliberations, the Independent Directors met separately in executive session on several occasions, with independent legal counsel and the Consultant, to review the relevant materials and consider their responsibilities under relevant laws and regulations.
| 48 |
| Hartford Series Fund, Inc. |
| Main Risks (Unaudited) |
The main risks of investing in the Funds are described below. Each Fund is exposed to these risks through its investment in the corresponding Underlying Fund.
American Funds Asset Allocation HLS Fund 1,2,3,6,8,9,10,11,12
American Funds Blue Chip Income and Growth HLS Fund 4,6,7,9,11,12
American Funds Bond HLS Fund 2,3,6,8,9,10,11,12,13,16
American Funds Global Bond HLS Fund 2,3,5,6,8,9,10,11,12,14
American Funds Global Growth and Income HLS Fund 4,5,6,7,9,11,12
American Funds Global Growth HLS Fund 5,6,7,9,11,12
American Funds Global Small Capitalization HLS Fund 5,6,7,9,11,12,15
American Funds Growth HLS Fund 6,7,9,11,12
American Funds Growth-Income HLS Fund 4,6,7,9,11,12
American Funds International HLS Fund 5,6,7,9,11,12
American Funds New World HLS Fund 2,3,5,6,7,8,9,10,11,12,15
| 1. | Asset Allocation Risk - The risk that if the strategy of the Underlying Fund’s investment adviser for allocating assets among different asset classes does not work as intended, the Fund may not achieve its objective or may underperform other funds with similar investment strategies. |
| 2. | Call Risk - Call risk is the risk that an issuer, especially during a period of falling interest rates, may redeem a security by repaying it early, which may reduce the Fund’s income if the proceeds are reinvested at lower interest rates. |
| 3. | Credit Risk - Credit risk is the risk that the issuer of a security or other instrument will not be able to make principal and interest payments when due. Changes in an issuer’s credit rating or the market’s perception of an issuer’s creditworthiness may also affect the value of the Fund’s investment in that issuer. The degree of credit risk depends on both the financial condition of the issuer and the terms of the obligation. |
| 4. | Dividend Paying Security Investment Risk - Securities that pay high dividends as a group can fall out of favor with the market, causing the Fund during such periods to underperform funds that do not focus on dividends. The Fund’s focus on dividend paying investments may cause the Fund’s share price and total return to fluctuate more than the share price and total return of funds that do not focus their investments on dividend paying securities. In addition, income provided by the Fund may be affected by changes in the dividend policies of the companies in which the Fund invests and the capital resources available for such payments at such companies. |
| 5. | Emerging Markets Risk - The risks related to investing in foreign securities are generally greater with respect to securities of companies that conduct their principal business activities in emerging markets or whose securities are traded principally on exchanges in emerging markets. The risks of investing in emerging markets include risks of illiquidity, increased price volatility, smaller market capitalizations, less government regulation, less extensive and less frequent accounting, financial and other reporting requirements, risk of loss resulting from problems in share registration and custody and substantial economic and political disruptions. |
| 6. | Foreign Investments Risk - Investments in foreign securities may be riskier than investments in U.S. securities. Differences between the U.S. and foreign regulatory regimes and securities markets, including the less stringent investor protection and disclosure standards of some foreign markets, as well as political and economic developments in foreign countries and regions, may affect the value of the Fund’s investments in foreign securities. Changes in currency exchange rates may also adversely affect the Fund’s foreign investments. |
| 49 |
| Hartford Series Fund, Inc. |
| Main Risks (Unaudited) ─ (continued) |
| 7. | Growth Orientation Risk - The price of a growth company’s stock may decrease, or it may not increase to the level that the Underlying Fund’s investment adviser had anticipated. In addition, growth stocks may be more volatile than other stocks because they are more sensitive to investors’ perceptions of the issuing company’s growth potential. Also, the growth investing style may over time go in and out of favor. At times when the investing style used by the Underlying Fund is out of favor, the Underlying Fund may underperform other equity funds that use different investing styles. |
| 8. | Interest Rate Risk - The risk that your investment may go down in value when interest rates rise, because when interest rates rise, the prices of bonds and fixed rate loans fall. Generally, the longer the maturity of a bond or fixed rate loan, the more sensitive it is to this risk. Falling interest rates also create the potential for a decline in the Fund’s income. These risks are greater during periods of rising inflation. |
| 9. | Investment Strategy Risk - The investment strategy of the Underlying Fund’s investment adviser will influence performance significantly. If the strategy of the Underlying Fund’s investment adviser does not perform as expected, the Fund could underperform its peers or lose money. There is no guarantee that the Underlying Fund’s investment objective will be achieved. |
| 10. | Junk Bond Risk - Investments rated below investment grade (also referred to as “junk bonds”) are considered to be speculative and are subject to heightened credit risk, which may make the Fund more sensitive to adverse developments in the U.S. and abroad. Lower rated debt securities generally involve greater risk of default or price changes due to changes in the issuer’s creditworthiness than higher rated debt securities. The market prices of these securities may fluctuate more than higher quality securities and may decline significantly in periods of general economic difficulty. There may be little trading in the secondary market for particular debt securities, which may make them more difficult to value or sell. |
| 11. | Master-Feeder Structure Risk - Because it invests in the Underlying Fund, the Fund is also subject to risks related to the master-feeder structure. Other “feeder” funds may also invest in an Underlying Fund. As shareholders of an Underlying Fund, feeder funds, including the Fund, vote on matters pertaining to their respective Underlying Fund. Feeder funds with a greater pro rata ownership in an Underlying Fund could have effective voting control of the operations of the Underlying Fund. Also, a large-scale redemption by another feeder fund may increase the proportionate share of the costs of an Underlying Fund borne by the remaining feeder fund shareholders, including the applicable fund. |
| 12. | Market Risk - Market risk is the risk that one or more markets in which the Fund invests will go down in value, including the possibility that the markets will go down sharply and unpredictably. Securities may decline in value due to the activities and financial prospects of individual companies or to general market and economic movements and trends. |
| 13. | Mortgage- and Asset-Backed Securities Risk - Mortgage- and asset-backed securities represent interests in “pools” of mortgages or other assets, including consumer loans or receivables held in trust. Mortgage-backed securities are subject to credit risk, interest rate risk, “prepayment risk” (the risk that borrowers will repay a loan more quickly in periods of falling interest rates) and “extension risk” (the risk that borrowers will repay a loan more slowly in periods of rising interest rates). If the Fund invests in mortgage-backed or asset-backed securities that are subordinated to other interests in the same mortgage pool, the Fund may only receive payments after the pool’s obligations to other investors have been satisfied. An unexpectedly high rate of defaults on the mortgages held by a mortgage pool may limit substantially the pool’s ability to make payments of principal or interest to the Fund, reducing the values of those securities or in some cases rendering them worthless. The risk of such defaults is generally higher in the case of mortgage pools that include so-called “subprime” mortgages. |
| 14. | Non-Diversification Risk - The Underlying Fund is non-diversified, which means it is permitted to invest more of its assets in fewer issuers than a “diversified” fund. Thus, the Fund may be more exposed to the risks associated with and developments affecting an individual issuer than a fund that invests more widely. The Fund may also be subject to greater market fluctuation and price volatility than a more broadly diversified Fund. |
| 50 |
| 15. | Small Cap Stock Risk – Small capitalization stocks may be more risky than stocks of larger companies. Historically, small market capitalization stocks and stocks of recently organized companies are subject to increased price volatility due to: |
| · | less certain growth prospects |
| · | lower degree of liquidity in the markets for such stocks |
| · | thin trading that could result in the stocks being sold at a discount or in small lots over an extended period of time |
| · | limited product lines, markets or financial resources |
| · | dependence on a few key management personnel |
| · | increased susceptibility to losses and bankruptcy increased transaction costs |
| 16. | U.S. Government Securities Risk - Treasury obligations may differ in their interest rates, maturities, times of issuance and other characteristics. Obligations of U.S. Government agencies and authorities are supported by varying degrees of credit but generally are not backed by the full faith and credit of the U.S. Government. No assurance can be given that the U.S. Government will provide financial support to its agencies and authorities if it is not obligated by law to do so. In addition, the value of U.S. Government securities may be affected by changes in the credit rating of the U.S. Government. |
| 51 |
THIS PRIVACY POLICY IS NOT PART OF THIS REPORT
Privacy Policy and Practices of The Hartford Financial Services Group, Inc. and its Affiliates
(herein called “we, our, and us”)
This Privacy Policy applies to our United States Operations
We value your trust. We are committed to the responsible: a) management; b) use; and c) protection; of Personal Information. This notice describes how we collect, disclose, and protect Personal Information.
We collect Personal Information to: a) service your Transactions with us; and b) support our business functions.
We may obtain Personal Information from: a) You; b) your Transactions with us; and c) third parties such as a consumer-reporting agency.
Based on the type of product or service You apply for or get from us, Personal Information such as: a) your name; b) your address; c) your income; d) your payment; or e) your credit history; may be gathered from sources such as applications, Transactions, and consumer reports.
To serve You and service our business, we may share certain Personal Information. We will share Personal Information, only as allowed by law, with affiliates such as: a) our insurance companies; b) our employee agents; c) our brokerage firms; and d) our administrators.
As allowed by law, we may share Personal Financial Information with our affiliates to: a) market our products; or b) market our services; to You without providing You with an option to prevent these disclosures. | We may also share Personal Information, only as allowed by law, with unaffiliated third parties including:
When allowed by law, we may share certain Personal Financial Information with other unaffiliated third parties who assist us by performing services or functions such as:
We, and third parties we partner with, may track some of the pages You visit through the use of: a) cookies; b) pixel tagging; or c) other technologies; and currently do not process or comply with any web browser’s “do not track” signal or similar mechanism that indicates a request to disable online tracking of individual users who visit our websites or use our services.
We will not sell or share your Personal Financial Information with anyone for purposes unrelated to our business functions without offering You the opportunity to:
We only disclose Personal Health Information with:
Our employees have access to Personal Information in the course of doing their jobs, such as: |
We use manual and electronic security procedures to maintain: a) the confidentiality; and b) the integrity of; Personal Information that we have. We use these procedures to guard against unauthorized access.
Some techniques we use to protect Personal Information include: a) secured files; b) user authentication; c) encryption; d) firewall technology; and e) the use of detection software.
We are responsible for and must: a) identify information to be protected; b) provide an adequate level of protection for that data; c) grant access to protected data only to those people who must use it in the performance of their job-related duties. Employees who violate our Privacy Policy will be subject to discipline, which may include ending their employment with us.
At the start of our business relationship, we will give You a copy of our current Privacy Policy.
We will also give You a copy of our current Privacy Policy once a year if You maintain a continuing business relationship with us.
We will continue to follow our Privacy Policy regarding Personal Information even when a business relationship no longer exists between us. | As used in this Privacy Notice:
Application means your request for our product or service.
Personal Financial Information means financial information such as:
Personal Health Information means health information such as:
Personal Information means information that identifies You personally and is not otherwise available to the public. It includes:
Transaction means your business dealings with us, such as:
You means an individual who has given us Personal Information in conjunction with: |
This Privacy Policy is being provided on behalf of the following affiliates of The Hartford Financial Services Group, Inc.:
1stAGChoice, Inc.; Access CoverageCorp, Inc.; Access CoverageCorp Technologies, Inc.; American Maturity Life Insurance Company; Archway 60 R, LLC; Business Management Group, Inc.; Catalyst360, LLC; Champlain Life Reinsurance Company; DMS R, LLC; Eloy R, LLC; Ersatz Corporation; First State Insurance Company; Hartford Accident and Indemnity Company; Hartford Administrative Services Company; Hartford Casualty General Agency, Inc.; Hartford Casualty Insurance Company; Hartford-Comprehensive Employee Benefit Service Company; Hartford Equity Sales Company, Inc.; Hartford Fire General Agency, Inc.; Hartford Fire Insurance Company; Hartford Funds Management Company, LLC; Hartford Funds Management Group, Inc.; Hartford HLS Series Fund II, Inc.; Hartford Insurance Company of Illinois; Hartford Insurance Company of the Midwest; Hartford Insurance Company of the Southeast; Hartford Integrated Technologies, Inc.; Hartford International Life Reassurance Corporation; Hartford Funds Distributors, LLC; Hartford Investment Management Company; Hartford Life and Accident Insurance Company; Hartford Life and Annuity Insurance Company; Hartford Life Insurance Company; Hartford Life Private Placement, LLC; Hartford Lloyd’s Corporation; Hartford Lloyd’s Insurance Company; Hartford Mezzanine Investors I, LLC; Hartford Residual Market, L.C.C.; Hartford Retirement Services, LLC; Hartford Securities Distribution Company, Inc.; Hartford Series Fund, Inc.; Hartford Specialty Insurance Services of Texas, LLC; Hartford Strategic Investments, LLC; Hartford Underwriters Insurance Company; Hartford Technology Services Company, L.L.C.; Hartford of Texas General Agency, Inc.; Hartford Underwriters General Agency, Inc.; HARTRE Company, L.C.C.; HL Investment Advisors, LLC; HLA LLC; Horizon Management Group, LLC; HRA Brokerage Services, Inc.; Lanidex Class B, LLC; M-CAP Insurance Agency, LLC; New England Insurance Company; New England Reinsurance Corporation; Nutmeg Insurance Agency, Inc.; Nutmeg Insurance Company; Pacific Insurance Company, Limited; Planco, LLC: Property and Casualty Insurance Company of Hartford; Revere R, LLC; RVR R, LLC; Sentinel Insurance Company, Ltd.; Sunstone R, LLC; Symphony R, LLC; The Evergreen Group Incorporated; The Hartford Alternative Strategies Fund; The Hartford Mutual Funds, Inc.; The Hartford Mutual Funds II, Inc.; Trumbull Flood Management, L.L.C.; Trumbull Insurance Company; Twin City Fire Insurance Company; White River Life Reinsurance Company.
HPP Revised December 2013
HARTFORD HLS FUNDS
c/o The Hartford Wealth Management - Global Annuities
P.O. Box 14293
Lexington, KY 40512-4293
HARTFORDFUNDS
hartfordfunds.com
Hartford Series Fund, Inc. is underwritten and distributed by Hartford Funds Distributors, LLC.
Hartford Series Fund, Inc. inception dates range from 1977 to date. Hartford Series Fund, Inc. is not a subsidiary of The Hartford Financial Services Group, Inc. ("The Hartford") but is underwritten, distributed by and advised by subsidiaries of The Hartford. Investments in Hartford Series Fund, Inc. are not guaranteed by The Hartford or any other entity.
This report is submitted for the general information of the shareholders of the Funds. It is not authorized for distribution unless preceded or accompanied by a current prospectus for the Funds.
Investors should carefully consider the investment objectives, risks, charges, and expenses of Hartford Funds before investing. This and other information can be found in the prospectus and summary prospectus, which can be obtained by calling 888-843-7824 (retail) or 877-836-5854 (institutional). Investors should read them carefully before they invest.
AFHLSAR-13 2-14 113558-2 Printed in U.S.A ©2013 The Hartford, Hartford, CT 06115
HARTFORDFUNDS
| HARTFORD BALANCED HLS FUND
2013 Annual Report
|
A MESSAGE FROM THE PRESIDENT
Dear Fellow Shareholders:
Thank you for investing in Hartford HLS Funds.
Market Review
U.S. equities (as represented by the S&P 500 Index) generated their strongest year since 1997 in 2013, rising 32.39% for the year. During the fourth quarter, equities rose without looking back, pushing the S&P 500 Index and the Dow Jones Industrial Average to new all-time highs. Despite previously cheering delays to quantitative-easing tapering, the stock market received an additional boost at the end of the year following the U.S. Federal Reserve’s (Fed) announcement of a $10-billion-a-month reduction in bond purchases beginning in January.
The Fed’s decision to begin tapering its bond purchases is generally considered a vote of confidence in the recovering U.S. economy. Consumer spending has stabilized, the housing market is showing steady improvement, the unemployment rate is slowly declining and economic growth clocked in at a healthy 4.1% in the third quarter. Equities have also recovered since the market low in March 2009: The S&P 500 Index has gained 173% from the market low through December 31, 2013.
Signs of improvement are also visible outside the U.S. Europe appears to have begun its own economic recovery, and emerging markets have reversed their recent lackluster performance. Fiscal policy continues to wield significant influence in today’s economy and central banks across the globe are maintaining their accommodative stances, including the appointment of Janet Yellen, who is widely expected to continue current monetary policies, to succeed Ben Bernanke as U.S. Federal Reserve chairman.
It’s important to stay abreast of domestic and international economic developments while balancing your individual investment goals. Meeting with your financial advisor on a regular basis to examine your current investment strategy can help you determine whether you are on the right track:
| • | Is your portfolio fully diversified with an appropriate mix of stocks and bonds? |
| • | Is your portfolio incorporating both domestic and international holdings to take advantage of the global economic recovery? |
| • | Are your investments still in line with your risk tolerance and investment time horizon? |
Your financial advisor can help you choose options within our fund family to navigate today’s markets with confidence.
Thank you again for investing with Hartford HLS Funds.
James Davey
President
Hartford HLS Funds
1The S&P 500 Index is a market capitalization-weighted price index composed of 500 widely held common stocks.
2The Dow Jones Industrial Average is an unmanaged, price-weighted index of 30 of the largest, most widely held stocks traded on the New York Stock Exchange.
Table of Contents
This report is prepared for the general information of contract owners and qualified retirement plan participants. It is not an offer of contracts or of qualified retirement plans. It should not be used in connection with any offer, except in conjunction with the appropriate product prospectus which contains all pertinent information including the applicable sales, administrative and other charges.
The views expressed in the Fund’s Manager Discussion under ‘‘Why did the Fund perform this way?’’ and ‘‘What is the outlook?’’ are views of the Fund’s sub-adviser and portfolio management team through the end of the period and are subject to change based on market and other conditions. The Fund’s Manager Discussion is for informational purposes only and does not represent an offer, recommendation or solicitation to buy, hold or sell any security. The specific securities identified and described, if any, do not represent all of the securities purchased or sold and you should not assume that investments in the securities identified and discussed will be profitable.
Hartford Balanced HLS Fund inception 03/31/1983
(sub-advised by Wellington Management Company, LLP)
| Investment objective – Seeks long-term total return. |
Performance Overview 12/31/03 - 12/31/13

The chart above represents the hypothetical growth of a $10,000 investment in Class IA. Growth results in classes other than Class IA will vary from what is seen above due to differences in the expenses charged to those share classes.
| Average Annual Total Returns (as of 12/31/13) |
| 1 Year | 5 Years | 10 Years | ||||||||||
| Balanced IA | 21.19 | % | 15.10 | % | 6.13 | % | ||||||
| Balanced IB | 20.88 | % | 14.81 | % | 5.87 | % | ||||||
| Barclays Government/Credit Bond Index | -2.35 | % | 4.40 | % | 4.52 | % | ||||||
| S&P 500 Index | 32.39 | % | 17.94 | % | 7.41 | % | ||||||
PERFORMANCE DATA QUOTED REPRESENTS PAST PERFORMANCE AND DOES NOT GUARANTEE FUTURE RESULTS. The investment return and principal value of the investment will fluctuate so that investors’ shares, when redeemed, may be worth more or less than their original cost. Current performance may be lower or higher than the performance data quoted. To obtain performance data current to the most recent month-end, please visit our website at www.hartfordfunds.com.
Total returns presented above were calculated using the Fund’s net asset value available to shareholders for sale or redemption of Fund shares on December 31, 2013, which may exclude investment transactions as of this date. All share class returns assume the reinvestment of all distributions at net asset value and the deduction of all fund expenses.
Barclays Government/Credit Bond Index is an unmanaged, market-value-weighted index of all debt obligations of the U.S. Treasury and U.S. Government agencies (excluding mortgage-backed securities) and of all publicly-issued fixed-rate, nonconvertible, investment grade domestic corporate debt.
S&P 500 Index is a market capitalization-weighted price index composed of 500 widely held common stocks.
You cannot invest directly in an index.
As of the Fund's current prospectus dated May 1, 2013, the total annual operating expense ratios for Class IA and Class IB were 0.65% and 0.90%, respectively. Actual expenses may be higher. Please see the accompanying Financial Highlights for expense ratios for the year ended December 31, 2013.
All investments are subject to risk including the possible loss of principal. For a discussion of the Fund’s risks, please see the Main Risks section of this report. For more detailed information on the risks associated with an investment in the Fund, please see the prospectus.
The chart and table do not reflect the deductions of taxes, sales charges or other fees which may be applied at the variable life insurance, variable annuity or qualified retirement plan product level. Any such additional sales charges or other fees or expenses would lower the contract’s or plan’s performance.
| 2 |
| Hartford Balanced HLS Fund |
| Manager Discussion |
| December 31, 2013 (Unaudited) |
| Portfolio Managers | |
| John C. Keogh | Karen H. Grimes, CFA |
| Senior Vice President and Fixed Income Portfolio Manager | Senior Vice President and Equity Portfolio Manager |
How did the Fund perform?
The Class IA shares of the Hartford Balanced HLS Fund returned 21.19% for the twelve-month period ended December 31, 2013, versus the Fund’s benchmarks, the Barclays Government/Credit Bond Index and the S&P 500 Index, which returned -2.35% and 32.39%, respectively, for the same period. The Fund outperformed the 19.17% average return of the Variable Products-Underlying Funds Lipper Mixed-Asset Target Allocation Growth Funds peer group, a group of funds that hold between 60%-80% in equity securities, with the remainder invested in bonds, cash, and cash equivalents.
Why did the Fund perform this way?
U.S. equities reached another all-time high in December and finished 2013 with a gain of 32.4%, as measured by the S&P 500 Index, the Index’s best return since 1997. The rally in U.S. equities began on the first trading day of the year after a last-minute compromise by the U.S. Congress averted the fiscal cliff. Optimism surrounding the fiscal reprieve was furthered during the first quarter by better-than-expected corporate earnings, a robust housing market, and a steadily improving employment picture. Solid gains in April and the first part of May paused following comments by U.S. Federal Reserve (Fed) Chairman Ben Bernanke that suggested the Fed might begin to slow quantitative easing sooner than investors anticipated. Nonetheless, equities resumed their ascent in the third quarter as the surprising “no taper” decision by the Federal Open Markets Committee eased near-term concerns about rapidly rising interest rates derailing the recovery. Additionally, accommodative rhetoric from the European Central Bank, along with encouraging data in China and further evidence of a European economic recovery, contributed to a broad-based global equity rally that extended through the end of the year. In December, the year ended with an optimistic tone as investors cheered the elimination of two market overhangs: the timing of Fed tapering and the threat of another U.S. government shutdown in early 2014.
Equity markets, as measured by the S&P 500 Index, returned (+32%) during the period. Within the S&P 500 Index, Consumer Discretionary (+43%), Health Care (+41%), and Industrials (+41%) sectors posted the largest gains while Telecommunication Services (+12%), Utilities (+13%), and Energy (+25%) lagged the broader index.
The Barclays Government/Credit Bond Index returned -2.35% for the period. Signs of economic momentum and speculation over Fed tapering weighed on U.S. Treasury prices during the year; for the full year 2013, 5-, 10-, and 30-year Treasury yields rose 1.02%, 1.27%, and 1.02%, respectively. Many of the major fixed income sectors, with the exception of high yield and bank loans, posted negative absolute returns during the period due to the rise in yields. However, most sectors outperformed Treasuries on a duration-adjusted basis as credit spreads tightened.
The Fund has three primary levers to generate investment performance: equity investments, fixed income investments, and asset allocation among stocks, bonds, and cash. During the period, the equity and fixed income portions of the Fund outperformed their respective benchmarks. Asset allocation was the primary driver of benchmark-relative outperformance during the period as the Fund was generally overweight in equities and underweight in fixed income and cash relative to the benchmark.
Equity outperformance versus the benchmark was driven by sector allocation, which is a result of our bottom-up stock selection process. An underweight to Telecommunication Services and an overweight to Health Care aided results. This was partially offset by a frictional cash position which detracted in a rising equity environment. Overall security selection also contributed positively to relative returns, in part due to strong stock selection in the Financials and Industrials sectors.
Top contributors to relative performance of the equity portion of the Fund during the period were Celgene (Health Care), Vertex Pharmaceuticals (Health Care), and IBM (Information Technology). Shares of Celgene, a global biopharmaceutical company that engages in the discovery, development, and commercialization of therapies designed to treat cancer and immune-inflammatory related diseases, surged after management announced strong quarterly performance, beating consensus revenue and earnings estimates and raising its 2013 earnings-per-share (EPS) guidance. Vertex Pharmaceuticals, a biotech firm with a focus on cancer and neurodegenerative diseases, saw its shares surge after a Phase II study showed that its cystic fibrosis drug Kalydeco, combined with an experimental drug VX-661, significantly improved the lung function of patients. Software manufacturer IBM saw its shares fall after the company
| 3 |
| Hartford Balanced HLS Fund |
| Manager Discussion – (continued) |
| December 31, 2013 (Unaudited) |
reported weaker-than-expected sales, in part due to a weak IT spending environment, disappointing results from the hardware business, and poor performance in China. Our underweight position in the company contributed to benchmark-relative results. Our positions in JPMorgan (Financials) and Google (Information Technology) also contributed positively to the Fund’s returns on an absolute basis.
Stocks that detracted the most from relative returns in the equity portion of the Fund during the period were Maxim Integrated Products (Information Technology), Mosaic (Materials), and Statoil (Energy). Shares of Maxim Integrated Products, a U.S.-based international supplier of quality analog and mixed signal semiconductors, lagged the market on concerns that its largest customer, Samsung, continues to experience disappointing commercial success with its high-end mobile products. Mosaic, one of the largest global fertilizer producers, saw its shares fall amid a deteriorating demand and pricing environment for phosphates and potash. Statoil is a Norway-based integrated energy company primarily engaged in oil and gas exploration and production. Shares fell amid falling oil and gas production and prices. Apple (Information Technology) and Coach (Consumer Discretionary) also detracted from the Fund’s returns on an absolute basis.
The fixed income portion of the Fund also outperformed its benchmark during the period. Security selection within the investment grade corporate bond sector, led by financials, was the primary driver of the outperformance. The portfolio’s short duration positioning was also a large contributor to benchmark-relative results, as rates increased over the period. Allocations to agency mortgage backed securities (MBS) pass-throughs and commercial mortgage backed securities (CMBS) also contributed to relative outperformance.
Derivatives are not used in a significant manner in this Fund and did not have a material impact on performance during the period.
What is the outlook?
While equities enjoyed strong gains during 2013, much of this was accomplished through multiple expansion. In 2014, we anticipate more balance with earnings growth becoming a more important driver. In the U.S., we continue to believe there will be positive gross domestic product (GDP) growth of about 3% as the fiscal drag reverses. We estimate that fiscal policies reduced GDP by 1.5% in 2013 (and some of these effects may linger in early 2014), but importantly, state and local governments now appear to be moving back to expansionary mode. The employment picture continues to improve and housing should remain constructive, in our view. Housing paused recently in part due to the uptick in mortgage rates but we believe it will reaccelerate in the spring selling season. While higher rates can be a hurdle to further recovery, they are still low historically and we believe early signs of wage growth should boost consumer confidence. The Fed is expected to remain accommodative throughout the year and we view the Fed’s decision to start unwinding quantitative easing as a healthy sign for the economy. We have been encouraged by recent data out of Europe that suggests Europe has stabilized. We believe the euro area economy could expand by 1 to 1.5% in 2014. We are watching France as an ongoing risk. France is Europe’s second largest economy and government policies have so far failed to revive growth as GDP is still contracting. Data out of Japan has been positive as Prime Minister Shinzo Abe’s bid to revitalize the economy appears to be rekindling growth after decades of economic malaise.
At the end of the period, our largest overweights relative to the benchmark in the equity portion of the Fund were in the Health Care and Information Technology sectors. Our largest underweights were in the Consumer Staples and Industrials sectors.
Within the fixed income portion of the Fund, we ended the period with a short duration posture. We continue to be positioned with a modest underweight to the Government sector, as we believe that there are more compelling opportunities in other sectors, such as agency MBS. Within investment grade corporates, we continue to focus on financials and communications issuers. Financial companies have de-leveraged significantly, and communications issuers have solid balance sheets, in our view. We also maintain an overweight to taxable municipals.
The equity and fixed income managers will continue to work collaboratively to make decisions regarding portfolio weights in stocks, bonds, and cash. As of December 31, 2013, the Fund’s equity exposure was at 69% compared to 60% in its benchmark, and at the upper end of the Fund’s 50-70% range.
| 4 |
| Diversification by Security Type | ||||
| as of December 31, 2013 | ||||
| Category | Percentage of Net Assets | |||
| Equity Securities | ||||
| Common Stocks | 68.9 | % | ||
| Total | 68.9 | % | ||
| Fixed Income Securities | ||||
| Asset & Commercial Mortgage Backed Securities | 0.3 | % | ||
| Corporate Bonds | 11.1 | |||
| Municipal Bonds | 1.0 | |||
| U.S. Government Agencies | 2.7 | |||
| U.S. Government Securities | 14.1 | |||
| Total | 29.2 | % | ||
| Short-Term Investments | 2.7 | % | ||
| Other Assets and Liabilities | (0.8 | ) | ||
| Total | 100.0 | % | ||
| Credit Exposure | ||||
| as of December 31, 2013 | ||||
| Credit Rating * | Percentage of Net Assets | |||
| Aaa / AAA | 3.1 | % | ||
| Aa / AA | 15.8 | |||
| A | 4.3 | |||
| Baa / BBB | 5.4 | |||
| Ba / BB | 0.1 | |||
| Not Rated | 0.5 | |||
| Non-Debt Securities and Other Short-Term Instruments | 71.6 | |||
| Other Assets and Liabilities | (0.8 | ) | ||
| Total | 100.0 | % | ||
| * | Credit exposure is the long-term credit ratings for the Fund's holdings, as of the date noted, as provided by Standard and Poor's (S&P) or Moody's Investors Service and typically range from AAA/Aaa (highest) to C/D (lowest). If Moody's and S&P assign different ratings, the lower rating is used. Fixed income securities that are not rated by either agency are listed as "Not Rated." Ratings do not apply to the Fund itself or to Fund shares. Ratings may change. |
| 5 |
| Hartford Balanced HLS Fund |
| Schedule of Investments |
| December 31, 2013 |
| (000’s Omitted) |
| Shares or Principal Amount | Market Value ╪ | |||||||
| COMMON STOCKS - 68.9% | ||||||||
| Automobiles and Components - 0.6% | ||||||||
| 1,228 | Ford Motor Co. | $ | 18,948 | |||||
| Banks - 3.8% | ||||||||
| 503 | BB&T Corp. | 18,769 | ||||||
| 474 | PNC Financial Services Group, Inc. | 36,759 | ||||||
| 1,445 | Wells Fargo & Co. | 65,610 | ||||||
| 121,138 | ||||||||
| Capital Goods - 4.4% | ||||||||
| 288 | 3M Co. | 40,417 | ||||||
| 156 | Boeing Co. | 21,308 | ||||||
| 442 | Ingersoll-Rand plc | 27,252 | ||||||
| 472 | PACCAR, Inc. | 27,906 | ||||||
| 215 | United Technologies Corp. | 24,466 | ||||||
| 141,349 | ||||||||
| Consumer Durables and Apparel - 0.7% | ||||||||
| 159 | PVH Corp. | 21,682 | ||||||
| Diversified Financials - 6.7% | ||||||||
| 170 | Ameriprise Financial, Inc. | 19,599 | ||||||
| 107 | BlackRock, Inc. | 33,770 | ||||||
| 779 | Citigroup, Inc. | 40,581 | ||||||
| 142 | Goldman Sachs Group, Inc. | 25,183 | ||||||
| 704 | Invesco Ltd. | 25,616 | ||||||
| 1,144 | JP Morgan Chase & Co. | 66,900 | ||||||
| 211,649 | ||||||||
| Energy - 6.7% | ||||||||
| 313 | Anadarko Petroleum Corp. | 24,793 | ||||||
| 805 | BG Group plc | 17,314 | ||||||
| 401 | BP plc ADR | 19,513 | ||||||
| 257 | Chevron Corp. | 32,043 | ||||||
| 83 | EOG Resources, Inc. | 13,986 | ||||||
| 454 | Exxon Mobil Corp. | 45,928 | ||||||
| 499 | Halliburton Co. | 25,325 | ||||||
| 227 | Occidental Petroleum Corp. | 21,553 | ||||||
| 324 | Southwestern Energy Co. ● | 12,725 | ||||||
| 213,180 | ||||||||
| Food and Staples Retailing - 1.1% | ||||||||
| 498 | CVS Caremark Corp. | 35,651 | ||||||
| Food, Beverage and Tobacco - 3.4% | ||||||||
| 150 | Anheuser-Busch InBev N.V. ADR | 16,011 | ||||||
| 165 | Diageo plc ADR | 21,823 | ||||||
| 291 | Kraft Foods Group, Inc. | 15,692 | ||||||
| 395 | Mondelez International, Inc. | 13,933 | ||||||
| 216 | Philip Morris International, Inc. | 18,808 | ||||||
| 564 | Unilever N.V. NY Shares ADR | 22,695 | ||||||
| 108,962 | ||||||||
| Health Care Equipment and Services - 2.5% | ||||||||
| 323 | Baxter International, Inc. | 22,446 | ||||||
| 428 | Covidien plc | 29,136 | ||||||
| 385 | UnitedHealth Group, Inc. | 28,969 | ||||||
| 80,551 | ||||||||
| Insurance - 2.5% | ||||||||
| 502 | American International Group, Inc. | 25,638 | ||||||
| 759 | Marsh & McLennan Cos., Inc. | 36,696 | ||||||
| 490 | Unum Group | 17,199 | ||||||
| 79,533 | ||||||||
| Materials - 2.0% | ||||||||
| 558 | Dow Chemical Co. | 24,781 | ||||||
| 458 | International Paper Co. | 22,456 | ||||||
| 285 | Nucor Corp. | 15,209 | ||||||
| 62,446 | ||||||||
| Media - 3.1% | ||||||||
| 267 | CBS Corp. Class B | 17,003 | ||||||
| 555 | Comcast Corp. Class A | 28,818 | ||||||
| 525 | Thomson Reuters Corp. | 19,837 | ||||||
| 408 | Walt Disney Co. | 31,145 | ||||||
| 96,803 | ||||||||
| Pharmaceuticals, Biotechnology and Life Sciences - 9.7% | ||||||||
| 349 | Agilent Technologies, Inc. | 19,964 | ||||||
| 203 | Amgen, Inc. | 23,186 | ||||||
| 186 | AstraZeneca plc ADR | 11,025 | ||||||
| 371 | Bristol-Myers Squibb Co. | 19,703 | ||||||
| 181 | Celgene Corp. ● | 30,642 | ||||||
| 955 | Daiichi Sankyo Co., Ltd. | 17,453 | ||||||
| 282 | Gilead Sciences, Inc. ● | 21,193 | ||||||
| 131 | Johnson & Johnson | 11,969 | ||||||
| 1,016 | Merck & Co., Inc. | 50,829 | ||||||
| 128 | Roche Holding AG | 35,742 | ||||||
| 443 | UCB S.A. | 33,000 | ||||||
| 344 | Vertex Pharmaceuticals, Inc. ● | 25,535 | ||||||
| 274 | Zoetis, Inc. | 8,965 | ||||||
| 309,206 | ||||||||
| Retailing - 4.3% | ||||||||
| 11,702 | Allstar Co. ⌂●† | 25,390 | ||||||
| 56 | AutoZone, Inc. ● | 26,989 | ||||||
| 290 | Kohl's Corp. | 16,475 | ||||||
| 771 | Lowe's Cos., Inc. | 38,187 | ||||||
| 290 | Nordstrom, Inc. | 17,898 | ||||||
| 163 | Tory Burch LLC ⌂† | 12,615 | ||||||
| 137,554 | ||||||||
| Semiconductors and Semiconductor Equipment - 3.4% | ||||||||
| 537 | Analog Devices, Inc. | 27,362 | ||||||
| 1,067 | Intel Corp. | 27,701 | ||||||
| 1,001 | Maxim Integrated Products, Inc. | 27,925 | ||||||
| 541 | Xilinx, Inc. | 24,828 | ||||||
| 107,816 | ||||||||
| Software and Services - 6.4% | ||||||||
| 361 | Accenture plc | 29,650 | ||||||
| 447 | eBay, Inc. ● | 24,517 | ||||||
| 43 | Google, Inc. ● | 47,720 | ||||||
| 1,390 | Microsoft Corp. | 52,037 | ||||||
| 472 | Oracle Corp. | 18,055 | ||||||
| 1,333 | Symantec Corp. | 31,426 | ||||||
| 203,405 | ||||||||
| Technology Hardware and Equipment - 5.2% | ||||||||
| 105 | Apple, Inc. | 58,647 | ||||||
| 2,445 | Cisco Systems, Inc. | 54,895 | ||||||
| 1,308 | EMC Corp. | 32,898 | ||||||
| 236 | Qualcomm, Inc. | 17,490 | ||||||
| 163,930 | ||||||||
| Telecommunication Services - 0.5% | ||||||||
| 377 | Vodafone Group plc ADR | 14,810 | ||||||
| Transportation - 0.8% | ||||||||
| 182 | FedEx Corp. | 26,160 | ||||||
The accompanying notes are an integral part of these financial statements.
| 6 |
| Shares or Principal Amount | Market Value ╪ | |||||||
| COMMON STOCKS - 68.9% - (continued) | ||||||||
| Utilities - 1.1% | ||||||||
| 423 | NextEra Energy, Inc. | $ | 36,199 | |||||
| Total common stocks | ||||||||
| (cost $1,487,838) | $ | 2,190,972 | ||||||
| ASSET & COMMERCIAL MORTGAGE BACKED SECURITIES - 0.3% | ||||||||
| Computer and Electronic Product Manufacturing - 0.1% | ||||||||
| SBA Tower Trust | ||||||||
| $ | 2,035 | 4.25%, 04/15/2015 ■Δ | $ | 2,061 | ||||
| Finance and Insurance - 0.2% | ||||||||
| Ally Master Owner Trust | ||||||||
| 4,885 | 1.54%, 09/15/2019 | 4,850 | ||||||
| Hilton USA Trust | ||||||||
| 1,765 | 2.66%, 11/05/2030 ■ | 1,747 | ||||||
| New Century Home Equity Loan Trust | ||||||||
| 8 | 0.74%, 03/25/2035 Δ | 8 | ||||||
| 6,605 | ||||||||
| Total asset & commercial mortgage backed securities | ||||||||
| (cost $8,692) | $ | 8,666 | ||||||
| CORPORATE BONDS - 11.1% | ||||||||
| Air Transportation - 0.3% | ||||||||
| Continental Airlines, Inc. | ||||||||
| $ | 3,560 | 5.98%, 04/19/2022 | $ | 3,890 | ||||
| Southwest Airlines Co. | ||||||||
| 2,700 | 5.75%, 12/15/2016 | 3,008 | ||||||
| 2,702 | 6.15%, 08/01/2022 | 3,093 | ||||||
| 9,991 | ||||||||
| Arts, Entertainment and Recreation - 0.7% | ||||||||
| CBS Corp. | ||||||||
| 3,760 | 3.38%, 03/01/2022 | 3,589 | ||||||
| Comcast Corp. | ||||||||
| 1,000 | 4.50%, 01/15/2043 | 903 | ||||||
| 1,740 | 4.65%, 07/15/2042 | 1,619 | ||||||
| 4,500 | 5.90%, 03/15/2016 | 4,970 | ||||||
| DirecTV Holdings LLC | ||||||||
| 3,310 | 6.38%, 03/01/2041 | 3,432 | ||||||
| Discovery Communications, Inc. | ||||||||
| 280 | 3.25%, 04/01/2023 | 260 | ||||||
| 325 | 4.88%, 04/01/2043 | 300 | ||||||
| 250 | 4.95%, 05/15/2042 | 232 | ||||||
| News America, Inc. | ||||||||
| 385 | 4.00%, 10/01/2023 ■ | 380 | ||||||
| 1,275 | 4.50%, 02/15/2021 | 1,367 | ||||||
| Time Warner Cable, Inc. | ||||||||
| 4,120 | 5.85%, 05/01/2017 | 4,494 | ||||||
| Viacom, Inc. | ||||||||
| 835 | 3.88%, 12/15/2021 | 830 | ||||||
| 22,376 | ||||||||
| �� | Beverage and Tobacco Product Manufacturing - 0.5% | |||||||
| Altria Group, Inc. | ||||||||
| 2,050 | 4.50%, 05/02/2043 | 1,811 | ||||||
| 2,445 | 4.75%, 05/05/2021 | 2,624 | ||||||
| Anheuser-Busch InBev Worldwide, Inc. | ||||||||
| 3,205 | 7.75%, 01/15/2019 | 4,002 | ||||||
| BAT International Finance plc | ||||||||
| 2,775 | 3.25%, 06/07/2022 ■ | 2,658 | ||||||
| Coca-Cola Co. | ||||||||
| 500 | 3.30%, 09/01/2021 | 501 | ||||||
| Coca-Cola FEMSA SAB CV | ||||||||
| 1,176 | 2.38%, 11/26/2018 | 1,167 | ||||||
| 1,300 | 3.88%, 11/26/2023 | 1,282 | ||||||
| Diageo Capital plc | ||||||||
| 1,925 | 2.63%, 04/29/2023 | 1,755 | ||||||
| Molson Coors Brewing Co. | ||||||||
| 60 | 2.00%, 05/01/2017 | 60 | ||||||
| 765 | 3.50%, 05/01/2022 | 751 | ||||||
| 495 | 5.00%, 05/01/2042 | 485 | ||||||
| Philip Morris International, Inc. | ||||||||
| 270 | 5.65%, 05/16/2018 | 310 | ||||||
| 17,406 | ||||||||
| Couriers and Messengers - 0.0% | ||||||||
| FedEx Corp. | ||||||||
| 270 | 2.63%, 08/01/2022 | 244 | ||||||
| 405 | 2.70%, 04/15/2023 | 364 | ||||||
| 608 | ||||||||
| Finance and Insurance - 5.6% | ||||||||
| ACE INA Holdings, Inc. | ||||||||
| 700 | 5.88%, 06/15/2014 | 717 | ||||||
| American Express Centurion Bank | ||||||||
| 6,350 | 6.00%, 09/13/2017 | 7,285 | ||||||
| American International Group, Inc. | ||||||||
| 925 | 4.13%, 02/15/2024 | 920 | ||||||
| Avalonbay Communities, Inc. | ||||||||
| 760 | 3.63%, 10/01/2020 | 768 | ||||||
| Bank of America Corp. | ||||||||
| 4,500 | 5.00%, 05/13/2021 | 4,917 | ||||||
| 200 | 7.38%, 05/15/2014 | 205 | ||||||
| Barclays Bank plc | ||||||||
| 2,150 | 2.38%, 01/13/2014 | 2,151 | ||||||
| BNP Paribas | ||||||||
| 2,075 | 2.40%, 12/12/2018 | 2,076 | ||||||
| 305 | 3.25%, 03/03/2023 | 289 | ||||||
| BP Capital Markets plc | ||||||||
| 140 | 3.99%, 09/26/2023 | 141 | ||||||
| 2,850 | 4.75%, 03/10/2019 | 3,177 | ||||||
| BPCE S.A. | ||||||||
| 1,865 | 2.50%, 12/10/2018 | 1,855 | ||||||
| Brandywine Operating Partnership L.P. | ||||||||
| 2,010 | 6.00%, 04/01/2016 | 2,192 | ||||||
| Capital One Bank | ||||||||
| 1,655 | 2.15%, 11/21/2018 | 1,646 | ||||||
| Capital One Financial Corp. | ||||||||
| 2,460 | 2.15%, 03/23/2015 | 2,501 | ||||||
| CDP Financial, Inc. | ||||||||
| 3,475 | 4.40%, 11/25/2019 ■ | 3,825 | ||||||
| Citigroup, Inc. | ||||||||
| 1,000 | 4.95%, 11/07/2043 | 996 | ||||||
| 3,000 | 5.85%, 08/02/2016 | 3,339 | ||||||
| 2,700 | 6.13%, 05/15/2018 | 3,125 | ||||||
| 520 | 8.13%, 07/15/2039 | 729 | ||||||
| Credit Agricole S.A. | ||||||||
| 3,950 | 3.50%, 04/13/2015 ■ | 4,077 | ||||||
The accompanying notes are an integral part of these financial statements.
| 7 |
| Hartford Balanced HLS Fund |
| Schedule of Investments – (continued) |
| December 31, 2013 |
| (000’s Omitted) |
| Shares or Principal Amount | Market Value ╪ | |||||||
| CORPORATE BONDS - 11.1% - (continued) | ||||||||
| Finance and Insurance - 5.6% - (continued) | ||||||||
| Discover Financial Services, Inc. | ||||||||
| $ | 3,620 | 6.45%, 06/12/2017 | $ | 4,102 | ||||
| Eaton Vance Corp. | ||||||||
| 614 | 6.50%, 10/02/2017 | 697 | ||||||
| Everest Reinsurance Holdings, Inc. | ||||||||
| 4,525 | 5.40%, 10/15/2014 | 4,677 | ||||||
| Five Corners Funding TRS | ||||||||
| 1,440 | 4.42%, 11/15/2023 ■ | 1,419 | ||||||
| Ford Motor Credit Co. LLC | ||||||||
| 2,665 | 3.00%, 06/12/2017 | 2,770 | ||||||
| General Electric Capital Corp. | ||||||||
| 4,300 | 4.63%, 01/07/2021 | 4,689 | ||||||
| 5,000 | 5.88%, 01/14/2038 | 5,695 | ||||||
| Goldman Sachs Group, Inc. | ||||||||
| 6,000 | 5.63%, 01/15/2017 | 6,612 | ||||||
| 1,700 | 6.15%, 04/01/2018 | 1,949 | ||||||
| 2,590 | 6.25%, 02/01/2041 | 2,985 | ||||||
| HCP, Inc. | ||||||||
| 2,030 | 6.00%, 01/30/2017 | 2,275 | ||||||
| HSBC Holdings plc | ||||||||
| 3,010 | 6.10%, 01/14/2042 | 3,586 | ||||||
| ING Bank N.V. | ||||||||
| 5,200 | 3.75%, 03/07/2017 ■ | 5,477 | ||||||
| Jackson National Life Insurance Co. | ||||||||
| 6,250 | 8.15%, 03/15/2027 ■ | 7,302 | ||||||
| JP Morgan Chase & Co. | ||||||||
| 2,240 | 3.25%, 09/23/2022 | 2,146 | ||||||
| 2,000 | 4.95%, 03/25/2020 | 2,218 | ||||||
| 6,035 | 5.13%, 09/15/2014 | 6,218 | ||||||
| 1,080 | 5.40%, 01/06/2042 | 1,163 | ||||||
| Korea Finance Corp. | ||||||||
| 965 | 2.88%, 08/22/2018 | 971 | ||||||
| Liberty Mutual Group, Inc. | ||||||||
| 550 | 4.25%, 06/15/2023 ■ | 531 | ||||||
| Loews Corp. | ||||||||
| 835 | 2.63%, 05/15/2023 | 748 | ||||||
| Merrill Lynch & Co., Inc. | ||||||||
| 1,000 | 6.40%, 08/28/2017 | 1,153 | ||||||
| 6,000 | 6.88%, 04/25/2018 | 7,094 | ||||||
| MetLife, Inc. | ||||||||
| 1,210 | 4.88%, 11/13/2043 | 1,188 | ||||||
| Morgan Stanley | ||||||||
| 250 | 5.63%, 09/23/2019 | 284 | ||||||
| National City Corp. | ||||||||
| 4,250 | 6.88%, 05/15/2019 | 5,036 | ||||||
| Nordea Bank AB | ||||||||
| 1,790 | 3.70%, 11/13/2014 ■ | 1,840 | ||||||
| Postal Square L.P. | ||||||||
| 12,311 | 8.95%, 06/15/2022 | 15,964 | ||||||
| Prudential Financial, Inc. | ||||||||
| 3,000 | 5.50%, 03/15/2016 | 3,275 | ||||||
| Rabobank Netherlands | ||||||||
| 3,900 | 3.20%, 03/11/2015 ■ | 4,021 | ||||||
| Republic New York Capital I | ||||||||
| 500 | 7.75%, 11/15/2006 | 506 | ||||||
| Southern Capital Corp. | ||||||||
| 46 | 5.70%, 06/30/2022 ■ | 47 | ||||||
| Sovereign Bancorp, Inc. | ||||||||
| 4,795 | 8.75%, 05/30/2018 | 5,761 | ||||||
| Svenska Handelsbanken AB | ||||||||
| 2,900 | 4.88%, 06/10/2014 ■ | 2,957 | ||||||
| UBS AG Stamford | ||||||||
| 235 | 5.88%, 12/20/2017 | 270 | ||||||
| Wachovia Corp. | ||||||||
| 1,000 | 5.75%, 06/15/2017 | 1,141 | ||||||
| WEA Finance LLC | ||||||||
| 1,450 | 7.13%, 04/15/2018 ■ | 1,722 | ||||||
| Wellpoint, Inc. | ||||||||
| 421 | 3.30%, 01/15/2023 | 393 | ||||||
| Wells Fargo & Co. | ||||||||
| 10,344 | 4.48%, 01/16/2024 ■ | 10,297 | ||||||
| 178,110 | ||||||||
| Food Manufacturing - 0.4% | ||||||||
| ConAgra Foods, Inc. | ||||||||
| 265 | 1.90%, 01/25/2018 | 260 | ||||||
| 235 | 3.20%, 01/25/2023 | 218 | ||||||
| Kellogg Co. | ||||||||
| 3,900 | 4.00%, 12/15/2020 | 4,047 | ||||||
| Kraft Foods Group, Inc. | ||||||||
| 555 | 2.25%, 06/05/2017 | 562 | ||||||
| 535 | 3.50%, 06/06/2022 | 522 | ||||||
| 605 | 5.00%, 06/04/2042 | 596 | ||||||
| Mondelez International, Inc. | ||||||||
| 3,800 | 4.13%, 02/09/2016 | 4,029 | ||||||
| Wrigley Jr., William Co. | ||||||||
| 3,900 | 3.70%, 06/30/2014 ■ | 3,960 | ||||||
| 14,194 | ||||||||
| Health Care and Social Assistance - 0.4% | ||||||||
| Amgen, Inc. | ||||||||
| 3,300 | 5.15%, 11/15/2041 | 3,288 | ||||||
| Catholic Health Initiatives | ||||||||
| 765 | 2.60%, 08/01/2018 | 767 | ||||||
| CVS Caremark Corp. | ||||||||
| 2,350 | 4.00%, 12/05/2023 | 2,345 | ||||||
| GlaxoSmithKline Capital, Inc. | ||||||||
| 2,370 | 2.80%, 03/18/2023 | 2,195 | ||||||
| Kaiser Foundation Hospitals | ||||||||
| 326 | 3.50%, 04/01/2022 | 309 | ||||||
| 640 | 4.88%, 04/01/2042 | 605 | ||||||
| McKesson Corp. | ||||||||
| 100 | 2.85%, 03/15/2023 | 90 | ||||||
| Merck & Co., Inc. | ||||||||
| 1,640 | 2.80%, 05/18/2023 | 1,518 | ||||||
| 630 | 4.15%, 05/18/2043 | 576 | ||||||
| Zoetis, Inc. | ||||||||
| 150 | 3.25%, 02/01/2023 | 141 | ||||||
| 180 | 4.70%, 02/01/2043 | 168 | ||||||
| 12,002 | ||||||||
| Information - 0.8% | ||||||||
| America Movil S.A.B. de C.V. | ||||||||
| 635 | 3.13%, 07/16/2022 | 586 | ||||||
| 530 | 4.38%, 07/16/2042 | 440 | ||||||
| AT&T, Inc. | ||||||||
| 2,510 | 6.80%, 05/15/2036 | 2,911 | ||||||
| Cox Communications, Inc. | ||||||||
| 1,325 | 4.50%, 06/30/2043 ■ | 1,068 | ||||||
| 255 | 4.70%, 12/15/2042 ■ | 214 | ||||||
| France Telecom S.A. | ||||||||
| 1,300 | 4.13%, 09/14/2021 | 1,316 | ||||||
The accompanying notes are an integral part of these financial statements.
| 8 |
| Shares or Principal Amount | Market Value ╪ | |||||||
| CORPORATE BONDS - 11.1% - (continued) | ||||||||
| Information - 0.8% - (continued) | ||||||||
| Verizon Communications, Inc. | ||||||||
| $ | 2,415 | 3.50%, 11/01/2021 | $ | 2,398 | ||||
| 4,795 | 4.50%, 09/15/2020 | 5,133 | ||||||
| 715 | 4.75%, 11/01/2041 | 669 | ||||||
| 3,590 | 6.40%, 09/15/2033 | 4,129 | ||||||
| 4,215 | 6.55%, 09/15/2043 | 4,931 | ||||||
| 23,795 | ||||||||
| Mining - 0.1% | ||||||||
| BHP Billiton Finance USA Ltd. | ||||||||
| 1,720 | 3.85%, 09/30/2023 | 1,727 | ||||||
| Rio Tinto Finance USA Ltd. | ||||||||
| 1,905 | 2.25%, 12/14/2018 | 1,896 | ||||||
| 3,623 | ||||||||
| Miscellaneous Manufacturing - 0.0% | ||||||||
| United Technologies Corp. | ||||||||
| 365 | 3.10%, 06/01/2022 | 357 | ||||||
| Motor Vehicle and Parts Manufacturing - 0.2% | ||||||||
| Daimler Finance NA LLC | ||||||||
| 5,600 | 2.63%, 09/15/2016 ■ | 5,791 | ||||||
| Petroleum and Coal Products Manufacturing - 0.6% | ||||||||
| Atmos Energy Corp. | ||||||||
| 5,875 | 6.35%, 06/15/2017 | 6,644 | ||||||
| EnCana Corp. | ||||||||
| 305 | 5.90%, 12/01/2017 | 346 | ||||||
| Gazprom Neft OAO via GPN Capital S.A. | ||||||||
| 1,100 | 4.38%, 09/19/2022 ■ | 1,008 | ||||||
| Motiva Enterprises LLC | ||||||||
| 420 | 5.75%, 01/15/2020 ■ | 477 | ||||||
| Ras Laffan Liquefied Natural Gas Co., Ltd. | ||||||||
| 1,200 | 5.50%, 09/30/2014 ■ | 1,239 | ||||||
| Schlumberger Investment S.A. | ||||||||
| 1,625 | 3.65%, 12/01/2023 | 1,611 | ||||||
| Shell International Finance B.V. | ||||||||
| 6,400 | 4.38%, 03/25/2020 | 7,016 | ||||||
| Statoil ASA | ||||||||
| 1,635 | 2.90%, 11/08/2020 | 1,624 | ||||||
| 19,965 | ||||||||
| Pipeline Transportation - 0.2% | ||||||||
| Kinder Morgan Energy Partners L.P. | ||||||||
| 5,000 | 6.95%, 01/15/2038 | 5,744 | ||||||
| Real Estate, Rental and Leasing - 0.2% | ||||||||
| ERAC USA Finance Co. | ||||||||
| 1,121 | 2.25%, 01/10/2014 ■ | 1,121 | ||||||
| 340 | 2.75%, 03/15/2017 ■ | 350 | ||||||
| 1,800 | 4.50%, 08/16/2021 ■ | 1,876 | ||||||
| 1,500 | 5.63%, 03/15/2042 ■ | 1,532 | ||||||
| 4,879 | ||||||||
| Retail Trade - 0.3% | ||||||||
| Amazon.com, Inc. | ||||||||
| 1,550 | 2.50%, 11/29/2022 | 1,397 | ||||||
| AutoZone, Inc. | ||||||||
| 900 | 3.13%, 07/15/2023 | 815 | ||||||
| 1,908 | 3.70%, 04/15/2022 | 1,841 | ||||||
| Kroger (The) Co. | ||||||||
| 620 | 3.30%, 01/15/2021 | 616 | ||||||
| Lowe's Cos., Inc. | ||||||||
| 3,400 | 4.63%, 04/15/2020 | 3,754 | ||||||
| 8,423 | ||||||||
| Soap, Cleaning Compound and Toilet Manufacturing - 0.3% | ||||||||
| Procter & Gamble Co. | ||||||||
| 8,593 | 9.36%, 01/01/2021 | 10,957 | ||||||
| Transportation Equipment Manufacturing - 0.0% | ||||||||
| Kansas City Southern de Mexico S.A. de C.V. | ||||||||
| 175 | 2.35%, 05/15/2020 | 163 | ||||||
| Utilities - 0.5% | ||||||||
| Consolidated Edison Co. of NY | ||||||||
| 4,605 | 5.30%, 12/01/2016 | 5,151 | ||||||
| Indianapolis Power and Light | ||||||||
| 3,750 | 6.60%, 06/01/2037 ■ | 4,374 | ||||||
| Pacific Gas & Electric Co. | ||||||||
| 695 | 3.85%, 11/15/2023 | 692 | ||||||
| 435 | 5.13%, 11/15/2043 | 449 | ||||||
| Southern California Edison Co. | ||||||||
| 4,000 | 5.55%, 01/15/2037 | 4,418 | ||||||
| 15,084 | ||||||||
| Wholesale Trade - 0.0% | ||||||||
| Heineken N.V. | ||||||||
| 1,330 | 2.75%, 04/01/2023 ■ | 1,192 | ||||||
| 50 | 4.00%, 10/01/2042 ■ | 42 | ||||||
| 1,234 | ||||||||
| Total corporate bonds | ||||||||
| (cost $331,320) | $ | 354,702 | ||||||
| MUNICIPAL BONDS - 1.0% | ||||||||
| General Obligations - 0.2% | ||||||||
| California State GO, Taxable, | ||||||||
| $ | 1,235 | 7.55%, 04/01/2039 | $ | 1,598 | ||||
| Chicago, IL, Metropolitan Water Reclamation GO, | ||||||||
| 685 | 5.72%, 12/01/2038 | 728 | ||||||
| Los Angeles, CA, USD GO, | ||||||||
| 4,300 | 5.75%, 07/01/2034 | 4,760 | ||||||
| 7,086 | ||||||||
| Health Care/Services - 0.1% | ||||||||
| University of California, Regents MedCenter Pooled Rev, | ||||||||
| 1,935 | 6.58%, 05/15/2049 | 2,253 | ||||||
| Higher Education (Univ., Dorms, etc.) - 0.1% | ||||||||
| University of California, Build America Bonds Rev, | ||||||||
| 1,960 | 5.77%, 05/15/2043 | 2,160 | ||||||
| Refunded - 0.1% | ||||||||
| Irvine Ranch, CA, Water Dist Joint Powers Agency, | ||||||||
| 2,870 | 2.61%, 03/15/2014 | 2,883 | ||||||
| New York and New Jersey PA, Taxable Rev, | ||||||||
| 975 | 5.86%, 12/01/2024 | 1,115 | ||||||
| 570 | 6.04%, 12/01/2029 | 648 | ||||||
| 4,646 | ||||||||
The accompanying notes are an integral part of these financial statements.
| 9 |
| Hartford Balanced HLS Fund |
| Schedule of Investments – (continued) |
| December 31, 2013 |
| (000’s Omitted) |
| Shares or Principal Amount | Market Value ╪ | |||||||
| MUNICIPAL BONDS - 1.0% - (continued) | ||||||||
| Tax Allocation - 0.1% | ||||||||
| Dallas, TX, Area Rapid Transit Sales Tax Rev, | ||||||||
| $ | 2,200 | 6.00%, 12/01/2044 | $ | 2,536 | ||||
| Transportation - 0.4% | ||||||||
| Bay Area, CA, Toll Auth Bridge Rev, | ||||||||
| 3,100 | 6.26%, 04/01/2049 | 3,718 | ||||||
| Illinois State Toll Highway Auth, Taxable Rev, | ||||||||
| 1,875 | 6.18%, 01/01/2034 | 2,118 | ||||||
| Maryland State Transportation Auth, | ||||||||
| 1,350 | 5.89%, 07/01/2043 | 1,520 | ||||||
| North Texas Tollway Auth Rev, | ||||||||
| 3,400 | 6.72%, 01/01/2049 | 4,053 | ||||||
| 11,409 | ||||||||
| Utilities - Combined - 0.0% | ||||||||
| Utility Debt Securitization Auth, New York, | ||||||||
| 485 | 3.44%, 12/15/2025 | 478 | ||||||
| Total municipal bonds | ||||||||
| (cost $27,269) | $ | 30,568 | ||||||
| U.S. GOVERNMENT AGENCIES - 2.7% | ||||||||
| FHLMC - 2.2% | ||||||||
| $ | 116 | 2.28%, 04/01/2029 Δ | $ | 121 | ||||
| 50 | 4.00%, 03/01/2041 | 51 | ||||||
| 62,318 | 4.50%, 10/01/2023 - 11/01/2043 ☼ | 65,972 | ||||||
| 2,627 | 5.00%, 07/01/2028 - 05/01/2041 | 2,841 | ||||||
| 68,985 | ||||||||
| FNMA - 0.0% | ||||||||
| 84 | 4.85%, 02/01/2014 | 84 | ||||||
| 127 | 5.00%, 02/01/2019 - 04/01/2019 | 136 | ||||||
| 1 | 7.00%, 02/01/2029 | 1 | ||||||
| 221 | ||||||||
| GNMA - 0.5% | ||||||||
| 6,373 | 5.00%, 07/15/2037 - 10/15/2039 | 6,920 | ||||||
| 2,665 | 6.00%, 06/15/2024 - 06/15/2035 | 2,982 | ||||||
| 912 | 6.50%, 03/15/2026 - 02/15/2035 | 1,018 | ||||||
| 3,926 | 7.00%, 11/15/2031 - 11/15/2033 | 4,588 | ||||||
| 191 | 7.50%, 09/16/2035 | 222 | ||||||
| 760 | 8.00%, 09/15/2026 - 02/15/2031 | 834 | ||||||
| 24 | 9.00%, 07/20/2016 - 06/15/2022 | 24 | ||||||
| 16,588 | ||||||||
| Total U.S. government agencies | ||||||||
| (cost $84,876) | $ | 85,794 | ||||||
| U.S. GOVERNMENT SECURITIES - 14.1% | ||||||||
| Other Direct Federal Obligations - 0.7% | ||||||||
| Tennessee Valley Authority - 0.7% | ||||||||
| $ | 22,300 | 4.38%, 06/15/2015 | $ | 23,569 | ||||
| U.S. Treasury Securities - 13.4% | ||||||||
| U.S. Treasury Bonds - 1.3% | ||||||||
| 20,211 | 2.88%, 05/15/2043 ╦ | 16,380 | ||||||
| 362 | 3.13%, 02/15/2043 | 309 | ||||||
| 22,000 | 4.38%, 02/15/2038 ‡ | 23,946 | ||||||
| 1,750 | 6.00%, 02/15/2026 | 2,234 | ||||||
| 42,869 | ||||||||
| U.S. Treasury Notes - 12.1% | ||||||||
| 82,000 | 0.25%, 09/30/2015 - 11/30/2015 ‡ ╦ | 81,872 | ||||||
| 6,850 | 0.38%, 06/30/2015 - 08/31/2015 | 6,864 | ||||||
| 8,300 | 0.63%, 05/31/2017 | 8,192 | ||||||
| 5,343 | 0.88%, 01/31/2017 | 5,348 | ||||||
| 11,800 | 1.00%, 09/30/2016 - 05/31/2018 | 11,688 | ||||||
| 123,200 | 1.25%, 10/31/2015 - 11/30/2018 | 124,861 | ||||||
| 36,835 | 1.38%, 09/30/2018 | 36,386 | ||||||
| 28,700 | 1.50%, 06/30/2016 | 29,361 | ||||||
| 5,300 | 2.00%, 04/30/2016 | 5,483 | ||||||
| 45,250 | 2.75%, 02/15/2019 - 11/15/2023 | 45,867 | ||||||
| 24,575 | 3.88%, 05/15/2018 | 27,086 | ||||||
| 383,008 | ||||||||
| 425,877 | ||||||||
| Total U.S. government securities | ||||||||
| (cost $440,394) | $ | 449,446 | ||||||
| Total long-term investments | ||||||||
| (cost $2,380,389) | $ | 3,120,148 | ||||||
| SHORT-TERM INVESTMENTS - 2.7% | ||||||||
| Repurchase Agreements - 2.7% | ||||||||
| Bank of America Merrill Lynch TriParty Repurchase Agreement (maturing on 01/02/2014 in the amount of $4,291, collateralized by GNMA 4.00%, 2043, value of $4,377) | ||||||||
| $ | 4,291 | 0.005%, 12/31/2013 | $ | 4,291 | ||||
| Bank of Montreal TriParty Repurchase Agreement (maturing on 01/02/2014 in the amount of $4,123, collateralized by FNMA 1.58% - 4.50%, 2020 - 2043, U.S. Treasury Note 0.25% - 4.00%, 2015 - 2020, value of $4,206) | ||||||||
| 4,123 | 0.01%, 12/31/2013 | 4,123 | ||||||
| Bank of Montreal TriParty Repurchase Agreement (maturing on 01/02/2014 in the amount of $14,603, collateralized by FHLMC 3.00% - 5.00%, 2019 - 2043, FNMA 0.76% - 6.00%, 2016 - 2043, GNMA 1.50% - 5.25%, 2028 - 2043, value of $14,895) | ||||||||
| 14,603 | 0.02%, 12/31/2013 | 14,603 | ||||||
| Barclays Capital TriParty Repurchase Agreement (maturing on 01/02/2014 in the amount of $13,170, collateralized by U.S. Treasury Note 0.50% - 2.25%, 2017, value of $13,433) | ||||||||
| 13,170 | 0.01%, 12/31/2013 | 13,170 | ||||||
| Citigroup Global Markets, Inc. TriParty Repurchase Agreement (maturing on 01/02/2014 in the amount of $23,697, collateralized by U.S. Treasury Bond 3.88% - 8.13%, 2021 - 2040, U.S. Treasury Note 0.25% - 3.38%, 2014 - 2020, value of $24,171) | ||||||||
| 23,697 | 0.01%, 12/31/2013 | 23,697 | ||||||
The accompanying notes are an integral part of these financial statements.
| 10 |
| Shares or Principal Amount | Market Value ╪ | |||||||||||
SHORT-TERM INVESTMENTS - 2.7% - (continued) | ||||||||||||
Repurchase Agreements - 2.7% - (continued) | ||||||||||||
| RBS Securities, Inc. TriParty Repurchase Agreement (maturing on 01/02/2014 in the amount of $7,700, collateralized by U.S. Treasury Note 0.25% - 1.00%, 2015 - 2017, value of $7,854) | ||||||||||||
| $ | 7,700 | 0.01%, 12/31/2013 | $ | 7,700 | ||||||||
| TD Securities TriParty Repurchase Agreement (maturing on 01/02/2014 in the amount of $18,485, collateralized by FFCB 0.20% - 0.50%, 2015 - 2016, FHLMC 0.38% - 5.25%, 2014 - 2042, FNMA 0.50% - 7.13%, 2014 - 2043, value of $18,855) | ||||||||||||
| 18,485 | 0.01%, 12/31/2013 | 18,485 | ||||||||||
| UBS Securities, Inc. Repurchase Agreement (maturing on 01/02/2014 in the amount of $158, collateralized by U.S. Treasury Note 2.13%, 2015, value of $162) | ||||||||||||
| 158 | 0.01%, 12/31/2013 | 158 | ||||||||||
| 86,227 | ||||||||||||
| Total short-term investments | ||||||||||||
| (cost $86,227) | $ | 86,227 | ||||||||||
| Total investments | ||||||||||||
| (cost $2,466,616) ▲ | 100.8 | % | $ | 3,206,375 | ||||||||
| Other assets and liabilities | (0.8 | )% | (23,996 | ) | ||||||||
| Total net assets | 100.0 | % | $ | 3,182,379 | ||||||||
| Note: | Percentage of investments as shown is the ratio of the total market value to total net assets. |
Prices of foreign equities that are principally traded on certain foreign markets may be adjusted daily pursuant to a fair value pricing service approved by the Board of Directors in order to reflect an adjustment for factors occurring after the close of certain foreign markets but before the close of the New York Stock Exchange.
| ▲ | At December 31, 2013, the cost of securities for federal income tax purposes was $2,479,538 and the aggregate gross unrealized appreciation and depreciation based on that cost were: |
| Unrealized Appreciation | $ | 748,312 | ||
| Unrealized Depreciation | (21,475 | ) | ||
| Net Unrealized Appreciation | $ | 726,837 |
| † | These securities were valued in good faith at fair value as determined under policies and procedures established by and under the supervision of the Company's Board of Directors. At December 31, 2013, the aggregate value of these securities was $38,005, which represents 1.2% of total net assets. This amount excludes securities that are principally traded in certain foreign markets and whose prices are adjusted pursuant to a third party pricing service methodology approved by the Board of Directors. |
| ● | Non-income producing. |
| Δ | Variable rate securities; the rate reported is the coupon rate in effect at December 31, 2013. |
| ■ | Securities issued within terms of a private placement memorandum, exempt from registration under Rule 144A under the Securities Act of 1933, as amended, and may be sold only to qualified institutional buyers. Unless otherwise indicated, these holdings are determined to be liquid. At December 31, 2013, the aggregate value of these securities was $74,605, which represents 2.3% of total net assets. |
The accompanying notes are an integral part of these financial statements.
| 11 |
| Hartford Balanced HLS Fund |
| Schedule of Investments – (continued) |
| December 31, 2013 |
| (000’s Omitted) |
| ⌂ | The following securities are considered illiquid. Illiquid securities are often purchased in private placement transactions, are often not registered under the Securities Act of 1933 and may have contractual restrictions on resale. A security may also be considered illiquid if the security lacks a readily available market or if its valuation has not changed for a certain period of time. |
| Period Acquired | Shares/ Par | Security | Cost Basis | |||||||
| 08/2011 | 11,702 | Allstar Co. | $ | 6,915 | ||||||
| 11/2013 | 163 | Tory Burch LLC | $ | 12,794 | ||||||
At December 31, 2013, the aggregate value of these securities was $38,005, which represents 1.2% of total net assets.
| ☼ | This security, or a portion of this security, was purchased on a when-issued, delayed-delivery or delayed-draw basis. The cost of these securities was $40,119 at December 31, 2013. |
| ‡ | This security, or a portion of this security, has been segregated to cover funding requirements on investment transactions settling in the future. |
| ╦ | This security, or a portion of this security, has been pledged as collateral in connection with swap contracts. |
Securities Sold Short Outstanding at December 31, 2013
| Description | Principal Amount | Maturity Date | Market Value ╪ | Unrealized Appreciation/ Depreciation | ||||||||||
| GNMA, 5.00% | $ | 5,000 | 01/15/2040 | $ | 5,419 | $ | 4 | |||||||
At December 31, 2013, the aggregate value of these securities represents 0.2% of total net assets.
| Credit Default Swap Contracts Outstanding at December 31, 2013 | ||||||||||||||||||||||||
| Reference Entity | Counterparty | Notional Amount (a) | (Pay)/Receive Fixed Rate | Expiration Date | Upfront Premiums Paid/ (Received) | Market Value ╪ | Unrealized Appreciation/ (Depreciation) | |||||||||||||||||
| Credit default swaps on traded indices: | ||||||||||||||||||||||||
| Sell protection: | ||||||||||||||||||||||||
| CMBX.NA.AAA.6 | DEUT | $ | 1,815 | 0.50 | % | 05/11/63 | $ | (88 | ) | $ | (46 | ) | $ | 42 | ||||||||||
| CMBX.NA.AAA.6 | JPM | 6,500 | 0.50 | % | 05/11/63 | (254 | ) | (164 | ) | 90 | ||||||||||||||
| CMBX.NA.AAA.6 | MSC | 1,170 | 0.50 | % | 05/11/63 | (56 | ) | (30 | ) | 26 | ||||||||||||||
| Total | $ | (398 | ) | $ | (240 | ) | $ | 158 | ||||||||||||||||
| (a) | The maximum potential amount the Fund could be required to pay as a seller of credit protection or receive as a buyer of credit protection if a credit event occurs as defined under the terms of that particular swap agreement. Notional shown in U.S. dollars unless otherwise noted. |
| ╪ | See Significant Accounting Policies of accompanying Notes to Financial Statements regarding valuation of securities. |
The accompanying notes are an integral part of these financial statements.
| 12 |
| GLOSSARY: (abbreviations used in preceding Schedule of Investments) | ||
| Counterparty Abbreviations: | ||
| DEUT | Deutsche Bank Securities, Inc. | |
| JPM | JP Morgan Chase & Co. | |
| MSC | Morgan Stanley | |
| Index Abbreviations: | ||
| CMBX.NA | Markit Commercial Mortgage Backed North American | |
| Municipal Bond Abbreviations: | ||
| GO | General Obligation | |
| PA | Port Authority | |
| Rev | Revenue | |
| GLOSSARY: (abbreviations used in preceding Schedule of Investments) | ||
| Municipal Bond Abbreviations: - (continued) | ||
| USD | United School District | |
| Other Abbreviations: | ||
| ADR | American Depositary Receipt | |
| FFCB | Federal Farm Credit Bank | |
| FHLMC | Federal Home Loan Mortgage Corp. | |
| FNMA | Federal National Mortgage Association | |
| GNMA | Government National Mortgage Association | |
The accompanying notes are an integral part of these financial statements.
| 13 |
| Hartford Balanced HLS Fund |
| Investment Valuation Hierarchy Level Summary |
| December 31, 2013 |
| (000’s Omitted) |
| Total | Level 1 ♦ | Level 2 ♦ | Level 3 | |||||||||||||
| Assets: | ||||||||||||||||
| Asset & Commercial Mortgage Backed Securities | $ | 8,666 | $ | – | $ | 8,658 | $ | 8 | ||||||||
| Common Stocks ‡ | 2,190,972 | 2,049,458 | 103,509 | 38,005 | ||||||||||||
| Corporate Bonds | 354,702 | – | 331,708 | 22,994 | ||||||||||||
| Municipal Bonds | 30,568 | – | 30,568 | – | ||||||||||||
| U.S. Government Agencies | 85,794 | – | 85,794 | – | ||||||||||||
| U.S. Government Securities | 449,446 | 21,767 | 427,679 | – | ||||||||||||
| Short-Term Investments | 86,227 | – | 86,227 | – | ||||||||||||
| Total | $ | 3,206,375 | $ | 2,071,225 | $ | 1,074,143 | $ | 61,007 | ||||||||
| Credit Default Swaps * | 158 | – | 158 | – | ||||||||||||
| Total | $ | 158 | $ | – | $ | 158 | $ | – | ||||||||
| Liabilities: | ||||||||||||||||
| Securities Sold Short | $ | 5,419 | $ | – | $ | 5,419 | $ | – | ||||||||
| Total | $ | 5,419 | $ | – | $ | 5,419 | $ | – | ||||||||
| ♦ | For the year ended December 31, 2013, there were no transfers between Level 1 and Level 2. |
| ‡ | The Fund has all or primarily all of the equity securities categorized in a particular level. Refer to the Schedule of Investments for further industry breakout. |
| * | Derivative instruments (excluding purchased and written options, if applicable) are valued at the unrealized appreciation/depreciation on the investments. |
Following is a reconciliation of Level 3 assets for which significant unobservable inputs were used to determine fair value:
| Balance as of December 31, 2012 | Realized Gain (Loss) | Change in Unrealized Appreciation (Depreciation) | Net Amortization | Purchases | Sales | Transfers Into Level 3 | Transfers Out of Level 3 | Balance as of December 31, 2013 | ||||||||||||||||||||||||||||
| Assets: | ||||||||||||||||||||||||||||||||||||
| Asset & Commercial Mortgage Backed Securities | $ | 8 | $ | — | $ — | * | $ | — | $ | — | $ | — | $ | — | $ | — | $ | 8 | ||||||||||||||||||
| Common Stocks | 24,542 | 8,513 | 2,668 | † | — | 12,794 | (10,512 | ) | — | — | 38,005 | |||||||||||||||||||||||||
| Corporate Bonds | 25,415 | (98 | ) | (1,002 | )‡ | (104 | ) | — | (1,217 | ) | — | — | 22,994 | |||||||||||||||||||||||
| Total | $ | 49,965 | $ | 8,415 | $ | 1,666 | $ | (104 | ) | $ | 12,794 | $ | (11,729 | ) | $ | — | $ | — | $ | 61,007 | ||||||||||||||||
| * | Change in unrealized appreciation (depreciation) in the current period relating to assets still held at December 31, 2013 rounds to zero. |
| † | Change in unrealized appreciation (depreciation) in the current period relating to assets still held at December 31, 2013 was $8,709. |
| ‡ | Change in unrealized appreciation (depreciation) in the current period relating to assets still held at December 31, 2013 was $(1,002). |
| Note: | For purposes of reporting transfers between different hierarchy levels, both transfers in and out of each level, as applicable, are shown as if they occurred at the beginning of the period. |
The accompanying notes are an integral part of these financial statements.
| 14 |
| Hartford Balanced HLS Fund |
| Statement of Assets and Liabilities |
| December 31, 2013 |
| (000’s Omitted) |
| Assets: | ||||
| Investments in securities, at market value (cost $2,466,616) | $ | 3,206,375 | ||
| Cash | — | |||
| Unrealized appreciation on OTC swap contracts | 158 | |||
| Receivables: | ||||
| Investment securities sold | 24,169 | |||
| Fund shares sold | 66 | |||
| Dividends and interest | 9,599 | |||
| Total assets | 3,240,367 | |||
| Liabilities: | ||||
| Securities sold short, at market value (proceeds $5,423) | 5,419 | |||
| Payables: | ||||
| Investment securities purchased | 49,595 | |||
| Fund shares redeemed | 1,946 | |||
| Investment management fees | 427 | |||
| Distribution fees | 22 | |||
| Accrued expenses | 181 | |||
| OTC swap premiums received | 398 | |||
| Total liabilities | 57,988 | |||
| Net assets | $ | 3,182,379 | ||
| Summary of Net Assets: | ||||
| Capital stock and paid-in-capital | $ | 3,128,629 | ||
| Undistributed net investment income | 10,106 | |||
| Accumulated net realized loss | (696,299 | ) | ||
| Unrealized appreciation of investments and the translations of assets and liabilities denominated in foreign currency | 739,943 | |||
| Net assets | $ | 3,182,379 | ||
| Shares authorized | 9,500,000 | |||
| Par value | $ | 0.001 | ||
| Class IA: Net asset value per share | $ | 25.11 | ||
| Shares outstanding | 110,804 | |||
| Net assets | $ | 2,782,698 | ||
| Class IB: Net asset value per share | $ | 25.44 | ||
| Shares outstanding | 15,708 | |||
| Net assets | $ | 399,681 |
The accompanying notes are an integral part of these financial statements.
| 15 |
| Hartford Balanced HLS Fund |
| Statement of Operations |
| For the Year Ended December 31, 2013 |
| (000’s Omitted) |
| Investment Income: | ||||
| Dividends | $ | 48,749 | ||
| Interest | 28,832 | |||
| Less: Foreign tax withheld | (689 | ) | ||
| Total investment income, net | 76,892 | |||
| Expenses: | ||||
| Investment management fees | 19,733 | |||
| Transfer agent fees | 1 | |||
| Distribution fees - Class IB | 1,018 | |||
| Custodian fees | 22 | |||
| Accounting services fees | 514 | |||
| Board of Directors' fees | 84 | |||
| Audit fees | 35 | |||
| Other expenses | 449 | |||
| Total expenses (before fees paid indirectly) | 21,856 | |||
| Commission recapture | (11 | ) | ||
| Custodian fee offset | — | |||
| Total fees paid indirectly | (11 | ) | ||
| Total expenses, net | 21,845 | |||
| Net Investment Income | 55,047 | |||
| Net Realized Gain on Investments, Other Financial Instruments and Foreign Currency Transactions: | ||||
| Net realized gain on investments | 249,429 | |||
| Net realized loss on securities sold short | (54 | ) | ||
| Net realized gain on futures | 2 | |||
| Net realized gain on swap contracts | 17 | |||
| Net realized gain on foreign currency contracts | 199 | |||
| Net realized loss on other foreign currency transactions | (222 | ) | ||
| Net Realized Gain on Investments, Other Financial Instruments and Foreign Currency Transactions | 249,371 | |||
| Net Changes in Unrealized Appreciation of Investments, Other Financial Instruments and Foreign Currency Transactions: | ||||
| Net unrealized appreciation of investments | 311,313 | |||
| Net unrealized appreciation of securities sold short | 17 | |||
| Net unrealized appreciation of swap contracts | 158 | |||
| Net unrealized appreciation on translation of other assets and liabilities in foreign currencies | 2 | |||
| Net Changes in Unrealized Appreciation of Investments, Other Financial Instruments and Foreign Currency Transactions | 311,490 | |||
| Net Gain on Investments, Other Financial Instruments and Foreign Currency Transactions | 560,861 | |||
| Net Increase in Net Assets Resulting from Operations | $ | 615,908 |
The accompanying notes are an integral part of these financial statements.
| 16 |
| Hartford Balanced HLS Fund |
| Statement of Changes in Net Assets |
| (000’s Omitted) |
| For the Year Ended December 31, 2013 | For the Year Ended December 31, 2012 | |||||||
| Operations: | ||||||||
| Net investment income | $ | 55,047 | $ | 65,371 | ||||
| Net realized gain on investments, other financial instruments and foreign currency transactions | 249,371 | 166,748 | ||||||
| Net unrealized appreciation of investments, other financial instruments and foreign currency transactions | 311,490 | 152,137 | ||||||
| Net Increase in Net Assets Resulting from Operations | 615,908 | 384,256 | ||||||
| Distributions to Shareholders: | ||||||||
| From net investment income | ||||||||
| Class IA | (40,827 | ) | (82,214 | ) | ||||
| Class IB | (4,827 | ) | (10,942 | ) | ||||
| Total distributions | (45,654 | ) | (93,156 | ) | ||||
| Capital Share Transactions: | ||||||||
| Class IA | ||||||||
| Sold | 66,768 | 50,211 | ||||||
| Issued on reinvestment of distributions | 40,827 | 82,214 | ||||||
| Redeemed | (576,929 | ) | (589,901 | ) | ||||
| Total capital share transactions | (469,334 | ) | (457,476 | ) | ||||
| Class IB | ||||||||
| Sold | 32,394 | 19,586 | ||||||
| Issued on reinvestment of distributions | 4,827 | 10,942 | ||||||
| Redeemed | (116,032 | ) | (118,840 | ) | ||||
| Total capital share transactions | (78,811 | ) | (88,312 | ) | ||||
| Net decrease from capital share transactions | (548,145 | ) | (545,788 | ) | ||||
| Net Increase (Decrease) in Net Assets | 22,109 | (254,688 | ) | |||||
| Net Assets: | ||||||||
| Beginning of period | 3,160,270 | 3,414,958 | ||||||
| End of period | $ | 3,182,379 | $ | 3,160,270 | ||||
| Undistributed (distribution in excess of) net investment income | $ | 10,106 | $ | 664 | ||||
| Shares: | ||||||||
| Class IA | ||||||||
| Sold | 2,884 | 2,405 | ||||||
| Issued on reinvestment of distributions | 1,648 | 3,914 | ||||||
| Redeemed | (24,684 | ) | (28,367 | ) | ||||
| Total share activity | (20,152 | ) | (22,048 | ) | ||||
| Class IB | ||||||||
| Sold | 1,370 | 928 | ||||||
| Issued on reinvestment of distributions | 192 | 514 | ||||||
| Redeemed | (4,918 | ) | (5,664 | ) | ||||
| Total share activity | (3,356 | ) | (4,222 | ) | ||||
The accompanying notes are an integral part of these financial statements.
| 17 |
| Hartford Balanced HLS Fund |
| Notes to Financial Statements |
| December 31, 2013 |
| (000’s Omitted) |
| 1. | Organization: |
Hartford Balanced HLS Fund (the “Fund”) serves as an underlying investment option for certain variable annuity and variable life insurance separate accounts of Hartford Life Insurance Company (“HLIC”) and its affiliates and certain qualified retirement plans. The Fund may also serve as an underlying investment option for certain variable annuity and variable life separate accounts of other insurance companies. Owners of variable annuity contracts and policyholders of variable life insurance contracts may choose the funds permitted in the variable insurance contract prospectus. In addition, participants in certain qualified retirement plans may choose the Fund if permitted by their plans.
Hartford Series Fund, Inc. (the “Company”) is an open-end registered management investment company comprised of thirty portfolios. Financial statements for the Fund, a series of the Company, are included in this report.
The Company is organized under the laws of the State of Maryland and is registered with the Securities and Exchange Commission (“SEC”) under the Investment Company Act of 1940, as amended (“1940 Act”). The Fund is a diversified open-end management investment company.
The Fund is divided into Class IA and Class IB shares. Each class is offered at the per share net asset value (“NAV”) without a sales charge and is subject to the same expenses, except that the Class IB shares are subject to distribution and service fees charged pursuant to a Distribution Plan adopted in accordance with Rule 12b-1 under the 1940 Act.
| 2. | Significant Accounting Policies: |
The following is a summary of significant accounting policies of the Fund in the preparation of its financial statements, which are in accordance with United States Generally Accepted Accounting Principles (“U.S. GAAP”). The preparation of financial statements in accordance with U.S. GAAP may require management to make estimates and assumptions that affect the reported amounts of assets and liabilities and disclosure of contingent assets and liabilities at the date of the financial statements and the reported amounts of increases and decreases in net assets from operations during the reporting period. Actual results could differ from those estimates.
| a) | Determination of Net Asset Value – The NAV of each class of the Fund’s shares is determined as of the close of regular trading (normally 4:00 p.m. Eastern Time) (the “NYSE Close”) on each day that the New York Stock Exchange (the “Exchange”) is open (“Valuation Date”). Information that becomes known to the Fund after the NAV has been calculated on a particular day will not generally be used to retroactively adjust the NAV determined earlier that day. |
| b) | Investment Valuation and Fair Value Measurements – For purposes of calculating the NAV, portfolio investments and other assets held by the Fund's portfolio for which market quotes are readily available are valued at market value. Market value is generally determined on the basis of last reported sales prices or official close price. If no sales are reported, market value is based on quotes obtained from a quotation reporting system, established market makers, or independent pricing services. If market prices are not readily available or are deemed unreliable, the Fund will use the fair value of the investment as determined in good faith under policies and procedures established by and under the supervision of the Company’s Board of Directors. Market quotes are considered not readily available where there is an absence of current or reliable market-based data (e.g., trade information or indicative market quotes), including where events occur after the close of the relevant market, but prior to the NYSE Close, that materially affect the values of the Fund’s portfolio investments or assets. In addition, market quotes are considered not readily available when, due to extraordinary circumstances, the exchanges or markets on which the investments trade do not open for trading for the entire day and no other market prices are available. In addition, prices of foreign equities that are principally traded on certain foreign markets may be adjusted daily pursuant to a fair value pricing service approved by the Board of Directors in order to reflect an adjustment for the factors occurring after the close of certain foreign markets but before the NYSE Close. Investments that are primarily traded on foreign markets may trade on days that are not business days of the Fund. The value of the foreign investments in which the Fund invests may change on days when a shareholder will not be able to purchase or redeem shares of the Fund. Fair value pricing is subjective in nature and the use of fair value pricing by the |
| 18 |
Fund may cause the NAV of its shares to differ significantly from the NAV that would have been calculated using market prices at the close of the exchange on which a portfolio investment is primarily traded. There can be no assurance that the Fund could obtain the fair market value assigned to an investment if the Fund were to sell the investment at approximately the time at which the Fund determines its NAV.
Fixed income investments (other than short-term obligations), non-exchange traded derivatives and centrally cleared swaps held by the Fund are normally valued on the basis of quotes obtained from brokers and dealers or independent pricing services in accordance with procedures established by the Company’s Board of Directors. Prices obtained from independent pricing services use information provided by market makers or estimates of market values through accepted market modeling, trading and pricing conventions. Inputs to the models may include, but are not limited to, prepayment speeds, pricing spread, yield, trade information, dealer quotes, market color, cash flow models and the investment’s terms and conditions. Generally, the Fund may use fair valuation in regard to fixed income investments when the Fund holds defaulted or distressed investments or investments in a company in which a reorganization is pending. Short-term investments maturing in 60 days or less are generally valued at amortized cost, if their original term to maturity was 60 days or less, or by amortizing their value on the 61st day prior to maturity, if the original term to maturity exceeded 60 days.
Exchange traded options, futures and options on futures are valued at the settlement price or last trade price determined by the relevant exchange as of the NYSE Close. If the last trade price for exchange traded options does not fall between the bid and ask prices, the value will be the mean of the bid and ask prices as of the NYSE Close. If a last trade price is not available, the value will be the mean of the bid and ask prices as of the NYSE Close. If a mean of the bid and ask prices cannot be calculated for the day, the value will be the bid price as of the NYSE Close. In the case of OTC options and such instruments that do not trade on an exchange, values may be supplied by a pricing service using a formula or other objective method that may take into consideration the style, direction, expiration, strike price, notional value and volatility or other special adjustments.
Investments valued in currencies other than U.S. dollars are converted to U.S. dollars using exchange rates obtained from independent pricing services for calculation of the NAV. As a result, the NAV of the Fund’s shares may be affected by changes in the value of currencies in relation to the U.S. dollar. The value of investments traded in markets outside the United States or denominated in currencies other than the U.S. dollar may be affected significantly on a day that the NYSE is closed and the market value may change on days when an investor is not able to purchase, redeem or exchange shares of the Fund.
Foreign currency contracts represent agreements to exchange currencies on specific future dates at predetermined rates. Foreign currency contracts are valued using foreign currency exchange rates and forward rates as provided by an independent pricing service on the Valuation Date.
Financial instruments for which prices are not available from an independent pricing service may be valued using market quotations obtained from one or more dealers that make markets in the respective financial instrument in accordance with procedures established by the Company’s Board of Directors.
U.S. GAAP defines fair value as the price that the Fund would receive to sell an asset or pay to transfer a liability in an orderly transaction between market participants. The U.S. GAAP fair value measurement standards require disclosure of a fair value hierarchy for each major category of assets and liabilities. Various inputs are used in determining the fair value of the Fund’s investments. These inputs are summarized into three broad hierarchy levels. This hierarchy is based on whether the valuation inputs are observable or unobservable. These levels are:
| · | Level 1 – Quoted prices in active markets for identical investments. Level 1 may include exchange traded instruments, such as domestic equities, some foreign equities, options, futures, mutual funds, exchange traded funds, rights and warrants. |
| 19 |
| Hartford Balanced HLS Fund |
| Notes to Financial Statements – (continued) |
| December 31, 2013 |
| (000’s Omitted) |
| · | Level 2 – Observable inputs other than Level 1 prices, such as quoted prices for similar investments; quoted prices in markets that are not active; or other inputs that are observable or can be corroborated by observable market data. Level 2 may include debt investments that are traded less frequently than exchange traded instruments and which are valued using independent pricing services; foreign equities, which are principally traded on certain foreign markets and are adjusted daily pursuant to a fair value pricing service in order to reflect an adjustment for the factors occurring after the close of certain foreign markets but before the NYSE Close; senior floating rate interests, which are valued using an aggregate of dealer bids; short-term investments, which are valued at amortized cost; and swaps, which are valued based upon the terms of each swap contract. |
| · | Level 3 – Significant unobservable inputs that are supported by limited or no market activity. Level 3 may include financial instruments whose values are determined using indicative market quotes or require significant management judgment or estimation. These unobservable valuation inputs may include estimates for current yields, maturity/duration, prepayment speed, and indicative market quotes for comparable investments along with other assumptions relating to credit quality, collateral value, complexity of the investment structure, general market conditions and liquidity. This category may include investments where trading has been halted or there are certain restrictions on trading. While these investments are priced using unobservable inputs, the valuation of these investments reflects the best available data and management believes the prices are a reasonable representation of exit price. |
The Board of Directors of the Company generally reviews and approves the “Procedures for Valuation of Portfolio Securities” on an annual basis. These procedures define how investments are to be valued, including the formation and activities of a Valuation Committee. The Valuation Committee is responsible for determining in good faith the fair value of investments when the value cannot be obtained from primary pricing services or alternative sources or if the valuation of an investment as provided by the primary pricing service or alternative source is believed not to reflect the investment’s fair value as of the Valuation Date. Voting members of the Valuation Committee include the Fund’s Treasurer or designee and a Vice President of the investment manager or designee. An Assistant Vice President of the Fund with legal expertise or designee is also included on the Valuation Committee as a non-voting advisory member. In addition, the Fund’s Chief Compliance Officer shall designate a member of the compliance group to attend Valuation Committee meetings as a non-voting resource, to monitor for and provide guidance with respect to compliance with these procedures. Two members of the Valuation Committee or their designees, representing different departments, shall constitute a quorum for purposes of permitting the Valuation Committee to take action. The Valuation Committee will consider all relevant factors in determining an investment’s fair value, and may seek the advice of the Fund’s sub-adviser, knowledgeable brokers, and legal counsel in making such determination. The Valuation Committee reports to the Audit Committee of the Company’s Board of Directors. The Audit Committee receives quarterly written reports which include details of all fair-valued investments, including the reason for the fair valuation, and an indication, when possible, of the accuracy of the valuation by disclosing the next available reliable public price quotation or the disposition price of such investments (the “look-back” test). The Board of Directors then must consider for ratification all of the fair value determinations made during the previous quarter.
Valuation levels are not necessarily indicative of the risk associated with investing in such investments. Individual investments within any of the above mentioned asset classes may be assigned a different hierarchical level than those presented above, as individual circumstances dictate.
For additional information, refer to the Investment Valuation Hierarchy Level Summary and the Level 3 roll-forward reconciliation, if applicable, which follow the Schedule of Investments.
| c) | Investment Transactions and Investment Income – Investment transactions are recorded as of the trade date (the date the order to buy or sell is executed) for financial reporting purposes. Investments purchased or sold on a when-issued or delayed-delivery basis may be settled a month or more after the trade date. Realized gains and losses are determined on the basis of identified cost. |
| 20 |
Dividend income from domestic securities is accrued on the ex-dividend date. In general, dividend income from foreign securities is recorded on the ex-date; however, dividend notifications in certain foreign jurisdictions may not be available in a timely manner and as a result, the Fund will record the dividend as soon as the relevant details (i.e., rate per share, payment date, shareholders of record, etc.) are publicly available. Interest income, including amortization of premium, accretion of discounts and additional principal received in-kind in lieu of cash, is accrued on a daily basis. Paydown gains and losses on mortgage related and other asset backed securities are included in interest income in the Statement of Operations, as applicable.
| d) | Foreign Currency Transactions – Assets and liabilities denominated in currencies other than U.S. dollars are translated into U.S. dollars at the exchange rates in effect on the valuation date. Purchases and sales of investments, income and expenses are translated into U.S. dollars at the exchange rates on the dates of such transactions. |
The Fund does not isolate that portion of portfolio investment valuation resulting from fluctuations in the foreign currency exchange rates from the fluctuations arising from changes in the market prices of investments held. Exchange rate fluctuations are included with the net realized and unrealized gain or loss on investments in the accompanying financial statements.
Net realized foreign exchange gains or losses arise from sales of foreign currencies and the difference between asset and liability amounts initially stated in foreign currencies and the U.S. dollar value of the amounts actually received or paid. Net unrealized foreign exchange gains or losses arise from changes in the value of other assets and liabilities at the end of the reporting period, resulting from changes in the exchange rates.
| e) | Joint Trading Account – The Fund may invest cash balances into a joint trading account that may be invested in one or more repurchase agreements. |
| f) | Fund Share Valuation and Dividend Distributions to Shareholders – Orders for the Fund’s shares are executed in accordance with the investment instructions of the contract holders and plan participants. The NAV of the Fund’s shares is determined as of the close of business on each business day of the Exchange. The NAV is determined separately for each class of shares of the Fund by dividing the Fund’s net assets attributable to that class by the number of shares of the class outstanding. Each class of shares offered by the Fund has equal rights as to assets and voting privileges (except that shareholders of a class have exclusive voting rights regarding any matter relating solely to that class of shares). Income and non-class specific expenses are allocated daily to each class on the basis of the relative net assets of the class. Realized and unrealized gains and losses are allocated daily based on the relative net assets of each class of shares of the Fund. |
Orders for the purchase of the Fund’s shares received prior to the close of the Exchange on any day the Exchange is open for business are priced at the NAV determined as of the close of the Exchange. Orders received after the close of the Exchange, or on a day on which the Exchange and/or the Fund is not open for business, are priced at the next determined NAV.
Dividends are declared pursuant to a policy adopted by the Company’s Board of Directors based upon the investment performance of the Fund. The policy of the Fund is to pay dividends from net investment income and realized gains, if any, at least once a year.
Distributions from net investment income, net realized gains and capital are determined in accordance with federal income tax regulations, which may differ from U.S. GAAP with respect to character and timing. These differences may include but are not limited to losses deferred due to wash sale adjustments, foreign currency gains and losses, adjustments related to Passive Foreign Investment Companies (“PFICs”), Real Estate Investment Trusts (“REITs”), Regulated Investment Companies (“RICs”), certain derivatives and partnerships. Permanent book and federal income tax basis differences relating to shareholder distributions will result in reclassifications to certain of the Fund’s capital accounts (see Federal Income Taxes: Reclassification of Capital Accounts note).
| 21 |
| Hartford Balanced HLS Fund |
| Notes to Financial Statements – (continued) |
| December 31, 2013 |
| (000’s Omitted) |
| 3. | Securities and Other Investments: |
| a) | Repurchase Agreements – A repurchase agreement is an agreement by which a counterparty agrees to sell an investment and agrees to repurchase the investment sold from the buyer at a mutually agreed upon time and price. During the period of the repurchase agreement, the counterparty will deposit cash and or securities in a third party custodial account to serve as collateral. At the time the Fund enters into a repurchase agreement, the value of the underlying collateral, including accrued interest, will be equal to or exceed the value of the repurchase agreement. Repurchase agreements expose the Fund to counterparty risk - that is, the risk that the counterparty will not fulfill its obligations. To minimize counterparty risk, the investments that serve to collateralize the repurchase agreement are held by the Fund’s custodian in book entry or physical form in the custodial account of the Fund or in a third party custodial account. Repurchase agreements are valued at cost plus accrued interest, which approximates fair value. Repurchase agreements have master netting arrangements which allow the Fund to offset amounts owed to a counterparty with amounts owed by the counterparty, including any collateral. Upon an event of default under a master repurchase agreement, the non-defaulting party may close out all transactions traded under such agreement and net amounts owed under each transaction to one net amount payable by one party to the other. Absent an event of default, the master repurchase agreement does not result in an offset of reported amounts of assets and liabilities in the Statement of Assets and Liabilities across transactions between the Fund and the applicable counterparty. The Fund, as shown on the Schedule of Investments, had outstanding repurchase agreements and related collateral as of December 31, 2013. |
| b) | Illiquid and Restricted Investments – The Fund is permitted to invest up to 15% of its net assets in illiquid investments. Illiquid investments are those that may not be sold or disposed of in the ordinary course of business within seven days, at approximately the price used to determine the Fund’s NAV. The Fund may not be able to sell illiquid investments when its sub-adviser considers it desirable to do so or may have to sell such investments at a price that is lower than the price that could be obtained if the investments were more liquid. A sale of illiquid investments may require more time and may result in higher dealer discounts and other selling expenses than does the sale of those that are liquid. Illiquid investments also may be more difficult to value due to the unavailability of reliable market quotations for such investments, and an investment in them may have an adverse impact on the Fund’s NAV. The Fund may also purchase certain restricted investments that can only be resold to certain qualified investors and may be determined to be liquid pursuant to policies and guidelines established by the Company’s Board of Directors. The Fund, as shown on the Schedule of Investments, had illiquid and/or restricted investments as of December 31, 2013. |
| c) | Investments Purchased on a When-Issued or Delayed-Delivery Basis – Delivery and payment for investments that have been purchased by the Fund on a forward commitment, or when-issued or delayed-delivery basis, take place beyond the customary settlement period. The Fund may dispose of or renegotiate a delayed-delivery transaction after it is entered into, and may sell delayed-delivery investments before they are delivered, which may result in a realized gain or loss. During this period, such investments are subject to market fluctuations, and the Fund identifies investments segregated in its records with a value at least equal to the amount of the commitment. The Fund, as shown on the Schedule of Investments, had when-issued or delayed-delivery investments as of December 31, 2013. |
In connection with the Fund’s ability to purchase investments on a when-issued or forward commitment basis, the Fund may enter into to-be announced (“TBA”) commitments. TBA commitments are forward agreements for the purchase or sale of mortgage backed securities for a fixed price, with payment and delivery on an agreed-upon future settlement date. The specific securities to be delivered are not identified at the trade date; however, delivered securities must meet specified terms, including issuer, rate and mortgage terms. Although the Fund may enter into TBA commitments with the intention of acquiring or delivering securities for its portfolio, the Fund can extend the settlement date, roll the transaction, or dispose of a commitment prior to settlement if deemed appropriate to do so. If the TBA commitment is closed through the acquisition of an offsetting TBA commitment, the Fund realizes a gain or loss. In a TBA roll transaction, the Fund generally purchases or sells the initial TBA commitment prior to the agreed upon settlement date and enters into a new TBA commitment for future delivery or receipt of the mortgage backed securities. TBA commitments involve a risk of loss if the value of the security to be purchased or sold declines or increases, respectively, prior to settlement date.
| 22 |
The Fund may enter into “dollar rolls” in which the Fund sells securities and contracts with the same counterparty to repurchase substantially similar securities (for example, same issuer, coupon and maturity) on a specified future date at an agreed upon price. The Fund gives up the right to receive interest paid on the investments sold. The Fund would benefit to the extent of any differences between the price received for the security and the lower forward price for the future purchase. Dollar rolls involve the risk that the market value of the securities that the Fund is required to purchase may decline below the agreed upon repurchase price of those securities. The Fund records dollar roll transactions as purchases and sales and realizes gains and losses on these transactions. These transactions are excluded from the Fund’s portfolio turnover rate. The Fund had open dollar roll transactions as of December 31, 2013.
| d) | Mortgage Related and Other Asset Backed Securities – The Fund may invest in mortgage related and other asset backed securities. These securities include mortgage pass-through securities, collateralized mortgage obligations, commercial mortgage backed securities, stripped mortgage backed securities, asset backed securities, collateralized debt obligations and other securities that directly or indirectly represent a participation in, or are secured by and payable from, mortgage loans on real property. Mortgage related securities are created from pools of residential or commercial mortgage loans, including mortgage loans made by savings and loan institutions, mortgage bankers, commercial banks and others. Asset backed securities are created from many types of assets, including auto loans, credit card receivables, home equity loans, and student loans. These securities provide a monthly payment that consists of both interest and principal payments. Interest payments may be determined by fixed or adjustable rates. The rate of pre-payments on underlying mortgages will affect the price and volatility of a mortgage related security, and may have the effect of shortening or extending the effective duration of the security relative to what was anticipated at the time of purchase. The timely payment of principal and interest of certain mortgage related securities is guaranteed by the full faith and credit of the United States Government. Mortgage related and other asset backed securities created and guaranteed by non-governmental issuers, including government-sponsored corporations, may be supported by various forms of insurance or guarantees, but there can be no assurance that the private insurers or guarantors can meet their obligations under the insurance policies or guarantee arrangements. The Fund, as shown on the Schedule of Investments, had mortgage related and other asset backed securities as of December 31, 2013. |
| 4. | Financial Derivative Instruments: |
The following disclosures contain information on how and why the Fund uses derivative instruments, the credit-risk-related contingent features in certain derivative instruments, and how derivative instruments affect the Fund’s financial position and results of operations. The location and fair value amounts of these instruments on the Statement of Assets and Liabilities and the realized gains and losses and changes in unrealized gains and losses on the Statement of Operations, each categorized by type of derivative contract, are included in the following Additional Derivative Instrument Information footnote. The derivative instruments outstanding as of year-end are disclosed in the notes to or within the Schedule of Investments for purchased options, if applicable. The amounts of realized gains and losses and changes in unrealized gains and losses on derivative instruments during the year are disclosed in the Statement of Operations.
| a) | Foreign Currency Contracts – The Fund may enter into foreign currency contracts that obligate the Fund to purchase or sell currencies at specified future dates. Foreign currency contracts are used to hedge the currency exposure associated with some or all of the Fund’s investments and/or as part of an investment strategy. Foreign currency contracts are marked to market daily and the change in value is recorded by the Fund as an unrealized gain or loss. The Fund will record a realized gain or loss when the foreign currency contract is settled. |
Foreign currency contracts involve elements of market risk in excess of the amounts reflected in the Statement of Assets and Liabilities. In addition, risks may arise upon entering into these contracts from the potential inability of the counterparties to meet the terms of the contracts and from unanticipated movements in the value of the foreign currencies relative to the U.S. dollar. The Fund had no outstanding foreign currency contracts as of December 31, 2013.
| 23 |
| Hartford Balanced HLS Fund |
| Notes to Financial Statements – (continued) |
| December 31, 2013 |
| (000’s Omitted) |
| b) | Futures Contracts – The Fund may enter into futures contracts. A futures contract is an agreement between two parties to buy or sell an asset at a set price on a future date. The Fund uses futures contracts to manage or obtain exposure to the investment markets, commodities, or movements in interest rates and currency values. The primary risks associated with the use of futures contracts are the imperfect correlation between the change in market value of the investments held by the Fund and the prices of futures contracts and the possibility of an illiquid market. Upon entering into a futures contract, the Fund is required to deposit with a futures commission merchant (“FCM”) an amount of cash or U.S. Government or Agency Obligations in accordance with the initial margin requirements of the broker or exchange. Futures contracts are marked to market daily at the most recent settlement price reported by an exchange on which, over time, they are traded most extensively, and an appropriate payable or receivable for the change in value (“variation margin”) is recorded by the Fund. Gains or losses are recognized but not considered realized until the contracts expire or are closed. Futures contracts involve, to varying degrees, risk of loss in excess of the variation margin disclosed on the Statement of Assets and Liabilities; however, the Fund seeks to reduce this risk through the use of an FCM. As of December 31, 2013, the Fund had no outstanding futures contracts. |
| c) | Swap Contracts – The Fund may invest in swap contracts. Swap contracts are agreements to exchange or swap investment cash flows, assets, foreign currencies or market-linked returns at specified, future intervals. Swap contracts are either privately negotiated in the over-the-counter market (“OTC swaps”) or executed in a multilateral or other trade facility platform, such as a registered exchange (“centrally cleared swaps”). The Fund may enter into credit default, total return, cross-currency, interest rate, inflation and other forms of swap contracts to manage its exposure to credit, currency, interest rate, commodity and inflation risk. Swap contracts are also used to gain exposure to certain markets. In connection with these contracts, investments or cash may be identified as collateral or margin in accordance with the terms of the respective swap contracts and/or master netting arrangement to provide assets of value and recourse in the event of default or bankruptcy/insolvency. |
Swaps are valued based on custom valuations furnished by an independent pricing service. Swaps for which prices are not available from an independent pricing service are valued in accordance with procedures established by the Company’s Board of Directors. Changes in market value, if any, are reflected as a component of net changes in unrealized appreciation or depreciation on the Statement of Operations. Daily changes in valuation of centrally cleared swaps, if any, are recorded as a receivable or payable for the change in value as appropriate (“variation margin”) on the Statement of Assets and Liabilities. Realized gains or losses on centrally cleared swaps are recorded upon the termination of the swap. OTC swap payments received or made at the beginning of the measurement period are reflected as such on the Statement of Assets and Liabilities and represent premiums paid or received upon entering into the swap contract to compensate for differences between the stated terms of the swap contract and prevailing market conditions (credit spreads, currency exchange rates, interest rates and other relevant factors). These upfront premiums are recorded as realized gains or losses on the Statement of Operations upon termination or maturity of the swap. A liquidation payment received or made at the termination or maturity of the swap is recorded as a realized gain or loss on the Statement of Operations. Net periodic payments received or paid by the Fund are included as part of realized gains or losses on the Statement of Operations.
Entering into these contracts involves, to varying degrees, elements of liquidation, counterparty, credit and market risk in excess of the amounts recognized on the Statement of Assets and Liabilities. Such risks involve the possibility that there will be no liquid market for these contracts, that the counterparty to the contracts may default on its obligation to perform or disagree as to the meaning of contractual terms in the contracts, and that there may be unfavorable changes in market conditions (credit spreads, currency exchange rates, interest rates and other relevant factors).
The Fund’s maximum risk of loss from credit risk for OTC swaps is the net value of the discounted cash flows to be received from the counterparty over the contract’s remaining life, and current market value, to the extent that amount is positive. The risk is mitigated by having a master netting arrangement between the Fund and the counterparty, which allows for the netting of payments made or received (although such amounts are presented on a gross basis within the Statement of Assets and Liabilities, as applicable) as well as the posting of collateral to the Fund to cover the Fund’s exposure to the counterparty. In a centrally cleared swap, while the Fund enters into an agreement with a clearing broker
| 24 |
to execute contracts with a counterparty, the performance of the swap is guaranteed by the central clearinghouse, which reduces the Fund’s exposure to credit risk. The Fund is still exposed to the credit risk of the clearing broker and clearinghouse. The clearinghouse attempts to minimize this risk to all of its participants through the use of mandatory margin requirements, daily cash settlements, and other procedures designed to protect counterparties utilizing the clearinghouse. Likewise, the clearing broker reduces its risk through margin requirements and required segregation of customer balances.
Credit Default Swap Contracts – The credit default swap market allows the Fund to manage its exposure to the market or certain sectors of the market, to reduce its risk exposure to defaults of corporate and sovereign issuers, or to create exposure to corporate or sovereign issuers to which it is not otherwise exposed. Certain credit default swaps involve the exchange of a fixed rate premium for protection against the loss in value of an underlying investment or index in the event of a credit event, such as payment default or bankruptcy.
Under a credit default swap contract, one party acts as guarantor by receiving the fixed periodic payment in exchange for the commitment to purchase the underlying investment at par if the defined credit event occurs. Upon the occurrence of a defined credit event, the difference between the value of the reference obligation and the swap’s notional amount is recorded as realized gain or loss on swap transactions in the Statement of Operations. A “buyer” of credit protection agrees to pay a counterparty to assume the credit risk of an issuer upon the occurrence of certain events. The “seller” of the protection receives periodic payments and agrees to assume the credit risk of an issuer upon the occurrence of certain events. Although specified events are contract specific, credit events are generally defined as bankruptcy, failure to pay, restructuring, obligation acceleration, obligation default or repudiation/moratorium. A “seller’s” exposure is limited to the total notional amount of the credit default swap contract. These potential amounts would be partially offset by any recovery values of the respective referenced obligations or upfront payments received upon entering into the contract.
Implied credit spreads, represented in absolute terms, utilized in determining the market value of credit default swap contracts on corporate issues, sovereign government issues or U.S. municipal issues as of year-end are disclosed in the notes to the Schedule of Investments, as applicable, and serve as an indicator of the current status of the payment/performance risk and represent the likelihood or risk of default for the credit derivative. The implied credit spread of a particular referenced entity reflects the cost of buying/selling protection and may include upfront payments required to be made to enter into the contract. Wider credit spreads represent a deterioration of the referenced entity’s credit soundness and a greater likelihood or risk of default or other credit event occurring as defined under the terms of the contract. For credit default swap contracts on asset backed securities and credit indices, the quoted market prices and resulting values serve as the indicator of the current status of the payment/performance risk. Increasing market values, in absolute terms when compared to the notional amount of the swap, represent a deterioration of the referenced equity’s credit soundness and a greater likelihood or risk of default or other credit event occurring as defined under the terms of the contract. The Fund, as shown on the Schedule of Investments, had outstanding credit default swap contracts as of December 31, 2013.
| d) | Additional Derivative Instrument Information: |
Fair Value of Derivative Instruments on the Statement of Assets and Liabilities as of December 31, 2013:
| Risk Exposure Category | ||||||||||||||||||||||||||||
| Interest Rate Contracts | Foreign Exchange Contracts | Credit Contracts | Equity Contracts | Commodity Contracts | Other Contracts | Total | ||||||||||||||||||||||
| Assets: | ||||||||||||||||||||||||||||
| Unrealized appreciation on OTC swap contracts | $ | — | $ | — | $ | 158 | $ | — | $ | — | $ | — | $ | 158 | ||||||||||||||
| Total | $ | — | $ | — | $ | 158 | $ | — | $ | — | $ | — | $ | 158 | ||||||||||||||
The volume of derivatives that is presented in the Schedule of Investments is consistent with the derivative activity during the year ended December 31, 2013.
| 25 |
| Hartford Balanced HLS Fund |
| Notes to Financial Statements – (continued) |
| December 31, 2013 |
| (000’s Omitted) |
The Effect of Derivative Instruments on the Statement of Operations for the year ended December 31, 2013:
| Risk Exposure Category | ||||||||||||||||||||||||||||
| Interest Rate Contracts | Foreign Exchange Contracts | Credit Contracts | Equity Contracts | Commodity Contracts | Other Contracts | Total | ||||||||||||||||||||||
| Realized Gain on Derivatives Recognized as a Result of Operations: | ||||||||||||||||||||||||||||
| Net realized gain on futures | $ | 2 | $ | — | $ | — | $ | — | $ | — | $ | — | $ | 2 | ||||||||||||||
| Net realized gain on swap contracts | — | — | 17 | — | — | — | 17 | |||||||||||||||||||||
| Net realized gain on foreign currency contracts | — | 199 | — | — | — | — | 199 | |||||||||||||||||||||
| Total | $ | 2 | $ | 199 | $ | 17 | $ | — | $ | — | $ | — | $ | 218 | ||||||||||||||
| Net Change in Unrealized Appreciation (Depreciation) on Derivatives Recognized as a Result of Operations: | ||||||||||||||||||||||||||||
| Net change in unrealized appreciation of swap contracts | $ | — | $ | — | $ | 158 | $ | — | $ | — | $ | — | $ | 158 | ||||||||||||||
| Total | $ | — | $ | — | $ | 158 | $ | — | $ | — | $ | — | $ | 158 | ||||||||||||||
| e) | Balance Sheet Offsetting Information: |
Set forth below are tables which disclose both gross information and net information about instruments and transactions eligible for offset in the financial statements, and instruments and transactions that are subject to a master netting arrangement, as well as amounts related to margin, reflected as financial collateral (including cash collateral), held at clearing brokers, counterparties and the Fund’s custodian. The master netting arrangements allow the clearing brokers to net any collateral held in or on behalf of the Fund, or liabilities or payment obligations of the clearing brokers to the Fund, against any liabilities or payment obligations of the Fund to the clearing brokers. The Fund is required to deposit financial collateral (including cash collateral) at the Fund’s custodian on behalf of clearing brokers and counterparties to continually meet the original and maintenance requirements established by the clearing brokers and counterparties. Such requirements are specific to the respective clearing broker or counterparty.
Offsetting of Financial Liabilities and Derivative Liabilities as of December 31, 2013:
| Gross Amounts* of Liabilities Presented in Statement of Assets and Liabilities | Financial Instruments with Allowable Netting | Collateral Pledged | Net Amount (not less than $0) | |||||||||||||
| Description | ||||||||||||||||
| OTC swap contracts at market value | $ | 240 | $ | — | $ | 277 | $ | — | ||||||||
| Total subject to a master netting or similar arrangement | $ | 240 | $ | — | $ | 277 | $ | — | ||||||||
* Gross amounts presented as no amounts are netted within the Statement of Assets and Liabilities.
| 5. | Principal Risks: |
Credit risk depends largely on the perceived financial health of bond issuers. In general, the credit rating is inversely related to the credit risk of the issuer. Higher rated bonds generally are deemed to have less credit risk, while lower or unrated bonds are deemed to have higher risk of default. The share price, yield and total return of a fund that holds securities with higher credit risk may be more volatile than those of a fund that holds bonds with lower credit risk. Similar to credit risk, the Fund may be exposed to counterparty risk, or the risk that an institution or other entity with which the Fund has unsettled or open transactions will default.
The Fund’s investments expose the Fund to various risks including, but not limited to, interest rate, prepayment, extension, foreign currency and equity risks. Interest rate risk is the risk that fixed income securities will decline in value because of changes in interest rates. As nominal interest rates rise, the values of certain fixed income securities held by
| 26 |
the Fund are likely to decrease. A nominal interest rate can be described as the sum of a real interest rate and an expected inflation rate. Fixed income securities with longer durations tend to be more sensitive to changes in interest rates, usually making them more volatile than securities with shorter durations. Duration is useful primarily as a measure of the sensitivity of a fixed income security’s market price to interest rate (i.e., yield) movements. In addition, securities are subject to extension risk. Rising interest rates may cause prepayments to occur at a slower than expected rate, thereby effectively lengthening the maturity of the security and making the security more sensitive to interest rate changes. Prepayment and extension risk are major risks of mortgage backed securities and certain asset backed securities. For certain asset backed securities, the actual maturity may be less than the stated maturity shown in the Schedule of Investments, if applicable. As a result, the timing of income recognition relating to these securities may vary based upon the actual maturity.
If the Fund invests directly in foreign currencies or in securities that trade in, and receive revenues in, foreign currencies, or in derivatives that provide exposure to foreign currencies, it will be subject to the risk that those currencies will decline in value relative to the base currency (U.S. dollars) of the Fund, or, in the case of hedging positions, that the Fund’s base currency will decline in value relative to the currency being hedged. Currency rates in foreign countries may fluctuate significantly over short periods of time for a number of reasons, including changes in interest rates, intervention (or the failure to intervene) by U.S. or foreign governments, central banks or supranational entities, such as the International Monetary Fund, or by the imposition of currency controls or other political developments in the United States or abroad. As a result, the Fund’s investments in foreign currency denominated securities may reduce the returns of the Fund. The market values of equity securities, such as common stocks and preferred stocks, or equity related investments, such as futures and options, may decline due to general market conditions which are not specifically related to a particular company, such as real or perceived adverse economic conditions, changes in the general outlook for corporate earnings, changes in interest or currency rates or adverse investor sentiment generally. The market value of equity securities may also decline due to factors which affect a particular industry or industries, such as labor shortages or increased production costs and competitive conditions within an industry. Equity securities and equity related investments generally have greater market price volatility than fixed income securities.
| 6. | Federal Income Taxes: |
| a) | Federal Income Taxes – For federal income tax purposes, the Fund intends to continue to qualify as a RIC under Subchapter M of the Internal Revenue Code (“IRC”) by distributing substantially all of its taxable net investment income and net realized capital gains to its shareholders and otherwise complying with the requirements of the IRC. The Fund has distributed substantially all of its income and capital gains in prior years, if applicable, and intends to distribute substantially all of its income and capital gains prior to the next fiscal year-end. Accordingly, no provision for federal income or excise taxes has been made in the accompanying financial statements. Distributions from short-term capital gains are treated as ordinary income distributions for federal income tax purposes. |
| b) | Net Investment Income (Loss), Net Realized Gains (Losses) and Distributions – Net investment income (loss) and net realized gains (losses) may differ for financial statement and tax purposes primarily because of losses deferred due to wash sale adjustments, foreign currency gains and losses, adjustments related to PFICs, REITs, RICs, certain derivatives and partnerships. The character of distributions made during the year from net investment income or net realized gains may differ from their ultimate characterization for federal income tax purposes. Also, due to the timing of dividend distributions, the fiscal year in which amounts are distributed may differ from the year that the income or realized gains (losses) were recorded by the Fund. |
| c) | Distributions and Components of Distributable Earnings – The tax character of distributions paid by the Fund for the periods indicated is as follows (as adjusted for dividends payable, if applicable): |
| For the Year Ended December 31, 2013 | For the Year Ended December 31, 2012 | |||||||
| Ordinary Income | $ | 45,654 | $ | 93,156 | ||||
| 27 |
| Hartford Balanced HLS Fund |
| Notes to Financial Statements – (continued) |
| December 31, 2013 |
| (000’s Omitted) |
As of December 31, 2013, the Fund’s components of distributable earnings (deficit) on a tax basis were as follows:
| Amount | ||||
| Undistributed Ordinary Income | $ | 10,106 | ||
| Accumulated Capital and Other Losses* | (683,377 | ) | ||
| Unrealized Appreciation† | 727,021 | |||
| Total Accumulated Earnings | $ | 53,750 | ||
| * | The Fund has capital loss carryforwards that are identified in the Capital Loss Carryforward note that follows. |
| † | Differences between book-basis and tax-basis unrealized appreciation (depreciation) may be attributable to the losses deferred due to wash sale adjustments, foreign currency gains and losses, adjustments related to PFICs, REITs, RICs, certain derivatives and partnerships. |
| d) | Reclassification of Capital Accounts – The Fund may record reclassifications in its capital accounts. These reclassifications have no impact on the total net assets of the Fund. The reclassifications are a result of permanent differences between U.S. GAAP and tax accounting for such items as foreign currency, PFICs, expiration or utilization of capital loss carryforwards or net operating losses. Adjustments are made to reflect the impact these items have on current and future distributions to shareholders. Therefore, the source of the Fund’s distributions may be shown in the accompanying Statement of Changes in Net Assets as from undistributed net investment income, from accumulated net realized gains on investments or from capital depending on the type of book and tax differences that exist. For the year ended December 31, 2013, the Fund recorded reclassifications to increase (decrease) the accounts listed below: |
| Amount | ||||
| Undistributed Net Investment Income (Loss) | $ | 49 | ||
| Accumulated Net Realized Gain (Loss) | (49 | ) | ||
| e) | Capital Loss Carryforward – On December 22, 2010, the Regulated Investment Company Modernization Act of 2010 (the “Act”) was enacted, which made changes to the capital loss carryforward rules. The changes are effective for taxable years beginning after the date of enactment. Under the Act, funds are permitted to carry forward capital losses for an unlimited period. However, any losses incurred during those future taxable years will be required to be utilized prior to the losses incurred in pre-enactment taxable years, which carry an expiration date. As a result of this ordering rule, pre-enactment capital loss carryforwards may be more likely to expire unused. Additionally, post-enactment capital loss carryforwards retain their character as either short-term or long-term capital losses rather than being considered all short-term as permitted under prior regulation. |
At December 31, 2013 (tax-year-end), the Fund had capital loss carryforwards for U.S. federal income tax purposes as follows:
| Year of Expiration | Amount | |||
| 2017 | $ | 683,377 | ||
| Total | $ | 683,377 | ||
During the year ended December 31, 2013, the Fund utilized $242,056 of prior year capital loss carryforwards.
| f) | Accounting for Uncertainty in Income Taxes – The Fund has adopted financial reporting rules that require the Fund to analyze all open tax years, as defined by the statute of limitations, for all major jurisdictions. Generally, tax authorities can examine all tax returns filed for the last three years. The Fund does not have an examination in progress. |
| 28 |
The Fund has reviewed all open tax years and major jurisdictions and concluded that these financial reporting rules had no effect on the Fund’s financial position or results of operations. There is no tax liability resulting from unrecognized tax benefits relating to uncertain income tax positions taken or expected to be taken on the tax return for the fiscal year ended December 31, 2013. The Fund is also not aware of any tax positions for which it is reasonably possible that the total amounts of unrecognized tax benefits will significantly change in the next twelve months.
| 7. | Expenses: |
| a) | Investment Management Agreement – Hartford Funds Management Company, LLC (“HFMC”), an indirect wholly owned subsidiary of The Hartford Financial Services Group, Inc. (“The Hartford”), serves as investment manager to the Fund pursuant to an Investment Management Agreement with the Company. The investment manager has overall investment supervisory responsibility for the Fund. In addition, the investment manager provides administrative personnel, services, equipment, facilities and office space for proper operation of the Fund. The investment manager has contracted with Wellington Management Company, LLP (“Wellington Management”) under a sub-advisory agreement for the provision of day-to-day investment management services to the Fund in accordance with the Fund’s investment objective and policies. The Fund pays a fee to the investment manager, a portion of which may be used to compensate Wellington Management. |
The schedule below reflects the rates of compensation paid to HFMC for investment management services rendered as of December 31, 2013; the rates are accrued daily and paid monthly.
| Average Daily Net Assets | Annual Fee | |||
| On first $250 million | 0.6800 | % | ||
| On next $250 million | 0.6550 | % | ||
| On next $500 million | 0.6450 | % | ||
| On next $4 billion | 0.5950 | % | ||
| On next $5 billion | 0.5925 | % | ||
| Over $10 billion | 0.5900 | % | ||
| b) | Accounting Services Agreement – Pursuant to the Fund Accounting Agreement between HFMC and the Company, on behalf of the Fund, HFMC provides accounting services to the Fund and receives monthly compensation based on the Fund’s average daily net assets at the rates set forth below. The Fund’s accounting services fees are accrued daily and paid monthly. |
| Average Daily Net Assets | Annual Fee | |||
| On first $5 billion | 0.016 | % | ||
| On next $5 billion | 0.014 | % | ||
| Over $10 billion | 0.012 | % | ||
Effective January 1, 2014, the new accounting services fees schedule based on the Fund’s average daily net assets is as follows:
| Average Daily Net Assets | Annual Fee | |||
| On first $5 billion | 0.016 | % | ||
| On next $5 billion | 0.013 | % | ||
| Over $10 billion | 0.010 | % | ||
| c) | Operating Expenses – Allocable expenses incurred by the Company are allocated to each Fund and allocated to classes within a Fund in proportion to the average daily net assets of the Fund and each class, except where allocation of certain expenses is more fairly made directly to the Fund or to specific classes within a Fund. |
| 29 |
| Hartford Balanced HLS Fund |
| Notes to Financial Statements – (continued) |
| December 31, 2013 |
| (000’s Omitted) |
| d) | Fees Paid Indirectly – The Company, on behalf of the Fund, has entered into agreements with State Street Global Markets, LLC and Russell Implementation Services, Inc. to partially recapture non-discounted trade commissions. Such rebates are used to pay a portion of the Fund’s expenses. In addition, the Fund’s custodian bank has agreed to reduce its fees when the Fund maintains cash on deposit in a non-interest-bearing custody account. For the year ended December 31, 2013, these amounts, if any, are included in the Statement of Operations. |
The ratio of expenses to average net assets in the accompanying financial highlights excludes the reduction in expenses related to fees paid indirectly. The annualized expense ratio after waivers for the period listed below reflecting the reduction for fees paid indirectly is as follows:
| Year Ended December 31, 2013 | ||||
| Class IA | 0.65 | % | ||
| Class IB | 0.90 | |||
| e) | Distribution Plan for Class IB shares – Effective June 14, 2013, Hartford Investment Financial Services, LLC was renamed Hartford Funds Distributors, LLC (“HFD”). HFD, a wholly owned, ultimate subsidiary of The Hartford, serves as the Fund’s principal underwriter and distributor. The Company, on behalf of the Fund, has adopted a Distribution Plan pursuant to Rule 12b-1 of the 1940 Act to compensate the distributor, HFD, from assets attributable to the Class IB shares for services rendered and expenses borne in connection with activities primarily intended to result in the sale of the Class IB shares, subject to the review and approval of the Company’s Board of Directors. |
The Distribution Plan provides that the Fund may pay annually up to 0.25% of the average daily net assets of the Fund attributable to its Class IB shares for activities primarily intended to result in the sale of Class IB shares. The Board has the authority to suspend or reduce these payments at any point in time. Under the terms of the Distribution Plan and the principal underwriting agreement, the Fund is authorized to make payments monthly to the distributor that may be used to pay or compensate entities providing distribution and shareholder servicing with respect to the Class IB shares for such entities’ fees or expenses incurred or paid in that regard. These fees are accrued daily and paid monthly.
| f) | Other Related Party Transactions – Certain officers of the Fund are directors and/or officers of the investment manager and/or The Hartford or its subsidiaries. For the year ended December 31, 2013, a portion of the Fund’s Chief Compliance Officer’s salary was paid by all the investment companies in the Hartford fund complex. The portion allocated to the Fund was in the amount of $3. Hartford Administrative Services Company (“HASCO”), an indirect wholly owned subsidiary of The Hartford, provides transfer agent services to the Fund. HASCO was compensated on a per account basis for providing such services. The amount paid to HASCO can be found in the Statement of Operations. These fees are accrued daily and paid monthly. |
| 8. | Investment Transactions: |
For the year ended December 31, 2013, the Fund's aggregate purchases and sales of investment securities (excluding short-term investments) were as follows:
| Amount | ||||
| Cost of Purchases Excluding U.S. Government Obligations | $ | 877,872 | ||
| Sales Proceeds Excluding U.S. Government Obligations | 1,453,788 | |||
| Cost of Purchases for U.S. Government Obligations | 530,953 | |||
| Sales Proceeds for U.S. Government Obligations | 508,236 | |||
| 9. | Line of Credit: |
The Fund is one of several Hartford funds that participate in a $500 million committed revolving line of credit facility. The facility is to be used for temporary or emergency purposes. Under the arrangement, the funds are required to own securities having a market value in excess of 300% of the total bank borrowings. The interest rate on borrowings varies depending on
| 30 |
the nature of the loan. The facility also requires a fee to be paid based on the amount of the commitment. This commitment fee is allocated to all of the funds participating in the line of credit based on the average net assets of the funds. During the year ended December 31, 2013, the Fund did not have any borrowings under this facility.
| 10. | Industry Classifications: |
Other than the industry classifications “Other Investment Pools and Funds” and “Exchange Traded Funds,” equity industry classifications used in this report are the Global Industry Classification Standard, which was developed by and is the exclusive property and service mark of MSCI, Inc. and Standard & Poor’s.
| 11. | Indemnifications: |
Under the Company’s organizational documents, the Company shall indemnify its officers and directors to the full extent required or permitted under Maryland General Corporation Law and the federal securities laws. In addition, the Company, on behalf of the Fund, may enter into contracts that contain a variety of indemnifications. The Company’s maximum exposure under these arrangements is unknown. However, as of the date of these financial statements, the Company has not had prior claims or losses pursuant to these contracts and expects the risk of loss to be remote.
| 12. | Pending Legal Proceedings: |
On February 25, 2011, Jennifer L. Kasilag, Louis Mellinger, Judith M. Menendez, Jacqueline M. Robinson, and Linda A. Russell filed a derivative lawsuit against Hartford Investment Financial Services, LLC (“HIFSCO”)(now known as Hartford Funds Distributors, LLC) on behalf of six Hartford retail mutual funds in the United States District Court for the District of New Jersey, alleging that HIFSCO received excessive advisory and distribution fees in violation of its statutory fiduciary duty under Section 36(b) of the 1940 Act when serving as investment manager and principal underwriter, respectively, to the Hartford retail mutual funds. HIFSCO moved to dismiss and, in September 2011, the motion was granted in part and denied in part, with leave to amend the complaint. In November 2011, plaintiffs filed an amended complaint on behalf of certain Hartford retail mutual funds, The Hartford Global Health Fund (now known as The Hartford Healthcare Fund), The Hartford Conservative Allocation Fund, The Hartford Growth Opportunities Fund, The Hartford Inflation Plus Fund, The Hartford Advisers Fund (now known as The Hartford Balanced Fund), and The Hartford Capital Appreciation Fund. Plaintiffs seek to rescind the investment management agreements and distribution plans between HIFSCO and these funds and to recover the total fees charged thereunder or, in the alternative, to recover any improper compensation HIFSCO received, in addition to lost earnings. HIFSCO filed a partial motion to dismiss the amended complaint and, in December 2012, the court dismissed without prejudice the claims regarding distribution fees and denied the motion with respect to the advisory fees claims. HIFSCO disputes the allegations and intends to defend the advisory fee claims vigorously.
This action concerns the activities of HIFSCO in its capacity as investment manager and principal underwriter to the Hartford retail mutual funds and does not concern HIFSCO’s activities in its capacity as principal underwriter to the HLS funds. For this reason, no accrual for litigation relating to this matter has been recorded in the financial statements of the Fund.
| 31 |
| Hartford Balanced HLS Fund |
| Financial Highlights |
| — Selected Per-Share Data(A) — | — Ratios and Supplemental Data — | |||||||||||||||||||||||||||||||||||||||||||||||||||
| Class | Net Asset Value at Beginning of Period | Net Investment Income (Loss) | Net Realized and Unrealized Gain (Loss) on Investments | Total from Investment Operations | Dividends from Net Investment Income | Distributions from Realized Capital Gains | Total Dividends and Distributions | Net Asset Value at End of Period | Total Return(B) | Net Assets at End of Period (000s) | Ratio of Expenses to Average Net Assets Before Adjust- ments(C) | Ratio of Expenses to Average Net Assets After Adjust- ments(C) | Ratio of Net Investment Income (Loss) to Average Net Assets | |||||||||||||||||||||||||||||||||||||||
| For the Year Ended December 31, 2013 | ||||||||||||||||||||||||||||||||||||||||||||||||||||
| IA | $ | 21.03 | $ | 0.41 | $ | 4.04 | $ | 4.45 | $ | (0.37 | ) | $ | – | $ | (0.37 | ) | $ | 25.11 | 21.19 | % | $ | 2,782,698 | 0.65 | % | 0.65 | % | 1.75 | % | ||||||||||||||||||||||||
| IB | 21.30 | 0.35 | 4.10 | 4.45 | (0.31 | ) | – | (0.31 | ) | 25.44 | 20.88 | 399,681 | 0.90 | 0.90 | 1.50 | |||||||||||||||||||||||||||||||||||||
| For the Year Ended December 31, 2012 (D) | ||||||||||||||||||||||||||||||||||||||||||||||||||||
| IA | $ | 19.34 | $ | 0.47 | $ | 1.85 | $ | 2.32 | $ | (0.63 | ) | $ | – | $ | (0.63 | ) | $ | 21.03 | 12.02 | % | $ | 2,754,114 | 0.65 | % | 0.65 | % | 1.98 | % | ||||||||||||||||||||||||
| IB | 19.58 | 0.43 | 1.86 | 2.29 | (0.57 | ) | – | (0.57 | ) | 21.30 | 11.74 | 406,156 | 0.90 | 0.90 | 1.73 | |||||||||||||||||||||||||||||||||||||
| For the Year Ended December 31, 2011 (D) | ||||||||||||||||||||||||||||||||||||||||||||||||||||
| IA | $ | 19.32 | $ | 0.41 | $ | (0.06 | ) | $ | 0.35 | $ | (0.33 | ) | $ | – | $ | (0.33 | ) | $ | 19.34 | 1.86 | % | $ | 2,959,019 | 0.64 | % | 0.64 | % | 1.84 | % | |||||||||||||||||||||||
| IB | 19.55 | 0.36 | (0.05 | ) | 0.31 | (0.28 | ) | – | (0.28 | ) | 19.58 | 1.61 | 455,939 | 0.89 | 0.89 | 1.59 | ||||||||||||||||||||||||||||||||||||
| For the Year Ended December 31, 2010 | ||||||||||||||||||||||||||||||||||||||||||||||||||||
| IA | $ | 17.47 | $ | 0.30 | $ | 1.82 | $ | 2.12 | $ | (0.27 | ) | $ | – | $ | (0.27 | ) | $ | 19.32 | 12.14 | % | $ | 3,539,983 | 0.65 | % | 0.65 | % | 1.68 | % | ||||||||||||||||||||||||
| IB | 17.68 | 0.26 | 1.83 | 2.09 | (0.22 | ) | – | (0.22 | ) | 19.55 | 11.86 | 556,169 | 0.90 | 0.90 | 1.43 | |||||||||||||||||||||||||||||||||||||
| For the Year Ended December 31, 2009 (D) | ||||||||||||||||||||||||||||||||||||||||||||||||||||
| IA | $ | 13.69 | $ | 0.36 | $ | 3.78 | $ | 4.14 | $ | (0.36 | ) | $ | – | $ | (0.36 | ) | $ | 17.47 | 30.29 | % | $ | 3,607,929 | 0.65 | % | 0.65 | % | 2.15 | % | ||||||||||||||||||||||||
| IB | 13.85 | 0.32 | 3.83 | 4.15 | (0.32 | ) | – | (0.32 | ) | 17.68 | 29.96 | 578,338 | 0.90 | 0.90 | 1.90 | |||||||||||||||||||||||||||||||||||||
| (A) | Information presented relates to a share outstanding throughout the indicated period. Net investment income (loss) per share amounts are calculated based on average shares outstanding unless otherwise noted. |
| (B) | Assumes initial investment at net asset value at the beginning of each period, reinvestment of all distributions, the complete redemption of the investment at net asset value at the end of each period and no sales charge. Total return would be reduced if sales charges were taken into account. |
| (C) | Adjustments include waivers and reimbursements, if applicable. Ratios do not include fees paid indirectly (see Expenses in the accompanying Notes to Financial Statements). |
| (D) | Net investment income (loss) per share amounts have been calculated using the SEC method. |
| Portfolio Turnover Rate for All Share Classes | ||||
| For the Year Ended December 31, 2013 | 31 | % | ||
| For the Year Ended December 31, 2012 | 28 | |||
| For the Year Ended December 31, 2011 | 34 | |||
| For the Year Ended December 31, 2010 | 65 | (A) | ||
| For the Year Ended December 31, 2009 | 73 | |||
| (A) | During the year ended December 31, 2010, the Fund incurred $204.5 million in purchases associated with the transition of assets from Hartford Global Advisers HLS Fund, which merged into the Fund on March 19, 2010. These purchases were excluded from the portfolio turnover calculation. |
| 32 |
| Report of Independent Registered Public Accounting Firm |
| The Board of Directors and Shareholders of |
| Hartford Series Fund, Inc. |
We have audited the accompanying statement of assets and liabilities, including the schedule of investments, of Hartford Balanced HLS Fund (one of the portfolios constituting Hartford Series Fund, Inc. (the Funds)) as of December 31, 2013, and the related statement of operations for the year then ended, the statements of changes in net assets for each of the two years in the period then ended, and the financial highlights for each of the five years in the period then ended. These financial statements and financial highlights are the responsibility of the Funds’ management. Our responsibility is to express an opinion on these financial statements and financial highlights based on our audits.
We conducted our audits in accordance with the standards of the Public Company Accounting Oversight Board (United States). Those standards require that we plan and perform the audit to obtain reasonable assurance about whether the financial statements and financial highlights are free of material misstatement. We were not engaged to perform an audit of the Funds’ internal control over financial reporting. Our audits included consideration of internal control over financial reporting as a basis for designing audit procedures that are appropriate in the circumstances, but not for the purpose of expressing an opinion on the effectiveness of the Funds’ internal control over financial reporting. Accordingly, we express no such opinion. An audit also includes examining, on a test basis, evidence supporting the amounts and disclosures in the financial statements and financial highlights, assessing the accounting principles used and significant estimates made by management, and evaluating the overall financial statement presentation. Our procedures included confirmation of securities owned as of December 31, 2013, by correspondence with the custodian and brokers or by other appropriate auditing procedures where replies from brokers were not received. We believe that our audits provide a reasonable basis for our opinion.
In our opinion, the financial statements and financial highlights referred to above present fairly, in all material respects, the financial position of Hartford Balanced HLS Fund of the Hartford Series Fund, Inc. at December 31, 2013, the results of its operations for the year then ended, the changes in its net assets for each of the two years in the period then ended, and the financial highlights for each of the five years in the period then ended, in conformity with U.S. generally accepted accounting principles.
|
Minneapolis, MN
February 17, 2014
| 33 |
| Hartford Balanced HLS Fund |
| Directors and Officers (Unaudited) |
The Board of Directors of the Company appoints officers who are responsible for the day-to-day operations of the Fund and who execute policies formulated by the directors. Each director serves until his or her death, resignation, or retirement or until the next annual meeting of shareholders is held or until his or her successor is elected and qualifies.
Directors and officers who are employed by or who have a financial interest in The Hartford are considered “interested” persons of the Fund pursuant to the 1940 Act. Each officer and two of the Company’s directors, as noted in the chart below, are “interested” persons of the Fund. Each director serves as a director for The Hartford Mutual Funds, Inc., The Hartford Mutual Funds II, Inc., Hartford Series Fund, Inc., Hartford HLS Series Fund II, Inc., and as a trustee for The Hartford Alternative Strategies Fund, which, as of December 31, 2013, collectively consist of 91 funds. Correspondence may be sent to directors and officers c/o Hartford Funds, 5 Radnor Corporate Center, Suite 300, 100 Matsonford Road, Radnor, Pennsylvania 19087, except that correspondence to Mr. Annoni, Mr. Dressen and Ms. Quade may be sent to 500 Bielenberg Drive, Woodbury, Minnesota 55125.
The table below sets forth, for each director and officer, his or her name, year of birth, current position with the Company and date first elected or appointed to Hartford Series Fund, Inc. (“HSF”), and Hartford HLS Series Fund II, Inc. (“HSF2”), principal occupation, and, for directors, other directorships held. The Fund’s Statement of Additional Information contains further information on the directors and is available free of charge by calling 1-800-862-6668 or writing to Hartford HLS Funds, c/o Hartford Life Insurance Company, Hartford Life and Annuity Insurance Company, P.O. Box 14293, Lexington, KY 40512-4293.
Information on the aggregate remuneration paid to the directors of the Company can be found in the Statement of Operations herein. The Fund pays to The Hartford a portion of the Chief Compliance Officer’s compensation, but does not pay salaries or compensation to any of their other officers or directors who are employed by The Hartford.
Non-Interested Directors
Lynn S. Birdsong (1946) Director since 2003, Co-Chairman of the Investment Committee since 2005
Mr. Birdsong is a private investor. Mr. Birdsong currently serves as a Director of the Sovereign High Yield Investment Company (April 2010 to current). Mr. Birdsong currently serves as an Independent Director of Nomura Partners Funds, Inc. (formerly, The Japan Fund) (April 2003 to current). From 2003 to March 2005, Mr. Birdsong was an Independent Director of the Atlantic Whitehall Funds. From 1979 to 2002, Mr. Birdsong was a Managing Director of Zurich Scudder Investments, an investment management firm. During his employment with Scudder, Mr. Birdsong was an Interested Director of The Japan Fund. From January 1981 through December 2013, Mr. Birdsong was a partner in Birdsong Company, an advertising specialty firm.
Robert M. Gavin, Jr. (1940) Director since 2002 (HSF) and 1986 (HSF2), Chairman of the Board since 2004
Dr. Gavin is an educational consultant. Prior to September 1, 2001, he was President of Cranbrook Education Community and prior to July 1996, he was President of Macalester College, St. Paul, Minnesota.
Duane E. Hill (1945) Director since 2001 (HSF) and 2002 (HSF2), Chairman of the Nominating Committee since 2003
Mr. Hill is a Partner of TSG Ventures L.P., a private equity investment company. Mr. Hill is a former partner of TSG Capital Group, a private equity investment firm that served as sponsor and lead investor in leveraged buyouts of middle market companies.
Sandra S. Jaffee (1941) Director since 2005
Ms. Jaffee is the founder and Chief Executive Officer of a private company, Homeworks Concierge, LLC, which provides residential property management services in Westchester County, New York (January 2012 to present). Ms. Jaffee served as Chairman (2008 to 2009) and Chief Executive Officer of Fortent (formerly Searchspace Group), a leading provider of compliance/regulatory technology to financial institutions from August 2005 to August 2009. Ms. Jaffee currently serves as a member of the Board of Directors of Broadridge Financial Solutions as well as a Trustee of Muhlenberg College.
| 34 |
William P. Johnston (1944) Director since 2005, Chairman of the Compliance Committee since 2005
In June 2006, Mr. Johnston was appointed as Senior Advisor to The Carlyle Group, a global private equity and alternative asset investment firm and currently serves as an Operating Executive. In July 2006, Mr. Johnston was elected to the Board of Directors of MultiPlan, Inc. and served as a Director (July 2006 to August 2010). In August 2007, Mr. Johnston was elected to the Board of Directors of LifeCare Holdings, Inc. and served as a Director (August 2007 to June 2013). In February 2008, Mr. Johnston was elected to the Board of Directors of HCR-ManorCare, Inc. In May 2006, Mr. Johnston was elected to the Supervisory Board of Fresenius Medical Care AG & Co. KGaA, after its acquisition of Renal Care Group, Inc. in March 2006. Mr. Johnston joined Renal Care Group in November 2002 as a member of the Board of Directors and served as Chairman of the Board from March 2003 through March 2006. From 2002 through 2013, Mr. Johnston served as a Board member of the Georgia O’Keefe Museum. From September 1987 to December 2002, Mr. Johnston was with Equitable Securities Corporation (and its successors, SunTrust Equitable Securities and SunTrust Robinson Humphrey) serving in various investment banking and managerial positions, including Managing Director and Head of Investment Banking, Chief Executive Officer and Vice Chairman.
Phillip O. Peterson (1944) Director since 2002 (HSF) and 2000 (HSF2), Chairman of the Audit Committee since 2002
Mr. Peterson is a mutual fund industry consultant. He was a partner of KPMG LLP (an accounting firm) until July 1999. Mr. Peterson joined William Blair Funds in February 2007 as a member of the Board of Trustees. Mr. Peterson also joined the Board of Trustees of Symetra Variable Mutual Funds Trust as a trustee in February 2012.
Lemma W. Senbet (1946) Director since 2005
Dr. Senbet is the William E. Mayer Chair Professor of Finance and Founding Director, Center for Financial Policy, at the University of Maryland, Robert H. Smith School of Business. He was chair of the Finance Department of the University of Maryland, Robert H. Smith School of Business from 1998 to 2006. Since June 2013, he has been on leave from the University to serve as Executive Director of African Economic Research Consortium which focuses on economic policy research and training. Previously, he was a chaired professor of finance at the University of Wisconsin-Madison. Also, he was a Director of the Fortis Funds from March 2000 to July 2002. Dr. Senbet served as Director of the American Finance Association and President of the Western Finance Association. In 2006, Dr. Senbet was inducted Fellow of Financial Management Association International for his career-long distinguished scholarship and professional service.
Interested Directors and Officers
James E. Davey (1964) Director since 2012, President and Chief Executive Officer since 2010
Mr. Davey serves as Executive Vice President of Hartford Life Insurance Company (“HLIC”) and The Hartford Financial Services Group, Inc. Additionally, Mr. Davey serves as Chairman of the Board, Manager and Senior Managing Director of Hartford Funds Distributors, LLC (“HFD”). He also currently serves as Director, Chairman of the Board, President and Senior Managing Director of Hartford Administrative Services Company (“HASCO”). Mr. Davey also serves as Manager, Chairman of the Board and Senior Managing Director for Hartford Funds Management Company, LLC (“HFMC”). Mr. Davey joined The Hartford in 2002.
Lowndes A. Smith (1939) Director since 1996 (HSF) and 2002 (HSF2), Co-Chairman of the Investment Committee since 2005
Mr. Smith served as Vice Chairman of The Hartford from February 1997 to January 2002, as President and Chief Executive Officer of Hartford Life, Inc. from February 1997 to January 2002, and as President and Chief Operating Officer of The Hartford Life Insurance Companies from January 1989 to January 2002. Mr. Smith serves as a Director of White Mountains Insurance Group Ltd. (October 2003 to current); One Beacon Insurance (October 2006 to current); Symetra Financial (August 2007 to current) and is a Managing Director of Whittington Gray Associates (January 2007 to current).
Other Officers
Mark A. Annoni (1964) Vice President, Controller and Treasurer since 2012
Mr. Annoni currently serves as the Assistant Vice President of HLIC (February 2004 to present).
| 35 |
| Hartford Balanced HLS Fund |
| Directors and Officers (Unaudited) – (continued) |
Michael R. Dressen (1963) AML Compliance Officer since 2011
Mr. Dressen currently serves as Assistant Vice President of HLIC. He also serves as Chief Compliance Officer and AML Compliance Officer of HASCO and as AML Officer of HFD. Mr. Dressen has served in various positions within The Hartford and its subsidiaries in connection with the operation of the Hartford Funds.
Edward P. Macdonald (1967) Vice President, Secretary and Chief Legal Officer since 2005
Mr. Macdonald currently serves as Assistant Secretary, Executive Vice President and Deputy General Counsel of HFD, HASCO and HFMC. He also serves as Vice President of HLIC. Mr. Macdonald has served in various positions within The Hartford and its subsidiaries in connection with the operation of the Hartford Funds. Mr. Macdonald joined The Hartford in 2005.
Joseph G. Melcher (1973) Vice President and Chief Compliance Officer since 2013
Mr. Melcher currently serves as Executive Vice President of HASCO and HFD. Mr. Melcher also currently serves as Executive Vice President and Chief Compliance Officer of HFMC. Mr. Melcher has served in various positions within The Hartford and its subsidiaries in connection with the operation of the Hartford Funds since joining The Hartford in 2012. Prior to joining The Hartford, Mr. Melcher worked at Touchstone Investments, a member of the Western & Southern Financial Group, where he held the position of Vice President and Chief Compliance Officer from 2010 through 2012 and Assistant Vice President, Compliance from 2005 to 2010.
Vernon J. Meyer (1964) Vice President since 2006
Mr. Meyer currently serves as Senior Vice President of HLIC. He also currently serves as Managing Director and Chief Investment Officer of HFMC. Mr. Meyer has served in various positions within The Hartford and its subsidiaries in connection with the operation of the Hartford Funds. Mr. Meyer joined The Hartford in 2004.
Laura S. Quade (1969) Vice President since 2012
Ms. Quade currently serves as Vice President of HASCO and HFD. She is the Head of Operations of HASCO and also serves as Director, Enterprise Operations of HLIC. Ms. Quade has served in various positions within The Hartford and its subsidiaries in connection with the operation of the Hartford Funds.
Martin A. Swanson (1962) Vice President since 2010
Mr. Swanson currently serves as Vice President of HLIC. Mr. Swanson also serves as Managing Director, Chief Marketing Officer and Principal of HFD. Mr. Swanson has served in various positions within The Hartford and its subsidiaries in connection with the operation of the Hartford Funds.
HOW TO OBTAIN A COPY OF THE FUND’S PROXY VOTING POLICIES AND VOTING RECORDS
(UNAUDITED)
A description of the policies and procedures that the Fund uses to determine how to vote proxies relating to portfolio securities and information about how the Fund voted proxies relating to portfolio securities during the most recent twelve-month period ended June 30 are available (1) without charge, upon request, by calling 800-862-6668 and (2) on the SEC’s website at http://www.sec.gov.
QUARTERLY PORTFOLIO HOLDINGS INFORMATION (UNAUDITED)
The Fund files a complete schedule of portfolio holdings with the SEC for the first and third quarters of each fiscal year on Form N-Q. The Fund’s Forms N-Q are available (1) without charge, upon request, by calling 800-862-6668 and (2) on the SEC’s website at http://www.sec.gov. The Form N-Q may be reviewed and copied at the SEC’s Public Reference Room in Washington, DC. Information on the operation of the Public Reference Room may be obtained by calling 1-800-SEC-0330.
| 36 |
| Hartford Balanced HLS Fund |
| Expense Example (Unaudited) |
Your Fund's Expenses
As a shareholder of the Fund, you incur two types of costs: (1) transaction costs and (2) ongoing costs, including investment management fees, distribution and/or service (12b-1) fees, if any, and other fund expenses. This example is intended to help you understand your ongoing costs (in dollars) of investing in the Fund and to compare these costs with the ongoing costs of investing in other mutual funds. The example is based on an investment of $1,000 invested at the beginning of the period and held for the period of June 30, 2013 through December 31, 2013.
Actual Expenses
The first set of columns of the table below provides information about actual account values and actual expenses. You may use the information in this column, together with the amount you invested, to estimate the expenses that you paid over the period. Simply divide your account value by $1,000 (for example, an $8,600 account value divided by $1,000 = 8.6), then multiply the result by the number in the line under the heading entitled “Expenses Paid During Period” to estimate the expenses you paid on your account during this period.
Hypothetical Example for Comparison Purposes
The second set of columns of the table below provides information about hypothetical account values and hypothetical expenses based on the Fund’s actual expense ratio and an assumed rate of return of 5% per year before expenses, which is not the Fund’s actual return. The hypothetical account values and expenses may not be used to estimate the actual ending account balance or expenses you paid for the period. You may use this information to compare the ongoing costs of investing in the Fund and other funds. To do so, compare this 5% hypothetical example with the 5% hypothetical examples that appear in the shareholder reports of the other funds.
Please note that the expenses shown in the table are meant to highlight your ongoing costs only and do not reflect any transactional costs, such as sales charges (loads) and CDSC. Therefore, the second set of columns of the table is useful in comparing ongoing costs only, and will not help you determine the relative total costs of owning different funds. In addition, if these transactional costs were included, your costs would be higher. Expenses are equal to the Fund's annualized expense ratios multiplied by average account value over the period, multiplied by 184/365 (to reflect the one-half year period).
| Actual return | Hypothetical (5% return before expenses) | |||||||||||||||||||||||||||||||
| Beginning Account Value June 30, 2013 | Ending Account Value December 31, 2013 | Expenses paid during the period June 30, 2013 through December 31, 2013 | Beginning Account Value June 30, 2013 | Ending Account Value December 31, 2013 | Expenses paid during the period June 30, 2013 through December 31, 2013 | Annualized expense ratio | Days in the current 1/2 year | Days in the full year | ||||||||||||||||||||||||
| Class IA | $ | 1,000.00 | $ | 1,104.60 | $ | 3.43 | $ | 1,000.00 | $ | 1,021.94 | $ | 3.30 | 0.65 | % | 184 | 365 | ||||||||||||||||
| Class IB | $ | 1,000.00 | $ | 1,103.20 | $ | 4.76 | $ | 1,000.00 | $ | 1,020.68 | $ | 4.57 | 0.90 | % | 184 | 365 | ||||||||||||||||
| 37 |
| Hartford Balanced HLS Fund |
| Approval of Investment Management and Investment Sub-Advisory Agreements (Unaudited) |
Section 15(c) of the Investment Company Act of 1940, as amended (the “1940 Act”), requires that each mutual fund’s board of directors, including a majority of those directors who are not “interested persons” of the mutual fund, as defined in the 1940 Act (the “Independent Directors”), annually review and consider the continuation of the mutual fund’s investment advisory and sub-advisory agreements. At its meeting held on August 6-7, 2013, the Board of Directors (the “Board”) of Hartford Series Fund, Inc., including each of the Independent Directors, unanimously voted to approve the continuation of the investment management agreement for Hartford Balanced HLS Fund (the “Fund”) with Hartford Funds Management Company, LLC (“HFMC”) and the continuation of the investment sub-advisory agreement between HFMC and the Fund’s sub-adviser, Wellington Management Company, LLP (the “Sub-adviser,” and together with HFMC, the “Advisers”) (collectively, the “Agreements”).
In the months preceding the August 6-7, 2013 meeting, the Board requested, received, and reviewed written responses from the Advisers to questions posed to them on behalf of the Independent Directors and supporting materials relating to those questions and responses. The Board considered information furnished to the Board at its meetings throughout the year, as well as information specifically prepared in connection with the annual approval of the Agreements at the Board’s meetings held on June 18-19, 2013 and August 6-7, 2013. Information provided to the Board at its meetings throughout the year included, among other things, reports on Fund performance, legal and compliance matters, sales and marketing activity, shareholder services, and the other services provided to the Fund by the Advisers and their affiliates. The Board also received in-person presentations by Fund officers and representatives of HFMC at the Board’s meetings on June 18-19, 2013 and August 6-7, 2013 concerning the Agreements.
The Independent Directors, advised by independent legal counsel, engaged two service providers to assist them with evaluating the Agreements with respect to the Fund. Lipper Inc. (“Lipper”), an independent provider of investment company data, was retained to provide the Board with reports on how the Fund’s contractual management fees, actual management fees, other non-management fees, overall expense ratios and investment performance compared to those of mutual funds with similar investment objectives. The Independent Directors also engaged an independent financial services consulting firm (the “Consultant”) to assist them in evaluating the Fund’s management fees, sub-advisory fees, other non-management fees, overall expense ratios and investment performance. In addition, the Consultant reviewed the profitability calculations utilized by HFMC in connection with the continuation of the investment management agreement.
In determining whether to continue the Agreements for the Fund, the members of the Board reviewed and evaluated information and factors they believed to be relevant and appropriate in light of the information that the Board deemed necessary and appropriate through the exercise of its reasonable business judgment. While individual members of the Board may have weighed certain factors differently, the Board’s determination to continue the Agreements was based on a comprehensive consideration of all information provided to the Board throughout the year and specifically with respect to the continuation of the Agreements. A more detailed discussion of the factors the Board considered with respect to its approval of the Agreements is provided below.
Nature, Extent, and Quality of Services Provided by the Advisers
The Board requested and considered information concerning the nature, extent, and quality of the services provided to the Fund by the Advisers. The Board considered, among other things, the terms of the Agreements and the range of services provided by the Advisers. The Board considered the Advisers’ professional personnel who provide services to the Fund, including each Adviser’s ability and experience in attracting and retaining qualified personnel to service the Fund. The Board considered each Adviser’s reputation and overall financial strength, as well as its willingness to consider and implement organizational and operational changes designed to improve services to the Fund. In addition, the Board considered the quality of each Adviser’s communications with the Board and responsiveness to Board inquiries.
The Board also requested and evaluated information concerning each Adviser’s regulatory and compliance environment. In this regard, the Board requested and reviewed information on each Adviser’s compliance policies and procedures, compliance history, and a report from the Fund’s Chief Compliance Officer on each Adviser’s compliance with applicable laws and regulations, including responses to regulatory developments and compliance issues raised by regulators. The Board also noted the Advisers’ support of the Fund’s compliance control structure, particularly the resources devoted by the Advisers in support of the Fund’s obligations pursuant to Rule 38a-1 under the 1940 Act.
| 38 |
With respect to HFMC, the Board noted that under the Agreements, HFMC is responsible for the management of the Fund, including overseeing fund operations and service providers, as well as investment advisory services in connection with selecting, monitoring and supervising the Sub-adviser. The Board considered HFMC’s ongoing monitoring of people, process and performance, including its quarterly reviews of each of the Hartford Funds, semi-annual meetings with the leaders of each Fund’s portfolio management team, and oversight of the Funds’ approximately 40 portfolio managers. The Board recognized that HFMC has demonstrated a record of making changes to the management and/or strategies of the Funds when warranted. The Board considered HFMC’s oversight of the Sub-adviser’s investment approach and results, process for monitoring best execution of portfolio trades by the Sub-adviser, and approach to risk management with respect to the Fund and the service providers to the Fund. The Board also considered HFMC’s oversight of compliance with the Fund’s objective and policies as well as with applicable laws and regulations, noting that regulatory and other developments had over time led to an increase in the scope of HFMC’s services in this regard.
In addition, the Board considered HFMC’s ongoing commitment to review and rationalize the Hartford Funds product line-up and the expenses that HFMC had incurred in connection with fund combinations in recent years. The Board considered that HFMC or its affiliates are responsible for providing the Fund’s officers. The Board also noted that Hartford Life Insurance Company (“HLIC”) provides administrative services to the Fund. The Board considered its experiences with HFMC and HLIC with respect to each of these services.
With respect to the Sub-adviser, who provides day-to-day portfolio management services, the Board considered the quality of the Fund’s portfolio managers, the Sub-adviser’s other investment personnel, its investment philosophy and process, investment research capabilities and resources, performance record, trade execution capabilities and experience. The Board considered the experience of the Fund’s portfolio managers, the number of accounts managed by the portfolio managers, and the Sub-adviser’s method for compensating the portfolio managers.
Based on these considerations, the Board concluded that it was satisfied with the nature, extent and quality of the services provided to the Fund by HFMC and the Sub-adviser.
Performance of the Fund and the Advisers
The Board considered the investment performance of the Fund. In this regard, the Board reviewed the performance of the Fund over different time periods presented in the materials and evaluated HFMC’s analysis of the Fund’s performance for these time periods. The Board considered information and materials provided to the Board by the Advisers concerning Fund performance, as well as information from Lipper comparing the investment performance of the Fund to an appropriate benchmark and universe of peer funds. The Board noted that the Fund’s performance was in the 3rd quintile of its performance universe for the 1-year period, the 2nd quintile for the 3-year period and the 1st quintile for the 5-year period. The Board also noted that the Fund’s performance was above its benchmark for the 1- and 5-year periods and in line with its benchmark for the 3-year period.
The Board considered the detailed investment analytics reports provided by Hartford Funds’ Investment Advisory Group throughout the year. These reports include, among other things, information on the Fund’s gross and net returns, the Fund’s investment performance relative to an appropriate benchmark and peer group, various statistics concerning the Fund’s portfolio, and a narrative summary of various factors affecting Fund performance. The Board considered the Advisers’ cooperation with the Investment Committee, which assists the Board in evaluating the performance of the Fund at periodic meetings throughout the year. The Board also considered the analysis provided by the Consultant relating to the Fund’s performance track record.
In light of all the considerations noted above, the Board concluded that it had continued confidence in HFMC’s and the Sub-adviser’s overall capabilities to manage the Fund.
Costs of the Services and Profitability of the Advisers
The Board reviewed information regarding HFMC’s cost to provide investment management and related services to the Fund and HFMC’s profitability, both overall and for the Fund, on a pre-tax basis without regard to distribution expenses. The Board also requested and reviewed information about the profitability to HFMC and its affiliates from all services provided to the Fund and all aspects of their relationship with the Fund. The Board also requested and received information relating to the operations and profitability of the Sub-adviser.
| 39 |
| Hartford Balanced HLS Fund |
| Approval of Investment Management and Investment Sub-Advisory Agreements (Unaudited) – (continued) |
The Board considered the Consultant’s review of the profitability calculations utilized by HFMC in connection with the continuation of the investment management agreement, noting the Consultant’s view that Hartford Funds’ process for calculating and reporting Fund profitability is reasonable. In this regard, the Board noted that the Consultant had previously performed a full review of this process and reported that such process is sound and well within common industry practice.
Based on these considerations, the Board concluded that the profits anticipated to be realized by the Advisers and their affiliates from their relationships with the Fund would not be excessive.
Comparison of Fees and Services Provided by the Advisers
The Board considered comparative information with respect to the management fees to be paid by the Fund to HFMC and the total expense ratios of the Fund. The Board also considered comparative information with respect to the sub-advisory fees to be paid by HFMC to the Sub-adviser. In this regard, the Board requested and reviewed information from HFMC and the Sub-adviser relating to the management and sub-advisory fees, including the sub-advisory fee schedule for the Fund, and total operating expenses for the Fund. The Board considered that the management fee for the Fund includes the fee paid to HLIC for providing certain administrative services to the Fund. With respect to the sub-advisory fee schedule, the Board considered representations from HFMC and the Sub-adviser that the Sub-adviser’s fees were negotiated at arm’s length. The Board also reviewed information from Lipper comparing the Fund’s contractual management fees, actual management fees and overall expense ratios relative to a group of funds selected by Lipper, in consultation with the Consultant, and a broader universe of funds selected by Lipper. The Board noted that the Fund’s contractual management fee, actual management fee and total expenses (less 12b-1 and shareholder service fees) were in the 3rd quintile of its expense group.
While the Board recognized that comparisons between the Fund and peer funds are imprecise, given the differing service levels and characteristics of mutual funds and the different business models and cost structures of the Advisers, the comparative information provided by Lipper assisted the Board in evaluating the reasonableness of the Fund’s management and sub-advisory fees and total operating expenses. In addition, the Board considered the analysis and recommendations of the Consultant relating to the Fund’s management and sub-advisory fees and total operating expenses.
Based on these considerations, the Board concluded that the Fund’s fees and total operating expenses, in conjunction with the information about quality of services, profitability, economies of scale, and other matters discussed, were reasonable in light of the services provided.
Economies of Scale
The Board requested and considered information regarding the Advisers’ realization of economies of scale with respect to the Fund and whether the fee levels reflect these economies of scale for the benefit of the Fund’s shareholders. The Board reviewed the breakpoints in the management fee schedule for the Fund, which reduce fee rates as Fund assets grow over time. The Board recognized that a fund with assets beyond the last breakpoint level will continue to benefit from economies of scale because additional assets are charged the lowest breakpoint fee resulting in lower overall effective management fee rates. The Board also recognized that a fee schedule that reaches a lower breakpoint quickly provides shareholders with the benefit of anticipated or potential economies of scale. The Board noted the effect of the sale and run-off of the variable annuity business on the HLS Funds.
The Board reviewed and evaluated materials from Lipper showing how management fee schedules of peer funds reflect economies of scale for the benefit of shareholders as a peer fund’s assets hypothetically increase over time. Based on information provided by HFMC, Lipper, and the Consultant, the Board recognized that there is no uniform methodology for establishing breakpoints or uniform pattern in asset levels that trigger breakpoints or the amounts of breakpoints triggered.
After considering all of the information available to it, the Board concluded that it was satisfied with the extent to which economies of scale would be shared for the benefit of the Fund’s shareholders based on currently available information and the effective advisory fees and expense ratios for the Fund at its current and reasonably anticipated asset levels. The Board noted, however, that it would continue to monitor future growth in Fund assets and the appropriateness of additional breakpoints.
| 40 |
Other Benefits
The Board considered other benefits to the Advisers and their affiliates from their relationships with the Fund, including the role of the Fund in supporting the variable life insurance and variable annuity products offered by The Hartford.
The Board reviewed information noting that HLIC, an affiliate of HFMC, receives fees for providing certain administrative services to the Fund and that HFMC receives fees for fund accounting and related services from the Fund. The Board considered information on profits to HLIC and HFMC for such services. The Board also considered that Hartford Administrative Services Company (“HASCO”), the Fund’s transfer agent and an affiliate of HFMC, receives transfer agency compensation from the Fund, and the Board reviewed information on the profitability of the Fund’s transfer agency function to HASCO. The Board considered information provided by HASCO indicating that the transfer agent fees charged by HASCO to the Fund were fair and reasonable based on publicly available information.
The Board also considered that Hartford Funds Distributors, LLC (“HFD”), an affiliate of HFMC, serves as principal underwriter of the Fund. As principal underwriter, HFD receives 12b-1 fees from the Fund. The Board also noted that certain affiliates of HFD distribute shares of the Fund and receive compensation in that connection.
The Board considered benefits to the Sub-adviser from its use of the Fund’s brokerage commissions to obtain soft dollar research, and representations from HFMC and the Sub-adviser that the Sub-adviser would not make any revenue-sharing payments or any other type of distribution payments to HFMC or its affiliates.
The Board considered the benefits to shareholders of being part of the Hartford Funds family of funds. The Board considered HFMC’s efforts to provide investors in the family with a broad range of investment styles and asset classes.
* * * *
Based upon its review of these various factors, among others, the Board concluded that it is in the best interests of the Fund and its shareholders for the Board to approve the Agreements for an additional year. In reaching this decision, the Board did not assign relative weights to the factors discussed above or deem any one or group of them to be controlling in and of themselves. In connection with their deliberations, the Independent Directors met separately in executive session on several occasions, with independent legal counsel and the Consultant, to review the relevant materials and consider their responsibilities under relevant laws and regulations.
| 41 |
| Hartford Balanced HLS Fund |
| Main Risks (Unaudited) |
The main risks of investing in the Fund are described below.
Market, Selection, and Strategy Risk: The Fund’s share price may fluctuate due to market risk and/or security selections that may underperform the market or relevant benchmarks. If the sub-adviser’s investment strategy does not perform as expected, the Fund could underperform its peers or lose money. There is no guarantee the Fund will achieve its stated objective.
Asset Allocation Strategy Risk: The portfolio manager’s asset allocation strategy may not always work as intended, and asset allocation does not guarantee better performance or reduce the risk of investment loss.
Fixed Income Risk: The Fund is subject to interest rate risk (the risk that the value of an investment decreases when interest rates rise) and credit risk (the risk that the issuing company of a security is unable to pay interest and principal when due) and call risk (the risk that an investment may be redeemed early).
Mortgage-Backed Securities Risk: Mortgage-backed securities are subject to interest rate risk, credit risk, prepayment risk, extension risk, and the risk that an investment’s value may be reduced or become worthless if it receives interest or income payments only after other investments in the same pool.
| 42 |
THIS PRIVACY POLICY IS NOT PART OF THIS REPORT
Privacy Policy and Practices of The Hartford Financial Services Group, Inc. and its Affiliates
(herein called “we, our, and us”)
This Privacy Policy applies to our United States Operations
We value your trust. We are committed to the responsible: a) management; b) use; and c) protection; of Personal Information. This notice describes how we collect, disclose, and protect Personal Information.
We collect Personal Information to: a) service your Transactions with us; and b) support our business functions.
We may obtain Personal Information from: a) You; b) your Transactions with us; and c) third parties such as a consumer-reporting agency.
Based on the type of product or service You apply for or get from us, Personal Information such as: a) your name; b) your address; c) your income; d) your payment; or e) your credit history; may be gathered from sources such as applications, Transactions, and consumer reports.
To serve You and service our business, we may share certain Personal Information. We will share Personal Information, only as allowed by law, with affiliates such as: a) our insurance companies; b) our employee agents; c) our brokerage firms; and d) our administrators.
As allowed by law, we may share Personal Financial Information with our affiliates to: a) market our products; or b) market our services; to You without providing You with an option to prevent these disclosures. | We may also share Personal Information, only as allowed by law, with unaffiliated third parties including:
When allowed by law, we may share certain Personal Financial Information with other unaffiliated third parties who assist us by performing services or functions such as:
We, and third parties we partner with, may track some of the pages You visit through the use of: a) cookies; b) pixel tagging; or c) other technologies; and currently do not process or comply with any web browser’s “do not track” signal or similar mechanism that indicates a request to disable online tracking of individual users who visit our websites or use our services.
We will not sell or share your Personal Financial Information with anyone for purposes unrelated to our business functions without offering You the opportunity to:
We only disclose Personal Health Information with:
Our employees have access to Personal Information in the course of doing their jobs, such as: |
We use manual and electronic security procedures to maintain: a) the confidentiality; and b) the integrity of; Personal Information that we have. We use these procedures to guard against unauthorized access.
Some techniques we use to protect Personal Information include: a) secured files; b) user authentication; c) encryption; d) firewall technology; and e) the use of detection software.
We are responsible for and must: a) identify information to be protected; b) provide an adequate level of protection for that data; c) grant access to protected data only to those people who must use it in the performance of their job-related duties. Employees who violate our Privacy Policy will be subject to discipline, which may include ending their employment with us.
At the start of our business relationship, we will give You a copy of our current Privacy Policy.
We will also give You a copy of our current Privacy Policy once a year if You maintain a continuing business relationship with us.
We will continue to follow our Privacy Policy regarding Personal Information even when a business relationship no longer exists between us. | As used in this Privacy Notice:
Application means your request for our product or service.
Personal Financial Information means financial information such as:
Personal Health Information means health information such as:
Personal Information means information that identifies You personally and is not otherwise available to the public. It includes:
Transaction means your business dealings with us, such as:
You means an individual who has given us Personal Information in conjunction with: |
This Privacy Policy is being provided on behalf of the following affiliates of The Hartford Financial Services Group, Inc.:
1stAGChoice, Inc.; Access CoverageCorp, Inc.; Access CoverageCorp Technologies, Inc.; American Maturity Life Insurance Company; Archway 60 R, LLC; Business Management Group, Inc.; Catalyst360, LLC; Champlain Life Reinsurance Company; DMS R, LLC; Eloy R, LLC; Ersatz Corporation; First State Insurance Company; Hartford Accident and Indemnity Company; Hartford Administrative Services Company; Hartford Casualty General Agency, Inc.; Hartford Casualty Insurance Company; Hartford-Comprehensive Employee Benefit Service Company; Hartford Equity Sales Company, Inc.; Hartford Fire General Agency, Inc.; Hartford Fire Insurance Company; Hartford Funds Management Company, LLC; Hartford Funds Management Group, Inc.; Hartford HLS Series Fund II, Inc.; Hartford Insurance Company of Illinois; Hartford Insurance Company of the Midwest; Hartford Insurance Company of the Southeast; Hartford Integrated Technologies, Inc.; Hartford International Life Reassurance Corporation; Hartford Funds Distributors, LLC; Hartford Investment Management Company; Hartford Life and Accident Insurance Company; Hartford Life and Annuity Insurance Company; Hartford Life Insurance Company; Hartford Life Private Placement, LLC; Hartford Lloyd’s Corporation; Hartford Lloyd’s Insurance Company; Hartford Mezzanine Investors I, LLC; Hartford Residual Market, L.C.C.; Hartford Retirement Services, LLC; Hartford Securities Distribution Company, Inc.; Hartford Series Fund, Inc.; Hartford Specialty Insurance Services of Texas, LLC; Hartford Strategic Investments, LLC; Hartford Underwriters Insurance Company; Hartford Technology Services Company, L.L.C.; Hartford of Texas General Agency, Inc.; Hartford Underwriters General Agency, Inc.; HARTRE Company, L.C.C.; HL Investment Advisors, LLC; HLA LLC; Horizon Management Group, LLC; HRA Brokerage Services, Inc.; Lanidex Class B, LLC; M-CAP Insurance Agency, LLC; New England Insurance Company; New England Reinsurance Corporation; Nutmeg Insurance Agency, Inc.; Nutmeg Insurance Company; Pacific Insurance Company, Limited; Planco, LLC: Property and Casualty Insurance Company of Hartford; Revere R, LLC; RVR R, LLC; Sentinel Insurance Company, Ltd.; Sunstone R, LLC; Symphony R, LLC; The Evergreen Group Incorporated; The Hartford Alternative Strategies Fund; The Hartford Mutual Funds, Inc.; The Hartford Mutual Funds II, Inc.; Trumbull Flood Management, L.L.C.; Trumbull Insurance Company; Twin City Fire Insurance Company; White River Life Reinsurance Company.
HPP Revised December 2013
HARTFORD HLS FUNDS
c/o The Hartford Wealth Management - Global Annuities
P.O. Box 14293
Lexington, KY 40512-4293
HARTFORDFUNDS
hartfordfunds.com
Hartford Series Fund, Inc. is underwritten and distributed by Hartford Funds Distributors, LLC.
Hartford Series Fund, Inc. inception dates range from 1977 to date. Hartford Series Fund, Inc. is not a subsidiary of The Hartford Financial Services Group, Inc. ("The Hartford") but is underwritten, distributed by and advised by subsidiaries of The Hartford. Investments in Hartford Series Fund, Inc. are not guaranteed by The Hartford or any other entity.
This report is submitted for the general information of the shareholders of the Funds. It is not authorized for distribution unless preceded or accompanied by a current prospectus for the Funds.
Investors should carefully consider the investment objectives, risks, charges, and expenses of Hartford Funds before investing. This and other information can be found in the prospectus and summary prospectus, which can be obtained by calling 888-843-7824 (retail) or 877-836-5854 (institutional). Investors should read them carefully before they invest.
HLSAR-B13 2-14 115336 Printed in U.S.A ©2013 The Hartford, Hartford, CT 06115
HARTFORDFUNDS
| HARTFORD CAPITAL
APPRECIATION HLS FUND
2013 Annual Report
|
A MESSAGE FROM THE PRESIDENT
Dear Fellow Shareholders:
Thank you for investing in Hartford HLS Funds.
Market Review
U.S. equities (as represented by the S&P 500 Index) generated their strongest year since 1997 in 2013, rising 32.39% for the year. During the fourth quarter, equities rose without looking back, pushing the S&P 500 Index and the Dow Jones Industrial Average to new all-time highs. Despite previously cheering delays to quantitative-easing tapering, the stock market received an additional boost at the end of the year following the U.S. Federal Reserve’s (Fed) announcement of a $10-billion-a-month reduction in bond purchases beginning in January.
The Fed’s decision to begin tapering its bond purchases is generally considered a vote of confidence in the recovering U.S. economy. Consumer spending has stabilized, the housing market is showing steady improvement, the unemployment rate is slowly declining and economic growth clocked in at a healthy 4.1% in the third quarter. Equities have also recovered since the market low in March 2009: The S&P 500 Index has gained 173% from the market low through December 31, 2013.
Signs of improvement are also visible outside the U.S. Europe appears to have begun its own economic recovery, and emerging markets have reversed their recent lackluster performance. Fiscal policy continues to wield significant influence in today’s economy and central banks across the globe are maintaining their accommodative stances, including the appointment of Janet Yellen, who is widely expected to continue current monetary policies, to succeed Ben Bernanke as U.S. Federal Reserve chairman.
It’s important to stay abreast of domestic and international economic developments while balancing your individual investment goals. Meeting with your financial advisor on a regular basis to examine your current investment strategy can help you determine whether you are on the right track:
| • | Is your portfolio fully diversified with an appropriate mix of stocks and bonds? |
| • | Is your portfolio incorporating both domestic and international holdings to take advantage of the global economic recovery? |
| • | Are your investments still in line with your risk tolerance and investment time horizon? |
Your financial advisor can help you choose options within our fund family to navigate today’s markets with confidence.
Thank you again for investing with Hartford HLS Funds.
James Davey
President
Hartford HLS Funds
1The S&P 500 Index is a market capitalization-weighted price index composed of 500 widely held common stocks.
2The Dow Jones Industrial Average is an unmanaged, price-weighted index of 30 of the largest, most widely held stocks traded on the New York Stock Exchange.
Hartford Capital Appreciation HLS Fund
Table of Contents
This report is prepared for the general information of contract owners and qualified retirement plan participants. It is not an offer of contracts or of qualified retirement plans. It should not be used in connection with any offer, except in conjunction with the appropriate product prospectus which contains all pertinent information including the applicable sales, administrative and other charges.
The views expressed in the Fund’s Manager Discussion under ‘‘Why did the Fund perform this way?’’ and ‘‘What is the outlook?’’ are views of the Fund’s sub-adviser and portfolio management team through the end of the period and are subject to change based on market and other conditions. The Fund’s Manager Discussion is for informational purposes only and does not represent an offer, recommendation or solicitation to buy, hold or sell any security. The specific securities identified and described, if any, do not represent all of the securities purchased or sold and you should not assume that investments in the securities identified and discussed will be profitable.
| Hartford Capital Appreciation HLS Fund inception 04/02/1984 |
| (sub-advised by Wellington Management Company, LLP) |
| Investment objective – Seeks growth of capital. |
Performance Overview 12/31/03 - 12/31/13

The chart above represents the hypothetical growth of a $10,000 investment in Class IA. Growth results in classes other than Class IA will vary from what is seen above due to differences in the expenses charged to those share classes.
Average Annual Total Returns (as of 12/31/13)
| 1 Year | 5 Years | 10 Years | ||||||||||
| Capital Appreciation IA | 39.08 | % | 19.87 | % | 9.73 | % | ||||||
| Capital Appreciation IB | 38.72 | % | 19.57 | % | 9.45 | % | ||||||
| Russell 3000 Index | 33.55 | % | 18.71 | % | 7.88 | % | ||||||
| S&P 500 Index | 32.39 | % | 17.94 | % | 7.41 | % | ||||||
PERFORMANCE DATA QUOTED REPRESENTS PAST PERFORMANCE AND DOES NOT GUARANTEE FUTURE RESULTS. The investment return and principal value of the investment will fluctuate so that investors’ shares, when redeemed, may be worth more or less than their original cost. Current performance may be lower or higher than the performance data quoted. To obtain performance data current to the most recent month-end, please visit our website at www.hartfordfunds.com.
Total returns presented above were calculated using the Fund’s net asset value available to shareholders for sale or redemption of Fund shares on December 31, 2013, which may exclude investment transactions as of this date. All share class returns assume the reinvestment of all distributions at net asset value and the deduction of all fund expenses.
Russell 3000 Index is an unmanaged index that measures the performance of the 3,000 largest U.S. companies based on total market capitalization.
S&P 500 Index is a market capitalization-weighted price index composed of 500 widely held common stocks.
You cannot invest directly in an index.
As of the Fund's current prospectus dated May 1, 2013, the total annual operating expense ratios for Class IA and Class IB were 0.67% and 0.92%, respectively. Actual expenses may be higher. Please see the accompanying Financial Highlights for expense ratios for the year ended December 31, 2013.
All investments are subject to risk including the possible loss of principal. For a discussion of the Fund’s risks, please see the Main Risks section of this report. For more detailed information on the risks associated with an investment in the Fund, please see the prospectus.
The chart and table do not reflect the deductions of taxes, sales charges or other fees which may be applied at the variable life insurance, variable annuity or qualified retirement plan product level. Any such additional sales charges or other fees or expenses would lower the contract’s or plan’s performance.
| 2 |
| Hartford Capital Appreciation HLS Fund |
| Manager Discussion |
| December 31, 2013 (Unaudited) |
| Portfolio Managers | ||
| Saul J. Pannell, CFA | Kent M. Stahl, CFA | Peter I. Higgins, CFA |
| Senior Vice President and Equity Portfolio Manager | Senior Vice President and Director, Investments and Risk Managment | Senior Vice President and Equity Portfolio Manager |
| Paul E. Marrkand, CFA | Nicolas M. Choumenkovitch | Donald J. Kilbride |
| Senior Vice President and Equity Portfolio Manager | Senior Vice President and Equity Portfolio Manager | Senior Vice President and Equity Portfolio Manager |
| Stephen Mortimer | David W. Palmer, CFA | Francis J. Boggan, CFA |
| Senior Vice President and Equity Portfolio Manager | Senior Vice President and Equity Portfolio Manager | Senior Vice President and Equity Portfolio Manager |
| Gregg R. Thomas, CFA* | ||
| Vice President and Director, Risk Management | ||
| *Appointed as a Portfolio Manager for the Fund as of 2013. | ||
How did the Fund perform?
The Class IA shares of the Hartford Capital Appreciation HLS Fund returned 39.08% for the twelve-month period ended December 31, 2013, outperforming the Fund’s benchmark, the Russell 3000 Index, which returned 33.55% for the same period. The Fund also outperformed the 32.47% average return of the Variable Products-Underlying Funds Lipper Multi-Cap Core Funds peer group, a group of funds with investment strategies similar to those of the Fund.
Why did the Fund perform this way?
U.S. equities reached another all-time high in December and finished 2013 with a gain of 33.6%, as measured by the Russell 3000 Index. The rally in U.S. equities began on the first trading day of the year after a last-minute compromise by the U.S. Congress averted the fiscal cliff. Optimism surrounding the fiscal reprieve was furthered during the first quarter by better-than-expected corporate earnings, a robust housing market, and a steadily improving employment picture. Solid gains in April and the first part of May paused following comments by U.S. Federal Reserve (Fed) Chairman Ben Bernanke that suggested the Fed might begin to slow quantitative easing sooner than investors anticipated. Nonetheless, equities resumed their ascent in the third quarter as the surprising “no taper” decision by the Federal Open Market Committee eased near-term concerns about rapidly rising interest rates derailing the recovery. Additionally, accommodative rhetoric from the European Central Bank, along with encouraging data in China and further evidence of a European economic recovery, contributed to a broad-based global equity rally that extended through the end of the year. In December, the year ended with an optimistic tone as investors cheered the elimination of two market overhangs: the timing of Fed tapering and the threat of another U.S. government shutdown in early 2014.
Within the Russell 3000 Index, all ten sectors posted positive gains. Consumer Discretionary (+45%), Health Care (+43%) and Industrials (+42%) led the index higher while Telecommunication Services (+15%), Utilities (+15%) and Materials (+24%) lagged on a relative basis.
The Fund outperformed its benchmark primarily as a result of strong stock selection in the Financials, Information Technology, and Consumer Discretionary sectors. Stock selection was weaker within the Materials and Energy sectors. Sector allocation, a result of our bottom-up security selection process, also contributed to relative performance. In particular, an overweight allocation to Consumer Discretionary and an underweight to Utilities were additive.
The top contributors to relative and absolute performance during the quarter included Best Buy (Consumer Discretionary), Micron Technology (Information Technology) and Gilead Sciences (Health Care). Shares of Best Buy, a U.S.-based electronics retailer, rose during the period on strong earnings that beat consensus expectations. Shares of Micron Technology, a semiconductor manufacturer specializing in NAND Flash, DRAM, and NOR Flash memory devices, rose after a fire at a competitor’s factory in China increased the likelihood of improving DRAM and NAND prices in an already supply-constrained environment. Shares of Gilead Sciences, a biopharmaceutical company, moved higher based on strong sales for the firm’s antiviral drug franchise.
The largest detractors from relative returns were Barrick Gold (Materials), Cobalt International Energy (Energy), and Teva Pharmaceuticals (Health Care). Barrick Gold, a Canada-based gold exploration and mining company, saw shares decline as the spot price of gold continued to deteriorate and miners reduced earnings forecasts. Shares of Cobalt International
| 3 |
| Hartford Capital Appreciation HLS Fund |
| Manager Discussion – (continued) |
| December 31, 2013 (Unaudited) |
Energy, an offshore energy explorer, fell as a result of disappointing well test results at the company's Lontra well off the coast of Angola. Shares of Teva Pharmaceuticals, an Israel-based pharmaceutical company, declined after the unexpected announcement that CEO Jeremy Levin was stepping down. Positions in Apple (Information Technology) and JC Penney (Consumer Discretionary) were also significant detractors from absolute performance.
Derivatives are not used in a significant manner in this Fund and did not have a material impact on performance during the period.
What is the outlook?
In the U.S., we continue to expect positive gross domestic product (GDP) growth of about 3% for 2014 as the fiscal drag reverses. We estimate that fiscal policies reduced GDP by 1.5% in 2013 (and some of these effects may linger in early 2014), but importantly state and local governments now appear to be moving back to expansionary mode. The employment picture continues to improve and housing should remain constructive, in our view. Housing paused recently in part due to the uptick in mortgage rates but we believe it will reaccelerate in the spring selling season. While higher interest rates can be a hurdle to further recovery, they are still low historically and early signs of wage growth should boost consumer confidence. The Fed is expected to remain accommodative throughout the year and we view the Fed’s decision to start unwinding quantitative easing as a healthy sign for the economy.
We have been encouraged by recent data out of Europe that suggests Europe has stabilized. We are watching France as an ongoing risk. France is Europe’s second largest economy and government policies have so far failed to revive growth as GDP is still contracting. Data out of Japan has been positive as Prime Minister Shinzo Abe’s bid to revitalize the economy appears to be rekindling growth after decades of economic malaise.
As a result of our bottom-up investment process, at the end of the period the Fund was most overweight in the Consumer Discretionary, Industrials, and Health Care sectors relative to the benchmark. The Fund was most underweight in the Consumer Staples and Utilities sectors at the end of the period relative to the benchmark.
Diversification by Sector
as of December 31, 2013
| Sector | Percentage of Net Assets | |||
| Equity Securities | ||||
| Consumer Discretionary | 18.0 | % | ||
| Consumer Staples | 5.5 | |||
| Energy | 7.4 | |||
| Financials | 16.1 | |||
| Health Care | 13.3 | |||
| Industrials | 13.0 | |||
| Information Technology | 18.1 | |||
| Materials | 3.8 | |||
| Services | 1.0 | |||
| Utilities | 1.0 | |||
| Total | 97.2 | % | ||
| Fixed Income Securities | ||||
| Energy | 0.0 | % | ||
| Total | 0.0 | % | ||
| Purchased Options | 0.0 | |||
| Short-Term Investments | 2.3 | |||
| Other Assets and Liabilities | 0.5 | |||
| Total | 100.0 | % | ||
A sector may be comprised of several industries. For Fund compliance purposes, the Fund may not use the same classification system and these sector classifications are used for reporting ease.
| 4 |
| Hartford Capital Appreciation HLS Fund |
| Schedule of Investments |
| December 31, 2013 |
| (000’s Omitted) |
| Shares or Principal Amount | Market Value ╪ | |||||||
| COMMON STOCKS - 96.2% | ||||||||
| Automobiles and Components - 3.0% | ||||||||
| 2,344 | Brilliance China Automotive Holdings, Ltd. | $ | 3,829 | |||||
| 341 | Dana Holding Corp. | 6,690 | ||||||
| 6,199 | Ford Motor Co. | 95,649 | ||||||
| 225 | General Motors Co. ● | 9,200 | ||||||
| 1,817 | Goodyear (The) Tire & Rubber Co. | 43,329 | ||||||
| 198 | Harley-Davidson, Inc. | 13,734 | ||||||
| 38 | Hyundai Motor Co., Ltd. ● | 8,421 | ||||||
| 1,762 | Isuzu Motors Ltd. | 10,990 | ||||||
| 96 | Tenneco Automotive, Inc. ● | 5,449 | ||||||
| 549 | TRW Automotive Holdings Corp. ● | 40,809 | ||||||
| 238,100 | ||||||||
| Banks - 4.6% | ||||||||
| 2,512 | Banco Bilbao Vizcaya Argentaria S.A. | 31,071 | ||||||
| 134 | BNP Paribas | 10,460 | ||||||
| 233 | Erste Group Bank AG | 8,114 | ||||||
| 2,199 | Grupo Financiero Banorte S.A.B. de C.V. | 15,390 | ||||||
| 1,078 | ICICI Bank Ltd. | 19,271 | ||||||
| 1,144 | Kasikornbank PCL | 5,468 | ||||||
| 10,891 | Mitsubishi UFJ Financial Group, Inc. | 72,307 | ||||||
| 1,050 | PNC Financial Services Group, Inc. | 81,453 | ||||||
| 199 | Societe Generale Class A | 11,600 | ||||||
| 2,046 | Standard Chartered plc | 46,206 | ||||||
| 1,548 | Wells Fargo & Co. | 70,264 | ||||||
| 371,604 | ||||||||
| Capital Goods - 7.7% | ||||||||
| 68 | 3M Co. | 9,531 | ||||||
| 234 | AGCO Corp. | 13,874 | ||||||
| 202 | AMETEK, Inc. | 10,655 | ||||||
| 289 | Armstrong World Industries, Inc. ● | 16,630 | ||||||
| 173 | Assa Abloy Ab | 9,170 | ||||||
| 197 | Belden, Inc. | 13,898 | ||||||
| 309 | Cummins, Inc. | 43,503 | ||||||
| 99 | DigitalGlobe, Inc. ● | 4,072 | ||||||
| 202 | Eaton Corp. plc | 15,340 | ||||||
| 196 | Emerson Electric Co. | 13,725 | ||||||
| 177 | Flowserve Corp. | 13,931 | ||||||
| 586 | HD Supply Holdings, Inc. ● | 14,060 | ||||||
| 1,190 | KBR, Inc. | 37,949 | ||||||
| 144 | Lockheed Martin Corp. | 21,385 | ||||||
| 180 | Northrop Grumman Corp. | 20,633 | ||||||
| 478 | Okuma Corp. | 5,275 | ||||||
| 1,405 | Owens Corning, Inc. ● | 57,232 | ||||||
| 68 | Pall Corp. | 5,783 | ||||||
| 207 | Parker-Hannifin Corp. | 26,620 | ||||||
| 132 | Polypore International, Inc. ● | 5,140 | ||||||
| 1,215 | Rexel S.A. | 31,886 | ||||||
| 2,401 | Rolls-Royce Holdings plc | 50,777 | ||||||
| 666 | Safran S.A. | 46,337 | ||||||
| 108 | Schneider Electric S.A. | 9,409 | ||||||
| 72 | Siemens AG | 9,906 | ||||||
| 40 | Siemens AG ADR | 5,598 | ||||||
| 31 | SMC Corp. of America | 7,887 | ||||||
| 75 | Stanley Black & Decker, Inc. | 6,051 | ||||||
| 227 | Textron, Inc. | 8,356 | ||||||
| 151 | Titan International, Inc. | 2,710 | ||||||
| 19 | TransDigm Group, Inc. | 3,092 | ||||||
| 236 | United Technologies Corp. | 26,847 | ||||||
| 142 | Wabtec Corp. | 10,573 | ||||||
| 343 | WESCO International, Inc. ● | 31,206 | ||||||
| 527 | Westport Innovations, Inc. ● | 10,337 | ||||||
| 619,378 | ||||||||
| Commercial and Professional Services - 1.2% | ||||||||
| 525 | ADT (The) Corp. | 21,255 | ||||||
| 70 | Clean Harbors, Inc. ● | 4,221 | ||||||
| 252 | Edenred | 8,449 | ||||||
| 122 | Equifax, Inc. ● | 8,394 | ||||||
| 455 | Herman Miller, Inc. | 13,426 | ||||||
| 47 | IHS, Inc. ● | 5,642 | ||||||
| 301 | Knoll, Inc. | 5,513 | ||||||
| 656 | Nielsen Holdings N.V. | 30,097 | ||||||
| 96,997 | ||||||||
| Consumer Durables and Apparel - 2.4% | ||||||||
| 722 | D.R. Horton, Inc. ● | 16,106 | ||||||
| 312 | Electrolux AB Series B ☼ | 8,161 | ||||||
| 473 | Fifth & Pacific Cos., Inc. ● | 15,171 | ||||||
| 107 | Fossil Group, Inc. ● | 12,840 | ||||||
| 295 | Lennar Corp. | 11,683 | ||||||
| 146 | Lululemon Athletica, Inc. ● | 8,627 | ||||||
| 588 | Mattel, Inc. | 27,977 | ||||||
| 2,452 | Pulte Group, Inc. | 49,948 | ||||||
| 212 | PVH Corp. | 28,839 | ||||||
| 340 | Vera Bradley, Inc. ● | 8,179 | ||||||
| 41 | Whirlpool Corp. | 6,471 | ||||||
| 194,002 | ||||||||
| Consumer Services - 2.4% | ||||||||
| 289 | American Public Education, Inc. ● | 12,580 | ||||||
| 230 | Bloomin' Brands, Inc. ● | 5,528 | ||||||
| 28 | Buffalo Wild Wings, Inc. ● | 4,175 | ||||||
| 494 | Compass Group plc | 7,929 | ||||||
| 260 | Grand Canyon Education, Inc. ● | 11,323 | ||||||
| 271 | ITT Educational Services, Inc. ● | 9,101 | ||||||
| 79 | Life Time Fitness, Inc. ● | 3,732 | ||||||
| 279 | McDonald's Corp. | 27,080 | ||||||
| 179 | Melco PBL Entertainment Ltd. ADR ● | 7,028 | ||||||
| 1,275 | MGM China Holdings Ltd. | 5,457 | ||||||
| 135 | Outerwall, Inc. ● | 9,066 | ||||||
| 41 | Panera Bread Co. Class A ● | 7,269 | ||||||
| 187 | Tim Hortons, Inc. | 10,890 | ||||||
| 808 | Wyndham Worldwide Corp. | 59,556 | ||||||
| 1,571 | Wynn Macau Ltd. | 7,140 | ||||||
| 187,854 | ||||||||
| Diversified Financials - 6.5% | ||||||||
| 445 | Ameriprise Financial, Inc. | 51,213 | ||||||
| 21 | Artisan Partners Asset Management, Inc. | 1,377 | ||||||
| 278 | Banca Generali S.p.A. ☼ | 8,615 | ||||||
| 887 | Bank of America Corp. | 13,810 | ||||||
| 178 | BlackRock, Inc. | 56,434 | ||||||
| 1,109 | Citigroup, Inc. | 57,814 | ||||||
| 359 | Credit Suisse Group AG | 11,068 | ||||||
| 186 | IntercontinentalExchange Group, Inc. | 41,724 | ||||||
| 306 | Invesco Ltd. | 11,129 | ||||||
| 191 | Japan Exchange Group, Inc. | 5,429 | ||||||
| 2,213 | JP Morgan Chase & Co. | 129,400 | ||||||
| 750 | Julius Baer Group Ltd. ☼ | 36,056 | ||||||
| 190 | LPL Financial Holdings, Inc. | 8,921 | ||||||
| 1,121 | Nomura Holdings, Inc. | 8,661 | ||||||
| 134 | Northern Trust Corp. | 8,281 | ||||||
| 1,444 | ORIX Corp. | 25,372 | ||||||
The accompanying notes are an integral part of these financial statements.
| 5 |
| Hartford Capital Appreciation HLS Fund |
| Schedule of Investments – (continued) |
| December 31, 2013 |
| (000’s Omitted) |
| Shares or Principal Amount | Market Value ╪ | |||||||
| COMMON STOCKS - 96.2% - (continued) | ||||||||
| Diversified Financials - 6.5% - (continued) | ||||||||
| 21 | Partners Group | $ | 5,601 | |||||
| 448 | Platform Acquisition ⌂●† | 5,639 | ||||||
| 75 | Solar Cayman Ltd. ⌂■●† | 5 | ||||||
| 544 | UBS AG ADR | 10,465 | ||||||
| 292 | Waddell & Reed Financial, Inc. Class A | 19,034 | ||||||
| 256 | Wisdomtree Investment, Inc. ● | 4,541 | ||||||
| 520,589 | ||||||||
| Energy - 7.4% | ||||||||
| 360 | Anadarko Petroleum Corp. | 28,562 | ||||||
| 271 | Atwood Oceanics, Inc. ● | 14,475 | ||||||
| 132 | Baker Hughes, Inc. | 7,317 | ||||||
| 2,587 | BG Group plc | 55,679 | ||||||
| 1,344 | BP plc | 10,892 | ||||||
| 1,528 | BP plc ADR | 74,268 | ||||||
| 517 | Cameco Corp. | 10,733 | ||||||
| 159 | Cameron International Corp. ● | 9,493 | ||||||
| 440 | Canadian Natural Resources Ltd. ADR | 14,900 | ||||||
| 119 | Chevron Corp. | 14,805 | ||||||
| 33,034 | China Petroleum & Chemical Corp. Class H | 27,105 | ||||||
| 2,039 | Cobalt International Energy, Inc. ● | 33,547 | ||||||
| 138 | Continental Resources, Inc. ● | 15,471 | ||||||
| 229 | Exxon Mobil Corp. | 23,225 | ||||||
| 714 | Halliburton Co. | 36,259 | ||||||
| 4,665 | JX Holdings, Inc. | 24,024 | ||||||
| 3,364 | Karoon Gas Australia Ltd. ● | 13,097 | ||||||
| 739 | McDermott International, Inc. ● | 6,772 | ||||||
| 210 | National Oilwell Varco, Inc. | 16,692 | ||||||
| 206 | Newfield Exploration Co. ● | 5,077 | ||||||
| 80 | Occidental Petroleum Corp. | 7,604 | ||||||
| 120 | Patterson-UTI Energy, Inc. | 3,047 | ||||||
| 195 | Pioneer Natural Resources Co. | 35,940 | ||||||
| 356 | QEP Resources, Inc. | 10,902 | ||||||
| 69 | Range Resources Corp. | 5,847 | ||||||
| 509 | Southwestern Energy Co. ● | 20,028 | ||||||
| 173 | Statoil ASA | 4,212 | ||||||
| 351 | Suncor Energy, Inc. | 12,317 | ||||||
| 374 | Superior Energy Services, Inc. ● | 9,963 | ||||||
| 108 | Transocean, Inc. | 5,319 | ||||||
| 1,650 | Trican Well Service Ltd. | 20,157 | ||||||
| 171 | Valero Energy Corp. | 8,632 | ||||||
| 147 | Whiting Petroleum Corp. ● | 9,067 | ||||||
| 595,428 | ||||||||
| Food and Staples Retailing - 1.4% | ||||||||
| 1,180 | CVS Caremark Corp. | 84,460 | ||||||
| 163 | Seven & I Holdings Co., Ltd. | 6,490 | ||||||
| 146 | Wal-Mart Stores, Inc. | 11,512 | ||||||
| 104 | Whole Foods Market, Inc. | 6,019 | ||||||
| 108,481 | ||||||||
| Food, Beverage and Tobacco - 3.6% | ||||||||
| 580 | Anheuser-Busch InBev N.V. | 61,663 | ||||||
| 332 | Anheuser-Busch InBev N.V. ADR | 35,293 | ||||||
| 154 | British American Tobacco plc | 8,253 | ||||||
| 87 | Bunge Ltd. Finance Corp. | 7,176 | ||||||
| 641 | Diageo Capital plc | 21,231 | ||||||
| 277 | Green Mountain Coffee Roasters, Inc. ● | 20,921 | ||||||
| 381 | Imperial Tobacco Group plc | 14,761 | ||||||
| 322 | Kraft Foods Group, Inc. | 17,343 | ||||||
| 16,741 | LT Group, Inc. | 5,847 | ||||||
| 635 | Maple Leaf Foods, Inc. | 10,044 | ||||||
| 148 | Molson Coors Brewing Co. | 8,324 | ||||||
| 922 | Mondelez International, Inc. | 32,548 | ||||||
| 147 | Monster Beverage Corp. ● | 9,989 | ||||||
| 66 | Nutreco Holding N.V. | 3,259 | ||||||
| 92 | Philip Morris International, Inc. | 8,027 | ||||||
| 1,330 | Treasury Wine Estates Ltd. | 5,736 | ||||||
| 251 | Unilever N.V. NY Shares ADR | 10,090 | ||||||
| 267 | WhiteWave Foods Co. Class A ● | 6,123 | ||||||
| 286,628 | ||||||||
| Health Care Equipment and Services - 3.3% | ||||||||
| 1,425 | Aetna, Inc. | 97,730 | ||||||
| 520 | Cardinal Health, Inc. | 34,757 | ||||||
| 9,068 | CareView Communications, Inc. ●† | 3,160 | ||||||
| 147 | Catamaran Corp. ● | 6,962 | ||||||
| 144 | CIGNA Corp. | 12,613 | ||||||
| 413 | Covidien plc | 28,132 | ||||||
| 145 | Dexcom, Inc. ● | 5,135 | ||||||
| 29 | Envision Healthcare Holdings ● | 1,018 | ||||||
| 19 | Heartware International, Inc. ● | 1,807 | ||||||
| 500 | Medtronic, Inc. | 28,690 | ||||||
| 164 | St. Jude Medical, Inc. | 10,182 | ||||||
| 97 | Team Health Holdings ● | 4,421 | ||||||
| 154 | Universal Health Services, Inc. Class B | 12,546 | ||||||
| 167 | Wellpoint, Inc. | 15,401 | ||||||
| 262,554 | ||||||||
| Household and Personal Products - 0.5% | ||||||||
| 281 | Coty, Inc. | 4,292 | ||||||
| 122 | Estee Lauder Co., Inc. | 9,206 | ||||||
| 904 | Svenska Cellulosa AB Class B | 27,861 | ||||||
| 41,359 | ||||||||
| Insurance - 4.4% | ||||||||
| 196 | ACE Ltd. | 20,289 | ||||||
| 682 | Aflac, Inc. ‡ | 45,549 | ||||||
| 2,223 | AIA Group Ltd. | 11,189 | ||||||
| 2,023 | American International Group, Inc. | 103,257 | ||||||
| 634 | Assicurazioni Generali S.p.A. | 14,889 | ||||||
| 575 | Assured Guaranty Ltd. | 13,574 | ||||||
| 480 | AXA S.A. | 13,378 | ||||||
| 2,888 | China Pacific Insurance Co., Ltd. | 11,362 | ||||||
| 248 | Delta Lloyd N.V. | 6,157 | ||||||
| 253 | Lincoln National Corp. | 13,056 | ||||||
| 383 | Marsh & McLennan Cos., Inc. | 18,544 | ||||||
| 459 | MetLife, Inc. | 24,737 | ||||||
| 184 | Reinsurance Group of America, Inc. | 14,259 | ||||||
| 58 | Swiss Re Ltd. | 5,376 | ||||||
| 506 | Tokio Marine Holdings, Inc. | 16,950 | ||||||
| 403 | XL Group plc | 12,842 | ||||||
| 25 | Zurich Financial Services AG | 7,340 | ||||||
| 352,748 | ||||||||
| Materials - 3.8% | ||||||||
| 76 | Air Liquide | 10,718 | ||||||
| 124 | Akzo Nobel N.V. | 9,592 | ||||||
| 1,180 | Allied Nevada Gold Corp. ● | 4,191 | ||||||
| 1,538 | AuRico Gold, Inc. | 5,627 | ||||||
| 144 | Ball Corp. | 7,449 | ||||||
| 1,876 | Barrick Gold Corp. | 33,080 | ||||||
| 374 | Cabot Corp. | 19,199 | ||||||
| 113 | Celanese Corp. | 6,244 | ||||||
| 2,014 | Continental Gold Ltd. ● | 6,410 | ||||||
The accompanying notes are an integral part of these financial statements.
| 6 |
| Shares or Principal Amount | Market Value ╪ | |||||||
| COMMON STOCKS - 96.2% - (continued) | ||||||||
| Materials - 3.8% - (continued) | ||||||||
| 214 | Dow Chemical Co. | $ | 9,522 | |||||
| 135 | Ecolab, Inc. | 14,106 | ||||||
| 10 | Givaudan | 13,678 | ||||||
| 289 | International Paper Co. | 14,188 | ||||||
| 2,646 | Ivanhoe Mines Ltd. PIPE ⌂●† | 4,534 | ||||||
| 765 | JSR Corp. ☼ | 14,827 | ||||||
| 569 | Louisiana-Pacific Corp. ● | 10,536 | ||||||
| 151 | Methanex Corp. ADR | 8,936 | ||||||
| 3,837 | Mitsui Chemicals, Inc. | 9,278 | ||||||
| 61 | Monsanto Co. | 7,085 | ||||||
| 388 | Norbord, Inc. | 12,381 | ||||||
| 16 | OCI Co., Ltd. ● | 2,914 | ||||||
| 216 | Praxair, Inc. | 28,081 | ||||||
| 167 | Reliance Steel & Aluminum | 12,652 | ||||||
| 55 | Rock Tenn Co. Class A | 5,781 | ||||||
| 2,782 | Turquoise Hill Resources Ltd. ● | 9,181 | ||||||
| 2,782 | Turquoise Hill Resources Rights | 2,671 | ||||||
| 131 | Vulcan Materials Co. | 7,765 | ||||||
| 92 | Wacker Chemie AG | 10,180 | ||||||
| 300,806 | ||||||||
| Media - 2.4% | ||||||||
| 208 | CBS Corp. Class B | 13,266 | ||||||
| 74 | DirecTV ● | 5,140 | ||||||
| 59 | DISH Network Corp. ● | 3,415 | ||||||
| 30 | Harvey Weinstein Co. Holdings Class A-1 ⌂●†∞ | — | ||||||
| 130 | Imax Corp. ● | 3,823 | ||||||
| 3,147 | Interpublic Group of Cos., Inc. | 55,706 | ||||||
| 375 | Omnicom Group, Inc. | 27,892 | ||||||
| 112 | Publicis Groupe | 10,229 | ||||||
| 130 | Time Warner Cable, Inc. | 17,642 | ||||||
| 601 | Time Warner, Inc. | 41,931 | ||||||
| 727 | WPP plc | 16,653 | ||||||
| 195,697 | ||||||||
| Pharmaceuticals, Biotechnology and Life Sciences - 10.0% | ||||||||
| 49 | Actavis plc ● | 8,238 | ||||||
| 123 | Actelion Ltd. | 10,397 | ||||||
| 121 | Alkermes plc ● | 4,936 | ||||||
| 372 | Almirall S.A. | 6,067 | ||||||
| 264 | Amgen, Inc. | 30,121 | ||||||
| 1,760 | Arena Pharmaceuticals, Inc. ● | 10,298 | ||||||
| 93 | Astellas Pharma, Inc. | 5,520 | ||||||
| 214 | AstraZeneca plc | 12,677 | ||||||
| 787 | AstraZeneca plc ADR | 46,716 | ||||||
| 30 | Biogen Idec, Inc. ● | 8,379 | ||||||
| 1,838 | Bristol-Myers Squibb Co. | 97,709 | ||||||
| 153 | Celgene Corp. ● | 25,860 | ||||||
| 66 | Covance, Inc. ● | 5,782 | ||||||
| 549 | Daiichi Sankyo Co., Ltd. | 10,044 | ||||||
| 253 | Eli Lilly & Co. | 12,886 | ||||||
| 1,961 | Gilead Sciences, Inc. ● | 147,368 | ||||||
| 396 | Johnson & Johnson | 36,257 | ||||||
| 111 | Medivation, Inc. ● | 7,077 | ||||||
| 2,191 | Merck & Co., Inc. | 109,676 | ||||||
| 62 | Ono Pharmaceutical Co., Ltd. | 5,449 | ||||||
| 219 | Portola Pharmaceuticals, Inc. ● | 5,637 | ||||||
| 44 | Regeneron Pharmaceuticals, Inc. ● | 12,123 | ||||||
| 238 | Roche Holding AG | 66,599 | ||||||
| 51 | Salix Pharmaceuticals Ltd. ● | 4,565 | ||||||
| 1,339 | Teva Pharmaceutical Industries Ltd. ADR | 53,663 | ||||||
| 4,359 | TherapeuticsMD, Inc. ● | 22,710 | ||||||
| 278 | Vertex Pharmaceuticals, Inc. ● | 20,685 | ||||||
| 267 | Zoetis, Inc. | 8,718 | ||||||
| 796,157 | ||||||||
| Real Estate - 0.6% | ||||||||
| 94 | AvalonBay Communities, Inc. REIT | 11,057 | ||||||
| 67 | Boston Properties, Inc. REIT | 6,682 | ||||||
| 320 | Host Hotels & Resorts, Inc. REIT | 6,214 | ||||||
| 116 | Plum Creek Timber Co., Inc. REIT | 5,395 | ||||||
| 258 | Realogy Holdings Corp. ● | 12,775 | ||||||
| 171 | Weyerhaeuser Co. REIT | 5,389 | ||||||
| 34 | Zillow, Inc. ● | 2,774 | ||||||
| 50,286 | ||||||||
| Retailing - 6.8% | ||||||||
| 26 | Abercrombie & Fitch Co. Class A | 848 | ||||||
| 40 | Advance Automotive Parts, Inc. | 4,454 | ||||||
| 446 | Aeropostale, Inc. ● | 4,051 | ||||||
| 8,452 | Allstar Co. ⌂●† | 18,338 | ||||||
| 99 | AutoZone, Inc. ● | 47,173 | ||||||
| 1,815 | Best Buy Co., Inc. | 72,381 | ||||||
| 149 | Conns, Inc. ● | 11,738 | ||||||
| 133 | Dick's Sporting Goods, Inc. | 7,720 | ||||||
| 241 | Dollar Tree, Inc. ● | 13,578 | ||||||
| 72 | Dollarama, Inc. | 5,960 | ||||||
| 500 | Francescas Holding Corp. ● | 9,206 | ||||||
| 315 | GameStop Corp. Class A | 15,510 | ||||||
| 2,580 | Groupon, Inc. ● | 30,372 | ||||||
| 164 | Home Depot, Inc. | 13,489 | ||||||
| 182 | HomeAway, Inc. ● | 7,461 | ||||||
| 12,299 | Intime Retail Group Co., Ltd. | 12,821 | ||||||
| 940 | Kingfisher plc | 6,004 | ||||||
| 108 | L Brands, Inc. | 6,692 | ||||||
| 695 | Liberty Media - Interactive A ● | 20,387 | ||||||
| 965 | Lowe's Cos., Inc. | 47,807 | ||||||
| 62 | Lumber Liquidators Holdings, Inc. ● | 6,332 | ||||||
| 763 | Marks & Spencer Group plc | 5,481 | ||||||
| 20 | Netflix, Inc. ● | 7,222 | ||||||
| 1,172 | Office Depot, Inc. ● | 6,199 | ||||||
| 211 | Pier 1 Imports, Inc. | 4,881 | ||||||
| 37 | Priceline.com, Inc. ● | 43,557 | ||||||
| 458 | Rakuten, Inc. | 6,835 | ||||||
| 94 | Restoration Hardware Holdings, Inc. ● | 6,300 | ||||||
| 70 | Ross Stores, Inc. | 5,227 | ||||||
| 69 | Ryohin Keikaku Co., Ltd. | 7,479 | ||||||
| 186 | Start Today Co., Ltd. | 4,634 | ||||||
| 254 | Tile Shop Holdings, Inc. ● | 4,584 | ||||||
| 740 | TJX Cos., Inc. | 47,168 | ||||||
| 281 | Tory Burch LLC ⌂† | 21,677 | ||||||
| 110 | TripAdvisor, Inc. ● | 9,113 | ||||||
| 542,679 | ||||||||
| Semiconductors and Semiconductor Equipment - 5.0% | ||||||||
| 329 | Altera Corp. | 10,708 | ||||||
| 293 | Analog Devices, Inc. | 14,919 | ||||||
| 24,353 | GCL-Poly Energy Holdings Ltd. ● | 7,572 | ||||||
| 2,325 | GT Advanced Technologies, Inc. ● | 20,271 | ||||||
| 253 | Hynix Semiconductor, Inc. ● | 8,852 | ||||||
| 2,414 | Intel Corp. | 62,678 | ||||||
| 630 | Maxim Integrated Products, Inc. | 17,575 | ||||||
| 4,888 | Micron Technology, Inc. ● | 106,356 | ||||||
The accompanying notes are an integral part of these financial statements.
| 7 |
| Hartford Capital Appreciation HLS Fund |
| Schedule of Investments – (continued) |
| December 31, 2013 |
| (000’s Omitted) |
| Shares or Principal Amount | Market Value ╪ | |||||||
| COMMON STOCKS - 96.2% - (continued) | ||||||||
| Semiconductors and Semiconductor Equipment - 5.0% - (continued) | ||||||||
| 1,213 | NXP Semiconductors N.V. ● | $ | 55,711 | |||||
| 12 | Samsung Electronics Co., Ltd. | 16,009 | ||||||
| 679 | Skyworks Solutions, Inc. ● | 19,385 | ||||||
| 616 | Sumco Corp. | 5,430 | ||||||
| 3,408 | SunEdison, Inc. ● | 44,471 | ||||||
| 208 | Xilinx, Inc. | 9,570 | ||||||
| 399,507 | ||||||||
| Software and Services - 9.2% | ||||||||
| 155 | Accenture plc | 12,730 | ||||||
| 3,192 | Activision Blizzard, Inc. | 56,917 | ||||||
| 751 | Akamai Technologies, Inc. ● | 35,413 | ||||||
| 1,049 | Amadeus IT Holding S.A. Class A | 44,955 | ||||||
| 471 | Angie's List, Inc. ● | 7,142 | ||||||
| 258 | Autodesk, Inc. ● | 12,988 | ||||||
| 169 | Automatic Data Processing, Inc. | 13,678 | ||||||
| 303 | Booz Allen Hamilton Holding Corp. | 5,809 | ||||||
| 482 | Cadence Design Systems, Inc. ● | 6,755 | ||||||
| 130 | Capital Gemini S.A. | 8,785 | ||||||
| 339 | Check Point Software Technologies Ltd. ADR ● | 21,888 | ||||||
| 185 | Cognizant Technology Solutions Corp. ● | 18,726 | ||||||
| 87 | Concur Technologies, Inc. ● | 8,971 | ||||||
| 49 | Demandware, Inc. ● | 3,160 | ||||||
| 252 | DeNa Co., Ltd. | 5,320 | ||||||
| 208 | Dropbox, Inc. ⌂●† | 2,470 | ||||||
| 171 | eBay, Inc. ● | 9,389 | ||||||
| 218 | Facebook, Inc. ● | 11,898 | ||||||
| 103 | Fleetmatics Group Ltd. ● | 4,445 | ||||||
| 1,821 | Genpact Ltd. ● | 33,450 | ||||||
| 189 | Global Payments, Inc. | 12,309 | ||||||
| 58 | Google, Inc. ● | 65,414 | ||||||
| 112 | Heartland Payment Systems, Inc. | 5,588 | ||||||
| 290 | IAC/InterActiveCorp. | 19,896 | ||||||
| 180 | iGate Corp. ● | 7,214 | ||||||
| 31 | LinkedIn Corp. Class A ● | 6,737 | ||||||
| 3,288 | Microsoft Corp. | 123,067 | ||||||
| 1 | NetSuite, Inc. ● | 98 | ||||||
| 69 | Open Text Corp. | 6,310 | ||||||
| 48 | Opentable, Inc. ● | 3,786 | ||||||
| 1,308 | Oracle Corp. | 50,055 | ||||||
| 130 | Salesforce.com, Inc. ● | 7,191 | ||||||
| 55 | ServiceNow, Inc. ● | 3,059 | ||||||
| 550 | Symantec Corp. | 12,975 | ||||||
| 34 | Tableau Software, Inc. ● | 2,370 | ||||||
| 113 | Trulia, Inc. ● | 3,976 | ||||||
| 593 | UbiSoft Entertainment S.A. ● | 8,398 | ||||||
| 22 | Visa, Inc. | 4,797 | ||||||
| 502 | Web.com Group, Inc. ● | 15,946 | ||||||
| 1,251 | Yahoo!, Inc. ● | 50,599 | ||||||
| 734,674 | ||||||||
| Technology Hardware and Equipment - 3.9% | ||||||||
| 72 | Apple, Inc. | 40,350 | ||||||
| 204 | CDW Corp. of Delaware | 4,761 | ||||||
| 4,318 | Cisco Systems, Inc. | 96,928 | ||||||
| 2,867 | EMC Corp. | 72,098 | ||||||
| 323 | Fusion-io, Inc. ● | 2,882 | ||||||
| 480 | Hewlett-Packard Co. | 13,426 | ||||||
| 389 | JDS Uniphase Corp. ● | 5,052 | ||||||
| 194 | Largan Precision Co., Ltd. | 7,942 | ||||||
| 88 | Mobileye N.V. ⌂●† | 3,404 | ||||||
| 319 | NetApp, Inc. | 13,107 | ||||||
| 75 | Palo Alto Networks, Inc. ● | 4,336 | ||||||
| 4,179 | ParkerVision, Inc. ● | 19,013 | ||||||
| 153 | Qualcomm, Inc. | 11,348 | ||||||
| 169 | SanDisk Corp. | 11,946 | ||||||
| 506 | Xerox Corp. | 6,157 | ||||||
| 312,750 | ||||||||
| Telecommunication Services - 1.0% | ||||||||
| 461 | Hellenic Telecommunications Organization S.A. | 6,137 | ||||||
| 702 | Intelsat S.A. ● | 15,817 | ||||||
| 308 | KDDI Corp. | 18,995 | ||||||
| 2,000 | Portugal Telecom SGPS S.A. | 8,707 | ||||||
| 235 | Telenor ASA | 5,621 | ||||||
| 151 | T-Mobile US, Inc. | 5,084 | ||||||
| 267 | Verizon Communications, Inc. | 13,140 | ||||||
| 1,395 | Vodafone Group plc | 5,493 | ||||||
| 78,994 | ||||||||
| Transportation - 4.1% | ||||||||
| 85 | FedEx Corp. | 12,149 | ||||||
| 2,743 | Hertz Global Holdings, Inc. ● | 78,510 | ||||||
| 5,343 | JetBlue Airways Corp. ● | 45,679 | ||||||
| 122 | Kansas City Southern | 15,148 | ||||||
| 597 | Knight Transportation, Inc. | 10,943 | ||||||
| 95 | Norfolk Southern Corp. | 8,800 | ||||||
| 118 | Spirit Airlines, Inc. ● | 5,346 | ||||||
| 2,703 | United Continental Holdings, Inc. ● | 102,249 | ||||||
| 456 | United Parcel Service, Inc. Class B | 47,880 | ||||||
| 326,704 | ||||||||
| Utilities - 1.0% | ||||||||
| 13,434 | China Longyuan Power Group Corp. | 17,325 | ||||||
| 156 | Entergy Corp. | 9,868 | ||||||
| 409 | National Grid plc | 5,355 | ||||||
| 261 | NRG Energy, Inc. | 7,482 | ||||||
| 533 | Power Grid Corp. of India Ltd. | 861 | ||||||
| 1,633 | Snam S.p.A. | 9,129 | ||||||
| 323 | UGI Corp. | 13,378 | ||||||
| 689 | Xcel Energy, Inc. | 19,255 | ||||||
| 82,653 | ||||||||
| Total common stocks | ||||||||
| (cost $6,218,428) | $ | 7,696,629 | ||||||
| PREFERRED STOCKS - 1.0% | ||||||||
| Automobiles and Components - 0.4% | ||||||||
| 116 | Volkswagen AG N.V. | $ | 32,736 | |||||
| Media - 0.6% | ||||||||
| 875 | ProSieben Sat.1 Media AG | 43,465 | ||||||
| Total preferred stocks | ||||||||
| (cost $65,018) | $ | 76,201 | ||||||
The accompanying notes are an integral part of these financial statements.
| 8 |
| Shares or Principal Amount | Market Value ╪ | |||||||||||
| WARRANTS - 0.0% | ||||||||||||
| Diversified Financials - 0.0% | ||||||||||||
| 198 | Platform Acquisition ⌂† | $ | 147 | |||||||||
| Total warrants | ||||||||||||
| (cost $2) | $ | 147 | ||||||||||
| EXCHANGE TRADED FUNDS - 0.0% | ||||||||||||
| Other Investment Pools and Funds - 0.0% | ||||||||||||
| 19 | S&P 500 Depositary Receipt | $ | 3,416 | |||||||||
| Total exchange traded funds | ||||||||||||
| (cost $3,374) | $ | 3,416 | ||||||||||
| CORPORATE BONDS - 0.0% | ||||||||||||
| Petroleum and Coal Products Manufacturing - 0.0% | ||||||||||||
| Cobalt International Energy, Inc. | ||||||||||||
| $ | 371 | 2.63%, 12/01/2019 ۞ | $ | 328 | ||||||||
| Total corporate bonds | ||||||||||||
| (cost $327) | $ | 328 | ||||||||||
| Contracts | Market Value ╪ | |||||||||||
| PUT OPTIONS PURCHASED - 0.0% | ||||||||||||
| Equity Contracts - 0.0% | ||||||||||||
| Cognizant Technology Solutions Corp. Option | ||||||||||||
| 1 | Expiration: 01/18/2014, Exercise Price: $70.00 | $ | — | |||||||||
| Total put options purchased | ||||||||||||
| (cost $361) | $ | — | ||||||||||
| Total long-term investments | ||||||||||||
| (cost $6,287,510) | $ | 7,776,721 | ||||||||||
| Shares or Principal Amount | Market Value ╪ | |||||||||||
| SHORT-TERM INVESTMENTS - 2.3% | ||||||||||||
| Repurchase Agreements - 2.3% | ||||||||||||
| Bank of America Merrill Lynch TriParty Repurchase Agreement (maturing on 01/02/2014 in the amount of $9,179, collateralized by GNMA 4.00%, 2043, value of $9,363) | ||||||||||||
| $ | 9,179 | 0.005%, 12/31/2013 | $ | 9,179 | ||||||||
| Bank of Montreal TriParty Repurchase Agreement (maturing on 01/02/2014 in the amount of $8,819, collateralized by FNMA 1.58% - 4.50%, 2020 - 2043, U.S. Treasury Note 0.25% - 4.00%, 2015 - 2020, value of $8,996) | ||||||||||||
| 8,819 | 0.01%, 12/31/2013 | 8,819 | ||||||||||
| Bank of Montreal TriParty Repurchase Agreement (maturing on 01/02/2014 in the amount of $31,235, collateralized by FHLMC 3.00% - 5.00%, 2019 - 2043, FNMA 0.76% - 6.00%, 2016 - 2043, GNMA 1.50% - 5.25%, 2028 - 2043, value of $31,859) | ||||||||||||
| 31,235 | 0.02%, 12/31/2013 | 31,235 | ||||||||||
| Barclays Capital TriParty Repurchase Agreement (maturing on 01/02/2014 in the amount of $28,170, collateralized by U.S. Treasury Note 0.50% - 2.25%, 2017, value of $28,733) | ||||||||||||
| 28,170 | 0.01%, 12/31/2013 | 28,170 | ||||||||||
| Citigroup Global Markets, Inc. TriParty Repurchase Agreement (maturing on 01/02/2014 in the amount of $50,688, collateralized by U.S. Treasury Bond 3.88% - 8.13%, 2021 - 2040, U.S. Treasury Note 0.25% - 3.38%, 2014 - 2020, value of $51,702) | ||||||||||||
| 50,688 | 0.01%, 12/31/2013 | 50,688 | ||||||||||
| RBS Securities, Inc. TriParty Repurchase Agreement (maturing on 01/02/2014 in the amount of $16,470, collateralized by U.S. Treasury Note 0.25% - 1.00%, 2015 - 2017, value of $16,799) | ||||||||||||
| 16,470 | 0.01%, 12/31/2013 | 16,470 | ||||||||||
| TD Securities TriParty Repurchase Agreement (maturing on 01/02/2014 in the amount of $39,539, collateralized by FFCB 0.20% - 0.50%, 2015 - 2016, FHLMC 0.38% - 5.25%, 2014 - 2042, FNMA 0.50% - 7.13%, 2014 - 2043, value of $40,330) | ||||||||||||
| 39,539 | 0.01%, 12/31/2013 | 39,539 | ||||||||||
| UBS Securities, Inc. Repurchase Agreement (maturing on 01/02/2014 in the amount of $338, collateralized by U.S. Treasury Note 2.13%, 2015, value of $346) | ||||||||||||
| 338 | 0.01%, 12/31/2013 | 338 | ||||||||||
| 184,438 | ||||||||||||
| Total short-term investments | ||||||||||||
| (cost $184,438) | $ | 184,438 | ||||||||||
| Total investments | ||||||||||||
| (cost $6,471,948) ▲ | 99.5 | % | $ | 7,961,159 | ||||||||
| Other assets and liabilities | 0.5 | % | 37,653 | |||||||||
| Total net assets | 100.0 | % | $ | 7,998,812 | ||||||||
The accompanying notes are an integral part of these financial statements.
| 9 |
| Hartford Capital Appreciation HLS Fund |
| Schedule of Investments – (continued) |
| December 31, 2013 |
| (000’s Omitted) |
| Note: | Percentage of investments as shown is the ratio of the total market value to total net assets. |
| Prices of foreign equities that are principally traded on certain foreign markets may be adjusted daily pursuant to a fair value pricing service approved by the Board of Directors in order to reflect an adjustment for factors occurring after the close of certain foreign markets but before the close of the New York Stock Exchange. |
| ▲ | At December 31, 2013, the cost of securities for federal income tax purposes was $6,531,432 and the aggregate gross unrealized appreciation and depreciation based on that cost were: |
| Unrealized Appreciation | $ | 1,613,178 | ||
| Unrealized Depreciation | (183,451 | ) | ||
| Net Unrealized Appreciation | $ | 1,429,727 |
| † | These securities were valued in good faith at fair value as determined under policies and procedures established by and under the supervision of the Company's Board of Directors. At December 31, 2013, the aggregate value of these securities was $59,374, which represents 0.7% of total net assets. This amount excludes securities that are principally traded in certain foreign markets and whose prices are adjusted pursuant to a third party pricing service methodology approved by the Board of Directors. |
| ● | Non-income producing. |
| ■ | Securities issued within terms of a private placement memorandum, exempt from registration under Rule 144A under the Securities Act of 1933, as amended, and may be sold only to qualified institutional buyers. Unless otherwise indicated, these holdings are determined to be liquid. At December 31, 2013, the aggregate value of these securities was $5, which rounds to zero percent of total net assets. |
| ∞ | Securities exempt from registration under Regulation D of the Securities Act of 1933. The Fund may only be able to resell these securities if they are subsequently registered or if an exemption from registration under the federal and state securities laws is available. Unless otherwise indicated, these holdings are determined to be liquid. At December 31, 2013, the aggregate value and percentage of net assets of these securities rounds to zero. |
| ⌂ | The following securities are considered illiquid. Illiquid securities are often purchased in private placement transactions, are often not registered under the Securities Act of 1933 and may have contractual restrictions on resale. A security may also be considered illiquid if the security lacks a readily available market or if its valuation has not changed for a certain period of time. |
| Period Acquired | Shares/ Par | Security | Cost Basis | |||||||
| 08/2011 | 8,452 | Allstar Co. | $ | 4,994 | ||||||
| 05/2012 | 208 | Dropbox, Inc. | 1,885 | |||||||
| 10/2005 | 30 | Harvey Weinstein Co. Holdings Class A-1 - Reg D | 27,951 | |||||||
| 09/2013 | 2,646 | Ivanhoe Mines Ltd. PIPE | 5,132 | |||||||
| 08/2013 | 88 | Mobileye N.V. | 3,055 | |||||||
| 05/2013 - 10/2013 | 448 | Platform Acquisition | 4,506 | |||||||
| 05/2013 | 198 | Platform Acquisition Warrants | 2 | |||||||
| 03/2007 | 75 | Solar Cayman Ltd. - 144A | 22 | |||||||
| 11/2013 | 281 | Tory Burch LLC | 21,985 | |||||||
| At December 31, 2013, the aggregate value of these securities was $56,214, which represents 0.7% of total net assets. |
| ۞ | Convertible security. |
| ☼ | This security, or a portion of this security, was purchased on a when-issued, delayed-delivery or delayed-draw basis. The cost of these securities was $3,010 at December 31, 2013. |
| ‡ | This security, or a portion of this security, has been segregated to cover funding requirements on investment transactions settling in the future. |
The accompanying notes are an integral part of these financial statements.
| 10 |
Foreign Currency Contracts Outstanding at December 31, 2013
| Currency | Buy / Sell | Delivery Date | Counterparty | Contract Amount | Market Value ╪ | Unrealized Appreciation/ (Depreciation) | ||||||||||||
| AUD | Buy | 01/02/2014 | DEUT | $ | 634 | $ | 635 | $ | 1 | |||||||||
| CAD | Buy | 01/06/2014 | SSG | 24 | 24 | – | ||||||||||||
| CHF | Buy | 01/03/2014 | JPM | 1,398 | 1,393 | (5 | ) | |||||||||||
| EUR | Buy | 01/03/2014 | GSC | 41 | 41 | – | ||||||||||||
| EUR | Buy | 01/02/2014 | UBS | 1,980 | 1,978 | (2 | ) | |||||||||||
| EUR | Buy | 01/03/2014 | UBS | 59 | 59 | – | ||||||||||||
| JPY | Buy | 01/06/2014 | BCLY | 992 | 987 | (5 | ) | |||||||||||
| JPY | Sell | 01/06/2014 | BCLY | 1,980 | 1,970 | 10 | ||||||||||||
| JPY | Sell | 12/03/2014 | BCLY | 64,734 | 62,806 | 1,928 | ||||||||||||
| JPY | Sell | 12/03/2014 | BOA | 31,750 | 30,777 | 973 | ||||||||||||
| JPY | Sell | 12/03/2014 | CBK | 31,738 | 30,777 | 961 | ||||||||||||
| JPY | Sell | 12/03/2014 | DEUT | 5,955 | 5,891 | 64 | ||||||||||||
| JPY | Sell | 01/08/2014 | UBS | 135 | 135 | – | ||||||||||||
| SEK | Buy | 01/03/2014 | BCLY | 24 | 24 | – | ||||||||||||
| TWD | Sell | 01/02/2014 | JPM | 552 | 554 | (2 | ) | |||||||||||
| $ | 3,923 | |||||||||||||||||
| ╪ | See Significant Accounting Policies of accompanying Notes to Financial Statements regarding valuation of securities. |
| GLOSSARY: (abbreviations used in preceding Schedule of Investments) |
| Counterparty Abbreviations: | |
| BCLY | Barclays |
| BOA | Banc of America Securities LLC |
| CBK | Citibank NA |
| DEUT | Deutsche Bank Securities, Inc. |
| GSC | Goldman Sachs & Co. |
| JPM | JP Morgan Chase & Co. |
| SSG | State Street Global Markets LLC |
| UBS | UBS AG |
| Currency Abbreviations: | |
| AUD | Australian Dollar |
| CAD | Canadian Dollar |
| CHF | Swiss Franc |
| EUR | EURO |
| JPY | Japanese Yen |
| SEK | Swedish Krona |
| TWD | Taiwan Dollar |
| Index Abbreviations: | |
| S&P | Standard & Poors |
| Other Abbreviations: | |
| ADR | American Depositary Receipt |
| FFCB | Federal Farm Credit Bank |
| FHLMC | Federal Home Loan Mortgage Corp. |
| FNMA | Federal National Mortgage Association |
| GNMA | Government National Mortgage Association |
| PIPE | Private Investment in Public Equity |
| REIT | Real Estate Investment Trust |
The accompanying notes are an integral part of these financial statements.
| 11 |
| Hartford Capital Appreciation HLS Fund |
| Investment Valuation Hierarchy Level Summary |
| December 31, 2013 |
| (000’s Omitted) |
| Total | Level 1 ♦ | Level 2 ♦ | Level 3 | |||||||||||||
| Assets: | ||||||||||||||||
| Common Stocks | ||||||||||||||||
| Automobiles and Components | $ | 238,100 | $ | 214,860 | $ | 23,240 | $ | – | ||||||||
| Banks | 371,604 | 167,107 | 204,497 | – | ||||||||||||
| Capital Goods | 619,378 | 448,731 | 170,647 | – | ||||||||||||
| Commercial and Professional Services | 96,997 | 88,548 | 8,449 | – | ||||||||||||
| Consumer Durables and Apparel | 194,002 | 185,841 | 8,161 | – | ||||||||||||
| Consumer Services | 187,854 | 167,328 | 20,526 | – | ||||||||||||
| Diversified Financials | 520,589 | 419,744 | 95,201 | 5,644 | ||||||||||||
| Energy | 595,428 | 460,419 | 135,009 | – | ||||||||||||
| Food and Staples Retailing | 108,481 | 101,991 | 6,490 | – | ||||||||||||
| Food, Beverage and Tobacco | 286,628 | 165,878 | 120,750 | – | ||||||||||||
| Health Care Equipment and Services | 262,554 | 262,554 | – | – | ||||||||||||
| Household and Personal Products | 41,359 | 13,498 | 27,861 | – | ||||||||||||
| Insurance | 352,748 | 266,107 | 86,641 | – | ||||||||||||
| Materials | 300,806 | 225,085 | 71,187 | 4,534 | ||||||||||||
| Media | 195,697 | 168,815 | 26,882 | – | ||||||||||||
| Pharmaceuticals, Biotechnology and Life Sciences | 796,157 | 679,404 | 116,753 | – | ||||||||||||
| Real Estate | 50,286 | 50,286 | – | – | ||||||||||||
| Retailing | 542,679 | 459,410 | 43,254 | 40,015 | ||||||||||||
| Semiconductors and Semiconductor Equipment | 399,507 | 361,644 | 37,863 | – | ||||||||||||
| Software and Services | 734,674 | 664,746 | 67,458 | 2,470 | ||||||||||||
| Technology Hardware and Equipment | 312,750 | 301,404 | 7,942 | 3,404 | ||||||||||||
| Telecommunication Services | 78,994 | 34,041 | 44,953 | – | ||||||||||||
| Transportation | 326,704 | 326,704 | – | – | ||||||||||||
| Utilities | 82,653 | 49,983 | 32,670 | – | ||||||||||||
| Total | 7,696,629 | 6,284,128 | 1,356,434 | 56,067 | ||||||||||||
| Corporate Bonds | 328 | – | 328 | – | ||||||||||||
| Exchange Traded Funds | 3,416 | 3,416 | – | – | ||||||||||||
| Preferred Stocks | 76,201 | – | 76,201 | – | ||||||||||||
| Put Options Purchased | – | – | – | – | ||||||||||||
| Warrants | 147 | – | – | 147 | ||||||||||||
| Short-Term Investments | 184,438 | – | 184,438 | – | ||||||||||||
| Total | $ | 7,961,159 | $ | 6,287,544 | $ | 1,617,401 | $ | 56,214 | ||||||||
| Foreign Currency Contracts* | 3,937 | – | 3,937 | – | ||||||||||||
| Total | $ | 3,937 | $ | – | $ | 3,937 | $ | – | ||||||||
| Liabilities: | ||||||||||||||||
| Foreign Currency Contracts* | 14 | – | 14 | – | ||||||||||||
| Total | $ | 14 | $ | – | $ | 14 | $ | – | ||||||||
| ♦ | For the year ended December 31, 2013, investments valued at $16,496 were transferred from Level 1 to Level 2, and investments valued at $16,367 were transferred from Level 2 to Level 1. Investments are transferred between Level 1 and Level 2 for a variety of reasons including, but not limited to: |
| 1) | Foreign equities for which a fair value price is more representative of exit value than the local market close (transfer into Level 2). Foreign equities for which the local market close is more representative of exit value (transfer into Level 1). |
| 2) | U.S. Treasury securities that no longer represent the most recent issue (transfer into Level 2). |
| 3) | Equity investments with no observable trading but a bid or close price is used (transfer into Level 2). Equity investments using observable quoted prices in an active market (transfer into Level 1). |
| * | Derivative instruments (excluding purchased and written options, if applicable) are valued at the unrealized appreciation/depreciation on the investments. |
The accompanying notes are an integral part of these financial statements.
| 12 |
Following is a reconciliation of Level 3 assets for which significant unobservable inputs were used to determine fair value:
| Balance as of December 31, 2012 | Realized Gain (Loss) | Change in Unrealized Appreciation (Depreciation) | Net Amortization | Purchases | Sales | Transfers Into Level 3 | Transfers Out of Level 3 | Balance as of December 31, 2013 | ||||||||||||||||||||||||||||
| Assets: | ||||||||||||||||||||||||||||||||||||
| Common Stocks | $ | 34,559 | $ | 22,054 | $ | (7,936 | )* | $ | — | $ | 34,827 | $ | (27,437 | ) | $ | — | $ | — | $ | 56,067 | ||||||||||||||||
| Warrants | — | — | 145 | † | — | 4 | (2 | ) | — | — | 147 | |||||||||||||||||||||||||
| Total | $ | 34,559 | $ | 22,054 | $ | (7,791 | ) | $ | — | $ | 34,831 | $ | (27,439 | ) | $ | — | $ | — | $ | 56,214 | ||||||||||||||||
| * | Change in unrealized appreciation (depreciation) in the current period relating to assets still held at December 31, 2013 was $7,698. |
| † | Change in unrealized appreciation (depreciation) in the current period relating to assets still held at December 31, 2013 was $145. |
| Note: | For purposes of reporting transfers between different hierarchy levels, both transfers in and out of each level, as applicable, are shown as if they occurred at the beginning of the period. |
The accompanying notes are an integral part of these financial statements.
| 13 |
| Hartford Capital Appreciation HLS Fund |
| Statement of Assets and Liabilities |
| December 31, 2013 |
| (000’s Omitted) |
| Assets: | ||||
| Investments in securities, at market value (cost $6,471,948) | $ | 7,961,159 | ||
| Cash | 6,660 | |||
| Foreign currency on deposit with custodian (cost $87) | 87 | |||
| Unrealized appreciation on foreign currency contracts | 3,937 | |||
| Receivables: | ||||
| Investment securities sold | 46,159 | |||
| Fund shares sold | 1,759 | |||
| Dividends and interest | 6,056 | |||
| Other assets | — | |||
| Total assets | 8,025,817 | |||
| Liabilities: | ||||
| Unrealized depreciation on foreign currency contracts | 14 | |||
| Payables: | ||||
| Investment securities purchased | 19,609 | |||
| Fund shares redeemed | 5,674 | |||
| Investment management fees | 1,098 | |||
| Distribution fees | 53 | |||
| Accrued expenses | 557 | |||
| Total liabilities | 27,005 | |||
| Net assets | $ | 7,998,812 | ||
| Summary of Net Assets: | ||||
| Capital stock and paid-in-capital | $ | 5,541,617 | ||
| Undistributed net investment income | 6,200 | |||
| Accumulated net realized gain | 957,795 | |||
| Unrealized appreciation of investments and the translations of assets and liabilities denominated in foreign currency | 1,493,200 | |||
| Net assets | $ | 7,998,812 | ||
| Shares authorized | 5,000,000 | |||
| Par value | $ | 0.001 | ||
| Class IA: Net asset value per share | $ | 59.65 | ||
| Shares outstanding | 117,836 | |||
| Net assets | $ | 7,029,201 | ||
| Class IB: Net asset value per share | $ | 59.18 | ||
| Shares outstanding | 16,384 | |||
| Net assets | $ | 969,611 |
The accompanying notes are an integral part of these financial statements.
| 14 |
| Hartford Capital Appreciation HLS Fund |
| Statement of Operations |
| For the Year Ended December 31, 2013 |
| (000’s Omitted) |
| Investment Income: | ||||
| Dividends | $ | 127,843 | ||
| Interest | 104 | |||
| Less: Foreign tax withheld | (4,459 | ) | ||
| Total investment income, net | 123,488 | |||
| Expenses: | ||||
| Investment management fees | 50,473 | |||
| Transfer agent fees | 6 | |||
| Distribution fees - Class IB | 2,318 | |||
| Custodian fees | 180 | |||
| Accounting services fees | 1,381 | |||
| Board of Directors' fees | 215 | |||
| Audit fees | 108 | |||
| Other expenses | 1,115 | |||
| Total expenses (before fees paid indirectly) | 55,796 | |||
| Commission recapture | (334 | ) | ||
| Custodian fee offset | — | |||
| Total fees paid indirectly | (334 | ) | ||
| Total expenses, net | 55,462 | |||
| Net Investment Income | 68,026 | |||
| Net Realized Gain on Investments, Other Financial Instruments and Foreign Currency Transactions: | ||||
| Net realized gain on investments | 1,564,958 | |||
| Net realized loss on purchased options | (1,138 | ) | ||
| Net realized gain on futures | 194 | |||
| Net realized gain on foreign currency contracts | 26,556 | |||
| Net realized loss on other foreign currency transactions | (1,299 | ) | ||
| Net Realized Gain on Investments, Other Financial Instruments and Foreign Currency Transactions | 1,589,271 | |||
| Net Changes in Unrealized Appreciation of Investments and Foreign Currency Transactions: | ||||
| Net unrealized appreciation of investments | 984,567 | |||
| Net unrealized depreciation of purchased options | (361 | ) | ||
| Net unrealized appreciation of foreign currency contracts | 206 | |||
| Net unrealized appreciation on translation of other assets and liabilities in foreign currencies | 74 | |||
| Net Changes in Unrealized Appreciation of Investments and Foreign Currency Transactions | 984,486 | |||
| Net Gain on Investments, Other Financial Instruments and Foreign Currency Transactions | 2,573,757 | |||
| Net Increase in Net Assets Resulting from Operations | $ | 2,641,783 |
The accompanying notes are an integral part of these financial statements.
| 15 |
| Hartford Capital Appreciation HLS Fund |
| Statement of Changes in Net Assets |
| (000’s Omitted) |
| For the Year Ended December 31, 2013 | For the Year Ended December 31, 2012 | |||||||
| Operations: | ||||||||
| Net investment income | $ | 68,026 | $ | 111,091 | ||||
| Net realized gain on investments, other financial instruments and foreign currency transactions | 1,589,271 | 526,059 | ||||||
| Net unrealized appreciation of investments and foreign currency transactions | 984,486 | 921,257 | ||||||
| Net Increase in Net Assets Resulting from Operations | 2,641,783 | 1,558,407 | ||||||
| Distributions to Shareholders: | ||||||||
| From net investment income | ||||||||
| Class IA | (59,301 | ) | (113,065 | ) | ||||
| Class IB | (6,059 | ) | (10,365 | ) | ||||
| Total from net investment income | (65,360 | ) | (123,430 | ) | ||||
| From net realized gain on investments | ||||||||
| Class IA | (17,709 | ) | — | |||||
| Class IB | (2,473 | ) | — | |||||
| Total from net realized gain on investments | (20,182 | ) | — | |||||
| Total distributions | (85,542 | ) | (123,430 | ) | ||||
| Capital Share Transactions: | ||||||||
| Class IA | ||||||||
| Sold | 232,572 | 251,349 | ||||||
| Issued on reinvestment of distributions | 77,010 | 113,065 | ||||||
| Redeemed | (3,293,542 | ) | (2,056,141 | ) | ||||
| Total capital share transactions | (2,983,960 | ) | (1,691,727 | ) | ||||
| Class IB | ||||||||
| Sold | 67,775 | 60,463 | ||||||
| Issued on reinvestment of distributions | 8,532 | 10,365 | ||||||
| Redeemed | (275,086 | ) | (460,000 | ) | ||||
| Total capital share transactions | (198,779 | ) | (389,172 | ) | ||||
| Net decrease from capital share transactions | (3,182,739 | ) | (2,080,899 | ) | ||||
| Net Decrease in Net Assets | (626,498 | ) | (645,922 | ) | ||||
| Net Assets: | ||||||||
| Beginning of period | 8,625,310 | 9,271,232 | ||||||
| End of period | $ | 7,998,812 | $ | 8,625,310 | ||||
| Undistributed (distribution in excess of) | ||||||||
| net investment income | $ | 6,200 | $ | (2,150 | ) | |||
| Shares: | ||||||||
| Class IA | ||||||||
| Sold | 4,446 | 6,122 | ||||||
| Issued on reinvestment of distributions | 1,320 | 2,632 | ||||||
| Redeemed | (66,631 | ) | (49,673 | ) | ||||
| Total share activity | (60,865 | ) | (40,919 | ) | ||||
| Class IB | ||||||||
| Sold | 1,338 | 1,472 | ||||||
| Issued on reinvestment of distributions | 147 | 243 | ||||||
| Redeemed | (5,413 | ) | (11,267 | ) | ||||
| Total share activity | (3,928 | ) | (9,552 | ) | ||||
The accompanying notes are an integral part of these financial statements.
| 16 |
| Hartford Capital Appreciation HLS Fund |
| Notes to Financial Statements |
| December 31, 2013 |
| (000’s Omitted) |
| 1. | Organization: |
Hartford Capital Appreciation HLS Fund (the “Fund”) serves as an underlying investment option for certain variable annuity and variable life insurance separate accounts of Hartford Life Insurance Company (“HLIC”) and its affiliates and certain qualified retirement plans. The Fund may also serve as an underlying investment option for certain variable annuity and variable life separate accounts of other insurance companies. Owners of variable annuity contracts and policyholders of variable life insurance contracts may choose the funds permitted in the variable insurance contract prospectus. In addition, participants in certain qualified retirement plans may choose the Fund if permitted by their plans.
Hartford Series Fund, Inc. (the “Company”) is an open-end registered management investment company comprised of thirty portfolios. Financial statements for the Fund, a series of the Company, are included in this report.
The Company is organized under the laws of the State of Maryland and is registered with the Securities and Exchange Commission (“SEC”) under the Investment Company Act of 1940, as amended (“1940 Act”). The Fund is a diversified open-end management investment company.
The Fund is divided into Class IA and Class IB shares. Each class is offered at the per share net asset value (“NAV”) without a sales charge and is subject to the same expenses, except that the Class IB shares are subject to distribution and service fees charged pursuant to a Distribution Plan adopted in accordance with Rule 12b-1 under the 1940 Act.
| 2. | Significant Accounting Policies: |
The following is a summary of significant accounting policies of the Fund in the preparation of its financial statements, which are in accordance with United States Generally Accepted Accounting Principles (“U.S. GAAP”). The preparation of financial statements in accordance with U.S. GAAP may require management to make estimates and assumptions that affect the reported amounts of assets and liabilities and disclosure of contingent assets and liabilities at the date of the financial statements and the reported amounts of increases and decreases in net assets from operations during the reporting period. Actual results could differ from those estimates.
| a) | Determination of Net Asset Value – The NAV of each class of the Fund’s shares is determined as of the close of regular trading (normally 4:00 p.m. Eastern Time) (the “NYSE Close”) on each day that the New York Stock Exchange (the “Exchange”) is open (“Valuation Date”). Information that becomes known to the Fund after the NAV has been calculated on a particular day will not generally be used to retroactively adjust the NAV determined earlier that day. |
| b) | Investment Valuation and Fair Value Measurements – For purposes of calculating the NAV, portfolio investments and other assets held by the Fund's portfolio for which market quotes are readily available are valued at market value. Market value is generally determined on the basis of last reported sales prices or official close price. If no sales are reported, market value is based on quotes obtained from a quotation reporting system, established market makers, or independent pricing services. If market prices are not readily available or are deemed unreliable, the Fund will use the fair value of the investment as determined in good faith under policies and procedures established by and under the supervision of the Company’s Board of Directors. Market quotes are considered not readily available where there is an absence of current or reliable market-based data (e.g., trade information or indicative market quotes), including where events occur after the close of the relevant market, but prior to the NYSE Close, that materially affect the values of the Fund’s portfolio investments or assets. In addition, market quotes are considered not readily available when, due to extraordinary circumstances, the exchanges or markets on which the investments trade do not open for trading for the entire day and no other market prices are available. In addition, prices of foreign equities that are principally traded on certain foreign markets may be adjusted daily pursuant to a fair value pricing service approved by the Board of Directors in order to reflect an adjustment for the factors occurring after the close of certain foreign markets but before the NYSE Close. Investments that are primarily traded on foreign markets may trade on days that are not business days of the Fund. The value of the foreign investments in which the Fund invests may change on days when a shareholder will not be able to purchase or redeem shares of the Fund. Fair value pricing is subjective in nature and the use of fair |
| 17 |
| Hartford Capital Appreciation HLS Fund |
| Notes to Financial Statements – (continued) |
| December 31, 2013 |
| (000’s Omitted) |
| value pricing by the Fund may cause the NAV of its shares to differ significantly from the NAV that would have been calculated using market prices at the close of the exchange on which a portfolio investment is primarily traded. There can be no assurance that the Fund could obtain the fair market value assigned to an investment if the Fund were to sell the investment at approximately the time at which the Fund determines its NAV. |
Fixed income investments (other than short-term obligations), non-exchange traded derivatives and centrally cleared swaps held by the Fund are normally valued on the basis of quotes obtained from brokers and dealers or independent pricing services in accordance with procedures established by the Company’s Board of Directors. Prices obtained from independent pricing services use information provided by market makers or estimates of market values through accepted market modeling, trading and pricing conventions. Inputs to the models may include, but are not limited to, prepayment speeds, pricing spread, yield, trade information, dealer quotes, market color, cash flow models and the investment’s terms and conditions. Generally, the Fund may use fair valuation in regard to fixed income investments when the Fund holds defaulted or distressed investments or investments in a company in which a reorganization is pending. Short-term investments maturing in 60 days or less are generally valued at amortized cost, if their original term to maturity was 60 days or less, or by amortizing their value on the 61st day prior to maturity, if the original term to maturity exceeded 60 days.
Exchange traded options, futures and options on futures are valued at the settlement price or last trade price determined by the relevant exchange as of the NYSE Close. If the last trade price for exchange traded options does not fall between the bid and ask prices, the value will be the mean of the bid and ask prices as of the NYSE Close. If a last trade price is not available, the value will be the mean of the bid and ask prices as of the NYSE Close. If a mean of the bid and ask prices cannot be calculated for the day, the value will be the bid price as of the NYSE Close. In the case of OTC options and such instruments that do not trade on an exchange, values may be supplied by a pricing service using a formula or other objective method that may take into consideration the style, direction, expiration, strike price, notional value and volatility or other special adjustments.
Investments valued in currencies other than U.S. dollars are converted to U.S. dollars using exchange rates obtained from independent pricing services for calculation of the NAV. As a result, the NAV of the Fund’s shares may be affected by changes in the value of currencies in relation to the U.S. dollar. The value of investments traded in markets outside the United States or denominated in currencies other than the U.S. dollar may be affected significantly on a day that the NYSE is closed and the market value may change on days when an investor is not able to purchase, redeem or exchange shares of the Fund.
Foreign currency contracts represent agreements to exchange currencies on specific future dates at predetermined rates. Foreign currency contracts are valued using foreign currency exchange rates and forward rates as provided by an independent pricing service on the Valuation Date.
Financial instruments for which prices are not available from an independent pricing service may be valued using market quotations obtained from one or more dealers that make markets in the respective financial instrument in accordance with procedures established by the Company’s Board of Directors.
U.S. GAAP defines fair value as the price that the Fund would receive to sell an asset or pay to transfer a liability in an orderly transaction between market participants. The U.S. GAAP fair value measurement standards require disclosure of a fair value hierarchy for each major category of assets and liabilities. Various inputs are used in determining the fair value of the Fund’s investments. These inputs are summarized into three broad hierarchy levels. This hierarchy is based on whether the valuation inputs are observable or unobservable. These levels are:
| · | Level 1 – Quoted prices in active markets for identical investments. Level 1 may include exchange traded instruments, such as domestic equities, some foreign equities, options, futures, mutual funds, exchange traded funds, rights and warrants. |
| 18 |
| · | Level 2 – Observable inputs other than Level 1 prices, such as quoted prices for similar investments; quoted prices in markets that are not active; or other inputs that are observable or can be corroborated by observable market data. Level 2 may include debt investments that are traded less frequently than exchange traded instruments and which are valued using independent pricing services; foreign equities, which are principally traded on certain foreign markets and are adjusted daily pursuant to a fair value pricing service in order to reflect an adjustment for the factors occurring after the close of certain foreign markets but before the NYSE Close; senior floating rate interests, which are valued using an aggregate of dealer bids; short-term investments, which are valued at amortized cost; and swaps, which are valued based upon the terms of each swap contract. |
| · | Level 3 – Significant unobservable inputs that are supported by limited or no market activity. Level 3 may include financial instruments whose values are determined using indicative market quotes or require significant management judgment or estimation. These unobservable valuation inputs may include estimates for current yields, maturity/duration, prepayment speed, and indicative market quotes for comparable investments along with other assumptions relating to credit quality, collateral value, complexity of the investment structure, general market conditions and liquidity. This category may include investments where trading has been halted or there are certain restrictions on trading. While these investments are priced using unobservable inputs, the valuation of these investments reflects the best available data and management believes the prices are a reasonable representation of exit price. |
The Board of Directors of the Company generally reviews and approves the “Procedures for Valuation of Portfolio Securities” on an annual basis. These procedures define how investments are to be valued, including the formation and activities of a Valuation Committee. The Valuation Committee is responsible for determining in good faith the fair value of investments when the value cannot be obtained from primary pricing services or alternative sources or if the valuation of an investment as provided by the primary pricing service or alternative source is believed not to reflect the investment’s fair value as of the Valuation Date. Voting members of the Valuation Committee include the Fund’s Treasurer or designee and a Vice President of the investment manager or designee. An Assistant Vice President of the Fund with legal expertise or designee is also included on the Valuation Committee as a non-voting advisory member. In addition, the Fund’s Chief Compliance Officer shall designate a member of the compliance group to attend Valuation Committee meetings as a non-voting resource, to monitor for and provide guidance with respect to compliance with these procedures. Two members of the Valuation Committee or their designees, representing different departments, shall constitute a quorum for purposes of permitting the Valuation Committee to take action. The Valuation Committee will consider all relevant factors in determining an investment’s fair value, and may seek the advice of the Fund’s sub-adviser, knowledgeable brokers, and legal counsel in making such determination. The Valuation Committee reports to the Audit Committee of the Company’s Board of Directors. The Audit Committee receives quarterly written reports which include details of all fair-valued investments, including the reason for the fair valuation, and an indication, when possible, of the accuracy of the valuation by disclosing the next available reliable public price quotation or the disposition price of such investments (the “look-back” test). The Board of Directors then must consider for ratification all of the fair value determinations made during the previous quarter.
| Valuation levels are not necessarily indicative of the risk associated with investing in such investments. Individual investments within any of the above mentioned asset classes may be assigned a different hierarchical level than those presented above, as individual circumstances dictate. |
| For additional information, refer to the Investment Valuation Hierarchy Level Summary and the Level 3 roll-forward reconciliation, if applicable, which follow the Schedule of Investments. |
| c) | Investment Transactions and Investment Income – Investment transactions are recorded as of the trade date (the date the order to buy or sell is executed) for financial reporting purposes. Investments purchased or sold on a when-issued or |
| 19 |
| Hartford Capital Appreciation HLS Fund |
| Notes to Financial Statements – (continued) |
| December 31, 2013 |
| (000’s Omitted) |
| delayed-delivery basis may be settled a month or more after the trade date. Realized gains and losses are determined on the basis of identified cost. |
Dividend income from domestic securities is accrued on the ex-dividend date. In general, dividend income from foreign securities is recorded on the ex-date; however, dividend notifications in certain foreign jurisdictions may not be available in a timely manner and as a result, the Fund will record the dividend as soon as the relevant details (i.e., rate per share, payment date, shareholders of record, etc.) are publicly available. Interest income, including amortization of premium, accretion of discounts and additional principal received in-kind in lieu of cash, is accrued on a daily basis.
| d) | Foreign Currency Transactions – Assets and liabilities denominated in currencies other than U.S. dollars are translated into U.S. dollars at the exchange rates in effect on the valuation date. Purchases and sales of investments, income and expenses are translated into U.S. dollars at the exchange rates on the dates of such transactions. |
The Fund does not isolate that portion of portfolio investment valuation resulting from fluctuations in the foreign currency exchange rates from the fluctuations arising from changes in the market prices of investments held. Exchange rate fluctuations are included with the net realized and unrealized gain or loss on investments in the accompanying financial statements.
Net realized foreign exchange gains or losses arise from sales of foreign currencies and the difference between asset and liability amounts initially stated in foreign currencies and the U.S. dollar value of the amounts actually received or paid. Net unrealized foreign exchange gains or losses arise from changes in the value of other assets and liabilities at the end of the reporting period, resulting from changes in the exchange rates.
| e) | Joint Trading Account – The Fund may invest cash balances into a joint trading account that may be invested in one or more repurchase agreements. |
| f) | Fund Share Valuation and Dividend Distributions to Shareholders – Orders for the Fund’s shares are executed in accordance with the investment instructions of the contract holders and plan participants. The NAV of the Fund’s shares is determined as of the close of business on each business day of the Exchange. The NAV is determined separately for each class of shares of the Fund by dividing the Fund’s net assets attributable to that class by the number of shares of the class outstanding. Each class of shares offered by the Fund has equal rights as to assets and voting privileges (except that shareholders of a class have exclusive voting rights regarding any matter relating solely to that class of shares). Income and non-class specific expenses are allocated daily to each class on the basis of the relative net assets of the class. Realized and unrealized gains and losses are allocated daily based on the relative net assets of each class of shares of the Fund. |
Orders for the purchase of the Fund’s shares received prior to the close of the Exchange on any day the Exchange is open for business are priced at the NAV determined as of the close of the Exchange. Orders received after the close of the Exchange, or on a day on which the Exchange and/or the Fund is not open for business, are priced at the next determined NAV.
Dividends are declared pursuant to a policy adopted by the Company’s Board of Directors based upon the investment performance of the Fund. The policy of the Fund is to pay dividends from net investment income and realized gains, if any, at least once a year.
Distributions from net investment income, net realized gains and capital are determined in accordance with federal income tax regulations, which may differ from U.S. GAAP with respect to character and timing. These differences may include, but are not limited to, losses deferred due to wash sale adjustments, foreign currency gains and losses, adjustments related to Passive Foreign Investment Companies (“PFICs”), Real Estate Investment Trusts (“REITs”), Regulated Investment Companies (“RICs”), certain derivatives and partnerships. Permanent book and federal income tax basis differences relating to shareholder distributions will result in reclassifications to certain of the Fund’s capital accounts (see Federal Income Taxes: Reclassification of Capital Accounts note).
| 20 |
| 3. | Securities and Other Investments: |
| a) | Repurchase Agreements – A repurchase agreement is an agreement by which a counterparty agrees to sell an investment and agrees to repurchase the investment sold from the buyer at a mutually agreed upon time and price. During the period of the repurchase agreement, the counterparty will deposit cash and or securities in a third party custodial account to serve as collateral. At the time the Fund enters into a repurchase agreement, the value of the underlying collateral, including accrued interest, will be equal to or exceed the value of the repurchase agreement. Repurchase agreements expose the Fund to counterparty risk - that is, the risk that the counterparty will not fulfill its obligations. To minimize counterparty risk, the investments that serve to collateralize the repurchase agreement are held by the Fund’s custodian in book entry or physical form in the custodial account of the Fund or in a third party custodial account. Repurchase agreements are valued at cost plus accrued interest, which approximates fair value. Repurchase agreements have master netting arrangements which allow the Fund to offset amounts owed to a counterparty with amounts owed by the counterparty, including any collateral. Upon an event of default under a master repurchase agreement, the non-defaulting party may close out all transactions traded under such agreement and net amounts owed under each transaction to one net amount payable by one party to the other. Absent an event of default, the master repurchase agreement does not result in an offset of reported amounts of assets and liabilities in the Statement of Assets and Liabilities across transactions between the Fund and the applicable counterparty. The Fund, as shown on the Schedule of Investments, had outstanding repurchase agreements and related collateral as of December 31, 2013. |
| b) | Illiquid and Restricted Investments – The Fund is permitted to invest up to 15% of its net assets in illiquid investments. Illiquid investments are those that may not be sold or disposed of in the ordinary course of business within seven days, at approximately the price used to determine the Fund’s NAV. The Fund may not be able to sell illiquid investments when its sub-adviser considers it desirable to do so or may have to sell such investments at a price that is lower than the price that could be obtained if the investments were more liquid. A sale of illiquid investments may require more time and may result in higher dealer discounts and other selling expenses than does the sale of those that are liquid. Illiquid investments also may be more difficult to value due to the unavailability of reliable market quotations for such investments, and an investment in them may have an adverse impact on the Fund’s NAV. The Fund may also purchase certain restricted investments that can only be resold to certain qualified investors and may be determined to be liquid pursuant to policies and guidelines established by the Company’s Board of Directors. The Fund, as shown on the Schedule of Investments, had illiquid and/or restricted investments as of December 31, 2013. |
| c) | Investments Purchased on a When-Issued or Delayed-Delivery Basis – Delivery and payment for investments that have been purchased by the Fund on a forward commitment, or when-issued or delayed-delivery basis, take place beyond the customary settlement period. The Fund may dispose of or renegotiate a delayed-delivery transaction after it is entered into, and may sell delayed-delivery investments before they are delivered, which may result in a realized gain or loss. During this period, such investments are subject to market fluctuations, and the Fund identifies investments segregated in its records with a value at least equal to the amount of the commitment. The Fund, as shown on the Schedule of Investments, had when-issued or delayed-delivery investments as of December 31, 2013. |
| 4. | Financial Derivative Instruments: |
The following disclosures contain information on how and why the Fund uses derivative instruments, the credit-risk-related contingent features in certain derivative instruments, and how derivative instruments affect the Fund’s financial position and results of operations. The location and fair value amounts of these instruments on the Statement of Assets and Liabilities and the realized gains and losses and changes in unrealized gains and losses on the Statement of Operations, each categorized by type of derivative contract, are included in the following Additional Derivative Instrument Information footnote. The derivative instruments outstanding as of year-end are disclosed in the notes to or within the Schedule of Investments for purchased options, if applicable. The amounts of realized gains and losses and changes in unrealized gains and losses on derivative instruments during the year are disclosed in the Statement of Operations.
| 21 |
| Hartford Capital Appreciation HLS Fund |
| Notes to Financial Statements – (continued) |
| December 31, 2013 |
| (000’s Omitted) |
| a) | Foreign Currency Contracts – The Fund may enter into foreign currency contracts that obligate the Fund to purchase or sell currencies at specified future dates. Foreign currency contracts are used to hedge the currency exposure associated with some or all of the Fund’s investments and/or as part of an investment strategy. Foreign currency contracts are marked to market daily and the change in value is recorded by the Fund as an unrealized gain or loss. The Fund will record a realized gain or loss when the foreign currency contract is settled. |
Foreign currency contracts involve elements of market risk in excess of the amounts reflected in the Statement of Assets and Liabilities. In addition, risks may arise upon entering into these contracts from the potential inability of the counterparties to meet the terms of the contracts and from unanticipated movements in the value of the foreign currencies relative to the U.S. dollar. The Fund had outstanding foreign currency contracts as shown on the Schedule of Investments as of December 31, 2013.
| b) | Futures Contracts – The Fund may enter into futures contracts. A futures contract is an agreement between two parties to buy or sell an asset at a set price on a future date. The Fund uses futures contracts to manage or obtain exposure to the investment markets, commodities, or movements in interest rates and currency values. The primary risks associated with the use of futures contracts are the imperfect correlation between the change in market value of the investments held by the Fund and the prices of futures contracts and the possibility of an illiquid market. Upon entering into a futures contract, the Fund is required to deposit with a futures commission merchant (“FCM”) an amount of cash or U.S. Government or Agency Obligations in accordance with the initial margin requirements of the broker or exchange. Futures contracts are marked to market daily at the most recent settlement price reported by an exchange on which, over time, they are traded most extensively, and an appropriate payable or receivable for the change in value (“variation margin”) is recorded by the Fund. Gains or losses are recognized but not considered realized until the contracts expire or are closed. Futures contracts involve, to varying degrees, risk of loss in excess of the variation margin disclosed on the Statement of Assets and Liabilities; however, the Fund seeks to reduce this risk through the use of an FCM. As of December 31, 2013, the Fund had no outstanding futures contracts. |
| c) | Options Contracts – An option contract is a contract sold by one party to another party that offers the buyer the right, but not the obligation, to buy (call) or sell (put) an investment or other financial asset at an agreed-upon price during a specific period of time or on a specific date. The Fund may write (sell) covered call and put options on futures, swaps (“swaptions”), securities, commodities or currencies. “Covered” means that so long as the Fund is obligated as the writer of an option, it will own either the underlying investments or currency or an option to purchase the same underlying investments or currency having an expiration date of the covered option and an exercise price equal to or less than the exercise price of the covered option, or will pledge cash or other liquid investments having a value equal to or greater than the fluctuating market value of the option investment or currency. Writing put options increases the Fund’s exposure to the underlying instrument. Writing call options decreases the Fund’s exposure to the underlying instrument. Premiums received from writing options that expire are treated as realized gains. Premiums received from writing options that are exercised or closed are added to the proceeds or offset amounts paid on the underlying futures, swap, investment or currency transaction to determine the realized gain or loss. The Fund as a writer of an option has no control over whether the underlying instrument may be sold (call) or purchased (put) and as a result bears the market risk of an unfavorable change in the price of the instrument underlying the written option. There is the risk the Fund may not be able to enter into a closing transaction because of an illiquid market. The Fund may also purchase put and call options. Purchasing call options increases the Fund’s exposure to the underlying instrument. Purchasing put options decreases the Fund’s exposure to the underlying instrument. The Fund pays a premium, which is included on the Fund’s Statement of Assets and Liabilities as an investment and is subsequently marked to market to reflect the current value of the option. Premiums paid for purchasing options that expire are treated as realized losses. Certain options may be purchased with premiums to be determined on a future date. The premiums for these options are based upon implied volatility parameters at specified terms. The risk associated with purchasing put and call options is generally limited to the premium paid. Premiums paid for purchasing options that are exercised or closed are added to the amounts paid or offset against the proceeds on the underlying investment transaction to determine the realized gain or loss. Entering into over-the-counter options also exposes the Fund to counterparty risk. Counterparty risk is the possibility that the counterparty to the agreements may default on its obligation to perform or disagree as to the meaning of the contractual terms in the agreements. The Fund, as shown on the Schedule of Investments, had outstanding purchased options |
| 22 |
| contracts as of December 31, 2013. The Fund had no outstanding written options contracts as of December 31, 2013. There were no transactions involving written options contracts during the year ended December 31, 2013. |
| d) | Additional Derivative Instrument Information: |
Fair Value of Derivative Instruments on the Statement of Assets and Liabilities as of December 31, 2013:
| Risk Exposure Category | ||||||||||||||||||||||||||||
| Interest Rate Contracts | Foreign Exchange Contracts | Credit Contracts | Equity Contracts | Commodity Contracts | Other Contracts | Total | ||||||||||||||||||||||
| Assets: | ||||||||||||||||||||||||||||
| Investments in securities, at value (purchased options), market value | $ | — | $ | — | $ | — | $ | — | $ | — | $ | — | $ | — | ||||||||||||||
| Unrealized appreciation on foreign currency contracts | — | 3,937 | — | — | — | — | 3,937 | |||||||||||||||||||||
| Total | $ | — | $ | 3,937 | $ | — | $ | — | $ | — | $ | — | $ | 3,937 | ||||||||||||||
| Liabilities: | ||||||||||||||||||||||||||||
| Unrealized depreciation on foreign currency contracts | $ | — | $ | 14 | $ | — | $ | — | $ | — | $ | — | $ | 14 | ||||||||||||||
| Total | $ | — | $ | 14 | $ | — | $ | — | $ | — | $ | — | $ | 14 | ||||||||||||||
| The volume of derivatives that is presented in the Schedule of Investments is consistent with the derivative activity during the year ended December 31, 2013. |
The Effect of Derivative Instruments on the Statement of Operations for the year ended December 31, 2013:
| Risk Exposure Category | ||||||||||||||||||||||||||||
| Interest Rate Contracts | Foreign Exchange Contracts | Credit Contracts | Equity Contracts | Commodity Contracts | Other Contracts | Total | ||||||||||||||||||||||
| Realized Gain (Loss) on Derivatives Recognized as a Result of Operations: | ||||||||||||||||||||||||||||
| Net realized loss on purchased options | $ | — | $ | — | $ | — | $ | (1,138 | ) | $ | — | $ | — | $ | (1,138 | ) | ||||||||||||
| Net realized gain on futures | — | — | — | 194 | — | — | 194 | |||||||||||||||||||||
| Net realized gain on foreign currency contracts | — | 26,556 | — | — | — | — | 26,556 | |||||||||||||||||||||
| Total | $ | — | $ | 26,556 | $ | — | $ | (944 | ) | $ | — | $ | — | $ | 25,612 | |||||||||||||
| Net Change in Unrealized Appreciation (Depreciation) on Derivatives Recognized as a Result of Operations: | ||||||||||||||||||||||||||||
| Net change in unrealized depreciation of investments in purchased options | $ | — | $ | — | $ | — | $ | (361 | ) | $ | — | $ | — | $ | (361 | ) | ||||||||||||
| Net change in unrealized appreciation of foreign currency contracts | — | 206 | — | — | — | — | 206 | |||||||||||||||||||||
| Total | $ | — | $ | 206 | $ | — | $ | (361 | ) | $ | — | $ | — | $ | (155 | ) | ||||||||||||
| e) | Balance Sheet Offsetting Information: |
Set forth below are tables which disclose both gross information and net information about instruments and transactions eligible for offset in the financial statements, and instruments and transactions that are subject to a master netting arrangement, as well as amounts related to margin, reflected as financial collateral (including cash collateral), held at clearing brokers, counterparties and the Fund’s custodian. The master netting arrangements allow the clearing brokers to net any collateral held in or on behalf of the Fund, or liabilities or payment obligations of the clearing brokers to the Fund, against any liabilities or payment obligations of the Fund to the clearing brokers. The Fund is required to deposit financial collateral (including cash collateral) at the Fund’s custodian on behalf of clearing brokers and counterparties to continually meet the original and maintenance requirements established by the clearing brokers and counterparties. Such requirements are specific to the respective clearing broker or counterparty.
| 23 |
| Hartford Capital Appreciation HLS Fund |
| Notes to Financial Statements – (continued) |
| December 31, 2013 |
| (000’s Omitted) |
Offsetting of Financial Assets and Derivative Assets as of December 31, 2013:
| Gross Amounts* of Assets Presented in Statement of Assets and Liabilities | Financial Instruments with Allowable Netting | Collateral Received | Net Amount (not less than $0) | |||||||||||||
| Description | ||||||||||||||||
| Unrealized appreciation on foreign currency contracts | $ | 3,926 | $ | — | $ | — | $ | 3,926 | ||||||||
| Total subject to a master netting or similar arrangement | $ | 3,926 | $ | — | $ | — | $ | 3,926 | ||||||||
* Gross amounts presented as no amounts are netted within the Statements of Assets and Liabilities.
| Certain derivatives held by the Fund, as of December 31, 2013, are not subject to a master netting arrangement and are excluded from the table above. |
| 5. | Principal Risks: |
| Credit risk depends largely on the perceived financial health of bond issuers. In general, the credit rating is inversely related to the credit risk of the issuer. Higher rated bonds generally are deemed to have less credit risk, while lower or unrated bonds are deemed to have higher risk of default. The share price, yield and total return of a fund that holds securities with higher credit risk may be more volatile than those of a fund that holds bonds with lower credit risk. Similar to credit risk, the Fund may be exposed to counterparty risk, or the risk that an institution or other entity with which the Fund has unsettled or open transactions will default. |
| The Fund’s investments expose the Fund to various risks including, but not limited to, interest rate, prepayment, extension, foreign currency and equity risks. Interest rate risk is the risk that fixed income securities will decline in value because of changes in interest rates. As nominal interest rates rise, the values of certain fixed income securities held by the Fund are likely to decrease. A nominal interest rate can be described as the sum of a real interest rate and an expected inflation rate. Fixed income securities with longer durations tend to be more sensitive to changes in interest rates, usually making them more volatile than securities with shorter durations. Duration is useful primarily as a measure of the sensitivity of a fixed income security’s market price to interest rate (i.e., yield) movements. In addition, securities are subject to extension risk. Rising interest rates may cause prepayments to occur at a slower than expected rate, thereby effectively lengthening the maturity of the security and making the security more sensitive to interest rate changes. Prepayment and extension risk are major risks of mortgage backed securities and certain asset backed securities. For certain asset backed securities, the actual maturity may be less than the stated maturity shown in the Schedule of Investments, if applicable. As a result, the timing of income recognition relating to these securities may vary based upon the actual maturity. |
| If the Fund invests directly in foreign currencies or in securities that trade in, and receive revenues in, foreign currencies, or in derivatives that provide exposure to foreign currencies, it will be subject to the risk that those currencies will decline in value relative to the base currency (U.S. dollars) of the Fund, or, in the case of hedging positions, that the Fund’s base currency will decline in value relative to the currency being hedged. Currency rates in foreign countries may fluctuate significantly over short periods of time for a number of reasons, including changes in interest rates, intervention (or the failure to intervene) by U.S. or foreign governments, central banks or supranational entities, such as the International Monetary Fund, or by the imposition of currency controls or other political developments in the United States or abroad. As a result, the Fund’s investments in foreign currency denominated securities may reduce the returns of the Fund. The market values of equity securities, such as common stocks and preferred stocks, or equity related investments, such as futures and options, may decline due to general market conditions which are not specifically related to a particular company, such as real or perceived adverse economic conditions, changes in the general outlook for corporate earnings, changes in interest or currency rates or adverse investor sentiment generally. The market value of equity securities may also decline due to factors which affect a particular industry or industries, such as labor shortages or increased production costs and competitive conditions within |
| 24 |
| an industry. Equity securities and equity related investments generally have greater market price volatility than fixed income securities. |
| 6. | Federal Income Taxes: |
| a) | Federal Income Taxes – For federal income tax purposes, the Fund intends to continue to qualify as a RIC under Subchapter M of the Internal Revenue Code (“IRC”) by distributing substantially all of its taxable net investment income and net realized capital gains to its shareholders and otherwise complying with the requirements of the IRC. The Fund has distributed substantially all of its income and capital gains in prior years, if applicable, and intends to distribute substantially all of its income and capital gains prior to the next fiscal year-end. Accordingly, no provision for federal income or excise taxes has been made in the accompanying financial statements. Distributions from short-term capital gains are treated as ordinary income distributions for federal income tax purposes. |
| b) | Net Investment Income (Loss), Net Realized Gains (Losses) and Distributions – Net investment income (loss) and net realized gains (losses) may differ for financial statement and tax purposes primarily because of losses deferred due to wash sale adjustments, foreign currency gains and losses, adjustments related to PFICs, REITs, RICs, certain derivatives and partnerships. The character of distributions made during the year from net investment income or net realized gains may differ from their ultimate characterization for federal income tax purposes. Also, due to the timing of dividend distributions, the fiscal year in which amounts are distributed may differ from the year that the income or realized gains (losses) were recorded by the Fund. |
| c) | Distributions and Components of Distributable Earnings – The tax character of distributions paid by the Fund for the periods indicated is as follows (as adjusted for dividends payable, if applicable): |
| For the Year Ended December 31, 2013 | For the Year Ended December 31, 2012 | |||||||
| Ordinary Income | $ | 85,542 | $ | 123,430 | ||||
As of December 31, 2013, the Fund’s components of distributable earnings (deficit) on a tax basis were as follows:
| Amount | ||||
| Undistributed Ordinary Income | $ | 371,714 | ||
| Undistributed Long-Term Capital Gain | 655,691 | |||
| Unrealized Appreciation* | 1,429,790 | |||
| Total Accumulated Earnings | $ | 2,457,195 | ||
| * | Differences between book-basis and tax-basis unrealized appreciation (depreciation) may be attributable to the losses deferred due to wash sale adjustments, foreign currency gains and losses, adjustments related to PFICs, REITs, RICs, certain derivatives and partnerships. |
| 25 |
| Hartford Capital Appreciation HLS Fund |
| Notes to Financial Statements – (continued) |
| December 31, 2013 |
| (000’s Omitted) |
| d) | Reclassification of Capital Accounts – The Fund may record reclassifications in its capital accounts. These reclassifications have no impact on the total net assets of the Fund. The reclassifications are a result of permanent differences between U.S. GAAP and tax accounting for such items as foreign currency, PFICs, expiration or utilization of capital loss carryforwards or net operating losses. Adjustments are made to reflect the impact these items have on current and future distributions to shareholders. Therefore, the source of the Fund’s distributions may be shown in the accompanying Statement of Changes in Net Assets as from undistributed net investment income, from accumulated net realized gains on investments or from capital depending on the type of book and tax differences that exist. For the year ended December 31, 2013, the Fund recorded reclassifications to increase (decrease) the accounts listed below: |
| Amount | ||||
| Undistributed Net Investment Income (Loss) | $ | 5,684 | ||
| Accumulated Net Realized Gain (Loss) | (4,701 | ) | ||
| Capital Stock and Paid-in-Capital | (983 | ) | ||
| e) | Capital Loss Carryforward – On December 22, 2010, the Regulated Investment Company Modernization Act of 2010 (the “Act”) was enacted, which made changes to the capital loss carryforward rules. The changes are effective for taxable years beginning after the date of enactment. Under the Act, funds are permitted to carry forward capital losses for an unlimited period. However, any losses incurred during those future taxable years will be required to be utilized prior to the losses incurred in pre-enactment taxable years, which carry an expiration date. As a result of this ordering rule, pre-enactment capital loss carryforwards may be more likely to expire unused. Additionally, post-enactment capital loss carryforwards retain their character as either short-term or long-term capital losses rather than being considered all short-term as permitted under prior regulation. |
The Fund had no capital loss carryforward for U.S. federal income tax purposes as of December 31, 2013.
During the year ended December 31, 2013, the Fund utilized $435,246 of prior year capital loss carryforwards.
| f) | Accounting for Uncertainty in Income Taxes – The Fund has adopted financial reporting rules that require the Fund to analyze all open tax years, as defined by the statute of limitations, for all major jurisdictions. Generally, tax authorities can examine all tax returns filed for the last three years. The Fund does not have an examination in progress. |
The Fund has reviewed all open tax years and major jurisdictions and concluded that these financial reporting rules had no effect on the Fund’s financial position or results of operations. There is no tax liability resulting from unrecognized tax benefits relating to uncertain income tax positions taken or expected to be taken on the tax return for the fiscal year ended December 31, 2013. The Fund is also not aware of any tax positions for which it is reasonably possible that the total amounts of unrecognized tax benefits will significantly change in the next twelve months.
| 7. | Expenses: |
| a) | Investment Management Agreement – Hartford Funds Management Company, LLC (“HFMC”), an indirect wholly owned subsidiary of The Hartford Financial Services Group, Inc. (“The Hartford”), serves as investment manager to the Fund pursuant to an Investment Management Agreement with the Company. The investment manager has overall investment supervisory responsibility for the Fund. In addition, the investment manager provides administrative personnel, services, equipment, facilities and office space for proper operation of the Fund. The investment manager has contracted with Wellington Management Company, LLP (“Wellington Management”) under a sub-advisory agreement for the provision of day-to-day investment management services to the Fund in accordance with the Fund’s investment objective and policies. The Fund pays a fee to the investment manager, a portion of which may be used to compensate Wellington Management. |
| 26 |
The schedule below reflects the rates of compensation paid to HFMC for investment management services rendered as of December 31, 2013; the rates are accrued daily and paid monthly.
| Average Daily Net Assets | Annual Fee | |||
| On first $250 million | 0.7750 | % | ||
| On next $250 million | 0.7250 | % | ||
| On next $500 million | 0.6750 | % | ||
| On next $1.5 billion | 0.6250 | % | ||
| On next $2.5 billion | 0.6200 | % | ||
| On next $5 billion | 0.6150 | % | ||
| Over $10 billion | 0.6100 | % | ||
| b) | Accounting Services Agreement – Pursuant to the Fund Accounting Agreement between HFMC and the Company, on behalf of the Fund, HFMC provides accounting services to the Fund and receives monthly compensation based on the Fund’s average daily net assets at the rates set forth below. The Fund’s accounting services fees are accrued daily and paid monthly. |
| Average Daily Net Assets | Annual Fee | |||
| On first $5 billion | 0.018 | % | ||
| On next $5 billion | 0.016 | % | ||
| Over $10 billion | 0.014 | % | ||
Effective January 1, 2014, the new accounting services fees schedule based on the Fund’s average daily net assets is as follows:
| Average Daily Net Assets | Annual Fee | |||
| On first $5 billion | 0.018 | % | ||
| On next $5 billion | 0.014 | % | ||
| Over $10 billion | 0.010 | % | ||
| c) | Operating Expenses – Allocable expenses incurred by the Company are allocated to each Fund and allocated to classes within a Fund in proportion to the average daily net assets of the Fund and each class, except where allocation of certain expenses is more fairly made directly to the Fund or to specific classes within a Fund. |
| d) | Fees Paid Indirectly – The Company, on behalf of the Fund, has entered into agreements with State Street Global Markets, LLC and Russell Implementation Services, Inc. to partially recapture non-discounted trade commissions. Such rebates are used to pay a portion of the Fund’s expenses. In addition, the Fund’s custodian banks have agreed to reduce its fees when the Fund maintains cash on deposit in a non-interest-bearing custody account. For the year ended December 31, 2013, these amounts, if any, are included in the Statement of Operations. |
The ratio of expenses to average net assets in the accompanying financial highlights excludes the reduction in expenses related to fees paid indirectly. The annualized expense ratio after waivers for the period listed below reflecting the reduction for fees paid indirectly is as follows:
| Year Ended December 31, 2013 | ||||
| Class IA | 0.67 | % | ||
| Class IB | 0.92 | |||
| e) | Distribution Plan for Class IB shares – Effective June 14, 2013, Hartford Investment Financial Services, LLC was renamed Hartford Funds Distributors, LLC (“HFD”). HFD, a wholly owned, ultimate subsidiary of The Hartford, serves |
| 27 |
| Hartford Capital Appreciation HLS Fund |
| Notes to Financial Statements – (continued) |
| December 31, 2013 |
| (000’s Omitted) |
| as the Fund’s principal underwriter and distributor. The Company, on behalf of the Fund, has adopted a Distribution Plan pursuant to Rule 12b-1 of the 1940 Act to compensate the distributor, HFD, from assets attributable to the Class IB shares for services rendered and expenses borne in connection with activities primarily intended to result in the sale of the Class IB shares, subject to the review and approval of the Company’s Board of Directors. |
The Distribution Plan provides that the Fund may pay annually up to 0.25% of the average daily net assets of the Fund attributable to its Class IB shares for activities primarily intended to result in the sale of Class IB shares. The Board has the authority to suspend or reduce these payments at any point in time. Under the terms of the Distribution Plan and the principal underwriting agreement, the Fund is authorized to make payments monthly to the distributor that may be used to pay or compensate entities providing distribution and shareholder servicing with respect to the Class IB shares for such entities’ fees or expenses incurred or paid in that regard. These fees are accrued daily and paid monthly.
| f) | Other Related Party Transactions – Certain officers of the Fund are directors and/or officers of the investment manager and/or The Hartford or its subsidiaries. For the year ended December 31, 2013, a portion of the Fund’s Chief Compliance Officer’s salary was paid by all the investment companies in the Hartford fund complex. The portion allocated to the Fund was in the amount of $8. Hartford Administrative Services Company (“HASCO”), an indirect wholly owned subsidiary of The Hartford, provides transfer agent services to the Fund. HASCO was compensated on a per account basis for providing such services. The amount paid to HASCO can be found in the Statement of Operations. These fees are accrued daily and paid monthly. |
| g) | Payment from Affiliate – In July of 2007, The Hartford entered into a settlement with the Attorneys General of the states of New York, Connecticut and Illinois relating to market timing and the company's individual variable annuity contracts in which certain payments would be made directly to the variable annuity contract holders. The distribution plan provided that unclaimed money from the settlement would be distributed to certain HLS Funds that are investment options through a Hartford individual variable annuity contract. The unclaimed money was distributed to the Fund on September 18, 2009. |
The total return in the accompanying financial highlights includes a payment from an affiliate. Had the payment from the affiliate been excluded, the impact and total return for the period listed below would have been as follows:
| For the Year Ended December 31, 2009 | ||||||||
| Class IA | Class IB | |||||||
| Impact from Payment from Affiliate for Attorneys General Settlement | — | % | — | % | ||||
| Total Return Excluding Payment from Affiliate | 45.66 | % | 45.30 | % | ||||
| 8. | Investment Transactions: |
For the year ended December 31, 2013, the Fund's aggregate purchases and sales of investment securities (excluding short-term investments) were as follows:
| Amount | ||||
| Cost of Purchases Excluding U.S. Government Obligations | $ | 6,769,996 | ||
| Sales Proceeds Excluding U.S. Government Obligations | 10,016,452 | |||
| 9. | Line of Credit: |
The Fund is one of several Hartford funds that participate in a $500 million committed revolving line of credit facility. The facility is to be used for temporary or emergency purposes. Under the arrangement, the funds are required to own securities having a market value in excess of 300% of the total bank borrowings. The interest rate on borrowings varies depending on the nature of the loan. The facility also requires a fee to be paid based on the amount of the commitment. This commitment fee is allocated to all of the funds participating in the line of credit based on the average net assets of the funds. During the year ended December 31, 2013, the Fund did not have any borrowings under this facility.
| 28 |
| 10. | Industry Classifications: |
Other than the industry classifications “Other Investment Pools and Funds” and “Exchange Traded Funds,” equity industry classifications used in this report are the Global Industry Classification Standard, which was developed by and is the exclusive property and service mark of MSCI, Inc. and Standard & Poor’s.
| 11. | Indemnifications: |
Under the Company’s organizational documents, the Company shall indemnify its officers and directors to the full extent required or permitted under Maryland General Corporation Law and the federal securities laws. In addition, the Company, on behalf of the Fund, may enter into contracts that contain a variety of indemnifications. The Company’s maximum exposure under these arrangements is unknown. However, as of the date of these financial statements, the Company has not had prior claims or losses pursuant to these contracts and expects the risk of loss to be remote.
| 12. | Pending Legal Proceedings: |
On February 25, 2011, Jennifer L. Kasilag, Louis Mellinger, Judith M. Menendez, Jacqueline M. Robinson, and Linda A. Russell filed a derivative lawsuit against Hartford Investment Financial Services, LLC (“HIFSCO”)(now known as Hartford Funds Distributors, LLC) on behalf of six Hartford retail mutual funds in the United States District Court for the District of New Jersey, alleging that HIFSCO received excessive advisory and distribution fees in violation of its statutory fiduciary duty under Section 36(b) of the 1940 Act when serving as investment manager and principal underwriter, respectively, to the Hartford retail mutual funds. HIFSCO moved to dismiss and, in September 2011, the motion was granted in part and denied in part, with leave to amend the complaint. In November 2011, plaintiffs filed an amended complaint on behalf of certain Hartford retail mutual funds, The Hartford Global Health Fund (now known as The Hartford Healthcare Fund), The Hartford Conservative Allocation Fund, The Hartford Growth Opportunities Fund, The Hartford Inflation Plus Fund, The Hartford Advisers Fund (now known as The Hartford Balanced Fund), and The Hartford Capital Appreciation Fund. Plaintiffs seek to rescind the investment management agreements and distribution plans between HIFSCO and these funds and to recover the total fees charged thereunder or, in the alternative, to recover any improper compensation HIFSCO received, in addition to lost earnings. HIFSCO filed a partial motion to dismiss the amended complaint and, in December 2012, the court dismissed without prejudice the claims regarding distribution fees and denied the motion with respect to the advisory fees claims. HIFSCO disputes the allegations and intends to defend the advisory fee claims vigorously.
This action concerns the activities of HIFSCO in its capacity as investment manager and principal underwriter to the Hartford retail mutual funds and does not concern HIFSCO’s activities in its capacity as principal underwriter to the HLS funds. For this reason, no accrual for litigation relating to this matter has been recorded in the financial statements of the Fund.
| 29 |
| Hartford Capital Appreciation HLS Fund |
| Financial Highlights |
| ─ Selected Per-Share Data(A) ─ | ─ Ratios and Supplemental Data ─ | |||||||||||||||||||||||||||||||||||||||||||||||||||
| Class | Net Asset Value at Beginning of Period | Net Investment Income (Loss) | Net Realized and Unrealized Gain (Loss) on Investments | Total from Investment Operations | Dividends from Net Investment Income | Distributions from Realized Capital Gains | Total Dividends and Distributions | Net Asset Value at End of Period | Total Return(B) | Net Assets at End of Period (000s) | Ratio of Expenses to Average Net Assets Before Adjustments(C) | Ratio of Expenses to Average Net Assets After Adjustments(C) | Ratio of Net Investment Income (Loss) to Average Net Assets | |||||||||||||||||||||||||||||||||||||||
| For the Year Ended December 31, 2013 | ||||||||||||||||||||||||||||||||||||||||||||||||||||
| IA | $ | 43.37 | $ | 0.45 | $ | 16.49 | $ | 16.94 | $ | (0.51 | ) | $ | (0.15 | ) | $ | (0.66 | ) | $ | 59.65 | 39.08 | % | $ | 7,029,201 | 0.67 | % | 0.67 | % | 0.88 | % | |||||||||||||||||||||||
| IB | 43.05 | 0.32 | 16.33 | 16.65 | (0.37 | ) | (0.15 | ) | (0.52 | ) | 59.18 | 38.72 | 969,611 | 0.92 | 0.92 | 0.63 | ||||||||||||||||||||||||||||||||||||
| For the Year Ended December 31, 2012 (D) | ||||||||||||||||||||||||||||||||||||||||||||||||||||
| IA | $ | 37.20 | $ | 0.57 | $ | 6.24 | $ | 6.81 | $ | (0.64 | ) | $ | – | $ | (0.64 | ) | $ | 43.37 | 18.34 | % | $ | 7,750,924 | 0.67 | % | 0.67 | % | 1.24 | % | ||||||||||||||||||||||||
| IB | 36.90 | 0.52 | 6.14 | 6.66 | (0.51 | ) | – | (0.51 | ) | 43.05 | 18.04 | 874,386 | 0.92 | 0.92 | 0.99 | |||||||||||||||||||||||||||||||||||||
| For the Year Ended December 31, 2011 (D) | ||||||||||||||||||||||||||||||||||||||||||||||||||||
| IA | $ | 42.36 | $ | 0.37 | $ | (5.20 | ) | $ | (4.83 | ) | $ | (0.33 | ) | $ | – | $ | (0.33 | ) | $ | 37.20 | (11.41 | )% | $ | 8,169,178 | 0.67 | % | 0.67 | % | 0.95 | % | ||||||||||||||||||||||
| IB | 42.00 | 0.32 | (5.20 | ) | (4.88 | ) | (0.22 | ) | – | (0.22 | ) | 36.90 | (11.62 | ) | 1,102,054 | 0.92 | 0.92 | 0.71 | ||||||||||||||||||||||||||||||||||
| For the Year Ended December 31, 2010 (D) | ||||||||||||||||||||||||||||||||||||||||||||||||||||
| IA | $ | 36.63 | $ | 0.30 | $ | 5.72 | $ | 6.02 | $ | (0.29 | )(E) | $ | – | $ | (0.29 | ) | $ | 42.36 | 16.50 | % | $ | 8,889,906 | 0.67 | % | 0.67 | % | 0.77 | % | ||||||||||||||||||||||||
| IB | 36.32 | 0.21 | 5.66 | 5.87 | (0.19 | )(E) | – | (0.19 | ) | 42.00 | 16.21 | 1,522,218 | 0.92 | 0.92 | 0.52 | |||||||||||||||||||||||||||||||||||||
| For the Year Ended December 31, 2009 (D) | ||||||||||||||||||||||||||||||||||||||||||||||||||||
| IA | $ | 25.34 | $ | 0.31 | $ | 11.27 | $ | 11.58 | $ | (0.29 | ) | $ | – | $ | (0.29 | ) | $ | 36.63 | 45.67 | %(F) | $ | 8,410,214 | 0.68 | % | 0.68 | % | 1.03 | % | ||||||||||||||||||||||||
| IB | 25.14 | 0.25 | 11.14 | 11.39 | (0.21 | ) | – | (0.21 | ) | 36.32 | 45.30 | (F) | 1,595,912 | 0.93 | 0.93 | 0.79 | ||||||||||||||||||||||||||||||||||||
| (A) | Information presented relates to a share outstanding throughout the indicated period. Net investment income (loss) per share amounts are calculated based on average shares outstanding unless otherwise noted. |
| (B) | The figures do not include sales charges or other fees which may be applied at the variable life insurance, variable annuity or qualified retirement plan product level. Any such additional sales charges or other fees would lower the Fund's performance. |
| (C) | Adjustments include waivers and reimbursements, if applicable. Ratios do not include fees paid indirectly (see Expenses in the accompanying Notes to Financial Statements). |
| (D) | Net investment income (loss) per share amounts have been calculated using the SEC method. |
| (E) | The impact of Distributions from Capital was ($0.03). |
| (F) | Total return without the inclusion of the Payment from (to) Affiliate can be found in Expenses in the accompanying Notes to Financial Statements. |
| Portfolio Turnover Rate for All Share Classes | ||||
| For the Year Ended December 31, 2013 | 86 | % | ||
| For the Year Ended December 31, 2012 | 142 | |||
| For the Year Ended December 31, 2011 | 113 | |||
| For the Year Ended December 31, 2010 | 95 | |||
| For the Year Ended December 31, 2009 | 128 | |||
| 30 |
| Report of Independent Registered Public Accounting Firm |
| The Board of Directors and Shareholders of |
| Hartford Series Fund, Inc. |
We have audited the accompanying statement of assets and liabilities, including the schedule of investments, of Hartford Capital Appreciation HLS Fund (one of the portfolios constituting Hartford Series Fund, Inc. (the Funds)) as of December 31, 2013, and the related statement of operations for the year then ended, the statements of changes in net assets for each of the two years in the period then ended, and the financial highlights for each of the five years in the period then ended. These financial statements and financial highlights are the responsibility of the Funds’ management. Our responsibility is to express an opinion on these financial statements and financial highlights based on our audits.
We conducted our audits in accordance with the standards of the Public Company Accounting Oversight Board (United States). Those standards require that we plan and perform the audit to obtain reasonable assurance about whether the financial statements and financial highlights are free of material misstatement. We were not engaged to perform an audit of the Funds’ internal control over financial reporting. Our audits included consideration of internal control over financial reporting as a basis for designing audit procedures that are appropriate in the circumstances, but not for the purpose of expressing an opinion on the effectiveness of the Funds’ internal control over financial reporting. Accordingly, we express no such opinion. An audit also includes examining, on a test basis, evidence supporting the amounts and disclosures in the financial statements and financial highlights, assessing the accounting principles used and significant estimates made by management, and evaluating the overall financial statement presentation. Our procedures included confirmation of securities owned as of December 31, 2013, by correspondence with the custodians and brokers or by other appropriate auditing procedures where replies from brokers were not received. We believe that our audits provide a reasonable basis for our opinion.
In our opinion, the financial statements and financial highlights referred to above present fairly, in all material respects, the financial position of Hartford Capital Appreciation HLS Fund of the Hartford Series Fund, Inc. at December 31, 2013, the results of its operations for the year then ended, the changes in its net assets for each of the two years in the period then ended, and the financial highlights for each of the five years in the period then ended, in conformity with U.S. generally accepted accounting principles.
|
Minneapolis, MN
February 17, 2014
| 31 |
| Hartford Capital Appreciation HLS Fund |
| Directors and Officers (Unaudited) |
The Board of Directors of the Company appoints officers who are responsible for the day-to-day operations of the Fund and who execute policies formulated by the directors. Each director serves until his or her death, resignation, or retirement or until the next annual meeting of shareholders is held or until his or her successor is elected and qualifies.
Directors and officers who are employed by or who have a financial interest in The Hartford are considered “interested” persons of the Fund pursuant to the 1940 Act. Each officer and two of the Company’s directors, as noted in the chart below, are “interested” persons of the Fund. Each director serves as a director for The Hartford Mutual Funds, Inc., The Hartford Mutual Funds II, Inc., Hartford Series Fund, Inc., Hartford HLS Series Fund II, Inc., and as a trustee for The Hartford Alternative Strategies Fund, which, as of December 31, 2013, collectively consist of 91 funds. Correspondence may be sent to directors and officers c/o Hartford Funds, 5 Radnor Corporate Center, Suite 300, 100 Matsonford Road, Radnor, Pennsylvania 19087, except that correspondence to Mr. Annoni, Mr. Dressen and Ms. Quade may be sent to 500 Bielenberg Drive, Woodbury, Minnesota 55125.
The table below sets forth, for each director and officer, his or her name, year of birth, current position with the Company and date first elected or appointed to Hartford Series Fund, Inc. (“HSF”), and Hartford HLS Series Fund II, Inc. (“HSF2”), principal occupation, and, for directors, other directorships held. The Fund’s Statement of Additional Information contains further information on the directors and is available free of charge by calling 1-800-862-6668 or writing to Hartford HLS Funds, c/o Hartford Life Insurance Company, Hartford Life and Annuity Insurance Company, P.O. Box 14293, Lexington, KY 40512-4293.
Information on the aggregate remuneration paid to the directors of the Company can be found in the Statement of Operations herein. The Fund pays to The Hartford a portion of the Chief Compliance Officer’s compensation, but does not pay salaries or compensation to any of their other officers or directors who are employed by The Hartford.
Non-Interested Directors
Lynn S. Birdsong (1946) Director since 2003, Co-Chairman of the Investment Committee since 2005
Mr. Birdsong is a private investor. Mr. Birdsong currently serves as a Director of the Sovereign High Yield Investment Company (April 2010 to current). Mr. Birdsong currently serves as an Independent Director of Nomura Partners Funds, Inc. (formerly, The Japan Fund) (April 2003 to current). From 2003 to March 2005, Mr. Birdsong was an Independent Director of the Atlantic Whitehall Funds. From 1979 to 2002, Mr. Birdsong was a Managing Director of Zurich Scudder Investments, an investment management firm. During his employment with Scudder, Mr. Birdsong was an Interested Director of The Japan Fund. From January 1981 through December 2013, Mr. Birdsong was a partner in Birdsong Company, an advertising specialty firm.
Robert M. Gavin, Jr. (1940) Director since 2002 (HSF) and 1986 (HSF2), Chairman of the Board since 2004
Dr. Gavin is an educational consultant. Prior to September 1, 2001, he was President of Cranbrook Education Community and prior to July 1996, he was President of Macalester College, St. Paul, Minnesota.
Duane E. Hill (1945) Director since 2001 (HSF) and 2002 (HSF2), Chairman of the Nominating Committee since 2003
Mr. Hill is a Partner of TSG Ventures L.P., a private equity investment company. Mr. Hill is a former partner of TSG Capital Group, a private equity investment firm that served as sponsor and lead investor in leveraged buyouts of middle market companies.
Sandra S. Jaffee (1941) Director since 2005
Ms. Jaffee is the founder and Chief Executive Officer of a private company, Homeworks Concierge, LLC, which provides residential property management services in Westchester County, New York (January 2012 to present). Ms. Jaffee served as Chairman (2008 to 2009) and Chief Executive Officer of Fortent (formerly Searchspace Group), a leading provider of compliance/regulatory technology to financial institutions from August 2005 to August 2009. Ms. Jaffee currently serves as a member of the Board of Directors of Broadridge Financial Solutions as well as a Trustee of Muhlenberg College.
| 32 |
William P. Johnston (1944) Director since 2005, Chairman of the Compliance Committee since 2005
In June 2006, Mr. Johnston was appointed as Senior Advisor to The Carlyle Group, a global private equity and alternative asset investment firm and currently serves as an Operating Executive. In July 2006, Mr. Johnston was elected to the Board of Directors of MultiPlan, Inc. and served as a Director (July 2006 to August 2010). In August 2007, Mr. Johnston was elected to the Board of Directors of LifeCare Holdings, Inc. and served as a Director (August 2007 to June 2013). In February 2008, Mr. Johnston was elected to the Board of Directors of HCR-ManorCare, Inc. In May 2006, Mr. Johnston was elected to the Supervisory Board of Fresenius Medical Care AG & Co. KGaA, after its acquisition of Renal Care Group, Inc. in March 2006. Mr. Johnston joined Renal Care Group in November 2002 as a member of the Board of Directors and served as Chairman of the Board from March 2003 through March 2006. From 2002 through 2013, Mr. Johnston served as a Board member of the Georgia O’Keefe Museum. From September 1987 to December 2002, Mr. Johnston was with Equitable Securities Corporation (and its successors, SunTrust Equitable Securities and SunTrust Robinson Humphrey) serving in various investment banking and managerial positions, including Managing Director and Head of Investment Banking, Chief Executive Officer and Vice Chairman.
Phillip O. Peterson (1944) Director since 2002 (HSF) and 2000 (HSF2), Chairman of the Audit Committee since 2002
Mr. Peterson is a mutual fund industry consultant. He was a partner of KPMG LLP (an accounting firm) until July 1999. Mr. Peterson joined William Blair Funds in February 2007 as a member of the Board of Trustees. Mr. Peterson also joined the Board of Trustees of Symetra Variable Mutual Funds Trust as a trustee in February 2012.
Lemma W. Senbet (1946) Director since 2005
Dr. Senbet is the William E. Mayer Chair Professor of Finance and Founding Director, Center for Financial Policy, at the University of Maryland, Robert H. Smith School of Business. He was chair of the Finance Department of the University of Maryland, Robert H. Smith School of Business from 1998 to 2006. Since June 2013, he has been on leave from the University to serve as Executive Director of African Economic Research Consortium which focuses on economic policy research and training. Previously, he was a chaired professor of finance at the University of Wisconsin-Madison. Also, he was a Director of the Fortis Funds from March 2000 to July 2002. Dr. Senbet served as Director of the American Finance Association and President of the Western Finance Association. In 2006, Dr. Senbet was inducted Fellow of Financial Management Association International for his career-long distinguished scholarship and professional service.
Interested Directors and Officers
James E. Davey (1964) Director since 2012, President and Chief Executive Officer since 2010
Mr. Davey serves as Executive Vice President of Hartford Life Insurance Company (“HLIC”) and The Hartford Financial Services Group, Inc. Additionally, Mr. Davey serves as Chairman of the Board, Manager and Senior Managing Director of Hartford Funds Distributors, LLC (“HFD”). He also currently serves as Director, Chairman of the Board, President and Senior Managing Director of Hartford Administrative Services Company (“HASCO”). Mr. Davey also serves as Manager, Chairman of the Board and Senior Managing Director for Hartford Funds Management Company, LLC (“HFMC”). Mr. Davey joined The Hartford in 2002.
Lowndes A. Smith (1939) Director since 1996 (HSF) and 2002 (HSF2), Co-Chairman of the Investment Committee since 2005
Mr. Smith served as Vice Chairman of The Hartford from February 1997 to January 2002, as President and Chief Executive Officer of Hartford Life, Inc. from February 1997 to January 2002, and as President and Chief Operating Officer of The Hartford Life Insurance Companies from January 1989 to January 2002. Mr. Smith serves as a Director of White Mountains Insurance Group Ltd. (October 2003 to current); One Beacon Insurance (October 2006 to current); Symetra Financial (August 2007 to current) and is a Managing Director of Whittington Gray Associates (January 2007 to current).
Other Officers
Mark A. Annoni (1964) Vice President, Controller and Treasurer since 2012
Mr. Annoni currently serves as the Assistant Vice President of HLIC (February 2004 to present).
| 33 |
| Hartford Capital Appreciation HLS Fund |
| Directors and Officers (Unaudited) – (continued) |
Michael R. Dressen (1963) AML Compliance Officer since 2011
Mr. Dressen currently serves as Assistant Vice President of HLIC. He also serves as Chief Compliance Officer and AML Compliance Officer of HASCO and as AML Officer of HFD. Mr. Dressen has served in various positions within The Hartford and its subsidiaries in connection with the operation of the Hartford Funds.
Edward P. Macdonald (1967) Vice President, Secretary and Chief Legal Officer since 2005
Mr. Macdonald currently serves as Assistant Secretary, Executive Vice President and Deputy General Counsel of HFD, HASCO and HFMC. He also serves as Vice President of HLIC. Mr. Macdonald has served in various positions within The Hartford and its subsidiaries in connection with the operation of the Hartford Funds. Mr. Macdonald joined The Hartford in 2005.
Joseph G. Melcher (1973) Vice President and Chief Compliance Officer since 2013
Mr. Melcher currently serves as Executive Vice President of HASCO and HFD. Mr. Melcher also currently serves as Executive Vice President and Chief Compliance Officer of HFMC. Mr. Melcher has served in various positions within The Hartford and its subsidiaries in connection with the operation of the Hartford Funds since joining The Hartford in 2012. Prior to joining The Hartford, Mr. Melcher worked at Touchstone Investments, a member of the Western & Southern Financial Group, where he held the position of Vice President and Chief Compliance Officer from 2010 through 2012 and Assistant Vice President, Compliance from 2005 to 2010.
Vernon J. Meyer (1964) Vice President since 2006
Mr. Meyer currently serves as Senior Vice President of HLIC. He also currently serves as Managing Director and Chief Investment Officer of HFMC. Mr. Meyer has served in various positions within The Hartford and its subsidiaries in connection with the operation of the Hartford Funds. Mr. Meyer joined The Hartford in 2004.
Laura S. Quade (1969) Vice President since 2012
Ms. Quade currently serves as Vice President of HASCO and HFD. She is the Head of Operations of HASCO and also serves as Director, Enterprise Operations of HLIC. Ms. Quade has served in various positions within The Hartford and its subsidiaries in connection with the operation of the Hartford Funds.
Martin A. Swanson (1962) Vice President since 2010
Mr. Swanson currently serves as Vice President of HLIC. Mr. Swanson also serves as Managing Director, Chief Marketing Officer and Principal of HFD. Mr. Swanson has served in various positions within The Hartford and its subsidiaries in connection with the operation of the Hartford Funds.
HOW TO OBTAIN A COPY OF THE FUND’S PROXY VOTING POLICIES AND VOTING RECORDS (UNAUDITED)
A description of the policies and procedures that the Fund uses to determine how to vote proxies relating to portfolio securities and information about how the Fund voted proxies relating to portfolio securities during the most recent twelve-month period ended June 30 are available (1) without charge, upon request, by calling 800-862-6668 and (2) on the SEC’s website at http://www.sec.gov.
QUARTERLY PORTFOLIO HOLDINGS INFORMATION (UNAUDITED)
The Fund files a complete schedule of portfolio holdings with the SEC for the first and third quarters of each fiscal year on Form N-Q. The Fund’s Forms N-Q are available (1) without charge, upon request, by calling 800-862-6668 and (2) on the SEC’s website at http://www.sec.gov. The Form N-Q may be reviewed and copied at the SEC’s Public Reference Room in Washington, DC. Information on the operation of the Public Reference Room may be obtained by calling 1-800-SEC-0330.
| 34 |
| Hartford Capital Appreciation HLS Fund |
| Expense Example (Unaudited) |
Your Fund's Expenses
As a shareholder of the Fund, you incur two types of costs: (1) transaction costs and (2) ongoing costs, including investment management fees, distribution and/or service (12b-1) fees, if any, and other fund expenses. This example is intended to help you understand your ongoing costs (in dollars) of investing in the Fund and to compare these costs with the ongoing costs of investing in other mutual funds. The example is based on an investment of $1,000 invested at the beginning of the period and held for the period of June 30, 2013 through December 31, 2013.
Actual Expenses
The first set of columns of the table below provides information about actual account values and actual expenses. You may use the information in this column, together with the amount you invested, to estimate the expenses that you paid over the period. Simply divide your account value by $1,000 (for example, an $8,600 account value divided by $1,000 = 8.6), then multiply the result by the number in the line under the heading entitled “Expenses Paid During Period” to estimate the expenses you paid on your account during this period.
Hypothetical Example for Comparison Purposes
The second set of columns of the table below provides information about hypothetical account values and hypothetical expenses based on the Fund’s actual expense ratio and an assumed rate of return of 5% per year before expenses, which is not the Fund’s actual return. The hypothetical account values and expenses may not be used to estimate the actual ending account balance or expenses you paid for the period. You may use this information to compare the ongoing costs of investing in the Fund and other funds. To do so, compare this 5% hypothetical example with the 5% hypothetical examples that appear in the shareholder reports of the other funds.
Please note that the expenses shown in the table are meant to highlight your ongoing costs only and do not reflect any transactional costs, such as sales charges (loads) and CDSC. Therefore, the second set of columns of the table is useful in comparing ongoing costs only, and will not help you determine the relative total costs of owning different funds. In addition, if these transactional costs were included, your costs would be higher. Expenses are equal to the Fund's annualized expense ratios multiplied by average account value over the period, multiplied by 184/365 (to reflect the one-half year period).
| Actual return | Hypothetical (5% return before expenses) | |||||||||||||||||||||||||||||||||
| Beginning Account Value June 30, 2013 | Ending Account Value December 31, 2013 | Expenses paid during the period June 30, 2013 through December 31, 2013 | Beginning Account Value June 30, 2013 | Ending Account Value December 31, 2013 | Expenses paid during the period June 30, 2013 through December 31, 2013 | Annualized expense ratio | Days in the current 1/2 year | Days in the full year | ||||||||||||||||||||||||||
| Class IA | $ | 1,000.00 | $ | 1,189.70 | $ | 3.70 | $ | 1,000.00 | $ | 1,021.83 | $ | 3.42 | 0.67 | % | 184 | 365 | ||||||||||||||||||
| Class IB | $ | 1,000.00 | $ | 1,188.20 | $ | 5.08 | $ | 1,000.00 | $ | 1,020.56 | $ | 4.69 | 0.92 | % | 184 | 365 | ||||||||||||||||||
| 35 |
| Hartford Capital Appreciation HLS Fund |
| Approval of Investment Management and Investment Sub-Advisory Agreements (Unaudited) |
Section 15(c) of the Investment Company Act of 1940, as amended (the “1940 Act”), requires that each mutual fund’s board of directors, including a majority of those directors who are not “interested persons” of the mutual fund, as defined in the 1940 Act (the “Independent Directors”), annually review and consider the continuation of the mutual fund’s investment advisory and sub-advisory agreements. At its meeting held on August 6-7, 2013, the Board of Directors (the “Board”) of Hartford Series Fund, Inc., including each of the Independent Directors, unanimously voted to approve the continuation of the investment management agreement for Hartford Capital Appreciation HLS Fund (the “Fund”) with Hartford Funds Management Company, LLC (“HFMC”) and the continuation of the investment sub-advisory agreement between HFMC and the Fund’s sub-adviser, Wellington Management Company, LLP (the “Sub-adviser,” and together with HFMC, the “Advisers”) (collectively, the “Agreements”).
In the months preceding the August 6-7, 2013 meeting, the Board requested, received, and reviewed written responses from the Advisers to questions posed to them on behalf of the Independent Directors and supporting materials relating to those questions and responses. The Board considered information furnished to the Board at its meetings throughout the year, as well as information specifically prepared in connection with the annual approval of the Agreements at the Board’s meetings held on June 18-19, 2013 and August 6-7, 2013. Information provided to the Board at its meetings throughout the year included, among other things, reports on Fund performance, legal and compliance matters, sales and marketing activity, shareholder services, and the other services provided to the Fund by the Advisers and their affiliates. The Board also received in-person presentations by Fund officers and representatives of HFMC at the Board’s meetings on June 18-19, 2013 and August 6-7, 2013 concerning the Agreements.
The Independent Directors, advised by independent legal counsel, engaged two service providers to assist them with evaluating the Agreements with respect to the Fund. Lipper Inc. (“Lipper”), an independent provider of investment company data, was retained to provide the Board with reports on how the Fund’s contractual management fees, actual management fees, other non-management fees, overall expense ratios and investment performance compared to those of mutual funds with similar investment objectives. The Independent Directors also engaged an independent financial services consulting firm (the “Consultant”) to assist them in evaluating the Fund’s management fees, sub-advisory fees, other non-management fees, overall expense ratios and investment performance. In addition, the Consultant reviewed the profitability calculations utilized by HFMC in connection with the continuation of the investment management agreement.
In determining whether to continue the Agreements for the Fund, the members of the Board reviewed and evaluated information and factors they believed to be relevant and appropriate in light of the information that the Board deemed necessary and appropriate through the exercise of its reasonable business judgment. While individual members of the Board may have weighed certain factors differently, the Board’s determination to continue the Agreements was based on a comprehensive consideration of all information provided to the Board throughout the year and specifically with respect to the continuation of the Agreements. A more detailed discussion of the factors the Board considered with respect to its approval of the Agreements is provided below.
Nature, Extent, and Quality of Services Provided by the Advisers
The Board requested and considered information concerning the nature, extent, and quality of the services provided to the Fund by the Advisers. The Board considered, among other things, the terms of the Agreements and the range of services provided by the Advisers. The Board considered the Advisers’ professional personnel who provide services to the Fund, including each Adviser’s ability and experience in attracting and retaining qualified personnel to service the Fund. The Board considered each Adviser’s reputation and overall financial strength, as well as its willingness to consider and implement organizational and operational changes designed to improve services to the Fund. In addition, the Board considered the quality of each Adviser’s communications with the Board and responsiveness to Board inquiries.
The Board also requested and evaluated information concerning each Adviser’s regulatory and compliance environment. In this regard, the Board requested and reviewed information on each Adviser’s compliance policies and procedures, compliance history, and a report from the Fund’s Chief Compliance Officer on each Adviser’s compliance with applicable laws and regulations, including responses to regulatory developments and compliance issues raised by regulators. The Board also noted the Advisers’ support of the Fund’s compliance control structure, particularly the resources devoted by the Advisers in support of the Fund’s obligations pursuant to Rule 38a-1 under the 1940 Act.
| 36 |
With respect to HFMC, the Board noted that under the Agreements, HFMC is responsible for the management of the Fund, including overseeing fund operations and service providers, as well as investment advisory services in connection with selecting, monitoring and supervising the Sub-adviser. The Board considered HFMC’s ongoing monitoring of people, process and performance, including its quarterly reviews of each of the Hartford Funds, semi-annual meetings with the leaders of each Fund’s portfolio management team, and oversight of the Funds’ approximately 40 portfolio managers. The Board recognized that HFMC has demonstrated a record of making changes to the management and/or strategies of the Funds when warranted. The Board considered HFMC’s oversight of the Sub-adviser’s investment approach and results, process for monitoring best execution of portfolio trades by the Sub-adviser, and approach to risk management with respect to the Fund and the service providers to the Fund. The Board also considered HFMC’s oversight of compliance with the Fund’s objective and policies as well as with applicable laws and regulations, noting that regulatory and other developments had over time led to an increase in the scope of HFMC’s services in this regard.
In addition, the Board considered HFMC’s ongoing commitment to review and rationalize the Hartford Funds product line-up and the expenses that HFMC had incurred in connection with fund combinations in recent years. The Board considered that HFMC or its affiliates are responsible for providing the Fund’s officers. The Board also noted that Hartford Life Insurance Company (“HLIC”) provides administrative services to the Fund. The Board considered its experiences with HFMC and HLIC with respect to each of these services.
With respect to the Sub-adviser, who provides day-to-day portfolio management services, the Board considered the quality of the Fund’s portfolio managers, the Sub-adviser’s other investment personnel, its investment philosophy and process, investment research capabilities and resources, performance record, trade execution capabilities and experience. The Board considered the experience of the Fund’s portfolio managers, the number of accounts managed by the portfolio managers, and the Sub-adviser’s method for compensating the portfolio managers.
Based on these considerations, the Board concluded that it was satisfied with the nature, extent and quality of the services provided to the Fund by HFMC and the Sub-adviser.
Performance of the Fund and the Advisers
The Board considered the investment performance of the Fund. In this regard, the Board reviewed the performance of the Fund over different time periods presented in the materials and evaluated HFMC’s analysis of the Fund’s performance for these time periods. The Board considered information and materials provided to the Board by the Advisers concerning Fund performance, as well as information from Lipper comparing the investment performance of the Fund to an appropriate benchmark and universe of peer funds. The Board noted that the Fund’s performance was in the 2nd quintile of its performance universe for the 1-year period and the 4th quintile for the 3- and 5-year periods. The Board also noted that the Fund’s performance was below its benchmark for the 1-, 3- and 5-year periods. The Board noted recent changes to the Fund’s portfolio management team. The Board considered that, in response to questions raised concerning the Fund’s performance, HFMC stated that it has confidence in the Fund’s portfolio management team and investment strategy.
The Board considered the detailed investment analytics reports provided by Hartford Funds’ Investment Advisory Group throughout the year. These reports include, among other things, information on the Fund’s gross and net returns, the Fund’s investment performance relative to an appropriate benchmark and peer group, various statistics concerning the Fund’s portfolio, and a narrative summary of various factors affecting Fund performance. The Board considered the Advisers’ cooperation with the Investment Committee, which assists the Board in evaluating the performance of the Fund at periodic meetings throughout the year. The Board also considered the analysis provided by the Consultant relating to the Fund’s performance track record.
In light of all the considerations noted above, the Board concluded that it had continued confidence in HFMC’s and the Sub-adviser’s overall capabilities to manage the Fund.
Costs of the Services and Profitability of the Advisers
The Board reviewed information regarding HFMC’s cost to provide investment management and related services to the Fund and HFMC’s profitability, both overall and for the Fund, on a pre-tax basis without regard to distribution expenses. The Board also requested and reviewed information about the profitability to HFMC and its affiliates from all services provided to the Fund and
| 37 |
| Hartford Capital Appreciation HLS Fund |
| Approval of Investment Management and Investment Sub-Advisory Agreements (Unaudited) – (continued) |
all aspects of their relationship with the Fund. The Board also requested and received information relating to the operations and profitability of the Sub-adviser.
The Board considered the Consultant’s review of the profitability calculations utilized by HFMC in connection with the continuation of the investment management agreement, noting the Consultant’s view that Hartford Funds’ process for calculating and reporting Fund profitability is reasonable. In this regard, the Board noted that the Consultant had previously performed a full review of this process and reported that such process is sound and well within common industry practice.
Based on these considerations, the Board concluded that the profits anticipated to be realized by the Advisers and their affiliates from their relationships with the Fund would not be excessive.
Comparison of Fees and Services Provided by the Advisers
The Board considered comparative information with respect to the management fees to be paid by the Fund to HFMC and the total expense ratios of the Fund. The Board also considered comparative information with respect to the sub-advisory fees to be paid by HFMC to the Sub-adviser. In this regard, the Board requested and reviewed information from HFMC and the Sub-adviser relating to the management and sub-advisory fees, including the sub-advisory fee schedule for the Fund, and total operating expenses for the Fund. The Board considered that the management fee for the Fund includes the fee paid to HLIC for providing certain administrative services to the Fund. With respect to the sub-advisory fee schedule, the Board considered representations from HFMC and the Sub-adviser that the Sub-adviser’s fees were negotiated at arm’s length. The Board also reviewed information from Lipper comparing the Fund’s contractual management fees, actual management fees and overall expense ratios relative to a group of funds selected by Lipper, in consultation with the Consultant, and a broader universe of funds selected by Lipper. The Board noted that the Fund’s contractual management fee was in the 4th quintile of its expense group, while its actual management fee was in the 3rd quintile and its total expenses (less 12b-1 and shareholder service fees) were in the 2nd quintile.
While the Board recognized that comparisons between the Fund and peer funds are imprecise, given the differing service levels and characteristics of mutual funds and the different business models and cost structures of the Advisers, the comparative information provided by Lipper assisted the Board in evaluating the reasonableness of the Fund’s management and sub-advisory fees and total operating expenses. In addition, the Board considered the analysis and recommendations of the Consultant relating to the Fund’s management and sub-advisory fees and total operating expenses.
Based on these considerations, the Board concluded that the Fund’s fees and total operating expenses, in conjunction with the information about quality of services, profitability, economies of scale, and other matters discussed, were reasonable in light of the services provided.
Economies of Scale
The Board requested and considered information regarding the Advisers’ realization of economies of scale with respect to the Fund and whether the fee levels reflect these economies of scale for the benefit of the Fund’s shareholders. The Board reviewed the breakpoints in the management fee schedule for the Fund, which reduce fee rates as Fund assets grow over time. The Board recognized that a fund with assets beyond the last breakpoint level will continue to benefit from economies of scale because additional assets are charged the lowest breakpoint fee resulting in lower overall effective management fee rates. The Board also recognized that a fee schedule that reaches a lower breakpoint quickly provides shareholders with the benefit of anticipated or potential economies of scale. The Board noted the effect of the sale and run-off of the variable annuity business on the HLS Funds.
The Board reviewed and evaluated materials from Lipper showing how management fee schedules of peer funds reflect economies of scale for the benefit of shareholders as a peer fund’s assets hypothetically increase over time. Based on information provided by HFMC, Lipper, and the Consultant, the Board recognized that there is no uniform methodology for establishing breakpoints or uniform pattern in asset levels that trigger breakpoints or the amounts of breakpoints triggered.
After considering all of the information available to it, the Board concluded that it was satisfied with the extent to which economies of scale would be shared for the benefit of the Fund’s shareholders based on currently available information and the
| 38 |
effective advisory fees and expense ratios for the Fund at its current and reasonably anticipated asset levels. The Board noted, however, that it would continue to monitor future growth in Fund assets and the appropriateness of additional breakpoints.
Other Benefits
The Board considered other benefits to the Advisers and their affiliates from their relationships with the Fund, including the role of the Fund in supporting the variable life insurance and variable annuity products offered by The Hartford.
The Board reviewed information noting that HLIC, an affiliate of HFMC, receives fees for providing certain administrative services to the Fund and that HFMC receives fees for fund accounting and related services from the Fund. The Board considered information on profits to HLIC and HFMC for such services. The Board also considered that Hartford Administrative Services Company (“HASCO”), the Fund’s transfer agent and an affiliate of HFMC, receives transfer agency compensation from the Fund, and the Board reviewed information on the profitability of the Fund’s transfer agency function to HASCO. The Board considered information provided by HASCO indicating that the transfer agent fees charged by HASCO to the Fund were fair and reasonable based on publicly available information.
The Board also considered that Hartford Funds Distributors, LLC (“HFD”), an affiliate of HFMC, serves as principal underwriter of the Fund. As principal underwriter, HFD receives 12b-1 fees from the Fund. The Board also noted that certain affiliates of HFD distribute shares of the Fund and receive compensation in that connection.
The Board considered benefits to the Sub-adviser from its use of the Fund’s brokerage commissions to obtain soft dollar research, and representations from HFMC and the Sub-adviser that the Sub-adviser would not make any revenue-sharing payments or any other type of distribution payments to HFMC or its affiliates.
The Board considered the benefits to shareholders of being part of the Hartford Funds family of funds. The Board considered HFMC’s efforts to provide investors in the family with a broad range of investment styles and asset classes.
* * * *
Based upon its review of these various factors, among others, the Board concluded that it is in the best interests of the Fund and its shareholders for the Board to approve the Agreements for an additional year. In reaching this decision, the Board did not assign relative weights to the factors discussed above or deem any one or group of them to be controlling in and of themselves. In connection with their deliberations, the Independent Directors met separately in executive session on several occasions, with independent legal counsel and the Consultant, to review the relevant materials and consider their responsibilities under relevant laws and regulations.
| 39 |
| Hartford Capital Appreciation HLS Fund |
| Main Risks (Unaudited) |
The main risks of investing in the Fund are described below.
Market, Selection, and Strategy Risk: The Fund’s share price may fluctuate due to market risk and/or security selections that may underperform the market or relevant benchmarks. If the sub-adviser’s investment strategy does not perform as expected, the Fund could underperform its peers or lose money. There is no guarantee the Fund will achieve its stated objective.
Small/Mid-cap Stock Risk: Small- and mid-cap stocks are generally more volatile and risky and may be less liquid than large-cap stocks because they may have limited operating histories, narrow product lines, and focus on niche markets.
Foreign Investment and Emerging Markets Risk: Foreign investments can be riskier than U.S. investments. Potential risks include currency risk that may result from unfavorable exchange rates, liquidity risk if decreased demand for a security makes it difficult to sell at the desired price, and risks that stem from substantially lower trading volume on foreign markets. These risks are generally greater for investments in emerging markets, which are also subject to greater price volatility, and custodial and regulatory risks.
Asset Allocation Strategy Risk: The portfolio manager’s asset allocation strategy may not always work as intended, and asset allocation does not guarantee better performance or reduce the risk of investment loss.
Active Trading Risk: Actively trading investments may result in higher costs (thus affecting performance).
| 40 |
THIS PRIVACY POLICY IS NOT PART OF THIS REPORT
Privacy Policy and Practices of The Hartford Financial Services Group, Inc. and its Affiliates
(herein called “we, our, and us”)
This Privacy Policy applies to our United States Operations
We value your trust. We are committed to the responsible: a) management; b) use; and c) protection; of Personal Information. This notice describes how we collect, disclose, and protect Personal Information.
We collect Personal Information to: a) service your Transactions with us; and b) support our business functions.
We may obtain Personal Information from: a) You; b) your Transactions with us; and c) third parties such as a consumer-reporting agency.
Based on the type of product or service You apply for or get from us, Personal Information such as: a) your name; b) your address; c) your income; d) your payment; or e) your credit history; may be gathered from sources such as applications, Transactions, and consumer reports.
To serve You and service our business, we may share certain Personal Information. We will share Personal Information, only as allowed by law, with affiliates such as: a) our insurance companies; b) our employee agents; c) our brokerage firms; and d) our administrators.
As allowed by law, we may share Personal Financial Information with our affiliates to: a) market our products; or b) market our services; to You without providing You with an option to prevent these disclosures. | We may also share Personal Information, only as allowed by law, with unaffiliated third parties including:
When allowed by law, we may share certain Personal Financial Information with other unaffiliated third parties who assist us by performing services or functions such as:
We, and third parties we partner with, may track some of the pages You visit through the use of: a) cookies; b) pixel tagging; or c) other technologies; and currently do not process or comply with any web browser’s “do not track” signal or similar mechanism that indicates a request to disable online tracking of individual users who visit our websites or use our services.
We will not sell or share your Personal Financial Information with anyone for purposes unrelated to our business functions without offering You the opportunity to:
We only disclose Personal Health Information with:
Our employees have access to Personal Information in the course of doing their jobs, such as: |
We use manual and electronic security procedures to maintain: a) the confidentiality; and b) the integrity of; Personal Information that we have. We use these procedures to guard against unauthorized access.
Some techniques we use to protect Personal Information include: a) secured files; b) user authentication; c) encryption; d) firewall technology; and e) the use of detection software.
We are responsible for and must: a) identify information to be protected; b) provide an adequate level of protection for that data; c) grant access to protected data only to those people who must use it in the performance of their job-related duties. Employees who violate our Privacy Policy will be subject to discipline, which may include ending their employment with us.
At the start of our business relationship, we will give You a copy of our current Privacy Policy.
We will also give You a copy of our current Privacy Policy once a year if You maintain a continuing business relationship with us.
We will continue to follow our Privacy Policy regarding Personal Information even when a business relationship no longer exists between us. | As used in this Privacy Notice:
Application means your request for our product or service.
Personal Financial Information means financial information such as:
Personal Health Information means health information such as:
Personal Information means information that identifies You personally and is not otherwise available to the public. It includes:
Transaction means your business dealings with us, such as:
You means an individual who has given us Personal Information in conjunction with: |
This Privacy Policy is being provided on behalf of the following affiliates of The Hartford Financial Services Group, Inc.:
1stAGChoice, Inc.; Access CoverageCorp, Inc.; Access CoverageCorp Technologies, Inc.; American Maturity Life Insurance Company; Archway 60 R, LLC; Business Management Group, Inc.; Catalyst360, LLC; Champlain Life Reinsurance Company; DMS R, LLC; Eloy R, LLC; Ersatz Corporation; First State Insurance Company; Hartford Accident and Indemnity Company; Hartford Administrative Services Company; Hartford Casualty General Agency, Inc.; Hartford Casualty Insurance Company; Hartford-Comprehensive Employee Benefit Service Company; Hartford Equity Sales Company, Inc.; Hartford Fire General Agency, Inc.; Hartford Fire Insurance Company; Hartford Funds Management Company, LLC; Hartford Funds Management Group, Inc.; Hartford HLS Series Fund II, Inc.; Hartford Insurance Company of Illinois; Hartford Insurance Company of the Midwest; Hartford Insurance Company of the Southeast; Hartford Integrated Technologies, Inc.; Hartford International Life Reassurance Corporation; Hartford Funds Distributors, LLC; Hartford Investment Management Company; Hartford Life and Accident Insurance Company; Hartford Life and Annuity Insurance Company; Hartford Life Insurance Company; Hartford Life Private Placement, LLC; Hartford Lloyd’s Corporation; Hartford Lloyd’s Insurance Company; Hartford Mezzanine Investors I, LLC; Hartford Residual Market, L.C.C.; Hartford Retirement Services, LLC; Hartford Securities Distribution Company, Inc.; Hartford Series Fund, Inc.; Hartford Specialty Insurance Services of Texas, LLC; Hartford Strategic Investments, LLC; Hartford Underwriters Insurance Company; Hartford Technology Services Company, L.L.C.; Hartford of Texas General Agency, Inc.; Hartford Underwriters General Agency, Inc.; HARTRE Company, L.C.C.; HL Investment Advisors, LLC; HLA LLC; Horizon Management Group, LLC; HRA Brokerage Services, Inc.; Lanidex Class B, LLC; M-CAP Insurance Agency, LLC; New England Insurance Company; New England Reinsurance Corporation; Nutmeg Insurance Agency, Inc.; Nutmeg Insurance Company; Pacific Insurance Company, Limited; Planco, LLC: Property and Casualty Insurance Company of Hartford; Revere R, LLC; RVR R, LLC; Sentinel Insurance Company, Ltd.; Sunstone R, LLC; Symphony R, LLC; The Evergreen Group Incorporated; The Hartford Alternative Strategies Fund; The Hartford Mutual Funds, Inc.; The Hartford Mutual Funds II, Inc.; Trumbull Flood Management, L.L.C.; Trumbull Insurance Company; Twin City Fire Insurance Company; White River Life Reinsurance Company.
HPP Revised December 2013
HARTFORD HLS FUNDS
c/o The Hartford Wealth Management - Global Annuities
P.O. Box 14293
Lexington, KY 40512-4293
HARTFORDFUNDS
hartfordfunds.com
Hartford Series Fund, Inc. is underwritten and distributed by Hartford Funds Distributors, LLC.
Hartford Series Fund, Inc. inception dates range from 1977 to date. Hartford Series Fund, Inc. is not a subsidiary of The Hartford Financial Services Group, Inc. ("The Hartford") but is underwritten, distributed by and advised by subsidiaries of The Hartford. Investments in Hartford Series Fund, Inc. are not guaranteed by The Hartford or any other entity.
This report is submitted for the general information of the shareholders of the Funds. It is not authorized for distribution unless preceded or accompanied by a current prospectus for the Funds.
Investors should carefully consider the investment objectives, risks, charges, and expenses of Hartford Funds before investing. This and other information can be found in the prospectus and summary prospectus, which can be obtained by calling 888-843-7824 (retail) or 877-836-5854 (institutional). Investors should read them carefully before they invest.
HLSAR-CA13 2-14 115337 Printed in U.S.A ©2013 The Hartford, Hartford, CT 06115
HARTFORDFUNDS
| HARTFORD DISCIPLINED EQUITY
HLS FUND
2013 Annual Report
|
A MESSAGE FROM THE PRESIDENT
Dear Fellow Shareholders:
Thank you for investing in Hartford HLS Funds.
Market Review
U.S. equities (as represented by the S&P 500 Index) generated their strongest year since 1997 in 2013, rising 32.39% for the year. During the fourth quarter, equities rose without looking back, pushing the S&P 500 Index and the Dow Jones Industrial Average to new all-time highs. Despite previously cheering delays to quantitative-easing tapering, the stock market received an additional boost at the end of the year following the U.S. Federal Reserve’s (Fed) announcement of a $10-billion-a-month reduction in bond purchases beginning in January.
The Fed’s decision to begin tapering its bond purchases is generally considered a vote of confidence in the recovering U.S. economy. Consumer spending has stabilized, the housing market is showing steady improvement, the unemployment rate is slowly declining and economic growth clocked in at a healthy 4.1% in the third quarter. Equities have also recovered since the market low in March 2009: The S&P 500 Index has gained 173% from the market low through December 31, 2013.
Signs of improvement are also visible outside the U.S. Europe appears to have begun its own economic recovery, and emerging markets have reversed their recent lackluster performance. Fiscal policy continues to wield significant influence in today’s economy and central banks across the globe are maintaining their accommodative stances, including the appointment of Janet Yellen, who is widely expected to continue current monetary policies, to succeed Ben Bernanke as U.S. Federal Reserve chairman.
It’s important to stay abreast of domestic and international economic developments while balancing your individual investment goals. Meeting with your financial advisor on a regular basis to examine your current investment strategy can help you determine whether you are on the right track:
| • | Is your portfolio fully diversified with an appropriate mix of stocks and bonds? |
| • | Is your portfolio incorporating both domestic and international holdings to take advantage of the global economic recovery? |
| • | Are your investments still in line with your risk tolerance and investment time horizon? |
Your financial advisor can help you choose options within our fund family to navigate today’s markets with confidence.
Thank you again for investing with Hartford HLS Funds.
James Davey
President
Hartford HLS Funds
1The S&P 500 Index is a market capitalization-weighted price index composed of 500 widely held common stocks.
2The Dow Jones Industrial Average is an unmanaged, price-weighted index of 30 of the largest, most widely held stocks traded on the New York Stock Exchange.
Hartford Disciplined Equity HLS Fund
Table of Contents
This report is prepared for the general information of contract owners and qualified retirement plan participants. It is not an offer of contracts or of qualified retirement plans. It should not be used in connection with any offer, except in conjunction with the appropriate product prospectus which contains all pertinent information including the applicable sales, administrative and other charges.
The views expressed in the Fund’s Manager Discussion under ‘‘Why did the Fund perform this way?’’ and ‘‘What is the outlook?’’ are views of the Fund’s sub-adviser and portfolio management team through the end of the period and are subject to change based on market and other conditions. The Fund’s Manager Discussion is for informational purposes only and does not represent an offer, recommendation or solicitation to buy, hold or sell any security. The specific securities identified and described, if any, do not represent all of the securities purchased or sold and you should not assume that investments in the securities identified and discussed will be profitable.
| Hartford Disciplined Equity HLS Fund inception 05/29/1998 |
| (sub-advised by Wellington Management Company, LLP) |
| Investment objective - Seeks growth of capital. |
Performance Overview 12/31/03 - 12/31/13

The chart above represents the hypothetical growth of a $10,000 investment in Class 1A. Growth results in classes other than Class 1A will vary from what is seen above due to differences in the expenses charged to those share classes.
Average Annual Total Returns (as of 12/31/13)
| 1 Year | 5 Years | 10 Years | ||||||||||
| Disciplined Equity IA | 35.82 | % | 18.28 | % | 7.41 | % | ||||||
| Disciplined Equity IB | 35.47 | % | 17.99 | % | 7.15 | % | ||||||
| S&P 500 Index | 32.39 | % | 17.94 | % | 7.41 | % | ||||||
PERFORMANCE DATA QUOTED REPRESENTS PAST PERFORMANCE AND DOES NOT GUARANTEE FUTURE RESULTS. The investment return and principal value of the investment will fluctuate so that investors’ shares, when redeemed, may be worth more or less than their original cost. Current performance may be lower or higher than the performance data quoted. To obtain performance data current to the most recent month-end, please visit our website at www.hartfordfunds.com.
Total returns presented above were calculated using the Fund’s net asset value available to shareholders for sale or redemption of Fund shares on December 31, 2013, which may exclude investment transactions as of this date. All share class returns assume the reinvestment of all distributions at net asset value and the deduction of all fund expenses.
S&P 500 Index is a market capitalization-weighted price index composed of 500 widely held common stocks.
You cannot invest directly in an index.
As of the Fund's current prospectus dated May 1, 2013, the total annual operating expense ratios for Class IA and Class IB were 0.75% and 1.00%, respectively. Actual expenses may be higher. Please see the accompanying Financial Highlights for expense ratios for the year ended December 31, 2013.
The chart and table do not reflect the deductions of taxes, sales charges or other fees which may be applied at the variable life insurance, variable annuity or qualified retirement plan product level. Any such additional sales charges or other fees or expenses would lower the contract’s or plan’s performance.
All investments are subject to risk including the possible loss of principal. For a discussion of the Fund’s risks, please see the Main Risks section of this report. For more detailed information on the risks associated with an investment in the Fund, please see the prospectus.
| 2 |
| Hartford Disciplined Equity HLS Fund |
| Manager Discussion |
| December 31, 2013 (Unaudited) |
| Portfolio Manager | |
| Mammen Chally, CFA | |
| Vice President and Equity Portfolio Manager | |
How did the Fund perform?
The Class IA shares of the Hartford Disciplined Equity HLS Fund returned 35.82% for the twelve-month period ended December 31, 2013, outperforming the Fund’s benchmark, the S&P 500 Index, which returned 32.39% for the same period. The Fund also outperformed the 31.34% average return of the Variable Products-Underlying Funds Lipper Large-Cap Core Funds peer group, a group of funds with investment strategies similar to those of the Fund.
Why did the Fund perform this way?
U.S. equities reached another all-time high in December and finished 2013 with a gain of 32.4%, as measured by the S&P 500 Index, the Index’s best return since 1997. The rally in U.S. equities began on the first trading day of the year after a last-minute compromise by the U.S. Congress averted the fiscal cliff. Optimism surrounding the fiscal reprieve was furthered during the first quarter by better-than-expected corporate earnings, a robust housing market, and a steadily improving employment picture. Solid gains in April and the first part of May paused following comments by U.S. Federal Reserve (Fed) Chairman Ben Bernanke that suggested the Fed might begin to slow quantitative easing sooner than investors anticipated. Nonetheless, equities resumed their ascent in the third quarter as the surprising “no taper” decision by the Federal Open Market Committee eased near-term concerns about rapidly rising interest rates derailing the recovery. Additionally, accommodative rhetoric from the European Central Bank, along with encouraging data in China and further evidence of a European economic recovery, contributed to a broad-based global equity rally that extended through the end of the year. In December, the year ended with an optimistic tone as investors cheered the elimination of two market overhangs: the timing of Fed tapering and the threat of another US government shutdown in early 2014.
Overall equity market performance was positive for the period across all market capitalizations: large cap (+32%), mid caps (+34%) and small cap equities (+39%) all rose significantly as represented by the S&P 500, S&P 400 MidCap, and Russell 2000 Indices, respectively. During the twelve-month period all ten sectors within the S&P 500 Index posted positive returns, led by Consumer Discretionary (+43%), Health Care (+42%), and Industrials (+41%).
The Fund outperformed its benchmark primarily due to positive stock selection, which was strongest in the Health Care, Financials, and Industrials sectors. This performance was partially offset by weaker security selection in Energy, Information Technology, and Materials. Allocation among sectors, a residual of the bottom-up stock selection process, also contributed to benchmark-relative outperformance due mainly to an overweight to the Health Care sector and an underweight to the Telecommunication Services sector.
The largest contributors to benchmark-relative performance were Towers Watson (Industrials), Gilead Sciences (Health Care), and Actavis (Health Care). Shares of Towers Watson, a global professional services company, surged after the firm posted better-than-expected quarterly earnings and management offered solid guidance for the 2013 fiscal year. Biopharmaceutical company Gilead Sciences saw its shares rise after reporting strong quarterly results that were driven by growing sales of the firm's antiviral drug franchise. Shares of specialty pharmaceutical company Actavis rose after Valeant Pharmaceuticals initiated merger discussions with the company. Management rejected the offer but completed a merger agreement with Warner-Chilcott. Google (Information Technology) also contributed to relative performance.
The largest detractors from benchmark-relative performance were Cobalt International Energy (Energy), Teradata (Information Technology), and Eli Lilly (Health Care). Shares of Cobalt International Energy, an offshore energy explorer, fell as a result of disappointing well test results at the company’s Lontra well off the coast of Angola. Shares of Teradata, a U.S.-based provider of analytic data and business applications, fell amid investors’ fears of increasing competition and declining pricing power. Additionally, the company preannounced a revenue shortfall citing weak demand in emerging markets. Biopharmaceutical company Eli Lilly saw its shares underperform following some disappointing developments in its pipeline, including a failed phase 2 clinical trial for its experimental Alzheimer’s treatment. Newmont Mining (Materials) also detracted on an absolute basis.
Derivatives are not used in a significant manner in this Fund and did not have a material impact on performance during the period.
What is the outlook?
We believe the U.S. economy is poised for continued moderate growth, which is in-line with consensus expectations
| 3 |
| Hartford Disciplined Equity HLS Fund |
| Manager Discussion – (continued) |
| December 31, 2013 (Unaudited) |
at this point. In our opinion, real gross domestic product (GDP) and Institute of Supply Management (ISM) manufacturing data both point to a fairly healthy outlook. We believe housing remains constructive, and the employment picture is grudgingly improving. We are also encouraged by rising levels of capacity utilization, which we believe will lead to increased capital expenditures in 2014 and benefit corporate earnings in future years. We believe the fiscal drag from last year should abate on a year-over-year basis and the Fed is likely to remain accommodative with a zero interest rate policy through 2014 and only modestly taper bond buying throughout the year. We believe that disruption related to the Affordable Care Act (Obama Care), rising interest rates, and only average valuation support, given the strong equity market this past year, are the biggest domestic risks.
Despite the strong run in equity markets and the more than 35% return in the Fund in 2013, we continue to find attractively valued stocks with the characteristics we seek. We are optimistic about the outlook for the U.S. economy and for equity markets, and we continue to monitor policy decisions and economic trends that may impact our holdings. We remain consistent in adhering to our disciplined portfolio construction process that is designed to allow us to assess risk, weight individual positions accordingly, and in the process build a portfolio that focuses largely on stock selection for generating benchmark relative outperformance. Based on individual stock decisions, the Fund ended the period most overweight to the Health Care, Industrials, and Consumer Staples sectors, and most underweight to Energy, Information Technology, and Telecommunication Services relative to the S&P 500 Index, the Fund’s benchmark.
Diversification by Sector
as of December 31, 2013
| Sector | Percentage of Net Assets | |||
| Equity Securities | ||||
| Consumer Discretionary | 12.0 | % | ||
| Consumer Staples | 10.2 | |||
| Energy | 8.2 | |||
| Financials | 15.1 | |||
| Health Care | 18.3 | |||
| Industrials | 12.0 | |||
| Information Technology | 16.8 | |||
| Materials | 2.7 | |||
| Services | 1.3 | |||
| Utilities | 2.2 | |||
| Total | 98.8 | % | ||
| Short-Term Investments | 0.9 | |||
| Other Assets and Liabilities | 0.3 | |||
| Total | 100.0 | % | ||
A sector may be comprised of several industries. For Fund compliance purposes, the Fund may not use the same classification system and these sector classifications are used for reporting ease.
| 4 |
| Hartford Disciplined Equity HLS Fund |
| Schedule of Investments |
| December 31, 2013 |
| (000’s Omitted) |
| Shares or Principal Amount | Market Value ╪ | |||||||
| COMMON STOCKS - 98.8% | ||||||||
| Banks - 4.3% | ||||||||
| 88 | Ocwen Financial Corp. ● | $ | 4,897 | |||||
| 161 | PNC Financial Services Group, Inc. | 12,487 | ||||||
| 389 | Wells Fargo & Co. | 17,668 | ||||||
| 157 | Zions Bancorporation | 4,695 | ||||||
| 39,747 | ||||||||
| Capital Goods - 8.1% | ||||||||
| 145 | AMETEK, Inc. | 7,613 | ||||||
| 94 | Boeing Co. | 12,847 | ||||||
| 102 | Dover Corp. | 9,874 | ||||||
| 112 | Eaton Corp. plc | 8,554 | ||||||
| 126 | Illinois Tool Works, Inc. | 10,596 | ||||||
| 40 | TransDigm Group, Inc. | 6,417 | ||||||
| 167 | United Technologies Corp. | 19,037 | ||||||
| 74,938 | ||||||||
| Commercial and Professional Services - 3.2% | ||||||||
| 132 | Equifax, Inc. ● | 9,098 | ||||||
| 84 | Quintiles Transnational Holdings ● | 3,909 | ||||||
| 74 | Towers Watson & Co. | 9,401 | ||||||
| 107 | Verisk Analytics, Inc. ● | 7,012 | ||||||
| 29,420 | ||||||||
| Consumer Durables and Apparel - 1.3% | ||||||||
| 90 | PVH Corp. | 12,247 | ||||||
| Consumer Services - 1.3% | ||||||||
| 129 | McDonald's Corp. | 12,474 | ||||||
| Diversified Financials - 6.1% | ||||||||
| 95 | Ameriprise Financial, Inc. | 10,931 | ||||||
| 23 | BlackRock, Inc. | 7,396 | ||||||
| 253 | Citigroup, Inc. | 13,195 | ||||||
| 294 | JP Morgan Chase & Co. | 17,208 | ||||||
| 253 | Morgan Stanley | 7,943 | ||||||
| 56,673 | ||||||||
| Energy - 8.2% | ||||||||
| 117 | Anadarko Petroleum Corp. | 9,278 | ||||||
| 224 | Chesapeake Energy Corp. | 6,070 | ||||||
| 144 | Chevron Corp. | 17,931 | ||||||
| 286 | Cobalt International Energy, Inc. ● | 4,706 | ||||||
| 144 | Exxon Mobil Corp. | 14,546 | ||||||
| 133 | Halliburton Co. | 6,735 | ||||||
| 78 | National Oilwell Varco, Inc. | 6,173 | ||||||
| 160 | Newfield Exploration Co. ● | 3,931 | ||||||
| 89 | Phillips 66 | 6,894 | ||||||
| 76,264 | ||||||||
| Food and Staples Retailing - 4.1% | ||||||||
| 93 | Costco Wholesale Corp. | 11,089 | ||||||
| 202 | CVS Caremark Corp. | 14,470 | ||||||
| 217 | Walgreen Co. | 12,473 | ||||||
| 38,032 | ||||||||
| Food, Beverage and Tobacco - 5.5% | ||||||||
| 240 | Altria Group, Inc. | 9,220 | ||||||
| 86 | Constellation Brands, Inc. Class A ● | 6,067 | ||||||
| 191 | Hillshire (The) Brands Co. | 6,386 | ||||||
| 149 | Monster Beverage Corp. ● | 10,102 | ||||||
| 150 | Philip Morris International, Inc. | 13,104 | ||||||
| 269 | WhiteWave Foods Co. Class A ● | 6,170 | ||||||
| 51,049 | ||||||||
| Health Care Equipment and Services - 4.7% | ||||||||
| 101 | Covidien plc | 6,860 | ||||||
| 139 | Envision Healthcare Holdings ● | 4,925 | ||||||
| 72 | McKesson Corp. | 11,645 | ||||||
| 151 | UnitedHealth Group, Inc. | 11,354 | ||||||
| 92 | Zimmer Holdings, Inc. | 8,572 | ||||||
| 43,356 | ||||||||
| Household and Personal Products - 0.6% | ||||||||
| 372 | Coty, Inc. | 5,675 | ||||||
| Insurance - 4.1% | ||||||||
| 77 | ACE Ltd. | 7,938 | ||||||
| 202 | American International Group, Inc. | 10,286 | ||||||
| 138 | Aon plc | 11,543 | ||||||
| 96 | Prudential Financial, Inc. | 8,828 | ||||||
| 38,595 | ||||||||
| Materials - 2.7% | ||||||||
| 169 | Crown Holdings, Inc. ● | 7,539 | ||||||
| 239 | Dow Chemical Co. | 10,602 | ||||||
| 38 | Sherwin-Williams Co. | 7,012 | ||||||
| 25,153 | ||||||||
| Media - 2.6% | ||||||||
| 219 | Time Warner, Inc. | 15,297 | ||||||
| 102 | Viacom, Inc. Class B | 8,943 | ||||||
| 24,240 | ||||||||
| Pharmaceuticals, Biotechnology and Life Sciences - 13.6% | ||||||||
| 71 | Actavis plc ● | 11,943 | ||||||
| 36 | Biogen Idec, Inc. ● | 9,993 | ||||||
| 224 | Bristol-Myers Squibb Co. | 11,905 | ||||||
| 112 | Cubist Pharmaceuticals, Inc. ● | 7,745 | ||||||
| 201 | Eli Lilly & Co. | 10,229 | ||||||
| 233 | Forest Laboratories, Inc. ● | 13,979 | ||||||
| 264 | Gilead Sciences, Inc. ● | 19,830 | ||||||
| 384 | Merck & Co., Inc. | 19,197 | ||||||
| 313 | Pfizer, Inc. | 9,576 | ||||||
| 25 | Regeneron Pharmaceuticals, Inc. ● | 6,749 | ||||||
| 54 | Salix Pharmaceuticals Ltd. ● | 4,897 | ||||||
| 126,043 | ||||||||
| Real Estate - 0.6% | ||||||||
| 283 | American Capital Agency Corp. | 5,459 | ||||||
| Retailing - 6.8% | ||||||||
| 35 | Amazon.com, Inc. ●Θ | 13,866 | ||||||
| 209 | Dollar Tree, Inc. ● | 11,818 | ||||||
| 290 | Lowe's Cos., Inc. | 14,345 | ||||||
| 145 | Ross Stores, Inc. | 10,866 | ||||||
| 200 | TJX Cos., Inc. | 12,718 | ||||||
| 63,613 | ||||||||
| Software and Services - 12.7% | ||||||||
| 148 | Accenture plc | 12,160 | ||||||
| 153 | Automatic Data Processing, Inc. | 12,372 | ||||||
| 73 | Cognizant Technology Solutions Corp. ● | 7,356 | ||||||
| 127 | eBay, Inc. ●Ø | 6,954 | ||||||
| 448 | Genpact Ltd. ● | 8,231 | ||||||
| 17 | Google, Inc. ● | 19,489 | ||||||
| 126 | Intuit, Inc. | 9,579 | ||||||
| 14 | Mastercard, Inc. | 11,563 | ||||||
| 325 | Oracle Corp. | 12,422 | ||||||
| 148 | VeriSign, Inc. ● | 8,825 | ||||||
| 215 | Yahoo!, Inc. ● | 8,697 | ||||||
| 117,648 | ||||||||
The accompanying notes are an integral part of these financial statements.
| 5 |
| Hartford Disciplined Equity HLS Fund |
| Schedule of Investments – (continued) |
| December 31, 2013 |
| (000’s Omitted) |
| Shares or Principal Amount | Market Value ╪ | ||||||||||
| COMMON STOCKS - 98.8% - (continued) | |||||||||||
| Technology Hardware and Equipment - 4.1% | |||||||||||
| 53 | Apple, Inc. | $ | 29,826 | ||||||||
| 376 | Cisco Systems, Inc. | 8,442 | |||||||||
| 38,268 | |||||||||||
| Telecommunication Services - 1.3% | |||||||||||
| 337 | AT&T, Inc. | 11,840 | |||||||||
| Transportation - 0.7% | |||||||||||
| 233 | Hertz Global Holdings, Inc. ●Θ | 6,680 | |||||||||
| Utilities - 2.2% | |||||||||||
| 170 | American Electric Power Co., Inc. | 7,965 | |||||||||
| 76 | NextEra Energy, Inc. | 6,471 | |||||||||
| 90 | NRG Energy, Inc. | 2,577 | |||||||||
| 70 | Pinnacle West Capital Corp. | 3,702 | |||||||||
| 20,715 | |||||||||||
| Total common stocks | |||||||||||
| (cost $595,347) | $ | 918,129 | |||||||||
| Total long-term investments (cost $595,347) | $ | 918,129 | |||||||||
| SHORT-TERM INVESTMENTS - 0.9% | |||||||||||
| Repurchase Agreements - 0.9% | |||||||||||
| Bank of America Merrill Lynch TriParty Repurchase Agreement (maturing on 01/02/2014 in the amount of $435, collateralized by GNMA 4.00%, 2043, value of $443) | |||||||||||
| $ | 435 | 0.005%, 12/31/2013 | $ | 435 | |||||||
| Bank of Montreal TriParty Repurchase Agreement (maturing on 01/02/2014 in the amount of $418, collateralized by FNMA 1.58% - 4.50%, 2020 - 2043, U.S. Treasury Note 0.25% - 4.00%, 2015 - 2020, value of $426) | |||||||||||
| 418 | 0.01%, 12/31/2013 | 418 | |||||||||
| Bank of Montreal TriParty Repurchase Agreement (maturing on 01/02/2014 in the amount of $1,479, collateralized by FHLMC 3.00% - 5.00%, 2019 - 2043, FNMA 0.76% - 6.00%, 2016 - 2043, GNMA 1.50% - 5.25%, 2028 - 2043, value of $1,509) | |||||||||||
| 1,479 | 0.02%, 12/31/2013 | 1,479 | |||||||||
| Barclays Capital TriParty Repurchase Agreement (maturing on 01/02/2014 in the amount of $1,334, collateralized by U.S. Treasury Note 0.50% - 2.25%, 2017, value of $1,361) | |||||||||||
| 1,334 | 0.01%, 12/31/2013 | 1,334 | |||||||||
| Citigroup Global Markets, Inc. TriParty Repurchase Agreement (maturing on 01/02/2014 in the amount of $2,400, collateralized by U.S. Treasury Bond 3.88% - 8.13%, 2021 - 2040, U.S. Treasury Note 0.25% - 3.38%, 2014 - 2020, value of $2,448) | |||||||||||
| 2,400 | 0.01%, 12/31/2013 | 2,400 | |||||||||
| RBS Securities, Inc. TriParty Repurchase Agreement (maturing on 01/02/2014 in the amount of $780, collateralized by U.S. Treasury Note 0.25% - 1.00%, 2015 - 2017, value of $796) | |||||||||||
| $ | 780 | 0.01%, 12/31/2013 | 780 | ||||||||
| TD Securities TriParty Repurchase Agreement (maturing on 01/02/2014 in the amount of $1,872, collateralized by FFCB 0.20% - 0.50%, 2015 - 2016, FHLMC 0.38% - 5.25%, 2014 - 2042, FNMA 0.50% - 7.13%, 2014 - 2043, value of $1,910) | |||||||||||
| 1,872 | 0.01%, 12/31/2013 | 1,872 | |||||||||
| UBS Securities, Inc. Repurchase Agreement (maturing on 01/02/2014 in the amount of $16, collateralized by U.S. Treasury Note 2.13%, 2015, value of $16) | |||||||||||
| 16 | 0.01%, 12/31/2013 | 16 | |||||||||
| 8,734 | |||||||||||
| Total short-term investments | |||||||||||
| (cost $8,734) | $ | 8,734 | |||||||||
| Total investments | |||||||||||
| (cost $604,081) ▲ | 99.7 | % | $ | 926,863 | |||||||
| Other assets and liabilities | 0.3 | % | 2,834 | ||||||||
| Total net assets | 100.0 | % | $ | 929,697 | |||||||
The accompanying notes are an integral part of these financial statements.
| 6 |
| Note: | Percentage of investments as shown is the ratio of the total market value to total net assets. |
| ▲ | At December 31, 2013, the cost of securities for federal income tax purposes was $603,894 and the aggregate gross unrealized appreciation and depreciation based on that cost were: |
| Unrealized Appreciation | $ | 329,188 | ||
| Unrealized Depreciation | (6,219 | ) | ||
| Net Unrealized Appreciation | $ | 322,969 |
| ● | Non-income producing. |
| Θ | At December 31, 2013, this security, or a portion of this security, is designated to cover written call options in the table below: |
Written Call Options Outstanding at December 31, 2013
| Description | Option Type | Exercise Price/ Rate | Expiration Date | Number of Contracts* | Market Value ╪ | Premiums Received | Unrealized Appreciation (Depreciation) | ||||||||||||||||
| Amazon.com Option | Equity | $ | 395.00 | 01/18/2014 | 25 | $ | 28 | $ | 26 | $ | (2 | ) | |||||||||||
| Hertz Global Option | Equity | $ | 27.00 | 01/18/2014 | 370 | 72 | 13 | (59 | ) | ||||||||||||||
| $ | 100 | $ | 39 | $ | (61 | ) | |||||||||||||||||
| * | The number of contracts does not omit 000's. Number of contracts shown in U.S. dollars unless otherwise noted. |
| Ø | At December 31, 2013, this security, or a portion of this security, and cash of $2,923 collateralized the written put options in the table below: |
Written Put Options Outstanding at December 31, 2013
| Description | Option Type | Exercise Price/ Rate | Expiration Date | Number of Contracts* | Market Value ╪ | Premiums Received | Unrealized Appreciation (Depreciation) | ||||||||||||||||
| Newfield Exploration Option | Equity | $ | 22.50 | 01/18/2014 | 366 | $ | 4 | $ | 9 | $ | 5 | ||||||||||||
| Walgreen Co. Option | Equity | $ | 52.50 | 01/18/2014 | 162 | 2 | 9 | 7 | |||||||||||||||
| $ | 6 | $ | 18 | $ | 12 | ||||||||||||||||||
| * | The number of contracts does not omit 000's. Number of contracts shown in U.S. dollars unless otherwise noted. |
| ╪ | See Significant Accounting Policies of accompanying Notes to Financial Statements regarding valuation of securities. |
| GLOSSARY: (abbreviations used in preceding Schedule of Investments) | |
| Other Abbreviations: | |
| FFCB | Federal Farm Credit Bank |
| FHLMC | Federal Home Loan Mortgage Corp. |
| FNMA | Federal National Mortgage Association |
| GNMA | Government National Mortgage Association |
The accompanying notes are an integral part of these financial statements.
| 7 |
| Hartford Disciplined Equity HLS Fund |
| Investment Valuation Hierarchy Level Summary |
| December 31, 2013 |
| (000’s Omitted) |
| Total | Level 1 ♦ | Level 2 ♦ | Level 3 | |||||||||||||
| Assets: | ||||||||||||||||
| Common Stocks ‡ | $ | 918,129 | $ | 918,129 | $ | – | $ | – | ||||||||
| Short-Term Investments | 8,734 | – | 8,734 | – | ||||||||||||
| Total | $ | 926,863 | $ | 918,129 | $ | 8,734 | $ | – | ||||||||
| Liabilities: | ||||||||||||||||
| Written Options | 106 | 106 | – | – | ||||||||||||
| Total | $ | 106 | $ | 106 | $ | – | $ | – | ||||||||
| ♦ | For the year ended December 31, 2013, there were no transfers between Level 1 and Level 2. |
| ‡ | The Fund has all or primarily all of the equity securities categorized in a particular level. Refer to the Schedule of Investments for further industry breakout. |
| Note: | For purposes of reporting transfers between different hierarchy levels, both transfers in and out of each level, as applicable, are shown as if they occurred at the beginning of the period. |
The accompanying notes are an integral part of these financial statements.
| 8 |
| Hartford Disciplined Equity HLS Fund |
| Statement of Assets and Liabilities |
| December 31, 2013 |
| (000’s Omitted) |
| Assets: | ||||
| Investments in securities, at market value (cost $604,081) | $ | 926,863 | ||
| Cash | 2,924 | * | ||
| Receivables: | ||||
| Fund shares sold | 40 | |||
| Dividends and interest | 976 | |||
| Total assets | 930,803 | |||
| Liabilities: | ||||
| Payables: | ||||
| Investment securities purchased | 24 | |||
| Fund shares redeemed | 733 | |||
| Investment management fees | 146 | |||
| Distribution fees | 6 | |||
| Accrued expenses | 91 | |||
| Written options (proceeds $57) | 106 | |||
| Total liabilities | 1,106 | |||
| Net assets | $ | 929,697 | ||
| Summary of Net Assets: | ||||
| Capital stock and paid-in-capital | $ | 607,660 | ||
| Undistributed net investment income | 377 | |||
| Accumulated net realized loss | (1,073 | ) | ||
| Unrealized appreciation of investments | 322,733 | |||
| Net assets | $ | 929,697 | ||
| Shares authorized | 3,500,000 | |||
| Par value | $ | 0.001 | ||
| Class IA: Net asset value per share | $ | 18.36 | ||
| Shares outstanding | 44,169 | |||
| Net assets | $ | 811,099 | ||
| Class IB: Net asset value per share | $ | 18.27 | ||
| Shares outstanding | 6,490 | |||
| Net assets | $ | 118,598 |
| * | Cash of $2,923 was designated to cover open put options written at December 31, 2013. |
The accompanying notes are an integral part of these financial statements.
| 9 |
| Hartford Disciplined Equity HLS Fund |
| Statement of Operations |
| For the Year Ended December 31, 2013 |
| (000’s Omitted) |
| Investment Income: | ||||
| Dividends | $ | 17,079 | ||
| Interest | 4 | |||
| Total investment income, net | 17,083 | |||
| Expenses: | ||||
| Investment management fees | 6,693 | |||
| Transfer agent fees | 1 | |||
| Distribution fees - Class IB | 296 | |||
| Custodian fees | 8 | |||
| Accounting services fees | 112 | |||
| Board of Directors' fees | 25 | |||
| Audit fees | 19 | |||
| Other expenses | 217 | |||
| Total expenses (before fees paid indirectly) | 7,371 | |||
| Commission recapture | (5 | ) | ||
| Custodian fee offset | — | |||
| Total fees paid indirectly | (5 | ) | ||
| Total expenses, net | 7,366 | |||
| Net Investment Income | 9,717 | |||
| Net Realized Gain on Investments and Other Financial Instruments: | ||||
| Net realized gain on investments | 138,607 | |||
| Net realized gain on written options | 639 | |||
| Net Realized Gain on Investments and Other Financial Instruments | 139,246 | |||
| Net Changes in Unrealized Appreciation of Investments and Other Financial Instruments: | ||||
| Net unrealized appreciation of investments | 136,650 | |||
| Net unrealized depreciation of written options | (79 | ) | ||
| Net Changes in Unrealized Appreciation of Investments and Other Financial Instruments | 136,571 | |||
| Net Gain on Investments and Other Financial Instruments | 275,817 | |||
| Net Increase in Net Assets Resulting from Operations | $ | 285,534 |
The accompanying notes are an integral part of these financial statements.
| 10 |
| Hartford Disciplined Equity HLS Fund |
| Statement of Changes in Net Assets |
| (000’s Omitted) |
| For the Year Ended December 31, 2013 | For the Year Ended December 31, 2012 | |||||||
| Operations: | ||||||||
| Net investment income | $ | 9,717 | $ | 13,907 | ||||
| Net realized gain on investments and other financial instruments | 139,246 | 95,446 | ||||||
| Net unrealized appreciation of investments and other financial instruments | 136,571 | 52,037 | ||||||
| Net Increase in Net Assets Resulting from Operations | 285,534 | 161,390 | ||||||
| Distributions to Shareholders: | ||||||||
| From net investment income | ||||||||
| Class IA | (7,372 | ) | (12,461 | ) | ||||
| Class IB | (797 | ) | (1,507 | ) | ||||
| Total distributions | (8,169 | ) | (13,968 | ) | ||||
| Capital Share Transactions: | ||||||||
| Class IA | ||||||||
| Sold | 57,246 | 32,537 | ||||||
| Issued on reinvestment of distributions | 7,372 | 12,461 | ||||||
| Redeemed | (293,919 | ) | (227,233 | ) | ||||
| Total capital share transactions | (229,301 | ) | (182,235 | ) | ||||
| Class IB | ||||||||
| Sold | 9,794 | 9,132 | ||||||
| Issued on reinvestment of distributions | 797 | 1,507 | ||||||
| Redeemed | (43,219 | ) | (43,293 | ) | ||||
| Total capital share transactions | (32,628 | ) | (32,654 | ) | ||||
| Net decrease from capital share transactions | (261,929 | ) | (214,889 | ) | ||||
| Net Increase (Decrease) in Net Assets | 15,436 | (67,467 | ) | |||||
| Net Assets: | ||||||||
| Beginning of period | 914,261 | 981,728 | ||||||
| End of period | $ | 929,697 | $ | 914,261 | ||||
| Undistributed (distribution in excess of) | ||||||||
| net investment income | $ | 377 | $ | — | ||||
| Shares: | ||||||||
| Class IA | ||||||||
| Sold | 3,665 | 2,498 | ||||||
| Issued on reinvestment of distributions | 408 | 918 | ||||||
| Redeemed | (18,406 | ) | (17,242 | ) | ||||
| Total share activity | (14,333 | ) | (13,826 | ) | ||||
| Class IB | ||||||||
| Sold | 624 | 705 | ||||||
| Issued on reinvestment of distributions | 44 | 111 | ||||||
| Redeemed | (2,729 | ) | (3,301 | ) | ||||
| Total share activity | (2,061 | ) | (2,485 | ) | ||||
The accompanying notes are an integral part of these financial statements.
| 11 |
| Hartford Disciplined Equity HLS Fund |
| Notes to Financial Statements |
| December 31, 2013 |
| (000’s Omitted) |
| 1. | Organization: |
Hartford Disciplined Equity HLS Fund (the “Fund”) serves as an underlying investment option for certain variable annuity and variable life insurance separate accounts of Hartford Life Insurance Company (“HLIC”) and its affiliates and certain qualified retirement plans. The Fund may also serve as an underlying investment option for certain variable annuity and variable life separate accounts of other insurance companies. Owners of variable annuity contracts and policyholders of variable life insurance contracts may choose the funds permitted in the variable insurance contract prospectus. In addition, participants in certain qualified retirement plans may choose the Fund if permitted by their plans.
Hartford Series Fund, Inc. (the “Company”) is an open-end registered management investment company comprised of thirty portfolios. Financial statements for the Fund, a series of the Company, are included in this report.
The Company is organized under the laws of the State of Maryland and is registered with the Securities and Exchange Commission (“SEC”) under the Investment Company Act of 1940, as amended (“1940 Act”). The Fund is a diversified open-end management investment company.
The Fund is divided into Class IA and Class IB shares. Each class is offered at the per share net asset value (“NAV”) without a sales charge and is subject to the same expenses, except that the Class IB shares are subject to distribution and service fees charged pursuant to a Distribution Plan adopted in accordance with Rule 12b-1 under the 1940 Act.
| 2. | Significant Accounting Policies: |
The following is a summary of significant accounting policies of the Fund in the preparation of its financial statements, which are in accordance with United States Generally Accepted Accounting Principles (“U.S. GAAP”). The preparation of financial statements in accordance with U.S. GAAP may require management to make estimates and assumptions that affect the reported amounts of assets and liabilities and disclosure of contingent assets and liabilities at the date of the financial statements and the reported amounts of increases and decreases in net assets from operations during the reporting period. Actual results could differ from those estimates.
| a) | Determination of Net Asset Value – The NAV of each class of the Fund’s shares is determined as of the close of regular trading (normally 4:00 p.m. Eastern Time) (the “NYSE Close”) on each day that the New York Stock Exchange (the “Exchange”) is open (“Valuation Date”). Information that becomes known to the Fund after the NAV has been calculated on a particular day will not generally be used to retroactively adjust the NAV determined earlier that day. |
| b) | Investment Valuation and Fair Value Measurements – For purposes of calculating the NAV, portfolio investments and other assets held by the Fund's portfolio for which market quotes are readily available are valued at market value. Market value is generally determined on the basis of last reported sales prices or official close price. If no sales are reported, market value is based on quotes obtained from a quotation reporting system, established market makers, or independent pricing services. If market prices are not readily available or are deemed unreliable, the Fund will use the fair value of the investment as determined in good faith under policies and procedures established by and under the supervision of the Company’s Board of Directors. Market quotes are considered not readily available where there is an absence of current or reliable market-based data (e.g., trade information or indicative market quotes), including where events occur after the close of the relevant market, but prior to the NYSE Close, that materially affect the values of the Fund’s portfolio investments or assets. In addition, market quotes are considered not readily available when, due to extraordinary circumstances, the exchanges or markets on which the investments trade do not open for trading for the entire day and no other market prices are available. In addition, prices of foreign equities that are principally traded on certain foreign markets may be adjusted daily pursuant to a fair value pricing service approved by the Board of Directors in order to reflect an adjustment for the factors occurring after the close of certain foreign markets but before the NYSE Close. Investments that are primarily traded on foreign markets may trade on days that are not business days of the Fund. The value of the foreign investments in which the Fund invests may change on days when a shareholder will not be able to purchase or redeem shares of the Fund. Fair value pricing is subjective in nature and the use of fair value pricing by the |
| 12 |
Fund may cause the NAV of its shares to differ significantly from the NAV that would have been calculated using market prices at the close of the exchange on which a portfolio investment is primarily traded. There can be no assurance that the Fund could obtain the fair market value assigned to an investment if the Fund were to sell the investment at approximately the time at which the Fund determines its NAV.
Exchange traded options, futures and options on futures are valued at the settlement price or last trade price determined by the relevant exchange as of the NYSE Close. If the last trade price for exchange traded options does not fall between the bid and ask prices, the value will be the mean of the bid and ask prices as of the NYSE Close. If a last trade price is not available, the value will be the mean of the bid and ask prices as of the NYSE Close. If a mean of the bid and ask prices cannot be calculated for the day, the value will be the bid price as of the NYSE Close. In the case of OTC options and such instruments that do not trade on an exchange, values may be supplied by a pricing service using a formula or other objective method that may take into consideration the style, direction, expiration, strike price, notional value and volatility or other special adjustments.
Financial instruments for which prices are not available from an independent pricing service may be valued using market quotations obtained from one or more dealers that make markets in the respective financial instrument in accordance with procedures established by the Company’s Board of Directors.
U.S. GAAP defines fair value as the price that the Fund would receive to sell an asset or pay to transfer a liability in an orderly transaction between market participants. The U.S. GAAP fair value measurement standards require disclosure of a fair value hierarchy for each major category of assets and liabilities. Various inputs are used in determining the fair value of the Fund’s investments. These inputs are summarized into three broad hierarchy levels. This hierarchy is based on whether the valuation inputs are observable or unobservable. These levels are:
| · | Level 1 – Quoted prices in active markets for identical investments. Level 1 may include exchange traded instruments, such as domestic equities, some foreign equities, options, futures, mutual funds, exchange traded funds, rights and warrants. |
| · | Level 2 – Observable inputs other than Level 1 prices, such as quoted prices for similar investments; quoted prices in markets that are not active; or other inputs that are observable or can be corroborated by observable market data. Level 2 may include debt investments that are traded less frequently than exchange traded instruments and which are valued using independent pricing services; foreign equities, which are principally traded on certain foreign markets and are adjusted daily pursuant to a fair value pricing service in order to reflect an adjustment for the factors occurring after the close of certain foreign markets but before the NYSE Close; senior floating rate interests, which are valued using an aggregate of dealer bids; short-term investments, which are valued at amortized cost; and swaps, which are valued based upon the terms of each swap contract. |
| · | Level 3 – Significant unobservable inputs that are supported by limited or no market activity. Level 3 may include financial instruments whose values are determined using indicative market quotes or require significant management judgment or estimation. These unobservable valuation inputs may include estimates for current yields, maturity/duration, prepayment speed, and indicative market quotes for comparable investments along with other assumptions relating to credit quality, collateral value, complexity of the investment structure, general market conditions and liquidity. This category may include investments where trading has been halted or there are certain restrictions on trading. While these investments are priced using unobservable inputs, the valuation of these investments reflects the best available data and management believes the prices are a reasonable representation of exit price. |
The Board of Directors of the Company generally reviews and approves the “Procedures for Valuation of Portfolio Securities” on an annual basis. These procedures define how investments are to be valued, including the formation and activities of a Valuation Committee. The Valuation Committee is responsible for determining in good faith the fair value of investments when the value cannot be obtained from primary pricing services or alternative sources or if the valuation of an investment as provided by the primary pricing service or alternative source is believed not to reflect the investment’s fair value as of the Valuation Date. Voting members of the
| 13 |
| Hartford Disciplined Equity HLS Fund |
| Notes to Financial Statements – (continued) |
| December 31, 2013 |
| (000’s Omitted) |
Valuation Committee include the Fund’s Treasurer or designee and a Vice President of the investment manager or designee. An Assistant Vice President of the Fund with legal expertise or designee is also included on the Valuation Committee as a non-voting advisory member. In addition, the Fund’s Chief Compliance Officer shall designate a member of the compliance group to attend Valuation Committee meetings as a non-voting resource, to monitor for and provide guidance with respect to compliance with these procedures. Two members of the Valuation Committee or their designees, representing different departments, shall constitute a quorum for purposes of permitting the Valuation Committee to take action. The Valuation Committee will consider all relevant factors in determining an investment’s fair value, and may seek the advice of the Fund’s sub-adviser, knowledgeable brokers, and legal counsel in making such determination. The Valuation Committee reports to the Audit Committee of the Company’s Board of Directors. The Audit Committee receives quarterly written reports which include details of all fair-valued investments, including the reason for the fair valuation, and an indication, when possible, of the accuracy of the valuation by disclosing the next available reliable public price quotation or the disposition price of such investments (the “look-back” test). The Board of Directors then must consider for ratification all of the fair value determinations made during the previous quarter.
Valuation levels are not necessarily indicative of the risk associated with investing in such investments. Individual investments within any of the above mentioned asset classes may be assigned a different hierarchical level than those presented above, as individual circumstances dictate.
For additional information, refer to the Investment Valuation Hierarchy Level Summary and the Level 3 roll-forward reconciliation, if applicable, which follow the Schedule of Investments.
| c) | Investment Transactions and Investment Income – Investment transactions are recorded as of the trade date (the date the order to buy or sell is executed) for financial reporting purposes. Investments purchased or sold on a when-issued or delayed-delivery basis may be settled a month or more after the trade date. Realized gains and losses are determined on the basis of identified cost. |
Dividend income from domestic securities is accrued on the ex-dividend date. In general, dividend income from foreign securities is recorded on the ex-date; however, dividend notifications in certain foreign jurisdictions may not be available in a timely manner and as a result, the Fund will record the dividend as soon as the relevant details (i.e., rate per share, payment date, shareholders of record, etc.) are publicly available. Interest income, including amortization of premium, accretion of discounts and additional principal received in-kind in lieu of cash, is accrued on a daily basis.
| d) | Joint Trading Account – The Fund may invest cash balances into a joint trading account that may be invested in one or more repurchase agreements. |
| e) | Fund Share Valuation and Dividend Distributions to Shareholders – Orders for the Fund’s shares are executed in accordance with the investment instructions of the contract holders and plan participants. The NAV of the Fund’s shares is determined as of the close of business on each business day of the Exchange. The NAV is determined separately for each class of shares of the Fund by dividing the Fund’s net assets attributable to that class by the number of shares of the class outstanding. Each class of shares offered by the Fund has equal rights as to assets and voting privileges (except that shareholders of a class have exclusive voting rights regarding any matter relating solely to that class of shares). Income and non-class specific expenses are allocated daily to each class on the basis of the relative net assets of the class. Realized and unrealized gains and losses are allocated daily based on the relative net assets of each class of shares of the Fund. |
Orders for the purchase of the Fund’s shares received prior to the close of the Exchange on any day the Exchange is open for business are priced at the NAV determined as of the close of the Exchange. Orders received after the close of the Exchange, or on a day on which the Exchange and/or the Fund is not open for business, are priced at the next determined NAV.
| 14 |
Dividends are declared pursuant to a policy adopted by the Company’s Board of Directors based upon the investment performance of the Fund. The policy of the Fund is to pay dividends from net investment income and realized gains, if any, at least once a year.
Distributions from net investment income, net realized gains and capital are determined in accordance with federal income tax regulations, which may differ from U.S. GAAP with respect to character and timing. These differences may include, but are not limited to, losses deferred due to wash sale adjustments, foreign currency gains and losses, adjustments related to Passive Foreign Investment Companies (“PFICs”), Real Estate Investment Trusts (“REITs”), Regulated Investment Companies (“RICs”), certain derivatives and partnerships. Permanent book and federal income tax basis differences relating to shareholder distributions will result in reclassifications to certain of the Fund’s capital accounts (see Federal Income Taxes: Reclassification of Capital Accounts note).
| 3. | Securities and Other Investments: |
| a) | Repurchase Agreements – A repurchase agreement is an agreement by which a counterparty agrees to sell an investment and agrees to repurchase the investment sold from the buyer at a mutually agreed upon time and price. During the period of the repurchase agreement, the counterparty will deposit cash and or securities in a third party custodial account to serve as collateral. At the time the Fund enters into a repurchase agreement, the value of the underlying collateral, including accrued interest, will be equal to or exceed the value of the repurchase agreement. Repurchase agreements expose the Fund to counterparty risk - that is, the risk that the counterparty will not fulfill its obligations. To minimize counterparty risk, the investments that serve to collateralize the repurchase agreement are held by the Fund’s custodian in book entry or physical form in the custodial account of the Fund or in a third party custodial account. Repurchase agreements are valued at cost plus accrued interest, which approximates fair value. Repurchase agreements have master netting arrangements which allow the Fund to offset amounts owed to a counterparty with amounts owed by the counterparty, including any collateral. Upon an event of default under a master repurchase agreement, the non-defaulting party may close out all transactions traded under such agreement and net amounts owed under each transaction to one net amount payable by one party to the other. Absent an event of default, the master repurchase agreement does not result in an offset of reported amounts of assets and liabilities in the Statement of Assets and Liabilities across transactions between the Fund and the applicable counterparty. The Fund, as shown on the Schedule of Investments, had outstanding repurchase agreements and related collateral as of December 31, 2013. |
| 4. | Financial Derivative Instruments: |
The following disclosures contain information on how and why the Fund uses derivative instruments, the credit-risk-related contingent features in certain derivative instruments, and how derivative instruments affect the Fund’s financial position and results of operations. The location and fair value amounts of these instruments on the Statement of Assets and Liabilities and the realized gains and losses and changes in unrealized gains and losses on the Statement of Operations, each categorized by type of derivative contract, are included in the following Additional Derivative Instrument Information footnote. The derivative instruments outstanding as of year-end are disclosed in the notes to or within the Schedule of Investments for purchased options, if applicable. The amounts of realized gains and losses and changes in unrealized gains and losses on derivative instruments during the year are disclosed in the Statement of Operations.
| a) | Options Contracts – An option contract is a contract sold by one party to another party that offers the buyer the right, but not the obligation, to buy (call) or sell (put) an investment or other financial asset at an agreed-upon price during a specific period of time or on a specific date. The Fund may write (sell) covered call and put options on futures, swaps (“swaptions”), securities, commodities or currencies. “Covered” means that so long as the Fund is obligated as the writer of an option, it will own either the underlying investments or currency or an option to purchase the same underlying investments or currency having an expiration date of the covered option and an exercise price equal to or less than the exercise price of the covered option, or will pledge cash or other liquid investments having a value equal to or greater than the fluctuating market value of the option investment or currency. Writing put options increases the Fund’s |
| 15 |
| Hartford Disciplined Equity HLS Fund |
| Notes to Financial Statements – (continued) |
| December 31, 2013 |
| (000’s Omitted) |
exposure to the underlying instrument. Writing call options decreases the Fund’s exposure to the underlying instrument. Premiums received from writing options that expire are treated as realized gains. Premiums received from writing options that are exercised or closed are added to the proceeds or offset amounts paid on the underlying futures, swap, investment or currency transaction to determine the realized gain or loss. The Fund as a writer of an option has no control over whether the underlying instrument may be sold (call) or purchased (put) and as a result bears the market risk of an unfavorable change in the price of the instrument underlying the written option. There is the risk the Fund may not be able to enter into a closing transaction because of an illiquid market. The Fund may also purchase put and call options. Purchasing call options increases the Fund’s exposure to the underlying instrument. Purchasing put options decreases the Fund’s exposure to the underlying instrument. The Fund pays a premium, which is included on the Fund’s Statement of Assets and Liabilities as an investment and is subsequently marked to market to reflect the current value of the option. Premiums paid for purchasing options that expire are treated as realized losses. Certain options may be purchased with premiums to be determined on a future date. The premiums for these options are based upon implied volatility parameters at specified terms. The risk associated with purchasing put and call options is generally limited to the premium paid. Premiums paid for purchasing options that are exercised or closed are added to the amounts paid or offset against the proceeds on the underlying investment transaction to determine the realized gain or loss. Entering into over-the-counter options also exposes the Fund to counterparty risk. Counterparty risk is the possibility that the counterparty to the agreements may default on its obligation to perform or disagree as to the meaning of the contractual terms in the agreements. The Fund had no outstanding purchased options contracts as of December 31, 2013. The Fund, as shown on the Schedule of Investments, had outstanding written options contracts as of December 31, 2013. Transactions involving written options contracts during the year ended December 31, 2013, are summarized below:
| Options Contract Activity During the Year Ended December 31, 2013 | ||||||||
| Call Options Written During the Year | Number of Contracts* | Premium Amounts | ||||||
| Beginning of the year | 1,364 | $ | 80 | |||||
| Written | 7,735 | 621 | ||||||
| Expired | (5,414 | ) | (393 | ) | ||||
| Closed | (1,962 | ) | (200 | ) | ||||
| Exercised | (1,328 | ) | (69 | ) | ||||
| End of year | 395 | $ | 39 | |||||
| Put Options Written During the Year | Number of Contracts* | Premium Amounts | ||||||
| Beginning of the year | 755 | $ | 58 | |||||
| Written | 11,118 | 720 | ||||||
| Expired | (9,103 | ) | (527 | ) | ||||
| Closed | (2,242 | ) | (233 | ) | ||||
| Exercised | — | — | ||||||
| End of year | 528 | $ | 18 | |||||
| * | The number of contracts does not omit 000's. |
| b) | Additional Derivative Instrument Information: |
Fair Value of Derivative Instruments on the Statement of Assets and Liabilities as of December 31, 2013:
| Risk Exposure Category | ||||||||||||||||||||||||||||
| Interest Rate Contracts | Foreign Exchange Contracts | Credit Contracts | Equity Contracts | Commodity Contracts | Other Contracts | Total | ||||||||||||||||||||||
| Liabilities: | ||||||||||||||||||||||||||||
| Written options, market value | $ | — | $ | — | $ | — | $ | 106 | $ | — | $ | — | $ | 106 | ||||||||||||||
| Total | $ | — | $ | — | $ | — | $ | 106 | $ | — | $ | — | $ | 106 | ||||||||||||||
The volume of derivatives that is presented in the Schedule of Investments is consistent with the derivative activity during the year ended December 31, 2013.
| 16 |
The Effect of Derivative Instruments on the Statement of Operations for the year ended December 31, 2013:
| Risk Exposure Category | ||||||||||||||||||||||||||||
| Interest Rate Contracts | Foreign Exchange Contracts | Credit Contracts | Equity Contracts | Commodity Contracts | Other Contracts | Total | ||||||||||||||||||||||
| Realized Gain on Derivatives Recognized as a Result of Operations: | ||||||||||||||||||||||||||||
| Net realized gain on written options | $ | — | $ | — | $ | — | $ | 639 | $ | — | $ | — | $ | 639 | ||||||||||||||
| Total | $ | — | $ | — | $ | — | $ | 639 | $ | — | $ | — | $ | 639 | ||||||||||||||
| Net Change in Unrealized Appreciation (Depreciation) on Derivatives Recognized as a Result of Operations: | ||||||||||||||||||||||||||||
| Net change in unrealized depreciation of written options | $ | — | $ | — | $ | — | $ | (79 | ) | $ | — | $ | — | $ | (79 | ) | ||||||||||||
| Total | $ | — | $ | — | $ | — | $ | (79 | ) | $ | — | $ | — | $ | (79 | ) | ||||||||||||
The derivatives held by the Fund as of December 31, 2013 are not subject to a master netting arrangement; therefore, no balance sheet offsetting disclosure is presented.
| 5. | Principal Risks: |
The Fund may be exposed to counterparty risk, or the risk that an institution or other entity with which the Fund has unsettled or open transactions will default.
The market values of equity securities, such as common stocks and preferred stocks, or equity related investments, such as futures and options, may decline due to general market conditions which are not specifically related to a particular company, such as real or perceived adverse economic conditions, changes in the general outlook for corporate earnings, changes in interest or currency rates or adverse investor sentiment generally. The market value of equity securities may also decline due to factors which affect a particular industry or industries, such as labor shortages or increased production costs and competitive conditions within an industry. Equity securities and equity related investments generally have greater market price volatility than fixed income securities.
| 6. | Federal Income Taxes: |
| a) | Federal Income Taxes – For federal income tax purposes, the Fund intends to continue to qualify as a RIC under Subchapter M of the Internal Revenue Code (“IRC”) by distributing substantially all of its taxable net investment income and net realized capital gains to its shareholders and otherwise complying with the requirements of the IRC. The Fund has distributed substantially all of its income and capital gains in prior years, if applicable, and intends to distribute substantially all of its income and capital gains prior to the next fiscal year-end. Accordingly, no provision for federal income or excise taxes has been made in the accompanying financial statements. Distributions from short-term capital gains are treated as ordinary income distributions for federal income tax purposes. |
| b) | Net Investment Income (Loss), Net Realized Gains (Losses) and Distributions – Net investment income (loss) and net realized gains (losses) may differ for financial statement and tax purposes primarily because of losses deferred due to wash sale adjustments, foreign currency gains and losses, adjustments related to PFICs, REITs, RICs, certain derivatives and partnerships. The character of distributions made during the year from net investment income or net realized gains may differ from their ultimate characterization for federal income tax purposes. Also, due to the timing of dividend distributions, the fiscal year in which amounts are distributed may differ from the year that the income or realized gains (losses) were recorded by the Fund. |
| 17 |
| Hartford Disciplined Equity HLS Fund |
| Notes to Financial Statements – (continued) |
| December 31, 2013 |
| (000’s Omitted) |
| c) | Distributions and Components of Distributable Earnings – The tax character of distributions paid by the Fund for the periods indicated is as follows (as adjusted for dividends payable, if applicable): |
| For the Year Ended December 31, 2013 | For the Year Ended December 31, 2012 | |||||||
| Ordinary Income | $ | 8,169 | $ | 13,968 | ||||
As of December 31, 2013, the Fund’s components of distributable earnings (deficit) on a tax basis were as follows:
| Amount | ||||
| Undistributed Ordinary Income | $ | 377 | ||
| Accumulated Capital and Other Losses* | (1,260 | ) | ||
| Unrealized Appreciation† | 322,920 | |||
| Total Accumulated Earnings | $ | 322,037 | ||
| * | The Fund has capital loss carryforwards that are identified in the Capital Loss Carryforward note that follows. |
| † | Differences between book-basis and tax-basis unrealized appreciation (depreciation) may be attributable to the losses deferred due to wash sale adjustments, foreign currency gains and losses, adjustments related to PFICs, REITs, RICs, certain derivatives and partnerships. |
| d) | Reclassification of Capital Accounts – The Fund may record reclassifications in its capital accounts. These reclassifications have no impact on the total net assets of the Fund. The reclassifications are a result of permanent differences between U.S. GAAP and tax accounting for such items as foreign currency, PFICs, expiration or utilization of capital loss carryforwards or net operating losses. Adjustments are made to reflect the impact these items have on current and future distributions to shareholders. Therefore, the source of the Fund’s distributions may be shown in the accompanying Statement of Changes in Net Assets as from undistributed net investment income, from accumulated net realized gains on investments or from capital depending on the type of book and tax differences that exist. For the year ended December 31, 2013, the Fund recorded reclassifications to increase (decrease) the accounts listed below: |
| Amount | ||||
| Undistributed Net Investment Income (Loss) | $ | (1,171 | ) | |
| Accumulated Net Realized Gain (Loss) | 1,171 | |||
| e) | Capital Loss Carryforward – On December 22, 2010, the Regulated Investment Company Modernization Act of 2010 (the “Act”) was enacted, which made changes to the capital loss carryforward rules. The changes are effective for taxable years beginning after the date of enactment. Under the Act, funds are permitted to carry forward capital losses for an unlimited period. However, any losses incurred during those future taxable years will be required to be utilized prior to the losses incurred in pre-enactment taxable years, which carry an expiration date. As a result of this ordering rule, pre-enactment capital loss carryforwards may be more likely to expire unused. Additionally, post-enactment capital loss carryforwards retain their character as either short-term or long-term capital losses rather than being considered all short-term as permitted under prior regulation. |
At December 31, 2013 (tax-year-end), the Fund had capital loss carryforwards for U.S. federal income tax purposes as follows:
| Year of Expiration | Amount | |||
| 2017 | $ | 1,260 | ||
| Total | $ | 1,260 | ||
During the year ended December 31, 2013, the Fund utilized $139,515 of prior year capital loss carryforwards.
| 18 |
| f) | Accounting for Uncertainty in Income Taxes – The Fund has adopted financial reporting rules that require the Fund to analyze all open tax years, as defined by the statute of limitations, for all major jurisdictions. Generally, tax authorities can examine all tax returns filed for the last three years. The Fund does not have an examination in progress. |
The Fund has reviewed all open tax years and major jurisdictions and concluded that these financial reporting rules had no effect on the Fund’s financial position or results of operations. There is no tax liability resulting from unrecognized tax benefits relating to uncertain income tax positions taken or expected to be taken on the tax return for the fiscal year ended December 31, 2013. The Fund is also not aware of any tax positions for which it is reasonably possible that the total amounts of unrecognized tax benefits will significantly change in the next twelve months.
| 7. | Expenses: |
| a) | Investment Management Agreement – Hartford Funds Management Company, LLC (“HFMC”), an indirect wholly owned subsidiary of The Hartford Financial Services Group, Inc. (“The Hartford”), serves as investment manager to the Fund pursuant to an Investment Management Agreement with the Company. The investment manager has overall investment supervisory responsibility for the Fund. In addition, the investment manager provides administrative personnel, services, equipment, facilities and office space for proper operation of the Fund. The investment manager has contracted with Wellington Management Company, LLP (“Wellington Management”) under a sub-advisory agreement for the provision of day-to-day investment management services to the Fund in accordance with the Fund’s investment objective and policies. The Fund pays a fee to the investment manager, a portion of which may be used to compensate Wellington Management. |
The schedule below reflects the rates of compensation paid to HFMC for investment management services rendered as of December 31, 2013; the rates are accrued daily and paid monthly.
| Average Daily Net Assets | Annual Fee | |||
| On first $250 million | 0.7750 | % | ||
| On next $250 million | 0.7250 | % | ||
| On next $500 million | 0.6750 | % | ||
| On next $4 billion | 0.6250 | % | ||
| On next $5 billion | 0.6225 | % | ||
| Over $10 billion | 0.6200 | % | ||
| b) | Accounting Services Agreement – Pursuant to the Fund Accounting Agreement between HFMC and the Company, on behalf of the Fund, HFMC provides accounting services to the Fund and receives monthly compensation based on the Fund’s average daily net assets at the rates set forth below. The Fund’s accounting services fees are accrued daily and paid monthly. |
| Average Daily Net Assets | Annual Fee | |||
| On first $5 billion | 0.012 | % | ||
| Over $5 billion | 0.010 | % | ||
| c) | Operating Expenses – Allocable expenses incurred by the Company are allocated to each Fund and allocated to classes within a Fund in proportion to the average daily net assets of the Fund and each class, except where allocation of certain expenses is more fairly made directly to the Fund or to specific classes within a Fund. |
| d) | Fees Paid Indirectly – The Company, on behalf of the Fund, has entered into agreements with State Street Global Markets, LLC and Russell Implementation Services, Inc. to partially recapture non-discounted trade commissions. Such rebates are used to pay a portion of the Fund’s expenses. In addition, the Fund’s custodian bank has agreed to reduce its fees when the Fund maintains cash on deposit in a non-interest-bearing custody account. For the year ended December 31, 2013, these amounts, if any, are included in the Statement of Operations. |
| 19 |
| Hartford Disciplined Equity HLS Fund |
| Notes to Financial Statements – (continued) |
| December 31, 2013 |
| (000’s Omitted) |
The ratio of expenses to average net assets in the accompanying financial highlights excludes the reduction in expenses related to fees paid indirectly. The annualized expense ratio after waivers for the period listed below reflecting the reduction for fees paid indirectly is as follows:
| Year Ended December 31, 2013 | ||||
| Class IA | 0.76 | % | ||
| Class IB | 1.01 | |||
| e) | Distribution Plan for Class IB shares – Effective June 14, 2013, Hartford Investment Financial Services, LLC was renamed Hartford Funds Distributors, LLC (“HFD”). HFD, a wholly owned, ultimate subsidiary of The Hartford, serves as the Fund’s principal underwriter and distributor. The Company, on behalf of the Fund, has adopted a Distribution Plan pursuant to Rule 12b-1 of the 1940 Act to compensate the distributor, HFD, from assets attributable to the Class IB shares for services rendered and expenses borne in connection with activities primarily intended to result in the sale of the Class IB shares, subject to the review and approval of the Company’s Board of Directors. |
The Distribution Plan provides that the Fund may pay annually up to 0.25% of the average daily net assets of the Fund attributable to its Class IB shares for activities primarily intended to result in the sale of Class IB shares. The Board has the authority to suspend or reduce these payments at any point in time. Under the terms of the Distribution Plan and the principal underwriting agreement, the Fund is authorized to make payments monthly to the distributor that may be used to pay or compensate entities providing distribution and shareholder servicing with respect to the Class IB shares for such entities’ fees or expenses incurred or paid in that regard. These fees are accrued daily and paid monthly.
| f) | Other Related Party Transactions – Certain officers of the Fund are directors and/or officers of the investment manager and/or The Hartford or its subsidiaries. For the year ended December 31, 2013, a portion of the Fund’s Chief Compliance Officer’s salary was paid by all the investment companies in the Hartford fund complex. The portion allocated to the Fund was in the amount of $1. Hartford Administrative Services Company (“HASCO”), an indirect wholly owned subsidiary of The Hartford, provides transfer agent services to the Fund. HASCO was compensated on a per account basis for providing such services. The amount paid to HASCO can be found in the Statement of Operations. These fees are accrued daily and paid monthly. |
| g) | Payment from Affiliate – In July of 2007, The Hartford entered into a settlement with the Attorneys General of the states of New York, Connecticut and Illinois relating to market timing and the company's individual variable annuity contracts in which certain payments would be made directly to the variable annuity contract holders. The distribution plan provided that unclaimed money from the settlement would be distributed to certain HLS Funds that are investment options through a Hartford individual variable annuity contract. The unclaimed money was distributed to the Fund on September 18, 2009. |
The total return in the accompanying financial highlights includes a payment from an affiliate. Had the payment from the affiliate been excluded, the impact and total return for the period listed below would have been as follows:
| For the Year Ended December 31, 2009 | ||||||||
| Class IA | Class IB | |||||||
| Impact from Payment from Affiliate for Attorneys General Settlement | 0.01 | % | 0.01 | % | ||||
| Total Return Excluding Payment from Affiliate | 25.64 | % | 25.32 | % | ||||
| 20 |
| 8. | Investment Transactions: |
For the year ended December 31, 2013, the Fund's aggregate purchases and sales of investment securities (excluding short-term investments) were as follows:
| Amount | ||||
| Cost of Purchases Excluding U.S. Government Obligations | $ | 208,070 | ||
| Sales Proceeds Excluding U.S. Government Obligations | 470,764 | |||
| 9. | Line of Credit: |
The Fund is one of several Hartford funds that participate in a $500 million committed revolving line of credit facility. The facility is to be used for temporary or emergency purposes. Under the arrangement, the funds are required to own securities having a market value in excess of 300% of the total bank borrowings. The interest rate on borrowings varies depending on the nature of the loan. The facility also requires a fee to be paid based on the amount of the commitment. This commitment fee is allocated to all of the funds participating in the line of credit based on the average net assets of the funds. During the year ended December 31, 2013, the Fund did not have any borrowings under this facility.
| 10. | Industry Classifications: |
Other than the industry classifications “Other Investment Pools and Funds” and “Exchange Traded Funds,” equity industry classifications used in this report are the Global Industry Classification Standard, which was developed by and is the exclusive property and service mark of MSCI, Inc. and Standard & Poor’s.
| 11. | Indemnifications: |
Under the Company’s organizational documents, the Company shall indemnify its officers and directors to the full extent required or permitted under Maryland General Corporation Law and the federal securities laws. In addition, the Company, on behalf of the Fund, may enter into contracts that contain a variety of indemnifications. The Company’s maximum exposure under these arrangements is unknown. However, as of the date of these financial statements, the Company has not had prior claims or losses pursuant to these contracts and expects the risk of loss to be remote.
| 12. | Pending Legal Proceedings: |
On February 25, 2011, Jennifer L. Kasilag, Louis Mellinger, Judith M. Menendez, Jacqueline M. Robinson, and Linda A. Russell filed a derivative lawsuit against Hartford Investment Financial Services, LLC (“HIFSCO”)(now known as Hartford Funds Distributors, LLC) on behalf of six Hartford retail mutual funds in the United States District Court for the District of New Jersey, alleging that HIFSCO received excessive advisory and distribution fees in violation of its statutory fiduciary duty under Section 36(b) of the 1940 Act when serving as investment manager and principal underwriter, respectively, to the Hartford retail mutual funds. HIFSCO moved to dismiss and, in September 2011, the motion was granted in part and denied in part, with leave to amend the complaint. In November 2011, plaintiffs filed an amended complaint on behalf of certain Hartford retail mutual funds, The Hartford Global Health Fund (now known as The Hartford Healthcare Fund), The Hartford Conservative Allocation Fund, The Hartford Growth Opportunities Fund, The Hartford Inflation Plus Fund, The Hartford Advisers Fund (now known as The Hartford Balanced Fund), and The Hartford Capital Appreciation Fund. Plaintiffs seek to rescind the investment management agreements and distribution plans between HIFSCO and these funds and to recover the total fees charged thereunder or, in the alternative, to recover any improper compensation HIFSCO received, in addition to lost earnings. HIFSCO filed a partial motion to dismiss the amended complaint and, in December 2012, the court dismissed without prejudice the claims regarding distribution fees and denied the motion with respect to the advisory fees claims. HIFSCO disputes the allegations and intends to defend the advisory fee claims vigorously.
This action concerns the activities of HIFSCO in its capacity as investment manager and principal underwriter to the Hartford retail mutual funds and does not concern HIFSCO’s activities in its capacity as principal underwriter to the HLS funds. For this reason, no accrual for litigation relating to this matter has been recorded in the financial statements of the Fund.
| 21 |
| Hartford Disciplined Equity HLS Fund |
| Financial Highlights |
| ─ Selected Per-Share Data(A) ─ | ─ Ratios and Supplemental Data ─ | |||||||||||||||||||||||||||||||||||||||||||||||||||
| Class | Net Asset Value at Beginning of Period | Net Investment Income (Loss) | Net Realized and Unrealized Gain (Loss) on Investments | Total from Investment Operations | Dividends from Net Investment Income | Distributions from Realized Capital Gains | Total Dividends and Distributions | Net Asset Value at End of Period | Total Return(B) | Net Assets at End of Period (000s) | Ratio of Expenses to Average Net Assets Before Adjustments(C) | Ratio of Expenses to Average Net Assets After Adjustments(C) | Ratio of Net Investment Income (Loss) to Average Net Assets | |||||||||||||||||||||||||||||||||||||||
| For the Year Ended December 31, 2013 | ||||||||||||||||||||||||||||||||||||||||||||||||||||
| IA | $ | 13.64 | $ | 0.17 | $ | 4.72 | $ | 4.89 | $ | (0.17 | ) | $ | – | $ | (0.17 | ) | $ | 18.36 | 35.82 | % | $ | 811,099 | 0.76 | % | 0.76 | % | 1.07 | % | ||||||||||||||||||||||||
| IB | 13.58 | 0.13 | 4.68 | 4.81 | (0.12 | ) | – | (0.12 | ) | 18.27 | 35.47 | 118,598 | 1.01 | 1.01 | 0.82 | |||||||||||||||||||||||||||||||||||||
| For the Year Ended December 31, 2012 (D) | ||||||||||||||||||||||||||||||||||||||||||||||||||||
| IA | $ | 11.78 | $ | 0.22 | $ | 1.86 | $ | 2.08 | $ | (0.22 | ) | $ | – | $ | (0.22 | ) | $ | 13.64 | 17.62 | % | $ | 798,148 | 0.75 | % | 0.75 | % | 1.45 | % | ||||||||||||||||||||||||
| IB | 11.73 | 0.18 | 1.85 | 2.03 | (0.18 | ) | – | (0.18 | ) | 13.58 | 17.33 | 116,113 | 1.00 | 1.00 | 1.20 | |||||||||||||||||||||||||||||||||||||
| For the Year Ended December 31, 2011 (D) | ||||||||||||||||||||||||||||||||||||||||||||||||||||
| IA | $ | 11.79 | $ | 0.14 | $ | (0.01 | ) | $ | 0.13 | $ | (0.14 | ) | $ | – | $ | (0.14 | ) | $ | 11.78 | 1.15 | % | $ | 852,312 | 0.74 | % | 0.74 | % | 1.06 | % | |||||||||||||||||||||||
| IB | 11.73 | 0.11 | – | 0.11 | (0.11 | ) | – | (0.11 | ) | 11.73 | 0.90 | 129,416 | 0.99 | 0.99 | 0.81 | |||||||||||||||||||||||||||||||||||||
| For the Year Ended December 31, 2010 (D) | ||||||||||||||||||||||||||||||||||||||||||||||||||||
| IA | $ | 10.47 | $ | 0.15 | $ | 1.32 | $ | 1.47 | $ | (0.15 | ) | $ | – | $ | (0.15 | ) | $ | 11.79 | 14.04 | % | $ | 1,022,321 | 0.75 | % | 0.75 | % | 1.35 | % | ||||||||||||||||||||||||
| IB | 10.42 | 0.13 | 1.30 | 1.43 | (0.12 | ) | – | (0.12 | ) | 11.73 | 13.76 | 159,898 | 1.00 | 1.00 | 1.10 | |||||||||||||||||||||||||||||||||||||
| For the Year Ended December 31, 2009 (D) | ||||||||||||||||||||||||||||||||||||||||||||||||||||
| IA | $ | 8.46 | $ | 0.15 | $ | 2.01 | $ | 2.16 | $ | (0.15 | ) | $ | – | $ | (0.15 | ) | $ | 10.47 | 25.65 | %(E) | $ | 1,008,875 | 0.75 | % | 0.75 | % | 1.56 | % | ||||||||||||||||||||||||
| IB | 8.41 | 0.13 | 2.00 | 2.13 | (0.12 | ) | – | (0.12 | ) | 10.42 | 25.33 | (E) | 173,063 | 1.00 | 1.00 | 1.31 | ||||||||||||||||||||||||||||||||||||
| (A) | Information presented relates to a share outstanding throughout the indicated period. Net investment income (loss) per share amounts are calculated based on average shares outstanding unless otherwise noted. |
| (B) | The figures do not include sales charges or other fees which may be applied at the variable life insurance, variable annuity or qualified retirement plan product level. Any such additional sales charges or other fees would lower the Fund's performance. |
| (C) | Adjustments include waivers and reimbursements, if applicable. Ratios do not include fees paid indirectly (see Expenses in the accompanying Notes to Financial Statements). |
| (D) | Net investment income (loss) per share amounts have been calculated using the SEC method. |
| (E) | Total return without the inclusion of the Payment from (to) Affiliate can be found in Expenses in the accompanying Notes to Financial Statements. |
| Portfolio Turnover Rate for All Share Classes | ||||
| For the Year Ended December 31, 2013 | 23 | % | ||
| For the Year Ended December 31, 2012 | 34 | |||
| For the Year Ended December 31, 2011 | 44 | |||
| For the Year Ended December 31, 2010 | 44 | |||
| For the Year Ended December 31, 2009 | 59 | |||
| 22 |
| Report of Independent Registered Public Accounting Firm |
| The Board of Directors and Shareholders of |
| Hartford Series Fund, Inc. |
We have audited the accompanying statement of assets and liabilities, including the schedule of investments, of Hartford Disciplined Equity HLS Fund (one of the portfolios constituting Hartford Series Fund, Inc. (the Funds)) as of December 31, 2013, and the related statement of operations for the year then ended, the statements of changes in net assets for each of the two years in the period then ended, and the financial highlights for each of the five years in the period then ended. These financial statements and financial highlights are the responsibility of the Funds’ management. Our responsibility is to express an opinion on these financial statements and financial highlights based on our audits.
We conducted our audits in accordance with the standards of the Public Company Accounting Oversight Board (United States). Those standards require that we plan and perform the audit to obtain reasonable assurance about whether the financial statements and financial highlights are free of material misstatement. We were not engaged to perform an audit of the Funds’ internal control over financial reporting. Our audits included consideration of internal control over financial reporting as a basis for designing audit procedures that are appropriate in the circumstances, but not for the purpose of expressing an opinion on the effectiveness of the Funds’ internal control over financial reporting. Accordingly, we express no such opinion. An audit also includes examining, on a test basis, evidence supporting the amounts and disclosures in the financial statements and financial highlights, assessing the accounting principles used and significant estimates made by management, and evaluating the overall financial statement presentation. Our procedures included confirmation of securities owned as of December 31, 2013, by correspondence with the custodian and brokers or by other appropriate auditing procedures where replies from brokers were not received. We believe that our audits provide a reasonable basis for our opinion.
In our opinion, the financial statements and financial highlights referred to above present fairly, in all material respects, the financial position of Hartford Disciplined Equity HLS Fund of the Hartford Series Fund, Inc. at December 31, 2013, the results of its operations for the year then ended, the changes in its net assets for each of the two years in the period then ended, and the financial highlights for each of the five years in the period then ended, in conformity with U.S. generally accepted accounting principles.
| |
| Minneapolis, MN | |
| February 17, 2014 |
| 23 |
| Hartford Disciplined Equity HLS Fund |
| Directors and Officers (Unaudited) |
The Board of Directors of the Company appoints officers who are responsible for the day-to-day operations of the Fund and who execute policies formulated by the directors. Each director serves until his or her death, resignation, or retirement or until the next annual meeting of shareholders is held or until his or her successor is elected and qualifies.
Directors and officers who are employed by or who have a financial interest in The Hartford are considered “interested” persons of the Fund pursuant to the 1940 Act. Each officer and two of the Company’s directors, as noted in the chart below, are “interested” persons of the Fund. Each director serves as a director for The Hartford Mutual Funds, Inc., The Hartford Mutual Funds II, Inc., Hartford Series Fund, Inc., Hartford HLS Series Fund II, Inc., and as a trustee for The Hartford Alternative Strategies Fund, which, as of December 31, 2013, collectively consist of 91 funds. Correspondence may be sent to directors and officers c/o Hartford Funds, 5 Radnor Corporate Center, Suite 300, 100 Matsonford Road, Radnor, Pennsylvania 19087, except that correspondence to Mr. Annoni, Mr. Dressen and Ms. Quade may be sent to 500 Bielenberg Drive, Woodbury, Minnesota 55125.
The table below sets forth, for each director and officer, his or her name, year of birth, current position with the Company and date first elected or appointed to Hartford Series Fund, Inc. (“HSF”), and Hartford HLS Series Fund II, Inc. (“HSF2”), principal occupation, and, for directors, other directorships held. The Fund’s Statement of Additional Information contains further information on the directors and is available free of charge by calling 1-800-862-6668 or writing to Hartford HLS Funds, c/o Hartford Life Insurance Company, Hartford Life and Annuity Insurance Company, P.O. Box 14293, Lexington, KY 40512-4293.
Information on the aggregate remuneration paid to the directors of the Company can be found in the Statement of Operations herein. The Fund pays to The Hartford a portion of the Chief Compliance Officer’s compensation, but does not pay salaries or compensation to any of their other officers or directors who are employed by The Hartford.
Non-Interested Directors
Lynn S. Birdsong (1946) Director since 2003, Co-Chairman of the Investment Committee since 2005
Mr. Birdsong is a private investor. Mr. Birdsong currently serves as a Director of the Sovereign High Yield Investment Company (April 2010 to current). Mr. Birdsong currently serves as an Independent Director of Nomura Partners Funds, Inc. (formerly, The Japan Fund) (April 2003 to current). From 2003 to March 2005, Mr. Birdsong was an Independent Director of the Atlantic Whitehall Funds. From 1979 to 2002, Mr. Birdsong was a Managing Director of Zurich Scudder Investments, an investment management firm. During his employment with Scudder, Mr. Birdsong was an Interested Director of The Japan Fund. From January 1981 through December 2013, Mr. Birdsong was a partner in Birdsong Company, an advertising specialty firm.
Robert M. Gavin, Jr. (1940) Director since 2002 (HSF) and 1986 (HSF2), Chairman of the Board since 2004
Dr. Gavin is an educational consultant. Prior to September 1, 2001, he was President of Cranbrook Education Community and prior to July 1996, he was President of Macalester College, St. Paul, Minnesota.
Duane E. Hill (1945) Director since 2001 (HSF) and 2002 (HSF2), Chairman of the Nominating Committee since 2003
Mr. Hill is a Partner of TSG Ventures L.P., a private equity investment company. Mr. Hill is a former partner of TSG Capital Group, a private equity investment firm that served as sponsor and lead investor in leveraged buyouts of middle market companies.
Sandra S. Jaffee (1941) Director since 2005
Ms. Jaffee is the founder and Chief Executive Officer of a private company, Homeworks Concierge, LLC, which provides residential property management services in Westchester County, New York (January 2012 to present). Ms. Jaffee served as Chairman (2008 to 2009) and Chief Executive Officer of Fortent (formerly Searchspace Group), a leading provider of compliance/regulatory technology to financial institutions from August 2005 to August 2009. Ms. Jaffee currently serves as a member of the Board of Directors of Broadridge Financial Solutions as well as a Trustee of Muhlenberg College.
| 24 |
William P. Johnston (1944) Director since 2005, Chairman of the Compliance Committee since 2005
In June 2006, Mr. Johnston was appointed as Senior Advisor to The Carlyle Group, a global private equity and alternative asset investment firm and currently serves as an Operating Executive. In July 2006, Mr. Johnston was elected to the Board of Directors of MultiPlan, Inc. and served as a Director (July 2006 to August 2010). In August 2007, Mr. Johnston was elected to the Board of Directors of LifeCare Holdings, Inc. and served as a Director (August 2007 to June 2013). In February 2008, Mr. Johnston was elected to the Board of Directors of HCR-ManorCare, Inc. In May 2006, Mr. Johnston was elected to the Supervisory Board of Fresenius Medical Care AG & Co. KGaA, after its acquisition of Renal Care Group, Inc. in March 2006. Mr. Johnston joined Renal Care Group in November 2002 as a member of the Board of Directors and served as Chairman of the Board from March 2003 through March 2006. From 2002 through 2013, Mr. Johnston served as a Board member of the Georgia O’Keefe Museum. From September 1987 to December 2002, Mr. Johnston was with Equitable Securities Corporation (and its successors, SunTrust Equitable Securities and SunTrust Robinson Humphrey) serving in various investment banking and managerial positions, including Managing Director and Head of Investment Banking, Chief Executive Officer and Vice Chairman.
Phillip O. Peterson (1944) Director since 2002 (HSF) and 2000 (HSF2), Chairman of the Audit Committee since 2002
Mr. Peterson is a mutual fund industry consultant. He was a partner of KPMG LLP (an accounting firm) until July 1999. Mr. Peterson joined William Blair Funds in February 2007 as a member of the Board of Trustees. Mr. Peterson also joined the Board of Trustees of Symetra Variable Mutual Funds Trust as a trustee in February 2012.
Lemma W. Senbet (1946) Director since 2005
Dr. Senbet is the William E. Mayer Chair Professor of Finance and Founding Director, Center for Financial Policy, at the University of Maryland, Robert H. Smith School of Business. He was chair of the Finance Department of the University of Maryland, Robert H. Smith School of Business from 1998 to 2006. Since June 2013, he has been on leave from the University to serve as Executive Director of African Economic Research Consortium which focuses on economic policy research and training. Previously, he was a chaired professor of finance at the University of Wisconsin-Madison. Also, he was a Director of the Fortis Funds from March 2000 to July 2002. Dr. Senbet served as Director of the American Finance Association and President of the Western Finance Association. In 2006, Dr. Senbet was inducted Fellow of Financial Management Association International for his career-long distinguished scholarship and professional service.
Interested Directors and Officers
James E. Davey (1964) Director since 2012, President and Chief Executive Officer since 2010
Mr. Davey serves as Executive Vice President of Hartford Life Insurance Company (“HLIC”) and The Hartford Financial Services Group, Inc. Additionally, Mr. Davey serves as Chairman of the Board, Manager and Senior Managing Director of Hartford Funds Distributors, LLC (“HFD”). He also currently serves as Director, Chairman of the Board, President and Senior Managing Director of Hartford Administrative Services Company (“HASCO”). Mr. Davey also serves as Manager, Chairman of the Board and Senior Managing Director for Hartford Funds Management Company, LLC (“HFMC”). Mr. Davey joined The Hartford in 2002.
Lowndes A. Smith (1939) Director since 1996 (HSF) and 2002 (HSF2), Co-Chairman of the Investment Committee since 2005
Mr. Smith served as Vice Chairman of The Hartford from February 1997 to January 2002, as President and Chief Executive Officer of Hartford Life, Inc. from February 1997 to January 2002, and as President and Chief Operating Officer of The Hartford Life Insurance Companies from January 1989 to January 2002. Mr. Smith serves as a Director of White Mountains Insurance Group Ltd. (October 2003 to current); One Beacon Insurance (October 2006 to current); Symetra Financial (August 2007 to current) and is a Managing Director of Whittington Gray Associates (January 2007 to current).
Other Officers
Mark A. Annoni (1964) Vice President, Controller and Treasurer since 2012
Mr. Annoni currently serves as the Assistant Vice President of HLIC (February 2004 to present).
| 25 |
| Hartford Disciplined Equity HLS Fund |
| Directors and Officers (Unaudited) – (continued) |
Michael R. Dressen (1963) AML Compliance Officer since 2011
Mr. Dressen currently serves as Assistant Vice President of HLIC. He also serves as Chief Compliance Officer and AML Compliance Officer of HASCO and as AML Officer of HFD. Mr. Dressen has served in various positions within The Hartford and its subsidiaries in connection with the operation of the Hartford Funds.
Edward P. Macdonald (1967) Vice President, Secretary and Chief Legal Officer since 2005
Mr. Macdonald currently serves as Assistant Secretary, Executive Vice President and Deputy General Counsel of HFD, HASCO and HFMC. He also serves as Vice President of HLIC. Mr. Macdonald has served in various positions within The Hartford and its subsidiaries in connection with the operation of the Hartford Funds. Mr. Macdonald joined The Hartford in 2005.
Joseph G. Melcher (1973) Vice President and Chief Compliance Officer since 2013
Mr. Melcher currently serves as Executive Vice President of HASCO and HFD. Mr. Melcher also currently serves as Executive Vice President and Chief Compliance Officer of HFMC. Mr. Melcher has served in various positions within The Hartford and its subsidiaries in connection with the operation of the Hartford Funds since joining The Hartford in 2012. Prior to joining The Hartford, Mr. Melcher worked at Touchstone Investments, a member of the Western & Southern Financial Group, where he held the position of Vice President and Chief Compliance Officer from 2010 through 2012 and Assistant Vice President, Compliance from 2005 to 2010.
Vernon J. Meyer (1964) Vice President since 2006
Mr. Meyer currently serves as Senior Vice President of HLIC. He also currently serves as Managing Director and Chief Investment Officer of HFMC. Mr. Meyer has served in various positions within The Hartford and its subsidiaries in connection with the operation of the Hartford Funds. Mr. Meyer joined The Hartford in 2004.
Laura S. Quade (1969) Vice President since 2012
Ms. Quade currently serves as Vice President of HASCO and HFD. She is the Head of Operations of HASCO and also serves as Director, Enterprise Operations of HLIC. Ms. Quade has served in various positions within The Hartford and its subsidiaries in connection with the operation of the Hartford Funds.
Martin A. Swanson (1962) Vice President since 2010
Mr. Swanson currently serves as Vice President of HLIC. Mr. Swanson also serves as Managing Director, Chief Marketing Officer and Principal of HFD. Mr. Swanson has served in various positions within The Hartford and its subsidiaries in connection with the operation of the Hartford Funds.
HOW TO OBTAIN A COPY OF THE FUND’S PROXY VOTING POLICIES AND VOTING RECORDS (UNAUDITED)
A description of the policies and procedures that the Fund uses to determine how to vote proxies relating to portfolio securities and information about how the Fund voted proxies relating to portfolio securities during the most recent twelve-month period ended June 30 are available (1) without charge, upon request, by calling 800-862-6668 and (2) on the SEC’s website at http://www.sec.gov.
QUARTERLY PORTFOLIO HOLDINGS INFORMATION (UNAUDITED)
The Fund files a complete schedule of portfolio holdings with the SEC for the first and third quarters of each fiscal year on Form N-Q. The Fund’s Forms N-Q are available (1) without charge, upon request, by calling 800-862-6668 and (2) on the SEC’s website at http://www.sec.gov. The Form N-Q may be reviewed and copied at the SEC’s Public Reference Room in Washington, DC. Information on the operation of the Public Reference Room may be obtained by calling 1-800-SEC-0330.
| 26 |
| Hartford Disciplined Equity HLS Fund |
| Expense Example (Unaudited) |
Your Fund's Expenses
As a shareholder of the Fund, you incur two types of costs: (1) transaction costs and (2) ongoing costs, including investment management fees, distribution and/or service (12b-1) fees, if any, and other fund expenses. This example is intended to help you understand your ongoing costs (in dollars) of investing in the Fund and to compare these costs with the ongoing costs of investing in other mutual funds. The example is based on an investment of $1,000 invested at the beginning of the period and held for the period of June 30, 2013 through December 31, 2013.
Actual Expenses
The first set of columns of the table below provides information about actual account values and actual expenses. You may use the information in this column, together with the amount you invested, to estimate the expenses that you paid over the period. Simply divide your account value by $1,000 (for example, an $8,600 account value divided by $1,000 = 8.6), then multiply the result by the number in the line under the heading entitled “Expenses Paid During Period” to estimate the expenses you paid on your account during this period.
Hypothetical Example for Comparison Purposes
The second set of columns of the table below provides information about hypothetical account values and hypothetical expenses based on the Fund’s actual expense ratio and an assumed rate of return of 5% per year before expenses, which is not the Fund’s actual return. The hypothetical account values and expenses may not be used to estimate the actual ending account balance or expenses you paid for the period. You may use this information to compare the ongoing costs of investing in the Fund and other funds. To do so, compare this 5% hypothetical example with the 5% hypothetical examples that appear in the shareholder reports of the other funds.
Please note that the expenses shown in the table are meant to highlight your ongoing costs only and do not reflect any transactional costs, such as sales charges (loads) and CDSC. Therefore, the second set of columns of the table is useful in comparing ongoing costs only, and will not help you determine the relative total costs of owning different funds. In addition, if these transactional costs were included, your costs would be higher. Expenses are equal to the Fund's annualized expense ratios multiplied by average account value over the period, multiplied by 184/365 (to reflect the one-half year period).
| Actual return | Hypothetical (5% return before expenses) | |||||||||||||||||||||||||||||||||
| Beginning Account Value June 30, 2013 | Ending Account Value December 31, 2013 | Expenses paid during the period June 30, 2013 through December 31, 2013 | Beginning Account Value June 30, 2013 | Ending Account Value December 31, 2013 | Expenses paid during the period June 30, 2013 through December 31, 2013 | Annualized expense ratio | Days in | Days in the full year | ||||||||||||||||||||||||||
| Class IA | $ | 1,000.00 | $ | 1,186.70 | $ | 4.20 | $ | 1,000.00 | $ | 1,021.37 | $ | 3.88 | 0.76 | % | 184 | 365 | ||||||||||||||||||
| Class IB | $ | 1,000.00 | $ | 1,185.10 | $ | 5.57 | $ | 1,000.00 | $ | 1,020.11 | $ | 5.15 | 1.01 | % | 184 | 365 | ||||||||||||||||||
| 27 |
| Hartford Disciplined Equity HLS Fund |
| Approval of Investment Management and Investment Sub-Advisory Agreements (Unaudited) |
Section 15(c) of the Investment Company Act of 1940, as amended (the “1940 Act”), requires that each mutual fund’s board of directors, including a majority of those directors who are not “interested persons” of the mutual fund, as defined in the 1940 Act (the “Independent Directors”), annually review and consider the continuation of the mutual fund’s investment advisory and sub-advisory agreements. At its meeting held on August 6-7, 2013, the Board of Directors (the “Board”) of Hartford Series Fund, Inc., including each of the Independent Directors, unanimously voted to approve the continuation of the investment management agreement for Hartford Disciplined Equity HLS Fund (the “Fund”) with Hartford Funds Management Company, LLC (“HFMC”) and the continuation of the investment sub-advisory agreement between HFMC and the Fund’s sub-adviser, Wellington Management Company, LLP (the “Sub-adviser,” and together with HFMC, the “Advisers”) (collectively, the “Agreements”).
In the months preceding the August 6-7, 2013 meeting, the Board requested, received, and reviewed written responses from the Advisers to questions posed to them on behalf of the Independent Directors and supporting materials relating to those questions and responses. The Board considered information furnished to the Board at its meetings throughout the year, as well as information specifically prepared in connection with the annual approval of the Agreements at the Board’s meetings held on June 18-19, 2013 and August 6-7, 2013. Information provided to the Board at its meetings throughout the year included, among other things, reports on Fund performance, legal and compliance matters, sales and marketing activity, shareholder services, and the other services provided to the Fund by the Advisers and their affiliates. The Board also received in-person presentations by Fund officers and representatives of HFMC at the Board’s meetings on June 18-19, 2013 and August 6-7, 2013 concerning the Agreements.
The Independent Directors, advised by independent legal counsel, engaged two service providers to assist them with evaluating the Agreements with respect to the Fund. Lipper Inc. (“Lipper”), an independent provider of investment company data, was retained to provide the Board with reports on how the Fund’s contractual management fees, actual management fees, other non-management fees, overall expense ratios and investment performance compared to those of mutual funds with similar investment objectives. The Independent Directors also engaged an independent financial services consulting firm (the “Consultant”) to assist them in evaluating the Fund’s management fees, sub-advisory fees, other non-management fees, overall expense ratios and investment performance. In addition, the Consultant reviewed the profitability calculations utilized by HFMC in connection with the continuation of the investment management agreement.
In determining whether to continue the Agreements for the Fund, the members of the Board reviewed and evaluated information and factors they believed to be relevant and appropriate in light of the information that the Board deemed necessary and appropriate through the exercise of its reasonable business judgment. While individual members of the Board may have weighed certain factors differently, the Board’s determination to continue the Agreements was based on a comprehensive consideration of all information provided to the Board throughout the year and specifically with respect to the continuation of the Agreements. A more detailed discussion of the factors the Board considered with respect to its approval of the Agreements is provided below.
Nature, Extent, and Quality of Services Provided by the Advisers
The Board requested and considered information concerning the nature, extent, and quality of the services provided to the Fund by the Advisers. The Board considered, among other things, the terms of the Agreements and the range of services provided by the Advisers. The Board considered the Advisers’ professional personnel who provide services to the Fund, including each Adviser’s ability and experience in attracting and retaining qualified personnel to service the Fund. The Board considered each Adviser’s reputation and overall financial strength, as well as its willingness to consider and implement organizational and operational changes designed to improve services to the Fund. In addition, the Board considered the quality of each Adviser’s communications with the Board and responsiveness to Board inquiries.
The Board also requested and evaluated information concerning each Adviser’s regulatory and compliance environment. In this regard, the Board requested and reviewed information on each Adviser’s compliance policies and procedures, compliance history, and a report from the Fund’s Chief Compliance Officer on each Adviser’s compliance with applicable laws and regulations, including responses to regulatory developments and compliance issues raised by regulators. The Board also noted the Advisers’ support of the Fund’s compliance control structure, particularly the resources devoted by the Advisers in support of the Fund’s obligations pursuant to Rule 38a-1 under the 1940 Act.
| 28 |
With respect to HFMC, the Board noted that under the Agreements, HFMC is responsible for the management of the Fund, including overseeing fund operations and service providers, as well as investment advisory services in connection with selecting, monitoring and supervising the Sub-adviser. The Board considered HFMC’s ongoing monitoring of people, process and performance, including its quarterly reviews of each of the Hartford Funds, semi-annual meetings with the leaders of each Fund’s portfolio management team, and oversight of the Funds’ approximately 40 portfolio managers. The Board recognized that HFMC has demonstrated a record of making changes to the management and/or strategies of the Funds when warranted. The Board considered HFMC’s oversight of the Sub-adviser’s investment approach and results, process for monitoring best execution of portfolio trades by the Sub-adviser, and approach to risk management with respect to the Fund and the service providers to the Fund. The Board also considered HFMC’s oversight of compliance with the Fund’s objective and policies as well as with applicable laws and regulations, noting that regulatory and other developments had over time led to an increase in the scope of HFMC’s services in this regard.
In addition, the Board considered HFMC’s ongoing commitment to review and rationalize the Hartford Funds product line-up and the expenses that HFMC had incurred in connection with fund combinations in recent years. The Board considered that HFMC or its affiliates are responsible for providing the Fund’s officers. The Board also noted that Hartford Life Insurance Company (“HLIC”) provides administrative services to the Fund. The Board considered its experiences with HFMC and HLIC with respect to each of these services.
With respect to the Sub-adviser, who provides day-to-day portfolio management services, the Board considered the quality of the Fund’s portfolio manager, the Sub-adviser’s other investment personnel, its investment philosophy and process, investment research capabilities and resources, performance record, trade execution capabilities and experience. The Board considered the experience of the Fund’s portfolio manager, the number of accounts managed by the portfolio manager, and the Sub-adviser’s method for compensating the portfolio manager.
Based on these considerations, the Board concluded that it was satisfied with the nature, extent and quality of the services provided to the Fund by HFMC and the Sub-adviser.
Performance of the Fund and the Advisers
The Board considered the investment performance of the Fund. In this regard, the Board reviewed the performance of the Fund over different time periods presented in the materials and evaluated HFMC’s analysis of the Fund’s performance for these time periods. The Board considered information and materials provided to the Board by the Advisers concerning Fund performance, as well as information from Lipper comparing the investment performance of the Fund to an appropriate benchmark and universe of peer funds. The Board noted that the Fund’s performance was in the 2nd quintile of its performance universe for the 1-year period and the 1st quintile for the 3- and 5-year periods. The Board also noted that the Fund’s performance was above its benchmark for the 1-, 3- and 5-year periods.
The Board considered the detailed investment analytics reports provided by Hartford Funds’ Investment Advisory Group throughout the year. These reports include, among other things, information on the Fund’s gross and net returns, the Fund’s investment performance relative to an appropriate benchmark and peer group, various statistics concerning the Fund’s portfolio, and a narrative summary of various factors affecting Fund performance. The Board considered the Advisers’ cooperation with the Investment Committee, which assists the Board in evaluating the performance of the Fund at periodic meetings throughout the year. The Board also considered the analysis provided by the Consultant relating to the Fund’s performance track record.
In light of all the considerations noted above, the Board concluded that it had continued confidence in HFMC’s and the Sub-adviser’s overall capabilities to manage the Fund.
Costs of the Services and Profitability of the Advisers
The Board reviewed information regarding HFMC’s cost to provide investment management and related services to the Fund and HFMC’s profitability, both overall and for the Fund, on a pre-tax basis without regard to distribution expenses. The Board also requested and reviewed information about the profitability to HFMC and its affiliates from all services provided to the Fund and all aspects of their relationship with the Fund. The Board also requested and received information relating to the operations and profitability of the Sub-adviser.
| 29 |
| Hartford Disciplined Equity HLS Fund |
| Approval of Investment Management and Investment Sub-Advisory Agreements (Unaudited) – (continued) |
The Board considered the Consultant’s review of the profitability calculations utilized by HFMC in connection with the continuation of the investment management agreement, noting the Consultant’s view that Hartford Funds’ process for calculating and reporting Fund profitability is reasonable. In this regard, the Board noted that the Consultant had previously performed a full review of this process and reported that such process is sound and well within common industry practice.
Based on these considerations, the Board concluded that the profits anticipated to be realized by the Advisers and their affiliates from their relationships with the Fund would not be excessive.
Comparison of Fees and Services Provided by the Advisers
The Board considered comparative information with respect to the management fees to be paid by the Fund to HFMC and the total expense ratios of the Fund. The Board also considered comparative information with respect to the sub-advisory fees to be paid by HFMC to the Sub-adviser. In this regard, the Board requested and reviewed information from HFMC and the Sub-adviser relating to the management and sub-advisory fees, including the sub-advisory fee schedule for the Fund, and total operating expenses for the Fund. The Board considered that the management fee for the Fund includes the fee paid to HLIC for providing certain administrative services to the Fund. With respect to the sub-advisory fee schedule, the Board considered representations from HFMC and the Sub-adviser that the Sub-adviser’s fees were negotiated at arm’s length. The Board also reviewed information from Lipper comparing the Fund’s contractual management fees, actual management fees and overall expense ratios relative to a group of funds selected by Lipper, in consultation with the Consultant, and a broader universe of funds selected by Lipper. The Board noted that the Fund’s contractual management fee and actual management fee were in the 4th quintile of its expense group, while its total expenses (less 12b-1 and shareholder service fees) were in the 3rd quintile.
While the Board recognized that comparisons between the Fund and peer funds are imprecise, given the differing service levels and characteristics of mutual funds and the different business models and cost structures of the Advisers, the comparative information provided by Lipper assisted the Board in evaluating the reasonableness of the Fund’s management and sub-advisory fees and total operating expenses. In addition, the Board considered the analysis and recommendations of the Consultant relating to the Fund’s management and sub-advisory fees and total operating expenses.
Based on these considerations, the Board concluded that the Fund’s fees and total operating expenses, in conjunction with the information about quality of services, profitability, economies of scale, and other matters discussed, were reasonable in light of the services provided.
Economies of Scale
The Board requested and considered information regarding the Advisers’ realization of economies of scale with respect to the Fund and whether the fee levels reflect these economies of scale for the benefit of the Fund’s shareholders. The Board reviewed the breakpoints in the management fee schedule for the Fund, which reduce fee rates as Fund assets grow over time. The Board recognized that a fund with assets beyond the last breakpoint level will continue to benefit from economies of scale because additional assets are charged the lowest breakpoint fee resulting in lower overall effective management fee rates. The Board also recognized that a fee schedule that reaches a lower breakpoint quickly provides shareholders with the benefit of anticipated or potential economies of scale. The Board noted the effect of the sale and run-off of the variable annuity business on the HLS Funds.
The Board reviewed and evaluated materials from Lipper showing how management fee schedules of peer funds reflect economies of scale for the benefit of shareholders as a peer fund’s assets hypothetically increase over time. Based on information provided by HFMC, Lipper, and the Consultant, the Board recognized that there is no uniform methodology for establishing breakpoints or uniform pattern in asset levels that trigger breakpoints or the amounts of breakpoints triggered.
After considering all of the information available to it, the Board concluded that it was satisfied with the extent to which economies of scale would be shared for the benefit of the Fund’s shareholders based on currently available information and the effective advisory fees and expense ratios for the Fund at its current and reasonably anticipated asset levels. The Board noted, however, that it would continue to monitor future growth in Fund assets and the appropriateness of additional breakpoints.
| 30 |
Other Benefits
The Board considered other benefits to the Advisers and their affiliates from their relationships with the Fund, including the role of the Fund in supporting the variable life insurance and variable annuity products offered by The Hartford.
The Board reviewed information noting that HLIC, an affiliate of HFMC, receives fees for providing certain administrative services to the Fund and that HFMC receives fees for fund accounting and related services from the Fund. The Board considered information on profits to HLIC and HFMC for such services. The Board also considered that Hartford Administrative Services Company (“HASCO”), the Fund’s transfer agent and an affiliate of HFMC, receives transfer agency compensation from the Fund, and the Board reviewed information on the profitability of the Fund’s transfer agency function to HASCO. The Board considered information provided by HASCO indicating that the transfer agent fees charged by HASCO to the Fund were fair and reasonable based on publicly available information.
The Board also considered that Hartford Funds Distributors, LLC (“HFD”), an affiliate of HFMC, serves as principal underwriter of the Fund. As principal underwriter, HFD receives 12b-1 fees from the Fund. The Board also noted that certain affiliates of HFD distribute shares of the Fund and receive compensation in that connection.
The Board considered benefits to the Sub-adviser from its use of the Fund’s brokerage commissions to obtain soft dollar research, and representations from HFMC and the Sub-adviser that the Sub-adviser would not make any revenue-sharing payments or any other type of distribution payments to HFMC or its affiliates.
The Board considered the benefits to shareholders of being part of the Hartford Funds family of funds. The Board considered HFMC’s efforts to provide investors in the family with a broad range of investment styles and asset classes.
* * * *
Based upon its review of these various factors, among others, the Board concluded that it is in the best interests of the Fund and its shareholders for the Board to approve the Agreements for an additional year. In reaching this decision, the Board did not assign relative weights to the factors discussed above or deem any one or group of them to be controlling in and of themselves. In connection with their deliberations, the Independent Directors met separately in executive session on several occasions, with independent legal counsel and the Consultant, to review the relevant materials and consider their responsibilities under relevant laws and regulations.
| 31 |
| Hartford Disciplined Equity HLS Fund |
| Main Risks (Unaudited) |
The main risks of investing in the Fund are described below.
Market, Selection, and Strategy Risk: The Fund’s share price may fluctuate due to market risk and/or security selections that may underperform the market or relevant benchmarks. If the sub-adviser’s investment strategy does not perform as expected, the Fund could underperform its peers or lose money. There is no guarantee the Fund will achieve its stated objective.
Foreign Investment Risk: Foreign investments can be riskier than U.S. investments. Potential risks include currency risk that may result from unfavorable exchange rates, liquidity risk if decreased demand for a security makes it difficult to sell at the desired price, and risks that stem from substantially lower trading volume on foreign markets.
Quantitative Analysis Risk: The Fund uses quantitative analysis in its securities selection; securities selected by this method may perform differently from the broader stock market.
Active Trading Risk: Actively trading investments may result in higher costs (thus affecting performance).
| 32 |
THIS PRIVACY POLICY IS NOT PART OF THIS REPORT
Privacy Policy and Practices of The Hartford Financial Services Group, Inc. and its Affiliates
(herein called “we, our, and us”)
This Privacy Policy applies to our United States Operations
We value your trust. We are committed to the responsible: a) management; b) use; and c) protection; of Personal Information. This notice describes how we collect, disclose, and protect Personal Information.
We collect Personal Information to: a) service your Transactions with us; and b) support our business functions.
We may obtain Personal Information from: a) You; b) your Transactions with us; and c) third parties such as a consumer-reporting agency.
Based on the type of product or service You apply for or get from us, Personal Information such as: a) your name; b) your address; c) your income; d) your payment; or e) your credit history; may be gathered from sources such as applications, Transactions, and consumer reports.
To serve You and service our business, we may share certain Personal Information. We will share Personal Information, only as allowed by law, with affiliates such as: a) our insurance companies; b) our employee agents; c) our brokerage firms; and d) our administrators.
As allowed by law, we may share Personal Financial Information with our affiliates to: a) market our products; or b) market our services; to You without providing You with an option to prevent these disclosures. | We may also share Personal Information, only as allowed by law, with unaffiliated third parties including:
When allowed by law, we may share certain Personal Financial Information with other unaffiliated third parties who assist us by performing services or functions such as:
We, and third parties we partner with, may track some of the pages You visit through the use of: a) cookies; b) pixel tagging; or c) other technologies; and currently do not process or comply with any web browser’s “do not track” signal or similar mechanism that indicates a request to disable online tracking of individual users who visit our websites or use our services.
We will not sell or share your Personal Financial Information with anyone for purposes unrelated to our business functions without offering You the opportunity to:
We only disclose Personal Health Information with:
Our employees have access to Personal Information in the course of doing their jobs, such as: |
We use manual and electronic security procedures to maintain: a) the confidentiality; and b) the integrity of; Personal Information that we have. We use these procedures to guard against unauthorized access.
Some techniques we use to protect Personal Information include: a) secured files; b) user authentication; c) encryption; d) firewall technology; and e) the use of detection software.
We are responsible for and must: a) identify information to be protected; b) provide an adequate level of protection for that data; c) grant access to protected data only to those people who must use it in the performance of their job-related duties. Employees who violate our Privacy Policy will be subject to discipline, which may include ending their employment with us.
At the start of our business relationship, we will give You a copy of our current Privacy Policy.
We will also give You a copy of our current Privacy Policy once a year if You maintain a continuing business relationship with us.
We will continue to follow our Privacy Policy regarding Personal Information even when a business relationship no longer exists between us. | As used in this Privacy Notice:
Application means your request for our product or service.
Personal Financial Information means financial information such as:
Personal Health Information means health information such as:
Personal Information means information that identifies You personally and is not otherwise available to the public. It includes:
Transaction means your business dealings with us, such as:
You means an individual who has given us Personal Information in conjunction with: |
This Privacy Policy is being provided on behalf of the following affiliates of The Hartford Financial Services Group, Inc.:
1stAGChoice, Inc.; Access CoverageCorp, Inc.; Access CoverageCorp Technologies, Inc.; American Maturity Life Insurance Company; Archway 60 R, LLC; Business Management Group, Inc.; Catalyst360, LLC; Champlain Life Reinsurance Company; DMS R, LLC; Eloy R, LLC; Ersatz Corporation; First State Insurance Company; Hartford Accident and Indemnity Company; Hartford Administrative Services Company; Hartford Casualty General Agency, Inc.; Hartford Casualty Insurance Company; Hartford-Comprehensive Employee Benefit Service Company; Hartford Equity Sales Company, Inc.; Hartford Fire General Agency, Inc.; Hartford Fire Insurance Company; Hartford Funds Management Company, LLC; Hartford Funds Management Group, Inc.; Hartford HLS Series Fund II, Inc.; Hartford Insurance Company of Illinois; Hartford Insurance Company of the Midwest; Hartford Insurance Company of the Southeast; Hartford Integrated Technologies, Inc.; Hartford International Life Reassurance Corporation; Hartford Funds Distributors, LLC; Hartford Investment Management Company; Hartford Life and Accident Insurance Company; Hartford Life and Annuity Insurance Company; Hartford Life Insurance Company; Hartford Life Private Placement, LLC; Hartford Lloyd’s Corporation; Hartford Lloyd’s Insurance Company; Hartford Mezzanine Investors I, LLC; Hartford Residual Market, L.C.C.; Hartford Retirement Services, LLC; Hartford Securities Distribution Company, Inc.; Hartford Series Fund, Inc.; Hartford Specialty Insurance Services of Texas, LLC; Hartford Strategic Investments, LLC; Hartford Underwriters Insurance Company; Hartford Technology Services Company, L.L.C.; Hartford of Texas General Agency, Inc.; Hartford Underwriters General Agency, Inc.; HARTRE Company, L.C.C.; HL Investment Advisors, LLC; HLA LLC; Horizon Management Group, LLC; HRA Brokerage Services, Inc.; Lanidex Class B, LLC; M-CAP Insurance Agency, LLC; New England Insurance Company; New England Reinsurance Corporation; Nutmeg Insurance Agency, Inc.; Nutmeg Insurance Company; Pacific Insurance Company, Limited; Planco, LLC: Property and Casualty Insurance Company of Hartford; Revere R, LLC; RVR R, LLC; Sentinel Insurance Company, Ltd.; Sunstone R, LLC; Symphony R, LLC; The Evergreen Group Incorporated; The Hartford Alternative Strategies Fund; The Hartford Mutual Funds, Inc.; The Hartford Mutual Funds II, Inc.; Trumbull Flood Management, L.L.C.; Trumbull Insurance Company; Twin City Fire Insurance Company; White River Life Reinsurance Company.
HPP Revised December 2013
HARTFORD HLS FUNDS
c/o The Hartford Wealth Management - Global Annuities
P.O. Box 14293
Lexington, KY 40512-4293
HARTFORDFUNDS
hartfordfunds.com
Hartford Series Fund, Inc. is underwritten and distributed by Hartford Funds Distributors, LLC.
Hartford Series Fund, Inc. inception dates range from 1977 to date. Hartford Series Fund, Inc. is not a subsidiary of The Hartford Financial Services Group, Inc. ("The Hartford") but is underwritten, distributed by and advised by subsidiaries of The Hartford. Investments in Hartford Series Fund, Inc. are not guaranteed by The Hartford or any other entity.
This report is submitted for the general information of the shareholders of the Funds. It is not authorized for distribution unless preceded or accompanied by a current prospectus for the Funds.
Investors should carefully consider the investment objectives, risks, charges, and expenses of Hartford Funds before investing. This and other information can be found in the prospectus and summary prospectus, which can be obtained by calling 888-843-7824 (retail) or 877-836-5854 (institutional). Investors should read them carefully before they invest.
HLSAR-DE13 2-14 115338 Printed in U.S.A ©2013 The Hartford, Hartford, CT 06115
HARTFORDFUNDS
| HARTFORD DIVIDEND AND
GROWTH HLS FUND
2013 Annual Report
|
A MESSAGE FROM THE PRESIDENT
Dear Fellow Shareholders:
Thank you for investing in Hartford HLS Funds.
Market Review
U.S. equities (as represented by the S&P 500 Index) generated their strongest year since 1997 in 2013, rising 32.39% for the year. During the fourth quarter, equities rose without looking back, pushing the S&P 500 Index and the Dow Jones Industrial Average to new all-time highs. Despite previously cheering delays to quantitative-easing tapering, the stock market received an additional boost at the end of the year following the U.S. Federal Reserve’s (Fed) announcement of a $10-billion-a-month reduction in bond purchases beginning in January.
The Fed’s decision to begin tapering its bond purchases is generally considered a vote of confidence in the recovering U.S. economy. Consumer spending has stabilized, the housing market is showing steady improvement, the unemployment rate is slowly declining and economic growth clocked in at a healthy 4.1% in the third quarter. Equities have also recovered since the market low in March 2009: The S&P 500 Index has gained 173% from the market low through December 31, 2013.
Signs of improvement are also visible outside the U.S. Europe appears to have begun its own economic recovery, and emerging markets have reversed their recent lackluster performance. Fiscal policy continues to wield significant influence in today’s economy and central banks across the globe are maintaining their accommodative stances, including the appointment of Janet Yellen, who is widely expected to continue current monetary policies, to succeed Ben Bernanke as U.S. Federal Reserve chairman.
It’s important to stay abreast of domestic and international economic developments while balancing your individual investment goals. Meeting with your financial advisor on a regular basis to examine your current investment strategy can help you determine whether you are on the right track:
| • | Is your portfolio fully diversified with an appropriate mix of stocks and bonds? |
| • | Is your portfolio incorporating both domestic and international holdings to take advantage of the global economic recovery? |
| • | Are your investments still in line with your risk tolerance and investment time horizon? |
Your financial advisor can help you choose options within our fund family to navigate today’s markets with confidence.
Thank you again for investing with Hartford HLS Funds.
James Davey
President
Hartford HLS Funds
1The S&P 500 Index is a market capitalization-weighted price index composed of 500 widely held common stocks.
2The Dow Jones Industrial Average is an unmanaged, price-weighted index of 30 of the largest, most widely held stocks traded on the New York Stock Exchange.
Hartford Dividend and Growth HLS Fund
Table of Contents
This report is prepared for the general information of contract owners and qualified retirement plan participants. It is not an offer of contracts or of qualified retirement plans. It should not be used in connection with any offer, except in conjunction with the appropriate product prospectus which contains all pertinent information including the applicable sales, administrative and other charges.
The views expressed in the Fund’s Manager Discussion under ‘‘Why did the Fund perform this way?’’ and ‘‘What is the outlook?’’ are views of the Fund’s sub-adviser and portfolio management team through the end of the period and are subject to change based on market and other conditions. The Fund’s Manager Discussion is for informational purposes only and does not represent an offer, recommendation or solicitation to buy, hold or sell any security. The specific securities identified and described, if any, do not represent all of the securities purchased or sold and you should not assume that investments in the securities identified and discussed will be profitable.
| Hartford Dividend and Growth HLS Fund inception 03/09/1994 |
| (sub-advised by Wellington Management Company, LLP) |
| Investment objective – Seeks a high level of current income consistent with growth of capital. |
Performance Overview 12/31/03 – 12/31/13

The chart above represents the hypothetical growth of a $10,000 investment in Class 1A. Growth results in classes other than Class 1A will vary from what is seen above due to differences in the expenses charged to those share classes.
Average Annual Total Returns (as of 12/31/13)
| 1 Year | 5 Years | 10 Years | ||||||||||
| Dividend and Growth IA | 31.92 | % | 16.47 | % | 8.43 | % | ||||||
| Dividend and Growth IB | 31.58 | % | 16.18 | % | 8.16 | % | ||||||
| Russell 1000 Value Index | 32.53 | % | 16.67 | % | 7.58 | % | ||||||
| S&P 500 Index | 32.39 | % | 17.94 | % | 7.41 | % | ||||||
PERFORMANCE DATA QUOTED REPRESENTS PAST PERFORMANCE AND DOES NOT GUARANTEE FUTURE RESULTS. The investment return and principal value of the investment will fluctuate so that investors’ shares, when redeemed, may be worth more or less than their original cost. Current performance may be lower or higher than the performance data quoted. To obtain performance data current to the most recent month-end, please visit our website at www.hartfordfunds.com.
Total returns presented above were calculated using the Fund’s net asset value available to shareholders for sale or redemption of Fund shares on December 31, 2013, which may exclude investment transactions as of this date. All share class returns assume the reinvestment of all distributions at net asset value and the deduction of all fund expenses.
Russell 1000 Value Index is an unmanaged index measuring the performance of those Russell 1000 Index companies with lower price-to-book ratios and lower forecasted growth values. The Russell 1000 Index is an unmanaged index that measures the performance of the 1,000 largest companies in the Russell 3000 Index, which measures the performance of the 3,000 largest U.S. companies, based on total market capitalizations.
S&P 500 Index is a market capitalization-weighted price index composed of 500 widely held common stocks.
You cannot invest directly in an index.
As of the Fund's current prospectus dated May 1, 2013, the total annual operating expense ratios for Class IA and Class IB were 0.67% and 0.92%, respectively. Actual expenses may be higher. Please see the accompanying Financial Highlights for expense ratios for the year ended December 31, 2013.
The chart and table do not reflect the deductions of taxes, sales charges or other fees which may be applied at the variable life insurance, variable annuity or qualified retirement plan product level. Any such additional sales charges or other fees or expenses would lower the contract’s or plan’s performance.
All investments are subject to risk including the possible loss of principal. For a discussion of the Fund’s risks, please see the Main Risks section of this report. For more detailed information on the risks associated with an investment in the Fund, please see the prospectus.
| 2 |
| Hartford Dividend and Growth HLS Fund |
| Manager Discussion |
| December 31, 2013 (Unaudited) |
| Portfolio Managers | ||
| Edward P. Bousa, CFA | Donald J. Kilbride | Matthew G. Baker |
| Senior Vice President and Equity Portfolio Manager | Senior Vice President and Equity Portfolio Manager | Senior Vice President and Equity Portfolio Manager |
How did the Fund perform?
The Class IA shares of the Hartford Dividend and Growth HLS Fund returned 31.92% for the twelve-month period ended December 31, 2013, modestly underperforming the Fund’s benchmark, the S&P 500 Index, which returned 32.39% for the same period. The Fund outperformed the 27.90% average return of the Variable Products-Underlying Funds Lipper Equity Income Funds peer group, a group of funds with investment strategies similar to those of the Fund.
Why did the Fund perform this way?
The rally in U.S. equities began on the first trading day of 2013 after a last-minute compromise by the U.S. Congress averted the fiscal cliff. Optimism surrounding the fiscal reprieve was furthered during the first quarter by better-than-expected corporate earnings, a robust housing market, and a steadily improving employment picture. Solid gains in April and the first part of May paused following comments by U.S. Federal Reserve (Fed) Chairman Ben Bernanke that suggested the Fed might begin to slow quantitative easing sooner than investors anticipated. Nonetheless, equities resumed their ascent in the third quarter as the surprising “no taper” decision by the Federal Open Market Committee eased near-term concerns about rapidly rising interest rates derailing the recovery. Additionally, accommodative rhetoric from the European Central Bank, along with encouraging data in China and further evidence of a European economic recovery, contributed to a broad-based global equity rally that extended through the end of the year. In December, the year ended with an optimistic tone as investors cheered the elimination of two market overhangs: the timing of Fed tapering and the threat of another U.S. government shutdown in early 2014.
Overall equity market performance was positive for the period across all market capitalizations: large cap equities (+32%), small caps (+39%), and mid caps (+34%) all rose as represented by the S&P 500, Russell 2000, and S&P 400 MidCap Indices, respectively. During the twelve-month period, all ten sectors within the S&P 500 Index posted positive returns, led by Consumer Discretionary (+43%), Health Care (+42%), and Industrials (+41%).
The Fund’s performance relative to the S&P 500 Index was driven primarily by stock selection. Security selection within Financials, Industrials, and Utilities contributed positively to relative performance, while selection within Health Care, Energy, and Materials lagged on a relative basis. Our overweight position to Health Care, and underweight to Information Technology, positively contributed to relative performance, while an underweight to Consumer Discretionary and an overweight to Utilities lagged on a relative basis. A modest cash position detracted in an upward trending market.
The Fund’s top detractors from benchmark-relative returns were Barrick Gold (Materials), Google (Information Technology), and Eli Lilly (Health Care). Shares of Barrick Gold, a Canada-based gold exploration and mining company, fell as investors feared that rising costs, primarily higher costs to extract gold, would continue to cause Barrick’s incremental returns to be challenged. Downward pressure on gold prices due to the strong dollar also weighed on the stock. We eliminated our position during the period. Shares of Google, a U.S.-based leading internet search provider, rose amid strong earnings, due in part to a 26% year-over-year increase in paid clicks (ad volume). Not owning the stock weighed on relative performance during the period. Eli Lilly, a U.S.-based global pharmaceutical company, underperformed as foreign exchange, weakness in the animal health division, and disappointing pipeline developments weighed on the stock. JC Penney (Consumer Discretionary) and EnCana (Energy) also detracted from absolute returns.
The Fund’s top contributors to benchmark-relative performance during the period were Apple (Information Technology), Prudential (Financials), and Ameriprise Financial (Financials). Shares of Apple, a designer, manufacturer, and retailer of a range of interconnected computing devices and personal electronic products, underperformed as the company had mixed results during the period. Apple missed revenue expectations and issued disappointing earnings guidance early in the period, but posted strong earnings due to robust iPhone sales and promising growth in China later in the period. Our underweight position in the stock contributed to relative performance during the period. Shares of Prudential, an insurance services firm, increased on strong and improved quality of earnings, driven by higher stock prices and higher long term interests rates. Shares of Ameriprise Financial, a diversified financial services company, outperformed after the company posted strong quarterly earnings that exceeded consensus expectations.
| 3 |
| Hartford Dividend and Growth HLS Fund |
| Manager Discussion – (continued) |
| December 31, 2013 (Unaudited) |
Wells Fargo (Financials) and JPMorgan Chase (Financials) were among the top contributors to absolute performance.
Derivatives are not used in a significant manner in this Fund and did not have a material impact on performance during the period.
What is the outlook?
We believe the U.S. economy is poised for continued moderate growth, which is in line with consensus expectations at this point. Real gross domestic product (GDP) and Institute of Supply Management (ISM) manufacturing data both appear to point to a fairly healthy outlook, housing remains constructive, and the employment picture is steadily improving. We believe the fiscal drag from last year should abate on a year over year basis and we believe the Fed is likely to remain accommodative with a zero interest rate policy through 2014 and only modest tapering of bond buying throughout the year. Disruption related to the Affordable Care Act, rising interest rates, and only average valuation support given the strong equity market this past year are the biggest domestic obstacles, in our opinion. At the end of the period, the Fund retained an overweight position in Financials, particularly large cap U.S. banks. In our view, rising interest rates should prove beneficial for longer-term profitability. The Fund remained underweight in Consumer Discretionary and Information Technology, relative to the benchmark.
| Diversification by Sector |
| as of December 31, 2013 |
| Percentage of | ||||
| Sector | Net Assets | |||
| Equity Securities | ||||
| Consumer Discretionary | 8.2 | % | ||
| Consumer Staples | 7.1 | |||
| Energy | 10.3 | |||
| Financials | 20.8 | |||
| Health Care | 16.5 | |||
| Industrials | 13.5 | |||
| Information Technology | 14.4 | |||
| Materials | 1.9 | |||
| Services | 2.5 | |||
| Utilities | 3.4 | |||
| Total | 98.6 | % | ||
| Short-Term Investments | 1.5 | |||
| Other Assets and Liabilities | (0.1) | |||
| Total | 100.0 | % | ||
A sector may be comprised of several industries. For Fund compliance purposes, the Fund may not use the same classification system and these sector classifications are used for reporting ease.
| 4 |
| Hartford Dividend and Growth HLS Fund |
| Schedule of Investments |
| December 31, 2013 |
| (000’s Omitted) |
| Shares or Principal Amount | Market Value ╪ | |||||||
| COMMON STOCKS - 98.6% | ||||||||
| Automobiles and Components - 1.2% | ||||||||
| 3,468 | Ford Motor Co. | $ | 53,518 | |||||
| Banks - 7.1% | ||||||||
| 121 | Bank of Nova Scotia | 7,550 | ||||||
| 1,017 | PNC Financial Services Group, Inc. | 78,903 | ||||||
| 831 | US Bancorp | 33,552 | ||||||
| 4,193 | Wells Fargo & Co. | 190,349 | ||||||
| 310,354 | ||||||||
| Capital Goods - 8.1% | ||||||||
| 214 | Boeing Co. | 29,198 | ||||||
| 130 | Caterpillar, Inc. | 11,762 | ||||||
| 393 | Deere & Co. | 35,857 | ||||||
| 454 | Eaton Corp. plc | 34,539 | ||||||
| 299 | Emerson Electric Co. | 20,951 | ||||||
| 67 | General Dynamics Corp. | 6,412 | ||||||
| 2,480 | General Electric Co. | 69,506 | ||||||
| 511 | Honeywell International, Inc. | 46,651 | ||||||
| 444 | Raytheon Co. | 40,270 | ||||||
| 263 | Siemens AG ADR | 36,475 | ||||||
| 644 | Textron, Inc. | 23,676 | ||||||
| 355,297 | ||||||||
| Commercial and Professional Services - 1.0% | ||||||||
| 641 | Equifax, Inc. | 44,267 | ||||||
| Diversified Financials - 7.1% | ||||||||
| 461 | Ameriprise Financial, Inc. | 53,091 | ||||||
| 1,639 | Bank of America Corp. | 25,523 | ||||||
| 192 | BlackRock, Inc. | 60,617 | ||||||
| 915 | Citigroup, Inc. | 47,701 | ||||||
| 2,103 | JP Morgan Chase & Co. | 122,969 | ||||||
| 309,901 | ||||||||
| Energy - 10.3% | ||||||||
| 674 | Anadarko Petroleum Corp. | 53,428 | ||||||
| 1,095 | BP plc ADR | 53,223 | ||||||
| 865 | Chevron Corp. | 108,103 | ||||||
| 1,055 | Exxon Mobil Corp. | 106,789 | ||||||
| 423 | Halliburton Co. | 21,469 | ||||||
| 222 | Occidental Petroleum Corp. | 21,088 | ||||||
| 410 | Phillips 66 | 31,613 | ||||||
| 348 | Schlumberger Ltd. | 31,324 | ||||||
| 641 | Suncor Energy, Inc. | 22,456 | ||||||
| 449,493 | ||||||||
| Food and Staples Retailing - 2.5% | ||||||||
| 1,035 | CVS Caremark Corp. | 74,062 | ||||||
| 441 | Wal-Mart Stores, Inc. | 34,710 | ||||||
| 108,772 | ||||||||
| Food, Beverage and Tobacco - 3.5% | ||||||||
| 140 | Anheuser-Busch InBev N.V. ADR | 14,862 | ||||||
| 624 | Kraft Foods Group, Inc. | 33,641 | ||||||
| 618 | Mondelez International, Inc. | 21,805 | ||||||
| 500 | Philip Morris International, Inc. | 43,595 | ||||||
| 1,025 | Unilever N.V. Class NY ADR | 41,243 | ||||||
| 155,146 | ||||||||
| Health Care Equipment and Services - 3.9% | ||||||||
| 898 | Cardinal Health, Inc. | 59,987 | ||||||
| 1,222 | Medtronic, Inc. | 70,115 | ||||||
| 510 | UnitedHealth Group, Inc. | 38,418 | ||||||
| 168,520 | ||||||||
| Household and Personal Products - 1.1% | ||||||||
| 609 | Procter & Gamble Co. | 49,615 | ||||||
| Insurance - 6.6% | ||||||||
| 785 | ACE Ltd. | 81,264 | ||||||
| 330 | Aflac, Inc. | 22,071 | ||||||
| 593 | Marsh & McLennan Cos., Inc. | 28,667 | ||||||
| 655 | MetLife, Inc. | 35,301 | ||||||
| 756 | Principal Financial Group, Inc. | 37,284 | ||||||
| 892 | Prudential Financial, Inc. | 82,226 | ||||||
| 286,813 | ||||||||
| Materials - 1.9% | ||||||||
| 1,044 | Dow Chemical Co. | 46,337 | ||||||
| 690 | Goldcorp, Inc. | 14,944 | ||||||
| 456 | International Paper Co. | 22,348 | ||||||
| 83,629 | ||||||||
| Media - 5.5% | ||||||||
| 1,718 | Comcast Corp. Class A | 89,291 | ||||||
| 505 | Omnicom Group, Inc. | 37,570 | ||||||
| 1,002 | Time Warner, Inc. | 69,868 | ||||||
| 575 | Walt Disney Co. | 43,958 | ||||||
| 240,687 | ||||||||
| Pharmaceuticals, Biotechnology and Life Sciences - 12.6% | ||||||||
| 988 | AstraZeneca plc ADR | 58,671 | ||||||
| 894 | Bristol-Myers Squibb Co. | 47,492 | ||||||
| 1,277 | Eli Lilly & Co. | 65,109 | ||||||
| 1,059 | Johnson & Johnson | 96,999 | ||||||
| 2,869 | Merck & Co., Inc. | 143,594 | ||||||
| 2,613 | Pfizer, Inc. | 80,024 | ||||||
| 731 | Teva Pharmaceutical Industries Ltd. ADR | 29,297 | ||||||
| 934 | Zoetis, Inc. | 30,517 | ||||||
| 551,703 | ||||||||
| Retailing - 1.5% | ||||||||
| 1,078 | Lowe's Cos., Inc. | 53,406 | ||||||
| 211 | Target Corp. | 13,379 | ||||||
| 66,785 | ||||||||
| Semiconductors and Semiconductor Equipment - 3.0% | ||||||||
| 494 | Broadcom Corp. Class A | 14,635 | ||||||
| 2,430 | Intel Corp. | 63,096 | ||||||
| 1,213 | Texas Instruments, Inc. | 53,279 | ||||||
| 131,010 | ||||||||
| Software and Services - 7.5% | ||||||||
| 674 | Accenture plc | 55,396 | ||||||
| 881 | eBay, Inc. ● | 48,340 | ||||||
| 318 | IBM Corp. | 59,737 | ||||||
| 3,056 | Microsoft Corp. | 114,396 | ||||||
| 755 | Oracle Corp. | 28,904 | ||||||
| 944 | Symantec Corp. | 22,269 | ||||||
| 329,042 | ||||||||
| Technology Hardware and Equipment - 3.9% | ||||||||
| 97 | Apple, Inc. | 54,231 | ||||||
| 2,180 | Cisco Systems, Inc. | 48,950 | ||||||
| 1,045 | EMC Corp. | 26,289 | ||||||
| 213 | Qualcomm, Inc. | 15,817 | ||||||
| 2,256 | Xerox Corp. | 27,456 | ||||||
| 172,743 | ||||||||
| Telecommunication Services - 2.5% | ||||||||
| 2,261 | Verizon Communications, Inc. | 111,095 | ||||||
The accompanying notes are an integral part of these financial statements.
| 5 |
| Hartford Dividend and Growth HLS Fund |
| Schedule of Investments – (continued) |
| December 31, 2013 |
| (000’s Omitted) |
| Market Value ╪ | ||||||||||||
| Shares or Principal Amount | ||||||||||||
| COMMON STOCKS - 98.6% - (continued) | ||||||||||||
| Transportation - 4.4% | ||||||||||||
| 1,132 | CSX Corp. | $ | 32,563 | |||||||||
| 1,388 | Delta Air Lines, Inc. | 38,137 | ||||||||||
| 389 | FedEx Corp. | 55,965 | ||||||||||
| 635 | United Parcel Service, Inc. Class B | 66,689 | ||||||||||
| 193,354 | ||||||||||||
| Utilities - 3.4% | ||||||||||||
| 912 | Dominion Resources, Inc. | 58,997 | ||||||||||
| 960 | Exelon Corp. | 26,284 | ||||||||||
| 573 | NextEra Energy, Inc. | 49,098 | ||||||||||
| 455 | NRG Energy, Inc. | 13,071 | ||||||||||
| 147,450 | ||||||||||||
| Total common stocks | ||||||||||||
| (cost $2,905,496) | $ | 4,319,194 | ||||||||||
| Total long-term investments | ||||||||||||
| (cost $2,905,496) | $ | 4,319,194 | ||||||||||
| SHORT-TERM INVESTMENTS - 1.5% | ||||||||||||
| Repurchase Agreements - 1.5% | ||||||||||||
| Bank of America Merrill Lynch TriParty Repurchase Agreement (maturing on 01/02/2014 in the amount of $3,292, collateralized by GNMA 4.00%, 2043, value of $3,358) | ||||||||||||
| $ | 3,292 | 0.005%, 12/31/2013 | $ | 3,292 | ||||||||
| Bank of Montreal TriParty Repurchase Agreement (maturing on 01/02/2014 in the amount of $3,163, collateralized by FNMA 1.58% - 4.50%, 2020 - 2043, U.S. Treasury Note 0.25% - 4.00%, 2015 - 2020, value of $3,226) | ||||||||||||
| 3,163 | 0.01%, 12/31/2013 | 3,163 | ||||||||||
| Bank of Montreal TriParty Repurchase Agreement (maturing on 01/02/2014 in the amount of $11,203, collateralized by FHLMC 3.00% - 5.00%, 2019 - 2043, FNMA 0.76% - 6.00%, 2016 - 2043, GNMA 1.50% - 5.25%, 2028 - 2043, value of $11,427) | ||||||||||||
| 11,203 | 0.02%, 12/31/2013 | 11,203 | ||||||||||
| Barclays Capital TriParty Repurchase Agreement (maturing on 01/02/2014 in the amount of $10,104, collateralized by U.S. Treasury Note 0.50% - 2.25%, 2017, value of $10,306) | ||||||||||||
| 10,104 | 0.01%, 12/31/2013 | 10,104 | ||||||||||
| Citigroup Global Markets, Inc. TriParty Repurchase Agreement (maturing on 01/02/2014 in the amount of $18,181, collateralized by U.S. Treasury Bond 3.88% - 8.13%, 2021 - 2040, U.S. Treasury Note 0.25% - 3.38%, 2014 - 2020, value of $18,544) | |||||||||||
| 18,181 | 0.01%, 12/31/2013 | 18,181 | ||||||||||
| RBS Securities, Inc. TriParty Repurchase Agreement (maturing on 01/02/2014 in the amount of $5,907, collateralized by U.S. Treasury Note 0.25% - 1.00%, 2015 – 2017, value of $6,025) | ||||||||||||
| 5,907 | 0.01%, 12/31/2013 | 5,907 | ||||||||||
| TD Securities TriParty Repurchase Agreement (maturing on 01/02/2014 in the amount of $14,182, collateralized by FFCB 0.20% - 0.50%, 2015 - 2016, FHLMC 0.38% - 5.25%, 2014 - 2042, FNMA 0.50% - 7.13%, 2014 - 2043, value of $14,465) | ||||||||||||
| 14,182 | 0.01%, 12/31/2013 | 14,182 | ||||||||||
| UBS Securities, Inc. Repurchase Agreement (maturing on 01/02/2014 in the amount of $121, collateralized by U.S. Treasury Note 2.13%, 2015, value of $124) | ||||||||||||
| 121 | 0.01%, 12/31/2013 | 121 | ||||||||||
| 66,153 | ||||||||||||
| Total short-term investments | ||||||||||||
| (cost $66,153) | $ | 66,153 | ||||||||||
| Total investments | ||||||||||||
| (cost $2,971,649) ▲ | 100.1 | % | $ | 4,385,347 | ||||||||
| Other assets and liabilities | (0.1 | )% | (3,413 | ) | ||||||||
| Total net assets | 100.0 | % | $ | 4,381,934 | ||||||||
The accompanying notes are an integral part of these financial statements.
| 6 |
| Note: | Percentage of investments as shown is the ratio of the total market value to total net assets. |
| ▲ | At December 31, 2013, the cost of securities for federal income tax purposes was $2,975,694 and the aggregate gross unrealized appreciation and depreciation based on that cost were: |
| Unrealized Appreciation | $ | 1,432,383 | ||
| Unrealized Depreciation | (22,730 | ) | ||
| Net Unrealized Appreciation | $ | 1,409,653 |
| ● | Non-income producing. |
| ╪ | See Significant Accounting Policies of accompanying Notes to Financial Statements regarding valuation of securities. |
| GLOSSARY: (abbreviations used in preceding Schedule of Investments) | |
| Other Abbreviations: | |
| ADR | American Depositary Receipt |
| FFCB | Federal Farm Credit Bank |
| FHLMC | Federal Home Loan Mortgage Corp. |
| FNMA | Federal National Mortgage Association |
| GNMA | Government National Mortgage Association |
The accompanying notes are an integral part of these financial statements.
| 7 |
| Hartford Dividend and Growth HLS Fund |
| Investment Valuation Hierarchy Level Summary |
| December 31, 2013 |
| (000’s Omitted) |
| Total | Level 1 ♦ | Level 2 ♦ | Level 3 | |||||||||||||
| Assets: | ||||||||||||||||
| Common Stocks ‡ | $ | 4,319,194 | $ | 4,319,194 | $ | — | $ | — | ||||||||
| Short-Term Investments | 66,153 | — | 66,153 | — | ||||||||||||
| Total | $ | 4,385,347 | $ | 4,319,194 | $ | 66,153 | $ | — | ||||||||
| ♦ | For the year ended December 31, 2013, there were no transfers between Level 1 and Level 2. |
| ‡ | The Fund has all or primarily all of the equity securities categorized in a particular level. Refer to the Schedule of Investments for further industry breakout. |
| Note: | For purposes of reporting transfers between different hierarchy levels, both transfers in and out of each level, as applicable, are shown as if they occurred at the beginning of the period. |
The accompanying notes are an integral part of these financial statements.
| 8 |
| Hartford Dividend and Growth HLS Fund |
| Statement of Assets and Liabilities |
| December 31, 2013 |
| (000’s Omitted) |
| Assets: | ||||
| Investments in securities, at market value (cost $2,971,649) | $ | 4,385,347 | ||
| Cash | 9 | |||
| Receivables: | ||||
| Fund shares sold | 213 | |||
| Dividends and interest | 6,359 | |||
| Total assets | 4,391,928 | |||
| Liabilities: | ||||
| Payables: | ||||
| Investment securities purchased | 5,203 | |||
| Fund shares redeemed | 3,921 | |||
| Investment management fees | 616 | |||
| Distribution fees | 34 | |||
| Accrued expenses | 220 | |||
| Total liabilities | 9,994 | |||
| Net assets | $ | 4,381,934 | ||
| Summary of Net Assets: | ||||
| Capital stock and paid-in-capital | $ | 2,492,430 | ||
| Undistributed net investment income | 2,679 | |||
| Accumulated net realized gain | 473,127 | |||
| Unrealized appreciation of investments | 1,413,698 | |||
| Net assets | $ | 4,381,934 | ||
| Shares authorized | 4,000,000 | |||
| Par value | $ | 0.001 | ||
| Class IA: Net asset value per share | $ | 27.05 | ||
| Shares outstanding | 139,016 | |||
| Net assets | $ | 3,760,183 | ||
| Class IB: Net asset value per share | $ | 26.99 | ||
| Shares outstanding | 23,036 | |||
| Net assets | $ | 621,751 |
The accompanying notes are an integral part of these financial statements.
| 9 |
| Hartford Dividend and Growth HLS Fund |
| Statement of Operations |
| For the Year Ended December 31, 2013 |
| (000’s Omitted) |
| Investment Income: | ||||
| Dividends | $ | 112,777 | ||
| Interest | 43 | |||
| Less: Foreign tax withheld | (609 | ) | ||
| Total investment income, net | 112,211 | |||
| Expenses: | ||||
| Investment management fees | 28,345 | |||
| Transfer agent fees | 5 | |||
| Distribution fees - Class IB | 1,537 | |||
| Custodian fees | 16 | |||
| Accounting services fees | 530 | |||
| Board of Directors' fees | 116 | |||
| Audit fees | 57 | |||
| Other expenses | 532 | |||
| Total expenses (before fees paid indirectly) | 31,138 | |||
| Commission recapture | (43 | ) | ||
| Custodian fee offset | — | |||
| Total fees paid indirectly | (43 | ) | ||
| Total expenses, net | 31,095 | |||
| Net Investment Income | 81,116 | |||
| Net Realized Gain on Investments and Foreign Currency Transactions: | ||||
| Net realized gain on investments | 504,604 | |||
| Net realized gain on foreign currency contracts | — | |||
| Net realized gain on other foreign currency transactions | 2 | |||
| Net Realized Gain on Investments and Foreign Currency Transactions | 504,606 | |||
| Net Changes in Unrealized Appreciation of Investments and Foreign Currency Transactions: | ||||
| Net unrealized appreciation of investments | 630,298 | |||
| Net unrealized appreciation on translation of other assets and liabilities in foreign currencies | — | |||
| Net Changes in Unrealized Appreciation of Investments and Foreign Currency Transactions | 630,298 | |||
| Net Gain on Investments and Foreign Currency Transactions | 1,134,904 | |||
| Net Increase in Net Assets Resulting from Operations | $ | 1,216,020 |
The accompanying notes are an integral part of these financial statements.
| 10 |
| Hartford Dividend and Growth HLS Fund |
| Statement of Changes in Net Assets |
| (000’s Omitted) |
| For the Year Ended December 31, 2013 | For the Year Ended December 31, 2012 | |||||||
| Operations: | ||||||||
| Net investment income | $ | 81,116 | $ | 93,878 | ||||
| Net realized gain on investments and foreign currency transactions | 504,606 | 237,302 | ||||||
| Net unrealized appreciation of investments | 630,298 | 243,080 | ||||||
| Net Increase in Net Assets Resulting from Operations | 1,216,020 | 574,260 | ||||||
| Distributions to Shareholders: | ||||||||
| From net investment income | ||||||||
| Class IA | (69,768 | ) | (83,992 | ) | ||||
| Class IB | (10,132 | ) | (12,015 | ) | ||||
| Total from net investment income | (79,900 | ) | (96,007 | ) | ||||
| From net realized gain on investments | ||||||||
| Class IA | (100,606 | ) | — | |||||
| Class IB | (16,432 | ) | — | |||||
| Total from net realized gain on investments | (117,038 | ) | — | |||||
| Total distributions | (196,938 | ) | (96,007 | ) | ||||
| Capital Share Transactions: | ||||||||
| Class IA | ||||||||
| Sold | 143,649 | 108,142 | ||||||
| Issued on reinvestment of distributions | 170,374 | 83,992 | ||||||
| Redeemed | (1,089,386 | ) | (794,723 | ) | ||||
| Total capital share transactions | (775,363 | ) | (602,589 | ) | ||||
| Class IB | ||||||||
| Sold | 57,875 | 52,210 | ||||||
| Issued on reinvestment of distributions | 26,564 | 12,015 | ||||||
| Redeemed | (193,494 | ) | (202,695 | ) | ||||
| Total capital share transactions | (109,055 | ) | (138,470 | ) | ||||
| Net decrease from capital share transactions | (884,418 | ) | (741,059 | ) | ||||
| Net Increase (Decrease) in Net Assets | 134,664 | (262,806 | ) | |||||
| Net Assets: | ||||||||
| Beginning of period | 4,247,270 | 4,510,076 | ||||||
| End of period | $ | 4,381,934 | $ | 4,247,270 | ||||
| Undistributed (distribution in excess of) | ||||||||
| net investment income | $ | 2,679 | $ | 1,559 | ||||
| Shares: | ||||||||
| Class IA | ||||||||
| Sold | 5,815 | 5,191 | ||||||
| Issued on reinvestment of distributions | 6,547 | 3,923 | ||||||
| Redeemed | (43,794 | ) | (37,859 | ) | ||||
| Total share activity | (31,432 | ) | (28,745 | ) | ||||
| Class IB | ||||||||
| Sold | 2,348 | 2,507 | ||||||
| Issued on reinvestment of distributions | 1,025 | 562 | ||||||
| Redeemed | (7,843 | ) | (9,685 | ) | ||||
| Total share activity | (4,470 | ) | (6,616 | ) | ||||
The accompanying notes are an integral part of these financial statements.
| 11 |
| Hartford Dividend and Growth HLS Fund |
| Notes to Financial Statements |
| December 31, 2013 |
| (000’s Omitted) |
| 1. | Organization: |
Hartford Dividend and Growth HLS Fund (the “Fund”) serves as an underlying investment option for certain variable annuity and variable life insurance separate accounts of Hartford Life Insurance Company (“HLIC”) and its affiliates and certain qualified retirement plans. The Fund may also serve as an underlying investment option for certain variable annuity and variable life separate accounts of other insurance companies. Owners of variable annuity contracts and policyholders of variable life insurance contracts may choose the funds permitted in the variable insurance contract prospectus. In addition, participants in certain qualified retirement plans may choose the Fund if permitted by their plans.
Hartford Series Fund, Inc. (the “Company”) is an open-end registered management investment company comprised of thirty portfolios. Financial statements for the Fund, a series of the Company, are included in this report.
The Company is organized under the laws of the State of Maryland and is registered with the Securities and Exchange Commission (“SEC”) under the Investment Company Act of 1940, as amended (“1940 Act”). The Fund is a diversified open-end management investment company.
The Fund is divided into Class IA and Class IB shares. Each class is offered at the per share net asset value (“NAV”) without a sales charge and is subject to the same expenses, except that the Class IB shares are subject to distribution and service fees charged pursuant to a Distribution Plan adopted in accordance with Rule 12b-1 under the 1940 Act.
| 2. | Significant Accounting Policies: |
The following is a summary of significant accounting policies of the Fund in the preparation of its financial statements, which are in accordance with United States Generally Accepted Accounting Principles (“U.S. GAAP”). The preparation of financial statements in accordance with U.S. GAAP may require management to make estimates and assumptions that affect the reported amounts of assets and liabilities and disclosure of contingent assets and liabilities at the date of the financial statements and the reported amounts of increases and decreases in net assets from operations during the reporting period. Actual results could differ from those estimates.
| a) | Determination of Net Asset Value – The NAV of each class of the Fund’s shares is determined as of the close of regular trading (normally 4:00 p.m. Eastern Time) (the “NYSE Close”) on each day that the New York Stock Exchange (the “Exchange”) is open (“Valuation Date”). Information that becomes known to the Fund after the NAV has been calculated on a particular day will not generally be used to retroactively adjust the NAV determined earlier that day. |
| b) | Investment Valuation and Fair Value Measurements – For purposes of calculating the NAV, portfolio investments and other assets held by the Fund's portfolio for which market quotes are readily available are valued at market value. Market value is generally determined on the basis of last reported sales prices or official close price. If no sales are reported, market value is based on quotes obtained from a quotation reporting system, established market makers, or independent pricing services. If market prices are not readily available or are deemed unreliable, the Fund will use the fair value of the investment as determined in good faith under policies and procedures established by and under the supervision of the Company’s Board of Directors. Market quotes are considered not readily available where there is an absence of current or reliable market-based data (e.g., trade information or indicative market quotes), including where events occur after the close of the relevant market, but prior to the NYSE Close, that materially affect the values of the Fund’s portfolio investments or assets. In addition, market quotes are considered not readily available when, due to extraordinary circumstances, the exchanges or markets on which the investments trade do not open for trading for the entire day and no other market prices are available. In addition, prices of foreign equities that are principally traded on certain foreign markets may be adjusted daily pursuant to a fair value pricing service approved by the Board of Directors in order to reflect an adjustment for the factors occurring after the close of certain foreign markets but before the NYSE Close. Investments that are primarily traded on foreign markets may trade on days that are not business days of the Fund. The value of the foreign investments in which the Fund invests may change on days when a shareholder will not be able to purchase or redeem shares of the Fund. Fair value pricing is subjective in nature and the use of fair value pricing by the Fund may cause the NAV of its shares to differ significantly from the NAV that would have been calculated using |
| 12 |
market prices at the close of the exchange on which a portfolio investment is primarily traded. There can be no assurance that the Fund could obtain the fair market value assigned to an investment if the Fund were to sell the investment at approximately the time at which the Fund determines its NAV.
Investments valued in currencies other than U.S. dollars are converted to U.S. dollars using exchange rates obtained from independent pricing services for calculation of the NAV. As a result, the NAV of the Fund’s shares may be affected by changes in the value of currencies in relation to the U.S. dollar. The value of investments traded in markets outside the United States or denominated in currencies other than the U.S. dollar may be affected significantly on a day that the NYSE is closed and the market value may change on days when an investor is not able to purchase, redeem or exchange shares of the Fund.
Financial instruments for which prices are not available from an independent pricing service may be valued using market quotations obtained from one or more dealers that make markets in the respective financial instrument in accordance with procedures established by the Company’s Board of Directors.
U.S. GAAP defines fair value as the price that the Fund would receive to sell an asset or pay to transfer a liability in an orderly transaction between market participants. The U.S. GAAP fair value measurement standards require disclosure of a fair value hierarchy for each major category of assets and liabilities. Various inputs are used in determining the fair value of the Fund’s investments. These inputs are summarized into three broad hierarchy levels. This hierarchy is based on whether the valuation inputs are observable or unobservable. These levels are:
| · | Level 1 – Quoted prices in active markets for identical investments. Level 1 may include exchange traded instruments, such as domestic equities, some foreign equities, options, futures, mutual funds, exchange traded funds, rights and warrants. |
| · | Level 2 – Observable inputs other than Level 1 prices, such as quoted prices for similar investments; quoted prices in markets that are not active; or other inputs that are observable or can be corroborated by observable market data. Level 2 may include debt investments that are traded less frequently than exchange traded instruments and which are valued using independent pricing services; foreign equities, which are principally traded on certain foreign markets and are adjusted daily pursuant to a fair value pricing service in order to reflect an adjustment for the factors occurring after the close of certain foreign markets but before the NYSE Close; senior floating rate interests, which are valued using an aggregate of dealer bids; short-term investments, which are valued at amortized cost; and swaps, which are valued based upon the terms of each swap contract. |
| · | Level 3 – Significant unobservable inputs that are supported by limited or no market activity. Level 3 may include financial instruments whose values are determined using indicative market quotes or require significant management judgment or estimation. These unobservable valuation inputs may include estimates for current yields, maturity/duration, prepayment speed, and indicative market quotes for comparable investments along with other assumptions relating to credit quality, collateral value, complexity of the investment structure, general market conditions and liquidity. This category may include investments where trading has been halted or there are certain restrictions on trading. While these investments are priced using unobservable inputs, the valuation of these investments reflects the best available data and management believes the prices are a reasonable representation of exit price. |
The Board of Directors of the Company generally reviews and approves the “Procedures for Valuation of Portfolio Securities” on an annual basis. These procedures define how investments are to be valued, including the formation and activities of a Valuation Committee. The Valuation Committee is responsible for determining in good faith the fair value of investments when the value cannot be obtained from primary pricing services or alternative sources or if the valuation of an investment as provided by the primary pricing service or alternative source is believed not to reflect the investment’s fair value as of the Valuation Date. Voting members of the Valuation Committee include the Fund’s Treasurer or designee and a Vice President of the investment manager or designee. An Assistant Vice President of the Fund with legal expertise or designee is also included on the Valuation Committee as a non-voting advisory member. In addition, the Fund’s Chief Compliance Officer shall designate a member of the compliance group to attend Valuation Committee meetings as a non-voting resource,
| 13 |
| Hartford Dividend and Growth HLS Fund |
| Notes to Financial Statements – (continued) |
| December 31, 2013 |
| (000’s Omitted) |
to monitor for and provide guidance with respect to compliance with these procedures. Two members of the Valuation Committee or their designees, representing different departments, shall constitute a quorum for purposes of permitting the Valuation Committee to take action. The Valuation Committee will consider all relevant factors in determining an investment’s fair value, and may seek the advice of the Fund’s sub-adviser, knowledgeable brokers, and legal counsel in making such determination. The Valuation Committee reports to the Audit Committee of the Company’s Board of Directors. The Audit Committee receives quarterly written reports which include details of all fair-valued investments, including the reason for the fair valuation, and an indication, when possible, of the accuracy of the valuation by disclosing the next available reliable public price quotation or the disposition price of such investments (the “look-back” test). The Board of Directors then must consider for ratification all of the fair value determinations made during the previous quarter.
Valuation levels are not necessarily indicative of the risk associated with investing in such investments. Individual investments within any of the above mentioned asset classes may be assigned a different hierarchical level than those presented above, as individual circumstances dictate.
For additional information, refer to the Investment Valuation Hierarchy Level Summary and the Level 3 roll-forward reconciliation, if applicable, which follow the Schedule of Investments.
| c) | Investment Transactions and Investment Income – Investment transactions are recorded as of the trade date (the date the order to buy or sell is executed) for financial reporting purposes. Investments purchased or sold on a when-issued or delayed-delivery basis may be settled a month or more after the trade date. Realized gains and losses are determined on the basis of identified cost. |
Dividend income from domestic securities is accrued on the ex-dividend date. In general, dividend income from foreign securities is recorded on the ex-date; however, dividend notifications in certain foreign jurisdictions may not be available in a timely manner and as a result, the Fund will record the dividend as soon as the relevant details (i.e., rate per share, payment date, shareholders of record, etc.) are publicly available. Interest income, including amortization of premium, accretion of discounts and additional principal received in-kind in lieu of cash, is accrued on a daily basis.
| d) | Foreign Currency Transactions – Assets and liabilities denominated in currencies other than U.S. dollars are translated into U.S. dollars at the exchange rates in effect on the valuation date. Purchases and sales of investments, income and expenses are translated into U.S. dollars at the exchange rates on the dates of such transactions. |
The Fund does not isolate that portion of portfolio investment valuation resulting from fluctuations in the foreign currency exchange rates from the fluctuations arising from changes in the market prices of investments held. Exchange rate fluctuations are included with the net realized and unrealized gain or loss on investments in the accompanying financial statements.
Net realized foreign exchange gains or losses arise from sales of foreign currencies and the difference between asset and liability amounts initially stated in foreign currencies and the U.S. dollar value of the amounts actually received or paid. Net unrealized foreign exchange gains or losses arise from changes in the value of other assets and liabilities at the end of the reporting period, resulting from changes in the exchange rates.
| e) | Joint Trading Account – The Fund may invest cash balances into a joint trading account that may be invested in one or more repurchase agreements. |
| f) | Fund Share Valuation and Dividend Distributions to Shareholders – Orders for the Fund’s shares are executed in accordance with the investment instructions of the contract holders and plan participants. The NAV of the Fund’s shares is determined as of the close of business on each business day of the Exchange. The NAV is determined separately for each class of shares of the Fund by dividing the Fund’s net assets attributable to that class by the number of shares of the class outstanding. Each class of shares offered by the Fund has equal rights as to assets and voting privileges (except that shareholders of a class have exclusive voting rights regarding any matter relating solely to that class of shares). Income |
| 14 |
and non-class specific expenses are allocated daily to each class on the basis of the relative net assets of the class. Realized and unrealized gains and losses are allocated daily based on the relative net assets of each class of shares of the Fund.
Orders for the purchase of the Fund’s shares received prior to the close of the Exchange on any day the Exchange is open for business are priced at the NAV determined as of the close of the Exchange. Orders received after the close of the Exchange, or on a day on which the Exchange and/or the Fund is not open for business, are priced at the next determined NAV.
Dividends are declared pursuant to a policy adopted by the Company’s Board of Directors based upon the investment performance of the Fund. The policy of the Fund is to pay dividends from net investment income and realized gains, if any, at least once a year.
Distributions from net investment income, net realized gains and capital are determined in accordance with federal income tax regulations, which may differ from U.S. GAAP with respect to character and timing. These differences may include but are not limited to losses deferred due to wash sale adjustments, foreign currency gains and losses, adjustments related to Passive Foreign Investment Companies (“PFICs”), Real Estate Investment Trusts (“REITs”), Regulated Investment Companies (“RICs”), certain derivatives and partnerships. Permanent book and federal income tax basis differences relating to shareholder distributions will result in reclassifications to certain of the Fund’s capital accounts (see Federal Income Taxes: Reclassification of Capital Accounts note).
| 3. | Securities and Other Investments: |
| a) | Repurchase Agreements – A repurchase agreement is an agreement by which a counterparty agrees to sell an investment and agrees to repurchase the investment sold from the buyer at a mutually agreed upon time and price. During the period of the repurchase agreement, the counterparty will deposit cash and or securities in a third party custodial account to serve as collateral. At the time the Fund enters into a repurchase agreement, the value of the underlying collateral, including accrued interest, will be equal to or exceed the value of the repurchase agreement. Repurchase agreements expose the Fund to counterparty risk - that is, the risk that the counterparty will not fulfill its obligations. To minimize counterparty risk, the investments that serve to collateralize the repurchase agreement are held by the Fund’s custodian in book entry or physical form in the custodial account of the Fund or in a third party custodial account. Repurchase agreements are valued at cost plus accrued interest, which approximates fair value. Repurchase agreements have master netting arrangements which allow the Fund to offset amounts owed to a counterparty with amounts owed by the counterparty, including any collateral. Upon an event of default under a master repurchase agreement, the non-defaulting party may close out all transactions traded under such agreement and net amounts owed under each transaction to one net amount payable by one party to the other. Absent an event of default, the master repurchase agreement does not result in an offset of reported amounts of assets and liabilities in the Statement of Assets and Liabilities across transactions between the Fund and the applicable counterparty. The Fund, as shown on the Schedule of Investments, had outstanding repurchase agreements and related collateral as of December 31, 2013. |
| 4. | Principal Risks: |
The Fund may be exposed to counterparty risk, or the risk that an institution or other entity with which the Fund has unsettled or open transactions will default.
If the Fund invests directly in foreign currencies or in securities that trade in, and receive revenues in, foreign currencies, or in derivatives that provide exposure to foreign currencies, it will be subject to the risk that those currencies will decline in value relative to the base currency (U.S. dollars) of the Fund, or, in the case of hedging positions, that the Fund’s base currency will decline in value relative to the currency being hedged. Currency rates in foreign countries may fluctuate significantly over short periods of time for a number of reasons, including changes in interest rates, intervention (or the failure to intervene) by U.S. or foreign governments, central banks or supranational entities, such as the International Monetary Fund, or by the imposition of currency controls or other political developments in the United
| 15 |
| Hartford Dividend and Growth HLS Fund |
| Notes to Financial Statements – (continued) |
| December 31, 2013 |
| (000’s Omitted) |
States or abroad. As a result, the Fund’s investments in foreign currency denominated securities may reduce the returns of the Fund. The market values of equity securities, such as common stocks and preferred stocks, or equity related investments, such as futures and options, may decline due to general market conditions which are not specifically related to a particular company, such as real or perceived adverse economic conditions, changes in the general outlook for corporate earnings, changes in interest or currency rates or adverse investor sentiment generally. The market value of equity securities may also decline due to factors which affect a particular industry or industries, such as labor shortages or increased production costs and competitive conditions within an industry. Equity securities and equity related investments generally have greater market price volatility than fixed income securities.
| 5. | Federal Income Taxes: |
| a) | Federal Income Taxes – For federal income tax purposes, the Fund intends to continue to qualify as a RIC under Subchapter M of the Internal Revenue Code (“IRC”) by distributing substantially all of its taxable net investment income and net realized capital gains to its shareholders and otherwise complying with the requirements of the IRC. The Fund has distributed substantially all of its income and capital gains in prior years, if applicable, and intends to distribute substantially all of its income and capital gains prior to the next fiscal year-end. Accordingly, no provision for federal income or excise taxes has been made in the accompanying financial statements. Distributions from short-term capital gains are treated as ordinary income distributions for federal income tax purposes. |
| b) | Net Investment Income (Loss), Net Realized Gains (Losses) and Distributions – Net investment income (loss) and net realized gains (losses) may differ for financial statement and tax purposes primarily because of losses deferred due to wash sale adjustments, foreign currency gains and losses, adjustments related to PFICs, REITs, RICs, certain derivatives and partnerships. The character of distributions made during the year from net investment income or net realized gains may differ from their ultimate characterization for federal income tax purposes. Also, due to the timing of dividend distributions, the fiscal year in which amounts are distributed may differ from the year that the income or realized gains (losses) were recorded by the Fund. |
| c) | Distributions and Components of Distributable Earnings – The tax character of distributions paid by the Fund for the periods indicated is as follows (as adjusted for dividends payable, if applicable): |
| For the Year Ended December 31, 2013 | For the Year Ended December 31, 2012 | |||||||
| Ordinary Income | $ | 79,900 | $ | 96,007 | ||||
| Long-Term Capital Gains* | 117,038 | — | ||||||
| * | The Fund designates these distributions as long-term capital dividends pursuant to IRC Sec. 852(b)(3)(C). |
As of December 31, 2013, the Fund’s components of distributable earnings (deficit) on a tax basis were as follows:
| Amount | ||||
| Undistributed Ordinary Income | $ | 52,045 | ||
| Undistributed Long-Term Capital Gain | 427,806 | |||
| Unrealized Appreciation* | 1,409,653 | |||
| Total Accumulated Earnings | $ | 1,889,504 | ||
| * | Differences between book-basis and tax-basis unrealized appreciation (depreciation) may be attributable to the losses deferred due to wash sale adjustments, foreign currency gains and losses, adjustments related to PFICs, REITs, RICs, certain derivatives and partnerships. |
| d) | Reclassification of Capital Accounts – The Fund may record reclassifications in its capital accounts. These reclassifications have no impact on the total net assets of the Fund. The reclassifications are a result of permanent differences between U.S. GAAP and tax accounting for such items as foreign currency, PFICs, expiration or utilization |
| 16 |
of capital loss carryforwards or net operating losses. Adjustments are made to reflect the impact these items have on current and future distributions to shareholders. Therefore, the source of the Fund’s distributions may be shown in the accompanying Statement of Changes in Net Assets as from undistributed net investment income, from accumulated net realized gains on investments or from capital depending on the type of book and tax differences that exist. For the year ended December 31, 2013, the Fund recorded reclassifications to increase (decrease) the accounts listed below:
| Amount | ||||
| Undistributed Net Investment Income (Loss) | $ | (96 | ) | |
| Accumulated Net Realized Gain (Loss) | 96 | |||
| e) | Capital Loss Carryforward – On December 22, 2010, the Regulated Investment Company Modernization Act of 2010 (the “Act”) was enacted, which made changes to the capital loss carryforward rules. The changes are effective for taxable years beginning after the date of enactment. Under the Act, funds are permitted to carry forward capital losses for an unlimited period. However, any losses incurred during those future taxable years will be required to be utilized prior to the losses incurred in pre-enactment taxable years, which carry an expiration date. As a result of this ordering rule, pre-enactment capital loss carryforwards may be more likely to expire unused. Additionally, post-enactment capital loss carryforwards retain their character as either short-term or long-term capital losses rather than being considered all short-term as permitted under prior regulation. |
The Fund had no capital loss carryforward for U.S. federal income tax purposes as of December 31, 2013.
| f) | Accounting for Uncertainty in Income Taxes – The Fund has adopted financial reporting rules that require the Fund to analyze all open tax years, as defined by the statute of limitations, for all major jurisdictions. Generally, tax authorities can examine all tax returns filed for the last three years. The Fund does not have an examination in progress. |
The Fund has reviewed all open tax years and major jurisdictions and concluded that these financial reporting rules had no effect on the Fund’s financial position or results of operations. There is no tax liability resulting from unrecognized tax benefits relating to uncertain income tax positions taken or expected to be taken on the tax return for the fiscal year ended December 31, 2013. The Fund is also not aware of any tax positions for which it is reasonably possible that the total amounts of unrecognized tax benefits will significantly change in the next twelve months.
| 6. | Expenses: |
| a) | Investment Management Agreement – Hartford Funds Management Company, LLC (“HFMC”), an indirect wholly owned subsidiary of The Hartford Financial Services Group, Inc. (“The Hartford”), serves as investment manager to the Fund pursuant to an Investment Management Agreement with the Company. The investment manager has overall investment supervisory responsibility for the Fund. In addition, the investment manager provides administrative personnel, services, equipment, facilities and office space for proper operation of the Fund. The investment manager has contracted with Wellington Management Company, LLP (“Wellington Management”) under a sub-advisory agreement for the provision of day-to-day investment management services to the Fund in accordance with the Fund’s investment objective and policies. The Fund pays a fee to the investment manager, a portion of which may be used to compensate Wellington Management. |
| 17 |
| Hartford Dividend and Growth HLS Fund |
| Notes to Financial Statements – (continued) |
| December 31, 2013 |
| (000’s Omitted) |
The schedule below reflects the rates of compensation paid to HFMC for investment management services rendered as of December 31, 2013; the rates are accrued daily and paid monthly.
| Average Daily Net Assets | Annual Fee | |||
| On first $250 million | 0.7750 | % | ||
| On next $250 million | 0.7250 | % | ||
| On next $500 million | 0.6750 | % | ||
| On next $1.5 billion | 0.6250 | % | ||
| On next $2.5 billion | 0.6200 | % | ||
| On next $5 billion | 0.6150 | % | ||
| Over $10 billion | 0.6100 | % |
| b) | Accounting Services Agreement – Pursuant to the Fund Accounting Agreement between HFMC and the Company, on behalf of the Fund, HFMC provides accounting services to the Fund and receives monthly compensation based on the Fund’s average daily net assets at the rates set forth below. The Fund’s accounting services fees are accrued daily and paid monthly. |
| Average Daily Net Assets | Annual Fee | |||
| On first $5 billion | 0.012 | % | ||
| Over $5 billion | 0.010 | % |
| c) | Operating Expenses – Allocable expenses incurred by the Company are allocated to each Fund and allocated to classes within a Fund in proportion to the average daily net assets of the Fund and each class, except where allocation of certain expenses is more fairly made directly to the Fund or to specific classes within a Fund. |
| d) | Fees Paid Indirectly – The Company, on behalf of the Fund, has entered into agreements with State Street Global Markets, LLC and Russell Implementation Services, Inc. to partially recapture non-discounted trade commissions. Such rebates are used to pay a portion of the Fund’s expenses. In addition, the Fund’s custodian bank has agreed to reduce its fees when the Fund maintains cash on deposit in a non-interest-bearing custody account. For the year ended December 31, 2013, these amounts, if any, are included in the Statement of Operations. |
The ratio of expenses to average net assets in the accompanying financial highlights excludes the reduction in expenses related to fees paid indirectly. The annualized expense ratio after waivers for the period listed below reflecting the reduction for fees paid indirectly is as follows:
| Year Ended December 31, 2013 | ||||
| Class IA | 0.67 | % | ||
| Class IB | 0.92 |
| e) | Distribution Plan for Class IB shares – Effective June 14, 2013, Hartford Investment Financial Services, LLC was renamed Hartford Funds Distributors, LLC (“HFD”). HFD, a wholly owned, ultimate subsidiary of The Hartford, serves as the Fund’s principal underwriter and distributor. The Company, on behalf of the Fund, has adopted a Distribution Plan pursuant to Rule 12b-1 of the 1940 Act to compensate the distributor, HFD, from assets attributable to the Class IB shares for services rendered and expenses borne in connection with activities primarily intended to result in the sale of the Class IB shares, subject to the review and approval of the Company’s Board of Directors. |
The Distribution Plan provides that the Fund may pay annually up to 0.25% of the average daily net assets of the Fund attributable to its Class IB shares for activities primarily intended to result in the sale of Class IB shares. The Board has the authority to suspend or reduce these payments at any point in time. Under the terms of the Distribution Plan and the principal underwriting agreement, the Fund is authorized to make payments monthly to the distributor that may be used
| 18 |
to pay or compensate entities providing distribution and shareholder servicing with respect to the Class IB shares for such entities’ fees or expenses incurred or paid in that regard. These fees are accrued daily and paid monthly.
| f) | Other Related Party Transactions – Certain officers of the Fund are directors and/or officers of the investment manager and/or The Hartford or its subsidiaries. For the year ended December 31, 2013, a portion of the Fund’s Chief Compliance Officer’s salary was paid by all the investment companies in the Hartford fund complex. The portion allocated to the Fund was in the amount of $4. Hartford Administrative Services Company (“HASCO”), an indirect wholly owned subsidiary of The Hartford, provides transfer agent services to the Fund. HASCO was compensated on a per account basis for providing such services. The amount paid to HASCO can be found in the Statement of Operations. These fees are accrued daily and paid monthly. |
| g) | Payment from Affiliate – In July of 2007, The Hartford entered into a settlement with the Attorneys General of the states of New York, Connecticut and Illinois relating to market timing and the company's individual variable annuity contracts in which certain payments would be made directly to the variable annuity contract holders. The distribution plan provided that unclaimed money from the settlement would be distributed to certain HLS Funds that are investment options through a Hartford individual variable annuity contract. The unclaimed money was distributed to the Fund on September 18, 2009. |
The total return in the accompanying financial highlights includes a payment from an affiliate. Had the payment from the affiliate been excluded, the impact and total return for the period listed below would have been as follows:
| For the Year Ended December 31, 2009 | ||||||||
| Class IA | Class IB | |||||||
| Impact from Payment from Affiliate for Attorneys General Settlement | — | % | — | % | ||||
| Total Return Excluding Payment from Affiliate | 24.67 | % | 24.36 | % | ||||
| 7. | Investment Transactions: |
For the year ended December 31, 2013, the Fund's aggregate purchases and sales of investment securities (excluding short-term investments) were as follows:
| Amount | ||||
| Cost of Purchases Excluding U.S. Government Obligations | $ | 1,068,394 | ||
| Sales Proceeds Excluding U.S. Government Obligations | 2,072,241 | |||
| 8. | Line of Credit: |
The Fund is one of several Hartford funds that participate in a $500 million committed revolving line of credit facility. The facility is to be used for temporary or emergency purposes. Under the arrangement, the funds are required to own securities having a market value in excess of 300% of the total bank borrowings. The interest rate on borrowings varies depending on the nature of the loan. The facility also requires a fee to be paid based on the amount of the commitment. This commitment fee is allocated to all of the funds participating in the line of credit based on the average net assets of the funds. During the year ended December 31, 2013, the Fund did not have any borrowings under this facility.
| 9. | Industry Classifications: |
Other than the industry classifications “Other Investment Pools and Funds” and “Exchange Traded Funds,” equity industry classifications used in this report are the Global Industry Classification Standard, which was developed by and is the exclusive property and service mark of MSCI, Inc. and Standard & Poor’s.
| 19 |
| Hartford Dividend and Growth HLS Fund |
| Notes to Financial Statements – (continued) |
| December 31, 2013 |
| (000’s Omitted) |
| 10. | Indemnifications: |
Under the Company’s organizational documents, the Company shall indemnify its officers and directors to the full extent required or permitted under Maryland General Corporation Law and the federal securities laws. In addition, the Company, on behalf of the Fund, may enter into contracts that contain a variety of indemnifications. The Company’s maximum exposure under these arrangements is unknown. However, as of the date of these financial statements, the Company has not had prior claims or losses pursuant to these contracts and expects the risk of loss to be remote.
| 11. | Pending Legal Proceedings: |
On February 25, 2011, Jennifer L. Kasilag, Louis Mellinger, Judith M. Menendez, Jacqueline M. Robinson, and Linda A. Russell filed a derivative lawsuit against Hartford Investment Financial Services, LLC (“HIFSCO”)(now known as Hartford Funds Distributors, LLC) on behalf of six Hartford retail mutual funds in the United States District Court for the District of New Jersey, alleging that HIFSCO received excessive advisory and distribution fees in violation of its statutory fiduciary duty under Section 36(b) of the 1940 Act when serving as investment manager and principal underwriter, respectively, to the Hartford retail mutual funds. HIFSCO moved to dismiss and, in September 2011, the motion was granted in part and denied in part, with leave to amend the complaint. In November 2011, plaintiffs filed an amended complaint on behalf of certain Hartford retail mutual funds, The Hartford Global Health Fund (now known as The Hartford Healthcare Fund), The Hartford Conservative Allocation Fund, The Hartford Growth Opportunities Fund, The Hartford Inflation Plus Fund, The Hartford Advisers Fund (now known as The Hartford Balanced Fund), and The Hartford Capital Appreciation Fund. Plaintiffs seek to rescind the investment management agreements and distribution plans between HIFSCO and these funds and to recover the total fees charged thereunder or, in the alternative, to recover any improper compensation HIFSCO received, in addition to lost earnings. HIFSCO filed a partial motion to dismiss the amended complaint and, in December 2012, the court dismissed without prejudice the claims regarding distribution fees and denied the motion with respect to the advisory fees claims. HIFSCO disputes the allegations and intends to defend the advisory fee claims vigorously.
This action concerns the activities of HIFSCO in its capacity as investment manager and principal underwriter to the Hartford retail mutual funds and does not concern HIFSCO’s activities in its capacity as principal underwriter to the HLS funds. For this reason, no accrual for litigation relating to this matter has been recorded in the financial statements of the Fund.
| 20 |
| Hartford Dividend and Growth HLS Fund |
| Financial Highlights |
| ─ Selected Per-Share Data(A) ─ | ─ Ratios and Supplemental Data ─ | |||||||||||||||||||||||||||||||||||||||||||||||||||
| Class | Net Asset Value at Beginning of Period | Net Investment Income (Loss) | Net Realized and Unrealized Gain (Loss) on Investments | Total from Investment Operations | Dividends from Net Investment Income | Distributions from Realized Capital Gains | Total Dividends and Distributions | Net Asset Value at End of Period | Total Return(B) | Net Assets at End of Period (000s) | Ratio of Expenses to Average Net Assets Before Adjust- ments(C) | Ratio of Expenses to Average Net Assets After Adjust- ments(C) | Ratio of Net Investment Income (Loss) to Average Net Assets | |||||||||||||||||||||||||||||||||||||||
| For the Year Ended December 31, 2013 | ||||||||||||||||||||||||||||||||||||||||||||||||||||
| IA | $ | 21.46 | $ | 0.46 | $ | 6.33 | $ | 6.79 | $ | (0.51 | ) | $ | (0.69 | ) | $ | (1.20 | ) | $ | 27.05 | 31.92 | % | $ | 3,760,183 | 0.67 | % | 0.67 | % | 1.88 | % | |||||||||||||||||||||||
| IB | 21.42 | 0.40 | 6.31 | 6.71 | (0.45 | ) | (0.69 | ) | (1.14 | ) | 26.99 | 31.58 | 621,751 | 0.92 | 0.92 | 1.62 | ||||||||||||||||||||||||||||||||||||
| For the Year Ended December 31, 2012 (D) | ||||||||||||||||||||||||||||||||||||||||||||||||||||
| IA | $ | 19.34 | $ | 0.49 | $ | 2.13 | $ | 2.62 | $ | (0.50 | ) | $ | — | $ | (0.50 | ) | $ | 21.46 | 13.59 | % | $ | 3,658,076 | 0.67 | % | 0.67 | % | 2.13 | % | ||||||||||||||||||||||||
| IB | 19.30 | 0.45 | 2.11 | 2.56 | (0.44 | ) | — | (0.44 | ) | 21.42 | 13.31 | 589,194 | 0.92 | 0.92 | 1.88 | |||||||||||||||||||||||||||||||||||||
| For the Year Ended December 31, 2011 (D) | ||||||||||||||||||||||||||||||||||||||||||||||||||||
| IA | $ | 19.50 | $ | 0.42 | $ | (0.16 | ) | $ | 0.26 | $ | (0.42 | ) | $ | — | $ | (0.42 | ) | $ | 19.34 | 1.32 | % | $ | 3,851,657 | 0.67 | % | 0.67 | % | 1.98 | % | |||||||||||||||||||||||
| IB | 19.46 | 0.36 | (0.16 | ) | 0.20 | (0.36 | ) | — | (0.36 | ) | 19.30 | 1.06 | 658,419 | 0.92 | 0.92 | 1.73 | ||||||||||||||||||||||||||||||||||||
| For the Year Ended December 31, 2010 (D) | ||||||||||||||||||||||||||||||||||||||||||||||||||||
| IA | $ | 17.55 | $ | 0.35 | $ | 1.96 | $ | 2.31 | $ | (0.36 | ) | $ | — | $ | (0.36 | ) | $ | 19.50 | 13.21 | % | $ | 4,409,787 | 0.68 | % | 0.68 | % | 1.87 | % | ||||||||||||||||||||||||
| IB | 17.51 | 0.32 | 1.94 | 2.26 | (0.31 | ) | — | (0.31 | ) | 19.46 | 12.93 | 756,001 | 0.93 | 0.93 | 1.62 | |||||||||||||||||||||||||||||||||||||
| For the Year Ended December 31, 2009 (D) | ||||||||||||||||||||||||||||||||||||||||||||||||||||
| IA | $ | 14.37 | $ | 0.35 | $ | 3.19 | $ | 3.54 | $ | (0.36 | ) | $ | — | $ | (0.36 | ) | $ | 17.55 | 24.68 | %(E) | $ | 4,247,031 | 0.69 | % | 0.69 | % | 2.24 | % | ||||||||||||||||||||||||
| IB | 14.34 | 0.33 | 3.16 | 3.49 | (0.32 | ) | — | (0.32 | ) | 17.51 | 24.36 | (E) | 815,752 | 0.94 | 0.94 | 2.00 | ||||||||||||||||||||||||||||||||||||
| (A) | Information presented relates to a share outstanding throughout the indicated period. Net investment income (loss) per share amounts are calculated based on average shares outstanding unless otherwise noted. |
| (B) | The figures do not include sales charges or other fees which may be applied at the variable life insurance, variable annuity or qualified retirement plan product level. Any such additional sales charges or other fees would lower the Fund's performance. |
| (C) | Adjustments include waivers and reimbursements, if applicable. Ratios do not include fees paid indirectly (see Expenses in the accompanying Notes to Financial Statements). |
| (D) | Net investment income (loss) per share amounts have been calculated using the SEC method. |
| (E) | Total return without the inclusion of the Payment from (to) Affiliate can be found in Expenses in the accompanying Notes to Financial Statements. |
| Portfolio Turnover Rate for All Share Classes | ||||
| For the Year Ended December 31, 2013 | 25 | % | ||
| For the Year Ended December 31, 2012 | 20 | |||
| For the Year Ended December 31, 2011 | 24 | |||
| For the Year Ended December 31, 2010 | 32 | |||
| For the Year Ended December 31, 2009 | 34 | |||
| 21 |
| Report of Independent Registered Public Accounting Firm |
| The Board of Directors and Shareholders of |
| Hartford Series Fund, Inc. |
We have audited the accompanying statement of assets and liabilities, including the schedule of investments, of Hartford Dividend and Growth HLS Fund (one of the portfolios constituting Hartford Series Fund, Inc. (the Funds)) as of December 31, 2013, and the related statement of operations for the year then ended, the statements of changes in net assets for each of the two years in the period then ended, and the financial highlights for each of the five years in the period then ended. These financial statements and financial highlights are the responsibility of the Funds’ management. Our responsibility is to express an opinion on these financial statements and financial highlights based on our audits.
We conducted our audits in accordance with the standards of the Public Company Accounting Oversight Board (United States). Those standards require that we plan and perform the audit to obtain reasonable assurance about whether the financial statements and financial highlights are free of material misstatement. We were not engaged to perform an audit of the Funds’ internal control over financial reporting. Our audits included consideration of internal control over financial reporting as a basis for designing audit procedures that are appropriate in the circumstances, but not for the purpose of expressing an opinion on the effectiveness of the Funds’ internal control over financial reporting. Accordingly, we express no such opinion. An audit also includes examining, on a test basis, evidence supporting the amounts and disclosures in the financial statements and financial highlights, assessing the accounting principles used and significant estimates made by management, and evaluating the overall financial statement presentation. Our procedures included confirmation of securities owned as of December 31, 2013, by correspondence with the custodian and brokers or by other appropriate auditing procedures where replies from brokers were not received. We believe that our audits provide a reasonable basis for our opinion.
In our opinion, the financial statements and financial highlights referred to above present fairly, in all material respects, the financial position of Hartford Dividend and Growth HLS Fund of the Hartford Series Fund, Inc. at December 31, 2013, the results of its operations for the year then ended, the changes in its net assets for each of the two years in the period then ended, and the financial highlights for each of the five years in the period then ended, in conformity with U.S. generally accepted accounting principles.
|
Minneapolis, MN
February 17, 2014
| 22 |
| Hartford Dividend and Growth HLS Fund |
| Directors and Officers (Unaudited) |
The Board of Directors of the Company appoints officers who are responsible for the day-to-day operations of the Fund and who execute policies formulated by the directors. Each director serves until his or her death, resignation, or retirement or until the next annual meeting of shareholders is held or until his or her successor is elected and qualifies.
Directors and officers who are employed by or who have a financial interest in The Hartford are considered “interested” persons of the Fund pursuant to the 1940 Act. Each officer and two of the Company’s directors, as noted in the chart below, are “interested” persons of the Fund. Each director serves as a director for The Hartford Mutual Funds, Inc., The Hartford Mutual Funds II, Inc., Hartford Series Fund, Inc., Hartford HLS Series Fund II, Inc., and as a trustee for The Hartford Alternative Strategies Fund, which, as of December 31, 2013, collectively consist of 91 funds. Correspondence may be sent to directors and officers c/o Hartford Funds, 5 Radnor Corporate Center, Suite 300, 100 Matsonford Road, Radnor, Pennsylvania 19087, except that correspondence to Mr. Annoni, Mr. Dressen and Ms. Quade may be sent to 500 Bielenberg Drive, Woodbury, Minnesota 55125.
The table below sets forth, for each director and officer, his or her name, year of birth, current position with the Company and date first elected or appointed to Hartford Series Fund, Inc. (“HSF”), and Hartford HLS Series Fund II, Inc. (“HSF2”), principal occupation, and, for directors, other directorships held. The Fund’s Statement of Additional Information contains further information on the directors and is available free of charge by calling 1-800-862-6668 or writing to Hartford HLS Funds, c/o Hartford Life Insurance Company, Hartford Life and Annuity Insurance Company, P.O. Box 14293, Lexington, KY 40512-4293.
Information on the aggregate remuneration paid to the directors of the Company can be found in the Statement of Operations herein. The Fund pays to The Hartford a portion of the Chief Compliance Officer’s compensation, but does not pay salaries or compensation to any of their other officers or directors who are employed by The Hartford.
Non-Interested Directors
Lynn S. Birdsong (1946) Director since 2003, Co-Chairman of the Investment Committee since 2005
Mr. Birdsong is a private investor. Mr. Birdsong currently serves as a Director of the Sovereign High Yield Investment Company (April 2010 to current). Mr. Birdsong currently serves as an Independent Director of Nomura Partners Funds, Inc. (formerly, The Japan Fund) (April 2003 to current). From 2003 to March 2005, Mr. Birdsong was an Independent Director of the Atlantic Whitehall Funds. From 1979 to 2002, Mr. Birdsong was a Managing Director of Zurich Scudder Investments, an investment management firm. During his employment with Scudder, Mr. Birdsong was an Interested Director of The Japan Fund. From January 1981 through December 2013, Mr. Birdsong was a partner in Birdsong Company, an advertising specialty firm.
Robert M. Gavin, Jr. (1940) Director since 2002 (HSF) and 1986 (HSF2), Chairman of the Board since 2004
Dr. Gavin is an educational consultant. Prior to September 1, 2001, he was President of Cranbrook Education Community and prior to July 1996, he was President of Macalester College, St. Paul, Minnesota.
Duane E. Hill (1945) Director since 2001 (HSF) and 2002 (HSF2), Chairman of the Nominating Committee since 2003
Mr. Hill is a Partner of TSG Ventures L.P., a private equity investment company. Mr. Hill is a former partner of TSG Capital Group, a private equity investment firm that served as sponsor and lead investor in leveraged buyouts of middle market companies.
Sandra S. Jaffee (1941) Director since 2005
Ms. Jaffee is the founder and Chief Executive Officer of a private company, Homeworks Concierge, LLC, which provides residential property management services in Westchester County, New York (January 2012 to present). Ms. Jaffee served as Chairman (2008 to 2009) and Chief Executive Officer of Fortent (formerly Searchspace Group), a leading provider of compliance/regulatory technology to financial institutions from August 2005 to August 2009. Ms. Jaffee currently serves as a member of the Board of Directors of Broadridge Financial Solutions as well as a Trustee of Muhlenberg College.
| 23 |
| Hartford Dividend and Growth HLS Fund |
| Directors and Officers (Unaudited) – (continued) |
William P. Johnston (1944) Director since 2005, Chairman of the Compliance Committee since 2005
In June 2006, Mr. Johnston was appointed as Senior Advisor to The Carlyle Group, a global private equity and alternative asset investment firm and currently serves as an Operating Executive. In July 2006, Mr. Johnston was elected to the Board of Directors of MultiPlan, Inc. and served as a Director (July 2006 to August 2010). In August 2007, Mr. Johnston was elected to the Board of Directors of LifeCare Holdings, Inc. and served as a Director (August 2007 to June 2013). In February 2008, Mr. Johnston was elected to the Board of Directors of HCR-ManorCare, Inc. In May 2006, Mr. Johnston was elected to the Supervisory Board of Fresenius Medical Care AG & Co. KGaA, after its acquisition of Renal Care Group, Inc. in March 2006. Mr. Johnston joined Renal Care Group in November 2002 as a member of the Board of Directors and served as Chairman of the Board from March 2003 through March 2006. From 2002 through 2013, Mr. Johnston served as a Board member of the Georgia O’Keefe Museum. From September 1987 to December 2002, Mr. Johnston was with Equitable Securities Corporation (and its successors, SunTrust Equitable Securities and SunTrust Robinson Humphrey) serving in various investment banking and managerial positions, including Managing Director and Head of Investment Banking, Chief Executive Officer and Vice Chairman.
Phillip O. Peterson (1944) Director since 2002 (HSF) and 2000 (HSF2), Chairman of the Audit Committee since 2002
Mr. Peterson is a mutual fund industry consultant. He was a partner of KPMG LLP (an accounting firm) until July 1999. Mr. Peterson joined William Blair Funds in February 2007 as a member of the Board of Trustees. Mr. Peterson also joined the Board of Trustees of Symetra Variable Mutual Funds Trust as a trustee in February 2012.
Lemma W. Senbet (1946) Director since 2005
Dr. Senbet is the William E. Mayer Chair Professor of Finance and Founding Director, Center for Financial Policy, at the University of Maryland, Robert H. Smith School of Business. He was chair of the Finance Department of the University of Maryland, Robert H. Smith School of Business from 1998 to 2006. Since June 2013, he has been on leave from the University to serve as Executive Director of African Economic Research Consortium which focuses on economic policy research and training. Previously, he was a chaired professor of finance at the University of Wisconsin-Madison. Also, he was a Director of the Fortis Funds from March 2000 to July 2002. Dr. Senbet served as Director of the American Finance Association and President of the Western Finance Association. In 2006, Dr. Senbet was inducted Fellow of Financial Management Association International for his career-long distinguished scholarship and professional service.
Interested Directors and Officers
James E. Davey (1964) Director since 2012, President and Chief Executive Officer since 2010
Mr. Davey serves as Executive Vice President of Hartford Life Insurance Company (“HLIC”) and The Hartford Financial Services Group, Inc. Additionally, Mr. Davey serves as Chairman of the Board, Manager and Senior Managing Director of Hartford Funds Distributors, LLC (“HFD”). He also currently serves as Director, Chairman of the Board, President and Senior Managing Director of Hartford Administrative Services Company (“HASCO”). Mr. Davey also serves as Manager, Chairman of the Board and Senior Managing Director for Hartford Funds Management Company, LLC (“HFMC”). Mr. Davey joined The Hartford in 2002.
Lowndes A. Smith (1939) Director since 1996 (HSF) and 2002 (HSF2), Co-Chairman of the Investment Committee since 2005
Mr. Smith served as Vice Chairman of The Hartford from February 1997 to January 2002, as President and Chief Executive Officer of Hartford Life, Inc. from February 1997 to January 2002, and as President and Chief Operating Officer of The Hartford Life Insurance Companies from January 1989 to January 2002. Mr. Smith serves as a Director of White Mountains Insurance Group Ltd. (October 2003 to current); One Beacon Insurance (October 2006 to current); Symetra Financial (August 2007 to current) and is a Managing Director of Whittington Gray Associates (January 2007 to current).
Other Officers
Mark A. Annoni (1964) Vice President, Controller and Treasurer since 2012
Mr. Annoni currently serves as the Assistant Vice President of HLIC (February 2004 to present).
| 24 |
Michael R. Dressen (1963) AML Compliance Officer since 2011
Mr. Dressen currently serves as Assistant Vice President of HLIC. He also serves as Chief Compliance Officer and AML Compliance Officer of HASCO and as AML Officer of HFD. Mr. Dressen has served in various positions within The Hartford and its subsidiaries in connection with the operation of the Hartford Funds.
Edward P. Macdonald (1967) Vice President, Secretary and Chief Legal Officer since 2005
Mr. Macdonald currently serves as Assistant Secretary, Executive Vice President and Deputy General Counsel of HFD, HASCO and HFMC. He also serves as Vice President of HLIC. Mr. Macdonald has served in various positions within The Hartford and its subsidiaries in connection with the operation of the Hartford Funds. Mr. Macdonald joined The Hartford in 2005.
Joseph G. Melcher (1973) Vice President and Chief Compliance Officer since 2013
Mr. Melcher currently serves as Executive Vice President of HASCO and HFD. Mr. Melcher also currently serves as Executive Vice President and Chief Compliance Officer of HFMC. Mr. Melcher has served in various positions within The Hartford and its subsidiaries in connection with the operation of the Hartford Funds since joining The Hartford in 2012. Prior to joining The Hartford, Mr. Melcher worked at Touchstone Investments, a member of the Western & Southern Financial Group, where he held the position of Vice President and Chief Compliance Officer from 2010 through 2012 and Assistant Vice President, Compliance from 2005 to 2010.
Vernon J. Meyer (1964) Vice President since 2006
Mr. Meyer currently serves as Senior Vice President of HLIC. He also currently serves as Managing Director and Chief Investment Officer of HFMC. Mr. Meyer has served in various positions within The Hartford and its subsidiaries in connection with the operation of the Hartford Funds. Mr. Meyer joined The Hartford in 2004.
Laura S. Quade (1969) Vice President since 2012
Ms. Quade currently serves as Vice President of HASCO and HFD. She is the Head of Operations of HASCO and also serves as Director, Enterprise Operations of HLIC. Ms. Quade has served in various positions within The Hartford and its subsidiaries in connection with the operation of the Hartford Funds.
Martin A. Swanson (1962) Vice President since 2010
Mr. Swanson currently serves as Vice President of HLIC. Mr. Swanson also serves as Managing Director, Chief Marketing Officer and Principal of HFD. Mr. Swanson has served in various positions within The Hartford and its subsidiaries in connection with the operation of the Hartford Funds.
HOW TO OBTAIN A COPY OF THE FUND’S PROXY VOTING POLICIES AND VOTING RECORDS (UNAUDITED)
A description of the policies and procedures that the Fund uses to determine how to vote proxies relating to portfolio securities and information about how the Fund voted proxies relating to portfolio securities during the most recent twelve-month period ended June 30 are available (1) without charge, upon request, by calling 800-862-6668 and (2) on the SEC’s website at http://www.sec.gov.
QUARTERLY PORTFOLIO HOLDINGS INFORMATION (UNAUDITED)
The Fund files a complete schedule of portfolio holdings with the SEC for the first and third quarters of each fiscal year on Form N-Q. The Fund’s Forms N-Q are available (1) without charge, upon request, by calling 800-862-6668 and (2) on the SEC’s website at http://www.sec.gov. The Form N-Q may be reviewed and copied at the SEC’s Public Reference Room in Washington, DC. Information on the operation of the Public Reference Room may be obtained by calling 1-800-SEC-0330.
| 25 |
| Hartford Dividend and Growth HLS Fund |
| Expense Example (Unaudited) |
Your Fund's Expenses
As a shareholder of the Fund, you incur two types of costs: (1) transaction costs and (2) ongoing costs, including investment management fees, distribution and/or service (12b-1) fees, if any, and other fund expenses. This example is intended to help you understand your ongoing costs (in dollars) of investing in the Fund and to compare these costs with the ongoing costs of investing in other mutual funds. The example is based on an investment of $1,000 invested at the beginning of the period and held for the period of June 30, 2013 through December 31, 2013.
Actual Expenses
The first set of columns of the table below provides information about actual account values and actual expenses. You may use the information in this column, together with the amount you invested, to estimate the expenses that you paid over the period. Simply divide your account value by $1,000 (for example, an $8,600 account value divided by $1,000 = 8.6), then multiply the result by the number in the line under the heading entitled “Expenses Paid During Period” to estimate the expenses you paid on your account during this period.
Hypothetical Example for Comparison Purposes
The second set of columns of the table below provides information about hypothetical account values and hypothetical expenses based on the Fund’s actual expense ratio and an assumed rate of return of 5% per year before expenses, which is not the Fund’s actual return. The hypothetical account values and expenses may not be used to estimate the actual ending account balance or expenses you paid for the period. You may use this information to compare the ongoing costs of investing in the Fund and other funds. To do so, compare this 5% hypothetical example with the 5% hypothetical examples that appear in the shareholder reports of the other funds.
Please note that the expenses shown in the table are meant to highlight your ongoing costs only and do not reflect any transactional costs, such as sales charges (loads) and CDSC. Therefore, the second set of columns of the table is useful in comparing ongoing costs only, and will not help you determine the relative total costs of owning different funds. In addition, if these transactional costs were included, your costs would be higher. Expenses are equal to the Fund's annualized expense ratios multiplied by average account value over the period, multiplied by 184/365 (to reflect the one-half year period).
| Actual return | Hypothetical (5% return before expenses) | |||||||||||||||||||||||||||||||||||
| Beginning Account Value June 30, 2013 | Ending Account Value December 31, 2013 | Expenses paid during the period June 30, 2013 through December 31, 2013 | Beginning Account Value June 30, 2013 | Ending Account Value December 31, 2013 | Expenses paid during the period June 30, 2013 through December 31, 2013 | Annualized expense ratio | Days in the current 1/2 year | Days in the full year | ||||||||||||||||||||||||||||
| Class IA | $ | 1,000.00 | $ | 1,145.10 | $ | 3.63 | $ | 1,000.00 | $ | 1,021.82 | $ | 3.43 | 0.67 | % | 184 | 365 | ||||||||||||||||||||
| Class IB | $ | 1,000.00 | $ | 1,143.60 | $ | 4.98 | $ | 1,000.00 | $ | 1,020.56 | $ | 4.70 | 0.92 | % | 184 | 365 | ||||||||||||||||||||
| 26 |
| Hartford Dividend and Growth HLS Fund |
| Approval of Investment Management and Investment Sub-Advisory Agreements (Unaudited) |
Section 15(c) of the Investment Company Act of 1940, as amended (the “1940 Act”), requires that each mutual fund’s board of directors, including a majority of those directors who are not “interested persons” of the mutual fund, as defined in the 1940 Act (the “Independent Directors”), annually review and consider the continuation of the mutual fund’s investment advisory and sub-advisory agreements. At its meeting held on August 6-7, 2013, the Board of Directors (the “Board”) of Hartford Series Fund, Inc., including each of the Independent Directors, unanimously voted to approve the continuation of the investment management agreement for Hartford Dividend and Growth HLS Fund (the “Fund”) with Hartford Funds Management Company, LLC (“HFMC”) and the continuation of the investment sub-advisory agreement between HFMC and the Fund’s sub-adviser, Wellington Management Company, LLP (the “Sub-adviser,” and together with HFMC, the “Advisers”) (collectively, the “Agreements”).
In the months preceding the August 6-7, 2013 meeting, the Board requested, received, and reviewed written responses from the Advisers to questions posed to them on behalf of the Independent Directors and supporting materials relating to those questions and responses. The Board considered information furnished to the Board at its meetings throughout the year, as well as information specifically prepared in connection with the annual approval of the Agreements at the Board’s meetings held on June 18-19, 2013 and August 6-7, 2013. Information provided to the Board at its meetings throughout the year included, among other things, reports on Fund performance, legal and compliance matters, sales and marketing activity, shareholder services, and the other services provided to the Fund by the Advisers and their affiliates. The Board also received in-person presentations by Fund officers and representatives of HFMC at the Board’s meetings on June 18-19, 2013 and August 6-7, 2013 concerning the Agreements.
The Independent Directors, advised by independent legal counsel, engaged two service providers to assist them with evaluating the Agreements with respect to the Fund. Lipper Inc. (“Lipper”), an independent provider of investment company data, was retained to provide the Board with reports on how the Fund’s contractual management fees, actual management fees, other non-management fees, overall expense ratios and investment performance compared to those of mutual funds with similar investment objectives. The Independent Directors also engaged an independent financial services consulting firm (the “Consultant”) to assist them in evaluating the Fund’s management fees, sub-advisory fees, other non-management fees, overall expense ratios and investment performance. In addition, the Consultant reviewed the profitability calculations utilized by HFMC in connection with the continuation of the investment management agreement.
In determining whether to continue the Agreements for the Fund, the members of the Board reviewed and evaluated information and factors they believed to be relevant and appropriate in light of the information that the Board deemed necessary and appropriate through the exercise of its reasonable business judgment. While individual members of the Board may have weighed certain factors differently, the Board’s determination to continue the Agreements was based on a comprehensive consideration of all information provided to the Board throughout the year and specifically with respect to the continuation of the Agreements. A more detailed discussion of the factors the Board considered with respect to its approval of the Agreements is provided below.
Nature, Extent, and Quality of Services Provided by the Advisers
The Board requested and considered information concerning the nature, extent, and quality of the services provided to the Fund by the Advisers. The Board considered, among other things, the terms of the Agreements and the range of services provided by the Advisers. The Board considered the Advisers’ professional personnel who provide services to the Fund, including each Adviser’s ability and experience in attracting and retaining qualified personnel to service the Fund. The Board considered each Adviser’s reputation and overall financial strength, as well as its willingness to consider and implement organizational and operational changes designed to improve services to the Fund. In addition, the Board considered the quality of each Adviser’s communications with the Board and responsiveness to Board inquiries.
The Board also requested and evaluated information concerning each Adviser’s regulatory and compliance environment. In this regard, the Board requested and reviewed information on each Adviser’s compliance policies and procedures, compliance history, and a report from the Fund’s Chief Compliance Officer on each Adviser’s compliance with applicable laws and regulations, including responses to regulatory developments and compliance issues raised by regulators. The Board also noted the Advisers’ support of the Fund’s compliance control structure, particularly the resources devoted by the Advisers in support of the Fund’s obligations pursuant to Rule 38a-1 under the 1940 Act.
| 27 |
| Hartford Dividend and Growth HLS Fund |
| Approval of Investment Management and Investment Sub-Advisory Agreements (Unaudited) – (continued) |
With respect to HFMC, the Board noted that under the Agreements, HFMC is responsible for the management of the Fund, including overseeing fund operations and service providers, as well as investment advisory services in connection with selecting, monitoring and supervising the Sub-adviser. The Board considered HFMC’s ongoing monitoring of people, process and performance, including its quarterly reviews of each of the Hartford Funds, semi-annual meetings with the leaders of each Fund’s portfolio management team, and oversight of the Funds’ approximately 40 portfolio managers. The Board recognized that HFMC has demonstrated a record of making changes to the management and/or strategies of the Funds when warranted. The Board considered HFMC’s oversight of the Sub-adviser’s investment approach and results, process for monitoring best execution of portfolio trades by the Sub-adviser, and approach to risk management with respect to the Fund and the service providers to the Fund. The Board also considered HFMC’s oversight of compliance with the Fund’s objective and policies as well as with applicable laws and regulations, noting that regulatory and other developments had over time led to an increase in the scope of HFMC’s services in this regard.
In addition, the Board considered HFMC’s ongoing commitment to review and rationalize the Hartford Funds product line-up and the expenses that HFMC had incurred in connection with fund combinations in recent years. The Board considered that HFMC or its affiliates are responsible for providing the Fund’s officers. The Board also noted that Hartford Life Insurance Company (“HLIC”) provides administrative services to the Fund. The Board considered its experiences with HFMC and HLIC with respect to each of these services.
With respect to the Sub-adviser, who provides day-to-day portfolio management services, the Board considered the quality of the Fund’s portfolio managers, the Sub-adviser’s other investment personnel, its investment philosophy and process, investment research capabilities and resources, performance record, trade execution capabilities and experience. The Board considered the experience of the Fund’s portfolio managers, the number of accounts managed by the portfolio managers, and the Sub-adviser’s method for compensating the portfolio managers.
Based on these considerations, the Board concluded that it was satisfied with the nature, extent and quality of the services provided to the Fund by HFMC and the Sub-adviser.
Performance of the Fund and the Advisers
The Board considered the investment performance of the Fund. In this regard, the Board reviewed the performance of the Fund over different time periods presented in the materials and evaluated HFMC’s analysis of the Fund’s performance for these time periods. The Board considered information and materials provided to the Board by the Advisers concerning Fund performance, as well as information from Lipper comparing the investment performance of the Fund to an appropriate benchmark and universe of peer funds. The Board noted that the Fund’s performance was in the 4th quintile of its performance universe for the 1- and 3-year periods and the 2nd quintile for the 5-year period. The Board also noted that the Fund’s performance was above its benchmark for the 1-year period, below its benchmark for the 3-year period and in line with its benchmark for the 5-year period. The Board considered that, in response to questions raised concerning the Fund’s performance, HFMC stated that it has confidence in the Fund’s portfolio management team and investment strategy.
The Board considered the detailed investment analytics reports provided by Hartford Funds’ Investment Advisory Group throughout the year. These reports include, among other things, information on the Fund’s gross and net returns, the Fund’s investment performance relative to an appropriate benchmark and peer group, various statistics concerning the Fund’s portfolio, and a narrative summary of various factors affecting Fund performance. The Board considered the Advisers’ cooperation with the Investment Committee, which assists the Board in evaluating the performance of the Fund at periodic meetings throughout the year. The Board also considered the analysis provided by the Consultant relating to the Fund’s performance track record.
In light of all the considerations noted above, the Board concluded that it had continued confidence in HFMC’s and the Sub-adviser’s overall capabilities to manage the Fund.
| 28 |
Costs of the Services and Profitability of the Advisers
The Board reviewed information regarding HFMC’s cost to provide investment management and related services to the Fund and HFMC’s profitability, both overall and for the Fund, on a pre-tax basis without regard to distribution expenses. The Board also requested and reviewed information about the profitability to HFMC and its affiliates from all services provided to the Fund and all aspects of their relationship with the Fund. The Board also requested and received information relating to the operations and profitability of the Sub-adviser.
The Board considered the Consultant’s review of the profitability calculations utilized by HFMC in connection with the continuation of the investment management agreement, noting the Consultant’s view that Hartford Funds’ process for calculating and reporting Fund profitability is reasonable. In this regard, the Board noted that the Consultant had previously performed a full review of this process and reported that such process is sound and well within common industry practice.
Based on these considerations, the Board concluded that the profits anticipated to be realized by the Advisers and their affiliates from their relationships with the Fund would not be excessive.
Comparison of Fees and Services Provided by the Advisers
The Board considered comparative information with respect to the management fees to be paid by the Fund to HFMC and the total expense ratios of the Fund. The Board also considered comparative information with respect to the sub-advisory fees to be paid by HFMC to the Sub-adviser. In this regard, the Board requested and reviewed information from HFMC and the Sub-adviser relating to the management and sub-advisory fees, including the sub-advisory fee schedule for the Fund, and total operating expenses for the Fund. The Board considered that the management fee for the Fund includes the fee paid to HLIC for providing certain administrative services to the Fund. With respect to the sub-advisory fee schedule, the Board considered representations from HFMC and the Sub-adviser that the Sub-adviser’s fees were negotiated at arm’s length. The Board also reviewed information from Lipper comparing the Fund’s contractual management fees, actual management fees and overall expense ratios relative to a group of funds selected by Lipper, in consultation with the Consultant, and a broader universe of funds selected by Lipper. The Board noted that the Fund’s contractual management fee and actual management fee were in the 2nd quintile of its expense group, while its total expenses (less 12b-1 and shareholder service fees) were in the 1st quintile.
While the Board recognized that comparisons between the Fund and peer funds are imprecise, given the differing service levels and characteristics of mutual funds and the different business models and cost structures of the Advisers, the comparative information provided by Lipper assisted the Board in evaluating the reasonableness of the Fund’s management and sub-advisory fees and total operating expenses. In addition, the Board considered the analysis and recommendations of the Consultant relating to the Fund’s management and sub-advisory fees and total operating expenses.
Based on these considerations, the Board concluded that the Fund’s fees and total operating expenses, in conjunction with the information about quality of services, profitability, economies of scale, and other matters discussed, were reasonable in light of the services provided.
Economies of Scale
The Board requested and considered information regarding the Advisers’ realization of economies of scale with respect to the Fund and whether the fee levels reflect these economies of scale for the benefit of the Fund’s shareholders. The Board reviewed the breakpoints in the management fee schedule for the Fund, which reduce fee rates as Fund assets grow over time. The Board recognized that a fund with assets beyond the last breakpoint level will continue to benefit from economies of scale because additional assets are charged the lowest breakpoint fee resulting in lower overall effective management fee rates. The Board also recognized that a fee schedule that reaches a lower breakpoint quickly provides shareholders with the benefit of anticipated or potential economies of scale. The Board noted the effect of the sale and run-off of the variable annuity business on the HLS Funds.
The Board reviewed and evaluated materials from Lipper showing how management fee schedules of peer funds reflect economies of scale for the benefit of shareholders as a peer fund’s assets hypothetically increase over time. Based on information
| 29 |
| Hartford Dividend and Growth HLS Fund |
| Approval of Investment Management and Investment Sub-Advisory Agreements (Unaudited) – (continued) |
provided by HFMC, Lipper, and the Consultant, the Board recognized that there is no uniform methodology for establishing breakpoints or uniform pattern in asset levels that trigger breakpoints or the amounts of breakpoints triggered.
After considering all of the information available to it, the Board concluded that it was satisfied with the extent to which economies of scale would be shared for the benefit of the Fund’s shareholders based on currently available information and the effective advisory fees and expense ratios for the Fund at its current and reasonably anticipated asset levels. The Board noted, however, that it would continue to monitor future growth in Fund assets and the appropriateness of additional breakpoints.
Other Benefits
The Board considered other benefits to the Advisers and their affiliates from their relationships with the Fund, including the role of the Fund in supporting the variable life insurance and variable annuity products offered by The Hartford.
The Board reviewed information noting that HLIC, an affiliate of HFMC, receives fees for providing certain administrative services to the Fund and that HFMC receives fees for fund accounting and related services from the Fund. The Board considered information on profits to HLIC and HFMC for such services. The Board also considered that Hartford Administrative Services Company (“HASCO”), the Fund’s transfer agent and an affiliate of HFMC, receives transfer agency compensation from the Fund, and the Board reviewed information on the profitability of the Fund’s transfer agency function to HASCO. The Board considered information provided by HASCO indicating that the transfer agent fees charged by HASCO to the Fund were fair and reasonable based on publicly available information.
The Board also considered that Hartford Funds Distributors, LLC (“HFD”), an affiliate of HFMC, serves as principal underwriter of the Fund. As principal underwriter, HFD receives 12b-1 fees from the Fund. The Board also noted that certain affiliates of HFD distribute shares of the Fund and receive compensation in that connection.
The Board considered benefits to the Sub-adviser from its use of the Fund’s brokerage commissions to obtain soft dollar research, and representations from HFMC and the Sub-adviser that the Sub-adviser would not make any revenue-sharing payments or any other type of distribution payments to HFMC or its affiliates.
The Board considered the benefits to shareholders of being part of the Hartford Funds family of funds. The Board considered HFMC’s efforts to provide investors in the family with a broad range of investment styles and asset classes.
* * * *
Based upon its review of these various factors, among others, the Board concluded that it is in the best interests of the Fund and its shareholders for the Board to approve the Agreements for an additional year. In reaching this decision, the Board did not assign relative weights to the factors discussed above or deem any one or group of them to be controlling in and of themselves. In connection with their deliberations, the Independent Directors met separately in executive session on several occasions, with independent legal counsel and the Consultant, to review the relevant materials and consider their responsibilities under relevant laws and regulations.
| 30 |
| Hartford Dividend and Growth HLS Fund |
| Main Risks (Unaudited) |
The main risks of investing in the Fund are described below.
Market, Selection, and Strategy Risk: The Fund’s share price may fluctuate due to market risk and/or security selections that may underperform the market or relevant benchmarks. If the sub-adviser’s investment strategy does not perform as expected, the Fund could underperform its peers or lose money. There is no guarantee the Fund will achieve its stated objective.
Foreign Investment Risk: Foreign investments can be riskier than U.S. investments. Potential risks include currency risk that may result from unfavorable exchange rates, liquidity risk if decreased demand for a security makes it difficult to sell at the desired price, and risks that stem from substantially lower trading volume on foreign markets.
Dividend Paying Security Investment Risk: Dividends are not guaranteed and are subject to change. Dividend paying securities as a group can fall out of favor with the market, causing the Fund to underperform.
| 31 |
THIS PRIVACY POLICY IS NOT PART OF THIS REPORT
Privacy Policy and Practices of The Hartford Financial Services Group, Inc. and its Affiliates
(herein called “we, our, and us”)
This Privacy Policy applies to our United States Operations
We value your trust. We are committed to the responsible: a) management; b) use; and c) protection; of Personal Information. This notice describes how we collect, disclose, and protect Personal Information.
We collect Personal Information to: a) service your Transactions with us; and b) support our business functions.
We may obtain Personal Information from: a) You; b) your Transactions with us; and c) third parties such as a consumer-reporting agency.
Based on the type of product or service You apply for or get from us, Personal Information such as: a) your name; b) your address; c) your income; d) your payment; or e) your credit history; may be gathered from sources such as applications, Transactions, and consumer reports.
To serve You and service our business, we may share certain Personal Information. We will share Personal Information, only as allowed by law, with affiliates such as: a) our insurance companies; b) our employee agents; c) our brokerage firms; and d) our administrators.
As allowed by law, we may share Personal Financial Information with our affiliates to: a) market our products; or b) market our services; to You without providing You with an option to prevent these disclosures. | We may also share Personal Information, only as allowed by law, with unaffiliated third parties including:
When allowed by law, we may share certain Personal Financial Information with other unaffiliated third parties who assist us by performing services or functions such as:
We, and third parties we partner with, may track some of the pages You visit through the use of: a) cookies; b) pixel tagging; or c) other technologies; and currently do not process or comply with any web browser’s “do not track” signal or similar mechanism that indicates a request to disable online tracking of individual users who visit our websites or use our services.
We will not sell or share your Personal Financial Information with anyone for purposes unrelated to our business functions without offering You the opportunity to:
We only disclose Personal Health Information with:
Our employees have access to Personal Information in the course of doing their jobs, such as: |
We use manual and electronic security procedures to maintain: a) the confidentiality; and b) the integrity of; Personal Information that we have. We use these procedures to guard against unauthorized access.
Some techniques we use to protect Personal Information include: a) secured files; b) user authentication; c) encryption; d) firewall technology; and e) the use of detection software.
We are responsible for and must: a) identify information to be protected; b) provide an adequate level of protection for that data; c) grant access to protected data only to those people who must use it in the performance of their job-related duties. Employees who violate our Privacy Policy will be subject to discipline, which may include ending their employment with us.
At the start of our business relationship, we will give You a copy of our current Privacy Policy.
We will also give You a copy of our current Privacy Policy once a year if You maintain a continuing business relationship with us.
We will continue to follow our Privacy Policy regarding Personal Information even when a business relationship no longer exists between us. | As used in this Privacy Notice:
Application means your request for our product or service.
Personal Financial Information means financial information such as:
Personal Health Information means health information such as:
Personal Information means information that identifies You personally and is not otherwise available to the public. It includes:
Transaction means your business dealings with us, such as:
You means an individual who has given us Personal Information in conjunction with: |
This Privacy Policy is being provided on behalf of the following affiliates of The Hartford Financial Services Group, Inc.:
1stAGChoice, Inc.; Access CoverageCorp, Inc.; Access CoverageCorp Technologies, Inc.; American Maturity Life Insurance Company; Archway 60 R, LLC; Business Management Group, Inc.; Catalyst360, LLC; Champlain Life Reinsurance Company; DMS R, LLC; Eloy R, LLC; Ersatz Corporation; First State Insurance Company; Hartford Accident and Indemnity Company; Hartford Administrative Services Company; Hartford Casualty General Agency, Inc.; Hartford Casualty Insurance Company; Hartford-Comprehensive Employee Benefit Service Company; Hartford Equity Sales Company, Inc.; Hartford Fire General Agency, Inc.; Hartford Fire Insurance Company; Hartford Funds Management Company, LLC; Hartford Funds Management Group, Inc.; Hartford HLS Series Fund II, Inc.; Hartford Insurance Company of Illinois; Hartford Insurance Company of the Midwest; Hartford Insurance Company of the Southeast; Hartford Integrated Technologies, Inc.; Hartford International Life Reassurance Corporation; Hartford Funds Distributors, LLC; Hartford Investment Management Company; Hartford Life and Accident Insurance Company; Hartford Life and Annuity Insurance Company; Hartford Life Insurance Company; Hartford Life Private Placement, LLC; Hartford Lloyd’s Corporation; Hartford Lloyd’s Insurance Company; Hartford Mezzanine Investors I, LLC; Hartford Residual Market, L.C.C.; Hartford Retirement Services, LLC; Hartford Securities Distribution Company, Inc.; Hartford Series Fund, Inc.; Hartford Specialty Insurance Services of Texas, LLC; Hartford Strategic Investments, LLC; Hartford Underwriters Insurance Company; Hartford Technology Services Company, L.L.C.; Hartford of Texas General Agency, Inc.; Hartford Underwriters General Agency, Inc.; HARTRE Company, L.C.C.; HL Investment Advisors, LLC; HLA LLC; Horizon Management Group, LLC; HRA Brokerage Services, Inc.; Lanidex Class B, LLC; M-CAP Insurance Agency, LLC; New England Insurance Company; New England Reinsurance Corporation; Nutmeg Insurance Agency, Inc.; Nutmeg Insurance Company; Pacific Insurance Company, Limited; Planco, LLC: Property and Casualty Insurance Company of Hartford; Revere R, LLC; RVR R, LLC; Sentinel Insurance Company, Ltd.; Sunstone R, LLC; Symphony R, LLC; The Evergreen Group Incorporated; The Hartford Alternative Strategies Fund; The Hartford Mutual Funds, Inc.; The Hartford Mutual Funds II, Inc.; Trumbull Flood Management, L.L.C.; Trumbull Insurance Company; Twin City Fire Insurance Company; White River Life Reinsurance Company.
HPP Revised December 2013
HARTFORD HLS FUNDS
c/o The Hartford Wealth Management - Global Annuities
P.O. Box 14293
Lexington, KY 40512-4293
HARTFORDFUNDS
hartfordfunds.com
Hartford Series Fund, Inc. is underwritten and distributed by Hartford Funds Distributors, LLC.
Hartford Series Fund, Inc. inception dates range from 1977 to date. Hartford Series Fund, Inc. is not a subsidiary of The Hartford Financial Services Group, Inc. ("The Hartford") but is underwritten, distributed by and advised by subsidiaries of The Hartford. Investments in Hartford Series Fund, Inc. are not guaranteed by The Hartford or any other entity.
This report is submitted for the general information of the shareholders of the Funds. It is not authorized for distribution unless preceded or accompanied by a current prospectus for the Funds.
Investors should carefully consider the investment objectives, risks, charges, and expenses of Hartford Funds before investing. This and other information can be found in the prospectus and summary prospectus, which can be obtained by calling 888-843-7824 (retail) or 877-836-5854 (institutional). Investors should read them carefully before they invest.
HLSAR-DG13 2-14 113538-2 Printed in U.S.A ©2013 The Hartford, Hartford, CT 06115
HARTFORDFUNDS
| HARTFORD GLOBAL GROWTH
HLS FUND
2013 Annual Report
|
A MESSAGE FROM THE PRESIDENT
Dear Fellow Shareholders:
Thank you for investing in Hartford HLS Funds.
Market Review
U.S. equities (as represented by the S&P 500 Index) generated their strongest year since 1997 in 2013, rising 32.39% for the year. During the fourth quarter, equities rose without looking back, pushing the S&P 500 Index and the Dow Jones Industrial Average to new all-time highs. Despite previously cheering delays to quantitative-easing tapering, the stock market received an additional boost at the end of the year following the U.S. Federal Reserve’s (Fed) announcement of a $10-billion-a-month reduction in bond purchases beginning in January.
The Fed’s decision to begin tapering its bond purchases is generally considered a vote of confidence in the recovering U.S. economy. Consumer spending has stabilized, the housing market is showing steady improvement, the unemployment rate is slowly declining and economic growth clocked in at a healthy 4.1% in the third quarter. Equities have also recovered since the market low in March 2009: The S&P 500 Index has gained 173% from the market low through December 31, 2013.
Signs of improvement are also visible outside the U.S. Europe appears to have begun its own economic recovery, and emerging markets have reversed their recent lackluster performance. Fiscal policy continues to wield significant influence in today’s economy and central banks across the globe are maintaining their accommodative stances, including the appointment of Janet Yellen, who is widely expected to continue current monetary policies, to succeed Ben Bernanke as U.S. Federal Reserve chairman.
It’s important to stay abreast of domestic and international economic developments while balancing your individual investment goals. Meeting with your financial advisor on a regular basis to examine your current investment strategy can help you determine whether you are on the right track:
| • | Is your portfolio fully diversified with an appropriate mix of stocks and bonds? |
| • | Is your portfolio incorporating both domestic and international holdings to take advantage of the global economic recovery? |
| • | Are your investments still in line with your risk tolerance and investment time horizon? |
Your financial advisor can help you choose options within our fund family to navigate today’s markets with confidence.
Thank you again for investing with Hartford HLS Funds.
James Davey
President
Hartford HLS Funds
1The S&P 500 Index is a market capitalization-weighted price index composed of 500 widely held common stocks.
2The Dow Jones Industrial Average is an unmanaged, price-weighted index of 30 of the largest, most widely held stocks traded on the New York Stock Exchange.
Hartford Global Growth HLS Fund
This report is prepared for the general information of contract owners and qualified retirement plan participants. It is not an offer of contracts or of qualified retirement plans. It should not be used in connection with any offer, except in conjunction with the appropriate product prospectus which contains all pertinent information including the applicable sales, administrative and other charges.
The views expressed in the Fund’s Manager Discussion under ‘‘Why did the Fund perform this way?’’ and ‘‘What is the outlook?’’ are views of the Fund’s sub-adviser and portfolio management team through the end of the period and are subject to change based on market and other conditions. The Fund’s Manager Discussion is for informational purposes only and does not represent an offer, recommendation or solicitation to buy, hold or sell any security. The specific securities identified and described, if any, do not represent all of the securities purchased or sold and you should not assume that investments in the securities identified and discussed will be profitable.
| Hartford Global Growth HLS Fund inception 09/30/1998 |
| (sub-advised by Wellington Management Company, LLP) |
| Investment objective – Seeks growth of capital. |
Performance Overview 12/31/03 - 12/31/13

The chart above represents the hypothetical growth of a $10,000 investments in Class IA. Growth results in classes other than Class IA will vary from what is seen above due to differences in the expenses charged to those share classes.
Average Annual Total Returns (as of 12/31/13)
| 1 Year | 5 Years | 10 Years | ||||||||||
| Global Growth IA | 36.30 | % | 17.55 | % | 6.42 | % | ||||||
| Global Growth IB | 35.90 | % | 17.25 | % | 6.15 | % | ||||||
| MSCI World Growth Index | 27.20 | % | 16.70 | % | 7.57 | % | ||||||
PERFORMANCE DATA QUOTED REPRESENTS PAST PERFORMANCE AND DOES NOT GUARANTEE FUTURE RESULTS. The investment return and principal value of the investment will fluctuate so that investors’ shares, when redeemed, may be worth more or less than their original cost. Current performance may be lower or higher than the performance data quoted. To obtain performance data current to the most recent month-end, please visit our website at www.hartfordfunds.com.
Total returns presented above were calculated using the Fund’s net asset value available to shareholders for sale or redemption of Fund shares on December 31, 2013, which may exclude investment transactions as of this date. All share class returns assume the reinvestment of all distributions at net asset value and the deduction of all fund expenses.
MSCI World Growth Index is a broad-based unmanaged market capitalization-weighted total return index which measures the performance of growth securities in 23 developed-country global equity markets including the United States, Canada, Europe, Australia, New Zealand and the Far East.
You cannot invest directly in an index.
As of the Fund's current prospectus dated May 1, 2013, the total annual operating expense ratios for Class IA and Class IB were 0.82% and 1.07%, respectively. Actual expenses may be higher. Please see the accompanying Financial Highlights for expense ratios for the year ended December 31, 2013.
The chart and table do not reflect the deductions of taxes, sales charges or other fees which may be applied at the variable life insurance, variable annuity or qualified retirement plan product level. Any such additional sales charges or other fees or expenses would lower the contract’s or plan’s performance.
All investments are subject to risk including the possible loss of principal. For a discussion of the Fund’s risks, please see the Main Risks section of this report. For more detailed information on the risks associated with an investment in the Fund, please see the prospectus.
| 2 |
| Hartford Global Growth HLS Fund |
| Manager Discussion |
| December 31, 2013 (Unaudited) |
| Portfolio Managers | |
| Matthew D. Hudson, CFA | John A. Boselli, CFA |
| Vice President and Equity Portfolio Manager | Director and Equity Portfolio Manager |
How did the Fund perform?
The Class IA shares of the Hartford Global Growth HLS Fund returned 36.30% for the twelve-month period ended December 31, 2013, outperforming the Fund’s benchmark, the MSCI World Growth Index, which returned 27.20% for the same period. The Fund also outperformed the 24.49% average return of the Variable Products-Underlying Funds Lipper Global Growth Funds peer group, a group of funds with investment strategies similar to those of the Fund.
Why did the Fund perform this way?
Global equities returned 27.20% for the 12-month period ended December 31, 2013, as measured by the MSCI World Growth Index. Starting in the first quarter, global equities surged as solid corporate earnings results and favorable global liquidity dynamics lifted enthusiasm for stocks. Further monetary easing by the Bank of Japan and a steadily improving U.S. economy also fueled the rally, which continued at a more modest pace in the second quarter. Solid gains in April and the first part of May paused following comments by U.S. Federal Reserve (Fed) Chairman Ben Bernanke that suggested the Fed might begin to slow quantitative easing sooner than investors anticipated. Nonetheless, equities resumed their ascent in the third quarter as the surprising “no taper” decision by the Federal Open Market Committee eased near-term concerns about rapidly rising interest rates derailing the recovery. Additionally, accommodative rhetoric from the European Central Bank, along with encouraging data in China and further evidence of a European economic recovery, contributed to a broad-based global equity rally that extended through the end of the year. In December, the year ended with an optimistic tone as investors cheered the elimination of two market overhangs: the timing of Fed tapering and the threat of another U.S. government shutdown in early 2014.
For the annual period, growth stocks (+27.20%) modestly underperformed value stocks (+27.52%) as measured by the MSCI World Growth Index and the MSCI World Value Index, respectively. Within the MSCI World Growth Index, all ten sectors posted positive returns. Telecommunication Services (+55%), Health Care (41%) and Consumer Discretionary (+40%) sectors gained the most, while the Materials (+0.2%), Utilities (+7%), and Energy (+17%) sectors lagged on a relative basis.
The Fund’s outperformance versus its benchmark was primarily due to broad-based, strong security selection, particularly in the Health Care, Consumer Discretionary, and Information Technology sectors. This more than offset unfavorable selection in the Utilities and Energy sectors. Sector allocation, a residual of our bottom-up stock selection process, contributed to relative returns, primarily due to an underweight to the Materials and Consumer Staples sectors and an overweight to the Health Care sector. A small cash position detracted in an upward trending market environment.
Top contributors to relative performance included Gilead Sciences (Health Care), Sands China (Consumer Discretionary) and Priceline.com (Consumer Discretionary). Shares of U.S.-based Gilead Sciences, a biopharmaceutical company, moved higher as quarterly results were driven by growing sales of the firm’s antiviral drug franchise and pipeline momentum continued to build. Shares of Sands China, a Hong Kong-listed casino in Macau, and a subsidiary of Las Vegas Sands, posted strong third quarter 2013 results, which were driven by strong gaming performance and increased hotel occupancy. This was received favorably by the market. Shares of U.S.-based Priceline.com, a global leader in online travel reservations, outperformed after the company posted solid quarterly earnings as it continued to gain share across all geographies. In addition, Google (Information Technology) and Celegene (Health Care) were among top contributors during the period.
The top detractors from the Fund’s relative performance were Samsung Electronics (Information Technology), Cobalt International Energy (Energy), and Teradata (Information Technology). Shares of South Korea-based global electronics company Samsung, declined during the period due to concerns regarding increased competition in the handsets market and the belief amongst investors that the company is underestimating the local competition, primarily based in China. Shares of Cobalt International Energy, a U.S.-based offshore energy explorer, declined during the period due to disappointing well test results at the company's Lontra well off the coast of Angola. Higher gas content and lower oil content could mean that the asset will be less profitable than initially expected. Shares of Teradata, a U.S.-based provider of analytic data solutions, declined after management preannounced a revenue shortfall due to weak demand in emerging markets. Top absolute detractors also included SABESP (Utilities).
| 3 |
| Hartford Global Growth HLS Fund |
| Manager Discussion – (continued) |
| December 31, 2013 (Unaudited) |
Please note, derivatives are not used in a significant manner in this Fund and did not have a material impact on performance during the period.
What is the outlook?
Looking forward, we see signs of recovery and growth in Europe’s economy. We are looking for opportunities among European companies whose valuations do not yet appear to reflect the accelerating economic recovery. We have a generally favorable outlook for Japan, as Prime Minister Shinzo Abe’s policies begin to be implemented in an attempt to jumpstart the economy and stop the cycle of deflation with a focus on rising wages. In addition, Japan was also victorious in securing the 2020 Summer Olympics, which we believe may further stimulate development. We remain optimistic, but also are closely watching the effects of the slated consumption tax hike for April 1, 2014. In the aggregate, emerging markets continue to falter in our opinion. We have seen increasing cases of political unrest and market volatility. We believe as the U.S. dollar strengthens, emerging market currencies are weakening, causing inflation and creating a loss of purchasing power by consumers in these markets. This is one of the reasons we are underweight consumer staples as emerging markets consumption was one of their main growth drivers. Outside of specific stocks, we remain on the sidelines in emerging markets overall.
One exception is China, which concluded its Third Plenum proposing some potentially game-changing economic reforms, like the easing of the one child policy and a commitment to streamline the role of the government. If implemented, in time we believe these reforms might help sustain a high level of gross domestic product (GDP) growth. We are on the lookout for opportunities that may emerge based on actions taken.
Our focus remains on stock selection that is driven by bottom-up, fundamental research, diligent meetings with the managements of leading companies globally, and leveraging the deep research capabilities of our firm. As always, we invest in companies that we believe have improving fundamentals and catalysts that we think will lead to accelerating earnings growth above consensus expectations.
At the end of the period, the Fund’s largest overweights were to Financials, Information Technology, and Consumer Discretionary, while the Fund remained underweight to Consumer Staples, Industrials, and Materials, relative to the benchmark.
Diversification by Country
as of December 31, 2013
| Percentage of | ||||
| Country | Net Assets | |||
| Austria | 0.6 | % | ||
| Belgium | 1.5 | |||
| Canada | 0.6 | |||
| China | 1.7 | |||
| Denmark | 0.8 | |||
| France | 2.3 | |||
| Germany | 3.1 | |||
| Hong Kong | 2.5 | |||
| Ireland | 1.1 | |||
| Italy | 0.3 | |||
| Japan | 4.8 | |||
| Mexico | 0.6 | |||
| Netherlands | 1.0 | |||
| Sweden | 0.9 | |||
| Switzerland | 5.5 | |||
| Taiwan | 0.5 | |||
| United Kingdom | 5.3 | |||
| United States | 65.4 | |||
| Short-Term Investments | 0.9 | |||
| Other Assets and Liabilities | 0.6 | |||
| Total | 100.0 | % | ||
| 4 |
| Hartford Global Growth HLS Fund |
| Schedule of Investments |
| December 31, 2013 |
| (000’s Omitted) |
| Shares or Principal Amount | Market Value ╪ | |||||||
COMMON STOCKS - 97.1% | ||||||||
| Automobiles and Components - 0.5% | ||||||||
| 252 | Nissan Motor Co., Ltd. | $ | 2,115 | |||||
| Banks - 3.8% | ||||||||
| 582 | Barclays Bank plc ADR | 2,631 | ||||||
| 45 | BNP Paribas | 3,535 | ||||||
| 76 | Erste Group Bank AG | 2,632 | ||||||
| 417 | Mitsubishi UFJ Financial Group, Inc. | 2,769 | ||||||
| 46 | Ocwen Financial Corp. ● | 2,571 | ||||||
| 33 | PNC Financial Services Group, Inc. | 2,597 | ||||||
| 16,735 | ||||||||
| Capital Goods - 6.1% | ||||||||
| 18 | Boeing Co. | 2,395 | ||||||
| 27 | Honeywell International, Inc. | 2,472 | ||||||
| 450 | Mitsubishi Heavy Industries Ltd. | 2,787 | ||||||
| 21 | Parker-Hannifin Corp. | 2,638 | ||||||
| 134 | Rolls-Royce Holdings plc | 2,840 | ||||||
| 59 | Safran S.A. | 4,122 | ||||||
| 27 | Schneider Electric S.A. | 2,399 | ||||||
| 85 | SKF AB Class B | 2,234 | ||||||
| 10 | SMC Corp. of America | 2,429 | ||||||
| 28 | Wabco Holdings, Inc. ● | 2,606 | ||||||
| 26,922 | ||||||||
| Commercial and Professional Services - 1.3% | ||||||||
| 50 | Equifax, Inc. ● | 3,459 | ||||||
| 125 | Experian plc | 2,301 | ||||||
| 5,760 | ||||||||
| Consumer Durables and Apparel - 3.7% | ||||||||
| 19 | Adidas AG | 2,450 | ||||||
| 34 | Compagnie Financiere Richemont S.A. | 3,394 | ||||||
| 41 | Lululemon Athletica, Inc. ● | 2,432 | ||||||
| 62 | Pandora A/S | 3,379 | ||||||
| 169 | Prada S.p.A. | 1,507 | ||||||
| 150 | Pulte Group, Inc. | 3,065 | ||||||
| 16,227 | ||||||||
| Consumer Services - 5.4% | ||||||||
| 159 | Compass Group plc | 2,554 | ||||||
| 42 | Ctrip.com International Ltd. ADR ● | 2,094 | ||||||
| 133 | Galaxy Entertainment Group Ltd. ● | 1,196 | ||||||
| 111 | MGM Resorts International ● | 2,604 | ||||||
| 860 | Sands China Ltd. | 7,050 | ||||||
| 28 | Starbucks Corp. | 2,184 | ||||||
| 44 | Whitbread plc | 2,721 | ||||||
| 47 | Wyndham Worldwide Corp. | 3,459 | ||||||
| 23,862 | ||||||||
| Diversified Financials - 11.7% | ||||||||
| 13 | Affiliated Managers Group, Inc. ● | 2,746 | ||||||
| 65 | American Express Co. | 5,872 | ||||||
| 32 | Ameriprise Financial, Inc. | 3,703 | ||||||
| 17 | BlackRock, Inc. | 5,370 | ||||||
| 64 | Discover Financial Services, Inc. | 3,572 | ||||||
| 62 | Franklin Resources, Inc. | 3,554 | ||||||
| 23 | IntercontinentalExchange Group, Inc. | 5,226 | ||||||
| 61 | JP Morgan Chase & Co. | 3,551 | ||||||
| 114 | Julius Baer Group Ltd. | 5,490 | ||||||
| 47 | Moody's Corp. | 3,653 | ||||||
| 59 | Nasdaq OMX Group, Inc. | 2,363 | ||||||
| 12 | Partners Group | 3,131 | ||||||
| 95 | SEI Investments Co. | 3,282 | ||||||
| 51,513 | ||||||||
| Energy - 2.6% | ||||||||
| 25 | Anadarko Petroleum Corp. | 1,997 | ||||||
| 99 | Cobalt International Energy, Inc. ● | 1,635 | ||||||
| 14 | EOG Resources, Inc. | 2,274 | ||||||
| 50 | Halliburton Co. | 2,528 | ||||||
| 31 | Schlumberger Ltd. | 2,821 | ||||||
| 11,255 | ||||||||
| Food and Staples Retailing - 2.1% | ||||||||
| 93 | CVS Caremark Corp. | 6,687 | ||||||
| 64 | Seven & I Holdings Co., Ltd. | 2,546 | ||||||
| 9,233 | ||||||||
| Food, Beverage and Tobacco - 4.0% | ||||||||
| 38 | Anheuser-Busch InBev N.V. | 4,014 | ||||||
| 108 | Diageo Capital plc | 3,588 | ||||||
| 47 | Green Mountain Coffee Roasters, Inc. ● | 3,587 | ||||||
| 98 | Japan Tobacco, Inc. | 3,179 | ||||||
| 45 | Monster Beverage Corp. ● | 3,026 | ||||||
| 17,394 | ||||||||
| Health Care Equipment and Services - 1.5% | ||||||||
| 29 | Aetna, Inc. | 2,013 | ||||||
| 41 | Medtronic, Inc. | 2,347 | ||||||
| 24 | Zimmer Holdings, Inc. | 2,255 | ||||||
| 6,615 | ||||||||
| Insurance - 4.6% | ||||||||
| 37 | Aflac, Inc. | 2,472 | ||||||
| 578 | AIA Group Ltd. | 2,910 | ||||||
| 121 | American International Group, Inc. | 6,153 | ||||||
| 151 | Prudential plc | 3,384 | ||||||
| 251 | St. James's Place Capital plc | 3,030 | ||||||
| 67 | Tokio Marine Holdings, Inc. | 2,235 | ||||||
| 20,184 | ||||||||
| Materials - 1.7% | ||||||||
| 216 | Cemex S.A.B. de C.V. ADR ● | 2,554 | ||||||
| 31 | HeidelbergCement AG | 2,356 | ||||||
| 209 | James Hardie Industries plc | 2,430 | ||||||
| 7,340 | ||||||||
| Media - 5.5% | ||||||||
| 52 | Comcast Corp. Class A | 2,721 | ||||||
| 47 | DirecTV ● | 3,247 | ||||||
| 151 | Interpublic Group of Cos., Inc. | 2,671 | ||||||
| 33 | Scripps Networks Interactive Class A | 2,869 | ||||||
| 528 | Sirius XM Holdings, Inc. ● | 1,843 | ||||||
| 170 | Twenty-First Century Fox, Inc. | 5,975 | ||||||
| 34 | Walt Disney Co. | 2,626 | ||||||
| 108 | WPP plc | 2,479 | ||||||
| 24,431 | ||||||||
| Pharmaceuticals, Biotechnology and Life Sciences - 13.2% | ||||||||
| 27 | Actelion Ltd. | 2,304 | ||||||
| 36 | Amgen, Inc. | 4,153 | ||||||
| 15 | Biogen Idec, Inc. ● | 4,196 | ||||||
| 119 | Bristol-Myers Squibb Co. | 6,317 | ||||||
| 44 | Celgene Corp. ● | 7,423 | ||||||
| 133 | Gilead Sciences, Inc. ● | 10,024 | ||||||
| 60 | Merck & Co., Inc. | 2,981 | ||||||
| 58 | Mylan, Inc. ● | 2,534 | ||||||
| 11 | Regeneron Pharmaceuticals, Inc. ● | 2,954 | ||||||
| 35 | Roche Holding AG | 9,935 | ||||||
| 36 | UCB S.A. | 2,693 | ||||||
| 33 | Vertex Pharmaceuticals, Inc. ● | 2,448 | ||||||
| 57,962 | ||||||||
The accompanying notes are an integral part of these financial statements.
| 5 |
| Hartford Global Growth HLS Fund |
| Schedule of Investments – (continued) |
| December 31, 2013 |
| (000’s Omitted) |
| Shares or Principal Amount | Market Value ╪ | |||||||
COMMON STOCKS - 97.1% - (continued) | ||||||||
| Real Estate - 0.6% | ||||||||
| 31 | American Tower Corp. REIT | $ | 2,460 | |||||
| Retailing - 4.9% | ||||||||
| 6 | Amazon.com, Inc. ● | 2,409 | ||||||
| 45 | GameStop Corp. Class A | 2,215 | ||||||
| 141 | Lowe's Cos., Inc. | 6,988 | ||||||
| 33 | PetSmart, Inc. | 2,415 | ||||||
| 7 | Priceline.com, Inc. ● | 7,608 | ||||||
| 21,635 | ||||||||
| Semiconductors and Semiconductor Equipment - 2.7% | ||||||||
| 47 | ASML Holding N.V. | 4,402 | ||||||
| 242 | Infineon Technologies AG | 2,580 | ||||||
| 139 | MediaTek, Inc. | 2,065 | ||||||
| 122 | Micron Technology, Inc. ● | 2,653 | ||||||
| 11,700 | ||||||||
| Software and Services - 15.9% | ||||||||
| 46 | Accenture plc | 3,772 | ||||||
| 139 | Activision Blizzard, Inc. | 2,481 | ||||||
| 55 | Akamai Technologies, Inc. ● | 2,586 | ||||||
| 11 | Alliance Data Systems Corp. ● | 2,923 | ||||||
| 54 | Amdocs Ltd. | 2,243 | ||||||
| 41 | Automatic Data Processing, Inc. | 3,328 | ||||||
| 32 | Cognizant Technology Solutions Corp. ● | 3,188 | ||||||
| 118 | eBay, Inc. ● | 6,485 | ||||||
| 60 | Facebook, Inc. ● | 3,257 | ||||||
| 127 | Genpact Ltd. ● | 2,334 | ||||||
| 11 | Google, Inc. ● | 12,226 | ||||||
| 11 | LinkedIn Corp. Class A ● | 2,400 | ||||||
| 6 | Mastercard, Inc. | 4,811 | ||||||
| 42 | Salesforce.com, Inc. ● | 2,310 | ||||||
| 23 | Splunk, Inc. ● | 1,575 | ||||||
| 43 | Tencent Holdings Ltd. | 2,734 | ||||||
| 93 | Vantiv, Inc. ● | 3,041 | ||||||
| 23 | Visa, Inc. | 5,039 | ||||||
| 80 | Yahoo!, Inc. ● | 3,232 | ||||||
| 69,965 | ||||||||
| Technology Hardware and Equipment - 3.6% | ||||||||
| 4 | Apple, Inc. | 2,143 | ||||||
| 433 | Hitachi Ltd. | 3,282 | ||||||
| 102 | Juniper Networks, Inc. ● | 2,301 | ||||||
| 2,240 | Lenovo Group Ltd. | 2,731 | ||||||
| 51 | Qualcomm, Inc. | 3,787 | ||||||
| 149 | Telefonaktiebolaget LM Ericsson Class B | 1,823 | ||||||
| 16,067 | ||||||||
| Telecommunication Services - 0.7% | ||||||||
| 94 | T-Mobile US, Inc. | 3,173 | ||||||
| Transportation - 1.0% | ||||||||
| 77 | Delta Air Lines, Inc. | 2,122 | ||||||
| 17 | FedEx Corp. | 2,480 | ||||||
| 4,602 | ||||||||
| Total common stocks | ||||||||
| (cost $303,861) | $ | 427,150 | ||||||
PREFERRED STOCKS - 1.4% | ||||||||
| Automobiles and Components - 0.7% | ||||||||
| 10 | Volkswagen AG N.V. | $ | 2,934 | |||||
| Media - 0.7% | ||||||||
| 64 | ProSieben Sat.1 Media AG | 3,197 | ||||||
| Total preferred stocks | ||||||||
| (cost $4,675) | $ | 6,131 | ||||||
| Total long-term investments | ||||||||
| (cost $308,536) | $ | 433,281 | ||||||
SHORT-TERM INVESTMENTS - 0.9% | ||||||||
Repurchase Agreements - 0.9% | ||||||||
| Bank of America Merrill Lynch TriParty Repurchase Agreement (maturing on 01/02/2014 in the amount of $196, collateralized by GNMA 4.00%, 2043, value of $200) | ||||||||
| $ | 196 | 0.005%, 12/31/2013 | $ | 196 | ||||
| Bank of Montreal TriParty Repurchase Agreement (maturing on 01/02/2014 in the amount of $188, collateralized by FNMA 1.58% - 4.50%, 2020 - 2043, U.S. Treasury Note 0.25% - 4.00%, 2015 - 2020, value of $192) | ||||||||
| 188 | 0.01%, 12/31/2013 | 188 | ||||||
| Bank of Montreal TriParty Repurchase Agreement (maturing on 01/02/2014 in the amount of $666, collateralized by FHLMC 3.00% - 5.00%, 2019 - 2043, FNMA 0.76% - 6.00%, 2016 - 2043, GNMA 1.50% - 5.25%, 2028 - 2043, value of $679) | ||||||||
| 666 | 0.02%, 12/31/2013 | 666 | ||||||
| Barclays Capital TriParty Repurchase Agreement (maturing on 01/02/2014 in the amount of $601, collateralized by U.S. Treasury Note 0.50% - 2.25%, 2017, value of $613) | ||||||||
| 601 | 0.01%, 12/31/2013 | 601 | ||||||
| Citigroup Global Markets, Inc. TriParty Repurchase Agreement (maturing on 01/02/2014 in the amount of $1,081, collateralized by U.S. Treasury Bond 3.88% - 8.13%, 2021 - 2040, U.S. Treasury Note 0.25% - 3.38%, 2014 - 2020, value of $1,103) | ||||||||
| 1,081 | 0.01%, 12/31/2013 | 1,081 | ||||||
| RBS Securities, Inc. TriParty Repurchase Agreement (maturing on 01/02/2014 in the amount of $351, collateralized by U.S. Treasury Note 0.25% - 1.00%, 2015 - 2017, value of $358) | ||||||||
| 351 | 0.01%, 12/31/2013 | 351 | ||||||
| TD Securities TriParty Repurchase Agreement (maturing on 01/02/2014 in the amount of $843, collateralized by FFCB 0.20% - 0.50%, 2015 - 2016, FHLMC 0.38% - 5.25%, 2014 - 2042, FNMA 0.50% - 7.13%, 2014 - 2043, value of $860) | ||||||||
| 843 | 0.01%, 12/31/2013 | 843 | ||||||
The accompanying notes are an integral part of these financial statements.
| 6 |
| Shares or Principal Amount | Market Value ╪ | |||||||||||
| SHORT-TERM INVESTMENTS - 0.9% - (continued) | ||||||||||||
| Repurchase Agreements - 0.9% - (continued) | ||||||||||||
| UBS Securities, Inc. Repurchase Agreement (maturing on 01/02/2014 in the amount of $7, collateralized by U.S. Treasury Note 2.13%, 2015, value of $7) | ||||||||||||
| $ | 7 | 0.01%, 12/31/2013 | $ | 7 | ||||||||
| 3,933 | ||||||||||||
| Total short-term investments | ||||||||||||
| (cost $3,933) | $ | 3,933 | ||||||||||
| Total investments | ||||||||||||
| (cost $312,469) ▲ | 99.4 | % | $ | 437,214 | ||||||||
| Other assets and liabilities | 0.6 | % | 2,695 | |||||||||
| Total net assets | 100.0 | % | $ | 439,909 | ||||||||
| Note: | Percentage of investments as shown is the ratio of the total market value to total net assets. |
Prices of foreign equities that are principally traded on certain foreign markets may be adjusted daily pursuant to a fair value pricing service approved by the Board of Directors in order to reflect an adjustment for factors occurring after the close of certain foreign markets but before the close of the New York Stock Exchange.
| ▲ | At December 31, 2013, the cost of securities for federal income tax purposes was $313,512 and the aggregate gross unrealized appreciation and depreciation based on that cost were: |
| Unrealized Appreciation | $ | 126,716 | ||
| Unrealized Depreciation | (3,014 | ) | ||
| Net Unrealized Appreciation | $ | 123,702 |
| ● | Non-income producing. |
Foreign Currency Contracts Outstanding at December 31, 2013
| Currency | Buy / Sell | Delivery Date | Counterparty | Contract Amount | Market Value ╪ | Unrealized Appreciation/ (Depreciation) | ||||||||||||
| AUD | Sell | 01/06/2014 | JPM | $ | 36 | $ | 36 | $ | – | |||||||||
| CHF | Sell | 01/06/2014 | GSC | 102 | 101 | 1 | ||||||||||||
| EUR | Sell | 01/03/2014 | GSC | 275 | 274 | 1 | ||||||||||||
| EUR | Sell | 01/07/2014 | GSC | 39 | 39 | – | ||||||||||||
| GBP | Sell | 01/02/2014 | BCLY | 425 | 426 | (1 | ) | |||||||||||
| GBP | Sell | 01/03/2014 | GSC | 127 | 127 | – | ||||||||||||
| HKD | Sell | 01/03/2014 | BCLY | 134 | 134 | – | ||||||||||||
| SEK | Sell | 01/07/2014 | GSC | 59 | 59 | – | ||||||||||||
| $ | 1 | |||||||||||||||||
| ╪ | See Significant Accounting Policies of accompanying Notes to Financial Statements regarding valuation of securities. |
The accompanying notes are an integral part of these financial statements.
| 7 |
| Hartford Global Growth HLS Fund |
| Schedule of Investments – (continued) |
| December 31, 2013 |
| (000’s Omitted) |
| GLOSSARY: (abbreviations used in preceding Schedule of Investments) | ||
| Counterparty Abbreviations: | ||
| BCLY | Barclays | |
| GSC | Goldman Sachs & Co. | |
| JPM | JP Morgan Chase & Co. | |
| Currency Abbreviations: | ||
| AUD | Australian Dollar | |
| CHF | Swiss Franc | |
| EUR | EURO | |
| GBP | British Pound | |
| HKD | Hong Kong Dollar | |
| SEK | Swedish Krona | |
| Other Abbreviations: | ||
| ADR | American Depositary Receipt | |
| FFCB | Federal Farm Credit Bank | |
| FHLMC | Federal Home Loan Mortgage Corp. | |
| FNMA | Federal National Mortgage Association | |
| GNMA | Government National Mortgage Association | |
| REIT | Real Estate Investment Trust | |
The accompanying notes are an integral part of these financial statements.
| 8 |
| Hartford Global Growth HLS Fund |
| Investment Valuation Hierarchy Level Summary |
| December 31, 2013 |
| (000’s Omitted) |
| Total | Level 1 ♦ | Level 2 ♦ | Level 3 | |||||||||||||
| Assets: | ||||||||||||||||
| Common Stocks | ||||||||||||||||
| Automobiles and Components | $ | 2,115 | $ | – | $ | 2,115 | $ | – | ||||||||
| Banks | 16,735 | 5,168 | 11,567 | – | ||||||||||||
| Capital Goods | 26,922 | 10,111 | 16,811 | – | ||||||||||||
| Commercial and Professional Services | 5,760 | 3,459 | 2,301 | – | ||||||||||||
| Consumer Durables and Apparel | 16,227 | 5,497 | 10,730 | – | ||||||||||||
| Consumer Services | 23,862 | 10,341 | 13,521 | – | ||||||||||||
| Diversified Financials | 51,513 | 46,023 | 5,490 | – | ||||||||||||
| Energy | 11,255 | 11,255 | – | – | ||||||||||||
| Food and Staples Retailing | 9,233 | 6,687 | 2,546 | – | ||||||||||||
| Food, Beverage and Tobacco | 17,394 | 6,613 | 10,781 | – | ||||||||||||
| Health Care Equipment and Services | 6,615 | 6,615 | – | – | ||||||||||||
| Insurance | 20,184 | 8,625 | 11,559 | – | ||||||||||||
| Materials | 7,340 | 2,554 | 4,786 | – | ||||||||||||
| Media | 24,431 | 21,952 | 2,479 | – | ||||||||||||
| Pharmaceuticals, Biotechnology and Life Sciences | 57,962 | 43,030 | 14,932 | – | ||||||||||||
| Real Estate | 2,460 | 2,460 | – | – | ||||||||||||
| Retailing | 21,635 | 21,635 | – | – | ||||||||||||
| Semiconductors and Semiconductor Equipment | 11,700 | 2,653 | 9,047 | – | ||||||||||||
| Software and Services | 69,965 | 67,231 | 2,734 | – | ||||||||||||
| Technology Hardware and Equipment | 16,067 | 8,231 | 7,836 | – | ||||||||||||
| Telecommunication Services | 3,173 | 3,173 | – | – | ||||||||||||
| Transportation | 4,602 | 4,602 | – | – | ||||||||||||
| Total | 427,150 | 297,915 | 129,235 | – | ||||||||||||
| Preferred Stocks | 6,131 | – | 6,131 | – | ||||||||||||
| Short-Term Investments | 3,933 | – | 3,933 | – | ||||||||||||
| Total | $ | 437,214 | $ | 297,915 | $ | 139,299 | $ | – | ||||||||
| Foreign Currency Contracts* | 2 | – | 2 | – | ||||||||||||
| Total | $ | 2 | $ | – | $ | 2 | $ | – | ||||||||
| Liabilities: | ||||||||||||||||
| Foreign Currency Contracts* | 1 | – | 1 | – | ||||||||||||
| Total | $ | 1 | $ | – | $ | 1 | $ | – | ||||||||
| ♦ | For the year ended December 31, 2013, investments valued at $5,050 were transferred from Level 2 to Level 1, and there were no transfers from Level 1 to Level 2. Investments are transferred between Level 1 and Level 2 for a variety of reasons including, but not limited to: |
| 1) | Foreign equities for which a fair value price is more representative of exit value than the local market close (transfer into Level 2). Foreign equities for which the local market close is more representative of exit value (transfer into Level 1). |
| 2) | U.S. Treasury securities that no longer represent the most recent issue (transfer into Level 2). |
| 3) | Equity investments with no observable trading but a bid or close price is used (transfer into Level 2). Equity investments using observable quoted prices in an active market (transfer into Level 1). |
| * | Derivative instruments (excluding purchased and written options, if applicable) are valued at the unrealized appreciation/depreciation on the investments. |
| Note: | For purposes of reporting transfers between different hierarchy levels, both transfers in and out of each level, as applicable, are shown as if they occurred at the beginning of the period. |
The accompanying notes are an integral part of these financial statements.
| 9 |
| Hartford Global Growth HLS Fund |
| Statement of Assets and Liabilities |
| December 31, 2013 |
| (000’s Omitted) |
| Assets: | ||||
| Investments in securities, at market value (cost $312,469) | $ | 437,214 | ||
| Cash | — | |||
| Foreign currency on deposit with custodian (cost $—) | — | |||
| Unrealized appreciation on foreign currency contracts | 2 | |||
| Receivables: | ||||
| Investment securities sold | 3,083 | |||
| Fund shares sold | — | |||
| Dividends and interest | 452 | |||
| Total assets | 440,751 | |||
| Liabilities: | ||||
| Unrealized depreciation on foreign currency contracts | 1 | |||
| Payables: | ||||
| Investment securities purchased | 256 | |||
| Fund shares redeemed | 442 | |||
| Investment management fees | 72 | |||
| Distribution fees | 4 | |||
| Accrued expenses | 67 | |||
| Total liabilities | 842 | |||
| Net assets | $ | 439,909 | ||
| Summary of Net Assets: | ||||
| Capital stock and paid-in-capital | $ | 372,922 | ||
| Undistributed net investment income | 2,048 | |||
| Accumulated net realized loss | (59,816 | ) | ||
| Unrealized appreciation of investments and the translations of assets and liabilities denominated in foreign currency | 124,755 | |||
| Net assets | $ | 439,909 | ||
| Shares authorized | 3,400,000 | |||
| Par value | $ | 0.001 | ||
| Class IA: Net asset value per share | $ | 22.33 | ||
| Shares outstanding | 16,129 | |||
| Net assets | $ | 360,086 | ||
| Class IB: Net asset value per share | $ | 22.16 | ||
| Shares outstanding | 3,602 | |||
| Net assets | $ | 79,823 |
The accompanying notes are an integral part of these financial statements.
| 10 |
| Hartford Global Growth HLS Fund |
| Statement of Operations |
| For the Year Ended December 31, 2013 |
| (000’s Omitted) |
| Investment Income: | ||||
| Dividends | $ | 6,189 | ||
| Interest | 4 | |||
| Less: Foreign tax withheld | (445 | ) | ||
| Total investment income, net | 5,748 | |||
| Expenses: | ||||
| Investment management fees | 3,144 | |||
| Transfer agent fees | 1 | |||
| Distribution fees - Class IB | 196 | |||
| Custodian fees | 20 | |||
| Accounting services fees | 58 | |||
| Board of Directors' fees | 11 | |||
| Audit fees | 17 | |||
| Other expenses | 160 | |||
| Total expenses (before fees paid indirectly) | 3,607 | |||
| Commission recapture | (12 | ) | ||
| Custodian fee offset | — | |||
| Total fees paid indirectly | (12 | ) | ||
| Total expenses, net | 3,595 | |||
| Net Investment Income | 2,153 | |||
| Net Realized Gain on Investments and Foreign Currency Transactions: | ||||
| Net realized gain on investments | 64,310 | |||
| Net realized loss on foreign currency contracts | (57 | ) | ||
| Net realized loss on other foreign currency transactions | (13 | ) | ||
| Net Realized Gain on Investments and Foreign Currency Transactions | 64,240 | |||
| Net Changes in Unrealized Appreciation of Investments and Foreign Currency Transactions: | ||||
| Net unrealized appreciation of investments | 62,254 | |||
| Net unrealized appreciation of foreign currency contracts | 1 | |||
| Net unrealized depreciation on translation of other assets and liabilities in foreign currencies | (6 | ) | ||
| Net Changes in Unrealized Appreciation of Investments and Foreign Currency Transactions | 62,249 | |||
| Net Gain on Investments and Foreign Currency Transactions | 126,489 | |||
| Net Increase in Net Assets Resulting from Operations | $ | 128,642 |
The accompanying notes are an integral part of these financial statements.
| 11 |
| Hartford Global Growth HLS Fund |
| Statement of Changes in Net Assets |
| (000’s Omitted) |
| For the Year Ended December 31, 2013 | For the Year Ended December 31, 2012 | |||||||
| Operations: | ||||||||
| Net investment income | $ | 2,153 | $ | 3,002 | ||||
| Net realized gain on investments and foreign currency transactions | 64,240 | 53,493 | ||||||
| Net unrealized appreciation of investments and foreign currency transactions | 62,249 | 36,058 | ||||||
| Net Increase in Net Assets Resulting from Operations | 128,642 | 92,553 | ||||||
| Distributions to Shareholders: | ||||||||
| From net investment income | ||||||||
| Class IA | (2,480 | ) | (2,003 | ) | ||||
| Class IB | (371 | ) | (201 | ) | ||||
| Total distributions | (2,851 | ) | (2,204 | ) | ||||
| Capital Share Transactions: | ||||||||
| Class IA | ||||||||
| Sold | 16,538 | 18,835 | ||||||
| Issued on reinvestment of distributions | 2,480 | 2,003 | ||||||
| Redeemed | (82,410 | ) | (125,314 | ) | ||||
| Total capital share transactions | (63,392 | ) | (104,476 | ) | ||||
| Class IB | ||||||||
| Sold | 8,653 | 8,583 | ||||||
| Issued on reinvestment of distributions | 371 | 201 | ||||||
| Redeemed | (30,109 | ) | (31,213 | ) | ||||
| Total capital share transactions | (21,085 | ) | (22,429 | ) | ||||
| Net decrease from capital share transactions | (84,477 | ) | (126,905 | ) | ||||
| Net Increase (Decrease) in Net Assets | 41,314 | (36,556 | ) | |||||
| Net Assets: | ||||||||
| Beginning of period | 398,595 | 435,151 | ||||||
| End of period | $ | 439,909 | $ | 398,595 | ||||
| Undistributed (distribution in excess of) | ||||||||
| net investment income | $ | 2,048 | $ | 2,850 | ||||
| Shares: | ||||||||
| Class IA | ||||||||
| Sold | 869 | 1,247 | ||||||
| Issued on reinvestment of distributions | 125 | 129 | ||||||
| Redeemed | (4,338 | ) | (8,150 | ) | ||||
| Total share activity | (3,344 | ) | (6,774 | ) | ||||
| Class IB | ||||||||
| Sold | 458 | 574 | ||||||
| Issued on reinvestment of distributions | 19 | 13 | ||||||
| Redeemed | (1,589 | ) | (2,035 | ) | ||||
| Total share activity | (1,112 | ) | (1,448 | ) | ||||
The accompanying notes are an integral part of these financial statements.
| 12 |
| Hartford Global Growth HLS Fund |
| Notes to Financial Statements |
| December 31, 2013 |
| (000’s Omitted) |
| 1. | Organization: |
Hartford Global Growth HLS Fund (the “Fund”) serves as an underlying investment option for certain variable annuity and variable life insurance separate accounts of Hartford Life Insurance Company (“HLIC”) and its affiliates and certain qualified retirement plans. The Fund may also serve as an underlying investment option for certain variable annuity and variable life separate accounts of other insurance companies. Owners of variable annuity contracts and policyholders of variable life insurance contracts may choose the funds permitted in the variable insurance contract prospectus. In addition, participants in certain qualified retirement plans may choose the Fund if permitted by their plans.
Hartford Series Fund, Inc. (the “Company”) is an open-end registered management investment company comprised of thirty portfolios. Financial statements for the Fund, a series of the Company, are included in this report.
The Company is organized under the laws of the State of Maryland and is registered with the Securities and Exchange Commission (“SEC”) under the Investment Company Act of 1940, as amended (“1940 Act”). The Fund’s portfolio managers are Matthew D. Hudson (51.62%) and John A. Boselli (48.38%). The Fund is a diversified open-end management investment company.
The Fund is divided into Class IA and Class IB shares. Each class is offered at the per share net asset value (“NAV”) without a sales charge and is subject to the same expenses, except that the Class IB shares are subject to distribution and service fees charged pursuant to a Distribution Plan adopted in accordance with Rule 12b-1 under the 1940 Act.
| 2. | Significant Accounting Policies: |
The following is a summary of significant accounting policies of the Fund in the preparation of its financial statements, which are in accordance with United States Generally Accepted Accounting Principles (“U.S. GAAP”). The preparation of financial statements in accordance with U.S. GAAP may require management to make estimates and assumptions that affect the reported amounts of assets and liabilities and disclosure of contingent assets and liabilities at the date of the financial statements and the reported amounts of increases and decreases in net assets from operations during the reporting period. Actual results could differ from those estimates.
| a) | Determination of Net Asset Value – The NAV of each class of the Fund’s shares is determined as of the close of regular trading (normally 4:00 p.m. Eastern Time) (the “NYSE Close”) on each day that the New York Stock Exchange (the “Exchange”) is open (“Valuation Date”). Information that becomes known to the Fund after the NAV has been calculated on a particular day will not generally be used to retroactively adjust the NAV determined earlier that day. |
| b) | Investment Valuation and Fair Value Measurements – For purposes of calculating the NAV, portfolio investments and other assets held by the Fund's portfolio for which market quotes are readily available are valued at market value. Market value is generally determined on the basis of last reported sales prices or official close price. If no sales are reported, market value is based on quotes obtained from a quotation reporting system, established market makers, or independent pricing services. If market prices are not readily available or are deemed unreliable, the Fund will use the fair value of the investment as determined in good faith under policies and procedures established by and under the supervision of the Company’s Board of Directors. Market quotes are considered not readily available where there is an absence of current or reliable market-based data (e.g., trade information or indicative market quotes), including where events occur after the close of the relevant market, but prior to the NYSE Close, that materially affect the values of the Fund’s portfolio investments or assets. In addition, market quotes are considered not readily available when, due to extraordinary circumstances, the exchanges or markets on which the investments trade do not open for trading for the entire day and no other market prices are available. In addition, prices of foreign equities that are principally traded on certain foreign markets may be adjusted daily pursuant to a fair value pricing service approved by the Board of Directors in order to reflect an adjustment for the factors occurring after the close of certain foreign markets but before the NYSE Close. Investments that are primarily traded on foreign markets may trade on days that are not business days of the Fund. The |
| 13 |
| Hartford Global Growth HLS Fund |
| Notes to Financial Statements – (continued) |
| December 31, 2013 |
| (000’s Omitted) |
value of the foreign investments in which the Fund invests may change on days when a shareholder will not be able to purchase or redeem shares of the Fund. Fair value pricing is subjective in nature and the use of fair value pricing by the Fund may cause the NAV of its shares to differ significantly from the NAV that would have been calculated using market prices at the close of the exchange on which a portfolio investment is primarily traded. There can be no assurance that the Fund could obtain the fair market value assigned to an investment if the Fund were to sell the investment at approximately the time at which the Fund determines its NAV.
Investments valued in currencies other than U.S. dollars are converted to U.S. dollars using exchange rates obtained from independent pricing services for calculation of the NAV. As a result, the NAV of the Fund’s shares may be affected by changes in the value of currencies in relation to the U.S. dollar. The value of investments traded in markets outside the United States or denominated in currencies other than the U.S. dollar may be affected significantly on a day that the NYSE is closed and the market value may change on days when an investor is not able to purchase, redeem or exchange shares of the Fund.
Foreign currency contracts represent agreements to exchange currencies on specific future dates at predetermined rates. Foreign currency contracts are valued using foreign currency exchange rates and forward rates as provided by an independent pricing service on the Valuation Date.
Financial instruments for which prices are not available from an independent pricing service may be valued using market quotations obtained from one or more dealers that make markets in the respective financial instrument in accordance with procedures established by the Company’s Board of Directors.
U.S. GAAP defines fair value as the price that the Fund would receive to sell an asset or pay to transfer a liability in an orderly transaction between market participants. The U.S. GAAP fair value measurement standards require disclosure of a fair value hierarchy for each major category of assets and liabilities. Various inputs are used in determining the fair value of the Fund’s investments. These inputs are summarized into three broad hierarchy levels. This hierarchy is based on whether the valuation inputs are observable or unobservable. These levels are:
| · | Level 1 – Quoted prices in active markets for identical investments. Level 1 may include exchange traded instruments, such as domestic equities, some foreign equities, options, futures, mutual funds, exchange traded funds, rights and warrants. |
| · | Level 2 – Observable inputs other than Level 1 prices, such as quoted prices for similar investments; quoted prices in markets that are not active; or other inputs that are observable or can be corroborated by observable market data. Level 2 may include debt investments that are traded less frequently than exchange traded instruments and which are valued using independent pricing services; foreign equities, which are principally traded on certain foreign markets and are adjusted daily pursuant to a fair value pricing service in order to reflect an adjustment for the factors occurring after the close of certain foreign markets but before the NYSE Close; senior floating rate interests, which are valued using an aggregate of dealer bids; short-term investments, which are valued at amortized cost; and swaps, which are valued based upon the terms of each swap contract. |
| · | Level 3 – Significant unobservable inputs that are supported by limited or no market activity. Level 3 may include financial instruments whose values are determined using indicative market quotes or require significant management judgment or estimation. These unobservable valuation inputs may include estimates for current yields, maturity/duration, prepayment speed, and indicative market quotes for comparable investments along with other assumptions relating to credit quality, collateral value, complexity of the investment structure, general market conditions and liquidity. This category may include investments where trading has been halted or there are certain restrictions on trading. While these investments are priced using unobservable inputs, the valuation of these investments reflects the best available data and management believes the prices are a reasonable representation of exit price. |
The Board of Directors of the Company generally reviews and approves the “Procedures for Valuation of Portfolio Securities” on an annual basis. These procedures define how investments are to be valued, including
| 14 |
the formation and activities of a Valuation Committee. The Valuation Committee is responsible for determining in good faith the fair value of investments when the value cannot be obtained from primary pricing services or alternative sources or if the valuation of an investment as provided by the primary pricing service or alternative source is believed not to reflect the investment’s fair value as of the Valuation Date. Voting members of the Valuation Committee include the Fund’s Treasurer or designee and a Vice President of the investment manager or designee. An Assistant Vice President of the Fund with legal expertise or designee is also included on the Valuation Committee as a non-voting advisory member. In addition, the Fund’s Chief Compliance Officer shall designate a member of the compliance group to attend Valuation Committee meetings as a non-voting resource, to monitor for and provide guidance with respect to compliance with these procedures. Two members of the Valuation Committee or their designees, representing different departments, shall constitute a quorum for purposes of permitting the Valuation Committee to take action. The Valuation Committee will consider all relevant factors in determining an investment’s fair value, and may seek the advice of the Fund’s sub-adviser, knowledgeable brokers, and legal counsel in making such determination. The Valuation Committee reports to the Audit Committee of the Company’s Board of Directors. The Audit Committee receives quarterly written reports which include details of all fair-valued investments, including the reason for the fair valuation, and an indication, when possible, of the accuracy of the valuation by disclosing the next available reliable public price quotation or the disposition price of such investments (the “look-back” test). The Board of Directors then must consider for ratification all of the fair value determinations made during the previous quarter.
Valuation levels are not necessarily indicative of the risk associated with investing in such investments. Individual investments within any of the above mentioned asset classes may be assigned a different hierarchical level than those presented above, as individual circumstances dictate.
For additional information, refer to the Investment Valuation Hierarchy Level Summary and the Level 3 roll-forward reconciliation, if applicable, which follow the Schedule of Investments.
| c) | Investment Transactions and Investment Income – Investment transactions are recorded as of the trade date (the date the order to buy or sell is executed) for financial reporting purposes. Investments purchased or sold on a when-issued or delayed-delivery basis may be settled a month or more after the trade date. Realized gains and losses are determined on the basis of identified cost. |
Dividend income from domestic securities is accrued on the ex-dividend date. In general, dividend income from foreign securities is recorded on the ex-date; however, dividend notifications in certain foreign jurisdictions may not be available in a timely manner and as a result, the Fund will record the dividend as soon as the relevant details (i.e., rate per share, payment date, shareholders of record, etc.) are publicly available. Interest income, including amortization of premium, accretion of discounts and additional principal received in-kind in lieu of cash, is accrued on a daily basis.
| d) | Foreign Currency Transactions – Assets and liabilities denominated in currencies other than U.S. dollars are translated into U.S. dollars at the exchange rates in effect on the valuation date. Purchases and sales of investments, income and expenses are translated into U.S. dollars at the exchange rates on the dates of such transactions. |
The Fund does not isolate that portion of portfolio investment valuation resulting from fluctuations in the foreign currency exchange rates from the fluctuations arising from changes in the market prices of investments held. Exchange rate fluctuations are included with the net realized and unrealized gain or loss on investments in the accompanying financial statements.
Net realized foreign exchange gains or losses arise from sales of foreign currencies and the difference between asset and liability amounts initially stated in foreign currencies and the U.S. dollar value of the amounts actually received or paid. Net unrealized foreign exchange gains or losses arise from changes in the value of other assets and liabilities at the end of the reporting period, resulting from changes in the exchange rates.
| 15 |
| Hartford Global Growth HLS Fund |
| Notes to Financial Statements – (continued) |
| December 31, 2013 |
| (000’s Omitted) |
| e) | Joint Trading Account – The Fund may invest cash balances into a joint trading account that may be invested in one or more repurchase agreements. |
| f) | Fund Share Valuation and Dividend Distributions to Shareholders – Orders for the Fund’s shares are executed in accordance with the investment instructions of the contract holders and plan participants. The NAV of the Fund’s shares is determined as of the close of business on each business day of the Exchange. The NAV is determined separately for each class of shares of the Fund by dividing the Fund’s net assets attributable to that class by the number of shares of the class outstanding. Each class of shares offered by the Fund has equal rights as to assets and voting privileges (except that shareholders of a class have exclusive voting rights regarding any matter relating solely to that class of shares). Income and non-class specific expenses are allocated daily to each class on the basis of the relative net assets of the class. Realized and unrealized gains and losses are allocated daily based on the relative net assets of each class of shares of the Fund. |
Orders for the purchase of the Fund’s shares received prior to the close of the Exchange on any day the Exchange is open for business are priced at the NAV determined as of the close of the Exchange. Orders received after the close of the Exchange, or on a day on which the Exchange and/or the Fund is not open for business, are priced at the next determined NAV.
Dividends are declared pursuant to a policy adopted by the Company’s Board of Directors based upon the investment performance of the Fund. The policy of the Fund is to pay dividends from net investment income and realized gains, if any, at least once a year.
Distributions from net investment income, net realized gains and capital are determined in accordance with federal income tax regulations, which may differ from U.S. GAAP with respect to character and timing. These differences may include, but are not limited to, losses deferred due to wash sale adjustments, foreign currency gains and losses, adjustments related to Passive Foreign Investment Companies (“PFICs”), Real Estate Investment Trusts (“REITs”), Regulated Investment Companies (“RICs”), certain derivatives and partnerships. Permanent book and federal income tax basis differences relating to shareholder distributions will result in reclassifications to certain of the Fund’s capital accounts (see Federal Income Taxes: Reclassification of Capital Accounts note).
| 3. | Securities and Other Investments: |
| a) | Repurchase Agreements – A repurchase agreement is an agreement by which a counterparty agrees to sell an investment and agrees to repurchase the investment sold from the buyer at a mutually agreed upon time and price. During the period of the repurchase agreement, the counterparty will deposit cash and or securities in a third party custodial account to serve as collateral. At the time the Fund enters into a repurchase agreement, the value of the underlying collateral, including accrued interest, will be equal to or exceed the value of the repurchase agreement. Repurchase agreements expose the Fund to counterparty risk - that is, the risk that the counterparty will not fulfill its obligations. To minimize counterparty risk, the investments that serve to collateralize the repurchase agreement are held by the Fund’s custodian in book entry or physical form in the custodial account of the Fund or in a third party custodial account. Repurchase agreements are valued at cost plus accrued interest, which approximates fair value. Repurchase agreements have master netting arrangements which allow the Fund to offset amounts owed to a counterparty with amounts owed by the counterparty, including any collateral. Upon an event of default under a master repurchase agreement, the non-defaulting party may close out all transactions traded under such agreement and net amounts owed under each transaction to one net amount payable by one party to the other. Absent an event of default, the master repurchase agreement does not result in an offset of reported amounts of assets and liabilities in the Statement of Assets and Liabilities across transactions between the Fund and the applicable counterparty. The Fund, as shown on the Schedule of Investments, had outstanding repurchase agreements and related collateral as of December 31, 2013. |
| b) | Investments Purchased on a When-Issued or Delayed-Delivery Basis – Delivery and payment for investments that have been purchased by the Fund on a forward commitment, or when-issued or delayed-delivery basis, take place beyond the |
| 16 |
customary settlement period. The Fund may dispose of or renegotiate a delayed-delivery transaction after it is entered into, and may sell delayed-delivery investments before they are delivered, which may result in a realized gain or loss. During this period, such investments are subject to market fluctuations, and the Fund identifies investments segregated in its records with a value at least equal to the amount of the commitment. As of December 31, 2013, the Fund had no outstanding when-issued or delayed-delivery investments.
| 4. | Financial Derivative Instruments: |
The following disclosures contain information on how and why the Fund uses derivative instruments, the credit-risk-related contingent features in certain derivative instruments, and how derivative instruments affect the Fund’s financial position and results of operations. The location and fair value amounts of these instruments on the Statement of Assets and Liabilities and the realized gains and losses and changes in unrealized gains and losses on the Statement of Operations, each categorized by type of derivative contract, are included in the following Additional Derivative Instrument Information footnote. The derivative instruments outstanding as of year-end are disclosed in the notes to or within the Schedule of Investments for purchased options, if applicable. The amounts of realized gains and losses and changes in unrealized gains and losses on derivative instruments during the year are disclosed in the Statement of Operations.
| a) | Foreign Currency Contracts – The Fund may enter into foreign currency contracts that obligate the Fund to purchase or sell currencies at specified future dates. Foreign currency contracts are used to hedge the currency exposure associated with some or all of the Fund’s investments and/or as part of an investment strategy. Foreign currency contracts are marked to market daily and the change in value is recorded by the Fund as an unrealized gain or loss. The Fund will record a realized gain or loss when the foreign currency contract is settled. |
Foreign currency contracts involve elements of market risk in excess of the amounts reflected in the Statement of Assets and Liabilities. In addition, risks may arise upon entering into these contracts from the potential inability of the counterparties to meet the terms of the contracts and from unanticipated movements in the value of the foreign currencies relative to the U.S. dollar. The Fund had outstanding foreign currency contracts as shown on the Schedule of Investments as of December 31, 2013.
| b) | Additional Derivative Instrument Information: |
Fair Value of Derivative Instruments on the Statement of Assets and Liabilities as of December 31, 2013:
| Risk Exposure Category | ||||||||||||||||||||||||||||
| Interest Rate Contracts | Foreign Exchange Contracts | Credit Contracts | Equity Contracts | Commodity Contracts | Other Contracts | Total | ||||||||||||||||||||||
| Assets: | ||||||||||||||||||||||||||||
| Unrealized appreciation on foreign currency contracts | $ | — | $ | 2 | $ | — | $ | — | $ | — | $ | — | $ | 2 | ||||||||||||||
| Total | $ | — | $ | 2 | $ | — | $ | — | $ | — | $ | — | $ | 2 | ||||||||||||||
| Liabilities: | ||||||||||||||||||||||||||||
| Unrealized depreciation on foreign currency contracts | $ | — | $ | 1 | $ | — | $ | — | $ | — | $ | — | $ | 1 | ||||||||||||||
| Total | $ | — | $ | 1 | $ | — | $ | — | $ | — | $ | — | $ | 1 | ||||||||||||||
The volume of derivatives that is presented in the Schedule of Investments is consistent with the derivative activity during the year ended December 31, 2013.
| 17 |
| Hartford Global Growth HLS Fund |
| Notes to Financial Statements – (continued) |
| December 31, 2013 |
| (000’s Omitted) |
The Effect of Derivative Instruments on the Statement of Operations for the year ended December 31, 2013:
| Risk Exposure Category | ||||||||||||||||||||||||||||
| Interest Rate Contracts | Foreign Exchange Contracts | Credit Contracts | Equity Contracts | Commodity Contracts | Other Contracts | Total | ||||||||||||||||||||||
| Realized Loss on Derivatives Recognized as a Result of Operations: | ||||||||||||||||||||||||||||
| Net realized loss on foreign currency contracts | $ | — | $ | (57 | ) | $ | — | $ | — | $ | — | $ | — | $ | (57 | ) | ||||||||||||
| Total | $ | — | $ | (57 | ) | $ | — | $ | — | $ | — | $ | — | $ | (57 | ) | ||||||||||||
| Net Change in Unrealized Appreciation (Depreciation) on Derivatives Recognized as a Result of Operations: | ||||||||||||||||||||||||||||
| Net change in unrealized appreciation of foreign currency contracts | $ | — | $ | 1 | $ | — | $ | — | $ | — | $ | — | $ | 1 | ||||||||||||||
| Total | $ | — | $ | 1 | $ | — | $ | — | $ | — | $ | — | $ | 1 | ||||||||||||||
The derivatives held by the Fund as of December 31, 2013 are not subject to a master netting arrangement; therefore, no balance sheet offsetting disclosure is presented.
| 5. | Principal Risks: |
The Fund may be exposed to counterparty risk, or the risk that an institution or other entity with which the Fund has unsettled or open transactions will default.
If the Fund invests directly in foreign currencies or in securities that trade in, and receive revenues in, foreign currencies, or in derivatives that provide exposure to foreign currencies, it will be subject to the risk that those currencies will decline in value relative to the base currency (U.S. dollars) of the Fund, or, in the case of hedging positions, that the Fund’s base currency will decline in value relative to the currency being hedged. Currency rates in foreign countries may fluctuate significantly over short periods of time for a number of reasons, including changes in interest rates, intervention (or the failure to intervene) by U.S. or foreign governments, central banks or supranational entities, such as the International Monetary Fund, or by the imposition of currency controls or other political developments in the United States or abroad. As a result, the Fund’s investments in foreign currency denominated securities may reduce the returns of the Fund. The market values of equity securities, such as common stocks and preferred stocks, or equity related investments, such as futures and options, may decline due to general market conditions which are not specifically related to a particular company, such as real or perceived adverse economic conditions, changes in the general outlook for corporate earnings, changes in interest or currency rates or adverse investor sentiment generally. The market value of equity securities may also decline due to factors which affect a particular industry or industries, such as labor shortages or increased production costs and competitive conditions within an industry. Equity securities and equity related investments generally have greater market price volatility than fixed income securities.
| 6. | Federal Income Taxes: |
| a) | Federal Income Taxes – For federal income tax purposes, the Fund intends to continue to qualify as a RIC under Subchapter M of the Internal Revenue Code (“IRC”) by distributing substantially all of its taxable net investment income and net realized capital gains to its shareholders and otherwise complying with the requirements of the IRC. The Fund has distributed substantially all of its income and capital gains in prior years, if applicable, and intends to distribute substantially all of its income and capital gains prior to the next fiscal year-end. Accordingly, no provision for federal income or excise taxes has been made in the accompanying financial statements. Distributions from short-term capital gains are treated as ordinary income distributions for federal income tax purposes. |
| b) | Net Investment Income (Loss), Net Realized Gains (Losses) and Distributions – Net investment income (loss) and net realized gains (losses) may differ for financial statement and tax purposes primarily because of losses deferred due to wash sale adjustments, foreign currency gains and losses, adjustments related to PFICs, REITs, RICs, certain derivatives |
| 18 |
and partnerships. The character of distributions made during the year from net investment income or net realized gains may differ from their ultimate characterization for federal income tax purposes. Also, due to the timing of dividend distributions, the fiscal year in which amounts are distributed may differ from the year that the income or realized gains (losses) were recorded by the Fund.
| c) | Distributions and Components of Distributable Earnings – The tax character of distributions paid by the Fund for the periods indicated is as follows (as adjusted for dividends payable, if applicable): |
| For the Year Ended December 31, 2013 | For the Year Ended December 31, 2012 | |||||||
| Ordinary Income | $ | 2,851 | $ | 2,204 | ||||
As of December 31, 2013, the Fund’s components of distributable earnings (deficit) on a tax basis were as follows:
| Amount | ||||
| Undistributed Ordinary Income | $ | 2,048 | ||
| Accumulated Capital and Other Losses* | (58,773 | ) | ||
| Unrealized Appreciation† | 123,712 | |||
| Total Accumulated Earnings | $ | 66,987 | ||
| * | The Fund has capital loss carryforwards that are identified in the Capital Loss Carryforward note that follows. |
| † | Differences between book-basis and tax-basis unrealized appreciation (depreciation) may be attributable to the losses deferred due to wash sale adjustments, foreign currency gains and losses, adjustments related to PFICs, REITs, RICs, certain derivatives and partnerships. |
| d) | Reclassification of Capital Accounts – The Fund may record reclassifications in its capital accounts. These reclassifications have no impact on the total net assets of the Fund. The reclassifications are a result of permanent differences between U.S. GAAP and tax accounting for such items as foreign currency, PFICs, expiration or utilization of capital loss carryforwards or net operating losses. Adjustments are made to reflect the impact these items have on current and future distributions to shareholders. Therefore, the source of the Fund’s distributions may be shown in the accompanying Statement of Changes in Net Assets as from undistributed net investment income, from accumulated net realized gains on investments or from capital depending on the type of book and tax differences that exist. For the year ended December 31, 2013, the Fund recorded reclassifications to increase (decrease) the accounts listed below: |
| Amount | ||||
| Undistributed Net Investment Income (Loss) | $ | (104 | ) | |
| Accumulated Net Realized Gain (Loss) | 104 | |||
| e) | Capital Loss Carryforward – On December 22, 2010, the Regulated Investment Company Modernization Act of 2010 (the “Act”) was enacted, which made changes to the capital loss carryforward rules. The changes are effective for taxable years beginning after the date of enactment. Under the Act, funds are permitted to carry forward capital losses for an unlimited period. However, any losses incurred during those future taxable years will be required to be utilized prior to the losses incurred in pre-enactment taxable years, which carry an expiration date. As a result of this ordering rule, pre-enactment capital loss carryforwards may be more likely to expire unused. Additionally, post-enactment capital loss carryforwards retain their character as either short-term or long-term capital losses rather than being considered all short-term as permitted under prior regulation. |
| 19 |
| Hartford Global Growth HLS Fund |
| Notes to Financial Statements – (continued) |
| December 31, 2013 |
| (000’s Omitted) |
At December 31, 2013 (tax-year-end), the Fund had capital loss carryforwards for U.S. federal income tax purposes as follows:
| Year of Expiration | Amount | |||
| 2017 | $ | 58,773 | ||
| Total | $ | 58,773 | ||
During the year ended December 31, 2013, the Fund utilized $63,706 of prior year capital loss carryforwards.
| f) | Accounting for Uncertainty in Income Taxes – The Fund has adopted financial reporting rules that require the Fund to analyze all open tax years, as defined by the statute of limitations, for all major jurisdictions. Generally, tax authorities can examine all tax returns filed for the last three years. The Fund does not have an examination in progress. |
The Fund has reviewed all open tax years and major jurisdictions and concluded that these financial reporting rules had no effect on the Fund’s financial position or results of operations. There is no tax liability resulting from unrecognized tax benefits relating to uncertain income tax positions taken or expected to be taken on the tax return for the fiscal year ended December 31, 2013. The Fund is also not aware of any tax positions for which it is reasonably possible that the total amounts of unrecognized tax benefits will significantly change in the next twelve months.
| 7. | Expenses: |
| a) | Investment Management Agreement – Hartford Funds Management Company, LLC (“HFMC”), an indirect wholly owned subsidiary of The Hartford Financial Services Group, Inc. (“The Hartford”), serves as investment manager to the Fund pursuant to an Investment Management Agreement with the Company. The investment manager has overall investment supervisory responsibility for the Fund. In addition, the investment manager provides administrative personnel, services, equipment, facilities and office space for proper operation of the Fund. The investment manager has contracted with Wellington Management Company, LLP (“Wellington Management”) under a sub-advisory agreement for the provision of day-to-day investment management services to the Fund in accordance with the Fund’s investment objective and policies. The Fund pays a fee to the investment manager, a portion of which may be used to compensate Wellington Management. |
The schedule below reflects the rates of compensation paid to HFMC for investment management services rendered as of December 31, 2013; the rates are accrued daily and paid monthly.
| Average Daily Net Assets | Annual Fee | |||
| On first $250 million | 0.7750 | % | ||
| On next $250 million | 0.7250 | % | ||
| On next $500 million | 0.6750 | % | ||
| On next $4 billion | 0.6250 | % | ||
| On next $5 billion | 0.6225 | % | ||
| Over $10 billion | 0.6200 | % | ||
| 20 |
| b) | Accounting Services Agreement – Pursuant to the Fund Accounting Agreement between HFMC and the Company, on behalf of the Fund, HFMC provides accounting services to the Fund and receives monthly compensation based on the Fund’s average daily net assets at the rates set forth below. The Fund’s accounting services fees are accrued daily and paid monthly. |
| Average Daily Net Assets | Annual Fee | |||
| On first $5 billion | 0.014 | % | ||
| On next $5 billion | 0.012 | % | ||
| Over $10 billion | 0.010 | % | ||
| c) | Operating Expenses – Allocable expenses incurred by the Company are allocated to each Fund and allocated to classes within a Fund in proportion to the average daily net assets of the Fund and each class, except where allocation of certain expenses is more fairly made directly to the Fund or to specific classes within a Fund. |
| d) | Fees Paid Indirectly – The Company, on behalf of the Fund, has entered into agreements with State Street Global Markets, LLC and Russell Implementation Services, Inc. to partially recapture non-discounted trade commissions. Such rebates are used to pay a portion of the Fund’s expenses. In addition, the Fund’s custodian bank has agreed to reduce its fees when the Fund maintains cash on deposit in a non-interest-bearing custody account. For the year ended December 31, 2013, these amounts, if any, are included in the Statement of Operations. |
The ratio of expenses to average net assets in the accompanying financial highlights excludes the reduction in expenses related to fees paid indirectly. The annualized expense ratio after waivers for the period listed below reflecting the reduction for fees paid indirectly is as follows:
| Year Ended December 31, 2013 | ||||
| Class IA | 0.82 | % | ||
| Class IB | 1.07 | |||
| e) | Distribution Plan for Class IB shares – Effective June 14, 2013, Hartford Investment Financial Services, LLC was renamed Hartford Funds Distributors, LLC (“HFD”). HFD, a wholly owned, ultimate subsidiary of The Hartford, serves as the Fund’s principal underwriter and distributor. The Company, on behalf of the Fund, has adopted a Distribution Plan pursuant to Rule 12b-1 of the 1940 Act to compensate the distributor, HFD, from assets attributable to the Class IB shares for services rendered and expenses borne in connection with activities primarily intended to result in the sale of the Class IB shares, subject to the review and approval of the Company’s Board of Directors. |
The Distribution Plan provides that the Fund may pay annually up to 0.25% of the average daily net assets of the Fund attributable to its Class IB shares for activities primarily intended to result in the sale of Class IB shares. The Board has the authority to suspend or reduce these payments at any point in time. Under the terms of the Distribution Plan and the principal underwriting agreement, the Fund is authorized to make payments monthly to the distributor that may be used to pay or compensate entities providing distribution and shareholder servicing with respect to the Class IB shares for such entities’ fees or expenses incurred or paid in that regard. These fees are accrued daily and paid monthly.
| f) | Other Related Party Transactions – Certain officers of the Fund are directors and/or officers of the investment manager and/or The Hartford or its subsidiaries. For the year ended December 31, 2013, a portion of the Fund’s Chief Compliance Officer’s salary was paid by all the investment companies in the Hartford fund complex. The portion allocated to the Fund rounds to zero. Hartford Administrative Services Company (“HASCO”), an indirect wholly owned subsidiary of The Hartford, provides transfer agent services to the Fund. HASCO was compensated on a per account basis for providing such services. The amount paid to HASCO can be found in the Statement of Operations. These fees are accrued daily and paid monthly. |
| 21 |
| Hartford Global Growth HLS Fund |
| Notes to Financial Statements – (continued) |
| December 31, 2013 |
| (000’s Omitted) |
| g) | Payment from Affiliate – In July of 2007, The Hartford entered into a settlement with the Attorneys General of the states of New York, Connecticut and Illinois relating to market timing and the company's individual variable annuity contracts in which certain payments would be made directly to the variable annuity contract holders. The distribution plan provided that unclaimed money from the settlement would be distributed to certain HLS Funds that are investment options through a Hartford individual variable annuity contract. The unclaimed money was distributed to the Fund on September 18, 2009. |
The total return in the accompanying financial highlights includes a payment from an affiliate. Had the payment from the affiliate been excluded, the impact and total return for the period listed below would have been as follows:
| For the Year Ended December 31, 2009 | ||||||||
| Class IA | Class IB | |||||||
| Impact from Payment from Affiliate for Attorneys General Settlement | 0.04 | % | 0.04 | % | ||||
| Total Return Excluding Payment from Affiliate | 35.59 | % | 35.26 | % | ||||
| 8. | Investment Transactions: |
For the year ended December 31, 2013, the Fund's aggregate purchases and sales of investment securities (excluding short-term investments) were as follows:
| Amount | ||||
| Cost of Purchases Excluding U.S. Government Obligations | $ | 291,178 | ||
| Sales Proceeds Excluding U.S. Government Obligations | 376,721 | |||
| 9. | Line of Credit: |
The Fund is one of several Hartford funds that participate in a $500 million committed revolving line of credit facility. The facility is to be used for temporary or emergency purposes. Under the arrangement, the funds are required to own securities having a market value in excess of 300% of the total bank borrowings. The interest rate on borrowings varies depending on the nature of the loan. The facility also requires a fee to be paid based on the amount of the commitment. This commitment fee is allocated to all of the funds participating in the line of credit based on the average net assets of the funds. During the year ended December 31, 2013, the Fund did not have any borrowings under this facility.
| 10. | Industry Classifications: |
Other than the industry classifications “Other Investment Pools and Funds” and “Exchange Traded Funds,” equity industry classifications used in this report are the Global Industry Classification Standard, which was developed by and is the exclusive property and service mark of MSCI, Inc. and Standard & Poor’s.
| 11. | Indemnifications: |
Under the Company’s organizational documents, the Company shall indemnify its officers and directors to the full extent required or permitted under Maryland General Corporation Law and the federal securities laws. In addition, the Company, on behalf of the Fund, may enter into contracts that contain a variety of indemnifications. The Company’s maximum exposure under these arrangements is unknown. However, as of the date of these financial statements, the Company has not had prior claims or losses pursuant to these contracts and expects the risk of loss to be remote.
| 22 |
| 12. | Pending Legal Proceedings: |
On February 25, 2011, Jennifer L. Kasilag, Louis Mellinger, Judith M. Menendez, Jacqueline M. Robinson, and Linda A. Russell filed a derivative lawsuit against Hartford Investment Financial Services, LLC (“HIFSCO”)(now known as Hartford Funds Distributors, LLC) on behalf of six Hartford retail mutual funds in the United States District Court for the District of New Jersey, alleging that HIFSCO received excessive advisory and distribution fees in violation of its statutory fiduciary duty under Section 36(b) of the 1940 Act when serving as investment manager and principal underwriter, respectively, to the Hartford retail mutual funds. HIFSCO moved to dismiss and, in September 2011, the motion was granted in part and denied in part, with leave to amend the complaint. In November 2011, plaintiffs filed an amended complaint on behalf of certain Hartford retail mutual funds, The Hartford Global Health Fund (now known as The Hartford Healthcare Fund), The Hartford Conservative Allocation Fund, The Hartford Growth Opportunities Fund, The Hartford Inflation Plus Fund, The Hartford Advisers Fund (now known as The Hartford Balanced Fund), and The Hartford Capital Appreciation Fund. Plaintiffs seek to rescind the investment management agreements and distribution plans between HIFSCO and these funds and to recover the total fees charged thereunder or, in the alternative, to recover any improper compensation HIFSCO received, in addition to lost earnings. HIFSCO filed a partial motion to dismiss the amended complaint and, in December 2012, the court dismissed without prejudice the claims regarding distribution fees and denied the motion with respect to the advisory fees claims. HIFSCO disputes the allegations and intends to defend the advisory fee claims vigorously.
This action concerns the activities of HIFSCO in its capacity as investment manager and principal underwriter to the Hartford retail mutual funds and does not concern HIFSCO’s activities in its capacity as principal underwriter to the HLS funds. For this reason, no accrual for litigation relating to this matter has been recorded in the financial statements of the Fund.
| 13. | Subsequent Events: |
At a meeting held on February 5, 2014, the Board of Directors of Hartford Series Fund, Inc. approved an Agreement and Plan of Reorganization relating to the reorganization of Hartford Global Research HLS Fund, a series of Hartford Series Fund, Inc., into the Fund. The Reorganization does not require shareholder approval. The Reorganization is expected to occur on or about June 23, 2014.
| 23 |
| Hartford Global Growth HLS Fund |
| Financial Highlights |
─Selected Per-Share Data(A) ─ | ─Ratios and Supplemental Data ─ | |||||||||||||||||||||||||||||||||||||||||||||||||||
Class | Net Asset | Net | Net | Total from | Dividends | Distributions | Total | Net | Total | Net | Ratio of | Ratio of | Ratio of | |||||||||||||||||||||||||||||||||||||||
| For the Year Ended December 31, 2013 | ||||||||||||||||||||||||||||||||||||||||||||||||||||
| IA | $ | 16.50 | $ | 0.11 | $ | 5.86 | $ | 5.97 | $ | (0.14 | ) | $ | – | $ | (0.14 | ) | $ | 22.33 | 36.30 | % | $ | 360,086 | 0.82 | % | 0.82 | % | 0.56 | % | ||||||||||||||||||||||||
| IB | 16.38 | 0.06 | 5.81 | 5.87 | (0.09 | ) | – | (0.09 | ) | 22.16 | 35.90 | 79,823 | 1.07 | 1.07 | 0.32 | |||||||||||||||||||||||||||||||||||||
| For the Year Ended December 31, 2012 (D) | ||||||||||||||||||||||||||||||||||||||||||||||||||||
| IA | $ | 13.45 | $ | 0.14 | $ | 3.00 | $ | 3.14 | $ | (0.09 | ) | $ | – | $ | (0.09 | ) | $ | 16.50 | 23.41 | % | $ | 321,371 | 0.82 | % | 0.82 | % | 0.73 | % | ||||||||||||||||||||||||
| IB | 13.34 | 0.09 | 2.99 | 3.08 | (0.04 | ) | – | (0.04 | ) | 16.38 | 23.10 | 77,224 | 1.07 | 1.07 | 0.47 | |||||||||||||||||||||||||||||||||||||
| For the Year Ended December 31, 2011 (D) | ||||||||||||||||||||||||||||||||||||||||||||||||||||
| IA | $ | 15.62 | $ | 0.08 | $ | (2.24 | ) | $ | (2.16 | ) | $ | (0.01 | ) | $ | – | $ | (0.01 | ) | $ | 13.45 | (13.89 | )% | $ | 352,947 | 0.80 | % | 0.80 | % | 0.46 | % | ||||||||||||||||||||||
| IB | 15.53 | 0.04 | (2.23 | ) | (2.19 | ) | – | – | – | 13.34 | (14.10 | ) | 82,204 | 1.05 | 1.05 | 0.22 | ||||||||||||||||||||||||||||||||||||
| For the Year Ended December 31, 2010 (D) | ||||||||||||||||||||||||||||||||||||||||||||||||||||
| IA | $ | 13.71 | $ | 0.04 | $ | 1.91 | $ | 1.95 | $ | (0.04 | ) | $ | – | $ | (0.04 | ) | $ | 15.62 | 14.25 | % | $ | 484,754 | 0.81 | % | 0.81 | % | 0.28 | % | ||||||||||||||||||||||||
| IB | 13.64 | – | 1.90 | 1.90 | (0.01 | ) | – | (0.01 | ) | 15.53 | 13.96 | 118,824 | 1.06 | 1.06 | 0.03 | |||||||||||||||||||||||||||||||||||||
| For the Year Ended December 31, 2009 (D) | ||||||||||||||||||||||||||||||||||||||||||||||||||||
| IA | $ | 10.17 | $ | 0.08 | $ | 3.55 | $ | 3.63 | $ | (0.09 | ) | $ | – | $ | (0.09 | ) | $ | 13.71 | 35.64 | %(E) | $ | 488,720 | 0.81 | % | 0.81 | % | 0.67 | % | ||||||||||||||||||||||||
| IB | 10.12 | 0.05 | 3.53 | 3.58 | (0.06 | ) | – | (0.06 | ) | 13.64 | 35.31 | (E) | 126,320 | 1.06 | 1.06 | 0.42 | ||||||||||||||||||||||||||||||||||||
| (A) | Information presented relates to a share outstanding throughout the indicated period. Net investment income (loss) per share amounts are calculated based on average shares outstanding unless otherwise noted. |
| (B) | The figures do not include sales charges or other fees which may be applied at the variable life insurance, variable annuity or qualified retirement plan product level. Any such additional sales charges or other fees would lower the Fund's performance. |
| (C) | Adjustments include waivers and reimbursements, if applicable. Ratios do not include fees paid indirectly (see Expenses in the accompanying Notes to Financial Statements). |
| (D) | Net investment income (loss) per share amounts have been calculated using the SEC method. |
| (E) | Total return without the inclusion of the Payment from (to) Affiliate can be found in Expenses in the accompanying Notes to Financial Statements. |
| Portfolio Turnover Rate for All Share Classes | ||||
| For the Year Ended December 31, 2013 | 71 | % | ||
| For the Year Ended December 31, 2012 | 108 | |||
| For the Year Ended December 31, 2011 | 57 | |||
| For the Year Ended December 31, 2010 | 62 | |||
| For the Year Ended December 31, 2009 | 70 | |||
| 24 |
| Report of Independent Registered Public Accounting Firm |
The Board of Directors and Shareholders of Hartford Series Fund, Inc. |
We have audited the accompanying statement of assets and liabilities, including the schedule of investments, of Hartford Global Growth HLS Fund (one of the portfolios constituting Hartford Series Fund, Inc. (the Funds)) as of December 31, 2013, and the related statement of operations for the year then ended, the statements of changes in net assets for each of the two years in the period then ended, and the financial highlights for each of the five years in the period then ended. These financial statements and financial highlights are the responsibility of the Funds’ management. Our responsibility is to express an opinion on these financial statements and financial highlights based on our audits.
We conducted our audits in accordance with the standards of the Public Company Accounting Oversight Board (United States). Those standards require that we plan and perform the audit to obtain reasonable assurance about whether the financial statements and financial highlights are free of material misstatement. We were not engaged to perform an audit of the Funds’ internal control over financial reporting. Our audits included consideration of internal control over financial reporting as a basis for designing audit procedures that are appropriate in the circumstances, but not for the purpose of expressing an opinion on the effectiveness of the Funds’ internal control over financial reporting. Accordingly, we express no such opinion. An audit also includes examining, on a test basis, evidence supporting the amounts and disclosures in the financial statements and financial highlights, assessing the accounting principles used and significant estimates made by management, and evaluating the overall financial statement presentation. Our procedures included confirmation of securities owned as of December 31, 2013, by correspondence with the custodian and brokers or by other appropriate auditing procedures where replies from brokers were not received. We believe that our audits provide a reasonable basis for our opinion.
In our opinion, the financial statements and financial highlights referred to above present fairly, in all material respects, the financial position of Hartford Global Growth HLS Fund of the Hartford Series Fund, Inc. at December 31, 2013, the results of its operations for the year then ended, the changes in its net assets for each of the two years in the period then ended, and the financial highlights for each of the five years in the period then ended, in conformity with U.S. generally accepted accounting principles.
|
Minneapolis, MN
February 17, 2014
| 25 |
| Hartford Global Growth HLS Fund |
| Directors and Officers (Unaudited) |
The Board of Directors of the Company appoints officers who are responsible for the day-to-day operations of the Fund and who execute policies formulated by the directors. Each director serves until his or her death, resignation, or retirement or until the next annual meeting of shareholders is held or until his or her successor is elected and qualifies.
Directors and officers who are employed by or who have a financial interest in The Hartford are considered “interested” persons of the Fund pursuant to the 1940 Act. Each officer and two of the Company’s directors, as noted in the chart below, are “interested” persons of the Fund. Each director serves as a director for The Hartford Mutual Funds, Inc., The Hartford Mutual Funds II, Inc., Hartford Series Fund, Inc., Hartford HLS Series Fund II, Inc., and as a trustee for The Hartford Alternative Strategies Fund, which, as of December 31, 2013, collectively consist of 91 funds. Correspondence may be sent to directors and officers c/o Hartford Funds, 5 Radnor Corporate Center, Suite 300, 100 Matsonford Road, Radnor, Pennsylvania 19087, except that correspondence to Mr. Annoni, Mr. Dressen and Ms. Quade may be sent to 500 Bielenberg Drive, Woodbury, Minnesota 55125.
The table below sets forth, for each director and officer, his or her name, year of birth, current position with the Company and date first elected or appointed to Hartford Series Fund, Inc. (“HSF”), and Hartford HLS Series Fund II, Inc. (“HSF2”), principal occupation, and, for directors, other directorships held. The Fund’s Statement of Additional Information contains further information on the directors and is available free of charge by calling 1-800-862-6668 or writing to Hartford HLS Funds, c/o Hartford Life Insurance Company, Hartford Life and Annuity Insurance Company, P.O. Box 14293, Lexington, KY 40512-4293.
Information on the aggregate remuneration paid to the directors of the Company can be found in the Statement of Operations herein. The Fund pays to The Hartford a portion of the Chief Compliance Officer’s compensation, but does not pay salaries or compensation to any of their other officers or directors who are employed by The Hartford.
Non-Interested Directors
Lynn S. Birdsong (1946) Director since 2003, Co-Chairman of the Investment Committee since 2005
Mr. Birdsong is a private investor. Mr. Birdsong currently serves as a Director of the Sovereign High Yield Investment Company (April 2010 to current). Mr. Birdsong currently serves as an Independent Director of Nomura Partners Funds, Inc. (formerly, The Japan Fund) (April 2003 to current). From 2003 to March 2005, Mr. Birdsong was an Independent Director of the Atlantic Whitehall Funds. From 1979 to 2002, Mr. Birdsong was a Managing Director of Zurich Scudder Investments, an investment management firm. During his employment with Scudder, Mr. Birdsong was an Interested Director of The Japan Fund. From January 1981 through December 2013, Mr. Birdsong was a partner in Birdsong Company, an advertising specialty firm.
Robert M. Gavin, Jr. (1940) Director since 2002 (HSF) and 1986 (HSF2), Chairman of the Board since 2004
Dr. Gavin is an educational consultant. Prior to September 1, 2001, he was President of Cranbrook Education Community and prior to July 1996, he was President of Macalester College, St. Paul, Minnesota.
Duane E. Hill (1945) Director since 2001 (HSF) and 2002 (HSF2), Chairman of the Nominating Committee since 2003
Mr. Hill is a Partner of TSG Ventures L.P., a private equity investment company. Mr. Hill is a former partner of TSG Capital Group, a private equity investment firm that served as sponsor and lead investor in leveraged buyouts of middle market companies.
Sandra S. Jaffee (1941) Director since 2005
Ms. Jaffee is the founder and Chief Executive Officer of a private company, Homeworks Concierge, LLC, which provides residential property management services in Westchester County, New York (January 2012 to present). Ms. Jaffee served as Chairman (2008 to 2009) and Chief Executive Officer of Fortent (formerly Searchspace Group), a leading provider of compliance/regulatory technology to financial institutions from August 2005 to August 2009. Ms. Jaffee currently serves as a member of the Board of Directors of Broadridge Financial Solutions as well as a Trustee of Muhlenberg College.
| 26 |
William P. Johnston (1944) Director since 2005, Chairman of the Compliance Committee since 2005
In June 2006, Mr. Johnston was appointed as Senior Advisor to The Carlyle Group, a global private equity and alternative asset investment firm and currently serves as an Operating Executive. In July 2006, Mr. Johnston was elected to the Board of Directors of MultiPlan, Inc. and served as a Director (July 2006 to August 2010). In August 2007, Mr. Johnston was elected to the Board of Directors of LifeCare Holdings, Inc. and served as a Director (August 2007 to June 2013). In February 2008, Mr. Johnston was elected to the Board of Directors of HCR-ManorCare, Inc. In May 2006, Mr. Johnston was elected to the Supervisory Board of Fresenius Medical Care AG & Co. KGaA, after its acquisition of Renal Care Group, Inc. in March 2006. Mr. Johnston joined Renal Care Group in November 2002 as a member of the Board of Directors and served as Chairman of the Board from March 2003 through March 2006. From 2002 through 2013, Mr. Johnston served as a Board member of the Georgia O’Keefe Museum. From September 1987 to December 2002, Mr. Johnston was with Equitable Securities Corporation (and its successors, SunTrust Equitable Securities and SunTrust Robinson Humphrey) serving in various investment banking and managerial positions, including Managing Director and Head of Investment Banking, Chief Executive Officer and Vice Chairman.
Phillip O. Peterson (1944) Director since 2002 (HSF) and 2000 (HSF2), Chairman of the Audit Committee since 2002
Mr. Peterson is a mutual fund industry consultant. He was a partner of KPMG LLP (an accounting firm) until July 1999. Mr. Peterson joined William Blair Funds in February 2007 as a member of the Board of Trustees. Mr. Peterson also joined the Board of Trustees of Symetra Variable Mutual Funds Trust as a trustee in February 2012.
Lemma W. Senbet (1946) Director since 2005
Dr. Senbet is the William E. Mayer Chair Professor of Finance and Founding Director, Center for Financial Policy, at the University of Maryland, Robert H. Smith School of Business. He was chair of the Finance Department of the University of Maryland, Robert H. Smith School of Business from 1998 to 2006. Since June 2013, he has been on leave from the University to serve as Executive Director of African Economic Research Consortium which focuses on economic policy research and training. Previously, he was a chaired professor of finance at the University of Wisconsin-Madison. Also, he was a Director of the Fortis Funds from March 2000 to July 2002. Dr. Senbet served as Director of the American Finance Association and President of the Western Finance Association. In 2006, Dr. Senbet was inducted Fellow of Financial Management Association International for his career-long distinguished scholarship and professional service.
Interested Directors and Officers
James E. Davey (1964) Director since 2012, President and Chief Executive Officer since 2010
Mr. Davey serves as Executive Vice President of Hartford Life Insurance Company (“HLIC”) and The Hartford Financial Services Group, Inc. Additionally, Mr. Davey serves as Chairman of the Board, Manager and Senior Managing Director of Hartford Funds Distributors, LLC (“HFD”). He also currently serves as Director, Chairman of the Board, President and Senior Managing Director of Hartford Administrative Services Company (“HASCO”). Mr. Davey also serves as Manager, Chairman of the Board and Senior Managing Director for Hartford Funds Management Company, LLC (“HFMC”). Mr. Davey joined The Hartford in 2002.
Lowndes A. Smith (1939) Director since 1996 (HSF) and 2002 (HSF2), Co-Chairman of the Investment Committee since 2005
Mr. Smith served as Vice Chairman of The Hartford from February 1997 to January 2002, as President and Chief Executive Officer of Hartford Life, Inc. from February 1997 to January 2002, and as President and Chief Operating Officer of The Hartford Life Insurance Companies from January 1989 to January 2002. Mr. Smith serves as a Director of White Mountains Insurance Group Ltd. (October 2003 to current); One Beacon Insurance (October 2006 to current); Symetra Financial (August 2007 to current) and is a Managing Director of Whittington Gray Associates (January 2007 to current).
Other Officers
Mark A. Annoni (1964) Vice President, Controller and Treasurer since 2012
Mr. Annoni currently serves as the Assistant Vice President of HLIC (February 2004 to present).
| 27 |
| Hartford Global Growth HLS Fund |
| Directors and Officers (Unaudited) – (continued) |
Michael R. Dressen (1963) AML Compliance Officer since 2011
Mr. Dressen currently serves as Assistant Vice President of HLIC. He also serves as Chief Compliance Officer and AML Compliance Officer of HASCO and as AML Officer of HFD. Mr. Dressen has served in various positions within The Hartford and its subsidiaries in connection with the operation of the Hartford Funds.
Edward P. Macdonald (1967) Vice President, Secretary and Chief Legal Officer since 2005
Mr. Macdonald currently serves as Assistant Secretary, Executive Vice President and Deputy General Counsel of HFD, HASCO and HFMC. He also serves as Vice President of HLIC. Mr. Macdonald has served in various positions within The Hartford and its subsidiaries in connection with the operation of the Hartford Funds. Mr. Macdonald joined The Hartford in 2005.
Joseph G. Melcher (1973) Vice President and Chief Compliance Officer since 2013
Mr. Melcher currently serves as Executive Vice President of HASCO and HFD. Mr. Melcher also currently serves as Executive Vice President and Chief Compliance Officer of HFMC. Mr. Melcher has served in various positions within The Hartford and its subsidiaries in connection with the operation of the Hartford Funds since joining The Hartford in 2012. Prior to joining The Hartford, Mr. Melcher worked at Touchstone Investments, a member of the Western & Southern Financial Group, where he held the position of Vice President and Chief Compliance Officer from 2010 through 2012 and Assistant Vice President, Compliance from 2005 to 2010.
Vernon J. Meyer (1964) Vice President since 2006
Mr. Meyer currently serves as Senior Vice President of HLIC. He also currently serves as Managing Director and Chief Investment Officer of HFMC. Mr. Meyer has served in various positions within The Hartford and its subsidiaries in connection with the operation of the Hartford Funds. Mr. Meyer joined The Hartford in 2004.
Laura S. Quade (1969) Vice President since 2012
Ms. Quade currently serves as Vice President of HASCO and HFD. She is the Head of Operations of HASCO and also serves as Director, Enterprise Operations of HLIC. Ms. Quade has served in various positions within The Hartford and its subsidiaries in connection with the operation of the Hartford Funds.
Martin A. Swanson (1962) Vice President since 2010
Mr. Swanson currently serves as Vice President of HLIC. Mr. Swanson also serves as Managing Director, Chief Marketing Officer and Principal of HFD. Mr. Swanson has served in various positions within The Hartford and its subsidiaries in connection with the operation of the Hartford Funds.
HOW TO OBTAIN A COPY OF THE FUND’S PROXY VOTING POLICIES AND VOTING RECORDS (UNAUDITED)
A description of the policies and procedures that the Fund uses to determine how to vote proxies relating to portfolio securities and information about how the Fund voted proxies relating to portfolio securities during the most recent twelve-month period ended June 30 are available (1) without charge, upon request, by calling 800-862-6668 and (2) on the SEC’s website at http://www.sec.gov.
QUARTERLY PORTFOLIO HOLDINGS INFORMATION (UNAUDITED)
The Fund files a complete schedule of portfolio holdings with the SEC for the first and third quarters of each fiscal year on Form N-Q. The Fund’s Forms N-Q are available (1) without charge, upon request, by calling 800-862-6668 and (2) on the SEC’s website at http://www.sec.gov. The Form N-Q may be reviewed and copied at the SEC’s Public Reference Room in Washington, DC. Information on the operation of the Public Reference Room may be obtained by calling 1-800-SEC-0330.
| 28 |
| Hartford Global Growth HLS Fund |
| Expense Example (Unaudited) |
Your Fund's Expenses
As a shareholder of the Fund, you incur two types of costs: (1) transaction costs and (2) ongoing costs, including investment management fees, distribution and/or service (12b-1) fees, if any, and other fund expenses. This example is intended to help you understand your ongoing costs (in dollars) of investing in the Fund and to compare these costs with the ongoing costs of investing in other mutual funds. The example is based on an investment of $1,000 invested at the beginning of the period and held for the period of June 30, 2013 through December 31, 2013.
Actual Expenses
The first set of columns of the table below provides information about actual account values and actual expenses. You may use the information in this column, together with the amount you invested, to estimate the expenses that you paid over the period. Simply divide your account value by $1,000 (for example, an $8,600 account value divided by $1,000 = 8.6), then multiply the result by the number in the line under the heading entitled “Expenses Paid During Period” to estimate the expenses you paid on your account during this period.
Hypothetical Example for Comparison Purposes
The second set of columns of the table below provides information about hypothetical account values and hypothetical expenses based on the Fund’s actual expense ratio and an assumed rate of return of 5% per year before expenses, which is not the Fund’s actual return. The hypothetical account values and expenses may not be used to estimate the actual ending account balance or expenses you paid for the period. You may use this information to compare the ongoing costs of investing in the Fund and other funds. To do so, compare this 5% hypothetical example with the 5% hypothetical examples that appear in the shareholder reports of the other funds.
Please note that the expenses shown in the table are meant to highlight your ongoing costs only and do not reflect any transactional costs, such as sales charges (loads) and CDSC. Therefore, the second set of columns of the table is useful in comparing ongoing costs only, and will not help you determine the relative total costs of owning different funds. In addition, if these transactional costs were included, your costs would be higher. Expenses are equal to the Fund's annualized expense ratios multiplied by average account value over the period, multiplied by 184/365 (to reflect the one-half year period).
| Actual return | Hypothetical (5% return before expenses) | |||||||||||||||||||||||||||||||||||
Beginning | Ending | Expenses paid during the period June 30, 2013 through December 31, 2013 | Beginning | Ending | Expenses paid | Annualized | Days in | Days | ||||||||||||||||||||||||||||
| Class IA | $ | 1,000.00 | $ | 1,222.80 | $ | 4.60 | $ | 1,000.00 | $ | 1,021.07 | $ | 4.18 | 0.82 | % | 184 | 365 | ||||||||||||||||||||
| Class IB | $ | 1,000.00 | $ | 1,220.80 | $ | 5.99 | $ | 1,000.00 | $ | 1,019.81 | $ | 5.45 | 1.07 | % | 184 | 365 | ||||||||||||||||||||
| 29 |
| Hartford Global Growth HLS Fund |
| Approval of Investment Management and Investment Sub-Advisory Agreements (Unaudited) |
Section 15(c) of the Investment Company Act of 1940, as amended (the “1940 Act”), requires that each mutual fund’s board of directors, including a majority of those directors who are not “interested persons” of the mutual fund, as defined in the 1940 Act (the “Independent Directors”), annually review and consider the continuation of the mutual fund’s investment advisory and sub-advisory agreements. At its meeting held on August 6-7, 2013, the Board of Directors (the “Board”) of Hartford Series Fund, Inc., including each of the Independent Directors, unanimously voted to approve the continuation of the investment management agreement for Hartford Global Growth HLS Fund (the “Fund”) with Hartford Funds Management Company, LLC (“HFMC”) and the continuation of the investment sub-advisory agreement between HFMC and the Fund’s sub-adviser, Wellington Management Company, LLP (the “Sub-adviser,” and together with HFMC, the “Advisers”) (collectively, the “Agreements”).
In the months preceding the August 6-7, 2013 meeting, the Board requested, received, and reviewed written responses from the Advisers to questions posed to them on behalf of the Independent Directors and supporting materials relating to those questions and responses. The Board considered information furnished to the Board at its meetings throughout the year, as well as information specifically prepared in connection with the annual approval of the Agreements at the Board’s meetings held on June 18-19, 2013 and August 6-7, 2013. Information provided to the Board at its meetings throughout the year included, among other things, reports on Fund performance, legal and compliance matters, sales and marketing activity, shareholder services, and the other services provided to the Fund by the Advisers and their affiliates. The Board also received in-person presentations by Fund officers and representatives of HFMC at the Board’s meetings on June 18-19, 2013 and August 6-7, 2013 concerning the Agreements.
The Independent Directors, advised by independent legal counsel, engaged two service providers to assist them with evaluating the Agreements with respect to the Fund. Lipper Inc. (“Lipper”), an independent provider of investment company data, was retained to provide the Board with reports on how the Fund’s contractual management fees, actual management fees, other non-management fees, overall expense ratios and investment performance compared to those of mutual funds with similar investment objectives. The Independent Directors also engaged an independent financial services consulting firm (the “Consultant”) to assist them in evaluating the Fund’s management fees, sub-advisory fees, other non-management fees, overall expense ratios and investment performance. In addition, the Consultant reviewed the profitability calculations utilized by HFMC in connection with the continuation of the investment management agreement.
In determining whether to continue the Agreements for the Fund, the members of the Board reviewed and evaluated information and factors they believed to be relevant and appropriate in light of the information that the Board deemed necessary and appropriate through the exercise of its reasonable business judgment. While individual members of the Board may have weighed certain factors differently, the Board’s determination to continue the Agreements was based on a comprehensive consideration of all information provided to the Board throughout the year and specifically with respect to the continuation of the Agreements. A more detailed discussion of the factors the Board considered with respect to its approval of the Agreements is provided below.
Nature, Extent, and Quality of Services Provided by the Advisers
The Board requested and considered information concerning the nature, extent, and quality of the services provided to the Fund by the Advisers. The Board considered, among other things, the terms of the Agreements and the range of services provided by the Advisers. The Board considered the Advisers’ professional personnel who provide services to the Fund, including each Adviser’s ability and experience in attracting and retaining qualified personnel to service the Fund. The Board considered each Adviser’s reputation and overall financial strength, as well as its willingness to consider and implement organizational and operational changes designed to improve services to the Fund. In addition, the Board considered the quality of each Adviser’s communications with the Board and responsiveness to Board inquiries.
The Board also requested and evaluated information concerning each Adviser’s regulatory and compliance environment. In this regard, the Board requested and reviewed information on each Adviser’s compliance policies and procedures, compliance history, and a report from the Fund’s Chief Compliance Officer on each Adviser’s compliance with applicable laws and regulations, including responses to regulatory developments and compliance issues raised by regulators. The Board also noted the Advisers’ support of the Fund’s compliance control structure, particularly the resources devoted by the Advisers in support of the Fund’s obligations pursuant to Rule 38a-1 under the 1940 Act.
With respect to HFMC, the Board noted that under the Agreements, HFMC is responsible for the management of the Fund, including overseeing fund operations and service providers, as well as investment advisory services in connection with selecting,
| 30 |
monitoring and supervising the Sub-adviser. The Board considered HFMC’s ongoing monitoring of people, process and performance, including its quarterly reviews of each of the Hartford Funds, semi-annual meetings with the leaders of each Fund’s portfolio management team, and oversight of the Funds’ approximately 40 portfolio managers. The Board recognized that HFMC has demonstrated a record of making changes to the management and/or strategies of the Funds when warranted. The Board considered HFMC’s oversight of the Sub-adviser’s investment approach and results, process for monitoring best execution of portfolio trades by the Sub-adviser, and approach to risk management with respect to the Fund and the service providers to the Fund. The Board also considered HFMC’s oversight of compliance with the Fund’s objective and policies as well as with applicable laws and regulations, noting that regulatory and other developments had over time led to an increase in the scope of HFMC’s services in this regard.
In addition, the Board considered HFMC’s ongoing commitment to review and rationalize the Hartford Funds product line-up and the expenses that HFMC had incurred in connection with fund combinations in recent years. The Board considered that HFMC or its affiliates are responsible for providing the Fund’s officers. The Board also noted that Hartford Life Insurance Company (“HLIC”) provides administrative services to the Fund. The Board considered its experiences with HFMC and HLIC with respect to each of these services.
With respect to the Sub-adviser, who provides day-to-day portfolio management services, the Board considered the quality of the Fund’s portfolio managers, the Sub-adviser’s other investment personnel, its investment philosophy and process, investment research capabilities and resources, performance record, trade execution capabilities and experience. The Board considered the experience of the Fund’s portfolio managers, the number of accounts managed by the portfolio managers, and the Sub-adviser’s method for compensating the portfolio managers.
Based on these considerations, the Board concluded that it was satisfied with the nature, extent and quality of the services provided to the Fund by HFMC and the Sub-adviser.
Performance of the Fund and the Advisers
The Board considered the investment performance of the Fund. In this regard, the Board reviewed the performance of the Fund over different time periods presented in the materials and evaluated HFMC’s analysis of the Fund’s performance for these time periods. The Board considered information and materials provided to the Board by the Advisers concerning Fund performance, as well as information from Lipper comparing the investment performance of the Fund to an appropriate benchmark and universe of peer funds. The Board noted that the Fund’s performance was in the 3rd quintile of its performance universe for the 1- and 3-year periods and in the 5th quintile for the 5-year period. The Board also noted that the Fund’s performance was above its benchmark for the 1-year period, in line with its benchmark for the 3-year period and below its benchmark for the 5-year period. The Board noted changes to the Fund’s portfolio management team in 2012. The Board considered that, in response to questions raised concerning the Fund’s performance, HFMC stated that it has confidence in the Fund’s portfolio management team and investment strategy.
The Board considered the detailed investment analytics reports provided by Hartford Funds’ Investment Advisory Group throughout the year. These reports include, among other things, information on the Fund’s gross and net returns, the Fund’s investment performance relative to an appropriate benchmark and peer group, various statistics concerning the Fund’s portfolio, and a narrative summary of various factors affecting Fund performance. The Board considered the Advisers’ cooperation with the Investment Committee, which assists the Board in evaluating the performance of the Fund at periodic meetings throughout the year. The Board also considered the analysis provided by the Consultant relating to the Fund’s performance track record.
In light of all the considerations noted above, the Board concluded that it had continued confidence in HFMC’s and the Sub-adviser’s overall capabilities to manage the Fund.
| 31 |
| Hartford Global Growth HLS Fund |
| Approval of Investment Management and Investment Sub-Advisory Agreements (Unaudited) – (continued) |
Costs of the Services and Profitability of the Advisers
The Board reviewed information regarding HFMC’s cost to provide investment management and related services to the Fund and HFMC’s profitability, both overall and for the Fund, on a pre-tax basis without regard to distribution expenses. The Board also requested and reviewed information about the profitability to HFMC and its affiliates from all services provided to the Fund and all aspects of their relationship with the Fund. The Board also requested and received information relating to the operations and profitability of the Sub-adviser.
The Board considered the Consultant’s review of the profitability calculations utilized by HFMC in connection with the continuation of the investment management agreement, noting the Consultant’s view that Hartford Funds’ process for calculating and reporting Fund profitability is reasonable. In this regard, the Board noted that the Consultant had previously performed a full review of this process and reported that such process is sound and well within common industry practice.
Based on these considerations, the Board concluded that the profits anticipated to be realized by the Advisers and their affiliates from their relationships with the Fund would not be excessive.
Comparison of Fees and Services Provided by the Advisers
The Board considered comparative information with respect to the management fees to be paid by the Fund to HFMC and the total expense ratios of the Fund. The Board also considered comparative information with respect to the sub-advisory fees to be paid by HFMC to the Sub-adviser. In this regard, the Board requested and reviewed information from HFMC and the Sub-adviser relating to the management and sub-advisory fees, including the sub-advisory fee schedule for the Fund, and total operating expenses for the Fund. The Board considered that the management fee for the Fund includes the fee paid to HLIC for providing certain administrative services to the Fund. With respect to the sub-advisory fee schedule, the Board considered representations from HFMC and the Sub-adviser that the Sub-adviser’s fees were negotiated at arm’s length. The Board also reviewed information from Lipper comparing the Fund’s contractual management fees, actual management fees and overall expense ratios relative to a group of funds selected by Lipper, in consultation with the Consultant, and a broader universe of funds selected by Lipper. The Board noted that the Fund’s contractual management fee was in the 5th quintile of its expense group, while its actual management fee was in the 4th quintile and its total expenses (less 12b-1 and shareholder service fees) were in the 2nd quintile.
While the Board recognized that comparisons between the Fund and peer funds are imprecise, given the differing service levels and characteristics of mutual funds and the different business models and cost structures of the Advisers, the comparative information provided by Lipper assisted the Board in evaluating the reasonableness of the Fund’s management and sub-advisory fees and total operating expenses. In addition, the Board considered the analysis and recommendations of the Consultant relating to the Fund’s management and sub-advisory fees and total operating expenses.
Based on these considerations, the Board concluded that the Fund’s fees and total operating expenses, in conjunction with the information about quality of services, profitability, economies of scale, and other matters discussed, were reasonable in light of the services provided.
Economies of Scale
The Board requested and considered information regarding the Advisers’ realization of economies of scale with respect to the Fund and whether the fee levels reflect these economies of scale for the benefit of the Fund’s shareholders. The Board reviewed the breakpoints in the management fee schedule for the Fund, which reduce fee rates as Fund assets grow over time. The Board recognized that a fund with assets beyond the last breakpoint level will continue to benefit from economies of scale because additional assets are charged the lowest breakpoint fee resulting in lower overall effective management fee rates. The Board also recognized that a fee schedule that reaches a lower breakpoint quickly provides shareholders with the benefit of anticipated or potential economies of scale. The Board noted the effect of the sale and run-off of the variable annuity business on the HLS Funds.
The Board reviewed and evaluated materials from Lipper showing how management fee schedules of peer funds reflect economies of scale for the benefit of shareholders as a peer fund’s assets hypothetically increase over time. Based on information
| 32 |
provided by HFMC, Lipper, and the Consultant, the Board recognized that there is no uniform methodology for establishing breakpoints or uniform pattern in asset levels that trigger breakpoints or the amounts of breakpoints triggered.
After considering all of the information available to it, the Board concluded that it was satisfied with the extent to which economies of scale would be shared for the benefit of the Fund’s shareholders based on currently available information and the effective advisory fees and expense ratios for the Fund at its current and reasonably anticipated asset levels. The Board noted, however, that it would continue to monitor future growth in Fund assets and the appropriateness of additional breakpoints.
Other Benefits
The Board considered other benefits to the Advisers and their affiliates from their relationships with the Fund, including the role of the Fund in supporting the variable life insurance and variable annuity products offered by The Hartford.
The Board reviewed information noting that HLIC, an affiliate of HFMC, receives fees for providing certain administrative services to the Fund and that HFMC receives fees for fund accounting and related services from the Fund. The Board considered information on profits to HLIC and HFMC for such services. The Board also considered that Hartford Administrative Services Company (“HASCO”), the Fund’s transfer agent and an affiliate of HFMC, receives transfer agency compensation from the Fund, and the Board reviewed information on the profitability of the Fund’s transfer agency function to HASCO. The Board considered information provided by HASCO indicating that the transfer agent fees charged by HASCO to the Fund were fair and reasonable based on publicly available information.
The Board also considered that Hartford Funds Distributors, LLC (“HFD”), an affiliate of HFMC, serves as principal underwriter of the Fund. As principal underwriter, HFD receives 12b-1 fees from the Fund. The Board also noted that certain affiliates of HFD distribute shares of the Fund and receive compensation in that connection.
The Board considered benefits to the Sub-adviser from its use of the Fund’s brokerage commissions to obtain soft dollar research, and representations from HFMC and the Sub-adviser that the Sub-adviser would not make any revenue-sharing payments or any other type of distribution payments to HFMC or its affiliates.
The Board considered the benefits to shareholders of being part of the Hartford Funds family of funds. The Board considered HFMC’s efforts to provide investors in the family with a broad range of investment styles and asset classes.
* * * *
Based upon its review of these various factors, among others, the Board concluded that it is in the best interests of the Fund and its shareholders for the Board to approve the Agreements for an additional year. In reaching this decision, the Board did not assign relative weights to the factors discussed above or deem any one or group of them to be controlling in and of themselves. In connection with their deliberations, the Independent Directors met separately in executive session on several occasions, with independent legal counsel and the Consultant, to review the relevant materials and consider their responsibilities under relevant laws and regulations.
| 33 |
| Hartford Global Growth HLS Fund |
| Main Risks (Unaudited) |
The main risks of investing in the Fund are described below.
Market, Selection, and Strategy Risk: The Fund’s share price may fluctuate due to market risk and/or security selections that may underperform the market or relevant benchmarks. If the sub-adviser’s investment strategy does not perform as expected, the Fund could underperform its peers or lose money. There is no guarantee the Fund will achieve its stated objective.
Foreign Investment and Emerging Markets Risk: Foreign investments can be riskier than U.S. investments. Potential risks include currency risk that may result from unfavorable exchange rates, liquidity risk if decreased demand for a security makes it difficult to sell at the desired price, and risks that stem from substantially lower trading volume on foreign markets. These risks are generally greater for investments in emerging markets, which are also subject to greater price volatility, and custodial and regulatory risks.
Growth Investing Risk: Growth investments can be volatile, and may fail to increase earnings or grow as quickly as anticipated. Growth-style investing falls in and out of favor, which may result in periods of underperformance.
Mid-cap Stock Risk: Mid-cap stocks are generally more volatile and risky and may be less liquid than large-cap stocks because they may have limited operating histories, narrow product lines, and focus on niche markets.
Active Trading Risk: Actively trading investments may result in higher costs (thus affecting performance).
| 34 |
THIS PRIVACY POLICY IS NOT PART OF THIS REPORT
Privacy Policy and Practices of The Hartford Financial Services Group, Inc. and its Affiliates
(herein called “we, our, and us”)
This Privacy Policy applies to our United States Operations
We value your trust. We are committed to the responsible: a) management; b) use; and c) protection; of Personal Information. This notice describes how we collect, disclose, and protect Personal Information.
We collect Personal Information to: a) service your Transactions with us; and b) support our business functions.
We may obtain Personal Information from: a) You; b) your Transactions with us; and c) third parties such as a consumer-reporting agency.
Based on the type of product or service You apply for or get from us, Personal Information such as: a) your name; b) your address; c) your income; d) your payment; or e) your credit history; may be gathered from sources such as applications, Transactions, and consumer reports.
To serve You and service our business, we may share certain Personal Information. We will share Personal Information, only as allowed by law, with affiliates such as: a) our insurance companies; b) our employee agents; c) our brokerage firms; and d) our administrators.
As allowed by law, we may share Personal Financial Information with our affiliates to: a) market our products; or b) market our services; to You without providing You with an option to prevent these disclosures. | We may also share Personal Information, only as allowed by law, with unaffiliated third parties including:
When allowed by law, we may share certain Personal Financial Information with other unaffiliated third parties who assist us by performing services or functions such as:
We, and third parties we partner with, may track some of the pages You visit through the use of: a) cookies; b) pixel tagging; or c) other technologies; and currently do not process or comply with any web browser’s “do not track” signal or similar mechanism that indicates a request to disable online tracking of individual users who visit our websites or use our services.
We will not sell or share your Personal Financial Information with anyone for purposes unrelated to our business functions without offering You the opportunity to:
We only disclose Personal Health Information with:
Our employees have access to Personal Information in the course of doing their jobs, such as: |
We use manual and electronic security procedures to maintain: a) the confidentiality; and b) the integrity of; Personal Information that we have. We use these procedures to guard against unauthorized access.
Some techniques we use to protect Personal Information include: a) secured files; b) user authentication; c) encryption; d) firewall technology; and e) the use of detection software.
We are responsible for and must: a) identify information to be protected; b) provide an adequate level of protection for that data; c) grant access to protected data only to those people who must use it in the performance of their job-related duties. Employees who violate our Privacy Policy will be subject to discipline, which may include ending their employment with us.
At the start of our business relationship, we will give You a copy of our current Privacy Policy.
We will also give You a copy of our current Privacy Policy once a year if You maintain a continuing business relationship with us.
We will continue to follow our Privacy Policy regarding Personal Information even when a business relationship no longer exists between us. | As used in this Privacy Notice:
Application means your request for our product or service.
Personal Financial Information means financial information such as:
Personal Health Information means health information such as:
Personal Information means information that identifies You personally and is not otherwise available to the public. It includes:
Transaction means your business dealings with us, such as:
You means an individual who has given us Personal Information in conjunction with: |
This Privacy Policy is being provided on behalf of the following affiliates of The Hartford Financial Services Group, Inc.:
1stAGChoice, Inc.; Access CoverageCorp, Inc.; Access CoverageCorp Technologies, Inc.; American Maturity Life Insurance Company; Archway 60 R, LLC; Business Management Group, Inc.; Catalyst360, LLC; Champlain Life Reinsurance Company; DMS R, LLC; Eloy R, LLC; Ersatz Corporation; First State Insurance Company; Hartford Accident and Indemnity Company; Hartford Administrative Services Company; Hartford Casualty General Agency, Inc.; Hartford Casualty Insurance Company; Hartford-Comprehensive Employee Benefit Service Company; Hartford Equity Sales Company, Inc.; Hartford Fire General Agency, Inc.; Hartford Fire Insurance Company; Hartford Funds Management Company, LLC; Hartford Funds Management Group, Inc.; Hartford HLS Series Fund II, Inc.; Hartford Insurance Company of Illinois; Hartford Insurance Company of the Midwest; Hartford Insurance Company of the Southeast; Hartford Integrated Technologies, Inc.; Hartford International Life Reassurance Corporation; Hartford Funds Distributors, LLC; Hartford Investment Management Company; Hartford Life and Accident Insurance Company; Hartford Life and Annuity Insurance Company; Hartford Life Insurance Company; Hartford Life Private Placement, LLC; Hartford Lloyd’s Corporation; Hartford Lloyd’s Insurance Company; Hartford Mezzanine Investors I, LLC; Hartford Residual Market, L.C.C.; Hartford Retirement Services, LLC; Hartford Securities Distribution Company, Inc.; Hartford Series Fund, Inc.; Hartford Specialty Insurance Services of Texas, LLC; Hartford Strategic Investments, LLC; Hartford Underwriters Insurance Company; Hartford Technology Services Company, L.L.C.; Hartford of Texas General Agency, Inc.; Hartford Underwriters General Agency, Inc.; HARTRE Company, L.C.C.; HL Investment Advisors, LLC; HLA LLC; Horizon Management Group, LLC; HRA Brokerage Services, Inc.; Lanidex Class B, LLC; M-CAP Insurance Agency, LLC; New England Insurance Company; New England Reinsurance Corporation; Nutmeg Insurance Agency, Inc.; Nutmeg Insurance Company; Pacific Insurance Company, Limited; Planco, LLC: Property and Casualty Insurance Company of Hartford; Revere R, LLC; RVR R, LLC; Sentinel Insurance Company, Ltd.; Sunstone R, LLC; Symphony R, LLC; The Evergreen Group Incorporated; The Hartford Alternative Strategies Fund; The Hartford Mutual Funds, Inc.; The Hartford Mutual Funds II, Inc.; Trumbull Flood Management, L.L.C.; Trumbull Insurance Company; Twin City Fire Insurance Company; White River Life Reinsurance Company.
HPP Revised December 2013
HARTFORD HLS FUNDS
c/o The Hartford Wealth Management - Global Annuities
P.O. Box 14293
Lexington, KY 40512-4293
HARTFORDFUNDS
hartfordfunds.com
Hartford Series Fund, Inc. is underwritten and distributed by Hartford Funds Distributors, LLC.
Hartford Series Fund, Inc. inception dates range from 1977 to date. Hartford Series Fund, Inc. is not a subsidiary of The Hartford Financial Services Group, Inc. ("The Hartford") but is underwritten, distributed by and advised by subsidiaries of The Hartford. Investments in Hartford Series Fund, Inc. are not guaranteed by The Hartford or any other entity.
This report is submitted for the general information of the shareholders of the Funds. It is not authorized for distribution unless preceded or accompanied by a current prospectus for the Funds.
Investors should carefully consider the investment objectives, risks, charges, and expenses of Hartford Funds before investing. This and other information can be found in the prospectus and summary prospectus, which can be obtained by calling 888-843-7824 (retail) or 877-836-5854 (institutional). Investors should read them carefully before they invest.
HLSAR-GG13 2-14 115539-2 Printed in U.S.A ©2013 The Hartford, Hartford, CT 06115
HARTFORDFUNDS
| HARTFORD GLOBAL RESEARCH
HLS FUND
2013 Annual Report
|
A MESSAGE FROM THE PRESIDENT
Dear Fellow Shareholders:
Thank you for investing in Hartford HLS Funds.
Market Review
U.S. equities (as represented by the S&P 500 Index) generated their strongest year since 1997 in 2013, rising 32.39% for the year. During the fourth quarter, equities rose without looking back, pushing the S&P 500 Index and the Dow Jones Industrial Average to new all-time highs. Despite previously cheering delays to quantitative-easing tapering, the stock market received an additional boost at the end of the year following the U.S. Federal Reserve’s (Fed) announcement of a $10-billion-a-month reduction in bond purchases beginning in January.
The Fed’s decision to begin tapering its bond purchases is generally considered a vote of confidence in the recovering U.S. economy. Consumer spending has stabilized, the housing market is showing steady improvement, the unemployment rate is slowly declining and economic growth clocked in at a healthy 4.1% in the third quarter. Equities have also recovered since the market low in March 2009: The S&P 500 Index has gained 173% from the market low through December 31, 2013.
Signs of improvement are also visible outside the U.S. Europe appears to have begun its own economic recovery, and emerging markets have reversed their recent lackluster performance. Fiscal policy continues to wield significant influence in today’s economy and central banks across the globe are maintaining their accommodative stances, including the appointment of Janet Yellen, who is widely expected to continue current monetary policies, to succeed Ben Bernanke as U.S. Federal Reserve chairman.
It’s important to stay abreast of domestic and international economic developments while balancing your individual investment goals. Meeting with your financial advisor on a regular basis to examine your current investment strategy can help you determine whether you are on the right track:
| • | Is your portfolio fully diversified with an appropriate mix of stocks and bonds? |
| • | Is your portfolio incorporating both domestic and international holdings to take advantage of the global economic recovery? |
| • | Are your investments still in line with your risk tolerance and investment time horizon? |
Your financial advisor can help you choose options within our fund family to navigate today’s markets with confidence.
Thank you again for investing with Hartford HLS Funds.
James Davey
President
Hartford HLS Funds
1The S&P 500 Index is a market capitalization-weighted price index composed of 500 widely held common stocks.
2The Dow Jones Industrial Average is an unmanaged, price-weighted index of 30 of the largest, most widely held stocks traded on the New York Stock Exchange.
Hartford Global Research HLS Fund
Table of Contents
This report is prepared for the general information of contract owners and qualified retirement plan participants. It is not an offer of contracts or of qualified retirement plans. It should not be used in connection with any offer, except in conjunction with the appropriate product prospectus which contains all pertinent information including the applicable sales, administrative and other charges.
The views expressed in the Fund’s Manager Discussion under ‘‘Why did the Fund perform this way?’’ and ‘‘What is the outlook?’’ are views of the Fund’s sub-adviser and portfolio management team through the end of the period and are subject to change based on market and other conditions. The Fund’s Manager Discussion is for informational purposes only and does not represent an offer, recommendation or solicitation to buy, hold or sell any security. The specific securities identified and described, if any, do not represent all of the securities purchased or sold and you should not assume that investments in the securities identified and discussed will be profitable.
| 1 |
| Hartford Global Research HLS Fund inception 01/31/2008 | |
| (sub-advised by Wellington Management Company, LLP) | |
| Investment objective – Seeks long-term capital appreciation. | |
Performance Overview 1/31/08 - 12/31/13
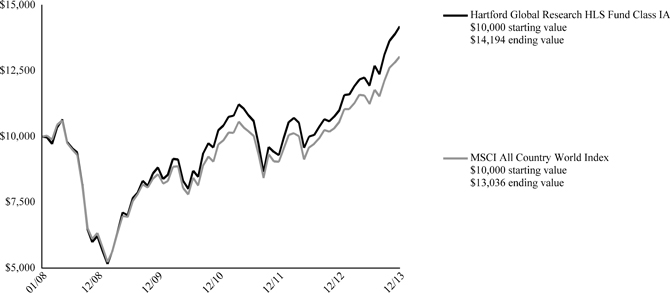
The chart above represents the hypothetical growth of a $10,000 investment in Class IA. Growth results in classes other than Class IA will vary from what is seen above due to difference in the expenses charged to those shae classes.
Average Annual Total Returns (as of 12/31/13) (1) (2)
| 1 Year | 5 Years | Since Inception▲ | ||||||||||
| Global Research IA | 29.01 | % | 17.97 | % | 6.10 | % | ||||||
| Global Research IB | 28.65 | % | 17.67 | % | 5.83 | % | ||||||
| MSCI All Country World Index | 23.44 | % | 15.53 | % | 4.58 | % | ||||||
| ▲ | Inception: 01/31/2008 |
PERFORMANCE DATA QUOTED REPRESENTS PAST PERFORMANCE AND DOES NOT GUARANTEE FUTURE RESULTS. The investment return and principal value of the investment will fluctuate so that investors’ shares, when redeemed, may be worth more or less than their original cost. Current performance may be lower or higher than the performance data quoted. To obtain performance data current to the most recent month-end, please visit our website at www.hartfordfunds.com.
Total returns presented above were calculated using the Fund’s net asset value available to shareholders for sale or redemption of Fund shares on December 31, 2013, which may exclude investment transactions as of this date. All share class returns assume the reinvestment of all distributions at net asset value and the deduction of all fund expenses.
MSCI All Country World Index is a free float-adjusted market capitalization index that is designed to measure equity market performance in the global developed and emerging markets, consisting of more than 45 developed and emerging market country indices. This index is unmanaged, and its results include reinvested dividends and/or distributions, but do not reflect the effect of sales charges, commissions, expenses or taxes.
You cannot invest directly in an index.
As of the Fund's current prospectus dated May 1, 2013, the total annual operating expense ratios for Class IA and Class IB were 1.04% and 1.29%, respectively. Actual expenses may be higher. Please see the accompanying Financial Highlights for expense ratios for the year ended December 31, 2013.
The chart and table do not reflect the deductions of taxes, sales charges or other fees which may be applied at the variable life insurance, variable annuity or qualified retirement plan product level. Any such additional sales charges or other fees or expenses would lower the contract’s or plan’s performance.
All investments are subject to risk including the possible loss of principal. For a discussion of the Fund’s risks, please see the Main Risks section of this report. For more detailed information on the risks associated with an investment in the Fund, please see the prospectus.
| 2 |
| Hartford Global Research HLS Fund |
| Manager Discussion |
| December 31, 2013 (Unaudited) |
| Portfolio Managers | |
| Cheryl M. Duckworth, CFA | Mark D. Mandel, CFA* |
| Senior Vice President and Associate Director of Global Industry Research | Director and Director of Global Industry Research |
| * Mr. Mandel supervises a team of global industry analysts that manage the Fund. Mr. Mandel is not involved in day-to-day management of the Fund. | |
How did the Fund perform?
The Class IA shares of the Hartford Global Research HLS Fund returned 29.01% for the twelve-month period ended December 31, 2013, outperforming the Fund’s benchmark, the MSCI All Country World Index, which returned 23.44% for the same period. The Fund also outperformed the 26.58% average return of the Variable Products-Underlying Funds Lipper Global Multi-Cap Growth Funds peer group, a group of funds with investment strategies similar to those of the Fund.
Why did the Fund perform this way?
Global equities returned 23.4% for the twelve-month period ended December 31, 2013, as measured by the MSCI All Country World Index. Starting in the first quarter, global equities surged as solid corporate earnings results and favorable global liquidity dynamics lifted enthusiasm for stocks. Further monetary easing by the Bank of Japan and a steadily improving U.S. economy also fueled the rally, which continued at a more modest pace in the second quarter. Solid gains in April and the first part of May paused following comments by U.S. Federal Reserve (Fed) Chairman Ben Bernanke that suggested the Fed might begin to slow quantitative easing sooner than investors anticipated. Nonetheless, equities resumed their ascent in the third quarter as the surprising “no taper” decision by the Federal Open Market Committee eased near-term concerns about rapidly rising interest rates derailing the recovery. Additionally, accommodative rhetoric from the European Central Bank, along with encouraging data in China and further evidence of a European economic recovery, contributed to a broad-based global equity rally that extended through the end of the year. In December, the year ended with an optimistic tone as investors cheered the elimination of two market overhangs: the timing of Fed tapering and the threat of another U.S. government shutdown in early 2014.
Nine of the ten sectors in the MSCI All Country World Index posted positive returns during the period. Health Care (+37%), Consumer Discretionary (+37%), and Industrials (+30%) increased the most while Materials (-0.2%) and Utilities (12%) lagged on a relative basis.
The Fund’s outperformance versus the benchmark was driven by positive security selection in all ten of the sectors. Selection was strongest in the Industrials, Health Care, and Information Technology sectors. Sector allocation, a result of the bottom-up stock selection process, also contributed modestly to the Fund’s performance, largely due to an overweight to Consumer Discretionary and an underweight to Materials. A modest cash position detracted in an upward trending market environment.
Top contributors to benchmark-relative performance during the period included Delta Airlines (Industrials), Apple (Information Technology), and FireEye (Information Technology). Shares of Delta Airlines, a U.S.-based air line carrier, rose during the first half of the period, benefitting from continued effectiveness in managing capacity and industry consolidation; shares continued to rise in the latter half of the period on strong third quarter results with solid earnings and operating profit improvement. Our underweight in consumer electronics manufacturer Apple contributed to benchmark-relative performance. The stock fell during the period as investors feared that the company may face near term pressure due to increasing competition, slowing growth rates, and compressing margins. Additionally, some investors were disappointed that Apple did not price the iPhone 5c lower to gain more traction in emerging markets. Shares of FireEye, a technology firm that helps companies fend off cyber-attacks, rose following the company’s initial public offering. Top absolute contributors during the period also included Amazon (Consumer Discretionary) and Lorillard (Consumer Staples).
The largest detractors from benchmark-relative returns were AirAsia (Industrials), Banco Santander Brasil (Financials), and Standard Chartered (Financials). Shares of low-cost airline AirAsia declined on market concern about excess capacity growth in their home market of Malaysia, as well as foreign exchange losses on dollar denominated aircraft debt. Shares of Banco Santander, a Brazil-based bank, fell during the period after the company underperformed and was forced to lay off employees. Shares of UK-based global bank Standard Chartered declined following the departures of its long-serving finance director and head of consumer banking. Additionally, the company announced that it would miss its profit targets following a $1 billion write-off against its struggling South Korean operations. Whitehaven Coal (Energy) also detracted from performance on an absolute basis.
| 3 |
| Hartford Global Research HLS Fund |
| Manager Discussion – (continued) |
| December 31, 2013 (Unaudited) |
Derivatives are not used in a significant manner in this Fund and did not have a material impact on performance during the period.
What is the outlook?
In Health Care, we believe that there will be significant developments in the nascent field of immunoncology. We continue to find interesting investment opportunities in immunotherapy and its potential to treat cancer. Within biotechnology, we are discovering smaller cap companies that appear increasingly attractive. Elsewhere in Health Care, we believe that the environment is favorable for generic drug price increases along with steady volume growth, which is creating a sustainable tailwind for retail drugstores, wholesalers and other companies in the pharmaceutical supply chain.
In Energy, we believe that the overall sector will be challenged due to supply increases and slowing oil demand from emerging markets. We also believe that investor sentiment towards the exploration and production (E&P) sector has improved dramatically with higher oil prices and we have begun to pare back our risk exposure.
In the Materials sector, we expect the metals and mining industry to continue to be challenged in 2014, with supply growing faster than demand and prices falling to marginal cost points. Our stock selection favors other subsectors within materials, container packaging and paper products, which continue to benefit from strong pricing power and a period of strong demand.
Within Industrials, we continue to have a positive view of the airline industry based on the general view that industry consolidation will continue to create value for many stakeholders.
The Fund ended the period most overweight in the Consumer Discretionary, Consumer Staples, and Industrials sectors and most underweight in the Financials, Energy, and Telecommunication Services sectors relative to the MSCI All Country World Index. The Fund’s largest absolute weightings were also in the Consumer Discretionary, Consumer Staples, and Industrials sectors.
Diversification by Country
as of December 31, 2013
| Percentage of | ||||
| Country | Net Assets | |||
| Australia | 2.0 | % | ||
| Austria | 0.2 | |||
| Belgium | 2.3 | |||
| Brazil | 1.4 | |||
| British Virgin Islands | 0.3 | |||
| Canada | 4.6 | |||
| Cayman Islands | 0.1 | |||
| China | 1.1 | |||
| Cyprus | 0.0 | |||
| Denmark | 0.6 | |||
| Finland | 0.2 | |||
| France | 4.8 | |||
| Germany | 2.0 | |||
| Greece | 0.2 | |||
| Hong Kong | 1.2 | |||
| India | 0.7 | |||
| Ireland | 0.2 | |||
| Israel | 0.6 | |||
| Italy | 0.7 | |||
| Japan | 4.4 | |||
| Kenya | 0.0 | |||
| Luxembourg | 0.6 | |||
| Malaysia | 0.4 | |||
| Mexico | 0.1 | |||
| Netherlands | 2.4 | |||
| Norway | 1.4 | |||
| Panama | 0.1 | |||
| Papua New Guinea | 0.0 | |||
| Philippines | 0.2 | |||
| Poland | 0.1 | |||
| Portugal | 0.1 | |||
| Singapore | 0.0 | |||
| South Korea | 1.8 | |||
| Spain | 0.7 | |||
| Sweden | 0.5 | |||
| Switzerland | 2.0 | |||
| Taiwan | 0.4 | |||
| Thailand | 0.1 | |||
| Turkey | 0.4 | |||
| United Kingdom | 8.3 | |||
| United States | 51.0 | |||
| Short-Term Investments | 1.9 | |||
| Other Assets and Liabilities | (0.1) | |||
| Total | 100.0 | % | ||
| 4 |
| Hartford Global Research HLS Fund |
| Schedule of Investments |
| December 31, 2013 |
| (000’s Omitted) |
| Shares or Principal Amount | Market Value ╪ | |||||||
| COMMON STOCKS - 97.4% | ||||||||
| Automobiles and Components - 1.5% | ||||||||
| 3 | Bayerische Motoren Werke (BMW) AG | $ | 305 | |||||
| 16 | Ford Motor Co. | 245 | ||||||
| 30 | Nissan Motor Co., Ltd. | 254 | ||||||
| 6 | Toyota Motor Corp. | 370 | ||||||
| 1,174 | ||||||||
| Banks - 9.3% | ||||||||
| 37 | Banco ABC Brasil S.A. | 199 | ||||||
| 14 | Banco Bilbao Vizcaya Argentaria S.A. | 172 | ||||||
| 22 | Banco Santander Brasil S.A. | 131 | ||||||
| 6 | BNP Paribas | 493 | ||||||
| 12 | BS Financial Group, Inc. ● | 187 | ||||||
| 6 | Canadian Imperial Bank of Commerce | 529 | ||||||
| 2 | Citizens & Northern Corp. | 31 | ||||||
| 9 | Concentradora Fibra Hotelera | 15 | ||||||
| 21 | Credit Agricole S.A. | 272 | ||||||
| 14 | DGB Financial Group, Inc. ● | 225 | ||||||
| 29 | DNB ASA | 520 | ||||||
| 6 | Erste Group Bank AG | 197 | ||||||
| 7 | First National Financial Corp. | 142 | ||||||
| 4 | Genworth MI Canada, Inc. | 145 | ||||||
| 1 | Gronlandsbanken | 78 | ||||||
| 3 | Hana Financial Holdings | 140 | ||||||
| 7 | Home Capital Group, Inc. | 542 | ||||||
| 20 | HSBC Holdings plc | 221 | ||||||
| 20 | Itau Unibanco Banco Multiplo S.A. ADR | 274 | ||||||
| 7 | KBC Groep N.V. | 422 | ||||||
| 35 | Metropolitan Bank & Trust Co. ☼ | 60 | ||||||
| 12 | Mizrahi Tefahot Bank Ltd. | 153 | ||||||
| 6 | National Bank of Canada | 498 | ||||||
| 3 | Shinhan Financial Group Co., Ltd. ● | 139 | ||||||
| 8 | Societe Generale Class A | 481 | ||||||
| 28 | Spar Nord Bank A/S ● | 254 | ||||||
| 14 | SpareBank 1 SR Bank ASA | 144 | ||||||
| 26 | Standard Chartered plc | 579 | ||||||
| 254 | Turkiye Sinai Kalkinma Bankasi A.S. | 216 | ||||||
| 7,459 | ||||||||
| Capital Goods - 7.7% | ||||||||
| 1 | AGCO Corp. | 81 | ||||||
| 2 | Airbus Group N.V. | 125 | ||||||
| 4 | AMETEK, Inc. | 185 | ||||||
| – | Arcam AB ● | 40 | ||||||
| 13 | BAE Systems plc | 94 | ||||||
| 10 | Balfour Beatty plc | 48 | ||||||
| 2 | Boeing Co. | 259 | ||||||
| 1 | Brenntag AG | 182 | ||||||
| 1 | Carlisle Cos., Inc. | 42 | ||||||
| 2 | Caterpillar, Inc. | 142 | ||||||
| 4 | Colfax Corp. ● | 274 | ||||||
| 5 | Compagnie De Saint-Gobain | 258 | ||||||
| – | Curtis-Wright Corp. | 22 | ||||||
| 3 | Danaher Corp. | 260 | ||||||
| 1 | Dover Corp. | 107 | ||||||
| 2 | Eaton Corp. plc | 158 | ||||||
| – | Esterline Technologies Corp. ● | 24 | ||||||
| 20 | General Electric Co. | 568 | ||||||
| 7 | GrafTech International Ltd. ● | 77 | ||||||
| 2 | Honeywell International, Inc. | 222 | ||||||
| 3 | IDEX Corp. | 193 | ||||||
| 3 | Illinois Tool Works, Inc. | 235 | ||||||
| 2 | Ingersoll-Rand plc | 149 | ||||||
| 7 | KBR, Inc. | 224 | ||||||
| 1 | Lockheed Martin Corp. | 147 | ||||||
| 10 | Luxfer Holdings plc | 199 | ||||||
| – | Moog, Inc. Class A ● | 23 | ||||||
| – | Northrop Grumman Corp. | 33 | ||||||
| 3 | Pentair Ltd. | 254 | ||||||
| – | Precision Castparts Corp. | 74 | ||||||
| 1 | Raytheon Co. | 119 | ||||||
| 6 | Rexel S.A. | 163 | ||||||
| 7 | Rolls-Royce Holdings plc | 143 | ||||||
| 5 | Russel Metals, Inc. | 136 | ||||||
| 1 | Safran S.A. | 89 | ||||||
| 38 | Sinopec Engineering (Group) Co., Ltd. | 56 | ||||||
| 3 | United Technologies Corp. | 304 | ||||||
| 2 | Vallourec S.A. | 106 | ||||||
| 3 | Vinci S.A. | 212 | ||||||
| 2 | WESCO International, Inc. ● | 142 | ||||||
| 6,169 | ||||||||
| Commercial and Professional Services - 0.7% | ||||||||
| 4 | ADT (The) Corp. | 178 | ||||||
| 1 | Equifax, Inc. ● | 57 | ||||||
| 2 | Huron Consulting Group, Inc. ● | 136 | ||||||
| 2 | Nielsen Holdings N.V. | 79 | ||||||
| 3 | Quintiles Transnational Holdings ● | 126 | ||||||
| 7 | Transfield Services Ltd. | 6 | ||||||
| 582 | ||||||||
| Consumer Durables and Apparel - 2.2% | ||||||||
| 1 | Adidas AG | 141 | ||||||
| 7 | Coway Co., Ltd. | 441 | ||||||
| 3 | Fifth & Pacific Cos., Inc. ● | 97 | ||||||
| 3 | Lululemon Athletica, Inc. ● | 151 | ||||||
| 1 | LVMH Moet Hennessy Louis Vuitton S.A. | 205 | ||||||
| 3 | NIKE, Inc. Class B | 253 | ||||||
| – | Pulte Group, Inc. | 5 | ||||||
| 1 | PVH Corp. | 88 | ||||||
| 1 | Ralph Lauren Corp. | 99 | ||||||
| 67 | Samsonite International S.A. | 203 | ||||||
| 106 | Sunny Optical Technology Group | 103 | ||||||
| 1,786 | ||||||||
| Consumer Services - 1.0% | ||||||||
| 1 | Churchill Downs, Inc. | 48 | ||||||
| 23 | Domino's Pizza Enterprises Ltd. | 332 | ||||||
| – | Extended Stay America, Inc. ● | 5 | ||||||
| 1 | Melia Hotels International S.A. | 8 | ||||||
| 17 | MGM China Holdings Ltd. | 73 | ||||||
| 2 | Norwegian Cruise Line Holdings Ltd. ● | 77 | ||||||
| – | Panera Bread Co. Class A ● | 72 | ||||||
| 6 | Sands China Ltd. | 50 | ||||||
| – | Starwood Hotels & Resorts, Inc. | 30 | ||||||
| – | Vail Resorts, Inc. | 10 | ||||||
| – | Whitbread plc | 28 | ||||||
| – | Wyndham Worldwide Corp. | 34 | ||||||
| 767 | ||||||||
| Diversified Financials - 4.0% | ||||||||
| 9 | ARA Asset Management | 13 | ||||||
| 99 | Asia Sermkij Leasing plc | 49 | ||||||
| 16 | Atlas Mara Co-Nvest Ltd. ● | 196 | ||||||
| 22 | CETIP S.A. - Mercados Organizado | 228 | ||||||
The accompanying notes are an integral part of these financial statements.
| 5 |
| Hartford Global Research HLS Fund |
| Schedule of Investments – (continued) |
| December 31, 2013 |
| (000’s Omitted) |
| Shares or Principal Amount | Market Value ╪ | |||||||
| COMMON STOCKS - 97.4% - (continued) | ||||||||
| Diversified Financials - 4.0% - (continued) | ||||||||
| 67 | Challenger Financial Services Group Ltd. | $ | 370 | |||||
| 8 | Citigroup, Inc. | 391 | ||||||
| 10 | EFG International AG ● | 150 | ||||||
| 23 | ING Groep N.V. ● | 327 | ||||||
| 6 | JP Morgan Chase & Co. | 332 | ||||||
| 10 | Julius Baer Group Ltd. | 472 | ||||||
| 22 | Mitsubishi UFJ Lease & Finance Co., Ltd. ☼ | 137 | ||||||
| 29 | UBS AG | 553 | ||||||
| 3,218 | ||||||||
| Energy - 8.2% | ||||||||
| 2 | Anadarko Petroleum Corp. | 140 | ||||||
| 2 | Apache Corp. | 162 | ||||||
| 3 | Athlon Energy, Inc. ● | 98 | ||||||
| 73 | Beach Energy Ltd. | 93 | ||||||
| 23 | BG Group plc | 485 | ||||||
| 42 | BP plc | 344 | ||||||
| 4 | BP plc ADR | 208 | ||||||
| 24 | Buru Energy Ltd. ● | 37 | ||||||
| 20 | Cairn Energy plc ● | 89 | ||||||
| 3 | Canadian Natural Resources Ltd. ADR | 92 | ||||||
| 3 | Chevron Corp. | 421 | ||||||
| 32 | CNOOC Ltd. | 60 | ||||||
| 5 | Cobalt International Energy, Inc. ● | 75 | ||||||
| 3 | Consol Energy, Inc. | 121 | ||||||
| 1 | Dril-Quip, Inc. ● | 63 | ||||||
| 7 | Enbridge, Inc. | 293 | ||||||
| 5 | EnCana Corp. ADR | 94 | ||||||
| 1 | EOG Resources, Inc. | 202 | ||||||
| 1 | Eurasia Drilling Co., Ltd. § | 66 | ||||||
| 3 | Exxon Mobil Corp. | 341 | ||||||
| 7 | Galp Energia SGPS S.A. | 114 | ||||||
| 3 | Halliburton Co. | 167 | ||||||
| 5 | Imperial Oil Ltd. | 202 | ||||||
| 11 | Karoon Gas Australia Ltd. ● | 43 | ||||||
| 39 | Kunlun Energy Co., Ltd. | 70 | ||||||
| 1 | Marathon Petroleum Corp. | 107 | ||||||
| 5 | MEG Energy Corp. ● | 138 | ||||||
| 1 | National Oilwell Varco, Inc. | 90 | ||||||
| 100 | New Standard Energy Ltd. ● | 11 | ||||||
| 14 | Oil Search Ltd. | 99 | ||||||
| 18 | Ophilr Energy plc ● | 99 | ||||||
| 6 | Patterson-UTI Energy, Inc. | 155 | ||||||
| 80 | PetroChina Co., Ltd. | 88 | ||||||
| 8 | Petroleo Brasileiro S.A. ADR | 113 | ||||||
| 3 | Phillips 66 | 243 | ||||||
| 1 | Pioneer Natural Resources Co. | 242 | ||||||
| 34 | Polskie Gornictwo Naftowe I | 57 | ||||||
| 6 | Reliance Industries Ltd. | 81 | ||||||
| 4 | Repsol S.A. | 105 | ||||||
| 4 | Repsol S.A. - Rights ● | 3 | ||||||
| 2 | Royal Dutch Shell plc | 69 | ||||||
| 5 | Santos Ltd. | 64 | ||||||
| 1 | Schlumberger Ltd. | 106 | ||||||
| 3 | Southwestern Energy Co. ● | 117 | ||||||
| 6 | Statoil ASA | 142 | ||||||
| 2 | Superior Energy Services, Inc. ● | 47 | ||||||
| – | Technip S.A. | 23 | ||||||
| 2 | Tourmaline Oil Corp. ● | 70 | ||||||
| 9 | Trican Well Service Ltd. | 114 | ||||||
| 7 | Tullow Oil plc | 94 | ||||||
| 6,557 | ||||||||
| Food and Staples Retailing - 1.5% | ||||||||
| 6 | Carrefour S.A. | 247 | ||||||
| 2 | Costco Wholesale Corp. | 259 | ||||||
| 1 | CVS Caremark Corp. | 103 | ||||||
| 5 | Seven & I Holdings Co., Ltd. | 219 | ||||||
| 3 | Walgreen Co. | 146 | ||||||
| 7 | Woolworths Ltd. | 202 | ||||||
| 1,176 | ||||||||
| Food, Beverage and Tobacco - 8.3% | ||||||||
| 10 | Altria Group, Inc. | 403 | ||||||
| 10 | Anheuser-Busch InBev N.V. | 1,105 | ||||||
| 6 | British American Tobacco plc | 322 | ||||||
| 34 | Diageo Capital plc | 1,111 | ||||||
| 13 | Hillshire (The) Brands Co. | 432 | ||||||
| 9 | Imperial Tobacco Group plc | 337 | ||||||
| 39 | ITC Ltd. | 205 | ||||||
| 10 | Lorillard, Inc. | 522 | ||||||
| 31 | Mondelez International, Inc. | 1,081 | ||||||
| 7 | Monster Beverage Corp. ● | 441 | ||||||
| 6 | New Britain Palm Oil Ltd. | 39 | ||||||
| 2 | Philip Morris International, Inc. | 182 | ||||||
| 51 | Treasury Wine Estates Ltd. | 221 | ||||||
| 5 | Unilever N.V. | 182 | ||||||
| 2 | United Spirits Ltd. | 105 | ||||||
| 6,688 | ||||||||
| Health Care Equipment and Services - 3.2% | ||||||||
| 1 | Abbott Laboratories | 52 | ||||||
| 1 | Aetna, Inc. | 85 | ||||||
| 3 | Al Noor Hospitals Group ● | 43 | ||||||
| 8 | Boston Scientific Corp. ● | 99 | ||||||
| 1 | Cardinal Health, Inc. | 87 | ||||||
| 1 | Cie Generale d'Optique Essilor International S.A. | 77 | ||||||
| 2 | CIGNA Corp. | 158 | ||||||
| 1 | Community Health Systems, Inc. ● | 23 | ||||||
| 3 | Covidien plc | 202 | ||||||
| 1 | Envision Healthcare Holdings ● | 46 | ||||||
| 4 | HCA Holdings, Inc. ● | 198 | ||||||
| 1 | Hologic, Inc. ● | 26 | ||||||
| – | M3, Inc. | 115 | ||||||
| 2 | McKesson Corp. | 253 | ||||||
| 3 | Medtronic, Inc. | 178 | ||||||
| 7 | NMC Health plc | 51 | ||||||
| 3 | Olympus Corp. | 83 | ||||||
| 50 | Phoenix Healthcare Group Co., Ltd. ● | 80 | ||||||
| 6 | Smith & Nephew plc | 89 | ||||||
| 1 | St. Jude Medical, Inc. | 90 | ||||||
| 2 | Stryker Corp. | 119 | ||||||
| – | Sysmex Corp. | 18 | ||||||
| 3 | UnitedHealth Group, Inc. | 242 | ||||||
| – | Universal Health Services, Inc. Class B | 5 | ||||||
| 1 | Zimmer Holdings, Inc. | 112 | ||||||
| 2,531 | ||||||||
| Household and Personal Products - 0.5% | ||||||||
| 2 | Beiersdorf AG | 165 | ||||||
| 3 | Colgate-Palmolive Co. | 175 | ||||||
| – | Coty, Inc. | 5 | ||||||
The accompanying notes are an integral part of these financial statements.
| 6 |
| Shares or Principal Amount | Market Value ╪ | |||||||
| COMMON STOCKS - 97.4% - (continued) | ||||||||
| Household and Personal Products - 0.5% - (continued) | ||||||||
| 31 | Jyothy Laboratories Ltd. | $ | 95 | |||||
| 440 | ||||||||
| Insurance - 2.5% | ||||||||
| 3 | Ageas | 141 | ||||||
| 15 | AXA S.A. | 428 | ||||||
| 18 | Delta Lloyd N.V. | 438 | ||||||
| 74 | Direct Line Insurance Group plc | 307 | ||||||
| 7 | Sony Financial Holdings, Inc. | 129 | ||||||
| 20 | Storebrand ASA | 124 | ||||||
| 13 | XL Group plc | 399 | ||||||
| 1,966 | ||||||||
| Materials - 5.1% | ||||||||
| 2 | Akzo Nobel N.V. | 155 | ||||||
| 2 | Allegheny Technologies, Inc. | 80 | ||||||
| 4 | Anglo American plc | 84 | ||||||
| 3 | ArcelorMittal ADR | 56 | ||||||
| 4 | Asahi Kasei Corp. | 29 | ||||||
| 10 | AuRico Gold, Inc. | 37 | ||||||
| 5 | AZ Electronic Materials S.A. | 34 | ||||||
| 3 | Ball Corp. | 139 | ||||||
| 3 | Billerud | 34 | ||||||
| 2 | Boise Cascade Co. ● | 55 | ||||||
| 1 | Cabot Corp. | 48 | ||||||
| 1 | Celanese Corp. | 58 | ||||||
| 54 | China Shanshui Cement Group | 23 | ||||||
| 12 | Constellium N.V. ● | 269 | ||||||
| 2 | Crown Holdings, Inc. ● | 91 | ||||||
| 4 | Dow Chemical Co. | 199 | ||||||
| 7 | EcoSynthetix, Inc. ● | 18 | ||||||
| 62 | Fosun International | 61 | ||||||
| 11 | Graphic Packaging Holding Co. ● | 102 | ||||||
| 2 | HeidelbergCement AG | 137 | ||||||
| 128 | Huabao International Holdings Ltd. | 71 | ||||||
| 2 | International Paper Co. | 100 | ||||||
| 4 | JSR Corp. | 82 | ||||||
| 3 | Lafarge S.A. | 199 | ||||||
| 1 | Lanxess | 68 | ||||||
| 2 | Louisiana-Pacific Corp. ● | 40 | ||||||
| 2 | LyondellBasell Industries Class A | 167 | ||||||
| 1 | MeadWestvaco Corp. | 19 | ||||||
| 2 | Methanex Corp. ADR | 114 | ||||||
| 7 | Mitsubishi Chemical Holdings | 30 | ||||||
| 368 | Mongolian Mining Corp. ● | 49 | ||||||
| 1 | Monsanto Co. | 172 | ||||||
| 1 | Mosaic Co. | 29 | ||||||
| 14 | Nine Dragons Paper Holdings | 13 | ||||||
| 3 | Nippon Shokubai Co., Ltd. | 31 | ||||||
| 8 | NuFarm Ltd. | 32 | ||||||
| 5 | Omnova Solutions, Inc. ● | 49 | ||||||
| 17 | Osisko Mining Corp. ● | 74 | ||||||
| 3 | Owens-Illinois, Inc. ● | 90 | ||||||
| 51 | Platinum Group Metals Ltd. ● | 61 | ||||||
| 1 | Posco ADR | 79 | ||||||
| 6 | Rexam plc | 49 | ||||||
| 2 | Rio Tinto plc | 110 | ||||||
| – | Sherwin-Williams Co. | 91 | ||||||
| 1 | Shin-Etsu Chemical Co., Ltd. | 60 | ||||||
| 4 | Smurfit Kappa Group plc | 98 | ||||||
| 10 | Synthomer plc | 43 | ||||||
| 2 | Tikkurila Oyj | 58 | ||||||
| 8 | Ube Industries Ltd. | 17 | ||||||
| 1 | Umicore S.A. | 64 | ||||||
| 5 | Universal Stainless & Alloy Products, Inc. ● | 172 | ||||||
| – | Westlake Chemical Corp. | 34 | ||||||
| 4,074 | ||||||||
| Media - 4.7% | ||||||||
| 10 | British Sky Broadcasting Group plc | 139 | ||||||
| 2 | Charter Communications, Inc. ● | 217 | ||||||
| 4 | Comcast Corp. Class A | 225 | ||||||
| 3 | Comcast Corp. Special Class A | 158 | ||||||
| 3 | CyberAgent, Inc. ☼ | 110 | ||||||
| 3 | Dentsu, Inc. | 102 | ||||||
| 2 | DirecTV ● | 151 | ||||||
| 2 | DreamWorks Animation SKG, Inc. ● | 74 | ||||||
| 2 | Fuji Media Holdings, Inc. | 41 | ||||||
| 7 | Havas S.A. | 60 | ||||||
| 1 | Imax Corp. ● | 29 | ||||||
| 6 | Interpublic Group of Cos., Inc. | 108 | ||||||
| 1 | Liberty Global plc ● | 109 | ||||||
| 18 | Megacable Holdings - CPO | 60 | ||||||
| 11 | Pandora Media, Inc. ● | 295 | ||||||
| 10 | Reed Elsevier Capital, Inc. | 149 | ||||||
| 4 | SES Global | 132 | ||||||
| 3 | SES Global S.A. | 96 | ||||||
| 3 | Thomson Reuters Corp. | 96 | ||||||
| 3 | Time Warner Cable, Inc. | 375 | ||||||
| 4 | Time Warner, Inc. | 302 | ||||||
| 3 | TV Asahi Corp. | 61 | ||||||
| 9 | TVA S.A. | 46 | ||||||
| 6 | United Business Media Ltd. | 67 | ||||||
| 8 | Walt Disney Co. | 606 | ||||||
| 3,808 | ||||||||
| Pharmaceuticals, Biotechnology and Life Sciences - 7.2% | ||||||||
| 1 | Acorda Therapeutics, Inc. ● | 30 | ||||||
| 1 | Actavis plc ● | 162 | ||||||
| 1 | Actelion Ltd. | 53 | ||||||
| 1 | Agilent Technologies, Inc. | 61 | ||||||
| 1 | Algeta ASA ● | 83 | ||||||
| 5 | Alkermes plc ● | 220 | ||||||
| 3 | Almirall S.A. | 44 | ||||||
| 1 | Alnylam Pharmaceuticals, Inc. ● | 54 | ||||||
| 16 | Arena Pharmaceuticals, Inc. ● | 95 | ||||||
| 1 | Astellas Pharma, Inc. | 78 | ||||||
| 3 | AstraZeneca plc ADR | 168 | ||||||
| 2 | Auxilium Pharmaceuticals, Inc. ● | 38 | ||||||
| 1 | Biogen Idec, Inc. ● | 183 | ||||||
| 11 | Bristol-Myers Squibb Co. | 587 | ||||||
| 1 | Celgene Corp. ● | 154 | ||||||
| 1 | Covance, Inc. ● | 64 | ||||||
| 1 | Cubist Pharmaceuticals, Inc. ● | 61 | ||||||
| 6 | Daiichi Sankyo Co., Ltd. | 103 | ||||||
| 2 | Eisai Co., Ltd. | 81 | ||||||
| 7 | Eli Lilly & Co. | 342 | ||||||
| 12 | Exelixis, Inc. ● | 72 | ||||||
| 5 | Forest Laboratories, Inc. ● | 293 | ||||||
| 5 | Gilead Sciences, Inc. ● | 382 | ||||||
| 2 | H. Lundbeck A/S | 49 | ||||||
| 2 | Immunogen, Inc. ● | 25 | ||||||
| 1 | Incyte Corp. ● | 66 | ||||||
| 2 | Ironwood Pharmaceuticals, Inc. ● | 23 | ||||||
The accompanying notes are an integral part of these financial statements.
| 7 |
| Hartford Global Research HLS Fund |
| Schedule of Investments – (continued) |
| December 31, 2013 |
| (000’s Omitted) |
| Shares or Principal Amount | Market Value ╪ | |||||||
| COMMON STOCKS - 97.4% - (continued) | ||||||||
| Pharmaceuticals, Biotechnology and Life Sciences - 7.2% - (continued) | ||||||||
| 2 | Johnson & Johnson | $ | 140 | |||||
| 3 | Medicines Co. ● | 108 | ||||||
| 9 | Merck & Co., Inc. | 428 | ||||||
| 2 | Mylan, Inc. ● | 66 | ||||||
| 4 | NPS Pharmaceuticals, Inc. ● | 128 | ||||||
| 1 | Ono Pharmaceutical Co., Ltd. | 54 | ||||||
| 2 | Regeneron Pharmaceuticals, Inc. ● | 440 | ||||||
| 1 | Roche Holding AG | 141 | ||||||
| – | Salix Pharmaceuticals Ltd. ● | 17 | ||||||
| 1 | Seattle Genetics, Inc. ● | 55 | ||||||
| 8 | Shionogi & Co., Ltd. | 184 | ||||||
| 6 | Teva Pharmaceutical Industries Ltd. ADR | 247 | ||||||
| 2 | UCB S.A. | 131 | ||||||
| 1 | Vertex Pharmaceuticals, Inc. ● | 85 | ||||||
| 5,795 | ||||||||
| Real Estate - 2.0% | ||||||||
| – | Acadia Realty Trust REIT | 9 | ||||||
| – | Alexander & Baldwin, Inc. | 16 | ||||||
| 1 | American Assets Trust, Inc. REIT | 19 | ||||||
| – | American Tower Corp. REIT | 25 | ||||||
| – | AvalonBay Communities, Inc. REIT | 44 | ||||||
| 16 | Ayala Land, Inc. | 9 | ||||||
| 15 | Beni Stabili S.p.A. | 10 | ||||||
| 3 | Big Yellow Group REIT | 23 | ||||||
| – | Boston Properties, Inc. REIT | 30 | ||||||
| – | Camden Property Trust REIT | 15 | ||||||
| 2 | Cheung Kong Holdings Ltd. | 37 | ||||||
| 5 | Corporacion Inmobiliaria Vesta S. de RL de C.V. | 10 | ||||||
| 1 | Cousins Properties, Inc. REIT | 15 | ||||||
| – | Daito Trust Construction Co., Ltd. | 34 | ||||||
| 1 | DDR Corp. REIT | 17 | ||||||
| 1 | Derwent London plc REIT | 38 | ||||||
| 1 | Deutsche Annington Immobile ● | 18 | ||||||
| – | Deutsche Wohnen A.G. | 9 | ||||||
| 16 | Dexus Property Group REIT | 15 | ||||||
| 1 | Douglas Emmett, Inc. REIT | 29 | ||||||
| – | EastGroup Properties, Inc. REIT | 19 | ||||||
| 1 | Equity Lifestyle Properties, Inc. REIT | 24 | ||||||
| – | Essex Property Trust, Inc. REIT | 46 | ||||||
| 1 | EuroBank Properties REIT ● | 13 | ||||||
| – | Extra Space Storage, Inc. REIT | 14 | ||||||
| 2 | Fastighets AB Balder ● | 16 | ||||||
| 1 | First Industrial Realty Trust, Inc. REIT | 20 | ||||||
| 2 | Forest City Enterprises, Inc. REIT ● | 32 | ||||||
| 1 | Gagfah S.A. ● | 18 | ||||||
| 3 | General Growth Properties, Inc. REIT | 53 | ||||||
| 8 | Goodman Group REIT | 34 | ||||||
| 2 | Hammerson plc REIT | 19 | ||||||
| 1 | Health Care, Inc. REIT | 44 | ||||||
| 6 | Hibernia REIT ● | 10 | ||||||
| 2 | Host Hotels & Resorts, Inc. REIT | 30 | ||||||
| 6 | Hysan Development Co., Ltd. | 27 | ||||||
| – | Industrial & Infrastructure Fund Investment Corp. REIT | 33 | ||||||
| – | Japan Logistics Fund REIT | 42 | ||||||
| 1 | Kennedy-Wilson Holdings, Inc. | 11 | ||||||
| – | Kilroy Realty Corp. REIT | 12 | ||||||
| 2 | Land Securities Group plc REIT | 36 | ||||||
| 6 | Link (The) REIT | 30 | ||||||
| 4 | Londonmetric Property plc | 9 | ||||||
| 19 | Mirvac Group REIT | 28 | ||||||
| 4 | Mitsubishi Estate Co., Ltd. | 107 | ||||||
| 3 | Mitsui Fudosan Co., Ltd. | 93 | ||||||
| – | Public Storage REIT | 45 | ||||||
| 1 | Rayonier, Inc. REIT | 21 | ||||||
| – | RLJ Lodging Trust REIT | 10 | ||||||
| 39 | Robinsons Land Corp. | 18 | ||||||
| – | Simon Property Group, Inc. REIT | 73 | ||||||
| – | SL Green Realty Corp. REIT | 36 | ||||||
| 2 | Sun Hung Kai Properties Ltd. | 30 | ||||||
| – | Taubman Centers, Inc. REIT | 18 | ||||||
| – | Unibail Rodamco REIT | 62 | ||||||
| 3 | Unite Group plc | 22 | ||||||
| – | Wereldhave N.V. REIT | 12 | ||||||
| 3 | Westfield Group REIT | 31 | ||||||
| 1 | Wihlborgs Fastigheter A.B. | 18 | ||||||
| 1,638 | ||||||||
| Retailing - 6.3% | ||||||||
| 3 | Amazon.com, Inc. ● | 1,135 | ||||||
| – | AutoZone, Inc. ● | 148 | ||||||
| 5 | Best Buy Co., Inc. | 210 | ||||||
| 4 | Dollar Tree, Inc. ● | 201 | ||||||
| 2 | DSW, Inc. | 66 | ||||||
| 2 | Five Below, Inc. ● | 82 | ||||||
| 3 | GNC Holdings, Inc. | 147 | ||||||
| 5 | Hennes & Mauritz Ab | 240 | ||||||
| 2 | HSN, Inc. | 124 | ||||||
| 91 | Intime Retail Group Co., Ltd. | 95 | ||||||
| 3 | Kohl's Corp. | 159 | ||||||
| 10 | Lowe's Cos., Inc. | 519 | ||||||
| 26 | Marks & Spencer Group plc | 189 | ||||||
| 10 | Moncler S.p.A. ● | 217 | ||||||
| – | Netflix, Inc. ● | 38 | ||||||
| 1 | PetSmart, Inc. | 87 | ||||||
| 4 | Pier 1 Imports, Inc. | 93 | ||||||
| – | Priceline.com, Inc. ● | 329 | ||||||
| 19 | Rakuten, Inc. | 285 | ||||||
| 1 | Ross Stores, Inc. | 112 | ||||||
| 1 | Ryohin Keikaku Co., Ltd. | 108 | ||||||
| 3 | TJX Cos., Inc. | 207 | ||||||
| 1 | TripAdvisor, Inc. ● | 96 | ||||||
| 10 | World Duty Free S.p.A. ●☼ | 127 | ||||||
| 5,014 | ||||||||
| Semiconductors and Semiconductor Equipment - 1.6% | ||||||||
| 4 | ASM Pacific Technology Ltd. | 35 | ||||||
| 1 | ASML Holding N.V. | 114 | ||||||
| 3 | Broadcom Corp. Class A | 86 | ||||||
| 4 | First Solar, Inc. ● | 215 | ||||||
| 4 | Hynix Semiconductor, Inc. ● | 134 | ||||||
| 1 | International Rectifier Corp. ● | 20 | ||||||
| 2 | Maxim Integrated Products, Inc. | 49 | ||||||
| 1 | Montage Technology Group Ltd. ● | 10 | ||||||
| 9 | NXP Semiconductors N.V. ● | 426 | ||||||
| 1 | Silicon Laboratories, Inc. ● | 48 | ||||||
The accompanying notes are an integral part of these financial statements.
| 8 |
| Shares or Principal Amount | Market Value ╪ | |||||||
| COMMON STOCKS - 97.4% - (continued) | ||||||||
| Semiconductors and Semiconductor Equipment - 1.6% - (continued) | ||||||||
| 46 | Taiwan Semiconductor Manufacturing Co., Ltd. | $ | 162 | |||||
| 1,299 | ||||||||
| Software and Services - 6.6% | ||||||||
| 3 | Accenture plc | 266 | ||||||
| 9 | Activision Blizzard, Inc. ‡ | 163 | ||||||
| 4 | Akamai Technologies, Inc. ● | 170 | ||||||
| 1 | Alliance Data Systems Corp. ●‡ | 228 | ||||||
| 3 | Autodesk, Inc. ● | 161 | ||||||
| 2 | Automatic Data Processing, Inc. | 156 | ||||||
| 1 | CACI International, Inc. Class A ● | 40 | ||||||
| 6 | Cadence Design Systems, Inc. ● | 86 | ||||||
| 3 | Cognizant Technology Solutions Corp. ● | 344 | ||||||
| 4 | Dropbox, Inc. ⌂●† | 48 | ||||||
| 10 | eBay, Inc. ● | 545 | ||||||
| 6 | Facebook, Inc. ● | 322 | ||||||
| 8 | Genpact Ltd. ● | 141 | ||||||
| 1 | Google, Inc. ● | 897 | ||||||
| 3 | Heartland Payment Systems, Inc. | 137 | ||||||
| 21 | Higher One Holdings, Inc. ● | 202 | ||||||
| 1 | LinkedIn Corp. Class A ● | 170 | ||||||
| 5 | Mavenir Systems, Inc. ● | 59 | ||||||
| 1 | Micros Systems, Inc. ● | 37 | ||||||
| 3 | Oracle Corp. | 112 | ||||||
| 4 | Sumisho Computer Systems Corp. ☼ | 112 | ||||||
| 2 | Tencent Holdings Ltd. | 115 | ||||||
| – | Twitter, Inc. ● | 30 | ||||||
| 2 | Visa, Inc. | 401 | ||||||
| – | WEX, Inc. ● | 31 | ||||||
| 7 | Yahoo!, Inc. ● | 299 | ||||||
| 5,272 | ||||||||
| Technology Hardware and Equipment - 3.5% | ||||||||
| 23 | AAC Technologies Holdings, Inc. | 110 | ||||||
| 13 | Advantech Co., Ltd. | 93 | ||||||
| 1 | Allegion plc ● | 36 | ||||||
| 2 | Apple, Inc. | 875 | ||||||
| 3 | Calix, Inc. ● | 33 | ||||||
| 11 | Delta Electronics, Inc. | 63 | ||||||
| 10 | EMC Corp. | 251 | ||||||
| 1 | F5 Networks, Inc. ● | 57 | ||||||
| 9 | Juniper Networks, Inc. ● | 197 | ||||||
| 1 | National Instruments Corp. | 24 | ||||||
| 3 | Palo Alto Networks, Inc. ● | 179 | ||||||
| – | QIWI plc ADR | 13 | ||||||
| 9 | Qualcomm, Inc. | 680 | ||||||
| 1 | Rogers Corp. ● | 74 | ||||||
| 1 | Stratasys Ltd. ● | 91 | ||||||
| 2,776 | ||||||||
| Telecommunication Services - 2.9% | ||||||||
| 26 | Axiata Group Berhad | 55 | ||||||
| 1 | BCE, Inc. | 57 | ||||||
| 48 | Bezeq Israeli Telecommunication Corp., Ltd. | 82 | ||||||
| 11 | Bharti Airtel Ltd. | 57 | ||||||
| 13 | China Mobile Ltd. | 133 | ||||||
| 3 | Deutsche Telekom AG | 58 | ||||||
| 3 | Elisa Oyj | 77 | ||||||
| 10 | Hellenic Telecommunications Organization S.A. | 139 | ||||||
| 20 | Idea Cellular Ltd. | 54 | ||||||
| 4 | Intelsat S.A. ● | 81 | ||||||
| 1 | KDDI Corp. | 83 | ||||||
| 18 | Koninklijke (Royal) KPN N.V. | 60 | ||||||
| 3 | Nippon Telegraph & Telephone Corp. ADR | 88 | ||||||
| 1 | Philippine Long Distance Telephone Co. ADR | 49 | ||||||
| 250 | Safaricom Ltd. | 31 | ||||||
| 2 | SK Telecom Co., Ltd. ADR | 59 | ||||||
| – | Swisscom AG ☼ | 91 | ||||||
| 9 | Telefonica Deutschland Holdings | 72 | ||||||
| 5 | Telefonica S.A. | 81 | ||||||
| 6 | Telenor ASA | 144 | ||||||
| 8 | Telia Ab | 63 | ||||||
| 2 | Telus Corp. | 59 | ||||||
| 7 | T-Mobile US, Inc. | 243 | ||||||
| 5 | Turkcell Iletisim Hizmetleri A.S. ADR ● | 71 | ||||||
| 79 | Vodafone Group plc | 310 | ||||||
| 2,297 | ||||||||
| Transportation - 3.2% | ||||||||
| 18 | Air France ● | 192 | ||||||
| 397 | AirAsia Berhad | 267 | ||||||
| 68 | AirAsia X Berhad ● | 21 | ||||||
| 13 | American Airlines Group, Inc. ● | 327 | ||||||
| 3 | Avianca Holdings S.A. ADR ● | 48 | ||||||
| 8 | Covenant Transport ● | 65 | ||||||
| 11 | Delta Air Lines, Inc. | 310 | ||||||
| 2 | DSV A/S ☼ | 77 | ||||||
| 3 | FedEx Corp. | 361 | ||||||
| – | Flughafen Zuerich AG | 130 | ||||||
| 1 | Genesee & Wyoming, Inc. Class A ● | 134 | ||||||
| 3 | J.B. Hunt Transport Services, Inc. | 228 | ||||||
| 1 | Kansas City Southern | 96 | ||||||
| 1 | Norfolk Southern Corp. | 93 | ||||||
| 5 | United Continental Holdings, Inc. ● | 184 | ||||||
| 2,533 | ||||||||
| Utilities - 3.7% | ||||||||
| 2 | Alliant Energy Corp. | 102 | ||||||
| 7 | Cheung Kong Infrastructure Holdings Ltd. | 47 | ||||||
| 8 | Cia de Saneamento Basico do Estado de Sao Paulo | 91 | ||||||
| 2 | Dominion Resources, Inc. | 156 | ||||||
| 3 | Duke Energy Corp. | 220 | ||||||
| 7 | E.On SE | 120 | ||||||
| 2 | Endesa S.A. | 80 | ||||||
| 39 | Enel Green Power S.p.A. | 97 | ||||||
| 4 | ENN Energy Holdings Ltd. | 27 | ||||||
| 6 | GDF Suez | 139 | ||||||
| 145 | Guangdong Investment Ltd. | 142 | ||||||
| 9 | Iberdrola S.A. | 59 | ||||||
| 16 | National Grid plc | 206 | ||||||
| 5 | NextEra Energy, Inc. | 441 | ||||||
| 3 | Northeast Utilities | 146 | ||||||
| 4 | NRG Yield, Inc. | 156 | ||||||
| 5 | OGE Energy Corp. | 172 | ||||||
| 16 | Osaka Gas Co., Ltd. | 63 | ||||||
| 5 | Pattern Energy Group, Inc. | 145 | ||||||
| 1 | PG&E Corp. | 45 | ||||||
| 13 | Snam S.p.A. | 73 | ||||||
| 8 | Suez Environment S.A. | 136 | ||||||
The accompanying notes are an integral part of these financial statements.
| 9 |
| Hartford Global Research HLS Fund |
| Schedule of Investments – (continued) |
| December 31, 2013 |
| (000’s Omitted) |
| Shares or Principal Amount | Market Value ╪ | |||||||||||
| COMMON STOCKS - 97.4% - (continued) | ||||||||||||
| Utilities - 3.7% - (continued) | ||||||||||||
| 16 | Tokyo Gas Co., Ltd. | $ | 78 | |||||||||
| 2,941 | ||||||||||||
| Total common stocks | ||||||||||||
| (cost $64,262) | $ | 77,960 | ||||||||||
| PREFERRED STOCKS - 0.8% | ||||||||||||
| Automobiles and Components - 0.4% | ||||||||||||
| 1 | Volkswagen AG N.V. | $ | 308 | |||||||||
| Software and Services - 0.3% | ||||||||||||
| 7 | FireEye, Inc. ⌂●† | 280 | ||||||||||
| Utilities - 0.1% | ||||||||||||
| 4 | Cia Paranaense de Energie | 52 | ||||||||||
| Total preferred stocks | ||||||||||||
| (cost $342) | $ | 640 | ||||||||||
| WARRANTS - 0.0% | ||||||||||||
| Diversified Financials - 0.0% | ||||||||||||
| 16 | Atlas Mara Co-Nvest Ltd. † | $ | 10 | |||||||||
| Total warrants | ||||||||||||
| (cost $–) | $ | 10 | ||||||||||
| Total long-term investments | ||||||||||||
| (cost $64,604) | $ | 78,610 | ||||||||||
| SHORT-TERM INVESTMENTS - 1.9% | ||||||||||||
| Repurchase Agreements - 1.9% | ||||||||||||
| Bank of America Merrill Lynch TriParty Repurchase Agreement (maturing on 01/02/2014 in the amount of $77, collateralized by GNMA 4.00%, 2043, value of $79) | ||||||||||||
| $ | 77 | 0.005%, 12/31/2013 | $ | 77 | ||||||||
| Bank of Montreal TriParty Repurchase Agreement (maturing on 01/02/2014 in the amount of $74, collateralized by FNMA 1.58% - 4.50%, 2020 - 2043, U.S. Treasury Note 0.25% - 4.00%, 2015 - 2020, value of $75) | ||||||||||||
| 74 | 0.01%, 12/31/2013 | 74 | ||||||||||
| Bank of Montreal TriParty Repurchase Agreement (maturing on 01/02/2014 in the amount of $262, collateralized by FHLMC 3.00% - 5.00%, 2019 - 2043, FNMA 0.76% - 6.00%, 2016 - 2043, GNMA 1.50% - 5.25%, 2028 - 2043, value of $267) | ||||||||||||
| 262 | 0.02%, 12/31/2013 | 262 | ||||||||||
| Barclays Capital TriParty Repurchase Agreement (maturing on 01/02/2014 in the amount of $236, collateralized by U.S. Treasury Note 0.50% - 2.25%, 2017, value of $241) | ||||||||||||
| 236 | 0.01%, 12/31/2013 | 236 | ||||||||||
| Citigroup Global Markets, Inc. TriParty Repurchase Agreement (maturing on 01/02/2014 in the amount of $425, collateralized by U.S. Treasury Bond 3.88% - 8.13%, 2021 - 2040, U.S. Treasury Note 0.25% - 3.38%, 2014 - 2020, value of $434) | ||||||||||||
| 425 | 0.01%, 12/31/2013 | 425 | ||||||||||
| RBS Securities, Inc. TriParty Repurchase Agreement (maturing on 01/02/2014 in the amount of $138, collateralized by U.S. Treasury Note 0.25% - 1.00%, 2015 - 2017, value of $141) | ||||||||||||
| 138 | 0.01%, 12/31/2013 | 138 | ||||||||||
| TD Securities TriParty Repurchase Agreement (maturing on 01/02/2014 in the amount of $332, collateralized by FFCB 0.20% - 0.50%, 2015 - 2016, FHLMC 0.38% - 5.25%, 2014 - 2042, FNMA 0.50% - 7.13%, 2014 - 2043, value of $338) | ||||||||||||
| 332 | 0.01%, 12/31/2013 | 332 | ||||||||||
| UBS Securities, Inc. Repurchase Agreement (maturing on 01/02/2014 in the amount of $3, collateralized by U.S. Treasury Note 2.13%, 2015, value of $3) | ||||||||||||
| 3 | 0.01%, 12/31/2013 | 3 | ||||||||||
| 1,547 | ||||||||||||
| Total short-term investments | ||||||||||||
| (cost $1,547) | $ | 1,547 | ||||||||||
| Total investments | ||||||||||||
| (cost $66,151) ▲ | 100.1 | % | $ | 80,157 | ||||||||
| Other assets and liabilities | (0.1 | )% | (69 | ) | ||||||||
| Total net assets | 100.0 | % | $ | 80,088 | ||||||||
The accompanying notes are an integral part of these financial statements.
| 10 |
| Note: | Percentage of investments as shown is the ratio of the total market value to total net assets. |
| Prices of foreign equities that are principally traded on certain foreign markets may be adjusted daily pursuant to a fair value pricing service approved by the Board of Directors in order to reflect an adjustment for factors occurring after the close of certain foreign markets but before the close of the New York Stock Exchange. |
| ▲ | At December 31, 2013, the cost of securities for federal income tax purposes was $66,878 and the aggregate gross unrealized appreciation and depreciation based on that cost were: |
| Unrealized Appreciation | $ | 14,988 | ||
| Unrealized Depreciation | (1,709 | ) | ||
| Net Unrealized Appreciation | $ | 13,279 |
| † | These securities were valued in good faith at fair value as determined under policies and procedures established by and under the supervision of the Company's Board of Directors. At December 31, 2013, the aggregate value of these securities was $338, which represents 0.4% of total net assets. This amount excludes securities that are principally traded in certain foreign markets and whose prices are adjusted pursuant to a third party pricing service methodology approved by the Board of Directors. |
| ● | Non-income producing. |
| § | These securities were sold to the Fund under Regulation S, rules governing offers and sales made outside the United States without registration under the Securities Act of 1933. The Fund may only be able to resell these securities in the United States if an exemption from registration under the federal and state securities laws is available, or the Fund may only be able to sell these securities outside of the United States (such as on a foreign exchange) to a non-U.S. person. Unless otherwise indicated, these holdings are determined to be liquid. At December 31, 2013, the aggregate value of these securities was $66, which represents 0.1% of total net assets. |
| ⌂ | The following securities are considered illiquid. Illiquid securities are often purchased in private placement transactions, are often not registered under the Securities Act of 1933 and may have contractual restrictions on resale. A security may also be considered illiquid if the security lacks a readily available market or if its valuation has not changed for a certain period of time. |
| Period Acquired | Shares/ Par | Security | Cost Basis | |||||||
| 05/2012 | 4 | Dropbox, Inc. | $ | 36 | ||||||
| 12/2012 | 7 | FireEye, Inc. Preferred | 71 | |||||||
At December 31, 2013, the aggregate value of these securities was $328, which represents 0.4% of total net assets.
| ☼ | This security, or a portion of this security, was purchased on a when-issued, delayed-delivery or delayed-draw basis. The cost of these securities was $310 at December 31, 2013. |
| ‡ | This security, or a portion of this security, has been segregated to cover funding requirements on investment transactions settling in the future. |
The accompanying notes are an integral part of these financial statements.
| 11 |
| Hartford Global Research HLS Fund |
| Schedule of Investments – (continued) |
| December 31, 2013 |
| (000’s Omitted) |
Foreign Currency Contracts Outstanding at December 31, 2013
| Currency | Buy / Sell | Delivery Date | Counterparty | Contract Amount | Market Value ╪ | Unrealized Appreciation/ (Depreciation) | ||||||||||||
| AUD | Buy | 01/06/2014 | JPM | $ | 14 | $ | 14 | $ | – | |||||||||
| BRL | Sell | 01/02/2014 | JPM | 3 | 3 | – | ||||||||||||
| CAD | Buy | 01/02/2014 | BOA | 9 | 9 | – | ||||||||||||
| CAD | Buy | 01/06/2014 | SSG | 3 | 3 | – | ||||||||||||
| CAD | Sell | 01/03/2014 | DEUT | 4 | 4 | – | ||||||||||||
| CHF | Buy | 01/03/2014 | JPM | 29 | 29 | – | ||||||||||||
| DKK | Buy | 01/03/2014 | BCLY | 53 | 53 | – | ||||||||||||
| EUR | Buy | 01/03/2014 | GSC | 2 | 2 | – | ||||||||||||
| EUR | Buy | 01/02/2014 | MSC | 36 | 36 | – | ||||||||||||
| EUR | Buy | 01/02/2014 | UBS | 15 | 15 | – | ||||||||||||
| EUR | Sell | 01/02/2014 | MSC | 1 | 1 | – | ||||||||||||
| EUR | Sell | 01/02/2014 | UBS | 5 | 5 | – | ||||||||||||
| EUR | Sell | 01/03/2014 | UBS | 36 | 36 | – | ||||||||||||
| EUR | Sell | 01/06/2014 | UBS | 30 | 30 | – | ||||||||||||
| GBP | Sell | 01/02/2014 | BCLY | 1 | 1 | – | ||||||||||||
| GBP | Sell | 01/06/2014 | BCLY | 15 | 15 | – | ||||||||||||
| GBP | Sell | 01/03/2014 | GSC | 20 | 20 | – | ||||||||||||
| HKD | Buy | 01/03/2014 | BCLY | 24 | 24 | – | ||||||||||||
| HKD | Buy | 01/03/2014 | BCLY | 13 | 13 | – | ||||||||||||
| HKD | Buy | 01/03/2014 | JPM | 20 | 20 | – | ||||||||||||
| JPY | Buy | 01/06/2014 | BCLY | 90 | 89 | (1 | ) | |||||||||||
| JPY | Buy | 01/07/2014 | DEUT | 18 | 18 | – | ||||||||||||
| JPY | Sell | 03/20/2014 | DEUT | 146 | 142 | 4 | ||||||||||||
| JPY | Sell | 01/08/2014 | UBS | 135 | 135 | – | ||||||||||||
| MYR | Buy | 01/03/2014 | JPM | 21 | 21 | – | ||||||||||||
| $ | 3 | |||||||||||||||||
| ╪ | See Significant Accounting Policies of accompanying Notes to Financial Statements regarding valuation of securities. |
| GLOSSARY: (abbreviations used in preceding Schedule of Investments) | |
| Counterparty Abbreviations: | |
| BCLY | Barclays |
| BOA | Banc of America Securities LLC |
| DEUT | Deutsche Bank Securities, Inc. |
| GSC | Goldman Sachs & Co. |
| JPM | JP Morgan Chase & Co. |
| MSC | Morgan Stanley |
| SSG | State Street Global Markets LLC |
| UBS | UBS AG |
| Currency Abbreviations: | |
| AUD | Australian Dollar |
| BRL | Brazilian Real |
| CAD | Canadian Dollar |
| CHF | Swiss Franc |
| DKK | Danish Krone |
| EUR | EURO |
| GBP | British Pound |
| HKD | Hong Kong Dollar |
| JPY | Japanese Yen |
| MYR | Malaysian Ringgit |
| Other Abbreviations: | |
| ADR | American Depositary Receipt |
| FFCB | Federal Farm Credit Bank |
| FHLMC | Federal Home Loan Mortgage Corp. |
| FNMA | Federal National Mortgage Association |
| GNMA | Government National Mortgage Association |
| REIT | Real Estate Investment Trust |
The accompanying notes are an integral part of these financial statements.
| 12 |
| Hartford Global Research HLS Fund |
| Investment Valuation Hierarchy Level Summary |
| December 31, 2013 |
| (000’s Omitted) |
| Total | Level 1 ♦ | Level 2 ♦ | Level 3 | |||||||||||||
| Assets: | ||||||||||||||||
| Common Stocks | ||||||||||||||||
| Automobiles and Components | $ | 1,174 | $ | 245 | $ | 929 | $ | – | ||||||||
| Banks | 7,459 | 2,838 | 4,621 | – | ||||||||||||
| Capital Goods | 6,169 | 4,653 | 1,516 | – | ||||||||||||
| Commercial and Professional Services | 582 | 576 | 6 | – | ||||||||||||
| Consumer Durables and Apparel | 1,786 | 693 | 1,093 | – | ||||||||||||
| Consumer Services | 767 | 276 | 491 | – | ||||||||||||
| Diversified Financials | 3,218 | 1,297 | 1,921 | – | ||||||||||||
| Energy | 6,557 | 4,301 | 2,256 | – | ||||||||||||
| Food and Staples Retailing | 1,176 | 508 | 668 | – | ||||||||||||
| Food, Beverage and Tobacco | 6,688 | 3,100 | 3,588 | – | ||||||||||||
| Health Care Equipment and Services | 2,531 | 2,149 | 382 | – | ||||||||||||
| Household and Personal Products | 440 | 180 | 260 | – | ||||||||||||
| Insurance | 1,966 | 706 | 1,260 | – | ||||||||||||
| Materials | 4,074 | 2,501 | 1,573 | – | ||||||||||||
| Media | 3,808 | 3,076 | 732 | – | ||||||||||||
| Pharmaceuticals, Biotechnology and Life Sciences | 5,795 | 4,926 | 869 | – | ||||||||||||
| Real Estate | 1,638 | 797 | 841 | – | ||||||||||||
| Retailing | 5,014 | 4,097 | 917 | – | ||||||||||||
| Semiconductors and Semiconductor Equipment | 1,299 | 1,003 | 296 | – | ||||||||||||
| Software and Services | 5,272 | 4,997 | 227 | 48 | ||||||||||||
| Technology Hardware and Equipment | 2,776 | 2,510 | 266 | – | ||||||||||||
| Telecommunication Services | 2,297 | 815 | 1,482 | – | ||||||||||||
| Transportation | 2,533 | 1,846 | 687 | – | ||||||||||||
| Utilities | 2,941 | 1,674 | 1,267 | – | ||||||||||||
| Total | 77,960 | 49,764 | 28,148 | 48 | ||||||||||||
| Preferred Stocks | 640 | 52 | 308 | 280 | ||||||||||||
| Warrants | 10 | 10 | – | – | ||||||||||||
| Short-Term Investments | 1,547 | – | 1,547 | – | ||||||||||||
| Total | $ | 80,157 | $ | 49,826 | $ | 30,003 | $ | 328 | ||||||||
| Foreign Currency Contracts* | 4 | – | 4 | – | ||||||||||||
| Total | $ | 4 | $ | – | $ | 4 | $ | – | ||||||||
| Liabilities: | ||||||||||||||||
| Foreign Currency Contracts* | 1 | – | 1 | – | ||||||||||||
| Total | $ | 1 | $ | – | $ | 1 | $ | – | ||||||||
| ♦ | For the year ended December 31, 2013, investments valued at $957 were transferred from Level 1 to Level 2, and investments valued at $389 were transferred from Level 2 to Level 1. Investments are transferred between Level 1 and Level 2 for a variety of reasons including, but not limited to: |
| 1) | Foreign equities for which a fair value price is more representative of exit value than the local market close (transfer into Level 2). Foreign equities for which the local market close is more representative of exit value (transfer into Level 1). |
| 2) | U.S. Treasury securities that no longer represent the most recent issue (transfer into Level 2). |
| 3) | Equity investments with no observable trading but a bid or close price is used (transfer into Level 2). Equity investments using observable quoted prices in an active market (transfer into Level 1). |
| * | Derivative instruments (excluding purchased and written options, if applicable) are valued at the unrealized appreciation/depreciation on the investments. |
| Note: | For purposes of reporting transfers between different hierarchy levels, both transfers in and out of each level, as applicable, are shown as if they occurred at the beginning of the period. |
The accompanying notes are an integral part of these financial statements.
| 13 |
| Hartford Global Research HLS Fund |
| Investment Valuation Hierarchy Level Summary – (continued) |
| December 31, 2013 |
| (000’s Omitted) |
Following is a reconciliation of Level 3 assets for which significant unobservable inputs were used to determine fair value:
| Balance as of December 31, 2012 | Realized Gain (Loss) | Change in Unrealized Appreciation (Depreciation) | Net Amortization | Purchases | Sales | Transfers Into Level 3 * | Transfers Out of Level 3 * | Balance as of December 31, 2013 | ||||||||||||||||||||||||||||
| Assets: | ||||||||||||||||||||||||||||||||||||
| Common Stocks | $ | 37 | $ | 1 | $ | 13 | † | $ | — | $ | — | $ | (2 | ) | $ | — | $ | (1 | ) | $ | 48 | |||||||||||||||
| Preferred Stocks | 64 | — | 216 | ‡ | — | — | — | — | — | 280 | ||||||||||||||||||||||||||
| Total | $ | 101 | $ | 1 | $ | 229 | $ | — | $ | — | $ | (2 | ) | $ | — | $ | (1 | ) | $ | 328 | ||||||||||||||||
| * | Investments are transferred into and out of Level 3 for a variety of reasons including, but not limited to: |
| 1) | Investments where trading has been halted (transfer into Level 3) or investments where trading has resumed (transfer out of Level 3). |
| 2) | Broker quoted investments (transfer into Level 3) or quoted prices in active markets (transfer out of Level 3). |
| 3) | Investments that have certain restrictions on trading (transfer into Level 3) or investments where trading restrictions have expired (transfer out of Level 3). |
| † | Change in unrealized appreciation (depreciation) in the current period relating to assets still held at December 31, 2013 was $13. |
| ‡ | Change in unrealized appreciation (depreciation) in the current period relating to assets still held at December 31, 2013 was $216. |
The accompanying notes are an integral part of these financial statements.
| 14 |
| Hartford Global Research HLS Fund |
| Statement of Assets and Liabilities |
| December 31, 2013 |
| (000’s Omitted) |
| Assets: | ||||
| Investments in securities, at market value (cost $66,151) | $ | 80,157 | ||
| Cash | 63 | |||
| Foreign currency on deposit with custodian (cost $18) | 18 | |||
| Unrealized appreciation on foreign currency contracts | 4 | |||
| Receivables: | ||||
| Investment securities sold | 758 | |||
| Fund shares sold | 51 | |||
| Dividends and interest | 103 | |||
| Total assets | 81,154 | |||
| Liabilities: | ||||
| Unrealized depreciation on foreign currency contracts | 1 | |||
| Payables: | ||||
| Investment securities purchased | 955 | |||
| Fund shares redeemed | 69 | |||
| Investment management fees | 16 | |||
| Distribution fees | 1 | |||
| Accrued expenses | 24 | |||
| Total liabilities | 1,066 | |||
| Net assets | $ | 80,088 | ||
| Summary of Net Assets: | ||||
| Capital stock and paid-in-capital | $ | 68,287 | ||
| Undistributed net investment income | 711 | |||
| Accumulated net realized loss | (2,920 | ) | ||
| Unrealized appreciation of investments and the translations of assets and liabilities denominated in foreign currency | 14,010 | |||
| Net assets | $ | 80,088 | ||
| Shares authorized | 800,000 | |||
| Par value | $ | 0.001 | ||
| Class IA: Net asset value per share | $ | 13.41 | ||
| Shares outstanding | 4,241 | |||
| Net assets | $ | 56,870 | ||
| Class IB: Net asset value per share | $ | 13.36 | ||
| Shares outstanding | 1,738 | |||
| Net assets | $ | 23,218 |
The accompanying notes are an integral part of these financial statements.
| 15 |
| Hartford Global Research HLS Fund |
| Statement of Operations |
| For the Year Ended December 31, 2013 |
| (000’s Omitted) |
| Investment Income: | ||||
| Dividends | $ | 1,667 | ||
| Interest | 1 | |||
| Less: Foreign tax withheld | (110 | ) | ||
| Total investment income, net | 1,558 | |||
| Expenses: | ||||
| Investment management fees | 696 | |||
| Transfer agent fees | 1 | |||
| Distribution fees - Class IB | 57 | |||
| Custodian fees | 9 | |||
| Accounting services fees | 14 | |||
| Board of Directors' fees | 3 | |||
| Audit fees | 34 | |||
| Other expenses | 23 | |||
| Total expenses (before fees paid indirectly) | 837 | |||
| Commission recapture | (2 | ) | ||
| Custodian fee offset | — | |||
| Total fees paid indirectly | (2 | ) | ||
| Total expenses, net | 835 | |||
| Net Investment Income | 723 | |||
| Net Realized Gain on Investments, Other Financial Instruments and Foreign Currency Transactions: | ||||
| Net realized gain on investments | 11,778 | |||
| Net realized gain on futures | 7 | |||
| Net realized gain on foreign currency contracts | 55 | |||
| Net realized gain on other foreign currency transactions | 34 | |||
| Net Realized Gain on Investments, Other Financial Instruments and Foreign Currency Transactions | 11,874 | |||
| Net Changes in Unrealized Appreciation of Investments and Foreign Currency Transactions: | ||||
| Net unrealized appreciation of investments | 7,067 | |||
| Net unrealized depreciation of foreign currency contracts | (38 | ) | ||
| Net unrealized appreciation on translation of other assets and liabilities in foreign currencies | — | |||
| Net Changes in Unrealized Appreciation of Investments and Foreign Currency Transactions | 7,029 | |||
| Net Gain on Investments, Other Financial Instruments and Foreign Currency Transactions | 18,903 | |||
| Net Increase in Net Assets Resulting from Operations | $ | 19,626 |
The accompanying notes are an integral part of these financial statements.
| 16 |
| Hartford Global Research HLS Fund |
| Statement of Changes in Net Assets |
| (000’s Omitted) |
| For the Year Ended December 31, 2013 | For the Year Ended December 31, 2012 | |||||||
| Operations: | ||||||||
| Net investment income | $ | 723 | $ | 980 | ||||
| Net realized gain on investments, other financial instruments and foreign currency transactions | 11,874 | 3,819 | ||||||
| Net unrealized appreciation of investments | 7,029 | 8,656 | ||||||
| Net Increase in Net Assets Resulting from Operations | 19,626 | 13,455 | ||||||
| Distributions to Shareholders: | ||||||||
| From net investment income | ||||||||
| Class IA | (828 | ) | (627 | ) | ||||
| Class IB | (278 | ) | (228 | ) | ||||
| Total distributions | (1,106 | ) | (855 | ) | ||||
| Capital Share Transactions: | ||||||||
| Class IA | ||||||||
| Sold | 11,848 | 10,859 | ||||||
| Issued on reinvestment of distributions | 828 | 627 | ||||||
| Redeemed | (21,597 | ) | (20,019 | ) | ||||
| Total capital share transactions | (8,921 | ) | (8,533 | ) | ||||
| Class IB | ||||||||
| Sold | 4,730 | 5,524 | ||||||
| Issued on reinvestment of distributions | 278 | 228 | ||||||
| Redeemed | (10,413 | ) | (12,440 | ) | ||||
| Total capital share transactions | (5,405 | ) | (6,688 | ) | ||||
| Net decrease from capital share transactions | (14,326 | ) | (15,221 | ) | ||||
| Net Increase (Decrease) in Net Assets | 4,194 | (2,621 | ) | |||||
| Net Assets: | ||||||||
| Beginning of period | 75,894 | 78,515 | ||||||
| End of period | $ | 80,088 | $ | 75,894 | ||||
| Undistributed (distribution in excess of) net investment income | $ | 711 | $ | 1,044 | ||||
| Shares: | ||||||||
| Class IA | ||||||||
| Sold | 1,004 | 1,084 | ||||||
| Issued on reinvestment of distributions | 68 | 63 | ||||||
| Redeemed | (1,832 | ) | (1,997 | ) | ||||
| Total share activity | (760 | ) | (850 | ) | ||||
| Class IB | ||||||||
| Sold | 406 | 557 | ||||||
| Issued on reinvestment of distributions | 23 | 23 | ||||||
| Redeemed | (889 | ) | (1,249 | ) | ||||
| Total share activity | (460 | ) | (669 | ) | ||||
The accompanying notes are an integral part of these financial statements.
| 17 |
| Hartford Global Research HLS Fund |
| Notes to Financial Statements |
| December 31, 2013 |
| (000’s Omitted) |
| 1. | Organization: |
Hartford Global Research HLS Fund (the “Fund”) serves as an underlying investment option for certain variable annuity and variable life insurance separate accounts of Hartford Life Insurance Company (“HLIC”) and its affiliates and certain qualified retirement plans. The Fund may also serve as an underlying investment option for certain variable annuity and variable life separate accounts of other insurance companies. Owners of variable annuity contracts and policyholders of variable life insurance contracts may choose the funds permitted in the variable insurance contract prospectus. In addition, participants in certain qualified retirement plans may choose the Fund if permitted by their plans.
Hartford Series Fund, Inc. (the “Company”) is an open-end registered management investment company comprised of thirty portfolios. Financial statements for the Fund, a series of the Company, are included in this report.
The Company is organized under the laws of the State of Maryland and is registered with the Securities and Exchange Commission (“SEC”) under the Investment Company Act of 1940, as amended (“1940 Act”). The Fund is a diversified open-end management investment company.
The Fund is divided into Class IA and Class IB shares. Each class is offered at the per share net asset value (“NAV”) without a sales charge and is subject to the same expenses, except that the Class IB shares are subject to distribution and service fees charged pursuant to a Distribution Plan adopted in accordance with Rule 12b-1 under the 1940 Act.
| 2. | Significant Accounting Policies: |
The following is a summary of significant accounting policies of the Fund in the preparation of its financial statements, which are in accordance with United States Generally Accepted Accounting Principles (“U.S. GAAP”). The preparation of financial statements in accordance with U.S. GAAP may require management to make estimates and assumptions that affect the reported amounts of assets and liabilities and disclosure of contingent assets and liabilities at the date of the financial statements and the reported amounts of increases and decreases in net assets from operations during the reporting period. Actual results could differ from those estimates.
| a) | Determination of Net Asset Value – The NAV of each class of the Fund’s shares is determined as of the close of regular trading (normally 4:00 p.m. Eastern Time) (the “NYSE Close”) on each day that the New York Stock Exchange (the “Exchange”) is open (“Valuation Date”). Information that becomes known to the Fund after the NAV has been calculated on a particular day will not generally be used to retroactively adjust the NAV determined earlier that day. |
| b) | Investment Valuation and Fair Value Measurements – For purposes of calculating the NAV, portfolio investments and other assets held by the Fund's portfolio for which market quotes are readily available are valued at market value. Market value is generally determined on the basis of last reported sales prices or official close price. If no sales are reported, market value is based on quotes obtained from a quotation reporting system, established market makers, or independent pricing services. If market prices are not readily available or are deemed unreliable, the Fund will use the fair value of the investment as determined in good faith under policies and procedures established by and under the supervision of the Company’s Board of Directors. Market quotes are considered not readily available where there is an absence of current or reliable market-based data (e.g., trade information or indicative market quotes), including where events occur after the close of the relevant market, but prior to the NYSE Close, that materially affect the values of the Fund’s portfolio investments or assets. In addition, market quotes are considered not readily available when, due to extraordinary circumstances, the exchanges or markets on which the investments trade do not open for trading for the entire day and no other market prices are available. In addition, prices of foreign equities that are principally traded on certain foreign markets may be adjusted daily pursuant to a fair value pricing service approved by the Board of Directors in order to reflect an adjustment for the factors occurring after the close of certain foreign markets but before the NYSE Close. Investments that are primarily traded on foreign markets may trade on days that are not business days of the Fund. The value of the foreign investments in which the Fund invests may change on days when a shareholder will not be able to purchase or redeem shares of the Fund. Fair value pricing is subjective in nature and the use of fair value pricing by the |
| 18 |
Fund may cause the NAV of its shares to differ significantly from the NAV that would have been calculated using market prices at the close of the exchange on which a portfolio investment is primarily traded. There can be no assurance that the Fund could obtain the fair market value assigned to an investment if the Fund were to sell the investment at approximately the time at which the Fund determines its NAV.
Fixed income investments (other than short-term obligations), non-exchange traded derivatives and centrally cleared swaps held by the Fund are normally valued on the basis of quotes obtained from brokers and dealers or independent pricing services in accordance with procedures established by the Company’s Board of Directors. Prices obtained from independent pricing services use information provided by market makers or estimates of market values through accepted market modeling, trading and pricing conventions. Inputs to the models may include, but are not limited to, prepayment speeds, pricing spread, yield, trade information, dealer quotes, market color, cash flow models and the investment’s terms and conditions. Generally, the Fund may use fair valuation in regard to fixed income investments when the Fund holds defaulted or distressed investments or investments in a company in which a reorganization is pending. Short-term investments maturing in 60 days or less are generally valued at amortized cost, if their original term to maturity was 60 days or less, or by amortizing their value on the 61st day prior to maturity, if the original term to maturity exceeded 60 days.
Exchange traded options, futures and options on futures are valued at the settlement price or last trade price determined by the relevant exchange as of the NYSE Close. If the last trade price for exchange traded options does not fall between the bid and ask prices, the value will be the mean of the bid and ask prices as of the NYSE Close. If a last trade price is not available, the value will be the mean of the bid and ask prices as of the NYSE Close. If a mean of the bid and ask prices cannot be calculated for the day, the value will be the bid price as of the NYSE Close. In the case of OTC options and such instruments that do not trade on an exchange, values may be supplied by a pricing service using a formula or other objective method that may take into consideration the style, direction, expiration, strike price, notional value and volatility or other special adjustments.
Investments valued in currencies other than U.S. dollars are converted to U.S. dollars using exchange rates obtained from independent pricing services for calculation of the NAV. As a result, the NAV of the Fund’s shares may be affected by changes in the value of currencies in relation to the U.S. dollar. The value of investments traded in markets outside the United States or denominated in currencies other than the U.S. dollar may be affected significantly on a day that the NYSE is closed and the market value may change on days when an investor is not able to purchase, redeem or exchange shares of the Fund.
Foreign currency contracts represent agreements to exchange currencies on specific future dates at predetermined rates. Foreign currency contracts are valued using foreign currency exchange rates and forward rates as provided by an independent pricing service on the Valuation Date.
Financial instruments for which prices are not available from an independent pricing service may be valued using market quotations obtained from one or more dealers that make markets in the respective financial instrument in accordance with procedures established by the Company’s Board of Directors.
U.S. GAAP defines fair value as the price that the Fund would receive to sell an asset or pay to transfer a liability in an orderly transaction between market participants. The U.S. GAAP fair value measurement standards require disclosure of a fair value hierarchy for each major category of assets and liabilities. Various inputs are used in determining the fair value of the Fund’s investments. These inputs are summarized into three broad hierarchy levels. This hierarchy is based on whether the valuation inputs are observable or unobservable. These levels are:
| · | Level 1 – Quoted prices in active markets for identical investments. Level 1 may include exchange traded instruments, such as domestic equities, some foreign equities, options, futures, mutual funds, exchange traded funds, rights and warrants. |
| 19 |
| Hartford Global Research HLS Fund |
| Notes to Financial Statements – (continued) |
| December 31, 2013 |
| (000’s Omitted) |
| · | Level 2 – Observable inputs other than Level 1 prices, such as quoted prices for similar investments; quoted prices in markets that are not active; or other inputs that are observable or can be corroborated by observable market data. Level 2 may include debt investments that are traded less frequently than exchange traded instruments and which are valued using independent pricing services; foreign equities, which are principally traded on certain foreign markets and are adjusted daily pursuant to a fair value pricing service in order to reflect an adjustment for the factors occurring after the close of certain foreign markets but before the NYSE Close; senior floating rate interests, which are valued using an aggregate of dealer bids; short-term investments, which are valued at amortized cost; and swaps, which are valued based upon the terms of each swap contract. |
| · | Level 3 – Significant unobservable inputs that are supported by limited or no market activity. Level 3 may include financial instruments whose values are determined using indicative market quotes or require significant management judgment or estimation. These unobservable valuation inputs may include estimates for current yields, maturity/duration, prepayment speed, and indicative market quotes for comparable investments along with other assumptions relating to credit quality, collateral value, complexity of the investment structure, general market conditions and liquidity. This category may include investments where trading has been halted or there are certain restrictions on trading. While these investments are priced using unobservable inputs, the valuation of these investments reflects the best available data and management believes the prices are a reasonable representation of exit price. |
The Board of Directors of the Company generally reviews and approves the “Procedures for Valuation of Portfolio Securities” on an annual basis. These procedures define how investments are to be valued, including the formation and activities of a Valuation Committee. The Valuation Committee is responsible for determining in good faith the fair value of investments when the value cannot be obtained from primary pricing services or alternative sources or if the valuation of an investment as provided by the primary pricing service or alternative source is believed not to reflect the investment’s fair value as of the Valuation Date. Voting members of the Valuation Committee include the Fund’s Treasurer or designee and a Vice President of the investment manager or designee. An Assistant Vice President of the Fund with legal expertise or designee is also included on the Valuation Committee as a non-voting advisory member. In addition, the Fund’s Chief Compliance Officer shall designate a member of the compliance group to attend Valuation Committee meetings as a non-voting resource, to monitor for and provide guidance with respect to compliance with these procedures. Two members of the Valuation Committee or their designees, representing different departments, shall constitute a quorum for purposes of permitting the Valuation Committee to take action. The Valuation Committee will consider all relevant factors in determining an investment’s fair value, and may seek the advice of the Fund’s sub-adviser, knowledgeable brokers, and legal counsel in making such determination. The Valuation Committee reports to the Audit Committee of the Company’s Board of Directors. The Audit Committee receives quarterly written reports which include details of all fair-valued investments, including the reason for the fair valuation, and an indication, when possible, of the accuracy of the valuation by disclosing the next available reliable public price quotation or the disposition price of such investments (the “look-back” test). The Board of Directors then must consider for ratification all of the fair value determinations made during the previous quarter.
Valuation levels are not necessarily indicative of the risk associated with investing in such investments. Individual investments within any of the above mentioned asset classes may be assigned a different hierarchical level than those presented above, as individual circumstances dictate.
For additional information, refer to the Investment Valuation Hierarchy Level Summary and the Level 3 roll-forward reconciliation, if applicable, which follow the Schedule of Investments.
| c) | Investment Transactions and Investment Income – Investment transactions are recorded as of the trade date (the date the order to buy or sell is executed) for financial reporting purposes. Investments purchased or sold on a when-issued or delayed-delivery basis may be settled a month or more after the trade date. Realized gains and losses are determined on the basis of identified cost. |
| 20 |
Dividend income from domestic securities is accrued on the ex-dividend date. In general, dividend income from foreign securities is recorded on the ex-date; however, dividend notifications in certain foreign jurisdictions may not be available in a timely manner and as a result, the Fund will record the dividend as soon as the relevant details (i.e., rate per share, payment date, shareholders of record, etc.) are publicly available. Interest income, including amortization of premium, accretion of discounts and additional principal received in-kind in lieu of cash, is accrued on a daily basis.
| d) | Foreign Currency Transactions – Assets and liabilities denominated in currencies other than U.S. dollars are translated into U.S. dollars at the exchange rates in effect on the valuation date. Purchases and sales of investments, income and expenses are translated into U.S. dollars at the exchange rates on the dates of such transactions. |
The Fund does not isolate that portion of portfolio investment valuation resulting from fluctuations in the foreign currency exchange rates from the fluctuations arising from changes in the market prices of investments held. Exchange rate fluctuations are included with the net realized and unrealized gain or loss on investments in the accompanying financial statements.
Net realized foreign exchange gains or losses arise from sales of foreign currencies and the difference between asset and liability amounts initially stated in foreign currencies and the U.S. dollar value of the amounts actually received or paid. Net unrealized foreign exchange gains or losses arise from changes in the value of other assets and liabilities at the end of the reporting period, resulting from changes in the exchange rates.
| e) | Joint Trading Account – The Fund may invest cash balances into a joint trading account that may be invested in one or more repurchase agreements. |
| f) | Fund Share Valuation and Dividend Distributions to Shareholders – Orders for the Fund’s shares are executed in accordance with the investment instructions of the contract holders and plan participants. The NAV of the Fund’s shares is determined as of the close of business on each business day of the Exchange. The NAV is determined separately for each class of shares of the Fund by dividing the Fund’s net assets attributable to that class by the number of shares of the class outstanding. Each class of shares offered by the Fund has equal rights as to assets and voting privileges (except that shareholders of a class have exclusive voting rights regarding any matter relating solely to that class of shares). Income and non-class specific expenses are allocated daily to each class on the basis of the relative net assets of the class. Realized and unrealized gains and losses are allocated daily based on the relative net assets of each class of shares of the Fund. |
Orders for the purchase of the Fund’s shares received prior to the close of the Exchange on any day the Exchange is open for business are priced at the NAV determined as of the close of the Exchange. Orders received after the close of the Exchange, or on a day on which the Exchange and/or the Fund is not open for business, are priced at the next determined NAV.
Dividends are declared pursuant to a policy adopted by the Company’s Board of Directors based upon the investment performance of the Fund. The policy of the Fund is to pay dividends from net investment income and realized gains, if any, at least once a year.
Distributions from net investment income, net realized gains and capital are determined in accordance with federal income tax regulations, which may differ from U.S. GAAP with respect to character and timing. These differences may include, but are not limited to, losses deferred due to wash sale adjustments, foreign currency gains and losses, adjustments related to Passive Foreign Investment Companies (“PFICs”), Real Estate Investment Trusts (“REITs”), Regulated Investment Companies (“RICs”), certain derivatives and partnerships. Permanent book and federal income tax basis differences relating to shareholder distributions will result in reclassifications to certain of the Fund’s capital accounts (see Federal Income Taxes: Reclassification of Capital Accounts note).
| 21 |
| Hartford Global Research HLS Fund |
| Notes to Financial Statements – (continued) |
| December 31, 2013 |
| (000’s Omitted) |
| 3. | Securities and Other Investments: |
| a) | Repurchase Agreements – A repurchase agreement is an agreement by which a counterparty agrees to sell an investment and agrees to repurchase the investment sold from the buyer at a mutually agreed upon time and price. During the period of the repurchase agreement, the counterparty will deposit cash and or securities in a third party custodial account to serve as collateral. At the time the Fund enters into a repurchase agreement, the value of the underlying collateral, including accrued interest, will be equal to or exceed the value of the repurchase agreement. Repurchase agreements expose the Fund to counterparty risk - that is, the risk that the counterparty will not fulfill its obligations. To minimize counterparty risk, the investments that serve to collateralize the repurchase agreement are held by the Fund’s custodian in book entry or physical form in the custodial account of the Fund or in a third party custodial account. Repurchase agreements are valued at cost plus accrued interest, which approximates fair value. Repurchase agreements have master netting arrangements which allow the Fund to offset amounts owed to a counterparty with amounts owed by the counterparty, including any collateral. Upon an event of default under a master repurchase agreement, the non-defaulting party may close out all transactions traded under such agreement and net amounts owed under each transaction to one net amount payable by one party to the other. Absent an event of default, the master repurchase agreement does not result in an offset of reported amounts of assets and liabilities in the Statement of Assets and Liabilities across transactions between the Fund and the applicable counterparty. The Fund, as shown on the Schedule of Investments, had outstanding repurchase agreements and related collateral as of December 31, 2013. |
| b) | Illiquid and Restricted Investments – The Fund is permitted to invest up to 15% of its net assets in illiquid investments. Illiquid investments are those that may not be sold or disposed of in the ordinary course of business within seven days, at approximately the price used to determine the Fund’s NAV. The Fund may not be able to sell illiquid investments when its sub-adviser considers it desirable to do so or may have to sell such investments at a price that is lower than the price that could be obtained if the investments were more liquid. A sale of illiquid investments may require more time and may result in higher dealer discounts and other selling expenses than does the sale of those that are liquid. Illiquid investments also may be more difficult to value due to the unavailability of reliable market quotations for such investments, and an investment in them may have an adverse impact on the Fund’s NAV. The Fund may also purchase certain restricted investments that can only be resold to certain qualified investors and may be determined to be liquid pursuant to policies and guidelines established by the Company’s Board of Directors. The Fund, as shown on the Schedule of Investments, had illiquid and/or restricted investments as of December 31, 2013. |
| c) | Investments Purchased on a When-Issued or Delayed-Delivery Basis – Delivery and payment for investments that have been purchased by the Fund on a forward commitment, or when-issued or delayed-delivery basis, take place beyond the customary settlement period. The Fund may dispose of or renegotiate a delayed-delivery transaction after it is entered into, and may sell delayed-delivery investments before they are delivered, which may result in a realized gain or loss. During this period, such investments are subject to market fluctuations, and the Fund identifies investments segregated in its records with a value at least equal to the amount of the commitment. The Fund, as shown on the Schedule of Investments, had when-issued or delayed-delivery investments as of December 31, 2013. |
| 4. | Financial Derivative Instruments: |
The following disclosures contain information on how and why the Fund uses derivative instruments, the credit-risk-related contingent features in certain derivative instruments, and how derivative instruments affect the Fund’s financial position and results of operations. The location and fair value amounts of these instruments on the Statement of Assets and Liabilities and the realized gains and losses and changes in unrealized gains and losses on the Statement of Operations, each categorized by type of derivative contract, are included in the following Additional Derivative Instrument Information footnote. The derivative instruments outstanding as of year-end are disclosed in the notes to or within the Schedule of Investments for purchased options, if applicable. The amounts of realized gains and losses and changes in unrealized gains and losses on derivative instruments during the year are disclosed in the Statement of Operations.
| 22 |
| a) | Foreign Currency Contracts – The Fund may enter into foreign currency contracts that obligate the Fund to purchase or sell currencies at specified future dates. Foreign currency contracts are used to hedge the currency exposure associated with some or all of the Fund’s investments and/or as part of an investment strategy. Foreign currency contracts are marked to market daily and the change in value is recorded by the Fund as an unrealized gain or loss. The Fund will record a realized gain or loss when the foreign currency contract is settled. |
Foreign currency contracts involve elements of market risk in excess of the amounts reflected in the Statement of Assets and Liabilities. In addition, risks may arise upon entering into these contracts from the potential inability of the counterparties to meet the terms of the contracts and from unanticipated movements in the value of the foreign currencies relative to the U.S. dollar. The Fund had outstanding foreign currency contracts as shown on the Schedule of Investments as of December 31, 2013.
| b) | Futures Contracts – The Fund may enter into futures contracts. A futures contract is an agreement between two parties to buy or sell an asset at a set price on a future date. The Fund uses futures contracts to manage or obtain exposure to the investment markets, commodities, or movements in interest rates and currency values. The primary risks associated with the use of futures contracts are the imperfect correlation between the change in market value of the investments held by the Fund and the prices of futures contracts and the possibility of an illiquid market. Upon entering into a futures contract, the Fund is required to deposit with a futures commission merchant (“FCM”) an amount of cash or U.S. Government or Agency Obligations in accordance with the initial margin requirements of the broker or exchange. Futures contracts are marked to market daily at the most recent settlement price reported by an exchange on which, over time, they are traded most extensively, and an appropriate payable or receivable for the change in value (“variation margin”) is recorded by the Fund. Gains or losses are recognized but not considered realized until the contracts expire or are closed. Futures contracts involve, to varying degrees, risk of loss in excess of the variation margin disclosed on the Statement of Assets and Liabilities; however, the Fund seeks to reduce this risk through the use of an FCM. As of December 31, 2013, the Fund had no outstanding futures contracts. |
| c) | Additional Derivative Instrument Information: |
Fair Value of Derivative Instruments on the Statement of Assets and Liabilities as of December 31, 2013:
| Risk Exposure Category | ||||||||||||||||||||||||||||
| Interest Rate Contracts | Foreign Exchange Contracts | Credit Contracts | Equity Contracts | Commodity Contracts | Other Contracts | Total | ||||||||||||||||||||||
| Assets: | ||||||||||||||||||||||||||||
| Unrealized appreciation on foreign currency contracts | $ | — | $ | 4 | $ | — | $ | — | $ | — | $ | — | $ | 4 | ||||||||||||||
| Total | $ | — | $ | 4 | $ | — | $ | — | $ | — | $ | — | $ | 4 | ||||||||||||||
| Liabilities: | ||||||||||||||||||||||||||||
| Unrealized depreciation on foreign currency contracts | $ | — | $ | 1 | $ | — | $ | — | $ | — | $ | — | $ | 1 | ||||||||||||||
| Total | $ | — | $ | 1 | $ | — | $ | — | $ | — | $ | — | $ | 1 | ||||||||||||||
The volume of derivatives that is presented in the Schedule of Investments is consistent with the derivative activity during the year ended December 31, 2013.
| 23 |
| Hartford Global Research HLS Fund |
| Notes to Financial Statements – (continued) |
| December 31, 2013 |
| (000’s Omitted) |
The Effect of Derivative Instruments on the Statement of Operations for the year ended December 31, 2013:
| Risk Exposure Category | ||||||||||||||||||||||||||||
| Interest Rate Contracts | Foreign Exchange Contracts | Credit Contracts | Equity Contracts | Commodity Contracts | Other Contracts | Total | ||||||||||||||||||||||
| Realized Gain on Derivatives Recognized as a Result of Operations: | ||||||||||||||||||||||||||||
| Net realized gain on futures | $ | — | $ | — | $ | — | $ | 7 | $ | — | $ | — | $ | 7 | ||||||||||||||
| Net realized gain on foreign currency contracts | — | 55 | — | — | — | — | 55 | |||||||||||||||||||||
| Total | $ | — | $ | 55 | $ | — | $ | 7 | $ | — | $ | — | $ | 62 | ||||||||||||||
| Net Change in Unrealized Appreciation (Depreciation) on Derivatives Recognized as a Result of Operations: | ||||||||||||||||||||||||||||
| Net change in unrealized depreciation of foreign currency contracts | $ | — | $ | (38 | ) | $ | — | $ | — | $ | — | $ | — | $ | (38 | ) | ||||||||||||
| Total | $ | — | $ | (38 | ) | $ | — | $ | — | $ | — | $ | — | $ | (38 | ) | ||||||||||||
| d) | Balance Sheet Offsetting Information: |
Set forth below are tables which disclose both gross information and net information about instruments and transactions eligible for offset in the financial statements, and instruments and transactions that are subject to a master netting arrangement, as well as amounts related to margin, reflected as financial collateral (including cash collateral), held at clearing brokers, counterparties and the Fund’s custodian. The master netting arrangements allow the clearing brokers to net any collateral held in or on behalf of the Fund, or liabilities or payment obligations of the clearing brokers to the Fund, against any liabilities or payment obligations of the Fund to the clearing brokers. The Fund is required to deposit financial collateral (including cash collateral) at the Fund’s custodian on behalf of clearing brokers and counterparties to continually meet the original and maintenance requirements established by the clearing brokers and counterparties. Such requirements are specific to the respective clearing broker or counterparty.
Offsetting of Financial Assets and Derivative Assets as of December 31, 2013:
| Gross Amounts* of Assets Presented in Statement of Assets and Liabilities | Financial Instruments with Allowable Netting | Collateral Received | Net Amount (not less than $0) | |||||||||||||
| Description | �� | |||||||||||||||
| Unrealized appreciation on foreign currency contracts | $ | 4 | $ | — | $ | — | $ | 4 | ||||||||
| Total subject to a master netting or similar arrangement | $ | 4 | $ | — | $ | — | $ | 4 | ||||||||
| * | Gross amounts presented as no amounts are netted within the Statements of Assets and Liabilities. |
Certain derivatives held by the Fund, as of December 31, 2013, are not subject to a master netting arrangement and are excluded from the table above.
| 5. | Principal Risks: |
The Fund may be exposed to counterparty risk, or the risk that an institution or other entity with which the Fund has unsettled or open transactions will default.
If the Fund invests directly in foreign currencies or in securities that trade in, and receive revenues in, foreign currencies, or in derivatives that provide exposure to foreign currencies, it will be subject to the risk that those currencies will decline in value relative to the base currency (U.S. dollars) of the Fund, or, in the case of hedging positions, that the Fund’s base currency will decline in value relative to the currency being hedged. Currency rates in foreign countries may fluctuate significantly over short periods of time for a number of reasons, including changes in interest rates, intervention (or the failure to intervene) by U.S. or foreign governments, central banks or supranational entities, such as the
| 24 |
International Monetary Fund, or by the imposition of currency controls or other political developments in the United States or abroad. As a result, the Fund’s investments in foreign currency denominated securities may reduce the returns of the Fund. The market values of equity securities, such as common stocks and preferred stocks, or equity related investments, such as futures and options, may decline due to general market conditions which are not specifically related to a particular company, such as real or perceived adverse economic conditions, changes in the general outlook for corporate earnings, changes in interest or currency rates or adverse investor sentiment generally. The market value of equity securities may also decline due to factors which affect a particular industry or industries, such as labor shortages or increased production costs and competitive conditions within an industry. Equity securities and equity related investments generally have greater market price volatility than fixed income securities.
| 6. | Federal Income Taxes: |
| a) | Federal Income Taxes – For federal income tax purposes, the Fund intends to continue to qualify as a RIC under Subchapter M of the Internal Revenue Code (“IRC”) by distributing substantially all of its taxable net investment income and net realized capital gains to its shareholders and otherwise complying with the requirements of the IRC. The Fund has distributed substantially all of its income and capital gains in prior years, if applicable, and intends to distribute substantially all of its income and capital gains prior to the next fiscal year-end. Accordingly, no provision for federal income or excise taxes has been made in the accompanying financial statements. Distributions from short-term capital gains are treated as ordinary income distributions for federal income tax purposes. |
| b) | Net Investment Income (Loss), Net Realized Gains (Losses) and Distributions – Net investment income (loss) and net realized gains (losses) may differ for financial statement and tax purposes primarily because of losses deferred due to wash sale adjustments, foreign currency gains and losses, adjustments related to PFICs, REITs, RICs, certain derivatives and partnerships. The character of distributions made during the year from net investment income or net realized gains may differ from their ultimate characterization for federal income tax purposes. Also, due to the timing of dividend distributions, the fiscal year in which amounts are distributed may differ from the year that the income or realized gains (losses) were recorded by the Fund. |
| c) | Distributions and Components of Distributable Earnings – The tax character of distributions paid by the Fund for the periods indicated is as follows (as adjusted for dividends payable, if applicable): |
| For the Year Ended December 31, 2013 | For the Year Ended December 31, 2012 | |||||||
| Ordinary Income | $ | 1,106 | $ | 855 | ||||
As of December 31, 2013, the Fund’s components of distributable earnings (deficit) on a tax basis were as follows:
| Amount | ||||
| Undistributed Ordinary Income | $ | 763 | ||
| Accumulated Capital and Other Losses* | (2,242 | ) | ||
| Unrealized Appreciation† | 13,280 | |||
| Total Accumulated Earnings | $ | 11,801 | ||
| * | The Fund has capital loss carryforwards that are identified in the Capital Loss Carryforward note that follows. |
| † | Differences between book-basis and tax-basis unrealized appreciation (depreciation) may be attributable to the losses deferred due to wash sale adjustments, foreign currency gains and losses, adjustments related to PFICs, REITs, RICs, certain derivatives and partnerships. |
| d) | Reclassification of Capital Accounts – The Fund may record reclassifications in its capital accounts. These reclassifications have no impact on the total net assets of the Fund. The reclassifications are a result of permanent differences between U.S. GAAP and tax accounting for such items as foreign currency, PFICs, expiration or utilization |
| 25 |
| Hartford Global Research HLS Fund |
| Notes to Financial Statements – (continued) |
| December 31, 2013 |
| (000’s Omitted) |
of capital loss carryforwards or net operating losses. Adjustments are made to reflect the impact these items have on current and future distributions to shareholders. Therefore, the source of the Fund’s distributions may be shown in the accompanying Statement of Changes in Net Assets as from undistributed net investment income, from accumulated net realized gains on investments or from capital depending on the type of book and tax differences that exist. For the year ended December 31, 2013, the Fund recorded reclassifications to increase (decrease) the accounts listed below:
| Amount | ||||
| Undistributed Net Investment Income (Loss) | $ | 50 | ||
| Accumulated Net Realized Gain (Loss) | (50 | ) | ||
| e) | Capital Loss Carryforward – On December 22, 2010, the Regulated Investment Company Modernization Act of 2010 (the “Act”) was enacted, which made changes to the capital loss carryforward rules. The changes are effective for taxable years beginning after the date of enactment. Under the Act, funds are permitted to carry forward capital losses for an unlimited period. However, any losses incurred during those future taxable years will be required to be utilized prior to the losses incurred in pre-enactment taxable years, which carry an expiration date. As a result of this ordering rule, pre-enactment capital loss carryforwards may be more likely to expire unused. Additionally, post-enactment capital loss carryforwards retain their character as either short-term or long-term capital losses rather than being considered all short-term as permitted under prior regulation. |
At December 31, 2013 (tax-year-end), the Fund had capital loss carryforwards for U.S. federal income tax purposes as follows:
| Year of Expiration | Amount | |||
| 2017 | $ | 2,242 | ||
| Total | $ | 2,242 | ||
During the year ended December 31, 2013, the Fund utilized $11,342 of prior year capital loss carryforwards.
| f) | Accounting for Uncertainty in Income Taxes – The Fund has adopted financial reporting rules that require the Fund to analyze all open tax years, as defined by the statute of limitations, for all major jurisdictions. Generally, tax authorities can examine all tax returns filed for the last three years. The Fund does not have an examination in progress. |
The Fund has reviewed all open tax years and major jurisdictions and concluded that these financial reporting rules had no effect on the Fund’s financial position or results of operations. There is no tax liability resulting from unrecognized tax benefits relating to uncertain income tax positions taken or expected to be taken on the tax return for the fiscal year ended December 31, 2013. The Fund is also not aware of any tax positions for which it is reasonably possible that the total amounts of unrecognized tax benefits will significantly change in the next twelve months.
| 7. | Expenses: |
| a) | Investment Management Agreement – Hartford Funds Management Company, LLC (“HFMC”), an indirect wholly owned subsidiary of The Hartford Financial Services Group, Inc. (“The Hartford”), serves as investment manager to the Fund pursuant to an Investment Management Agreement with the Company. The investment manager has overall investment supervisory responsibility for the Fund. In addition, the investment manager provides administrative personnel, services, equipment, facilities and office space for proper operation of the Fund. The investment manager has contracted with Wellington Management Company, LLP (“Wellington Management”) under a sub-advisory agreement for the provision of day-to-day investment management services to the Fund in accordance with the Fund’s investment objective and policies. The Fund pays a fee to the investment manager, a portion of which may be used to compensate Wellington Management. |
| 26 |
The schedule below reflects the rates of compensation paid to HFMC for investment management services rendered as of December 31, 2013; the rates are accrued daily and paid monthly.
| Average Daily Net Assets | Annual Fee | |||
| On first $500 million | 0.9000 | % | ||
| On next $500 million | 0.8750 | % | ||
| On next $4 billion | 0.8500 | % | ||
| On next $5 billion | 0.8475 | % | ||
| Over $10 billion | 0.8450 | % | ||
| b) | Accounting Services Agreement – Pursuant to the Fund Accounting Agreement between HFMC and the Company, on behalf of the Fund, HFMC provides accounting services to the Fund and receives monthly compensation based on the Fund’s average daily net assets at the rates set forth below. The Fund’s accounting services fees are accrued daily and paid monthly. |
| Average Daily Net Assets | Annual Fee | |||
| On first $5 billion | 0.018 | % | ||
| On next $5 billion | 0.016 | % | ||
| Over $10 billion | 0.014 | % | ||
Effective January 1, 2014, the new accounting services fees schedule based on the Fund’s average daily net assets is as follows:
| Average Daily Net Assets | Annual Fee | |||
| On first $5 billion | 0.018 | % | ||
| On next $5 billion | 0.014 | % | ||
| Over $10 billion | 0.010 | % | ||
| c) | Operating Expenses – Allocable expenses incurred by the Company are allocated to each Fund and allocated to classes within a Fund in proportion to the average daily net assets of the Fund and each class, except where allocation of certain expenses is more fairly made directly to the Fund or to specific classes within a Fund. |
| d) | Fees Paid Indirectly – The Company, on behalf of the Fund, has entered into agreements with State Street Global Markets, LLC and Russell Implementation Services, Inc. to partially recapture non-discounted trade commissions. Such rebates are used to pay a portion of the Fund’s expenses. In addition, the Fund’s custodian bank has agreed to reduce its fees when the Fund maintains cash on deposit in a non-interest-bearing custody account. For the year ended December 31, 2013, these amounts, if any, are included in the Statement of Operations. |
The ratio of expenses to average net assets in the accompanying financial highlights excludes the reduction in expenses related to fees paid indirectly. The annualized expense ratio after waivers for the period listed below reflecting the reduction for fees paid indirectly is as follows:
| Year Ended December 31, 2013 | ||||
| Class IA | 1.01 | % | ||
| Class IB | 1.26 | |||
| e) | Distribution Plan for Class IB shares – Effective June 14, 2013, Hartford Investment Financial Services, LLC was renamed Hartford Funds Distributors, LLC (“HFD”). HFD, a wholly owned, ultimate subsidiary of The Hartford, serves |
| 27 |
| Hartford Global Research HLS Fund |
| Notes to Financial Statements – (continued) |
| December 31, 2013 |
| (000’s Omitted) |
as the Fund’s principal underwriter and distributor. The Company, on behalf of the Fund, has adopted a Distribution Plan pursuant to Rule 12b-1 of the 1940 Act to compensate the distributor, HFD, from assets attributable to the Class IB shares for services rendered and expenses borne in connection with activities primarily intended to result in the sale of the Class IB shares, subject to the review and approval of the Company’s Board of Directors.
The Distribution Plan provides that the Fund may pay annually up to 0.25% of the average daily net assets of the Fund attributable to its Class IB shares for activities primarily intended to result in the sale of Class IB shares. The Board has the authority to suspend or reduce these payments at any point in time. Under the terms of the Distribution Plan and the principal underwriting agreement, the Fund is authorized to make payments monthly to the distributor that may be used to pay or compensate entities providing distribution and shareholder servicing with respect to the Class IB shares for such entities’ fees or expenses incurred or paid in that regard. These fees are accrued daily and paid monthly.
| f) | Other Related Party Transactions – Certain officers of the Fund are directors and/or officers of the investment manager and/or The Hartford or its subsidiaries. For the year ended December 31, 2013, a portion of the Fund’s Chief Compliance Officer’s salary was paid by all the investment companies in the Hartford fund complex. The portion allocated to the Fund rounds to zero. Hartford Administrative Services Company (“HASCO”), an indirect wholly owned subsidiary of The Hartford, provides transfer agent services to the Fund. HASCO was compensated on a per account basis for providing such services. The amount paid to HASCO can be found in the Statement of Operations. These fees are accrued daily and paid monthly. |
| g) | Payment from Affiliate – In July of 2007, The Hartford entered into a settlement with the Attorneys General of the states of New York, Connecticut and Illinois relating to market timing and the company's individual variable annuity contracts in which certain payments would be made directly to the variable annuity contract holders. The distribution plan provided that unclaimed money from the settlement would be distributed to certain HLS Funds that are investment options through a Hartford individual variable annuity contract. The unclaimed money was distributed to the Fund on September 18, 2009. |
The total return in the accompanying financial highlights includes payments from an affiliate. Had the payments from the affiliate been excluded, the impact and total return for the periods listed below would have been as follows:
| For the Year Ended December 31, 2009 | ||||||||
Class IA | Class IB | |||||||
| Impact from Payment from Affiliate for Attorneys General Settlement | 0.02 | % | 0.02 | % | ||||
| Total Return Excluding Payment from Affiliate | 42.10 | % | 41.76 | % | ||||
| 8. | Investment Transactions: |
For the year ended December 31, 2013, the Fund's aggregate purchases and sales of investment securities (excluding short-term investments) were as follows:
| Amount | ||||
| Cost of Purchases Excluding U.S. Government Obligations | $ | 73,992 | ||
| Sales Proceeds Excluding U.S. Government Obligations | 89,903 | |||
| 9. | Line of Credit: |
The Fund is one of several Hartford funds that participate in a $500 million committed revolving line of credit facility. The facility is to be used for temporary or emergency purposes. Under the arrangement, the funds are required to own securities having a market value in excess of 300% of the total bank borrowings. The interest rate on borrowings varies depending on the nature of the loan. The facility also requires a fee to be paid based on the amount of the commitment. This commitment
| 28 |
fee is allocated to all of the funds participating in the line of credit based on the average net assets of the funds. During the year ended December 31, 2013, the Fund did not have any borrowings under this facility.
| 10. | Industry Classifications: |
Other than the industry classifications “Other Investment Pools and Funds” and “Exchange Traded Funds,” equity industry classifications used in this report are the Global Industry Classification Standard, which was developed by and is the exclusive property and service mark of MSCI, Inc. and Standard & Poor’s.
| 11. | Indemnifications: |
Under the Company’s organizational documents, the Company shall indemnify its officers and directors to the full extent required or permitted under Maryland General Corporation Law and the federal securities laws. In addition, the Company, on behalf of the Fund, may enter into contracts that contain a variety of indemnifications. The Company’s maximum exposure under these arrangements is unknown. However, as of the date of these financial statements, the Company has not had prior claims or losses pursuant to these contracts and expects the risk of loss to be remote.
| 12. | Pending Legal Proceedings: |
On February 25, 2011, Jennifer L. Kasilag, Louis Mellinger, Judith M. Menendez, Jacqueline M. Robinson, and Linda A. Russell filed a derivative lawsuit against Hartford Investment Financial Services, LLC (“HIFSCO”)(now known as Hartford Funds Distributors, LLC) on behalf of six Hartford retail mutual funds in the United States District Court for the District of New Jersey, alleging that HIFSCO received excessive advisory and distribution fees in violation of its statutory fiduciary duty under Section 36(b) of the 1940 Act when serving as investment manager and principal underwriter, respectively, to the Hartford retail mutual funds. HIFSCO moved to dismiss and, in September 2011, the motion was granted in part and denied in part, with leave to amend the complaint. In November 2011, plaintiffs filed an amended complaint on behalf of certain Hartford retail mutual funds, The Hartford Global Health Fund (now known as The Hartford Healthcare Fund), The Hartford Conservative Allocation Fund, The Hartford Growth Opportunities Fund, The Hartford Inflation Plus Fund, The Hartford Advisers Fund (now known as The Hartford Balanced Fund), and The Hartford Capital Appreciation Fund. Plaintiffs seek to rescind the investment management agreements and distribution plans between HIFSCO and these funds and to recover the total fees charged thereunder or, in the alternative, to recover any improper compensation HIFSCO received, in addition to lost earnings. HIFSCO filed a partial motion to dismiss the amended complaint and, in December 2012, the court dismissed without prejudice the claims regarding distribution fees and denied the motion with respect to the advisory fees claims. HIFSCO disputes the allegations and intends to defend the advisory fee claims vigorously.
This action concerns the activities of HIFSCO in its capacity as investment manager and principal underwriter to the Hartford retail mutual funds and does not concern HIFSCO’s activities in its capacity as principal underwriter to the HLS funds. For this reason, no accrual for litigation relating to this matter has been recorded in the financial statements of the Fund.
| 13. | Subsequent Events: |
At a meeting held on February 5, 2014, the Board of Directors of Hartford Series Fund, Inc. approved an Agreement and Plan of Reorganization relating to the reorganization of the Fund into Hartford Global Growth HLS Fund, a series of Hartford Series Fund, Inc. The Reorganization does not require shareholder approval. The Reorganization is expected to occur on or about June 23, 2014.
| 29 |
| Hartford Global Research HLS Fund |
| Financial Highlights |
| ─ Selected Per-Share Data(A) ─ | ─ Ratios and Supplemental Data─ | |||||||||||||||||||||||||||||||||||||||||||||||||||
| Class | Net Asset Value at Beginning of Period | Net Investment Income (Loss) | Net Realized and Unrealized Gain (Loss) on Investments | Total from Investment Operations | Dividends from Net Investment Income | Distributions from Realized Capital Gains | Total Dividends and Distributions | Net Asset Value at End of Period | Total Return(B) | Net Assets at End of Period (000s) | Ratio of Expenses to Average Net Assets Before Adjust- ments(C) | Ratio of Expenses to Average Net Assets After Adjust- ments(C) | Ratio of Net Investment Income (Loss) to Average Net Assets | |||||||||||||||||||||||||||||||||||||||
| For the Year Ended December 31, 2013 | ||||||||||||||||||||||||||||||||||||||||||||||||||||
| IA | $ | 10.56 | $ | 0.12 | $ | 2.92 | $ | 3.04 | $ | (0.19 | ) | $ | – | $ | (0.19 | ) | $ | 13.41 | 29.01 | % | $ | 56,870 | 1.01 | % | 1.01 | % | 1.01 | % | ||||||||||||||||||||||||
| IB | 10.52 | 0.09 | 2.90 | 2.99 | (0.15 | ) | – | (0.15 | ) | 13.36 | 28.65 | 23,218 | 1.26 | 1.26 | 0.76 | |||||||||||||||||||||||||||||||||||||
| For the Year Ended December 31, 2012 (D) | ||||||||||||||||||||||||||||||||||||||||||||||||||||
| IA | $ | 9.02 | $ | 0.15 | $ | 1.51 | $ | 1.66 | $ | (0.12 | ) | $ | – | $ | (0.12 | ) | $ | 10.56 | 18.39 | % | $ | 52,785 | 1.04 | % | 1.04 | % | 1.28 | % | ||||||||||||||||||||||||
| IB | 8.98 | 0.13 | 1.50 | 1.63 | (0.09 | ) | – | (0.09 | ) | 10.52 | 18.10 | 23,109 | 1.29 | 1.29 | 1.03 | |||||||||||||||||||||||||||||||||||||
| For the Year Ended December 31, 2011 (D) | ||||||||||||||||||||||||||||||||||||||||||||||||||||
| IA | $ | 9.94 | $ | 0.11 | $ | (1.03 | ) | $ | (0.92 | ) | $ | – | $ | – | $ | – | $ | 9.02 | (9.28 | )% | $ | 52,768 | 1.03 | % | 1.03 | % | 1.01 | % | ||||||||||||||||||||||||
| IB | 9.93 | 0.09 | (1.04 | ) | (0.95 | ) | – | – | – | 8.98 | (9.51 | ) | 25,747 | 1.28 | 1.28 | 0.76 | ||||||||||||||||||||||||||||||||||||
| For the Year Ended December 31, 2010 (D) | ||||||||||||||||||||||||||||||||||||||||||||||||||||
| IA | $ | 8.67 | $ | 0.10 | $ | 1.28 | $ | 1.38 | $ | (0.11 | ) | $ | – | $ | (0.11 | ) | $ | 9.94 | 16.01 | % | $ | 69,740 | 1.01 | % | 0.98 | % | 1.03 | % | ||||||||||||||||||||||||
| IB | 8.66 | 0.08 | 1.28 | 1.36 | (0.09 | ) | – | (0.09 | ) | 9.93 | 15.72 | 35,774 | 1.26 | 1.23 | 0.78 | |||||||||||||||||||||||||||||||||||||
| For the Year Ended December 31, 2009 (D) | ||||||||||||||||||||||||||||||||||||||||||||||||||||
| IA | $ | 6.16 | $ | 0.08 | $ | 2.51 | $ | 2.59 | $ | (0.08 | ) | $ | – | $ | (0.08 | ) | $ | 8.67 | 42.13 | %(E) | $ | 67,012 | 1.16 | % | 1.06 | % | 1.17 | % | ||||||||||||||||||||||||
| IB | 6.15 | 0.07 | 2.50 | 2.57 | (0.06 | ) | – | (0.06 | ) | 8.66 | 41.79 | (E) | 37,695 | 1.41 | 1.31 | 0.93 | ||||||||||||||||||||||||||||||||||||
| (A) | Information presented relates to a share outstanding throughout the indicated period. Net investment income (loss) per share amounts are calculated based on average shares outstanding unless otherwise noted. |
| (B) | The figures do not include sales charges or other fees which may be applied at the variable life insurance, variable annuity or qualified retirement plan product level. Any such additional sales charges or other fees would lower the Fund's performance. |
| (C) | Adjustments include waivers and reimbursements, if applicable. Ratios do not include fees paid indirectly (see Expenses in the accompanying Notes to Financial Statements). |
| (D) | Net investment income (loss) per share amounts have been calculated using the SEC method. |
| (E) | Total return without the inclusion of the Payment from (to) Affiliate can be found in Expenses in the accompanying Notes to Financial Statements. |
| Portfolio Turnover Rate for All Share Classes | ||||
| For the Year Ended December 31, 2013 | 97 | % | ||
| For the Year Ended December 31, 2012 | 85 | |||
| For the Year Ended December 31, 2011 | 86 | |||
| For the Year Ended December 31, 2010 | 92 | |||
| For the Year Ended December 31, 2009 | 124 | |||
| 30 |
| Report of Independent Registered Public Accounting Firm |
| The Board of Directors and Shareholders of |
| Hartford Series Fund, Inc. |
We have audited the accompanying statement of assets and liabilities, including the schedule of investments, of Hartford Global Research HLS Fund (one of the portfolios constituting Hartford Series Fund, Inc. (the Funds)) as of December 31, 2013, and the related statement of operations for the year then ended, the statements of changes in net assets for each of the two years in the period then ended, and the financial highlights for each of the five years in the period then ended. These financial statements and financial highlights are the responsibility of the Funds’ management. Our responsibility is to express an opinion on these financial statements and financial highlights based on our audits.
We conducted our audits in accordance with the standards of the Public Company Accounting Oversight Board (United States). Those standards require that we plan and perform the audit to obtain reasonable assurance about whether the financial statements and financial highlights are free of material misstatement. We were not engaged to perform an audit of the Funds’ internal control over financial reporting. Our audits included consideration of internal control over financial reporting as a basis for designing audit procedures that are appropriate in the circumstances, but not for the purpose of expressing an opinion on the effectiveness of the Funds’ internal control over financial reporting. Accordingly, we express no such opinion. An audit also includes examining, on a test basis, evidence supporting the amounts and disclosures in the financial statements and financial highlights, assessing the accounting principles used and significant estimates made by management, and evaluating the overall financial statement presentation. Our procedures included confirmation of securities owned as of December 31, 2013, by correspondence with the custodian and brokers or by other appropriate auditing procedures where replies from brokers were not received. We believe that our audits provide a reasonable basis for our opinion.
In our opinion, the financial statements and financial highlights referred to above present fairly, in all material respects, the financial position of Hartford Global Research HLS Fund of the Hartford Series Fund, Inc. at December 31, 2013, the results of its operations for the year then ended, the changes in its net assets for each of the two years in the period then ended, and the financial highlights for each of the five years in the period then ended, in conformity with U.S. generally accepted accounting principles.
Minneapolis, MN
February 17, 2014
| 31 |
| Hartford Global Research HLS Fund |
| Directors and Officers (Unaudited) |
The Board of Directors of the Company appoints officers who are responsible for the day-to-day operations of the Fund and who execute policies formulated by the directors. Each director serves until his or her death, resignation, or retirement or until the next annual meeting of shareholders is held or until his or her successor is elected and qualifies.
Directors and officers who are employed by or who have a financial interest in The Hartford are considered “interested” persons of the Fund pursuant to the 1940 Act. Each officer and two of the Company’s directors, as noted in the chart below, are “interested” persons of the Fund. Each director serves as a director for The Hartford Mutual Funds, Inc., The Hartford Mutual Funds II, Inc., Hartford Series Fund, Inc., Hartford HLS Series Fund II, Inc., and as a trustee for The Hartford Alternative Strategies Fund, which, as of December 31, 2013, collectively consist of 91 funds. Correspondence may be sent to directors and officers c/o Hartford Funds, 5 Radnor Corporate Center, Suite 300, 100 Matsonford Road, Radnor, Pennsylvania 19087, except that correspondence to Mr. Annoni, Mr. Dressen and Ms. Quade may be sent to 500 Bielenberg Drive, Woodbury, Minnesota 55125.
The table below sets forth, for each director and officer, his or her name, year of birth, current position with the Company and date first elected or appointed to Hartford Series Fund, Inc. (“HSF”), and Hartford HLS Series Fund II, Inc. (“HSF2”), principal occupation, and, for directors, other directorships held. The Fund’s Statement of Additional Information contains further information on the directors and is available free of charge by calling 1-800-862-6668 or writing to Hartford HLS Funds, c/o Hartford Life Insurance Company, Hartford Life and Annuity Insurance Company, P.O. Box 14293, Lexington, KY 40512-4293.
Information on the aggregate remuneration paid to the directors of the Company can be found in the Statement of Operations herein. The Fund pays to The Hartford a portion of the Chief Compliance Officer’s compensation, but does not pay salaries or compensation to any of their other officers or directors who are employed by The Hartford.
Non-Interested Directors
Lynn S. Birdsong (1946) Director since 2003, Co-Chairman of the Investment Committee since 2005
Mr. Birdsong is a private investor. Mr. Birdsong currently serves as a Director of the Sovereign High Yield Investment Company (April 2010 to current). Mr. Birdsong currently serves as an Independent Director of Nomura Partners Funds, Inc. (formerly, The Japan Fund) (April 2003 to current). From 2003 to March 2005, Mr. Birdsong was an Independent Director of the Atlantic Whitehall Funds. From 1979 to 2002, Mr. Birdsong was a Managing Director of Zurich Scudder Investments, an investment management firm. During his employment with Scudder, Mr. Birdsong was an Interested Director of The Japan Fund. From January 1981 through December 2013, Mr. Birdsong was a partner in Birdsong Company, an advertising specialty firm.
Robert M. Gavin, Jr. (1940) Director since 2002 (HSF) and 1986 (HSF2), Chairman of the Board since 2004
Dr. Gavin is an educational consultant. Prior to September 1, 2001, he was President of Cranbrook Education Community and prior to July 1996, he was President of Macalester College, St. Paul, Minnesota.
Duane E. Hill (1945) Director since 2001 (HSF) and 2002 (HSF2), Chairman of the Nominating Committee since 2003
Mr. Hill is a Partner of TSG Ventures L.P., a private equity investment company. Mr. Hill is a former partner of TSG Capital Group, a private equity investment firm that served as sponsor and lead investor in leveraged buyouts of middle market companies.
Sandra S. Jaffee (1941) Director since 2005
Ms. Jaffee is the founder and Chief Executive Officer of a private company, Homeworks Concierge, LLC, which provides residential property management services in Westchester County, New York (January 2012 to present). Ms. Jaffee served as Chairman (2008 to 2009) and Chief Executive Officer of Fortent (formerly Searchspace Group), a leading provider of compliance/regulatory technology to financial institutions from August 2005 to August 2009. Ms. Jaffee currently serves as a member of the Board of Directors of Broadridge Financial Solutions as well as a Trustee of Muhlenberg College.
| 32 |
William P. Johnston (1944) Director since 2005, Chairman of the Compliance Committee since 2005
In June 2006, Mr. Johnston was appointed as Senior Advisor to The Carlyle Group, a global private equity and alternative asset investment firm and currently serves as an Operating Executive. In July 2006, Mr. Johnston was elected to the Board of Directors of MultiPlan, Inc. and served as a Director (July 2006 to August 2010). In August 2007, Mr. Johnston was elected to the Board of Directors of LifeCare Holdings, Inc. and served as a Director (August 2007 to June 2013). In February 2008, Mr. Johnston was elected to the Board of Directors of HCR-ManorCare, Inc. In May 2006, Mr. Johnston was elected to the Supervisory Board of Fresenius Medical Care AG & Co. KGaA, after its acquisition of Renal Care Group, Inc. in March 2006. Mr. Johnston joined Renal Care Group in November 2002 as a member of the Board of Directors and served as Chairman of the Board from March 2003 through March 2006. From 2002 through 2013, Mr. Johnston served as a Board member of the Georgia O’Keefe Museum. From September 1987 to December 2002, Mr. Johnston was with Equitable Securities Corporation (and its successors, SunTrust Equitable Securities and SunTrust Robinson Humphrey) serving in various investment banking and managerial positions, including Managing Director and Head of Investment Banking, Chief Executive Officer and Vice Chairman.
Phillip O. Peterson (1944) Director since 2002 (HSF) and 2000 (HSF2), Chairman of the Audit Committee since 2002
Mr. Peterson is a mutual fund industry consultant. He was a partner of KPMG LLP (an accounting firm) until July 1999. Mr. Peterson joined William Blair Funds in February 2007 as a member of the Board of Trustees. Mr. Peterson also joined the Board of Trustees of Symetra Variable Mutual Funds Trust as a trustee in February 2012.
Lemma W. Senbet (1946) Director since 2005
Dr. Senbet is the William E. Mayer Chair Professor of Finance and Founding Director, Center for Financial Policy, at the University of Maryland, Robert H. Smith School of Business. He was chair of the Finance Department of the University of Maryland, Robert H. Smith School of Business from 1998 to 2006. Since June 2013, he has been on leave from the University to serve as Executive Director of African Economic Research Consortium which focuses on economic policy research and training. Previously, he was a chaired professor of finance at the University of Wisconsin-Madison. Also, he was a Director of the Fortis Funds from March 2000 to July 2002. Dr. Senbet served as Director of the American Finance Association and President of the Western Finance Association. In 2006, Dr. Senbet was inducted Fellow of Financial Management Association International for his career-long distinguished scholarship and professional service.
Interested Directors and Officers
James E. Davey (1964) Director since 2012, President and Chief Executive Officer since 2010
Mr. Davey serves as Executive Vice President of Hartford Life Insurance Company (“HLIC”) and The Hartford Financial Services Group, Inc. Additionally, Mr. Davey serves as Chairman of the Board, Manager and Senior Managing Director of Hartford Funds Distributors, LLC (“HFD”). He also currently serves as Director, Chairman of the Board, President and Senior Managing Director of Hartford Administrative Services Company (“HASCO”). Mr. Davey also serves as Manager, Chairman of the Board and Senior Managing Director for Hartford Funds Management Company, LLC (“HFMC”). Mr. Davey joined The Hartford in 2002.
Lowndes A. Smith (1939) Director since 1996 (HSF) and 2002 (HSF2), Co-Chairman of the Investment Committee since 2005
Mr. Smith served as Vice Chairman of The Hartford from February 1997 to January 2002, as President and Chief Executive Officer of Hartford Life, Inc. from February 1997 to January 2002, and as President and Chief Operating Officer of The Hartford Life Insurance Companies from January 1989 to January 2002. Mr. Smith serves as a Director of White Mountains Insurance Group Ltd. (October 2003 to current); One Beacon Insurance (October 2006 to current); Symetra Financial (August 2007 to current) and is a Managing Director of Whittington Gray Associates (January 2007 to current).
Other Officers
Mark A. Annoni (1964) Vice President, Controller and Treasurer since 2012
Mr. Annoni currently serves as the Assistant Vice President of HLIC (February 2004 to present).
| 33 |
| Hartford Global Research HLS Fund |
| Directors and Officers (Unaudited) – (continued) |
Michael R. Dressen (1963) AML Compliance Officer since 2011
Mr. Dressen currently serves as Assistant Vice President of HLIC. He also serves as Chief Compliance Officer and AML Compliance Officer of HASCO and as AML Officer of HFD. Mr. Dressen has served in various positions within The Hartford and its subsidiaries in connection with the operation of the Hartford Funds.
Edward P. Macdonald (1967) Vice President, Secretary and Chief Legal Officer since 2005
Mr. Macdonald currently serves as Assistant Secretary, Executive Vice President and Deputy General Counsel of HFD, HASCO and HFMC. He also serves as Vice President of HLIC. Mr. Macdonald has served in various positions within The Hartford and its subsidiaries in connection with the operation of the Hartford Funds. Mr. Macdonald joined The Hartford in 2005.
Joseph G. Melcher (1973) Vice President and Chief Compliance Officer since 2013
Mr. Melcher currently serves as Executive Vice President of HASCO and HFD. Mr. Melcher also currently serves as Executive Vice President and Chief Compliance Officer of HFMC. Mr. Melcher has served in various positions within The Hartford and its subsidiaries in connection with the operation of the Hartford Funds since joining The Hartford in 2012. Prior to joining The Hartford, Mr. Melcher worked at Touchstone Investments, a member of the Western & Southern Financial Group, where he held the position of Vice President and Chief Compliance Officer from 2010 through 2012 and Assistant Vice President, Compliance from 2005 to 2010.
Vernon J. Meyer (1964) Vice President since 2006
Mr. Meyer currently serves as Senior Vice President of HLIC. He also currently serves as Managing Director and Chief Investment Officer of HFMC. Mr. Meyer has served in various positions within The Hartford and its subsidiaries in connection with the operation of the Hartford Funds. Mr. Meyer joined The Hartford in 2004.
Laura S. Quade (1969) Vice President since 2012
Ms. Quade currently serves as Vice President of HASCO and HFD. She is the Head of Operations of HASCO and also serves as Director, Enterprise Operations of HLIC. Ms. Quade has served in various positions within The Hartford and its subsidiaries in connection with the operation of the Hartford Funds.
Martin A. Swanson (1962) Vice President since 2010
Mr. Swanson currently serves as Vice President of HLIC. Mr. Swanson also serves as Managing Director, Chief Marketing Officer and Principal of HFD. Mr. Swanson has served in various positions within The Hartford and its subsidiaries in connection with the operation of the Hartford Funds.
HOW TO OBTAIN A COPY OF THE FUND’S PROXY VOTING POLICIES AND VOTING RECORDS (UNAUDITED)
A description of the policies and procedures that the Fund uses to determine how to vote proxies relating to portfolio securities and information about how the Fund voted proxies relating to portfolio securities during the most recent twelve-month period ended June 30 are available (1) without charge, upon request, by calling 800-862-6668 and (2) on the SEC’s website at http://www.sec.gov.
QUARTERLY PORTFOLIO HOLDINGS INFORMATION (UNAUDITED)
The Fund files a complete schedule of portfolio holdings with the SEC for the first and third quarters of each fiscal year on Form N-Q. The Fund’s Forms N-Q are available (1) without charge, upon request, by calling 800-862-6668 and (2) on the SEC’s website at http://www.sec.gov. The Form N-Q may be reviewed and copied at the SEC’s Public Reference Room in Washington, DC. Information on the operation of the Public Reference Room may be obtained by calling 1-800-SEC-0330.
| 34 |
| Hartford Global Research HLS Fund |
| Expense Example (Unaudited) |
Your Fund's Expenses
As a shareholder of the Fund, you incur two types of costs: (1) transaction costs and (2) ongoing costs, including investment management fees, distribution and/or service (12b-1) fees, if any, and other fund expenses. This example is intended to help you understand your ongoing costs (in dollars) of investing in the Fund and to compare these costs with the ongoing costs of investing in other mutual funds. The example is based on an investment of $1,000 invested at the beginning of the period and held for the period of June 30, 2013 through December 31, 2013.
Actual Expenses
The first set of columns of the table below provides information about actual account values and actual expenses. You may use the information in this column, together with the amount you invested, to estimate the expenses that you paid over the period. Simply divide your account value by $1,000 (for example, an $8,600 account value divided by $1,000 = 8.6), then multiply the result by the number in the line under the heading entitled “Expenses Paid During Period” to estimate the expenses you paid on your account during this period.
Hypothetical Example for Comparison Purposes
The second set of columns of the table below provides information about hypothetical account values and hypothetical expenses based on the Fund’s actual expense ratio and an assumed rate of return of 5% per year before expenses, which is not the Fund’s actual return. The hypothetical account values and expenses may not be used to estimate the actual ending account balance or expenses you paid for the period. You may use this information to compare the ongoing costs of investing in the Fund and other funds. To do so, compare this 5% hypothetical example with the 5% hypothetical examples that appear in the shareholder reports of the other funds.
Please note that the expenses shown in the table are meant to highlight your ongoing costs only and do not reflect any transactional costs, such as sales charges (loads) and CDSC. Therefore, the second set of columns of the table is useful in comparing ongoing costs only, and will not help you determine the relative total costs of owning different funds. In addition, if these transactional costs were included, your costs would be higher. Expenses are equal to the Fund's annualized expense ratios multiplied by average account value over the period, multiplied by 184/365 (to reflect the one-half year period).
| Actual return | Hypothetical (5% return before expenses) | |||||||||||||||||||||||||||||||
| Beginning Account Value June 30, 2013 | Ending Account Value December 31, 2013 | Expenses paid during the period June 30, 2013 through December 31, 2013 | Beginning Account Value June 30, 2013 | Ending Account Value December 31, 2013 | Expenses paid during the period June 30, 2013 through December 31, 2013 | Annualized expense ratio | Days in the current 1/2 year | Days in the full year | ||||||||||||||||||||||||
| Class IA | $ | 1,000.00 | $ | 1,189.00 | $ | 5.69 | $ | 1,000.00 | $ | 1,020.01 | $ | 5.25 | 1.03 | % | 184 | 365 | ||||||||||||||||
| Class IB | $ | 1,000.00 | $ | 1,187.40 | $ | 7.06 | $ | 1,000.00 | $ | 1,018.75 | $ | 6.52 | 1.28 | % | 184 | 365 | ||||||||||||||||
| 35 |
| Hartford Global Research HLS Fund |
| Approval of Investment Management and Investment Sub-Advisory Agreements (Unaudited) |
Section 15(c) of the Investment Company Act of 1940, as amended (the “1940 Act”), requires that each mutual fund’s board of directors, including a majority of those directors who are not “interested persons” of the mutual fund, as defined in the 1940 Act (the “Independent Directors”), annually review and consider the continuation of the mutual fund’s investment advisory and sub-advisory agreements. At its meeting held on August 6-7, 2013, the Board of Directors (the “Board”) of Hartford Series Fund, Inc., including each of the Independent Directors, unanimously voted to approve the continuation of the investment management agreement for Hartford Global Research HLS Fund (the “Fund”) with Hartford Funds Management Company, LLC (“HFMC”) and the continuation of the investment sub-advisory agreement between HFMC and the Fund’s sub-adviser, Wellington Management Company, LLP (the “Sub-adviser,” and together with HFMC, the “Advisers”) (collectively, the “Agreements”).
In the months preceding the August 6-7, 2013 meeting, the Board requested, received, and reviewed written responses from the Advisers to questions posed to them on behalf of the Independent Directors and supporting materials relating to those questions and responses. The Board considered information furnished to the Board at its meetings throughout the year, as well as information specifically prepared in connection with the annual approval of the Agreements at the Board’s meetings held on June 18-19, 2013 and August 6-7, 2013. Information provided to the Board at its meetings throughout the year included, among other things, reports on Fund performance, legal and compliance matters, sales and marketing activity, shareholder services, and the other services provided to the Fund by the Advisers and their affiliates. The Board also received in-person presentations by Fund officers and representatives of HFMC at the Board’s meetings on June 18-19, 2013 and August 6-7, 2013 concerning the Agreements.
The Independent Directors, advised by independent legal counsel, engaged two service providers to assist them with evaluating the Agreements with respect to the Fund. Lipper Inc. (“Lipper”), an independent provider of investment company data, was retained to provide the Board with reports on how the Fund’s contractual management fees, actual management fees, other non-management fees, overall expense ratios and investment performance compared to those of mutual funds with similar investment objectives. The Independent Directors also engaged an independent financial services consulting firm (the “Consultant”) to assist them in evaluating the Fund’s management fees, sub-advisory fees, other non-management fees, overall expense ratios and investment performance. In addition, the Consultant reviewed the profitability calculations utilized by HFMC in connection with the continuation of the investment management agreement.
In determining whether to continue the Agreements for the Fund, the members of the Board reviewed and evaluated information and factors they believed to be relevant and appropriate in light of the information that the Board deemed necessary and appropriate through the exercise of its reasonable business judgment. While individual members of the Board may have weighed certain factors differently, the Board’s determination to continue the Agreements was based on a comprehensive consideration of all information provided to the Board throughout the year and specifically with respect to the continuation of the Agreements. A more detailed discussion of the factors the Board considered with respect to its approval of the Agreements is provided below.
Nature, Extent, and Quality of Services Provided by the Advisers
The Board requested and considered information concerning the nature, extent, and quality of the services provided to the Fund by the Advisers. The Board considered, among other things, the terms of the Agreements and the range of services provided by the Advisers. The Board considered the Advisers’ professional personnel who provide services to the Fund, including each Adviser’s ability and experience in attracting and retaining qualified personnel to service the Fund. The Board considered each Adviser’s reputation and overall financial strength, as well as its willingness to consider and implement organizational and operational changes designed to improve services to the Fund. In addition, the Board considered the quality of each Adviser’s communications with the Board and responsiveness to Board inquiries.
The Board also requested and evaluated information concerning each Adviser’s regulatory and compliance environment. In this regard, the Board requested and reviewed information on each Adviser’s compliance policies and procedures, compliance history, and a report from the Fund’s Chief Compliance Officer on each Adviser’s compliance with applicable laws and regulations, including responses to regulatory developments and compliance issues raised by regulators. The Board also noted the Advisers’ support of the Fund’s compliance control structure, particularly the resources devoted by the Advisers in support of the Fund’s obligations pursuant to Rule 38a-1 under the 1940 Act.
| 36 |
With respect to HFMC, the Board noted that under the Agreements, HFMC is responsible for the management of the Fund, including overseeing fund operations and service providers, as well as investment advisory services in connection with selecting, monitoring and supervising the Sub-adviser. The Board considered HFMC’s ongoing monitoring of people, process and performance, including its quarterly reviews of each of the Hartford Funds, semi-annual meetings with the leaders of each Fund’s portfolio management team, and oversight of the Funds’ approximately 40 portfolio managers. The Board recognized that HFMC has demonstrated a record of making changes to the management and/or strategies of the Funds when warranted. The Board considered HFMC’s oversight of the Sub-adviser’s investment approach and results, process for monitoring best execution of portfolio trades by the Sub-adviser, and approach to risk management with respect to the Fund and the service providers to the Fund. The Board also considered HFMC’s oversight of compliance with the Fund’s objective and policies as well as with applicable laws and regulations, noting that regulatory and other developments had over time led to an increase in the scope of HFMC’s services in this regard.
In addition, the Board considered HFMC’s ongoing commitment to review and rationalize the Hartford Funds product line-up and the expenses that HFMC had incurred in connection with fund combinations in recent years. The Board considered that HFMC or its affiliates are responsible for providing the Fund’s officers. The Board also noted that Hartford Life Insurance Company (“HLIC”) provides administrative services to the Fund. The Board considered its experiences with HFMC and HLIC with respect to each of these services.
With respect to the Sub-adviser, who provides day-to-day portfolio management services, the Board considered the quality of the Fund’s portfolio managers, the Sub-adviser’s other investment personnel, its investment philosophy and process, investment research capabilities and resources, performance record, trade execution capabilities and experience. The Board considered the experience of the Fund’s portfolio managers, the number of accounts managed by the portfolio managers, and the Sub-adviser’s method for compensating the portfolio managers.
Based on these considerations, the Board concluded that it was satisfied with the nature, extent and quality of the services provided to the Fund by HFMC and the Sub-adviser.
Performance of the Fund and the Advisers
The Board considered the investment performance of the Fund. In this regard, the Board reviewed the performance of the Fund over different time periods presented in the materials and evaluated HFMC’s analysis of the Fund’s performance for these time periods. The Board considered information and materials provided to the Board by the Advisers concerning Fund performance, as well as information from Lipper comparing the investment performance of the Fund to an appropriate benchmark and universe of peer funds. The Board noted that the Fund’s performance was in the 5th quintile of its performance universe for the 1- and 3-year periods and in the 4th quintile for the 5-year period. The Board also noted that the Fund’s performance was above its benchmark for the 1-, 3- and 5-year periods.
The Board considered the detailed investment analytics reports provided by Hartford Funds’ Investment Advisory Group throughout the year. These reports include, among other things, information on the Fund’s gross and net returns, the Fund’s investment performance relative to an appropriate benchmark and peer group, various statistics concerning the Fund’s portfolio, and a narrative summary of various factors affecting Fund performance. The Board considered the Advisers’ cooperation with the Investment Committee, which assists the Board in evaluating the performance of the Fund at periodic meetings throughout the year. The Board also considered the analysis provided by the Consultant relating to the Fund’s performance track record.
In light of all the considerations noted above, the Board concluded that it had continued confidence in HFMC’s and the Sub-adviser’s overall capabilities to manage the Fund.
Costs of the Services and Profitability of the Advisers
The Board reviewed information regarding HFMC’s cost to provide investment management and related services to the Fund and HFMC’s profitability, both overall and for the Fund, on a pre-tax basis without regard to distribution expenses. The Board also requested and reviewed information about the profitability to HFMC and its affiliates from all services provided to the Fund and
| 37 |
| Hartford Global Research HLS Fund |
| Approval of Investment Management and Investment Sub-Advisory Agreements (Unaudited) – (continued) |
all aspects of their relationship with the Fund. The Board also requested and received information relating to the operations and profitability of the Sub-adviser.
The Board considered the Consultant’s review of the profitability calculations utilized by HFMC in connection with the continuation of the investment management agreement, noting the Consultant’s view that Hartford Funds’ process for calculating and reporting Fund profitability is reasonable. In this regard, the Board noted that the Consultant had previously performed a full review of this process and reported that such process is sound and well within common industry practice.
Based on these considerations, the Board concluded that the profits anticipated to be realized by the Advisers and their affiliates from their relationships with the Fund would not be excessive.
Comparison of Fees and Services Provided by the Advisers
The Board considered comparative information with respect to the management fees to be paid by the Fund to HFMC and the total expense ratios of the Fund. The Board also considered comparative information with respect to the sub-advisory fees to be paid by HFMC to the Sub-adviser. In this regard, the Board requested and reviewed information from HFMC and the Sub-adviser relating to the management and sub-advisory fees, including the sub-advisory fee schedule for the Fund, and total operating expenses for the Fund. The Board considered that the management fee for the Fund includes the fee paid to HLIC for providing certain administrative services to the Fund. With respect to the sub-advisory fee schedule, the Board considered representations from HFMC and the Sub-adviser that the Sub-adviser’s fees were negotiated at arm’s length. The Board also reviewed information from Lipper comparing the Fund’s contractual management fees, actual management fees and overall expense ratios relative to a group of funds selected by Lipper, in consultation with the Consultant, and a broader universe of funds selected by Lipper. The Board noted that the Fund’s contractual management fee was in the 4th quintile of its expense group, while its actual management fee was in the 2nd quintile and its total expenses (less 12b-1 and shareholder service fees) were in the 3rd quintile.
While the Board recognized that comparisons between the Fund and peer funds are imprecise, given the differing service levels and characteristics of mutual funds and the different business models and cost structures of the Advisers, the comparative information provided by Lipper assisted the Board in evaluating the reasonableness of the Fund’s management and sub-advisory fees and total operating expenses. In addition, the Board considered the analysis and recommendations of the Consultant relating to the Fund’s management and sub-advisory fees and total operating expenses.
Based on these considerations, the Board concluded that the Fund’s fees and total operating expenses, in conjunction with the information about quality of services, profitability, economies of scale, and other matters discussed, were reasonable in light of the services provided.
Economies of Scale
The Board requested and considered information regarding the Advisers’ realization of economies of scale with respect to the Fund and whether the fee levels reflect these economies of scale for the benefit of the Fund’s shareholders. The Board reviewed the breakpoints in the management fee schedule for the Fund, which reduce fee rates as Fund assets grow over time. The Board recognized that a fund with assets beyond the last breakpoint level will continue to benefit from economies of scale because additional assets are charged the lowest breakpoint fee resulting in lower overall effective management fee rates. The Board also recognized that a fee schedule that reaches a lower breakpoint quickly provides shareholders with the benefit of anticipated or potential economies of scale. The Board noted the effect of the sale and run-off of the variable annuity business on the HLS Funds and also noted that the Fund’s current low asset levels have kept the Fund from fully realizing the benefits of anticipated or potential economies of scale.
The Board reviewed and evaluated materials from Lipper showing how management fee schedules of peer funds reflect economies of scale for the benefit of shareholders as a peer fund’s assets hypothetically increase over time. Based on information provided by HFMC, Lipper, and the Consultant, the Board recognized that there is no uniform methodology for establishing breakpoints or uniform pattern in asset levels that trigger breakpoints or the amounts of breakpoints triggered.
| 38 |
After considering all of the information available to it, the Board concluded that it was satisfied with the extent to which economies of scale would be shared for the benefit of the Fund’s shareholders based on currently available information and the effective advisory fees and expense ratios for the Fund at its current and reasonably anticipated asset levels. The Board noted, however, that it would continue to monitor future growth in Fund assets and the appropriateness of additional breakpoints.
Other Benefits
The Board considered other benefits to the Advisers and their affiliates from their relationships with the Fund, including the role of the Fund in supporting the variable life insurance and variable annuity products offered by The Hartford.
The Board reviewed information noting that HLIC, an affiliate of HFMC, receives fees for providing certain administrative services to the Fund and that HFMC receives fees for fund accounting and related services from the Fund. The Board considered information on profits to HLIC and HFMC for such services. The Board also considered that Hartford Administrative Services Company (“HASCO”), the Fund’s transfer agent and an affiliate of HFMC, receives transfer agency compensation from the Fund, and the Board reviewed information on the profitability of the Fund’s transfer agency function to HASCO. The Board considered information provided by HASCO indicating that the transfer agent fees charged by HASCO to the Fund were fair and reasonable based on publicly available information.
The Board also considered that Hartford Funds Distributors, LLC (“HFD”), an affiliate of HFMC, serves as principal underwriter of the Fund. As principal underwriter, HFD receives 12b-1 fees from the Fund. The Board also noted that certain affiliates of HFD distribute shares of the Fund and receive compensation in that connection.
The Board considered benefits to the Sub-adviser from its use of the Fund’s brokerage commissions to obtain soft dollar research, and representations from HFMC and the Sub-adviser that the Sub-adviser would not make any revenue-sharing payments or any other type of distribution payments to HFMC or its affiliates.
The Board considered the benefits to shareholders of being part of the Hartford Funds family of funds. The Board considered HFMC’s efforts to provide investors in the family with a broad range of investment styles and asset classes.
* * * *
Based upon its review of these various factors, among others, the Board concluded that it is in the best interests of the Fund and its shareholders for the Board to approve the Agreements for an additional year. In reaching this decision, the Board did not assign relative weights to the factors discussed above or deem any one or group of them to be controlling in and of themselves. In connection with their deliberations, the Independent Directors met separately in executive session on several occasions, with independent legal counsel and the Consultant, to review the relevant materials and consider their responsibilities under relevant laws and regulations.
| 39 |
| Hartford Global Research HLS Fund |
| Main Risks (Unaudited) |
The main risks of investing in the Fund are described below.
Market, Selection, and Strategy Risk: The Fund’s share price may fluctuate due to market risk and/or security selections that may underperform the market or relevant benchmarks. If the sub-adviser’s investment strategy does not perform as expected, the Fund could underperform its peers or lose money. There is no guarantee the Fund will achieve its stated objective.
Foreign Investment and Emerging Markets Risk: Foreign investments can be riskier than U.S. investments. Potential risks include currency risk that may result from unfavorable exchange rates, liquidity risk if decreased demand for a security makes it difficult to sell at the desired price, and risks that stem from substantially lower trading volume on foreign markets. These risks are generally greater for investments in emerging markets, which are also subject to greater price volatility, and custodial and regulatory risks.
Small/Mid-cap Stock Risk: Small- and mid-cap stocks are generally more volatile and risky and may be less liquid than large-cap stocks because they may have limited operating histories, narrow product lines, and focus on niche markets.
Active Trading Risk: Actively trading investments may result in higher costs (thus affecting performance).
| 40 |
THIS PRIVACY POLICY IS NOT PART OF THIS REPORT
Privacy Policy and Practices of The Hartford Financial Services Group, Inc. and its Affiliates
(herein called “we, our, and us”)
This Privacy Policy applies to our United States Operations
We value your trust. We are committed to the responsible: a) management; b) use; and c) protection; of Personal Information. This notice describes how we collect, disclose, and protect Personal Information.
We collect Personal Information to: a) service your Transactions with us; and b) support our business functions.
We may obtain Personal Information from: a) You; b) your Transactions with us; and c) third parties such as a consumer-reporting agency.
Based on the type of product or service You apply for or get from us, Personal Information such as: a) your name; b) your address; c) your income; d) your payment; or e) your credit history; may be gathered from sources such as applications, Transactions, and consumer reports.
To serve You and service our business, we may share certain Personal Information. We will share Personal Information, only as allowed by law, with affiliates such as: a) our insurance companies; b) our employee agents; c) our brokerage firms; and d) our administrators.
As allowed by law, we may share Personal Financial Information with our affiliates to: a) market our products; or b) market our services; to You without providing You with an option to prevent these disclosures. | We may also share Personal Information, only as allowed by law, with unaffiliated third parties including:
When allowed by law, we may share certain Personal Financial Information with other unaffiliated third parties who assist us by performing services or functions such as:
We, and third parties we partner with, may track some of the pages You visit through the use of: a) cookies; b) pixel tagging; or c) other technologies; and currently do not process or comply with any web browser’s “do not track” signal or similar mechanism that indicates a request to disable online tracking of individual users who visit our websites or use our services.
We will not sell or share your Personal Financial Information with anyone for purposes unrelated to our business functions without offering You the opportunity to:
We only disclose Personal Health Information with:
Our employees have access to Personal Information in the course of doing their jobs, such as: |
We use manual and electronic security procedures to maintain: a) the confidentiality; and b) the integrity of; Personal Information that we have. We use these procedures to guard against unauthorized access.
Some techniques we use to protect Personal Information include: a) secured files; b) user authentication; c) encryption; d) firewall technology; and e) the use of detection software.
We are responsible for and must: a) identify information to be protected; b) provide an adequate level of protection for that data; c) grant access to protected data only to those people who must use it in the performance of their job-related duties. Employees who violate our Privacy Policy will be subject to discipline, which may include ending their employment with us.
At the start of our business relationship, we will give You a copy of our current Privacy Policy.
We will also give You a copy of our current Privacy Policy once a year if You maintain a continuing business relationship with us.
We will continue to follow our Privacy Policy regarding Personal Information even when a business relationship no longer exists between us. | As used in this Privacy Notice:
Application means your request for our product or service.
Personal Financial Information means financial information such as:
Personal Health Information means health information such as:
Personal Information means information that identifies You personally and is not otherwise available to the public. It includes:
Transaction means your business dealings with us, such as:
You means an individual who has given us Personal Information in conjunction with: |
This Privacy Policy is being provided on behalf of the following affiliates of The Hartford Financial Services Group, Inc.:
1stAGChoice, Inc.; Access CoverageCorp, Inc.; Access CoverageCorp Technologies, Inc.; American Maturity Life Insurance Company; Archway 60 R, LLC; Business Management Group, Inc.; Catalyst360, LLC; Champlain Life Reinsurance Company; DMS R, LLC; Eloy R, LLC; Ersatz Corporation; First State Insurance Company; Hartford Accident and Indemnity Company; Hartford Administrative Services Company; Hartford Casualty General Agency, Inc.; Hartford Casualty Insurance Company; Hartford-Comprehensive Employee Benefit Service Company; Hartford Equity Sales Company, Inc.; Hartford Fire General Agency, Inc.; Hartford Fire Insurance Company; Hartford Funds Management Company, LLC; Hartford Funds Management Group, Inc.; Hartford HLS Series Fund II, Inc.; Hartford Insurance Company of Illinois; Hartford Insurance Company of the Midwest; Hartford Insurance Company of the Southeast; Hartford Integrated Technologies, Inc.; Hartford International Life Reassurance Corporation; Hartford Funds Distributors, LLC; Hartford Investment Management Company; Hartford Life and Accident Insurance Company; Hartford Life and Annuity Insurance Company; Hartford Life Insurance Company; Hartford Life Private Placement, LLC; Hartford Lloyd’s Corporation; Hartford Lloyd’s Insurance Company; Hartford Mezzanine Investors I, LLC; Hartford Residual Market, L.C.C.; Hartford Retirement Services, LLC; Hartford Securities Distribution Company, Inc.; Hartford Series Fund, Inc.; Hartford Specialty Insurance Services of Texas, LLC; Hartford Strategic Investments, LLC; Hartford Underwriters Insurance Company; Hartford Technology Services Company, L.L.C.; Hartford of Texas General Agency, Inc.; Hartford Underwriters General Agency, Inc.; HARTRE Company, L.C.C.; HL Investment Advisors, LLC; HLA LLC; Horizon Management Group, LLC; HRA Brokerage Services, Inc.; Lanidex Class B, LLC; M-CAP Insurance Agency, LLC; New England Insurance Company; New England Reinsurance Corporation; Nutmeg Insurance Agency, Inc.; Nutmeg Insurance Company; Pacific Insurance Company, Limited; Planco, LLC: Property and Casualty Insurance Company of Hartford; Revere R, LLC; RVR R, LLC; Sentinel Insurance Company, Ltd.; Sunstone R, LLC; Symphony R, LLC; The Evergreen Group Incorporated; The Hartford Alternative Strategies Fund; The Hartford Mutual Funds, Inc.; The Hartford Mutual Funds II, Inc.; Trumbull Flood Management, L.L.C.; Trumbull Insurance Company; Twin City Fire Insurance Company; White River Life Reinsurance Company.
HPP Revised December 2013
HARTFORD HLS FUNDS
c/o The Hartford Wealth Management - Global Annuities
P.O. Box 14293
Lexington, KY 40512-4293
HARTFORDFUNDS
hartfordfunds.com
Hartford Series Fund, Inc. is underwritten and distributed by Hartford Funds Distributors, LLC.
Hartford Series Fund, Inc. inception dates range from 1977 to date. Hartford Series Fund, Inc. is not a subsidiary of The Hartford Financial Services Group, Inc. ("The Hartford") but is underwritten, distributed by and advised by subsidiaries of The Hartford. Investments in Hartford Series Fund, Inc. are not guaranteed by The Hartford or any other entity.
This report is submitted for the general information of the shareholders of the Funds. It is not authorized for distribution unless preceded or accompanied by a current prospectus for the Funds.
Investors should carefully consider the investment objectives, risks, charges, and expenses of Hartford Funds before investing. This and other information can be found in the prospectus and summary prospectus, which can be obtained by calling 888-843-7824 (retail) or 877-836-5854 (institutional). Investors should read them carefully before they invest.
HLSAR-GR13 2-14 113540-2 Printed in U.S.A ©2013 The Hartford, Hartford, CT 06115
HARTFORDFUNDS
| HARTFORD GROWTH HLS FUND
2013 Annual Report
|
A MESSAGE FROM THE PRESIDENT
Dear Fellow Shareholders:
Thank you for investing in Hartford HLS Funds.
Market Review
U.S. equities (as represented by the S&P 500 Index) generated their strongest year since 1997 in 2013, rising 32.39% for the year. During the fourth quarter, equities rose without looking back, pushing the S&P 500 Index and the Dow Jones Industrial Average to new all-time highs. Despite previously cheering delays to quantitative-easing tapering, the stock market received an additional boost at the end of the year following the U.S. Federal Reserve’s (Fed) announcement of a $10-billion-a-month reduction in bond purchases beginning in January.
The Fed’s decision to begin tapering its bond purchases is generally considered a vote of confidence in the recovering U.S. economy. Consumer spending has stabilized, the housing market is showing steady improvement, the unemployment rate is slowly declining and economic growth clocked in at a healthy 4.1% in the third quarter. Equities have also recovered since the market low in March 2009: The S&P 500 Index has gained 173% from the market low through December 31, 2013.
Signs of improvement are also visible outside the U.S. Europe appears to have begun its own economic recovery, and emerging markets have reversed their recent lackluster performance. Fiscal policy continues to wield significant influence in today’s economy and central banks across the globe are maintaining their accommodative stances, including the appointment of Janet Yellen, who is widely expected to continue current monetary policies, to succeed Ben Bernanke as U.S. Federal Reserve chairman.
It’s important to stay abreast of domestic and international economic developments while balancing your individual investment goals. Meeting with your financial advisor on a regular basis to examine your current investment strategy can help you determine whether you are on the right track:
| • | Is your portfolio fully diversified with an appropriate mix of stocks and bonds? |
| • | Is your portfolio incorporating both domestic and international holdings to take advantage of the global economic recovery? |
| • | Are your investments still in line with your risk tolerance and investment time horizon? |
Your financial advisor can help you choose options within our fund family to navigate today’s markets with confidence.
Thank you again for investing with Hartford HLS Funds.
James Davey
President
Hartford HLS Funds
1The S&P 500 Index is a market capitalization-weighted price index composed of 500 widely held common stocks.
2The Dow Jones Industrial Average is an unmanaged, price-weighted index of 30 of the largest, most widely held stocks traded on the New York Stock Exchange.
Table of Contents
This report is prepared for the general information of contract owners and qualified retirement plan participants. It is not an offer of contracts or of qualified retirement plans. It should not be used in connection with any offer, except in conjunction with the appropriate product prospectus which contains all pertinent information including the applicable sales, administrative and other charges.
The views expressed in the Fund’s Manager Discussion under ‘‘Why did the Fund perform this way?’’ and ‘‘What is the outlook?’’ are views of the Fund’s sub-adviser and portfolio management team through the end of the period and are subject to change based on market and other conditions. The Fund’s Manager Discussion is for informational purposes only and does not represent an offer, recommendation or solicitation to buy, hold or sell any security. The specific securities identified and described, if any, do not represent all of the securities purchased or sold and you should not assume that investments in the securities identified and discussed will be profitable.
Hartford Growth HLS Fund inception 04/30/2002
(sub-advised by Wellington Management Company, LLP)
| Investment objective – Seeks long-term capital appreciation. |
Performance Overview 12/31/03 - 12/31/13
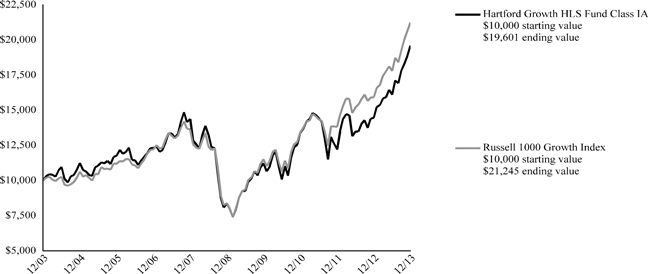
The chart above represents the hypothetical growth of a $10,000 investment in Class IA. Growth results in classes other than Class IA will vary from what is seen above due to differences in the expenses charged to those share classes.
Average Annual Total Returns (as of 12/31/13)
| 1 Year | 5 Years | 10 Years | ||||
| Growth IA | 35.48% | 18.54% | 6.96% | |||
| Growth IB | 35.14% | 18.24% | 6.70% | |||
| Russell 1000 Growth Index | 33.48% | 20.39% | 7.83% |
PERFORMANCE DATA QUOTED REPRESENTS PAST PERFORMANCE AND DOES NOT GUARANTEE FUTURE RESULTS. The investment return and principal value of the investment will fluctuate so that investors’ shares, when redeemed, may be worth more or less than their original cost. Current performance may be lower or higher than the performance data quoted. To obtain performance data current to the most recent month-end, please visit our website at www.hartfordfunds.com.
Total returns presented above were calculated using the Fund’s net asset value available to shareholders for sale or redemption of Fund shares on December 31, 2013, which may exclude investment transactions as of this date. All share class returns assume the reinvestment of all distributions at net asset value and the deduction of all fund expenses.
Russell 1000 Growth Index is an unmanaged index which measures the performance of those Russell 1000 Index companies with higher price-to-book ratios and higher forecasted growth values. (The Russell 1000 Index is an unmanaged index that measures the performance of the 1,000 largest companies in the Russell 3000 Index, which measures the performance of the 3,000 largest U.S. companies based on total market capitalization.)
You cannot invest directly in an index.
As of the Fund's current prospectus dated May 1, 2013, the total annual operating expense ratios for Class IA and Class IB were 0.83% and 1.08%, respectively. Actual expenses may be higher. Please see the accompanying Financial Highlights for expense ratios for the year ended December 31, 2013.
The chart and table do not reflect the deductions of taxes, sales charges or other fees which may be applied at the variable life insurance, variable annuity or qualified retirement plan product level. Any such additional sales charges or other fees or expenses would lower the contract’s or plan’s performance.
All investments are subject to risk including the possible loss of principal. For a discussion of the Fund’s risks, please see the Main Risks section of this report. For more detailed information on the risks associated with an investment in the Fund, please see the prospectus.
| 2 |
| Hartford Growth HLS Fund |
| Manager Discussion |
| December 31, 2013 (Unaudited) |
| Portfolio Manager | ||
| Andrew J. Shilling, CFA | ||
| Senior Vice President and Equity Portfolio Manager | ||
How did the Fund perform?
The Class IA shares of the Hartford Growth HLS Fund returned 35.48% for the twelve-month period ended December 31, 2013, outperforming the Fund’s benchmark, the Russell 1000 Growth Index, which returned 33.48% for the same period. The Fund also outperformed the 35.03% average return of the Variable Products-Underlying Funds Lipper Multi-Cap Growth Funds peer group, a group of funds with investment strategies similar to those of the Fund.
Why did the Fund perform this way?
U.S. equities reached another all-time high in December and finished 2013 with a gain of 32.4%, as measured by the S&P 500 Index, the Index’s best return since 1997. The rally in U.S. equities began on the first trading day of the year after a last-minute compromise by the U.S. Congress averted the fiscal cliff. Optimism surrounding the fiscal reprieve was furthered during the first quarter by better-than-expected corporate earnings, a robust housing market, and a steadily improving employment picture. Solid gains in April and the first part of May paused following comments by U.S. Federal Reserve (Fed) Chairman Ben Bernanke that suggested the Fed might begin to slow quantitative easing sooner than investors anticipated. Nonetheless, equities resumed their ascent in the third quarter as the surprising “no taper” decision by the Federal Open Market Committee eased near-term concerns about rapidly rising interest rates derailing the recovery. Additionally, accommodative rhetoric from the European Central Bank, along with encouraging data in China and further evidence of a European economic recovery, contributed to a broad-based global equity rally that extended through the end of the year. In December, the year ended with an optimistic tone as investors cheered the elimination of two market overhangs: the timing of Fed tapering and the threat of another US government shutdown in early 2014.
All ten sectors of the Russell 1000 Growth Index posted positive returns for the period. Health Care (+48.2%), Consumer Discretionary (+44.5%), and Industrials (+41.2 %) sectors performed the best, while Telecommunication Services (17.4%), Consumer Staples (24.0%), and Information Technology (26.2%) lagged on a relative basis. Growth stocks (+33.5%) outperformed value stocks (+32.5%), as measured by the Russell 1000 Growth and Russell 1000 Value Indices.
The Fund’s relative performance benefited from strong security selection in Information Technology, Consumer Staples, and Financials. This performance was partially offset by weaker security selection in Consumer Discretionary, Energy, and Health Care, which detracted from relative returns. Sector allocation, which is a residual of bottom-up stock selection, contributed positively to relative performance. Positive effects from an overweight to consumer Discretionary as well as underweights to Consumer Staples and Telecommunication Services were enough to offset the negative effects of the Fund’s overweight exposure to Information Technology and underweight exposure to Industrials. A modest cash position also detracted from performance in an upward-trending market.
Green Mountain Coffee Roasters (Consumer Staples), Gilead Sciences (Health Care), and Splunk (Information Technology) were the top contributors to relative performance during the period. Shares of Green Mountain Coffee Roasters, the leading provider of single-cup brewers and portion packs, outperformed during the period after the firm posted solid earnings and raised 2013 earnings guidance during the third quarter. Investors also took solace from Starbucks’ tepid sales results for its single serve Verismo machines. Shares of Gilead Sciences, a U.S.-based biopharmaceutical company, moved steadily higher alongside positive news flow, including passing the first hurdle for the firm’s hepatitis C single tablet regimen and growing sales of the firm’s antiviral drug franchise. Splunk, a provider of a software platform for collecting and analyzing data, saw its shares jump after the company posted strong quarterly results with license revenue, total revenue, margins, and operating cash flow all beating consensus estimates. Top absolute contributors for the period also included Google (Information Technology).
Top detractors from relative performance during the period were Edwards Lifesciences (Health Care), Cobalt (Energy), and Altera (Information Technology). Shares of Edwards Lifesciences, a medical device company specializing in heart valve technology and treatments for cardiovascular diseases, declined after the company reported disappointing first quarter results due to poor transcatheter heart value (THV) sales; we eliminated the position to pursue more attractive opportunities, as our research led us to believe the ultimate end market size was smaller than initially expected. U.S. oil and gas exploration company Cobalt saw its shares fall as a result of disappointing well test results at the company’s Lontra well off the coast of Angola. Altera Corporation, a global semiconductor company, posted better-than-expected quarterly earnings but slightly missed revenue expectations. Additionally, fourth quarter sales guidance was well below
| 3 |
| Hartford Growth HLS Fund |
| Manager Discussion – (continued) |
| December 31, 2013 (Unaudited) |
consensus estimates. Stocks that detracted most from absolute returns also included Apple (Information Technology).
Derivatives are not used in a significant manner in this Fund and did not have a material impact on performance during the period.
What is the outlook?
We believe the U.S. economy is poised for continued moderate growth, which is in line with consensus expectations at this point. In our view, real gross domestic product (GDP) and Institute of Supply Management (ISM) manufacturing data both point to a fairly healthy outlook, housing remains constructive, and the employment picture is grudgingly improving. The fiscal drag from last year should abate on a year-over-year basis and we believe the Fed is likely to remain accommodative with a zero interest rate policy through 2014 and only modest tapering of bond buying throughout the year. We believe that disruption related to the Affordable Care Act (Obama Care), rising interest rates, and only average valuation support, given the strong equity market this past year, are the biggest domestic risks.
From a global perspective, there are still some outstanding issues that we will be keeping a close eye on this year. For instance, is China’s reform-oriented growth self-sustainable, particularly in the context of their overall debt situation? Will Japanese Prime Minister Shinzo Abe’s economic policy rekindle Japan’s growth? Is Europe truly past the sovereign debt issues and entering a period of sustainable growth? With global central banks still very accommodative, we believe the overall global environment will be reasonable in 2014.
Our investment discipline is focused on finding proven companies with attractive valuations, solid fundamentals, and sustainable growth business models. At the end of the period, the Fund’s largest overweight was to Consumer Discretionary, while the Fund remained underweight to Consumer Staples and Energy, relative to the benchmark.
| Diversification by Sector | ||||
| as of December 31, 2013 | ||||
| Sector | Percentage of Net Assets | |||
| Equity Securities | ||||
| Consumer Discretionary | 34.0 | % | ||
| Consumer Staples | 8.6 | |||
| Energy | 1.3 | |||
| Financials | 4.1 | |||
| Health Care | 11.1 | |||
| Industrials | 11.6 | |||
| Information Technology | 25.9 | |||
| Materials | 3.0 | |||
| Total | 99.6 | % | ||
| Short-Term Investments | 0.3 | |||
| Other Assets and Liabilities | 0.1 | |||
| Total | 100.0 | % | ||
A sector may be comprised of several industries. For Fund compliance purposes, the Fund may not use the same classification system and these sector classifications are used for reporting ease.
| 4 |
| Hartford Growth HLS Fund |
| Schedule of Investments |
| December 31, 2013 |
| (000’s Omitted) |
| Shares or Principal Amount | Market Value ╪ | |||||||
| COMMON STOCKS - 99.6% | ||||||||
| Automobiles and Components - 1.6% | ||||||||
| 57 | Harley-Davidson, Inc. | $ | 3,913 | |||||
| Capital Goods - 4.7% | ||||||||
| 62 | AMETEK, Inc. | 3,245 | ||||||
| 37 | Eaton Corp. plc | 2,839 | ||||||
| 7 | Precision Castparts Corp. | 1,970 | ||||||
| 170 | Safran S.A. ADR | 2,937 | ||||||
| 2 | W.W. Grainger, Inc. | 540 | ||||||
| 11,531 | ||||||||
| Commercial and Professional Services - 3.7% | ||||||||
| 43 | Equifax, Inc. | 2,988 | ||||||
| 25 | IHS, Inc. ● | 2,941 | ||||||
| 70 | Nielsen Holdings N.V. | 3,211 | ||||||
| 9,140 | ||||||||
| Consumer Durables and Apparel - 7.3% | ||||||||
| 187 | D.R. Horton, Inc. ● | 4,166 | ||||||
| 105 | Lennar Corp. | 4,156 | ||||||
| 51 | Lululemon Athletica, Inc. ● | 2,984 | ||||||
| 26 | Michael Kors Holdings Ltd. ● | 2,117 | ||||||
| 18 | PVH Corp. | 2,391 | ||||||
| 12 | Ralph Lauren Corp. | 2,124 | ||||||
| 17,938 | ||||||||
| Consumer Services - 7.4% | ||||||||
| 3 | Chipotle Mexican Grill, Inc. ● | 1,758 | ||||||
| 71 | Dunkin' Brands Group, Inc. | 3,428 | ||||||
| 6 | Panera Bread Co. Class A ● | 1,078 | ||||||
| 44 | Starwood Hotels & Resorts, Inc. | 3,526 | ||||||
| 34 | Wyndham Worldwide Corp. | 2,471 | ||||||
| 17 | Wynn Resorts Ltd. | 3,393 | ||||||
| 32 | Yum! Brands, Inc. | 2,440 | ||||||
| 18,094 | ||||||||
| Diversified Financials - 3.3% | ||||||||
| 31 | American Express Co. | 2,776 | ||||||
| 9 | BlackRock, Inc. | 2,992 | ||||||
| 11 | IntercontinentalExchange Group, Inc. | 2,496 | ||||||
| 8,264 | ||||||||
| Energy - 1.3% | ||||||||
| 23 | Anadarko Petroleum Corp. | 1,861 | ||||||
| 81 | Cobalt International Energy, Inc. ● | 1,326 | ||||||
| 3,187 | ||||||||
| Food and Staples Retailing - 1.4% | ||||||||
| 49 | CVS Caremark Corp. | 3,472 | ||||||
| Food, Beverage and Tobacco - 7.2% | ||||||||
| 29 | Anheuser-Busch InBev N.V. ADR | 3,098 | ||||||
| 17 | Diageo plc ADR | 2,223 | ||||||
| 62 | Green Mountain Coffee Roasters, Inc. ● | 4,656 | ||||||
| 17 | Mead Johnson Nutrition Co. | 1,401 | ||||||
| 93 | Mondelez International, Inc. | 3,270 | ||||||
| 44 | Monster Beverage Corp. ● | 2,975 | ||||||
| 17,623 | ||||||||
| Health Care Equipment and Services - 1.9% | ||||||||
| 38 | Covidien plc | 2,598 | ||||||
| 6 | Intuitive Surgical, Inc. ● | 2,197 | ||||||
| 4,795 | ||||||||
| Materials - 3.0% | ||||||||
| 40 | Monsanto Co. | 4,669 | ||||||
| 14 | Sherwin-Williams Co. | 2,634 | ||||||
| 7,303 | ||||||||
| Media - 7.0% | ||||||||
| 66 | Comcast Corp. Class A | 3,446 | ||||||
| 690 | Sirius XM Holdings, Inc. ● | 2,409 | ||||||
| 47 | Time Warner, Inc. | 3,267 | ||||||
| 109 | Twenty-First Century Fox, Inc. | 3,838 | ||||||
| 54 | Walt Disney Co. | 4,162 | ||||||
| 17,122 | ||||||||
| Pharmaceuticals, Biotechnology and Life Sciences - 9.2% | ||||||||
| 27 | Allergan, Inc. | 2,973 | ||||||
| 15 | Biogen Idec, Inc. ● | 4,239 | ||||||
| 80 | Bristol-Myers Squibb Co. | 4,258 | ||||||
| 96 | Gilead Sciences, Inc. ● | 7,229 | ||||||
| 9 | Regeneron Pharmaceuticals, Inc. ● | 2,538 | ||||||
| 17 | Vertex Pharmaceuticals, Inc. ● | 1,280 | ||||||
| 22,517 | ||||||||
| Real Estate - 0.8% | ||||||||
| 24 | American Tower Corp. REIT | 1,907 | ||||||
| Retailing - 10.7% | ||||||||
| 2 | Amazon.com, Inc. ● | 728 | ||||||
| 9 | AutoZone, Inc. ● | 4,175 | ||||||
| 39 | Dollar General Corp. ● | 2,326 | ||||||
| 59 | Home Depot, Inc. | 4,883 | ||||||
| 99 | Lowe's Cos., Inc. | 4,901 | ||||||
| 4 | Priceline.com, Inc. ● | 4,498 | ||||||
| 39 | Ross Stores, Inc. | 2,947 | ||||||
| 24 | Tory Burch, LLC ● ⌂† | 1,875 | ||||||
| 26,333 | ||||||||
| Software and Services - 23.3% | ||||||||
| 15 | Alliance Data Systems Corp. ● | 3,944 | ||||||
| 19 | Citrix Systems, Inc. ● | 1,183 | ||||||
| 49 | Cognizant Technology Solutions Corp. ● | 4,927 | ||||||
| 28 | eBay, Inc. ● | 1,545 | ||||||
| 87 | Facebook, Inc. ● | 4,777 | ||||||
| 9 | Google, Inc. ● | 9,649 | ||||||
| 34 | Intuit, Inc. | 2,632 | ||||||
| 13 | LinkedIn Corp. Class A ● | 2,878 | ||||||
| 6 | Mastercard, Inc. | 4,641 | ||||||
| 185 | Microsoft Corp. | 6,914 | ||||||
| 76 | Oracle Corp. | 2,894 | ||||||
| 66 | Salesforce.com, Inc. ● | 3,658 | ||||||
| 33 | ServiceNow, Inc. ● | 1,854 | ||||||
| 32 | Splunk, Inc. ● | 2,181 | ||||||
| 17 | Visa, Inc. | 3,674 | ||||||
| 57,351 | ||||||||
| Technology Hardware and Equipment - 2.6% | ||||||||
| 7 | Apple, Inc. | 3,903 | ||||||
| 114 | Juniper Networks, Inc. ● | 2,565 | ||||||
| 6,468 | ||||||||
| Transportation - 3.2% | ||||||||
| 105 | Hertz Global Holdings, Inc. ● | 2,991 | ||||||
| 31 | J.B. Hunt Transport Services, Inc. | 2,359 | ||||||
The accompanying notes are an integral part of these financial statements.
| 5 |
| Hartford Growth HLS Fund |
| Schedule of Investments – (continued) |
| December 31, 2013 |
| (000’s Omitted) |
| Shares or Principal Amount | Market Value ╪ | |||||||||||
| COMMON STOCKS - 99.6% - (continued) | ||||||||||||
| Transportation - 3.2% - (continued) | ||||||||||||
| 20 | Kansas City Southern | $ | 2,481 | |||||||||
| 7,831 | ||||||||||||
| Total common stocks | ||||||||||||
| (cost $177,758) | $ | 244,789 | ||||||||||
| Total long-term investments (cost $177,758) | $ | 244,789 | ||||||||||
| SHORT-TERM INVESTMENTS - 0.3% | ||||||||||||
| Repurchase Agreements - 0.3% | ||||||||||||
| Bank of America Merrill Lynch TriParty Repurchase Agreement (maturing on 01/02/2014 in the amount of $33, collateralized by GNMA 4.00%, 2043, value of $34) | ||||||||||||
| $ | 33 | 0.005%, 12/31/2013 | $ | 33 | ||||||||
| Bank of Montreal TriParty Repurchase Agreement (maturing on 01/02/2014 in the amount of $32, collateralized by FNMA 1.58% - 4.50%, 2020 - 2043, U.S. Treasury Note 0.25% - 4.00%, 2015 - 2020, value of $32) | ||||||||||||
| 32 | 0.01%, 12/31/2013 | 32 | ||||||||||
| Bank of Montreal TriParty Repurchase Agreement (maturing on 01/02/2014 in the amount of $112, collateralized by FHLMC 3.00% - 5.00%, 2019 - 2043, FNMA 0.76% - 6.00%, 2016 - 2043, GNMA 1.50% - 5.25%, 2028 - 2043, value of $114) | ||||||||||||
| 112 | 0.02%, 12/31/2013 | 112 | ||||||||||
| Barclays Capital TriParty Repurchase Agreement (maturing on 01/02/2014 in the amount of $101, collateralized by U.S. Treasury Note 0.50% - 2.25%, 2017, value of $103) | ||||||||||||
| 101 | 0.01%, 12/31/2013 | 101 | ||||||||||
| Citigroup Global Markets, Inc. TriParty Repurchase Agreement (maturing on 01/02/2014 in the amount of $182, collateralized by U.S. Treasury Bond 3.88% - 8.13%, 2021 - 2040, U.S. Treasury Note 0.25% - 3.38%, 2014 - 2020, value of $186) | ||||||||||||
| 182 | 0.01%, 12/31/2013 | 182 | ||||||||||
| RBS Securities, Inc. TriParty Repurchase Agreement (maturing on 01/02/2014 in the amount of $59, collateralized by U.S. Treasury Note 0.25% - 1.00%, 2015 - 2017, value of $60) | ||||||||||||
| 59 | 0.01%, 12/31/2013 | 59 | ||||||||||
| TD Securities TriParty Repurchase Agreement (maturing on 01/02/2014 in the amount of $142, collateralized by FFCB 0.20% - 0.50%, 2015 - 2016, FHLMC 0.38% - 5.25%, 2014 - 2042, FNMA 0.50% - 7.13%, 2014 - 2043, value of $145) | ||||||||||||
| 142 | 0.01%, 12/31/2013 | 142 | ||||||||||
| UBS Securities, Inc. Repurchase Agreement (maturing on 01/02/2014 in the amount of $1, collateralized by U.S. Treasury Note 2.13%, 2015, value of $1) | ||||||||||||
| 1 | 0.01%, 12/31/2013 | 1 | ||||||||||
| 662 | ||||||||||||
| Total short-term investments | ||||||||||||
| (cost $662) | $ | 662 | ||||||||||
| Total investments | ||||||||||||
| (cost $178,420) ▲ | 99.9% | $ | 245,451 | |||||||||
| Other assets and liabilities | 0.1% | 184 | ||||||||||
| Total net assets | 100.0% | $ | 245,635 | |||||||||
The accompanying notes are an integral part of these financial statements.
| 6 |
| Note: | Percentage of investments as shown is the ratio of the total market value to total net assets. |
| ▲ | At December 31, 2013, the cost of securities for federal income tax purposes was $178,797 and the aggregate gross unrealized appreciation and depreciation based on that cost were: |
| Unrealized Appreciation | $ | 69,768 | ||
| Unrealized Depreciation | (3,114 | ) | ||
| Net Unrealized Appreciation | $ | 66,654 |
| † | These securities were valued in good faith at fair value as determined under policies and procedures established by and under the supervision of the Company's Board of Directors. At December 31, 2013, the aggregate value of these securities was $1,875, which represents 0.8% of total net assets. |
| ● | Non-income producing. |
| ⌂ | The following securities are considered illiquid. Illiquid securities are often purchased in private placement transactions, are often not registered under the Securities Act of 1933 and may have contractual restrictions on resale. A security may also be considered illiquid if the security lacks a readily available market or if its valuation has not changed for a certain period of time. |
| Period Acquired | Shares/ Par | Security | Cost Basis | |||||||
| 11/2013 | 24 | Tory Burch LLC | $ | 1,901 | ||||||
At December 31, 2013, the aggregate value of these securities was $1,875, which represents 0.8% of total net assets.
| ╪ | See Significant Accounting Policies of accompanying Notes to Financial Statements regarding valuation of securities. |
| GLOSSARY: (abbreviations used in preceding Schedule of Investments) | |
| Other Abbreviations: | |
| ADR | American Depositary Receipt |
| FFCB | Federal Farm Credit Bank |
| FHLMC | Federal Home Loan Mortgage Corp. |
| FNMA | Federal National Mortgage Association |
| GNMA | Government National Mortgage Association |
| REIT | Real Estate Investment Trust |
The accompanying notes are an integral part of these financial statements.
| 7 |
| Hartford Growth HLS Fund |
| Investment Valuation Hierarchy Level Summary |
| December 31, 2013 |
| (000’s Omitted) |
| Total | Level 1 ♦ | Level 2 ♦ | Level 3 | |||||||||||||
| Assets: | ||||||||||||||||
| Common Stocks ‡ | $ | 244,789 | $ | 242,914 | $ | – | $ | 1,875 | ||||||||
| Short-Term Investments | 662 | – | 662 | – | ||||||||||||
| Total | $ | 245,451 | $ | 242,914 | $ | 662 | $ | 1,875 | ||||||||
| ♦ | For the year ended December 31, 2013, there were no transfers between Level 1 and Level 2. |
| ‡ | The Fund has all or primarily all of the equity securities categorized in a particular level. Refer to the Schedule of Investments for further industry breakout. |
Following is a reconciliation of Level 3 assets for which significant unobservable inputs were used to determine fair value:
| Balance as of December 31, 2012 | Realized Gain (Loss) | Change in Unrealized Appreciation (Depreciation) | Net Amortization | Purchases | Sales | Transfers Into Level 3 | Transfers Out of Level 3 | Balance as of December 31, 2013 | ||||||||||||||||||||||||||||
| Assets: | ||||||||||||||||||||||||||||||||||||
| Common Stocks | $ | — | $ | — | $ | (27 | )* | $ | — | $ | 1,902 | $ | — | $ | — | $ | — | $ | 1,875 | |||||||||||||||||
| Total | $ | — | $ | — | $ | (27 | ) | $ | — | $ | 1,902 | $ | — | $ | — | $ | — | $ | 1,875 | |||||||||||||||||
| * | Change in unrealized appreciation (depreciation) in the current period relating to assets still held at December 31, 2013 was $(27). |
| Note: | For purposes of reporting transfers between different hierarchy levels, both transfers in and out of each level, as applicable, are shown as if they occurred at the beginning of the period. |
The accompanying notes are an integral part of these financial statements.
| 8 |
| Hartford Growth HLS Fund |
| Statement of Assets and Liabilities |
| December 31, 2013 |
| (000’s Omitted) |
| Assets: | ||||
| Investments in securities, at market value (cost $178,420) | $ | 245,451 | ||
| Cash | 1 | |||
| Receivables: | ||||
| Investment securities sold | 2,691 | |||
| Fund shares sold | 1 | |||
| Dividends and interest | 119 | |||
| Total assets | 248,263 | |||
| Liabilities: | ||||
| Payables: | ||||
| Investment securities purchased | 2,335 | |||
| Fund shares redeemed | 214 | |||
| Investment management fees | 43 | |||
| Distribution fees | 4 | |||
| Accrued expenses | 32 | |||
| Total liabilities | 2,628 | |||
| Net assets | $ | 245,635 | ||
| Summary of Net Assets: | ||||
| Capital stock and paid-in-capital | $ | 131,151 | ||
| Undistributed net investment income | 44 | |||
| Accumulated net realized gain | 47,409 | |||
| Unrealized appreciation of investments | 67,031 | |||
| Net assets | $ | 245,635 | ||
| Shares authorized | 800,000 | |||
| Par value | $ | 0.001 | ||
| Class IA: Net asset value per share | $ | 17.51 | ||
| Shares outstanding | 10,001 | |||
| Net assets | $ | 175,124 | ||
| Class IB: Net asset value per share | $ | 17.12 | ||
| Shares outstanding | 4,118 | |||
| Net assets | $ | 70,511 |
The accompanying notes are an integral part of these financial statements.
| 9 |
| Hartford Growth HLS Fund |
| Statement of Operations |
| For the Year Ended December 31, 2013 |
| (000’s Omitted) |
| Investment Income: | ||||
| Dividends | $ | 2,743 | ||
| Interest | 1 | |||
| Less: Foreign tax withheld | (34 | ) | ||
| Total investment income, net | 2,710 | |||
| Expenses: | ||||
| Investment management fees | 2,299 | |||
| Transfer agent fees | 5 | |||
| Distribution fees - Class IB | 170 | |||
| Custodian fees | 3 | |||
| Accounting services fees | 29 | |||
| Board of Directors' fees | 9 | |||
| Audit fees | 13 | |||
| Other expenses | 86 | |||
| Total expenses (before fees paid indirectly) | 2,614 | |||
| Commission recapture | (1 | ) | ||
| Total fees paid indirectly | (1 | ) | ||
| Total expenses, net | 2,613 | |||
| Net Investment Income | 97 | |||
| Net Realized Gain on Investments: | ||||
| Net realized gain on investments | 59,442 | |||
| Net Realized Gain on Investments | 59,442 | |||
| Net Changes in Unrealized Appreciation of Investments: | ||||
| Net unrealized appreciation of investments | 28,241 | |||
| Net Changes in Unrealized Appreciation of Investments | 28,241 | |||
| Net Gain on Investments | 87,683 | |||
| Net Increase in Net Assets Resulting from Operations | $ | 87,780 |
The accompanying notes are an integral part of these financial statements.
| 10 |
| Hartford Growth HLS Fund |
| Statement of Changes in Net Assets |
| (000’s Omitted) |
| For the Year Ended December 31, 2013 | For the Year Ended December 31, 2012 | |||||||
| Operations: | ||||||||
| Net investment income | $ | 97 | $ | 132 | ||||
| Net realized gain on investments | 59,442 | 41,625 | ||||||
| Net unrealized appreciation of investments | 28,241 | 13,554 | ||||||
| Net Increase in Net Assets Resulting from Operations | 87,780 | 55,311 | ||||||
| Distributions to Shareholders: | ||||||||
| From net investment income | ||||||||
| Class IA | (155 | ) | — | |||||
| Total distributions | (155 | ) | — | |||||
| Capital Share Transactions: | ||||||||
| Class IA | ||||||||
| Sold | 24,548 | 35,467 | ||||||
| Issued on reinvestment of distributions | 155 | — | ||||||
| Redeemed | (149,760 | ) | (88,213 | ) | ||||
| Total capital share transactions | (125,057 | ) | (52,746 | ) | ||||
| Class IB | ||||||||
| Sold | 8,374 | 7,707 | ||||||
| Redeemed | (25,799 | ) | (29,736 | ) | ||||
| Total capital share transactions | (17,425 | ) | (22,029 | ) | ||||
| Net decrease from capital share transactions | (142,482 | ) | (74,775 | ) | ||||
| Net Decrease in Net Assets | (54,857 | ) | (19,464 | ) | ||||
| Net Assets: | ||||||||
| Beginning of period | 300,492 | 319,956 | ||||||
| End of period | $ | 245,635 | $ | 300,492 | ||||
| Undistributed (distribution in excess of) net investment income | $ | 44 | $ | 108 | ||||
| Shares: | ||||||||
| Class IA | ||||||||
| Sold | 1,677 | 2,848 | ||||||
| Issued on reinvestment of distributions | 10 | — | ||||||
| Redeemed | (9,709 | ) | (7,121 | ) | ||||
| Total share activity | (8,022 | ) | (4,273 | ) | ||||
| Class IB | ||||||||
| Sold | 573 | 629 | ||||||
| Redeemed | (1,776 | ) | (2,436 | ) | ||||
| Total share activity | (1,203 | ) | (1,807 | ) | ||||
The accompanying notes are an integral part of these financial statements.
| 11 |
| Hartford Growth HLS Fund |
| Notes to Financial Statements |
| December 31, 2013 |
| (000’s Omitted) |
| 1. | Organization: |
Hartford Growth HLS Fund (the “Fund”) serves as an underlying investment option for certain variable annuity and variable life insurance separate accounts of Hartford Life Insurance Company (“HLIC”) and its affiliates and certain qualified retirement plans. The Fund may also serve as an underlying investment option for certain variable annuity and variable life separate accounts of other insurance companies. Owners of variable annuity contracts and policyholders of variable life insurance contracts may choose the funds permitted in the variable insurance contract prospectus. In addition, participants in certain qualified retirement plans may choose the Fund if permitted by their plans.
Hartford Series Fund, Inc. (the “Company”) is an open-end registered management investment company comprised of thirty portfolios. Financial statements for the Fund, a series of the Company, are included in this report.
The Company is organized under the laws of the State of Maryland and is registered with the Securities and Exchange Commission (“SEC”) under the Investment Company Act of 1940, as amended (“1940 Act”). The Fund is a diversified open-end management investment company.
The Fund is divided into Class IA and Class IB shares. Each class is offered at the per share net asset value (“NAV”) without a sales charge and is subject to the same expenses, except that the Class IB shares are subject to distribution and service fees charged pursuant to a Distribution Plan adopted in accordance with Rule 12b-1 under the 1940 Act.
| 2. | Significant Accounting Policies: |
The following is a summary of significant accounting policies of the Fund in the preparation of its financial statements, which are in accordance with United States Generally Accepted Accounting Principles (“U.S. GAAP”). The preparation of financial statements in accordance with U.S. GAAP may require management to make estimates and assumptions that affect the reported amounts of assets and liabilities and disclosure of contingent assets and liabilities at the date of the financial statements and the reported amounts of increases and decreases in net assets from operations during the reporting period. Actual results could differ from those estimates.
| a) | Determination of Net Asset Value – The NAV of each class of the Fund’s shares is determined as of the close of regular trading (normally 4:00 p.m. Eastern Time) (the “NYSE Close”) on each day that the New York Stock Exchange (the “Exchange”) is open (“Valuation Date”). Information that becomes known to the Fund after the NAV has been calculated on a particular day will not generally be used to retroactively adjust the NAV determined earlier that day. |
| b) | Investment Valuation and Fair Value Measurements – For purposes of calculating the NAV, portfolio investments and other assets held by the Fund's portfolio for which market quotes are readily available are valued at market value. Market value is generally determined on the basis of last reported sales prices or official close price. If no sales are reported, market value is based on quotes obtained from a quotation reporting system, established market makers, or independent pricing services. If market prices are not readily available or are deemed unreliable, the Fund will use the fair value of the investment as determined in good faith under policies and procedures established by and under the supervision of the Company’s Board of Directors. Market quotes are considered not readily available where there is an absence of current or reliable market-based data (e.g., trade information or indicative market quotes), including where events occur after the close of the relevant market, but prior to the NYSE Close, that materially affect the values of the Fund’s portfolio investments or assets. In addition, market quotes are considered not readily available when, due to extraordinary circumstances, the exchanges or markets on which the investments trade do not open for trading for the entire day and no other market prices are available. In addition, prices of foreign equities that are principally traded on certain foreign markets may be adjusted daily pursuant to a fair value pricing service approved by the Board of Directors in order to reflect an adjustment for the factors occurring after the close of certain foreign markets but before the NYSE Close. Investments that are primarily traded on foreign markets may trade on days that are not business days of the Fund. The value of the foreign investments in which the Fund invests may change on days when a shareholder will not be able to purchase or redeem shares of the Fund. Fair value pricing is subjective in nature and the use of fair value pricing by the |
| 12 |
Fund may cause the NAV of its shares to differ significantly from the NAV that would have been calculated using market prices at the close of the exchange on which a portfolio investment is primarily traded. There can be no assurance that the Fund could obtain the fair market value assigned to an investment if the Fund were to sell the investment at approximately the time at which the Fund determines its NAV.
Financial instruments for which prices are not available from an independent pricing service may be valued using market quotations obtained from one or more dealers that make markets in the respective financial instrument in accordance with procedures established by the Company’s Board of Directors.
U.S. GAAP defines fair value as the price that the Fund would receive to sell an asset or pay to transfer a liability in an orderly transaction between market participants. The U.S. GAAP fair value measurement standards require disclosure of a fair value hierarchy for each major category of assets and liabilities. Various inputs are used in determining the fair value of the Fund’s investments. These inputs are summarized into three broad hierarchy levels. This hierarchy is based on whether the valuation inputs are observable or unobservable. These levels are:
| · | Level 1 – Quoted prices in active markets for identical investments. Level 1 may include exchange traded instruments, such as domestic equities, some foreign equities, options, futures, mutual funds, exchange traded funds, rights and warrants. |
| · | Level 2 – Observable inputs other than Level 1 prices, such as quoted prices for similar investments; quoted prices in markets that are not active; or other inputs that are observable or can be corroborated by observable market data. Level 2 may include debt investments that are traded less frequently than exchange traded instruments and which are valued using independent pricing services; foreign equities, which are principally traded on certain foreign markets and are adjusted daily pursuant to a fair value pricing service in order to reflect an adjustment for the factors occurring after the close of certain foreign markets but before the NYSE Close; senior floating rate interests, which are valued using an aggregate of dealer bids; short-term investments, which are valued at amortized cost; and swaps, which are valued based upon the terms of each swap contract. |
| · | Level 3 – Significant unobservable inputs that are supported by limited or no market activity. Level 3 may include financial instruments whose values are determined using indicative market quotes or require significant management judgment or estimation. These unobservable valuation inputs may include estimates for current yields, maturity/duration, prepayment speed, and indicative market quotes for comparable investments along with other assumptions relating to credit quality, collateral value, complexity of the investment structure, general market conditions and liquidity. This category may include investments where trading has been halted or there are certain restrictions on trading. While these investments are priced using unobservable inputs, the valuation of these investments reflects the best available data and management believes the prices are a reasonable representation of exit price. |
The Board of Directors of the Company generally reviews and approves the “Procedures for Valuation of Portfolio Securities” on an annual basis. These procedures define how investments are to be valued, including the formation and activities of a Valuation Committee. The Valuation Committee is responsible for determining in good faith the fair value of investments when the value cannot be obtained from primary pricing services or alternative sources or if the valuation of an investment as provided by the primary pricing service or alternative source is believed not to reflect the investment’s fair value as of the Valuation Date. Voting members of the Valuation Committee include the Fund’s Treasurer or designee and a Vice President of the investment manager or designee. An Assistant Vice President of the Fund with legal expertise or designee is also included on the Valuation Committee as a non-voting advisory member. In addition, the Fund’s Chief Compliance Officer shall designate a member of the compliance group to attend Valuation Committee meetings as a non-voting resource, to monitor for and provide guidance with respect to compliance with these procedures. Two members of the Valuation Committee or their designees, representing different departments, shall constitute a quorum for purposes of permitting the Valuation Committee to take action. The Valuation Committee will consider all relevant factors in determining an investment’s fair value, and may seek the advice of the Fund’s sub-adviser, knowledgeable brokers, and legal counsel in making such determination. The Valuation Committee reports to the Audit Committee of the Company’s Board of Directors. The Audit Committee receives quarterly written
| 13 |
| Hartford Growth HLS Fund |
| Notes to Financial Statements – (continued) |
| December 31, 2013 |
| (000’s Omitted) |
reports which include details of all fair-valued investments, including the reason for the fair valuation, and an indication, when possible, of the accuracy of the valuation by disclosing the next available reliable public price quotation or the disposition price of such investments (the “look-back” test). The Board of Directors then must consider for ratification all of the fair value determinations made during the previous quarter.
Valuation levels are not necessarily indicative of the risk associated with investing in such investments. Individual investments within any of the above mentioned asset classes may be assigned a different hierarchical level than those presented above, as individual circumstances dictate.
For additional information, refer to the Investment Valuation Hierarchy Level Summary and the Level 3 roll-forward reconciliation, if applicable, which follow the Schedule of Investments.
| c) | Investment Transactions and Investment Income – Investment transactions are recorded as of the trade date (the date the order to buy or sell is executed) for financial reporting purposes. Investments purchased or sold on a when-issued or delayed-delivery basis may be settled a month or more after the trade date. Realized gains and losses are determined on the basis of identified cost. |
Dividend income from domestic securities is accrued on the ex-dividend date. In general, dividend income from foreign securities is recorded on the ex-date; however, dividend notifications in certain foreign jurisdictions may not be available in a timely manner and as a result, the Fund will record the dividend as soon as the relevant details (i.e., rate per share, payment date, shareholders of record, etc.) are publicly available. Interest income, including amortization of premium, accretion of discounts and additional principal received in-kind in lieu of cash, is accrued on a daily basis.
| d) | Joint Trading Account – The Fund may invest cash balances into a joint trading account that may be invested in one or more repurchase agreements. |
| e) | Fund Share Valuation and Dividend Distributions to Shareholders – Orders for the Fund’s shares are executed in accordance with the investment instructions of the contract holders and plan participants. The NAV of the Fund’s shares is determined as of the close of business on each business day of the Exchange. The NAV is determined separately for each class of shares of the Fund by dividing the Fund’s net assets attributable to that class by the number of shares of the class outstanding. Each class of shares offered by the Fund has equal rights as to assets and voting privileges (except that shareholders of a class have exclusive voting rights regarding any matter relating solely to that class of shares). Income and non-class specific expenses are allocated daily to each class on the basis of the relative net assets of the class. Realized and unrealized gains and losses are allocated daily based on the relative net assets of each class of shares of the Fund. |
Orders for the purchase of the Fund’s shares received prior to the close of the Exchange on any day the Exchange is open for business are priced at the NAV determined as of the close of the Exchange. Orders received after the close of the Exchange, or on a day on which the Exchange and/or the Fund is not open for business, are priced at the next determined NAV.
Dividends are declared pursuant to a policy adopted by the Company’s Board of Directors based upon the investment performance of the Fund. The policy of the Fund is to pay dividends from net investment income and realized gains, if any, at least once a year.
Distributions from net investment income, net realized gains and capital are determined in accordance with federal income tax regulations, which may differ from U.S. GAAP with respect to character and timing. These differences may include, but are not limited to, losses deferred due to wash sale adjustments, foreign currency gains and losses, adjustments related to Passive Foreign Investment Companies (“PFICs”), Real Estate Investment Trusts (“REITs”), Regulated Investment Companies (“RICs”), certain derivatives and partnerships. Permanent book and federal income tax
| 14 |
basis differences relating to shareholder distributions will result in reclassifications to certain of the Fund’s capital accounts (see Federal Income Taxes: Reclassification of Capital Accounts note).
| 3. | Securities and Other Investments: |
| a) | Repurchase Agreements – A repurchase agreement is an agreement by which a counterparty agrees to sell an investment and agrees to repurchase the investment sold from the buyer at a mutually agreed upon time and price. During the period of the repurchase agreement, the counterparty will deposit cash and or securities in a third party custodial account to serve as collateral. At the time the Fund enters into a repurchase agreement, the value of the underlying collateral, including accrued interest, will be equal to or exceed the value of the repurchase agreement. Repurchase agreements expose the Fund to counterparty risk - that is, the risk that the counterparty will not fulfill its obligations. To minimize counterparty risk, the investments that serve to collateralize the repurchase agreement are held by the Fund’s custodian in book entry or physical form in the custodial account of the Fund or in a third party custodial account. Repurchase agreements are valued at cost plus accrued interest, which approximates fair value. Repurchase agreements have master netting arrangements which allow the Fund to offset amounts owed to a counterparty with amounts owed by the counterparty, including any collateral. Upon an event of default under a master repurchase agreement, the non-defaulting party may close out all transactions traded under such agreement and net amounts owed under each transaction to one net amount payable by one party to the other. Absent an event of default, the master repurchase agreement does not result in an offset of reported amounts of assets and liabilities in the Statement of Assets and Liabilities across transactions between the Fund and the applicable counterparty. The Fund, as shown on the Schedule of Investments, had outstanding repurchase agreements and related collateral as of December 31, 2013. |
| b) | Illiquid and Restricted Investments – The Fund is permitted to invest up to 15% of its net assets in illiquid investments. Illiquid investments are those that may not be sold or disposed of in the ordinary course of business within seven days, at approximately the price used to determine the Fund’s NAV. The Fund may not be able to sell illiquid investments when its sub-adviser considers it desirable to do so or may have to sell such investments at a price that is lower than the price that could be obtained if the investments were more liquid. A sale of illiquid investments may require more time and may result in higher dealer discounts and other selling expenses than does the sale of those that are liquid. Illiquid investments also may be more difficult to value due to the unavailability of reliable market quotations for such investments, and an investment in them may have an adverse impact on the Fund’s NAV. The Fund may also purchase certain restricted investments that can only be resold to certain qualified investors and may be determined to be liquid pursuant to policies and guidelines established by the Company’s Board of Directors. The Fund, as shown on the Schedule of Investments, had illiquid and/or restricted investments as of December 31, 2013. |
| 4. | Principal Risks: |
The Fund may be exposed to counterparty risk, or the risk that an institution or other entity with which the Fund has unsettled or open transactions will default.
If the Fund invests directly in foreign currencies or in securities that trade in, and receive revenues in, foreign currencies, or in derivatives that provide exposure to foreign currencies, it will be subject to the risk that those currencies will decline in value relative to the base currency (U.S. dollars) of the Fund, or, in the case of hedging positions, that the Fund’s base currency will decline in value relative to the currency being hedged. Currency rates in foreign countries may fluctuate significantly over short periods of time for a number of reasons, including changes in interest rates, intervention (or the failure to intervene) by U.S. or foreign governments, central banks or supranational entities, such as the International Monetary Fund, or by the imposition of currency controls or other political developments in the United States or abroad. As a result, the Fund’s investments in foreign currency denominated securities may reduce the returns of the Fund. The market values of equity securities, such as common stocks and preferred stocks, or equity related investments, such as futures and options, may decline due to general market conditions which are not specifically related to a particular company, such as real or perceived adverse economic conditions, changes in the general outlook for corporate earnings, changes in interest or currency rates or adverse investor sentiment generally. The market value of equity securities may also decline due to factors which affect a particular industry or industries, such as labor shortages
| 15 |
| Hartford Growth HLS Fund |
| Notes to Financial Statements – (continued) |
| December 31, 2013 |
| (000’s Omitted) |
or increased production costs and competitive conditions within an industry. Equity securities and equity related investments generally have greater market price volatility than fixed income securities.
| 5. | Federal Income Taxes: |
| a) | Federal Income Taxes – For federal income tax purposes, the Fund intends to continue to qualify as a RIC under Subchapter M of the Internal Revenue Code (“IRC”) by distributing substantially all of its taxable net investment income and net realized capital gains to its shareholders and otherwise complying with the requirements of the IRC. The Fund has distributed substantially all of its income and capital gains in prior years, if applicable, and intends to distribute substantially all of its income and capital gains prior to the next fiscal year-end. Accordingly, no provision for federal income or excise taxes has been made in the accompanying financial statements. Distributions from short-term capital gains are treated as ordinary income distributions for federal income tax purposes. |
| b) | Net Investment Income (Loss), Net Realized Gains (Losses) and Distributions – Net investment income (loss) and net realized gains (losses) may differ for financial statement and tax purposes primarily because of losses deferred due to wash sale adjustments, foreign currency gains and losses, adjustments related to PFICs, REITs, RICs, certain derivatives and partnerships. The character of distributions made during the year from net investment income or net realized gains may differ from their ultimate characterization for federal income tax purposes. Also, due to the timing of dividend distributions, the fiscal year in which amounts are distributed may differ from the year that the income or realized gains (losses) were recorded by the Fund. |
| c) | Distributions and Components of Distributable Earnings – The tax character of distributions paid by the Fund for the periods indicated is as follows (as adjusted for dividends payable, if applicable): |
| For the Year Ended December 31, 2013 | For the Year Ended December 31, 2012 | |||||||
| Ordinary Income | $ | 155 | $ | — | ||||
| As of December 31, 2013, the Fund’s components of distributable earnings (deficit) on a tax basis were as follows: |
| Amount | ||||
| Undistributed Ordinary Income | $ | 863 | ||
| Undistributed Long-Term Capital Gain | 46,967 | |||
| Unrealized Appreciation* | 66,654 | |||
| Total Accumulated Earnings | $ | 114,484 | ||
| * | Differences between book-basis and tax-basis unrealized appreciation (depreciation) may be attributable to the losses deferred due to wash sale adjustments, foreign currency gains and losses, adjustments related to PFICs, REITs, RICs, certain derivatives and partnerships. |
| 16 |
| d) | Reclassification of Capital Accounts – The Fund may record reclassifications in its capital accounts. These reclassifications have no impact on the total net assets of the Fund. The reclassifications are a result of permanent differences between U.S. GAAP and tax accounting for such items as expiration or utilization of capital loss carryforwards or net operating losses. Adjustments are made to reflect the impact these items have on current and future distributions to shareholders. Therefore, the source of the Fund’s distributions may be shown in the accompanying Statement of Changes in Net Assets as from undistributed net investment income, from accumulated net realized gains on investments or from capital depending on the type of book and tax differences that exist. For the year ended December 31, 2013, the Fund recorded reclassifications to increase (decrease) the accounts listed below: |
| Amount | ||||
| Undistributed Net Investment Income (Loss) | $ | (6 | ) | |
| Accumulated Net Realized Gain (Loss) | 6 | |||
| e) | Capital Loss Carryforward – On December 22, 2010, the Regulated Investment Company Modernization Act of 2010 (the “Act”) was enacted, which made changes to the capital loss carryforward rules. The changes are effective for taxable years beginning after the date of enactment. Under the Act, funds are permitted to carry forward capital losses for an unlimited period. However, any losses incurred during those future taxable years will be required to be utilized prior to the losses incurred in pre-enactment taxable years, which carry an expiration date. As a result of this ordering rule, pre-enactment capital loss carryforwards may be more likely to expire unused. Additionally, post-enactment capital loss carryforwards retain their character as either short-term or long-term capital losses rather than being considered all short-term as permitted under prior regulation. |
The Fund had no capital loss carryforward for U.S. federal income tax purposes as of December 31, 2013.
During the year ended December 31, 2013, the Fund utilized $10,765 of prior year capital loss carryforwards.
| f) | Accounting for Uncertainty in Income Taxes – The Fund has adopted financial reporting rules that require the Fund to analyze all open tax years, as defined by the statute of limitations, for all major jurisdictions. Generally, tax authorities can examine all tax returns filed for the last three years. The Fund does not have an examination in progress. |
The Fund has reviewed all open tax years and major jurisdictions and concluded that these financial reporting rules had no effect on the Fund’s financial position or results of operations. There is no tax liability resulting from unrecognized tax benefits relating to uncertain income tax positions taken or expected to be taken on the tax return for the fiscal year ended December 31, 2013. The Fund is also not aware of any tax positions for which it is reasonably possible that the total amounts of unrecognized tax benefits will significantly change in the next twelve months.
| 6. | Expenses: |
| a) | Investment Management Agreement – Hartford Funds Management Company, LLC (“HFMC”), an indirect wholly owned subsidiary of The Hartford Financial Services Group, Inc. (“The Hartford”), serves as investment manager to the Fund pursuant to an Investment Management Agreement with the Company. The investment manager has overall investment supervisory responsibility for the Fund. In addition, the investment manager provides administrative personnel, services, equipment, facilities and office space for proper operation of the Fund. The investment manager has contracted with Wellington Management Company, LLP (“Wellington Management”) under a sub-advisory agreement for the provision of day-to-day investment management services to the Fund in accordance with the Fund’s investment objective and policies. The Fund pays a fee to the investment manager, a portion of which may be used to compensate Wellington Management. |
| 17 |
| Hartford Growth HLS Fund |
| Notes to Financial Statements – (continued) |
| December 31, 2013 |
| (000’s Omitted) |
The schedule below reflects the rates of compensation paid to HFMC for investment management services rendered as of December 31, 2013; the rates are accrued daily and paid monthly.
| Average Daily Net Assets | Annual Fee |
| On first $250 million | 0.8000% |
| On next $250 million | 0.7500% |
| On next $500 million | 0.7000% |
| On next $4 billion | 0.6750% |
| On next $5 billion | 0.6725% |
| Over $10 billion | 0.6700% |
| b) | Accounting Services Agreement – Pursuant to the Fund Accounting Agreement between HFMC and the Company, on behalf of the Fund, HFMC provides accounting services to the Fund and receives monthly compensation based on the Fund’s average daily net assets at the rates set forth below. The Fund’s accounting services fees are accrued daily and paid monthly. |
| Average Daily Net Assets | Annual Fee |
| All Assets | 0.010% |
| c) | Operating Expenses – Allocable expenses incurred by the Company are allocated to each Fund and allocated to classes within a Fund in proportion to the average daily net assets of the Fund and each class, except where allocation of certain expenses is more fairly made directly to the Fund or to specific classes within a Fund. |
| d) | Fees Paid Indirectly – The Company, on behalf of the Fund, has entered into agreements with State Street Global Markets, LLC and Russell Implementation Services, Inc. to partially recapture non-discounted trade commissions. Such rebates are used to pay a portion of the Fund’s expenses. In addition, the Fund’s custodian bank has agreed to reduce its fees when the Fund maintains cash on deposit in a non-interest-bearing custody account. For the year ended December 31, 2013, these amounts, if any, are included in the Statement of Operations. |
The ratio of expenses to average net assets in the accompanying financial highlights excludes the reduction in expenses related to fees paid indirectly. The annualized expense ratio after waivers for the period listed below reflecting the reduction for fees paid indirectly is as follows:
| Year Ended December 31, 2013 | ||||
| Class IA | 0.84 | % | ||
| Class IB | 1.09 | |||
| e) | Distribution Plan for Class IB shares – Effective June 14, 2013, Hartford Investment Financial Services, LLC was renamed Hartford Funds Distributors, LLC (“HFD”). HFD, a wholly owned, ultimate subsidiary of The Hartford, serves as the Fund’s principal underwriter and distributor. The Company, on behalf of the Fund, has adopted a Distribution Plan pursuant to Rule 12b-1 of the 1940 Act to compensate the distributor, HFD, from assets attributable to the Class IB shares for services rendered and expenses borne in connection with activities primarily intended to result in the sale of the Class IB shares, subject to the review and approval of the Company’s Board of Directors. |
The Distribution Plan provides that the Fund may pay annually up to 0.25% of the average daily net assets of the Fund attributable to its Class IB shares for activities primarily intended to result in the sale of Class IB shares. The Board has the authority to suspend or reduce these payments at any point in time. Under the terms of the Distribution Plan and the principal underwriting agreement, the Fund is authorized to make payments monthly to the distributor that may be used to pay or compensate entities providing distribution and shareholder servicing with respect to the Class IB shares for such entities’ fees or expenses incurred or paid in that regard. These fees are accrued daily and paid monthly.
| 18 |
| f) | Other Related Party Transactions – Certain officers of the Fund are directors and/or officers of the investment manager and/or The Hartford or its subsidiaries. For the year ended December 31, 2013, a portion of the Fund’s Chief Compliance Officer’s salary was paid by all the investment companies in the Hartford fund complex. The portion allocated to the Fund rounds to zero. Hartford Administrative Services Company (“HASCO”), an indirect wholly owned subsidiary of The Hartford, provides transfer agent services to the Fund. HASCO was compensated on a per account basis for providing such services. The amount paid to HASCO can be found in the Statement of Operations. These fees are accrued daily and paid monthly. |
| 7. | Investment Transactions: |
For the year ended December 31, 2013, the Fund's aggregate purchases and sales of investment securities (excluding short-term investments) were as follows:
| Amount | ||||
| Cost of Purchases Excluding U.S. Government Obligations | $ | 139,520 | ||
| Sales Proceeds Excluding U.S. Government Obligations | 282,179 | |||
| 8. | Line of Credit: |
The Fund is one of several Hartford funds that participate in a $500 million committed revolving line of credit facility. The facility is to be used for temporary or emergency purposes. Under the arrangement, the funds are required to own securities having a market value in excess of 300% of the total bank borrowings. The interest rate on borrowings varies depending on the nature of the loan. The facility also requires a fee to be paid based on the amount of the commitment. This commitment fee is allocated to all of the funds participating in the line of credit based on the average net assets of the funds. During the year ended December 31, 2013, the Fund did not have any borrowings under this facility.
| 9. | Industry Classifications: |
Other than the industry classifications “Other Investment Pools and Funds” and “Exchange Traded Funds,” equity industry classifications used in this report are the Global Industry Classification Standard, which was developed by and is the exclusive property and service mark of MSCI, Inc. and Standard & Poor’s.
| 10. | Indemnifications: |
Under the Company’s organizational documents, the Company shall indemnify its officers and directors to the full extent required or permitted under Maryland General Corporation Law and the federal securities laws. In addition, the Company, on behalf of the Fund, may enter into contracts that contain a variety of indemnifications. The Company’s maximum exposure under these arrangements is unknown. However, as of the date of these financial statements, the Company has not had prior claims or losses pursuant to these contracts and expects the risk of loss to be remote.
| 11. | Pending Legal Proceedings: |
On February 25, 2011, Jennifer L. Kasilag, Louis Mellinger, Judith M. Menendez, Jacqueline M. Robinson, and Linda A. Russell filed a derivative lawsuit against Hartford Investment Financial Services, LLC (“HIFSCO”)(now known as Hartford Funds Distributors, LLC) on behalf of six Hartford retail mutual funds in the United States District Court for the District of New Jersey, alleging that HIFSCO received excessive advisory and distribution fees in violation of its statutory fiduciary duty under Section 36(b) of the 1940 Act when serving as investment manager and principal underwriter, respectively, to the Hartford retail mutual funds. HIFSCO moved to dismiss and, in September 2011, the motion was granted in part and denied in part, with leave to amend the complaint. In November 2011, plaintiffs filed an amended complaint on behalf of certain Hartford retail mutual funds, The Hartford Global Health Fund (now known as The Hartford Healthcare Fund), The Hartford Conservative Allocation Fund, The Hartford Growth Opportunities Fund, The Hartford Inflation Plus Fund, The Hartford Advisers Fund (now known as The Hartford Balanced Fund), and The Hartford Capital Appreciation Fund. Plaintiffs seek to rescind the investment management agreements and distribution plans between HIFSCO and these funds and to recover the
| 19 |
| Hartford Growth HLS Fund |
| Notes to Financial Statements – (continued) |
| December 31, 2013 |
| (000’s Omitted) |
total fees charged thereunder or, in the alternative, to recover any improper compensation HIFSCO received, in addition to lost earnings. HIFSCO filed a partial motion to dismiss the amended complaint and, in December 2012, the court dismissed without prejudice the claims regarding distribution fees and denied the motion with respect to the advisory fees claims. HIFSCO disputes the allegations and intends to defend the advisory fee claims vigorously.
This action concerns the activities of HIFSCO in its capacity as investment manager and principal underwriter to the Hartford retail mutual funds and does not concern HIFSCO’s activities in its capacity as principal underwriter to the HLS funds. For this reason, no accrual for litigation relating to this matter has been recorded in the financial statements of the Fund.
| 12. | Subsequent Events: |
At a meeting held on February 5, 2014, the Board of Directors of Hartford Series Fund, Inc. approved an Agreement and Plan of Reorganization relating to the reorganization of the Fund into Hartford Growth Opportunities HLS Fund, a series of Hartford HLS Series Fund II, Inc. The Reorganization does not require shareholder approval. The Reorganization is expected to occur on or about June 23, 2014.
| 20 |
| Hartford Growth HLS Fund |
| Financial Highlights |
| ─ Selected Per-Share Data(A) ─ | ─ Ratios and Supplemental Data ─ | |||||||||||||||||||||||||||||||||||||||||||||||||||
| Class | Net Asset Value at Beginning of Period | Net Investment Income (Loss) | Net Realized and Unrealized Gain (Loss) on Investments | Total from Investment Operations | Dividends from Net Investment Income | Distributions from Realized Capital Gains | Total Dividends and Distributions | Net Asset Value at End of Period | Total Return(B) | Net Assets at End of Period (000s) | Ratio of Expenses to Average Net Assets Before Adjust- ments(C) | Ratio of Expenses to Average Net Assets After Adjust- ments(C) | Ratio of Net Investment Income (Loss) to Average Net Assets | |||||||||||||||||||||||||||||||||||||||
| For the Year Ended December 31, 2013 | ||||||||||||||||||||||||||||||||||||||||||||||||||||
| IA | $ | 12.93 | $ | 0.01 | $ | 4.58 | $ | 4.59 | $ | (0.01 | ) | $ | – | $ | (0.01 | ) | $ | 17.51 | 35.48 | % | $ | 175,124 | 0.84 | % | 0.84 | % | 0.09 | % | ||||||||||||||||||||||||
| IB | 12.67 | (0.02 | ) | 4.47 | 4.45 | – | – | – | 17.12 | 35.14 | 70,511 | 1.09 | 1.09 | (0.15 | ) | |||||||||||||||||||||||||||||||||||||
| For the Year Ended December 31, 2012 (D) | ||||||||||||||||||||||||||||||||||||||||||||||||||||
| IA | $ | 10.92 | $ | 0.01 | $ | 2.00 | $ | 2.01 | $ | – | $ | – | $ | – | $ | 12.93 | 18.42 | % | $ | 233,089 | 0.83 | % | 0.83 | % | 0.10 | % | ||||||||||||||||||||||||||
| IB | 10.73 | (0.02 | ) | 1.96 | 1.94 | – | – | – | 12.67 | 18.12 | 67,403 | 1.08 | 1.08 | (0.16 | ) | |||||||||||||||||||||||||||||||||||||
| For the Year Ended December 31, 2011 (D) | ||||||||||||||||||||||||||||||||||||||||||||||||||||
| IA | $ | 12.02 | $ | 0.01 | $ | (1.09 | ) | $ | (1.08 | ) | $ | (0.02 | ) | $ | – | $ | (0.02 | ) | $ | 10.92 | (8.95 | )% | $ | 243,509 | 0.82 | % | 0.82 | % | 0.06 | % | ||||||||||||||||||||||
| IB | 11.81 | (0.03 | ) | (1.05 | ) | (1.08 | ) | – | – | – | 10.73 | (9.18 | ) | 76,447 | 1.07 | 1.07 | (0.19 | ) | ||||||||||||||||||||||||||||||||||
| For the Year Ended December 31, 2010 | ||||||||||||||||||||||||||||||||||||||||||||||||||||
| IA | $ | 10.07 | $ | 0.02 | $ | 1.93 | $ | 1.95 | $ | – | $ | – | $ | – | $ | 12.02 | 19.37 | % | $ | 317,464 | 0.84 | % | 0.84 | % | 0.21 | % | ||||||||||||||||||||||||||
| IB | 9.92 | – | 1.89 | 1.89 | – | – | – | 11.81 | 19.07 | 108,774 | 1.09 | 1.09 | (0.04 | ) | ||||||||||||||||||||||||||||||||||||||
| For the Year Ended December 31, 2009 (D) | ||||||||||||||||||||||||||||||||||||||||||||||||||||
| IA | $ | 7.53 | $ | 0.04 | $ | 2.54 | $ | 2.58 | $ | (0.04 | ) | $ | – | $ | (0.04 | ) | $ | 10.07 | 34.24 | % | $ | 242,406 | 0.88 | % | 0.88 | % | 0.44 | % | ||||||||||||||||||||||||
| IB | 7.42 | 0.02 | 2.49 | 2.51 | (0.01 | ) | – | (0.01 | ) | 9.92 | 33.90 | 86,556 | 1.13 | 1.13 | 0.20 | |||||||||||||||||||||||||||||||||||||
| (A) | Information presented relates to a share outstanding throughout the indicated period. Net investment income (loss) per share amounts are calculated based on average shares outstanding unless otherwise noted. |
| (B) | The figures do not include sales charges or other fees which may be applied at the variable life insurance, variable annuity or qualified retirement plan product level. Any such additional sales charges or other fees would lower the Fund's performance. |
| (C) | Adjustments include waivers and reimbursements, if applicable. Ratios do not include fees paid indirectly (see Expenses in the accompanying Notes to Financial Statements). |
| (D) | Net investment income (loss) per share amounts have been calculated using the SEC method. |
| Portfolio Turnover Rate for All Share Classes | ||||
| For the Year Ended December 31, 2013 | 49 | % | ||
| For the Year Ended December 31, 2012 | 64 | |||
| For the Year Ended December 31, 2011 | 37 | |||
| For the Year Ended December 31, 2010 | 74 | (A) | ||
| For the Year Ended December 31, 2009 | 85 | |||
| (A) | During the year ended December 31, 2010, the Fund incurred $49.9 million in sales associated with the transition of assets from Hartford Fundamental Growth HLS Fund, which merged into the Fund on April 16, 2010. These sales were excluded from the portfolio turnover calculation. |
| 21 |
| Report of Independent Registered Public Accounting Firm |
| The Board of Directors and Shareholders of |
| Hartford Series Fund, Inc. |
We have audited the accompanying statement of assets and liabilities, including the schedule of investments, of Hartford Growth HLS Fund (one of the portfolios constituting Hartford Series Fund, Inc. (the Funds)) as of December 31, 2013, and the related statement of operations for the year then ended, the statements of changes in net assets for each of the two years in the period then ended, and the financial highlights for each of the five years in the period then ended. These financial statements and financial highlights are the responsibility of the Funds’ management. Our responsibility is to express an opinion on these financial statements and financial highlights based on our audits.
We conducted our audits in accordance with the standards of the Public Company Accounting Oversight Board (United States). Those standards require that we plan and perform the audit to obtain reasonable assurance about whether the financial statements and financial highlights are free of material misstatement. We were not engaged to perform an audit of the Funds’ internal control over financial reporting. Our audits included consideration of internal control over financial reporting as a basis for designing audit procedures that are appropriate in the circumstances, but not for the purpose of expressing an opinion on the effectiveness of the Funds’ internal control over financial reporting. Accordingly, we express no such opinion. An audit also includes examining, on a test basis, evidence supporting the amounts and disclosures in the financial statements and financial highlights, assessing the accounting principles used and significant estimates made by management, and evaluating the overall financial statement presentation. Our procedures included confirmation of securities owned as of December 31, 2013, by correspondence with the custodian and brokers or by other appropriate auditing procedures where replies from brokers were not received. We believe that our audits provide a reasonable basis for our opinion.
In our opinion, the financial statements and financial highlights referred to above present fairly, in all material respects, the financial position of Hartford Growth HLS Fund of the Hartford Series Fund, Inc. at December 31, 2013, the results of its operations for the year then ended, the changes in its net assets for each of the two years in the period then ended, and the financial highlights for each of the five years in the period then ended, in conformity with U.S. generally accepted accounting principles.
|
Minneapolis, MN
February 17, 2014
| 22 |
| Hartford Growth HLS Fund |
| Directors and Officers (Unaudited) |
The Board of Directors of the Company appoints officers who are responsible for the day-to-day operations of the Fund and who execute policies formulated by the directors. Each director serves until his or her death, resignation, or retirement or until the next annual meeting of shareholders is held or until his or her successor is elected and qualifies.
Directors and officers who are employed by or who have a financial interest in The Hartford are considered “interested” persons of the Fund pursuant to the 1940 Act. Each officer and two of the Company’s directors, as noted in the chart below, are “interested” persons of the Fund. Each director serves as a director for The Hartford Mutual Funds, Inc., The Hartford Mutual Funds II, Inc., Hartford Series Fund, Inc., Hartford HLS Series Fund II, Inc., and as a trustee for The Hartford Alternative Strategies Fund, which, as of December 31, 2013, collectively consist of 91 funds. Correspondence may be sent to directors and officers c/o Hartford Funds, 5 Radnor Corporate Center, Suite 300, 100 Matsonford Road, Radnor, Pennsylvania 19087, except that correspondence to Mr. Annoni, Mr. Dressen and Ms. Quade may be sent to 500 Bielenberg Drive, Woodbury, Minnesota 55125.
The table below sets forth, for each director and officer, his or her name, year of birth, current position with the Company and date first elected or appointed to Hartford Series Fund, Inc. (“HSF”), and Hartford HLS Series Fund II, Inc. (“HSF2”), principal occupation, and, for directors, other directorships held. The Fund’s Statement of Additional Information contains further information on the directors and is available free of charge by calling 1-800-862-6668 or writing to Hartford HLS Funds, c/o Hartford Life Insurance Company, Hartford Life and Annuity Insurance Company, P.O. Box 14293, Lexington, KY 40512-4293.
Information on the aggregate remuneration paid to the directors of the Company can be found in the Statement of Operations herein. The Fund pays to The Hartford a portion of the Chief Compliance Officer’s compensation, but does not pay salaries or compensation to any of their other officers or directors who are employed by The Hartford.
Non-Interested Directors
Lynn S. Birdsong (1946) Director since 2003, Co-Chairman of the Investment Committee since 2005
Mr. Birdsong is a private investor. Mr. Birdsong currently serves as a Director of the Sovereign High Yield Investment Company (April 2010 to current). Mr. Birdsong currently serves as an Independent Director of Nomura Partners Funds, Inc. (formerly, The Japan Fund) (April 2003 to current). From 2003 to March 2005, Mr. Birdsong was an Independent Director of the Atlantic Whitehall Funds. From 1979 to 2002, Mr. Birdsong was a Managing Director of Zurich Scudder Investments, an investment management firm. During his employment with Scudder, Mr. Birdsong was an Interested Director of The Japan Fund. From January 1981 through December 2013, Mr. Birdsong was a partner in Birdsong Company, an advertising specialty firm.
Robert M. Gavin, Jr. (1940) Director since 2002 (HSF) and 1986 (HSF2), Chairman of the Board since 2004
Dr. Gavin is an educational consultant. Prior to September 1, 2001, he was President of Cranbrook Education Community and prior to July 1996, he was President of Macalester College, St. Paul, Minnesota.
Duane E. Hill (1945) Director since 2001 (HSF) and 2002 (HSF2), Chairman of the Nominating Committee since 2003
Mr. Hill is a Partner of TSG Ventures L.P., a private equity investment company. Mr. Hill is a former partner of TSG Capital Group, a private equity investment firm that served as sponsor and lead investor in leveraged buyouts of middle market companies.
Sandra S. Jaffee (1941) Director since 2005
Ms. Jaffee is the founder and Chief Executive Officer of a private company, Homeworks Concierge, LLC, which provides residential property management services in Westchester County, New York (January 2012 to present). Ms. Jaffee served as Chairman (2008 to 2009) and Chief Executive Officer of Fortent (formerly Searchspace Group), a leading provider of compliance/regulatory technology to financial institutions from August 2005 to August 2009. Ms. Jaffee currently serves as a member of the Board of Directors of Broadridge Financial Solutions as well as a Trustee of Muhlenberg College.
| 23 |
| Hartford Growth HLS Fund |
| Directors and Officers (Unaudited) �� (continued) |
William P. Johnston (1944) Director since 2005, Chairman of the Compliance Committee since 2005
In June 2006, Mr. Johnston was appointed as Senior Advisor to The Carlyle Group, a global private equity and alternative asset investment firm and currently serves as an Operating Executive. In July 2006, Mr. Johnston was elected to the Board of Directors of MultiPlan, Inc. and served as a Director (July 2006 to August 2010). In August 2007, Mr. Johnston was elected to the Board of Directors of LifeCare Holdings, Inc. and served as a Director (August 2007 to June 2013). In February 2008, Mr. Johnston was elected to the Board of Directors of HCR-ManorCare, Inc. In May 2006, Mr. Johnston was elected to the Supervisory Board of Fresenius Medical Care AG & Co. KGaA, after its acquisition of Renal Care Group, Inc. in March 2006. Mr. Johnston joined Renal Care Group in November 2002 as a member of the Board of Directors and served as Chairman of the Board from March 2003 through March 2006. From 2002 through 2013, Mr. Johnston served as a Board member of the Georgia O’Keefe Museum. From September 1987 to December 2002, Mr. Johnston was with Equitable Securities Corporation (and its successors, SunTrust Equitable Securities and SunTrust Robinson Humphrey) serving in various investment banking and managerial positions, including Managing Director and Head of Investment Banking, Chief Executive Officer and Vice Chairman.
Phillip O. Peterson (1944) Director since 2002 (HSF) and 2000 (HSF2), Chairman of the Audit Committee since 2002
Mr. Peterson is a mutual fund industry consultant. He was a partner of KPMG LLP (an accounting firm) until July 1999. Mr. Peterson joined William Blair Funds in February 2007 as a member of the Board of Trustees. Mr. Peterson also joined the Board of Trustees of Symetra Variable Mutual Funds Trust as a trustee in February 2012.
Lemma W. Senbet (1946) Director since 2005
Dr. Senbet is the William E. Mayer Chair Professor of Finance and Founding Director, Center for Financial Policy, at the University of Maryland, Robert H. Smith School of Business. He was chair of the Finance Department of the University of Maryland, Robert H. Smith School of Business from 1998 to 2006. Since June 2013, he has been on leave from the University to serve as Executive Director of African Economic Research Consortium which focuses on economic policy research and training. Previously, he was a chaired professor of finance at the University of Wisconsin-Madison. Also, he was a Director of the Fortis Funds from March 2000 to July 2002. Dr. Senbet served as Director of the American Finance Association and President of the Western Finance Association. In 2006, Dr. Senbet was inducted Fellow of Financial Management Association International for his career-long distinguished scholarship and professional service.
Interested Directors and Officers
James E. Davey (1964) Director since 2012, President and Chief Executive Officer since 2010
Mr. Davey serves as Executive Vice President of Hartford Life Insurance Company (“HLIC”) and The Hartford Financial Services Group, Inc. Additionally, Mr. Davey serves as Chairman of the Board, Manager and Senior Managing Director of Hartford Funds Distributors, LLC (“HFD”). He also currently serves as Director, Chairman of the Board, President and Senior Managing Director of Hartford Administrative Services Company (“HASCO”). Mr. Davey also serves as Manager, Chairman of the Board and Senior Managing Director for Hartford Funds Management Company, LLC (“HFMC”). Mr. Davey joined The Hartford in 2002.
Lowndes A. Smith (1939) Director since 1996 (HSF) and 2002 (HSF2), Co-Chairman of the Investment Committee since 2005
Mr. Smith served as Vice Chairman of The Hartford from February 1997 to January 2002, as President and Chief Executive Officer of Hartford Life, Inc. from February 1997 to January 2002, and as President and Chief Operating Officer of The Hartford Life Insurance Companies from January 1989 to January 2002. Mr. Smith serves as a Director of White Mountains Insurance Group Ltd. (October 2003 to current); One Beacon Insurance (October 2006 to current); Symetra Financial (August 2007 to current) and is a Managing Director of Whittington Gray Associates (January 2007 to current).
Other Officers
Mark A. Annoni (1964) Vice President, Controller and Treasurer since 2012
Mr. Annoni currently serves as the Assistant Vice President of HLIC (February 2004 to present).
| 24 |
Michael R. Dressen (1963) AML Compliance Officer since 2011
Mr. Dressen currently serves as Assistant Vice President of HLIC. He also serves as Chief Compliance Officer and AML Compliance Officer of HASCO and as AML Officer of HFD. Mr. Dressen has served in various positions within The Hartford and its subsidiaries in connection with the operation of the Hartford Funds.
Edward P. Macdonald (1967) Vice President, Secretary and Chief Legal Officer since 2005
Mr. Macdonald currently serves as Assistant Secretary, Executive Vice President and Deputy General Counsel of HFD, HASCO and HFMC. He also serves as Vice President of HLIC. Mr. Macdonald has served in various positions within The Hartford and its subsidiaries in connection with the operation of the Hartford Funds. Mr. Macdonald joined The Hartford in 2005.
Joseph G. Melcher (1973) Vice President and Chief Compliance Officer since 2013
Mr. Melcher currently serves as Executive Vice President of HASCO and HFD. Mr. Melcher also currently serves as Executive Vice President and Chief Compliance Officer of HFMC. Mr. Melcher has served in various positions within The Hartford and its subsidiaries in connection with the operation of the Hartford Funds since joining The Hartford in 2012. Prior to joining The Hartford, Mr. Melcher worked at Touchstone Investments, a member of the Western & Southern Financial Group, where he held the position of Vice President and Chief Compliance Officer from 2010 through 2012 and Assistant Vice President, Compliance from 2005 to 2010.
Vernon J. Meyer (1964) Vice President since 2006
Mr. Meyer currently serves as Senior Vice President of HLIC. He also currently serves as Managing Director and Chief Investment Officer of HFMC. Mr. Meyer has served in various positions within The Hartford and its subsidiaries in connection with the operation of the Hartford Funds. Mr. Meyer joined The Hartford in 2004.
Laura S. Quade (1969) Vice President since 2012
Ms. Quade currently serves as Vice President of HASCO and HFD. She is the Head of Operations of HASCO and also serves as Director, Enterprise Operations of HLIC. Ms. Quade has served in various positions within The Hartford and its subsidiaries in connection with the operation of the Hartford Funds.
Martin A. Swanson (1962) Vice President since 2010
Mr. Swanson currently serves as Vice President of HLIC. Mr. Swanson also serves as Managing Director, Chief Marketing Officer and Principal of HFD. Mr. Swanson has served in various positions within The Hartford and its subsidiaries in connection with the operation of the Hartford Funds.
HOW TO OBTAIN A COPY OF THE FUND’S PROXY VOTING POLICIES AND VOTING RECORDS (UNAUDITED)
A description of the policies and procedures that the Fund uses to determine how to vote proxies relating to portfolio securities and information about how the Fund voted proxies relating to portfolio securities during the most recent twelve-month period ended June 30 are available (1) without charge, upon request, by calling 800-862-6668 and (2) on the SEC’s website at http://www.sec.gov.
QUARTERLY PORTFOLIO HOLDINGS INFORMATION (UNAUDITED)
The Fund files a complete schedule of portfolio holdings with the SEC for the first and third quarters of each fiscal year on Form N-Q. The Fund’s Forms N-Q are available (1) without charge, upon request, by calling 800-862-6668 and (2) on the SEC’s website at http://www.sec.gov. The Form N-Q may be reviewed and copied at the SEC’s Public Reference Room in Washington, DC. Information on the operation of the Public Reference Room may be obtained by calling 1-800-SEC-0330.
| 25 |
| Hartford Growth HLS Fund |
| Expense Example (Unaudited) |
Your Fund's Expenses
As a shareholder of the Fund, you incur two types of costs: (1) transaction costs and (2) ongoing costs, including investment management fees, distribution and/or service (12b-1) fees, if any, and other fund expenses. This example is intended to help you understand your ongoing costs (in dollars) of investing in the Fund and to compare these costs with the ongoing costs of investing in other mutual funds. The example is based on an investment of $1,000 invested at the beginning of the period and held for the period of June 30, 2013 through December 31, 2013.
Actual Expenses
The first set of columns of the table below provides information about actual account values and actual expenses. You may use the information in this column, together with the amount you invested, to estimate the expenses that you paid over the period. Simply divide your account value by $1,000 (for example, an $8,600 account value divided by $1,000 = 8.6), then multiply the result by the number in the line under the heading entitled “Expenses Paid During Period” to estimate the expenses you paid on your account during this period.
Hypothetical Example for Comparison Purposes
The second set of columns of the table below provides information about hypothetical account values and hypothetical expenses based on the Fund’s actual expense ratio and an assumed rate of return of 5% per year before expenses, which is not the Fund’s actual return. The hypothetical account values and expenses may not be used to estimate the actual ending account balance or expenses you paid for the period. You may use this information to compare the ongoing costs of investing in the Fund and other funds. To do so, compare this 5% hypothetical example with the 5% hypothetical examples that appear in the shareholder reports of the other funds.
Please note that the expenses shown in the table are meant to highlight your ongoing costs only and do not reflect any transactional costs, such as sales charges (loads) and CDSC. Therefore, the second set of columns of the table is useful in comparing ongoing costs only, and will not help you determine the relative total costs of owning different funds. In addition, if these transactional costs were included, your costs would be higher. Expenses are equal to the Fund's annualized expense ratios multiplied by average account value over the period, multiplied by 184/365 (to reflect the one-half year period).
| Actual return | Hypothetical (5% return before expenses) | |||||||||||||||||||||||||||||||
| Beginning Account Value June 30, 2013 | Ending Account Value December 31, 2013 | Expenses paid during the period June 30, 2013 through December 31, 2013 | Beginning Account Value June 30, 2013 | Ending Account Value December 31, 2013 | Expenses paid during the period June 30, 2013 through December 31, 2013 | Annualized expense ratio | Days in the current 1/2 year | Days in the full year | ||||||||||||||||||||||||
| Class IA | $ | 1,000.00 | $ | 1,215.90 | $ | 4.74 | $ | 1,000.00 | $ | 1,020.93 | $ | 4.32 | 0.85 | % | 184 | 365 | ||||||||||||||||
| Class IB | $ | 1,000.00 | $ | 1,214.30 | $ | 6.13 | $ | 1,000.00 | $ | 1,019.67 | $ | 5.59 | 1.10 | % | 184 | 365 | ||||||||||||||||
| 26 |
| Hartford Growth HLS Fund |
| Approval of Investment Management and Investment Sub-Advisory Agreements (Unaudited) |
Section 15(c) of the Investment Company Act of 1940, as amended (the “1940 Act”), requires that each mutual fund’s board of directors, including a majority of those directors who are not “interested persons” of the mutual fund, as defined in the 1940 Act (the “Independent Directors”), annually review and consider the continuation of the mutual fund’s investment advisory and sub-advisory agreements. At its meeting held on August 6-7, 2013, the Board of Directors (the “Board”) of Hartford Series Fund, Inc., including each of the Independent Directors, unanimously voted to approve the continuation of the investment management agreement for Hartford Growth HLS Fund (the “Fund”) with Hartford Funds Management Company, LLC (“HFMC”) and the continuation of the investment sub-advisory agreement between HFMC and the Fund’s sub-adviser, Wellington Management Company, LLP (the “Sub-adviser,” and together with HFMC, the “Advisers”) (collectively, the “Agreements”).
In the months preceding the August 6-7, 2013 meeting, the Board requested, received, and reviewed written responses from the Advisers to questions posed to them on behalf of the Independent Directors and supporting materials relating to those questions and responses. The Board considered information furnished to the Board at its meetings throughout the year, as well as information specifically prepared in connection with the annual approval of the Agreements at the Board’s meetings held on June 18-19, 2013 and August 6-7, 2013. Information provided to the Board at its meetings throughout the year included, among other things, reports on Fund performance, legal and compliance matters, sales and marketing activity, shareholder services, and the other services provided to the Fund by the Advisers and their affiliates. The Board also received in-person presentations by Fund officers and representatives of HFMC at the Board’s meetings on June 18-19, 2013 and August 6-7, 2013 concerning the Agreements.
The Independent Directors, advised by independent legal counsel, engaged two service providers to assist them with evaluating the Agreements with respect to the Fund. Lipper Inc. (“Lipper”), an independent provider of investment company data, was retained to provide the Board with reports on how the Fund’s contractual management fees, actual management fees, other non-management fees, overall expense ratios and investment performance compared to those of mutual funds with similar investment objectives. The Independent Directors also engaged an independent financial services consulting firm (the “Consultant”) to assist them in evaluating the Fund’s management fees, sub-advisory fees, other non-management fees, overall expense ratios and investment performance. In addition, the Consultant reviewed the profitability calculations utilized by HFMC in connection with the continuation of the investment management agreement.
In determining whether to continue the Agreements for the Fund, the members of the Board reviewed and evaluated information and factors they believed to be relevant and appropriate in light of the information that the Board deemed necessary and appropriate through the exercise of its reasonable business judgment. While individual members of the Board may have weighed certain factors differently, the Board’s determination to continue the Agreements was based on a comprehensive consideration of all information provided to the Board throughout the year and specifically with respect to the continuation of the Agreements. A more detailed discussion of the factors the Board considered with respect to its approval of the Agreements is provided below.
Nature, Extent, and Quality of Services Provided by the Advisers
The Board requested and considered information concerning the nature, extent, and quality of the services provided to the Fund by the Advisers. The Board considered, among other things, the terms of the Agreements and the range of services provided by the Advisers. The Board considered the Advisers’ professional personnel who provide services to the Fund, including each Adviser’s ability and experience in attracting and retaining qualified personnel to service the Fund. The Board considered each Adviser’s reputation and overall financial strength, as well as its willingness to consider and implement organizational and operational changes designed to improve services to the Fund. In addition, the Board considered the quality of each Adviser’s communications with the Board and responsiveness to Board inquiries.
The Board also requested and evaluated information concerning each Adviser’s regulatory and compliance environment. In this regard, the Board requested and reviewed information on each Adviser’s compliance policies and procedures, compliance history, and a report from the Fund’s Chief Compliance Officer on each Adviser’s compliance with applicable laws and regulations, including responses to regulatory developments and compliance issues raised by regulators. The Board also noted the Advisers’ support of the Fund’s compliance control structure, particularly the resources devoted by the Advisers in support of the Fund’s obligations pursuant to Rule 38a-1 under the 1940 Act.
| 27 |
| Hartford Growth HLS Fund |
| Approval of Investment Management and Investment Sub-Advisory Agreements (Unaudited) – (continued) |
With respect to HFMC, the Board noted that under the Agreements, HFMC is responsible for the management of the Fund, including overseeing fund operations and service providers, as well as investment advisory services in connection with selecting, monitoring and supervising the Sub-adviser. The Board considered HFMC’s ongoing monitoring of people, process and performance, including its quarterly reviews of each of the Hartford Funds, semi-annual meetings with the leaders of each Fund’s portfolio management team, and oversight of the Funds’ approximately 40 portfolio managers. The Board recognized that HFMC has demonstrated a record of making changes to the management and/or strategies of the Funds when warranted. The Board considered HFMC’s oversight of the Sub-adviser’s investment approach and results, process for monitoring best execution of portfolio trades by the Sub-adviser, and approach to risk management with respect to the Fund and the service providers to the Fund. The Board also considered HFMC’s oversight of compliance with the Fund’s objective and policies as well as with applicable laws and regulations, noting that regulatory and other developments had over time led to an increase in the scope of HFMC’s services in this regard.
In addition, the Board considered HFMC’s ongoing commitment to review and rationalize the Hartford Funds product line-up and the expenses that HFMC had incurred in connection with fund combinations in recent years. The Board considered that HFMC or its affiliates are responsible for providing the Fund’s officers. The Board also noted that Hartford Life Insurance Company (“HLIC”) provides administrative services to the Fund. The Board considered its experiences with HFMC and HLIC with respect to each of these services.
With respect to the Sub-adviser, who provides day-to-day portfolio management services, the Board considered the quality of the Fund’s portfolio manager, the Sub-adviser’s other investment personnel, its investment philosophy and process, investment research capabilities and resources, performance record, trade execution capabilities and experience. The Board considered the experience of the Fund’s portfolio manager, the number of accounts managed by the portfolio manager, and the Sub-adviser’s method for compensating the portfolio manager.
Based on these considerations, the Board concluded that it was satisfied with the nature, extent and quality of the services provided to the Fund by HFMC and the Sub-adviser.
Performance of the Fund and the Advisers
The Board considered the investment performance of the Fund. In this regard, the Board reviewed the performance of the Fund over different time periods presented in the materials and evaluated HFMC’s analysis of the Fund’s performance for these time periods. The Board considered information and materials provided to the Board by the Advisers concerning Fund performance, as well as information from Lipper comparing the investment performance of the Fund to an appropriate benchmark and universe of peer funds. The Board noted that the Fund’s performance was in the 4th quintile of its performance universe for the 1- and 3-year periods and the 3rd quintile for the 5-year period. The Board also noted that the Fund’s performance was below its benchmark for the 1-, 3- and 5-year periods. The Board considered that, in response to questions raised concerning the Fund’s performance, HFMC stated that it has confidence in the Fund’s portfolio management team and investment strategy.
The Board considered the detailed investment analytics reports provided by Hartford Funds’ Investment Advisory Group throughout the year. These reports include, among other things, information on the Fund’s gross and net returns, the Fund’s investment performance relative to an appropriate benchmark and peer group, various statistics concerning the Fund’s portfolio, and a narrative summary of various factors affecting Fund performance. The Board considered the Advisers’ cooperation with the Investment Committee, which assists the Board in evaluating the performance of the Fund at periodic meetings throughout the year. The Board also considered the analysis provided by the Consultant relating to the Fund’s performance track record.
In light of all the considerations noted above, the Board concluded that it had continued confidence in HFMC’s and the Sub-adviser’s overall capabilities to manage the Fund.
Costs of the Services and Profitability of the Advisers
The Board reviewed information regarding HFMC’s cost to provide investment management and related services to the Fund and HFMC’s profitability, both overall and for the Fund, on a pre-tax basis without regard to distribution expenses. The Board also requested and reviewed information about the profitability to HFMC and its affiliates from all services provided to the Fund and
| 28 |
all aspects of their relationship with the Fund. The Board also requested and received information relating to the operations and profitability of the Sub-adviser.
The Board considered the Consultant’s review of the profitability calculations utilized by HFMC in connection with the continuation of the investment management agreement, noting the Consultant’s view that Hartford Funds’ process for calculating and reporting Fund profitability is reasonable. In this regard, the Board noted that the Consultant had previously performed a full review of this process and reported that such process is sound and well within common industry practice.
Based on these considerations, the Board concluded that the profits anticipated to be realized by the Advisers and their affiliates from their relationships with the Fund would not be excessive.
Comparison of Fees and Services Provided by the Advisers
The Board considered comparative information with respect to the management fees to be paid by the Fund to HFMC and the total expense ratios of the Fund. The Board also considered comparative information with respect to the sub-advisory fees to be paid by HFMC to the Sub-adviser. In this regard, the Board requested and reviewed information from HFMC and the Sub-adviser relating to the management and sub-advisory fees, including the sub-advisory fee schedule for the Fund, and total operating expenses for the Fund. The Board considered that the management fee for the Fund includes the fee paid to HLIC for providing certain administrative services to the Fund. With respect to the sub-advisory fee schedule, the Board considered representations from HFMC and the Sub-adviser that the Sub-adviser’s fees were negotiated at arm’s length. The Board also reviewed information from Lipper comparing the Fund’s contractual management fees, actual management fees and overall expense ratios relative to a group of funds selected by Lipper, in consultation with the Consultant, and a broader universe of funds selected by Lipper. The Board noted that the Fund’s contractual management fee was in the 4th quintile of its expense group, while its actual management fee was in the 3rd quintile and its total expenses (less 12b-1 and shareholder service fees) were in the 2nd quintile.
While the Board recognized that comparisons between the Fund and peer funds are imprecise, given the differing service levels and characteristics of mutual funds and the different business models and cost structures of the Advisers, the comparative information provided by Lipper assisted the Board in evaluating the reasonableness of the Fund’s management and sub-advisory fees and total operating expenses. In addition, the Board considered the analysis and recommendations of the Consultant relating to the Fund’s management and sub-advisory fees and total operating expenses.
Based on these considerations, the Board concluded that the Fund’s fees and total operating expenses, in conjunction with the information about quality of services, profitability, economies of scale, and other matters discussed, were reasonable in light of the services provided.
Economies of Scale
The Board requested and considered information regarding the Advisers’ realization of economies of scale with respect to the Fund and whether the fee levels reflect these economies of scale for the benefit of the Fund’s shareholders. The Board reviewed the breakpoints in the management fee schedule for the Fund, which reduce fee rates as Fund assets grow over time. The Board recognized that a fund with assets beyond the last breakpoint level will continue to benefit from economies of scale because additional assets are charged the lowest breakpoint fee resulting in lower overall effective management fee rates. The Board also recognized that a fee schedule that reaches a lower breakpoint quickly provides shareholders with the benefit of anticipated or potential economies of scale. The Board noted the effect of the sale and run-off of the variable annuity business on the HLS Funds.
The Board reviewed and evaluated materials from Lipper showing how management fee schedules of peer funds reflect economies of scale for the benefit of shareholders as a peer fund’s assets hypothetically increase over time. Based on information provided by HFMC, Lipper, and the Consultant, the Board recognized that there is no uniform methodology for establishing breakpoints or uniform pattern in asset levels that trigger breakpoints or the amounts of breakpoints triggered.
After considering all of the information available to it, the Board concluded that it was satisfied with the extent to which economies of scale would be shared for the benefit of the Fund’s shareholders based on currently available information and the effective advisory fees and expense ratios for the Fund at its current and reasonably anticipated asset levels. The Board noted, however, that it would continue to monitor future growth in Fund assets and the appropriateness of additional breakpoints.
| 29 |
| Hartford Growth HLS Fund |
| Approval of Investment Management and Investment Sub-Advisory Agreements (Unaudited) – (continued) |
Other Benefits
The Board considered other benefits to the Advisers and their affiliates from their relationships with the Fund, including the role of the Fund in supporting the variable life insurance and variable annuity products offered by The Hartford.
The Board reviewed information noting that HLIC, an affiliate of HFMC, receives fees for providing certain administrative services to the Fund and that HFMC receives fees for fund accounting and related services from the Fund. The Board considered information on profits to HLIC and HFMC for such services. The Board also considered that Hartford Administrative Services Company (“HASCO”), the Fund’s transfer agent and an affiliate of HFMC, receives transfer agency compensation from the Fund, and the Board reviewed information on the profitability of the Fund’s transfer agency function to HASCO. The Board considered information provided by HASCO indicating that the transfer agent fees charged by HASCO to the Fund were fair and reasonable based on publicly available information.
The Board also considered that Hartford Funds Distributors, LLC (“HFD”), an affiliate of HFMC, serves as principal underwriter of the Fund. As principal underwriter, HFD receives 12b-1 fees from the Fund. The Board also noted that certain affiliates of HFD distribute shares of the Fund and receive compensation in that connection.
The Board considered benefits to the Sub-adviser from its use of the Fund’s brokerage commissions to obtain soft dollar research, and representations from HFMC and the Sub-adviser that the Sub-adviser would not make any revenue-sharing payments or any other type of distribution payments to HFMC or its affiliates.
The Board considered the benefits to shareholders of being part of the Hartford Funds family of funds. The Board considered HFMC’s efforts to provide investors in the family with a broad range of investment styles and asset classes.
* * * *
Based upon its review of these various factors, among others, the Board concluded that it is in the best interests of the Fund and its shareholders for the Board to approve the Agreements for an additional year. In reaching this decision, the Board did not assign relative weights to the factors discussed above or deem any one or group of them to be controlling in and of themselves. In connection with their deliberations, the Independent Directors met separately in executive session on several occasions, with independent legal counsel and the Consultant, to review the relevant materials and consider their responsibilities under relevant laws and regulations.
| 30 |
| Hartford Growth HLS Fund |
| Main Risks (Unaudited) |
The main risks of investing in the Fund are described below.
Market, Selection, and Strategy Risk: The Fund’s share price may fluctuate due to market risk and/or security selections that may underperform the market or relevant benchmarks. If the sub-adviser’s investment strategy does not perform as expected, the Fund could underperform its peers or lose money. There is no guarantee the Fund will achieve its stated objective.
Growth Investing Risk: Growth investments can be volatile, and may fail to increase earnings or grow as quickly as anticipated. Growth-style investing falls in and out of favor, which may result in periods of underperformance.
Foreign Investment Risk: Foreign investments can be riskier than U.S. investments. Potential risks include currency risk that may result from unfavorable exchange rates, liquidity risk if decreased demand for a security makes it difficult to sell at the desired price, and risks that stem from substantially lower trading volume on foreign markets.
| 31 |
THIS PRIVACY POLICY IS NOT PART OF THIS REPORT
Privacy Policy and Practices of The Hartford Financial Services Group, Inc. and its Affiliates
(herein called “we, our, and us”)
This Privacy Policy applies to our United States Operations
We value your trust. We are committed to the responsible: a) management; b) use; and c) protection; of Personal Information. This notice describes how we collect, disclose, and protect Personal Information.
We collect Personal Information to: a) service your Transactions with us; and b) support our business functions.
We may obtain Personal Information from: a) You; b) your Transactions with us; and c) third parties such as a consumer-reporting agency.
Based on the type of product or service You apply for or get from us, Personal Information such as: a) your name; b) your address; c) your income; d) your payment; or e) your credit history; may be gathered from sources such as applications, Transactions, and consumer reports.
To serve You and service our business, we may share certain Personal Information. We will share Personal Information, only as allowed by law, with affiliates such as: a) our insurance companies; b) our employee agents; c) our brokerage firms; and d) our administrators.
As allowed by law, we may share Personal Financial Information with our affiliates to: a) market our products; or b) market our services; to You without providing You with an option to prevent these disclosures. | We may also share Personal Information, only as allowed by law, with unaffiliated third parties including:
When allowed by law, we may share certain Personal Financial Information with other unaffiliated third parties who assist us by performing services or functions such as:
We, and third parties we partner with, may track some of the pages You visit through the use of: a) cookies; b) pixel tagging; or c) other technologies; and currently do not process or comply with any web browser’s “do not track” signal or similar mechanism that indicates a request to disable online tracking of individual users who visit our websites or use our services.
We will not sell or share your Personal Financial Information with anyone for purposes unrelated to our business functions without offering You the opportunity to:
We only disclose Personal Health Information with:
Our employees have access to Personal Information in the course of doing their jobs, such as: |
We use manual and electronic security procedures to maintain: a) the confidentiality; and b) the integrity of; Personal Information that we have. We use these procedures to guard against unauthorized access.
Some techniques we use to protect Personal Information include: a) secured files; b) user authentication; c) encryption; d) firewall technology; and e) the use of detection software.
We are responsible for and must: a) identify information to be protected; b) provide an adequate level of protection for that data; c) grant access to protected data only to those people who must use it in the performance of their job-related duties. Employees who violate our Privacy Policy will be subject to discipline, which may include ending their employment with us.
At the start of our business relationship, we will give You a copy of our current Privacy Policy.
We will also give You a copy of our current Privacy Policy once a year if You maintain a continuing business relationship with us.
We will continue to follow our Privacy Policy regarding Personal Information even when a business relationship no longer exists between us. | As used in this Privacy Notice:
Application means your request for our product or service.
Personal Financial Information means financial information such as:
Personal Health Information means health information such as:
Personal Information means information that identifies You personally and is not otherwise available to the public. It includes:
Transaction means your business dealings with us, such as:
You means an individual who has given us Personal Information in conjunction with: |
This Privacy Policy is being provided on behalf of the following affiliates of The Hartford Financial Services Group, Inc.:
1stAGChoice, Inc.; Access CoverageCorp, Inc.; Access CoverageCorp Technologies, Inc.; American Maturity Life Insurance Company; Archway 60 R, LLC; Business Management Group, Inc.; Catalyst360, LLC; Champlain Life Reinsurance Company; DMS R, LLC; Eloy R, LLC; Ersatz Corporation; First State Insurance Company; Hartford Accident and Indemnity Company; Hartford Administrative Services Company; Hartford Casualty General Agency, Inc.; Hartford Casualty Insurance Company; Hartford-Comprehensive Employee Benefit Service Company; Hartford Equity Sales Company, Inc.; Hartford Fire General Agency, Inc.; Hartford Fire Insurance Company; Hartford Funds Management Company, LLC; Hartford Funds Management Group, Inc.; Hartford HLS Series Fund II, Inc.; Hartford Insurance Company of Illinois; Hartford Insurance Company of the Midwest; Hartford Insurance Company of the Southeast; Hartford Integrated Technologies, Inc.; Hartford International Life Reassurance Corporation; Hartford Funds Distributors, LLC; Hartford Investment Management Company; Hartford Life and Accident Insurance Company; Hartford Life and Annuity Insurance Company; Hartford Life Insurance Company; Hartford Life Private Placement, LLC; Hartford Lloyd’s Corporation; Hartford Lloyd’s Insurance Company; Hartford Mezzanine Investors I, LLC; Hartford Residual Market, L.C.C.; Hartford Retirement Services, LLC; Hartford Securities Distribution Company, Inc.; Hartford Series Fund, Inc.; Hartford Specialty Insurance Services of Texas, LLC; Hartford Strategic Investments, LLC; Hartford Underwriters Insurance Company; Hartford Technology Services Company, L.L.C.; Hartford of Texas General Agency, Inc.; Hartford Underwriters General Agency, Inc.; HARTRE Company, L.C.C.; HL Investment Advisors, LLC; HLA LLC; Horizon Management Group, LLC; HRA Brokerage Services, Inc.; Lanidex Class B, LLC; M-CAP Insurance Agency, LLC; New England Insurance Company; New England Reinsurance Corporation; Nutmeg Insurance Agency, Inc.; Nutmeg Insurance Company; Pacific Insurance Company, Limited; Planco, LLC: Property and Casualty Insurance Company of Hartford; Revere R, LLC; RVR R, LLC; Sentinel Insurance Company, Ltd.; Sunstone R, LLC; Symphony R, LLC; The Evergreen Group Incorporated; The Hartford Alternative Strategies Fund; The Hartford Mutual Funds, Inc.; The Hartford Mutual Funds II, Inc.; Trumbull Flood Management, L.L.C.; Trumbull Insurance Company; Twin City Fire Insurance Company; White River Life Reinsurance Company.
HPP Revised December 2013
HARTFORD HLS FUNDS
c/o The Hartford Wealth Management - Global Annuities
P.O. Box 14293
Lexington, KY 40512-4293
HARTFORDFUNDS
hartfordfunds.com
Hartford Series Fund, Inc. is underwritten and distributed by Hartford Funds Distributors, LLC.
Hartford Series Fund, Inc. inception dates range from 1977 to date. Hartford Series Fund, Inc. is not a subsidiary of The Hartford Financial Services Group, Inc. ("The Hartford") but is underwritten, distributed by and advised by subsidiaries of The Hartford. Investments in Hartford Series Fund, Inc. are not guaranteed by The Hartford or any other entity.
This report is submitted for the general information of the shareholders of the Funds. It is not authorized for distribution unless preceded or accompanied by a current prospectus for the Funds.
Investors should carefully consider the investment objectives, risks, charges, and expenses of Hartford Funds before investing. This and other information can be found in the prospectus and summary prospectus, which can be obtained by calling 888-843-7824 (retail) or 877-836-5854 (institutional). Investors should read them carefully before they invest.
HLSAR-G13 2-14 113541-2 Printed in U.S.A ©2013 The Hartford, Hartford, CT 06115
HARTFORDFUNDS
| HARTFORD HEALTHCARE
HLS FUND
2013 Annual Report
|
A MESSAGE FROM THE PRESIDENT
Dear Fellow Shareholders:
Thank you for investing in Hartford HLS Funds.
Market Review
U.S. equities (as represented by the S&P 500 Index) generated their strongest year since 1997 in 2013, rising 32.39% for the year. During the fourth quarter, equities rose without looking back, pushing the S&P 500 Index and the Dow Jones Industrial Average to new all-time highs. Despite previously cheering delays to quantitative-easing tapering, the stock market received an additional boost at the end of the year following the U.S. Federal Reserve’s (Fed) announcement of a $10-billion-a-month reduction in bond purchases beginning in January.
The Fed’s decision to begin tapering its bond purchases is generally considered a vote of confidence in the recovering U.S. economy. Consumer spending has stabilized, the housing market is showing steady improvement, the unemployment rate is slowly declining and economic growth clocked in at a healthy 4.1% in the third quarter. Equities have also recovered since the market low in March 2009: The S&P 500 Index has gained 173% from the market low through December 31, 2013.
Signs of improvement are also visible outside the U.S. Europe appears to have begun its own economic recovery, and emerging markets have reversed their recent lackluster performance. Fiscal policy continues to wield significant influence in today’s economy and central banks across the globe are maintaining their accommodative stances, including the appointment of Janet Yellen, who is widely expected to continue current monetary policies, to succeed Ben Bernanke as U.S. Federal Reserve chairman.
It’s important to stay abreast of domestic and international economic developments while balancing your individual investment goals. Meeting with your financial advisor on a regular basis to examine your current investment strategy can help you determine whether you are on the right track:
| • | Is your portfolio fully diversified with an appropriate mix of stocks and bonds? |
| • | Is your portfolio incorporating both domestic and international holdings to take advantage of the global economic recovery? |
| • | Are your investments still in line with your risk tolerance and investment time horizon? |
Your financial advisor can help you choose options within our fund family to navigate today’s markets with confidence.
Thank you again for investing with Hartford HLS Funds.
James Davey
President
Hartford HLS Funds
1The S&P 500 Index is a market capitalization-weighted price index composed of 500 widely held common stocks.
2The Dow Jones Industrial Average is an unmanaged, price-weighted index of 30 of the largest, most widely held stocks traded on the New York Stock Exchange.
Hartford Healthcare HLS Fund
This report is prepared for the general information of contract owners and qualified retirement plan participants. It is not an offer of contracts or of qualified retirement plans. It should not be used in connection with any offer, except in conjunction with the appropriate product prospectus which contains all pertinent information including the applicable sales, administrative and other charges.
The views expressed in the Fund’s Manager Discussion under ‘‘Why did the Fund perform this way?’’ and ‘‘What is the outlook?’’ are views of the Fund’s sub-adviser and portfolio management team through the end of the period and are subject to change based on market and other conditions. The Fund’s Manager Discussion is for informational purposes only and does not represent an offer, recommendation or solicitation to buy, hold or sell any security. The specific securities identified and described, if any, do not represent all of the securities purchased or sold and you should not assume that investments in the securities identified and discussed will be profitable.
| Hartford Healthcare HLS Fund inception 05/01/2000 |
| (sub-advised by Wellington Management Company, LLP) |
| Investment objective – Seeks long-term capital appreciation. |
Performance Overview 12/31/03 - 12/31/13

The chart above represents the hypothetical growth of a $10,000 investment in Class IA. Growth results in classes other than Class IA will vary from what is seen above due to differences in the expenses charged to those share classes.
Average Annual Total Returns (as of 12/31/13)
| 1 Year | 5 Years | 10 Years | ||||
| Healthcare IA | 51.84% | 21.18% | 11.27% | |||
| Healthcare IB | 51.50% | 20.88% | 11.00% | |||
| S&P 500 Index | 32.39% | 17.94% | 7.41% | |||
| S&P North American Health Care Sector Index | 43.70% | 20.08% | 10.00% |
PERFORMANCE DATA QUOTED REPRESENTS PAST PERFORMANCE AND DOES NOT GUARANTEE FUTURE RESULTS. The investment return and principal value of the investment will fluctuate so that investors’ shares, when redeemed, may be worth more or less than their original cost. Current performance may be lower or higher than the performance data quoted. To obtain performance data current to the most recent month-end, please visit our website at www.hartfordfunds.com.
Total returns presented above were calculated using the Fund’s net asset value available to shareholders for sale or redemption of Fund shares on December 31, 2013, which may exclude investment transactions as of this date. All share class returns assume the reinvestment of all distributions at net asset value and the deduction of all fund expenses.
S&P 500 Index is a market capitalization-weighted price index composed of 500 widely held common stocks.
S&P North American Health Care Sector Index is a modified capitalization-weighted index based on United States headquartered health care companies. Stocks in the index are weighted such that each stock is no more than 7.5% of the market capitalization as of the most recent reconstitution date. The companies included in the index must be common stocks and be traded on the NYSE MKT LLC, Nasdaq or the New York Stock Exchange and meet certain established market capitalization levels.
You cannot invest directly in an index.
As of the Fund's current prospectus dated May 1, 2013, the total annual operating expense ratios for Class IA and Class IB were 0.91% and 1.16%, respectively. Actual expenses may be higher. Please see the accompanying Financial Highlights for expense ratios for the year ended December 31, 2013.
The chart and table do not reflect the deductions of taxes, sales charges or other fees which may be applied at the variable life insurance, variable annuity or qualified retirement plan product level. Any such additional sales charges or other fees or expenses would lower the contract’s or plan’s performance.
All investments are subject to risk including the possible loss of principal. For a discussion of the Fund’s risks, please see the Main Risks section of this report. For more detailed information on the risks associated with an investment in the Fund, please see the prospectus.
| 2 |
| Hartford Healthcare HLS Fund |
| Manager Discussion |
| December 31, 2013 (Unaudited) |
| Portfolio Managers | |||
| Ann C. Gallo | Jean M. Hynes, CFA | Robert L. Deresiewicz | Kirk J. Mayer, CFA |
Senior Vice President and Global Industry Analyst | Senior Vice President and Global Industry Analyst | Senior Vice President and Global Industry Analyst | Senior Vice President and Global Industry Analyst |
How did the Fund perform?
The Class IA shares of the Hartford Healthcare HLS Fund returned 51.84% for the twelve-month period ended December 31, 2013, outperforming the Fund’s benchmark, the S&P North American Health Care Sector Index, which returned 43.70% for the same period. The Fund also outperformed the 46.68% average return of the Variable Products-Underlying Funds Lipper Global Health and Biotechnology peer group, a group of funds with investment strategies similar to those of the Fund.
Why did the Fund perform this way?
Health Care stocks (+44%) outperformed both the broader U.S. market (+32%) and the global equity market (+27%) during the period, as measured by the S&P North American Health Care Sector, S&P 500, and the MSCI World Indices, respectively. Within the S&P North American Health Care Sector Index, all four sub-sectors posted positive returns. Specialty Pharmaceuticals/Biotechnology (+69%) gained the most while Health Services rose 42%, Major Pharmaceuticals rose 34%, and Medical Technology rose 31%.
The Fund outperformed its benchmark primarily due to strong security selection. Positive stock selection in Health Services and Medical Technology was the primary driver of the Fund’s relative outperformance. A modest cash position detracted slightly from relative performance in an upward trending market.
Pfizer (Specialty Pharmaceuticals), Alkermes (Specialty Pharmaceuticals), and Anacor (Specialty Pharmaceuticals) were the biggest contributors to benchmark-relative results over the period. Shares of Pfizer, a research-based, global biopharmaceutical company, underperformed during the period as investors have grown concerned that new product launches may not be enough to offset slowing sales from several of the company’s blockbuster drugs. We didn’t hold benchmark-component Pfizer, which contributed to benchmark-relative performance during the period. Shares of drug developer Alkermes rose after the U.S. Food and Drug Administration’s (FDA) recent comments on abuse-deterrent opioids, which is expected to bode positively for Alkermes. Alkermes is using novel technologies to develop analgesics that are more abuse resistant than what is currently available in the market. Shares of Anacor, a U.S.-based biopharmaceutical company, increased due to its two lead compounds in development. Also, Anacor’s most advanced drug, a topical toe nail antifungal, was submitted for approval this quarter and offers both efficacy and safety advantages over the current standard of care. Top contributors to absolute performance during the period also included Gilead Sciences (Specialty Pharmaceuticals), Bristol-Myers (Specialty Pharmaceuticals), and McKesson (Health Services).
Celgene (Specialty Pharmaceuticals), Orthofix International (Medical Technology), and Teva Pharmaceuticals (Specialty Pharmaceuticals) detracted from benchmark-relative performance. Not owning global biotechnology company Celgene hurt relative performance as the stock is a large component of the benchmark and had strong performance during the period due to positive earnings results and long-term guidance that was ahead of expectations. Medical device company Orthofix International saw its shares trade lower following the delayed release of its second quarter earnings results due to an investigation into revenue recognition policies. Shares of Teva Pharmaceuticals, an Israel-based pharmaceutical company, underperformed after the unexpected announcement that CEO Jeremy Levin would step down. Top detractors from absolute performance during the period also included Rigel Pharmaceutical (Specialty Pharmaceuticals) and Infinity Pharmaceutical (Specialty Pharmaceuticals).
What is the outlook?
We continue to find attractive investments within the Pharmaceutical and Biotechnology sectors, across geographies and market caps, despite the recent strength. While valuations have risen over the past two years, we believe the sector should continue to be driven by biopharmaceutical innovation that is occurring at an accelerating pace and a supportive FDA posture that is leading to more timely drug approvals. These two trends, combined with cost management, growth from emerging markets, and ancillary businesses like animal health and over the counter drugs, should allow for the industry to grow through the decade. We believe that Japanese pharmaceutical companies remain attractive given their strong balance sheets and the value of their pipelines relative to the companies’ current market capitalizations. Among smaller biotechnology names, we believe that select opportunities with great upside remain, based on the promise of innovative products to address important unmet medical needs.
Within the Medical Technology sector, we continue to look for companies with what we consider to be underappreciated franchises or promising research and development (R&D) projects. We continue to believe that cardiovascular disease
| 3 |
| Hartford Healthcare HLS Fund |
| Manager Discussion – (continued) |
| December 31, 2013 (Unaudited) |
represents one of the strongest areas for growth, with a large, under-penetrated market, particularly for atrial fibrillation procedures, we think that longer-term prospects for the industry remain solid, as procedure volumes return to normal after the slowdown in 2010-2011 and emerging markets become more significant growth drivers.
Within Health Care Services, relative to recent years, our holdings are more diversified among the various subsectors. While uncertainty regarding the implementation of the Affordable Care Act (ACA) exchanges is likely overhang the group in the near/intermediate term, ultimately we believe that the impact on the Health Maintenance Organization (HMO) will not be as bad as feared since these companies are best positioned to address cost issues over the longer term. Going forward we expect the HMOs to benefit from delays in implementation of the more onerous provisions of the ACA and more discretion shifting to the states from the federal government. While cost growth trends have stopped decelerating, the current rate of growth remains below historic levels and is in line with expectations. We believe the uptick will remain muted as employers and individuals look to keep health care spending under control.
We also consider drug distributors and drug stores attractive, as we believe they should continue to benefit from the ongoing conversion of approximately U.S. $100 billion of branded pharmaceuticals to generics over the next several years. Internationally, we see a number of attractive opportunities in emerging market stocks. In addition to the burgeoning middle class, we believe many emerging market countries are attempting to increase domestic spending on health care and are increasingly looking to the private sector to achieve this objective.
Looking ahead, the bar has been raised for companies seeking reimbursement for health care products and services in the U.S. and across the globe. We believe that success will accrue only to those companies able to offer a demonstrable improvement over current standards of care, or alternatively, to those companies able to offer an equivalent level of care but at lower cost. This is one of the key tenets upon which we have structured our portfolio.
Diversification by Sector
as of December 31, 2013
| Sector | Percentage of Net Assets | |||
| Equity Securities | ||||
| Consumer Staples | 3.3 | % | ||
| Health Care | 91.7 | |||
| Industrials | 1.5 | |||
| Total | 96.5 | % | ||
| Short-Term Investments | 3.5 | |||
| Other Assets and Liabilities | 0.0 | |||
| Total | 100.0 | % | ||
A sector may be comprised of several industries. For Fund compliance purposes, the Fund may not use the same classification system and these sector classifications are used for reporting ease.
| 4 |
| Hartford Healthcare HLS Fund |
| Schedule of Investments |
| December 31, 2013 |
| (000’s Omitted) |
| Shares or Principal Amount | Market Value ╪ | |||||||
COMMON STOCKS - 96.5% | ||||||||
| Biotechnology - 25.1% | ||||||||
| 25 | Acorda Therapeutics, Inc. ● | $ | 715 | |||||
| 51 | Algeta ASA ● | 3,001 | ||||||
| 177 | Alkermes plc ● | 7,204 | ||||||
| 53 | Alnylam Pharmaceuticals, Inc. ● | 3,435 | ||||||
| 175 | Anacor Pharmaceuticals, Inc. ● | 2,941 | ||||||
| 426 | Arena Pharmaceuticals, Inc. ● | 2,492 | ||||||
| 270 | BioCryst Pharmaceuticals, Inc. ● | 2,051 | ||||||
| 10 | Biogen Idec, Inc. ● | 2,870 | ||||||
| 34 | Cubist Pharmaceuticals, Inc. ● | 2,337 | ||||||
| 359 | Exelixis, Inc. ● | 2,202 | ||||||
| 230 | Gilead Sciences, Inc. ● | 17,256 | ||||||
| 72 | Incyte Corp. ● | 3,646 | ||||||
| 58 | Innate Pharma S.A. ● | 394 | ||||||
| 102 | Ironwood Pharmaceuticals, Inc. ● | 1,182 | ||||||
| 127 | NPS Pharmaceuticals, Inc. ● | 3,847 | ||||||
| 12 | Puma Biotechnology, Inc. ● | 1,292 | ||||||
| 32 | Regeneron Pharmaceuticals, Inc. ● | 8,739 | ||||||
| 262 | Rigel Pharmaceuticals, Inc. ● | 746 | ||||||
| 49 | Seattle Genetics, Inc. ● | 1,939 | ||||||
| 96 | Tesaro, Inc. ● | 2,714 | ||||||
| 119 | Tetraphase Pharmaceuticals, Inc. ● | 1,605 | ||||||
| 38 | Vertex Pharmaceuticals, Inc. ● | 2,838 | ||||||
| 75,446 | ||||||||
| Drug Retail - 3.3% | ||||||||
| 78 | CVS Caremark Corp. | 5,585 | ||||||
| 75 | Walgreen Co. | 4,294 | ||||||
| 9,879 | ||||||||
| Health Care Distributors - 5.3% | ||||||||
| 85 | Cardinal Health, Inc. | 5,681 | ||||||
| 64 | McKesson Corp. | 10,255 | ||||||
| 15,936 | ||||||||
| Health Care Equipment - 17.2% | ||||||||
| 132 | Abbott Laboratories | 5,052 | ||||||
| 418 | Boston Scientific Corp. ● | 5,022 | ||||||
| 130 | Covidien plc | 8,837 | ||||||
| 122 | Globus Medical, Inc. ● | 2,453 | ||||||
| 24 | Heartware International, Inc. ● | 2,265 | ||||||
| 87 | Hologic, Inc. ● | 1,941 | ||||||
| 121 | Medtronic, Inc. | 6,933 | ||||||
| 99 | Orthofix International N.V. ● | 2,250 | ||||||
| 79 | St. Jude Medical, Inc. | 4,870 | ||||||
| 61 | Stryker Corp. | 4,614 | ||||||
| 131 | Tornier N.V. ● | 2,452 | ||||||
| 95 | Volcano Corp. ● | 2,067 | ||||||
| 32 | Zimmer Holdings, Inc. | 3,023 | ||||||
| 51,779 | ||||||||
| Health Care Facilities - 4.1% | ||||||||
| 36 | Community Health Systems, Inc. ● | 1,422 | ||||||
| 126 | HCA Holdings, Inc. ● | 6,010 | ||||||
| 237 | NMC Health plc | 1,720 | ||||||
| 1,207 | Phoenix Healthcare Group Co., Ltd. ● | 1,932 | ||||||
| 18 | Universal Health Services, Inc. Class B | 1,438 | ||||||
| 12,522 | ||||||||
| Health Care Services - 1.0% | ||||||||
| 95 | Al Noor Hospitals Group ● | 1,411 | ||||||
| 46 | Envision Healthcare Holdings ● | 1,634 | ||||||
| 3,045 | ||||||||
| Health Care Supplies - 0.6% | ||||||||
| 38 | Dentsply International, Inc. | 1,828 | ||||||
| Health Care Technology - 0.2% | ||||||||
| 39 | Allscripts Healthcare Solutions, Inc. ● | 600 | ||||||
| Life Sciences Tools and Services - 2.2% | ||||||||
| 47 | Agilent Technologies, Inc. | 2,659 | ||||||
| 25 | Covance, Inc. ● | 2,230 | ||||||
| 25 | MorphoSys AG ● | 1,921 | ||||||
| 6,810 | ||||||||
| Managed Health Care - 8.2% | ||||||||
| 87 | Aetna, Inc. | 5,943 | ||||||
| 68 | CIGNA Corp. | 5,910 | ||||||
| 73 | Qualicorp S.A. ● | 693 | ||||||
| 160 | UnitedHealth Group, Inc. | 12,030 | ||||||
| 24,576 | ||||||||
| Pharmaceuticals - 27.8% | ||||||||
| 35 | Actavis plc ● | 5,927 | ||||||
| 94 | Aerie Pharmaceuticals, Inc. ● | 1,695 | ||||||
| 40 | Almirall S.A. | 655 | ||||||
| 27 | Astellas Pharma, Inc. | 1,585 | ||||||
| 42 | AstraZeneca plc ADR | 2,488 | ||||||
| 347 | Bristol-Myers Squibb Co. | 18,417 | ||||||
| 78 | Cadence Pharmaceuticals, Inc. ● | 709 | ||||||
| 132 | Daiichi Sankyo Co., Ltd. | 2,412 | ||||||
| 36 | Dr. Reddy's Laboratories Ltd. ADR | 1,477 | ||||||
| 52 | Eisai Co., Ltd. | 2,006 | ||||||
| 99 | Eli Lilly & Co. | 5,033 | ||||||
| 142 | Forest Laboratories, Inc. ● | 8,541 | ||||||
| 24 | H. Lundbeck A/S | 600 | ||||||
| 36 | Johnson & Johnson | 3,340 | ||||||
| 93 | Medicines Co. ● | 3,608 | ||||||
| 105 | Merck & Co., Inc. | 5,267 | ||||||
| 91 | Mylan, Inc. ● | 3,943 | ||||||
| 17 | Ono Pharmaceutical Co., Ltd. | 1,446 | ||||||
| 11 | Salix Pharmaceuticals Ltd. ● | 952 | ||||||
| 199 | Shionogi & Co., Ltd. | 4,313 | ||||||
| 131 | Teva Pharmaceutical Industries Ltd. ADR | 5,250 | ||||||
| 43 | UCB S.A. | 3,207 | ||||||
| 130 | Xenoport, Inc. ● | 745 | ||||||
| 83,616 | ||||||||
| Research and Consulting Services - 1.5% | ||||||||
| 99 | Quintiles Transnational Holdings ● | 4,564 | ||||||
| Total common stocks | ||||||||
| (cost $191,601) | $ | 290,601 | ||||||
| Total long-term investments | ||||||||
| (cost $191,601) | $ | 290,601 | ||||||
| SHORT-TERM INVESTMENTS - 3.5% | ||||||||
| Repurchase Agreements - 3.5% | ||||||||
| Bank of America Merrill Lynch TriParty Repurchase Agreement (maturing on 01/02/2014 in the amount of $519, collateralized by GNMA 4.00%, 2043, value of $530) | ||||||||
| $ | 519 | 0.005%, 12/31/2013 | $ | 519 | ||||
The accompanying notes are an integral part of these financial statements.
| 5 |
| Hartford Healthcare HLS Fund |
| Schedule of Investments – (continued) |
| December 31, 2013 |
| (000’s Omitted) |
| Shares or Principal Amount | Market Value ╪ | |||||||||||
| SHORT-TERM INVESTMENTS - 3.5% - (continued) | ||||||||||||
| Repurchase Agreements - 3.5% - (continued) | ||||||||||||
| Bank of Montreal TriParty Repurchase Agreement (maturing on 01/02/2014 in the amount of $499, collateralized by FNMA 1.58% - 4.50%, 2020 - 2043, U.S. Treasury Note 0.25% - 4.00%, 2015 - 2020, value of $509) | ||||||||||||
| $ | 499 | 0.01%, 12/31/2013 | $ | 499 | ||||||||
| Bank of Montreal TriParty Repurchase Agreement (maturing on 01/02/2014 in the amount of $1,767, collateralized by FHLMC 3.00% - 5.00%, 2019 - 2043, FNMA 0.76% - 6.00%, 2016 - 2043, GNMA 1.50% - 5.25%, 2028 - 2043, value of $1,803) | ||||||||||||
| 1,767 | 0.02%, 12/31/2013 | 1,767 | ||||||||||
| Barclays Capital TriParty Repurchase Agreement (maturing on 01/02/2014 in the amount of $1,594, collateralized by U.S. Treasury Note 0.50% - 2.25%, 2017, value of $1,626) | ||||||||||||
| 1,594 | 0.01%, 12/31/2013 | 1,594 | ||||||||||
| Citigroup Global Markets, Inc. TriParty Repurchase Agreement (maturing on 01/02/2014 in the amount of $2,868, collateralized by U.S. Treasury Bond 3.88% - 8.13%, 2021 - 2040, U.S. Treasury Note 0.25% - 3.38%, 2014 - 2020, value of $2,925) | ||||||||||||
| 2,868 | 0.01%, 12/31/2013 | 2,868 | ||||||||||
| RBS Securities, Inc. TriParty Repurchase Agreement (maturing on 01/02/2014 in the amount of $932, collateralized by U.S. Treasury Note 0.25% - 1.00%, 2015 - 2017, value of $950) | ||||||||||||
| 932 | 0.01%, 12/31/2013 | 932 | ||||||||||
| TD Securities TriParty Repurchase Agreement (maturing on 01/02/2014 in the amount of $2,237, collateralized by FFCB 0.20% - 0.50%, 2015 - 2016, FHLMC 0.38% - 5.25%, 2014 - 2042, FNMA 0.50% - 7.13%, 2014 - 2043, value of $2,282) | ||||||||||||
| 2,237 | 0.01%, 12/31/2013 | 2,237 | ||||||||||
| UBS Securities, Inc. Repurchase Agreement (maturing on 01/02/2014 in the amount of $19, collateralized by U.S. Treasury Note 2.13%, 2015, value of $20) | ||||||||||||
| 19 | 0.01%, 12/31/2013 | 19 | ||||||||||
| 10,435 | ||||||||||||
| Total short-term investments | ||||||||||||
| (cost $10,435) | $ | 10,435 | ||||||||||
| Total investments | ||||||||||||
| (cost $202,036) ▲ | 100.0 | % | $ | 301,036 | ||||||||
| Other assets and liabilities | — | % | (130 | ) | ||||||||
| Total net assets | 100.0 | % | $ | 300,906 | ||||||||
The accompanying notes are an integral part of these financial statements.
| 6 |
| Note: | Percentage of investments as shown is the ratio of the total market value to total net assets. |
Prices of foreign equities that are principally traded on certain foreign markets may be adjusted daily pursuant to a fair value pricing service approved by the Board of Directors in order to reflect an adjustment for factors occurring after the close of certain foreign markets but before the close of the New York Stock Exchange.
| ▲ | At December 31, 2013, the cost of securities for federal income tax purposes was $203,553 and the aggregate gross unrealized appreciation and depreciation based on that cost were: |
| Unrealized Appreciation | $ | 102,980 | ||
| Unrealized Depreciation | (5,497 | ) | ||
| Net Unrealized Appreciation | $ | 97,483 |
| ● | Non-income producing. |
Foreign Currency Contracts Outstanding at December 31, 2013
| Currency | Buy / Sell | Delivery Date | Counterparty | Contract Amount | Market Value ╪ | Unrealized Appreciation/ (Depreciation) | ||||||||||||
| JPY | Sell | 03/20/2014 | DEUT | $ | 5,238 | $ | 5,122 | $ | 116 | |||||||||
| ╪ | See Significant Accounting Policies of accompanying Notes to Financial Statements regarding valuation of securities. |
| GLOSSARY: (abbreviations used in preceding Schedule of Investments) | ||
| Counterparty Abbreviations: | ||
| DEUT | Deutsche Bank Securities, Inc. | |
| Currency Abbreviations: | ||
| JPY | Japanese Yen | |
| Other Abbreviations: | ||
| ADR | American Depositary Receipt | |
| FFCB | Federal Farm Credit Bank | |
| FHLMC | Federal Home Loan Mortgage Corp. | |
| FNMA | Federal National Mortgage Association | |
| GNMA | Government National Mortgage Association | |
The accompanying notes are an integral part of these financial statements.
| 7 |
| Hartford Healthcare HLS Fund |
| Investment Valuation Hierarchy Level Summary |
| December 31, 2013 |
| (000’s Omitted) |
| Total | Level 1 ♦ | Level 2 ♦ | Level 3 | |||||||||||||
| Assets: | ||||||||||||||||
| Common Stocks ‡ | $ | 290,601 | $ | 272,662 | $ | 17,939 | $ | – | ||||||||
| Short-Term Investments | 10,435 | – | 10,435 | – | ||||||||||||
| Total | $ | 301,036 | $ | 272,662 | $ | 28,374 | $ | – | ||||||||
| Foreign Currency Contracts * | 116 | – | 116 | – | ||||||||||||
| Total | $ | 116 | $ | – | $ | 116 | $ | – | ||||||||
| ♦ | For the year ended December 31, 2013, investments valued at $660 were transferred from Level 1 to Level 2, and investments valued at $1,893 were transferred from Level 2 to Level 1. Investments are transferred between Level 1 and Level 2 for a variety of reasons including, but not limited to: |
| 1) | Foreign equities for which a fair value price is more representative of exit value than the local market close (transfer into Level 2). Foreign equities for which the local market close is more representative of exit value (transfer into Level 1). |
| 2) | U.S. Treasury securities that no longer represent the most recent issue (transfer into Level 2). |
| 3) | Equity investments with no observable trading but a bid or close price is used (transfer into Level 2). Equity investments using observable quoted prices in an active market (transfer into Level 1). |
| ‡ | The Fund has all or primarily all of the equity securities categorized in a particular level. Refer to the Schedule of Investments for further industry breakout. |
| * | Derivative instruments (excluding purchased and written options, if applicable) are valued at the unrealized appreciation/depreciation on the investments. |
| Note: | For purposes of reporting transfers between different hierarchy levels, both transfers in and out of each level, as applicable, are shown as if they occurred at the beginning of the period. |
The accompanying notes are an integral part of these financial statements.
| 8 |
| Hartford Healthcare HLS Fund |
| Statement of Assets and Liabilities |
| December 31, 2013 |
| (000’s Omitted) |
| Assets: | ||||
| Investments in securities, at market value (cost $202,036) | $ | 301,036 | ||
| Cash | — | |||
| Foreign currency on deposit with custodian (cost $—) | — | |||
| Unrealized appreciation on foreign currency contracts | 116 | |||
| Receivables: | ||||
| Fund shares sold | 210 | |||
| Dividends and interest | 311 | |||
| Total assets | 301,673 | |||
| Liabilities: | ||||
| Payables: | ||||
| Investment securities purchased | 299 | |||
| Fund shares redeemed | 387 | |||
| Investment management fees | 55 | |||
| Distribution fees | 3 | |||
| Accrued expenses | 23 | |||
| Total liabilities | 767 | |||
| Net assets | $ | 300,906 | ||
| Summary of Net Assets: | ||||
| Capital stock and paid-in-capital | $ | 176,666 | ||
| Undistributed net investment income | 268 | |||
| Accumulated net realized gain | 24,855 | |||
| Unrealized appreciation of investments and the translations of assets and liabilities denominated in foreign currency | 99,117 | |||
| Net assets | $ | 300,906 | ||
| Shares authorized | 800,000 | |||
| Par value | $ | 0.001 | ||
| Class IA: Net asset value per share | $ | 25.67 | ||
| Shares outstanding | 9,492 | |||
| Net assets | $ | 243,719 | ||
| Class IB: Net asset value per share | $ | 25.07 | ||
| Shares outstanding | 2,281 | |||
| Net assets | $ | 57,187 |
The accompanying notes are an integral part of these financial statements.
| 9 |
| Hartford Healthcare HLS Fund |
| Statement of Operations |
| For the Year Ended December 31, 2013 |
| (000’s Omitted) |
| Investment Income: | ||||
| Dividends | $ | 2,758 | ||
| Interest | 3 | |||
| Less: Foreign tax withheld | (57 | ) | ||
| Total investment income, net | 2,704 | |||
| Expenses: | ||||
| Investment management fees | 2,124 | |||
| Transfer agent fees | 5 | |||
| Distribution fees - Class IB | 130 | |||
| Custodian fees | 5 | |||
| Accounting services fees | 25 | |||
| Board of Directors' fees | 7 | |||
| Audit fees | 13 | |||
| Other expenses | 62 | |||
| Total expenses (before fees paid indirectly) | 2,371 | |||
| Commission recapture | (6 | ) | ||
| Total fees paid indirectly | (6 | ) | ||
| Total expenses, net | 2,365 | |||
| Net Investment Income | 339 | |||
| Net Realized Gain on Investments and Foreign Currency Transactions: | ||||
| Net realized gain on investments | 25,087 | |||
| Net realized gain on foreign currency contracts | 1,520 | |||
| Net realized loss on other foreign currency transactions | (12 | ) | ||
| Net Realized Gain on Investments and Foreign Currency Transactions | 26,595 | |||
| Net Changes in Unrealized Appreciation of Investments and Foreign Currency Transactions: | ||||
| Net unrealized appreciation of investments | 75,533 | |||
| Net unrealized depreciation of foreign currency contracts | (489 | ) | ||
| Net unrealized appreciation on translation of other assets and liabilities in foreign currencies | 1 | |||
| Net Changes in Unrealized Appreciation of Investments and Foreign Currency Transactions | 75,045 | |||
| Net Gain on Investments and Foreign Currency Transactions | 101,640 | |||
| Net Increase in Net Assets Resulting from Operations | $ | 101,979 |
The accompanying notes are an integral part of these financial statements.
| 10 |
| Hartford Healthcare HLS Fund |
| Statement of Changes in Net Assets |
| (000’s Omitted) |
| For the Year Ended December 31, 2013 | For the Year Ended December 31, 2012 | |||||||
| Operations: | ||||||||
| Net investment income | $ | 339 | $ | 1,264 | ||||
| Net realized gain on investments and foreign currency transactions | 26,595 | 23,084 | ||||||
| Net unrealized appreciation of investments and foreign currency transactions | 75,045 | 12,872 | ||||||
| Net Increase in Net Assets Resulting from Operations | 101,979 | 37,220 | ||||||
| Distributions to Shareholders: | ||||||||
| From net investment income | ||||||||
| Class IA | (1,076 | ) | (586 | ) | ||||
| Class IB | (150 | ) | (64 | ) | ||||
| Total from net investment income | (1,226 | ) | (650 | ) | ||||
| From net realized gain on investments | ||||||||
| Class IA | (13,067 | ) | — | |||||
| Class IB | (3,368 | ) | — | |||||
| Total from net realized gain on investments | (16,435 | ) | — | |||||
| Total distributions | (17,661 | ) | (650 | ) | ||||
| Capital Share Transactions: | ||||||||
| Class IA | ||||||||
| Sold | 61,195 | 27,494 | ||||||
| Issued on reinvestment of distributions | 14,143 | 586 | ||||||
| Redeemed | (47,935 | ) | (42,507 | ) | ||||
| Total capital share transactions | 27,403 | (14,427 | ) | |||||
| Class IB | ||||||||
| Sold | 9,853 | 7,528 | ||||||
| Issued on reinvestment of distributions | 3,518 | 64 | ||||||
| Redeemed | (19,293 | ) | (20,649 | ) | ||||
| Total capital share transactions | (5,922 | ) | (13,057 | ) | ||||
| Net increase (decrease) from capital share transactions | 21,481 | (27,484 | ) | |||||
| Net Increase in Net Assets | 105,799 | 9,086 | ||||||
| Net Assets: | ||||||||
| Beginning of period | 195,107 | 186,021 | ||||||
| End of period | $ | 300,906 | $ | 195,107 | ||||
| Undistributed (distribution in excess of) | ||||||||
| net investment income | $ | 268 | $ | 1,173 | ||||
| Shares: | ||||||||
| Class IA | ||||||||
| Sold | 2,741 | 1,592 | ||||||
| Issued on reinvestment of distributions | 630 | 34 | ||||||
| Redeemed | (2,152 | ) | (2,450 | ) | ||||
| Total share activity | 1,219 | (824 | ) | |||||
| Class IB | ||||||||
| Sold | 457 | 452 | ||||||
| Issued on reinvestment of distributions | 161 | 4 | ||||||
| Redeemed | (895 | ) | (1,218 | ) | ||||
| Total share activity | (277 | ) | (762 | ) | ||||
The accompanying notes are an integral part of these financial statements.
| 11 |
| Hartford Healthcare HLS Fund |
| Notes to Financial Statements |
| December 31, 2013 |
| (000’s Omitted) |
| 1. | Organization: |
Hartford Healthcare HLS Fund (the “Fund”) serves as an underlying investment option for certain variable annuity and variable life insurance separate accounts of Hartford Life Insurance Company (“HLIC”) and its affiliates and certain qualified retirement plans. The Fund may also serve as an underlying investment option for certain variable annuity and variable life separate accounts of other insurance companies. Owners of variable annuity contracts and policyholders of variable life insurance contracts may choose the funds permitted in the variable insurance contract prospectus. In addition, participants in certain qualified retirement plans may choose the Fund if permitted by their plans.
Hartford Series Fund, Inc. (the “Company”) is an open-end registered management investment company comprised of thirty portfolios. Financial statements for the Fund, a series of the Company, are included in this report.
The Company is organized under the laws of the State of Maryland and is registered with the Securities and Exchange Commission (“SEC”) under the Investment Company Act of 1940, as amended (“1940 Act”). The Fund is a diversified open-end management investment company.
The Fund is divided into Class IA and Class IB shares. Each class is offered at the per share net asset value (“NAV”) without a sales charge and is subject to the same expenses, except that the Class IB shares are subject to distribution and service fees charged pursuant to a Distribution Plan adopted in accordance with Rule 12b-1 under the 1940 Act.
| 2. | Significant Accounting Policies: |
The following is a summary of significant accounting policies of the Fund in the preparation of its financial statements, which are in accordance with United States Generally Accepted Accounting Principles (“U.S. GAAP”). The preparation of financial statements in accordance with U.S. GAAP may require management to make estimates and assumptions that affect the reported amounts of assets and liabilities and disclosure of contingent assets and liabilities at the date of the financial statements and the reported amounts of increases and decreases in net assets from operations during the reporting period. Actual results could differ from those estimates.
| a) | Determination of Net Asset Value – The NAV of each class of the Fund’s shares is determined as of the close of regular trading (normally 4:00 p.m. Eastern Time) (the “NYSE Close”) on each day that the New York Stock Exchange (the “Exchange”) is open (“Valuation Date”). Information that becomes known to the Fund after the NAV has been calculated on a particular day will not generally be used to retroactively adjust the NAV determined earlier that day. |
| b) | Investment Valuation and Fair Value Measurements – For purposes of calculating the NAV, portfolio investments and other assets held by the Fund's portfolio for which market quotes are readily available are valued at market value. Market value is generally determined on the basis of last reported sales prices or official close price. If no sales are reported, market value is based on quotes obtained from a quotation reporting system, established market makers, or independent pricing services. If market prices are not readily available or are deemed unreliable, the Fund will use the fair value of the investment as determined in good faith under policies and procedures established by and under the supervision of the Company’s Board of Directors. Market quotes are considered not readily available where there is an absence of current or reliable market-based data (e.g., trade information or indicative market quotes), including where events occur after the close of the relevant market, but prior to the NYSE Close, that materially affect the values of the Fund’s portfolio investments or assets. In addition, market quotes are considered not readily available when, due to extraordinary circumstances, the exchanges or markets on which the investments trade do not open for trading for the entire day and no other market prices are available. In addition, prices of foreign equities that are principally traded on certain foreign markets may be adjusted daily pursuant to a fair value pricing service approved by the Board of Directors in order to reflect an adjustment for the factors occurring after the close of certain foreign markets but before the NYSE Close. Investments that are primarily traded on foreign markets may trade on days that are not business days of the Fund. The value of the foreign investments in which the Fund invests may change on days when a shareholder will not be able to purchase or redeem shares of the Fund. Fair value pricing is subjective in nature and the use of fair value pricing by the |
| 12 |
Fund may cause the NAV of its shares to differ significantly from the NAV that would have been calculated using market prices at the close of the exchange on which a portfolio investment is primarily traded. There can be no assurance that the Fund could obtain the fair market value assigned to an investment if the Fund were to sell the investment at approximately the time at which the Fund determines its NAV.
Investments valued in currencies other than U.S. dollars are converted to U.S. dollars using exchange rates obtained from independent pricing services for calculation of the NAV. As a result, the NAV of the Fund’s shares may be affected by changes in the value of currencies in relation to the U.S. dollar. The value of investments traded in markets outside the United States or denominated in currencies other than the U.S. dollar may be affected significantly on a day that the NYSE is closed and the market value may change on days when an investor is not able to purchase, redeem or exchange shares of the Fund.
Foreign currency contracts represent agreements to exchange currencies on specific future dates at predetermined rates. Foreign currency contracts are valued using foreign currency exchange rates and forward rates as provided by an independent pricing service on the Valuation Date.
Financial instruments for which prices are not available from an independent pricing service may be valued using market quotations obtained from one or more dealers that make markets in the respective financial instrument in accordance with procedures established by the Company’s Board of Directors.
U.S. GAAP defines fair value as the price that the Fund would receive to sell an asset or pay to transfer a liability in an orderly transaction between market participants. The U.S. GAAP fair value measurement standards require disclosure of a fair value hierarchy for each major category of assets and liabilities. Various inputs are used in determining the fair value of the Fund’s investments. These inputs are summarized into three broad hierarchy levels. This hierarchy is based on whether the valuation inputs are observable or unobservable. These levels are:
| · | Level 1 – Quoted prices in active markets for identical investments. Level 1 may include exchange traded instruments, such as domestic equities, some foreign equities, options, futures, mutual funds, exchange traded funds, rights and warrants. |
| · | Level 2 – Observable inputs other than Level 1 prices, such as quoted prices for similar investments; quoted prices in markets that are not active; or other inputs that are observable or can be corroborated by observable market data. Level 2 may include debt investments that are traded less frequently than exchange traded instruments and which are valued using independent pricing services; foreign equities, which are principally traded on certain foreign markets and are adjusted daily pursuant to a fair value pricing service in order to reflect an adjustment for the factors occurring after the close of certain foreign markets but before the NYSE Close; senior floating rate interests, which are valued using an aggregate of dealer bids; short-term investments, which are valued at amortized cost; and swaps, which are valued based upon the terms of each swap contract. |
| · | Level 3 – Significant unobservable inputs that are supported by limited or no market activity. Level 3 may include financial instruments whose values are determined using indicative market quotes or require significant management judgment or estimation. These unobservable valuation inputs may include estimates for current yields, maturity/duration, prepayment speed, and indicative market quotes for comparable investments along with other assumptions relating to credit quality, collateral value, complexity of the investment structure, general market conditions and liquidity. This category may include investments where trading has been halted or there are certain restrictions on trading. While these investments are priced using unobservable inputs, the valuation of these investments reflects the best available data and management believes the prices are a reasonable representation of exit price. |
The Board of Directors of the Company generally reviews and approves the “Procedures for Valuation of Portfolio Securities” on an annual basis. These procedures define how investments are to be valued, including the formation and activities of a Valuation Committee. The Valuation Committee is responsible for determining in good faith the fair value of investments when the value cannot be obtained from primary pricing services or
| 13 |
| Hartford Healthcare HLS Fund |
| Notes to Financial Statements – (continued) |
| December 31, 2013 |
| (000’s Omitted) |
alternative sources or if the valuation of an investment as provided by the primary pricing service or alternative source is believed not to reflect the investment’s fair value as of the Valuation Date. Voting members of the Valuation Committee include the Fund’s Treasurer or designee and a Vice President of the investment manager or designee. An Assistant Vice President of the Fund with legal expertise or designee is also included on the Valuation Committee as a non-voting advisory member. In addition, the Fund’s Chief Compliance Officer shall designate a member of the compliance group to attend Valuation Committee meetings as a non-voting resource, to monitor for and provide guidance with respect to compliance with these procedures. Two members of the Valuation Committee or their designees, representing different departments, shall constitute a quorum for purposes of permitting the Valuation Committee to take action. The Valuation Committee will consider all relevant factors in determining an investment’s fair value, and may seek the advice of the Fund’s sub-adviser, knowledgeable brokers, and legal counsel in making such determination. The Valuation Committee reports to the Audit Committee of the Company’s Board of Directors. The Audit Committee receives quarterly written reports which include details of all fair-valued investments, including the reason for the fair valuation, and an indication, when possible, of the accuracy of the valuation by disclosing the next available reliable public price quotation or the disposition price of such investments (the “look-back” test). The Board of Directors then must consider for ratification all of the fair value determinations made during the previous quarter.
Valuation levels are not necessarily indicative of the risk associated with investing in such investments. Individual investments within any of the above mentioned asset classes may be assigned a different hierarchical level than those presented above, as individual circumstances dictate.
For additional information, refer to the Investment Valuation Hierarchy Level Summary and the Level 3 roll-forward reconciliation, if applicable, which follow the Schedule of Investments.
| c) | Investment Transactions and Investment Income – Investment transactions are recorded as of the trade date (the date the order to buy or sell is executed) for financial reporting purposes. Investments purchased or sold on a when-issued or delayed-delivery basis may be settled a month or more after the trade date. Realized gains and losses are determined on the basis of identified cost. |
Dividend income from domestic securities is accrued on the ex-dividend date. In general, dividend income from foreign securities is recorded on the ex-date; however, dividend notifications in certain foreign jurisdictions may not be available in a timely manner and as a result, the Fund will record the dividend as soon as the relevant details (i.e., rate per share, payment date, shareholders of record, etc.) are publicly available. Interest income, including amortization of premium, accretion of discounts and additional principal received in-kind in lieu of cash, is accrued on a daily basis.
| d) | Foreign Currency Transactions – Assets and liabilities denominated in currencies other than U.S. dollars are translated into U.S. dollars at the exchange rates in effect on the valuation date. Purchases and sales of investments, income and expenses are translated into U.S. dollars at the exchange rates on the dates of such transactions. |
The Fund does not isolate that portion of portfolio investment valuation resulting from fluctuations in the foreign currency exchange rates from the fluctuations arising from changes in the market prices of investments held. Exchange rate fluctuations are included with the net realized and unrealized gain or loss on investments in the accompanying financial statements.
Net realized foreign exchange gains or losses arise from sales of foreign currencies and the difference between asset and liability amounts initially stated in foreign currencies and the U.S. dollar value of the amounts actually received or paid. Net unrealized foreign exchange gains or losses arise from changes in the value of other assets and liabilities at the end of the reporting period, resulting from changes in the exchange rates.
| e) | Joint Trading Account – The Fund may invest cash balances into a joint trading account that may be invested in one or more repurchase agreements. |
| 14 |
| f) | Fund Share Valuation and Dividend Distributions to Shareholders – Orders for the Fund’s shares are executed in accordance with the investment instructions of the contract holders and plan participants. The NAV of the Fund’s shares is determined as of the close of business on each business day of the Exchange. The NAV is determined separately for each class of shares of the Fund by dividing the Fund’s net assets attributable to that class by the number of shares of the class outstanding. Each class of shares offered by the Fund has equal rights as to assets and voting privileges (except that shareholders of a class have exclusive voting rights regarding any matter relating solely to that class of shares). Income and non-class specific expenses are allocated daily to each class on the basis of the relative net assets of the class. Realized and unrealized gains and losses are allocated daily based on the relative net assets of each class of shares of the Fund. |
Orders for the purchase of the Fund’s shares received prior to the close of the Exchange on any day the Exchange is open for business are priced at the NAV determined as of the close of the Exchange. Orders received after the close of the Exchange, or on a day on which the Exchange and/or the Fund is not open for business, are priced at the next determined NAV.
Dividends are declared pursuant to a policy adopted by the Company’s Board of Directors based upon the investment performance of the Fund. The policy of the Fund is to pay dividends from net investment income and realized gains, if any, at least once a year.
Distributions from net investment income, net realized gains and capital are determined in accordance with federal income tax regulations, which may differ from U.S. GAAP with respect to character and timing. These differences may include, but are not limited to, losses deferred due to wash sale adjustments, foreign currency gains and losses, adjustments related to Passive Foreign Investment Companies (“PFICs”), Real Estate Investment Trusts (“REITs”), Regulated Investment Companies (“RICs”), certain derivatives and partnerships. Permanent book and federal income tax basis differences relating to shareholder distributions will result in reclassifications to certain of the Fund’s capital accounts (see Federal Income Taxes: Reclassification of Capital Accounts note).
| 3. | Securities and Other Investments: |
| a) | Repurchase Agreements – A repurchase agreement is an agreement by which a counterparty agrees to sell an investment and agrees to repurchase the investment sold from the buyer at a mutually agreed upon time and price. During the period of the repurchase agreement, the counterparty will deposit cash and or securities in a third party custodial account to serve as collateral. At the time the Fund enters into a repurchase agreement, the value of the underlying collateral, including accrued interest, will be equal to or exceed the value of the repurchase agreement. Repurchase agreements expose the Fund to counterparty risk - that is, the risk that the counterparty will not fulfill its obligations. To minimize counterparty risk, the investments that serve to collateralize the repurchase agreement are held by the Fund’s custodian in book entry or physical form in the custodial account of the Fund or in a third party custodial account. Repurchase agreements are valued at cost plus accrued interest, which approximates fair value. Repurchase agreements have master netting arrangements which allow the Fund to offset amounts owed to a counterparty with amounts owed by the counterparty, including any collateral. Upon an event of default under a master repurchase agreement, the non-defaulting party may close out all transactions traded under such agreement and net amounts owed under each transaction to one net amount payable by one party to the other. Absent an event of default, the master repurchase agreement does not result in an offset of reported amounts of assets and liabilities in the Statement of Assets and Liabilities across transactions between the Fund and the applicable counterparty. The Fund, as shown on the Schedule of Investments, had outstanding repurchase agreements and related collateral as of December 31, 2013. |
| b) | Investments Purchased on a When-Issued or Delayed-Delivery Basis – Delivery and payment for investments that have been purchased by the Fund on a forward commitment, or when-issued or delayed-delivery basis, take place beyond the customary settlement period. The Fund may dispose of or renegotiate a delayed-delivery transaction after it is entered into, and may sell delayed-delivery investments before they are delivered, which may result in a realized gain or loss. During this period, such investments are subject to market fluctuations, and the Fund identifies investments segregated in |
| 15 |
| Hartford Healthcare HLS Fund |
| Notes to Financial Statements – (continued) |
| December 31, 2013 |
| (000’s Omitted) |
its records with a value at least equal to the amount of the commitment. As of December 31, 2013, the Fund had no outstanding when-issued or delayed-delivery investments.
| 4. | Financial Derivative Instruments: |
The following disclosures contain information on how and why the Fund uses derivative instruments, the credit-risk-related contingent features in certain derivative instruments, and how derivative instruments affect the Fund’s financial position and results of operations. The location and fair value amounts of these instruments on the Statement of Assets and Liabilities and the realized gains and losses and changes in unrealized gains and losses on the Statement of Operations, each categorized by type of derivative contract, are included in the following Additional Derivative Instrument Information footnote. The derivative instruments outstanding as of year-end are disclosed in the notes to or within the Schedule of Investments for purchased options, if applicable. The amounts of realized gains and losses and changes in unrealized gains and losses on derivative instruments during the year are disclosed in the Statement of Operations.
| a) | Foreign Currency Contracts – The Fund may enter into foreign currency contracts that obligate the Fund to purchase or sell currencies at specified future dates. Foreign currency contracts are used to hedge the currency exposure associated with some or all of the Fund’s investments and/or as part of an investment strategy. Foreign currency contracts are marked to market daily and the change in value is recorded by the Fund as an unrealized gain or loss. The Fund will record a realized gain or loss when the foreign currency contract is settled. |
Foreign currency contracts involve elements of market risk in excess of the amounts reflected in the Statement of Assets and Liabilities. In addition, risks may arise upon entering into these contracts from the potential inability of the counterparties to meet the terms of the contracts and from unanticipated movements in the value of the foreign currencies relative to the U.S. dollar. The Fund had outstanding foreign currency contracts as shown on the Schedule of Investments as of December 31, 2013.
| b) | Additional Derivative Instrument Information: |
Fair Value of Derivative Instruments on the Statement of Assets and Liabilities as of December 31, 2013:
| Risk Exposure Category | ||||||||||||||||||||||||||||
| Interest Rate Contracts | Foreign Exchange Contracts | Credit Contracts | Equity Contracts | Commodity Contracts | Other Contracts | Total | ||||||||||||||||||||||
| Assets: | ||||||||||||||||||||||||||||
| Unrealized appreciation on foreign currency contracts | $ | — | $ | 116 | $ | — | $ | — | $ | — | $ | — | $ | 116 | ||||||||||||||
| Total | $ | — | $ | 116 | $ | — | $ | — | $ | — | $ | — | $ | 116 | ||||||||||||||
The volume of derivatives that is presented in the Schedule of Investments is consistent with the derivative activity during the year ended December 31, 2013.
| 16 |
The Effect of Derivative Instruments on the Statement of Operations for the year ended December 31, 2013:
| Risk Exposure Category | ||||||||||||||||||||||||||||
| Interest Rate Contracts | Foreign Exchange Contracts | Credit Contracts | Equity Contracts | Commodity Contracts | Other Contracts | Total | ||||||||||||||||||||||
| Realized Gain on Derivatives Recognized as a Result of Operations: | ||||||||||||||||||||||||||||
| Net realized gain on foreign currency contracts | $ | — | $ | 1,520 | $ | — | $ | — | $ | — | $ | — | $ | 1,520 | ||||||||||||||
| Total | $ | — | $ | 1,520 | $ | — | $ | — | $ | — | $ | — | $ | 1,520 | ||||||||||||||
| Net Change in Unrealized Appreciation (Depreciation) on Derivatives Recognized as a Result of Operations: | ||||||||||||||||||||||||||||
| Net change in unrealized depreciation of foreign currency contracts | $ | — | $ | (489 | ) | $ | — | $ | — | $ | — | $ | — | $ | (489 | ) | ||||||||||||
| Total | $ | — | $ | (489 | ) | $ | — | $ | — | $ | — | $ | — | $ | (489 | ) | ||||||||||||
| c) | Balance Sheet Offsetting Information: |
Set forth below are tables which disclose both gross information and net information about instruments and transactions eligible for offset in the financial statements, and instruments and transactions that are subject to a master netting arrangement, as well as amounts related to margin, reflected as financial collateral (including cash collateral), held at clearing brokers, counterparties and the Fund’s custodian. The master netting arrangements allow the clearing brokers to net any collateral held in or on behalf of the Fund, or liabilities or payment obligations of the clearing brokers to the Fund, against any liabilities or payment obligations of the Fund to the clearing brokers. The Fund is required to deposit financial collateral (including cash collateral) at the Fund’s custodian on behalf of clearing brokers and counterparties to continually meet the original and maintenance requirements established by the clearing brokers and counterparties. Such requirements are specific to the respective clearing broker or counterparty.
Offsetting of Financial Assets and Derivative Assets as of December 31, 2013:
| Gross Amounts* of Assets Presented in Statement of Assets and Liabilities | Financial Instruments with Allowable Netting | Collateral Received | Net Amount (not less than $0) | |||||||||||||
| Description | ||||||||||||||||
| Unrealized appreciation on foreign currency contracts | $ | 116 | $ | — | $ | — | $ | 116 | ||||||||
| Total subject to a master netting or similar arrangement | $ | 116 | $ | — | $ | — | $ | 116 | ||||||||
* Gross amounts presented as no amounts are netted within the Statements of Assets and Liabilities.
| 5. | Principal Risks: |
The Fund may be exposed to counterparty risk, or the risk that an institution or other entity with which the Fund has unsettled or open transactions will default.
If the Fund invests directly in foreign currencies or in securities that trade in, and receive revenues in, foreign currencies, or in derivatives that provide exposure to foreign currencies, it will be subject to the risk that those currencies will decline in value relative to the base currency (U.S. dollars) of the Fund, or, in the case of hedging positions, that the Fund’s base currency will decline in value relative to the currency being hedged. Currency rates in foreign countries may fluctuate significantly over short periods of time for a number of reasons, including changes in interest rates, intervention (or the failure to intervene) by U.S. or foreign governments, central banks or supranational entities, such as the International Monetary Fund, or by the imposition of currency controls or other political developments in the United States or abroad. As a result, the Fund’s investments in foreign currency denominated securities may reduce the returns of the Fund. The market values of equity securities, such as common stocks and preferred stocks, or equity related investments, such as futures and options, may decline due to general market conditions which are not specifically related
| 17 |
| Hartford Healthcare HLS Fund |
| Notes to Financial Statements – (continued) |
| December 31, 2013 |
| (000’s Omitted) |
to a particular company, such as real or perceived adverse economic conditions, changes in the general outlook for corporate earnings, changes in interest or currency rates or adverse investor sentiment generally. The market value of equity securities may also decline due to factors which affect a particular industry or industries, such as labor shortages or increased production costs and competitive conditions within an industry. Equity securities and equity related investments generally have greater market price volatility than fixed income securities.
| 6. | Federal Income Taxes: |
| a) | Federal Income Taxes – For federal income tax purposes, the Fund intends to continue to qualify as a RIC under Subchapter M of the Internal Revenue Code (“IRC”) by distributing substantially all of its taxable net investment income and net realized capital gains to its shareholders and otherwise complying with the requirements of the IRC. The Fund has distributed substantially all of its income and capital gains in prior years, if applicable, and intends to distribute substantially all of its income and capital gains prior to the next fiscal year-end. Accordingly, no provision for federal income or excise taxes has been made in the accompanying financial statements. Distributions from short-term capital gains are treated as ordinary income distributions for federal income tax purposes. |
| b) | Net Investment Income (Loss), Net Realized Gains (Losses) and Distributions – Net investment income (loss) and net realized gains (losses) may differ for financial statement and tax purposes primarily because of losses deferred due to wash sale adjustments, foreign currency gains and losses, adjustments related to PFICs, REITs, RICs, certain derivatives and partnerships. The character of distributions made during the year from net investment income or net realized gains may differ from their ultimate characterization for federal income tax purposes. Also, due to the timing of dividend distributions, the fiscal year in which amounts are distributed may differ from the year that the income or realized gains (losses) were recorded by the Fund. |
| c) | Distributions and Components of Distributable Earnings – The tax character of distributions paid by the Fund for the periods indicated is as follows (as adjusted for dividends payable, if applicable): |
| For the Year Ended December 31, 2013 | For the Year Ended December 31, 2012 | |||||||
| Ordinary Income | $ | 1,226 | $ | 650 | ||||
| Long-Term Capital Gains* | 16,435 | — | ||||||
| * | The Fund designates these distributions as long-term capital dividends pursuant to IRC Sec. 852(b)(3)(C). |
As of December 31, 2013, the Fund’s components of distributable earnings (deficit) on a tax basis were as follows:
| Amount | ||||
| Undistributed Ordinary Income | $ | 4,632 | ||
| Undistributed Long-Term Capital Gain | 22,124 | |||
| Unrealized Appreciation* | 97,484 | |||
| Total Accumulated Earnings | $ | 124,240 | ||
| * | Differences between book-basis and tax-basis unrealized appreciation (depreciation) may be attributable to the losses deferred due to wash sale adjustments, foreign currency gains and losses, adjustments related to PFICs, REITs, RICs, certain derivatives and partnerships. |
| d) | Reclassification of Capital Accounts – The Fund may record reclassifications in its capital accounts. These reclassifications have no impact on the total net assets of the Fund. The reclassifications are a result of permanent differences between U.S. GAAP and tax accounting for such items as foreign currency, PFICs, expiration or utilization of capital loss carryforwards or net operating losses. Adjustments are made to reflect the impact these items have on |
| 18 |
current and future distributions to shareholders. Therefore, the source of the Fund’s distributions may be shown in the accompanying Statement of Changes in Net Assets as from undistributed net investment income, from accumulated net realized gains on investments or from capital depending on the type of book and tax differences that exist. For the year ended December 31, 2013, the Fund recorded reclassifications to increase (decrease) the accounts listed below:
| Amount | ||||
| Undistributed Net Investment Income (Loss) | $ | (18 | ) | |
| Accumulated Net Realized Gain (Loss) | 18 | |||
| e) | Capital Loss Carryforward – On December 22, 2010, the Regulated Investment Company Modernization Act of 2010 (the “Act”) was enacted, which made changes to the capital loss carryforward rules. The changes are effective for taxable years beginning after the date of enactment. Under the Act, funds are permitted to carry forward capital losses for an unlimited period. However, any losses incurred during those future taxable years will be required to be utilized prior to the losses incurred in pre-enactment taxable years, which carry an expiration date. As a result of this ordering rule, pre-enactment capital loss carryforwards may be more likely to expire unused. Additionally, post-enactment capital loss carryforwards retain their character as either short-term or long-term capital losses rather than being considered all short-term as permitted under prior regulation. |
The Fund had no capital loss carryforward for U.S. federal income tax purposes as of December 31, 2013.
| f) | Accounting for Uncertainty in Income Taxes – The Fund has adopted financial reporting rules that require the Fund to analyze all open tax years, as defined by the statute of limitations, for all major jurisdictions. Generally, tax authorities can examine all tax returns filed for the last three years. The Fund does not have an examination in progress. |
The Fund has reviewed all open tax years and major jurisdictions and concluded that these financial reporting rules had no effect on the Fund’s financial position or results of operations. There is no tax liability resulting from unrecognized tax benefits relating to uncertain income tax positions taken or expected to be taken on the tax return for the fiscal year ended December 31, 2013. The Fund is also not aware of any tax positions for which it is reasonably possible that the total amounts of unrecognized tax benefits will significantly change in the next twelve months.
| 7. | Expenses: |
| a) | Investment Management Agreement – Hartford Funds Management Company, LLC (“HFMC”), an indirect wholly owned subsidiary of The Hartford Financial Services Group, Inc. (“The Hartford”), serves as investment manager to the Fund pursuant to an Investment Management Agreement with the Company. The investment manager has overall investment supervisory responsibility for the Fund. In addition, the investment manager provides administrative personnel, services, equipment, facilities and office space for proper operation of the Fund. The investment manager has contracted with Wellington Management Company, LLP (“Wellington Management”) under a sub-advisory agreement for the provision of day-to-day investment management services to the Fund in accordance with the Fund’s investment objective and policies. The Fund pays a fee to the investment manager, a portion of which may be used to compensate Wellington Management. |
| 19 |
| Hartford Healthcare HLS Fund |
| Notes to Financial Statements – (continued) |
| December 31, 2013 |
| (000’s Omitted) |
The schedule below reflects the rates of compensation paid to HFMC for investment management services rendered as of December 31, 2013; the rates are accrued daily and paid monthly.
| Average Daily Net Assets | Annual Fee | |
| On first $250 million | 0.8500% | |
| On next $250 million | 0.8000% | |
| On next $4.5 billion | 0.7500% | |
| On next $5 billion | 0.7475% | |
| Over $10 billion | 0.7450% |
| b) | Accounting Services Agreement – Pursuant to the Fund Accounting Agreement between HFMC and the Company, on behalf of the Fund, HFMC provides accounting services to the Fund and receives monthly compensation based on the Fund’s average daily net assets at the rates set forth below. The Fund’s accounting services fees are accrued daily and paid monthly. |
| Average Daily Net Assets | Annual Fee | |
| All Assets | 0.010% |
| c) | Operating Expenses – Allocable expenses incurred by the Company are allocated to each Fund and allocated to classes within a Fund in proportion to the average daily net assets of the Fund and each class, except where allocation of certain expenses is more fairly made directly to the Fund or to specific classes within a Fund. |
| d) | Fees Paid Indirectly – The Company, on behalf of the Fund, has entered into agreements with State Street Global Markets, LLC and Russell Implementation Services, Inc. to partially recapture non-discounted trade commissions. Such rebates are used to pay a portion of the Fund’s expenses. In addition, the Fund’s custodian bank has agreed to reduce its fees when the Fund maintains cash on deposit in a non-interest-bearing custody account. For the year ended December 31, 2013, these amounts, if any, are included in the Statement of Operations. |
The ratio of expenses to average net assets in the accompanying financial highlights excludes the reduction in expenses related to fees paid indirectly. The annualized expense ratio after waivers for the period listed below reflecting the reduction for fees paid indirectly is as follows:
| Year Ended December 31, 2013 | ||||
| Class IA | 0.89 | % | ||
| Class IB | 1.14 | |||
| e) | Distribution Plan for Class IB shares – Effective June 14, 2013, Hartford Investment Financial Services, LLC was renamed Hartford Funds Distributors, LLC (“HFD”). HFD, a wholly owned, ultimate subsidiary of The Hartford, serves as the Fund’s principal underwriter and distributor. The Company, on behalf of the Fund, has adopted a Distribution Plan pursuant to Rule 12b-1 of the 1940 Act to compensate the distributor, HFD, from assets attributable to the Class IB shares for services rendered and expenses borne in connection with activities primarily intended to result in the sale of the Class IB shares, subject to the review and approval of the Company’s Board of Directors. |
The Distribution Plan provides that the Fund may pay annually up to 0.25% of the average daily net assets of the Fund attributable to its Class IB shares for activities primarily intended to result in the sale of Class IB shares. The Board has the authority to suspend or reduce these payments at any point in time. Under the terms of the Distribution Plan and the principal underwriting agreement, the Fund is authorized to make payments monthly to the distributor that may be used to pay or compensate entities providing distribution and shareholder servicing with respect to the Class IB shares for such entities’ fees or expenses incurred or paid in that regard. These fees are accrued daily and paid monthly.
| 20 |
| f) | Other Related Party Transactions – Certain officers of the Fund are directors and/or officers of the investment manager and/or The Hartford or its subsidiaries. For the year ended December 31, 2013, a portion of the Fund’s Chief Compliance Officer’s salary was paid by all the investment companies in the Hartford fund complex. The portion allocated to the Fund rounds to zero. Hartford Administrative Services Company (“HASCO”), an indirect wholly owned subsidiary of The Hartford, provides transfer agent services to the Fund. HASCO was compensated on a per account basis for providing such services. The amount paid to HASCO can be found in the Statement of Operations. These fees are accrued daily and paid monthly. |
| g) | Payment from Affiliate – In July of 2007, The Hartford entered into a settlement with the Attorneys General of the states of New York, Connecticut and Illinois relating to market timing and the company's individual variable annuity contracts in which certain payments would be made directly to the variable annuity contract holders. The distribution plan provided that unclaimed money from the settlement would be distributed to certain HLS Funds that are investment options through a Hartford individual variable annuity contract. The unclaimed money was distributed to the Fund on September 18, 2009. |
The total return in the accompanying financial highlights includes a payment from an affiliate. Had the payment from the affiliate been excluded, the impact and total return for the period listed below would have been as follows:
| For the Year Ended December 31, 2009 | ||||||||
| Class IA | Class IB | |||||||
| Impact from Payment from Affiliate for Attorneys General Settlement | 0.01 | % | 0.01 | % | ||||
| Total Return Excluding Payment from Affiliate | 22.70 | % | 22.39 | % | ||||
| 8. | Investment Transactions: |
For the year ended December 31, 2013, the Fund's aggregate purchases and sales of investment securities (excluding short-term investments) were as follows:
| Amount | ||||
| Cost of Purchases Excluding U.S. Government Obligations | $ | 80,694 | ||
| Sales Proceeds Excluding U.S. Government Obligations | 84,735 | |||
| 9. | Line of Credit: |
The Fund is one of several Hartford funds that participate in a $500 million committed revolving line of credit facility. The facility is to be used for temporary or emergency purposes. Under the arrangement, the funds are required to own securities having a market value in excess of 300% of the total bank borrowings. The interest rate on borrowings varies depending on the nature of the loan. The facility also requires a fee to be paid based on the amount of the commitment. This commitment fee is allocated to all of the funds participating in the line of credit based on the average net assets of the funds. During the year ended December 31, 2013, the Fund did not have any borrowings under this facility.
| 10. | Industry Classifications: |
Other than the industry classifications “Other Investment Pools and Funds” and “Exchange Traded Funds,” equity industry classifications used in this report are the Global Industry Classification Standard, which was developed by and is the exclusive property and service mark of MSCI, Inc. and Standard & Poor’s.
| 21 |
| Hartford Healthcare HLS Fund |
| Notes to Financial Statements – (continued) |
| December 31, 2013 |
| (000’s Omitted) |
| 11. | Indemnifications: |
Under the Company’s organizational documents, the Company shall indemnify its officers and directors to the full extent required or permitted under Maryland General Corporation Law and the federal securities laws. In addition, the Company, on behalf of the Fund, may enter into contracts that contain a variety of indemnifications. The Company’s maximum exposure under these arrangements is unknown. However, as of the date of these financial statements, the Company has not had prior claims or losses pursuant to these contracts and expects the risk of loss to be remote.
| 12. | Pending Legal Proceedings: |
On February 25, 2011, Jennifer L. Kasilag, Louis Mellinger, Judith M. Menendez, Jacqueline M. Robinson, and Linda A. Russell filed a derivative lawsuit against Hartford Investment Financial Services, LLC (“HIFSCO”)(now known as Hartford Funds Distributors, LLC) on behalf of six Hartford retail mutual funds in the United States District Court for the District of New Jersey, alleging that HIFSCO received excessive advisory and distribution fees in violation of its statutory fiduciary duty under Section 36(b) of the 1940 Act when serving as investment manager and principal underwriter, respectively, to the Hartford retail mutual funds. HIFSCO moved to dismiss and, in September 2011, the motion was granted in part and denied in part, with leave to amend the complaint. In November 2011, plaintiffs filed an amended complaint on behalf of certain Hartford retail mutual funds, The Hartford Global Health Fund (now known as The Hartford Healthcare Fund), The Hartford Conservative Allocation Fund, The Hartford Growth Opportunities Fund, The Hartford Inflation Plus Fund, The Hartford Advisers Fund (now known as The Hartford Balanced Fund), and The Hartford Capital Appreciation Fund. Plaintiffs seek to rescind the investment management agreements and distribution plans between HIFSCO and these funds and to recover the total fees charged thereunder or, in the alternative, to recover any improper compensation HIFSCO received, in addition to lost earnings. HIFSCO filed a partial motion to dismiss the amended complaint and, in December 2012, the court dismissed without prejudice the claims regarding distribution fees and denied the motion with respect to the advisory fees claims. HIFSCO disputes the allegations and intends to defend the advisory fee claims vigorously.
This action concerns the activities of HIFSCO in its capacity as investment manager and principal underwriter to the Hartford retail mutual funds and does not concern HIFSCO’s activities in its capacity as principal underwriter to the HLS funds. For this reason, no accrual for litigation relating to this matter has been recorded in the financial statements of the Fund.
| 22 |
| Hartford Healthcare HLS Fund |
| Financial Highlights |
─Selected Per-Share Data(A) ─ | ─Ratios and Supplemental Data ─ | |||||||||||||||||||||||||||||||||||||||||||||||||||
Class | Net Asset | Net | Net | Total from | Dividends | Distributions | Total | Net | Total | Net | Ratio of | Ratio of | Ratio of | |||||||||||||||||||||||||||||||||||||||
| For the Year Ended December 31, 2013 | ||||||||||||||||||||||||||||||||||||||||||||||||||||
| IA | $ | 18.11 | $ | 0.04 | $ | 9.12 | $ | 9.16 | $ | (0.12 | ) | $ | (1.48 | ) | $ | (1.60 | ) | $ | 25.67 | 51.84 | % | $ | 243,719 | 0.89 | % | 0.89 | % | 0.19 | % | |||||||||||||||||||||||
| IB | 17.71 | (0.01 | ) | 8.92 | 8.91 | (0.07 | ) | (1.48 | ) | (1.55 | ) | 25.07 | 51.50 | 57,187 | 1.14 | 1.14 | (0.06 | ) | ||||||||||||||||||||||||||||||||||
| For the Year Ended December 31, 2012 (D) | ||||||||||||||||||||||||||||||||||||||||||||||||||||
| IA | $ | 15.07 | $ | 0.13 | $ | 2.98 | $ | 3.11 | $ | (0.07 | ) | $ | – | $ | (0.07 | ) | $ | 18.11 | 20.62 | % | $ | 149,801 | 0.91 | % | 0.91 | % | 0.69 | % | ||||||||||||||||||||||||
| IB | 14.74 | 0.09 | 2.90 | 2.99 | (0.02 | ) | – | (0.02 | ) | 17.71 | 20.32 | 45,306 | 1.16 | 1.16 | 0.43 | |||||||||||||||||||||||||||||||||||||
| For the Year Ended December 31, 2011 (D) | ||||||||||||||||||||||||||||||||||||||||||||||||||||
| IA | $ | 13.89 | $ | 0.06 | $ | 1.13 | $ | 1.19 | $ | (0.01 | ) | $ | – | $ | (0.01 | ) | $ | 15.07 | 8.54 | % | $ | 137,088 | 0.91 | % | 0.91 | % | 0.33 | % | ||||||||||||||||||||||||
| IB | 13.61 | 0.02 | 1.11 | 1.13 | – | – | – | 14.74 | 8.27 | 48,933 | 1.16 | 1.16 | 0.08 | |||||||||||||||||||||||||||||||||||||||
| For the Year Ended December 31, 2010 (D) | ||||||||||||||||||||||||||||||||||||||||||||||||||||
| IA | $ | 12.99 | $ | 0.08 | $ | 0.84 | $ | 0.92 | $ | (0.02 | ) | $ | – | $ | (0.02 | ) | $ | 13.89 | 7.10 | % | $ | 137,454 | 0.90 | % | 0.90 | % | 0.55 | % | ||||||||||||||||||||||||
| IB | 12.74 | 0.04 | 0.83 | 0.87 | – | – | – | 13.61 | 6.84 | 54,753 | 1.15 | 1.15 | 0.30 | |||||||||||||||||||||||||||||||||||||||
| For the Year Ended December 31, 2009 (D) | ||||||||||||||||||||||||||||||||||||||||||||||||||||
| IA | $ | 10.66 | $ | 0.07 | $ | 2.35 | $ | 2.42 | $ | (0.07 | ) | $ | (0.02 | ) | $ | (0.09 | ) | $ | 12.99 | 22.72 | %(E) | $ | 154,216 | 0.91 | % | 0.91 | % | 0.51 | % | |||||||||||||||||||||||
| IB | 10.46 | 0.03 | 2.31 | 2.34 | (0.04 | ) | (0.02 | ) | (0.06 | ) | 12.74 | 22.41 | (E) | 63,065 | 1.16 | 1.16 | 0.26 | |||||||||||||||||||||||||||||||||||
| (A) | Information presented relates to a share outstanding throughout the indicated period. Net investment income (loss) per share amounts are calculated based on average shares outstanding unless otherwise noted. |
| (B) | The figures do not include sales charges or other fees which may be applied at the variable life insurance, variable annuity or qualified retirement plan product level. Any such additional sales charges or other fees would lower the Fund's performance. |
| (C) | Adjustments include waivers and reimbursements, if applicable. Ratios do not include fees paid indirectly (see Expenses in the accompanying Notes to Financial Statements). |
| (D) | Net investment income (loss) per share amounts have been calculated using the SEC method. |
| (E) | Total return without the inclusion of the Payment from (to) Affiliate can be found in Expenses in the accompanying Notes to Financial Statements. |
| Portfolio Turnover Rate for All Share Classes | ||||
| For the Year Ended December 31, 2013 | 33 | % | ||
| For the Year Ended December 31, 2012 | 46 | |||
| For the Year Ended December 31, 2011 | 45 | |||
| For the Year Ended December 31, 2010 | 32 | |||
| For the Year Ended December 31, 2009 | 73 | |||
| 23 |
| Report of Independent Registered Public Accounting Firm |
The Board of Directors and Shareholders of Hartford Series Fund, Inc. |
We have audited the accompanying statement of assets and liabilities, including the schedule of investments, of Hartford Healthcare HLS Fund (one of the portfolios constituting Hartford Series Fund, Inc. (the Funds)) as of December 31, 2013, and the related statement of operations for the year then ended, the statements of changes in net assets for each of the two years in the period then ended, and the financial highlights for each of the five years in the period then ended. These financial statements and financial highlights are the responsibility of the Funds’ management. Our responsibility is to express an opinion on these financial statements and financial highlights based on our audits.
We conducted our audits in accordance with the standards of the Public Company Accounting Oversight Board (United States). Those standards require that we plan and perform the audit to obtain reasonable assurance about whether the financial statements and financial highlights are free of material misstatement. We were not engaged to perform an audit of the Funds’ internal control over financial reporting. Our audits included consideration of internal control over financial reporting as a basis for designing audit procedures that are appropriate in the circumstances, but not for the purpose of expressing an opinion on the effectiveness of the Funds’ internal control over financial reporting. Accordingly, we express no such opinion. An audit also includes examining, on a test basis, evidence supporting the amounts and disclosures in the financial statements and financial highlights, assessing the accounting principles used and significant estimates made by management, and evaluating the overall financial statement presentation. Our procedures included confirmation of securities owned as of December 31, 2013, by correspondence with the custodian and brokers or by other appropriate auditing procedures where replies from brokers were not received. We believe that our audits provide a reasonable basis for our opinion.
In our opinion, the financial statements and financial highlights referred to above present fairly, in all material respects, the financial position of Hartford Healthcare HLS Fund of the Hartford Series Fund, Inc. at December 31, 2013, the results of its operations for the year then ended, the changes in its net assets for each of the two years in the period then ended, and the financial highlights for each of the five years in the period then ended, in conformity with U.S. generally accepted accounting principles.
|
Minneapolis, MN
February 17, 2014
| 24 |
| Hartford Healthcare HLS Fund |
| Directors and Officers (Unaudited) |
The Board of Directors of the Company appoints officers who are responsible for the day-to-day operations of the Fund and who execute policies formulated by the directors. Each director serves until his or her death, resignation, or retirement or until the next annual meeting of shareholders is held or until his or her successor is elected and qualifies.
Directors and officers who are employed by or who have a financial interest in The Hartford are considered “interested” persons of the Fund pursuant to the 1940 Act. Each officer and two of the Company’s directors, as noted in the chart below, are “interested” persons of the Fund. Each director serves as a director for The Hartford Mutual Funds, Inc., The Hartford Mutual Funds II, Inc., Hartford Series Fund, Inc., Hartford HLS Series Fund II, Inc., and as a trustee for The Hartford Alternative Strategies Fund, which, as of December 31, 2013, collectively consist of 91 funds. Correspondence may be sent to directors and officers c/o Hartford Funds, 5 Radnor Corporate Center, Suite 300, 100 Matsonford Road, Radnor, Pennsylvania 19087, except that correspondence to Mr. Annoni, Mr. Dressen and Ms. Quade may be sent to 500 Bielenberg Drive, Woodbury, Minnesota 55125.
The table below sets forth, for each director and officer, his or her name, year of birth, current position with the Company and date first elected or appointed to Hartford Series Fund, Inc. (“HSF”), and Hartford HLS Series Fund II, Inc. (“HSF2”), principal occupation, and, for directors, other directorships held. The Fund’s Statement of Additional Information contains further information on the directors and is available free of charge by calling 1-800-862-6668 or writing to Hartford HLS Funds, c/o Hartford Life Insurance Company, Hartford Life and Annuity Insurance Company, P.O. Box 14293, Lexington, KY 40512-4293.
Information on the aggregate remuneration paid to the directors of the Company can be found in the Statement of Operations herein. The Fund pays to The Hartford a portion of the Chief Compliance Officer’s compensation, but does not pay salaries or compensation to any of their other officers or directors who are employed by The Hartford.
Non-Interested Directors
Lynn S. Birdsong (1946) Director since 2003, Co-Chairman of the Investment Committee since 2005
Mr. Birdsong is a private investor. Mr. Birdsong currently serves as a Director of the Sovereign High Yield Investment Company (April 2010 to current). Mr. Birdsong currently serves as an Independent Director of Nomura Partners Funds, Inc. (formerly, The Japan Fund) (April 2003 to current). From 2003 to March 2005, Mr. Birdsong was an Independent Director of the Atlantic Whitehall Funds. From 1979 to 2002, Mr. Birdsong was a Managing Director of Zurich Scudder Investments, an investment management firm. During his employment with Scudder, Mr. Birdsong was an Interested Director of The Japan Fund. From January 1981 through December 2013, Mr. Birdsong was a partner in Birdsong Company, an advertising specialty firm.
Robert M. Gavin, Jr. (1940) Director since 2002 (HSF) and 1986 (HSF2), Chairman of the Board since 2004
Dr. Gavin is an educational consultant. Prior to September 1, 2001, he was President of Cranbrook Education Community and prior to July 1996, he was President of Macalester College, St. Paul, Minnesota.
Duane E. Hill (1945) Director since 2001 (HSF) and 2002 (HSF2), Chairman of the Nominating Committee since 2003
Mr. Hill is a Partner of TSG Ventures L.P., a private equity investment company. Mr. Hill is a former partner of TSG Capital Group, a private equity investment firm that served as sponsor and lead investor in leveraged buyouts of middle market companies.
Sandra S. Jaffee (1941) Director since 2005
Ms. Jaffee is the founder and Chief Executive Officer of a private company, Homeworks Concierge, LLC, which provides residential property management services in Westchester County, New York (January 2012 to present). Ms. Jaffee served as Chairman (2008 to 2009) and Chief Executive Officer of Fortent (formerly Searchspace Group), a leading provider of compliance/regulatory technology to financial institutions from August 2005 to August 2009. Ms. Jaffee currently serves as a member of the Board of Directors of Broadridge Financial Solutions as well as a Trustee of Muhlenberg College.
| 25 |
| Hartford Healthcare HLS Fund |
| Directors and Officers (Unaudited) – (continued) |
William P. Johnston (1944) Director since 2005, Chairman of the Compliance Committee since 2005
In June 2006, Mr. Johnston was appointed as Senior Advisor to The Carlyle Group, a global private equity and alternative asset investment firm and currently serves as an Operating Executive. In July 2006, Mr. Johnston was elected to the Board of Directors of MultiPlan, Inc. and served as a Director (July 2006 to August 2010). In August 2007, Mr. Johnston was elected to the Board of Directors of LifeCare Holdings, Inc. and served as a Director (August 2007 to June 2013). In February 2008, Mr. Johnston was elected to the Board of Directors of HCR-ManorCare, Inc. In May 2006, Mr. Johnston was elected to the Supervisory Board of Fresenius Medical Care AG & Co. KGaA, after its acquisition of Renal Care Group, Inc. in March 2006. Mr. Johnston joined Renal Care Group in November 2002 as a member of the Board of Directors and served as Chairman of the Board from March 2003 through March 2006. From 2002 through 2013, Mr. Johnston served as a Board member of the Georgia O’Keefe Museum. From September 1987 to December 2002, Mr. Johnston was with Equitable Securities Corporation (and its successors, SunTrust Equitable Securities and SunTrust Robinson Humphrey) serving in various investment banking and managerial positions, including Managing Director and Head of Investment Banking, Chief Executive Officer and Vice Chairman.
Phillip O. Peterson (1944) Director since 2002 (HSF) and 2000 (HSF2), Chairman of the Audit Committee since 2002
Mr. Peterson is a mutual fund industry consultant. He was a partner of KPMG LLP (an accounting firm) until July 1999. Mr. Peterson joined William Blair Funds in February 2007 as a member of the Board of Trustees. Mr. Peterson also joined the Board of Trustees of Symetra Variable Mutual Funds Trust as a trustee in February 2012.
Lemma W. Senbet (1946) Director since 2005
Dr. Senbet is the William E. Mayer Chair Professor of Finance and Founding Director, Center for Financial Policy, at the University of Maryland, Robert H. Smith School of Business. He was chair of the Finance Department of the University of Maryland, Robert H. Smith School of Business from 1998 to 2006. Since June 2013, he has been on leave from the University to serve as Executive Director of African Economic Research Consortium which focuses on economic policy research and training. Previously, he was a chaired professor of finance at the University of Wisconsin-Madison. Also, he was a Director of the Fortis Funds from March 2000 to July 2002. Dr. Senbet served as Director of the American Finance Association and President of the Western Finance Association. In 2006, Dr. Senbet was inducted Fellow of Financial Management Association International for his career-long distinguished scholarship and professional service.
Interested Directors and Officers
James E. Davey (1964) Director since 2012, President and Chief Executive Officer since 2010
Mr. Davey serves as Executive Vice President of Hartford Life Insurance Company (“HLIC”) and The Hartford Financial Services Group, Inc. Additionally, Mr. Davey serves as Chairman of the Board, Manager and Senior Managing Director of Hartford Funds Distributors, LLC (“HFD”). He also currently serves as Director, Chairman of the Board, President and Senior Managing Director of Hartford Administrative Services Company (“HASCO”). Mr. Davey also serves as Manager, Chairman of the Board and Senior Managing Director for Hartford Funds Management Company, LLC (“HFMC”). Mr. Davey joined The Hartford in 2002.
Lowndes A. Smith (1939) Director since 1996 (HSF) and 2002 (HSF2), Co-Chairman of the Investment Committee since 2005
Mr. Smith served as Vice Chairman of The Hartford from February 1997 to January 2002, as President and Chief Executive Officer of Hartford Life, Inc. from February 1997 to January 2002, and as President and Chief Operating Officer of The Hartford Life Insurance Companies from January 1989 to January 2002. Mr. Smith serves as a Director of White Mountains Insurance Group Ltd. (October 2003 to current); One Beacon Insurance (October 2006 to current); Symetra Financial (August 2007 to current) and is a Managing Director of Whittington Gray Associates (January 2007 to current).
Other Officers
Mark A. Annoni (1964) Vice President, Controller and Treasurer since 2012
Mr. Annoni currently serves as the Assistant Vice President of HLIC (February 2004 to present).
| 26 |
Michael R. Dressen (1963) AML Compliance Officer since 2011
Mr. Dressen currently serves as Assistant Vice President of HLIC. He also serves as Chief Compliance Officer and AML Compliance Officer of HASCO and as AML Officer of HFD. Mr. Dressen has served in various positions within The Hartford and its subsidiaries in connection with the operation of the Hartford Funds.
Edward P. Macdonald (1967) Vice President, Secretary and Chief Legal Officer since 2005
Mr. Macdonald currently serves as Assistant Secretary, Executive Vice President and Deputy General Counsel of HFD, HASCO and HFMC. He also serves as Vice President of HLIC. Mr. Macdonald has served in various positions within The Hartford and its subsidiaries in connection with the operation of the Hartford Funds. Mr. Macdonald joined The Hartford in 2005.
Joseph G. Melcher (1973) Vice President and Chief Compliance Officer since 2013
Mr. Melcher currently serves as Executive Vice President of HASCO and HFD. Mr. Melcher also currently serves as Executive Vice President and Chief Compliance Officer of HFMC. Mr. Melcher has served in various positions within The Hartford and its subsidiaries in connection with the operation of the Hartford Funds since joining The Hartford in 2012. Prior to joining The Hartford, Mr. Melcher worked at Touchstone Investments, a member of the Western & Southern Financial Group, where he held the position of Vice President and Chief Compliance Officer from 2010 through 2012 and Assistant Vice President, Compliance from 2005 to 2010.
Vernon J. Meyer (1964) Vice President since 2006
Mr. Meyer currently serves as Senior Vice President of HLIC. He also currently serves as Managing Director and Chief Investment Officer of HFMC. Mr. Meyer has served in various positions within The Hartford and its subsidiaries in connection with the operation of the Hartford Funds. Mr. Meyer joined The Hartford in 2004.
Laura S. Quade (1969) Vice President since 2012
Ms. Quade currently serves as Vice President of HASCO and HFD. She is the Head of Operations of HASCO and also serves as Director, Enterprise Operations of HLIC. Ms. Quade has served in various positions within The Hartford and its subsidiaries in connection with the operation of the Hartford Funds.
Martin A. Swanson (1962) Vice President since 2010
Mr. Swanson currently serves as Vice President of HLIC. Mr. Swanson also serves as Managing Director, Chief Marketing Officer and Principal of HFD. Mr. Swanson has served in various positions within The Hartford and its subsidiaries in connection with the operation of the Hartford Funds.
HOW TO OBTAIN A COPY OF THE FUND’S PROXY VOTING POLICIES AND VOTING RECORDS (UNAUDITED)
A description of the policies and procedures that the Fund uses to determine how to vote proxies relating to portfolio securities and information about how the Fund voted proxies relating to portfolio securities during the most recent twelve-month period ended June 30 are available (1) without charge, upon request, by calling 800-862-6668 and (2) on the SEC’s website at http://www.sec.gov.
QUARTERLY PORTFOLIO HOLDINGS INFORMATION (UNAUDITED)
The Fund files a complete schedule of portfolio holdings with the SEC for the first and third quarters of each fiscal year on Form N-Q. The Fund’s Forms N-Q are available (1) without charge, upon request, by calling 800-862-6668 and (2) on the SEC’s website at http://www.sec.gov. The Form N-Q may be reviewed and copied at the SEC’s Public Reference Room in Washington, DC. Information on the operation of the Public Reference Room may be obtained by calling 1-800-SEC-0330.
| 27 |
| Hartford Healthcare HLS Fund |
| Expense Example (Unaudited) |
Your Fund's Expenses
As a shareholder of the Fund, you incur two types of costs: (1) transaction costs and (2) ongoing costs, including investment management fees, distribution and/or service (12b-1) fees, if any, and other fund expenses. This example is intended to help you understand your ongoing costs (in dollars) of investing in the Fund and to compare these costs with the ongoing costs of investing in other mutual funds. The example is based on an investment of $1,000 invested at the beginning of the period and held for the period of June 30, 2013 through December 31, 2013.
Actual Expenses
The first set of columns of the table below provides information about actual account values and actual expenses. You may use the information in this column, together with the amount you invested, to estimate the expenses that you paid over the period. Simply divide your account value by $1,000 (for example, an $8,600 account value divided by $1,000 = 8.6), then multiply the result by the number in the line under the heading entitled “Expenses Paid During Period” to estimate the expenses you paid on your account during this period.
Hypothetical Example for Comparison Purposes
The second set of columns of the table below provides information about hypothetical account values and hypothetical expenses based on the Fund’s actual expense ratio and an assumed rate of return of 5% per year before expenses, which is not the Fund’s actual return. The hypothetical account values and expenses may not be used to estimate the actual ending account balance or expenses you paid for the period. You may use this information to compare the ongoing costs of investing in the Fund and other funds. To do so, compare this 5% hypothetical example with the 5% hypothetical examples that appear in the shareholder reports of the other funds.
Please note that the expenses shown in the table are meant to highlight your ongoing costs only and do not reflect any transactional costs, such as sales charges (loads) and CDSC. Therefore, the second set of columns of the table is useful in comparing ongoing costs only, and will not help you determine the relative total costs of owning different funds. In addition, if these transactional costs were included, your costs would be higher. Expenses are equal to the Fund's annualized expense ratios multiplied by average account value over the period, multiplied by 184/365 (to reflect the one-half year period).
| Actual return | Hypothetical (5% return before expenses) | |||||||||||||||||||||||||||||||||||
Beginning | Ending | Expenses paid during the period June 30, 2013 through December 31, 2013 | Beginning | Ending | Expenses paid | Annualized | Days in | Days | ||||||||||||||||||||||||||||
| Class IA | $ | 1,000.00 | $ | 1,242.90 | $ | 5.03 | $ | 1,000.00 | $ | 1,020.72 | $ | 4.53 | 0.89 | % | 184 | 365 | ||||||||||||||||||||
| Class IB | $ | 1,000.00 | $ | 1,241.80 | $ | 6.44 | $ | 1,000.00 | $ | 1,019.46 | $ | 5.80 | 1.14 | % | 184 | 365 | ||||||||||||||||||||
| 28 |
| Hartford Healthcare HLS Fund |
| Approval of Investment Management and Investment Sub-Advisory Agreements (Unaudited) |
Section 15(c) of the Investment Company Act of 1940, as amended (the “1940 Act”), requires that each mutual fund’s board of directors, including a majority of those directors who are not “interested persons” of the mutual fund, as defined in the 1940 Act (the “Independent Directors”), annually review and consider the continuation of the mutual fund’s investment advisory and sub-advisory agreements. At its meeting held on August 6-7, 2013, the Board of Directors (the “Board”) of Hartford Series Fund, Inc., including each of the Independent Directors, unanimously voted to approve the continuation of the investment management agreement for Hartford Healthcare HLS Fund (the “Fund”) with Hartford Funds Management Company, LLC (“HFMC”) and the continuation of the investment sub-advisory agreement between HFMC and the Fund’s sub-adviser, Wellington Management Company, LLP (the “Sub-adviser,” and together with HFMC, the “Advisers”) (collectively, the “Agreements”).
In the months preceding the August 6-7, 2013 meeting, the Board requested, received, and reviewed written responses from the Advisers to questions posed to them on behalf of the Independent Directors and supporting materials relating to those questions and responses. The Board considered information furnished to the Board at its meetings throughout the year, as well as information specifically prepared in connection with the annual approval of the Agreements at the Board’s meetings held on June 18-19, 2013 and August 6-7, 2013. Information provided to the Board at its meetings throughout the year included, among other things, reports on Fund performance, legal and compliance matters, sales and marketing activity, shareholder services, and the other services provided to the Fund by the Advisers and their affiliates. The Board also received in-person presentations by Fund officers and representatives of HFMC at the Board’s meetings on June 18-19, 2013 and August 6-7, 2013 concerning the Agreements.
The Independent Directors, advised by independent legal counsel, engaged two service providers to assist them with evaluating the Agreements with respect to the Fund. Lipper Inc. (“Lipper”), an independent provider of investment company data, was retained to provide the Board with reports on how the Fund’s contractual management fees, actual management fees, other non-management fees, overall expense ratios and investment performance compared to those of mutual funds with similar investment objectives. The Independent Directors also engaged an independent financial services consulting firm (the “Consultant”) to assist them in evaluating the Fund’s management fees, sub-advisory fees, other non-management fees, overall expense ratios and investment performance. In addition, the Consultant reviewed the profitability calculations utilized by HFMC in connection with the continuation of the investment management agreement.
In determining whether to continue the Agreements for the Fund, the members of the Board reviewed and evaluated information and factors they believed to be relevant and appropriate in light of the information that the Board deemed necessary and appropriate through the exercise of its reasonable business judgment. While individual members of the Board may have weighed certain factors differently, the Board’s determination to continue the Agreements was based on a comprehensive consideration of all information provided to the Board throughout the year and specifically with respect to the continuation of the Agreements. A more detailed discussion of the factors the Board considered with respect to its approval of the Agreements is provided below.
Nature, Extent, and Quality of Services Provided by the Advisers
The Board requested and considered information concerning the nature, extent, and quality of the services provided to the Fund by the Advisers. The Board considered, among other things, the terms of the Agreements and the range of services provided by the Advisers. The Board considered the Advisers’ professional personnel who provide services to the Fund, including each Adviser’s ability and experience in attracting and retaining qualified personnel to service the Fund. The Board considered each Adviser’s reputation and overall financial strength, as well as its willingness to consider and implement organizational and operational changes designed to improve services to the Fund. In addition, the Board considered the quality of each Adviser’s communications with the Board and responsiveness to Board inquiries.
The Board also requested and evaluated information concerning each Adviser’s regulatory and compliance environment. In this regard, the Board requested and reviewed information on each Adviser’s compliance policies and procedures, compliance history, and a report from the Fund’s Chief Compliance Officer on each Adviser’s compliance with applicable laws and regulations, including responses to regulatory developments and compliance issues raised by regulators. The Board also noted the Advisers’ support of the Fund’s compliance control structure, particularly the resources devoted by the Advisers in support of the Fund’s obligations pursuant to Rule 38a-1 under the 1940 Act.
| 29 |
| Hartford Healthcare HLS Fund |
| Approval of Investment Management and Investment Sub-Advisory Agreements (Unaudited) – (continued) |
With respect to HFMC, the Board noted that under the Agreements, HFMC is responsible for the management of the Fund, including overseeing fund operations and service providers, as well as investment advisory services in connection with selecting, monitoring and supervising the Sub-adviser. The Board considered HFMC’s ongoing monitoring of people, process and performance, including its quarterly reviews of each of the Hartford Funds, semi-annual meetings with the leaders of each Fund’s portfolio management team, and oversight of the Funds’ approximately 40 portfolio managers. The Board recognized that HFMC has demonstrated a record of making changes to the management and/or strategies of the Funds when warranted. The Board considered HFMC’s oversight of the Sub-adviser’s investment approach and results, process for monitoring best execution of portfolio trades by the Sub-adviser, and approach to risk management with respect to the Fund and the service providers to the Fund. The Board also considered HFMC’s oversight of compliance with the Fund’s objective and policies as well as with applicable laws and regulations, noting that regulatory and other developments had over time led to an increase in the scope of HFMC’s services in this regard.
In addition, the Board considered HFMC’s ongoing commitment to review and rationalize the Hartford Funds product line-up and the expenses that HFMC had incurred in connection with fund combinations in recent years. The Board considered that HFMC or its affiliates are responsible for providing the Fund’s officers. The Board also noted that Hartford Life Insurance Company (“HLIC”) provides administrative services to the Fund. The Board considered its experiences with HFMC and HLIC with respect to each of these services.
With respect to the Sub-adviser, who provides day-to-day portfolio management services, the Board considered the quality of the Fund’s portfolio managers, the Sub-adviser’s other investment personnel, its investment philosophy and process, investment research capabilities and resources, performance record, trade execution capabilities and experience. The Board considered the experience of the Fund’s portfolio managers, the number of accounts managed by the portfolio managers, and the Sub-adviser’s method for compensating the portfolio managers.
Based on these considerations, the Board concluded that it was satisfied with the nature, extent and quality of the services provided to the Fund by HFMC and the Sub-adviser.
Performance of the Fund and the Advisers
The Board considered the investment performance of the Fund. In this regard, the Board reviewed the performance of the Fund over different time periods presented in the materials and evaluated HFMC’s analysis of the Fund’s performance for these time periods. The Board considered information and materials provided to the Board by the Advisers concerning Fund performance, as well as information from Lipper comparing the investment performance of the Fund to an appropriate benchmark and universe of peer funds. The Board noted that the Fund’s performance was in the 5th quintile of its performance universe for the 1-year period and the 3rd quintile for the 3- and 5-year periods. The Board also noted that the Fund’s performance was below its benchmark for the 1-year period and in line with its benchmark for the 3- and 5-year periods. The Board considered that, in response to questions raised concerning the Fund’s performance, HFMC stated that it has confidence in the Fund’s portfolio management team and investment strategy.
The Board considered the detailed investment analytics reports provided by Hartford Funds’ Investment Advisory Group throughout the year. These reports include, among other things, information on the Fund’s gross and net returns, the Fund’s investment performance relative to an appropriate benchmark and peer group, various statistics concerning the Fund’s portfolio, and a narrative summary of various factors affecting Fund performance. The Board considered the Advisers’ cooperation with the Investment Committee, which assists the Board in evaluating the performance of the Fund at periodic meetings throughout the year. The Board also considered the analysis provided by the Consultant relating to the Fund’s performance track record.
In light of all the considerations noted above, the Board concluded that it had continued confidence in HFMC’s and the Sub-adviser’s overall capabilities to manage the Fund.
Costs of the Services and Profitability of the Advisers
The Board reviewed information regarding HFMC’s cost to provide investment management and related services to the Fund and HFMC’s profitability, both overall and for the Fund, on a pre-tax basis without regard to distribution expenses. The Board also
| 30 |
requested and reviewed information about the profitability to HFMC and its affiliates from all services provided to the Fund and all aspects of their relationship with the Fund. The Board also requested and received information relating to the operations and profitability of the Sub-adviser.
The Board considered the Consultant’s review of the profitability calculations utilized by HFMC in connection with the continuation of the investment management agreement, noting the Consultant’s view that Hartford Funds’ process for calculating and reporting Fund profitability is reasonable. In this regard, the Board noted that the Consultant had previously performed a full review of this process and reported that such process is sound and well within common industry practice.
Based on these considerations, the Board concluded that the profits anticipated to be realized by the Advisers and their affiliates from their relationships with the Fund would not be excessive.
Comparison of Fees and Services Provided by the Advisers
The Board considered comparative information with respect to the management fees to be paid by the Fund to HFMC and the total expense ratios of the Fund. The Board also considered comparative information with respect to the sub-advisory fees to be paid by HFMC to the Sub-adviser. In this regard, the Board requested and reviewed information from HFMC and the Sub-adviser relating to the management and sub-advisory fees, including the sub-advisory fee schedule for the Fund, and total operating expenses for the Fund. The Board considered that the management fee for the Fund includes the fee paid to HLIC for providing certain administrative services to the Fund. With respect to the sub-advisory fee schedule, the Board considered representations from HFMC and the Sub-adviser that the Sub-adviser’s fees were negotiated at arm’s length. The Board also reviewed information from Lipper comparing the Fund’s contractual management fees, actual management fees and overall expense ratios relative to a group of funds selected by Lipper, in consultation with the Consultant, and a broader universe of funds selected by Lipper. The Board noted that the Fund’s contractual management fee was in the 2nd quintile of its expense group, while its actual management fee was in the 3rd quintile and its total expenses (less 12b-1 and shareholder service fees) were in the 1st quintile.
While the Board recognized that comparisons between the Fund and peer funds are imprecise, given the differing service levels and characteristics of mutual funds and the different business models and cost structures of the Advisers, the comparative information provided by Lipper assisted the Board in evaluating the reasonableness of the Fund’s management and sub-advisory fees and total operating expenses. In addition, the Board considered the analysis and recommendations of the Consultant relating to the Fund’s management and sub-advisory fees and total operating expenses.
Based on these considerations, the Board concluded that the Fund’s fees and total operating expenses, in conjunction with the information about quality of services, profitability, economies of scale, and other matters discussed, were reasonable in light of the services provided.
Economies of Scale
The Board requested and considered information regarding the Advisers’ realization of economies of scale with respect to the Fund and whether the fee levels reflect these economies of scale for the benefit of the Fund’s shareholders. The Board reviewed the breakpoints in the management fee schedule for the Fund, which reduce fee rates as Fund assets grow over time. The Board recognized that a fund with assets beyond the last breakpoint level will continue to benefit from economies of scale because additional assets are charged the lowest breakpoint fee resulting in lower overall effective management fee rates. The Board also recognized that a fee schedule that reaches a lower breakpoint quickly provides shareholders with the benefit of anticipated or potential economies of scale. The Board noted the effect of the sale and run-off of the variable annuity business on the HLS Funds.
The Board reviewed and evaluated materials from Lipper showing how management fee schedules of peer funds reflect economies of scale for the benefit of shareholders as a peer fund’s assets hypothetically increase over time. Based on information provided by HFMC, Lipper, and the Consultant, the Board recognized that there is no uniform methodology for establishing breakpoints or uniform pattern in asset levels that trigger breakpoints or the amounts of breakpoints triggered.
After considering all of the information available to it, the Board concluded that it was satisfied with the extent to which economies of scale would be shared for the benefit of the Fund’s shareholders based on currently available information and the
| 31 |
| Hartford Healthcare HLS Fund |
| Approval of Investment Management and Investment Sub-Advisory Agreements (Unaudited) – (continued) |
effective advisory fees and expense ratios for the Fund at its current and reasonably anticipated asset levels. The Board noted, however, that it would continue to monitor future growth in Fund assets and the appropriateness of additional breakpoints.
Other Benefits
The Board considered other benefits to the Advisers and their affiliates from their relationships with the Fund, including the role of the Fund in supporting the variable life insurance and variable annuity products offered by The Hartford.
The Board reviewed information noting that HLIC, an affiliate of HFMC, receives fees for providing certain administrative services to the Fund and that HFMC receives fees for fund accounting and related services from the Fund. The Board considered information on profits to HLIC and HFMC for such services. The Board also considered that Hartford Administrative Services Company (“HASCO”), the Fund’s transfer agent and an affiliate of HFMC, receives transfer agency compensation from the Fund, and the Board reviewed information on the profitability of the Fund’s transfer agency function to HASCO. The Board considered information provided by HASCO indicating that the transfer agent fees charged by HASCO to the Fund were fair and reasonable based on publicly available information.
The Board also considered that Hartford Funds Distributors, LLC (“HFD”), an affiliate of HFMC, serves as principal underwriter of the Fund. As principal underwriter, HFD receives 12b-1 fees from the Fund. The Board also noted that certain affiliates of HFD distribute shares of the Fund and receive compensation in that connection.
The Board considered benefits to the Sub-adviser from its use of the Fund’s brokerage commissions to obtain soft dollar research, and representations from HFMC and the Sub-adviser that the Sub-adviser would not make any revenue-sharing payments or any other type of distribution payments to HFMC or its affiliates.
The Board considered the benefits to shareholders of being part of the Hartford Funds family of funds. The Board considered HFMC’s efforts to provide investors in the family with a broad range of investment styles and asset classes.
* * * *
Based upon its review of these various factors, among others, the Board concluded that it is in the best interests of the Fund and its shareholders for the Board to approve the Agreements for an additional year. In reaching this decision, the Board did not assign relative weights to the factors discussed above or deem any one or group of them to be controlling in and of themselves. In connection with their deliberations, the Independent Directors met separately in executive session on several occasions, with independent legal counsel and the Consultant, to review the relevant materials and consider their responsibilities under relevant laws and regulations.
| 32 |
| Hartford Healthcare HLS Fund |
| Main Risks (Unaudited) |
The main risks of investing in the Fund are described below.
Market, Selection, and Strategy Risk: The Fund’s share price may fluctuate due to market risk and/or security selections that may underperform the market or relevant benchmarks. If the sub-adviser’s investment strategy does not perform as expected, the Fund could underperform its peers or lose money. There is no guarantee the Fund will achieve its stated objective.
Health Sector Risk: Risks of focusing investments on the health care sector include regulatory and legal developments, patent considerations, intense competitive pressures, rapid technological changes and potential product obsolescence, and liquidity risk.
Foreign Investment and Emerging Markets Risk: Foreign investments can be riskier than U.S. investments. Potential risks include currency risk that may result from unfavorable exchange rates, liquidity risk if decreased demand for a security makes it difficult to sell at the desired price, and risks that stem from substantially lower trading volume on foreign markets. These risks are generally greater for investments in emerging markets, which are also subject to greater price volatility, and custodial and regulatory risks.
Small/Mid-cap Stock Risk: Small- and mid-cap stocks are generally more volatile and risky and may be less liquid than large-cap stocks because they may have limited operating histories, narrow product lines, and focus on niche markets.
| 33 |
THIS PRIVACY POLICY IS NOT PART OF THIS REPORT
Privacy Policy and Practices of The Hartford Financial Services Group, Inc. and its Affiliates
(herein called “we, our, and us”)
This Privacy Policy applies to our United States Operations
We value your trust. We are committed to the responsible: a) management; b) use; and c) protection; of Personal Information. This notice describes how we collect, disclose, and protect Personal Information.
We collect Personal Information to: a) service your Transactions with us; and b) support our business functions.
We may obtain Personal Information from: a) You; b) your Transactions with us; and c) third parties such as a consumer-reporting agency.
Based on the type of product or service You apply for or get from us, Personal Information such as: a) your name; b) your address; c) your income; d) your payment; or e) your credit history; may be gathered from sources such as applications, Transactions, and consumer reports.
To serve You and service our business, we may share certain Personal Information. We will share Personal Information, only as allowed by law, with affiliates such as: a) our insurance companies; b) our employee agents; c) our brokerage firms; and d) our administrators.
As allowed by law, we may share Personal Financial Information with our affiliates to: a) market our products; or b) market our services; to You without providing You with an option to prevent these disclosures. | We may also share Personal Information, only as allowed by law, with unaffiliated third parties including:
When allowed by law, we may share certain Personal Financial Information with other unaffiliated third parties who assist us by performing services or functions such as:
We, and third parties we partner with, may track some of the pages You visit through the use of: a) cookies; b) pixel tagging; or c) other technologies; and currently do not process or comply with any web browser’s “do not track” signal or similar mechanism that indicates a request to disable online tracking of individual users who visit our websites or use our services.
We will not sell or share your Personal Financial Information with anyone for purposes unrelated to our business functions without offering You the opportunity to:
We only disclose Personal Health Information with:
Our employees have access to Personal Information in the course of doing their jobs, such as: |
We use manual and electronic security procedures to maintain: a) the confidentiality; and b) the integrity of; Personal Information that we have. We use these procedures to guard against unauthorized access.
Some techniques we use to protect Personal Information include: a) secured files; b) user authentication; c) encryption; d) firewall technology; and e) the use of detection software.
We are responsible for and must: a) identify information to be protected; b) provide an adequate level of protection for that data; c) grant access to protected data only to those people who must use it in the performance of their job-related duties. Employees who violate our Privacy Policy will be subject to discipline, which may include ending their employment with us.
At the start of our business relationship, we will give You a copy of our current Privacy Policy.
We will also give You a copy of our current Privacy Policy once a year if You maintain a continuing business relationship with us.
We will continue to follow our Privacy Policy regarding Personal Information even when a business relationship no longer exists between us. | As used in this Privacy Notice:
Application means your request for our product or service.
Personal Financial Information means financial information such as:
Personal Health Information means health information such as:
Personal Information means information that identifies You personally and is not otherwise available to the public. It includes:
Transaction means your business dealings with us, such as:
You means an individual who has given us Personal Information in conjunction with: |
This Privacy Policy is being provided on behalf of the following affiliates of The Hartford Financial Services Group, Inc.:
1stAGChoice, Inc.; Access CoverageCorp, Inc.; Access CoverageCorp Technologies, Inc.; American Maturity Life Insurance Company; Archway 60 R, LLC; Business Management Group, Inc.; Catalyst360, LLC; Champlain Life Reinsurance Company; DMS R, LLC; Eloy R, LLC; Ersatz Corporation; First State Insurance Company; Hartford Accident and Indemnity Company; Hartford Administrative Services Company; Hartford Casualty General Agency, Inc.; Hartford Casualty Insurance Company; Hartford-Comprehensive Employee Benefit Service Company; Hartford Equity Sales Company, Inc.; Hartford Fire General Agency, Inc.; Hartford Fire Insurance Company; Hartford Funds Management Company, LLC; Hartford Funds Management Group, Inc.; Hartford HLS Series Fund II, Inc.; Hartford Insurance Company of Illinois; Hartford Insurance Company of the Midwest; Hartford Insurance Company of the Southeast; Hartford Integrated Technologies, Inc.; Hartford International Life Reassurance Corporation; Hartford Funds Distributors, LLC; Hartford Investment Management Company; Hartford Life and Accident Insurance Company; Hartford Life and Annuity Insurance Company; Hartford Life Insurance Company; Hartford Life Private Placement, LLC; Hartford Lloyd’s Corporation; Hartford Lloyd’s Insurance Company; Hartford Mezzanine Investors I, LLC; Hartford Residual Market, L.C.C.; Hartford Retirement Services, LLC; Hartford Securities Distribution Company, Inc.; Hartford Series Fund, Inc.; Hartford Specialty Insurance Services of Texas, LLC; Hartford Strategic Investments, LLC; Hartford Underwriters Insurance Company; Hartford Technology Services Company, L.L.C.; Hartford of Texas General Agency, Inc.; Hartford Underwriters General Agency, Inc.; HARTRE Company, L.C.C.; HL Investment Advisors, LLC; HLA LLC; Horizon Management Group, LLC; HRA Brokerage Services, Inc.; Lanidex Class B, LLC; M-CAP Insurance Agency, LLC; New England Insurance Company; New England Reinsurance Corporation; Nutmeg Insurance Agency, Inc.; Nutmeg Insurance Company; Pacific Insurance Company, Limited; Planco, LLC: Property and Casualty Insurance Company of Hartford; Revere R, LLC; RVR R, LLC; Sentinel Insurance Company, Ltd.; Sunstone R, LLC; Symphony R, LLC; The Evergreen Group Incorporated; The Hartford Alternative Strategies Fund; The Hartford Mutual Funds, Inc.; The Hartford Mutual Funds II, Inc.; Trumbull Flood Management, L.L.C.; Trumbull Insurance Company; Twin City Fire Insurance Company; White River Life Reinsurance Company.
HPP Revised December 2013
HARTFORD HLS FUNDS
c/o The Hartford Wealth Management - Global Annuities
P.O. Box 14293
Lexington, KY 40512-4293
HARTFORDFUNDS
hartfordfunds.com
Hartford Series Fund, Inc. is underwritten and distributed by Hartford Funds Distributors, LLC.
Hartford Series Fund, Inc. inception dates range from 1977 to date. Hartford Series Fund, Inc. is not a subsidiary of The Hartford Financial Services Group, Inc. ("The Hartford") but is underwritten, distributed by and advised by subsidiaries of The Hartford. Investments in Hartford Series Fund, Inc. are not guaranteed by The Hartford or any other entity.
This report is submitted for the general information of the shareholders of the Funds. It is not authorized for distribution unless preceded or accompanied by a current prospectus for the Funds.
Investors should carefully consider the investment objectives, risks, charges, and expenses of Hartford Funds before investing. This and other information can be found in the prospectus and summary prospectus, which can be obtained by calling 888-843-7824 (retail) or 877-836-5854 (institutional). Investors should read them carefully before they invest.
HLSAR-HC13 2-14 113543-2 Printed in U.S.A ©2013 The Hartford, Hartford, CT 06115
HARTFORDFUNDS
| HARTFORD HIGH YIELD HLS FUND
2013 Annual Report
|
A MESSAGE FROM THE PRESIDENT
Dear Fellow Shareholders:
Thank you for investing in Hartford HLS Funds.
Market Review
U.S. equities (as represented by the S&P 500 Index) generated their strongest year since 1997 in 2013, rising 32.39% for the year. During the fourth quarter, equities rose without looking back, pushing the S&P 500 Index and the Dow Jones Industrial Average to new all-time highs. Despite previously cheering delays to quantitative-easing tapering, the stock market received an additional boost at the end of the year following the U.S. Federal Reserve’s (Fed) announcement of a $10-billion-a-month reduction in bond purchases beginning in January.
The Fed’s decision to begin tapering its bond purchases is generally considered a vote of confidence in the recovering U.S. economy. Consumer spending has stabilized, the housing market is showing steady improvement, the unemployment rate is slowly declining and economic growth clocked in at a healthy 4.1% in the third quarter. Equities have also recovered since the market low in March 2009: The S&P 500 Index has gained 173% from the market low through December 31, 2013.
Signs of improvement are also visible outside the U.S. Europe appears to have begun its own economic recovery, and emerging markets have reversed their recent lackluster performance. Fiscal policy continues to wield significant influence in today’s economy and central banks across the globe are maintaining their accommodative stances, including the appointment of Janet Yellen, who is widely expected to continue current monetary policies, to succeed Ben Bernanke as U.S. Federal Reserve chairman.
It’s important to stay abreast of domestic and international economic developments while balancing your individual investment goals. Meeting with your financial advisor on a regular basis to examine your current investment strategy can help you determine whether you are on the right track:
| • | Is your portfolio fully diversified with an appropriate mix of stocks and bonds? |
| • | Is your portfolio incorporating both domestic and international holdings to take advantage of the global economic recovery? |
| • | Are your investments still in line with your risk tolerance and investment time horizon? |
Your financial advisor can help you choose options within our fund family to navigate today’s markets with confidence.
Thank you again for investing with Hartford HLS Funds.
James Davey
President
Hartford HLS Funds
1The S&P 500 Index is a market capitalization-weighted price index composed of 500 widely held common stocks.
2The Dow Jones Industrial Average is an unmanaged, price-weighted index of 30 of the largest, most widely held stocks traded on the New York Stock Exchange.
Table of Contents
This report is prepared for the general information of contract owners and qualified retirement plan participants. It is not an offer of contracts or of qualified retirement plans. It should not be used in connection with any offer, except in conjunction with the appropriate product prospectus which contains all pertinent information including the applicable sales, administrative and other charges.
The views expressed in the Fund’s Manager Discussion under ‘‘Why did the Fund perform this way?’’ and ‘‘What is the outlook?’’ are views of the Fund’s sub-adviser and portfolio management team through the end of the period and are subject to change based on market and other conditions. The Fund’s Manager Discussion is for informational purposes only and does not represent an offer, recommendation or solicitation to buy, hold or sell any security. The specific securities identified and described, if any, do not represent all of the securities purchased or sold and you should not assume that investments in the securities identified and discussed will be profitable.
| 1 |
Hartford High Yield HLS Fund inception 09/30/1998
(sub-advised by Wellington Management Company, LLP)
Investment objective – Seeks to provide high current income, and long-term total return.
Performance Overview 12/31/03 - 12/31/13

The chart above represents the hypothetical growth of a $10,000 investment in Class IA. Growth results in classes other than Class IA will vary from what is seen above due to differences in the expenses charged to those share classes.
Average Annual Total Returns (as of 12/31/13)
| 1 Year | 5 Years | 10 Years | ||||
| High Yield IA | 6.43% | 17.36% | 7.63% | |||
| High Yield IB | 6.17% | 17.07% | 7.36% | |||
| Barclays U.S. Corporate High Yield Index | 7.44% | 18.93% | 8.62% |
PERFORMANCE DATA QUOTED REPRESENTS PAST PERFORMANCE AND DOES NOT GUARANTEE FUTURE RESULTS. The investment return and principal value of the investment will fluctuate so that investors’ shares, when redeemed, may be worth more or less than their original cost. Current performance may be lower or higher than the performance data quoted. To obtain performance data current to the most recent month-end, please visit our website at www.hartfordfunds.com.
Total returns presented above were calculated using the Fund’s net asset value available to shareholders for sale or redemption of Fund shares on December 31, 2013, which may exclude investment transactions as of this date. All share class returns assume the reinvestment of all distributions at net asset value and the deduction of all fund expenses.
Performance information includes performance under the Fund’s previous sub-adviser, Hartford Investment Management Company. As of March 5, 2012, Hartford Investment Management Company no longer served as the sub-adviser to the Fund.
Barclays U.S. Corporate High Yield Index is an unmanaged broad-based market-value-weighted index that tracks the total return performance of non-investment grade, fixed-rate, publicly placed, dollar denominated and nonconvertible debt registered with the Securities and Exchange Commission.
You cannot invest directly in an index.
As of the Fund's current prospectus dated May 1, 2013, the total annual operating expense ratios for Class IA and Class IB were 0.75% and 1.00%, respectively. Actual expenses may be higher. Please see the accompanying Financial Highlights for expense ratios for the year ended December 31, 2013.
The chart and table do not reflect the deductions of taxes, sales charges or other fees which may be applied at the variable life insurance, variable annuity or qualified retirement plan product level. Any such additional sales charges or other fees or expenses would lower the contract’s or plan’s performance.
All investments are subject to risk including the possible loss of principal. For a discussion of the Fund’s risks, please see the Main Risks section of this report. For more detailed information on the risks associated with an investment in the Fund, please see the prospectus.
| 2 |
Hartford High Yield HLS Fund
Manager Discussion
December 31, 2013 (Unaudited)
| Portfolio Managers |
| Christopher A. Jones, CFA |
| Senior Vice President and Fixed Income Portfolio Manager |
How did the Fund perform?
The Class IA shares of the Hartford High Yield HLS Fund returned 6.43% for the twelve-month period ended December 31, 2013, underperforming the Fund’s benchmark, the Barclays U.S. Corporate High Yield Index, which returned 7.44% for the same period. The Fund also underperformed the 6.82% average return of the Variable Products-Underlying Funds Lipper High Current Yield Funds peer group, a group of funds with investment strategies similar to those of the Fund.
Why did the Fund perform this way?
Global central banks’ unconventional policy measures continued to be one of the biggest influences on the market during the year. Central bank easing and signs of gradual global economic recovery imparted a positive tone to financial markets early in the year. However, concerns about a possible pull back in U.S. Federal Reserve (Fed) stimulus were felt in the second quarter, triggered by Fed Chairman Ben Bernanke’s unexpectedly hawkish tone. Fed officials signaled a readiness to begin tapering the Fed’s asset purchases under quantitative easing (QE) by September and to end purchases by mid-2014 if the economy strengthened sufficiently. The Fed’s earlier-than-expected plan to taper asset purchases sent yields sharply higher and credit spreads gapped out in sympathy. Meanwhile, other major central banks, including the Bank of Japan, European Central Bank, and Bank of England, reiterated their commitment to easy monetary policy for as long it was needed.
Signs of economic momentum and speculation over Fed tapering weighed on U.S. Treasury prices during the year; for the full year 2013, 5-, 10-, and 30-year Treasury yields rose 1.02%, 1.27%, and 1.02%, respectively. Many of the major fixed income sectors, with the exception of high yield and bank loans, posted negative absolute returns due to the rise in yields. However, most sectors outperformed Treasuries on a duration-adjusted basis as credit spreads tightened.
High yield outperformed almost all other U.S. fixed income sectors over the twelve-month period on a total return basis. The Barclays U.S. Corporate High Yield Index returned 7.44% for the twelve-month period ended December 31, 2013, and outperformed duration equivalent treasuries. The Option-Adjusted Spread of the Index was 3.82% on December 31, 2013, a decrease of 129 basis points from December 31, 2012.
The Fund underperformed its benchmark, the Barclays U.S. Corporate High Yield Index. Throughout the year the Fund maintained a slightly defensive positioning with respect to credit risk, which was the primary detractor from relative performance as the strong rally in the overall market caused lower quality, riskier securities to perform better than higher quality securities. We continue to believe that maintaining a slightly defensive risk position at this point in the credit cycle is prudent, as historically investors have not generally been adequately compensated for taking on additional default risk in the high yield market.
In aggregate, security selection detracted from benchmark-relative results with weakest selection coming from the financial services sector. Performance in financial services was driven by a combination of exposure to higher quality, longer duration issues whose increased interest rate sensitivity proved detrimental as rates rose during the year. Moreover, lack of exposure to the benchmark component Springleaf Financial, a troubled former subprime lender that was able to complete an initial public offering in October, detracted from relative performance. The Fund benefitted from positive security selection in chemicals, driven primarily by our position in Ferro Corp. Ferro reported strong third quarter earnings in 2013 that were ahead of expectations. The company has been divesting some non-core businesses and focusing on cost saving measures.
In aggregate, industry allocation detracted modestly from benchmark-relative performance, in part due to an overweight allocation to media cable. We continue to favor the media cable sector due to its historically stable cash flows, high margins and strong balance sheets of issuers across the sectors. These characteristics allow media cable to perform well across the down side of the credit cycle. However, the sector lagged the broader market this year as a number of potential merger and acquisition (M&A) deals kept cable in the headlines and investors feared the potential for increased leverage. An overweight allocation to the technology sector contributed positively to relative performance during the period. We consider the technology sector attractive due to a combination of some long term secular trends, as well as the bottom-up opportunities that we are finding in the space. Within the sector, we see the best opportunities in payment processing and service companies. This is due to their recurring revenue streams, low capital expenditures, and high barriers to entry. We are generally more skeptical of hardware companies.
| 3 |
Hartford High Yield HLS Fund
Manager Discussion – (continued)
December 31, 2013 (Unaudited)
A modest cash position detracted from benchmark-relative returns in an upward trending environment. In addition, our credit default swap positions on the Credit Default Swap Index (CDX), which are used to tactically adjust our exposure to the market, contributed positively to performance.
What is the outlook?
Our outlook for high yield remains positive going forward, though we believe returns will be lower in 2014 than they were this past year. We believe economic fundamentals and corporate credit fundamentals continue to be positive and supportive of high yield issuers. In our opinion, while there are some indications of a pickup in shareholder-friendly actions such as M&A activity and leveraged buyouts at the margin, in general we believe issuers continue to manage balance sheets prudently, and proceeds from new issuance have been used mainly to refinance existing debt. The trailing twelve-month par-weighted default rate remains well below its long-term average. We believe valuations are now richer, reducing the prospects for significant capital appreciation going forward, but the sector’s yield still compares favorably to other fixed income options.
Diversification by Security Type
as of December 31, 2013
| Category | Percentage of Net Assets | |||
| Equity Securities | ||||
| Common Stocks | 0.3 | % | ||
| Preferred Stocks | 1.5 | |||
| Total | 1.8 | % | ||
| Fixed Income Securities | ||||
| Asset & Commercial Mortgage Backed Securities | 0.0 | % | ||
| Corporate Bonds | 89.4 | |||
| Senior Floating Rate Interests | 6.9 | |||
| Total | 96.3 | % | ||
| Short-Term Investments | 0.8 | % | ||
| Other Assets and Liabilities | 1.1 | |||
| Total | 100.0 | % | ||
Credit Exposure
as of December 31, 2013
| Credit Rating * | Percentage of Net Assets | |||
| Baa / BBB | 1.4 | % | ||
| Ba / BB | 30.2 | |||
| B | 39.0 | |||
| Caa / CCC or Lower | 22.6 | |||
| Not Rated | 3.1 | |||
| Non-Debt Securities and Other Short-Term Instruments | 2.6 | |||
| Other Assets and Liabilities | 1.1 | |||
| Total | 100.0 | % | ||
| * | Credit exposure is the long-term credit ratings for the Fund's holdings, as of the date noted, as provided by Standard and Poor's (S&P) or Moody's Investors Service and typically range from AAA/Aaa (highest) to C/D (lowest). If Moody's and S&P assign different ratings, the lower rating is used. Fixed income securities that are not rated by either agency are listed as "Not Rated." Ratings do not apply to the Fund itself or to Fund shares. Ratings may change. |
| 4 |
Schedule of Investments
December 31, 2013
(000’s Omitted)
| Shares or Principal Amount ╬ | Market Value ╪ | |||||||
| ASSET & COMMERCIAL MORTGAGE BACKED SECURITIES - 0.0% | ||||||||
| Finance and Insurance - 0.0% | ||||||||
| Soundview NIM Trust | ||||||||
| $ | 2,490 | 0.00%, 12/25/2036 ■● | $ | — | ||||
| Total asset & commercial mortgage backed securities | ||||||||
| (cost $2,479) | $ | — | ||||||
CORPORATE BONDS - 89.4% | ||||||||
| Administrative Waste Management and Remediation - 1.7% | ||||||||
| Carlson Wagonlit B.V. | ||||||||
| $ | 1,675 | 6.88%, 06/15/2019 ■ | $ | 1,738 | ||||
| Casella Waste Systems, Inc. | ||||||||
| 1,650 | 7.75%, 02/15/2019 | 1,691 | ||||||
| Equinix, Inc. | ||||||||
| 165 | 4.88%, 04/01/2020 | 164 | ||||||
| 2,050 | 7.00%, 07/15/2021 | 2,240 | ||||||
| Servicemaster Co. | ||||||||
| 3,220 | 7.00%, 08/15/2020 | 3,192 | ||||||
| 9,025 | ||||||||
| Arts, Entertainment and Recreation - 7.8% | ||||||||
| AMC Entertainment, Inc. | ||||||||
| 4,944 | 9.75%, 12/01/2020 | 5,655 | ||||||
| CCO Holdings LLC | ||||||||
| 4,042 | 7.38%, 06/01/2020 | 4,375 | ||||||
| Emdeon, Inc. | ||||||||
| 1,640 | 11.00%, 12/31/2019 | 1,894 | ||||||
| Gannett Co., Inc. | ||||||||
| 4,390 | 5.13%, 10/15/2019 ■ | 4,565 | ||||||
| GLP Capital L.P./Finance II | ||||||||
| 390 | 4.38%, 11/01/2018 ■ | 399 | ||||||
| 1,645 | 4.88%, 11/01/2020 ■ | 1,645 | ||||||
| 380 | 5.38%, 11/01/2023 ■ | 373 | ||||||
| Gray Television, Inc. | ||||||||
| 4,941 | 7.50%, 10/01/2020 | 5,250 | ||||||
| Great Canadian Gaming Co. | ||||||||
| CAD 1,361 | 6.63%, 07/25/2022 ■ | 1,344 | ||||||
| Greektown Superholdings, Inc. | ||||||||
| 1,650 | 13.00%, 07/01/2015 | 1,708 | ||||||
| NBC Universal Enterprise | ||||||||
| 2,180 | 5.25%, 12/19/2049 ■ | 2,158 | ||||||
| Nexstar Broadcasting, Inc. | ||||||||
| 2,185 | 6.88%, 11/15/2020 | 2,338 | ||||||
| Regal Entertainment Group | ||||||||
| 246 | 5.75%, 02/01/2025 | 232 | ||||||
| 2,006 | 9.13%, 08/15/2018 | 2,176 | ||||||
| Sirius XM Radio, Inc. | ||||||||
| 860 | 4.25%, 05/15/2020 ■ | 813 | ||||||
| 2,420 | 4.63%, 05/15/2023 ■ | 2,190 | ||||||
| 376 | 5.25%, 08/15/2022 ■ | 380 | ||||||
| Univision Communications, Inc. | ||||||||
| 2,695 | 6.75%, 09/15/2022 ■ | 2,951 | ||||||
| 40,446 | ||||||||
| Chemical Manufacturing - 2.6% | ||||||||
| Ferro Corp. | ||||||||
| 3,873 | 7.88%, 08/15/2018 | 4,086 | ||||||
| Hexion Specialty Chemicals | ||||||||
| 3,055 | 8.88%, 02/01/2018 | 3,174 | ||||||
| Hexion U.S. Finance Corp. | ||||||||
| 1,245 | 6.63%, 04/15/2020 | 1,276 | ||||||
| Ineos Group Holdings plc | ||||||||
| 3,265 | 6.13%, 08/15/2018 ■ | 3,281 | ||||||
| MPM Escrow LLC/MPM Finance Corp. | ||||||||
| 1,580 | 8.88%, 10/15/2020 | 1,663 | ||||||
| 13,480 | ||||||||
| Computer and Electronic Product Manufacturing - 3.1% | ||||||||
| Alcatel-Lucent USA Inc. | ||||||||
| 2,430 | 6.75%, 11/15/2020 ■ | 2,524 | ||||||
| CDW Escrow Corp. | ||||||||
| 5,455 | 8.50%, 04/01/2019 | 6,028 | ||||||
| Freescale Semiconductor, Inc. | ||||||||
| 2,115 | 6.00%, 01/15/2022 ■ | 2,141 | ||||||
| Lucent Technologies, Inc. | ||||||||
| 2,181 | 6.45%, 03/15/2029 | 1,930 | ||||||
| 765 | 6.50%, 01/15/2028 | 669 | ||||||
| NXP B.V./NXP Funding LLC | ||||||||
| 1,425 | 3.75%, 06/01/2018 ■ | 1,436 | ||||||
| ON Semiconductor Corp. | ||||||||
| 973 | 2.63%, 12/15/2026 ۞ | 1,070 | ||||||
| 15,798 | ||||||||
| Construction - 3.1% | ||||||||
| K Hovnanian Enterprises, Inc. | ||||||||
| 1,775 | 9.13%, 11/15/2020 ■ | 1,948 | ||||||
| KB Home | ||||||||
| 2,206 | 7.50%, 09/15/2022 | 2,322 | ||||||
| 2,930 | 8.00%, 03/15/2020 | 3,238 | ||||||
| Lennar Corp. | ||||||||
| 6,475 | 4.75%, 12/15/2017 - 11/15/2022 | 6,644 | ||||||
| M/I Homes, Inc. | ||||||||
| 566 | 3.00%, 03/01/2018 ۞ | 627 | ||||||
| Pulte Homes, Inc. | ||||||||
| 615 | 6.38%, 05/15/2033 | 556 | ||||||
| Ryland Group, Inc. | ||||||||
| 910 | 5.38%, 10/01/2022 | 864 | ||||||
| 16,199 | ||||||||
| Fabricated Metal Product Manufacturing - 0.9% | ||||||||
| BOE Intermediate Holdings Corp. | ||||||||
| 2,206 | 9.00%, 11/01/2017 ■Þ | 2,300 | ||||||
| Masco Corp. | ||||||||
| 1,135 | 5.95%, 03/15/2022 | 1,200 | ||||||
| 320 | 7.13%, 03/15/2020 | 365 | ||||||
| Ply Gem Industries, Inc. | ||||||||
| 693 | 9.38%, 04/15/2017 | 749 | ||||||
| 4,614 | ||||||||
| Finance and Insurance - 11.7% | ||||||||
| Barclays Bank plc | ||||||||
| 3,640 | 8.25%, 12/15/2018 ۞♠ | 3,758 | ||||||
| CIT Group, Inc. | ||||||||
| 3,011 | 5.25%, 03/15/2018 | 3,229 | ||||||
| 2,470 | 6.63%, 04/01/2018 ■ | 2,776 | ||||||
| Community Choice Financial, Inc. | ||||||||
| 3,780 | 10.75%, 05/01/2019 | 3,166 | ||||||
| Credit Suisse Group AG | ||||||||
| 1,400 | 7.50%, 12/11/2023 ■♠ | 1,479 | ||||||
| Fibria Overseas Finance Ltd. | ||||||||
| 1,578 | 7.50%, 05/04/2020 ■ | 1,726 | ||||||
The accompanying notes are an integral part of these financial statements.
| 5 |
Hartford High Yield HLS Fund
Schedule of Investments – (continued)
December 31, 2013
(000’s Omitted)
| Shares or Principal Amount ╬ | Market Value ╪ | |||||||
| CORPORATE BONDS - 89.4% - (continued) | ||||||||
| Finance and Insurance - 11.7% - (continued) | ||||||||
| Ineos Finance plc | ||||||||
| $ | 1,220 | 7.50%, 05/01/2020 ■ | $ | 1,337 | ||||
| 715 | 8.38%, 02/15/2019 ■ | 795 | ||||||
| ING US, Inc. | ||||||||
| 1,300 | 5.65%, 05/15/2053 | 1,264 | ||||||
| Ladder Capital Finance Holdings LLC | ||||||||
| 1,335 | 7.38%, 10/01/2017 | 1,402 | ||||||
| Nationstar Mortgage LLC | ||||||||
| 6,335 | 6.50%, 08/01/2018 - 07/01/2021 | 6,243 | ||||||
| Nuveen Investments, Inc. | ||||||||
| 4,880 | 9.13%, 10/15/2017 ■ | 4,880 | ||||||
| 2,681 | 9.50%, 10/15/2020 ■ | 2,688 | ||||||
| Provident Funding Associates L.P. | ||||||||
| 3,025 | 6.75%, 06/15/2021 ■ | 3,010 | ||||||
| Royal Bank of Scotland Group plc | ||||||||
| 2,520 | 6.99%, 10/05/2017 ■♠ | 2,684 | ||||||
| 1,000 | 7.64%, 09/27/2017 ♠Δ | 975 | ||||||
| SLM Corp. | ||||||||
| 1,960 | 7.25%, 01/25/2022 | 2,073 | ||||||
| 2,335 | 8.45%, 06/15/2018 | 2,720 | ||||||
| Societe Generale | ||||||||
| 3,780 | 7.88%, 12/18/2023 ■♠ | 3,807 | ||||||
| 1,600 | 8.25%, 11/29/2018 §♠ | 1,714 | ||||||
| Softbank Corp. | ||||||||
| 2,825 | 4.50%, 04/15/2020 ■ | 2,754 | ||||||
| TMX Finance LLC | ||||||||
| 3,625 | 8.50%, 09/15/2018 ■ | 3,861 | ||||||
| UBS AG Stamford CT | ||||||||
| 1,665 | 7.63%, 08/17/2022 | 1,907 | ||||||
| 60,248 | ||||||||
| Food Manufacturing - 0.5% | ||||||||
| Pinnacle Foods Finance LLC | ||||||||
| 2,930 | 4.88%, 05/01/2021 ■ | 2,769 | ||||||
| Health Care and Social Assistance - 8.1% | ||||||||
| Alere, Inc. | ||||||||
| 2,340 | 6.50%, 06/15/2020 | 2,393 | ||||||
| Biomet, Inc. | ||||||||
| 2,710 | 6.50%, 08/01/2020 - 10/01/2020 | 2,820 | ||||||
| Community Health Systems, Inc. | ||||||||
| 2,076 | 5.13%, 08/15/2018 | 2,143 | ||||||
| 2,935 | 7.13%, 07/15/2020 | 3,045 | ||||||
| Cubist Pharmaceuticals | ||||||||
| 568 | 1.13%, 09/01/2018 ۞■ | 654 | ||||||
| 792 | 1.88%, 09/01/2020 ۞■ | 905 | ||||||
| Exelixis, Inc. | ||||||||
| 1,265 | 4.25%, 08/15/2019 ۞ | 1,549 | ||||||
| HCA Holdings, Inc. | ||||||||
| 1,835 | 6.25%, 02/15/2021 | 1,920 | ||||||
| HCA, Inc. | ||||||||
| 4,260 | 7.25%, 09/15/2020 | 4,643 | ||||||
| 8,189 | 7.50%, 11/15/2095 | 7,084 | ||||||
| Health Management Associates, Inc. | ||||||||
| 2,070 | 7.38%, 01/15/2020 | 2,316 | ||||||
| Hologic, Inc. | ||||||||
| 455 | 6.25%, 08/01/2020 | 480 | ||||||
| Pinnacle Merger Sub, Inc. | ||||||||
| 2,540 | 9.50%, 10/01/2023 ■ | 2,705 | ||||||
| Salix Pharmaceuticals Ltd. | ||||||||
| 3,145 | 6.00%, 01/15/2021 ■ | 3,224 | ||||||
| Savient Pharmaceuticals, Inc. | ||||||||
| 3,885 | 4.75%, 02/01/2018 ۞Ψ | 44 | ||||||
| Tenet Healthcare Corp. | ||||||||
| 2,855 | 8.13%, 04/01/2022 | 3,076 | ||||||
| VPII Escrow Corp. | ||||||||
| 1,230 | 6.75%, 08/15/2018 ■ | 1,351 | ||||||
| Wellcare Health Plans, Inc. | ||||||||
| 1,255 | 5.75%, 11/15/2020 | 1,283 | ||||||
| 41,635 | ||||||||
| Information - 22.1% | ||||||||
| Activision Blizzard | ||||||||
| 6,152 | 5.63%, 09/15/2021 ■ | 6,367 | ||||||
| Altice Financing S.A. | ||||||||
| 885 | 6.50%, 01/15/2022 ■ | 894 | ||||||
| 1,500 | 7.88%, 12/15/2019 ■ | 1,631 | ||||||
| 295 | 8.13%, 01/15/2024 ■ | 306 | ||||||
| 1,080 | 9.88%, 12/15/2020 ■ | 1,215 | ||||||
| DISH DBS Corp. | ||||||||
| 2,170 | 5.00%, 03/15/2023 | 2,024 | ||||||
| 3,725 | 5.88%, 07/15/2022 | 3,725 | ||||||
| 945 | 6.75%, 06/01/2021 | 1,002 | ||||||
| 4,886 | 7.88%, 09/01/2019 | 5,595 | ||||||
| First Data Corp. | ||||||||
| 1,800 | 6.75%, 11/01/2020 ■ | 1,872 | ||||||
| 5,425 | 7.38%, 06/15/2019 ■ | 5,791 | ||||||
| 6,210 | 8.25%, 01/15/2021 ■ | 6,606 | ||||||
| Harron Communications L.P. | ||||||||
| 1,205 | 9.13%, 04/01/2020 ■ | 1,335 | ||||||
| Intelsat Jackson Holdings S.A. | ||||||||
| 1,300 | 6.63%, 12/15/2022 | 1,339 | ||||||
| 1,030 | 6.63%, 12/15/2022 ■ | 1,061 | ||||||
| 1,445 | 8.50%, 11/01/2019 | 1,577 | ||||||
| Intelsat Luxembourg S.A. | ||||||||
| 695 | 6.75%, 06/01/2018 ■ | 738 | ||||||
| 6,550 | 7.75%, 06/01/2021 ■ | 7,025 | ||||||
| Lawson Software | ||||||||
| 1,890 | 9.38%, 04/01/2019 | 2,126 | ||||||
| Level 3 Financing, Inc. | ||||||||
| 970 | 6.13%, 01/15/2021 ■ | 980 | ||||||
| MetroPCS Wireless, Inc. | ||||||||
| 1,425 | 6.63%, 11/15/2020 | 1,511 | ||||||
| 1,685 | 7.88%, 09/01/2018 | 1,809 | ||||||
| Nara Cable Funding Ltd. | ||||||||
| 3,615 | 8.88%, 12/01/2018 ■ | 3,886 | ||||||
| NII Capital Corp. | ||||||||
| 1,930 | 7.63%, 04/01/2021 | 791 | ||||||
| NII International Telecom S.a.r.l. | ||||||||
| 1,900 | 7.88%, 08/15/2019 ■ | 1,435 | ||||||
| Sprint Corp. | ||||||||
| 6,120 | 7.25%, 09/15/2021 ■ | 6,571 | ||||||
| 5,715 | 7.88%, 09/15/2023 ■ | 6,144 | ||||||
| Sprint Nextel Corp. | ||||||||
| 507 | 7.00%, 03/01/2020 ■ | 565 | ||||||
| 3,092 | 9.00%, 11/15/2018 ■ | 3,726 | ||||||
| Syniverse Holdings, Inc. | ||||||||
| 3,470 | 9.13%, 01/15/2019 | 3,791 | ||||||
The accompanying notes are an integral part of these financial statements.
| 6 |
| Shares or Principal Amount ╬ | Market Value ╪ | |||||||
| CORPORATE BONDS - 89.4% - (continued) | ||||||||
| Information - 22.1% - (continued) | ||||||||
| T-Mobile USA, Inc. | ||||||||
| $ | 275 | 5.25%, 09/01/2018 ■ | $ | 289 | ||||
| 330 | 6.13%, 01/15/2022 | 336 | ||||||
| 2,490 | 6.46%, 04/28/2019 | 2,646 | ||||||
| 490 | 6.50%, 01/15/2024 | 496 | ||||||
| 1,030 | 6.63%, 04/28/2021 | 1,084 | ||||||
| 2,865 | 6.73%, 04/28/2022 | 2,987 | ||||||
| 405 | 6.84%, 04/28/2023 | 420 | ||||||
| Unitymedia Hessen GmbH & Co. | ||||||||
| 2,555 | 5.50%, 01/15/2023 ■ | 2,478 | ||||||
| 1,496 | 7.50%, 03/15/2019 ■ | 1,627 | ||||||
| UPCB Finance III Ltd. | ||||||||
| 2,868 | 6.63%, 07/01/2020 ■ | 3,047 | ||||||
| UPCB Finance VI Ltd. | ||||||||
| 1,845 | 6.88%, 01/15/2022 ■ | 1,960 | ||||||
| Videotron Ltee | ||||||||
| 1,138 | 9.13%, 04/15/2018 | 1,192 | ||||||
| Wind Acquisition Finance S.A. | ||||||||
| 1,145 | 6.50%, 04/30/2020 ■ | 1,219 | ||||||
| 6,790 | 7.25%, 02/15/2018 ■ | 7,137 | ||||||
| Windstream Corp. | ||||||||
| 3,400 | 7.50%, 04/01/2023 | 3,417 | ||||||
| 113,773 | ||||||||
| Machinery Manufacturing - 1.6% | ||||||||
| Case New Holland, Inc. | ||||||||
| 6,921 | 7.88%, 12/01/2017 | 8,167 | ||||||
| Mining - 0.3% | ||||||||
| AK Steel Corp. | ||||||||
| 70 | 7.63%, 05/15/2020 | 70 | ||||||
| 220 | 8.38%, 04/01/2022 | 221 | ||||||
| American Rock Salt Co. LLC | ||||||||
| 1,171 | 8.25%, 05/01/2018 ■ | 1,179 | ||||||
| 1,470 | ||||||||
| Miscellaneous Manufacturing - 0.8% | ||||||||
| BE Aerospace, Inc. | ||||||||
| 1,286 | 5.25%, 04/01/2022 | 1,305 | ||||||
| DigitalGlobe, Inc. | ||||||||
| 2,945 | 5.25%, 02/01/2021 ■ | 2,872 | ||||||
| 4,177 | ||||||||
| Nonmetallic Mineral Product Manufacturing - 0.9% | ||||||||
| Ardagh Packaging Finance plc | ||||||||
| 510 | 4.88%, 11/15/2022 ■ | 505 | ||||||
| 1,575 | 7.00%, 11/15/2020 ■ | 1,591 | ||||||
| 480 | 7.38%, 10/15/2017 ■ | 516 | ||||||
| 511 | 9.13%, 10/15/2020 ■ | 560 | ||||||
| Cemex S.A.B. de C.V. | ||||||||
| 1,200 | 3.75%, 03/15/2018 ۞ | 1,627 | ||||||
| 4,799 | ||||||||
| Other Services - 1.6% | ||||||||
| Abengoa Finance | ||||||||
| 1,815 | 7.75%, 02/01/2020 ■ | 1,869 | ||||||
| Service Corp. International | ||||||||
| 520 | 5.38%, 01/15/2022 ■ | 527 | ||||||
| 5,075 | 7.63%, 10/01/2018 | 5,836 | ||||||
| 8,232 | ||||||||
| Petroleum and Coal Products Manufacturing - 6.9% | ||||||||
| Antero Resources Finance Corp. | ||||||||
| 2,700 | 6.00%, 12/01/2020 | 2,835 | ||||||
| 2,340 | 7.25%, 08/01/2019 | 2,516 | ||||||
| Bonanza Creek Energy, Inc. | ||||||||
| 1,940 | 6.75%, 04/15/2021 | 2,032 | ||||||
| Cobalt International Energy, Inc. | ||||||||
| 1,790 | 2.63%, 12/01/2019 ۞ | 1,583 | ||||||
| Diamondback Energy, Inc. | ||||||||
| 2,485 | 7.63%, 10/01/2021 ■ | 2,622 | ||||||
| Endeavour International Corp. | ||||||||
| 3,793 | 12.00%, 03/01/2018 | 3,897 | ||||||
| EPE Holding/EP Energy Bond | ||||||||
| 1,509 | 8.88%, 12/15/2017 ■Þ | 1,550 | ||||||
| Everest Acquisition LLC | ||||||||
| 570 | 6.88%, 05/01/2019 | 613 | ||||||
| 3,792 | 9.38%, 05/01/2020 | 4,375 | ||||||
| Ferrellgas Partners L.P. | ||||||||
| 891 | 6.50%, 05/01/2021 | 909 | ||||||
| 740 | 6.75%, 01/15/2022 ■ | 751 | ||||||
| Harvest Operations Corp. | ||||||||
| 1,315 | 6.88%, 10/01/2017 | 1,440 | ||||||
| Rosetta Resources, Inc. | ||||||||
| 1,875 | 5.63%, 05/01/2021 | 1,870 | ||||||
| 1,860 | 5.88%, 06/01/2022 | 1,846 | ||||||
| 1,898 | 9.50%, 04/15/2018 | 2,031 | ||||||
| Seadrill Ltd. | ||||||||
| 2,585 | 5.63%, 09/15/2017 ■ | 2,675 | ||||||
| Tullow Oil plc | ||||||||
| 1,725 | 6.00%, 11/01/2020 ■ | 1,751 | ||||||
| 35,296 | ||||||||
| Pipeline Transportation - 1.6% | ||||||||
| El Paso Corp. | ||||||||
| 955 | 7.75%, 01/15/2032 | 969 | ||||||
| 1,025 | 7.80%, 08/01/2031 | 1,040 | ||||||
| Energy Transfer Equity L.P. | ||||||||
| 2,588 | 7.50%, 10/15/2020 | 2,905 | ||||||
| Kinder Morgan Finance Co. | ||||||||
| 2,850 | 6.00%, 01/15/2018 ■ | 3,123 | ||||||
| 8,037 | ||||||||
| Plastics and Rubber Products Manufacturing - 1.5% | ||||||||
| Associated Materials LLC | ||||||||
| 1,005 | 9.13%, 11/01/2017 | 1,073 | ||||||
| Continental Rubber of America Corp. | ||||||||
| 3,180 | 4.50%, 09/15/2019 ■ | 3,370 | ||||||
| Nortek, Inc. | ||||||||
| 2,785 | 8.50%, 04/15/2021 | 3,084 | ||||||
| 7,527 | ||||||||
| Professional, Scientific and Technical Services - 1.2% | ||||||||
| SunGard Data Systems, Inc. | �� | |||||||
| 490 | 6.63%, 11/01/2019 | 515 | ||||||
| 3,685 | 7.38%, 11/15/2018 | 3,901 | ||||||
| 1,520 | 7.63%, 11/15/2020 | 1,657 | ||||||
| 6,073 | ||||||||
| Real Estate, Rental and Leasing - 3.9% | ||||||||
| CBRE Services, Inc. | ||||||||
| 2,940 | 5.00%, 03/15/2023 | 2,826 | ||||||
| Hertz Global Holdings, Inc. | ||||||||
| 1,075 | 5.88%, 10/15/2020 | 1,114 | ||||||
| 695 | 6.25%, 10/15/2022 | 717 | ||||||
The accompanying notes are an integral part of these financial statements.
| 7 |
Hartford High Yield HLS Fund
Schedule of Investments – (continued)
December 31, 2013
(000’s Omitted)
| Shares or Principal Amount ╬ | Market Value ╪ | |||||||
| CORPORATE BONDS - 89.4% - (continued) | ||||||||
| Real Estate, Rental and Leasing - 3.9% - (continued) | ||||||||
| International Lease Finance Corp. | ||||||||
| $ | 10,126 | 5.88%, 04/01/2019 - 08/15/2022 | $ | 10,739 | ||||
| 1,720 | 6.25%, 05/15/2019 | 1,862 | ||||||
| 2,535 | 8.88%, 09/01/2017 | 3,017 | ||||||
| 20,275 | ||||||||
| Retail Trade - 4.7% | ||||||||
| 99 Cents Only Stores | ||||||||
| 3,545 | 11.00%, 12/15/2019 | 4,024 | ||||||
| AmeriGas Partners L.P. | ||||||||
| 3,336 | 6.25%, 08/20/2019 ‡ | 3,586 | ||||||
| ARAMARK Corp. | ||||||||
| 3,825 | 5.75%, 03/15/2020 ■ | 3,997 | ||||||
| GRD Holding III Corp. | ||||||||
| 3,095 | 10.75%, 06/01/2019 ■ | 3,373 | ||||||
| Michaels Stores, Inc. | ||||||||
| 3,190 | 7.75%, 11/01/2018 | 3,461 | ||||||
| Party City Holdings, Inc. | ||||||||
| 1,080 | 8.88%, 08/01/2020 | 1,210 | ||||||
| Party City Nextco Holdings | ||||||||
| 2,995 | 8.75%, 08/15/2019 ■ | 3,074 | ||||||
| Sally Holdings LLC | ||||||||
| 1,425 | 5.75%, 06/01/2022 | 1,482 | ||||||
| 24,207 | ||||||||
| Transportation Equipment Manufacturing - 0.4% | ||||||||
| Huntington Ingalls Industries, Inc. | ||||||||
| 1,785 | 7.13%, 03/15/2021 | 1,959 | ||||||
| Utilities - 1.9% | ||||||||
| AES (The) Corp. | ||||||||
| 3,230 | 8.00%, 10/15/2017 | 3,795 | ||||||
| Calpine Corp. | ||||||||
| 1,060 | 7.88%, 01/15/2023 ■ | 1,158 | ||||||
| Dolphin Subsidiary II, Inc. | ||||||||
| 2,615 | 7.25%, 10/15/2021 | 2,648 | ||||||
| Texas Competitive Electric Co. | ||||||||
| 2,765 | 11.50%, 10/01/2020 ■ | 2,032 | ||||||
| 9,633 | ||||||||
| Wholesale Trade - 0.5% | ||||||||
| J.M. Huber Corp. | ||||||||
| 2,290 | 9.88%, 11/01/2019 ■ | 2,631 | ||||||
| Total corporate bonds | ||||||||
| (cost $446,286) | $ | 460,470 | ||||||
SENIOR FLOATING RATE INTERESTS ♦ - 6.9% | ||||||||
| Arts, Entertainment and Recreation - 0.6% | ||||||||
| Tribune Co. | ||||||||
| $ | 2,810 | 11/20/2020 ◊☼ | $ | 2,792 | ||||
| Computer and Electronic Product Manufacturing - 0.4% | ||||||||
| Freescale Semiconductor, Inc. | ||||||||
| 2,045 | 5.00%, 01/15/2021 | 2,066 | ||||||
| Finance and Insurance - 0.9% | ||||||||
| Asurion LLC | ||||||||
| 2,293 | 3.50%, 07/08/2020 | 2,248 | ||||||
| 2,332 | 4.50%, 05/24/2019 | 2,331 | ||||||
| 4,579 | ||||||||
| Mining - 0.5% | ||||||||
| Arch Coal, Inc. | ||||||||
| 2,640 | 6.25%, 05/16/2018 | 2,601 | ||||||
| Other Services - 1.3% | ||||||||
| Gardner Denver | ||||||||
| 3,007 | 4.25%, 07/30/2020 | 3,007 | ||||||
| Rexnord LLC | ||||||||
| 3,681 | 4.00%, 08/21/2020 | 3,689 | ||||||
| 6,696 | ||||||||
| Petroleum and Coal Products Manufacturing - 0.4% | ||||||||
| Crosby Worldwide, Ltd. | ||||||||
| 2,145 | 4.00%, 11/23/2020 | 2,146 | ||||||
| Retail Trade - 1.7% | ||||||||
| EB Sports Corp. | ||||||||
| 5,436 | 11.50%, 12/31/2015 Þ | 5,409 | ||||||
| J. C. Penney Co., Inc. | ||||||||
| 1,443 | 6.00%, 05/22/2018 | 1,409 | ||||||
| Neiman Marcus Group, Inc. | ||||||||
| 1,965 | 5.00%, 10/25/2020 | 1,988 | ||||||
| 8,806 | ||||||||
| Soap, Cleaning Compound and Toilet Manufacturing - 0.3% | ||||||||
| Spotless Group | ||||||||
| 1,397 | 5.00%, 10/02/2018 | 1,415 | ||||||
| Utilities - 0.8% | ||||||||
| Calpine Corp. | ||||||||
| 515 | 4.00%, 10/31/2020 | 518 | ||||||
| Texas Competitive Electric Holdings Co. LLC | ||||||||
| 5,425 | 4.73%, 10/10/2017 | 3,746 | ||||||
| 4,264 | ||||||||
| Total senior floating rate interests | ||||||||
| (cost $35,207) | $ | 35,365 | ||||||
COMMON STOCKS - 0.3% | ||||||||
| Energy - 0.3% | ||||||||
| 206,275 | KCA Deutag ⌂●† | $ | 1,509 | |||||
| Software and Services - 0.0% | ||||||||
| 38 | Stratus Technologies, Inc. ⌂●† | 17 | ||||||
| Total common stocks | ||||||||
| (cost $2,795) | $ | 1,526 | ||||||
PREFERRED STOCKS - 1.5% | ||||||||
| Diversified Financials - 1.2% | ||||||||
| 5 | Citigroup Capital XIII | $ | 146 | |||||
| 221 | GMAC Capital Trust I ۞ | 5,902 | ||||||
| 6,048 | ||||||||
| Software and Services - 0.0% | ||||||||
| 9 | Stratus Technologies, Inc. ⌂† | 160 | ||||||
The accompanying notes are an integral part of these financial statements.
| 8 |
| Shares or Principal Amount ╬ | Market Value ╪ | |||||||||||
| PREFERRED STOCKS - 1.5% - (continued) | ||||||||||||
| Telecommunication Services - 0.3% | ||||||||||||
| 25 | Intelsat S.A. ۞ | $ | 1,436 | |||||||||
| Total preferred stocks | ||||||||||||
| (cost $6,549) | $ | 7,644 | ||||||||||
| Total long-term investments | ||||||||||||
| (cost $493,316) | $ | 505,005 | ||||||||||
| SHORT-TERM INVESTMENTS - 0.8% | ||||||||||||
| Repurchase Agreements - 0.8% | ||||||||||||
| Bank of America Merrill Lynch TriParty Repurchase Agreement (maturing on 01/02/2014 in the amount of $215, collateralized by GNMA 4.00%, 2043, value of $219) | ||||||||||||
| $ | 215 | 0.005%, 12/31/2013 | $ | 215 | ||||||||
| Bank of Montreal TriParty Repurchase Agreement (maturing on 01/02/2014 in the amount of $206, collateralized by FNMA 1.58% - 4.50%, 2020 - 2043, U.S. Treasury Note 0.25% - 4.00%, 2015 - 2020, value of $210) | ||||||||||||
| 206 | 0.01%, 12/31/2013 | 206 | ||||||||||
| Bank of Montreal TriParty Repurchase Agreement (maturing on 01/02/2014 in the amount of $730, collateralized by FHLMC 3.00% - 5.00%, 2019 - 2043, FNMA 0.76% - 6.00%, 2016 - 2043, GNMA 1.50% - 5.25%, 2028 - 2043, value of $745) | ||||||||||||
| 730 | 0.02%, 12/31/2013 | 730 | ||||||||||
| Barclays Capital TriParty Repurchase Agreement (maturing on 01/02/2014 in the amount of $659, collateralized by U.S. Treasury Note 0.50% - 2.25%, 2017, value of $672) | ||||||||||||
| 659 | 0.01%, 12/31/2013 | 659 | ||||||||||
| Citigroup Global Markets, Inc. TriParty Repurchase Agreement (maturing on 01/02/2014 in the amount of $1,185, collateralized by U.S. Treasury Bond 3.88% - 8.13%, 2021 - 2040, U.S. Treasury Note 0.25% - 3.38%, 2014 - 2020, value of $1,209) | ||||||||||||
| 1,185 | 0.01%, 12/31/2013 | 1,185 | ||||||||||
| RBS Securities, Inc. TriParty Repurchase Agreement (maturing on 01/02/2014 in the amount of $385, collateralized by U.S. Treasury Note 0.25% - 1.00%, 2015 - 2017, value of $393) | ||||||||||||
| 385 | 0.01%, 12/31/2013 | 385 | ||||||||||
| TD Securities TriParty Repurchase Agreement (maturing on 01/02/2014 in the amount of $924, collateralized by FFCB 0.20% - 0.50%, 2015 - 2016, FHLMC 0.38% - 5.25%, 2014 - 2042, FNMA 0.50% - 7.13%, 2014 - 2043, value of $943) | ||||||||||||
| 924 | 0.01%, 12/31/2013 | 924 | ||||||||||
| UBS Securities, Inc. Repurchase Agreement (maturing on 01/02/2014 in the amount of $8, collateralized by U.S. Treasury Note 2.13%, 2015, value of $8) | ||||||||||||
| 8 | 0.01%, 12/31/2013 | 8 | ||||||||||
| 4,312 | ||||||||||||
| Total short-term investments | ||||||||||||
| (cost $4,312) | $ | 4,312 | ||||||||||
| Total investments | ||||||||||||
| (cost $497,628) ▲ | 98.9 | % | $ | 509,317 | ||||||||
| Other assets and liabilities | 1.1 | % | 5,724 | |||||||||
| Total net assets | 100.0 | % | $ | 515,041 | ||||||||
The accompanying notes are an integral part of these financial statements.
| 9 |
Hartford High Yield HLS Fund
Schedule of Investments – (continued)
December 31, 2013
(000’s Omitted)
| Note: | Percentage of investments as shown is the ratio of the total market value to total net assets. |
| ▲ | At December 31, 2013, the cost of securities for federal income tax purposes was $497,766 and the aggregate gross unrealized appreciation and depreciation based on that cost were: |
| Unrealized Appreciation | $ | 21,642 | ||
| Unrealized Depreciation | (10,091 | ) | ||
| Net Unrealized Appreciation | $ | 11,551 |
| † | These securities are valued in good faith at fair value as determined under policies and procedures established by and under the supervision of the Company's Board of Directors. At December 31, 2013, the aggregate value of these securities was $1,686, which represents 0.3% of total net assets. |
| ● | Non-income producing. For long-term debt securities, items identified are in default as to payment of interest and/or principal. |
| Ψ | The company is in bankruptcy. The investment held by the Fund is current with respect to interest payments. |
| Δ | Variable rate securities; the rate reported is the coupon rate in effect at December 31, 2013. |
| ◊ | All or a portion of this position represents an unsettled loan commitment. The coupon rate will be determined at time of settlement. |
| ♦ | Senior floating rate interests generally pay interest rates which are periodically adjusted by reference to a base short-term, floating lending rate plus a premium. These base lending rates are generally (i) the lending rate offered by one or more major European banks, such as the LIBOR, (ii) the prime rate offered by one or more major United States banks, or (iii) the bank's certificate of deposit rate. Senior floating rate interests often require prepayments from excess cash flows or permit the borrower to repay at its election. The rate at which the borrower repays cannot be predicted with accuracy. As a result, the actual remaining maturity may be substantially less than the stated maturities shown. Unless otherwise noted, the interest rate disclosed for these securities represents the average coupon as of December 31, 2013. |
| ■ | Securities issued within terms of a private placement memorandum, exempt from registration under Rule 144A under the Securities Act of 1933, as amended, and may be sold only to qualified institutional buyers. Unless otherwise indicated, these holdings are determined to be liquid. At December 31, 2013, the aggregate value of these securities was $193,222, which represents 37.5% of total net assets. |
| § | These securities were sold to the Fund under Regulation S, rules governing offers and sales made outside the United States without registration under the Securities Act of 1933. The Fund may only be able to resell these securities in the United States if an exemption from registration under the federal and state securities laws is available, or the Fund may only be able to sell these securities outside of the United States (such as on a foreign exchange) to a non-U.S. person. Unless otherwise indicated, these holdings are determined to be liquid. At December 31, 2013, the aggregate value of these securities was $1,714, which represents 0.3% of total net assets. |
| ⌂ | The following securities are considered illiquid. Illiquid securities are often purchased in private placement transactions, are often not registered under the Securities Act of 1933 and may have contractual restrictions on resale. A security may also be considered illiquid if the security lacks a readily available market or if its valuation has not changed for a certain period of time. |
| Period Acquired | Shares/ Par | Security | Cost Basis | |||||||
| 03/2011 | 206,275 | KCA Deutag | $ | 2,796 | ||||||
| 03/2010 - 04/2010 | 38 | Stratus Technologies, Inc. | – | |||||||
| 03/2010 - 04/2010 | 9 | Stratus Technologies, Inc. Preferred | – | |||||||
At December 31, 2013, the aggregate value of these securities was $1,686, which represents 0.3% of total net assets.
| ۞ | Convertible security. |
| ♠ | Perpetual maturity security. Maturity date shown is the next call date. |
| ╬ | All principal or contract amounts are in U.S. dollars unless otherwise indicated. |
| ☼ | This security, or a portion of this security, was purchased on a when-issued, delayed-delivery or delayed-draw basis. The cost of these securities was $2,803 at December 31, 2013. |
| ‡ | This security, or a portion of this security, has been segregated to cover funding requirements on investment transactions settling in the future. |
| Þ | This security may pay interest in additional principal instead of cash. |
The accompanying notes are an integral part of these financial statements.
| 10 |
Foreign Currency Contracts Outstanding at December 31, 2013
| Currency | Buy / Sell | Delivery Date | Counterparty | Contract Amount | Market Value ╪ | Unrealized Appreciation/ (Depreciation) | ||||||||||||||
CAD | Sell | 01/22/2014 | RBC | $ | 1,279 | $ | 1,281 | $ | (2 | ) | ||||||||||
Credit Default Swap Contracts Outstanding at December 31, 2013
| Reference Entity | Counterparty/ Clearinghouse | Notional Amount (a) | (Pay)/Receive Fixed Rate | Expiration Date | Upfront Premiums Paid/ (Received) | Market Value ╪ | Unrealized Appreciation/ (Depreciation) | |||||||||||||||||||
| Credit default swaps on traded indices: | ||||||||||||||||||||||||||
| Sell protection: | ||||||||||||||||||||||||||
| CDX.NA.HY.20 | CME | $ | 12,590 | 5.00 | % | 06/20/18 | $ | 567 | $ | 1,199 | $ | 632 | ||||||||||||||
| (a) | The maximum potential amount the Fund could be required to pay as a seller of credit protection or receive as a buyer of credit protection if a credit event occurs as defined under the terms of that particular swap agreement. Notional shown in U.S. dollars unless otherwise noted. |
Cash of $489 was pledged as initial margin deposit and collateral for daily variation margin loss on centrally cleared swap contracts as of December 31, 2013.
| ╪ | See Significant Accounting Policies of accompanying Notes to Financial Statements regarding valuation of securities. |
| GLOSSARY: (abbreviations used in preceding Schedule of Investments) | ||
| Counterparty Abbreviations: | ||
| CME | Chicago Mercantile Exchange | |
| RBC | RBC Dominion Securities | |
| Currency Abbreviations: | ||
| CAD | Canadian Dollar | |
| Index Abbreviations: | ||
| CDX.NA.HY | Credit Derivatives North American High Yield | |
| Other Abbreviations: | ||
| FFCB | Federal Farm Credit Bank | |
| FHLMC | Federal Home Loan Mortgage Corp. | |
| FNMA | Federal National Mortgage Association | |
| GNMA | Government National Mortgage Association | |
| LIBOR | London Interbank Offered Rate | |
The accompanying notes are an integral part of these financial statements.
| 11 |
Investment Valuation Hierarchy Level Summary
December 31, 2013
(000’s Omitted)
| Total | Level 1 ♦ | Level 2 ♦ | Level 3 | |||||||||||||
| Assets: | ||||||||||||||||
| Asset & Commercial Mortgage Backed Securities | $ | – | $ | – | $ | – | $ | – | ||||||||
| Common Stocks ‡ | 1,526 | – | – | 1,526 | ||||||||||||
| Corporate Bonds | 460,470 | – | 460,470 | – | ||||||||||||
| Preferred Stocks | 7,644 | 7,484 | – | 160 | ||||||||||||
| Senior Floating Rate Interests | 35,365 | – | 35,365 | – | ||||||||||||
| Short-Term Investments | 4,312 | – | 4,312 | – | ||||||||||||
| Total | $ | 509,317 | $ | 7,484 | $ | 500,147 | $ | 1,686 | ||||||||
| Credit Default Swaps * | 632 | – | 632 | – | ||||||||||||
| Total | $ | 632 | $ | – | $ | 632 | $ | – | ||||||||
| Liabilities: | ||||||||||||||||
| Foreign Currency Contracts * | 2 | – | 2 | – | ||||||||||||
| Total | $ | 2 | $ | – | $ | 2 | $ | – | ||||||||
| ♦ | For the year ended December 31, 2013, there were no transfers between Level 1 and Level 2. |
| ‡ | The Fund has all or primarily all of the equity securities categorized in a particular level. Refer to the Schedule of Investments for further industry breakout. |
| * | Derivative instruments (excluding purchased and written options, if applicable) are valued at the unrealized appreciation/depreciation on the investments. |
Following is a reconciliation of Level 3 assets for which significant unobservable inputs were used to determine fair value:
| Balance as of December 31, 2012 | Realized Gain (Loss) | Change in Unrealized Appreciation (Depreciation) | Net Amortization | Purchases | Sales | Transfers Into Level 3 | Transfers Out of Level 3 | Balance as of December 31, 2013 | ||||||||||||||||||||||||||||
| Assets: | ||||||||||||||||||||||||||||||||||||
| Asset & Commercial Mortgage Backed Securities | $ | — | $ | — | $ | — | * | $ | — | $ | — | $ | — | $ | — | $ | — | $ | — | |||||||||||||||||
| Common Stocks | 1,073 | — | 453 | † | — | — | — | — | — | 1,526 | ||||||||||||||||||||||||||
| Preferred Stocks | 149 | — | 11 | ‡ | — | — | — | — | — | 160 | ||||||||||||||||||||||||||
| Total | $ | 1,222 | $ | — | $ | 464 | $ | — | $ | — | $ | — | $ | — | $ | — | $ | 1,686 | ||||||||||||||||||
| * | Change in unrealized appreciation (depreciation) in the current period relating to assets still held at December 31, 2013 was zero. |
| † | Change in unrealized appreciation (depreciation) in the current period relating to assets still held at December 31, 2013 was $453. |
| ‡ | Change in unrealized appreciation (depreciation) in the current period relating to assets still held at December 31, 2013 was $11. |
| Note: | For purposes of reporting transfers between different hierarchy levels, both transfers in and out of each level, as applicable, are shown as if they occurred at the beginning of the period. |
The accompanying notes are an integral part of these financial statements.
| 12 |
Statement of Assets and Liabilities
December 31, 2013
(000’s Omitted)
| Assets: | ||||
| Investments in securities, at market value (cost $497,628) | $ | 509,317 | ||
| Cash | 650 | * | ||
| Receivables: | ||||
| Fund shares sold | 309 | |||
| Dividends and interest | 7,944 | |||
| Variation margin on financial derivative instruments | 37 | |||
| Total assets | 518,257 | |||
| Liabilities: | ||||
| Unrealized depreciation on foreign currency contracts | 2 | |||
| Payables: | ||||
| Investment securities purchased | 2,803 | |||
| Fund shares redeemed | 260 | |||
| Investment management fees | 79 | |||
| Distribution fees | 7 | |||
| Accrued expenses | 65 | |||
| Total liabilities | 3,216 | |||
| Net assets | $ | 515,041 | ||
| Summary of Net Assets: | ||||
| Capital stock and paid-in-capital | $ | 487,634 | ||
| Undistributed net investment income | 34,482 | |||
| Accumulated net realized loss | (19,393 | ) | ||
| Unrealized appreciation of investments and the translations of assets and liabilities denominated in foreign currency | 12,318 | |||
| Net assets | $ | 515,041 | ||
| Shares authorized | 2,800,000 | |||
| Par value | $ | 0.001 | ||
| Class IA: Net asset value per share | $ | 8.90 | ||
| Shares outstanding | 43,766 | |||
| Net assets | $ | 389,340 | ||
| Class IB: Net asset value per share | $ | 8.77 | ||
| Shares outstanding | 14,341 | |||
| Net assets | $ | 125,701 |
*Cash of $489 was pledged as initial margin deposit and collateral for daily variation margin loss on open financial derivative instruments at December 31, 2013.
The accompanying notes are an integral part of these financial statements.
| 13 |
Statement of Operations
For the Year Ended December 31, 2013
(000’s Omitted)
| Investment Income: | ||||
| Dividends | $ | 652 | ||
| Interest | 38,149 | |||
| Total investment income, net | 38,801 | |||
| Expenses: | ||||
| Investment management fees | 4,068 | |||
| Transfer agent fees | 5 | |||
| Distribution fees - Class IB | 343 | |||
| Custodian fees | 13 | |||
| Accounting services fees | 117 | |||
| Board of Directors' fees | 15 | |||
| Audit fees | 16 | |||
| Other expenses | 160 | |||
| Total expenses (before fees paid indirectly) | 4,737 | |||
| Custodian fee offset | — | |||
| Total fees paid indirectly | — | |||
| Total expenses, net | 4,737 | |||
| Net Investment Income | 34,064 | |||
| Net Realized Gain on Investments, Other Financial Instruments and Foreign Currency Transactions: | ||||
| Net realized gain on investments | 13,363 | |||
| Net realized gain on swap contracts | 1,247 | |||
| Net realized gain on foreign currency contracts | 86 | |||
| Net realized loss on other foreign currency transactions | (1 | ) | ||
| Net Realized Gain on Investments, Other Financial Instruments and Foreign Currency Transactions | 14,695 | |||
| Net Changes in Unrealized Depreciation of Investments, Other Financial Instruments and Foreign Currency Transactions: | ||||
| Net unrealized depreciation of investments | (14,291 | ) | ||
| Net unrealized appreciation of swap contracts | 546 | |||
| Net unrealized depreciation of foreign currency contracts | (10 | ) | ||
| Net unrealized depreciation on translation of other assets and liabilities in foreign currencies | (1 | ) | ||
| Net Changes in Unrealized Depreciation of Investments, Other Financial Instruments and Foreign Currency Transactions | (13,756 | ) | ||
| Net Gain on Investments, Other Financial Instruments and Foreign Currency Transactions | 939 | |||
| Net Increase in Net Assets Resulting from Operations | $ | 35,003 |
The accompanying notes are an integral part of these financial statements.
| 14 |
Statement of Changes in Net Assets
(000’s Omitted)
| For the Year Ended December 31, 2013 | For the Year Ended December 31, 2012 | |||||||
| Operations: | ||||||||
| Net investment income | $ | 34,064 | $ | 43,715 | ||||
| Net realized gain on investments, other financial instruments and foreign currency transactions | 14,695 | 13,105 | ||||||
| Net unrealized appreciation (depreciation) of investments, other financial instruments and foreign currency transactions | (13,756 | ) | 33,552 | |||||
| Net Increase in Net Assets Resulting from Operations | 35,003 | 90,372 | ||||||
| Distributions to Shareholders: | ||||||||
| From net investment income | ||||||||
| Class IA | (33,749 | ) | (44,027 | ) | ||||
| Class IB | (10,240 | ) | (13,154 | ) | ||||
| Total distributions | (43,989 | ) | (57,181 | ) | ||||
| Capital Share Transactions: | ||||||||
| Class IA | ||||||||
| Sold | 71,995 | 117,583 | ||||||
| Issued on reinvestment of distributions | 33,749 | 44,027 | ||||||
| Redeemed | (213,606 | ) | (232,004 | ) | ||||
| Total capital share transactions | (107,862 | ) | (70,394 | ) | ||||
| Class IB | ||||||||
| Sold | 26,312 | 28,736 | ||||||
| Issued on reinvestment of distributions | 10,240 | 13,154 | ||||||
| Redeemed | (57,755 | ) | (60,263 | ) | ||||
| Total capital share transactions | (21,203 | ) | (18,373 | ) | ||||
| Net decrease from capital share transactions | (129,065 | ) | (88,767 | ) | ||||
| Net Decrease in Net Assets | (138,051 | ) | (55,576 | ) | ||||
| Net Assets: | ||||||||
| Beginning of period | 653,092 | 708,668 | ||||||
| End of period | $ | 515,041 | $ | 653,092 | ||||
| Undistributed (distribution in excess of) | ||||||||
| net investment income | $ | 34,482 | $ | 43,954 | ||||
| Shares: | ||||||||
| Class IA | ||||||||
| Sold | 7,914 | 12,934 | ||||||
| Issued on reinvestment of distributions | 3,933 | 5,076 | ||||||
| Redeemed | (23,548 | ) | (25,580 | ) | ||||
| Total share activity | (11,701 | ) | (7,570 | ) | ||||
| Class IB | ||||||||
| Sold | 2,947 | 3,207 | ||||||
| Issued on reinvestment of distributions | 1,210 | 1,537 | ||||||
| Redeemed | (6,452 | ) | (6,746 | ) | ||||
| Total share activity | (2,295 | ) | (2,002 | ) | ||||
The accompanying notes are an integral part of these financial statements.
| 15 |
Notes to Financial Statements
December 31, 2013
(000’s Omitted)
| 1. | Organization: |
Hartford High Yield HLS Fund (the “Fund”) serves as an underlying investment option for certain variable annuity and variable life insurance separate accounts of Hartford Life Insurance Company (“HLIC”) and its affiliates and certain qualified retirement plans. The Fund may also serve as an underlying investment option for certain variable annuity and variable life separate accounts of other insurance companies. Owners of variable annuity contracts and policyholders of variable life insurance contracts may choose the funds permitted in the variable insurance contract prospectus. In addition, participants in certain qualified retirement plans may choose the Fund if permitted by their plans.
Hartford Series Fund, Inc. (the “Company”) is an open-end registered management investment company comprised of thirty portfolios. Financial statements for the Fund, a series of the Company, are included in this report.
The Company is organized under the laws of the State of Maryland and is registered with the Securities and Exchange Commission (“SEC”) under the Investment Company Act of 1940, as amended (“1940 Act”). The Fund is a diversified open-end management investment company.
The Fund is divided into Class IA and Class IB shares. Each class is offered at the per share net asset value (“NAV”) without a sales charge and is subject to the same expenses, except that the Class IB shares are subject to distribution and service fees charged pursuant to a Distribution Plan adopted in accordance with Rule 12b-1 under the 1940 Act.
| 2. | Significant Accounting Policies: |
The following is a summary of significant accounting policies of the Fund in the preparation of its financial statements, which are in accordance with United States Generally Accepted Accounting Principles (“U.S. GAAP”). The preparation of financial statements in accordance with U.S. GAAP may require management to make estimates and assumptions that affect the reported amounts of assets and liabilities and disclosure of contingent assets and liabilities at the date of the financial statements and the reported amounts of increases and decreases in net assets from operations during the reporting period. Actual results could differ from those estimates.
| a) | Determination of Net Asset Value – The NAV of each class of the Fund’s shares is determined as of the close of regular trading (normally 4:00 p.m. Eastern Time) (the “NYSE Close”) on each day that the New York Stock Exchange (the “Exchange”) is open (“Valuation Date”). Information that becomes known to the Fund after the NAV has been calculated on a particular day will not generally be used to retroactively adjust the NAV determined earlier that day. |
| b) | Investment Valuation and Fair Value Measurements – For purposes of calculating the NAV, portfolio investments and other assets held by the Fund's portfolio for which market quotes are readily available are valued at market value. Market value is generally determined on the basis of last reported sales prices or official close price. If no sales are reported, market value is based on quotes obtained from a quotation reporting system, established market makers, or independent pricing services. If market prices are not readily available or are deemed unreliable, the Fund will use the fair value of the investment as determined in good faith under policies and procedures established by and under the supervision of the Company’s Board of Directors. Market quotes are considered not readily available where there is an absence of current or reliable market-based data (e.g., trade information or indicative market quotes), including where events occur after the close of the relevant market, but prior to the NYSE Close, that materially affect the values of the Fund’s portfolio investments or assets. In addition, market quotes are considered not readily available when, due to extraordinary circumstances, the exchanges or markets on which the investments trade do not open for trading for the entire day and no other market prices are available. In addition, prices of foreign equities that are principally traded on certain foreign markets may be adjusted daily pursuant to a fair value pricing service approved by the Board of Directors in order to reflect an adjustment for the factors occurring after the close of certain foreign markets but before the NYSE Close. Investments that are primarily traded on foreign markets may trade on days that are not business days of the Fund. The value of the foreign investments in which the Fund invests may change on days when a shareholder will not be able to |
| 16 |
purchase or redeem shares of the Fund. Fair value pricing is subjective in nature and the use of fair value pricing by the Fund may cause the NAV of its shares to differ significantly from the NAV that would have been calculated using market prices at the close of the exchange on which a portfolio investment is primarily traded. There can be no assurance that the Fund could obtain the fair market value assigned to an investment if the Fund were to sell the investment at approximately the time at which the Fund determines its NAV.
Fixed income investments (other than short-term obligations), non-exchange traded derivatives and centrally cleared swaps held by the Fund are normally valued on the basis of quotes obtained from brokers and dealers or independent pricing services in accordance with procedures established by the Company’s Board of Directors. Prices obtained from independent pricing services use information provided by market makers or estimates of market values through accepted market modeling, trading and pricing conventions. Inputs to the models may include, but are not limited to, prepayment speeds, pricing spread, yield, trade information, dealer quotes, market color, cash flow models and the investment’s terms and conditions. Generally, the Fund may use fair valuation in regard to fixed income investments when the Fund holds defaulted or distressed investments or investments in a company in which a reorganization is pending. Senior floating rate interests generally trade in over-the-counter (“OTC”) markets and are priced through an independent pricing service utilizing independent market quotations from loan dealers or financial institutions. A composite bid price is used, which is an average of the dealer marks and dealer runs. Short-term investments maturing in 60 days or less are generally valued at amortized cost, if their original term to maturity was 60 days or less, or by amortizing their value on the 61st day prior to maturity, if the original term to maturity exceeded 60 days.
Investments valued in currencies other than U.S. dollars are converted to U.S. dollars using exchange rates obtained from independent pricing services for calculation of the NAV. As a result, the NAV of the Fund’s shares may be affected by changes in the value of currencies in relation to the U.S. dollar. The value of investments traded in markets outside the United States or denominated in currencies other than the U.S. dollar may be affected significantly on a day that the NYSE is closed and the market value may change on days when an investor is not able to purchase, redeem or exchange shares of the Fund.
Foreign currency contracts represent agreements to exchange currencies on specific future dates at predetermined rates. Foreign currency contracts are valued using foreign currency exchange rates and forward rates as provided by an independent pricing service on the Valuation Date.
Investments in open-end mutual funds are valued at the respective NAV of each open-end mutual fund on the Valuation Date.
Financial instruments for which prices are not available from an independent pricing service may be valued using market quotations obtained from one or more dealers that make markets in the respective financial instrument in accordance with procedures established by the Company’s Board of Directors.
U.S. GAAP defines fair value as the price that the Fund would receive to sell an asset or pay to transfer a liability in an orderly transaction between market participants. The U.S. GAAP fair value measurement standards require disclosure of a fair value hierarchy for each major category of assets and liabilities. Various inputs are used in determining the fair value of the Fund’s investments. These inputs are summarized into three broad hierarchy levels. This hierarchy is based on whether the valuation inputs are observable or unobservable. These levels are:
| · | Level 1 – Quoted prices in active markets for identical investments. Level 1 may include exchange traded instruments, such as domestic equities, some foreign equities, options, futures, mutual funds, exchange traded funds, rights and warrants. |
| · | Level 2 – Observable inputs other than Level 1 prices, such as quoted prices for similar investments; quoted prices in markets that are not active; or other inputs that are observable or can be corroborated by observable market data. Level 2 may include debt investments that are traded less frequently than exchange traded |
| 17 |
Hartford High Yield HLS Fund
Notes to Financial Statements – (continued)
December 31, 2013
(000’s Omitted)
instruments and which are valued using independent pricing services; foreign equities, which are principally traded on certain foreign markets and are adjusted daily pursuant to a fair value pricing service in order to reflect an adjustment for the factors occurring after the close of certain foreign markets but before the NYSE Close; senior floating rate interests, which are valued using an aggregate of dealer bids; short-term investments, which are valued at amortized cost; and swaps, which are valued based upon the terms of each swap contract.
| · | Level 3 – Significant unobservable inputs that are supported by limited or no market activity. Level 3 may include financial instruments whose values are determined using indicative market quotes or require significant management judgment or estimation. These unobservable valuation inputs may include estimates for current yields, maturity/duration, prepayment speed, and indicative market quotes for comparable investments along with other assumptions relating to credit quality, collateral value, complexity of the investment structure, general market conditions and liquidity. This category may include investments where trading has been halted or there are certain restrictions on trading. While these investments are priced using unobservable inputs, the valuation of these investments reflects the best available data and management believes the prices are a reasonable representation of exit price. |
The Board of Directors of the Company generally reviews and approves the “Procedures for Valuation of Portfolio Securities” on an annual basis. These procedures define how investments are to be valued, including the formation and activities of a Valuation Committee. The Valuation Committee is responsible for determining in good faith the fair value of investments when the value cannot be obtained from primary pricing services or alternative sources or if the valuation of an investment as provided by the primary pricing service or alternative source is believed not to reflect the investment’s fair value as of the Valuation Date. Voting members of the Valuation Committee include the Fund’s Treasurer or designee and a Vice President of the investment manager or designee. An Assistant Vice President of the Fund with legal expertise or designee is also included on the Valuation Committee as a non-voting advisory member. In addition, the Fund’s Chief Compliance Officer shall designate a member of the compliance group to attend Valuation Committee meetings as a non-voting resource, to monitor for and provide guidance with respect to compliance with these procedures. Two members of the Valuation Committee or their designees, representing different departments, shall constitute a quorum for purposes of permitting the Valuation Committee to take action. The Valuation Committee will consider all relevant factors in determining an investment’s fair value, and may seek the advice of the Fund’s sub-adviser, knowledgeable brokers, and legal counsel in making such determination. The Valuation Committee reports to the Audit Committee of the Company’s Board of Directors. The Audit Committee receives quarterly written reports which include details of all fair-valued investments, including the reason for the fair valuation, and an indication, when possible, of the accuracy of the valuation by disclosing the next available reliable public price quotation or the disposition price of such investments (the “look-back” test). The Board of Directors then must consider for ratification all of the fair value determinations made during the previous quarter.
Valuation levels are not necessarily indicative of the risk associated with investing in such investments. Individual investments within any of the above mentioned asset classes may be assigned a different hierarchical level than those presented above, as individual circumstances dictate.
For additional information, refer to the Investment Valuation Hierarchy Level Summary and the Level 3 roll-forward reconciliation, if applicable, which follow the Schedule of Investments.
| c) | Investment Transactions and Investment Income – Investment transactions are recorded as of the trade date (the date the order to buy or sell is executed) for financial reporting purposes. Investments purchased or sold on a when-issued or delayed-delivery basis may be settled a month or more after the trade date. Realized gains and losses are determined on the basis of identified cost. |
The trade date for senior floating rate interests purchased in the primary loan market is considered the date on which the loan allocations are determined. The trade date for senior floating rate interests purchased in the secondary loan market is the date on which the transaction is entered into.
| 18 |
Dividend income from domestic securities is accrued on the ex-dividend date. In general, dividend income from foreign securities is recorded on the ex-date; however, dividend notifications in certain foreign jurisdictions may not be available in a timely manner and as a result, the Fund will record the dividend as soon as the relevant details (i.e., rate per share, payment date, shareholders of record, etc.) are publicly available. Interest income, including amortization of premium, accretion of discounts and additional principal received in-kind in lieu of cash, is accrued on a daily basis. Paydown gains and losses on mortgage related and other asset backed securities are included in interest income in the Statement of Operations, as applicable.
| d) | Foreign Currency Transactions – Assets and liabilities denominated in currencies other than U.S. dollars are translated into U.S. dollars at the exchange rates in effect on the valuation date. Purchases and sales of investments, income and expenses are translated into U.S. dollars at the exchange rates on the dates of such transactions. |
The Fund does not isolate that portion of portfolio investment valuation resulting from fluctuations in the foreign currency exchange rates from the fluctuations arising from changes in the market prices of investments held. Exchange rate fluctuations are included with the net realized and unrealized gain or loss on investments in the accompanying financial statements.
Net realized foreign exchange gains or losses arise from sales of foreign currencies and the difference between asset and liability amounts initially stated in foreign currencies and the U.S. dollar value of the amounts actually received or paid. Net unrealized foreign exchange gains or losses arise from changes in the value of other assets and liabilities at the end of the reporting period, resulting from changes in the exchange rates.
| e) | Joint Trading Account – The Fund may invest cash balances into a joint trading account that may be invested in one or more repurchase agreements. |
| f) | Fund Share Valuation and Dividend Distributions to Shareholders – Orders for the Fund’s shares are executed in accordance with the investment instructions of the contract holders and plan participants. The NAV of the Fund’s shares is determined as of the close of business on each business day of the Exchange. The NAV is determined separately for each class of shares of the Fund by dividing the Fund’s net assets attributable to that class by the number of shares of the class outstanding. Each class of shares offered by the Fund has equal rights as to assets and voting privileges (except that shareholders of a class have exclusive voting rights regarding any matter relating solely to that class of shares). Income and non-class specific expenses are allocated daily to each class on the basis of the relative net assets of the class. Realized and unrealized gains and losses are allocated daily based on the relative net assets of each class of shares of the Fund. |
Orders for the purchase of the Fund’s shares received prior to the close of the Exchange on any day the Exchange is open for business are priced at the NAV determined as of the close of the Exchange. Orders received after the close of the Exchange, or on a day on which the Exchange and/or the Fund is not open for business, are priced at the next determined NAV.
Dividends are declared pursuant to a policy adopted by the Company’s Board of Directors based upon the investment performance of the Fund. The policy of the Fund is to pay dividends from net investment income and realized gains, if any, at least once a year.
Distributions from net investment income, net realized gains and capital are determined in accordance with federal income tax regulations, which may differ from U.S. GAAP with respect to character and timing. These differences may include but are not limited to losses deferred due to wash sale adjustments, foreign currency gains and losses, adjustments related to Passive Foreign Investment Companies (“PFICs”), Real Estate Investment Trusts (“REITs”), Regulated Investment Companies (“RICs”), certain derivatives and partnerships. Permanent book and federal income tax
| 19 |
Hartford High Yield HLS Fund
Notes to Financial Statements – (continued)
December 31, 2013
(000’s Omitted)
basis differences relating to shareholder distributions will result in reclassifications to certain of the Fund’s capital accounts (see Federal Income Taxes: Reclassification of Capital Accounts note).
| 3. | Securities and Other Investments: |
| a) | Repurchase Agreements – A repurchase agreement is an agreement by which a counterparty agrees to sell an investment and agrees to repurchase the investment sold from the buyer at a mutually agreed upon time and price. During the period of the repurchase agreement, the counterparty will deposit cash and or securities in a third party custodial account to serve as collateral. At the time the Fund enters into a repurchase agreement, the value of the underlying collateral, including accrued interest, will be equal to or exceed the value of the repurchase agreement. Repurchase agreements expose the Fund to counterparty risk - that is, the risk that the counterparty will not fulfill its obligations. To minimize counterparty risk, the investments that serve to collateralize the repurchase agreement are held by the Fund’s custodian in book entry or physical form in the custodial account of the Fund or in a third party custodial account. Repurchase agreements are valued at cost plus accrued interest, which approximates fair value. Repurchase agreements have master netting arrangements which allow the Fund to offset amounts owed to a counterparty with amounts owed by the counterparty, including any collateral. Upon an event of default under a master repurchase agreement, the non-defaulting party may close out all transactions traded under such agreement and net amounts owed under each transaction to one net amount payable by one party to the other. Absent an event of default, the master repurchase agreement does not result in an offset of reported amounts of assets and liabilities in the Statement of Assets and Liabilities across transactions between the Fund and the applicable counterparty. The Fund, as shown on the Schedule of Investments, had outstanding repurchase agreements and related collateral as of December 31, 2013. |
| b) | Illiquid and Restricted Investments – The Fund is permitted to invest up to 15% of its net assets in illiquid investments. Illiquid investments are those that may not be sold or disposed of in the ordinary course of business within seven days, at approximately the price used to determine the Fund’s NAV. The Fund may not be able to sell illiquid investments when its sub-adviser considers it desirable to do so or may have to sell such investments at a price that is lower than the price that could be obtained if the investments were more liquid. A sale of illiquid investments may require more time and may result in higher dealer discounts and other selling expenses than does the sale of those that are liquid. Illiquid investments also may be more difficult to value due to the unavailability of reliable market quotations for such investments, and an investment in them may have an adverse impact on the Fund’s NAV. The Fund may also purchase certain restricted investments that can only be resold to certain qualified investors and may be determined to be liquid pursuant to policies and guidelines established by the Company’s Board of Directors. The Fund, as shown on the Schedule of Investments, had illiquid and/or restricted investments as of December 31, 2013. |
| c) | Investments Purchased on a When-Issued or Delayed-Delivery Basis – Delivery and payment for investments that have been purchased by the Fund on a forward commitment, or when-issued or delayed-delivery basis, take place beyond the customary settlement period. The Fund may dispose of or renegotiate a delayed-delivery transaction after it is entered into, and may sell delayed-delivery investments before they are delivered, which may result in a realized gain or loss. During this period, such investments are subject to market fluctuations, and the Fund identifies investments segregated in its records with a value at least equal to the amount of the commitment. The Fund, as shown on the Schedule of Investments, had when-issued or delayed-delivery investments as of December 31, 2013. |
| d) | Senior Floating Rate Interests – The Fund, as shown on the Schedule of Investments, invests in senior floating rate interests. Senior floating rate interests hold the most senior position in the capital structure of a business entity (the “Borrower”), are typically secured by specific collateral and have a claim on the assets and/or stock of the Borrower that is senior to that held by subordinated debtholders and stockholders of the Borrower. Senior floating rate interests are typically structured and administered by a financial institution that acts as the agent of the lenders participating in the senior floating rate interest. The Fund may invest in multiple series or tranches of a senior floating rate interest, which may have varying terms and carry different associated risks. The Fund may also enter into unfunded loan commitments, which are contractual obligations for future funding. Unfunded loan commitments may include revolving credit facilities, which may obligate the Fund to supply additional cash to the borrower on demand. Unfunded loan commitments |
| 20 |
represent a future obligation in full. The Fund may receive a commitment fee based on the undrawn portion of the underlying line of credit portion of a senior floating rate interest. In certain circumstances, the Fund may receive various fees upon the restructure of a senior floating rate interest by a borrower. Fees earned/paid may be recorded as a component of income or realized gain/loss in the Statement of Operations.
Senior floating rate interests are typically rated below-investment-grade, which suggests they are more likely to default and generally pay higher interest rates than investment-grade loans. A default could lead to non-payment of income, which would result in a reduction of income to the Fund, and there can be no assurance that the liquidation of any collateral would satisfy the Borrower’s obligation in the event of non-payment of scheduled interest or principal payments, or that such collateral could be readily liquidated.
| e) | Mortgage Related and Other Asset Backed Securities – The Fund may invest in mortgage related and other asset backed securities. These securities include mortgage pass-through securities, collateralized mortgage obligations, commercial mortgage backed securities, stripped mortgage backed securities, asset backed securities, collateralized debt obligations and other securities that directly or indirectly represent a participation in, or are secured by and payable from, mortgage loans on real property. Mortgage related securities are created from pools of residential or commercial mortgage loans, including mortgage loans made by savings and loan institutions, mortgage bankers, commercial banks and others. Asset backed securities are created from many types of assets, including auto loans, credit card receivables, home equity loans, and student loans. These securities provide a monthly payment that consists of both interest and principal payments. Interest payments may be determined by fixed or adjustable rates. The rate of pre-payments on underlying mortgages will affect the price and volatility of a mortgage related security, and may have the effect of shortening or extending the effective duration of the security relative to what was anticipated at the time of purchase. The timely payment of principal and interest of certain mortgage related securities is guaranteed by the full faith and credit of the United States Government. Mortgage related and other asset backed securities created and guaranteed by non-governmental issuers, including government-sponsored corporations, may be supported by various forms of insurance or guarantees, but there can be no assurance that the private insurers or guarantors can meet their obligations under the insurance policies or guarantee arrangements. The Fund, as shown on the Schedule of Investments, had mortgage related and other asset backed securities as of December 31, 2013. |
| 4. | Financial Derivative Instruments: |
The following disclosures contain information on how and why the Fund uses derivative instruments, the credit-risk-related contingent features in certain derivative instruments, and how derivative instruments affect the Fund’s financial position and results of operations. The location and fair value amounts of these instruments on the Statement of Assets and Liabilities and the realized gains and losses and changes in unrealized gains and losses on the Statement of Operations, each categorized by type of derivative contract, are included in the following Additional Derivative Instrument Information footnote. The derivative instruments outstanding as of year-end are disclosed in the notes to or within the Schedule of Investments for purchased options, if applicable. The amounts of realized gains and losses and changes in unrealized gains and losses on derivative instruments during the year are disclosed in the Statement of Operations.
| a) | Foreign Currency Contracts – The Fund may enter into foreign currency contracts that obligate the Fund to purchase or sell currencies at specified future dates. Foreign currency contracts are used to hedge the currency exposure associated with some or all of the Fund’s investments and/or as part of an investment strategy. Foreign currency contracts are marked to market daily and the change in value is recorded by the Fund as an unrealized gain or loss. The Fund will record a realized gain or loss when the foreign currency contract is settled. |
Foreign currency contracts involve elements of market risk in excess of the amounts reflected in the Statement of Assets and Liabilities. In addition, risks may arise upon entering into these contracts from the potential inability of the counterparties to meet the terms of the contracts and from unanticipated movements in the value of the foreign currencies
| 21 |
| Hartford High Yield HLS Fund |
| Notes to Financial Statements – (continued) |
| December 31, 2013 |
| (000’s Omitted) |
relative to the U.S. dollar. The Fund had outstanding foreign currency contracts as shown on the Schedule of Investments as of December 31, 2013.
| b) | Swap Contracts – The Fund may invest in swap contracts. Swap contracts are agreements to exchange or swap investment cash flows, assets, foreign currencies or market-linked returns at specified, future intervals. Swap contracts are either privately negotiated in the over-the-counter market (“OTC swaps”) or executed in a multilateral or other trade facility platform, such as a registered exchange (“centrally cleared swaps”). The Fund may enter into credit default, total return, cross-currency, interest rate, inflation and other forms of swap contracts to manage its exposure to credit, currency, interest rate, commodity and inflation risk. Swap contracts are also used to gain exposure to certain markets. In connection with these contracts, investments or cash may be identified as collateral or margin in accordance with the terms of the respective swap contracts and/or master netting arrangement to provide assets of value and recourse in the event of default or bankruptcy/insolvency. |
Swaps are valued based on custom valuations furnished by an independent pricing service. Swaps for which prices are not available from an independent pricing service are valued in accordance with procedures established by the Company’s Board of Directors. Changes in market value, if any, are reflected as a component of net changes in unrealized appreciation or depreciation on the Statement of Operations. Daily changes in valuation of centrally cleared swaps, if any, are recorded as a receivable or payable for the change in value as appropriate (“variation margin”) on the Statement of Assets and Liabilities. Realized gains or losses on centrally cleared swaps are recorded upon the termination of the swap. OTC swap payments received or made at the beginning of the measurement period are reflected as such on the Statement of Assets and Liabilities and represent premiums paid or received upon entering into the swap contract to compensate for differences between the stated terms of the swap contract and prevailing market conditions (credit spreads, currency exchange rates, interest rates and other relevant factors). These upfront premiums are recorded as realized gains or losses on the Statement of Operations upon termination or maturity of the swap. A liquidation payment received or made at the termination or maturity of the swap is recorded as a realized gain or loss on the Statement of Operations. Net periodic payments received or paid by the Fund are included as part of realized gains or losses on the Statement of Operations.
Entering into these contracts involves, to varying degrees, elements of liquidation, counterparty, credit and market risk in excess of the amounts recognized on the Statement of Assets and Liabilities. Such risks involve the possibility that there will be no liquid market for these contracts, that the counterparty to the contracts may default on its obligation to perform or disagree as to the meaning of contractual terms in the contracts, and that there may be unfavorable changes in market conditions (credit spreads, currency exchange rates, interest rates and other relevant factors).
The Fund’s maximum risk of loss from credit risk for OTC swaps is the net value of the discounted cash flows to be received from the counterparty over the contract’s remaining life, and current market value, to the extent that amount is positive. The risk is mitigated by having a master netting arrangement between the Fund and the counterparty, which allows for the netting of payments made or received (although such amounts are presented on a gross basis within the Statement of Assets and Liabilities, as applicable) as well as the posting of collateral to the Fund to cover the Fund’s exposure to the counterparty. In a centrally cleared swap, while the Fund enters into an agreement with a clearing broker to execute contracts with a counterparty, the performance of the swap is guaranteed by the central clearinghouse, which reduces the Fund’s exposure to credit risk. The Fund is still exposed to the credit risk of the clearing broker and clearinghouse. The clearinghouse attempts to minimize this risk to all of its participants through the use of mandatory margin requirements, daily cash settlements, and other procedures designed to protect counterparties utilizing the clearinghouse. Likewise, the clearing broker reduces its risk through margin requirements and required segregation of customer balances.
Credit Default Swap Contracts – The credit default swap market allows the Fund to manage its exposure to the market or certain sectors of the market, to reduce its risk exposure to defaults of corporate and sovereign issuers, or to create exposure to corporate or sovereign issuers to which it is not otherwise exposed. Certain credit default swaps involve the
| 22 |
exchange of a fixed rate premium for protection against the loss in value of an underlying investment or index in the event of a credit event, such as payment default or bankruptcy.
Under a credit default swap contract, one party acts as guarantor by receiving the fixed periodic payment in exchange for the commitment to purchase the underlying investment at par if the defined credit event occurs. Upon the occurrence of a defined credit event, the difference between the value of the reference obligation and the swap’s notional amount is recorded as realized gain or loss on swap transactions in the Statement of Operations. A “buyer” of credit protection agrees to pay a counterparty to assume the credit risk of an issuer upon the occurrence of certain events. The “seller” of the protection receives periodic payments and agrees to assume the credit risk of an issuer upon the occurrence of certain events. Although specified events are contract specific, credit events are generally defined as bankruptcy, failure to pay, restructuring, obligation acceleration, obligation default or repudiation/moratorium. A “seller’s” exposure is limited to the total notional amount of the credit default swap contract. These potential amounts would be partially offset by any recovery values of the respective referenced obligations or upfront payments received upon entering into the contract.
Implied credit spreads, represented in absolute terms, utilized in determining the market value of credit default swap contracts on corporate issues, sovereign government issues or U.S. municipal issues as of year-end are disclosed in the notes to the Schedule of Investments, as applicable, and serve as an indicator of the current status of the payment/performance risk and represent the likelihood or risk of default for the credit derivative. The implied credit spread of a particular referenced entity reflects the cost of buying/selling protection and may include upfront payments required to be made to enter into the contract. Wider credit spreads represent a deterioration of the referenced entity’s credit soundness and a greater likelihood or risk of default or other credit event occurring as defined under the terms of the contract. For credit default swap contracts on asset backed securities and credit indices, the quoted market prices and resulting values serve as the indicator of the current status of the payment/performance risk. Increasing market values, in absolute terms when compared to the notional amount of the swap, represent a deterioration of the referenced equity’s credit soundness and a greater likelihood or risk of default or other credit event occurring as defined under the terms of the contract. The Fund, as shown on the Schedule of Investments, had outstanding credit default swap contracts as of December 31, 2013.
| c) | Additional Derivative Instrument Information: |
Fair Value of Derivative Instruments on the Statement of Assets and Liabilities as of December 31, 2013:
| Risk Exposure Category | ||||||||||||||||||||||||||||
| Interest Rate Contracts | Foreign Exchange Contracts | Credit Contracts | Equity Contracts | Commodity Contracts | Other Contracts | Total | ||||||||||||||||||||||
| Assets: | ||||||||||||||||||||||||||||
| Variation margin receivable * | $ | — | $ | — | $ | 37 | $ | — | $ | — | $ | — | $ | 37 | ||||||||||||||
| Total | $ | — | $ | — | $ | 37 | $ | — | $ | — | $ | — | $ | 37 | ||||||||||||||
| Liabilities: | ||||||||||||||||||||||||||||
| Unrealized depreciation on foreign currency contracts | $ | — | $ | 2 | $ | — | $ | — | $ | — | $ | — | $ | 2 | ||||||||||||||
| Total | $ | — | $ | 2 | $ | — | $ | — | $ | — | $ | — | $ | 2 | ||||||||||||||
* Only current day's variation margin is reported within the Statement of Assets and Liabilities. The variation margin is included in the open centrally cleared swaps cumulative appreciation of $632 as reported in the Schedule of Investments.
The volume of derivatives that is presented in the Schedule of Investments is consistent with the derivative activity during the year ended December 31, 2013.
| 23 |
| Hartford High Yield HLS Fund |
| Notes to Financial Statements – (continued) |
| December 31, 2013 |
| (000’s Omitted) |
The Effect of Derivative Instruments on the Statement of Operations for the year ended December 31, 2013:
| Risk Exposure Category | ||||||||||||||||||||||||||||
| Interest Rate Contracts | Foreign Exchange Contracts | Credit Contracts | Equity Contracts | Commodity Contracts | Other Contracts | Total | ||||||||||||||||||||||
| Realized Gain on Derivatives Recognized as a Result of Operations: | ||||||||||||||||||||||||||||
| Net realized gain on swap contracts | $ | — | $ | — | $ | 1,247 | $ | — | $ | — | $ | — | $ | 1,247 | ||||||||||||||
| Net realized gain on foreign currency contracts | — | 86 | — | — | — | — | 86 | |||||||||||||||||||||
| Total | $ | — | $ | 86 | $ | 1,247 | $ | — | $ | — | $ | — | $ | 1,333 | ||||||||||||||
| Net Change in Unrealized Appreciation (Depreciation) on Derivatives Recognized as a Result of Operations: | ||||||||||||||||||||||||||||
| Net change in unrealized appreciation of swap contracts | $ | — | $ | — | $ | 546 | $ | — | $ | — | $ | — | $ | 546 | ||||||||||||||
| Net change in unrealized depreciation of foreign currency contracts | — | (10 | ) | — | — | — | — | (10 | ) | |||||||||||||||||||
| Total | $ | — | $ | (10 | ) | $ | 546 | $ | — | $ | — | $ | — | $ | 536 | |||||||||||||
| d) | Balance Sheet Offsetting Information: |
Set forth below are tables which disclose both gross information and net information about instruments and transactions eligible for offset in the financial statements, and instruments and transactions that are subject to a master netting arrangement, as well as amounts related to margin, reflected as financial collateral (including cash collateral), held at clearing brokers, counterparties and the Fund’s custodian. The master netting arrangements allow the clearing brokers to net any collateral held in or on behalf of the Fund, or liabilities or payment obligations of the clearing brokers to the Fund, against any liabilities or payment obligations of the Fund to the clearing brokers. The Fund is required to deposit financial collateral (including cash collateral) at the Fund’s custodian on behalf of clearing brokers and counterparties to continually meet the original and maintenance requirements established by the clearing brokers and counterparties. Such requirements are specific to the respective clearing broker or counterparty.
Offsetting of Financial Assets and Derivative Assets as of December 31, 2013:
| Gross Amounts* of Assets Presented in Statement of Assets and Liabilities | Financial Instruments with Allowable Netting | Collateral Received | Net Amount (not less than $0) | |||||||||||||
| Description | ||||||||||||||||
| Swap contracts - Variation margin receivable | $ | 37 | $ | — | $ | — | † | $ | 37 | |||||||
| Total subject to a master netting or similar arrangement | $ | 37 | $ | — | $ | — | $ | 37 | ||||||||
| † | $489 was pledged as initial margin deposit and collateral for daily variation margin loss on centrally cleared swap contracts held at December 31, 2013. |
Offsetting of Financial Liabilities and Derivative Liabilities as of December 31, 2013:
| Gross Amounts* of Liabilities Presented in Statement of Assets and Liabilities | Financial Instruments with Allowable Netting | Collateral Pledged | Net Amount (not less than $0) | |||||||||||||
| Description | ||||||||||||||||
| Unrealized depreciation on foreign currency contracts | $ | 2 | $ | — | $ | — | $ | 2 | ||||||||
| Total subject to a master netting or similar arrangement | $ | 2 | $ | — | $ | — | $ | 2 | ||||||||
| * | Gross amounts presented as no amounts are netted within the Statement of Assets and Liabilities. |
| 24 |
| 5. | Principal Risks: |
Credit risk depends largely on the perceived financial health of bond issuers. In general, the credit rating is inversely related to the credit risk of the issuer. Higher rated bonds generally are deemed to have less credit risk, while lower or unrated bonds are deemed to have higher risk of default. The share price, yield and total return of a fund that holds securities with higher credit risk may be more volatile than those of a fund that holds bonds with lower credit risk. Similar to credit risk, the Fund may be exposed to counterparty risk, or the risk that an institution or other entity with which the Fund has unsettled or open transactions will default.
The Fund’s investments expose the Fund to various risks including, but not limited to, interest rate, prepayment, extension, foreign currency and equity risks. Interest rate risk is the risk that fixed income securities will decline in value because of changes in interest rates. As nominal interest rates rise, the values of certain fixed income securities held by the Fund are likely to decrease. A nominal interest rate can be described as the sum of a real interest rate and an expected inflation rate. Fixed income securities with longer durations tend to be more sensitive to changes in interest rates, usually making them more volatile than securities with shorter durations. Duration is useful primarily as a measure of the sensitivity of a fixed income security’s market price to interest rate (i.e., yield) movements. Senior floating rate interests and securities subject to prepayment and extension risk generally offer less potential for gains when interest rates decline. In addition, securities are subject to extension risk. Rising interest rates may cause prepayments to occur at a slower than expected rate, thereby effectively lengthening the maturity of the security and making the security more sensitive to interest rate changes. Prepayment and extension risk are major risks of mortgage backed securities, senior floating rate interests, and certain asset backed securities. For certain asset backed securities, the actual maturity may be less than the stated maturity shown in the Schedule of Investments, if applicable. As a result, the timing of income recognition relating to these securities may vary based upon the actual maturity.
If the Fund invests directly in foreign currencies or in securities that trade in, and receive revenues in, foreign currencies, or in derivatives that provide exposure to foreign currencies, it will be subject to the risk that those currencies will decline in value relative to the base currency (U.S. dollars) of the Fund, or, in the case of hedging positions, that the Fund’s base currency will decline in value relative to the currency being hedged. Currency rates in foreign countries may fluctuate significantly over short periods of time for a number of reasons, including changes in interest rates, intervention (or the failure to intervene) by U.S. or foreign governments, central banks or supranational entities, such as the International Monetary Fund, or by the imposition of currency controls or other political developments in the United States or abroad. As a result, the Fund’s investments in foreign currency denominated securities may reduce the returns of the Fund. The market values of equity securities, such as common stocks and preferred stocks, or equity related investments, such as futures and options, may decline due to general market conditions which are not specifically related to a particular company, such as real or perceived adverse economic conditions, changes in the general outlook for corporate earnings, changes in interest or currency rates or adverse investor sentiment generally. The market value of equity securities may also decline due to factors which affect a particular industry or industries, such as labor shortages or increased production costs and competitive conditions within an industry. Equity securities and equity related investments generally have greater market price volatility than fixed income securities.
| 6. | Federal Income Taxes: |
| a) | Federal Income Taxes – For federal income tax purposes, the Fund intends to continue to qualify as a RIC under Subchapter M of the Internal Revenue Code (“IRC”) by distributing substantially all of its taxable net investment income and net realized capital gains to its shareholders and otherwise complying with the requirements of the IRC. The Fund has distributed substantially all of its income and capital gains in prior years, if applicable, and intends to distribute substantially all of its income and capital gains prior to the next fiscal year-end. Accordingly, no provision for federal income or excise taxes has been made in the accompanying financial statements. Distributions from short-term capital gains are treated as ordinary income distributions for federal income tax purposes. |
| 25 |
| Hartford High Yield HLS Fund |
| Notes to Financial Statements – (continued) |
| December 31, 2013 |
| (000’s Omitted) |
| b) | Net Investment Income (Loss), Net Realized Gains (Losses) and Distributions – Net investment income (loss) and net realized gains (losses) may differ for financial statement and tax purposes primarily because of losses deferred due to wash sale adjustments, foreign currency gains and losses, adjustments related to PFICs, REITs, RICs, certain derivatives and partnerships. The character of distributions made during the year from net investment income or net realized gains may differ from their ultimate characterization for federal income tax purposes. Also, due to the timing of dividend distributions, the fiscal year in which amounts are distributed may differ from the year that the income or realized gains (losses) were recorded by the Fund. |
| c) | Distributions and Components of Distributable Earnings – The tax character of distributions paid by the Fund for the periods indicated is as follows (as adjusted for dividends payable, if applicable): |
| For the Year Ended December 31, 2013 | For the Year Ended December 31, 2012 | |||||||
| Ordinary Income | $ | 43,989 | $ | 57,181 | ||||
As of December 31, 2013, the Fund’s components of distributable earnings (deficit) on a tax basis were as follows:
| Amount | ||||
| Undistributed Ordinary Income | $ | 35,155 | ||
| Accumulated Capital and Other Losses* | (19,258 | ) | ||
| Unrealized Appreciation† | 12,182 | |||
| Total Accumulated Earnings | $ | 28,079 | ||
* The Fund has capital loss carryforwards that are identified in the Capital Loss Carryforward note that follows.
† Differences between book-basis and tax-basis unrealized appreciation (depreciation) may be attributable to the losses deferred due to wash sale adjustments, foreign currency gains and losses, adjustments related to PFICs, REITs, RICs, certain derivatives and partnerships.
| d) | Reclassification of Capital Accounts – The Fund may record reclassifications in its capital accounts. These reclassifications have no impact on the total net assets of the Fund. The reclassifications are a result of permanent differences between U.S. GAAP and tax accounting for such items as foreign currency, PFICs, expiration or utilization of capital loss carryforwards or net operating losses. Adjustments are made to reflect the impact these items have on current and future distributions to shareholders. Therefore, the source of the Fund’s distributions may be shown in the accompanying Statement of Changes in Net Assets as from undistributed net investment income, from accumulated net realized gains on investments or from capital depending on the type of book and tax differences that exist. For the year ended December 31, 2013, the Fund recorded reclassifications to increase (decrease) the accounts listed below: |
| Amount | ||||
| Undistributed Net Investment Income (Loss) | $ | 453 | ||
| Accumulated Net Realized Gain (Loss) | (453 | ) | ||
| e) | Capital Loss Carryforward – On December 22, 2010, the Regulated Investment Company Modernization Act of 2010 (the “Act”) was enacted, which made changes to the capital loss carryforward rules. The changes are effective for taxable years beginning after the date of enactment. Under the Act, funds are permitted to carry forward capital losses for an unlimited period. However, any losses incurred during those future taxable years will be required to be utilized prior to the losses incurred in pre-enactment taxable years, which carry an expiration date. As a result of this ordering rule, pre-enactment capital loss carryforwards may be more likely to expire unused. Additionally, post-enactment capital loss carryforwards retain their character as either short-term or long-term capital losses rather than being considered all short-term as permitted under prior regulation. |
| 26 |
At December 31, 2013 (tax-year-end), the Fund had capital loss carryforwards for U.S. federal income tax purposes as follows:
| Year of Expiration | Amount | |||
| 2017 | $ | 19,258 | ||
| Total | $ | 19,258 | ||
During the year ended December 31, 2013, the Fund utilized $13,881 of prior year capital loss carryforwards.
| f) | Accounting for Uncertainty in Income Taxes – The Fund has adopted financial reporting rules that require the Fund to analyze all open tax years, as defined by the statute of limitations, for all major jurisdictions. Generally, tax authorities can examine all tax returns filed for the last three years. The Fund does not have an examination in progress. |
The Fund has reviewed all open tax years and major jurisdictions and concluded that these financial reporting rules had no effect on the Fund’s financial position or results of operations. There is no tax liability resulting from unrecognized tax benefits relating to uncertain income tax positions taken or expected to be taken on the tax return for the fiscal year ended December 31, 2013. The Fund is also not aware of any tax positions for which it is reasonably possible that the total amounts of unrecognized tax benefits will significantly change in the next twelve months.
| 7. | Expenses: |
| a) | Investment Management Agreement – Hartford Funds Management Company, LLC (“HFMC”), an indirect wholly owned subsidiary of The Hartford Financial Services Group, Inc. (“The Hartford”), serves as investment manager to the Fund pursuant to an Investment Management Agreement with the Company. The investment manager has overall investment supervisory responsibility for the Fund. In addition, the investment manager provides administrative personnel, services, equipment, facilities and office space for proper operation of the Fund. The investment manager has contracted with Wellington Management Company, LLP (“Wellington Management”) under a sub-advisory agreement for the provision of day-to-day investment management services to the Fund in accordance with the Fund’s investment objective and policies. The Fund pays a fee to the investment manager, a portion of which may be used to compensate Wellington Management. |
The schedule below reflects the rates of compensation paid to HFMC for investment management services rendered as of December 31, 2013; the rates are accrued daily and paid monthly.
| Average Daily Net Assets | Annual Fee | |||
| On first $500 million | 0.7000 | % | ||
| On next $500 million | 0.6750 | % | ||
| On next $1.5 billion | 0.6250 | % | ||
| On next $2.5 billion | 0.6150 | % | ||
| On next $5 billion | 0.6050 | % | ||
| Over $10 billion | 0.5950 | % | ||
| 27 |
| Hartford High Yield HLS Fund |
| Notes to Financial Statements – (continued) |
| December 31, 2013 |
| (000’s Omitted) |
| b) | Accounting Services Agreement – Pursuant to the Fund Accounting Agreement between HFMC and the Company, on behalf of the Fund, HFMC provides accounting services to the Fund and receives monthly compensation based on the Fund’s average daily net assets at the rates set forth below. The Fund’s accounting services fees are accrued daily and paid monthly. |
| Average Daily Net Assets | Annual Fee |
| On first $5 billion | 0.020% |
| On next $5 billion | 0.018% |
| Over $10 billion | 0.016% |
Effective January 1, 2014, the new accounting services fees schedule based on the Fund’s average daily net assets is as follows:
| Average Daily Net Assets | Annual Fee |
| On first $5 billion | 0.020% |
| On next $5 billion | 0.015% |
| Over $10 billion | 0.010% |
| c) | Operating Expenses – Allocable expenses incurred by the Company are allocated to each Fund and allocated to classes within a Fund in proportion to the average daily net assets of the Fund and each class, except where allocation of certain expenses is more fairly made directly to the Fund or to specific classes within a Fund. |
| d) | Fees Paid Indirectly – The Fund’s custodian bank has agreed to reduce its fees when the Fund maintains cash on deposit in a non-interest-bearing custody account. For the year ended December 31, 2013, these amounts, if any, are included in the Statement of Operations. |
The ratio of expenses to average net assets in the accompanying financial highlights excludes the reduction in expenses related to fees paid indirectly. The annualized expense ratio after waivers for the period listed below reflecting the reduction for fees paid indirectly is as follows:
| Year Ended December 31, 2013 | ||
| Class IA | 0.75% | |
| Class IB | 1.00 | |
| e) | Distribution Plan for Class IB shares – Effective June 14, 2013, Hartford Investment Financial Services, LLC was renamed Hartford Funds Distributors, LLC (“HFD”). HFD, a wholly owned, ultimate subsidiary of The Hartford, serves as the Fund’s principal underwriter and distributor. The Company, on behalf of the Fund, has adopted a Distribution Plan pursuant to Rule 12b-1 of the 1940 Act to compensate the distributor, HFD, from assets attributable to the Class IB shares for services rendered and expenses borne in connection with activities primarily intended to result in the sale of the Class IB shares, subject to the review and approval of the Company’s Board of Directors. |
The Distribution Plan provides that the Fund may pay annually up to 0.25% of the average daily net assets of the Fund attributable to its Class IB shares for activities primarily intended to result in the sale of Class IB shares. The Board has the authority to suspend or reduce these payments at any point in time. Under the terms of the Distribution Plan and the principal underwriting agreement, the Fund is authorized to make payments monthly to the distributor that may be used to pay or compensate entities providing distribution and shareholder servicing with respect to the Class IB shares for such entities’ fees or expenses incurred or paid in that regard. These fees are accrued daily and paid monthly.
| 28 |
| f) | Other Related Party Transactions – Certain officers of the Fund are directors and/or officers of the investment manager and/or The Hartford or its subsidiaries. For the year ended December 31, 2013, a portion of the Fund’s Chief Compliance Officer’s salary was paid by all the investment companies in the Hartford fund complex. The portion allocated to the Fund was in the amount of $1. Hartford Administrative Services Company (“HASCO”), an indirect wholly owned subsidiary of The Hartford, provides transfer agent services to the Fund. HASCO was compensated on a per account basis for providing such services. The amount paid to HASCO can be found in the Statement of Operations. These fees are accrued daily and paid monthly. |
| g) | Payment from Affiliate – In July of 2007, The Hartford entered into a settlement with the Attorneys General of the states of New York, Connecticut and Illinois relating to market timing and the company's individual variable annuity contracts in which certain payments would be made directly to the variable annuity contract holders. The distribution plan provided that unclaimed money from the settlement would be distributed to certain HLS Funds that are investment options through a Hartford individual variable annuity contract. The unclaimed money was distributed to the Fund on September 18, 2009. |
The total return in the accompanying financial highlights includes a payment from an affiliate. Had the payment from the affiliate been excluded, the impact and total return for the period listed below would have been as follows:
| For the Year Ended December 31, 2009 | ||||||||
Class IA | Class IB | |||||||
| Impact from Payment from Affiliate for Attorneys General Settlement | 0.03% | 0.03% | ||||||
| Total Return Excluding Payment from Affiliate | 50.41% | 50.04% | ||||||
| 8. | Investment Transactions: |
For the year ended December 31, 2013, the Fund's aggregate purchases and sales of investment securities (excluding short-term investments) were as follows:
| Amount | ||||
| Cost of Purchases Excluding U.S. Government Obligations | $ | 257,928 | ||
| Sales Proceeds Excluding U.S. Government Obligations | 386,602 | |||
| 9. | Line of Credit: |
The Fund is one of several Hartford funds that participate in a $500 million committed revolving line of credit facility. The facility is to be used for temporary or emergency purposes. Under the arrangement, the funds are required to own securities having a market value in excess of 300% of the total bank borrowings. The interest rate on borrowings varies depending on the nature of the loan. The facility also requires a fee to be paid based on the amount of the commitment. This commitment fee is allocated to all of the funds participating in the line of credit based on the average net assets of the funds. During the year ended December 31, 2013, the Fund did not have any borrowings under this facility.
| 10. | Industry Classifications: |
Other than the industry classifications “Other Investment Pools and Funds” and “Exchange Traded Funds,” equity industry classifications used in this report are the Global Industry Classification Standard, which was developed by and is the exclusive property and service mark of MSCI, Inc. and Standard & Poor’s.
| 29 |
| Hartford High Yield HLS Fund |
| Notes to Financial Statements – (continued) |
| December 31, 2013 |
| (000’s Omitted) |
| 11. | Indemnifications: |
Under the Company’s organizational documents, the Company shall indemnify its officers and directors to the full extent required or permitted under Maryland General Corporation Law and the federal securities laws. In addition, the Company, on behalf of the Fund, may enter into contracts that contain a variety of indemnifications. The Company’s maximum exposure under these arrangements is unknown. However, as of the date of these financial statements, the Company has not had prior claims or losses pursuant to these contracts and expects the risk of loss to be remote.
| 12. | Pending Legal Proceedings: |
On February 25, 2011, Jennifer L. Kasilag, Louis Mellinger, Judith M. Menendez, Jacqueline M. Robinson, and Linda A. Russell filed a derivative lawsuit against Hartford Investment Financial Services, LLC (“HIFSCO”)(now known as Hartford Funds Distributors, LLC) on behalf of six Hartford retail mutual funds in the United States District Court for the District of New Jersey, alleging that HIFSCO received excessive advisory and distribution fees in violation of its statutory fiduciary duty under Section 36(b) of the 1940 Act when serving as investment manager and principal underwriter, respectively, to the Hartford retail mutual funds. HIFSCO moved to dismiss and, in September 2011, the motion was granted in part and denied in part, with leave to amend the complaint. In November 2011, plaintiffs filed an amended complaint on behalf of certain Hartford retail mutual funds, The Hartford Global Health Fund (now known as The Hartford Healthcare Fund), The Hartford Conservative Allocation Fund, The Hartford Growth Opportunities Fund, The Hartford Inflation Plus Fund, The Hartford Advisers Fund (now known as The Hartford Balanced Fund), and The Hartford Capital Appreciation Fund. Plaintiffs seek to rescind the investment management agreements and distribution plans between HIFSCO and these funds and to recover the total fees charged thereunder or, in the alternative, to recover any improper compensation HIFSCO received, in addition to lost earnings. HIFSCO filed a partial motion to dismiss the amended complaint and, in December 2012, the court dismissed without prejudice the claims regarding distribution fees and denied the motion with respect to the advisory fees claims. HIFSCO disputes the allegations and intends to defend the advisory fee claims vigorously.
This action concerns the activities of HIFSCO in its capacity as investment manager and principal underwriter to the Hartford retail mutual funds and does not concern HIFSCO’s activities in its capacity as principal underwriter to the HLS funds. For this reason, no accrual for litigation relating to this matter has been recorded in the financial statements of the Fund.
| 30 |
| Hartford High Yield HLS Fund |
| Financial Highlights |
| ─ Selected Per-Share Data(A) ─ | ─ Ratios and Supplemental Data ─ | |||||||||||||||||||||||||||||||||||||||||||||||||||
| Class | Net Asset Value at Beginning of Period | Net Investment Income (Loss) | Net Realized and Unrealized Gain (Loss) on Investments | Total from Investment Operations | Dividends from Net Investment Income | Distributions from Realized Capital Gains | Total Dividends and Distributions | Net Asset Value at End of Period | Total Return(B) | Net Assets at End of Period (000s) | Ratio of Expenses to Average Net Assets Before Adjust- ments(C) | Ratio of Expenses to Average Net Assets After Adjust- ments(C) | Ratio of Net Investment Income (Loss) to Average Net Assets | |||||||||||||||||||||||||||||||||||||||
| For the Year Ended December 31, 2013 | ||||||||||||||||||||||||||||||||||||||||||||||||||||
| IA | $ | 9.09 | $ | 0.54 | $ | 0.01 | $ | 0.55 | $ | (0.74 | ) | $ | – | $ | (0.74 | ) | $ | 8.90 | 6.43 | % | $ | 389,340 | 0.75 | % | 0.75 | % | 5.90 | % | ||||||||||||||||||||||||
| IB | 8.96 | 0.50 | 0.03 | 0.53 | (0.72 | ) | – | (0.72 | ) | 8.77 | 6.17 | 125,701 | 1.00 | 1.00 | 5.64 | |||||||||||||||||||||||||||||||||||||
| For the Year Ended December 31, 2012 | ||||||||||||||||||||||||||||||||||||||||||||||||||||
| IA | $ | 8.70 | $ | 0.58 | $ | 0.63 | $ | 1.21 | $ | (0.82 | ) | $ | – | $ | (0.82 | ) | $ | 9.09 | 14.31 | % | $ | 504,042 | 0.75 | % | 0.75 | % | 6.37 | % | ||||||||||||||||||||||||
| IB | 8.59 | 0.55 | 0.62 | 1.17 | (0.80 | ) | – | (0.80 | ) | 8.96 | 14.03 | 149,050 | 1.00 | 1.00 | 6.12 | |||||||||||||||||||||||||||||||||||||
| For the Year Ended December 31, 2011 | ||||||||||||||||||||||||||||||||||||||||||||||||||||
| IA | $ | 9.15 | $ | 0.71 | $ | (0.31 | ) | $ | 0.40 | $ | (0.85 | ) | $ | – | $ | (0.85 | ) | $ | 8.70 | 4.69 | % | $ | 548,608 | 0.74 | % | 0.74 | % | 7.68 | % | |||||||||||||||||||||||
| IB | 9.04 | 0.67 | (0.30 | ) | 0.37 | (0.82 | ) | – | (0.82 | ) | 8.59 | 4.44 | 160,060 | 0.99 | 0.99 | 7.43 | ||||||||||||||||||||||||||||||||||||
| For the Year Ended December 31, 2010 | ||||||||||||||||||||||||||||||||||||||||||||||||||||
| IA | $ | 7.94 | $ | 0.75 | $ | 0.52 | $ | 1.27 | $ | (0.06 | ) | $ | – | $ | (0.06 | ) | $ | 9.15 | 16.15 | % | $ | 602,493 | 0.75 | % | 0.75 | % | 8.80 | % | ||||||||||||||||||||||||
| IB | 7.86 | 0.72 | 0.52 | 1.24 | (0.06 | ) | – | (0.06 | ) | 9.04 | 15.86 | 186,357 | 1.00 | 1.00 | 8.57 | |||||||||||||||||||||||||||||||||||||
| For the Year Ended December 31, 2009 | ||||||||||||||||||||||||||||||||||||||||||||||||||||
| IA | $ | 5.73 | $ | 0.73 | $ | 2.16 | $ | 2.89 | $ | (0.68 | ) | $ | – | $ | (0.68 | ) | $ | 7.94 | 50.46 | %(D) | $ | 527,000 | 0.75 | % | 0.75 | % | 10.32 | % | ||||||||||||||||||||||||
| IB | 5.68 | 0.70 | 2.14 | 2.84 | (0.66 | ) | – | (0.66 | ) | 7.86 | 50.08 | (D) | 188,832 | 1.00 | 1.00 | 10.08 | ||||||||||||||||||||||||||||||||||||
| (A) | Information presented relates to a share outstanding throughout the indicated period. Net investment income (loss) per share amounts are calculated based on average shares outstanding unless otherwise noted. |
| (B) | The figures do not include sales charges or other fees which may be applied at the variable life insurance, variable annuity or qualified retirement plan product level. Any such additional sales charges or other fees would lower the Fund's performance. |
| (C) | Adjustments include waivers and reimbursements, if applicable. Ratios do not include fees paid indirectly (see Expenses in the accompanying Notes to Financial Statements). |
| (D) | Total return without the inclusion of the Payment from (to) Affiliate can be found in Expenses in the accompanying Notes to Financial Statements. |
| Portfolio Turnover Rate for All Share Classes | ||||
| For the Year Ended December 31, 2013 | 46% | |||
| For the Year Ended December 31, 2012 | 94 | |||
| For the Year Ended December 31, 2011 | 88 | |||
| For the Year Ended December 31, 2010 | 139 | |||
| For the Year Ended December 31, 2009 | 173 | |||
| 31 |
| Report of Independent Registered Public Accounting Firm |
| The Board of Directors and Shareholders of |
| Hartford Series Fund, Inc. |
We have audited the accompanying statement of assets and liabilities, including the schedule of investments, of Hartford High Yield HLS Fund (one of the portfolios constituting Hartford Series Fund, Inc. (the Funds)) as of December 31, 2013, and the related statement of operations for the year then ended, the statements of changes in net assets for each of the two years in the period then ended, and the financial highlights for each of the five years in the period then ended. These financial statements and financial highlights are the responsibility of the Funds’ management. Our responsibility is to express an opinion on these financial statements and financial highlights based on our audits.
We conducted our audits in accordance with the standards of the Public Company Accounting Oversight Board (United States). Those standards require that we plan and perform the audit to obtain reasonable assurance about whether the financial statements and financial highlights are free of material misstatement. We were not engaged to perform an audit of the Funds’ internal control over financial reporting. Our audits included consideration of internal control over financial reporting as a basis for designing audit procedures that are appropriate in the circumstances, but not for the purpose of expressing an opinion on the effectiveness of the Funds’ internal control over financial reporting. Accordingly, we express no such opinion. An audit also includes examining, on a test basis, evidence supporting the amounts and disclosures in the financial statements and financial highlights, assessing the accounting principles used and significant estimates made by management, and evaluating the overall financial statement presentation. Our procedures included confirmation of securities owned as of December 31, 2013, by correspondence with the custondian, agent banks and brokers or by other appropriate auditing procedures where replies from agent banks and brokers were not received. We believe that our audits provide a reasonable basis for our opinion.
In our opinion, the financial statements and financial highlights referred to above present fairly, in all material respects, the financial position of Hartford High Yield HLS Fund of the Hartford Series Fund, Inc. at December 31, 2013, the results of its operations for the year then ended, the changes in its net assets for each of the two years in the period then ended, and the financial highlights for each of the five years in the period then ended, in conformity with U.S. generally accepted accounting principles.
Minneapolis, MN
February 17, 2014
| 32 |
| Hartford High Yield HLS Fund |
Directors and Officers (Unaudited) |
The Board of Directors of the Company appoints officers who are responsible for the day-to-day operations of the Fund and who execute policies formulated by the directors. Each director serves until his or her death, resignation, or retirement or until the next annual meeting of shareholders is held or until his or her successor is elected and qualifies.
Directors and officers who are employed by or who have a financial interest in The Hartford are considered “interested” persons of the Fund pursuant to the 1940 Act. Each officer and two of the Company’s directors, as noted in the chart below, are “interested” persons of the Fund. Each director serves as a director for The Hartford Mutual Funds, Inc., The Hartford Mutual Funds II, Inc., Hartford Series Fund, Inc., Hartford HLS Series Fund II, Inc., and as a trustee for The Hartford Alternative Strategies Fund, which, as of December 31, 2013, collectively consist of 91 funds. Correspondence may be sent to directors and officers c/o Hartford Funds, 5 Radnor Corporate Center, Suite 300, 100 Matsonford Road, Radnor, Pennsylvania 19087, except that correspondence to Mr. Annoni, Mr. Dressen and Ms. Quade may be sent to 500 Bielenberg Drive, Woodbury, Minnesota 55125.
The table below sets forth, for each director and officer, his or her name, year of birth, current position with the Company and date first elected or appointed to Hartford Series Fund, Inc. (“HSF”), and Hartford HLS Series Fund II, Inc. (“HSF2”), principal occupation, and, for directors, other directorships held. The Fund’s Statement of Additional Information contains further information on the directors and is available free of charge by calling 1-800-862-6668 or writing to Hartford HLS Funds, c/o Hartford Life Insurance Company, Hartford Life and Annuity Insurance Company, P.O. Box 14293, Lexington, KY 40512-4293.
Information on the aggregate remuneration paid to the directors of the Company can be found in the Statement of Operations herein. The Fund pays to The Hartford a portion of the Chief Compliance Officer’s compensation, but does not pay salaries or compensation to any of their other officers or directors who are employed by The Hartford.
Non-Interested Directors
Lynn S. Birdsong (1946) Director since 2003, Co-Chairman of the Investment Committee since 2005
Mr. Birdsong is a private investor. Mr. Birdsong currently serves as a Director of the Sovereign High Yield Investment Company (April 2010 to current). Mr. Birdsong currently serves as an Independent Director of Nomura Partners Funds, Inc. (formerly, The Japan Fund) (April 2003 to current). From 2003 to March 2005, Mr. Birdsong was an Independent Director of the Atlantic Whitehall Funds. From 1979 to 2002, Mr. Birdsong was a Managing Director of Zurich Scudder Investments, an investment management firm. During his employment with Scudder, Mr. Birdsong was an Interested Director of The Japan Fund. From January 1981 through December 2013, Mr. Birdsong was a partner in Birdsong Company, an advertising specialty firm.
Robert M. Gavin, Jr. (1940) Director since 2002 (HSF) and 1986 (HSF2), Chairman of the Board since 2004
Dr. Gavin is an educational consultant. Prior to September 1, 2001, he was President of Cranbrook Education Community and prior to July 1996, he was President of Macalester College, St. Paul, Minnesota.
Duane E. Hill (1945) Director since 2001 (HSF) and 2002 (HSF2), Chairman of the Nominating Committee since 2003
Mr. Hill is a Partner of TSG Ventures L.P., a private equity investment company. Mr. Hill is a former partner of TSG Capital Group, a private equity investment firm that served as sponsor and lead investor in leveraged buyouts of middle market companies.
Sandra S. Jaffee (1941) Director since 2005
Ms. Jaffee is the founder and Chief Executive Officer of a private company, Homeworks Concierge, LLC, which provides residential property management services in Westchester County, New York (January 2012 to present). Ms. Jaffee served as Chairman (2008 to 2009) and Chief Executive Officer of Fortent (formerly Searchspace Group), a leading provider of compliance/regulatory technology to financial institutions from August 2005 to August 2009. Ms. Jaffee currently serves as a member of the Board of Directors of Broadridge Financial Solutions as well as a Trustee of Muhlenberg College.
| 33 |
| Hartford High Yield HLS Fund |
Directors and Officers (Unaudited) – (continued) |
William P. Johnston (1944) Director since 2005, Chairman of the Compliance Committee since 2005
In June 2006, Mr. Johnston was appointed as Senior Advisor to The Carlyle Group, a global private equity and alternative asset investment firm and currently serves as an Operating Executive. In July 2006, Mr. Johnston was elected to the Board of Directors of MultiPlan, Inc. and served as a Director (July 2006 to August 2010). In August 2007, Mr. Johnston was elected to the Board of Directors of LifeCare Holdings, Inc. and served as a Director (August 2007 to June 2013). In February 2008, Mr. Johnston was elected to the Board of Directors of HCR-ManorCare, Inc. In May 2006, Mr. Johnston was elected to the Supervisory Board of Fresenius Medical Care AG & Co. KGaA, after its acquisition of Renal Care Group, Inc. in March 2006. Mr. Johnston joined Renal Care Group in November 2002 as a member of the Board of Directors and served as Chairman of the Board from March 2003 through March 2006. From 2002 through 2013, Mr. Johnston served as a Board member of the Georgia O’Keefe Museum. From September 1987 to December 2002, Mr. Johnston was with Equitable Securities Corporation (and its successors, SunTrust Equitable Securities and SunTrust Robinson Humphrey) serving in various investment banking and managerial positions, including Managing Director and Head of Investment Banking, Chief Executive Officer and Vice Chairman.
Phillip O. Peterson (1944) Director since 2002 (HSF) and 2000 (HSF2), Chairman of the Audit Committee since 2002
Mr. Peterson is a mutual fund industry consultant. He was a partner of KPMG LLP (an accounting firm) until July 1999. Mr. Peterson joined William Blair Funds in February 2007 as a member of the Board of Trustees. Mr. Peterson also joined the Board of Trustees of Symetra Variable Mutual Funds Trust as a trustee in February 2012.
Lemma W. Senbet (1946) Director since 2005
Dr. Senbet is the William E. Mayer Chair Professor of Finance and Founding Director, Center for Financial Policy, at the University of Maryland, Robert H. Smith School of Business. He was chair of the Finance Department of the University of Maryland, Robert H. Smith School of Business from 1998 to 2006. Since June 2013, he has been on leave from the University to serve as Executive Director of African Economic Research Consortium which focuses on economic policy research and training. Previously, he was a chaired professor of finance at the University of Wisconsin-Madison. Also, he was a Director of the Fortis Funds from March 2000 to July 2002. Dr. Senbet served as Director of the American Finance Association and President of the Western Finance Association. In 2006, Dr. Senbet was inducted Fellow of Financial Management Association International for his career-long distinguished scholarship and professional service.
Interested Directors and Officers
James E. Davey (1964) Director since 2012, President and Chief Executive Officer since 2010
Mr. Davey serves as Executive Vice President of Hartford Life Insurance Company (“HLIC”) and The Hartford Financial Services Group, Inc. Additionally, Mr. Davey serves as Chairman of the Board, Manager and Senior Managing Director of Hartford Funds Distributors, LLC (“HFD”). He also currently serves as Director, Chairman of the Board, President and Senior Managing Director of Hartford Administrative Services Company (“HASCO”). Mr. Davey also serves as Manager, Chairman of the Board and Senior Managing Director for Hartford Funds Management Company, LLC (“HFMC”). Mr. Davey joined The Hartford in 2002.
Lowndes A. Smith (1939) Director since 1996 (HSF) and 2002 (HSF2), Co-Chairman of the Investment Committee since 2005
Mr. Smith served as Vice Chairman of The Hartford from February 1997 to January 2002, as President and Chief Executive Officer of Hartford Life, Inc. from February 1997 to January 2002, and as President and Chief Operating Officer of The Hartford Life Insurance Companies from January 1989 to January 2002. Mr. Smith serves as a Director of White Mountains Insurance Group Ltd. (October 2003 to current); One Beacon Insurance (October 2006 to current); Symetra Financial (August 2007 to current) and is a Managing Director of Whittington Gray Associates (January 2007 to current).
Other Officers
Mark A. Annoni (1964) Vice President, Controller and Treasurer since 2012
Mr. Annoni currently serves as the Assistant Vice President of HLIC (February 2004 to present).
| 34 |
Michael R. Dressen (1963) AML Compliance Officer since 2011
Mr. Dressen currently serves as Assistant Vice President of HLIC. He also serves as Chief Compliance Officer and AML Compliance Officer of HASCO and as AML Officer of HFD. Mr. Dressen has served in various positions within The Hartford and its subsidiaries in connection with the operation of the Hartford Funds.
Edward P. Macdonald (1967) Vice President, Secretary and Chief Legal Officer since 2005
Mr. Macdonald currently serves as Assistant Secretary, Executive Vice President and Deputy General Counsel of HFD, HASCO and HFMC. He also serves as Vice President of HLIC. Mr. Macdonald has served in various positions within The Hartford and its subsidiaries in connection with the operation of the Hartford Funds. Mr. Macdonald joined The Hartford in 2005.
Joseph G. Melcher (1973) Vice President and Chief Compliance Officer since 2013
Mr. Melcher currently serves as Executive Vice President of HASCO and HFD. Mr. Melcher also currently serves as Executive Vice President and Chief Compliance Officer of HFMC. Mr. Melcher has served in various positions within The Hartford and its subsidiaries in connection with the operation of the Hartford Funds since joining The Hartford in 2012. Prior to joining The Hartford, Mr. Melcher worked at Touchstone Investments, a member of the Western & Southern Financial Group, where he held the position of Vice President and Chief Compliance Officer from 2010 through 2012 and Assistant Vice President, Compliance from 2005 to 2010.
Vernon J. Meyer (1964) Vice President since 2006
Mr. Meyer currently serves as Senior Vice President of HLIC. He also currently serves as Managing Director and Chief Investment Officer of HFMC. Mr. Meyer has served in various positions within The Hartford and its subsidiaries in connection with the operation of the Hartford Funds. Mr. Meyer joined The Hartford in 2004.
Laura S. Quade (1969) Vice President since 2012
Ms. Quade currently serves as Vice President of HASCO and HFD. She is the Head of Operations of HASCO and also serves as Director, Enterprise Operations of HLIC. Ms. Quade has served in various positions within The Hartford and its subsidiaries in connection with the operation of the Hartford Funds.
Martin A. Swanson (1962) Vice President since 2010
Mr. Swanson currently serves as Vice President of HLIC. Mr. Swanson also serves as Managing Director, Chief Marketing Officer and Principal of HFD. Mr. Swanson has served in various positions within The Hartford and its subsidiaries in connection with the operation of the Hartford Funds.
HOW TO OBTAIN A COPY OF THE FUND’S PROXY VOTING POLICIES AND VOTING RECORDS (UNAUDITED)
A description of the policies and procedures that the Fund uses to determine how to vote proxies relating to portfolio securities and information about how the Fund voted proxies relating to portfolio securities during the most recent twelve-month period ended June 30 are available (1) without charge, upon request, by calling 800-862-6668 and (2) on the SEC’s website at http://www.sec.gov.
QUARTERLY PORTFOLIO HOLDINGS INFORMATION (UNAUDITED)
The Fund files a complete schedule of portfolio holdings with the SEC for the first and third quarters of each fiscal year on Form N-Q. The Fund’s Forms N-Q are available (1) without charge, upon request, by calling 800-862-6668 and (2) on the SEC’s website at http://www.sec.gov. The Form N-Q may be reviewed and copied at the SEC’s Public Reference Room in Washington, DC. Information on the operation of the Public Reference Room may be obtained by calling 1-800-SEC-0330.
| 35 |
| Hartford High Yield HLS Fund |
| Expense Example (Unaudited) |
Your Fund's Expenses
As a shareholder of the Fund, you incur two types of costs: (1) transaction costs and (2) ongoing costs, including investment management fees, distribution and/or service (12b-1) fees, if any, and other fund expenses. This example is intended to help you understand your ongoing costs (in dollars) of investing in the Fund and to compare these costs with the ongoing costs of investing in other mutual funds. The example is based on an investment of $1,000 invested at the beginning of the period and held for the period of June 30, 2013 through December 31, 2013.
Actual Expenses
The first set of columns of the table below provides information about actual account values and actual expenses. You may use the information in this column, together with the amount you invested, to estimate the expenses that you paid over the period. Simply divide your account value by $1,000 (for example, an $8,600 account value divided by $1,000 = 8.6), then multiply the result by the number in the line under the heading entitled “Expenses Paid During Period” to estimate the expenses you paid on your account during this period.
Hypothetical Example for Comparison Purposes
The second set of columns of the table below provides information about hypothetical account values and hypothetical expenses based on the Fund’s actual expense ratio and an assumed rate of return of 5% per year before expenses, which is not the Fund’s actual return. The hypothetical account values and expenses may not be used to estimate the actual ending account balance or expenses you paid for the period. You may use this information to compare the ongoing costs of investing in the Fund and other funds. To do so, compare this 5% hypothetical example with the 5% hypothetical examples that appear in the shareholder reports of the other funds.
Please note that the expenses shown in the table are meant to highlight your ongoing costs only and do not reflect any transactional costs, such as sales charges (loads) and CDSC. Therefore, the second set of columns of the table is useful in comparing ongoing costs only, and will not help you determine the relative total costs of owning different funds. In addition, if these transactional costs were included, your costs would be higher. Expenses are equal to the Fund's annualized expense ratios multiplied by average account value over the period, multiplied by 184/365 (to reflect the one-half year period).
| Actual return | Hypothetical (5% return before expenses) | |||||||||||||||||||||||||||||||||
| Beginning Account Value June 30, 2013 | Ending Account Value December 31, 2013 | Expenses paid during the period June 30, 2013 through December 31, 2013 | Beginning Account Value June 30, 2013 | Ending Account Value December 31, 2013 | Expenses paid during the period June 30, 2013 through December 31, 2013 | Annualized expense ratio | Days in the current 1/2 year | Days in the full year | ||||||||||||||||||||||||||
| Class IA | $ | 1,000.00 | $ | 1,053.90 | $ | 3.89 | $ | 1,000.00 | $ | 1,021.41 | $ | 3.83 | 0.75 | % | 184 | 365 | ||||||||||||||||||
| Class IB | $ | 1,000.00 | $ | 1,052.70 | $ | 5.18 | $ | 1,000.00 | $ | 1,020.15 | $ | 5.10 | 1.00 | % | 184 | 365 | ||||||||||||||||||
| 36 |
| Hartford High Yield HLS Fund |
| Approval of Investment Management and Investment Sub-Advisory Agreements (Unaudited) |
Section 15(c) of the Investment Company Act of 1940, as amended (the “1940 Act”), requires that each mutual fund’s board of directors, including a majority of those directors who are not “interested persons” of the mutual fund, as defined in the 1940 Act (the “Independent Directors”), annually review and consider the continuation of the mutual fund’s investment advisory and sub-advisory agreements. At its meeting held on August 6-7, 2013, the Board of Directors (the “Board”) of Hartford Series Fund, Inc., including each of the Independent Directors, unanimously voted to approve the continuation of the investment management agreement for Hartford High Yield HLS Fund (the “Fund”) with Hartford Funds Management Company, LLC (“HFMC”) and the continuation of the investment sub-advisory agreement between HFMC and the Fund’s sub-adviser, Wellington Management Company, LLP (the “Sub-adviser,” and together with HFMC, the “Advisers”) (collectively, the “Agreements”).
In the months preceding the August 6-7, 2013 meeting, the Board requested, received, and reviewed written responses from the Advisers to questions posed to them on behalf of the Independent Directors and supporting materials relating to those questions and responses. The Board considered information furnished to the Board at its meetings throughout the year, as well as information specifically prepared in connection with the annual approval of the Agreements at the Board’s meetings held on June 18-19, 2013 and August 6-7, 2013. Information provided to the Board at its meetings throughout the year included, among other things, reports on Fund performance, legal and compliance matters, sales and marketing activity, shareholder services, and the other services provided to the Fund by the Advisers and their affiliates. The Board also received in-person presentations by Fund officers and representatives of HFMC at the Board’s meetings on June 18-19, 2013 and August 6-7, 2013 concerning the Agreements.
The Independent Directors, advised by independent legal counsel, engaged two service providers to assist them with evaluating the Agreements with respect to the Fund. Lipper Inc. (“Lipper”), an independent provider of investment company data, was retained to provide the Board with reports on how the Fund’s contractual management fees, actual management fees, other non-management fees, overall expense ratios and investment performance compared to those of mutual funds with similar investment objectives. The Independent Directors also engaged an independent financial services consulting firm (the “Consultant”) to assist them in evaluating the Fund’s management fees, sub-advisory fees, other non-management fees, overall expense ratios and investment performance. In addition, the Consultant reviewed the profitability calculations utilized by HFMC in connection with the continuation of the investment management agreement.
In determining whether to continue the Agreements for the Fund, the members of the Board reviewed and evaluated information and factors they believed to be relevant and appropriate in light of the information that the Board deemed necessary and appropriate through the exercise of its reasonable business judgment. While individual members of the Board may have weighed certain factors differently, the Board’s determination to continue the Agreements was based on a comprehensive consideration of all information provided to the Board throughout the year and specifically with respect to the continuation of the Agreements. A more detailed discussion of the factors the Board considered with respect to its approval of the Agreements is provided below.
Nature, Extent, and Quality of Services Provided by the Advisers
The Board requested and considered information concerning the nature, extent, and quality of the services provided to the Fund by the Advisers. The Board considered, among other things, the terms of the Agreements and the range of services provided by the Advisers. The Board considered the Advisers’ professional personnel who provide services to the Fund, including each Adviser’s ability and experience in attracting and retaining qualified personnel to service the Fund. The Board considered each Adviser’s reputation and overall financial strength, as well as its willingness to consider and implement organizational and operational changes designed to improve services to the Fund. In addition, the Board considered the quality of each Adviser’s communications with the Board and responsiveness to Board inquiries.
The Board also requested and evaluated information concerning each Adviser’s regulatory and compliance environment. In this regard, the Board requested and reviewed information on each Adviser’s compliance policies and procedures, compliance history, and a report from the Fund’s Chief Compliance Officer on each Adviser’s compliance with applicable laws and regulations, including responses to regulatory developments and compliance issues raised by regulators. The Board also noted the Advisers’ support of the Fund’s compliance control structure, particularly the resources devoted by the Advisers in support of the Fund’s obligations pursuant to Rule 38a-1 under the 1940 Act.
| 37 |
| Hartford High Yield HLS Fund |
| Approval of Investment Management and Investment Sub-Advisory Agreements (Unaudited) – (continued) |
With respect to HFMC, the Board noted that under the Agreements, HFMC is responsible for the management of the Fund, including overseeing fund operations and service providers, as well as investment advisory services in connection with selecting, monitoring and supervising the Sub-adviser. The Board considered HFMC’s ongoing monitoring of people, process and performance, including its quarterly reviews of each of the Hartford Funds, semi-annual meetings with the leaders of each Fund’s portfolio management team, and oversight of the Funds’ approximately 40 portfolio managers. The Board recognized that HFMC has demonstrated a record of making changes to the management and/or strategies of the Funds when warranted. The Board considered HFMC’s oversight of the Sub-adviser’s investment approach and results, process for monitoring best execution of portfolio trades by the Sub-adviser, and approach to risk management with respect to the Fund and the service providers to the Fund. The Board also considered HFMC’s oversight of compliance with the Fund’s objective and policies as well as with applicable laws and regulations, noting that regulatory and other developments had over time led to an increase in the scope of HFMC’s services in this regard.
In addition, the Board considered HFMC’s ongoing commitment to review and rationalize the Hartford Funds product line-up and the expenses that HFMC had incurred in connection with fund combinations in recent years. The Board considered that HFMC or its affiliates are responsible for providing the Fund’s officers. The Board also noted that Hartford Life Insurance Company (“HLIC”) provides administrative services to the Fund. The Board considered its experiences with HFMC and HLIC with respect to each of these services.
With respect to the Sub-adviser, who provides day-to-day portfolio management services, the Board considered the quality of the Fund’s portfolio manager, the Sub-adviser’s other investment personnel, its investment philosophy and process, investment research capabilities and resources, performance record, trade execution capabilities and experience. The Board considered the experience of the Fund’s portfolio manager, the number of accounts managed by the portfolio manager, and the Sub-adviser’s method for compensating the portfolio manager.
Based on these considerations, the Board concluded that it was satisfied with the nature, extent and quality of the services provided to the Fund by HFMC and the Sub-adviser.
Performance of the Fund and the Advisers
The Board considered the investment performance of the Fund. In this regard, the Board reviewed the performance of the Fund over different time periods presented in the materials and evaluated HFMC’s analysis of the Fund’s performance for these time periods. The Board considered information and materials provided to the Board by the Advisers concerning Fund performance, as well as information from Lipper comparing the investment performance of the Fund to an appropriate benchmark and universe of peer funds. The Board noted that the Fund’s performance was in the 4th quintile of its performance universe for the 1-year period, the 2nd quintile for the 3-year period and the 1st quintile for the 5-year period. The Board also noted that the Fund’s performance was below its benchmark for the 1-year period and in line with its benchmark for the 3- and 5-year periods.
The Board considered the detailed investment analytics reports provided by Hartford Funds’ Investment Advisory Group throughout the year. These reports include, among other things, information on the Fund’s gross and net returns, the Fund’s investment performance relative to an appropriate benchmark and peer group, various statistics concerning the Fund’s portfolio, and a narrative summary of various factors affecting Fund performance. The Board considered the Advisers’ cooperation with the Investment Committee, which assists the Board in evaluating the performance of the Fund at periodic meetings throughout the year. The Board also considered the analysis provided by the Consultant relating to the Fund’s performance track record.
In light of all the considerations noted above, the Board concluded that it had continued confidence in HFMC’s and the Sub-adviser’s overall capabilities to manage the Fund.
Costs of the Services and Profitability of the Advisers
The Board reviewed information regarding HFMC’s cost to provide investment management and related services to the Fund and HFMC’s profitability, both overall and for the Fund, on a pre-tax basis without regard to distribution expenses. The Board also requested and reviewed information about the profitability to HFMC and its affiliates from all services provided to the Fund and
| 38 |
all aspects of their relationship with the Fund. The Board also requested and received information relating to the operations and profitability of the Sub-adviser.
The Board considered the Consultant’s review of the profitability calculations utilized by HFMC in connection with the continuation of the investment management agreement, noting the Consultant’s view that Hartford Funds’ process for calculating and reporting Fund profitability is reasonable. In this regard, the Board noted that the Consultant had previously performed a full review of this process and reported that such process is sound and well within common industry practice.
Based on these considerations, the Board concluded that the profits anticipated to be realized by the Advisers and their affiliates from their relationships with the Fund would not be excessive.
Comparison of Fees and Services Provided by the Advisers
The Board considered comparative information with respect to the management fees to be paid by the Fund to HFMC and the total expense ratios of the Fund. The Board also considered comparative information with respect to the sub-advisory fees to be paid by HFMC to the Sub-adviser. In this regard, the Board requested and reviewed information from HFMC and the Sub-adviser relating to the management and sub-advisory fees, including the sub-advisory fee schedule for the Fund, and total operating expenses for the Fund. The Board considered that the management fee for the Fund includes the fee paid to HLIC for providing certain administrative services to the Fund. With respect to the sub-advisory fee schedule, the Board considered representations from HFMC and the Sub-adviser that the Sub-adviser’s fees were negotiated at arm’s length. The Board also reviewed information from Lipper comparing the Fund’s contractual management fees, actual management fees and overall expense ratios relative to a group of funds selected by Lipper, in consultation with the Consultant, and a broader universe of funds selected by Lipper. The Board noted that the Fund’s contractual management fee and total expenses (less 12b-1 and shareholder service fees) were in the 4th quintile of its expense group, while its actual management fee was in the 5th quintile.
While the Board recognized that comparisons between the Fund and peer funds are imprecise, given the differing service levels and characteristics of mutual funds and the different business models and cost structures of the Advisers, the comparative information provided by Lipper assisted the Board in evaluating the reasonableness of the Fund’s management and sub-advisory fees and total operating expenses. In addition, the Board considered the analysis and recommendations of the Consultant relating to the Fund’s management and sub-advisory fees and total operating expenses.
Based on these considerations, the Board concluded that the Fund’s fees and total operating expenses, in conjunction with the information about quality of services, profitability, economies of scale, and other matters discussed, were reasonable in light of the services provided.
Economies of Scale
The Board requested and considered information regarding the Advisers’ realization of economies of scale with respect to the Fund and whether the fee levels reflect these economies of scale for the benefit of the Fund’s shareholders. The Board reviewed the breakpoints in the management fee schedule for the Fund, which reduce fee rates as Fund assets grow over time. The Board recognized that a fund with assets beyond the last breakpoint level will continue to benefit from economies of scale because additional assets are charged the lowest breakpoint fee resulting in lower overall effective management fee rates. The Board also recognized that a fee schedule that reaches a lower breakpoint quickly provides shareholders with the benefit of anticipated or potential economies of scale. The Board noted the effect of the sale and run-off of the variable annuity business on the HLS Funds.
The Board reviewed and evaluated materials from Lipper showing how management fee schedules of peer funds reflect economies of scale for the benefit of shareholders as a peer fund’s assets hypothetically increase over time. Based on information provided by HFMC, Lipper, and the Consultant, the Board recognized that there is no uniform methodology for establishing breakpoints or uniform pattern in asset levels that trigger breakpoints or the amounts of breakpoints triggered.
After considering all of the information available to it, the Board concluded that it was satisfied with the extent to which economies of scale would be shared for the benefit of the Fund’s shareholders based on currently available information and the
| 39 |
| Hartford High Yield HLS Fund |
| Approval of Investment Management and Investment Sub-Advisory Agreements (Unaudited) – (continued) |
effective advisory fees and expense ratios for the Fund at its current and reasonably anticipated asset levels. The Board noted, however, that it would continue to monitor future growth in Fund assets and the appropriateness of additional breakpoints.
Other Benefits
The Board considered other benefits to the Advisers and their affiliates from their relationships with the Fund, including the role of the Fund in supporting the variable life insurance and variable annuity products offered by The Hartford.
The Board reviewed information noting that HLIC, an affiliate of HFMC, receives fees for providing certain administrative services to the Fund and that HFMC receives fees for fund accounting and related services from the Fund. The Board considered information on profits to HLIC and HFMC for such services. The Board also considered that Hartford Administrative Services Company (“HASCO”), the Fund’s transfer agent and an affiliate of HFMC, receives transfer agency compensation from the Fund, and the Board reviewed information on the profitability of the Fund’s transfer agency function to HASCO. The Board considered information provided by HASCO indicating that the transfer agent fees charged by HASCO to the Fund were fair and reasonable based on publicly available information.
The Board also considered that Hartford Funds Distributors, LLC (“HFD”), an affiliate of HFMC, serves as principal underwriter of the Fund. As principal underwriter, HFD receives 12b-1 fees from the Fund. The Board also noted that certain affiliates of HFD distribute shares of the Fund and receive compensation in that connection.
The Board considered the benefits, if any, to the Sub-adviser from any use of the Fund’s brokerage commissions to obtain soft dollar research, and representations from HFMC and the Sub-adviser that the Sub-adviser would not make any revenue-sharing payments or any other type of distribution payments to HFMC or its affiliates.
The Board considered the benefits to shareholders of being part of the Hartford Funds family of funds. The Board considered HFMC’s efforts to provide investors in the family with a broad range of investment styles and asset classes.
* * * *
Based upon its review of these various factors, among others, the Board concluded that it is in the best interests of the Fund and its shareholders for the Board to approve the Agreements for an additional year. In reaching this decision, the Board did not assign relative weights to the factors discussed above or deem any one or group of them to be controlling in and of themselves. In connection with their deliberations, the Independent Directors met separately in executive session on several occasions, with independent legal counsel and the Consultant, to review the relevant materials and consider their responsibilities under relevant laws and regulations.
| 40 |
| Hartford High Yield HLS Fund |
| Main Risks (Unaudited) |
The main risks of investing in the Fund are described below.
Market, Selection, and Strategy Risk: The Fund’s share price may fluctuate due to market risk and/or security selections that may underperform the market or relevant benchmarks. If the sub-adviser’s investment strategy does not perform as expected, the Fund could underperform its peers or lose money. There is no guarantee the Fund will achieve its stated objective.
Junk Bond Risk: Investments in junk bonds involve greater risk of price volatility, illiquidity, and default than higher-rated debt securities.
Fixed Income Risk: The Fund is subject to interest rate risk (the risk that the value of an investment decreases when interest rates rise) and credit risk (the risk that the issuing company of a security is unable to pay interest and principal when due) and call risk (the risk that an investment may be redeemed early).
Foreign Investment Risk: Foreign investments can be riskier than U.S. investments. Potential risks include currency risk that may result from unfavorable exchange rates, liquidity risk if decreased demand for a security makes it difficult to sell at the desired price, and risks that stem from substantially lower trading volume on foreign markets.
Derivatives Risk: Investments in derivatives can be volatile. Potential risks include currency risk, leverage risk (the risk that small market movements may result in large changes in the value of an investment), liquidity risk, index risk, pricing risk, and counterparty risk (the risk that the counterparty may be unwilling or unable to honor its obligations).
Active Trading Risk: Actively trading investments may result in higher costs (thus affecting performance).
| 41 |
THIS PRIVACY POLICY IS NOT PART OF THIS REPORT
Privacy Policy and Practices of The Hartford Financial Services Group, Inc. and its Affiliates
(herein called “we, our, and us”)
This Privacy Policy applies to our United States Operations
We value your trust. We are committed to the responsible: a) management; b) use; and c) protection; of Personal Information. This notice describes how we collect, disclose, and protect Personal Information.
We collect Personal Information to: a) service your Transactions with us; and b) support our business functions.
We may obtain Personal Information from: a) You; b) your Transactions with us; and c) third parties such as a consumer-reporting agency.
Based on the type of product or service You apply for or get from us, Personal Information such as: a) your name; b) your address; c) your income; d) your payment; or e) your credit history; may be gathered from sources such as applications, Transactions, and consumer reports.
To serve You and service our business, we may share certain Personal Information. We will share Personal Information, only as allowed by law, with affiliates such as: a) our insurance companies; b) our employee agents; c) our brokerage firms; and d) our administrators.
As allowed by law, we may share Personal Financial Information with our affiliates to: a) market our products; or b) market our services; to You without providing You with an option to prevent these disclosures. | We may also share Personal Information, only as allowed by law, with unaffiliated third parties including:
When allowed by law, we may share certain Personal Financial Information with other unaffiliated third parties who assist us by performing services or functions such as:
We, and third parties we partner with, may track some of the pages You visit through the use of: a) cookies; b) pixel tagging; or c) other technologies; and currently do not process or comply with any web browser’s “do not track” signal or similar mechanism that indicates a request to disable online tracking of individual users who visit our websites or use our services.
We will not sell or share your Personal Financial Information with anyone for purposes unrelated to our business functions without offering You the opportunity to:
We only disclose Personal Health Information with:
Our employees have access to Personal Information in the course of doing their jobs, such as: |
We use manual and electronic security procedures to maintain: a) the confidentiality; and b) the integrity of; Personal Information that we have. We use these procedures to guard against unauthorized access.
Some techniques we use to protect Personal Information include: a) secured files; b) user authentication; c) encryption; d) firewall technology; and e) the use of detection software.
We are responsible for and must: a) identify information to be protected; b) provide an adequate level of protection for that data; c) grant access to protected data only to those people who must use it in the performance of their job-related duties. Employees who violate our Privacy Policy will be subject to discipline, which may include ending their employment with us.
At the start of our business relationship, we will give You a copy of our current Privacy Policy.
We will also give You a copy of our current Privacy Policy once a year if You maintain a continuing business relationship with us.
We will continue to follow our Privacy Policy regarding Personal Information even when a business relationship no longer exists between us. | As used in this Privacy Notice:
Application means your request for our product or service.
Personal Financial Information means financial information such as:
Personal Health Information means health information such as:
Personal Information means information that identifies You personally and is not otherwise available to the public. It includes:
Transaction means your business dealings with us, such as:
You means an individual who has given us Personal Information in conjunction with: |
This Privacy Policy is being provided on behalf of the following affiliates of The Hartford Financial Services Group, Inc.:
1stAGChoice, Inc.; Access CoverageCorp, Inc.; Access CoverageCorp Technologies, Inc.; American Maturity Life Insurance Company; Archway 60 R, LLC; Business Management Group, Inc.; Catalyst360, LLC; Champlain Life Reinsurance Company; DMS R, LLC; Eloy R, LLC; Ersatz Corporation; First State Insurance Company; Hartford Accident and Indemnity Company; Hartford Administrative Services Company; Hartford Casualty General Agency, Inc.; Hartford Casualty Insurance Company; Hartford-Comprehensive Employee Benefit Service Company; Hartford Equity Sales Company, Inc.; Hartford Fire General Agency, Inc.; Hartford Fire Insurance Company; Hartford Funds Management Company, LLC; Hartford Funds Management Group, Inc.; Hartford HLS Series Fund II, Inc.; Hartford Insurance Company of Illinois; Hartford Insurance Company of the Midwest; Hartford Insurance Company of the Southeast; Hartford Integrated Technologies, Inc.; Hartford International Life Reassurance Corporation; Hartford Funds Distributors, LLC; Hartford Investment Management Company; Hartford Life and Accident Insurance Company; Hartford Life and Annuity Insurance Company; Hartford Life Insurance Company; Hartford Life Private Placement, LLC; Hartford Lloyd’s Corporation; Hartford Lloyd’s Insurance Company; Hartford Mezzanine Investors I, LLC; Hartford Residual Market, L.C.C.; Hartford Retirement Services, LLC; Hartford Securities Distribution Company, Inc.; Hartford Series Fund, Inc.; Hartford Specialty Insurance Services of Texas, LLC; Hartford Strategic Investments, LLC; Hartford Underwriters Insurance Company; Hartford Technology Services Company, L.L.C.; Hartford of Texas General Agency, Inc.; Hartford Underwriters General Agency, Inc.; HARTRE Company, L.C.C.; HL Investment Advisors, LLC; HLA LLC; Horizon Management Group, LLC; HRA Brokerage Services, Inc.; Lanidex Class B, LLC; M-CAP Insurance Agency, LLC; New England Insurance Company; New England Reinsurance Corporation; Nutmeg Insurance Agency, Inc.; Nutmeg Insurance Company; Pacific Insurance Company, Limited; Planco, LLC: Property and Casualty Insurance Company of Hartford; Revere R, LLC; RVR R, LLC; Sentinel Insurance Company, Ltd.; Sunstone R, LLC; Symphony R, LLC; The Evergreen Group Incorporated; The Hartford Alternative Strategies Fund; The Hartford Mutual Funds, Inc.; The Hartford Mutual Funds II, Inc.; Trumbull Flood Management, L.L.C.; Trumbull Insurance Company; Twin City Fire Insurance Company; White River Life Reinsurance Company.
HPP Revised December 2013
HARTFORD HLS FUNDS
c/o The Hartford Wealth Management - Global Annuities
P.O. Box 14293
Lexington, KY 40512-4293
HARTFORDFUNDS
hartfordfunds.com
Hartford Series Fund, Inc. is underwritten and distributed by Hartford Funds Distributors, LLC.
Hartford Series Fund, Inc. inception dates range from 1977 to date. Hartford Series Fund, Inc. is not a subsidiary of The Hartford Financial Services Group, Inc. ("The Hartford") but is underwritten, distributed by and advised by subsidiaries of The Hartford. Investments in Hartford Series Fund, Inc. are not guaranteed by The Hartford or any other entity.
This report is submitted for the general information of the shareholders of the Funds. It is not authorized for distribution unless preceded or accompanied by a current prospectus for the Funds.
Investors should carefully consider the investment objectives, risks, charges, and expenses of Hartford Funds before investing. This and other information can be found in the prospectus and summary prospectus, which can be obtained by calling 888-843-7824 (retail) or 877-836-5854 (institutional). Investors should read them carefully before they invest.
HLSAR-HY13 2-14 113544-2 Printed in U.S.A ©2013 The Hartford, Hartford, CT 06115
HARTFORDFUNDS
| HARTFORD INDEX HLS FUND
2013 Annual Report
|
A MESSAGE FROM THE PRESIDENT
Dear Fellow Shareholders:
Thank you for investing in Hartford HLS Funds.
Market Review
U.S. equities (as represented by the S&P 500 Index) generated their strongest year since 1997 in 2013, rising 32.39% for the year. During the fourth quarter, equities rose without looking back, pushing the S&P 500 Index and the Dow Jones Industrial Average to new all-time highs. Despite previously cheering delays to quantitative-easing tapering, the stock market received an additional boost at the end of the year following the U.S. Federal Reserve’s (Fed) announcement of a $10-billion-a-month reduction in bond purchases beginning in January.
The Fed’s decision to begin tapering its bond purchases is generally considered a vote of confidence in the recovering U.S. economy. Consumer spending has stabilized, the housing market is showing steady improvement, the unemployment rate is slowly declining and economic growth clocked in at a healthy 4.1% in the third quarter. Equities have also recovered since the market low in March 2009: The S&P 500 Index has gained 173% from the market low through December 31, 2013.
Signs of improvement are also visible outside the U.S. Europe appears to have begun its own economic recovery, and emerging markets have reversed their recent lackluster performance. Fiscal policy continues to wield significant influence in today’s economy and central banks across the globe are maintaining their accommodative stances, including the appointment of Janet Yellen, who is widely expected to continue current monetary policies, to succeed Ben Bernanke as U.S. Federal Reserve chairman.
It’s important to stay abreast of domestic and international economic developments while balancing your individual investment goals. Meeting with your financial advisor on a regular basis to examine your current investment strategy can help you determine whether you are on the right track:
| • | Is your portfolio fully diversified with an appropriate mix of stocks and bonds? |
| • | Is your portfolio incorporating both domestic and international holdings to take advantage of the global economic recovery? |
| • | Are your investments still in line with your risk tolerance and investment time horizon? |
Your financial advisor can help you choose options within our fund family to navigate today’s markets with confidence.
Thank you again for investing with Hartford HLS Funds.
James Davey
President
Hartford HLS Funds
1The S&P 500 Index is a market capitalization-weighted price index composed of 500 widely held common stocks.
2The Dow Jones Industrial Average is an unmanaged, price-weighted index of 30 of the largest, most widely held stocks traded on the New York Stock Exchange.
Table of Contents
This report is prepared for the general information of contract owners and qualified retirement plan participants. It is not an offer of contracts or of qualified retirement plans. It should not be used in connection with any offer, except in conjunction with the appropriate product prospectus which contains all pertinent information including the applicable sales, administrative and other charges.
The views expressed in the Fund’s Manager Discussion under ‘‘Why did the Fund perform this way?’’ and ‘‘What is the outlook?’’ are views of the Fund’s sub-adviser and portfolio management team through the end of the period and are subject to change based on market and other conditions. The Fund’s Manager Discussion is for informational purposes only and does not represent an offer, recommendation or solicitation to buy, hold or sell any security. The specific securities identified and described, if any, do not represent all of the securities purchased or sold and you should not assume that investments in the securities identified and discussed will be profitable.
Hartford Index HLS Fund inception 05/01/1987
(sub-advised by Hartford Investment Management Company)
| Investment objective – Seeks to provide investment results which approximate the price and yield performance of publicly traded common stocks in the aggregate. |
Performance Overview 12/31/03 - 12/31/13

The chart above represents the hypothetical growth of a $10,000 investment in Class IA. Growth results in classes other than Class IA will vary from what is seen above due to differences in the expenses charged to those share classes.
Average Annual Total Returns (as of 12/31/13)
| 1 Year | 5 Years | 10 Years | |||||
| Index IA | 31.95% | 17.59% | 7.08% | ||||
| Index IB | 31.61% | 17.30% | 6.82% | ||||
| S&P 500 Index | 32.39% | 17.94% | 7.41% | ||||
PERFORMANCE DATA QUOTED REPRESENTS PAST PERFORMANCE AND DOES NOT GUARANTEE FUTURE RESULTS. The investment return and principal value of the investment will fluctuate so that investors’ shares, when redeemed, may be worth more or less than their original cost. Current performance may be lower or higher than the performance data quoted. To obtain performance data current to the most recent month-end, please visit our website at www.hartfordfunds.com.
Total returns presented above were calculated using the Fund’s net asset value available to shareholders for sale or redemption of Fund shares on December 31, 2013, which may exclude investment transactions as of this date. All share class returns assume the reinvestment of all distributions at net asset value and the deduction of all fund expenses.
S&P 500 Index is a market capitalization-weighted price index composed of 500 widely held common stocks.
You cannot invest directly in an index.
As of the Fund's current prospectus dated May 1, 2013, the total annual operating expense ratios for Class IA and Class IB were 0.33% and 0.58%, respectively. Actual expenses may be higher. Please see the accompanying Financial Highlights for expense ratios for the year ended December 31, 2013.
The chart and table do not reflect the deductions of taxes, sales charges or other fees which may be applied at the variable life insurance, variable annuity or qualified retirement plan product level. Any such additional sales charges or other fees or expenses would lower the contract’s or plan’s performance.
All investments are subject to risk including the possible loss of principal. For a discussion of the Fund’s risks, please see the Main Risks section of this report. For more detailed information on the risks associated with an investment in the Fund, please see the prospectus.
| 2 |
| Hartford Index HLS Fund |
| Manager Discussion |
| December 31, 2013 (Unaudited) |
| Portfolio Manager | |||
| Deane Gyllenhaal | |||
| Vice President | |||
How did the Fund perform?
The Class IA shares of the Hartford Index HLS Fund returned 31.95% for the twelve-month period ended December 31, 2013. The Fund underperformed its benchmark, the S&P 500 Index, which returned 32.39%, and outperformed the Variable Products-Underlying Funds Lipper S&P 500 Index Funds category, a group of funds with investment strategies similar to those of the Fund, which returned 31.91%.
Why did the Fund perform this way?
By design, the Fund is managed to mimic the performance of the S&P 500 Index. Due to this approach, the Fund is expected to perform in line with the Index. However, we do not purchase the stock of our parent, The Hartford Financial Services Group, Inc. (HIG). This exposure to HIG is reallocated across the Life/Health, Property/Casualty and Multi-line Insurance industries. The performance of the Fund tends to marginally differ from the benchmark, primarily due to trading in futures contracts, index events, minimal cash exposure, and lack of exposure to HIG.
All ten of the sectors, as defined by the Global Industry Classification Standard (GICS), within the Index had positive returns during the calendar year 2013. Consumer Discretionary led the way, up 43.2%. Health Care gained 41.2%, followed by Industrials, which returned 40.6%. The two sectors with the lowest returns, while still positive, were Telecommunication Services and Utilities, which rose 11.2% and 13.2%, respectively.
On an individual stock level, the leading constituents in the S&P 500 Index were Netflix, which rallied 296.8%, followed by BestBuy Co. gaining 244.2%. Micro Technology rounded out the top three, finishing the year up 242.7%. Laggards for the year included J.C. Penney, falling 53.6%, and Newmont Mining Co., which fell 48.5%.
What is the outlook?
Despite the start of tapering in bond buying by the U.S. Federal Reserve (Fed), the equity market’s performance, as measured by the S&P 500 Index, accelerated from its 5.2% third quarter pace to 10.5% in the fourth quarter. This was helped by markets moving away from major headwinds such as sequestration, budget battles, and possible military confrontations with Iran and Syria and leveraging tailwinds such as generally positive and improving macro and earnings data. For all of 2013, U.S. equity markets outperformed non-U.S. equities (MSCI All Country World ex USA Index, 15.78%), as well as other asset classes such as cash (3 Month T-Bills, 0.07%), bonds (Long-Term Treasury Bonds, -13.29%), and gold (-27.79%).
Looking forward we expect improving macro, revenue, and earnings data that should support modestly positive ( i.e. not the size we have seen recently) equity returns over the next quarter or so. Our major concern is that this rally is beginning to get a little long in the tooth without having to endure any significant pullback. We don’t subscribe to the equity market bubble thesis, but since June of 2012 the S&P 500 Index has had only one significant drawdown, a 6% pullback that occurred from late-May to late-June 2013. Historically, this is a fairly small drawdown for a given year. Drawdowns of 10% or greater are more typical, and we think we are due for a more typical/significant drawdown. Another concern is that rising interest rates could be a headwind to stocks, especially high dividend yield stocks. We think cyclical growth sectors will be attractive to investors. The risk to this forecast is that earnings, sales and other fundamental factors may come in much better or worse than we currently expect.
The Fund will continue to invest in the securities that comprise the S&P 500 Index, with a focus on risk control and efficient trading. Performance of the Fund is expected to be similar to that of the Index.
| Diversification by Sector | ||||
| as of December 31, 2013 | ||||
| Sector | Percentage of Net Assets | |||
| Equity Securities | ||||
| Consumer Discretionary | 12.6 | % | ||
| Consumer Staples | 9.6 | |||
| Energy | 10.2 | |||
| Financials | 16.0 | |||
| Health Care | 12.8 | |||
| Industrials | 10.9 | |||
| Information Technology | 18.5 | |||
| Materials | 3.4 | |||
| Services | 2.3 | |||
| Utilities | 2.9 | |||
| Total | 99.2 | % | ||
| Short-Term Investments | 0.9 | |||
| Other Assets and Liabilities | (0.1 | ) | ||
| Total | 100.0 | % | ||
A sector may be comprised of several industries. For Fund compliance purposes, the Fund may not use the same classification system and these sector classifications are used for reporting ease.
| 3 |
| Hartford Index HLS Fund |
| Schedule of Investments |
| December 31, 2013 |
| (000’s Omitted) |
| Shares or Principal Amount | Market Value ╪ | |||||||
| COMMON STOCKS - 99.2% | ||||||||
| Automobiles and Components - 1.2% | ||||||||
| 16 | BorgWarner, Inc. | $ | 899 | |||||
| 20 | Delphi Automotive plc | 1,194 | ||||||
| 279 | Ford Motor Co. | 4,308 | ||||||
| 81 | General Motors Co. ● | 3,296 | ||||||
| 18 | Goodyear (The) Tire & Rubber Co. | 418 | ||||||
| 16 | Harley-Davidson, Inc. | 1,086 | ||||||
| 48 | Johnson Controls, Inc. | 2,486 | ||||||
| 13,687 | ||||||||
| Banks - 2.8% | ||||||||
| 50 | BB&T Corp. | 1,861 | ||||||
| 13 | Comerica, Inc. | 614 | ||||||
| 62 | Fifth Third Bancorp | 1,314 | ||||||
| 34 | Hudson City Bancorp, Inc. | 320 | ||||||
| 59 | Huntington Bancshares, Inc. | 567 | ||||||
| 63 | KeyCorp | 851 | ||||||
| 9 | M&T Bank Corp. | 1,069 | ||||||
| 22 | People's United Financial, Inc. | 340 | ||||||
| 38 | PNC Financial Services Group, Inc. | 2,919 | ||||||
| 97 | Regions Financial Corp. | 964 | ||||||
| 38 | SunTrust Banks, Inc. | 1,395 | ||||||
| 129 | US Bancorp | 5,220 | ||||||
| 339 | Wells Fargo & Co. | 15,401 | ||||||
| 13 | Zions Bancorporation | 390 | ||||||
| 33,225 | ||||||||
| Capital Goods - 8.2% | ||||||||
| 45 | 3M Co. | 6,354 | ||||||
| 17 | AMETEK, Inc. | 911 | ||||||
| 49 | Boeing Co. | 6,682 | ||||||
| 45 | Caterpillar, Inc. | 4,094 | ||||||
| 12 | Cummins, Inc. | 1,741 | ||||||
| 42 | Danaher Corp. | 3,276 | ||||||
| 27 | Deere & Co. | 2,475 | ||||||
| 12 | Dover Corp. | 1,161 | ||||||
| 34 | Eaton Corp. plc | 2,555 | ||||||
| 50 | Emerson Electric Co. | 3,498 | ||||||
| 19 | Fastenal Co. | 916 | ||||||
| 10 | Flowserve Corp. | 782 | ||||||
| 12 | Fluor Corp. | 927 | ||||||
| 24 | General Dynamics Corp. | 2,259 | ||||||
| 716 | General Electric Co. | 20,072 | ||||||
| 56 | Honeywell International, Inc. | 5,078 | ||||||
| 29 | Illinois Tool Works, Inc. | 2,429 | ||||||
| 19 | Ingersoll-Rand plc | 1,171 | ||||||
| 9 | Jacobs Engineering Group, Inc. ● | 590 | ||||||
| 8 | Joy Global, Inc. | 442 | ||||||
| 6 | L-3 Communications Holdings, Inc. | 670 | ||||||
| 19 | Lockheed Martin Corp. | 2,831 | ||||||
| 25 | Masco Corp. | 575 | ||||||
| 16 | Northrop Grumman Corp. | 1,800 | ||||||
| 25 | PACCAR, Inc. | 1,481 | ||||||
| 8 | Pall Corp. | 671 | ||||||
| 11 | Parker-Hannifin Corp. | 1,355 | ||||||
| 14 | Pentair Ltd. | 1,092 | ||||||
| 10 | Precision Castparts Corp. | 2,774 | ||||||
| 15 | Quanta Services, Inc. ● | 483 | ||||||
| 23 | Raytheon Co. | 2,046 | ||||||
| 10 | Rockwell Automation, Inc. | 1,160 | ||||||
| 10 | Rockwell Collins, Inc. | 705 | ||||||
| 7 | Roper Industries, Inc. | 975 | ||||||
| 4 | Snap-On, Inc. | 448 | ||||||
| 11 | Stanley Black & Decker, Inc. | 890 | ||||||
| 20 | Textron, Inc. | 733 | ||||||
| 60 | United Technologies Corp. | 6,801 | ||||||
| 4 | W.W. Grainger, Inc. | 1,115 | ||||||
| 13 | Xylem, Inc. | 452 | ||||||
| 96,470 | ||||||||
| Commercial and Professional Services - 0.7% | ||||||||
| 14 | ADT (The) Corp. | 571 | ||||||
| 7 | Avery Dennison Corp. | 341 | ||||||
| 7 | Cintas Corp. | 424 | ||||||
| 3 | Dun & Bradstreet Corp. | 332 | ||||||
| 9 | Equifax, Inc. ● | 596 | ||||||
| 12 | Iron Mountain, Inc. | 367 | ||||||
| 18 | Nielsen Holdings N.V. | 821 | ||||||
| 14 | Pitney Bowes, Inc. | 334 | ||||||
| 19 | Republic Services, Inc. | 633 | ||||||
| 10 | Robert Half International, Inc. | 411 | ||||||
| 6 | Stericycle, Inc. ● | 708 | ||||||
| 33 | Tyco International Ltd. | 1,351 | ||||||
| 31 | Waste Management, Inc. | 1,384 | ||||||
| 8,273 | ||||||||
| Consumer Durables and Apparel - 1.4% | ||||||||
| 20 | Coach, Inc. | 1,114 | ||||||
| 20 | D.R. Horton, Inc. ● | 448 | ||||||
| 4 | Fossil Group, Inc. ● | 420 | ||||||
| 9 | Garmin Ltd. | 404 | ||||||
| 5 | Harman International Industries, Inc. | 394 | ||||||
| 8 | Hasbro, Inc. | 448 | ||||||
| 10 | Leggett & Platt, Inc. | 308 | ||||||
| 12 | Lennar Corp. | 466 | ||||||
| 24 | Mattel, Inc. | 1,139 | ||||||
| 13 | Michael Kors Holdings Ltd. ● | 1,031 | ||||||
| 4 | Mohawk Industries, Inc. ● | 640 | ||||||
| 20 | Newell Rubbermaid, Inc. | 660 | ||||||
| 53 | NIKE, Inc. Class B | 4,156 | ||||||
| 24 | Pulte Group, Inc. | 497 | ||||||
| 6 | PVH Corp. | 789 | ||||||
| 4 | Ralph Lauren Corp. | 739 | ||||||
| 25 | V.F. Corp. | 1,576 | ||||||
| 6 | Whirlpool Corp. | 865 | ||||||
| 16,094 | ||||||||
| Consumer Services - 1.8% | ||||||||
| 31 | Carnival Corp. | 1,244 | ||||||
| 2 | Chipotle Mexican Grill, Inc. ● | 1,178 | ||||||
| 9 | Darden Restaurants, Inc. | 500 | ||||||
| 19 | H & R Block, Inc. | 562 | ||||||
| 18 | International Game Technology | 320 | ||||||
| 16 | Marriott International, Inc. Class A | 784 | ||||||
| 70 | McDonald's Corp. | 6,829 | ||||||
| 53 | Starbucks Corp. | 4,185 | ||||||
| 14 | Starwood Hotels & Resorts, Inc. | 1,078 | ||||||
| 9 | Wyndham Worldwide Corp. | 677 | ||||||
| 6 | Wynn Resorts Ltd. | 1,112 | ||||||
| 31 | Yum! Brands, Inc. | 2,380 | ||||||
| 20,849 | ||||||||
| Diversified Financials - 7.0% | ||||||||
| 65 | American Express Co. | 5,918 | ||||||
| 14 | Ameriprise Financial, Inc. | 1,587 | ||||||
The accompanying notes are an integral part of these financial statements.
| 4 |
| Shares or Principal Amount | Market Value ╪ | |||||||
| COMMON STOCKS - 99.2% - (continued) | ||||||||
| Diversified Financials - 7.0% - (continued) | ||||||||
| 755 | Bank of America Corp. | $ | 11,754 | |||||
| 81 | Bank of New York Mellon Corp. | 2,840 | ||||||
| 9 | BlackRock, Inc. | 2,838 | ||||||
| 41 | Capital One Financial Corp. | 3,125 | ||||||
| 82 | Charles Schwab Corp. | 2,134 | ||||||
| 215 | Citigroup, Inc. | 11,188 | ||||||
| 22 | CME Group, Inc. | 1,753 | ||||||
| 34 | Discover Financial Services, Inc. | 1,895 | ||||||
| 20 | E*Trade Financial Corp. ● | 399 | ||||||
| 29 | Franklin Resources, Inc. | 1,652 | ||||||
| 30 | Goldman Sachs Group, Inc. | 5,283 | ||||||
| 8 | IntercontinentalExchange Group, Inc. | 1,836 | ||||||
| 31 | Invesco Ltd. | 1,140 | ||||||
| 266 | JP Morgan Chase & Co. | 15,559 | ||||||
| 8 | Legg Mason, Inc. | 327 | ||||||
| 22 | Leucadia National Corp. | 629 | ||||||
| 13 | Moody's Corp. | 1,049 | ||||||
| 98 | Morgan Stanley | 3,076 | ||||||
| 8 | Nasdaq OMX Group, Inc. | 328 | ||||||
| 16 | Northern Trust Corp. | 982 | ||||||
| 31 | SLM Corp. | 810 | ||||||
| 31 | State Street Corp. | 2,280 | ||||||
| 18 | T. Rowe Price Group, Inc. | 1,546 | ||||||
| 81,928 | ||||||||
| Energy - 10.2% | ||||||||
| 36 | Anadarko Petroleum Corp. | 2,829 | ||||||
| 28 | Apache Corp. | 2,424 | ||||||
| 31 | Baker Hughes, Inc. | 1,731 | ||||||
| 30 | Cabot Oil & Gas Corp. | 1,156 | ||||||
| 17 | Cameron International Corp. ● | 1,002 | ||||||
| 36 | Chesapeake Energy Corp. | 970 | ||||||
| 136 | Chevron Corp. | 17,002 | ||||||
| 87 | ConocoPhillips Holding Co. | 6,127 | ||||||
| 16 | Consol Energy, Inc. | 617 | ||||||
| 26 | Denbury Resources, Inc. ● | 427 | ||||||
| 27 | Devon Energy Corp. | 1,671 | ||||||
| 5 | Diamond Offshore Drilling, Inc. | 281 | ||||||
| 17 | Ensco plc | 946 | ||||||
| 19 | EOG Resources, Inc. | 3,244 | ||||||
| 11 | EQT Corp. | 955 | ||||||
| 309 | Exxon Mobil Corp. | 31,284 | ||||||
| 17 | FMC Technologies, Inc. ● | 872 | ||||||
| 60 | Halliburton Co. | 3,048 | ||||||
| 8 | Helmerich & Payne, Inc. | 638 | ||||||
| 20 | Hess Corp. | 1,668 | ||||||
| 48 | Kinder Morgan, Inc. | 1,716 | ||||||
| 49 | Marathon Oil Corp. | 1,739 | ||||||
| 21 | Marathon Petroleum Corp. | 1,952 | ||||||
| 12 | Murphy Oil Corp. | 809 | ||||||
| 19 | Nabors Industries Ltd. | 315 | ||||||
| 30 | National Oilwell Varco, Inc. | 2,413 | ||||||
| 10 | Newfield Exploration Co. ● | 238 | ||||||
| 18 | Noble Corp. plc | 673 | ||||||
| 25 | Noble Energy, Inc. | 1,731 | ||||||
| 57 | Occidental Petroleum Corp. | 5,423 | ||||||
| 19 | Peabody Energy Corp. | 372 | ||||||
| 42 | Phillips 66 | 3,271 | ||||||
| 10 | Pioneer Natural Resources Co. | 1,857 | ||||||
| 13 | QEP Resources, Inc. | 390 | ||||||
| 12 | Range Resources Corp. | 975 | ||||||
| 9 | Rowan Cos. plc Class A ● | 310 | ||||||
| 93 | Schlumberger Ltd. | 8,399 | ||||||
| 25 | Southwestern Energy Co. ● | 978 | ||||||
| 47 | Spectra Energy Corp. | 1,688 | ||||||
| 9 | Tesoro Corp. | 551 | ||||||
| 24 | Transocean, Inc. | 1,184 | ||||||
| 38 | Valero Energy Corp. | 1,926 | ||||||
| 48 | Williams Cos., Inc. | 1,865 | ||||||
| 14 | WPX Energy, Inc. ● | 291 | ||||||
| 119,958 | ||||||||
| Food and Staples Retailing - 2.3% | ||||||||
| 31 | Costco Wholesale Corp. | 3,675 | ||||||
| 84 | CVS Caremark Corp. | 6,027 | ||||||
| 37 | Kroger (The) Co. | 1,457 | ||||||
| 18 | Safeway, Inc. | 571 | ||||||
| 41 | Sysco Corp. | 1,485 | ||||||
| 62 | Walgreen Co. | 3,538 | ||||||
| 114 | Wal-Mart Stores, Inc. | 9,007 | ||||||
| 26 | Whole Foods Market, Inc. | 1,525 | ||||||
| 27,285 | ||||||||
| Food, Beverage and Tobacco - 5.2% | ||||||||
| 142 | Altria Group, Inc. | 5,434 | ||||||
| 47 | Archer-Daniels-Midland Co. | 2,023 | ||||||
| 12 | Beam, Inc. | 789 | ||||||
| 11 | Brown-Forman Corp. | 864 | ||||||
| 13 | Campbell Soup Co. | 549 | ||||||
| 269 | Coca-Cola Co. | 11,102 | ||||||
| 17 | Coca-Cola Enterprises, Inc. | 753 | ||||||
| 30 | ConAgra Foods, Inc. | 1,005 | ||||||
| 12 | Constellation Brands, Inc. Class A ● | 827 | ||||||
| 14 | Dr. Pepper Snapple Group | 690 | ||||||
| 45 | General Mills, Inc. | 2,240 | ||||||
| 11 | Hershey Co. | 1,028 | ||||||
| 9 | Hormel Foods Corp. | 429 | ||||||
| 7 | J.M. Smucker Co. | 773 | ||||||
| 18 | Kellogg Co. | 1,109 | ||||||
| 42 | Kraft Foods Group, Inc. | 2,272 | ||||||
| 26 | Lorillard, Inc. | 1,320 | ||||||
| 9 | McCormick & Co., Inc. | 642 | ||||||
| 14 | Mead Johnson Nutrition Co. | 1,198 | ||||||
| 11 | Molson Coors Brewing Co. | 628 | ||||||
| 124 | Mondelez International, Inc. | 4,382 | ||||||
| 10 | Monster Beverage Corp. ● | 651 | ||||||
| 109 | PepsiCo, Inc. | 9,000 | ||||||
| 113 | Philip Morris International, Inc. | 9,883 | ||||||
| 22 | Reynolds American, Inc. | 1,111 | ||||||
| 19 | Tyson Foods, Inc. Class A | 642 | ||||||
| 61,344 | ||||||||
| Health Care Equipment and Services - 4.1% | ||||||||
| 109 | Abbott Laboratories | 4,193 | ||||||
| 26 | Aetna, Inc. | 1,786 | ||||||
| 16 | AmerisourceBergen Corp. | 1,143 | ||||||
| 6 | Bard (C.R.), Inc. | 738 | ||||||
| 38 | Baxter International, Inc. | 2,673 | ||||||
| 14 | Becton, Dickinson & Co. | 1,514 | ||||||
| 95 | Boston Scientific Corp. ● | 1,136 | ||||||
| 24 | Cardinal Health, Inc. | 1,615 | ||||||
| 15 | CareFusion Corp. ● | 595 | ||||||
| 21 | Cerner Corp. ● | 1,163 | ||||||
The accompanying notes are an integral part of these financial statements.
| 5 |
| Hartford Index HLS Fund |
| Schedule of Investments – (continued) |
| December 31, 2013 |
| (000’s Omitted) |
| Shares or Principal Amount | Market Value ╪ | |||||||
| COMMON STOCKS - 99.2% - (continued) | ||||||||
| Health Care Equipment and Services - 4.1% - (continued) | ||||||||
| 20 | CIGNA Corp. | $ | 1,714 | |||||
| 33 | Covidien plc | 2,218 | ||||||
| 13 | DaVita HealthCare Partners, Inc. ● | 794 | ||||||
| 10 | Dentsply International, Inc. | 489 | ||||||
| 8 | Edwards Lifesciences Corp. ● | 507 | ||||||
| 57 | Express Scripts Holding Co. ● | 4,006 | ||||||
| 11 | Humana, Inc. | 1,135 | ||||||
| 3 | Intuitive Surgical, Inc. ● | 1,019 | ||||||
| 6 | Laboratory Corp. of America Holdings ● | 566 | ||||||
| 16 | McKesson Corp. | 2,627 | ||||||
| 71 | Medtronic, Inc. | 4,058 | ||||||
| 6 | Patterson Cos., Inc. | 243 | ||||||
| 10 | Quest Diagnostics, Inc. | 550 | ||||||
| 21 | St. Jude Medical, Inc. | 1,282 | ||||||
| 21 | Stryker Corp. | 1,569 | ||||||
| 7 | Tenet Healthcare Corp. ● | 295 | ||||||
| 71 | UnitedHealth Group, Inc. | 5,362 | ||||||
| 7 | Varian Medical Systems, Inc. ● | 579 | ||||||
| 21 | Wellpoint, Inc. | 1,936 | ||||||
| 12 | Zimmer Holdings, Inc. | 1,132 | ||||||
| 48,637 | ||||||||
| Household and Personal Products - 2.1% | ||||||||
| 31 | Avon Products, Inc. | 528 | ||||||
| 9 | Clorox Co. | 843 | ||||||
| 62 | Colgate-Palmolive Co. | 4,055 | ||||||
| 18 | Estee Lauder Co., Inc. | 1,365 | ||||||
| 27 | Kimberly-Clark Corp. | 2,825 | ||||||
| 192 | Procter & Gamble Co. | 15,662 | ||||||
| 25,278 | ||||||||
| Insurance - 4.3% | ||||||||
| 24 | ACE Ltd. | 2,527 | ||||||
| 35 | Aflac, Inc. | 2,317 | ||||||
| 33 | Allstate (The) Corp. | 1,784 | ||||||
| 106 | American International Group, Inc. | 5,404 | ||||||
| 21 | Aon plc | 1,786 | ||||||
| 5 | Assurant, Inc. | 350 | ||||||
| 129 | Berkshire Hathaway, Inc. Class B ● | 15,336 | ||||||
| 18 | Chubb Corp. | 1,749 | ||||||
| 11 | Cincinnati Financial Corp. | 553 | ||||||
| 36 | Genworth Financial, Inc. ● | 552 | ||||||
| 19 | Lincoln National Corp. | 1,006 | ||||||
| 22 | Loews Corp. | 1,062 | ||||||
| 39 | Marsh & McLennan Cos., Inc. | 1,879 | ||||||
| 83 | MetLife, Inc. | 4,494 | ||||||
| 20 | Principal Financial Group, Inc. | 1,005 | ||||||
| 40 | Progressive Corp. | 1,083 | ||||||
| 34 | Prudential Financial, Inc. | 3,171 | ||||||
| 7 | Torchmark Corp. | 526 | ||||||
| 26 | Travelers Cos., Inc. | 2,368 | ||||||
| 19 | Unum Group | 680 | ||||||
| 20 | XL Group plc | 648 | ||||||
| 50,280 | ||||||||
| Materials - 3.4% | ||||||||
| 15 | Air Products & Chemicals, Inc. | 1,670 | ||||||
| 5 | Airgas, Inc. | 522 | ||||||
| 76 | Alcoa, Inc. | 805 | ||||||
| 8 | Allegheny Technologies, Inc. | 273 | ||||||
| 10 | Ball Corp. | 531 | ||||||
| 7 | Bemis Co., Inc. | 300 | ||||||
| 4 | CF Industries Holdings, Inc. | 934 | ||||||
| 11 | Cliff's Natural Resources, Inc. | 284 | ||||||
| 86 | Dow Chemical Co. | 3,813 | ||||||
| 66 | E.I. DuPont de Nemours & Co. | 4,262 | ||||||
| 11 | Eastman Chemical Co. | 881 | ||||||
| 19 | Ecolab, Inc. | 2,006 | ||||||
| 9 | FMC Corp. | 713 | ||||||
| 73 | Freeport-McMoRan Copper & Gold, Inc. | 2,771 | ||||||
| 6 | International Flavors & Fragrances, Inc. | 496 | ||||||
| 31 | International Paper Co. | 1,538 | ||||||
| 31 | LyondellBasell Industries Class A | 2,481 | ||||||
| 13 | MeadWestvaco Corp. | 466 | ||||||
| 37 | Monsanto Co. | 4,341 | ||||||
| 24 | Mosaic Co. | 1,142 | ||||||
| 35 | Newmont Mining Corp. | 812 | ||||||
| 23 | Nucor Corp. | 1,204 | ||||||
| 12 | Owens-Illinois, Inc. ● | 417 | ||||||
| 10 | PPG Industries, Inc. | 1,912 | ||||||
| 21 | Praxair, Inc. | 2,710 | ||||||
| 14 | Sealed Air Corp. | 474 | ||||||
| 6 | Sherwin-Williams Co. | 1,122 | ||||||
| 8 | Sigma-Aldrich Corp. | 795 | ||||||
| 10 | United States Steel Corp. | 301 | ||||||
| 9 | Vulcan Materials Co. | 545 | ||||||
| 40,521 | ||||||||
| Media - 3.8% | ||||||||
| 15 | Cablevision Systems Corp. | 271 | ||||||
| 40 | CBS Corp. Class B | 2,521 | ||||||
| 184 | Comcast Corp. Class A | 9,584 | ||||||
| 35 | DirecTV ● | 2,390 | ||||||
| 16 | Discovery Communications, Inc. ● | 1,444 | ||||||
| 16 | Gannett Co., Inc. | 476 | ||||||
| — | Graham Holdings Co. ● | 226 | ||||||
| 29 | Interpublic Group of Cos., Inc. | 521 | ||||||
| 19 | McGraw Hill Financial, Inc. | 1,497 | ||||||
| 35 | News Corp. Class A ● | 634 | ||||||
| 18 | Omnicom Group, Inc. | 1,357 | ||||||
| 8 | Scripps Networks Interactive Class A | 666 | ||||||
| 20 | Time Warner Cable, Inc. | 2,708 | ||||||
| 64 | Time Warner, Inc. | 4,465 | ||||||
| 139 | Twenty-First Century Fox, Inc. | 4,885 | ||||||
| 29 | Viacom, Inc. Class B | 2,505 | ||||||
| 116 | Walt Disney Co. | 8,833 | ||||||
| 44,983 | ||||||||
| Pharmaceuticals, Biotechnology and Life Sciences - 8.7% | ||||||||
| 113 | AbbVie, Inc. | 5,943 | ||||||
| 12 | Actavis plc ● | 2,065 | ||||||
| 23 | Agilent Technologies, Inc. | 1,340 | ||||||
| 14 | Alexion Pharmaceuticals, Inc. ● | 1,849 | ||||||
| 21 | Allergan, Inc. | 2,342 | ||||||
| 53 | Amgen, Inc. | 6,098 | ||||||
| 17 | Biogen Idec, Inc. ● | 4,688 | ||||||
| 117 | Bristol-Myers Squibb Co. | 6,194 | ||||||
| 29 | Celgene Corp. ● | 4,925 | ||||||
| 70 | Eli Lilly & Co. | 3,581 | ||||||
| 17 | Forest Laboratories, Inc. ● | 1,005 | ||||||
| 108 | Gilead Sciences, Inc. ● | 8,152 | ||||||
| 12 | Hospira, Inc. ● | 485 | ||||||
| 200 | Johnson & Johnson | 18,286 | ||||||
| 12 | Life Technologies Corp. ● | 923 | ||||||
| 207 | Merck & Co., Inc. | 10,352 | ||||||
The accompanying notes are an integral part of these financial statements.
| 6 |
| Shares or Principal Amount | Market Value ╪ | |||||||
| COMMON STOCKS - 99.2% - (continued) | ||||||||
| Pharmaceuticals, Biotechnology and Life Sciences - 8.7% - (continued) | ||||||||
| 27 | Mylan, Inc. ● | $ | 1,174 | |||||
| 8 | PerkinElmer, Inc. | 329 | ||||||
| 9 | Perrigo Co. plc | 1,440 | ||||||
| 459 | Pfizer, Inc. | 14,051 | ||||||
| 6 | Regeneron Pharmaceuticals, Inc. ● | 1,528 | ||||||
| 26 | Thermo Fisher Scientific, Inc. | 2,850 | ||||||
| 17 | Vertex Pharmaceuticals, Inc. ● | 1,226 | ||||||
| 6 | Waters Corp. ● | 605 | ||||||
| 35 | Zoetis, Inc. | 1,156 | ||||||
| 102,587 | ||||||||
| Real Estate - 1.9% | ||||||||
| 28 | American Tower Corp. REIT | 2,233 | ||||||
| 10 | Apartment Investment & Management Co. Class A REIT | 268 | ||||||
| 9 | AvalonBay Communities, Inc. REIT | 1,014 | ||||||
| 11 | Boston Properties, Inc. REIT | 1,084 | ||||||
| 20 | CBRE Group, Inc. ● | 518 | ||||||
| 24 | Equity Residential Properties Trust REIT | 1,229 | ||||||
| 38 | General Growth Properties, Inc. REIT | 763 | ||||||
| 32 | HCP, Inc. REIT | 1,173 | ||||||
| 20 | Health Care, Inc. REIT | 1,097 | ||||||
| 53 | Host Hotels & Resorts, Inc. REIT | 1,040 | ||||||
| 29 | Kimco Realty Corp. REIT | 573 | ||||||
| 10 | Macerich Co. REIT | 586 | ||||||
| 13 | Plum Creek Timber Co., Inc. REIT | 585 | ||||||
| 35 | ProLogis L.P. REIT | 1,306 | ||||||
| 10 | Public Storage REIT | 1,538 | ||||||
| 22 | Simon Property Group, Inc. REIT | 3,346 | ||||||
| 21 | Ventas, Inc. REIT | 1,193 | ||||||
| 12 | Vornado Realty Trust REIT | 1,097 | ||||||
| 41 | Weyerhaeuser Co. REIT | 1,301 | ||||||
| 21,944 | ||||||||
| Retailing - 4.4% | ||||||||
| 26 | Amazon.com, Inc. ● | 10,449 | ||||||
| 5 | AutoNation, Inc. ● | 225 | ||||||
| 2 | AutoZone, Inc. ● | 1,128 | ||||||
| 15 | Bed Bath & Beyond, Inc. ● | 1,220 | ||||||
| 19 | Best Buy Co., Inc. | 771 | ||||||
| 16 | CarMax, Inc. ● | 745 | ||||||
| 21 | Dollar General Corp. ● | 1,258 | ||||||
| 15 | Dollar Tree, Inc. ● | 829 | ||||||
| 7 | Expedia, Inc. | 510 | ||||||
| 7 | Family Dollar Stores, Inc. | 446 | ||||||
| 8 | GameStop Corp. Class A | 406 | ||||||
| 19 | Gap, Inc. | 734 | ||||||
| 11 | Genuine Parts Co. | 906 | ||||||
| 100 | Home Depot, Inc. | 8,210 | ||||||
| 14 | Kohl's Corp. | 808 | ||||||
| 17 | L Brands, Inc. | 1,067 | ||||||
| 74 | Lowe's Cos., Inc. | 3,670 | ||||||
| 26 | Macy's, Inc. | 1,394 | ||||||
| 4 | Netflix, Inc. ● | 1,560 | ||||||
| 10 | Nordstrom, Inc. | 624 | ||||||
| 8 | O'Reilly Automotive, Inc. ● | 972 | ||||||
| 7 | PetSmart, Inc. | 531 | ||||||
| 4 | Priceline.com, Inc. ● | 4,195 | ||||||
| 15 | Ross Stores, Inc. | 1,150 | ||||||
| 47 | Staples, Inc. | 743 | ||||||
| 45 | Target Corp. | 2,828 | ||||||
| 8 | Tiffany & Co. | 728 | ||||||
| 50 | TJX Cos., Inc. | 3,209 | ||||||
| 8 | TripAdvisor, Inc. ● | 648 | ||||||
| 8 | Urban Outfitters, Inc. ● | 288 | ||||||
| 52,252 | ||||||||
| Semiconductors and Semiconductor Equipment - 2.0% | ||||||||
| 23 | Altera Corp. | 739 | ||||||
| 22 | Analog Devices, Inc. | 1,120 | ||||||
| 85 | Applied Materials, Inc. | 1,508 | ||||||
| 38 | Broadcom Corp. Class A | 1,132 | ||||||
| 5 | First Solar, Inc. ● | 274 | ||||||
| 352 | Intel Corp. | 9,134 | ||||||
| 12 | KLA-Tencor Corp. | 757 | ||||||
| 11 | Lam Research Corp. ● | 625 | ||||||
| 17 | Linear Technology Corp. | 756 | ||||||
| 39 | LSI Corp. | 425 | ||||||
| 14 | Microchip Technology, Inc. | 627 | ||||||
| 74 | Micron Technology, Inc. ● | 1,619 | ||||||
| 41 | NVIDIA Corp. | 656 | ||||||
| 78 | Texas Instruments, Inc. | 3,404 | ||||||
| 19 | Xilinx, Inc. | 872 | ||||||
| 23,648 | ||||||||
| Software and Services - 10.2% | ||||||||
| 45 | Accenture plc | 3,701 | ||||||
| 33 | Adobe Systems, Inc. ● | 1,970 | ||||||
| 13 | Akamai Technologies, Inc. ● | 596 | ||||||
| 3 | Alliance Data Systems Corp. ● | 894 | ||||||
| 16 | Autodesk, Inc. ● | 804 | ||||||
| 34 | Automatic Data Processing, Inc. | 2,757 | ||||||
| 23 | CA, Inc. | 772 | ||||||
| 13 | Citrix Systems, Inc. ● | 835 | ||||||
| 21 | Cognizant Technology Solutions Corp. ● | 2,163 | ||||||
| 10 | Computer Sciences Corp. | 584 | ||||||
| 83 | eBay, Inc. ● | 4,529 | ||||||
| 22 | Electronic Arts, Inc. ● | 503 | ||||||
| 116 | Facebook, Inc. ● | 6,362 | ||||||
| 21 | Fidelity National Information Services, Inc. | 1,104 | ||||||
| 18 | Fiserv, Inc. ● | 1,076 | ||||||
| 20 | Google, Inc. ● | 22,255 | ||||||
| 72 | IBM Corp. | 13,557 | ||||||
| 20 | Intuit, Inc. | 1,536 | ||||||
| 7 | Mastercard, Inc. | 6,101 | ||||||
| 538 | Microsoft Corp. | 20,124 | ||||||
| 248 | Oracle Corp. | 9,502 | ||||||
| 23 | Paychex, Inc. | 1,046 | ||||||
| 13 | Red Hat, Inc. ● | 754 | ||||||
| 39 | Salesforce.com, Inc. ● | 2,165 | ||||||
| 49 | Symantec Corp. | 1,162 | ||||||
| 12 | Teradata Corp. ● | 526 | ||||||
| 12 | Total System Services, Inc. | 394 | ||||||
| 9 | VeriSign, Inc. ● | 546 | ||||||
| 36 | Visa, Inc. | 8,025 | ||||||
| 39 | Western Union Co. | 675 | ||||||
| 67 | Yahoo!, Inc. ● | 2,702 | ||||||
| 119,720 | ||||||||
| Technology Hardware and Equipment - 6.3% | ||||||||
| 6 | Allegion plc ● | 278 | ||||||
| 11 | Amphenol Corp. Class A | 997 | ||||||
| 64 | Apple, Inc. | 35,755 | ||||||
The accompanying notes are an integral part of these financial statements.
| 7 |
| Hartford Index HLS Fund |
| Schedule of Investments – (continued) |
| December 31, 2013 |
| (000’s Omitted) |
| Shares or Principal Amount | Market Value ╪ | |||||||||||
| COMMON STOCKS - 99.2% - (continued) | ||||||||||||
| Technology Hardware and Equipment - 6.3% - (continued) | ||||||||||||
| 378 | Cisco Systems, Inc. | $ | 8,494 | |||||||||
| 102 | Corning, Inc. | 1,825 | ||||||||||
| 146 | EMC Corp. | 3,664 | ||||||||||
| 5 | F5 Networks, Inc. ● | 496 | ||||||||||
| 10 | FLIR Systems, Inc. | 302 | ||||||||||
| 8 | Harris Corp. | 531 | ||||||||||
| 136 | Hewlett-Packard Co. | 3,805 | ||||||||||
| 13 | Jabil Circuit, Inc. | 230 | ||||||||||
| 36 | Juniper Networks, Inc. ● | 806 | ||||||||||
| 16 | Motorola Solutions, Inc. | 1,098 | ||||||||||
| 24 | NetApp, Inc. | 992 | ||||||||||
| 120 | Qualcomm, Inc. | 8,882 | ||||||||||
| 16 | SanDisk Corp. | 1,125 | ||||||||||
| 23 | Seagate Technology plc | 1,295 | ||||||||||
| 29 | TE Connectivity Ltd. | 1,599 | ||||||||||
| 15 | Western Digital Corp. | 1,250 | ||||||||||
| 82 | Xerox Corp. | 997 | ||||||||||
| 74,421 | ||||||||||||
| Telecommunication Services - 2.3% | ||||||||||||
| 373 | AT&T, Inc. | 13,111 | ||||||||||
| 42 | CenturyLink, Inc. | 1,332 | ||||||||||
| 24 | Crown Castle International Corp. ● | 1,736 | ||||||||||
| 71 | Frontier Communications Co. | 329 | ||||||||||
| 203 | Verizon Communications, Inc. | 9,955 | ||||||||||
| 42 | Windstream Holdings, Inc. | 337 | ||||||||||
| 26,800 | ||||||||||||
| Transportation - 2.0% | ||||||||||||
| 11 | C.H. Robinson Worldwide, Inc. | 625 | ||||||||||
| 72 | CSX Corp. | 2,065 | ||||||||||
| 61 | Delta Air Lines, Inc. | 1,663 | ||||||||||
| 15 | Expeditors International of Washington, Inc. | 645 | ||||||||||
| 21 | FedEx Corp. | 3,026 | ||||||||||
| 8 | Kansas City Southern | 960 | ||||||||||
| 22 | Norfolk Southern Corp. | 2,031 | ||||||||||
| 4 | Ryder System, Inc. | 278 | ||||||||||
| 49 | Southwest Airlines Co. | 929 | ||||||||||
| 33 | Union Pacific Corp. | 5,484 | ||||||||||
| 51 | United Parcel Service, Inc. Class B | 5,316 | ||||||||||
| 23,022 | ||||||||||||
| Utilities - 2.9% | ||||||||||||
| 46 | AES (The) Corp. | 675 | ||||||||||
| 8 | AGL Resources, Inc. | 395 | ||||||||||
| 17 | Ameren Corp. | 621 | ||||||||||
| 35 | American Electric Power Co., Inc. | 1,613 | ||||||||||
| 30 | CenterPoint Energy, Inc. | 703 | ||||||||||
| 19 | CMS Energy Corp. | 505 | ||||||||||
| 21 | Consolidated Edison, Inc. | 1,145 | ||||||||||
| 41 | Dominion Resources, Inc. | 2,655 | ||||||||||
| 13 | DTE Energy Co. | 831 | ||||||||||
| 50 | Duke Energy Corp. | 3,449 | ||||||||||
| 23 | Edison International | 1,068 | ||||||||||
| 13 | Entergy Corp. | 800 | ||||||||||
| 61 | Exelon Corp. | 1,662 | ||||||||||
| 30 | FirstEnergy Corp. | 975 | ||||||||||
| 6 | Integrys Energy Group, Inc. | 306 | ||||||||||
| 31 | NextEra Energy, Inc. | 2,614 | ||||||||||
| 22 | NiSource, Inc. | 728 | ||||||||||
| 22 | Northeast Utilities | 946 | ||||||||||
| 23 | NRG Energy, Inc. | 657 | ||||||||||
| 15 | Oneok, Inc. | 907 | ||||||||||
| 18 | Pepco Holdings, Inc. | 340 | ||||||||||
| 32 | PG&E Corp. | 1,281 | ||||||||||
| 8 | Pinnacle West Capital Corp. | 414 | ||||||||||
| 45 | PPL Corp. | 1,341 | ||||||||||
| 36 | Public Service Enterprise Group, Inc. | 1,146 | ||||||||||
| 10 | SCANA Corp. | 465 | ||||||||||
| 16 | Sempra Energy | 1,442 | ||||||||||
| 62 | Southern Co. | 2,566 | ||||||||||
| 14 | TECO Energy, Inc. | 249 | ||||||||||
| 16 | Wisconsin Energy Corp. | 663 | ||||||||||
| 35 | Xcel Energy, Inc. | 983 | ||||||||||
| 34,145 | ||||||||||||
| Total common stocks | ||||||||||||
| (cost $710,444) | $ | 1,167,351 | ||||||||||
| Total long-term investments | ||||||||||||
| (cost $710,444) | $ | 1,167,351 | ||||||||||
| SHORT-TERM INVESTMENTS - 0.9% | ||||||||||||
| Repurchase Agreements - 0.9% | ||||||||||||
| RBS Greenwich Capital Markets TriParty Repurchase Agreement (maturing on 01/02/2014 in the amount of $10,111, collateralized by U.S. Treasury Note 0.38% - 1.50%, 2016 - 2018, value of $10,317) | ||||||||||||
| $ | 10,111 | 0.01%, 12/31/2013 | $ | 10,111 | ||||||||
| U.S. Treasury Bills - 0.0% | ||||||||||||
| 850 | 0.04%, 01/09/2014 □○ | $ | 850 | |||||||||
| Total short-term investments | ||||||||||||
| (cost $10,961) | $ | 10,961 | ||||||||||
| Total investments | ||||||||||||
| (cost $721,405) ▲ | 100.1 | % | $ | 1,178,312 | ||||||||
| Other assets and liabilities | (0.1 | )% | (1,325 | ) | ||||||||
| Total net assets | 100.0 | % | $ | 1,176,987 | ||||||||
The accompanying notes are an integral part of these financial statements.
| 8 |
| Note: | Percentage of investments as shown is the ratio of the total market value to total net assets. |
| ▲ | At December 31, 2013, the cost of securities for federal income tax purposes was $758,213 and the aggregate gross unrealized appreciation and depreciation based on that cost were: |
| Unrealized Appreciation | $ | 491,555 | ||
| Unrealized Depreciation | (71,456 | ) | ||
| Net Unrealized Appreciation | $ | 420,099 |
| ● | Non-income producing. |
| ○ | The interest rate disclosed for these securities represents the effective yield on the date of the acquisition. | |
| □ | This security, or a portion of this security, is pledged as initial margin deposit and collateral for daily variation margin loss on open futures contracts held at December 31, 2013, as listed in the table below: |
| Futures Contracts Outstanding at December 31, 2013 | ||||||||||||||||||
| Description | Number of Contracts* | Expiration Date | Notional Amount | Market Value ╪ | Unrealized Appreciation/ (Depreciation) | |||||||||||||
| Long position contracts: | ||||||||||||||||||
| S&P 500 Futures | 27 | 03/20/2014 | $ | 12,134 | $ | 12,427 | $ | 293 | ||||||||||
* The number of contracts does not omit 000's.
| ╪ | See Significant Accounting Policies of accompanying Notes to Financial Statements regarding valuation of securities. |
| GLOSSARY: (abbreviations used in preceding Schedule of Investments) | |
| Index Abbreviations: | |
| S&P | Standard & Poors |
| Other Abbreviations: | |
| REIT | Real Estate Investment Trust |
The accompanying notes are an integral part of these financial statements.
| 9 |
| Hartford Index HLS Fund |
| Investment Valuation Hierarchy Level Summary |
| December 31, 2013 |
| (000’s Omitted) |
| Total | Level 1 ♦ | Level 2 ♦ | Level 3 | |||||||||||||
| Assets: | ||||||||||||||||
| Common Stocks ‡ | $ | 1,167,351 | $ | 1,167,351 | $ | – | $ | – | ||||||||
| Short-Term Investments | 10,961 | – | 10,961 | – | ||||||||||||
| Total | $ | 1,178,312 | $ | 1,167,351 | $ | 10,961 | $ | – | ||||||||
| Futures * | 293 | 293 | – | – | ||||||||||||
| Total | $ | 293 | $ | 293 | $ | – | $ | – | ||||||||
| ♦ | For the year ended December 31, 2013, there were no transfers between Level 1 and Level 2. |
| ‡ | The Fund has all or primarily all of the equity securities categorized in a particular level. Refer to the Schedule of Investments for further industry breakout. |
| * | Derivative instruments (excluding purchased and written options, if applicable) are valued at the unrealized appreciation/depreciation on the investments. |
| Note: | For purposes of reporting transfers between different hierarchy levels, both transfers in and out of each level, as applicable, are shown as if they occurred at the beginning of the period. |
The accompanying notes are an integral part of these financial statements.
| 10 |
| Hartford Index HLS Fund |
| Statement of Assets and Liabilities |
| December 31, 2013 |
| (000’s Omitted) |
| Assets: | ||||
| Investments in securities, at market value (cost $721,405) | $ | 1,178,312 | ||
| Receivables: | ||||
| Fund shares sold | 72 | |||
| Dividends and interest | 1,574 | |||
| Variation margin on financial derivative instruments | 43 | |||
| Total assets | 1,180,001 | |||
| Liabilities: | ||||
| Bank overdraft | 2 | |||
| Payables: | ||||
| Fund shares redeemed | 2,837 | |||
| Investment management fees | 77 | |||
| Distribution fees | 23 | |||
| Accrued expenses | 75 | |||
| Total liabilities | 3,014 | |||
| Net assets | $ | 1,176,987 | ||
| Summary of Net Assets: | ||||
| Capital stock and paid-in-capital | $ | 735,887 | ||
| Undistributed net investment income | 1,324 | |||
| Accumulated net realized loss | (17,424 | ) | ||
| Unrealized appreciation of investments | 457,200 | |||
| Net assets | $ | 1,176,987 | ||
| Shares authorized | 4,000,000 | |||
| Par value | $ | 0.001 | ||
| Class IA: Net asset value per share | $ | 38.54 | ||
| Shares outstanding | 19,818 | |||
| Net assets | $ | 763,868 | ||
| Class IB: Net asset value per share | $ | 38.35 | ||
| Shares outstanding | 10,772 | |||
| Net assets | $ | 413,119 |
The accompanying notes are an integral part of these financial statements.
| 11 |
| Hartford Index HLS Fund |
| Statement of Operations |
| For the Year Ended December 31, 2013 |
| (000’s Omitted) |
| Investment Income: | ||||
| Dividends | $ | 23,378 | ||
| Interest | 6 | |||
| Less: Foreign tax withheld | (5 | ) | ||
| Total investment income, net | 23,379 | |||
| Expenses: | ||||
| Investment management fees | 3,308 | |||
| Transfer agent fees | 2 | |||
| Distribution fees - Class IB | 916 | |||
| Custodian fees | 5 | |||
| Accounting services fees | 110 | |||
| Board of Directors' fees | 28 | |||
| Audit fees | 19 | |||
| Other expenses | 159 | |||
| Total expenses (before fees paid indirectly) | 4,547 | |||
| Custodian fee offset | — | |||
| Total fees paid indirectly | — | |||
| Total expenses, net | 4,547 | |||
| Net Investment Income | 18,832 | |||
| Net Realized Gain on Investments and Other Financial Instruments: | ||||
| Net realized gain on investments | 25,835 | |||
| Net realized gain on futures | 3,159 | |||
| Net Realized Gain on Investments and Other Financial Instruments | 28,994 | |||
| Net Changes in Unrealized Appreciation of Investments and Other Financial Instruments: | ||||
| Net unrealized appreciation of investments | 254,622 | |||
| Net unrealized appreciation of futures | 294 | |||
| Net Changes in Unrealized Appreciation of Investments and Other Financial Instruments | 254,916 | |||
| Net Gain on Investments and Other Financial Instruments | 283,910 | |||
| Net Increase in Net Assets Resulting from Operations | $ | 302,742 |
The accompanying notes are an integral part of these financial statements.
| 12 |
| Hartford Index HLS Fund |
| Statement of Changes in Net Assets |
| (000’s Omitted) |
| For the Year Ended December 31, 2013 | For the Year Ended December 31, 2012 | |||||||
| Operations: | ||||||||
| Net investment income | $ | 18,832 | $ | 18,994 | ||||
| Net realized gain on investments and other financial instruments | 28,994 | 8,922 | ||||||
| Net unrealized appreciation of investments and other financial instruments | 254,916 | 111,762 | ||||||
| Net Increase in Net Assets Resulting from Operations | 302,742 | 139,678 | ||||||
| Distributions to Shareholders: | ||||||||
| From net investment income | ||||||||
| Class IA | (12,238 | ) | (13,809 | ) | ||||
| Class IB | (5,814 | ) | (5,486 | ) | ||||
| Total distributions | (18,052 | ) | (19,295 | ) | ||||
| Capital Share Transactions: | ||||||||
| Class IA | ||||||||
| Sold | 45,696 | 67,728 | ||||||
| Issued on reinvestment of distributions | 12,238 | 13,809 | ||||||
| Redeemed | (176,785 | ) | (150,607 | ) | ||||
| Total capital share transactions | (118,851 | ) | (69,070 | ) | ||||
| Class IB | ||||||||
| Sold | 102,184 | 138,040 | ||||||
| Issued on reinvestment of distributions | 5,814 | 5,486 | ||||||
| Redeemed | (95,765 | ) | (101,658 | ) | ||||
| Total capital share transactions | 12,233 | 41,868 | ||||||
| Net decrease from capital share transactions | (106,618 | ) | (27,202 | ) | ||||
| Net Increase in Net Assets | 178,072 | 93,181 | ||||||
| Net Assets: | ||||||||
| Beginning of period | 998,915 | 905,734 | ||||||
| End of period | $ | 1,176,987 | $ | 998,915 | ||||
| Undistributed (distribution in excess of) net investment income | $ | 1,324 | $ | 821 | ||||
| Shares: | ||||||||
| Class IA | ||||||||
| Sold | 1,353 | 2,335 | ||||||
| Issued on reinvestment of distributions | 323 | 467 | ||||||
| Redeemed | (5,158 | ) | (5,199 | ) | ||||
| Total share activity | (3,482 | ) | (2,397 | ) | ||||
| Class IB | ||||||||
| Sold | 3,033 | 4,800 | ||||||
| Issued on reinvestment of distributions | 155 | 186 | ||||||
| Redeemed | (2,806 | ) | (3,505 | ) | ||||
| Total share activity | 382 | 1,481 | ||||||
The accompanying notes are an integral part of these financial statements.
| 13 |
| Hartford Index HLS Fund |
| Notes to Financial Statements |
| December 31, 2013 |
| (000’s Omitted) |
| 1. | Organization: |
Hartford Index HLS Fund (the “Fund”) serves as an underlying investment option for certain variable annuity and variable life insurance separate accounts of Hartford Life Insurance Company (“HLIC”) and its affiliates and certain qualified retirement plans. The Fund may also serve as an underlying investment option for certain variable annuity and variable life separate accounts of other insurance companies. Owners of variable annuity contracts and policyholders of variable life insurance contracts may choose the funds permitted in the variable insurance contract prospectus. In addition, participants in certain qualified retirement plans may choose the Fund if permitted by their plans.
Hartford Series Fund, Inc. (the “Company”) is an open-end registered management investment company comprised of thirty portfolios. Financial statements for the Fund, a series of the Company, are included in this report.
The Company is organized under the laws of the State of Maryland and is registered with the Securities and Exchange Commission (“SEC”) under the Investment Company Act of 1940, as amended (“1940 Act”). The Fund is a diversified open-end management investment company.
The Fund is divided into Class IA and Class IB shares. Each class is offered at the per share net asset value (“NAV”) without a sales charge and is subject to the same expenses, except that the Class IB shares are subject to distribution and service fees charged pursuant to a Distribution Plan adopted in accordance with Rule 12b-1 under the 1940 Act.
| 2. | Significant Accounting Policies: |
The following is a summary of significant accounting policies of the Fund in the preparation of its financial statements, which are in accordance with United States Generally Accepted Accounting Principles (“U.S. GAAP”). The preparation of financial statements in accordance with U.S. GAAP may require management to make estimates and assumptions that affect the reported amounts of assets and liabilities and disclosure of contingent assets and liabilities at the date of the financial statements and the reported amounts of increases and decreases in net assets from operations during the reporting period. Actual results could differ from those estimates.
| a) | Determination of Net Asset Value – The NAV of each class of the Fund’s shares is determined as of the close of regular trading (normally 4:00 p.m. Eastern Time) (the “NYSE Close”) on each day that the New York Stock Exchange (the “Exchange”) is open (“Valuation Date”). Information that becomes known to the Fund after the NAV has been calculated on a particular day will not generally be used to retroactively adjust the NAV determined earlier that day. |
| b) | Investment Valuation and Fair Value Measurements – For purposes of calculating the NAV, portfolio investments and other assets held by the Fund's portfolio for which market quotes are readily available are valued at market value. Market value is generally determined on the basis of last reported sales prices or official close price. If no sales are reported, market value is based on quotes obtained from a quotation reporting system, established market makers, or independent pricing services. If market prices are not readily available or are deemed unreliable, the Fund will use the fair value of the investment as determined in good faith under policies and procedures established by and under the supervision of the Company's Board of Directors. Market quotes are considered not readily available where there is an absence of current or reliable market-based data (e.g., trade information or indicative market quotes), including where events occur after the close of the relevant market, but prior to the NYSE Close that materially affect the values of the Fund's portfolio investments or assets. In addition, market quotes are considered not readily available when, due to extraordinary circumstances, the exchanges or markets on which the investments trade do not open for trading for the entire day and no other market prices are available. There can be no assurance that the Fund could obtain the fair market value assigned to an investment if the Fund were to sell the investment at approximately the time at which the Fund determines its NAV. |
| 14 |
Short-term investments maturing in 60 days or less are generally valued at amortized cost, if their original term to maturity was 60 days or less, or by amortizing their value on the 61st day prior to maturity, if the original term to maturity exceeded 60 days.
Exchange traded options, futures and options on futures are valued at the settlement price or last trade price determined by the relevant exchange as of the NYSE Close. If the last trade price for exchange traded options does not fall between the bid and ask prices, the value will be the mean of the bid and ask prices as of the NYSE Close. If a last trade price is not available, the value will be the mean of the bid and ask prices as of the NYSE Close. If a mean of the bid and ask prices cannot be calculated for the day, the value will be the bid price as of the NYSE Close. In the case of OTC options and such instruments that do not trade on an exchange, values may be supplied by a pricing service using a formula or other objective method that may take into consideration the style, direction, expiration, strike price, notional value and volatility or other special adjustments.
Financial instruments for which prices are not available from an independent pricing service may be valued using market quotations obtained from one or more dealers that make markets in the respective financial instrument in accordance with procedures established by the Company’s Board of Directors.
U.S. GAAP defines fair value as the price that the Fund would receive to sell an asset or pay to transfer a liability in an orderly transaction between market participants. The U.S. GAAP fair value measurement standards require disclosure of a fair value hierarchy for each major category of assets and liabilities. Various inputs are used in determining the fair value of the Fund’s investments. These inputs are summarized into three broad hierarchy levels. This hierarchy is based on whether the valuation inputs are observable or unobservable. These levels are:
| · | Level 1 – Quoted prices in active markets for identical investments. Level 1 may include exchange traded instruments, such as domestic equities, some foreign equities, options, futures, mutual funds, exchange traded funds, rights and warrants. |
| · | Level 2 – Observable inputs other than Level 1 prices, such as quoted prices for similar investments; quoted prices in markets that are not active; or other inputs that are observable or can be corroborated by observable market data. Level 2 may include debt investments that are traded less frequently than exchange traded instruments and which are valued using independent pricing services; foreign equities, which are principally traded on certain foreign markets and are adjusted daily pursuant to a fair value pricing service in order to reflect an adjustment for the factors occurring after the close of certain foreign markets but before the NYSE Close; senior floating rate interests, which are valued using an aggregate of dealer bids; short-term investments, which are valued at amortized cost; and swaps, which are valued based upon the terms of each swap contract. |
| · | Level 3 – Significant unobservable inputs that are supported by limited or no market activity. Level 3 may include financial instruments whose values are determined using indicative market quotes or require significant management judgment or estimation. These unobservable valuation inputs may include estimates for current yields, maturity/duration, prepayment speed, and indicative market quotes for comparable investments along with other assumptions relating to credit quality, collateral value, complexity of the investment structure, general market conditions and liquidity. This category may include investments where trading has been halted or there are certain restrictions on trading. While these investments are priced using unobservable inputs, the valuation of these investments reflects the best available data and management believes the prices are a reasonable representation of exit price. |
The Board of Directors of the Company generally reviews and approves the “Procedures for Valuation of Portfolio Securities” on an annual basis. These procedures define how investments are to be valued, including the formation and activities of a Valuation Committee. The Valuation Committee is responsible for determining in good faith the fair value of investments when the value cannot be obtained from primary pricing services or alternative sources or if the valuation of an investment as provided by the primary pricing service or alternative source is believed not to reflect the investment’s fair value as of the Valuation Date. Voting members of the Valuation Committee include the Fund’s Treasurer or designee and a Vice President of the investment manager
| 15 |
| Hartford Index HLS Fund |
| Notes to Financial Statements – (continued) |
| December 31, 2013 |
| (000’s Omitted) |
or designee. An Assistant Vice President of the Fund with legal expertise or designee is also included on the Valuation Committee as a non-voting advisory member. In addition, the Fund’s Chief Compliance Officer shall designate a member of the compliance group to attend Valuation Committee meetings as a non-voting resource, to monitor for and provide guidance with respect to compliance with these procedures. Two members of the Valuation Committee or their designees, representing different departments, shall constitute a quorum for purposes of permitting the Valuation Committee to take action. The Valuation Committee will consider all relevant factors in determining an investment’s fair value, and may seek the advice of the Fund’s sub-adviser, knowledgeable brokers, and legal counsel in making such determination. The Valuation Committee reports to the Audit Committee of the Company’s Board of Directors. The Audit Committee receives quarterly written reports which include details of all fair-valued investments, including the reason for the fair valuation, and an indication, when possible, of the accuracy of the valuation by disclosing the next available reliable public price quotation or the disposition price of such investments (the “look-back” test). The Board of Directors then must consider for ratification all of the fair value determinations made during the previous quarter.
Valuation levels are not necessarily indicative of the risk associated with investing in such investments. Individual investments within any of the above mentioned asset classes may be assigned a different hierarchical level than those presented above, as individual circumstances dictate.
For additional information, refer to the Investment Valuation Hierarchy Level Summary and the Level 3 roll-forward reconciliation, if applicable, which follow the Schedule of Investments.
| c) | Investment Transactions and Investment Income – Investment transactions are recorded as of the trade date (the date the order to buy or sell is executed) for financial reporting purposes. Investments purchased or sold on a when-issued or delayed-delivery basis may be settled a month or more after the trade date. Realized gains and losses are determined on the basis of identified cost. |
Dividend income from domestic securities is accrued on the ex-dividend date. In general, dividend income from foreign securities is recorded on the ex-date; however, dividend notifications in certain foreign jurisdictions may not be available in a timely manner and as a result, the Fund will record the dividend as soon as the relevant details (i.e., rate per share, payment date, shareholders of record, etc.) are publicly available. Interest income, including amortization of premium, accretion of discounts and additional principal received in-kind in lieu of cash, is accrued on a daily basis.
| d) | Fund Share Valuation and Dividend Distributions to Shareholders – Orders for the Fund’s shares are executed in accordance with the investment instructions of the contract holders and plan participants. The NAV of the Fund’s shares is determined as of the close of business on each business day of the Exchange. The NAV is determined separately for each class of shares of the Fund by dividing the Fund’s net assets attributable to that class by the number of shares of the class outstanding. Each class of shares offered by the Fund has equal rights as to assets and voting privileges (except that shareholders of a class have exclusive voting rights regarding any matter relating solely to that class of shares). Income and non-class specific expenses are allocated daily to each class on the basis of the relative net assets of the class. Realized and unrealized gains and losses are allocated daily based on the relative net assets of each class of shares of the Fund. |
Orders for the purchase of the Fund’s shares received prior to the close of the Exchange on any day the Exchange is open for business are priced at the NAV determined as of the close of the Exchange. Orders received after the close of the Exchange, or on a day on which the Exchange and/or the Fund is not open for business, are priced at the next determined NAV.
Dividends are declared pursuant to a policy adopted by the Company’s Board of Directors based upon the investment performance of the Fund. The policy of the Fund is to pay dividends from net investment income and realized gains, if any, at least once a year.
| 16 |
Distributions from net investment income, net realized gains and capital are determined in accordance with federal income tax regulations, which may differ from U.S. GAAP with respect to character and timing. These differences may include, but are not limited to, losses deferred due to wash sale adjustments, foreign currency gains and losses, adjustments related to Passive Foreign Investment Companies (“PFICs”), Real Estate Investment Trusts (“REITs”), Regulated Investment Companies (“RICs”), certain derivatives and partnerships. Permanent book and federal income tax basis differences relating to shareholder distributions will result in reclassifications to certain of the Fund’s capital accounts (see Federal Income Taxes: Reclassification of Capital Accounts note).
| 3. | Securities and Other Investments: |
| a) | Repurchase Agreements – A repurchase agreement is an agreement by which a counterparty agrees to sell an investment and agrees to repurchase the investment sold from the buyer at a mutually agreed upon time and price. During the period of the repurchase agreement, the counterparty will deposit cash and or securities in a third party custodial account to serve as collateral. At the time the Fund enters into a repurchase agreement, the value of the underlying collateral, including accrued interest, will be equal to or exceed the value of the repurchase agreement. Repurchase agreements expose the Fund to counterparty risk - that is, the risk that the counterparty will not fulfill its obligations. To minimize counterparty risk, the investments that serve to collateralize the repurchase agreement are held by the Fund’s custodian in book entry or physical form in the custodial account of the Fund or in a third party custodial account. Repurchase agreements are valued at cost plus accrued interest, which approximates fair value. Repurchase agreements have master netting arrangements which allow the Fund to offset amounts owed to a counterparty with amounts owed by the counterparty, including any collateral. Upon an event of default under a master repurchase agreement, the non-defaulting party may close out all transactions traded under such agreement and net amounts owed under each transaction to one net amount payable by one party to the other. Absent an event of default, the master repurchase agreement does not result in an offset of reported amounts of assets and liabilities in the Statement of Assets and Liabilities across transactions between the Fund and the applicable counterparty. The Fund, as shown on the Schedule of Investments, had outstanding repurchase agreements and related collateral as of December 31, 2013. |
| 4. | Financial Derivative Instruments: |
The following disclosures contain information on how and why the Fund uses derivative instruments, the credit-risk-related contingent features in certain derivative instruments, and how derivative instruments affect the Fund’s financial position and results of operations. The location and fair value amounts of these instruments on the Statement of Assets and Liabilities and the realized gains and losses and changes in unrealized gains and losses on the Statement of Operations, each categorized by type of derivative contract, are included in the following Additional Derivative Instrument Information footnote. The derivative instruments outstanding as of year-end are disclosed in the notes to or within the Schedule of Investments for purchased options, if applicable. The amounts of realized gains and losses and changes in unrealized gains and losses on derivative instruments during the year are disclosed in the Statement of Operations.
| a) | Futures Contracts – The Fund may enter into futures contracts. A futures contract is an agreement between two parties to buy or sell an asset at a set price on a future date. The Fund uses futures contracts to manage or obtain exposure to the investment markets, commodities, or movements in interest rates and currency values. The primary risks associated with the use of futures contracts are the imperfect correlation between the change in market value of the investments held by the Fund and the prices of futures contracts and the possibility of an illiquid market. Upon entering into a futures contract, the Fund is required to deposit with a futures commission merchant (“FCM”) an amount of cash or U.S. Government or Agency Obligations in accordance with the initial margin requirements of the broker or exchange. Futures contracts are marked to market daily at the most recent settlement price reported by an exchange on which, over time, they are traded most extensively, and an appropriate payable or receivable for the change in value (“variation margin”) is recorded by the Fund. Gains or losses are recognized but not considered realized until the contracts expire or are closed. Futures contracts involve, to varying degrees, risk of loss in excess of the variation margin disclosed on the |
| 17 |
| Hartford Index HLS Fund |
| Notes to Financial Statements – (continued) |
| December 31, 2013 |
| (000’s Omitted) |
Statement of Assets and Liabilities; however, the Fund seeks to reduce this risk through the use of an FCM. The Fund, as shown on the Schedule of Investments, had outstanding futures contracts as of December 31, 2013.
| b) | Additional Derivative Instrument Information: |
Fair Value of Derivative Instruments on the Statement of Assets and Liabilities as of December 31, 2013:
| Risk Exposure Category | ||||||||||||||||||||||||||||
| Interest Rate Contracts | Foreign Exchange Contracts | Credit Contracts | Equity Contracts | Commodity Contracts | Other Contracts | Total | ||||||||||||||||||||||
| Assets: | ||||||||||||||||||||||||||||
| Variation margin receivable * | $ | — | $ | — | $ | — | $ | 43 | $ | — | $ | — | $ | 43 | ||||||||||||||
| Total | $ | — | $ | — | $ | — | $ | 43 | $ | — | $ | — | $ | 43 | ||||||||||||||
| * | Only current day's variation margin is reported within the Statement of Assets and Liabilities. The variation margin is included in the open futures cumulative appreciation of $293 as reported in the Schedule of Investments. |
The volume of derivatives that is presented in the Schedule of Investments is consistent with the derivative activity during the year ended December 31, 2013.
The Effect of Derivative Instruments on the Statement of Operations for the year ended December 31, 2013:
| Risk Exposure Category | ||||||||||||||||||||||||||||
| Interest Rate Contracts | Foreign Exchange Contracts | Credit Contracts | Equity Contracts | Commodity Contracts | Other Contracts | Total | ||||||||||||||||||||||
| Realized Gain on Derivatives Recognized as a Result of Operations: | ||||||||||||||||||||||||||||
| Net realized gain on futures | $ | — | $ | — | $ | — | $ | 3,159 | $ | — | $ | — | $ | 3,159 | ||||||||||||||
| Total | $ | — | $ | — | $ | — | $ | 3,159 | $ | — | $ | — | $ | 3,159 | ||||||||||||||
| Net Change in Unrealized Appreciation (Depreciation) on Derivatives Recognized as a Result of Operations: | ||||||||||||||||||||||||||||
| Net change in unrealized appreciation of futures | $ | — | $ | — | $ | — | $ | 294 | $ | — | $ | — | $ | 294 | ||||||||||||||
| Total | $ | — | $ | — | $ | — | $ | 294 | $ | — | $ | — | $ | 294 | ||||||||||||||
The derivatives held by the Fund as of December 31, 2013 are not subject to a master netting arrangement; therefore, no balance sheet offsetting disclosure is presented.
| 5. | Principal Risks: |
The Fund may be exposed to counterparty risk, or the risk that an institution or other entity with which the Fund has unsettled or open transactions will default.
The market values of equity securities, such as common stocks and preferred stocks, or equity related investments, such as futures and options, may decline due to general market conditions which are not specifically related to a particular company, such as real or perceived adverse economic conditions, changes in the general outlook for corporate earnings, changes in interest or currency rates or adverse investor sentiment generally. The market value of equity securities may also decline due to factors which affect a particular industry or industries, such as labor shortages or increased production costs and competitive conditions within an industry. Equity securities and equity related investments generally have greater market price volatility than fixed income securities.
| 18 |
| 6. | Federal Income Taxes: |
| a) | Federal Income Taxes – For federal income tax purposes, the Fund intends to continue to qualify as a RIC under Subchapter M of the Internal Revenue Code (“IRC”) by distributing substantially all of its taxable net investment income and net realized capital gains to its shareholders and otherwise complying with the requirements of the IRC. The Fund has distributed substantially all of its income and capital gains in prior years, if applicable, and intends to distribute substantially all of its income and capital gains prior to the next fiscal year-end. Accordingly, no provision for federal income or excise taxes has been made in the accompanying financial statements. Distributions from short-term capital gains are treated as ordinary income distributions for federal income tax purposes. |
| b) | Net Investment Income (Loss), Net Realized Gains (Losses) and Distributions – Net investment income (loss) and net realized gains (losses) may differ for financial statement and tax purposes primarily because of losses deferred due to wash sale adjustments, foreign currency gains and losses, adjustments related to PFICs, REITs, RICs, certain derivatives and partnerships. The character of distributions made during the year from net investment income or net realized gains may differ from their ultimate characterization for federal income tax purposes. Also, due to the timing of dividend distributions, the fiscal year in which amounts are distributed may differ from the year that the income or realized gains (losses) were recorded by the Fund. |
| c) | Distributions and Components of Distributable Earnings – The tax character of distributions paid by the Fund for the periods indicated is as follows (as adjusted for dividends payable, if applicable): |
| For the Year Ended December 31, 2013 | For the Year Ended December 31, 2012 | |||||||
| Ordinary Income | $ | 18,052 | $ | 19,295 | ||||
As of December 31, 2013, the Fund’s components of distributable earnings (deficit) on a tax basis were as follows:
| Amount | ||||
| Undistributed Ordinary Income | $ | 1,324 | ||
| Undistributed Long-Term Capital Gain | 19,676 | |||
| Unrealized Appreciation* | 420,100 | |||
| Total Accumulated Earnings | $ | 441,100 | ||
| * | Differences between book-basis and tax-basis unrealized appreciation (depreciation) may be attributable to the losses deferred due to wash sale adjustments, foreign currency gains and losses, adjustments related to PFICs, REITs, RICs, certain derivatives and partnerships. |
| d) | Reclassification of Capital Accounts – The Fund may record reclassifications in its capital accounts. These reclassifications have no impact on the total net assets of the Fund. The reclassifications are a result of permanent differences between U.S. GAAP and tax accounting for such items as foreign currency, PFICs, expiration or utilization of capital loss carryforwards or net operating losses. Adjustments are made to reflect the impact these items have on current and future distributions to shareholders. Therefore, the source of the Fund’s distributions may be shown in the accompanying Statement of Changes in Net Assets as from undistributed net investment income, from accumulated net realized gains on investments or from capital depending on the type of book and tax differences that exist. For the year ended December 31, 2013, the Fund recorded reclassifications to increase (decrease) the accounts listed below: |
| Amount | ||||
| Undistributed Net Investment Income (Loss) | $ | (277 | ) | |
| Accumulated Net Realized Gain (Loss) | 277 | |||
| 19 |
| Hartford Index HLS Fund |
| Notes to Financial Statements – (continued) |
| December 31, 2013 |
| (000’s Omitted) |
| e) | Capital Loss Carryforward – On December 22, 2010, the Regulated Investment Company Modernization Act of 2010 (the “Act”) was enacted, which made changes to the capital loss carryforward rules. The changes are effective for taxable years beginning after the date of enactment. Under the Act, funds are permitted to carry forward capital losses for an unlimited period. However, any losses incurred during those future taxable years will be required to be utilized prior to the losses incurred in pre-enactment taxable years, which carry an expiration date. As a result of this ordering rule, pre-enactment capital loss carryforwards may be more likely to expire unused. Additionally, post-enactment capital loss carryforwards retain their character as either short-term or long-term capital losses rather than being considered all short-term as permitted under prior regulation. |
The Fund had no capital loss carryforward for U.S. federal income tax purposes as of December 31, 2013.
During the year ended December 31, 2013, the Fund utilized $2,042 of prior year capital loss carryforwards.
| f) | Accounting for Uncertainty in Income Taxes – The Fund has adopted financial reporting rules that require the Fund to analyze all open tax years, as defined by the statute of limitations, for all major jurisdictions. Generally, tax authorities can examine all tax returns filed for the last three years. The Fund does not have an examination in progress. |
The Fund has reviewed all open tax years and major jurisdictions and concluded that these financial reporting rules had no effect on the Fund’s financial position or results of operations. There is no tax liability resulting from unrecognized tax benefits relating to uncertain income tax positions taken or expected to be taken on the tax return for the fiscal year ended December 31, 2013. The Fund is also not aware of any tax positions for which it is reasonably possible that the total amounts of unrecognized tax benefits will significantly change in the next twelve months.
| 7. | Expenses: |
| a) | Investment Management Agreement – Hartford Funds Management Company, LLC (“HFMC”), an indirect wholly owned subsidiary of The Hartford Financial Services Group, Inc. (“The Hartford”), serves as investment manager to the Fund pursuant to an Investment Management Agreement with the Company. The investment manager has overall investment supervisory responsibility for the Fund. In addition, the investment manager provides administrative personnel, services, equipment, facilities and office space for proper operation of the Fund. The investment manager has contracted with Hartford Investment Management Company (“Hartford Investment Management”) under a sub-advisory agreement for the provision of day-to-day investment management services to the Fund in accordance with the Fund’s investment objective and policies. The Fund pays a fee to the investment manager, a portion of which may be used to compensate Hartford Investment Management. |
The schedule below reflects the rates of compensation paid to HFMC for investment management services rendered as of December 31, 2013; the rates are accrued daily and paid monthly.
| Average Daily Net Assets | Annual Fee |
| On first $2 billion | 0.3000% |
| On next $3 billion | 0.2000% |
| On next $5 billion | 0.1800% |
| Over $10 billion | 0.1700% |
| 20 |
| b) | Accounting Services Agreement – Pursuant to the Fund Accounting Agreement between HFMC and the Company, on behalf of the Fund, HFMC provides accounting services to the Fund and receives monthly compensation based on the Fund’s average daily net assets at the rates set forth below. The Fund’s accounting services fees are accrued daily and paid monthly. |
| Average Daily Net Assets | Annual Fee |
| All Assets | 0.010% |
| c) | Operating Expenses – Allocable expenses incurred by the Company are allocated to each Fund and allocated to classes within a Fund in proportion to the average daily net assets of the Fund and each class, except where allocation of certain expenses is more fairly made directly to the Fund or to specific classes within a Fund. |
| d) | Fees Paid Indirectly – The Fund’s custodian bank has agreed to reduce its fees when the Fund maintains cash on deposit in a non-interest-bearing custody account. For the year ended December 31, 2013, these amounts, if any, are included in the Statement of Operations. |
The ratio of expenses to average net assets in the accompanying financial highlights excludes the reduction in expenses related to fees paid indirectly. The annualized expense ratio after waivers for the period listed below reflecting the reduction for fees paid indirectly is as follows:
| Year Ended December 31, 2013 | ||||
| Class IA | 0.33 | % | ||
| Class IB | 0.58 | |||
| e) | Distribution Plan for Class IB shares – Effective June 14, 2013, Hartford Investment Financial Services, LLC was renamed Hartford Funds Distributors, LLC (“HFD”). HFD, a wholly owned, ultimate subsidiary of The Hartford, serves as the Fund’s principal underwriter and distributor. The Company, on behalf of the Fund, has adopted a Distribution Plan pursuant to Rule 12b-1 of the 1940 Act to compensate the distributor, HFD, from assets attributable to the Class IB shares for services rendered and expenses borne in connection with activities primarily intended to result in the sale of the Class IB shares, subject to the review and approval of the Company’s Board of Directors. |
The Distribution Plan provides that the Fund may pay annually up to 0.25% of the average daily net assets of the Fund attributable to its Class IB shares for activities primarily intended to result in the sale of Class IB shares. The Board has the authority to suspend or reduce these payments at any point in time. Under the terms of the Distribution Plan and the principal underwriting agreement, the Fund is authorized to make payments monthly to the distributor that may be used to pay or compensate entities providing distribution and shareholder servicing with respect to the Class IB shares for such entities’ fees or expenses incurred or paid in that regard. These fees are accrued daily and paid monthly.
| f) | Other Related Party Transactions – Certain officers of the Fund are directors and/or officers of the investment manager and/or The Hartford or its subsidiaries. For the year ended December 31, 2013, a portion of the Fund’s Chief Compliance Officer’s salary was paid by all the investment companies in the Hartford fund complex. The portion allocated to the Fund was in the amount of $1. Hartford Administrative Services Company (“HASCO”), an indirect wholly owned subsidiary of The Hartford, provides transfer agent services to the Fund. HASCO was compensated on a per account basis for providing such services. The amount paid to HASCO can be found in the Statement of Operations. These fees are accrued daily and paid monthly. |
| 21 |
| Hartford Index HLS Fund |
| Notes to Financial Statements – (continued) |
| December 31, 2013 |
| (000’s Omitted) |
| 8. | Investment Transactions: |
For the year ended December 31, 2013, the Fund's aggregate purchases and sales of investment securities (excluding short-term investments) were as follows:
| Amount | ||||
| Cost of Purchases Excluding U.S. Government Obligations | $ | 32,478 | ||
| Sales Proceeds Excluding U.S. Government Obligations | 137,845 | |||
| 9. | Line of Credit: |
The Fund is one of several Hartford funds that participate in a $500 million committed revolving line of credit facility. The facility is to be used for temporary or emergency purposes. Under the arrangement, the funds are required to own securities having a market value in excess of 300% of the total bank borrowings. The interest rate on borrowings varies depending on the nature of the loan. The facility also requires a fee to be paid based on the amount of the commitment. This commitment fee is allocated to all of the funds participating in the line of credit based on the average net assets of the funds. During the year ended December 31, 2013, the Fund did not have any borrowings under this facility.
| 10. | Industry Classifications: |
Other than the industry classifications “Other Investment Pools and Funds” and “Exchange Traded Funds,” equity industry classifications used in this report are the Global Industry Classification Standard, which was developed by and is the exclusive property and service mark of MSCI, Inc. and Standard & Poor’s.
| 11. | Indemnifications: |
Under the Company’s organizational documents, the Company shall indemnify its officers and directors to the full extent required or permitted under Maryland General Corporation Law and the federal securities laws. In addition, the Company, on behalf of the Fund, may enter into contracts that contain a variety of indemnifications. The Company’s maximum exposure under these arrangements is unknown. However, as of the date of these financial statements, the Company has not had prior claims or losses pursuant to these contracts and expects the risk of loss to be remote.
| 12. | Pending Legal Proceedings: |
| a) | On February 25, 2011, Jennifer L. Kasilag, Louis Mellinger, Judith M. Menendez, Jacqueline M. Robinson, and Linda A. Russell filed a derivative lawsuit against Hartford Investment Financial Services, LLC (“HIFSCO”)(now known as Hartford Funds Distributors, LLC) on behalf of six Hartford retail mutual funds in the United States District Court for the District of New Jersey, alleging that HIFSCO received excessive advisory and distribution fees in violation of its statutory fiduciary duty under Section 36(b) of the 1940 Act when serving as investment manager and principal underwriter, respectively, to the Hartford retail mutual funds. HIFSCO moved to dismiss and, in September 2011, the motion was granted in part and denied in part, with leave to amend the complaint. In November 2011, plaintiffs filed an amended complaint on behalf of certain Hartford retail mutual funds, The Hartford Global Health Fund (now known as The Hartford Healthcare Fund), The Hartford Conservative Allocation Fund, The Hartford Growth Opportunities Fund, The Hartford Inflation Plus Fund, The Hartford Advisers Fund (now known as The Hartford Balanced Fund), and The Hartford Capital Appreciation Fund. Plaintiffs seek to rescind the investment management agreements and distribution plans between HIFSCO and these funds and to recover the total fees charged thereunder or, in the alternative, to recover any improper compensation HIFSCO received, in addition to lost earnings. HIFSCO filed a partial motion to dismiss the amended complaint and, in December 2012, the court dismissed without prejudice the claims regarding distribution fees and denied the motion with respect to the advisory fees claims. HIFSCO disputes the allegations and intends to defend the advisory fee claims vigorously. |
This action concerns the activities of HIFSCO in its capacity as investment manager and principal underwriter to the Hartford retail mutual funds and does not concern HIFSCO’s activities in its capacity as principal underwriter to the
| 22 |
HLS funds. For this reason, no accrual for litigation relating to this matter has been recorded in the financial statements of the Fund.
| b) | On June 2, 2011, a complaint was filed against Hartford Investment Management Company in the United States District Court of Connecticut (Deutsche Bank Trust Company Americas v. Aetna, Inc., ING Investment Trust Co., Milan E. Chilla, Hartford Investment Management Co., and UBS AG (D. Conn.)). In a similar action, plaintiffs filed a complaint listing Hartford Series Fund, Inc. and Hartford HLS Series Fund II, Inc. as members of the defendant class (The Official Committee of Unsecured Creditors of Tribune Company v. Fitzsimons, et al. (Bankr. D. Del.)). The complaints relate to the bankruptcy of the Tribune Company, which was a public company that repurchased its shares in a leveraged buyout in 2007, but entered bankruptcy a year later. The complaints were served in August 2011. The plaintiffs in each case allege that the repurchase of shares acted as a fraudulent transfer. The plaintiffs in each case seek to recover from each class member the amount of consideration received in the buyout. Each action was recently transferred to the United States District Court for the Southern District of New York. In September 2013, the court dismissed the Deutsche Bank Trust Company Americas action. Plaintiffs appealed and the appeals court has not yet rendered a decision. Defendants plan to file a motion to dismiss The Official Committee of Unsecured Creditors of Tribune Company action, but briefing on that motion has not yet begun. The Hartford intends to vigorously defend these actions. |
| 23 |
| Hartford Index HLS Fund |
| Financial Highlights |
| ─ Selected Per-Share Data(A) ─ | ─ Ratios and Supplemental Data ─ | |||||||||||||||||||||||||||||||||||||||||||||||||||
| Class | Net Asset Value at Beginning of Period | Net Investment Income (Loss) | Net Realized and Unrealized Gain (Loss) on Investments | Total from Investment Operations | Dividends from Net Investment Income | Distributions from Realized Capital Gains | Total Dividends and Distributions | Net Asset Value at End of Period | Total Return(B) | Net Assets at End of Period (000s) | Ratio of Expenses to Average Net Assets Before Adjust- ments(C) | Ratio of Expenses to Average Net Assets After Adjust- ments(C) | Ratio of Net Investment Income (Loss) to Average Net Assets | |||||||||||||||||||||||||||||||||||||||
| For the Year Ended December 31, 2013 | ||||||||||||||||||||||||||||||||||||||||||||||||||||
| IA | $ | 29.69 | $ | 0.62 | $ | 8.85 | $ | 9.47 | $ | (0.62 | ) | $ | – | $ | (0.62 | ) | $ | 38.54 | 31.95 | % | $ | 763,868 | 0.33 | % | 0.33 | % | 1.79 | % | ||||||||||||||||||||||||
| IB | 29.56 | 0.53 | 8.80 | 9.33 | (0.54 | ) | – | (0.54 | ) | 38.35 | 31.61 | 413,119 | 0.58 | 0.58 | 1.54 | |||||||||||||||||||||||||||||||||||||
| For the Year Ended December 31, 2012 (D) | ||||||||||||||||||||||||||||||||||||||||||||||||||||
| IA | $ | 26.20 | $ | 0.61 | $ | 3.48 | $ | 4.09 | $ | (0.60 | ) | $ | – | $ | (0.60 | ) | $ | 29.69 | 15.63 | % | $ | 691,786 | 0.33 | % | 0.33 | % | 1.98 | % | ||||||||||||||||||||||||
| IB | 26.09 | 0.49 | 3.51 | 4.00 | (0.53 | ) | – | (0.53 | ) | 29.56 | 15.34 | 307,129 | 0.58 | 0.58 | 1.75 | |||||||||||||||||||||||||||||||||||||
| For the Year Ended December 31, 2011 (D) | ||||||||||||||||||||||||||||||||||||||||||||||||||||
| IA | $ | 26.20 | $ | 0.52 | $ | (0.05 | ) | $ | 0.47 | $ | (0.47 | ) | $ | – | $ | (0.47 | ) | $ | 26.20 | 1.81 | % | $ | 673,275 | 0.33 | % | 0.33 | % | 1.74 | % | |||||||||||||||||||||||
| IB | 26.08 | 0.39 | 0.03 | 0.42 | (0.41 | ) | – | (0.41 | ) | 26.09 | 1.60 | 232,459 | 0.58 | 0.58 | 1.51 | |||||||||||||||||||||||||||||||||||||
| For the Year Ended December 31, 2010 (D) | ||||||||||||||||||||||||||||||||||||||||||||||||||||
| IA | $ | 23.22 | $ | 0.44 | $ | 2.97 | $ | 3.41 | $ | (0.43 | ) | $ | – | $ | (0.43 | ) | $ | 26.20 | 14.73 | % | $ | 809,629 | 0.34 | % | 0.34 | % | 1.73 | % | ||||||||||||||||||||||||
| IB | 23.12 | 0.34 | 2.99 | 3.33 | (0.37 | ) | – | (0.37 | ) | 26.08 | 14.45 | 209,260 | 0.59 | 0.59 | 1.48 | |||||||||||||||||||||||||||||||||||||
| For the Year Ended December 31, 2009 (D) | ||||||||||||||||||||||||||||||||||||||||||||||||||||
| IA | $ | 18.75 | $ | 0.42 | $ | 4.48 | $ | 4.90 | $ | (0.42 | ) | $ | (0.01 | ) | $ | (0.43 | ) | $ | 23.22 | 26.15 | % | $ | 811,634 | 0.35 | % | 0.35 | % | 2.00 | % | |||||||||||||||||||||||
| IB | 18.69 | 0.35 | 4.46 | 4.81 | (0.37 | ) | (0.01 | ) | (0.38 | ) | 23.12 | 25.81 | 166,162 | 0.60 | 0.60 | 1.75 | ||||||||||||||||||||||||||||||||||||
| (A) | Information presented relates to a share outstanding throughout the indicated period. Net investment income (loss) per share amounts are calculated based on average shares outstanding unless otherwise noted. |
| (B) | The figures do not include sales charges or other fees which may be applied at the variable life insurance, variable annuity or qualified retirement plan product level. Any such additional sales charges or other fees would lower the Fund's performance. |
| (C) | Adjustments include waivers and reimbursements, if applicable. Ratios do not include fees paid indirectly (see Expenses in the accompanying Notes to Financial Statements). |
| (D) | Net investment income (loss) per share amounts have been calculated using the SEC method. |
| Portfolio Turnover Rate for All Share Classes | ||||
| For the Year Ended December 31, 2013 | 3 | % | ||
| For the Year Ended December 31, 2012 | 7 | |||
| For the Year Ended December 31, 2011 | 3 | |||
| For the Year Ended December 31, 2010 | 4 | |||
| For the Year Ended December 31, 2009 | 6 | |||
| 24 |
| Report of Independent Registered Public Accounting Firm |
| The Board of Directors and Shareholders of |
| Hartford Series Fund, Inc. |
We have audited the accompanying statement of assets and liabilities, including the schedule of investments, of Hartford Index HLS Fund (one of the portfolios constituting Hartford Series Fund, Inc. (the Funds)) as of December 31, 2013, and the related statement of operations for the year then ended, the statements of changes in net assets for each of the two years in the period then ended, and the financial highlights for each of the five years in the period then ended. These financial statements and financial highlights are the responsibility of the Funds’ management. Our responsibility is to express an opinion on these financial statements and financial highlights based on our audits.
We conducted our audits in accordance with the standards of the Public Company Accounting Oversight Board (United States). Those standards require that we plan and perform the audit to obtain reasonable assurance about whether the financial statements and financial highlights are free of material misstatement. We were not engaged to perform an audit of the Funds’ internal control over financial reporting. Our audits included consideration of internal control over financial reporting as a basis for designing audit procedures that are appropriate in the circumstances, but not for the purpose of expressing an opinion on the effectiveness of the Funds’ internal control over financial reporting. Accordingly, we express no such opinion. An audit also includes examining, on a test basis, evidence supporting the amounts and disclosures in the financial statements and financial highlights, assessing the accounting principles used and significant estimates made by management, and evaluating the overall financial statement presentation. Our procedures included confirmation of securities owned as of December 31, 2013, by correspondence with the custodian and brokers or by other appropriate auditing procedures where replies from brokers were not received. We believe that our audits provide a reasonable basis for our opinion.
In our opinion, the financial statements and financial highlights referred to above present fairly, in all material respects, the financial position of Hartford Index HLS Fund of the Hartford Series Fund, Inc. at December 31, 2013, the results of its operations for the year then ended, the changes in its net assets for each of the two years in the period then ended, and the financial highlights for each of the five years in the period then ended, in conformity with U.S. generally accepted accounting principles.
|
Minneapolis, MN
February 17, 2014
| 25 |
| Hartford Index HLS Fund |
| Directors and Officers (Unaudited) |
The Board of Directors of the Company appoints officers who are responsible for the day-to-day operations of the Fund and who execute policies formulated by the directors. Each director serves until his or her death, resignation, or retirement or until the next annual meeting of shareholders is held or until his or her successor is elected and qualifies.
Directors and officers who are employed by or who have a financial interest in The Hartford are considered “interested” persons of the Fund pursuant to the 1940 Act. Each officer and two of the Company’s directors, as noted in the chart below, are “interested” persons of the Fund. Each director serves as a director for The Hartford Mutual Funds, Inc., The Hartford Mutual Funds II, Inc., Hartford Series Fund, Inc., Hartford HLS Series Fund II, Inc., and as a trustee for The Hartford Alternative Strategies Fund, which, as of December 31, 2013, collectively consist of 91 funds. Correspondence may be sent to directors and officers c/o Hartford Funds, 5 Radnor Corporate Center, Suite 300, 100 Matsonford Road, Radnor, Pennsylvania 19087, except that correspondence to Mr. Annoni, Mr. Dressen and Ms. Quade may be sent to 500 Bielenberg Drive, Woodbury, Minnesota 55125.
The table below sets forth, for each director and officer, his or her name, year of birth, current position with the Company and date first elected or appointed to Hartford Series Fund, Inc. (“HSF”), and Hartford HLS Series Fund II, Inc. (“HSF2”), principal occupation, and, for directors, other directorships held. The Fund’s Statement of Additional Information contains further information on the directors and is available free of charge by calling 1-800-862-6668 or writing to Hartford HLS Funds, c/o Hartford Life Insurance Company, Hartford Life and Annuity Insurance Company, P.O. Box 14293, Lexington, KY 40512-4293.
Information on the aggregate remuneration paid to the directors of the Company can be found in the Statement of Operations herein. The Fund pays to The Hartford a portion of the Chief Compliance Officer’s compensation, but does not pay salaries or compensation to any of their other officers or directors who are employed by The Hartford.
Non-Interested Directors
Lynn S. Birdsong (1946) Director since 2003, Co-Chairman of the Investment Committee since 2005
Mr. Birdsong is a private investor. Mr. Birdsong currently serves as a Director of the Sovereign High Yield Investment Company (April 2010 to current). Mr. Birdsong currently serves as an Independent Director of Nomura Partners Funds, Inc. (formerly, The Japan Fund) (April 2003 to current). From 2003 to March 2005, Mr. Birdsong was an Independent Director of the Atlantic Whitehall Funds. From 1979 to 2002, Mr. Birdsong was a Managing Director of Zurich Scudder Investments, an investment management firm. During his employment with Scudder, Mr. Birdsong was an Interested Director of The Japan Fund. From January 1981 through December 2013, Mr. Birdsong was a partner in Birdsong Company, an advertising specialty firm.
Robert M. Gavin, Jr. (1940) Director since 2002 (HSF) and 1986 (HSF2), Chairman of the Board since 2004
Dr. Gavin is an educational consultant. Prior to September 1, 2001, he was President of Cranbrook Education Community and prior to July 1996, he was President of Macalester College, St. Paul, Minnesota.
Duane E. Hill (1945) Director since 2001 (HSF) and 2002 (HSF2), Chairman of the Nominating Committee since 2003
Mr. Hill is a Partner of TSG Ventures L.P., a private equity investment company. Mr. Hill is a former partner of TSG Capital Group, a private equity investment firm that served as sponsor and lead investor in leveraged buyouts of middle market companies.
Sandra S. Jaffee (1941) Director since 2005
Ms. Jaffee is the founder and Chief Executive Officer of a private company, Homeworks Concierge, LLC, which provides residential property management services in Westchester County, New York (January 2012 to present). Ms. Jaffee served as Chairman (2008 to 2009) and Chief Executive Officer of Fortent (formerly Searchspace Group), a leading provider of compliance/regulatory technology to financial institutions from August 2005 to August 2009. Ms. Jaffee currently serves as a member of the Board of Directors of Broadridge Financial Solutions as well as a Trustee of Muhlenberg College.
| 26 |
William P. Johnston (1944) Director since 2005, Chairman of the Compliance Committee since 2005
In June 2006, Mr. Johnston was appointed as Senior Advisor to The Carlyle Group, a global private equity and alternative asset investment firm and currently serves as an Operating Executive. In July 2006, Mr. Johnston was elected to the Board of Directors of MultiPlan, Inc. and served as a Director (July 2006 to August 2010). In August 2007, Mr. Johnston was elected to the Board of Directors of LifeCare Holdings, Inc. and served as a Director (August 2007 to June 2013). In February 2008, Mr. Johnston was elected to the Board of Directors of HCR-ManorCare, Inc. In May 2006, Mr. Johnston was elected to the Supervisory Board of Fresenius Medical Care AG & Co. KGaA, after its acquisition of Renal Care Group, Inc. in March 2006. Mr. Johnston joined Renal Care Group in November 2002 as a member of the Board of Directors and served as Chairman of the Board from March 2003 through March 2006. From 2002 through 2013, Mr. Johnston served as a Board member of the Georgia O’Keefe Museum. From September 1987 to December 2002, Mr. Johnston was with Equitable Securities Corporation (and its successors, SunTrust Equitable Securities and SunTrust Robinson Humphrey) serving in various investment banking and managerial positions, including Managing Director and Head of Investment Banking, Chief Executive Officer and Vice Chairman.
Phillip O. Peterson (1944) Director since 2002 (HSF) and 2000 (HSF2), Chairman of the Audit Committee since 2002
Mr. Peterson is a mutual fund industry consultant. He was a partner of KPMG LLP (an accounting firm) until July 1999. Mr. Peterson joined William Blair Funds in February 2007 as a member of the Board of Trustees. Mr. Peterson also joined the Board of Trustees of Symetra Variable Mutual Funds Trust as a trustee in February 2012.
Lemma W. Senbet (1946) Director since 2005
Dr. Senbet is the William E. Mayer Chair Professor of Finance and Founding Director, Center for Financial Policy, at the University of Maryland, Robert H. Smith School of Business. He was chair of the Finance Department of the University of Maryland, Robert H. Smith School of Business from 1998 to 2006. Since June 2013, he has been on leave from the University to serve as Executive Director of African Economic Research Consortium which focuses on economic policy research and training. Previously, he was a chaired professor of finance at the University of Wisconsin-Madison. Also, he was a Director of the Fortis Funds from March 2000 to July 2002. Dr. Senbet served as Director of the American Finance Association and President of the Western Finance Association. In 2006, Dr. Senbet was inducted Fellow of Financial Management Association International for his career-long distinguished scholarship and professional service.
Interested Directors and Officers
James E. Davey (1964) Director since 2012, President and Chief Executive Officer since 2010
Mr. Davey serves as Executive Vice President of Hartford Life Insurance Company (“HLIC”) and The Hartford Financial Services Group, Inc. Additionally, Mr. Davey serves as Chairman of the Board, Manager and Senior Managing Director of Hartford Funds Distributors, LLC (“HFD”). He also currently serves as Director, Chairman of the Board, President and Senior Managing Director of Hartford Administrative Services Company (“HASCO”). Mr. Davey also serves as Manager, Chairman of the Board and Senior Managing Director for Hartford Funds Management Company, LLC (“HFMC”). Mr. Davey joined The Hartford in 2002.
Lowndes A. Smith (1939) Director since 1996 (HSF) and 2002 (HSF2), Co-Chairman of the Investment Committee since 2005
Mr. Smith served as Vice Chairman of The Hartford from February 1997 to January 2002, as President and Chief Executive Officer of Hartford Life, Inc. from February 1997 to January 2002, and as President and Chief Operating Officer of The Hartford Life Insurance Companies from January 1989 to January 2002. Mr. Smith serves as a Director of White Mountains Insurance Group Ltd. (October 2003 to current); One Beacon Insurance (October 2006 to current); Symetra Financial (August 2007 to current) and is a Managing Director of Whittington Gray Associates (January 2007 to current).
Other Officers
Mark A. Annoni (1964) Vice President, Controller and Treasurer since 2012
Mr. Annoni currently serves as the Assistant Vice President of HLIC (February 2004 to present).
| 27 |
| Hartford Index HLS Fund |
| Directors and Officers (Unaudited) – (continued) |
Michael R. Dressen (1963) AML Compliance Officer since 2011
Mr. Dressen currently serves as Assistant Vice President of HLIC. He also serves as Chief Compliance Officer and AML Compliance Officer of HASCO and as AML Officer of HFD. Mr. Dressen has served in various positions within The Hartford and its subsidiaries in connection with the operation of the Hartford Funds.
Edward P. Macdonald (1967) Vice President, Secretary and Chief Legal Officer since 2005
Mr. Macdonald currently serves as Assistant Secretary, Executive Vice President and Deputy General Counsel of HFD, HASCO and HFMC. He also serves as Vice President of HLIC. Mr. Macdonald has served in various positions within The Hartford and its subsidiaries in connection with the operation of the Hartford Funds. Mr. Macdonald joined The Hartford in 2005.
Joseph G. Melcher (1973) Vice President and Chief Compliance Officer since 2013
Mr. Melcher currently serves as Executive Vice President of HASCO and HFD. Mr. Melcher also currently serves as Executive Vice President and Chief Compliance Officer of HFMC. Mr. Melcher has served in various positions within The Hartford and its subsidiaries in connection with the operation of the Hartford Funds since joining The Hartford in 2012. Prior to joining The Hartford, Mr. Melcher worked at Touchstone Investments, a member of the Western & Southern Financial Group, where he held the position of Vice President and Chief Compliance Officer from 2010 through 2012 and Assistant Vice President, Compliance from 2005 to 2010.
Vernon J. Meyer (1964) Vice President since 2006
Mr. Meyer currently serves as Senior Vice President of HLIC. He also currently serves as Managing Director and Chief Investment Officer of HFMC. Mr. Meyer has served in various positions within The Hartford and its subsidiaries in connection with the operation of the Hartford Funds. Mr. Meyer joined The Hartford in 2004.
Laura S. Quade (1969) Vice President since 2012
Ms. Quade currently serves as Vice President of HASCO and HFD. She is the Head of Operations of HASCO and also serves as Director, Enterprise Operations of HLIC. Ms. Quade has served in various positions within The Hartford and its subsidiaries in connection with the operation of the Hartford Funds.
Martin A. Swanson (1962) Vice President since 2010
Mr. Swanson currently serves as Vice President of HLIC. Mr. Swanson also serves as Managing Director, Chief Marketing Officer and Principal of HFD. Mr. Swanson has served in various positions within The Hartford and its subsidiaries in connection with the operation of the Hartford Funds.
HOW TO OBTAIN A COPY OF THE FUND’S PROXY VOTING POLICIES AND VOTING RECORDS (UNAUDITED)
A description of the policies and procedures that the Fund uses to determine how to vote proxies relating to portfolio securities and information about how the Fund voted proxies relating to portfolio securities during the most recent twelve-month period ended June 30 are available (1) without charge, upon request, by calling 800-862-6668 and (2) on the SEC’s website at http://www.sec.gov.
QUARTERLY PORTFOLIO HOLDINGS INFORMATION (UNAUDITED)
The Fund files a complete schedule of portfolio holdings with the SEC for the first and third quarters of each fiscal year on Form N-Q. The Fund’s Forms N-Q are available (1) without charge, upon request, by calling 800-862-6668 and (2) on the SEC’s website at http://www.sec.gov. The Form N-Q may be reviewed and copied at the SEC’s Public Reference Room in Washington, DC. Information on the operation of the Public Reference Room may be obtained by calling 1-800-SEC-0330.
| 28 |
| Hartford Index HLS Fund |
| Expense Example (Unaudited) |
Your Fund's Expenses
As a shareholder of the Fund, you incur two types of costs: (1) transaction costs and (2) ongoing costs, including investment management fees, distribution and/or service (12b-1) fees, if any, and other fund expenses. This example is intended to help you understand your ongoing costs (in dollars) of investing in the Fund and to compare these costs with the ongoing costs of investing in other mutual funds. The example is based on an investment of $1,000 invested at the beginning of the period and held for the period of June 30, 2013 through December 31, 2013.
Actual Expenses
The first set of columns of the table below provides information about actual account values and actual expenses. You may use the information in this column, together with the amount you invested, to estimate the expenses that you paid over the period. Simply divide your account value by $1,000 (for example, an $8,600 account value divided by $1,000 = 8.6), then multiply the result by the number in the line under the heading entitled “Expenses Paid During Period” to estimate the expenses you paid on your account during this period.
Hypothetical Example for Comparison Purposes
The second set of columns of the table below provides information about hypothetical account values and hypothetical expenses based on the Fund’s actual expense ratio and an assumed rate of return of 5% per year before expenses, which is not the Fund’s actual return. The hypothetical account values and expenses may not be used to estimate the actual ending account balance or expenses you paid for the period. You may use this information to compare the ongoing costs of investing in the Fund and other funds. To do so, compare this 5% hypothetical example with the 5% hypothetical examples that appear in the shareholder reports of the other funds.
Please note that the expenses shown in the table are meant to highlight your ongoing costs only and do not reflect any transactional costs, such as sales charges (loads) and CDSC. Therefore, the second set of columns of the table is useful in comparing ongoing costs only, and will not help you determine the relative total costs of owning different funds. In addition, if these transactional costs were included, your costs would be higher. Expenses are equal to the Fund's annualized expense ratios multiplied by average account value over the period, multiplied by 184/365 (to reflect the one-half year period).
| Actual return | Hypothetical (5% return before expenses) | |||||||||||||||||||||||||||||||
| Beginning Account Value June 30, 2013 | Ending Account Value December 31, 2013 | Expenses paid during the period June 30, 2013 through December 31, 2013 | Beginning Account Value June 30, 2013 | Ending Account Value December 31, 2013 | Expenses paid during the period June 30, 2013 through December 31, 2013 | Annualized expense ratio | Days in the current 1/2 year | Days in the full year | ||||||||||||||||||||||||
| Class IA | $ | 1,000.00 | $ | 1,161.10 | $ | 1.80 | $ | 1,000.00 | $ | 1,023.54 | $ | 1.68 | 0.33 | % | 184 | 365 | ||||||||||||||||
| Class IB | $ | 1,000.00 | $ | 1,159.70 | $ | 3.16 | $ | 1,000.00 | $ | 1,022.28 | $ | 2.96 | 0.58 | % | 184 | 365 | ||||||||||||||||
| 29 |
| Hartford Index HLS Fund |
| Approval of Investment Management and Investment Sub-Advisory Agreements (Unaudited) |
Section 15(c) of the Investment Company Act of 1940, as amended (the “1940 Act”), requires that each mutual fund’s board of directors, including a majority of those directors who are not “interested persons” of the mutual fund, as defined in the 1940 Act (the “Independent Directors”), annually review and consider the continuation of the mutual fund’s investment advisory and sub-advisory agreements. At its meeting held on August 6-7, 2013, the Board of Directors (the “Board”) of Hartford Series Fund, Inc., including each of the Independent Directors, unanimously voted to approve the continuation of the investment management agreement for Hartford Index HLS Fund (the “Fund”) with Hartford Funds Management Company, LLC (“HFMC”) and the continuation of the investment sub-advisory agreement between HFMC and the Fund’s sub-adviser, Hartford Investment Management Company (the “Sub-adviser,” and together with HFMC, the “Advisers”) (collectively, the “Agreements”).
In the months preceding the August 6-7, 2013 meeting, the Board requested, received, and reviewed written responses from the Advisers to questions posed to them on behalf of the Independent Directors and supporting materials relating to those questions and responses. The Board considered information furnished to the Board at its meetings throughout the year, as well as information specifically prepared in connection with the annual approval of the Agreements at the Board’s meetings held on June 18-19, 2013 and August 6-7, 2013. Information provided to the Board at its meetings throughout the year included, among other things, reports on Fund performance, legal and compliance matters, sales and marketing activity, shareholder services, and the other services provided to the Fund by the Advisers and their affiliates. The Board also received in-person presentations by Fund officers and representatives of HFMC at the Board’s meetings on June 18-19, 2013 and August 6-7, 2013 concerning the Agreements.
The Independent Directors, advised by independent legal counsel, engaged two service providers to assist them with evaluating the Agreements with respect to the Fund. Lipper Inc. (“Lipper”), an independent provider of investment company data, was retained to provide the Board with reports on how the Fund’s contractual management fees, actual management fees, other non-management fees, overall expense ratios and investment performance compared to those of mutual funds with similar investment objectives. The Independent Directors also engaged an independent financial services consulting firm (the “Consultant”) to assist them in evaluating the Fund’s management fees, sub-advisory fees, other non-management fees, overall expense ratios and investment performance. In addition, the Consultant reviewed the profitability calculations utilized by HFMC in connection with the continuation of the investment management agreement.
In determining whether to continue the Agreements for the Fund, the members of the Board reviewed and evaluated information and factors they believed to be relevant and appropriate in light of the information that the Board deemed necessary and appropriate through the exercise of its reasonable business judgment. While individual members of the Board may have weighed certain factors differently, the Board’s determination to continue the Agreements was based on a comprehensive consideration of all information provided to the Board throughout the year and specifically with respect to the continuation of the Agreements. A more detailed discussion of the factors the Board considered with respect to its approval of the Agreements is provided below.
Nature, Extent, and Quality of Services Provided by the Advisers
The Board requested and considered information concerning the nature, extent, and quality of the services provided to the Fund by the Advisers. The Board considered, among other things, the terms of the Agreements and the range of services provided by the Advisers. The Board considered the Advisers’ professional personnel who provide services to the Fund, including each Adviser’s ability and experience in attracting and retaining qualified personnel to service the Fund. The Board considered each Adviser’s reputation and overall financial strength, as well as its willingness to consider and implement organizational and operational changes designed to improve services to the Fund. In addition, the Board considered the quality of each Adviser’s communications with the Board and responsiveness to Board inquiries.
The Board also requested and evaluated information concerning each Adviser’s regulatory and compliance environment. In this regard, the Board requested and reviewed information on each Adviser’s compliance policies and procedures, compliance history, and a report from the Fund’s Chief Compliance Officer on each Adviser’s compliance with applicable laws and regulations, including responses to regulatory developments and compliance issues raised by regulators. The Board also noted the Advisers’ support of the Fund’s compliance control structure, particularly the resources devoted by the Advisers in support of the Fund’s obligations pursuant to Rule 38a-1 under the 1940 Act.
With respect to HFMC, the Board noted that under the Agreements, HFMC is responsible for the management of the Fund, including overseeing fund operations and service providers, as well as investment advisory services in connection with selecting,
| 30 |
monitoring and supervising the Sub-adviser. The Board considered HFMC’s ongoing monitoring of people, process and performance, including its quarterly reviews of each of the Hartford Funds, semi-annual meetings with the leaders of each Fund’s portfolio management team, and oversight of the Funds’ approximately 40 portfolio managers. The Board recognized that HFMC has demonstrated a record of making changes to the management and/or strategies of the Funds when warranted. The Board considered HFMC’s oversight of the Sub-adviser’s investment approach and results, process for monitoring best execution of portfolio trades by the Sub-adviser, and approach to risk management with respect to the Fund and the service providers to the Fund. The Board also considered HFMC’s oversight of compliance with the Fund’s objective and policies as well as with applicable laws and regulations, noting that regulatory and other developments had over time led to an increase in the scope of HFMC’s services in this regard.
In addition, the Board considered HFMC’s ongoing commitment to review and rationalize the Hartford Funds product line-up and the expenses that HFMC had incurred in connection with fund combinations in recent years. The Board considered that HFMC or its affiliates are responsible for providing the Fund’s officers. The Board also noted that Hartford Life Insurance Company (“HLIC”) provides administrative services to the Fund. The Board considered its experiences with HFMC and HLIC with respect to each of these services.
With respect to the Sub-adviser, who provides day-to-day portfolio management services, the Board considered the quality of the Fund’s portfolio manager, the Sub-adviser’s other investment personnel, its investment philosophy and process, investment research capabilities and resources, performance record, trade execution capabilities and experience. The Board considered the experience of the Fund’s portfolio manager, the number of accounts managed by the portfolio manager, and the Sub-adviser’s method for compensating the portfolio manager.
Based on these considerations, the Board concluded that it was satisfied with the nature, extent and quality of the services provided to the Fund by HFMC and the Sub-adviser.
Performance of the Fund and the Advisers
The Board considered the investment performance of the Fund. In this regard, the Board reviewed the performance of the Fund over different time periods presented in the materials and evaluated HFMC’s analysis of the Fund’s performance for these time periods, noting that the Fund is managed to approximate the performance of the S&P 500 Index. The Board considered information and materials provided to the Board by the Advisers concerning Fund performance, as well as information from Lipper comparing the investment performance of the Fund to an appropriate benchmark and universe of peer funds. The Board noted that the Fund’s performance was in the 3rd quintile of its performance universe for the 1-, 3- and 5-year periods. The Board also noted that the Fund’s performance was in line with its benchmark for the 1-, 3- and 5-year periods.
The Board considered the detailed investment analytics reports provided by Hartford Funds’ Investment Advisory Group throughout the year. These reports include, among other things, information on the Fund’s gross and net returns, the Fund’s investment performance relative to an appropriate benchmark and peer group, various statistics concerning the Fund’s portfolio, and a narrative summary of various factors affecting Fund performance. The Board considered the Advisers’ cooperation with the Investment Committee, which assists the Board in evaluating the performance of the Fund at periodic meetings throughout the year. The Board also considered the analysis provided by the Consultant relating to the Fund’s performance track record.
In light of all the considerations noted above, the Board concluded that it had continued confidence in HFMC’s and the Sub-adviser’s overall capabilities to manage the Fund.
Costs of the Services and Profitability of the Advisers
The Board reviewed information regarding HFMC’s cost to provide investment management and related services to the Fund and HFMC’s profitability, both overall and for the Fund, on a pre-tax basis without regard to distribution expenses. The Board also requested and reviewed information about the profitability to HFMC and its affiliates from all services provided to the Fund and all aspects of their relationship with the Fund. The Board noted that the fees payable to the Sub-adviser are equal to its estimated costs in providing sub-advisory services. Accordingly, the costs and profitability for the Sub-adviser and HFMC were considered in the aggregate.
| 31 |
| Hartford Index HLS Fund |
| Approval of Investment Management and Investment Sub-Advisory Agreements (Unaudited) – (continued) |
The Board considered the Consultant’s review of the profitability calculations utilized by HFMC in connection with the continuation of the investment management agreement, noting the Consultant’s view that Hartford Funds’ process for calculating and reporting Fund profitability is reasonable. In this regard, the Board noted that the Consultant had previously performed a full review of this process and reported that such process is sound and well within common industry practice.
Based on these considerations, the Board concluded that the profits anticipated to be realized by the Advisers and their affiliates from their relationships with the Fund would not be excessive.
Comparison of Fees and Services Provided by the Advisers
The Board considered comparative information with respect to the management fees to be paid by the Fund to HFMC and the total expense ratios of the Fund. The Board also considered comparative information with respect to the sub-advisory fees to be paid by HFMC to the Sub-adviser, to the extent applicable. In this regard, the Board requested and reviewed information from HFMC and the Sub-adviser relating to the management and sub-advisory fees and total operating expenses for the Fund. The Board considered that the management fee for the Fund includes the fee paid to HLIC for providing certain administrative services to the Fund. The Board also reviewed information from Lipper comparing the Fund’s contractual management fees, actual management fees and overall expense ratios relative to a group of funds selected by Lipper, in consultation with the Consultant, and a broader universe of funds selected by Lipper. The Board noted that the Fund’s contractual management fee and its total expenses (less 12b-1 and shareholder service fees) were in the 3rd quintile of its expense group, while its actual management fee was in the 4th quintile.
While the Board recognized that comparisons between the Fund and peer funds are imprecise, given the differing service levels and characteristics of mutual funds and the different business models and cost structures of the Advisers, the comparative information provided by Lipper assisted the Board in evaluating the reasonableness of the Fund’s management and sub-advisory fees and total operating expenses. In addition, the Board considered the analysis and recommendations of the Consultant relating to the Fund’s management and sub-advisory fees and total operating expenses.
Based on these considerations, the Board concluded that the Fund’s fees and total operating expenses, in conjunction with the information about quality of services, profitability, economies of scale, and other matters discussed, were reasonable in light of the services provided.
Economies of Scale
The Board requested and considered information regarding the Advisers’ realization of economies of scale with respect to the Fund and whether the fee levels reflect these economies of scale for the benefit of the Fund’s shareholders. The Board reviewed the breakpoints in the management fee schedule for the Fund, which reduce fee rates as Fund assets grow over time. The Board recognized that a fund with assets beyond the last breakpoint level will continue to benefit from economies of scale because additional assets are charged the lowest breakpoint fee resulting in lower overall effective management fee rates. The Board also recognized that a fee schedule that reaches a lower breakpoint quickly provides shareholders with the benefit of anticipated or potential economies of scale. The Board noted the effect of the sale and run-off of the variable annuity business on the HLS Funds and also noted that the Fund’s current low asset levels have kept the Fund from fully realizing the benefits of anticipated or potential economies of scale.
The Board reviewed and evaluated materials from Lipper showing how management fee schedules of peer funds reflect economies of scale for the benefit of shareholders as a peer fund’s assets hypothetically increase over time. Based on information provided by HFMC, Lipper, and the Consultant, the Board recognized that there is no uniform methodology for establishing breakpoints or uniform pattern in asset levels that trigger breakpoints or the amounts of breakpoints triggered.
After considering all of the information available to it, the Board concluded that it was satisfied with the extent to which economies of scale would be shared for the benefit of the Fund’s shareholders based on currently available information and the effective advisory fees and expense ratios for the Fund at its current and reasonably anticipated asset levels. The Board noted, however, that it would continue to monitor future growth in Fund assets and the appropriateness of additional breakpoints.
| 32 |
Other Benefits
The Board considered other benefits to the Advisers and their affiliates from their relationships with the Fund, including the role of the Fund in supporting the variable life insurance and variable annuity products offered by The Hartford.
The Board reviewed information noting that HLIC, an affiliate of HFMC, receives fees for providing certain administrative services to the Fund and that HFMC receives fees for fund accounting and related services from the Fund. The Board considered information on profits to HLIC and HFMC for such services. The Board also considered that Hartford Administrative Services Company (“HASCO”), the Fund’s transfer agent and an affiliate of HFMC, receives transfer agency compensation from the Fund, and the Board reviewed information on the profitability of the Fund’s transfer agency function to HASCO. The Board considered information provided by HASCO indicating that the transfer agent fees charged by HASCO to the Fund were fair and reasonable based on publicly available information.
The Board also considered that Hartford Funds Distributors, LLC (“HFD”), an affiliate of HFMC, serves as principal underwriter of the Fund. As principal underwriter, HFD receives 12b-1 fees from the Fund. The Board also noted that certain affiliates of HFD distribute shares of the Fund and receive compensation in that connection.
The Board considered the benefits, if any, to the Sub-adviser from any use of the Fund’s brokerage commissions to obtain soft dollar research.
The Board considered the benefits to shareholders of being part of the Hartford Funds family of funds. The Board considered HFMC’s efforts to provide investors in the family with a broad range of investment styles and asset classes.
* * * *
Based upon its review of these various factors, among others, the Board concluded that it is in the best interests of the Fund and its shareholders for the Board to approve the Agreements for an additional year. In reaching this decision, the Board did not assign relative weights to the factors discussed above or deem any one or group of them to be controlling in and of themselves. In connection with their deliberations, the Independent Directors met separately in executive session on several occasions, with independent legal counsel and the Consultant, to review the relevant materials and consider their responsibilities under relevant laws and regulations.
| 33 |
| Hartford Index HLS Fund |
| Main Risks (Unaudited) |
The main risks of investing in the Fund are described below.
Market, Selection, and Strategy Risk: The Fund’s share price may fluctuate due to market risk and/or security selections that may underperform the market or relevant benchmarks. If the sub-adviser’s investment strategy does not perform as expected, the Fund could underperform its peers or lose money. There is no guarantee the Fund will achieve its stated objective.
Passive Management Risk: The Fund is not actively managed, and will generally remain fully invested even when stock prices are falling.
Index Tracking Risk: The Fund’s performance may not match or correlate to that of its index, which may cause the Fund’s performance to be lower than expected.
"Standard & Poor's," "S&P®," "S&P 500®," "Standard & Poor's," and "500®" are trademarks of The McGraw-Hill Companies, Inc. and have been licensed for use by Hartford Life Insurance Company and Hartford Life and Annuity Insurance Company. Investment Options are not sponsored, endorsed, sold or promoted by Standard and Poor's and Standard & Poor's makes no representation regarding the advisability of investing in the Investment Options.
| 34 |
THIS PRIVACY POLICY IS NOT PART OF THIS REPORT
Privacy Policy and Practices of The Hartford Financial Services Group, Inc. and its Affiliates
(herein called “we, our, and us”)
This Privacy Policy applies to our United States Operations
We value your trust. We are committed to the responsible: a) management; b) use; and c) protection; of Personal Information. This notice describes how we collect, disclose, and protect Personal Information.
We collect Personal Information to: a) service your Transactions with us; and b) support our business functions.
We may obtain Personal Information from: a) You; b) your Transactions with us; and c) third parties such as a consumer-reporting agency.
Based on the type of product or service You apply for or get from us, Personal Information such as: a) your name; b) your address; c) your income; d) your payment; or e) your credit history; may be gathered from sources such as applications, Transactions, and consumer reports.
To serve You and service our business, we may share certain Personal Information. We will share Personal Information, only as allowed by law, with affiliates such as: a) our insurance companies; b) our employee agents; c) our brokerage firms; and d) our administrators.
As allowed by law, we may share Personal Financial Information with our affiliates to: a) market our products; or b) market our services; to You without providing You with an option to prevent these disclosures. | We may also share Personal Information, only as allowed by law, with unaffiliated third parties including:
When allowed by law, we may share certain Personal Financial Information with other unaffiliated third parties who assist us by performing services or functions such as:
We, and third parties we partner with, may track some of the pages You visit through the use of: a) cookies; b) pixel tagging; or c) other technologies; and currently do not process or comply with any web browser’s “do not track” signal or similar mechanism that indicates a request to disable online tracking of individual users who visit our websites or use our services.
We will not sell or share your Personal Financial Information with anyone for purposes unrelated to our business functions without offering You the opportunity to:
We only disclose Personal Health Information with:
Our employees have access to Personal Information in the course of doing their jobs, such as: |
We use manual and electronic security procedures to maintain: a) the confidentiality; and b) the integrity of; Personal Information that we have. We use these procedures to guard against unauthorized access.
Some techniques we use to protect Personal Information include: a) secured files; b) user authentication; c) encryption; d) firewall technology; and e) the use of detection software.
We are responsible for and must: a) identify information to be protected; b) provide an adequate level of protection for that data; c) grant access to protected data only to those people who must use it in the performance of their job-related duties. Employees who violate our Privacy Policy will be subject to discipline, which may include ending their employment with us.
At the start of our business relationship, we will give You a copy of our current Privacy Policy.
We will also give You a copy of our current Privacy Policy once a year if You maintain a continuing business relationship with us.
We will continue to follow our Privacy Policy regarding Personal Information even when a business relationship no longer exists between us. | As used in this Privacy Notice:
Application means your request for our product or service.
Personal Financial Information means financial information such as:
Personal Health Information means health information such as:
Personal Information means information that identifies You personally and is not otherwise available to the public. It includes:
Transaction means your business dealings with us, such as:
You means an individual who has given us Personal Information in conjunction with: |
This Privacy Policy is being provided on behalf of the following affiliates of The Hartford Financial Services Group, Inc.:
1stAGChoice, Inc.; Access CoverageCorp, Inc.; Access CoverageCorp Technologies, Inc.; American Maturity Life Insurance Company; Archway 60 R, LLC; Business Management Group, Inc.; Catalyst360, LLC; Champlain Life Reinsurance Company; DMS R, LLC; Eloy R, LLC; Ersatz Corporation; First State Insurance Company; Hartford Accident and Indemnity Company; Hartford Administrative Services Company; Hartford Casualty General Agency, Inc.; Hartford Casualty Insurance Company; Hartford-Comprehensive Employee Benefit Service Company; Hartford Equity Sales Company, Inc.; Hartford Fire General Agency, Inc.; Hartford Fire Insurance Company; Hartford Funds Management Company, LLC; Hartford Funds Management Group, Inc.; Hartford HLS Series Fund II, Inc.; Hartford Insurance Company of Illinois; Hartford Insurance Company of the Midwest; Hartford Insurance Company of the Southeast; Hartford Integrated Technologies, Inc.; Hartford International Life Reassurance Corporation; Hartford Funds Distributors, LLC; Hartford Investment Management Company; Hartford Life and Accident Insurance Company; Hartford Life and Annuity Insurance Company; Hartford Life Insurance Company; Hartford Life Private Placement, LLC; Hartford Lloyd’s Corporation; Hartford Lloyd’s Insurance Company; Hartford Mezzanine Investors I, LLC; Hartford Residual Market, L.C.C.; Hartford Retirement Services, LLC; Hartford Securities Distribution Company, Inc.; Hartford Series Fund, Inc.; Hartford Specialty Insurance Services of Texas, LLC; Hartford Strategic Investments, LLC; Hartford Underwriters Insurance Company; Hartford Technology Services Company, L.L.C.; Hartford of Texas General Agency, Inc.; Hartford Underwriters General Agency, Inc.; HARTRE Company, L.C.C.; HL Investment Advisors, LLC; HLA LLC; Horizon Management Group, LLC; HRA Brokerage Services, Inc.; Lanidex Class B, LLC; M-CAP Insurance Agency, LLC; New England Insurance Company; New England Reinsurance Corporation; Nutmeg Insurance Agency, Inc.; Nutmeg Insurance Company; Pacific Insurance Company, Limited; Planco, LLC: Property and Casualty Insurance Company of Hartford; Revere R, LLC; RVR R, LLC; Sentinel Insurance Company, Ltd.; Sunstone R, LLC; Symphony R, LLC; The Evergreen Group Incorporated; The Hartford Alternative Strategies Fund; The Hartford Mutual Funds, Inc.; The Hartford Mutual Funds II, Inc.; Trumbull Flood Management, L.L.C.; Trumbull Insurance Company; Twin City Fire Insurance Company; White River Life Reinsurance Company.
HPP Revised December 2013
HARTFORD HLS FUNDS
c/o The Hartford Wealth Management - Global Annuities
P.O. Box 14293
Lexington, KY 40512-4293
HARTFORDFUNDS
hartfordfunds.com
Hartford Series Fund, Inc. is underwritten and distributed by Hartford Funds Distributors, LLC.
Hartford Series Fund, Inc. inception dates range from 1977 to date. Hartford Series Fund, Inc. is not a subsidiary of The Hartford Financial Services Group, Inc. ("The Hartford") but is underwritten, distributed by and advised by subsidiaries of The Hartford. Investments in Hartford Series Fund, Inc. are not guaranteed by The Hartford or any other entity.
This report is submitted for the general information of the shareholders of the Funds. It is not authorized for distribution unless preceded or accompanied by a current prospectus for the Funds.
Investors should carefully consider the investment objectives, risks, charges, and expenses of Hartford Funds before investing. This and other information can be found in the prospectus and summary prospectus, which can be obtained by calling 888-843-7824 (retail) or 877-836-5854 (institutional). Investors should read them carefully before they invest.
HLSAR-IX13 2-14 113545-2 Printed in U.S.A ©2013 The Hartford, Hartford, CT 06115
HARTFORDFUNDS
| HARTFORD INTERNATIONAL
OPPORTUNITIES HLS FUND
2013 Annual Report
|
A MESSAGE FROM THE PRESIDENT
Dear Fellow Shareholders:
Thank you for investing in Hartford HLS Funds.
Market Review
U.S. equities (as represented by the S&P 500 Index) generated their strongest year since 1997 in 2013, rising 32.39% for the year. During the fourth quarter, equities rose without looking back, pushing the S&P 500 Index and the Dow Jones Industrial Average to new all-time highs. Despite previously cheering delays to quantitative-easing tapering, the stock market received an additional boost at the end of the year following the U.S. Federal Reserve’s (Fed) announcement of a $10-billion-a-month reduction in bond purchases beginning in January.
The Fed’s decision to begin tapering its bond purchases is generally considered a vote of confidence in the recovering U.S. economy. Consumer spending has stabilized, the housing market is showing steady improvement, the unemployment rate is slowly declining and economic growth clocked in at a healthy 4.1% in the third quarter. Equities have also recovered since the market low in March 2009: The S&P 500 Index has gained 173% from the market low through December 31, 2013.
Signs of improvement are also visible outside the U.S. Europe appears to have begun its own economic recovery, and emerging markets have reversed their recent lackluster performance. Fiscal policy continues to wield significant influence in today’s economy and central banks across the globe are maintaining their accommodative stances, including the appointment of Janet Yellen, who is widely expected to continue current monetary policies, to succeed Ben Bernanke as U.S. Federal Reserve chairman.
It’s important to stay abreast of domestic and international economic developments while balancing your individual investment goals. Meeting with your financial advisor on a regular basis to examine your current investment strategy can help you determine whether you are on the right track:
| • | Is your portfolio fully diversified with an appropriate mix of stocks and bonds? |
| • | Is your portfolio incorporating both domestic and international holdings to take advantage of the global economic recovery? |
| • | Are your investments still in line with your risk tolerance and investment time horizon? |
Your financial advisor can help you choose options within our fund family to navigate today’s markets with confidence.
Thank you again for investing with Hartford HLS Funds.
James Davey
President
Hartford HLS Funds
1The S&P 500 Index is a market capitalization-weighted price index composed of 500 widely held common stocks.
2The Dow Jones Industrial Average is an unmanaged, price-weighted index of 30 of the largest, most widely held stocks traded on the New York Stock Exchange.
Hartford International Opportunities HLS Fund
This report is prepared for the general information of contract owners and qualified retirement plan participants. It is not an offer of contracts or of qualified retirement plans. It should not be used in connection with any offer, except in conjunction with the appropriate product prospectus which contains all pertinent information including the applicable sales, administrative and other charges.
The views expressed in the Fund’s Manager Discussion under ‘‘Why did the Fund perform this way?’’ and ‘‘What is the outlook?’’ are views of the Fund’s sub-adviser and portfolio management team through the end of the period and are subject to change based on market and other conditions. The Fund’s Manager Discussion is for informational purposes only and does not represent an offer, recommendation or solicitation to buy, hold or sell any security. The specific securities identified and described, if any, do not represent all of the securities purchased or sold and you should not assume that investments in the securities identified and discussed will be profitable.
| Hartford International Opportunities HLS Fund inception 07/02/1990 |
| (sub-advised by Wellington Management Company, LLP) |
| Investment objective – Seeks long-term growth of capital. |
Performance Overview 12/31/03 - 12/31/13

The chart above represents the hypothetical growth of a $10,000 investment in Class IA. Growth results in classes other than Class IA will vary from what is seen above due to differences in the expenses charged to those share classes.
Average Annual Total Returns (as of 12/31/13)
| 1 Year | 5 Years | 10 Years | ||||
| International Opportunities IA | 21.55% | 13.94% | 9.06% | |||
| International Opportunities IB | 21.28% | 13.66% | 8.79% | |||
| MSCI All Country World ex USA Index | 15.78% | 13.32% | 8.04% |
PERFORMANCE DATA QUOTED REPRESENTS PAST PERFORMANCE AND DOES NOT GUARANTEE FUTURE RESULTS. The investment return and principal value of the investment will fluctuate so that investors’ shares, when redeemed, may be worth more or less than their original cost. Current performance may be lower or higher than the performance data quoted. To obtain performance data current to the most recent month-end, please visit our website at www.hartfordfunds.com.
Total returns presented above were calculated using the Fund’s net asset value available to shareholders for sale or redemption of Fund shares on December 31, 2013, which may exclude investment transactions as of this date. All share class returns assume the reinvestment of all distributions at net asset value and the deduction of all fund expenses.
MSCI All Country World ex USA Index is a broad-based, unmanaged, market capitalization weighted, total return index that measures the performance of both developed and emerging stock markets, excluding the U.S. The index is calculated to exclude companies and share classes which cannot be freely purchased by foreigners.
You cannot invest directly in an index.
As of the Fund's current prospectus dated May 1, 2013, the total annual operating expense ratios for Class IA and Class IB were 0.74% and 0.99%, respectively. Actual expenses may be higher. Please see the accompanying Financial Highlights for expense ratios for the year ended December 31, 2013.
The chart and table do not reflect the deductions of taxes, sales charges or other fees which may be applied at the variable life insurance, variable annuity or qualified retirement plan product level. Any such additional sales charges or other fees or expenses would lower the contract’s or plan’s performance.
All investments are subject to risk including the possible loss of principal. For a discussion of the Fund’s risks, please see the Main Risks section of this report. For more detailed information on the risks associated with an investment in the Fund, please see the prospectus.
| 2 |
| Hartford International Opportunities HLS Fund |
| Manager Discussion |
| December 31, 2013 (Unaudited) |
| Portfolio Managers | |
| Nicolas M. Choumenkovitch | Tara Connolly Stilwell, CFA |
| Senior Vice President and Equity Portfolio Manager | Vice President and Equity Portfolio Manager |
How did the Fund perform?
The Class IA shares of the Hartford International Opportunities HLS Fund returned 21.55% for the twelve-month period ended December 31, 2013, outperforming the Fund’s benchmark, the MSCI All Country World ex USA Index, which returned 15.78% for the same period. The Fund also outperformed the 19.47% average return of the Variable Products-Underlying Funds Lipper International Growth Fund peer group, a group of funds with investment strategies similar to those of the Fund.
Why did the Fund perform this way?
Global equities returned 23.4% for the twelve-month period ended December 31, 2013, as measured by the MSCI All Country World Index (USD). Starting in the first quarter, global equities surged as solid corporate earnings results and favorable global liquidity dynamics lifted enthusiasm for stocks. Further monetary easing by the Bank of Japan and a steadily improving U.S. economy also fueled the rally, which continued at a more modest pace in the second quarter. Solid gains in April and the first part of May paused following comments by U.S. Federal Reserve (Fed) Chairman Ben Bernanke that suggested the Fed might begin to slow quantitative easing sooner than investors anticipated. Nonetheless, equities resumed their ascent in the third quarter as the surprising “no taper” decision by the Federal Open Market Committee eased near-term concerns about rapidly rising interest rates derailing the recovery. Additionally, accommodative rhetoric from the European Central Bank, along with encouraging data in China and further evidence of a European economic recovery, contributed to a broad-based global equity rally that extended through the end of the year. In December, the year ended with an optimistic tone as investors cheered the elimination of two market overhangs: the timing of Fed tapering and the threat of another U.S. government shutdown in early 2014.
Non-U.S. stocks, as measured by the MSCI AC World ex USA Index, performed well during the period (+15.78%). Nine of the ten sectors in the Index posted positive returns, led by Consumer Discretionary (+30%), Health Care (+30%), and Telecommunication Services (+29%), while Materials (-7%), Energy (4%), and Utilities (10%) lagged on a relative basis.
The Fund’s outperformance versus its benchmark was primarily due to strong stock selection, particularly within Financials, Consumer Discretionary and Materials. This performance was modestly offset by weaker selection in Energy and Consumer Staples. Allocation among sectors, a result of the bottom-up stock selection process, also contributed to positive relative returns, largely due to underweight positions in Materials and Energy.
Top contributors to absolute and benchmark-relative performance during the period included AXA (Financials), Roche (Health Care), and Rolls-Royce (Industrials). Shares of AXA, an insurance company that also provides related financial services, rose as the market began to appreciate that concerns about the company's U.S. operations were excessive given its strong reserve position in the U.S. Shares of Roche, a Swiss-based global health care company, outperformed as investors became positive on the company's near-term product roll out and future drug pipeline as 11 of 14 Phase III trials delivered positive results in 2012. Shares of Rolls-Royce, UK-based manufacturer of engines and power systems for aircraft, particularly those used for long haul routes, rose as investors appreciated the company's steady and visible generation of cash flow.
The largest detractors from benchmark-relative returns were SABESP (Utilities), FANUC (Industrials), and Vodafone (Telecommunication Services). Shares of SABESP, a Brazilian water utility company, underperformed as the market became concerned about the sustainability of tariffs in the wake of massive protests throughout Brazil. Shares of FANUC, a Japan-based manufacturer of factory automation machinery, underperformed during the period as the company was not a direct beneficiary of the weakening yen. Additionally, weakening economic activity in China and the company's exposure to Apple contributed to the stock’s underperformance. Shares of Vodafone, a telecommunications company, surged following the announcement that the company had agreed to sell its stake in Verizon Wireless back to Verizon. Not owning this benchmark component in the portfolio detracted from relative performance. ArcelorMittal (Materials) also detracted on an absolute basis.
Derivatives are not used in a significant manner in this Fund and did not have a material impact on performance during the period.
What is the outlook?
We believe Europe continues to improve and, where valuations are not stretched, we see opportunities. Dominated by mining and energy stocks, we believe the equity market in the United Kingdom does not reflect the current strength of its
| 3 |
| Hartford International Opportunities HLS Fund |
| Manager Discussion – (continued) |
| December 31, 2013 (Unaudited) |
domestic economy characterized by solid employment trends and a rising housing market. Where the UK goes, so often goes Europe, so we are watching to see what the UK government does and how the market responds to rising rates. Other than problems with China’s domestic banking system, which we believe the central government has the tools to address efficiently, we see few risks on the horizon. This leaves us with less to take a position for or against as uncertainty is low; this also reflects fuller valuations and the fact that, in our view, the easy money has been made. As is consistent with our investment approach, we continue to look for opportunities at a company-by-company level, focusing on those companies which can deliver improvements in return on invested capital (ROIC) or sustain ROIC for longer than the market anticipates.
At the end of the period, relative to the benchmark, we were most overweight in Industrials, Health Care, and Information Technology, and most underweight in Energy, Materials, and Telecommunication Services. On a regional basis, we ended the period with an overweight to select European countries, including France, Italy, and Belgium, and underweight positions in Australia, Canada, China and Germany.
Diversification by Sector
as of December 31, 2013
| Sector | Percentage of Net Assets | |||
| Equity Securities | ||||
| Consumer Discretionary | 13.3 | % | ||
| Consumer Staples | 8.3 | |||
| Energy | 3.9 | |||
| Financials | 26.3 | |||
| Health Care | 11.9 | |||
| Industrials | 15.0 | |||
| Information Technology | 10.3 | |||
| Materials | 4.8 | |||
| Services | 2.2 | |||
| Utilities | 2.4 | |||
| Total | 98.4 | % | ||
| Short-Term Investments | 1.5 | |||
| Other Assets and Liabilities | 0.1 | |||
| Total | 100.0 | % | ||
A sector may be comprised of several industries. For Fund compliance purposes, the Fund may not use the same classification system and these sector classifications are used for reporting ease.
Currency Concentration of Securities
as of December 31, 2013
| Percentage of | ||||
| Description | Net Assets | |||
| Brazilian Real | 0.2 | % | ||
| British Pound | 16.0 | |||
| Canadian Dollar | 2.9 | |||
| Euro | 34.4 | |||
| Hong Kong Dollar | 3.5 | |||
| Indian Rupee | 0.6 | |||
| Japanese Yen | 22.4 | |||
| Mexican New Peso | 0.4 | |||
| Norwegian Krone | 0.5 | |||
| Republic of Korea Won | 1.0 | |||
| Swedish Krona | 1.7 | |||
| Swiss Franc | 8.0 | |||
| Taiwanese Dollar | 2.2 | |||
| United States Dollar | 6.1 | |||
| Other Assets and Liabilities | 0.1 | |||
| Total | 100.0 | % | ||
| 4 |
| Hartford International Opportunities HLS Fund |
| Schedule of Investments |
| December 31, 2013 |
| (000’s Omitted) |
| Shares or Principal Amount | Market Value ╪ | |||||||
COMMON STOCKS - 95.8% | ||||||||
| Austria - 0.4% | ||||||||
| 210 | Erste Group Bank AG | $ | 7,303 | |||||
| Belgium - 3.8% | ||||||||
| 499 | Anheuser-Busch InBev N.V. | 53,019 | ||||||
| 219 | Umicore S.A. | 10,221 | ||||||
| 63,240 | ||||||||
| Brazil - 0.2% | ||||||||
| 270 | Mills Estruturas e Servicos de Engenharia S.A. | 3,781 | ||||||
| Canada - 2.9% | ||||||||
| 334 | Canadian National Railway Co. | 19,030 | ||||||
| 191 | Suncor Energy, Inc. | 6,696 | ||||||
| 380 | Tim Hortons, Inc. | 22,204 | ||||||
| 47,930 | ||||||||
| China - 2.1% | ||||||||
| 1,714 | ENN Energy Holdings Ltd. | 12,703 | ||||||
| 17,722 | Lenovo Group Ltd. | 21,604 | ||||||
| 34,307 | ||||||||
| Cyprus - 0.3% | ||||||||
| 90 | QIWI plc ADR | 5,050 | ||||||
| Finland - 0.5% | ||||||||
| 201 | Kone Oyj Class B | 9,060 | ||||||
| France - 17.7% | ||||||||
| 171 | Accor S.A. | 8,056 | ||||||
| 208 | Air Liquide | 29,392 | ||||||
| 188 | AtoS | 17,033 | ||||||
| 1,315 | AXA S.A. | 36,608 | ||||||
| 354 | BNP Paribas | 27,593 | ||||||
| 180 | Bureau Veritas S.A. | 5,248 | ||||||
| 270 | Capital Gemini S.A. | 18,291 | ||||||
| 174 | Cie Generale d'Optique Essilor International S.A. | 18,542 | ||||||
| 542 | Peugeot S.A. | 7,047 | ||||||
| 964 | Rexel S.A. | 25,301 | ||||||
| 204 | Safran S.A. | 14,180 | ||||||
| 199 | Sanofi-Aventis S.A. | 21,272 | ||||||
| 388 | Schneider Electric S.A. | 33,838 | ||||||
| 363 | Societe Generale Class A | 21,096 | ||||||
| 105 | Technip S.A. | 10,088 | ||||||
| 8 | Unibail Rodamco REIT | 2,089 | ||||||
| 295,674 | ||||||||
| Germany - 2.2% | ||||||||
| 54 | Brenntag AG | 9,971 | ||||||
| 88 | Continental AG | 19,334 | ||||||
| 119 | Lanxess | 7,979 | ||||||
| 37,284 | ||||||||
| Hong Kong - 1.4% | ||||||||
| 2,166 | AIA Group Ltd. | 10,901 | ||||||
| 2,719 | MGM China Holdings Ltd. | 11,637 | ||||||
| 22,538 | ||||||||
| India - 0.6% | ||||||||
| 1,263 | ITC Ltd. | 6,577 | ||||||
| 63 | United Spirits Ltd. | 2,680 | ||||||
| 9,257 | ||||||||
| Ireland - 2.7% | ||||||||
| 968 | CRH plc | 24,588 | ||||||
| 1,111 | Experian plc | 20,531 | ||||||
| 45,119 | ||||||||
| Italy - 5.7% | ||||||||
| 1,356 | Assicurazioni Generali S.p.A. | 31,861 | ||||||
| 356 | Banca Generali S.p.A. | 11,026 | ||||||
| 863 | Fiat S.p.A. | 7,065 | ||||||
| 5,446 | Intesa Sanpaolo S.p.A. | 13,396 | ||||||
| 4,628 | Snam S.p.A. | 25,866 | ||||||
| 729 | Unicredit S.p.A. | 5,378 | ||||||
| 94,592 | ||||||||
| Japan - 22.4% | ||||||||
| 596 | AEON Co., Ltd. | 8,074 | ||||||
| 124 | AEON Mall Co., Ltd. | 3,473 | ||||||
| 392 | Aisin Seiki Co., Ltd. | 15,941 | ||||||
| 613 | Asahi Group Holdings Ltd. | 17,301 | ||||||
| 912 | Bank of Yokohama Ltd. | 5,088 | ||||||
| 36 | CyberAgent, Inc. | 1,450 | ||||||
| 109 | Daito Trust Construction Co., Ltd. | 10,218 | ||||||
| 496 | Daiwa House Industry Co., Ltd. | 9,610 | ||||||
| 396 | Dentsu, Inc. | 16,188 | ||||||
| 252 | Eisai Co., Ltd. | 9,755 | ||||||
| 172 | Honda Motor Co., Ltd. | 7,092 | ||||||
| 2,217 | Isuzu Motors Ltd. | 13,827 | ||||||
| 149 | Japan Exchange Group, Inc. | 4,246 | ||||||
| 627 | Japan Tobacco, Inc. | 20,392 | ||||||
| 352 | KDDI Corp. | 21,705 | ||||||
| 1,817 | Mitsubishi Electric Corp. | 22,848 | ||||||
| 5,443 | Mitsubishi UFJ Financial Group, Inc. | 36,135 | ||||||
| 2,014 | Nomura Holdings, Inc. | 15,564 | ||||||
| 277 | Nomura Research Institute Ltd. | 8,748 | ||||||
| 279 | Olympus Corp. | 8,862 | ||||||
| 218 | Ono Pharmaceutical Co., Ltd. | 19,118 | ||||||
| 1,039 | ORIX Corp. | 18,254 | ||||||
| 1,177 | Rakuten, Inc. | 17,557 | ||||||
| 151 | Rohm Co., Ltd. ☼ | 7,375 | ||||||
| 1,047 | T&D Holdings, Inc. | 14,660 | ||||||
| 172 | THK Co., Ltd. | 4,293 | ||||||
| 749 | Tokio Marine Holdings, Inc. | 25,069 | ||||||
| 2,815 | Toshiba Corp. | 11,851 | ||||||
| 374,694 | ||||||||
| Mexico - 0.8% | ||||||||
| 549 | Cemex S.A.B. de C.V. ADR ● | 6,495 | ||||||
| 1,964 | Fibra Uno Administracion S.A. REIT | 6,290 | ||||||
| 12,785 | ||||||||
| Netherlands - 1.8% | ||||||||
| 68 | ASML Holding N.V. ‡ | 6,390 | ||||||
| 502 | NXP Semiconductors N.V. ● | 23,066 | ||||||
| 29,456 | ||||||||
| Norway - 0.5% | ||||||||
| 149 | Algeta ASA ● | 8,785 | ||||||
| Panama - 0.6% | ||||||||
| 168 | Avianca Holdings S.A. ADR ● | 2,595 | ||||||
| 45 | Copa Holdings S.A. Class A | 7,159 | ||||||
| 9,754 | ||||||||
| Portugal - 0.6% | ||||||||
| 600 | Galp Energia SGPS S.A. | 9,826 | ||||||
The accompanying notes are an integral part of these financial statements.
| 5 |
| Hartford International Opportunities HLS Fund |
| Schedule of Investments – (continued) |
| December 31, 2013 |
| (000’s Omitted) |
| Shares or Principal Amount | Market Value ╪ | |||||||
COMMON STOCKS - 95.8% - (continued) | ||||||||
| Russia - 0.9% | ||||||||
| 1,196 | Sberbank of Russia ADR | $ | 15,083 | |||||
| South Korea - 1.0% | ||||||||
| 490 | Hynix Semiconductor, Inc. ● | 17,151 | ||||||
| Spain - 0.9% | ||||||||
| 956 | Telefonica S.A. | 15,631 | ||||||
| Sweden - 1.7% | ||||||||
| 547 | Assa Abloy Ab | 28,955 | ||||||
| Switzerland - 8.0% | ||||||||
| 149 | Compagnie Financiere Richemont S.A. | 14,860 | ||||||
| 807 | Julius Baer Group Ltd. | 38,793 | ||||||
| 184 | Roche Holding AG | 51,481 | ||||||
| 1,472 | UBS AG | 28,179 | ||||||
| 133,313 | ||||||||
| Taiwan - 2.2% | ||||||||
| 10,284 | Taiwan Semiconductor Manufacturing Co., Ltd. | 36,312 | ||||||
| United Kingdom - 13.3% | ||||||||
| 253 | Al Noor Hospitals Group ● | 3,761 | ||||||
| 688 | AstraZeneca plc | 40,846 | ||||||
| 1,243 | BAE Systems plc | 8,969 | ||||||
| 2,749 | Barclays Bank plc ADR | 12,431 | ||||||
| 1,277 | BG Group plc | 27,483 | ||||||
| 1,206 | BP plc | 9,776 | ||||||
| 81 | Derwent London plc REIT | 3,336 | ||||||
| 916 | Diageo Capital plc | 30,348 | ||||||
| 2,230 | Direct Line Insurance Group plc | 9,218 | ||||||
| 352 | Great Portland Est | 3,496 | ||||||
| 2,789 | Kingfisher plc | 17,804 | ||||||
| 942 | NMC Health plc | 6,836 | ||||||
| 1,766 | Rolls-Royce Holdings plc | 37,343 | ||||||
| 246 | Schroders plc | 10,613 | ||||||
| 222,260 | ||||||||
| United States - 0.6% | ||||||||
| 145 | Covidien plc | 9,881 | ||||||
| Total common stocks | ||||||||
| (cost $1,330,696) | $ | 1,599,021 | ||||||
PREFERRED STOCKS - 2.6% | ||||||||
| Germany - 2.6% | ||||||||
| 365 | ProSieben Sat.1 Media AG | $ | 18,106 | |||||
| 91 | Volkswagen AG N.V. | 25,666 | ||||||
| 43,772 | ||||||||
| Total preferred stocks | ||||||||
| (cost $35,213) | $ | 43,772 | ||||||
| Total long-term investments | ||||||||
| (cost $1,365,909) | $ | 1,642,793 | ||||||
| SHORT-TERM INVESTMENTS - 1.5% | ||||||||
| Repurchase Agreements - 1.5% | ||||||||
| Bank of America Merrill Lynch TriParty Repurchase Agreement (maturing on 01/02/2014 in the amount of $1,263, collateralized by GNMA 4.00%, 2043, value of $1,288) | ||||||||
| $ | 1,263 | 0.005%, 12/31/2013 | $ | 1,263 | ||||
| Bank of Montreal TriParty Repurchase Agreement (maturing on 01/02/2014 in the amount of $1,213, collateralized by FNMA 1.58% - 4.50%, 2020 - 2043, U.S. Treasury Note 0.25% - 4.00%, 2015 - 2020, value of $1,238) | ||||||||
| 1,213 | 0.01%, 12/31/2013 | 1,213 | ||||||
| Bank of Montreal TriParty Repurchase Agreement (maturing on 01/02/2014 in the amount of $4,297, collateralized by FHLMC 3.00% - 5.00%, 2019 - 2043, FNMA 0.76% - 6.00%, 2016 - 2043, GNMA 1.50% - 5.25%, 2028 - 2043, value of $4,383) | ||||||||
| 4,297 | 0.02%, 12/31/2013 | 4,297 | ||||||
| Barclays Capital TriParty Repurchase Agreement (maturing on 01/02/2014 in the amount of $3,876, collateralized by U.S. Treasury Note 0.50% - 2.25%, 2017, value of $3,953) | ||||||||
| 3,876 | 0.01%, 12/31/2013 | 3,876 | ||||||
| Citigroup Global Markets, Inc. TriParty Repurchase Agreement (maturing on 01/02/2014 in the amount of $6,974, collateralized by U.S. Treasury Bond 3.88% - 8.13%, 2021 - 2040, U.S. Treasury Note 0.25% - 3.38%, 2014 - 2020, value of $7,113) | ||||||||
| 6,974 | 0.01%, 12/31/2013 | 6,974 | ||||||
| RBS Securities, Inc. TriParty Repurchase Agreement (maturing on 01/02/2014 in the amount of $2,266, collateralized by U.S. Treasury Note 0.25% - 1.00%, 2015 - 2017, value of $2,311) | ||||||||
| 2,266 | 0.01%, 12/31/2013 | 2,266 | ||||||
| TD Securities TriParty Repurchase Agreement (maturing on 01/02/2014 in the amount of $5,440, collateralized by FFCB 0.20% - 0.50%, 2015 - 2016, FHLMC 0.38% - 5.25%, 2014 - 2042, FNMA 0.50% - 7.13%, 2014 - 2043, value of $5,549) | ||||||||
| 5,440 | 0.01%, 12/31/2013 | 5,440 | ||||||
The accompanying notes are an integral part of these financial statements.
| 6 |
| Shares or Principal Amount | Market Value ╪ | |||||||||||
| SHORT-TERM INVESTMENTS - 1.5% - (continued) | ||||||||||||
| Repurchase Agreements - 1.5% - (continued) | ||||||||||||
| UBS Securities, Inc. Repurchase Agreement (maturing on 01/02/2014 in the amount of $47, collateralized by U.S. Treasury Note 2.13%, 2015, value of $48) | ||||||||||||
| $ | 47 | 0.01%, 12/31/2013 | $ | 47 | ||||||||
| 25,376 | ||||||||||||
| Total short-term investments | ||||||||||||
| (cost $25,376) | $ | 25,376 | ||||||||||
| Total investments | ||||||||||||
| (cost $1,391,285) ▲ | 99.9 | % | $ | 1,668,169 | ||||||||
| Other assets and liabilities | 0.1 | % | 1,296 | |||||||||
| Total net assets | 100.0 | % | $ | 1,669,465 | ||||||||
| Note: | Percentage of investments as shown is the ratio of the total market value to total net assets. |
Prices of foreign equities that are principally traded on certain foreign markets may be adjusted daily pursuant to a fair value pricing service approved by the Board of Directors in order to reflect an adjustment for factors occurring after the close of certain foreign markets but before the close of the New York Stock Exchange.
| ▲ | At December 31, 2013, the cost of securities for federal income tax purposes was $1,400,647 and the aggregate gross unrealized appreciation and depreciation based on that cost were: |
| Unrealized Appreciation | $ | 284,024 | ||
| Unrealized Depreciation | (16,502 | ) | ||
| Net Unrealized Appreciation | $ | 267,522 |
| ● | Non-income producing. |
| ☼ | This security, or a portion of this security, was purchased on a when-issued, delayed-delivery or delayed-draw basis. The cost of these securities was $1,064 at December 31, 2013. |
| ‡ | This security, or a portion of this security, has been segregated to cover funding requirements on investment transactions settling in the future. |
The accompanying notes are an integral part of these financial statements.
| 7 |
| Hartford International Opportunities HLS Fund |
| Schedule of Investments – (continued) |
| December 31, 2013 |
| (000’s Omitted) |
Foreign Currency Contracts Outstanding at December 31, 2013
| Currency | Buy / Sell | Delivery Date | Counterparty | Contract Amount | Market Value ╪ | Unrealized Appreciation/ (Depreciation) | ||||||||||||
| JPY | Buy | 01/06/2014 | BCLY | $ | 556 | $ | 553 | $ | (3 | ) | ||||||||
| JPY | Buy | 01/07/2014 | DEUT | 513 | 511 | (2 | ) | |||||||||||
| $ | (5 | ) | ||||||||||||||||
| ╪ | See Significant Accounting Policies of accompanying Notes to Financial Statements regarding valuation of securities. |
| GLOSSARY: (abbreviations used in preceding Schedule of Investments) | ||
| Counterparty Abbreviations: | ||
| BCLY | Barclays | |
| DEUT | Deutsche Bank Securities, Inc. | |
| Currency Abbreviations: | ||
| JPY | Japanese Yen | |
| Other Abbreviations: | ||
| ADR | American Depositary Receipt | |
| FFCB | Federal Farm Credit Bank | |
| FHLMC | Federal Home Loan Mortgage Corp. | |
| FNMA | Federal National Mortgage Association | |
| GNMA | Government National Mortgage Association | |
| REIT | Real Estate Investment Trust | |
The accompanying notes are an integral part of these financial statements.
| 8 |
| Hartford International Opportunities HLS Fund |
| Investment Valuation Hierarchy Level Summary |
| December 31, 2013 |
| (000’s Omitted) |
| Total | Level 1 ♦ | Level 2 ♦ | Level 3 | |||||||||||||
| Assets: | ||||||||||||||||
| Common Stocks ‡ | $ | 1,599,021 | $ | 147,237 | $ | 1,451,784 | $ | – | ||||||||
| Preferred Stocks | 43,772 | – | 43,772 | – | ||||||||||||
| Short-Term Investments | 25,376 | – | 25,376 | – | ||||||||||||
| Total | $ | 1,668,169 | $ | 147,237 | $ | 1,520,932 | $ | – | ||||||||
| Liabilities: | ||||||||||||||||
| Foreign Currency Contracts * | 5 | – | 5 | – | ||||||||||||
| Total | $ | 5 | $ | – | $ | 5 | $ | – | ||||||||
| ♦ | For the year ended December 31, 2013, investments valued at $24,261 were transferred from Level 1 to Level 2, and investments valued at $46,160 were transferred from Level 2 to Level 1. Investments are transferred between Level 1 and Level 2 for a variety of reasons including, but not limited to: |
| 1) | Foreign equities for which a fair value price is more representative of exit value than the local market close (transfer into Level 2). Foreign equities for which the local market close is more representative of exit value (transfer into Level 1). |
| 2) | U.S. Treasury securities that no longer represent the most recent issue (transfer into Level 2). |
| 3) | Equity investments with no observable trading but a bid or close price is used (transfer into Level 2). Equity investments using observable quoted prices in an active market (transfer into Level 1). |
| ‡ | The Fund has all or primarily all of the equity securities categorized in a particular level. Refer to the Schedule of Investments for further industry breakout. |
| * | Derivative instruments (excluding purchased and written options, if applicable) are valued at the unrealized appreciation/depreciation on the investments. |
| Note: | For purposes of reporting transfers between different hierarchy levels, both transfers in and out of each level, as applicable, are shown as if they occurred at the beginning of the period. |
The accompanying notes are an integral part of these financial statements.
| 9 |
| Hartford International Opportunities HLS Fund |
| Statement of Assets and Liabilities |
| December 31, 2013 |
| (000’s Omitted) |
| Assets: | ||||
| Investments in securities, at market value (cost $1,391,285) | $ | 1,668,169 | ||
| Cash | 116 | |||
| Foreign currency on deposit with custodian (cost $205) | 205 | |||
| Receivables: | ||||
| Fund shares sold | 1,475 | |||
| Dividends and interest | 1,647 | |||
| Total assets | 1,671,612 | |||
| Liabilities: | ||||
| Unrealized depreciation on foreign currency contracts | 5 | |||
| Payables: | ||||
| Investment securities purchased | 1,064 | |||
| Fund shares redeemed | 654 | |||
| Investment management fees | 244 | |||
| Distribution fees | 12 | |||
| Accrued expenses | 168 | |||
| Total liabilities | 2,147 | |||
| Net assets | $ | 1,669,465 | ||
| Summary of Net Assets: | ||||
| Capital stock and paid-in-capital | $ | 1,926,000 | ||
| Undistributed net investment income | 25,773 | |||
| Accumulated net realized loss | (559,247 | ) | ||
| Unrealized appreciation of investments and the translations of assets and liabilities denominated in foreign currency | 276,939 | |||
| Net assets | $ | 1,669,465 | ||
| Shares authorized | 2,625,000 | |||
| Par value | $ | 0.001 | ||
| Class IA: Net asset value per share | $ | 15.03 | ||
| Shares outstanding | 96,712 | |||
| Net assets | $ | 1,454,018 | ||
| Class IB: Net asset value per share | $ | 15.20 | ||
| Shares outstanding | 14,173 | |||
| Net assets | $ | 215,447 |
The accompanying notes are an integral part of these financial statements.
| 10 |
| Hartford International Opportunities HLS Fund |
| Statement of Operations |
| For the Year Ended December 31, 2013 |
| (000’s Omitted) |
| Investment Income: | ||||
| Dividends | $ | 43,380 | ||
| Interest | 24 | |||
| Less: Foreign tax withheld | (4,634 | ) | ||
| Total investment income, net | 38,770 | |||
| Expenses: | ||||
| Investment management fees | 10,558 | |||
| Transfer agent fees | 5 | |||
| Distribution fees - Class IB | 533 | |||
| Custodian fees | 210 | |||
| Accounting services fees | 248 | |||
| Board of Directors' fees | 39 | |||
| Audit fees | 44 | |||
| Other expenses | 373 | |||
| Total expenses (before fees paid indirectly) | 12,010 | |||
| Commission recapture | (54 | ) | ||
| Custodian fee offset | — | |||
| Total fees paid indirectly | (54 | ) | ||
| Total expenses, net | 11,956 | |||
| Net Investment Income | 26,814 | |||
| Net Realized Gain on Investments and Foreign Currency Transactions: | ||||
| Net realized gain on investments | 165,924 | |||
| Net realized gain on foreign currency contracts | 1,550 | |||
| Net realized loss on other foreign currency transactions | (2,186 | ) | ||
| Net Realized Gain on Investments and Foreign Currency Transactions | 165,288 | |||
| Net Changes in Unrealized Appreciation of Investments and Foreign Currency Transactions: | ||||
| Net unrealized appreciation of investments | 113,146 | |||
| Net unrealized depreciation of foreign currency contracts | (2 | ) | ||
| Net unrealized appreciation on translation of other assets and liabilities in foreign currencies | 54 | |||
| Net Changes in Unrealized Appreciation of Investments and Foreign Currency Transactions | 113,198 | |||
| Net Gain on Investments and Foreign Currency Transactions | 278,486 | |||
| Net Increase in Net Assets Resulting from Operations | $ | 305,300 |
The accompanying notes are an integral part of these financial statements.
| 11 |
| Hartford International Opportunities HLS Fund |
| Statement of Changes in Net Assets |
| (000’s Omitted) |
| For the Year Ended December 31, 2013 | For the Year Ended December 31, 2012 | |||||||
| Operations: | ||||||||
| Net investment income | $ | 26,814 | $ | 28,213 | ||||
| Net realized gain on investments and foreign currency transactions | 165,288 | 18,671 | ||||||
| Net unrealized appreciation of investments and foreign currency transactions | 113,198 | 235,594 | ||||||
| Net Increase in Net Assets Resulting from Operations | 305,300 | 282,478 | ||||||
| Distributions to Shareholders: | ||||||||
| From net investment income | ||||||||
| Class IA | (28,319 | ) | (24,562 | ) | ||||
| Class IB | (3,870 | ) | (3,573 | ) | ||||
| Total distributions | (32,189 | ) | (28,135 | ) | ||||
| Capital Share Transactions: | ||||||||
| Class IA | ||||||||
| Sold | 170,972 | 85,672 | ||||||
| Issued on reinvestment of distributions | 28,319 | 24,562 | ||||||
| Redeemed | (284,350 | ) | (311,056 | ) | ||||
| Total capital share transactions | (85,059 | ) | (200,822 | ) | ||||
| Class IB | ||||||||
| Sold | 25,317 | 23,016 | ||||||
| Issued on reinvestment of distributions | 3,870 | 3,573 | ||||||
| Redeemed | (71,682 | ) | (76,826 | ) | ||||
| Total capital share transactions | (42,495 | ) | (50,237 | ) | ||||
| Net decrease from capital share transactions | (127,554 | ) | (251,059 | ) | ||||
| Net Increase in Net Assets | 145,557 | 3,284 | ||||||
| Net Assets: | ||||||||
| Beginning of period | 1,523,908 | 1,520,624 | ||||||
| End of period | $ | 1,669,465 | $ | 1,523,908 | ||||
| Undistributed (distribution in excess of) | ||||||||
| net investment income | $ | 25,773 | $ | 28,599 | ||||
| Shares: | ||||||||
| Class IA | ||||||||
| Sold | 12,510 | 7,362 | ||||||
| Issued on reinvestment of distributions | 2,067 | 2,110 | ||||||
| Redeemed | (21,051 | ) | (26,480 | ) | ||||
| Total share activity | (6,474 | ) | (17,008 | ) | ||||
| Class IB | ||||||||
| Sold | 1,861 | 1,956 | ||||||
| Issued on reinvestment of distributions | 279 | 303 | ||||||
| Redeemed | (5,258 | ) | (6,476 | ) | ||||
| Total share activity | (3,118 | ) | (4,217 | ) | ||||
The accompanying notes are an integral part of these financial statements.
| 12 |
| Hartford International Opportunities HLS Fund |
| Notes to Financial Statements |
| December 31, 2013 |
| (000’s Omitted) |
| 1. | Organization: |
Hartford International Opportunities HLS Fund (the “Fund”) serves as an underlying investment option for certain variable annuity and variable life insurance separate accounts of Hartford Life Insurance Company (“HLIC”) and its affiliates and certain qualified retirement plans. The Fund may also serve as an underlying investment option for certain variable annuity and variable life separate accounts of other insurance companies. Owners of variable annuity contracts and policyholders of variable life insurance contracts may choose the funds permitted in the variable insurance contract prospectus. In addition, participants in certain qualified retirement plans may choose the Fund if permitted by their plans.
Hartford Series Fund, Inc. (the “Company”) is an open-end registered management investment company comprised of thirty portfolios. Financial statements for the Fund, a series of the Company, are included in this report.
The Company is organized under the laws of the State of Maryland and is registered with the Securities and Exchange Commission (“SEC”) under the Investment Company Act of 1940, as amended (“1940 Act”). The Fund is a diversified open-end management investment company.
The Fund is divided into Class IA and Class IB shares. Each class is offered at the per share net asset value (“NAV”) without a sales charge and is subject to the same expenses, except that the Class IB shares are subject to distribution and service fees charged pursuant to a Distribution Plan adopted in accordance with Rule 12b-1 under the 1940 Act.
| 2. | Significant Accounting Policies: |
The following is a summary of significant accounting policies of the Fund in the preparation of its financial statements, which are in accordance with United States Generally Accepted Accounting Principles (“U.S. GAAP”). The preparation of financial statements in accordance with U.S. GAAP may require management to make estimates and assumptions that affect the reported amounts of assets and liabilities and disclosure of contingent assets and liabilities at the date of the financial statements and the reported amounts of increases and decreases in net assets from operations during the reporting period. Actual results could differ from those estimates.
| a) | Determination of Net Asset Value – The NAV of each class of the Fund’s shares is determined as of the close of regular trading (normally 4:00 p.m. Eastern Time) (the “NYSE Close”) on each day that the New York Stock Exchange (the “Exchange”) is open (“Valuation Date”). Information that becomes known to the Fund after the NAV has been calculated on a particular day will not generally be used to retroactively adjust the NAV determined earlier that day. |
| b) | Investment Valuation and Fair Value Measurements – For purposes of calculating the NAV, portfolio investments and other assets held by the Fund's portfolio for which market quotes are readily available are valued at market value. Market value is generally determined on the basis of last reported sales prices or official close price. If no sales are reported, market value is based on quotes obtained from a quotation reporting system, established market makers, or independent pricing services. If market prices are not readily available or are deemed unreliable, the Fund will use the fair value of the investment as determined in good faith under policies and procedures established by and under the supervision of the Company’s Board of Directors. Market quotes are considered not readily available where there is an absence of current or reliable market-based data (e.g., trade information or indicative market quotes), including where events occur after the close of the relevant market, but prior to the NYSE Close, that materially affect the values of the Fund’s portfolio investments or assets. In addition, market quotes are considered not readily available when, due to extraordinary circumstances, the exchanges or markets on which the investments trade do not open for trading for the entire day and no other market prices are available. In addition, prices of foreign equities that are principally traded on certain foreign markets may be adjusted daily pursuant to a fair value pricing service approved by the Board of Directors in order to reflect an adjustment for the factors occurring after the close of certain foreign markets but before the NYSE Close. Investments that are primarily traded on foreign markets may trade on days that are not business days of the Fund. The value of the foreign investments in which the Fund invests may change on days when a shareholder will not be able to purchase or redeem shares of the Fund. Fair value pricing is subjective in nature and the use of fair value pricing by the Fund may cause the NAV of its shares to differ significantly from the NAV that would have been calculated using |
| 13 |
| Hartford International Opportunities HLS Fund |
| Notes to Financial Statements – (continued) |
| December 31, 2013 |
| (000’s Omitted) |
market prices at the close of the exchange on which a portfolio investment is primarily traded. There can be no assurance that the Fund could obtain the fair market value assigned to an investment if the Fund were to sell the investment at approximately the time at which the Fund determines its NAV.
Investments valued in currencies other than U.S. dollars are converted to U.S. dollars using exchange rates obtained from independent pricing services for calculation of the NAV. As a result, the NAV of the Fund’s shares may be affected by changes in the value of currencies in relation to the U.S. dollar. The value of investments traded in markets outside the United States or denominated in currencies other than the U.S. dollar may be affected significantly on a day that the NYSE is closed and the market value may change on days when an investor is not able to purchase, redeem or exchange shares of the Fund.
Foreign currency contracts represent agreements to exchange currencies on specific future dates at predetermined rates. Foreign currency contracts are valued using foreign currency exchange rates and forward rates as provided by an independent pricing service on the Valuation Date.
Financial instruments for which prices are not available from an independent pricing service may be valued using market quotations obtained from one or more dealers that make markets in the respective financial instrument in accordance with procedures established by the Company’s Board of Directors.
U.S. GAAP defines fair value as the price that the Fund would receive to sell an asset or pay to transfer a liability in an orderly transaction between market participants. The U.S. GAAP fair value measurement standards require disclosure of a fair value hierarchy for each major category of assets and liabilities. Various inputs are used in determining the fair value of the Fund’s investments. These inputs are summarized into three broad hierarchy levels. This hierarchy is based on whether the valuation inputs are observable or unobservable. These levels are:
| · | Level 1 – Quoted prices in active markets for identical investments. Level 1 may include exchange traded instruments, such as domestic equities, some foreign equities, options, futures, mutual funds, exchange traded funds, rights and warrants. |
| · | Level 2 – Observable inputs other than Level 1 prices, such as quoted prices for similar investments; quoted prices in markets that are not active; or other inputs that are observable or can be corroborated by observable market data. Level 2 may include debt investments that are traded less frequently than exchange traded instruments and which are valued using independent pricing services; foreign equities, which are principally traded on certain foreign markets and are adjusted daily pursuant to a fair value pricing service in order to reflect an adjustment for the factors occurring after the close of certain foreign markets but before the NYSE Close; senior floating rate interests, which are valued using an aggregate of dealer bids; short-term investments, which are valued at amortized cost; and swaps, which are valued based upon the terms of each swap contract. |
| · | Level 3 – Significant unobservable inputs that are supported by limited or no market activity. Level 3 may include financial instruments whose values are determined using indicative market quotes or require significant management judgment or estimation. These unobservable valuation inputs may include estimates for current yields, maturity/duration, prepayment speed, and indicative market quotes for comparable investments along with other assumptions relating to credit quality, collateral value, complexity of the investment structure, general market conditions and liquidity. This category may include investments where trading has been halted or there are certain restrictions on trading. While these investments are priced using unobservable inputs, the valuation of these investments reflects the best available data and management believes the prices are a reasonable representation of exit price. |
The Board of Directors of the Company generally reviews and approves the “Procedures for Valuation of Portfolio Securities” on an annual basis. These procedures define how investments are to be valued, including the formation and activities of a Valuation Committee. The Valuation Committee is responsible for determining in good faith the fair value of investments when the value cannot be obtained from primary pricing services or alternative sources or if the valuation of an investment as provided by the primary pricing service or alternative
| 14 |
source is believed not to reflect the investment’s fair value as of the Valuation Date. Voting members of the Valuation Committee include the Fund’s Treasurer or designee and a Vice President of the investment manager or designee. An Assistant Vice President of the Fund with legal expertise or designee is also included on the Valuation Committee as a non-voting advisory member. In addition, the Fund’s Chief Compliance Officer shall designate a member of the compliance group to attend Valuation Committee meetings as a non-voting resource, to monitor for and provide guidance with respect to compliance with these procedures. Two members of the Valuation Committee or their designees, representing different departments, shall constitute a quorum for purposes of permitting the Valuation Committee to take action. The Valuation Committee will consider all relevant factors in determining an investment’s fair value, and may seek the advice of the Fund’s sub-adviser, knowledgeable brokers, and legal counsel in making such determination. The Valuation Committee reports to the Audit Committee of the Company’s Board of Directors. The Audit Committee receives quarterly written reports which include details of all fair-valued investments, including the reason for the fair valuation, and an indication, when possible, of the accuracy of the valuation by disclosing the next available reliable public price quotation or the disposition price of such investments (the “look-back” test). The Board of Directors then must consider for ratification all of the fair value determinations made during the previous quarter.
Valuation levels are not necessarily indicative of the risk associated with investing in such investments. Individual investments within any of the above mentioned asset classes may be assigned a different hierarchical level than those presented above, as individual circumstances dictate.
For additional information, refer to the Investment Valuation Hierarchy Level Summary and the Level 3 roll-forward reconciliation, if applicable, which follow the Schedule of Investments.
| c) | Investment Transactions and Investment Income – Investment transactions are recorded as of the trade date (the date the order to buy or sell is executed) for financial reporting purposes. Investments purchased or sold on a when-issued or delayed-delivery basis may be settled a month or more after the trade date. Realized gains and losses are determined on the basis of identified cost. |
Dividend income from domestic securities is accrued on the ex-dividend date. In general, dividend income from foreign securities is recorded on the ex-date; however, dividend notifications in certain foreign jurisdictions may not be available in a timely manner and as a result, the Fund will record the dividend as soon as the relevant details (i.e., rate per share, payment date, shareholders of record, etc.) are publicly available. Interest income, including amortization of premium, accretion of discounts and additional principal received in-kind in lieu of cash, is accrued on a daily basis.
| d) | Foreign Currency Transactions – Assets and liabilities denominated in currencies other than U.S. dollars are translated into U.S. dollars at the exchange rates in effect on the valuation date. Purchases and sales of investments, income and expenses are translated into U.S. dollars at the exchange rates on the dates of such transactions. |
The Fund does not isolate that portion of portfolio investment valuation resulting from fluctuations in the foreign currency exchange rates from the fluctuations arising from changes in the market prices of investments held. Exchange rate fluctuations are included with the net realized and unrealized gain or loss on investments in the accompanying financial statements.
Net realized foreign exchange gains or losses arise from sales of foreign currencies and the difference between asset and liability amounts initially stated in foreign currencies and the U.S. dollar value of the amounts actually received or paid. Net unrealized foreign exchange gains or losses arise from changes in the value of other assets and liabilities at the end of the reporting period, resulting from changes in the exchange rates.
| e) | Joint Trading Account – The Fund may invest cash balances into a joint trading account that may be invested in one or more repurchase agreements. |
| 15 |
| Hartford International Opportunities HLS Fund |
| Notes to Financial Statements – (continued) |
| December 31, 2013 |
| (000’s Omitted) |
| f) | Fund Share Valuation and Dividend Distributions to Shareholders – Orders for the Fund’s shares are executed in accordance with the investment instructions of the contract holders and plan participants. The NAV of the Fund’s shares is determined as of the close of business on each business day of the Exchange. The NAV is determined separately for each class of shares of the Fund by dividing the Fund’s net assets attributable to that class by the number of shares of the class outstanding. Each class of shares offered by the Fund has equal rights as to assets and voting privileges (except that shareholders of a class have exclusive voting rights regarding any matter relating solely to that class of shares). Income and non-class specific expenses are allocated daily to each class on the basis of the relative net assets of the class. Realized and unrealized gains and losses are allocated daily based on the relative net assets of each class of shares of the Fund. |
Orders for the purchase of the Fund’s shares received prior to the close of the Exchange on any day the Exchange is open for business are priced at the NAV determined as of the close of the Exchange. Orders received after the close of the Exchange, or on a day on which the Exchange and/or the Fund is not open for business, are priced at the next determined NAV.
Dividends are declared pursuant to a policy adopted by the Company’s Board of Directors based upon the investment performance of the Fund. The policy of the Fund is to pay dividends from net investment income and realized gains, if any, at least once a year.
Distributions from net investment income, net realized gains and capital are determined in accordance with federal income tax regulations, which may differ from U.S. GAAP with respect to character and timing. These differences may include, but are not limited to, losses deferred due to wash sale adjustments, foreign currency gains and losses, adjustments related to Passive Foreign Investment Companies (“PFICs”), Real Estate Investment Trusts (“REITs”), Regulated Investment Companies (“RICs”), certain derivatives and partnerships. Permanent book and federal income tax basis differences relating to shareholder distributions will result in reclassifications to certain of the Fund’s capital accounts (see Federal Income Taxes: Reclassification of Capital Accounts note).
| 3. | Securities and Other Investments: |
| a) | Repurchase Agreements – A repurchase agreement is an agreement by which a counterparty agrees to sell an investment and agrees to repurchase the investment sold from the buyer at a mutually agreed upon time and price. During the period of the repurchase agreement, the counterparty will deposit cash and or securities in a third party custodial account to serve as collateral. At the time the Fund enters into a repurchase agreement, the value of the underlying collateral, including accrued interest, will be equal to or exceed the value of the repurchase agreement. Repurchase agreements expose the Fund to counterparty risk - that is, the risk that the counterparty will not fulfill its obligations. To minimize counterparty risk, the investments that serve to collateralize the repurchase agreement are held by the Fund’s custodian in book entry or physical form in the custodial account of the Fund or in a third party custodial account. Repurchase agreements are valued at cost plus accrued interest, which approximates fair value. Repurchase agreements have master netting arrangements which allow the Fund to offset amounts owed to a counterparty with amounts owed by the counterparty, including any collateral. Upon an event of default under a master repurchase agreement, the non-defaulting party may close out all transactions traded under such agreement and net amounts owed under each transaction to one net amount payable by one party to the other. Absent an event of default, the master repurchase agreement does not result in an offset of reported amounts of assets and liabilities in the Statement of Assets and Liabilities across transactions between the Fund and the applicable counterparty. The Fund, as shown on the Schedule of Investments, had outstanding repurchase agreements and related collateral as of December 31, 2013. |
| b) | Illiquid and Restricted Investments – The Fund is permitted to invest up to 15% of its net assets in illiquid investments. Illiquid investments are those that may not be sold or disposed of in the ordinary course of business within seven days, at approximately the price used to determine the Fund’s NAV. The Fund may not be able to sell illiquid investments when its sub-adviser considers it desirable to do so or may have to sell such investments at a price that is lower than the price that could be obtained if the investments were more liquid. A sale of illiquid investments may require more time and |
| 16 |
may result in higher dealer discounts and other selling expenses than does the sale of those that are liquid. Illiquid investments also may be more difficult to value due to the unavailability of reliable market quotations for such investments, and an investment in them may have an adverse impact on the Fund’s NAV. The Fund may also purchase certain restricted investments that can only be resold to certain qualified investors and may be determined to be liquid pursuant to policies and guidelines established by the Company’s Board of Directors. The Fund had no illiquid or restricted investments as of December 31, 2013.
| c) | Investments Purchased on a When-Issued or Delayed-Delivery Basis – Delivery and payment for investments that have been purchased by the Fund on a forward commitment, or when-issued or delayed-delivery basis, take place beyond the customary settlement period. The Fund may dispose of or renegotiate a delayed-delivery transaction after it is entered into, and may sell delayed-delivery investments before they are delivered, which may result in a realized gain or loss. During this period, such investments are subject to market fluctuations, and the Fund identifies investments segregated in its records with a value at least equal to the amount of the commitment. The Fund, as shown on the Schedule of Investments, had when-issued or delayed-delivery investments as of December 31, 2013. |
| 4. | Financial Derivative Instruments: |
The following disclosures contain information on how and why the Fund uses derivative instruments, the credit-risk-related contingent features in certain derivative instruments, and how derivative instruments affect the Fund’s financial position and results of operations. The location and fair value amounts of these instruments on the Statement of Assets and Liabilities and the realized gains and losses and changes in unrealized gains and losses on the Statement of Operations, each categorized by type of derivative contract, are included in the following Additional Derivative Instrument Information footnote. The derivative instruments outstanding as of year-end are disclosed in the notes to or within the Schedule of Investments for purchased options, if applicable. The amounts of realized gains and losses and changes in unrealized gains and losses on derivative instruments during the year are disclosed in the Statement of Operations.
| a) | Foreign Currency Contracts – The Fund may enter into foreign currency contracts that obligate the Fund to purchase or sell currencies at specified future dates. Foreign currency contracts are used to hedge the currency exposure associated with some or all of the Fund’s investments and/or as part of an investment strategy. Foreign currency contracts are marked to market daily and the change in value is recorded by the Fund as an unrealized gain or loss. The Fund will record a realized gain or loss when the foreign currency contract is settled. |
Foreign currency contracts involve elements of market risk in excess of the amounts reflected in the Statement of Assets and Liabilities. In addition, risks may arise upon entering into these contracts from the potential inability of the counterparties to meet the terms of the contracts and from unanticipated movements in the value of the foreign currencies relative to the U.S. dollar. The Fund had outstanding foreign currency contracts as shown on the Schedule of Investments as of December 31, 2013.
| b) | Additional Derivative Instrument Information: |
Fair Value of Derivative Instruments on the Statement of Assets and Liabilities as of December 31, 2013:
| Risk Exposure Category | ||||||||||||||||||||||||||||
| Interest Rate Contracts | Foreign Exchange Contracts | Credit Contracts | Equity Contracts | Commodity Contracts | Other Contracts | Total | ||||||||||||||||||||||
| Liabilities: | ||||||||||||||||||||||||||||
| Unrealized depreciation on foreign currency contracts | $ | — | $ | 5 | $ | — | $ | — | $ | — | $ | — | $ | 5 | ||||||||||||||
| Total | $ | — | $ | 5 | $ | — | $ | — | $ | — | $ | — | $ | 5 | ||||||||||||||
The volume of derivatives that is presented in the Schedule of Investments is consistent with the derivative activity during the year ended December 31, 2013.
| 17 |
| Hartford International Opportunities HLS Fund |
| Notes to Financial Statements – (continued) |
| December 31, 2013 |
| (000’s Omitted) |
The Effect of Derivative Instruments on the Statement of Operations for the year ended December 31, 2013:
| Risk Exposure Category | ||||||||||||||||||||||||||||
| Interest Rate Contracts | Foreign Exchange Contracts | Credit Contracts | Equity Contracts | Commodity Contracts | Other Contracts | Total | ||||||||||||||||||||||
| Realized Gain on Derivatives Recognized as a Result of Operations: | ||||||||||||||||||||||||||||
| Net realized gain on foreign currency contracts | $ | — | $ | 1,550 | $ | — | $ | — | $ | — | $ | — | $ | 1,550 | ||||||||||||||
| Total | $ | — | $ | 1,550 | $ | — | $ | — | $ | — | $ | — | $ | 1,550 | ||||||||||||||
| Net Change in Unrealized Appreciation (Depreciation) on Derivatives Recognized as a Result of Operations: | ||||||||||||||||||||||||||||
| Net change in unrealized depreciation of foreign currency contracts | $ | — | $ | (2 | ) | $ | — | $ | — | $ | — | $ | — | $ | (2 | ) | ||||||||||||
| Total | $ | — | $ | (2 | ) | $ | — | $ | — | $ | — | $ | — | $ | (2 | ) | ||||||||||||
The derivatives held by the Fund as of December 31, 2013 are not subject to a master netting arrangement; therefore, no balance sheet offsetting disclosure is presented.
| 5. | Principal Risks: |
The Fund may be exposed to counterparty risk, or the risk that an institution or other entity with which the Fund has unsettled or open transactions will default.
If the Fund invests directly in foreign currencies or in securities that trade in, and receive revenues in, foreign currencies, or in derivatives that provide exposure to foreign currencies, it will be subject to the risk that those currencies will decline in value relative to the base currency (U.S. dollars) of the Fund, or, in the case of hedging positions, that the Fund’s base currency will decline in value relative to the currency being hedged. Currency rates in foreign countries may fluctuate significantly over short periods of time for a number of reasons, including changes in interest rates, intervention (or the failure to intervene) by U.S. or foreign governments, central banks or supranational entities, such as the International Monetary Fund, or by the imposition of currency controls or other political developments in the United States or abroad. As a result, the Fund’s investments in foreign currency denominated securities may reduce the returns of the Fund. The market values of equity securities, such as common stocks and preferred stocks, or equity related investments, such as futures and options, may decline due to general market conditions which are not specifically related to a particular company, such as real or perceived adverse economic conditions, changes in the general outlook for corporate earnings, changes in interest or currency rates or adverse investor sentiment generally. The market value of equity securities may also decline due to factors which affect a particular industry or industries, such as labor shortages or increased production costs and competitive conditions within an industry. Equity securities and equity related investments generally have greater market price volatility than fixed income securities.
| 6. | Federal Income Taxes: |
| a) | Federal Income Taxes – For federal income tax purposes, the Fund intends to continue to qualify as a RIC under Subchapter M of the Internal Revenue Code (“IRC”) by distributing substantially all of its taxable net investment income and net realized capital gains to its shareholders and otherwise complying with the requirements of the IRC. The Fund has distributed substantially all of its income and capital gains in prior years, if applicable, and intends to distribute substantially all of its income and capital gains prior to the next fiscal year-end. Accordingly, no provision for federal income or excise taxes has been made in the accompanying financial statements. Distributions from short-term capital gains are treated as ordinary income distributions for federal income tax purposes. |
| b) | Net Investment Income (Loss), Net Realized Gains (Losses) and Distributions – Net investment income (loss) and net realized gains (losses) may differ for financial statement and tax purposes primarily because of losses deferred due to wash sale adjustments, foreign currency gains and losses, adjustments related to PFICs, REITs, RICs, certain derivatives and partnerships. The character of distributions made during the year from net investment income or net realized gains |
| 18 |
may differ from their ultimate characterization for federal income tax purposes. Also, due to the timing of dividend distributions, the fiscal year in which amounts are distributed may differ from the year that the income or realized gains (losses) were recorded by the Fund.
| c) | Distributions and Components of Distributable Earnings – The tax character of distributions paid by the Fund for the periods indicated is as follows (as adjusted for dividends payable, if applicable): |
| For the Year Ended December 31, 2013 | For the Year Ended December 31, 2012 | |||||||
| Ordinary Income | $ | 32,189 | $ | 28,135 | ||||
As of December 31, 2013, the Fund’s components of distributable earnings (deficit) on a tax basis were as follows:
| Amount | ||||
| Undistributed Ordinary Income | $ | 32,481 | ||
| Accumulated Capital and Other Losses* | (556,593 | ) | ||
| Unrealized Appreciation† | 267,577 | |||
| Total Accumulated Deficit | $ | (256,535 | ) | |
| * | The Fund has capital loss carryforwards that are identified in the Capital Loss Carryforward note that follows. |
| † | Differences between book-basis and tax-basis unrealized appreciation (depreciation) may be attributable to the losses deferred due to wash sale adjustments, foreign currency gains and losses, adjustments related to PFICs, REITs, RICs, certain derivatives and partnerships. |
| d) | Reclassification of Capital Accounts – The Fund may record reclassifications in its capital accounts. These reclassifications have no impact on the total net assets of the Fund. The reclassifications are a result of permanent differences between U.S. GAAP and tax accounting for such items as foreign currency, PFICs, expiration or utilization of capital loss carryforwards or net operating losses. Adjustments are made to reflect the impact these items have on current and future distributions to shareholders. Therefore, the source of the Fund’s distributions may be shown in the accompanying Statement of Changes in Net Assets as from undistributed net investment income, from accumulated net realized gains on investments or from capital depending on the type of book and tax differences that exist. For the year ended December 31, 2013, the Fund recorded reclassifications to increase (decrease) the accounts listed below: |
| Amount | ||||
| Undistributed Net Investment Income (Loss) | $ | 2,549 | ||
| Accumulated Net Realized Gain (Loss) | (2,549 | ) | ||
| e) | Capital Loss Carryforward – On December 22, 2010, the Regulated Investment Company Modernization Act of 2010 (the “Act”) was enacted, which made changes to the capital loss carryforward rules. The changes are effective for taxable years beginning after the date of enactment. Under the Act, funds are permitted to carry forward capital losses for an unlimited period. However, any losses incurred during those future taxable years will be required to be utilized prior to the losses incurred in pre-enactment taxable years, which carry an expiration date. As a result of this ordering rule, pre-enactment capital loss carryforwards may be more likely to expire unused. Additionally, post-enactment capital loss carryforwards retain their character as either short-term or long-term capital losses rather than being considered all short-term as permitted under prior regulation. |
| 19 |
| Hartford International Opportunities HLS Fund |
| Notes to Financial Statements – (continued) |
| December 31, 2013 |
| (000’s Omitted) |
At December 31, 2013 (tax-year-end), the Fund had capital loss carryforwards for U.S. federal income tax purposes as follows:
| Year of Expiration | Amount | |||
| 2016 | $ | 268,993 | ||
| 2017 | 287,600 | |||
| Total | $ | 556,593 | ||
During the year ended December 31, 2013, the Fund utilized $154,388 of prior year capital loss carryforwards.
| f) | Accounting for Uncertainty in Income Taxes – The Fund has adopted financial reporting rules that require the Fund to analyze all open tax years, as defined by the statute of limitations, for all major jurisdictions. Generally, tax authorities can examine all tax returns filed for the last three years. The Fund does not have an examination in progress. |
The Fund has reviewed all open tax years and major jurisdictions and concluded that these financial reporting rules had no effect on the Fund’s financial position or results of operations. There is no tax liability resulting from unrecognized tax benefits relating to uncertain income tax positions taken or expected to be taken on the tax return for the fiscal year ended December 31, 2013. The Fund is also not aware of any tax positions for which it is reasonably possible that the total amounts of unrecognized tax benefits will significantly change in the next twelve months.
| 7. | Expenses: |
| a) | Investment Management Agreement – Hartford Funds Management Company, LLC (“HFMC”), an indirect wholly owned subsidiary of The Hartford Financial Services Group, Inc. (“The Hartford”), serves as investment manager to the Fund pursuant to an Investment Management Agreement with the Company. The investment manager has overall investment supervisory responsibility for the Fund. In addition, the investment manager provides administrative personnel, services, equipment, facilities and office space for proper operation of the Fund. The investment manager has contracted with Wellington Management Company, LLP (“Wellington Management”) under a sub-advisory agreement for the provision of day-to-day investment management services to the Fund in accordance with the Fund’s investment objective and policies. The Fund pays a fee to the investment manager, a portion of which may be used to compensate Wellington Management. |
The schedule below reflects the rates of compensation paid to HFMC for investment management services rendered as of December 31, 2013; the rates are accrued daily and paid monthly.
| Average Daily Net Assets | Annual Fee | |
| On first $250 million | 0.7750% | |
| On next $250 million | 0.7250% | |
| On next $500 million | 0.6750% | |
| On next $1.5 billion | 0.6250% | |
| On next $2.5 billion | 0.6200% | |
| On next $5 billion | 0.6150% | |
| Over $10 billion | 0.6100% |
| 20 |
| b) | Accounting Services Agreement – Pursuant to the Fund Accounting Agreement between HFMC and the Company, on behalf of the Fund, HFMC provides accounting services to the Fund and receives monthly compensation based on the Fund’s average daily net assets at the rates set forth below. The Fund’s accounting services fees are accrued daily and paid monthly. |
| Average Daily Net Assets | Annual Fee | |
| On first $5 billion | 0.016% | |
| On next $5 billion | 0.014% | |
| Over $10 billion | 0.012% |
Effective January 1, 2014, the new accounting services fees schedule based on the Fund’s average daily net assets is as follows:
| Average Daily Net Assets | Annual Fee | |
| On first $5 billion | 0.016% | |
| On next $5 billion | 0.013% | |
| Over $10 billion | 0.010% |
| c) | Operating Expenses – Allocable expenses incurred by the Company are allocated to each Fund and allocated to classes within a Fund in proportion to the average daily net assets of the Fund and each class, except where allocation of certain expenses is more fairly made directly to the Fund or to specific classes within a Fund. |
| d) | Fees Paid Indirectly – The Company, on behalf of the Fund, has entered into agreements with State Street Global Markets, LLC and Russell Implementation Services, Inc. to partially recapture non-discounted trade commissions. Such rebates are used to pay a portion of the Fund’s expenses. In addition, the Fund’s custodian bank has agreed to reduce its fees when the Fund maintains cash on deposit in a non-interest-bearing custody account. For the year ended December 31, 2013, these amounts, if any, are included in the Statement of Operations. |
The ratio of expenses to average net assets in the accompanying financial highlights excludes the reduction in expenses related to fees paid indirectly. The annualized expense ratio after waivers for the period listed below reflecting the reduction for fees paid indirectly is as follows:
| Year Ended December 31, 2013 | ||||
| Class IA | 0.74 | % | ||
| Class IB | 0.99 | |||
| e) | Distribution Plan for Class IB shares – Effective June 14, 2013, Hartford Investment Financial Services, LLC was renamed Hartford Funds Distributors, LLC (“HFD”). HFD, a wholly owned, ultimate subsidiary of The Hartford, serves as the Fund’s principal underwriter and distributor. The Company, on behalf of the Fund, has adopted a Distribution Plan pursuant to Rule 12b-1 of the 1940 Act to compensate the distributor, HFD, from assets attributable to the Class IB shares for services rendered and expenses borne in connection with activities primarily intended to result in the sale of the Class IB shares, subject to the review and approval of the Company’s Board of Directors. |
The Distribution Plan provides that the Fund may pay annually up to 0.25% of the average daily net assets of the Fund attributable to its Class IB shares for activities primarily intended to result in the sale of Class IB shares. The Board has the authority to suspend or reduce these payments at any point in time. Under the terms of the Distribution Plan and the principal underwriting agreement, the Fund is authorized to make payments monthly to the distributor that may be used to pay or compensate entities providing distribution and shareholder servicing with respect to the Class IB shares for such entities’ fees or expenses incurred or paid in that regard. These fees are accrued daily and paid monthly.
| 21 |
| Hartford International Opportunities HLS Fund |
| Notes to Financial Statements – (continued) |
| December 31, 2013 |
| (000’s Omitted) |
| f) | Other Related Party Transactions – Certain officers of the Fund are directors and/or officers of the investment manager and/or The Hartford or its subsidiaries. For the year ended December 31, 2013, a portion of the Fund’s Chief Compliance Officer’s salary was paid by all the investment companies in the Hartford fund complex. The portion allocated to the Fund was in the amount of $2. Hartford Administrative Services Company (“HASCO”), an indirect wholly owned subsidiary of The Hartford, provides transfer agent services to the Fund. HASCO was compensated on a per account basis for providing such services. The amount paid to HASCO can be found in the Statement of Operations. These fees are accrued daily and paid monthly. |
| g) | Payment from Affiliate – In July of 2007, The Hartford entered into a settlement with the Attorneys General of the states of New York, Connecticut and Illinois relating to market timing and the company's individual variable annuity contracts in which certain payments would be made directly to the variable annuity contract holders. The distribution plan provided that unclaimed money from the settlement would be distributed to certain HLS Funds that are investment options through a Hartford individual variable annuity contract. The unclaimed money was distributed to the Fund on September 18, 2009. |
The total return in the accompanying financial highlights includes a payment from an affiliate. Had the payment from the affiliate been excluded, the impact and total return for the period listed below would have been as follows:
| For the Year Ended December 31, 2009 | ||||||||
| Class IA | Class IB | |||||||
| Impact from Payment from Affiliate for Attorneys General Settlement | 0.23 | % | 0.23 | % | ||||
| Total Return Excluding Payment from Affiliate | 33.15 | % | 32.83 | % | ||||
| 8. | Investment Transactions: |
For the year ended December 31, 2013, the Fund's aggregate purchases and sales of investment securities (excluding short-term investments) were as follows:
| Amount | ||||
| Cost of Purchases Excluding U.S. Government Obligations | $ | 1,517,272 | ||
| Sales Proceeds Excluding U.S. Government Obligations | 1,670,520 | |||
| 9. | Line of Credit: |
The Fund is one of several Hartford funds that participate in a $500 million committed revolving line of credit facility. The facility is to be used for temporary or emergency purposes. Under the arrangement, the funds are required to own securities having a market value in excess of 300% of the total bank borrowings. The interest rate on borrowings varies depending on the nature of the loan. The facility also requires a fee to be paid based on the amount of the commitment. This commitment fee is allocated to all of the funds participating in the line of credit based on the average net assets of the funds. During the year ended December 31, 2013, the Fund did not have any borrowings under this facility.
| 10. | Industry Classifications: |
Other than the industry classifications “Other Investment Pools and Funds” and “Exchange Traded Funds,” equity industry classifications used in this report are the Global Industry Classification Standard, which was developed by and is the exclusive property and service mark of MSCI, Inc. and Standard & Poor’s.
| 22 |
| 11. | Indemnifications: |
Under the Company’s organizational documents, the Company shall indemnify its officers and directors to the full extent required or permitted under Maryland General Corporation Law and the federal securities laws. In addition, the Company, on behalf of the Fund, may enter into contracts that contain a variety of indemnifications. The Company’s maximum exposure under these arrangements is unknown. However, as of the date of these financial statements, the Company has not had prior claims or losses pursuant to these contracts and expects the risk of loss to be remote.
| 12. | Pending Legal Proceedings: |
On February 25, 2011, Jennifer L. Kasilag, Louis Mellinger, Judith M. Menendez, Jacqueline M. Robinson, and Linda A. Russell filed a derivative lawsuit against Hartford Investment Financial Services, LLC (“HIFSCO”)(now known as Hartford Funds Distributors, LLC) on behalf of six Hartford retail mutual funds in the United States District Court for the District of New Jersey, alleging that HIFSCO received excessive advisory and distribution fees in violation of its statutory fiduciary duty under Section 36(b) of the 1940 Act when serving as investment manager and principal underwriter, respectively, to the Hartford retail mutual funds. HIFSCO moved to dismiss and, in September 2011, the motion was granted in part and denied in part, with leave to amend the complaint. In November 2011, plaintiffs filed an amended complaint on behalf of certain Hartford retail mutual funds, The Hartford Global Health Fund (now known as The Hartford Healthcare Fund), The Hartford Conservative Allocation Fund, The Hartford Growth Opportunities Fund, The Hartford Inflation Plus Fund, The Hartford Advisers Fund (now known as The Hartford Balanced Fund), and The Hartford Capital Appreciation Fund. Plaintiffs seek to rescind the investment management agreements and distribution plans between HIFSCO and these funds and to recover the total fees charged thereunder or, in the alternative, to recover any improper compensation HIFSCO received, in addition to lost earnings. HIFSCO filed a partial motion to dismiss the amended complaint and, in December 2012, the court dismissed without prejudice the claims regarding distribution fees and denied the motion with respect to the advisory fees claims. HIFSCO disputes the allegations and intends to defend the advisory fee claims vigorously.
This action concerns the activities of HIFSCO in its capacity as investment manager and principal underwriter to the Hartford retail mutual funds and does not concern HIFSCO’s activities in its capacity as principal underwriter to the HLS funds. For this reason, no accrual for litigation relating to this matter has been recorded in the financial statements of the Fund.
| 23 |
| Hartford International Opportunities HLS Fund |
| Financial Highlights |
─Selected Per-Share Data(A) ─ | ─Ratios and Supplemental Data ─ | |||||||||||||||||||||||||||||||||||||||||||||||||||
Class | Net Asset | Net | Net | Total from | Dividends | Distributions | Total | Net | Total | Net Assets | Ratio of | Ratio of | Ratio of | |||||||||||||||||||||||||||||||||||||||
| For the Year Ended December 31, 2013 | ||||||||||||||||||||||||||||||||||||||||||||||||||||
| IA | $ | 12.63 | $ | 0.24 | $ | 2.45 | $ | 2.69 | $ | (0.29 | ) | $ | – | $ | (0.29 | ) | $ | 15.03 | 21.55 | % | $ | 1,454,018 | 0.74 | % | 0.74 | % | 1.76 | % | ||||||||||||||||||||||||
| IB | 12.76 | 0.21 | 2.49 | 2.70 | (0.26 | ) | – | (0.26 | ) | 15.20 | 21.28 | 215,447 | 0.99 | 0.99 | 1.55 | |||||||||||||||||||||||||||||||||||||
| For the Year Ended December 31, 2012 (D) | ||||||||||||||||||||||||||||||||||||||||||||||||||||
| IA | $ | 10.72 | $ | 0.26 | $ | 1.88 | $ | 2.14 | $ | (0.23 | ) | $ | – | $ | (0.23 | ) | $ | 12.63 | 20.20 | % | $ | 1,303,209 | 0.74 | % | 0.74 | % | 1.88 | % | ||||||||||||||||||||||||
| IB | 10.82 | 0.25 | 1.88 | 2.13 | (0.19 | ) | – | (0.19 | ) | 12.76 | 19.89 | 220,699 | 0.99 | 0.99 | 1.64 | |||||||||||||||||||||||||||||||||||||
| For the Year Ended December 31, 2011 (D) | ||||||||||||||||||||||||||||||||||||||||||||||||||||
| IA | $ | 12.46 | $ | 0.21 | $ | (1.94 | ) | $ | (1.73 | ) | $ | (0.01 | ) | $ | – | $ | (0.01 | ) | $ | 10.72 | (13.97 | )% | $ | 1,287,917 | 0.73 | % | 0.73 | % | 1.66 | % | ||||||||||||||||||||||
| IB | 12.61 | 0.19 | (1.97 | ) | (1.78 | ) | (0.01 | ) | – | (0.01 | ) | 10.82 | (14.19 | ) | 232,707 | 0.98 | 0.98 | 1.41 | ||||||||||||||||||||||||||||||||||
| For the Year Ended December 31, 2010 | ||||||||||||||||||||||||||||||||||||||||||||||||||||
| IA | $ | 11.01 | $ | 0.13 | $ | 1.46 | $ | 1.59 | $ | (0.14 | ) | $ | – | $ | (0.14 | ) | $ | 12.46 | 14.49 | % | $ | 1,705,757 | 0.74 | % | 0.74 | % | 1.19 | % | ||||||||||||||||||||||||
| IB | 11.15 | 0.11 | 1.46 | 1.57 | (0.11 | ) | – | (0.11 | ) | 12.61 | 14.20 | 328,671 | 0.99 | 0.99 | 0.94 | |||||||||||||||||||||||||||||||||||||
| For the Year Ended December 31, 2009 (D) | ||||||||||||||||||||||||||||||||||||||||||||||||||||
| IA | $ | 8.40 | $ | 0.19 | (E) | $ | 2.61 | $ | 2.80 | $ | (0.19 | ) | $ | – | $ | (0.19 | ) | $ | 11.01 | 33.46 | %(F) | $ | 1,247,179 | 0.76 | % | 0.76 | % | 1.68 | % | |||||||||||||||||||||||
| IB | 8.51 | 0.17 | (E) | 2.64 | 2.81 | (0.17 | ) | – | (0.17 | ) | 11.15 | 33.13 | (F) | 216,882 | 1.01 | 1.01 | 1.43 | |||||||||||||||||||||||||||||||||||
| (A) | Information presented relates to a share outstanding throughout the indicated period. Net investment income (loss) per share amounts are calculated based on average shares outstanding unless otherwise noted. |
| (B) | The figures do not include sales charges or other fees which may be applied at the variable life insurance, variable annuity or qualified retirement plan product level. Any such additional sales charges or other fees would lower the Fund's performance. |
| (C) | Adjustments include waivers and reimbursements, if applicable. Ratios do not include fees paid indirectly (see Expenses in the accompanying Notes to Financial Statements). |
| (D) | Net investment income (loss) per share amounts have been calculated using the SEC method. |
| (E) | The impact of Payment from Affiliate per share was $0.03. |
| (F) | Total return without the inclusion of the Payment from (to) Affiliate can be found in Expenses in the accompanying Notes to Financial Statements. |
| Portfolio Turnover Rate for All Share Classes | ||
| For the Year Ended December 31, 2013 | 100% | |
| For the Year Ended December 31, 2012 | 95 | |
| For the Year Ended December 31, 2011 | 111 | |
| For the Year Ended December 31, 2010 | 128(A) | |
| For the Year Ended December 31, 2009 | 152 |
| (A) | During the year ended December 31, 2010, the Fund incurred $456.2 million in sales associated with the transition of assets from Hartford International Growth HLS Fund and Hartford International Small Company HLS Fund, which merged into the Fund on April 16, 2010. These sales were excluded from the portfolio turnover calculation. |
| 24 |
| Report of Independent Registered Public Accounting Firm |
The Board of Directors and Shareholders of Hartford Series Fund, Inc. |
We have audited the accompanying statement of assets and liabilities, including the schedule of investments, of Hartford International Opportunities HLS Fund (one of the portfolios constituting Hartford Series Fund, Inc. (the Funds)) as of December 31, 2013, and the related statement of operations for the year then ended, the statements of changes in net assets for each of the two years in the period then ended, and the financial highlights for each of the five years in the period then ended. These financial statements and financial highlights are the responsibility of the Funds’ management. Our responsibility is to express an opinion on these financial statements and financial highlights based on our audits.
We conducted our audits in accordance with the standards of the Public Company Accounting Oversight Board (United States). Those standards require that we plan and perform the audit to obtain reasonable assurance about whether the financial statements and financial highlights are free of material misstatement. We were not engaged to perform an audit of the Funds’ internal control over financial reporting. Our audits included consideration of internal control over financial reporting as a basis for designing audit procedures that are appropriate in the circumstances, but not for the purpose of expressing an opinion on the effectiveness of the Funds’ internal control over financial reporting. Accordingly, we express no such opinion. An audit also includes examining, on a test basis, evidence supporting the amounts and disclosures in the financial statements and financial highlights, assessing the accounting principles used and significant estimates made by management, and evaluating the overall financial statement presentation. Our procedures included confirmation of securities owned as of December 31, 2013, by correspondence with the custodian and brokers or by other appropriate auditing procedures where replies from brokers were not received. We believe that our audits provide a reasonable basis for our opinion.
In our opinion, the financial statements and financial highlights referred to above present fairly, in all material respects, the financial position of Hartford International Opportunities HLS Fund of the Hartford Series Fund, Inc. at December 31, 2013, the results of its operations for the year then ended, the changes in its net assets for each of the two years in the period then ended, and the financial highlights for each of the five years in the period then ended, in conformity with U.S. generally accepted accounting principles.
|
Minneapolis, MN
February 17, 2014
| 25 |
| Hartford International Opportunities HLS Fund |
| Directors and Officers (Unaudited) |
The Board of Directors of the Company appoints officers who are responsible for the day-to-day operations of the Fund and who execute policies formulated by the directors. Each director serves until his or her death, resignation, or retirement or until the next annual meeting of shareholders is held or until his or her successor is elected and qualifies.
Directors and officers who are employed by or who have a financial interest in The Hartford are considered “interested” persons of the Fund pursuant to the 1940 Act. Each officer and two of the Company’s directors, as noted in the chart below, are “interested” persons of the Fund. Each director serves as a director for The Hartford Mutual Funds, Inc., The Hartford Mutual Funds II, Inc., Hartford Series Fund, Inc., Hartford HLS Series Fund II, Inc., and as a trustee for The Hartford Alternative Strategies Fund, which, as of December 31, 2013, collectively consist of 91 funds. Correspondence may be sent to directors and officers c/o Hartford Funds, 5 Radnor Corporate Center, Suite 300, 100 Matsonford Road, Radnor, Pennsylvania 19087, except that correspondence to Mr. Annoni, Mr. Dressen and Ms. Quade may be sent to 500 Bielenberg Drive, Woodbury, Minnesota 55125.
The table below sets forth, for each director and officer, his or her name, year of birth, current position with the Company and date first elected or appointed to Hartford Series Fund, Inc. (“HSF”), and Hartford HLS Series Fund II, Inc. (“HSF2”), principal occupation, and, for directors, other directorships held. The Fund’s Statement of Additional Information contains further information on the directors and is available free of charge by calling 1-800-862-6668 or writing to Hartford HLS Funds, c/o Hartford Life Insurance Company, Hartford Life and Annuity Insurance Company, P.O. Box 14293, Lexington, KY 40512-4293.
Information on the aggregate remuneration paid to the directors of the Company can be found in the Statement of Operations herein. The Fund pays to The Hartford a portion of the Chief Compliance Officer’s compensation, but does not pay salaries or compensation to any of their other officers or directors who are employed by The Hartford.
Non-Interested Directors
Lynn S. Birdsong (1946) Director since 2003, Co-Chairman of the Investment Committee since 2005
Mr. Birdsong is a private investor. Mr. Birdsong currently serves as a Director of the Sovereign High Yield Investment Company (April 2010 to current). Mr. Birdsong currently serves as an Independent Director of Nomura Partners Funds, Inc. (formerly, The Japan Fund) (April 2003 to current). From 2003 to March 2005, Mr. Birdsong was an Independent Director of the Atlantic Whitehall Funds. From 1979 to 2002, Mr. Birdsong was a Managing Director of Zurich Scudder Investments, an investment management firm. During his employment with Scudder, Mr. Birdsong was an Interested Director of The Japan Fund. From January 1981 through December 2013, Mr. Birdsong was a partner in Birdsong Company, an advertising specialty firm.
Robert M. Gavin, Jr. (1940) Director since 2002 (HSF) and 1986 (HSF2), Chairman of the Board since 2004
Dr. Gavin is an educational consultant. Prior to September 1, 2001, he was President of Cranbrook Education Community and prior to July 1996, he was President of Macalester College, St. Paul, Minnesota.
Duane E. Hill (1945) Director since 2001 (HSF) and 2002 (HSF2), Chairman of the Nominating Committee since 2003
Mr. Hill is a Partner of TSG Ventures L.P., a private equity investment company. Mr. Hill is a former partner of TSG Capital Group, a private equity investment firm that served as sponsor and lead investor in leveraged buyouts of middle market companies.
Sandra S. Jaffee (1941) Director since 2005
Ms. Jaffee is the founder and Chief Executive Officer of a private company, Homeworks Concierge, LLC, which provides residential property management services in Westchester County, New York (January 2012 to present). Ms. Jaffee served as Chairman (2008 to 2009) and Chief Executive Officer of Fortent (formerly Searchspace Group), a leading provider of compliance/regulatory technology to financial institutions from August 2005 to August 2009. Ms. Jaffee currently serves as a member of the Board of Directors of Broadridge Financial Solutions as well as a Trustee of Muhlenberg College.
| 26 |
William P. Johnston (1944) Director since 2005, Chairman of the Compliance Committee since 2005
In June 2006, Mr. Johnston was appointed as Senior Advisor to The Carlyle Group, a global private equity and alternative asset investment firm and currently serves as an Operating Executive. In July 2006, Mr. Johnston was elected to the Board of Directors of MultiPlan, Inc. and served as a Director (July 2006 to August 2010). In August 2007, Mr. Johnston was elected to the Board of Directors of LifeCare Holdings, Inc. and served as a Director (August 2007 to June 2013). In February 2008, Mr. Johnston was elected to the Board of Directors of HCR-ManorCare, Inc. In May 2006, Mr. Johnston was elected to the Supervisory Board of Fresenius Medical Care AG & Co. KGaA, after its acquisition of Renal Care Group, Inc. in March 2006. Mr. Johnston joined Renal Care Group in November 2002 as a member of the Board of Directors and served as Chairman of the Board from March 2003 through March 2006. From 2002 through 2013, Mr. Johnston served as a Board member of the Georgia O’Keefe Museum. From September 1987 to December 2002, Mr. Johnston was with Equitable Securities Corporation (and its successors, SunTrust Equitable Securities and SunTrust Robinson Humphrey) serving in various investment banking and managerial positions, including Managing Director and Head of Investment Banking, Chief Executive Officer and Vice Chairman.
Phillip O. Peterson (1944) Director since 2002 (HSF) and 2000 (HSF2), Chairman of the Audit Committee since 2002
Mr. Peterson is a mutual fund industry consultant. He was a partner of KPMG LLP (an accounting firm) until July 1999. Mr. Peterson joined William Blair Funds in February 2007 as a member of the Board of Trustees. Mr. Peterson also joined the Board of Trustees of Symetra Variable Mutual Funds Trust as a trustee in February 2012.
Lemma W. Senbet (1946) Director since 2005
Dr. Senbet is the William E. Mayer Chair Professor of Finance and Founding Director, Center for Financial Policy, at the University of Maryland, Robert H. Smith School of Business. He was chair of the Finance Department of the University of Maryland, Robert H. Smith School of Business from 1998 to 2006. Since June 2013, he has been on leave from the University to serve as Executive Director of African Economic Research Consortium which focuses on economic policy research and training. Previously, he was a chaired professor of finance at the University of Wisconsin-Madison. Also, he was a Director of the Fortis Funds from March 2000 to July 2002. Dr. Senbet served as Director of the American Finance Association and President of the Western Finance Association. In 2006, Dr. Senbet was inducted Fellow of Financial Management Association International for his career-long distinguished scholarship and professional service.
Interested Directors and Officers
James E. Davey (1964) Director since 2012, President and Chief Executive Officer since 2010
Mr. Davey serves as Executive Vice President of Hartford Life Insurance Company (“HLIC”) and The Hartford Financial Services Group, Inc. Additionally, Mr. Davey serves as Chairman of the Board, Manager and Senior Managing Director of Hartford Funds Distributors, LLC (“HFD”). He also currently serves as Director, Chairman of the Board, President and Senior Managing Director of Hartford Administrative Services Company (“HASCO”). Mr. Davey also serves as Manager, Chairman of the Board and Senior Managing Director for Hartford Funds Management Company, LLC (“HFMC”). Mr. Davey joined The Hartford in 2002.
Lowndes A. Smith (1939) Director since 1996 (HSF) and 2002 (HSF2), Co-Chairman of the Investment Committee since 2005
Mr. Smith served as Vice Chairman of The Hartford from February 1997 to January 2002, as President and Chief Executive Officer of Hartford Life, Inc. from February 1997 to January 2002, and as President and Chief Operating Officer of The Hartford Life Insurance Companies from January 1989 to January 2002. Mr. Smith serves as a Director of White Mountains Insurance Group Ltd. (October 2003 to current); One Beacon Insurance (October 2006 to current); Symetra Financial (August 2007 to current) and is a Managing Director of Whittington Gray Associates (January 2007 to current).
Other Officers
Mark A. Annoni (1964) Vice President, Controller and Treasurer since 2012
Mr. Annoni currently serves as the Assistant Vice President of HLIC (February 2004 to present).
| 27 |
| Hartford International Opportunities HLS Fund |
| Directors and Officers (Unaudited) – (continued) |
Michael R. Dressen (1963) AML Compliance Officer since 2011
Mr. Dressen currently serves as Assistant Vice President of HLIC. He also serves as Chief Compliance Officer and AML Compliance Officer of HASCO and as AML Officer of HFD. Mr. Dressen has served in various positions within The Hartford and its subsidiaries in connection with the operation of the Hartford Funds.
Edward P. Macdonald (1967) Vice President, Secretary and Chief Legal Officer since 2005
Mr. Macdonald currently serves as Assistant Secretary, Executive Vice President and Deputy General Counsel of HFD, HASCO and HFMC. He also serves as Vice President of HLIC. Mr. Macdonald has served in various positions within The Hartford and its subsidiaries in connection with the operation of the Hartford Funds. Mr. Macdonald joined The Hartford in 2005.
Joseph G. Melcher (1973) Vice President and Chief Compliance Officer since 2013
Mr. Melcher currently serves as Executive Vice President of HASCO and HFD. Mr. Melcher also currently serves as Executive Vice President and Chief Compliance Officer of HFMC. Mr. Melcher has served in various positions within The Hartford and its subsidiaries in connection with the operation of the Hartford Funds since joining The Hartford in 2012. Prior to joining The Hartford, Mr. Melcher worked at Touchstone Investments, a member of the Western & Southern Financial Group, where he held the position of Vice President and Chief Compliance Officer from 2010 through 2012 and Assistant Vice President, Compliance from 2005 to 2010.
Vernon J. Meyer (1964) Vice President since 2006
Mr. Meyer currently serves as Senior Vice President of HLIC. He also currently serves as Managing Director and Chief Investment Officer of HFMC. Mr. Meyer has served in various positions within The Hartford and its subsidiaries in connection with the operation of the Hartford Funds. Mr. Meyer joined The Hartford in 2004.
Laura S. Quade (1969) Vice President since 2012
Ms. Quade currently serves as Vice President of HASCO and HFD. She is the Head of Operations of HASCO and also serves as Director, Enterprise Operations of HLIC. Ms. Quade has served in various positions within The Hartford and its subsidiaries in connection with the operation of the Hartford Funds.
Martin A. Swanson (1962) Vice President since 2010
Mr. Swanson currently serves as Vice President of HLIC. Mr. Swanson also serves as Managing Director, Chief Marketing Officer and Principal of HFD. Mr. Swanson has served in various positions within The Hartford and its subsidiaries in connection with the operation of the Hartford Funds.
HOW TO OBTAIN A COPY OF THE FUND’S PROXY VOTING POLICIES AND VOTING RECORDS (UNAUDITED)
A description of the policies and procedures that the Fund uses to determine how to vote proxies relating to portfolio securities and information about how the Fund voted proxies relating to portfolio securities during the most recent twelve-month period ended June 30 are available (1) without charge, upon request, by calling 800-862-6668 and (2) on the SEC’s website at http://www.sec.gov.
QUARTERLY PORTFOLIO HOLDINGS INFORMATION (UNAUDITED)
The Fund files a complete schedule of portfolio holdings with the SEC for the first and third quarters of each fiscal year on Form N-Q. The Fund’s Forms N-Q are available (1) without charge, upon request, by calling 800-862-6668 and (2) on the SEC’s website at http://www.sec.gov. The Form N-Q may be reviewed and copied at the SEC’s Public Reference Room in Washington, DC. Information on the operation of the Public Reference Room may be obtained by calling 1-800-SEC-0330.
| 28 |
| Hartford International Opportunities HLS Fund |
| Expense Example (Unaudited) |
Your Fund's Expenses
As a shareholder of the Fund, you incur two types of costs: (1) transaction costs and (2) ongoing costs, including investment management fees, distribution and/or service (12b-1) fees, if any, and other fund expenses. This example is intended to help you understand your ongoing costs (in dollars) of investing in the Fund and to compare these costs with the ongoing costs of investing in other mutual funds. The example is based on an investment of $1,000 invested at the beginning of the period and held for the period of June 30, 2013 through December 31, 2013.
Actual Expenses
The first set of columns of the table below provides information about actual account values and actual expenses. You may use the information in this column, together with the amount you invested, to estimate the expenses that you paid over the period. Simply divide your account value by $1,000 (for example, an $8,600 account value divided by $1,000 = 8.6), then multiply the result by the number in the line under the heading entitled “Expenses Paid During Period” to estimate the expenses you paid on your account during this period.
Hypothetical Example for Comparison Purposes
The second set of columns of the table below provides information about hypothetical account values and hypothetical expenses based on the Fund’s actual expense ratio and an assumed rate of return of 5% per year before expenses, which is not the Fund’s actual return. The hypothetical account values and expenses may not be used to estimate the actual ending account balance or expenses you paid for the period. You may use this information to compare the ongoing costs of investing in the Fund and other funds. To do so, compare this 5% hypothetical example with the 5% hypothetical examples that appear in the shareholder reports of the other funds.
Please note that the expenses shown in the table are meant to highlight your ongoing costs only and do not reflect any transactional costs, such as sales charges (loads) and CDSC. Therefore, the second set of columns of the table is useful in comparing ongoing costs only, and will not help you determine the relative total costs of owning different funds. In addition, if these transactional costs were included, your costs would be higher. Expenses are equal to the Fund's annualized expense ratios multiplied by average account value over the period, multiplied by 184/365 (to reflect the one-half year period).
| Actual return | Hypothetical (5% return before expenses) | |||||||||||||||||||||||||||||||||
Beginning | Ending | Expenses paid during the period June 30, 2013 through December 31, 2013 | Beginning | Ending | Expenses paid | Annualized | Days in the current 1/2 year | Days in the full year | ||||||||||||||||||||||||||
| Class IA | $ | 1,000.00 | $ | 1,180.60 | $ | 4.06 | $ | 1,000.00 | $ | 1,021.49 | $ | 3.76 | 0.74 | % | 184 | 365 | ||||||||||||||||||
| Class IB | $ | 1,000.00 | $ | 1,179.40 | $ | 5.43 | $ | 1,000.00 | $ | 1,020.22 | $ | 5.03 | 0.99 | % | 184 | 365 | ||||||||||||||||||
| 29 |
| Hartford International Opportunities HLS Fund |
| Approval of Investment Management and Investment Sub-Advisory Agreements (Unaudited) |
Section 15(c) of the Investment Company Act of 1940, as amended (the “1940 Act”), requires that each mutual fund’s board of directors, including a majority of those directors who are not “interested persons” of the mutual fund, as defined in the 1940 Act (the “Independent Directors”), annually review and consider the continuation of the mutual fund’s investment advisory and sub-advisory agreements. At its meeting held on August 6-7, 2013, the Board of Directors (the “Board”) of Hartford Series Fund, Inc., including each of the Independent Directors, unanimously voted to approve the continuation of the investment management agreement for Hartford International Opportunities HLS Fund (the “Fund”) with Hartford Funds Management Company, LLC (“HFMC”) and the continuation of the investment sub-advisory agreement between HFMC and the Fund’s sub-adviser, Wellington Management Company, LLP (the “Sub-adviser,” and together with HFMC, the “Advisers”) (collectively, the “Agreements”).
In the months preceding the August 6-7, 2013 meeting, the Board requested, received, and reviewed written responses from the Advisers to questions posed to them on behalf of the Independent Directors and supporting materials relating to those questions and responses. The Board considered information furnished to the Board at its meetings throughout the year, as well as information specifically prepared in connection with the annual approval of the Agreements at the Board’s meetings held on June 18-19, 2013 and August 6-7, 2013. Information provided to the Board at its meetings throughout the year included, among other things, reports on Fund performance, legal and compliance matters, sales and marketing activity, shareholder services, and the other services provided to the Fund by the Advisers and their affiliates. The Board also received in-person presentations by Fund officers and representatives of HFMC at the Board’s meetings on June 18-19, 2013 and August 6-7, 2013 concerning the Agreements.
The Independent Directors, advised by independent legal counsel, engaged two service providers to assist them with evaluating the Agreements with respect to the Fund. Lipper Inc. (“Lipper”), an independent provider of investment company data, was retained to provide the Board with reports on how the Fund’s contractual management fees, actual management fees, other non-management fees, overall expense ratios and investment performance compared to those of mutual funds with similar investment objectives. The Independent Directors also engaged an independent financial services consulting firm (the “Consultant”) to assist them in evaluating the Fund’s management fees, sub-advisory fees, other non-management fees, overall expense ratios and investment performance. In addition, the Consultant reviewed the profitability calculations utilized by HFMC in connection with the continuation of the investment management agreement.
In determining whether to continue the Agreements for the Fund, the members of the Board reviewed and evaluated information and factors they believed to be relevant and appropriate in light of the information that the Board deemed necessary and appropriate through the exercise of its reasonable business judgment. While individual members of the Board may have weighed certain factors differently, the Board’s determination to continue the Agreements was based on a comprehensive consideration of all information provided to the Board throughout the year and specifically with respect to the continuation of the Agreements. A more detailed discussion of the factors the Board considered with respect to its approval of the Agreements is provided below.
Nature, Extent, and Quality of Services Provided by the Advisers
The Board requested and considered information concerning the nature, extent, and quality of the services provided to the Fund by the Advisers. The Board considered, among other things, the terms of the Agreements and the range of services provided by the Advisers. The Board considered the Advisers’ professional personnel who provide services to the Fund, including each Adviser’s ability and experience in attracting and retaining qualified personnel to service the Fund. The Board considered each Adviser’s reputation and overall financial strength, as well as its willingness to consider and implement organizational and operational changes designed to improve services to the Fund. In addition, the Board considered the quality of each Adviser’s communications with the Board and responsiveness to Board inquiries.
The Board also requested and evaluated information concerning each Adviser’s regulatory and compliance environment. In this regard, the Board requested and reviewed information on each Adviser’s compliance policies and procedures, compliance history, and a report from the Fund’s Chief Compliance Officer on each Adviser’s compliance with applicable laws and regulations, including responses to regulatory developments and compliance issues raised by regulators. The Board also noted the Advisers’ support of the Fund’s compliance control structure, particularly the resources devoted by the Advisers in support of the Fund’s obligations pursuant to Rule 38a-1 under the 1940 Act.
| 30 |
With respect to HFMC, the Board noted that under the Agreements, HFMC is responsible for the management of the Fund, including overseeing fund operations and service providers, as well as investment advisory services in connection with selecting, monitoring and supervising the Sub-adviser. The Board considered HFMC’s ongoing monitoring of people, process and performance, including its quarterly reviews of each of the Hartford Funds, semi-annual meetings with the leaders of each Fund’s portfolio management team, and oversight of the Funds’ approximately 40 portfolio managers. The Board recognized that HFMC has demonstrated a record of making changes to the management and/or strategies of the Funds when warranted. The Board considered HFMC’s oversight of the Sub-adviser’s investment approach and results, process for monitoring best execution of portfolio trades by the Sub-adviser, and approach to risk management with respect to the Fund and the service providers to the Fund. The Board also considered HFMC’s oversight of compliance with the Fund’s objective and policies as well as with applicable laws and regulations, noting that regulatory and other developments had over time led to an increase in the scope of HFMC’s services in this regard.
In addition, the Board considered HFMC’s ongoing commitment to review and rationalize the Hartford Funds product line-up and the expenses that HFMC had incurred in connection with fund combinations in recent years. The Board considered that HFMC or its affiliates are responsible for providing the Fund’s officers. The Board also noted that Hartford Life Insurance Company (“HLIC”) provides administrative services to the Fund. The Board considered its experiences with HFMC and HLIC with respect to each of these services.
With respect to the Sub-adviser, who provides day-to-day portfolio management services, the Board considered the quality of the Fund’s portfolio managers, the Sub-adviser’s other investment personnel, its investment philosophy and process, investment research capabilities and resources, performance record, trade execution capabilities and experience. The Board considered the experience of the Fund’s portfolio managers, the number of accounts managed by the portfolio managers, and the Sub-adviser’s method for compensating the portfolio managers.
Based on these considerations, the Board concluded that it was satisfied with the nature, extent and quality of the services provided to the Fund by HFMC and the Sub-adviser.
Performance of the Fund and the Advisers
The Board considered the investment performance of the Fund. In this regard, the Board reviewed the performance of the Fund over different time periods presented in the materials and evaluated HFMC’s analysis of the Fund’s performance for these time periods. The Board considered information and materials provided to the Board by the Advisers concerning Fund performance, as well as information from Lipper comparing the investment performance of the Fund to an appropriate benchmark and universe of peer funds. The Board noted that the Fund’s performance was in the 5th quintile of its performance universe for the 1-year period, the 4th quintile for the 3-year period and the 3rd quintile for the 5-year period. The Board also noted that the Fund’s performance was in line with its benchmark for the 1-year period and above its benchmark for the 3- and 5-year periods. The Board considered that, in response to questions raised concerning the Fund’s performance, HFMC stated that it has confidence in the Fund’s portfolio management team and investment strategy.
The Board considered the detailed investment analytics reports provided by Hartford Funds’ Investment Advisory Group throughout the year. These reports include, among other things, information on the Fund’s gross and net returns, the Fund’s investment performance relative to an appropriate benchmark and peer group, various statistics concerning the Fund’s portfolio, and a narrative summary of various factors affecting Fund performance. The Board considered the Advisers’ cooperation with the Investment Committee, which assists the Board in evaluating the performance of the Fund at periodic meetings throughout the year. The Board also considered the analysis provided by the Consultant relating to the Fund’s performance track record.
In light of all the considerations noted above, the Board concluded that it had continued confidence in HFMC’s and the Sub-adviser’s overall capabilities to manage the Fund.
Costs of the Services and Profitability of the Advisers
The Board reviewed information regarding HFMC’s cost to provide investment management and related services to the Fund and HFMC’s profitability, both overall and for the Fund, on a pre-tax basis without regard to distribution expenses. The Board also requested and reviewed information about the profitability to HFMC and its affiliates from all services provided to the Fund and
| 31 |
| Hartford International Opportunities HLS Fund |
| Approval of Investment Management and Investment Sub-Advisory Agreements (Unaudited) – (continued) |
all aspects of their relationship with the Fund. The Board also requested and received information relating to the operations and profitability of the Sub-adviser.
The Board considered the Consultant’s review of the profitability calculations utilized by HFMC in connection with the continuation of the investment management agreement, noting the Consultant’s view that Hartford Funds’ process for calculating and reporting Fund profitability is reasonable. In this regard, the Board noted that the Consultant had previously performed a full review of this process and reported that such process is sound and well within common industry practice.
Based on these considerations, the Board concluded that the profits anticipated to be realized by the Advisers and their affiliates from their relationships with the Fund would not be excessive.
Comparison of Fees and Services Provided by the Advisers
The Board considered comparative information with respect to the management fees to be paid by the Fund to HFMC and the total expense ratios of the Fund. The Board also considered comparative information with respect to the sub-advisory fees to be paid by HFMC to the Sub-adviser. In this regard, the Board requested and reviewed information from HFMC and the Sub-adviser relating to the management and sub-advisory fees, including the sub-advisory fee schedule for the Fund, and total operating expenses for the Fund. The Board considered that the management fee for the Fund includes the fee paid to HLIC for providing certain administrative services to the Fund. With respect to the sub-advisory fee schedule, the Board considered representations from HFMC and the Sub-adviser that the Sub-adviser’s fees were negotiated at arm’s length. The Board also reviewed information from Lipper comparing the Fund’s contractual management fees, actual management fees and overall expense ratios relative to a group of funds selected by Lipper, in consultation with the Consultant, and a broader universe of funds selected by Lipper. The Board noted that the Fund’s contractual management fee, actual management fee and total expenses (less 12b-1 and shareholder service fees) were in the 1st quintile of its expense group.
While the Board recognized that comparisons between the Fund and peer funds are imprecise, given the differing service levels and characteristics of mutual funds and the different business models and cost structures of the Advisers, the comparative information provided by Lipper assisted the Board in evaluating the reasonableness of the Fund’s management and sub-advisory fees and total operating expenses. In addition, the Board considered the analysis and recommendations of the Consultant relating to the Fund’s management and sub-advisory fees and total operating expenses.
Based on these considerations, the Board concluded that the Fund’s fees and total operating expenses, in conjunction with the information about quality of services, profitability, economies of scale, and other matters discussed, were reasonable in light of the services provided.
Economies of Scale
The Board requested and considered information regarding the Advisers’ realization of economies of scale with respect to the Fund and whether the fee levels reflect these economies of scale for the benefit of the Fund’s shareholders. The Board reviewed the breakpoints in the management fee schedule for the Fund, which reduce fee rates as Fund assets grow over time. The Board recognized that a fund with assets beyond the last breakpoint level will continue to benefit from economies of scale because additional assets are charged the lowest breakpoint fee resulting in lower overall effective management fee rates. The Board also recognized that a fee schedule that reaches a lower breakpoint quickly provides shareholders with the benefit of anticipated or potential economies of scale. The Board noted the effect of the sale and run-off of the variable annuity business on the HLS Funds.
The Board reviewed and evaluated materials from Lipper showing how management fee schedules of peer funds reflect economies of scale for the benefit of shareholders as a peer fund’s assets hypothetically increase over time. Based on information provided by HFMC, Lipper, and the Consultant, the Board recognized that there is no uniform methodology for establishing breakpoints or uniform pattern in asset levels that trigger breakpoints or the amounts of breakpoints triggered.
After considering all of the information available to it, the Board concluded that it was satisfied with the extent to which economies of scale would be shared for the benefit of the Fund’s shareholders based on currently available information and the
| 32 |
effective advisory fees and expense ratios for the Fund at its current and reasonably anticipated asset levels. The Board noted, however, that it would continue to monitor future growth in Fund assets and the appropriateness of additional breakpoints.
Other Benefits
The Board considered other benefits to the Advisers and their affiliates from their relationships with the Fund, including the role of the Fund in supporting the variable life insurance and variable annuity products offered by The Hartford.
The Board reviewed information noting that HLIC, an affiliate of HFMC, receives fees for providing certain administrative services to the Fund and that HFMC receives fees for fund accounting and related services from the Fund. The Board considered information on profits to HLIC and HFMC for such services. The Board also considered that Hartford Administrative Services Company (“HASCO”), the Fund’s transfer agent and an affiliate of HFMC, receives transfer agency compensation from the Fund, and the Board reviewed information on the profitability of the Fund’s transfer agency function to HASCO. The Board considered information provided by HASCO indicating that the transfer agent fees charged by HASCO to the Fund were fair and reasonable based on publicly available information.
The Board also considered that Hartford Funds Distributors, LLC (“HFD”), an affiliate of HFMC, serves as principal underwriter of the Fund. As principal underwriter, HFD receives 12b-1 fees from the Fund. The Board also noted that certain affiliates of HFD distribute shares of the Fund and receive compensation in that connection.
The Board considered benefits to the Sub-adviser from its use of the Fund’s brokerage commissions to obtain soft dollar research, and representations from HFMC and the Sub-adviser that the Sub-adviser would not make any revenue-sharing payments or any other type of distribution payments to HFMC or its affiliates.
The Board considered the benefits to shareholders of being part of the Hartford Funds family of funds. The Board considered HFMC’s efforts to provide investors in the family with a broad range of investment styles and asset classes.
* * * *
Based upon its review of these various factors, among others, the Board concluded that it is in the best interests of the Fund and its shareholders for the Board to approve the Agreements for an additional year. In reaching this decision, the Board did not assign relative weights to the factors discussed above or deem any one or group of them to be controlling in and of themselves. In connection with their deliberations, the Independent Directors met separately in executive session on several occasions, with independent legal counsel and the Consultant, to review the relevant materials and consider their responsibilities under relevant laws and regulations.
| 33 |
| Hartford International Opportunities HLS Fund |
| Main Risks (Unaudited) |
The main risks of investing in the Fund are described below.
Market, Selection, and Strategy Risk: The Fund’s share price may fluctuate due to market risk and/or security selections that may underperform the market or relevant benchmarks. If the sub-adviser’s investment strategy does not perform as expected, the Fund could underperform its peers or lose money. There is no guarantee the Fund will achieve its stated objective.
Foreign Investment and Emerging Markets Risk: Foreign investments can be riskier than U.S. investments. Potential risks include currency risk that may result from unfavorable exchange rates, liquidity risk if decreased demand for a security makes it difficult to sell at the desired price, and risks that stem from substantially lower trading volume on foreign markets. These risks are generally greater for investments in emerging markets, which are also subject to greater price volatility, and custodial and regulatory risks.
Mid-cap Stock Risk: Mid-cap stocks are generally more volatile and risky and may be less liquid than large-cap stocks because they may have limited operating histories, narrow product lines, and focus on niche markets.
Active Trading Risk: Actively trading investments may result in higher costs (thus affecting performance).
| 34 |
THIS PRIVACY POLICY IS NOT PART OF THIS REPORT
Privacy Policy and Practices of The Hartford Financial Services Group, Inc. and its Affiliates
(herein called “we, our, and us”)
This Privacy Policy applies to our United States Operations
We value your trust. We are committed to the responsible: a) management; b) use; and c) protection; of Personal Information. This notice describes how we collect, disclose, and protect Personal Information.
We collect Personal Information to: a) service your Transactions with us; and b) support our business functions.
We may obtain Personal Information from: a) You; b) your Transactions with us; and c) third parties such as a consumer-reporting agency.
Based on the type of product or service You apply for or get from us, Personal Information such as: a) your name; b) your address; c) your income; d) your payment; or e) your credit history; may be gathered from sources such as applications, Transactions, and consumer reports.
To serve You and service our business, we may share certain Personal Information. We will share Personal Information, only as allowed by law, with affiliates such as: a) our insurance companies; b) our employee agents; c) our brokerage firms; and d) our administrators.
As allowed by law, we may share Personal Financial Information with our affiliates to: a) market our products; or b) market our services; to You without providing You with an option to prevent these disclosures. | We may also share Personal Information, only as allowed by law, with unaffiliated third parties including:
When allowed by law, we may share certain Personal Financial Information with other unaffiliated third parties who assist us by performing services or functions such as:
We, and third parties we partner with, may track some of the pages You visit through the use of: a) cookies; b) pixel tagging; or c) other technologies; and currently do not process or comply with any web browser’s “do not track” signal or similar mechanism that indicates a request to disable online tracking of individual users who visit our websites or use our services.
We will not sell or share your Personal Financial Information with anyone for purposes unrelated to our business functions without offering You the opportunity to:
We only disclose Personal Health Information with:
Our employees have access to Personal Information in the course of doing their jobs, such as: |
We use manual and electronic security procedures to maintain: a) the confidentiality; and b) the integrity of; Personal Information that we have. We use these procedures to guard against unauthorized access.
Some techniques we use to protect Personal Information include: a) secured files; b) user authentication; c) encryption; d) firewall technology; and e) the use of detection software.
We are responsible for and must: a) identify information to be protected; b) provide an adequate level of protection for that data; c) grant access to protected data only to those people who must use it in the performance of their job-related duties. Employees who violate our Privacy Policy will be subject to discipline, which may include ending their employment with us.
At the start of our business relationship, we will give You a copy of our current Privacy Policy.
We will also give You a copy of our current Privacy Policy once a year if You maintain a continuing business relationship with us.
We will continue to follow our Privacy Policy regarding Personal Information even when a business relationship no longer exists between us. | As used in this Privacy Notice:
Application means your request for our product or service.
Personal Financial Information means financial information such as:
Personal Health Information means health information such as:
Personal Information means information that identifies You personally and is not otherwise available to the public. It includes:
Transaction means your business dealings with us, such as:
You means an individual who has given us Personal Information in conjunction with: |
This Privacy Policy is being provided on behalf of the following affiliates of The Hartford Financial Services Group, Inc.:
1stAGChoice, Inc.; Access CoverageCorp, Inc.; Access CoverageCorp Technologies, Inc.; American Maturity Life Insurance Company; Archway 60 R, LLC; Business Management Group, Inc.; Catalyst360, LLC; Champlain Life Reinsurance Company; DMS R, LLC; Eloy R, LLC; Ersatz Corporation; First State Insurance Company; Hartford Accident and Indemnity Company; Hartford Administrative Services Company; Hartford Casualty General Agency, Inc.; Hartford Casualty Insurance Company; Hartford-Comprehensive Employee Benefit Service Company; Hartford Equity Sales Company, Inc.; Hartford Fire General Agency, Inc.; Hartford Fire Insurance Company; Hartford Funds Management Company, LLC; Hartford Funds Management Group, Inc.; Hartford HLS Series Fund II, Inc.; Hartford Insurance Company of Illinois; Hartford Insurance Company of the Midwest; Hartford Insurance Company of the Southeast; Hartford Integrated Technologies, Inc.; Hartford International Life Reassurance Corporation; Hartford Funds Distributors, LLC; Hartford Investment Management Company; Hartford Life and Accident Insurance Company; Hartford Life and Annuity Insurance Company; Hartford Life Insurance Company; Hartford Life Private Placement, LLC; Hartford Lloyd’s Corporation; Hartford Lloyd’s Insurance Company; Hartford Mezzanine Investors I, LLC; Hartford Residual Market, L.C.C.; Hartford Retirement Services, LLC; Hartford Securities Distribution Company, Inc.; Hartford Series Fund, Inc.; Hartford Specialty Insurance Services of Texas, LLC; Hartford Strategic Investments, LLC; Hartford Underwriters Insurance Company; Hartford Technology Services Company, L.L.C.; Hartford of Texas General Agency, Inc.; Hartford Underwriters General Agency, Inc.; HARTRE Company, L.C.C.; HL Investment Advisors, LLC; HLA LLC; Horizon Management Group, LLC; HRA Brokerage Services, Inc.; Lanidex Class B, LLC; M-CAP Insurance Agency, LLC; New England Insurance Company; New England Reinsurance Corporation; Nutmeg Insurance Agency, Inc.; Nutmeg Insurance Company; Pacific Insurance Company, Limited; Planco, LLC: Property and Casualty Insurance Company of Hartford; Revere R, LLC; RVR R, LLC; Sentinel Insurance Company, Ltd.; Sunstone R, LLC; Symphony R, LLC; The Evergreen Group Incorporated; The Hartford Alternative Strategies Fund; The Hartford Mutual Funds, Inc.; The Hartford Mutual Funds II, Inc.; Trumbull Flood Management, L.L.C.; Trumbull Insurance Company; Twin City Fire Insurance Company; White River Life Reinsurance Company.
HPP Revised December 2013
HARTFORD HLS FUNDS
c/o The Hartford Wealth Management - Global Annuities
P.O. Box 14293
Lexington, KY 40512-4293
HARTFORDFUNDS
hartfordfunds.com
Hartford Series Fund, Inc. is underwritten and distributed by Hartford Funds Distributors, LLC.
Hartford Series Fund, Inc. inception dates range from 1977 to date. Hartford Series Fund, Inc. is not a subsidiary of The Hartford Financial Services Group, Inc. ("The Hartford") but is underwritten, distributed by and advised by subsidiaries of The Hartford. Investments in Hartford Series Fund, Inc. are not guaranteed by The Hartford or any other entity.
This report is submitted for the general information of the shareholders of the Funds. It is not authorized for distribution unless preceded or accompanied by a current prospectus for the Funds.
Investors should carefully consider the investment objectives, risks, charges, and expenses of Hartford Funds before investing. This and other information can be found in the prospectus and summary prospectus, which can be obtained by calling 888-843-7824 (retail) or 877-836-5854 (institutional). Investors should read them carefully before they invest.
HLSAR-IO13 2-14 113546-2 Printed in U.S.A ©2013 The Hartford, Hartford, CT 06115
HARTFORDFUNDS
| HARTFORD MIDCAP HLS FUND
2013 Annual Report
|
A MESSAGE FROM THE PRESIDENT
Dear Fellow Shareholders:
Thank you for investing in Hartford HLS Funds.
Market Review
U.S. equities (as represented by the S&P 500 Index) generated their strongest year since 1997 in 2013, rising 32.39% for the year. During the fourth quarter, equities rose without looking back, pushing the S&P 500 Index and the Dow Jones Industrial Average to new all-time highs. Despite previously cheering delays to quantitative-easing tapering, the stock market received an additional boost at the end of the year following the U.S. Federal Reserve’s (Fed) announcement of a $10-billion-a-month reduction in bond purchases beginning in January.
The Fed’s decision to begin tapering its bond purchases is generally considered a vote of confidence in the recovering U.S. economy. Consumer spending has stabilized, the housing market is showing steady improvement, the unemployment rate is slowly declining and economic growth clocked in at a healthy 4.1% in the third quarter. Equities have also recovered since the market low in March 2009: The S&P 500 Index has gained 173% from the market low through December 31, 2013.
Signs of improvement are also visible outside the U.S. Europe appears to have begun its own economic recovery, and emerging markets have reversed their recent lackluster performance. Fiscal policy continues to wield significant influence in today’s economy and central banks across the globe are maintaining their accommodative stances, including the appointment of Janet Yellen, who is widely expected to continue current monetary policies, to succeed Ben Bernanke as U.S. Federal Reserve chairman.
It’s important to stay abreast of domestic and international economic developments while balancing your individual investment goals. Meeting with your financial advisor on a regular basis to examine your current investment strategy can help you determine whether you are on the right track:
| • | Is your portfolio fully diversified with an appropriate mix of stocks and bonds? |
| • | Is your portfolio incorporating both domestic and international holdings to take advantage of the global economic recovery? |
| • | Are your investments still in line with your risk tolerance and investment time horizon? |
Your financial advisor can help you choose options within our fund family to navigate today’s markets with confidence.
Thank you again for investing with Hartford HLS Funds.
James Davey
President
Hartford HLS Funds
1The S&P 500 Index is a market capitalization-weighted price index composed of 500 widely held common stocks.
2The Dow Jones Industrial Average is an unmanaged, price-weighted index of 30 of the largest, most widely held stocks traded on the New York Stock Exchange.
Hartford MidCap HLS Fund
This report is prepared for the general information of contract owners and qualified retirement plan participants. It is not an offer of contracts or of qualified retirement plans. It should not be used in connection with any offer, except in conjunction with the appropriate product prospectus which contains all pertinent information including the applicable sales, administrative and other charges.
The views expressed in the Fund’s Manager Discussion under ‘‘Why did the Fund perform this way?’’ and ‘‘What is the outlook?’’ are views of the Fund’s sub-adviser and portfolio management team through the end of the period and are subject to change based on market and other conditions. The Fund’s Manager Discussion is for informational purposes only and does not represent an offer, recommendation or solicitation to buy, hold or sell any security. The specific securities identified and described, if any, do not represent all of the securities purchased or sold and you should not assume that investments in the securities identified and discussed will be profitable.
| Hartford MidCap HLS Fund* inception 07/14/1997 |
| (sub-advised by Wellington Management Company, LLP) |
| Investment objective – Seeks long-term growth of capital. |
Performance Overview 12/31/03 - 12/31/13

The chart above represents the hypothetical growth of a $10,000 investment in Class IA. Growth results in classes other than Class IA will vary from what is seen above due to differences in the expenses charged to those share classes.
Average Annual Total Returns (as of 12/31/13)
| 1 Year | 5 Years | 10 Years | ||||||||||
| MidCap IA | 39.82 | % | 19.98 | % | 10.91 | % | ||||||
| MidCap IB | 39.46 | % | 19.67 | % | 10.63 | % | ||||||
| S&P MidCap 400 Index | 33.50 | % | 21.89 | % | 10.36 | % | ||||||
PERFORMANCE DATA QUOTED REPRESENTS PAST PERFORMANCE AND DOES NOT GUARANTEE FUTURE RESULTS. The investment return and principal value of the investment will fluctuate so that investors’ shares, when redeemed, may be worth more or less than their original cost. Current performance may be lower or higher than the performance data quoted. To obtain performance data current to the most recent month-end, please visit our website at www.hartfordfunds.com.
Total returns presented above were calculated using the Fund’s net asset value available to shareholders for sale or redemption of Fund shares on December 31, 2013, which may exclude investment transactions as of this date. All share class returns assume the reinvestment of all distributions at net asset value and the deduction of all fund expenses.
S&P MidCap 400 Index is an unmanaged index of common stocks of companies chosen by S&P designed to represent price movements in the mid-cap U.S. equity market.
You cannot invest directly in an index.
As of the Fund's current prospectus dated May 1, 2013, the total annual operating expense ratios for Class IA and Class IB were 0.71% and 0.96%, respectively. Actual expenses may be higher. Please see the accompanying Financial Highlights for expense ratios for the year ended December 31, 2013.
The chart and table do not reflect the deductions of taxes, sales charges or other fees which may be applied at the variable life insurance, variable annuity or qualified retirement plan product level. Any such additional sales charges or other fees or expenses would lower the contract’s or plan’s performance.
All investments are subject to risk including the possible loss of principal. For a discussion of the Fund’s risks, please see the Main Risks section of this report. For more detailed information on the risks associated with an investment in the Fund, please see the prospectus.
* The Fund has restrictions on the purchase of shares. A description of the restrictions can be found in the prospectus.
| 2 |
| Hartford MidCap HLS Fund |
| Manager Discussion |
| December 31, 2013 (Unaudited) |
| Portfolio Managers | |
| Philip W. Ruedi, CFA | Mark A. Whitaker, CFA |
| Senior Vice President and Equity Portfolio Manager | Vice President and Equity Portfolio Manager |
How did the Fund perform?
The Class IA shares of the Hartford MidCap HLS Fund returned 39.82% for the twelve-month period ended December 31, 2013, outperforming the Fund’s benchmark, the S&P MidCap 400 Index, which returned 33.50% for the same period. The Fund also outperformed the 34.68% average return of the Variable Products-Underlying Funds Lipper Mid-Cap Core Funds peer group, a group of funds with investment strategies similar to those of the Fund.
Why did the Fund perform this way?
U.S. equities reached another all-time high in December and finished 2013 with a gain of 33.5%, as measured by the S&P MidCap 400 Index. The rally in U.S. equities began on the first trading day of the year after a last-minute compromise by the U.S. Congress averted the fiscal cliff. Optimism surrounding the fiscal reprieve was furthered during the first quarter by better-than-expected corporate earnings, a robust housing market, and a steadily improving employment picture. Solid gains in April and the first part of May paused following comments by U.S. Federal Reserve (Fed) Chairman Ben Bernanke that suggested the Fed might begin to slow quantitative easing sooner than investors anticipated. Nonetheless, equities resumed their ascent in the third quarter as the surprising “no taper” decision by the Federal Open Market Committee eased near-term concerns about rapidly rising interest rates derailing the recovery. Additionally, accommodative rhetoric from the European Central Bank, along with encouraging data in China and further evidence of a European economic recovery, contributed to a broad-based global equity rally that extended through the end of the year. In December, the year ended with an optimistic tone as investors cheered the elimination of two market overhangs: the timing of Fed tapering and the threat of another US government shutdown in early 2014.
Small cap stocks (+39%) outperformed mid cap stocks (+34%) and large cap stocks (+32%) during the period, as measured by the Russell 2000, S&P MidCap 400, and S&P 500 Indices, respectively. Within the S&P MidCap 400 Index, all ten sectors posted positive returns during the twelve-month period. The Health Care (+46.0%), Industrials (+43.9%), and Consumer Discretionary (+42.1%) sectors performed best while the Telecommunication Services (+19.4%), Materials (+24.6%) and Financials (+25.1%) sectors lagged on a relative basis.
Outperformance versus the benchmark during the period was driven by strong security selection in the Health Care, Financials, Information Technology sectors, which more than offset weak stock selection in the Energy, Industrials, and Utilities sectors. Sector allocation, which is a residual of our bottom-up stock selection process, also contributed to relative outperformance during the period primarily driven by our overweight allocation to Health Care and an underweight allocation to Financials.
Top contributors to relative performance during the period were Actavis (Health Care), Incyte (Health Care), and Alkermes (Health Care). Actavis is a global, integrated specialty pharmaceutical company and the third largest generics producer. Shares moved higher after Valeant Pharmaceuticals initiated merger discussions with the company. Management rejected the offer but completed a merger agreement with Warner-Chilcott. Shares of Incyte, a drug developer focused on the treatment of cancers, myelofibrosis, and inflammation, rose on the announcement of favorable test results for the Jakafi drug. Jakafi is a drug that used to treat myelofibrosis, a bone marrow disorder that affects the body's ability to produce blood cells. Shares of Alkermes, a U.S.-based drug developer, rose as a result of strong growth in its base revenues, which consist of manufacturing and royalty revenues. Manpowergroup (Industrials) was also a top contributor to absolute performance during the period.
Top detractors from relative performance during the period were Cobalt International Energy (Energy), Weight Watchers (Consumer Discretionary), and CH Robinson Worldwide (Industrials). U.S. oil and gas exploration company Cobalt saw its shares fall as a result of disappointing well test results at the company’s Lontra well off the coast of Angola. Weight Watchers is a global-branded consumer company and provider of weight management services. Shares declined after the company lowered its earnings guidance to a range more in line with analysts’ estimates. We exited the position. Provider of freight transportation services and logistics solutions, CH Robinson Worldwide, saw shares fall after the company announced disappointing earnings, attributed to a slow volume recovery. We eliminated the position during the period. Newfield Exploration (Energy) also detracted from absolute performance during the period.
| 3 |
| Hartford MidCap HLS Fund |
| Manager Discussion – (continued) |
| December 31, 2013 (Unaudited) |
Derivatives are not used in a significant manner in this Fund and did not have a material impact on performance during the period.
What is the outlook?
Looking forward to 2014, we are enthusiastic about the holdings in our portfolio. Through our F/V/E framework, which we use to assess each company’s fundamentals (F), valuation (V), and expectations (E), several investment themes have emerged in the portfolio. Health care and social media were among key themes in the portfolio as of year-end. The mid cap asset class remains compelling, presenting a universe of companies that we believe are in the “sweet spot” of their growth cycles.
At the end of the period, our largest overweights, relative to the benchmark, were in the Health Care and Information Technology sectors. Our largest underweights were in the Financials and Materials sectors.
Diversification by Sector
as of December 31, 2013
| Sector | Percentage of Net Assets | |||
| Equity Securities | ||||
| Consumer Discretionary | 13.0 | % | ||
| Consumer Staples | 2.5 | |||
| Energy | 8.8 | |||
| Financials | 12.4 | |||
| Health Care | 19.4 | |||
| Industrials | 19.8 | |||
| Information Technology | 20.0 | |||
| Materials | 1.9 | |||
| Utilities | 2.0 | |||
| Total | 99.8 | % | ||
| Short-Term Investments | 0.3 | |||
| Other Assets and Liabilities | (0.1 | ) | ||
| Total | 100.0 | % | ||
A sector may be comprised of several industries. For Fund compliance purposes, the Fund may not use the same classification system and these sector classifications are used for reporting ease.
| 4 |
| Hartford MidCap HLS Fund |
| Schedule of Investments |
| December 31, 2013 |
| (000’s Omitted) |
| Shares or Principal Amount | Market Value ╪ | |||||||
COMMON STOCKS - 99.8% | ||||||||
| Automobiles and Components - 3.0% | ||||||||
| 709 | Allison Transmission Holdings, Inc. | $ | 19,566 | |||||
| 391 | Harley-Davidson, Inc. | 27,074 | ||||||
| 46,640 | ||||||||
| Banks - 3.8% | ||||||||
| 89 | Cullen/Frost Bankers, Inc. | 6,611 | ||||||
| 191 | East West Bancorp, Inc. | 6,666 | ||||||
| 301 | First Republic Bank | 15,783 | ||||||
| 260 | M&T Bank Corp. | 30,215 | ||||||
| 59,275 | ||||||||
| Capital Goods - 8.8% | ||||||||
| 246 | IDEX Corp. | 18,138 | ||||||
| 350 | Jacobs Engineering Group, Inc. ● | 22,070 | ||||||
| 360 | Lennox International, Inc. | 30,624 | ||||||
| 268 | MSC Industrial Direct Co., Inc. | 21,688 | ||||||
| 318 | PACCAR, Inc. | 18,805 | ||||||
| 159 | Pall Corp. | 13,552 | ||||||
| 133 | Wabco Holdings, Inc. ● | 12,435 | ||||||
| 137,312 | ||||||||
| Commercial and Professional Services - 8.2% | ||||||||
| 318 | Clean Harbors, Inc. ● | 19,044 | ||||||
| 487 | Equifax, Inc. ● | 33,679 | ||||||
| 272 | Manpowergroup, Inc. | 23,326 | ||||||
| 711 | Robert Half International, Inc. | 29,848 | ||||||
| 534 | Waste Connections, Inc. | 23,286 | ||||||
| 129,183 | ||||||||
| Consumer Durables and Apparel - 1.6% | ||||||||
| 25 | NVR, Inc. ● | 25,641 | ||||||
| Diversified Financials - 4.3% | ||||||||
| 148 | Greenhill & Co., Inc. | 8,591 | ||||||
| 264 | Invesco Ltd. | 9,595 | ||||||
| 181 | Moody's Corp. | 14,179 | ||||||
| 658 | SEI Investments Co. | 22,847 | ||||||
| 148 | T. Rowe Price Group, Inc. | 12,426 | ||||||
| 67,638 | ||||||||
| Energy - 8.8% | ||||||||
| 228 | Cabot Oil & Gas Corp. | 8,826 | ||||||
| 770 | Cobalt International Energy, Inc. ● | 12,668 | ||||||
| 397 | Consol Energy, Inc. | 15,095 | ||||||
| 615 | Denbury Resources, Inc. ● | 10,112 | ||||||
| 114 | Energen Corp. | 8,041 | ||||||
| 172 | EQT Corp. | 15,420 | ||||||
| 156 | Oceaneering International, Inc. | 12,313 | ||||||
| 548 | Patterson-UTI Energy, Inc. | 13,872 | ||||||
| 37 | Pioneer Natural Resources Co. | 6,874 | ||||||
| 204 | Range Resources Corp. | 17,167 | ||||||
| 677 | Superior Energy Services, Inc. ● | 18,024 | ||||||
| 138,412 | ||||||||
| Food and Staples Retailing - 0.6% | ||||||||
| 77 | PriceSmart, Inc. | 8,929 | ||||||
| Food, Beverage and Tobacco - 1.9% | ||||||||
| 259 | Molson Coors Brewing Co. | 14,557 | ||||||
| 228 | Monster Beverage Corp. ● | 15,434 | ||||||
| 29,991 | ||||||||
| Health Care Equipment and Services - 5.0% | ||||||||
| 1,027 | Allscripts Healthcare Solutions, Inc. ● | 15,880 | ||||||
| 107 | Envision Healthcare Holdings ● | 3,805 | ||||||
| 56 | MEDNAX, Inc. ● | 2,973 | ||||||
| 54 | Omnicare, Inc. | 3,234 | ||||||
| 407 | Patterson Cos., Inc. | 16,760 | ||||||
| 200 | Sirona Dental Systems, Inc. ● | 14,035 | ||||||
| 67 | Team Health Holdings ● | 3,039 | ||||||
| 220 | Universal Health Services, Inc. Class B | 17,898 | ||||||
| 77,624 | ||||||||
| Insurance - 4.1% | ||||||||
| 48 | Alleghany Corp. ● | 19,082 | ||||||
| 28 | Fairfax Financial Holdings Ltd. | 11,303 | ||||||
| 39 | Markel Corp. ● | 22,675 | ||||||
| 261 | W.R. Berkley Corp. | 11,326 | ||||||
| 64,386 | ||||||||
| Materials - 1.9% | ||||||||
| 195 | Packaging Corp. of America | 12,363 | ||||||
| 49 | Sherwin-Williams Co. | 8,927 | ||||||
| 169 | Silgan Holdings, Inc. | 8,108 | ||||||
| 29,398 | ||||||||
| Media - 1.4% | ||||||||
| 352 | DreamWorks Animation SKG, Inc. ● | 12,494 | ||||||
| 367 | Pandora Media, Inc. ● | 9,764 | ||||||
| 22,258 | ||||||||
| Pharmaceuticals, Biotechnology and Life Sciences - 14.4% | ||||||||
| 231 | Actavis plc ● | 38,815 | ||||||
| 820 | Alkermes plc ● | 33,356 | ||||||
| 162 | Alnylam Pharmaceuticals, Inc. ● | 10,389 | ||||||
| 277 | Cubist Pharmaceuticals, Inc. ● | 19,067 | ||||||
| 118 | Illumina, Inc. ● | 13,026 | ||||||
| 372 | Incyte Corp. ● | 18,827 | ||||||
| 641 | Ironwood Pharmaceuticals, Inc. ● | 7,447 | ||||||
| 197 | Medivation, Inc. ● | 12,542 | ||||||
| 618 | Mylan, Inc. ● | 26,808 | ||||||
| 154 | Salix Pharmaceuticals Ltd. ● | 13,847 | ||||||
| 230 | Vertex Pharmaceuticals, Inc. ● | 17,103 | ||||||
| 150 | Waters Corp. ● | 14,975 | ||||||
| 226,202 | ||||||||
| Real Estate - 0.2% | ||||||||
| 40 | Zillow, Inc. ● | 3,262 | ||||||
| Retailing - 7.0% | ||||||||
| 297 | Advance Automotive Parts, Inc. | 32,897 | ||||||
| 418 | CarMax, Inc. ● | 19,655 | ||||||
| 421 | HomeAway, Inc. ● | 17,204 | ||||||
| 97 | Joseph A. Bank Clothiers, Inc. ● | 5,294 | ||||||
| 92 | Tiffany & Co. | 8,570 | ||||||
| 319 | TripAdvisor, Inc. ● | 26,428 | ||||||
| 110,048 | ||||||||
| Semiconductors and Semiconductor Equipment - 2.5% | ||||||||
| 559 | Maxim Integrated Products, Inc. | 15,595 | ||||||
| 504 | NXP Semiconductors N.V. ● | 23,139 | ||||||
| 38,734 | ||||||||
| Software and Services - 13.2% | ||||||||
| 309 | Akamai Technologies, Inc. ● | 14,561 | ||||||
| 156 | ANSYS, Inc. ● | 13,632 | ||||||
| 374 | Autodesk, Inc. ● | 18,816 | ||||||
| 90 | Factset Research Systems, Inc. | 9,817 | ||||||
| 138 | Gartner, Inc. Class A ● | 9,837 | ||||||
| 1,820 | Genpact Ltd. ● | 33,426 | ||||||
| 199 | Informatica Corp. ● | 8,252 | ||||||
| 327 | Micros Systems, Inc. ● | 18,774 | ||||||
The accompanying notes are an integral part of these financial statements.
| 5 |
| Hartford MidCap HLS Fund |
| Schedule of Investments – (continued) |
| December 31, 2013 |
| (000’s Omitted) |
| Shares or Principal Amount | Market Value ╪ | |||||||||||
| COMMON STOCKS - 99.8% - (continued) | ||||||||||||
| Software and Services - 13.2% - (continued) | ||||||||||||
| 80 | Solera Holdings, Inc. | $ | 5,653 | |||||||||
| 927 | Vantiv, Inc. ● | 30,239 | ||||||||||
| 225 | VeriSign, Inc. ● | 13,440 | ||||||||||
| 221 | WEX, Inc. ● | 21,933 | ||||||||||
| 114 | Yelp, Inc. ● | 7,872 | ||||||||||
| 206,252 | ||||||||||||
| Technology Hardware and Equipment - 4.3% | ||||||||||||
| 167 | Amphenol Corp. Class A | 14,911 | ||||||||||
| 83 | FEI Co. | 7,444 | ||||||||||
| 522 | National Instruments Corp. | 16,725 | ||||||||||
| 802 | Trimble Navigation Ltd. ● | 27,828 | ||||||||||
| 66,908 | ||||||||||||
| Transportation - 2.8% | ||||||||||||
| 472 | Expeditors International of Washington, Inc. | 20,889 | ||||||||||
| 114 | Genesee & Wyoming, Inc. Class A ● | 10,953 | ||||||||||
| 155 | J.B. Hunt Transport Services, Inc. | 12,020 | ||||||||||
| 43,862 | ||||||||||||
| Utilities - 2.0% | ||||||||||||
| 135 | Northeast Utilities | 5,716 | ||||||||||
| 445 | UGI Corp. | 18,470 | ||||||||||
| 164 | Wisconsin Energy Corp. | 6,761 | ||||||||||
| 30,947 | ||||||||||||
| Total common stocks | ||||||||||||
| (cost $1,104,479) | $ | 1,562,902 | ||||||||||
| Total long-term investments | ||||||||||||
| (cost $1,104,479) | $ | 1,562,902 | ||||||||||
| SHORT-TERM INVESTMENTS - 0.3% | ||||||||||||
| Repurchase Agreements - 0.3% | ||||||||||||
| Bank of America Merrill Lynch TriParty Repurchase Agreement (maturing on 01/02/2014 in the amount of $262, collateralized by GNMA 4.00%, 2043, value of $267) | ||||||||||||
| $ | 262 | 0.005%, 12/31/2013 | $ | 262 | ||||||||
| Bank of Montreal TriParty Repurchase Agreement (maturing on 01/02/2014 in the amount of $251, collateralized by FNMA 1.58% - 4.50%, 2020 - 2043, U.S. Treasury Note 0.25% - 4.00%, 2015 - 2020, value of $256) | ||||||||||||
| 251 | 0.01%, 12/31/2013 | 251 | ||||||||||
| Bank of Montreal TriParty Repurchase Agreement (maturing on 01/02/2014 in the amount of $890, collateralized by FHLMC 3.00% - 5.00%, 2019 - 2043, FNMA 0.76% - 6.00%, 2016 - 2043, GNMA 1.50% - 5.25%, 2028 - 2043, value of $908) | ||||||||||||
| 890 | 0.02%, 12/31/2013 | 890 | ||||||||||
| Barclays Capital TriParty Repurchase Agreement (maturing on 01/02/2014 in the amount of $803, collateralized by U.S. Treasury Note 0.50% - 2.25%, 2017, value of $819) | ||||||||||||
| 803 | 0.01%, 12/31/2013 | 803 | ||||||||||
| Citigroup Global Markets, Inc. TriParty Repurchase Agreement (maturing on 01/02/2014 in the amount of $1,445, collateralized by U.S. Treasury Bond 3.88% - 8.13%, 2021 - 2040, U.S. Treasury Note 0.25% - 3.38%, 2014 - 2020, value of $1,474) | ||||||||||||
| 1,445 | 0.01%, 12/31/2013 | 1,445 | ||||||||||
| RBS Securities, Inc. TriParty Repurchase Agreement (maturing on 01/02/2014 in the amount of $470, collateralized by U.S. Treasury Note 0.25% - 1.00%, 2015 - 2017, value of $479) | ||||||||||||
| 470 | 0.01%, 12/31/2013 | 470 | ||||||||||
| TD Securities TriParty Repurchase Agreement (maturing on 01/02/2014 in the amount of $1,127, collateralized by FFCB 0.20% - 0.50%, 2015 - 2016, FHLMC 0.38% - 5.25%, 2014 - 2042, FNMA 0.50% - 7.13%, 2014 - 2043, value of $1,150) | ||||||||||||
| 1,127 | 0.01%, 12/31/2013 | 1,127 | ||||||||||
| UBS Securities, Inc. Repurchase Agreement (maturing on 01/02/2014 in the amount of $10, collateralized by U.S. Treasury Note 2.13%, 2015, value of $10) | ||||||||||||
| 10 | 0.01%, 12/31/2013 | 10 | ||||||||||
| 5,258 | ||||||||||||
| Total short-term investments | ||||||||||||
| (cost $5,258) | $ | 5,258 | ||||||||||
| Total investments | ||||||||||||
| (cost $1,109,737) ▲ | 100.1 | % | $ | 1,568,160 | ||||||||
| Other assets and liabilities | (0.1 | )% | (2,051 | ) | ||||||||
| Total net assets | 100.0 | % | $ | 1,566,109 | ||||||||
The accompanying notes are an integral part of these financial statements.
| 6 |
| Note: | Percentage of investments as shown is the ratio of the total market value to total net assets. |
Prices of foreign equities that are principally traded on certain foreign markets may be adjusted daily pursuant to a fair value pricing service approved by the Board of Directors in order to reflect an adjustment for factors occurring after the close of certain foreign markets but before the close of the New York Stock Exchange.
| ▲ | At December 31, 2013, the cost of securities for federal income tax purposes was $1,114,726 and the aggregate gross unrealized appreciation and depreciation based on that cost were: |
| Unrealized Appreciation | $ | 464,579 | ||
| Unrealized Depreciation | (11,145 | ) | ||
| Net Unrealized Appreciation | $ | 453,434 |
| ● | Non-income producing. |
| ╪ | See Significant Accounting Policies of accompanying Notes to Financial Statements regarding valuation of securities. |
| GLOSSARY: (abbreviations used in preceding Schedule of Investments) | ||
| Other Abbreviations: | ||
| FFCB | Federal Farm Credit Bank | |
| FHLMC | Federal Home Loan Mortgage Corp. | |
| FNMA | Federal National Mortgage Association | |
| GNMA | Government National Mortgage Association | |
The accompanying notes are an integral part of these financial statements.
| 7 |
| Hartford MidCap HLS Fund |
| Investment Valuation Hierarchy Level Summary |
| December 31, 2013 |
| (000’s Omitted) |
| Total | Level 1 ♦ | Level 2 ♦ | Level 3 | |||||||||||||
| Assets: | ||||||||||||||||
| Common Stocks ‡ | $ | 1,562,902 | $ | 1,562,902 | $ | – | $ | – | ||||||||
| Short-Term Investments | 5,258 | – | 5,258 | – | ||||||||||||
| Total | $ | 1,568,160 | $ | 1,562,902 | $ | 5,258 | $ | – | ||||||||
| ♦ | For the year ended December 31, 2013, there were no transfers between Level 1 and Level 2. |
| ‡ | The Fund has all or primarily all of the equity securities categorized in a particular level. Refer to the Schedule of Investments for further industry breakout. |
| Note: | For purposes of reporting transfers between different hierarchy levels, both transfers in and out of each level, as applicable, are shown as if they occurred at the beginning of the period. |
The accompanying notes are an integral part of these financial statements.
| 8 |
| Hartford MidCap HLS Fund |
| Statement of Assets and Liabilities |
| December 31, 2013 |
| (000’s Omitted) |
| Assets: | ||||
| Investments in securities, at market value (cost $1,109,737) | $ | 1,568,160 | ||
| Cash | 7 | |||
| Receivables: | ||||
| Fund shares sold | 182 | |||
| Dividends and interest | 810 | |||
| Total assets | 1,569,159 | |||
| Liabilities: | ||||
| Payables: | ||||
| Investment securities purchased | 895 | |||
| Fund shares redeemed | 1,860 | |||
| Investment management fees | 233 | |||
| Distribution fees | 4 | |||
| Accrued expenses | 58 | |||
| Total liabilities | 3,050 | |||
| Net assets | $ | 1,566,109 | ||
| Summary of Net Assets: | ||||
| Capital stock and paid-in-capital | $ | 924,435 | ||
| Undistributed net investment income | 1,609 | |||
| Accumulated net realized gain | 181,642 | |||
| Unrealized appreciation of investments | 458,423 | |||
| Net assets | $ | 1,566,109 | ||
| Shares authorized | 2,400,000 | |||
| Par value | $ | 0.001 | ||
| Class IA: Net asset value per share | $ | 37.87 | ||
| Shares outstanding | 39,179 | |||
| Net assets | $ | 1,483,626 | ||
| Class IB: Net asset value per share | $ | 37.52 | ||
| Shares outstanding | 2,199 | |||
| Net assets | $ | 82,483 |
The accompanying notes are an integral part of these financial statements.
| 9 |
| Hartford MidCap HLS Fund |
| Statement of Operations |
| For the Year Ended December 31, 2013 |
| (000’s Omitted) |
| Investment Income: | ||||
| Dividends | $ | 14,032 | ||
| Interest | 3 | |||
| Total investment income, net | 14,035 | |||
| Expenses: | ||||
| Investment management fees | 10,426 | |||
| Transfer agent fees | 6 | |||
| Distribution fees - Class IB | 196 | |||
| Custodian fees | 17 | |||
| Accounting services fees | 153 | |||
| Board of Directors' fees | 39 | |||
| Audit fees | 22 | |||
| Other expenses | 159 | |||
| Total expenses (before fees paid indirectly) | 11,018 | |||
| Commission recapture | (23 | ) | ||
| Custodian fee offset | — | |||
| Total fees paid indirectly | (23 | ) | ||
| Total expenses, net | 10,995 | |||
| Net Investment Income | 3,040 | |||
| Net Realized Gain on Investments and Foreign Currency Transactions: | ||||
| Net realized gain on investments | 203,131 | |||
| Net realized gain on foreign currency contracts | 13 | |||
| Net realized loss on other foreign currency transactions | (14 | ) | ||
| Net Realized Gain on Investments and Foreign Currency Transactions | 203,130 | |||
| Net Changes in Unrealized Appreciation of Investments: | ||||
| Net unrealized appreciation of investments | 297,608 | |||
| Net Changes in Unrealized Appreciation of Investments | 297,608 | |||
| Net Gain on Investments and Foreign Currency Transactions | 500,738 | |||
| Net Increase in Net Assets Resulting from Operations | $ | 503,778 |
The accompanying notes are an integral part of these financial statements.
| 10 |
| Hartford MidCap HLS Fund |
| Statement of Changes in Net Assets |
| (000’s Omitted) |
| For the Year Ended December 31, 2013 | For the Year Ended December 31, 2012 | |||||||
| Operations: | ||||||||
| Net investment income | $ | 3,040 | $ | 11,454 | ||||
| Net realized gain on investments and foreign currency transactions | 203,130 | 115,900 | ||||||
| Net unrealized appreciation of investments | 297,608 | 113,137 | ||||||
| Net Increase in Net Assets Resulting from Operations | 503,778 | 240,491 | ||||||
| Distributions to Shareholders: | ||||||||
| From net investment income | ||||||||
| Class IA | (1,638 | ) | (10,752 | ) | ||||
| Class IB | (14 | ) | (400 | ) | ||||
| Total from net investment income | (1,652 | ) | (11,152 | ) | ||||
| From net realized gain on investments | ||||||||
| Class IA | (53,879 | ) | — | |||||
| Class IB | (3,100 | ) | — | |||||
| Total from net realized gain on investments | (56,979 | ) | — | |||||
| Total distributions | (58,631 | ) | (11,152 | ) | ||||
| Capital Share Transactions: | ||||||||
| Class IA | ||||||||
| Sold | 98,550 | 143,048 | ||||||
| Issued on reinvestment of distributions | 55,517 | 10,752 | ||||||
| Redeemed | (418,031 | ) | (257,552 | ) | ||||
| Total capital share transactions | (263,964 | ) | (103,752 | ) | ||||
| Class IB | ||||||||
| Sold | 11,537 | 15,835 | ||||||
| Issued on reinvestment of distributions | 3,114 | 400 | ||||||
| Redeemed | (25,943 | ) | (28,049 | ) | ||||
| Total capital share transactions | (11,292 | ) | (11,814 | ) | ||||
| Net decrease from capital share transactions | (275,256 | ) | (115,566 | ) | ||||
| Net Increase in Net Assets | 169,891 | 113,773 | ||||||
| Net Assets: | ||||||||
| Beginning of period | 1,396,218 | 1,282,445 | ||||||
| End of period | $ | 1,566,109 | $ | 1,396,218 | ||||
| Undistributed (distribution in excess of) net investment income | $ | 1,609 | $ | 260 | ||||
| Shares: | ||||||||
| Class IA | ||||||||
| Sold | 3,001 | 5,211 | ||||||
| Issued on reinvestment of distributions | 1,576 | 384 | ||||||
| Redeemed | (12,467 | ) | (9,535 | ) | ||||
| Total share activity | (7,890 | ) | (3,940 | ) | ||||
| Class IB | ||||||||
| Sold | 353 | 600 | ||||||
| Issued on reinvestment of distributions | 90 | 14 | ||||||
| Redeemed | (784 | ) | (1,049 | ) | ||||
| Total share activity | (341 | ) | (435 | ) | ||||
The accompanying notes are an integral part of these financial statements.
| 11 |
| Hartford MidCap HLS Fund |
| Notes to Financial Statements |
| December 31, 2013 |
| (000’s Omitted) |
| 1. | Organization: |
Hartford MidCap HLS Fund (the “Fund”) serves as an underlying investment option for certain variable annuity and variable life insurance separate accounts of Hartford Life Insurance Company (“HLIC”) and its affiliates and certain qualified retirement plans. The Fund may also serve as an underlying investment option for certain variable annuity and variable life separate accounts of other insurance companies. Owners of variable annuity contracts and policyholders of variable life insurance contracts may choose the funds permitted in the variable insurance contract prospectus. In addition, participants in certain qualified retirement plans may choose the Fund if permitted by their plans.
Hartford Series Fund, Inc. (the “Company”) is an open-end registered management investment company comprised of thirty portfolios. Financial statements for the Fund, a series of the Company, are included in this report.
The Company is organized under the laws of the State of Maryland and is registered with the Securities and Exchange Commission (“SEC”) under the Investment Company Act of 1940, as amended (“1940 Act”). The Fund is a diversified open-end management investment company.
The Fund is divided into Class IA and Class IB shares. Each class is offered at the per share net asset value (“NAV”) without a sales charge and is subject to the same expenses, except that the Class IB shares are subject to distribution and service fees charged pursuant to a Distribution Plan adopted in accordance with Rule 12b-1 under the 1940 Act.
| 2. | Significant Accounting Policies: |
The following is a summary of significant accounting policies of the Fund in the preparation of its financial statements, which are in accordance with United States Generally Accepted Accounting Principles (“U.S. GAAP”). The preparation of financial statements in accordance with U.S. GAAP may require management to make estimates and assumptions that affect the reported amounts of assets and liabilities and disclosure of contingent assets and liabilities at the date of the financial statements and the reported amounts of increases and decreases in net assets from operations during the reporting period. Actual results could differ from those estimates.
| a) | Determination of Net Asset Value – The NAV of each class of the Fund’s shares is determined as of the close of regular trading (normally 4:00 p.m. Eastern Time) (the “NYSE Close”) on each day that the New York Stock Exchange (the “Exchange”) is open (“Valuation Date”). Information that becomes known to the Fund after the NAV has been calculated on a particular day will not generally be used to retroactively adjust the NAV determined earlier that day. |
| b) | Investment Valuation and Fair Value Measurements – For purposes of calculating the NAV, portfolio investments and other assets held by the Fund's portfolio for which market quotes are readily available are valued at market value. Market value is generally determined on the basis of last reported sales prices or official close price. If no sales are reported, market value is based on quotes obtained from a quotation reporting system, established market makers, or independent pricing services. If market prices are not readily available or are deemed unreliable, the Fund will use the fair value of the investment as determined in good faith under policies and procedures established by and under the supervision of the Company’s Board of Directors. Market quotes are considered not readily available where there is an absence of current or reliable market-based data (e.g., trade information or indicative market quotes), including where events occur after the close of the relevant market, but prior to the NYSE Close, that materially affect the values of the Fund’s portfolio investments or assets. In addition, market quotes are considered not readily available when, due to extraordinary circumstances, the exchanges or markets on which the investments trade do not open for trading for the entire day and no other market prices are available. In addition, prices of foreign equities that are principally traded on certain foreign markets may be adjusted daily pursuant to a fair value pricing service approved by the Board of Directors in order to reflect an adjustment for the factors occurring after the close of certain foreign markets but before the NYSE Close. Investments that are primarily traded on foreign markets may trade on days that are not business days of the Fund. The value of the foreign investments in which the Fund invests may change on days when a shareholder will not be able to purchase or redeem shares of the Fund. Fair value pricing is subjective in nature and the use of fair value pricing by the |
| 12 |
Fund may cause the NAV of its shares to differ significantly from the NAV that would have been calculated using market prices at the close of the exchange on which a portfolio investment is primarily traded. There can be no assurance that the Fund could obtain the fair market value assigned to an investment if the Fund were to sell the investment at approximately the time at which the Fund determines its NAV.
Investments valued in currencies other than U.S. dollars are converted to U.S. dollars using exchange rates obtained from independent pricing services for calculation of the NAV. As a result, the NAV of the Fund’s shares may be affected by changes in the value of currencies in relation to the U.S. dollar. The value of investments traded in markets outside the United States or denominated in currencies other than the U.S. dollar may be affected significantly on a day that the NYSE is closed and the market value may change on days when an investor is not able to purchase, redeem or exchange shares of the Fund.
Foreign currency contracts represent agreements to exchange currencies on specific future dates at predetermined rates. Foreign currency contracts are valued using foreign currency exchange rates and forward rates as provided by an independent pricing service on the Valuation Date.
Financial instruments for which prices are not available from an independent pricing service may be valued using market quotations obtained from one or more dealers that make markets in the respective financial instrument in accordance with procedures established by the Company’s Board of Directors.
U.S. GAAP defines fair value as the price that the Fund would receive to sell an asset or pay to transfer a liability in an orderly transaction between market participants. The U.S. GAAP fair value measurement standards require disclosure of a fair value hierarchy for each major category of assets and liabilities. Various inputs are used in determining the fair value of the Fund’s investments. These inputs are summarized into three broad hierarchy levels. This hierarchy is based on whether the valuation inputs are observable or unobservable. These levels are:
| · | Level 1 – Quoted prices in active markets for identical investments. Level 1 may include exchange traded instruments, such as domestic equities, some foreign equities, options, futures, mutual funds, exchange traded funds, rights and warrants. |
| · | Level 2 – Observable inputs other than Level 1 prices, such as quoted prices for similar investments; quoted prices in markets that are not active; or other inputs that are observable or can be corroborated by observable market data. Level 2 may include debt investments that are traded less frequently than exchange traded instruments and which are valued using independent pricing services; foreign equities, which are principally traded on certain foreign markets and are adjusted daily pursuant to a fair value pricing service in order to reflect an adjustment for the factors occurring after the close of certain foreign markets but before the NYSE Close; senior floating rate interests, which are valued using an aggregate of dealer bids; short-term investments, which are valued at amortized cost; and swaps, which are valued based upon the terms of each swap contract. |
| · | Level 3 – Significant unobservable inputs that are supported by limited or no market activity. Level 3 may include financial instruments whose values are determined using indicative market quotes or require significant management judgment or estimation. These unobservable valuation inputs may include estimates for current yields, maturity/duration, prepayment speed, and indicative market quotes for comparable investments along with other assumptions relating to credit quality, collateral value, complexity of the investment structure, general market conditions and liquidity. This category may include investments where trading has been halted or there are certain restrictions on trading. While these investments are priced using unobservable inputs, the valuation of these investments reflects the best available data and management believes the prices are a reasonable representation of exit price. |
The Board of Directors of the Company generally reviews and approves the “Procedures for Valuation of Portfolio Securities” on an annual basis. These procedures define how investments are to be valued, including the formation and activities of a Valuation Committee. The Valuation Committee is responsible for determining in good faith the fair value of investments when the value cannot be obtained from primary pricing services or
| 13 |
| Hartford MidCap HLS Fund |
| Notes to Financial Statements – (continued) |
| December 31, 2013 |
| (000’s Omitted) |
alternative sources or if the valuation of an investment as provided by the primary pricing service or alternative source is believed not to reflect the investment’s fair value as of the Valuation Date. Voting members of the Valuation Committee include the Fund’s Treasurer or designee and a Vice President of the investment manager or designee. An Assistant Vice President of the Fund with legal expertise or designee is also included on the Valuation Committee as a non-voting advisory member. In addition, the Fund’s Chief Compliance Officer shall designate a member of the compliance group to attend Valuation Committee meetings as a non-voting resource, to monitor for and provide guidance with respect to compliance with these procedures. Two members of the Valuation Committee or their designees, representing different departments, shall constitute a quorum for purposes of permitting the Valuation Committee to take action. The Valuation Committee will consider all relevant factors in determining an investment’s fair value, and may seek the advice of the Fund’s sub-adviser, knowledgeable brokers, and legal counsel in making such determination. The Valuation Committee reports to the Audit Committee of the Company’s Board of Directors. The Audit Committee receives quarterly written reports which include details of all fair-valued investments, including the reason for the fair valuation, and an indication, when possible, of the accuracy of the valuation by disclosing the next available reliable public price quotation or the disposition price of such investments (the “look-back” test). The Board of Directors then must consider for ratification all of the fair value determinations made during the previous quarter.
Valuation levels are not necessarily indicative of the risk associated with investing in such investments. Individual investments within any of the above mentioned asset classes may be assigned a different hierarchical level than those presented above, as individual circumstances dictate.
For additional information, refer to the Investment Valuation Hierarchy Level Summary and the Level 3 roll-forward reconciliation, if applicable, which follow the Schedule of Investments.
| c) | Investment Transactions and Investment Income – Investment transactions are recorded as of the trade date (the date the order to buy or sell is executed) for financial reporting purposes. Investments purchased or sold on a when-issued or delayed-delivery basis may be settled a month or more after the trade date. Realized gains and losses are determined on the basis of identified cost. |
Dividend income from domestic securities is accrued on the ex-dividend date. In general, dividend income from foreign securities is recorded on the ex-date; however, dividend notifications in certain foreign jurisdictions may not be available in a timely manner and as a result, the Fund will record the dividend as soon as the relevant details (i.e., rate per share, payment date, shareholders of record, etc.) are publicly available. Interest income, including amortization of premium, accretion of discounts and additional principal received in-kind in lieu of cash, is accrued on a daily basis.
| d) | Foreign Currency Transactions – Assets and liabilities denominated in currencies other than U.S. dollars are translated into U.S. dollars at the exchange rates in effect on the valuation date. Purchases and sales of investments, income and expenses are translated into U.S. dollars at the exchange rates on the dates of such transactions. |
The Fund does not isolate that portion of portfolio investment valuation resulting from fluctuations in the foreign currency exchange rates from the fluctuations arising from changes in the market prices of investments held. Exchange rate fluctuations are included with the net realized and unrealized gain or loss on investments in the accompanying financial statements.
Net realized foreign exchange gains or losses arise from sales of foreign currencies and the difference between asset and liability amounts initially stated in foreign currencies and the U.S. dollar value of the amounts actually received or paid. Net unrealized foreign exchange gains or losses arise from changes in the value of other assets and liabilities at the end of the reporting period, resulting from changes in the exchange rates.
| e) | Joint Trading Account – The Fund may invest cash balances into a joint trading account that may be invested in one or more repurchase agreements. |
| 14 |
| f) | Fund Share Valuation and Dividend Distributions to Shareholders – Orders for the Fund’s shares are executed in accordance with the investment instructions of the contract holders and plan participants. The NAV of the Fund’s shares is determined as of the close of business on each business day of the Exchange. The NAV is determined separately for each class of shares of the Fund by dividing the Fund’s net assets attributable to that class by the number of shares of the class outstanding. Each class of shares offered by the Fund has equal rights as to assets and voting privileges (except that shareholders of a class have exclusive voting rights regarding any matter relating solely to that class of shares). Income and non-class specific expenses are allocated daily to each class on the basis of the relative net assets of the class. Realized and unrealized gains and losses are allocated daily based on the relative net assets of each class of shares of the Fund. |
Orders for the purchase of the Fund’s shares received prior to the close of the Exchange on any day the Exchange is open for business are priced at the NAV determined as of the close of the Exchange. Orders received after the close of the Exchange, or on a day on which the Exchange and/or the Fund is not open for business, are priced at the next determined NAV.
Dividends are declared pursuant to a policy adopted by the Company’s Board of Directors based upon the investment performance of the Fund. The policy of the Fund is to pay dividends from net investment income and realized gains, if any, at least once a year.
Distributions from net investment income, net realized gains and capital are determined in accordance with federal income tax regulations, which may differ from U.S. GAAP with respect to character and timing. These differences may include, but are not limited to, losses deferred due to wash sale adjustments, foreign currency gains and losses, adjustments related to Passive Foreign Investment Companies (“PFICs”), Real Estate Investment Trusts (“REITs”), Regulated Investment Companies (“RICs”), certain derivatives and partnerships. Permanent book and federal income tax basis differences relating to shareholder distributions will result in reclassifications to certain of the Fund’s capital accounts (see Federal Income Taxes: Reclassification of Capital Accounts note).
| 3. | Securities and Other Investments: |
| a) | Repurchase Agreements – A repurchase agreement is an agreement by which a counterparty agrees to sell an investment and agrees to repurchase the investment sold from the buyer at a mutually agreed upon time and price. During the period of the repurchase agreement, the counterparty will deposit cash and or securities in a third party custodial account to serve as collateral. At the time the Fund enters into a repurchase agreement, the value of the underlying collateral, including accrued interest, will be equal to or exceed the value of the repurchase agreement. Repurchase agreements expose the Fund to counterparty risk - that is, the risk that the counterparty will not fulfill its obligations. To minimize counterparty risk, the investments that serve to collateralize the repurchase agreement are held by the Fund’s custodian in book entry or physical form in the custodial account of the Fund or in a third party custodial account. Repurchase agreements are valued at cost plus accrued interest, which approximates fair value. Repurchase agreements have master netting arrangements which allow the Fund to offset amounts owed to a counterparty with amounts owed by the counterparty, including any collateral. Upon an event of default under a master repurchase agreement, the non-defaulting party may close out all transactions traded under such agreement and net amounts owed under each transaction to one net amount payable by one party to the other. Absent an event of default, the master repurchase agreement does not result in an offset of reported amounts of assets and liabilities in the Statement of Assets and Liabilities across transactions between the Fund and the applicable counterparty. The Fund, as shown on the Schedule of Investments, had outstanding repurchase agreements and related collateral as of December 31, 2013. |
| b) | Investments Purchased on a When-Issued or Delayed-Delivery Basis – Delivery and payment for investments that have been purchased by the Fund on a forward commitment, or when-issued or delayed-delivery basis, take place beyond the customary settlement period. The Fund may dispose of or renegotiate a delayed-delivery transaction after it is entered into, and may sell delayed-delivery investments before they are delivered, which may result in a realized gain or loss. During this period, such investments are subject to market fluctuations, and the Fund identifies investments segregated in |
| 15 |
| Hartford MidCap HLS Fund |
| Notes to Financial Statements – (continued) |
| December 31, 2013 |
| (000’s Omitted) |
its records with a value at least equal to the amount of the commitment. As of December 31, 2013, the Fund had no outstanding when-issued or delayed-delivery investments.
| 4. | Financial Derivative Instruments: |
The following disclosures contain information on how and why the Fund uses derivative instruments, the credit-risk-related contingent features in certain derivative instruments, and how derivative instruments affect the Fund’s financial position and results of operations. The location and fair value amounts of these instruments on the Statement of Assets and Liabilities and the realized gains and losses and changes in unrealized gains and losses on the Statement of Operations, each categorized by type of derivative contract, are included in the following Additional Derivative Instrument Information footnote. The derivative instruments outstanding as of year-end are disclosed in the notes to or within the Schedule of Investments for purchased options, if applicable. The amounts of realized gains and losses and changes in unrealized gains and losses on derivative instruments during the year are disclosed in the Statement of Operations.
| a) | Foreign Currency Contracts – The Fund may enter into foreign currency contracts that obligate the Fund to purchase or sell currencies at specified future dates. Foreign currency contracts are used to hedge the currency exposure associated with some or all of the Fund’s investments and/or as part of an investment strategy. Foreign currency contracts are marked to market daily and the change in value is recorded by the Fund as an unrealized gain or loss. The Fund will record a realized gain or loss when the foreign currency contract is settled. |
Foreign currency contracts involve elements of market risk in excess of the amounts reflected in the Statement of Assets and Liabilities. In addition, risks may arise upon entering into these contracts from the potential inability of the counterparties to meet the terms of the contracts and from unanticipated movements in the value of the foreign currencies relative to the U.S. dollar. The Fund had no outstanding foreign currency contracts as of December 31, 2013.
| b) | Additional Derivative Instrument Information: |
The volume of derivative activity was minimal during the year ended December 31, 2013.
The Effect of Derivative Instruments on the Statement of Operations for the year ended December 31, 2013:
| Risk Exposure Category | ||||||||||||||||||||||||||||
| Interest Rate Contracts | Foreign Exchange Contracts | Credit Contracts | Equity Contracts | Commodity Contracts | Other Contracts | Total | ||||||||||||||||||||||
| Realized Gain on Derivatives Recognized as a Result of Operations: | ||||||||||||||||||||||||||||
| Net realized gain on foreign currency contracts | $ | — | $ | 13 | $ | — | $ | — | $ | — | $ | — | $ | 13 | ||||||||||||||
| Total | $ | — | $ | 13 | $ | — | $ | — | $ | — | $ | — | $ | 13 | ||||||||||||||
| 5. | Principal Risks: |
The Fund may be exposed to counterparty risk, or the risk that an institution or other entity with which the Fund has unsettled or open transactions will default.
If the Fund invests directly in foreign currencies or in securities that trade in, and receive revenues in, foreign currencies, or in derivatives that provide exposure to foreign currencies, it will be subject to the risk that those currencies will decline in value relative to the base currency (U.S. dollars) of the Fund, or, in the case of hedging positions, that the Fund’s base currency will decline in value relative to the currency being hedged. Currency rates in foreign countries may fluctuate significantly over short periods of time for a number of reasons, including changes in interest rates, intervention (or the failure to intervene) by U.S. or foreign governments, central banks or supranational entities, such as the International Monetary Fund, or by the imposition of currency controls or other political developments in the United States or abroad. As a result, the Fund’s investments in foreign currency denominated securities may reduce the returns
| 16 |
of the Fund. The market values of equity securities, such as common stocks and preferred stocks, or equity related investments, such as futures and options, may decline due to general market conditions which are not specifically related to a particular company, such as real or perceived adverse economic conditions, changes in the general outlook for corporate earnings, changes in interest or currency rates or adverse investor sentiment generally. The market value of equity securities may also decline due to factors which affect a particular industry or industries, such as labor shortages or increased production costs and competitive conditions within an industry. Equity securities and equity related investments generally have greater market price volatility than fixed income securities.
| 6. | Federal Income Taxes: |
| a) | Federal Income Taxes – For federal income tax purposes, the Fund intends to continue to qualify as a RIC under Subchapter M of the Internal Revenue Code (“IRC”) by distributing substantially all of its taxable net investment income and net realized capital gains to its shareholders and otherwise complying with the requirements of the IRC. The Fund has distributed substantially all of its income and capital gains in prior years, if applicable, and intends to distribute substantially all of its income and capital gains prior to the next fiscal year-end. Accordingly, no provision for federal income or excise taxes has been made in the accompanying financial statements. Distributions from short-term capital gains are treated as ordinary income distributions for federal income tax purposes. |
| b) | Net Investment Income (Loss), Net Realized Gains (Losses) and Distributions – Net investment income (loss) and net realized gains (losses) may differ for financial statement and tax purposes primarily because of losses deferred due to wash sale adjustments, foreign currency gains and losses, adjustments related to PFICs, REITs, RICs, certain derivatives and partnerships. The character of distributions made during the year from net investment income or net realized gains may differ from their ultimate characterization for federal income tax purposes. Also, due to the timing of dividend distributions, the fiscal year in which amounts are distributed may differ from the year that the income or realized gains (losses) were recorded by the Fund. |
| c) | Distributions and Components of Distributable Earnings – The tax character of distributions paid by the Fund for the periods indicated is as follows (as adjusted for dividends payable, if applicable): |
| For the Year Ended December 31, 2013 | For the Year Ended December 31, 2012 | |||||||
| Ordinary Income | $ | 13,250 | $ | 11,152 | ||||
| Long-Term Capital Gains* | 45,381 | — | ||||||
| * | The Fund designates these distributions as long-term capital dividends pursuant to IRC Sec. 852(b)(3)(C). |
As of December 31, 2013, the Fund’s components of distributable earnings (deficit) on a tax basis were as follows:
| Amount | ||||
| Undistributed Ordinary Income | $ | 14,012 | ||
| Undistributed Long-Term Capital Gain | 174,228 | |||
| Unrealized Appreciation* | 453,434 | |||
| Total Accumulated Earnings | $ | 641,674 | ||
| * | Differences between book-basis and tax-basis unrealized appreciation (depreciation) may be attributable to the losses deferred due to wash sale adjustments, foreign currency gains and losses, adjustments related to PFICs, REITs, RICs, certain derivatives and partnerships. |
| d) | Reclassification of Capital Accounts – The Fund may record reclassifications in its capital accounts. These reclassifications have no impact on the total net assets of the Fund. The reclassifications are a result of permanent |
| 17 |
| Hartford MidCap HLS Fund |
| Notes to Financial Statements – (continued) |
| December 31, 2013 |
| (000’s Omitted) |
differences between U.S. GAAP and tax accounting for such items as foreign currency, PFICs, expiration or utilization of capital loss carryforwards or net operating losses. Adjustments are made to reflect the impact these items have on current and future distributions to shareholders. Therefore, the source of the Fund’s distributions may be shown in the accompanying Statement of Changes in Net Assets as from undistributed net investment income, from accumulated net realized gains on investments or from capital depending on the type of book and tax differences that exist. For the year ended December 31, 2013, the Fund recorded reclassifications to increase (decrease) the accounts listed below:
| Amount | ||||
| Undistributed Net Investment Income (Loss) | $ | (39 | ) | |
| Accumulated Net Realized Gain (Loss) | 39 | |||
| e) | Capital Loss Carryforward – On December 22, 2010, the Regulated Investment Company Modernization Act of 2010 (the “Act”) was enacted, which made changes to the capital loss carryforward rules. The changes are effective for taxable years beginning after the date of enactment. Under the Act, funds are permitted to carry forward capital losses for an unlimited period. However, any losses incurred during those future taxable years will be required to be utilized prior to the losses incurred in pre-enactment taxable years, which carry an expiration date. As a result of this ordering rule, pre-enactment capital loss carryforwards may be more likely to expire unused. Additionally, post-enactment capital loss carryforwards retain their character as either short-term or long-term capital losses rather than being considered all short-term as permitted under prior regulation. |
The Fund had no capital loss carryforward for U.S. federal income tax purposes as of December 31, 2013.
| f) | Accounting for Uncertainty in Income Taxes – The Fund has adopted financial reporting rules that require the Fund to analyze all open tax years, as defined by the statute of limitations, for all major jurisdictions. Generally, tax authorities can examine all tax returns filed for the last three years. The Fund does not have an examination in progress. |
The Fund has reviewed all open tax years and major jurisdictions and concluded that these financial reporting rules had no effect on the Fund’s financial position or results of operations. There is no tax liability resulting from unrecognized tax benefits relating to uncertain income tax positions taken or expected to be taken on the tax return for the fiscal year ended December 31, 2013. The Fund is also not aware of any tax positions for which it is reasonably possible that the total amounts of unrecognized tax benefits will significantly change in the next twelve months.
| 7. | Expenses: |
| a) | Investment Management Agreement – Hartford Funds Management Company, LLC (“HFMC”), an indirect wholly owned subsidiary of The Hartford Financial Services Group, Inc. (“The Hartford”), serves as investment manager to the Fund pursuant to an Investment Management Agreement with the Company. The investment manager has overall investment supervisory responsibility for the Fund. In addition, the investment manager provides administrative personnel, services, equipment, facilities and office space for proper operation of the Fund. The investment manager has contracted with Wellington Management Company, LLP (“Wellington Management”) under a sub-advisory agreement for the provision of day-to-day investment management services to the Fund in accordance with the Fund’s investment objective and policies. The Fund pays a fee to the investment manager, a portion of which may be used to compensate Wellington Management. |
| 18 |
The schedule below reflects the rates of compensation paid to HFMC for investment management services rendered as of December 31, 2013; the rates are accrued daily and paid monthly.
| Average Daily Net Assets | Annual Fee | |||
| On first $250 million | 0.7750 | % | ||
| On next $250 million | 0.7250 | % | ||
| On next $500 million | 0.6750 | % | ||
| On next $4 billion | 0.6250 | % | ||
| On next $5 billion | 0.6225 | % | ||
| Over $10 billion | 0.6200 | % | ||
| b) | Accounting Services Agreement – Pursuant to the Fund Accounting Agreement between HFMC and the Company, on behalf of the Fund, HFMC provides accounting services to the Fund and receives monthly compensation based on the Fund’s average daily net assets at the rates set forth below. The Fund’s accounting services fees are accrued daily and paid monthly. |
| Average Daily Net Assets | Annual Fee | |||
| All assets | 0.010 | % | ||
| c) | Operating Expenses – Allocable expenses incurred by the Company are allocated to each Fund and allocated to classes within a Fund in proportion to the average daily net assets of the Fund and each class, except where allocation of certain expenses is more fairly made directly to the Fund or to specific classes within a Fund. |
| d) | Fees Paid Indirectly – The Company, on behalf of the Fund, has entered into agreements with State Street Global Markets, LLC and Russell Implementation Services, Inc. to partially recapture non-discounted trade commissions. Such rebates are used to pay a portion of the Fund’s expenses. In addition, the Fund’s custodian bank has agreed to reduce its fees when the Fund maintains cash on deposit in a non-interest-bearing custody account. For the year ended December 31, 2013, these amounts, if any, are included in the Statement of Operations. |
The ratio of expenses to average net assets in the accompanying financial highlights excludes the reduction in expenses related to fees paid indirectly. The annualized expense ratio after waivers for the period listed below reflecting the reduction for fees paid indirectly is as follows:
| Year Ended December 31, 2013 | ||||
| Class IA | 0.71 | % | ||
| Class IB | 0.96 | |||
| e) | Distribution Plan for Class IB shares – Effective June 14, 2013, Hartford Investment Financial Services, LLC was renamed Hartford Funds Distributors, LLC (“HFD”). HFD, a wholly owned, ultimate subsidiary of The Hartford, serves as the Fund’s principal underwriter and distributor. The Company, on behalf of the Fund, has adopted a Distribution Plan pursuant to Rule 12b-1 of the 1940 Act to compensate the distributor, HFD, from assets attributable to the Class IB shares for services rendered and expenses borne in connection with activities primarily intended to result in the sale of the Class IB shares, subject to the review and approval of the Company’s Board of Directors. |
The Distribution Plan provides that the Fund may pay annually up to 0.25% of the average daily net assets of the Fund attributable to its Class IB shares for activities primarily intended to result in the sale of Class IB shares. The Board has the authority to suspend or reduce these payments at any point in time. Under the terms of the Distribution Plan and the principal underwriting agreement, the Fund is authorized to make payments monthly to the distributor that may be used
| 19 |
| Hartford MidCap HLS Fund |
| Notes to Financial Statements – (continued) |
| December 31, 2013 |
| (000’s Omitted) |
to pay or compensate entities providing distribution and shareholder servicing with respect to the Class IB shares for such entities’ fees or expenses incurred or paid in that regard. These fees are accrued daily and paid monthly.
| f) | Other Related Party Transactions – Certain officers of the Fund are directors and/or officers of the investment manager and/or The Hartford or its subsidiaries. For the year ended December 31, 2013, a portion of the Fund’s Chief Compliance Officer’s salary was paid by all the investment companies in the Hartford fund complex. The portion allocated to the Fund was in the amount of $2. Hartford Administrative Services Company (“HASCO”), an indirect wholly owned subsidiary of The Hartford, provides transfer agent services to the Fund. HASCO was compensated on a per account basis for providing such services. The amount paid to HASCO can be found in the Statement of Operations. These fees are accrued daily and paid monthly. |
| g) | Payment from Affiliate – In July of 2007, The Hartford entered into a settlement with the Attorneys General of the states of New York, Connecticut and Illinois relating to market timing and the company's individual variable annuity contracts in which certain payments would be made directly to the variable annuity contract holders. The distribution plan provided that unclaimed money from the settlement would be distributed to certain HLS Funds that are investment options through a Hartford individual variable annuity contract. The unclaimed money was distributed to the Fund on September 18, 2009. |
The total return in the accompanying financial highlights includes a payment from an affiliate. Had the payment from the affiliate been excluded, the impact and total return for the period listed below would have been as follows:
| For the Year Ended December 31, 2009 | ||||||||
| Class IA | Class IB | |||||||
| Impact from Payment from Affiliate for Attorneys General Settlement | 0.03 | % | 0.03 | % | ||||
| Total Return Excluding Payment from Affiliate | 30.92 | % | 30.59 | % | ||||
| 8. | Investment Transactions: |
For the year ended December 31, 2013, the Fund's aggregate purchases and sales of investment securities (excluding short-term investments) were as follows:
| Amount | ||||
| Cost of Purchases Excluding U.S. Government Obligations | $ | 519,156 | ||
| Sales Proceeds Excluding U.S. Government Obligations | 851,919 | |||
| 9. | Line of Credit: |
The Fund is one of several Hartford funds that participate in a $500 million committed revolving line of credit facility. The facility is to be used for temporary or emergency purposes. Under the arrangement, the funds are required to own securities having a market value in excess of 300% of the total bank borrowings. The interest rate on borrowings varies depending on the nature of the loan. The facility also requires a fee to be paid based on the amount of the commitment. This commitment fee is allocated to all of the funds participating in the line of credit based on the average net assets of the funds. During the year ended December 31, 2013, the Fund did not have any borrowings under this facility.
| 10. | Industry Classifications: |
Other than the industry classifications “Other Investment Pools and Funds” and “Exchange Traded Funds,” equity industry classifications used in this report are the Global Industry Classification Standard, which was developed by and is the exclusive property and service mark of MSCI, Inc. and Standard & Poor’s.
| 20 |
| 11. | Indemnifications: |
Under the Company’s organizational documents, the Company shall indemnify its officers and directors to the full extent required or permitted under Maryland General Corporation Law and the federal securities laws. In addition, the Company, on behalf of the Fund, may enter into contracts that contain a variety of indemnifications. The Company’s maximum exposure under these arrangements is unknown. However, as of the date of these financial statements, the Company has not had prior claims or losses pursuant to these contracts and expects the risk of loss to be remote.
| 12. | Pending Legal Proceedings: |
On February 25, 2011, Jennifer L. Kasilag, Louis Mellinger, Judith M. Menendez, Jacqueline M. Robinson, and Linda A. Russell filed a derivative lawsuit against Hartford Investment Financial Services, LLC (“HIFSCO”)(now known as Hartford Funds Distributors, LLC) on behalf of six Hartford retail mutual funds in the United States District Court for the District of New Jersey, alleging that HIFSCO received excessive advisory and distribution fees in violation of its statutory fiduciary duty under Section 36(b) of the 1940 Act when serving as investment manager and principal underwriter, respectively, to the Hartford retail mutual funds. HIFSCO moved to dismiss and, in September 2011, the motion was granted in part and denied in part, with leave to amend the complaint. In November 2011, plaintiffs filed an amended complaint on behalf of certain Hartford retail mutual funds, The Hartford Global Health Fund (now known as The Hartford Healthcare Fund), The Hartford Conservative Allocation Fund, The Hartford Growth Opportunities Fund, The Hartford Inflation Plus Fund, The Hartford Advisers Fund (now known as The Hartford Balanced Fund), and The Hartford Capital Appreciation Fund. Plaintiffs seek to rescind the investment management agreements and distribution plans between HIFSCO and these funds and to recover the total fees charged thereunder or, in the alternative, to recover any improper compensation HIFSCO received, in addition to lost earnings. HIFSCO filed a partial motion to dismiss the amended complaint and, in December 2012, the court dismissed without prejudice the claims regarding distribution fees and denied the motion with respect to the advisory fees claims. HIFSCO disputes the allegations and intends to defend the advisory fee claims vigorously.
This action concerns the activities of HIFSCO in its capacity as investment manager and principal underwriter to the Hartford retail mutual funds and does not concern HIFSCO’s activities in its capacity as principal underwriter to the HLS funds. For this reason, no accrual for litigation relating to this matter has been recorded in the financial statements of the Fund.
| 21 |
| Hartford MidCap HLS Fund |
| Financial Highlights |
─Selected Per-Share Data(A) ─ | ─Ratios and Supplemental Data ─ | |||||||||||||||||||||||||||||||||||||||||||||||||||
Class | Net Asset | Net | Net | Total from | Dividends | Distributions | Total | Net | Total | Net Assets | Ratio of | Ratio of | Ratio of | |||||||||||||||||||||||||||||||||||||||
| For the Year Ended December 31, 2013 | ||||||||||||||||||||||||||||||||||||||||||||||||||||
| IA | $ | 28.16 | $ | 0.07 | $ | 11.02 | $ | 11.09 | $ | (0.04 | ) | $ | (1.34 | ) | $ | (1.38 | ) | $ | 37.87 | 39.82 | % | $ | 1,483,626 | 0.71 | % | 0.71 | % | 0.21 | % | |||||||||||||||||||||||
| IB | 27.95 | (0.02 | ) | 10.94 | 10.92 | (0.01 | ) | (1.34 | ) | (1.35 | ) | 37.52 | 39.46 | 82,483 | 0.96 | 0.96 | (0.05 | ) | ||||||||||||||||||||||||||||||||||
| For the Year Ended December 31, 2012 (D) | ||||||||||||||||||||||||||||||||||||||||||||||||||||
| IA | $ | 23.77 | $ | 0.24 | $ | 4.38 | $ | 4.62 | $ | (0.23 | ) | $ | – | $ | (0.23 | ) | $ | 28.16 | 19.44 | % | $ | 1,325,221 | 0.71 | % | 0.71 | % | 0.84 | % | ||||||||||||||||||||||||
| IB | 23.59 | 0.17 | 4.35 | 4.52 | (0.16 | ) | – | (0.16 | ) | 27.95 | 19.14 | 70,997 | 0.96 | 0.96 | 0.59 | |||||||||||||||||||||||||||||||||||||
| For the Year Ended December 31, 2011 (D) | ||||||||||||||||||||||||||||||||||||||||||||||||||||
| IA | $ | 26.01 | $ | 0.15 | $ | (2.20 | ) | $ | (2.05 | ) | $ | (0.19 | ) | $ | – | $ | (0.19 | ) | $ | 23.77 | (7.92 | )% | $ | 1,212,257 | 0.71 | % | 0.71 | % | 0.48 | % | ||||||||||||||||||||||
| IB | 25.74 | 0.07 | (2.17 | ) | (2.10 | ) | (0.05 | ) | – | (0.05 | ) | 23.59 | (8.16 | ) | 70,188 | 0.96 | 0.96 | 0.18 | ||||||||||||||||||||||||||||||||||
| For the Year Ended December 31, 2010 (D) | ||||||||||||||||||||||||||||||||||||||||||||||||||||
| IA | $ | 21.12 | $ | 0.10 | $ | 4.85 | $ | 4.95 | $ | (0.06 | ) | $ | – | $ | (0.06 | ) | $ | 26.01 | 23.45 | % | $ | 1,722,182 | 0.70 | % | 0.70 | % | 0.44 | % | ||||||||||||||||||||||||
| IB | 20.92 | 0.04 | 4.79 | 4.83 | (0.01 | ) | – | (0.01 | ) | 25.74 | 23.15 | 124,465 | 0.95 | 0.95 | 0.12 | |||||||||||||||||||||||||||||||||||||
| For the Year Ended December 31, 2009 (D) | ||||||||||||||||||||||||||||||||||||||||||||||||||||
| IA | $ | 16.21 | $ | 0.12 | (E) | $ | 4.89 | $ | 5.01 | $ | (0.10 | ) | $ | – | $ | (0.10 | ) | $ | 21.12 | 30.96 | %(F) | $ | 1,490,852 | 0.72 | % | 0.72 | % | 0.48 | % | |||||||||||||||||||||||
| IB | 16.06 | 0.05 | (E) | 4.86 | 4.91 | (0.05 | ) | – | (0.05 | ) | 20.92 | 30.62 | (F) | 173,205 | 0.97 | 0.97 | 0.23 | |||||||||||||||||||||||||||||||||||
| (A) | Information presented relates to a share outstanding throughout the indicated period. Net investment income (loss) per share amounts are calculated based on average shares outstanding unless otherwise noted. |
| (B) | The figures do not include sales charges or other fees which may be applied at the variable life insurance, variable annuity or qualified retirement plan product level. Any such additional sales charges or other fees would lower the Fund's performance. |
| (C) | Adjustments include waivers and reimbursements, if applicable. Ratios do not include fees paid indirectly (see Expenses in the accompanying Notes to Financial Statements). |
| (D) | Net investment income (loss) per share amounts have been calculated using the SEC method. |
| (E) | The impact of Payment from Affiliate per share was $0.01. |
| (F) | Total return without the inclusion of the Payment from (to) Affiliate can be found in Expenses in the accompanying Notes to Financial Statements. |
| Portfolio Turnover Rate for All Share Classes | ||||
| For the Year Ended December 31, 2013 | 34 | % | ||
| For the Year Ended December 31, 2012 | 51 | |||
| For the Year Ended December 31, 2011 | 69 | |||
| For the Year Ended December 31, 2010 | 52 | |||
| For the Year Ended December 31, 2009 | 82 | |||
| 22 |
| Report of Independent Registered Public Accounting Firm |
The Board of Directors and Shareholders of Hartford Series Fund, Inc. |
We have audited the accompanying statement of assets and liabilities, including the schedule of investments, of Hartford MidCap HLS Fund (one of the portfolios constituting Hartford Series Fund, Inc. (the Funds)) as of December 31, 2013, and the related statement of operations for the year then ended, the statements of changes in net assets for each of the two years in the period then ended, and the financial highlights for each of the five years in the period then ended. These financial statements and financial highlights are the responsibility of the Funds’ management. Our responsibility is to express an opinion on these financial statements and financial highlights based on our audits.
We conducted our audits in accordance with the standards of the Public Company Accounting Oversight Board (United States). Those standards require that we plan and perform the audit to obtain reasonable assurance about whether the financial statements and financial highlights are free of material misstatement. We were not engaged to perform an audit of the Funds’ internal control over financial reporting. Our audits included consideration of internal control over financial reporting as a basis for designing audit procedures that are appropriate in the circumstances, but not for the purpose of expressing an opinion on the effectiveness of the Funds’ internal control over financial reporting. Accordingly, we express no such opinion. An audit also includes examining, on a test basis, evidence supporting the amounts and disclosures in the financial statements and financial highlights, assessing the accounting principles used and significant estimates made by management, and evaluating the overall financial statement presentation. Our procedures included confirmation of securities owned as of December 31, 2013, by correspondence with the custodian and brokers or by other appropriate auditing procedures where replies from brokers were not received. We believe that our audits provide a reasonable basis for our opinion.
In our opinion, the financial statements and financial highlights referred to above present fairly, in all material respects, the financial position of Hartford MidCap HLS Fund of the Hartford Series Fund, Inc. at December 31, 2013, the results of its operations for the year then ended, the changes in its net assets for each of the two years in the period then ended, and the financial highlights for each of the five years in the period then ended, in conformity with U.S. generally accepted accounting principles.
|
Minneapolis, MN
February 17, 2014
| 23 |
| Hartford MidCap HLS Fund |
| Directors and Officers (Unaudited) |
The Board of Directors of the Company appoints officers who are responsible for the day-to-day operations of the Fund and who execute policies formulated by the directors. Each director serves until his or her death, resignation, or retirement or until the next annual meeting of shareholders is held or until his or her successor is elected and qualifies.
Directors and officers who are employed by or who have a financial interest in The Hartford are considered “interested” persons of the Fund pursuant to the 1940 Act. Each officer and two of the Company’s directors, as noted in the chart below, are “interested” persons of the Fund. Each director serves as a director for The Hartford Mutual Funds, Inc., The Hartford Mutual Funds II, Inc., Hartford Series Fund, Inc., Hartford HLS Series Fund II, Inc., and as a trustee for The Hartford Alternative Strategies Fund, which, as of December 31, 2013, collectively consist of 91 funds. Correspondence may be sent to directors and officers c/o Hartford Funds, 5 Radnor Corporate Center, Suite 300, 100 Matsonford Road, Radnor, Pennsylvania 19087, except that correspondence to Mr. Annoni, Mr. Dressen and Ms. Quade may be sent to 500 Bielenberg Drive, Woodbury, Minnesota 55125.
The table below sets forth, for each director and officer, his or her name, year of birth, current position with the Company and date first elected or appointed to Hartford Series Fund, Inc. (“HSF”), and Hartford HLS Series Fund II, Inc. (“HSF2”), principal occupation, and, for directors, other directorships held. The Fund’s Statement of Additional Information contains further information on the directors and is available free of charge by calling 1-800-862-6668 or writing to Hartford HLS Funds, c/o Hartford Life Insurance Company, Hartford Life and Annuity Insurance Company, P.O. Box 14293, Lexington, KY 40512-4293.
Information on the aggregate remuneration paid to the directors of the Company can be found in the Statement of Operations herein. The Fund pays to The Hartford a portion of the Chief Compliance Officer’s compensation, but does not pay salaries or compensation to any of their other officers or directors who are employed by The Hartford.
Non-Interested Directors
Lynn S. Birdsong (1946) Director since 2003, Co-Chairman of the Investment Committee since 2005
Mr. Birdsong is a private investor. Mr. Birdsong currently serves as a Director of the Sovereign High Yield Investment Company (April 2010 to current). Mr. Birdsong currently serves as an Independent Director of Nomura Partners Funds, Inc. (formerly, The Japan Fund) (April 2003 to current). From 2003 to March 2005, Mr. Birdsong was an Independent Director of the Atlantic Whitehall Funds. From 1979 to 2002, Mr. Birdsong was a Managing Director of Zurich Scudder Investments, an investment management firm. During his employment with Scudder, Mr. Birdsong was an Interested Director of The Japan Fund. From January 1981 through December 2013, Mr. Birdsong was a partner in Birdsong Company, an advertising specialty firm.
Robert M. Gavin, Jr. (1940) Director since 2002 (HSF) and 1986 (HSF2), Chairman of the Board since 2004
Dr. Gavin is an educational consultant. Prior to September 1, 2001, he was President of Cranbrook Education Community and prior to July 1996, he was President of Macalester College, St. Paul, Minnesota.
Duane E. Hill (1945) Director since 2001 (HSF) and 2002 (HSF2), Chairman of the Nominating Committee since 2003
Mr. Hill is a Partner of TSG Ventures L.P., a private equity investment company. Mr. Hill is a former partner of TSG Capital Group, a private equity investment firm that served as sponsor and lead investor in leveraged buyouts of middle market companies.
Sandra S. Jaffee (1941) Director since 2005
Ms. Jaffee is the founder and Chief Executive Officer of a private company, Homeworks Concierge, LLC, which provides residential property management services in Westchester County, New York (January 2012 to present). Ms. Jaffee served as Chairman (2008 to 2009) and Chief Executive Officer of Fortent (formerly Searchspace Group), a leading provider of compliance/regulatory technology to financial institutions from August 2005 to August 2009. Ms. Jaffee currently serves as a member of the Board of Directors of Broadridge Financial Solutions as well as a Trustee of Muhlenberg College.
| 24 |
William P. Johnston (1944) Director since 2005, Chairman of the Compliance Committee since 2005
In June 2006, Mr. Johnston was appointed as Senior Advisor to The Carlyle Group, a global private equity and alternative asset investment firm and currently serves as an Operating Executive. In July 2006, Mr. Johnston was elected to the Board of Directors of MultiPlan, Inc. and served as a Director (July 2006 to August 2010). In August 2007, Mr. Johnston was elected to the Board of Directors of LifeCare Holdings, Inc. and served as a Director (August 2007 to June 2013). In February 2008, Mr. Johnston was elected to the Board of Directors of HCR-ManorCare, Inc. In May 2006, Mr. Johnston was elected to the Supervisory Board of Fresenius Medical Care AG & Co. KGaA, after its acquisition of Renal Care Group, Inc. in March 2006. Mr. Johnston joined Renal Care Group in November 2002 as a member of the Board of Directors and served as Chairman of the Board from March 2003 through March 2006. From 2002 through 2013, Mr. Johnston served as a Board member of the Georgia O’Keefe Museum. From September 1987 to December 2002, Mr. Johnston was with Equitable Securities Corporation (and its successors, SunTrust Equitable Securities and SunTrust Robinson Humphrey) serving in various investment banking and managerial positions, including Managing Director and Head of Investment Banking, Chief Executive Officer and Vice Chairman.
Phillip O. Peterson (1944) Director since 2002 (HSF) and 2000 (HSF2), Chairman of the Audit Committee since 2002
Mr. Peterson is a mutual fund industry consultant. He was a partner of KPMG LLP (an accounting firm) until July 1999. Mr. Peterson joined William Blair Funds in February 2007 as a member of the Board of Trustees. Mr. Peterson also joined the Board of Trustees of Symetra Variable Mutual Funds Trust as a trustee in February 2012.
Lemma W. Senbet (1946) Director since 2005
Dr. Senbet is the William E. Mayer Chair Professor of Finance and Founding Director, Center for Financial Policy, at the University of Maryland, Robert H. Smith School of Business. He was chair of the Finance Department of the University of Maryland, Robert H. Smith School of Business from 1998 to 2006. Since June 2013, he has been on leave from the University to serve as Executive Director of African Economic Research Consortium which focuses on economic policy research and training. Previously, he was a chaired professor of finance at the University of Wisconsin-Madison. Also, he was a Director of the Fortis Funds from March 2000 to July 2002. Dr. Senbet served as Director of the American Finance Association and President of the Western Finance Association. In 2006, Dr. Senbet was inducted Fellow of Financial Management Association International for his career-long distinguished scholarship and professional service.
Interested Directors and Officers
James E. Davey (1964) Director since 2012, President and Chief Executive Officer since 2010
Mr. Davey serves as Executive Vice President of Hartford Life Insurance Company (“HLIC”) and The Hartford Financial Services Group, Inc. Additionally, Mr. Davey serves as Chairman of the Board, Manager and Senior Managing Director of Hartford Funds Distributors, LLC (“HFD”). He also currently serves as Director, Chairman of the Board, President and Senior Managing Director of Hartford Administrative Services Company (“HASCO”). Mr. Davey also serves as Manager, Chairman of the Board and Senior Managing Director for Hartford Funds Management Company, LLC (“HFMC”). Mr. Davey joined The Hartford in 2002.
Lowndes A. Smith (1939) Director since 1996 (HSF) and 2002 (HSF2), Co-Chairman of the Investment Committee since 2005
Mr. Smith served as Vice Chairman of The Hartford from February 1997 to January 2002, as President and Chief Executive Officer of Hartford Life, Inc. from February 1997 to January 2002, and as President and Chief Operating Officer of The Hartford Life Insurance Companies from January 1989 to January 2002. Mr. Smith serves as a Director of White Mountains Insurance Group Ltd. (October 2003 to current); One Beacon Insurance (October 2006 to current); Symetra Financial (August 2007 to current) and is a Managing Director of Whittington Gray Associates (January 2007 to current).
Other Officers
Mark A. Annoni (1964) Vice President, Controller and Treasurer since 2012
Mr. Annoni currently serves as the Assistant Vice President of HLIC (February 2004 to present).
| 25 |
| Hartford MidCap HLS Fund |
| Directors and Officers (Unaudited) – (continued) |
Michael R. Dressen (1963) AML Compliance Officer since 2011
Mr. Dressen currently serves as Assistant Vice President of HLIC. He also serves as Chief Compliance Officer and AML Compliance Officer of HASCO and as AML Officer of HFD. Mr. Dressen has served in various positions within The Hartford and its subsidiaries in connection with the operation of the Hartford Funds.
Edward P. Macdonald (1967) Vice President, Secretary and Chief Legal Officer since 2005
Mr. Macdonald currently serves as Assistant Secretary, Executive Vice President and Deputy General Counsel of HFD, HASCO and HFMC. He also serves as Vice President of HLIC. Mr. Macdonald has served in various positions within The Hartford and its subsidiaries in connection with the operation of the Hartford Funds. Mr. Macdonald joined The Hartford in 2005.
Joseph G. Melcher (1973) Vice President and Chief Compliance Officer since 2013
Mr. Melcher currently serves as Executive Vice President of HASCO and HFD. Mr. Melcher also currently serves as Executive Vice President and Chief Compliance Officer of HFMC. Mr. Melcher has served in various positions within The Hartford and its subsidiaries in connection with the operation of the Hartford Funds since joining The Hartford in 2012. Prior to joining The Hartford, Mr. Melcher worked at Touchstone Investments, a member of the Western & Southern Financial Group, where he held the position of Vice President and Chief Compliance Officer from 2010 through 2012 and Assistant Vice President, Compliance from 2005 to 2010.
Vernon J. Meyer (1964) Vice President since 2006
Mr. Meyer currently serves as Senior Vice President of HLIC. He also currently serves as Managing Director and Chief Investment Officer of HFMC. Mr. Meyer has served in various positions within The Hartford and its subsidiaries in connection with the operation of the Hartford Funds. Mr. Meyer joined The Hartford in 2004.
Laura S. Quade (1969) Vice President since 2012
Ms. Quade currently serves as Vice President of HASCO and HFD. She is the Head of Operations of HASCO and also serves as Director, Enterprise Operations of HLIC. Ms. Quade has served in various positions within The Hartford and its subsidiaries in connection with the operation of the Hartford Funds.
Martin A. Swanson (1962) Vice President since 2010
Mr. Swanson currently serves as Vice President of HLIC. Mr. Swanson also serves as Managing Director, Chief Marketing Officer and Principal of HFD. Mr. Swanson has served in various positions within The Hartford and its subsidiaries in connection with the operation of the Hartford Funds.
HOW TO OBTAIN A COPY OF THE FUND’S PROXY VOTING POLICIES AND VOTING RECORDS (UNAUDITED)
A description of the policies and procedures that the Fund uses to determine how to vote proxies relating to portfolio securities and information about how the Fund voted proxies relating to portfolio securities during the most recent twelve-month period ended June 30 are available (1) without charge, upon request, by calling 800-862-6668 and (2) on the SEC’s website at http://www.sec.gov.
QUARTERLY PORTFOLIO HOLDINGS INFORMATION (UNAUDITED)
The Fund files a complete schedule of portfolio holdings with the SEC for the first and third quarters of each fiscal year on Form N-Q. The Fund’s Forms N-Q are available (1) without charge, upon request, by calling 800-862-6668 and (2) on the SEC’s website at http://www.sec.gov. The Form N-Q may be reviewed and copied at the SEC’s Public Reference Room in Washington, DC. Information on the operation of the Public Reference Room may be obtained by calling 1-800-SEC-0330.
| 26 |
| Hartford MidCap HLS Fund |
| Expense Example (Unaudited) |
Your Fund's Expenses
As a shareholder of the Fund, you incur two types of costs: (1) transaction costs and (2) ongoing costs, including investment management fees, distribution and/or service (12b-1) fees, if any, and other fund expenses. This example is intended to help you understand your ongoing costs (in dollars) of investing in the Fund and to compare these costs with the ongoing costs of investing in other mutual funds. The example is based on an investment of $1,000 invested at the beginning of the period and held for the period of June 30, 2013 through December 31, 2013.
Actual Expenses
The first set of columns of the table below provides information about actual account values and actual expenses. You may use the information in this column, together with the amount you invested, to estimate the expenses that you paid over the period. Simply divide your account value by $1,000 (for example, an $8,600 account value divided by $1,000 = 8.6), then multiply the result by the number in the line under the heading entitled “Expenses Paid During Period” to estimate the expenses you paid on your account during this period.
Hypothetical Example for Comparison Purposes
The second set of columns of the table below provides information about hypothetical account values and hypothetical expenses based on the Fund’s actual expense ratio and an assumed rate of return of 5% per year before expenses, which is not the Fund’s actual return. The hypothetical account values and expenses may not be used to estimate the actual ending account balance or expenses you paid for the period. You may use this information to compare the ongoing costs of investing in the Fund and other funds. To do so, compare this 5% hypothetical example with the 5% hypothetical examples that appear in the shareholder reports of the other funds.
Please note that the expenses shown in the table are meant to highlight your ongoing costs only and do not reflect any transactional costs, such as sales charges (loads) and CDSC. Therefore, the second set of columns of the table is useful in comparing ongoing costs only, and will not help you determine the relative total costs of owning different funds. In addition, if these transactional costs were included, your costs would be higher. Expenses are equal to the Fund's annualized expense ratios multiplied by average account value over the period, multiplied by 184/365 (to reflect the one-half year period).
| Actual return | Hypothetical (5% return before expenses) | |||||||||||||||||||||||||||||||||||
Beginning | Ending | Expenses paid during the period June 30, 2013 through December 31, 2013 | Beginning | Ending | Expenses paid | Annualized | Days in | Days | ||||||||||||||||||||||||||||
| Class IA | $ | 1,000.00 | $ | 1,192.70 | $ | 3.93 | $ | 1,000.00 | $ | 1,021.62 | $ | 3.62 | 0.71 | % | 184 | 365 | ||||||||||||||||||||
| Class IB | $ | 1,000.00 | $ | 1,191.20 | $ | 5.30 | $ | 1,000.00 | $ | 1,020.36 | $ | 4.89 | 0.96 | % | 184 | 365 | ||||||||||||||||||||
| 27 |
| Hartford MidCap HLS Fund |
| Approval of Investment Management and Investment Sub-Advisory Agreements (Unaudited) |
Section 15(c) of the Investment Company Act of 1940, as amended (the “1940 Act”), requires that each mutual fund’s board of directors, including a majority of those directors who are not “interested persons” of the mutual fund, as defined in the 1940 Act (the “Independent Directors”), annually review and consider the continuation of the mutual fund’s investment advisory and sub-advisory agreements. At its meeting held on August 6-7, 2013, the Board of Directors (the “Board”) of Hartford Series Fund, Inc., including each of the Independent Directors, unanimously voted to approve the continuation of the investment management agreement for Hartford MidCap HLS Fund (the “Fund”) with Hartford Funds Management Company, LLC (“HFMC”) and the continuation of the investment sub-advisory agreement between HFMC and the Fund’s sub-adviser, Wellington Management Company, LLP (the “Sub-adviser,” and together with HFMC, the “Advisers”) (collectively, the “Agreements”).
In the months preceding the August 6-7, 2013 meeting, the Board requested, received, and reviewed written responses from the Advisers to questions posed to them on behalf of the Independent Directors and supporting materials relating to those questions and responses. The Board considered information furnished to the Board at its meetings throughout the year, as well as information specifically prepared in connection with the annual approval of the Agreements at the Board’s meetings held on June 18-19, 2013 and August 6-7, 2013. Information provided to the Board at its meetings throughout the year included, among other things, reports on Fund performance, legal and compliance matters, sales and marketing activity, shareholder services, and the other services provided to the Fund by the Advisers and their affiliates. The Board also received in-person presentations by Fund officers and representatives of HFMC at the Board’s meetings on June 18-19, 2013 and August 6-7, 2013 concerning the Agreements.
The Independent Directors, advised by independent legal counsel, engaged two service providers to assist them with evaluating the Agreements with respect to the Fund. Lipper Inc. (“Lipper”), an independent provider of investment company data, was retained to provide the Board with reports on how the Fund’s contractual management fees, actual management fees, other non-management fees, overall expense ratios and investment performance compared to those of mutual funds with similar investment objectives. The Independent Directors also engaged an independent financial services consulting firm (the “Consultant”) to assist them in evaluating the Fund’s management fees, sub-advisory fees, other non-management fees, overall expense ratios and investment performance. In addition, the Consultant reviewed the profitability calculations utilized by HFMC in connection with the continuation of the investment management agreement.
In determining whether to continue the Agreements for the Fund, the members of the Board reviewed and evaluated information and factors they believed to be relevant and appropriate in light of the information that the Board deemed necessary and appropriate through the exercise of its reasonable business judgment. While individual members of the Board may have weighed certain factors differently, the Board’s determination to continue the Agreements was based on a comprehensive consideration of all information provided to the Board throughout the year and specifically with respect to the continuation of the Agreements. A more detailed discussion of the factors the Board considered with respect to its approval of the Agreements is provided below.
Nature, Extent, and Quality of Services Provided by the Advisers
The Board requested and considered information concerning the nature, extent, and quality of the services provided to the Fund by the Advisers. The Board considered, among other things, the terms of the Agreements and the range of services provided by the Advisers. The Board considered the Advisers’ professional personnel who provide services to the Fund, including each Adviser’s ability and experience in attracting and retaining qualified personnel to service the Fund. The Board considered each Adviser’s reputation and overall financial strength, as well as its willingness to consider and implement organizational and operational changes designed to improve services to the Fund. In addition, the Board considered the quality of each Adviser’s communications with the Board and responsiveness to Board inquiries.
The Board also requested and evaluated information concerning each Adviser’s regulatory and compliance environment. In this regard, the Board requested and reviewed information on each Adviser’s compliance policies and procedures, compliance history, and a report from the Fund’s Chief Compliance Officer on each Adviser’s compliance with applicable laws and regulations, including responses to regulatory developments and compliance issues raised by regulators. The Board also noted the Advisers’ support of the Fund’s compliance control structure, particularly the resources devoted by the Advisers in support of the Fund’s obligations pursuant to Rule 38a-1 under the 1940 Act.
| 28 |
With respect to HFMC, the Board noted that under the Agreements, HFMC is responsible for the management of the Fund, including overseeing fund operations and service providers, as well as investment advisory services in connection with selecting, monitoring and supervising the Sub-adviser. The Board considered HFMC’s ongoing monitoring of people, process and performance, including its quarterly reviews of each of the Hartford Funds, semi-annual meetings with the leaders of each Fund’s portfolio management team, and oversight of the Funds’ approximately 40 portfolio managers. The Board recognized that HFMC has demonstrated a record of making changes to the management and/or strategies of the Funds when warranted. The Board considered HFMC’s oversight of the Sub-adviser’s investment approach and results, process for monitoring best execution of portfolio trades by the Sub-adviser, and approach to risk management with respect to the Fund and the service providers to the Fund. The Board also considered HFMC’s oversight of compliance with the Fund’s objective and policies as well as with applicable laws and regulations, noting that regulatory and other developments had over time led to an increase in the scope of HFMC’s services in this regard.
In addition, the Board considered HFMC’s ongoing commitment to review and rationalize the Hartford Funds product line-up and the expenses that HFMC had incurred in connection with fund combinations in recent years. The Board considered that HFMC or its affiliates are responsible for providing the Fund’s officers. The Board also noted that Hartford Life Insurance Company (“HLIC”) provides administrative services to the Fund. The Board considered its experiences with HFMC and HLIC with respect to each of these services.
With respect to the Sub-adviser, who provides day-to-day portfolio management services, the Board considered the quality of the Fund’s portfolio managers, the Sub-adviser’s other investment personnel, its investment philosophy and process, investment research capabilities and resources, performance record, trade execution capabilities and experience. The Board considered the experience of the Fund’s portfolio managers, the number of accounts managed by the portfolio managers, and the Sub-adviser’s method for compensating the portfolio managers.
Based on these considerations, the Board concluded that it was satisfied with the nature, extent and quality of the services provided to the Fund by HFMC and the Sub-adviser.
Performance of the Fund and the Advisers
The Board considered the investment performance of the Fund. In this regard, the Board reviewed the performance of the Fund over different time periods presented in the materials and evaluated HFMC’s analysis of the Fund’s performance for these time periods. The Board considered information and materials provided to the Board by the Advisers concerning Fund performance, as well as information from Lipper comparing the investment performance of the Fund to an appropriate benchmark and universe of peer funds. The Board noted that the Fund’s performance was in the 3rd quintile of its performance universe for the 1- and 5-year periods and the 4th quintile for the 3-year period. The Board also noted that the Fund’s performance was in line with its benchmark for the 1-year period and below its benchmark for the 3- and 5-year periods. The Board considered that, in response to questions raised concerning the Fund’s performance, HFMC stated that it has confidence in the Fund’s portfolio management team and investment strategy.
The Board considered the detailed investment analytics reports provided by Hartford Funds’ Investment Advisory Group throughout the year. These reports include, among other things, information on the Fund’s gross and net returns, the Fund’s investment performance relative to an appropriate benchmark and peer group, various statistics concerning the Fund’s portfolio, and a narrative summary of various factors affecting Fund performance. The Board considered the Advisers’ cooperation with the Investment Committee, which assists the Board in evaluating the performance of the Fund at periodic meetings throughout the year. The Board also considered the analysis provided by the Consultant relating to the Fund’s performance track record.
In light of all the considerations noted above, the Board concluded that it had continued confidence in HFMC’s and the Sub-adviser’s overall capabilities to manage the Fund.
| 29 |
| Hartford MidCap HLS Fund |
| Approval of Investment Management and Investment Sub-Advisory Agreements (Unaudited) – (continued) |
Costs of the Services and Profitability of the Advisers
The Board reviewed information regarding HFMC’s cost to provide investment management and related services to the Fund and HFMC’s profitability, both overall and for the Fund, on a pre-tax basis without regard to distribution expenses. The Board also requested and reviewed information about the profitability to HFMC and its affiliates from all services provided to the Fund and all aspects of their relationship with the Fund. The Board also requested and received information relating to the operations and profitability of the Sub-adviser.
The Board considered the Consultant’s review of the profitability calculations utilized by HFMC in connection with the continuation of the investment management agreement, noting the Consultant’s view that Hartford Funds’ process for calculating and reporting Fund profitability is reasonable. In this regard, the Board noted that the Consultant had previously performed a full review of this process and reported that such process is sound and well within common industry practice.
Based on these considerations, the Board concluded that the profits anticipated to be realized by the Advisers and their affiliates from their relationships with the Fund would not be excessive.
Comparison of Fees and Services Provided by the Advisers
The Board considered comparative information with respect to the management fees to be paid by the Fund to HFMC and the total expense ratios of the Fund. The Board also considered comparative information with respect to the sub-advisory fees to be paid by HFMC to the Sub-adviser. In this regard, the Board requested and reviewed information from HFMC and the Sub-adviser relating to the management and sub-advisory fees, including the sub-advisory fee schedule for the Fund, and total operating expenses for the Fund. The Board considered that the management fee for the Fund includes the fee paid to HLIC for providing certain administrative services to the Fund. With respect to the sub-advisory fee schedule, the Board considered representations from HFMC and the Sub-adviser that the Sub-adviser’s fees were negotiated at arm’s length. The Board also reviewed information from Lipper comparing the Fund’s contractual management fees, actual management fees and overall expense ratios relative to a group of funds selected by Lipper, in consultation with the Consultant, and a broader universe of funds selected by Lipper. The Board noted that the Fund’s contractual management fee and actual management fee were in the 2nd quintile of its expense group, while its total expenses (less 12b-1 and shareholder service fees) were in the 1st quintile.
While the Board recognized that comparisons between the Fund and peer funds are imprecise, given the differing service levels and characteristics of mutual funds and the different business models and cost structures of the Advisers, the comparative information provided by Lipper assisted the Board in evaluating the reasonableness of the Fund’s management and sub-advisory fees and total operating expenses. In addition, the Board considered the analysis and recommendations of the Consultant relating to the Fund’s management and sub-advisory fees and total operating expenses.
Based on these considerations, the Board concluded that the Fund’s fees and total operating expenses, in conjunction with the information about quality of services, profitability, economies of scale, and other matters discussed, were reasonable in light of the services provided.
Economies of Scale
The Board requested and considered information regarding the Advisers’ realization of economies of scale with respect to the Fund and whether the fee levels reflect these economies of scale for the benefit of the Fund’s shareholders. The Board reviewed the breakpoints in the management fee schedule for the Fund, which reduce fee rates as Fund assets grow over time. The Board recognized that a fund with assets beyond the last breakpoint level will continue to benefit from economies of scale because additional assets are charged the lowest breakpoint fee resulting in lower overall effective management fee rates. The Board also recognized that a fee schedule that reaches a lower breakpoint quickly provides shareholders with the benefit of anticipated or potential economies of scale. The Board noted the effect of the sale and run-off of the variable annuity business on the HLS Funds.
The Board reviewed and evaluated materials from Lipper showing how management fee schedules of peer funds reflect economies of scale for the benefit of shareholders as a peer fund’s assets hypothetically increase over time. Based on information
| 30 |
provided by HFMC, Lipper, and the Consultant, the Board recognized that there is no uniform methodology for establishing breakpoints or uniform pattern in asset levels that trigger breakpoints or the amounts of breakpoints triggered.
After considering all of the information available to it, the Board concluded that it was satisfied with the extent to which economies of scale would be shared for the benefit of the Fund’s shareholders based on currently available information and the effective advisory fees and expense ratios for the Fund at its current and reasonably anticipated asset levels. The Board noted, however, that it would continue to monitor future growth in Fund assets and the appropriateness of additional breakpoints.
Other Benefits
The Board considered other benefits to the Advisers and their affiliates from their relationships with the Fund, including the role of the Fund in supporting the variable life insurance and variable annuity products offered by The Hartford.
The Board reviewed information noting that HLIC, an affiliate of HFMC, receives fees for providing certain administrative services to the Fund and that HFMC receives fees for fund accounting and related services from the Fund. The Board considered information on profits to HLIC and HFMC for such services. The Board also considered that Hartford Administrative Services Company (“HASCO”), the Fund’s transfer agent and an affiliate of HFMC, receives transfer agency compensation from the Fund, and the Board reviewed information on the profitability of the Fund’s transfer agency function to HASCO. The Board considered information provided by HASCO indicating that the transfer agent fees charged by HASCO to the Fund were fair and reasonable based on publicly available information.
The Board also considered that Hartford Funds Distributors, LLC (“HFD”), an affiliate of HFMC, serves as principal underwriter of the Fund. As principal underwriter, HFD receives 12b-1 fees from the Fund. The Board also noted that certain affiliates of HFD distribute shares of the Fund and receive compensation in that connection.
The Board considered benefits to the Sub-adviser from its use of the Fund’s brokerage commissions to obtain soft dollar research, and representations from HFMC and the Sub-adviser that the Sub-adviser would not make any revenue-sharing payments or any other type of distribution payments to HFMC or its affiliates.
The Board considered the benefits to shareholders of being part of the Hartford Funds family of funds. The Board considered HFMC’s efforts to provide investors in the family with a broad range of investment styles and asset classes.
* * * *
Based upon its review of these various factors, among others, the Board concluded that it is in the best interests of the Fund and its shareholders for the Board to approve the Agreements for an additional year. In reaching this decision, the Board did not assign relative weights to the factors discussed above or deem any one or group of them to be controlling in and of themselves. In connection with their deliberations, the Independent Directors met separately in executive session on several occasions, with independent legal counsel and the Consultant, to review the relevant materials and consider their responsibilities under relevant laws and regulations.
| 31 |
| Hartford MidCap HLS Fund |
| Main Risks (Unaudited) |
The main risks of investing in the Fund are described below.
Market, Selection, and Strategy Risk: The Fund’s share price may fluctuate due to market risk and/or security selections that may underperform the market or relevant benchmarks. If the sub-adviser’s investment strategy does not perform as expected, the Fund could underperform its peers or lose money. There is no guarantee the Fund will achieve its stated objective.
Mid-cap Stock Risk: Mid-cap stocks are generally more volatile and risky and may be less liquid than large-cap stocks because they may have limited operating histories, narrow product lines, and focus on niche markets.
Foreign Investment Risk: Foreign investments can be riskier than U.S. investments. Potential risks include currency risk that may result from unfavorable exchange rates, liquidity risk if decreased demand for a security makes it difficult to sell at the desired price, and risks that stem from substantially lower trading volume on foreign markets.
| 32 |
THIS PRIVACY POLICY IS NOT PART OF THIS REPORT
Privacy Policy and Practices of The Hartford Financial Services Group, Inc. and its Affiliates
(herein called “we, our, and us”)
This Privacy Policy applies to our United States Operations
We value your trust. We are committed to the responsible: a) management; b) use; and c) protection; of Personal Information. This notice describes how we collect, disclose, and protect Personal Information.
We collect Personal Information to: a) service your Transactions with us; and b) support our business functions.
We may obtain Personal Information from: a) You; b) your Transactions with us; and c) third parties such as a consumer-reporting agency.
Based on the type of product or service You apply for or get from us, Personal Information such as: a) your name; b) your address; c) your income; d) your payment; or e) your credit history; may be gathered from sources such as applications, Transactions, and consumer reports.
To serve You and service our business, we may share certain Personal Information. We will share Personal Information, only as allowed by law, with affiliates such as: a) our insurance companies; b) our employee agents; c) our brokerage firms; and d) our administrators.
As allowed by law, we may share Personal Financial Information with our affiliates to: a) market our products; or b) market our services; to You without providing You with an option to prevent these disclosures. | We may also share Personal Information, only as allowed by law, with unaffiliated third parties including:
When allowed by law, we may share certain Personal Financial Information with other unaffiliated third parties who assist us by performing services or functions such as:
We, and third parties we partner with, may track some of the pages You visit through the use of: a) cookies; b) pixel tagging; or c) other technologies; and currently do not process or comply with any web browser’s “do not track” signal or similar mechanism that indicates a request to disable online tracking of individual users who visit our websites or use our services.
We will not sell or share your Personal Financial Information with anyone for purposes unrelated to our business functions without offering You the opportunity to:
We only disclose Personal Health Information with:
Our employees have access to Personal Information in the course of doing their jobs, such as: |
We use manual and electronic security procedures to maintain: a) the confidentiality; and b) the integrity of; Personal Information that we have. We use these procedures to guard against unauthorized access.
Some techniques we use to protect Personal Information include: a) secured files; b) user authentication; c) encryption; d) firewall technology; and e) the use of detection software.
We are responsible for and must: a) identify information to be protected; b) provide an adequate level of protection for that data; c) grant access to protected data only to those people who must use it in the performance of their job-related duties. Employees who violate our Privacy Policy will be subject to discipline, which may include ending their employment with us.
At the start of our business relationship, we will give You a copy of our current Privacy Policy.
We will also give You a copy of our current Privacy Policy once a year if You maintain a continuing business relationship with us.
We will continue to follow our Privacy Policy regarding Personal Information even when a business relationship no longer exists between us. | As used in this Privacy Notice:
Application means your request for our product or service.
Personal Financial Information means financial information such as:
Personal Health Information means health information such as:
Personal Information means information that identifies You personally and is not otherwise available to the public. It includes:
Transaction means your business dealings with us, such as:
You means an individual who has given us Personal Information in conjunction with: |
This Privacy Policy is being provided on behalf of the following affiliates of The Hartford Financial Services Group, Inc.:
1stAGChoice, Inc.; Access CoverageCorp, Inc.; Access CoverageCorp Technologies, Inc.; American Maturity Life Insurance Company; Archway 60 R, LLC; Business Management Group, Inc.; Catalyst360, LLC; Champlain Life Reinsurance Company; DMS R, LLC; Eloy R, LLC; Ersatz Corporation; First State Insurance Company; Hartford Accident and Indemnity Company; Hartford Administrative Services Company; Hartford Casualty General Agency, Inc.; Hartford Casualty Insurance Company; Hartford-Comprehensive Employee Benefit Service Company; Hartford Equity Sales Company, Inc.; Hartford Fire General Agency, Inc.; Hartford Fire Insurance Company; Hartford Funds Management Company, LLC; Hartford Funds Management Group, Inc.; Hartford HLS Series Fund II, Inc.; Hartford Insurance Company of Illinois; Hartford Insurance Company of the Midwest; Hartford Insurance Company of the Southeast; Hartford Integrated Technologies, Inc.; Hartford International Life Reassurance Corporation; Hartford Funds Distributors, LLC; Hartford Investment Management Company; Hartford Life and Accident Insurance Company; Hartford Life and Annuity Insurance Company; Hartford Life Insurance Company; Hartford Life Private Placement, LLC; Hartford Lloyd’s Corporation; Hartford Lloyd’s Insurance Company; Hartford Mezzanine Investors I, LLC; Hartford Residual Market, L.C.C.; Hartford Retirement Services, LLC; Hartford Securities Distribution Company, Inc.; Hartford Series Fund, Inc.; Hartford Specialty Insurance Services of Texas, LLC; Hartford Strategic Investments, LLC; Hartford Underwriters Insurance Company; Hartford Technology Services Company, L.L.C.; Hartford of Texas General Agency, Inc.; Hartford Underwriters General Agency, Inc.; HARTRE Company, L.C.C.; HL Investment Advisors, LLC; HLA LLC; Horizon Management Group, LLC; HRA Brokerage Services, Inc.; Lanidex Class B, LLC; M-CAP Insurance Agency, LLC; New England Insurance Company; New England Reinsurance Corporation; Nutmeg Insurance Agency, Inc.; Nutmeg Insurance Company; Pacific Insurance Company, Limited; Planco, LLC: Property and Casualty Insurance Company of Hartford; Revere R, LLC; RVR R, LLC; Sentinel Insurance Company, Ltd.; Sunstone R, LLC; Symphony R, LLC; The Evergreen Group Incorporated; The Hartford Alternative Strategies Fund; The Hartford Mutual Funds, Inc.; The Hartford Mutual Funds II, Inc.; Trumbull Flood Management, L.L.C.; Trumbull Insurance Company; Twin City Fire Insurance Company; White River Life Reinsurance Company.
HPP Revised December 2013
HARTFORD HLS FUNDS
c/o The Hartford Wealth Management - Global Annuities
P.O. Box 14293
Lexington, KY 40512-4293
HARTFORDFUNDS
hartfordfunds.com
Hartford Series Fund, Inc. is underwritten and distributed by Hartford Funds Distributors, LLC.
Hartford Series Fund, Inc. inception dates range from 1977 to date. Hartford Series Fund, Inc. is not a subsidiary of The Hartford Financial Services Group, Inc. ("The Hartford") but is underwritten, distributed by and advised by subsidiaries of The Hartford. Investments in Hartford Series Fund, Inc. are not guaranteed by The Hartford or any other entity.
This report is submitted for the general information of the shareholders of the Funds. It is not authorized for distribution unless preceded or accompanied by a current prospectus for the Funds.
Investors should carefully consider the investment objectives, risks, charges, and expenses of Hartford Funds before investing. This and other information can be found in the prospectus and summary prospectus, which can be obtained by calling 888-843-7824 (retail) or 877-836-5854 (institutional). Investors should read them carefully before they invest.
HLSAR-MC13 2-14 113547-2 Printed in U.S.A ©2013 The Hartford, Hartford, CT 06115
HARTFORDFUNDS
| HARTFORD MIDCAP VALUE
HLS FUND
2013 Annual Report
|
A MESSAGE FROM THE PRESIDENT
Dear Fellow Shareholders:
Thank you for investing in Hartford HLS Funds.
Market Review
U.S. equities (as represented by the S&P 500 Index) generated their strongest year since 1997 in 2013, rising 32.39% for the year. During the fourth quarter, equities rose without looking back, pushing the S&P 500 Index and the Dow Jones Industrial Average to new all-time highs. Despite previously cheering delays to quantitative-easing tapering, the stock market received an additional boost at the end of the year following the U.S. Federal Reserve’s (Fed) announcement of a $10-billion-a-month reduction in bond purchases beginning in January.
The Fed’s decision to begin tapering its bond purchases is generally considered a vote of confidence in the recovering U.S. economy. Consumer spending has stabilized, the housing market is showing steady improvement, the unemployment rate is slowly declining and economic growth clocked in at a healthy 4.1% in the third quarter. Equities have also recovered since the market low in March 2009: The S&P 500 Index has gained 173% from the market low through December 31, 2013.
Signs of improvement are also visible outside the U.S. Europe appears to have begun its own economic recovery, and emerging markets have reversed their recent lackluster performance. Fiscal policy continues to wield significant influence in today’s economy and central banks across the globe are maintaining their accommodative stances, including the appointment of Janet Yellen, who is widely expected to continue current monetary policies, to succeed Ben Bernanke as U.S. Federal Reserve chairman.
It’s important to stay abreast of domestic and international economic developments while balancing your individual investment goals. Meeting with your financial advisor on a regular basis to examine your current investment strategy can help you determine whether you are on the right track:
| • | Is your portfolio fully diversified with an appropriate mix of stocks and bonds? |
| • | Is your portfolio incorporating both domestic and international holdings to take advantage of the global economic recovery? |
| • | Are your investments still in line with your risk tolerance and investment time horizon? |
Your financial advisor can help you choose options within our fund family to navigate today’s markets with confidence.
Thank you again for investing with Hartford HLS Funds.
James Davey
President
Hartford HLS Funds
1The S&P 500 Index is a market capitalization-weighted price index composed of 500 widely held common stocks.
2The Dow Jones Industrial Average is an unmanaged, price-weighted index of 30 of the largest, most widely held stocks traded on the New York Stock Exchange.
Hartford MidCap Value HLS Fund
Table of Contents
This report is prepared for the general information of contract owners and qualified retirement plan participants. It is not an offer of contracts or of qualified retirement plans. It should not be used in connection with any offer, except in conjunction with the appropriate product prospectus which contains all pertinent information including the applicable sales, administrative and other charges.
The views expressed in the Fund’s Manager Discussion under ‘‘Why did the Fund perform this way?’’ and ‘‘What is the outlook?’’ are views of the Fund’s sub-adviser and portfolio management team through the end of the period and are subject to change based on market and other conditions. The Fund’s Manager Discussion is for informational purposes only and does not represent an offer, recommendation or solicitation to buy, hold or sell any security. The specific securities identified and described, if any, do not represent all of the securities purchased or sold and you should not assume that investments in the securities identified and discussed will be profitable.
Hartford MidCap Value HLS Fund* inception 04/30/2001
(sub-advised by Wellington Management Company, LLP)
| Investment objective – Seeks long-term capital appreciation. |
Performance Overview 12/31/03 - 12/31/13

The chart above represents the hypothetical growth of a $10,000 investment in Class IA. Growth results in classes other than Class IA will vary from what is seen above due to differences in the expenses charged to those share classes.
Average Annual Total Returns (as of 12/31/13)
| 1 Year | 5 Years | 10 Years | ||||
| MidCap Value IA | 34.71% | 22.57% | 9.80% | |||
| MidCap Value IB | 34.37% | 22.27% | 9.53% | |||
| Russell 2500 Value Index | 33.32% | 19.61% | 9.29% | |||
| Russell Midcap Value Index | 33.46% | 21.16% | 10.25% |
PERFORMANCE DATA QUOTED REPRESENTS PAST PERFORMANCE AND DOES NOT GUARANTEE FUTURE RESULTS. The investment return and principal value of the investment will fluctuate so that investors’ shares, when redeemed, may be worth more or less than their original cost. Current performance may be lower or higher than the performance data quoted. To obtain performance data current to the most recent month-end, please visit our website at www.hartfordfunds.com.
Total returns presented above were calculated using the Fund’s net asset value available to shareholders for sale or redemption of Fund shares on December 31, 2013, which may exclude investment transactions as of this date. All share class returns assume the reinvestment of all distributions at net asset value and the deduction of all fund expenses.
Russell 2500 Value Index is an unmanaged index measuring the performance of those Russell 2500 Index companies with lower price-to-book ratios and lower forecasted growth values. (The Russell 2500 Index is an unmanaged index that measures the performance of the 2,500 smallest U.S. companies based on total market capitalization.)
Russell Midcap Value Index measures the performance of the mid-cap value segment of the U.S. equity universe. It includes those Russell Midcap Index companies with lower price-to-book ratios and lower forecasted growth values.
You cannot invest directly in an index.
As of the Fund's current prospectus dated May 1, 2013, the net total annual operating expense ratios for Class IA and Class IB shares were 0.85% and 1.10% respectively. Actual expenses may be higher. Please see the accompanying Financial Highlights for expense ratios for the year ended December 31, 2013.
The chart and table do not reflect the deductions of taxes, sales charges or other fees which may be applied at the variable life insurance, variable annuity or qualified retirement plan product level. Any such additional sales charges or other fees or expenses would lower the contract’s or plan’s performance.
All investments are subject to risk including the possible loss of principal. For a discussion of the Fund’s risks, please see the Main Risks section of this report. For more detailed information on the risks associated with an investment in the Fund, please see the prospectus.
| * | The Fund has restrictions on the purchase of shares. A description of the restrictions can be found in the prospectus |
| 2 |
| Hartford MidCap Value HLS Fund |
| Manager Discussion |
| December 31, 2013 (Unaudited) |
| Portfolio Manager |
| James N. Mordy |
| Senior Vice President and Equity Portfolio Manager |
How did the Fund perform?
The Class IA shares of the Hartford MidCap Value HLS Fund returned 34.71% for the twelve-month period ended December 31, 2013, outperforming the Fund’s benchmark, the Russell 2500 Value Index, which returned 33.32% for the same period. The Fund, however, underperformed the 35.85% average return of the Variable Products-Underlying Funds Lipper Mid-Cap Value Fund peer group, a group of funds with investment strategies similar to those of the Fund.
Why did the Fund perform this way?
U.S. equities reached another all-time high in December and finished 2013 with a gain of 32.4%, as measured by the S&P 500 Index, the Index’s best return since 1997. The rally in U.S. equities began on the first trading day of the year after a last-minute compromise by the U.S. Congress averted the fiscal cliff. Optimism surrounding the fiscal reprieve was furthered during the first quarter by better-than-expected corporate earnings, a robust housing market, and a steadily improving employment picture. Solid gains in April and the first part of May paused following comments by U.S. Federal Reserve (Fed) Chairman Ben Bernanke that suggested the Fed might begin to slow quantitative easing sooner than investors anticipated. Nonetheless, equities resumed their ascent in the third quarter as the surprising “no taper” decision by the Federal Open Market Committee eased near-term concerns about rapidly rising interest rates derailing the recovery. Additionally, accommodative rhetoric from the European Central Bank, along with encouraging data in China and further evidence of a European economic recovery, contributed to a broad-based global equity rally that extended through the end of the year. In December, the year ended with an optimistic tone as investors cheered the elimination of two market overhangs: the timing of Fed tapering and the threat of another U.S. government shutdown in early 2014.
During the period, mid cap equities (+34%) underperformed small caps (+39%) but outperformed large caps (+32%) as represented by the S&P 400 MidCap, Russell 2000, and S&P 500 Indices, respectively. All ten sectors in the Russell 2500 Value Index gained during the period, with Health Care (+45.3%), Industrials (+45.0%), and Consumer Discretionary (+43.3%) performing the best. Utilities (+20.1%) and Energy (+24.4%) lagged on a relative basis.
The Fund’s relative outperformance versus the benchmark index was primarily due to sector allocation, a result of the bottom-up security selection process. An underweight to Financials and Utilities and an overweight to Information Technology were the primary drivers of benchmark-relative outperformance. Overall, security selection also contributed to positive results driven by strong stock selection within Industrials, Financials, and Materials, which outweighed weaker stock selection within Energy, Consumer Staples, and Health Care.
The largest contributors to benchmark-relative performance included Methanex (Materials), Unum Group (Financials), and Delta Air Lines (Industrials). Shares of Methanex, a Canada-based supplier of methanol to international markets in Asia Pacific, North America, Europe and Latin America, rose as the company started to relocate its idle facility from Chile to the U.S. to take advantage of cheap U.S. natural gas. This is a key element of management's strategy to boost capacity utilization and should provide more visible earnings growth over the next few years. Shares of Unum Group, a benefits and disability insurer, gained as management downplayed the need for additional provisioning against its long-term care exposure and also benefitted as interest rates rose. Shares of Delta Air Lines, a U.S.-based airline, rose during the period as Delta's March quarter was profitable for the first time in thirteen years, and the company announced strong third quarter results with solid earnings and operating profit improvement. Almirall SA (health care) also contributed to the Fund’s absolute performance.
The largest detractors from benchmark-relative returns included Cobalt International Energy (Energy), Impax Lab (Health Care), and BR Properties (Financials). Shares of Cobalt International Energy, an offshore energy explorer, fell as a result of disappointing well test results at the company’s Lontra well off the coast of Angola. Shares of Impax Lab, a U.S.-based pharmaceutical company, declined during the period after the company failed a critical inspection by the U.S. Food and Drug Administration (FDA) of a key manufacturing facility. This will result in further delays to potential new drug approvals. Shares of BR Properties, a Brazil-based company engaged in the real estate sector, underperformed on weaker sentiment towards Brazilian equities (negative money flow) ahead of a potential interest rate tightening cycle in Brazil, and on moderately higher office supply in Sao Paolo. Aeropostale (Consumer Discretionary) also detracted from the Fund’s absolute performance.
| 3 |
| Hartford MidCap Value HLS Fund |
| Manager Discussion – (continued) |
| December 31, 2013 (Unaudited) |
Derivatives are not used in a significant manner in this Fund and did not have a material impact on performance during the period.
What is the outlook?
Our macroeconomics group projects global gross domestic product (GDP) growth of roughly 3% in 2014. We expect the U.S. to be boosted by reduced fiscal drag, Europe should be somewhat improved, and emerging markets appear mixed with China stabilizing above 7% growth. Policy risk remains, but seems diminished versus recent years. We believe this should still be a healthy environment for equities, even if long-term interest rates edge gradually higher. However, in our opinion consensus expectations for growth have risen, along with valuations, and if unemployment continues to drop, investors are likely to increasingly fret about tighter Fed policy as the year progresses.
We did not make major changes to sector positioning during the quarter, other than to move to a slight overweight in Consumer Discretionary and a slight underweight in Energy. Given our outlook, we continue to believe that pro-cyclical positioning is appropriate; however, some valuation opportunities in some of the more interest rate sensitive groups are starting to emerge.
Despite the rise in mid-cap valuations generally, we continue to find opportunities to buy good companies at relatively discounted prices and observe that our portfolio still sells at a significant discount to our benchmark index on a forward price-earnings (P/E) basis.
As of the end of the period we were most overweight in the Information Technology, Industrials, and Materials sectors and most underweight in the Financials, Utilities, and Energy sectors relative to the benchmark.
| Diversification by Sector | ||||
| as of December 31, 2013 | ||||
| Sector | Percentage of Net Assets | |||
| Equity Securities | ||||
| Consumer Discretionary | 11.9 | % | ||
| Consumer Staples | 3.3 | |||
| Energy | 5.4 | |||
| Financials | 25.1 | |||
| Health Care | 8.1 | |||
| Industrials | 16.9 | |||
| Information Technology | 14.5 | |||
| Materials | 9.2 | |||
| Utilities | 4.6 | |||
| Total | 99.0 | % | ||
| Short-Term Investments | 0.7 | |||
| Other Assets and Liabilities | 0.3 | |||
| Total | 100.0 | % | ||
A sector may be comprised of several industries. For Fund compliance purposes, the Fund may not use the same classification system and these sector classifications are used for reporting ease.
| 4 |
| Hartford MidCap Value HLS Fund |
| Schedule of Investments |
| December 31, 2013 |
| (000’s Omitted) |
| Shares or Principal Amount | Market Value ╪ | |||||||
| COMMON STOCKS - 99.0% | ||||||||
| Automobiles and Components - 0.9% | ||||||||
| 193 | Goodyear (The) Tire & Rubber Co. | $ | 4,591 | |||||
| Banks - 7.3% | ||||||||
| 180 | BankUnited, Inc. | 5,932 | ||||||
| 182 | Comerica, Inc. | 8,652 | ||||||
| 325 | EverBank Financial Corp. | 5,953 | ||||||
| 157 | First Midwest Bancorp, Inc. | 2,747 | ||||||
| 88 | Iberiabank Corp. | 5,512 | ||||||
| 256 | Zions Bancorporation | 7,664 | ||||||
| 36,460 | ||||||||
| Capital Goods - 15.9% | ||||||||
| 265 | Barnes Group, Inc. | 10,154 | ||||||
| 86 | Chicago Bridge & Iron Co. N.V. | 7,183 | ||||||
| 89 | Curtis-Wright Corp. | 5,563 | ||||||
| 95 | Esterline Technologies Corp. ● | 9,674 | ||||||
| 76 | Hubbell, Inc. Class B | 8,255 | ||||||
| 185 | KBR, Inc. | 5,893 | ||||||
| 117 | Moog, Inc. Class A ● | 7,976 | ||||||
| 75 | Pentair Ltd. | 5,794 | ||||||
| 244 | Rexel S.A. | 6,416 | ||||||
| 20 | Teledyne Technologies, Inc. ● | 1,819 | ||||||
| 122 | WESCO International, Inc. ● | 11,147 | ||||||
| 79,874 | ||||||||
| Consumer Durables and Apparel - 5.8% | ||||||||
| 135 | Lennar Corp. | 5,329 | ||||||
| 279 | Newell Rubbermaid, Inc. | 9,033 | ||||||
| 2,513 | Samsonite International S.A. | 7,666 | ||||||
| 188 | Toll Brothers, Inc. ● | 6,963 | ||||||
| 28,991 | ||||||||
| Consumer Services - 1.4% | ||||||||
| 191 | Norwegian Cruise Line Holdings Ltd. ● | 6,775 | ||||||
| Diversified Financials - 1.6% | ||||||||
| 173 | LPL Financial Holdings, Inc. | 8,131 | ||||||
| 452 | Solar Cayman Ltd. ⌂■●† | 32 | ||||||
| 8,163 | ||||||||
| Energy - 5.4% | ||||||||
| 389 | Cobalt International Energy, Inc. ● | 6,401 | ||||||
| 49 | Diamondback Energy, Inc. ● | 2,595 | ||||||
| 36 | HollyFrontier Corp. | 1,784 | ||||||
| 139 | Newfield Exploration Co. ● | 3,426 | ||||||
| 114 | Ocean Rig UDW, Inc. ● | 2,187 | ||||||
| 187 | QEP Resources, Inc. | 5,737 | ||||||
| 395 | Trican Well Service Ltd. | 4,828 | ||||||
| 26,958 | ||||||||
| Food, Beverage and Tobacco - 3.3% | ||||||||
| 15 | Bunge Ltd. Finance Corp. | 1,256 | ||||||
| 223 | Ebro Foods S.A. | 5,236 | ||||||
| 99 | Ingredion, Inc. | 6,805 | ||||||
| 809 | Treasury Wine Estates Ltd. | 3,488 | ||||||
| 16,785 | ||||||||
| Health Care Equipment and Services - 3.5% | ||||||||
| 283 | Brookdale Senior Living, Inc. ● | 7,678 | ||||||
| 58 | Community Health Systems, Inc. ● | 2,270 | ||||||
| 111 | Wellcare Health Plans, Inc. ● | 7,810 | ||||||
| 17,758 | ||||||||
| Insurance - 9.4% | ||||||||
| 97 | Argo Group International Holdings Ltd. | 4,519 | ||||||
| 135 | Hanover Insurance Group, Inc. | 8,061 | ||||||
| 55 | Principal Financial Group, Inc. | 2,732 | ||||||
| 152 | Reinsurance Group of America, Inc. | 11,775 | ||||||
| 356 | Unum Group | 12,499 | ||||||
| 237 | XL Group plc | 7,539 | ||||||
| 47,125 | ||||||||
| Materials - 9.2% | ||||||||
| 141 | Cabot Corp. | 7,232 | ||||||
| 117 | Celanese Corp. | 6,471 | ||||||
| 337 | Louisiana-Pacific Corp. ● | 6,242 | ||||||
| 203 | Methanex Corp. ADR | 12,049 | ||||||
| 128 | Owens-Illinois, Inc. ● | 4,587 | ||||||
| 120 | Packaging Corp. of America | 7,619 | ||||||
| 245 | Rexam plc | 2,155 | ||||||
| 46,355 | ||||||||
| Media - 1.7% | ||||||||
| 93 | AMC Entertainment Holdings ● | 1,917 | ||||||
| 370 | Interpublic Group of Cos., Inc. | 6,551 | ||||||
| 8,468 | ||||||||
| Pharmaceuticals, Biotechnology and Life Sciences - 4.6% | ||||||||
| 682 | Almirall S.A. | 11,111 | ||||||
| 72 | Ono Pharmaceutical Co., Ltd. | 6,267 | ||||||
| 75 | UCB S.A. | 5,591 | ||||||
| 22,969 | ||||||||
| Real Estate - 6.8% | ||||||||
| 168 | American Assets Trust, Inc. REIT | 5,265 | ||||||
| 218 | Blackstone Mortgage Trust, Inc. REIT | 5,904 | ||||||
| 166 | Equity Lifestyle Properties, Inc. REIT | 6,029 | ||||||
| 88 | Extra Space Storage, Inc. REIT | 3,707 | ||||||
| 255 | Forest City Enterprises, Inc. REIT ● | 4,878 | ||||||
| 102 | Hatteras Financial Corp. REIT | 1,665 | ||||||
| 138 | Plum Creek Timber Co., Inc. REIT | 6,395 | ||||||
| 33,843 | ||||||||
| Retailing - 2.1% | ||||||||
| 171 | Express, Inc. ● | 3,183 | ||||||
| 109 | GNC Holdings, Inc. | 6,394 | ||||||
| 13 | Ross Stores, Inc. | 982 | ||||||
| 10,559 | ||||||||
| Semiconductors and Semiconductor Equipment - 8.1% | ||||||||
| 205 | Avago Technologies Ltd. | 10,858 | ||||||
| 153 | Maxim Integrated Products, Inc. | 4,267 | ||||||
| 313 | Microsemi Corp. ● | 7,807 | ||||||
| 212 | NXP Semiconductors N.V. ● | 9,756 | ||||||
| 275 | Skyworks Solutions, Inc. ● | 7,845 | ||||||
| 40,533 | ||||||||
| Software and Services - 3.7% | ||||||||
| 214 | Booz Allen Hamilton Holding Corp. | 4,094 | ||||||
| 94 | Check Point Software Technologies Ltd. ADR ● | 6,091 | ||||||
| 194 | Verint Systems, Inc. ● | 8,322 | ||||||
| 18,507 | ||||||||
| Technology Hardware and Equipment - 2.7% | ||||||||
| 205 | Arrow Electronics, Inc. ● | 11,105 | ||||||
| 35 | SanDisk Corp. | 2,462 | ||||||
| 13,567 | ||||||||
| Transportation - 1.0% | ||||||||
| 120 | Avis Budget Group, Inc. ● | 4,842 | ||||||
| Utilities - 4.6% | ||||||||
| 104 | Alliant Energy Corp. | 5,371 | ||||||
The accompanying notes are an integral part of these financial statements.
| 5 |
| Hartford MidCap Value HLS Fund |
| Schedule of Investments – (continued) |
| December 31, 2013 |
| (000’s Omitted) |
| Shares or Principal Amount | Market Value ╪ | |||||||||||
| COMMON STOCKS - 99.0% - (continued) | ||||||||||||
| Utilities - 4.6% - (continued) | ||||||||||||
| 148 | Great Plains Energy, Inc. | $ | 3,585 | |||||||||
| 182 | UGI Corp. | 7,529 | ||||||||||
| 151 | Westar Energy, Inc. | 4,861 | ||||||||||
| 42 | Wisconsin Energy Corp. | 1,753 | ||||||||||
| 23,099 | ||||||||||||
| Total common stocks | ||||||||||||
| (cost $370,131) | $ | 496,222 | ||||||||||
| Total long-term investments | ||||||||||||
| (cost $370,131) | $ | 496,222 | ||||||||||
| SHORT-TERM INVESTMENTS - 0.7% | ||||||||||||
| Repurchase Agreements - 0.7% | ||||||||||||
| Bank of America Merrill Lynch TriParty Repurchase Agreement (maturing on 01/02/2014 in the amount of $177, collateralized by GNMA 4.00%, 2043, value of $181) | ||||||||||||
| $ | 177 | 0.005%, 12/31/2013 | $ | 177 | ||||||||
| Bank of Montreal TriParty Repurchase Agreement (maturing on 01/02/2014 in the amount of $171, collateralized by FNMA 1.58% - 4.50%, 2020 - 2043, U.S. Treasury Note 0.25% - 4.00%, 2015 - 2020, value of $174) | ||||||||||||
| 171 | 0.01%, 12/31/2013 | 171 | ||||||||||
| Bank of Montreal TriParty Repurchase Agreement (maturing on 01/02/2014 in the amount of $604, collateralized by FHLMC 3.00% - 5.00%, 2019 - 2043, FNMA 0.76% - 6.00%, 2016 - 2043, GNMA 1.50% - 5.25%, 2028 - 2043, value of $616) | ||||||||||||
| 604 | 0.02%, 12/31/2013 | 604 | ||||||||||
| Barclays Capital TriParty Repurchase Agreement (maturing on 01/02/2014 in the amount of $545, collateralized by U.S. Treasury Note 0.50% - 2.25%, 2017, value of $556) | ||||||||||||
| 545 | 0.01%, 12/31/2013 | 545 | ||||||||||
| Citigroup Global Markets, Inc. TriParty Repurchase Agreement (maturing on 01/02/2014 in the amount of $980, collateralized by U.S. Treasury Bond 3.88% - 8.13%, 2021 - 2040, U.S. Treasury Note 0.25% - 3.38%, 2014 - 2020, value of $1,000) | ||||||||||||
| 980 | 0.01%, 12/31/2013 | 980 | ||||||||||
| RBS Securities, Inc. TriParty Repurchase Agreement (maturing on 01/02/2014 in the amount of $318, collateralized by U.S. Treasury Note 0.25% - 1.00%, 2015 - 2017, value of $325) | ||||||||||||
| 318 | 0.01%, 12/31/2013 | 318 | ||||||||||
| TD Securities TriParty Repurchase Agreement (maturing on 01/02/2014 in the amount of $765, collateralized by FFCB 0.20% - 0.50%, 2015 - 2016, FHLMC 0.38% - 5.25%, 2014 - 2042, FNMA 0.50% - 7.13%, 2014 - 2043, value of $780) | ||||||||||||
| 765 | 0.01%, 12/31/2013 | 765 | ||||||||||
| UBS Securities, Inc. Repurchase Agreement (maturing on 01/02/2014 in the amount of $7, collateralized by U.S. Treasury Note 2.13%, 2015, value of $7) | ||||||||||||
| 7 | 0.01%, 12/31/2013 | 7 | ||||||||||
| 3,567 | ||||||||||||
| Total short-term investments | ||||||||||||
| (cost $3,567) | $ | 3,567 | ||||||||||
| Total investments | ||||||||||||
| (cost $373,698) ▲ | 99.7 | % | $ | 499,789 | ||||||||
| Other assets and liabilities | 0.3 | % | 1,367 | |||||||||
| Total net assets | 100.0 | % | $ | 501,156 | ||||||||
The accompanying notes are an integral part of these financial statements.
| 6 |
| Note: | Percentage of investments as shown is the ratio of the total market value to total net assets. |
Prices of foreign equities that are principally traded on certain foreign markets may be adjusted daily pursuant to a fair value pricing service approved by the Board of Directors in order to reflect an adjustment for factors occurring after the close of certain foreign markets but before the close of the New York Stock Exchange.
| ▲ | At December 31, 2013, the cost of securities for federal income tax purposes was $376,281 and the aggregate gross unrealized appreciation and depreciation based on that cost were: |
| Unrealized Appreciation | $ | 129,510 | ||
| Unrealized Depreciation | (6,002 | ) | ||
| Net Unrealized Appreciation | $ | 123,508 |
| † | These securities were valued in good faith at fair value as determined under policies and procedures established by and under the supervision of the Company's Board of Directors. At December 31, 2013, the aggregate value of these securities was $32, which rounds to zero percent of total net assets. This amount excludes securities that are principally traded in certain foreign markets and whose prices are adjusted pursuant to a third party pricing service methodology approved by the Board of Directors. |
| ● | Non-income producing. |
| ■ | Securities issued within terms of a private placement memorandum, exempt from registration under Rule 144A under the Securities Act of 1933, as amended, and may be sold only to qualified institutional buyers. Unless otherwise indicated, these holdings are determined to be liquid. At December 31, 2013, the aggregate value of these securities was $32, which rounds to zero percent of total net assets. |
| ⌂ | The following securities are considered illiquid. Illiquid securities are often purchased in private placement transactions, are often not registered under the Securities Act of 1933 and may have contractual restrictions on resale. A security may also be considered illiquid if the security lacks a readily available market or if its valuation has not changed for a certain period of time. |
| Period Acquired | Shares/ Par | Security | Cost Basis | ||||||||
| 03/2007 | 452 | Solar Cayman Ltd. - 144A | $ | 132 | |||||||
At December 31, 2013, the aggregate value of these securities was $32, which rounds to zero percent of total net assets.
| Foreign Currency Contracts Outstanding at December 31, 2013 | ||||||||||||||||||
| Currency | Buy / Sell | Delivery Date | Counterparty | Contract Amount | Market Value ╪ | Unrealized Appreciation/ (Depreciation) | ||||||||||||
| AUD | Buy | 01/06/2014 | JPM | $ | 90 | $ | 90 | $ | – | |||||||||
| AUD | Sell | 01/02/2014 | DEUT | 7 | 7 | – | ||||||||||||
| CAD | Sell | 01/03/2014 | BOA | 11 | 11 | – | ||||||||||||
| CAD | Sell | 01/06/2014 | SSG | 6 | 6 | – | ||||||||||||
| EUR | Sell | 01/02/2014 | UBS | 63 | 63 | – | ||||||||||||
| GBP | Sell | 01/02/2014 | BCLY | 5 | 5 | – | ||||||||||||
| HKD | Sell | 01/02/2014 | DEUT | 17 | 17 | – | ||||||||||||
| JPY | Sell | 01/06/2014 | BCLY | 463 | 461 | 2 | ||||||||||||
| JPY | Sell | 01/07/2014 | DEUT | 17 | 17 | – | ||||||||||||
| $ | 2 | |||||||||||||||||
| ╪ | See Significant Accounting Policies of accompanying Notes to Financial Statements regarding valuation of securities. |
The accompanying notes are an integral part of these financial statements.
| 7 |
| Hartford MidCap Value HLS Fund |
| Schedule of Investments – (continued) |
| December 31, 2013 |
| (000’s Omitted) |
| GLOSSARY: (abbreviations used in preceding Schedule of Investments) | ||
| Counterparty Abbreviations: | ||
| BCLY | Barclays | |
| BOA | Banc of America Securities LLC | |
| DEUT | Deutsche Bank Securities, Inc. | |
| JPM | JP Morgan Chase & Co. | |
| SSG | State Street Global Markets LLC | |
| UBS | UBS AG | |
| Currency Abbreviations: | ||
| AUD | Australian Dollar | |
| CAD | Canadian Dollar | |
| EUR | EURO | |
| GBP | British Pound | |
| HKD | Hong Kong Dollar | |
| JPY | Japanese Yen | |
| Other Abbreviations: | ||
| ADR | American Depositary Receipt | |
| FFCB | Federal Farm Credit Bank | |
| FHLMC | Federal Home Loan Mortgage Corp. | |
| FNMA | Federal National Mortgage Association | |
| GNMA | Government National Mortgage Association | |
| REIT | Real Estate Investment Trust | |
The accompanying notes are an integral part of these financial statements.
| 8 |
| Hartford MidCap Value HLS Fund |
| Investment Valuation Hierarchy Level Summary |
| December 31, 2013 |
| (000’s Omitted) |
| Total | Level 1 ♦ | Level 2 ♦ | Level 3 | |||||||||||||
| Assets: | ||||||||||||||||
| Common Stocks ‡ | $ | 496,222 | $ | 448,260 | $ | 47,930 | $ | 32 | ||||||||
| Short-Term Investments | 3,567 | – | 3,567 | – | ||||||||||||
| Total | $ | 499,789 | $ | 448,260 | $ | 51,497 | $ | 32 | ||||||||
| Foreign Currency Contracts * | 2 | – | 2 | – | ||||||||||||
| Total | $ | 2 | $ | – | $ | 2 | $ | – | ||||||||
| Liabilities: | ||||||||||||||||
| Foreign Currency Contracts * | – | – | – | – | ||||||||||||
| Total | $ | – | $ | – | $ | – | $ | – | ||||||||
| ♦ | For the year ended December 31, 2013, there were no transfers between Level 1 and Level 2. |
| ‡ | The Fund has all or primarily all of the equity securities categorized in a particular level. Refer to the Schedule of Investments for further industry breakout. |
| * | Derivative instruments (excluding purchased and written options, if applicable) are valued at the unrealized appreciation/depreciation on the investments. |
Following is a reconciliation of Level 3 assets for which significant unobservable inputs were used to determine fair value:
| Balance as of December 31, 2012 | Realized Gain (Loss) | Change in Unrealized Appreciation (Depreciation) | Net Amortization | Purchases | Sales | Transfers Into Level 3 | Transfers Out of Level 3 | Balance as of December 31, 2013 | ||||||||||||||||||||||||||||
| Assets: | ||||||||||||||||||||||||||||||||||||
| Common Stocks | $ | 4,172 | $ | 4,378 | $ | (3,105 | )* | $ | — | $ | — | $ | (5,413 | ) | $ | — | $ | — | $ | 32 | ||||||||||||||||
| Total | $ | 4,172 | $ | 4,378 | $ | (3,105 | ) | $ | — | $ | — | $ | (5,413 | ) | $ | — | $ | — | $ | 32 | ||||||||||||||||
| * | Change in unrealized appreciation (depreciation) in the current period relating to assets still held at December 31, 2013 was zero. |
| Note: | For purposes of reporting transfers between different hierarchy levels, both transfers in and out of each level, as applicable, are shown as if they occurred at the beginning of the period. |
The accompanying notes are an integral part of these financial statements.
| 9 |
| Hartford MidCap Value HLS Fund |
| Statement of Assets and Liabilities |
| December 31, 2013 |
| (000’s Omitted) |
| Assets: | ||||
| Investments in securities, at market value (cost $373,698) | $ | 499,789 | ||
| Cash | 1 | |||
| Unrealized appreciation on foreign currency contracts | 2 | |||
| Receivables: | ||||
| Investment securities sold | 3,307 | |||
| Fund shares sold | 80 | |||
| Dividends and interest | 540 | |||
| Total assets | 503,719 | |||
| Liabilities: | ||||
| Unrealized depreciation on foreign currency contracts | — | |||
| Bank overdraft - foreign cash | — | |||
| Payables: | ||||
| Investment securities purchased | 2,097 | |||
| Fund shares redeemed | 324 | |||
| Investment management fees | 88 | |||
| Distribution fees | 7 | |||
| Accrued expenses | 47 | |||
| Total liabilities | 2,563 | |||
| Net assets | $ | 501,156 | ||
| Summary of Net Assets: | ||||
| Capital stock and paid-in-capital | $ | 315,210 | ||
| Undistributed net investment income | 1,667 | |||
| Accumulated net realized gain | 58,187 | |||
| Unrealized appreciation of investments and the translations of assets and liabilities denominated in foreign currency | 126,092 | |||
| Net assets | $ | 501,156 | ||
| Shares authorized | 1,200,000 | |||
| Par value | $ | 0.001 | ||
| Class IA: Net asset value per share | $ | 15.51 | ||
| Shares outstanding | 24,326 | |||
| Net assets | $ | 377,272 | ||
| Class IB: Net asset value per share | $ | 15.42 | ||
| Shares outstanding | 8,034 | |||
| Net assets | $ | 123,884 |
The accompanying notes are an integral part of these financial statements.
| 10 |
| Hartford MidCap Value HLS Fund |
| Statement of Operations |
| For the Year Ended December 31, 2013 |
| (000’s Omitted) |
| Investment Income: | ||||
| Dividends | $ | 6,751 | ||
| Interest | 5 | |||
| Less: Foreign tax withheld | (108 | ) | ||
| Total investment income, net | 6,648 | |||
| Expenses: | ||||
| Investment management fees | 3,799 | |||
| Transfer agent fees | 3 | |||
| Distribution fees - Class IB | 298 | |||
| Custodian fees | 8 | |||
| Accounting services fees | 48 | |||
| Board of Directors' fees | 12 | |||
| Audit fees | 15 | |||
| Other expenses | 120 | |||
| Total expenses (before fees paid indirectly) | 4,303 | |||
| Commission recapture | (26 | ) | ||
| Custodian fee offset | — | |||
| Total fees paid indirectly | (26 | ) | ||
| Total expenses, net | 4,277 | |||
| Net Investment Income | 2,371 | |||
| Net Realized Gain on Investments and Foreign Currency Transactions: | ||||
| Net realized gain on investments | 86,320 | |||
| Net realized gain on foreign currency contracts | 58 | |||
| Net realized loss on other foreign currency transactions | (69 | ) | ||
| Net Realized Gain on Investments and Foreign Currency Transactions | 86,309 | |||
| Net Changes in Unrealized Appreciation of Investments and Foreign Currency Transactions: | ||||
| Net unrealized appreciation of investments | 51,786 | |||
| Net unrealized appreciation of foreign currency contracts | 2 | |||
| Net unrealized depreciation on translation of other assets and liabilities in foreign currencies | (1 | ) | ||
| Net Changes in Unrealized Appreciation of Investments and Foreign Currency Transactions | 51,787 | |||
| Net Gain on Investments and Foreign Currency Transactions | 138,096 | |||
| Net Increase in Net Assets Resulting from Operations | $ | 140,467 |
The accompanying notes are an integral part of these financial statements.
| 11 |
| Hartford MidCap Value HLS Fund |
| Statement of Changes in Net Assets |
| (000’s Omitted) |
| For the Year Ended December 31, 2013 | For the Year Ended December 31, 2012 | |||||||
| Operations: | ||||||||
| Net investment income | $ | 2,371 | $ | 4,416 | ||||
| Net realized gain on investments and foreign currency transactions | 86,309 | 41,884 | ||||||
| Net unrealized appreciation of investments and foreign currency transactions | 51,787 | 57,149 | ||||||
| Net Increase in Net Assets Resulting from Operations | 140,467 | 103,449 | ||||||
| Distributions to Shareholders: | ||||||||
| From net investment income | ||||||||
| Class IA | (4,389 | ) | (3,876 | ) | ||||
| Class IB | (1,173 | ) | (1,020 | ) | ||||
| Total distributions | (5,562 | ) | (4,896 | ) | ||||
| Capital Share Transactions: | ||||||||
| Class IA | ||||||||
| Sold | 35,081 | 20,918 | ||||||
| Issued on reinvestment of distributions | 4,389 | 3,876 | ||||||
| Redeemed | (87,130 | ) | (116,036 | ) | ||||
| Total capital share transactions | (47,660 | ) | (91,242 | ) | ||||
| Class IB | ||||||||
| Sold | 13,985 | 7,023 | ||||||
| Issued on reinvestment of distributions | 1,173 | 1,020 | ||||||
| Redeemed | (38,177 | ) | (36,570 | ) | ||||
| Total capital share transactions | (23,019 | ) | (28,527 | ) | ||||
| Net decrease from capital share transactions | (70,679 | ) | (119,769 | ) | ||||
| Net Increase (Decrease) in Net Assets | 64,226 | (21,216 | ) | |||||
| Net Assets: | ||||||||
| Beginning of period | 436,930 | 458,146 | ||||||
| End of period | $ | 501,156 | $ | 436,930 | ||||
| Undistributed (distribution in excess of) net investment income | $ | 1,667 | $ | 4,238 | ||||
| Shares: | ||||||||
| Class IA | ||||||||
| Sold | 2,657 | 1,942 | ||||||
| Issued on reinvestment of distributions | 312 | 357 | ||||||
| Redeemed | (6,440 | ) | (10,694 | ) | ||||
| Total share activity | (3,471 | ) | (8,395 | ) | ||||
| Class IB | ||||||||
| Sold | 1,052 | 652 | ||||||
| Issued on reinvestment of distributions | 84 | 94 | ||||||
| Redeemed | (2,853 | ) | (3,421 | ) | ||||
| Total share activity | (1,717 | ) | (2,675 | ) | ||||
The accompanying notes are an integral part of these financial statements.
| 12 |
| Hartford MidCap Value HLS Fund |
| Notes to Financial Statements |
| December 31, 2013 |
| (000’s Omitted) |
| 1. | Organization: |
Hartford MidCap Value HLS Fund (the “Fund”) serves as an underlying investment option for certain variable annuity and variable life insurance separate accounts of Hartford Life Insurance Company (“HLIC”) and its affiliates and certain qualified retirement plans. The Fund may also serve as an underlying investment option for certain variable annuity and variable life separate accounts of other insurance companies. Owners of variable annuity contracts and policyholders of variable life insurance contracts may choose the funds permitted in the variable insurance contract prospectus. In addition, participants in certain qualified retirement plans may choose the Fund if permitted by their plans.
Hartford Series Fund, Inc. (the “Company”) is an open-end registered management investment company comprised of thirty portfolios. Financial statements for the Fund, a series of the Company, are included in this report.
The Company is organized under the laws of the State of Maryland and is registered with the Securities and Exchange Commission (“SEC”) under the Investment Company Act of 1940, as amended (“1940 Act”). The Fund is a diversified open-end management investment company.
The Fund is divided into Class IA and Class IB shares. Each class is offered at the per share net asset value (“NAV”) without a sales charge and is subject to the same expenses, except that the Class IB shares are subject to distribution and service fees charged pursuant to a Distribution Plan adopted in accordance with Rule 12b-1 under the 1940 Act.
| 2. | Significant Accounting Policies: |
The following is a summary of significant accounting policies of the Fund in the preparation of its financial statements, which are in accordance with United States Generally Accepted Accounting Principles (“U.S. GAAP”). The preparation of financial statements in accordance with U.S. GAAP may require management to make estimates and assumptions that affect the reported amounts of assets and liabilities and disclosure of contingent assets and liabilities at the date of the financial statements and the reported amounts of increases and decreases in net assets from operations during the reporting period. Actual results could differ from those estimates.
| a) | Determination of Net Asset Value – The NAV of each class of the Fund’s shares is determined as of the close of regular trading (normally 4:00 p.m. Eastern Time) (the “NYSE Close”) on each day that the New York Stock Exchange (the “Exchange”) is open (“Valuation Date”). Information that becomes known to the Fund after the NAV has been calculated on a particular day will not generally be used to retroactively adjust the NAV determined earlier that day. |
| b) | Investment Valuation and Fair Value Measurements – For purposes of calculating the NAV, portfolio investments and other assets held by the Fund's portfolio for which market quotes are readily available are valued at market value. Market value is generally determined on the basis of last reported sales prices or official close price. If no sales are reported, market value is based on quotes obtained from a quotation reporting system, established market makers, or independent pricing services. If market prices are not readily available or are deemed unreliable, the Fund will use the fair value of the investment as determined in good faith under policies and procedures established by and under the supervision of the Company’s Board of Directors. Market quotes are considered not readily available where there is an absence of current or reliable market-based data (e.g., trade information or indicative market quotes), including where events occur after the close of the relevant market, but prior to the NYSE Close, that materially affect the values of the Fund’s portfolio investments or assets. In addition, market quotes are considered not readily available when, due to extraordinary circumstances, the exchanges or markets on which the investments trade do not open for trading for the entire day and no other market prices are available. In addition, prices of foreign equities that are principally traded on certain foreign markets may be adjusted daily pursuant to a fair value pricing service approved by the Board of Directors in order to reflect an adjustment for the factors occurring after the close of certain foreign markets but before the NYSE Close. Investments that are primarily traded on foreign markets may trade on days that are not business days of the Fund. The value of the foreign investments in which the Fund invests may change on days when a shareholder will not be able to purchase or redeem shares of the Fund. Fair value pricing is subjective in nature and the use of fair value pricing by the Fund may cause the NAV of its shares to differ significantly from the NAV that would have been calculated using |
| 13 |
| Hartford MidCap Value HLS Fund |
| Notes to Financial Statements – (continued) |
| December 31, 2013 |
| (000’s Omitted) |
market prices at the close of the exchange on which a portfolio investment is primarily traded. There can be no assurance that the Fund could obtain the fair market value assigned to an investment if the Fund were to sell the investment at approximately the time at which the Fund determines its NAV.
Investments valued in currencies other than U.S. dollars are converted to U.S. dollars using exchange rates obtained from independent pricing services for calculation of the NAV. As a result, the NAV of the Fund’s shares may be affected by changes in the value of currencies in relation to the U.S. dollar. The value of investments traded in markets outside the United States or denominated in currencies other than the U.S. dollar may be affected significantly on a day that the NYSE is closed and the market value may change on days when an investor is not able to purchase, redeem or exchange shares of the Fund.
Foreign currency contracts represent agreements to exchange currencies on specific future dates at predetermined rates. Foreign currency contracts are valued using foreign currency exchange rates and forward rates as provided by an independent pricing service on the Valuation Date.
Financial instruments for which prices are not available from an independent pricing service may be valued using market quotations obtained from one or more dealers that make markets in the respective financial instrument in accordance with procedures established by the Company’s Board of Directors.
U.S. GAAP defines fair value as the price that the Fund would receive to sell an asset or pay to transfer a liability in an orderly transaction between market participants. The U.S. GAAP fair value measurement standards require disclosure of a fair value hierarchy for each major category of assets and liabilities. Various inputs are used in determining the fair value of the Fund’s investments. These inputs are summarized into three broad hierarchy levels. This hierarchy is based on whether the valuation inputs are observable or unobservable. These levels are:
| · | Level 1 – Quoted prices in active markets for identical investments. Level 1 may include exchange traded instruments, such as domestic equities, some foreign equities, options, futures, mutual funds, exchange traded funds, rights and warrants. |
| · | Level 2 – Observable inputs other than Level 1 prices, such as quoted prices for similar investments; quoted prices in markets that are not active; or other inputs that are observable or can be corroborated by observable market data. Level 2 may include debt investments that are traded less frequently than exchange traded instruments and which are valued using independent pricing services; foreign equities, which are principally traded on certain foreign markets and are adjusted daily pursuant to a fair value pricing service in order to reflect an adjustment for the factors occurring after the close of certain foreign markets but before the NYSE Close; senior floating rate interests, which are valued using an aggregate of dealer bids; short-term investments, which are valued at amortized cost; and swaps, which are valued based upon the terms of each swap contract. |
| · | Level 3 – Significant unobservable inputs that are supported by limited or no market activity. Level 3 may include financial instruments whose values are determined using indicative market quotes or require significant management judgment or estimation. These unobservable valuation inputs may include estimates for current yields, maturity/duration, prepayment speed, and indicative market quotes for comparable investments along with other assumptions relating to credit quality, collateral value, complexity of the investment structure, general market conditions and liquidity. This category may include investments where trading has been halted or there are certain restrictions on trading. While these investments are priced using unobservable inputs, the valuation of these investments reflects the best available data and management believes the prices are a reasonable representation of exit price. |
The Board of Directors of the Company generally reviews and approves the “Procedures for Valuation of Portfolio Securities” on an annual basis. These procedures define how investments are to be valued, including the formation and activities of a Valuation Committee. The Valuation Committee is responsible for determining in good faith the fair value of investments when the value cannot be obtained from primary pricing services or alternative sources or if the valuation of an investment as provided by the primary pricing service or alternative source is believed not to reflect the investment’s fair value as of the Valuation Date. Voting members of the
| 14 |
Valuation Committee include the Fund’s Treasurer or designee and a Vice President of the investment manager or designee. An Assistant Vice President of the Fund with legal expertise or designee is also included on the Valuation Committee as a non-voting advisory member. In addition, the Fund’s Chief Compliance Officer shall designate a member of the compliance group to attend Valuation Committee meetings as a non-voting resource, to monitor for and provide guidance with respect to compliance with these procedures. Two members of the Valuation Committee or their designees, representing different departments, shall constitute a quorum for purposes of permitting the Valuation Committee to take action. The Valuation Committee will consider all relevant factors in determining an investment’s fair value, and may seek the advice of the Fund’s sub-adviser, knowledgeable brokers, and legal counsel in making such determination. The Valuation Committee reports to the Audit Committee of the Company’s Board of Directors. The Audit Committee receives quarterly written reports which include details of all fair-valued investments, including the reason for the fair valuation, and an indication, when possible, of the accuracy of the valuation by disclosing the next available reliable public price quotation or the disposition price of such investments (the “look-back” test). The Board of Directors then must consider for ratification all of the fair value determinations made during the previous quarter.
Valuation levels are not necessarily indicative of the risk associated with investing in such investments. Individual investments within any of the above mentioned asset classes may be assigned a different hierarchical level than those presented above, as individual circumstances dictate.
For additional information, refer to the Investment Valuation Hierarchy Level Summary and the Level 3 roll-forward reconciliation, if applicable, which follow the Schedule of Investments.
| c) | Investment Transactions and Investment Income – Investment transactions are recorded as of the trade date (the date the order to buy or sell is executed) for financial reporting purposes. Investments purchased or sold on a when-issued or delayed-delivery basis may be settled a month or more after the trade date. Realized gains and losses are determined on the basis of identified cost. |
Dividend income from domestic securities is accrued on the ex-dividend date. In general, dividend income from foreign securities is recorded on the ex-date; however, dividend notifications in certain foreign jurisdictions may not be available in a timely manner and as a result, the Fund will record the dividend as soon as the relevant details (i.e., rate per share, payment date, shareholders of record, etc.) are publicly available. Interest income, including amortization of premium, accretion of discounts and additional principal received in-kind in lieu of cash, is accrued on a daily basis.
| d) | Foreign Currency Transactions – Assets and liabilities denominated in currencies other than U.S. dollars are translated into U.S. dollars at the exchange rates in effect on the valuation date. Purchases and sales of investments, income and expenses are translated into U.S. dollars at the exchange rates on the dates of such transactions. |
The Fund does not isolate that portion of portfolio investment valuation resulting from fluctuations in the foreign currency exchange rates from the fluctuations arising from changes in the market prices of investments held. Exchange rate fluctuations are included with the net realized and unrealized gain or loss on investments in the accompanying financial statements.
Net realized foreign exchange gains or losses arise from sales of foreign currencies and the difference between asset and liability amounts initially stated in foreign currencies and the U.S. dollar value of the amounts actually received or paid. Net unrealized foreign exchange gains or losses arise from changes in the value of other assets and liabilities at the end of the reporting period, resulting from changes in the exchange rates.
| e) | Joint Trading Account – The Fund may invest cash balances into a joint trading account that may be invested in one or more repurchase agreements. |
| 15 |
| Hartford MidCap Value HLS Fund |
| Notes to Financial Statements – (continued) |
| December 31, 2013 |
| (000’s Omitted) |
| f) | Fund Share Valuation and Dividend Distributions to Shareholders – Orders for the Fund’s shares are executed in accordance with the investment instructions of the contract holders and plan participants. The NAV of the Fund’s shares is determined as of the close of business on each business day of the Exchange. The NAV is determined separately for each class of shares of the Fund by dividing the Fund’s net assets attributable to that class by the number of shares of the class outstanding. Each class of shares offered by the Fund has equal rights as to assets and voting privileges (except that shareholders of a class have exclusive voting rights regarding any matter relating solely to that class of shares). Income and non-class specific expenses are allocated daily to each class on the basis of the relative net assets of the class. Realized and unrealized gains and losses are allocated daily based on the relative net assets of each class of shares of the Fund. |
Orders for the purchase of the Fund’s shares received prior to the close of the Exchange on any day the Exchange is open for business are priced at the NAV determined as of the close of the Exchange. Orders received after the close of the Exchange, or on a day on which the Exchange and/or the Fund is not open for business, are priced at the next determined NAV.
Dividends are declared pursuant to a policy adopted by the Company’s Board of Directors based upon the investment performance of the Fund. The policy of the Fund is to pay dividends from net investment income and realized gains, if any, at least once a year.
Distributions from net investment income, net realized gains and capital are determined in accordance with federal income tax regulations, which may differ from U.S. GAAP with respect to character and timing. These differences may include, but are not limited to, losses deferred due to wash sale adjustments, foreign currency gains and losses, adjustments related to Passive Foreign Investment Companies (“PFICs”), Real Estate Investment Trusts (“REITs”), Regulated Investment Companies (“RICs”), certain derivatives and partnerships. Permanent book and federal income tax basis differences relating to shareholder distributions will result in reclassifications to certain of the Fund’s capital accounts (see Federal Income Taxes: Reclassification of Capital Accounts note).
| 3. | Securities and Other Investments: |
| a) | Repurchase Agreements – A repurchase agreement is an agreement by which a counterparty agrees to sell an investment and agrees to repurchase the investment sold from the buyer at a mutually agreed upon time and price. During the period of the repurchase agreement, the counterparty will deposit cash and or securities in a third party custodial account to serve as collateral. At the time the Fund enters into a repurchase agreement, the value of the underlying collateral, including accrued interest, will be equal to or exceed the value of the repurchase agreement. Repurchase agreements expose the Fund to counterparty risk - that is, the risk that the counterparty will not fulfill its obligations. To minimize counterparty risk, the investments that serve to collateralize the repurchase agreement are held by the Fund’s custodian in book entry or physical form in the custodial account of the Fund or in a third party custodial account. Repurchase agreements are valued at cost plus accrued interest, which approximates fair value. Repurchase agreements have master netting arrangements which allow the Fund to offset amounts owed to a counterparty with amounts owed by the counterparty, including any collateral. Upon an event of default under a master repurchase agreement, the non-defaulting party may close out all transactions traded under such agreement and net amounts owed under each transaction to one net amount payable by one party to the other. Absent an event of default, the master repurchase agreement does not result in an offset of reported amounts of assets and liabilities in the Statement of Assets and Liabilities across transactions between the Fund and the applicable counterparty. The Fund, as shown on the Schedule of Investments, had outstanding repurchase agreements and related collateral as of December 31, 2013. |
| b) | Illiquid and Restricted Investments – The Fund is permitted to invest up to 15% of its net assets in illiquid investments. Illiquid investments are those that may not be sold or disposed of in the ordinary course of business within seven days, at approximately the price used to determine the Fund’s NAV. The Fund may not be able to sell illiquid investments when its sub-adviser considers it desirable to do so or may have to sell such investments at a price that is lower than the price that could be obtained if the investments were more liquid. A sale of illiquid investments may require more time and may result in higher dealer discounts and other selling expenses than does the sale of those that are liquid. Illiquid |
| 16 |
investments also may be more difficult to value due to the unavailability of reliable market quotations for such investments, and an investment in them may have an adverse impact on the Fund’s NAV. The Fund may also purchase certain restricted investments that can only be resold to certain qualified investors and may be determined to be liquid pursuant to policies and guidelines established by the Company’s Board of Directors. The Fund, as shown on the Schedule of Investments, had illiquid and/or restricted investments as of December 31, 2013.
| c) | Investments Purchased on a When-Issued or Delayed-Delivery Basis – Delivery and payment for investments that have been purchased by the Fund on a forward commitment, or when-issued or delayed-delivery basis, take place beyond the customary settlement period. The Fund may dispose of or renegotiate a delayed-delivery transaction after it is entered into, and may sell delayed-delivery investments before they are delivered, which may result in a realized gain or loss. During this period, such investments are subject to market fluctuations, and the Fund identifies investments segregated in its records with a value at least equal to the amount of the commitment. As of December 31, 2013, the Fund had no outstanding when-issued or delayed-delivery investments. |
| 4. | Financial Derivative Instruments: |
The following disclosures contain information on how and why the Fund uses derivative instruments, the credit-risk-related contingent features in certain derivative instruments, and how derivative instruments affect the Fund’s financial position and results of operations. The location and fair value amounts of these instruments on the Statement of Assets and Liabilities and the realized gains and losses and changes in unrealized gains and losses on the Statement of Operations, each categorized by type of derivative contract, are included in the following Additional Derivative Instrument Information footnote. The derivative instruments outstanding as of year-end are disclosed in the notes to or within the Schedule of Investments for purchased options, if applicable. The amounts of realized gains and losses and changes in unrealized gains and losses on derivative instruments during the year are disclosed in the Statement of Operations.
| a) | Foreign Currency Contracts – The Fund may enter into foreign currency contracts that obligate the Fund to purchase or sell currencies at specified future dates. Foreign currency contracts are used to hedge the currency exposure associated with some or all of the Fund’s investments and/or as part of an investment strategy. Foreign currency contracts are marked to market daily and the change in value is recorded by the Fund as an unrealized gain or loss. The Fund will record a realized gain or loss when the foreign currency contract is settled. |
Foreign currency contracts involve elements of market risk in excess of the amounts reflected in the Statement of Assets and Liabilities. In addition, risks may arise upon entering into these contracts from the potential inability of the counterparties to meet the terms of the contracts and from unanticipated movements in the value of the foreign currencies relative to the U.S. dollar. The Fund had outstanding foreign currency contracts as shown on the Schedule of Investments as of December 31, 2013.
| 17 |
| Hartford MidCap Value HLS Fund |
| Notes to Financial Statements – (continued) |
| December 31, 2013 |
| (000’s Omitted) |
| b) | Additional Derivative Instrument Information: |
| Fair Value of Derivative Instruments on the Statement of Assets and Liabilities as of December 31, 2013: | ||||||||||||||||||||||||||||
| Risk Exposure Category | ||||||||||||||||||||||||||||
| Interest Rate Contracts | Foreign Exchange Contracts | Credit Contracts | Equity Contracts | Commodity Contracts | Other Contracts | Total | ||||||||||||||||||||||
| Assets: | ||||||||||||||||||||||||||||
| Unrealized appreciation on foreign currency contracts | $ | — | $ | 2 | $ | — | $ | — | $ | — | $ | — | $ | 2 | ||||||||||||||
| Total | $ | — | $ | 2 | $ | — | $ | — | $ | — | $ | — | $ | 2 | ||||||||||||||
| Liabilities: | ||||||||||||||||||||||||||||
| Unrealized depreciation on foreign currency contracts | $ | — | $ | — | $ | — | $ | — | $ | — | $ | — | $ | — | ||||||||||||||
| Total | $ | — | $ | — | $ | — | $ | — | $ | — | $ | — | $ | — | ||||||||||||||
The volume of derivatives that is presented in the Schedule of Investments is consistent with the derivative activity during the year ended December 31, 2013.
| The Effect of Derivative Instruments on the Statement of Operations for the year ended December 31, 2013: | ||||||||||||||||||||||||||||
| Risk Exposure Category | ||||||||||||||||||||||||||||
| Interest Rate Contracts | Foreign Exchange Contracts | Credit Contracts | Equity Contracts | Commodity Contracts | Other Contracts | Total | ||||||||||||||||||||||
| Realized Gain on Derivatives Recognized as a Result of Operations: | ||||||||||||||||||||||||||||
| Net realized gain on foreign currency contracts | $ | — | $ | 58 | $ | — | $ | — | $ | — | $ | — | $ | 58 | ||||||||||||||
| Total | $ | — | $ | 58 | $ | — | $ | — | $ | — | $ | — | $ | 58 | ||||||||||||||
| Net Change in Unrealized Appreciation (Depreciation) on Derivatives Recognized as a Result of Operations: | ||||||||||||||||||||||||||||
| Net change in unrealized appreciation of foreign currency contracts | $ | — | $ | 2 | $ | — | $ | — | $ | — | $ | — | $ | 2 | ||||||||||||||
| Total | $ | — | $ | 2 | $ | — | $ | — | $ | — | $ | — | $ | 2 | ||||||||||||||
The derivatives held by the Fund as of December 31, 2013 are not subject to a master netting arrangement; therefore, no balance sheet offsetting disclosure is presented.
| 5. | Principal Risks: |
The Fund may be exposed to counterparty risk, or the risk that an institution or other entity with which the Fund has unsettled or open transactions will default.
If the Fund invests directly in foreign currencies or in securities that trade in, and receive revenues in, foreign currencies, or in derivatives that provide exposure to foreign currencies, it will be subject to the risk that those currencies will decline in value relative to the base currency (U.S. dollars) of the Fund, or, in the case of hedging positions, that the Fund’s base currency will decline in value relative to the currency being hedged. Currency rates in foreign countries may fluctuate significantly over short periods of time for a number of reasons, including changes in interest rates, intervention (or the failure to intervene) by U.S. or foreign governments, central banks or supranational entities, such as the International Monetary Fund, or by the imposition of currency controls or other political developments in the United States or abroad. As a result, the Fund’s investments in foreign currency denominated securities may reduce the returns of the Fund. The market values of equity securities, such as common stocks and preferred stocks, or equity related investments, such as futures and options, may decline due to general market conditions which are not specifically related to a particular company, such as real or perceived adverse economic conditions, changes in the general outlook for
| 18 |
corporate earnings, changes in interest or currency rates or adverse investor sentiment generally. The market value of equity securities may also decline due to factors which affect a particular industry or industries, such as labor shortages or increased production costs and competitive conditions within an industry. Equity securities and equity related investments generally have greater market price volatility than fixed income securities.
| 6. | Federal Income Taxes: |
| a) | Federal Income Taxes – For federal income tax purposes, the Fund intends to continue to qualify as a RIC under Subchapter M of the Internal Revenue Code (“IRC”) by distributing substantially all of its taxable net investment income and net realized capital gains to its shareholders and otherwise complying with the requirements of the IRC. The Fund has distributed substantially all of its income and capital gains in prior years, if applicable, and intends to distribute substantially all of its income and capital gains prior to the next fiscal year-end. Accordingly, no provision for federal income or excise taxes has been made in the accompanying financial statements. Distributions from short-term capital gains are treated as ordinary income distributions for federal income tax purposes. |
| b) | Net Investment Income (Loss), Net Realized Gains (Losses) and Distributions – Net investment income (loss) and net realized gains (losses) may differ for financial statement and tax purposes primarily because of losses deferred due to wash sale adjustments, foreign currency gains and losses, adjustments related to PFICs, REITs, RICs, certain derivatives and partnerships. The character of distributions made during the year from net investment income or net realized gains may differ from their ultimate characterization for federal income tax purposes. Also, due to the timing of dividend distributions, the fiscal year in which amounts are distributed may differ from the year that the income or realized gains (losses) were recorded by the Fund. |
| c) | Distributions and Components of Distributable Earnings – The tax character of distributions paid by the Fund for the periods indicated is as follows (as adjusted for dividends payable, if applicable): |
| For the Year Ended December 31, 2013 | For the Year Ended December 31, 2012 | |||||||
| Ordinary Income | $ | 5,562 | $ | 4,896 | ||||
As of December 31, 2013, the Fund’s components of distributable earnings (deficit) on a tax basis were as follows:
| Amount | ||||
| Undistributed Ordinary Income | $ | 3,177 | ||
| Undistributed Long-Term Capital Gain | 60,097 | |||
| Accumulated Capital and Other Losses* | (837 | ) | ||
| Unrealized Appreciation† | 123,509 | |||
| Total Accumulated Earnings | $ | 185,946 | ||
| * | The Fund has capital loss carryforwards that are identified in the Capital Loss Carryforward note that follows. |
| † | Differences between book-basis and tax-basis unrealized appreciation (depreciation) may be attributable to the losses deferred due to wash sale adjustments, foreign currency gains and losses, adjustments related to PFICs, REITs, RICs, certain derivatives and partnerships. |
| 19 |
| Hartford MidCap Value HLS Fund |
| Notes to Financial Statements – (continued) |
| December 31, 2013 |
| (000’s Omitted) |
| d) | Reclassification of Capital Accounts – The Fund may record reclassifications in its capital accounts. These reclassifications have no impact on the total net assets of the Fund. The reclassifications are a result of permanent differences between U.S. GAAP and tax accounting for such items as foreign currency, PFICs, expiration or utilization of capital loss carryforwards or net operating losses. Adjustments are made to reflect the impact these items have on current and future distributions to shareholders. Therefore, the source of the Fund’s distributions may be shown in the accompanying Statement of Changes in Net Assets as from undistributed net investment income, from accumulated net realized gains on investments or from capital depending on the type of book and tax differences that exist. For the year ended December 31, 2013, the Fund recorded reclassifications to increase (decrease) the accounts listed below: |
| Amount | ||||
| Undistributed Net Investment Income (Loss) | $ | 620 | ||
| Accumulated Net Realized Gain (Loss) | (620 | ) | ||
| e) | Capital Loss Carryforward – On December 22, 2010, the Regulated Investment Company Modernization Act of 2010 (the “Act”) was enacted, which made changes to the capital loss carryforward rules. The changes are effective for taxable years beginning after the date of enactment. Under the Act, funds are permitted to carry forward capital losses for an unlimited period. However, any losses incurred during those future taxable years will be required to be utilized prior to the losses incurred in pre-enactment taxable years, which carry an expiration date. As a result of this ordering rule, pre-enactment capital loss carryforwards may be more likely to expire unused. Additionally, post-enactment capital loss carryforwards retain their character as either short-term or long-term capital losses rather than being considered all short-term as permitted under prior regulation. |
At December 31, 2013 (tax-year-end), the Fund had capital loss carryforwards for U.S. federal income tax purposes as follows:
| Year of Expiration | Amount | |||
| 2016 | $ | 837 | ||
| Total | $ | 837 | ||
As a result of current or past mergers in the Fund, certain provisions in the Internal Revenue Code may limit the future utilization of capital losses. During the year ended December 31, 2013, the Fund utilized $22,439 of prior year capital loss carryforwards.
| f) | Accounting for Uncertainty in Income Taxes – The Fund has adopted financial reporting rules that require the Fund to analyze all open tax years, as defined by the statute of limitations, for all major jurisdictions. Generally, tax authorities can examine all tax returns filed for the last three years. The Fund does not have an examination in progress. |
The Fund has reviewed all open tax years and major jurisdictions and concluded that these financial reporting rules had no effect on the Fund’s financial position or results of operations. There is no tax liability resulting from unrecognized tax benefits relating to uncertain income tax positions taken or expected to be taken on the tax return for the fiscal year ended December 31, 2013. The Fund is also not aware of any tax positions for which it is reasonably possible that the total amounts of unrecognized tax benefits will significantly change in the next twelve months.
| 7. | Expenses: |
| a) | Investment Management Agreement – Hartford Funds Management Company, LLC (“HFMC”), an indirect wholly owned subsidiary of The Hartford Financial Services Group, Inc. (“The Hartford”), serves as investment manager to the Fund pursuant to an Investment Management Agreement with the Company. The investment manager has overall investment supervisory responsibility for the Fund. In addition, the investment manager provides administrative personnel, services, equipment, facilities and office space for proper operation of the Fund. The investment manager has contracted with Wellington Management Company, LLP (“Wellington Management”) under a sub-advisory agreement |
| 20 |
for the provision of day-to-day investment management services to the Fund in accordance with the Fund’s investment objective and policies. The Fund pays a fee to the investment manager, a portion of which may be used to compensate Wellington Management.
The schedule below reflects the rates of compensation paid to HFMC for investment management services rendered as of December 31, 2013; the rates are accrued daily and paid monthly.
| Average Daily Net Assets | Annual Fee |
| On first $500 million | 0.8000% |
| On next $500 million | 0.7250% |
| On next $1.5 billion | 0.6750% |
| On next $2.5 billion | 0.6700% |
| On next $5 billion | 0.6650% |
| Over $10 billion | 0.6600% |
| b) | Accounting Services Agreement – Pursuant to the Fund Accounting Agreement between HFMC and the Company, on behalf of the Fund, HFMC provides accounting services to the Fund and receives monthly compensation based on the Fund’s average daily net assets at the rates set forth below. The Fund’s accounting services fees are accrued daily and paid monthly. |
| Average Daily Net Assets | Annual Fee |
| All Assets | 0.010% |
| c) | Operating Expenses – Allocable expenses incurred by the Company are allocated to each Fund and allocated to classes within a Fund in proportion to the average daily net assets of the Fund and each class, except where allocation of certain expenses is more fairly made directly to the Fund or to specific classes within a Fund. |
| d) | Fees Paid Indirectly – The Company, on behalf of the Fund, has entered into agreements with State Street Global Markets, LLC and Russell Implementation Services, Inc. to partially recapture non-discounted trade commissions. Such rebates are used to pay a portion of the Fund’s expenses. In addition, the Fund’s custodian bank has agreed to reduce its fees when the Fund maintains cash on deposit in a non-interest-bearing custody account. For the year ended December 31, 2013, these amounts, if any, are included in the Statement of Operations. |
The ratio of expenses to average net assets in the accompanying financial highlights excludes the reduction in expenses related to fees paid indirectly. The annualized expense ratio after waivers for the period listed below reflecting the reduction for fees paid indirectly is as follows:
| Year Ended December 31, 2013 | ||||
| Class IA | 0.84 | % | ||
| Class IB | 1.09 | |||
| e) | Distribution Plan for Class IB shares – Effective June 14, 2013, Hartford Investment Financial Services, LLC was renamed Hartford Funds Distributors, LLC (“HFD”). HFD, a wholly owned, ultimate subsidiary of The Hartford, serves as the Fund’s principal underwriter and distributor. The Company, on behalf of the Fund, has adopted a Distribution Plan pursuant to Rule 12b-1 of the 1940 Act to compensate the distributor, HFD, from assets attributable to the Class IB shares for services rendered and expenses borne in connection with activities primarily intended to result in the sale of the Class IB shares, subject to the review and approval of the Company’s Board of Directors. |
The Distribution Plan provides that the Fund may pay annually up to 0.25% of the average daily net assets of the Fund attributable to its Class IB shares for activities primarily intended to result in the sale of Class IB shares. The Board has the authority to suspend or reduce these payments at any point in time. Under the terms of the Distribution Plan and the
| 21 |
| Hartford MidCap Value HLS Fund |
| Notes to Financial Statements – (continued) |
| December 31, 2013 |
| (000’s Omitted) |
principal underwriting agreement, the Fund is authorized to make payments monthly to the distributor that may be used to pay or compensate entities providing distribution and shareholder servicing with respect to the Class IB shares for such entities’ fees or expenses incurred or paid in that regard. These fees are accrued daily and paid monthly.
| f) | Other Related Party Transactions – Certain officers of the Fund are directors and/or officers of the investment manager and/or The Hartford or its subsidiaries. For the year ended December 31, 2013, a portion of the Fund’s Chief Compliance Officer’s salary was paid by all the investment companies in the Hartford fund complex. The portion allocated to the Fund rounds to zero. Hartford Administrative Services Company (“HASCO”), an indirect wholly owned subsidiary of The Hartford, provides transfer agent services to the Fund. HASCO was compensated on a per account basis for providing such services. The amount paid to HASCO can be found in the Statement of Operations. These fees are accrued daily and paid monthly. |
| g) | Payment from Affiliate – In July of 2007, The Hartford entered into a settlement with the Attorneys General of the states of New York, Connecticut and Illinois relating to market timing and the company's individual variable annuity contracts in which certain payments would be made directly to the variable annuity contract holders. The distribution plan provided that unclaimed money from the settlement would be distributed to certain HLS Funds that are investment options through a Hartford individual variable annuity contract. The unclaimed money was distributed to the Fund on September 18, 2009. |
The total return in the accompanying financial highlights includes a payment from an affiliate. Had the payment from the affiliate been excluded, the impact and total return for the period listed below would have been as follows:
| For the Year Ended December 31, 2009 | ||||||||
| Class IA | Class IB | |||||||
| Impact from Payment from Affiliate for Attorneys General Settlement | 0.01 | % | 0.01 | % | ||||
| Total Return Excluding Payment from Affiliate | 44.18 | % | 43.82 | % | ||||
| 8. | Investment Transactions: |
For the year ended December 31, 2013, the Fund's aggregate purchases and sales of investment securities (excluding short-term investments) were as follows:
| Amount | ||||
| Cost of Purchases Excluding U.S. Government Obligations | $ | 228,750 | ||
| Sales Proceeds Excluding U.S. Government Obligations | 300,081 | |||
| 9. | Line of Credit: |
The Fund is one of several Hartford funds that participate in a $500 million committed revolving line of credit facility. The facility is to be used for temporary or emergency purposes. Under the arrangement, the funds are required to own securities having a market value in excess of 300% of the total bank borrowings. The interest rate on borrowings varies depending on the nature of the loan. The facility also requires a fee to be paid based on the amount of the commitment. This commitment fee is allocated to all of the funds participating in the line of credit based on the average net assets of the funds. During the year ended December 31, 2013, the Fund did not have any borrowings under this facility.
| 10. | Industry Classifications: |
Other than the industry classifications “Other Investment Pools and Funds” and “Exchange Traded Funds,” equity industry classifications used in this report are the Global Industry Classification Standard, which was developed by and is the exclusive property and service mark of MSCI, Inc. and Standard & Poor’s.
| 22 |
| 11. | Indemnifications: |
Under the Company’s organizational documents, the Company shall indemnify its officers and directors to the full extent required or permitted under Maryland General Corporation Law and the federal securities laws. In addition, the Company, on behalf of the Fund, may enter into contracts that contain a variety of indemnifications. The Company’s maximum exposure under these arrangements is unknown. However, as of the date of these financial statements, the Company has not had prior claims or losses pursuant to these contracts and expects the risk of loss to be remote.
| 12. | Pending Legal Proceedings: |
On February 25, 2011, Jennifer L. Kasilag, Louis Mellinger, Judith M. Menendez, Jacqueline M. Robinson, and Linda A. Russell filed a derivative lawsuit against Hartford Investment Financial Services, LLC (“HIFSCO”)(now known as Hartford Funds Distributors, LLC) on behalf of six Hartford retail mutual funds in the United States District Court for the District of New Jersey, alleging that HIFSCO received excessive advisory and distribution fees in violation of its statutory fiduciary duty under Section 36(b) of the 1940 Act when serving as investment manager and principal underwriter, respectively, to the Hartford retail mutual funds. HIFSCO moved to dismiss and, in September 2011, the motion was granted in part and denied in part, with leave to amend the complaint. In November 2011, plaintiffs filed an amended complaint on behalf of certain Hartford retail mutual funds, The Hartford Global Health Fund (now known as The Hartford Healthcare Fund), The Hartford Conservative Allocation Fund, The Hartford Growth Opportunities Fund, The Hartford Inflation Plus Fund, The Hartford Advisers Fund (now known as The Hartford Balanced Fund), and The Hartford Capital Appreciation Fund. Plaintiffs seek to rescind the investment management agreements and distribution plans between HIFSCO and these funds and to recover the total fees charged thereunder or, in the alternative, to recover any improper compensation HIFSCO received, in addition to lost earnings. HIFSCO filed a partial motion to dismiss the amended complaint and, in December 2012, the court dismissed without prejudice the claims regarding distribution fees and denied the motion with respect to the advisory fees claims. HIFSCO disputes the allegations and intends to defend the advisory fee claims vigorously.
This action concerns the activities of HIFSCO in its capacity as investment manager and principal underwriter to the Hartford retail mutual funds and does not concern HIFSCO’s activities in its capacity as principal underwriter to the HLS funds. For this reason, no accrual for litigation relating to this matter has been recorded in the financial statements of the Fund.
| 23 |
| Hartford MidCap Value HLS Fund |
| Financial Highlights |
| ─ Selected Per-Share Data(A) ─ | ─ Ratios and Supplemental Data ─ | |||||||||||||||||||||||||||||||||||||||||||||||||||
| Class | Net Asset Value at Beginning of Period | Net Investment Income (Loss) | Net Realized and Unrealized Gain (Loss) on Investments | Total from Investment Operations | Dividends from Net Investment Income | Distributions from Realized Capital Gains | Total Dividends and Distributions | Net Asset Value at End of Period | Total Return(B) | Net Assets at End of Period (000s) | Ratio of Expenses to Average Net Assets Before Adjust- ments(C) | Ratio of Expenses to Average Net Assets After Adjust- ments(C) | Ratio of Net Investment Income (Loss) to Average Net Assets | |||||||||||||||||||||||||||||||||||||||
| For the Year Ended December 31, 2013 | ||||||||||||||||||||||||||||||||||||||||||||||||||||
| IA | $ | 11.65 | $ | 0.08 | $ | 3.95 | $ | 4.03 | $ | (0.17 | ) | $ | – | $ | (0.17 | ) | $ | 15.51 | 34.71 | % | $ | 377,272 | 0.84 | % | 0.84 | % | 0.56 | % | ||||||||||||||||||||||||
| IB | 11.59 | 0.04 | 3.93 | 3.97 | (0.14 | ) | – | (0.14 | ) | 15.42 | 34.37 | 123,884 | 1.09 | 1.09 | 0.31 | |||||||||||||||||||||||||||||||||||||
| For the Year Ended December 31, 2012 (D) | ||||||||||||||||||||||||||||||||||||||||||||||||||||
| IA | $ | 9.44 | $ | 0.14 | $ | 2.20 | $ | 2.34 | $ | (0.13 | ) | $ | – | $ | (0.13 | ) | $ | 11.65 | 24.95 | % | $ | 323,934 | 0.85 | % | 0.85 | % | 1.03 | % | ||||||||||||||||||||||||
| IB | 9.38 | 0.10 | 2.21 | 2.31 | (0.10 | ) | – | (0.10 | ) | 11.59 | 24.64 | 112,996 | 1.10 | 1.10 | 0.79 | |||||||||||||||||||||||||||||||||||||
| For the Year Ended December 31, 2011 (D) | ||||||||||||||||||||||||||||||||||||||||||||||||||||
| IA | $ | 10.32 | $ | 0.07 | $ | (0.95 | ) | $ | (0.88 | ) | $ | – | $ | – | $ | – | $ | 9.44 | (8.56 | )% | $ | 341,583 | 0.83 | % | 0.83 | % | 0.57 | % | ||||||||||||||||||||||||
| IB | 10.29 | 0.04 | (0.95 | ) | (0.91 | ) | – | – | – | 9.38 | (8.79 | ) | 116,563 | 1.08 | 1.08 | 0.32 | ||||||||||||||||||||||||||||||||||||
| For the Year Ended December 31, 2010 | ||||||||||||||||||||||||||||||||||||||||||||||||||||
| IA | $ | 8.33 | $ | 0.05 | $ | 2.00 | $ | 2.05 | $ | (0.06 | ) | $ | – | $ | (0.06 | ) | $ | 10.32 | 24.67 | % | $ | 462,281 | 0.85 | % | 0.85 | % | 0.57 | % | ||||||||||||||||||||||||
| IB | 8.30 | 0.03 | 1.99 | 2.02 | (0.03 | ) | – | (0.03 | ) | 10.29 | 24.36 | 163,498 | 1.10 | 1.10 | 0.30 | |||||||||||||||||||||||||||||||||||||
| For the Year Ended December 31, 2009 (D) | ||||||||||||||||||||||||||||||||||||||||||||||||||||
| IA | $ | 5.82 | $ | 0.07 | $ | 2.50 | $ | 2.57 | $ | (0.06 | ) | $ | – | $ | (0.06 | ) | $ | 8.33 | 44.19 | %(E) | $ | 348,742 | 0.86 | % | 0.86 | % | 0.87 | % | ||||||||||||||||||||||||
| IB | 5.80 | 0.05 | 2.49 | 2.54 | (0.04 | ) | – | (0.04 | ) | 8.30 | 43.83 | (E) | 145,920 | 1.11 | 1.11 | 0.62 | ||||||||||||||||||||||||||||||||||||
| (A) | Information presented relates to a share outstanding throughout the indicated period. Net investment income (loss) per share amounts are calculated based on average shares outstanding unless otherwise noted. |
| (B) | The figures do not include sales charges or other fees which may be applied at the variable life insurance, variable annuity or qualified retirement plan product level. Any such additional sales charges or other fees would lower the Fund's performance. |
| (C) | Adjustments include waivers and reimbursements, if applicable. Ratios do not include fees paid indirectly (see Expenses in the accompanying Notes to Financial Statements). |
| (D) | Net investment income (loss) per share amounts have been calculated using the SEC method. |
| (E) | Total return without the inclusion of the Payment from (to) Affiliate can be found in Expenses in the accompanying Notes to Financial Statements. |
| Portfolio Turnover Rate for All Share Classes | ||||
| For the Year Ended December 31, 2013 | 49 | % | ||
| For the Year Ended December 31, 2012 | 45 | |||
| For the Year Ended December 31, 2011 | 43 | |||
| For the Year Ended December 31, 2010 | 57 | (A) | ||
| For the Year Ended December 31, 2009 | 50 | |||
| (A) | During the year ended December 31, 2010, the Fund incurred $89.7 million in purchases associated with the transition of assets from Hartford SmallCap Value HLS Fund, which merged into the Fund on July 30, 2010. These purchases were excluded from the portfolio turnover calculation. |
| 24 |
| Report of Independent Registered Public Accounting Firm |
| The Board of Directors and Shareholders of |
| Hartford Series Fund, Inc. |
We have audited the accompanying statement of assets and liabilities, including the schedule of investments, of Hartford MidCap Value HLS Fund (one of the portfolios constituting Hartford Series Fund, Inc. (the Funds)) as of December 31, 2013, and the related statement of operations for the year then ended, the statements of changes in net assets for each of the two years in the period then ended, and the financial highlights for each of the five years in the period then ended. These financial statements and financial highlights are the responsibility of the Funds’ management. Our responsibility is to express an opinion on these financial statements and financial highlights based on our audits.
We conducted our audits in accordance with the standards of the Public Company Accounting Oversight Board (United States). Those standards require that we plan and perform the audit to obtain reasonable assurance about whether the financial statements and financial highlights are free of material misstatement. We were not engaged to perform an audit of the Funds’ internal control over financial reporting. Our audits included consideration of internal control over financial reporting as a basis for designing audit procedures that are appropriate in the circumstances, but not for the purpose of expressing an opinion on the effectiveness of the Funds’ internal control over financial reporting. Accordingly, we express no such opinion. An audit also includes examining, on a test basis, evidence supporting the amounts and disclosures in the financial statements and financial highlights, assessing the accounting principles used and significant estimates made by management, and evaluating the overall financial statement presentation. Our procedures included confirmation of securities owned as of December 31, 2013, by correspondence with the custodian and brokers or by other appropriate auditing procedures where replies from brokers were not received. We believe that our audits provide a reasonable basis for our opinion.
In our opinion, the financial statements and financial highlights referred to above present fairly, in all material respects, the financial position of Hartford MidCap Value HLS Fund of the Hartford Series Fund, Inc. at December 31, 2013, the results of its operations for the year then ended, the changes in its net assets for each of the two years in the period then ended, and the financial highlights for each of the five years in the period then ended, in conformity with U.S. generally accepted accounting principles.
|
Minneapolis, MN
February 17, 2014
| 25 |
| Hartford MidCap Value HLS Fund |
| Directors and Officers (Unaudited) |
The Board of Directors of the Company appoints officers who are responsible for the day-to-day operations of the Fund and who execute policies formulated by the directors. Each director serves until his or her death, resignation, or retirement or until the next annual meeting of shareholders is held or until his or her successor is elected and qualifies.
Directors and officers who are employed by or who have a financial interest in The Hartford are considered “interested” persons of the Fund pursuant to the 1940 Act. Each officer and two of the Company’s directors, as noted in the chart below, are “interested” persons of the Fund. Each director serves as a director for The Hartford Mutual Funds, Inc., The Hartford Mutual Funds II, Inc., Hartford Series Fund, Inc., Hartford HLS Series Fund II, Inc., and as a trustee for The Hartford Alternative Strategies Fund, which, as of December 31, 2013, collectively consist of 91 funds. Correspondence may be sent to directors and officers c/o Hartford Funds, 5 Radnor Corporate Center, Suite 300, 100 Matsonford Road, Radnor, Pennsylvania 19087, except that correspondence to Mr. Annoni, Mr. Dressen and Ms. Quade may be sent to 500 Bielenberg Drive, Woodbury, Minnesota 55125.
The table below sets forth, for each director and officer, his or her name, year of birth, current position with the Company and date first elected or appointed to Hartford Series Fund, Inc. (“HSF”), and Hartford HLS Series Fund II, Inc. (“HSF2”), principal occupation, and, for directors, other directorships held. The Fund’s Statement of Additional Information contains further information on the directors and is available free of charge by calling 1-800-862-6668 or writing to Hartford HLS Funds, c/o Hartford Life Insurance Company, Hartford Life and Annuity Insurance Company, P.O. Box 14293, Lexington, KY 40512-4293.
Information on the aggregate remuneration paid to the directors of the Company can be found in the Statement of Operations herein. The Fund pays to The Hartford a portion of the Chief Compliance Officer’s compensation, but does not pay salaries or compensation to any of their other officers or directors who are employed by The Hartford.
Non-Interested Directors
Lynn S. Birdsong (1946) Director since 2003, Co-Chairman of the Investment Committee since 2005
Mr. Birdsong is a private investor. Mr. Birdsong currently serves as a Director of the Sovereign High Yield Investment Company (April 2010 to current). Mr. Birdsong currently serves as an Independent Director of Nomura Partners Funds, Inc. (formerly, The Japan Fund) (April 2003 to current). From 2003 to March 2005, Mr. Birdsong was an Independent Director of the Atlantic Whitehall Funds. From 1979 to 2002, Mr. Birdsong was a Managing Director of Zurich Scudder Investments, an investment management firm. During his employment with Scudder, Mr. Birdsong was an Interested Director of The Japan Fund. From January 1981 through December 2013, Mr. Birdsong was a partner in Birdsong Company, an advertising specialty firm.
Robert M. Gavin, Jr. (1940) Director since 2002 (HSF) and 1986 (HSF2), Chairman of the Board since 2004
Dr. Gavin is an educational consultant. Prior to September 1, 2001, he was President of Cranbrook Education Community and prior to July 1996, he was President of Macalester College, St. Paul, Minnesota.
Duane E. Hill (1945) Director since 2001 (HSF) and 2002 (HSF2), Chairman of the Nominating Committee since 2003
Mr. Hill is a Partner of TSG Ventures L.P., a private equity investment company. Mr. Hill is a former partner of TSG Capital Group, a private equity investment firm that served as sponsor and lead investor in leveraged buyouts of middle market companies.
Sandra S. Jaffee (1941) Director since 2005
Ms. Jaffee is the founder and Chief Executive Officer of a private company, Homeworks Concierge, LLC, which provides residential property management services in Westchester County, New York (January 2012 to present). Ms. Jaffee served as Chairman (2008 to 2009) and Chief Executive Officer of Fortent (formerly Searchspace Group), a leading provider of compliance/regulatory technology to financial institutions from August 2005 to August 2009. Ms. Jaffee currently serves as a member of the Board of Directors of Broadridge Financial Solutions as well as a Trustee of Muhlenberg College.
| 26 |
William P. Johnston (1944) Director since 2005, Chairman of the Compliance Committee since 2005
In June 2006, Mr. Johnston was appointed as Senior Advisor to The Carlyle Group, a global private equity and alternative asset investment firm and currently serves as an Operating Executive. In July 2006, Mr. Johnston was elected to the Board of Directors of MultiPlan, Inc. and served as a Director (July 2006 to August 2010). In August 2007, Mr. Johnston was elected to the Board of Directors of LifeCare Holdings, Inc. and served as a Director (August 2007 to June 2013). In February 2008, Mr. Johnston was elected to the Board of Directors of HCR-ManorCare, Inc. In May 2006, Mr. Johnston was elected to the Supervisory Board of Fresenius Medical Care AG & Co. KGaA, after its acquisition of Renal Care Group, Inc. in March 2006. Mr. Johnston joined Renal Care Group in November 2002 as a member of the Board of Directors and served as Chairman of the Board from March 2003 through March 2006. From 2002 through 2013, Mr. Johnston served as a Board member of the Georgia O’Keefe Museum. From September 1987 to December 2002, Mr. Johnston was with Equitable Securities Corporation (and its successors, SunTrust Equitable Securities and SunTrust Robinson Humphrey) serving in various investment banking and managerial positions, including Managing Director and Head of Investment Banking, Chief Executive Officer and Vice Chairman.
Phillip O. Peterson (1944) Director since 2002 (HSF) and 2000 (HSF2), Chairman of the Audit Committee since 2002
Mr. Peterson is a mutual fund industry consultant. He was a partner of KPMG LLP (an accounting firm) until July 1999. Mr. Peterson joined William Blair Funds in February 2007 as a member of the Board of Trustees. Mr. Peterson also joined the Board of Trustees of Symetra Variable Mutual Funds Trust as a trustee in February 2012.
Lemma W. Senbet (1946) Director since 2005
Dr. Senbet is the William E. Mayer Chair Professor of Finance and Founding Director, Center for Financial Policy, at the University of Maryland, Robert H. Smith School of Business. He was chair of the Finance Department of the University of Maryland, Robert H. Smith School of Business from 1998 to 2006. Since June 2013, he has been on leave from the University to serve as Executive Director of African Economic Research Consortium which focuses on economic policy research and training. Previously, he was a chaired professor of finance at the University of Wisconsin-Madison. Also, he was a Director of the Fortis Funds from March 2000 to July 2002. Dr. Senbet served as Director of the American Finance Association and President of the Western Finance Association. In 2006, Dr. Senbet was inducted Fellow of Financial Management Association International for his career-long distinguished scholarship and professional service.
Interested Directors and Officers
James E. Davey (1964) Director since 2012, President and Chief Executive Officer since 2010
Mr. Davey serves as Executive Vice President of Hartford Life Insurance Company (“HLIC”) and The Hartford Financial Services Group, Inc. Additionally, Mr. Davey serves as Chairman of the Board, Manager and Senior Managing Director of Hartford Funds Distributors, LLC (“HFD”). He also currently serves as Director, Chairman of the Board, President and Senior Managing Director of Hartford Administrative Services Company (“HASCO”). Mr. Davey also serves as Manager, Chairman of the Board and Senior Managing Director for Hartford Funds Management Company, LLC (“HFMC”). Mr. Davey joined The Hartford in 2002.
Lowndes A. Smith (1939) Director since 1996 (HSF) and 2002 (HSF2), Co-Chairman of the Investment Committee since 2005
Mr. Smith served as Vice Chairman of The Hartford from February 1997 to January 2002, as President and Chief Executive Officer of Hartford Life, Inc. from February 1997 to January 2002, and as President and Chief Operating Officer of The Hartford Life Insurance Companies from January 1989 to January 2002. Mr. Smith serves as a Director of White Mountains Insurance Group Ltd. (October 2003 to current); One Beacon Insurance (October 2006 to current); Symetra Financial (August 2007 to current) and is a Managing Director of Whittington Gray Associates (January 2007 to current).
Other Officers
Mark A. Annoni (1964) Vice President, Controller and Treasurer since 2012
Mr. Annoni currently serves as the Assistant Vice President of HLIC (February 2004 to present).
| 27 |
| Hartford MidCap Value HLS Fund |
| Directors and Officers (Unaudited) – (continued) |
Michael R. Dressen (1963) AML Compliance Officer since 2011
Mr. Dressen currently serves as Assistant Vice President of HLIC. He also serves as Chief Compliance Officer and AML Compliance Officer of HASCO and as AML Officer of HFD. Mr. Dressen has served in various positions within The Hartford and its subsidiaries in connection with the operation of the Hartford Funds.
Edward P. Macdonald (1967) Vice President, Secretary and Chief Legal Officer since 2005
Mr. Macdonald currently serves as Assistant Secretary, Executive Vice President and Deputy General Counsel of HFD, HASCO and HFMC. He also serves as Vice President of HLIC. Mr. Macdonald has served in various positions within The Hartford and its subsidiaries in connection with the operation of the Hartford Funds. Mr. Macdonald joined The Hartford in 2005.
Joseph G. Melcher (1973) Vice President and Chief Compliance Officer since 2013
Mr. Melcher currently serves as Executive Vice President of HASCO and HFD. Mr. Melcher also currently serves as Executive Vice President and Chief Compliance Officer of HFMC. Mr. Melcher has served in various positions within The Hartford and its subsidiaries in connection with the operation of the Hartford Funds since joining The Hartford in 2012. Prior to joining The Hartford, Mr. Melcher worked at Touchstone Investments, a member of the Western & Southern Financial Group, where he held the position of Vice President and Chief Compliance Officer from 2010 through 2012 and Assistant Vice President, Compliance from 2005 to 2010.
Vernon J. Meyer (1964) Vice President since 2006
Mr. Meyer currently serves as Senior Vice President of HLIC. He also currently serves as Managing Director and Chief Investment Officer of HFMC. Mr. Meyer has served in various positions within The Hartford and its subsidiaries in connection with the operation of the Hartford Funds. Mr. Meyer joined The Hartford in 2004.
Laura S. Quade (1969) Vice President since 2012
Ms. Quade currently serves as Vice President of HASCO and HFD. She is the Head of Operations of HASCO and also serves as Director, Enterprise Operations of HLIC. Ms. Quade has served in various positions within The Hartford and its subsidiaries in connection with the operation of the Hartford Funds.
Martin A. Swanson (1962) Vice President since 2010
Mr. Swanson currently serves as Vice President of HLIC. Mr. Swanson also serves as Managing Director, Chief Marketing Officer and Principal of HFD. Mr. Swanson has served in various positions within The Hartford and its subsidiaries in connection with the operation of the Hartford Funds.
HOW TO OBTAIN A COPY OF THE FUND’S PROXY VOTING POLICIES AND VOTING RECORDS (UNAUDITED)
A description of the policies and procedures that the Fund uses to determine how to vote proxies relating to portfolio securities and information about how the Fund voted proxies relating to portfolio securities during the most recent twelve-month period ended June 30 are available (1) without charge, upon request, by calling 800-862-6668 and (2) on the SEC’s website at http://www.sec.gov.
QUARTERLY PORTFOLIO HOLDINGS INFORMATION (UNAUDITED)
The Fund files a complete schedule of portfolio holdings with the SEC for the first and third quarters of each fiscal year on Form N-Q. The Fund’s Forms N-Q are available (1) without charge, upon request, by calling 800-862-6668 and (2) on the SEC’s website at http://www.sec.gov. The Form N-Q may be reviewed and copied at the SEC’s Public Reference Room in Washington, DC. Information on the operation of the Public Reference Room may be obtained by calling 1-800-SEC-0330.
| 28 |
| Hartford MidCap Value HLS Fund |
| Expense Example (Unaudited) |
Your Fund's Expenses
As a shareholder of the Fund, you incur two types of costs: (1) transaction costs and (2) ongoing costs, including investment management fees, distribution and/or service (12b-1) fees, if any, and other fund expenses. This example is intended to help you understand your ongoing costs (in dollars) of investing in the Fund and to compare these costs with the ongoing costs of investing in other mutual funds. The example is based on an investment of $1,000 invested at the beginning of the period and held for the period of June 30, 2013 through December 31, 2013.
Actual Expenses
The first set of columns of the table below provides information about actual account values and actual expenses. You may use the information in this column, together with the amount you invested, to estimate the expenses that you paid over the period. Simply divide your account value by $1,000 (for example, an $8,600 account value divided by $1,000 = 8.6), then multiply the result by the number in the line under the heading entitled “Expenses Paid During Period” to estimate the expenses you paid on your account during this period.
Hypothetical Example for Comparison Purposes
The second set of columns of the table below provides information about hypothetical account values and hypothetical expenses based on the Fund’s actual expense ratio and an assumed rate of return of 5% per year before expenses, which is not the Fund’s actual return. The hypothetical account values and expenses may not be used to estimate the actual ending account balance or expenses you paid for the period. You may use this information to compare the ongoing costs of investing in the Fund and other funds. To do so, compare this 5% hypothetical example with the 5% hypothetical examples that appear in the shareholder reports of the other funds.
Please note that the expenses shown in the table are meant to highlight your ongoing costs only and do not reflect any transactional costs, such as sales charges (loads) and CDSC. Therefore, the second set of columns of the table is useful in comparing ongoing costs only, and will not help you determine the relative total costs of owning different funds. In addition, if these transactional costs were included, your costs would be higher. Expenses are equal to the Fund's annualized expense ratios multiplied by average account value over the period, multiplied by 184/365 (to reflect the one-half year period).
| Actual return | Hypothetical (5% return before expenses) | |||||||||||||||||||||||||||||||
| Beginning Account Value June 30, 2013 | Ending Account Value December 31, 2013 | Expenses paid during the period June 30, 2013 through December 31, 2013 | Beginning Account Value June 30, 2013 | Ending Account Value December 31, 2013 | Expenses paid during the period June 30, 2013 through December 31, 2013 | Annualized expense ratio | Days in the current 1/2 year | Days in the full year | ||||||||||||||||||||||||
| Class IA | $ | 1,000.00 | $ | 1,175.50 | $ | 4.62 | $ | 1,000.00 | $ | 1,020.95 | $ | 4.30 | 0.84 | % | 184 | 365 | ||||||||||||||||
| Class IB | $ | 1,000.00 | $ | 1,173.90 | $ | 5.99 | $ | 1,000.00 | $ | 1,019.69 | $ | 5.57 | 1.09 | % | 184 | 365 | ||||||||||||||||
| 29 |
| Hartford MidCap Value HLS Fund |
| Approval of Investment Management and Investment Sub-Advisory Agreements (Unaudited) |
Section 15(c) of the Investment Company Act of 1940, as amended (the “1940 Act”), requires that each mutual fund’s board of directors, including a majority of those directors who are not “interested persons” of the mutual fund, as defined in the 1940 Act (the “Independent Directors”), annually review and consider the continuation of the mutual fund’s investment advisory and sub-advisory agreements. At its meeting held on August 6-7, 2013, the Board of Directors (the “Board”) of Hartford Series Fund, Inc., including each of the Independent Directors, unanimously voted to approve the continuation of the investment management agreement for Hartford MidCap Value HLS Fund (the “Fund”) with Hartford Funds Management Company, LLC (“HFMC”) and the continuation of the investment sub-advisory agreement between HFMC and the Fund’s sub-adviser, Wellington Management Company, LLP (the “Sub-adviser,” and together with HFMC, the “Advisers”) (collectively, the “Agreements”).
In the months preceding the August 6-7, 2013 meeting, the Board requested, received, and reviewed written responses from the Advisers to questions posed to them on behalf of the Independent Directors and supporting materials relating to those questions and responses. The Board considered information furnished to the Board at its meetings throughout the year, as well as information specifically prepared in connection with the annual approval of the Agreements at the Board’s meetings held on June 18-19, 2013 and August 6-7, 2013. Information provided to the Board at its meetings throughout the year included, among other things, reports on Fund performance, legal and compliance matters, sales and marketing activity, shareholder services, and the other services provided to the Fund by the Advisers and their affiliates. The Board also received in-person presentations by Fund officers and representatives of HFMC at the Board’s meetings on June 18-19, 2013 and August 6-7, 2013 concerning the Agreements.
The Independent Directors, advised by independent legal counsel, engaged two service providers to assist them with evaluating the Agreements with respect to the Fund. Lipper Inc. (“Lipper”), an independent provider of investment company data, was retained to provide the Board with reports on how the Fund’s contractual management fees, actual management fees, other non-management fees, overall expense ratios and investment performance compared to those of mutual funds with similar investment objectives. The Independent Directors also engaged an independent financial services consulting firm (the “Consultant”) to assist them in evaluating the Fund’s management fees, sub-advisory fees, other non-management fees, overall expense ratios and investment performance. In addition, the Consultant reviewed the profitability calculations utilized by HFMC in connection with the continuation of the investment management agreement.
In determining whether to continue the Agreements for the Fund, the members of the Board reviewed and evaluated information and factors they believed to be relevant and appropriate in light of the information that the Board deemed necessary and appropriate through the exercise of its reasonable business judgment. While individual members of the Board may have weighed certain factors differently, the Board’s determination to continue the Agreements was based on a comprehensive consideration of all information provided to the Board throughout the year and specifically with respect to the continuation of the Agreements. A more detailed discussion of the factors the Board considered with respect to its approval of the Agreements is provided below.
Nature, Extent, and Quality of Services Provided by the Advisers
The Board requested and considered information concerning the nature, extent, and quality of the services provided to the Fund by the Advisers. The Board considered, among other things, the terms of the Agreements and the range of services provided by the Advisers. The Board considered the Advisers’ professional personnel who provide services to the Fund, including each Adviser’s ability and experience in attracting and retaining qualified personnel to service the Fund. The Board considered each Adviser’s reputation and overall financial strength, as well as its willingness to consider and implement organizational and operational changes designed to improve services to the Fund. In addition, the Board considered the quality of each Adviser’s communications with the Board and responsiveness to Board inquiries.
The Board also requested and evaluated information concerning each Adviser’s regulatory and compliance environment. In this regard, the Board requested and reviewed information on each Adviser’s compliance policies and procedures, compliance history, and a report from the Fund’s Chief Compliance Officer on each Adviser’s compliance with applicable laws and regulations, including responses to regulatory developments and compliance issues raised by regulators. The Board also noted the Advisers’ support of the Fund’s compliance control structure, particularly the resources devoted by the Advisers in support of the Fund’s obligations pursuant to Rule 38a-1 under the 1940 Act.
| 30 |
With respect to HFMC, the Board noted that under the Agreements, HFMC is responsible for the management of the Fund, including overseeing fund operations and service providers, as well as investment advisory services in connection with selecting, monitoring and supervising the Sub-adviser. The Board considered HFMC’s ongoing monitoring of people, process and performance, including its quarterly reviews of each of the Hartford Funds, semi-annual meetings with the leaders of each Fund’s portfolio management team, and oversight of the Funds’ approximately 40 portfolio managers. The Board recognized that HFMC has demonstrated a record of making changes to the management and/or strategies of the Funds when warranted. The Board considered HFMC’s oversight of the Sub-adviser’s investment approach and results, process for monitoring best execution of portfolio trades by the Sub-adviser, and approach to risk management with respect to the Fund and the service providers to the Fund. The Board also considered HFMC’s oversight of compliance with the Fund’s objective and policies as well as with applicable laws and regulations, noting that regulatory and other developments had over time led to an increase in the scope of HFMC’s services in this regard.
In addition, the Board considered HFMC’s ongoing commitment to review and rationalize the Hartford Funds product line-up and the expenses that HFMC had incurred in connection with fund combinations in recent years. The Board considered that HFMC or its affiliates are responsible for providing the Fund’s officers. The Board also noted that Hartford Life Insurance Company (“HLIC”) provides administrative services to the Fund. The Board considered its experiences with HFMC and HLIC with respect to each of these services.
With respect to the Sub-adviser, who provides day-to-day portfolio management services, the Board considered the quality of the Fund’s portfolio manager, the Sub-adviser’s other investment personnel, its investment philosophy and process, investment research capabilities and resources, performance record, trade execution capabilities and experience. The Board considered the experience of the Fund’s portfolio manager, the number of accounts managed by the portfolio manager, and the Sub-adviser’s method for compensating the portfolio manager.
Based on these considerations, the Board concluded that it was satisfied with the nature, extent and quality of the services provided to the Fund by HFMC and the Sub-adviser.
Performance of the Fund and the Advisers
The Board considered the investment performance of the Fund. In this regard, the Board reviewed the performance of the Fund over different time periods presented in the materials and evaluated HFMC’s analysis of the Fund’s performance for these time periods. The Board considered information and materials provided to the Board by the Advisers concerning Fund performance, as well as information from Lipper comparing the investment performance of the Fund to an appropriate benchmark and universe of peer funds. The Board noted that the Fund’s performance was in the 1st quintile of its performance universe for the 1- and 5-year periods and the 2nd quintile for the 3-year period. The Board also noted that the Fund’s performance was below its benchmark for the 1-year period, in line with its benchmark for the 3-year period and above its benchmark for the 5-year period.
The Board considered the detailed investment analytics reports provided by Hartford Funds’ Investment Advisory Group throughout the year. These reports include, among other things, information on the Fund’s gross and net returns, the Fund’s investment performance relative to an appropriate benchmark and peer group, various statistics concerning the Fund’s portfolio, and a narrative summary of various factors affecting Fund performance. The Board considered the Advisers’ cooperation with the Investment Committee, which assists the Board in evaluating the performance of the Fund at periodic meetings throughout the year. The Board also considered the analysis provided by the Consultant relating to the Fund’s performance track record.
In light of all the considerations noted above, the Board concluded that it had continued confidence in HFMC’s and the Sub-adviser’s overall capabilities to manage the Fund.
Costs of the Services and Profitability of the Advisers
The Board reviewed information regarding HFMC’s cost to provide investment management and related services to the Fund and HFMC’s profitability, both overall and for the Fund, on a pre-tax basis without regard to distribution expenses. The Board also requested and reviewed information about the profitability to HFMC and its affiliates from all services provided to the Fund and all aspects of their relationship with the Fund. The Board also requested and received information relating to the operations and profitability of the Sub-adviser.
| 31 |
| Hartford MidCap Value HLS Fund |
| Approval of Investment Management and Investment Sub-Advisory Agreements(Unaudited) – (continued) |
The Board considered the Consultant’s review of the profitability calculations utilized by HFMC in connection with the continuation of the investment management agreement, noting the Consultant’s view that Hartford Funds’ process for calculating and reporting Fund profitability is reasonable. In this regard, the Board noted that the Consultant had previously performed a full review of this process and reported that such process is sound and well within common industry practice.
Based on these considerations, the Board concluded that the profits anticipated to be realized by the Advisers and their affiliates from their relationships with the Fund would not be excessive.
Comparison of Fees and Services Provided by the Advisers
The Board considered comparative information with respect to the management fees to be paid by the Fund to HFMC and the total expense ratios of the Fund. The Board also considered comparative information with respect to the sub-advisory fees to be paid by HFMC to the Sub-adviser. In this regard, the Board requested and reviewed information from HFMC and the Sub-adviser relating to the management and sub-advisory fees, including the sub-advisory fee schedule for the Fund, and total operating expenses for the Fund. The Board considered that the management fee for the Fund includes the fee paid to HLIC for providing certain administrative services to the Fund. With respect to the sub-advisory fee schedule, the Board considered representations from HFMC and the Sub-adviser that the Sub-adviser’s fees were negotiated at arm’s length. The Board also reviewed information from Lipper comparing the Fund’s contractual management fees, actual management fees and overall expense ratios relative to a group of funds selected by Lipper, in consultation with the Consultant, and a broader universe of funds selected by Lipper. The Board noted that the Fund’s contractual management fee, actual management fee and total expenses (less 12b-1 and shareholder service fees) were in the 3rd quintile of its expense group.
While the Board recognized that comparisons between the Fund and peer funds are imprecise, given the differing service levels and characteristics of mutual funds and the different business models and cost structures of the Advisers, the comparative information provided by Lipper assisted the Board in evaluating the reasonableness of the Fund’s management and sub-advisory fees and total operating expenses. In addition, the Board considered the analysis and recommendations of the Consultant relating to the Fund’s management and sub-advisory fees and total operating expenses.
Based on these considerations, the Board concluded that the Fund’s fees and total operating expenses, in conjunction with the information about quality of services, profitability, economies of scale, and other matters discussed, were reasonable in light of the services provided.
Economies of Scale
The Board requested and considered information regarding the Advisers’ realization of economies of scale with respect to the Fund and whether the fee levels reflect these economies of scale for the benefit of the Fund’s shareholders. The Board reviewed the breakpoints in the management fee schedule for the Fund, which reduce fee rates as Fund assets grow over time. The Board recognized that a fund with assets beyond the last breakpoint level will continue to benefit from economies of scale because additional assets are charged the lowest breakpoint fee resulting in lower overall effective management fee rates. The Board also recognized that a fee schedule that reaches a lower breakpoint quickly provides shareholders with the benefit of anticipated or potential economies of scale. The Board noted the effect of the sale and run-off of the variable annuity business on the HLS Funds.
The Board reviewed and evaluated materials from Lipper showing how management fee schedules of peer funds reflect economies of scale for the benefit of shareholders as a peer fund’s assets hypothetically increase over time. Based on information provided by HFMC, Lipper, and the Consultant, the Board recognized that there is no uniform methodology for establishing breakpoints or uniform pattern in asset levels that trigger breakpoints or the amounts of breakpoints triggered.
After considering all of the information available to it, the Board concluded that it was satisfied with the extent to which economies of scale would be shared for the benefit of the Fund’s shareholders based on currently available information and the effective advisory fees and expense ratios for the Fund at its current and reasonably anticipated asset levels. The Board noted, however, that it would continue to monitor future growth in Fund assets and the appropriateness of additional breakpoints.
| 32 |
Other Benefits
The Board considered other benefits to the Advisers and their affiliates from their relationships with the Fund, including the role of the Fund in supporting the variable life insurance and variable annuity products offered by The Hartford.
The Board reviewed information noting that HLIC, an affiliate of HFMC, receives fees for providing certain administrative services to the Fund and that HFMC receives fees for fund accounting and related services from the Fund. The Board considered information on profits to HLIC and HFMC for such services. The Board also considered that Hartford Administrative Services Company (“HASCO”), the Fund’s transfer agent and an affiliate of HFMC, receives transfer agency compensation from the Fund, and the Board reviewed information on the profitability of the Fund’s transfer agency function to HASCO. The Board considered information provided by HASCO indicating that the transfer agent fees charged by HASCO to the Fund were fair and reasonable based on publicly available information.
The Board also considered that Hartford Funds Distributors, LLC (“HFD”), an affiliate of HFMC, serves as principal underwriter of the Fund. As principal underwriter, HFD receives 12b-1 fees from the Fund. The Board also noted that certain affiliates of HFD distribute shares of the Fund and receive compensation in that connection.
The Board considered benefits to the Sub-adviser from its use of the Fund’s brokerage commissions to obtain soft dollar research, and representations from HFMC and the Sub-adviser that the Sub-adviser would not make any revenue-sharing payments or any other type of distribution payments to HFMC or its affiliates.
The Board considered the benefits to shareholders of being part of the Hartford Funds family of funds. The Board considered HFMC’s efforts to provide investors in the family with a broad range of investment styles and asset classes.
* * * *
Based upon its review of these various factors, among others, the Board concluded that it is in the best interests of the Fund and its shareholders for the Board to approve the Agreements for an additional year. In reaching this decision, the Board did not assign relative weights to the factors discussed above or deem any one or group of them to be controlling in and of themselves. In connection with their deliberations, the Independent Directors met separately in executive session on several occasions, with independent legal counsel and the Consultant, to review the relevant materials and consider their responsibilities under relevant laws and regulations.
| 33 |
| Hartford MidCap Value HLS Fund |
| Main Risks (Unaudited) |
The main risks of investing in the Fund are described below.
Market, Selection, and Strategy Risk: The Fund’s share price may fluctuate due to market risk and/or security selections that may underperform the market or relevant benchmarks. If the sub-adviser’s investment strategy does not perform as expected, the Fund could underperform its peers or lose money. There is no guarantee the Fund will achieve its stated objective.
Mid-cap Stock Risk: Mid-cap stocks are generally more volatile and risky and may be less liquid than large-cap stocks because they may have limited operating histories, narrow product lines, and focus on niche markets.
Value Investing Risk: Value investments are considered to be undervalued, but they may never attain their potential value. Value-style investing falls in and out of favor, which may result in periods of underperformance.
Foreign Investment Risk: Foreign investments can be riskier than U.S. investments. Potential risks include currency risk that may result from unfavorable exchange rates, liquidity risk if decreased demand for a security makes it difficult to sell at the desired price, and risks that stem from substantially lower trading volume on foreign markets.
| 34 |
THIS PRIVACY POLICY IS NOT PART OF THIS REPORT
Privacy Policy and Practices of The Hartford Financial Services Group, Inc. and its Affiliates
(herein called “we, our, and us”)
This Privacy Policy applies to our United States Operations
We value your trust. We are committed to the responsible: a) management; b) use; and c) protection; of Personal Information. This notice describes how we collect, disclose, and protect Personal Information.
We collect Personal Information to: a) service your Transactions with us; and b) support our business functions.
We may obtain Personal Information from: a) You; b) your Transactions with us; and c) third parties such as a consumer-reporting agency.
Based on the type of product or service You apply for or get from us, Personal Information such as: a) your name; b) your address; c) your income; d) your payment; or e) your credit history; may be gathered from sources such as applications, Transactions, and consumer reports.
To serve You and service our business, we may share certain Personal Information. We will share Personal Information, only as allowed by law, with affiliates such as: a) our insurance companies; b) our employee agents; c) our brokerage firms; and d) our administrators.
As allowed by law, we may share Personal Financial Information with our affiliates to: a) market our products; or b) market our services; to You without providing You with an option to prevent these disclosures. | We may also share Personal Information, only as allowed by law, with unaffiliated third parties including:
When allowed by law, we may share certain Personal Financial Information with other unaffiliated third parties who assist us by performing services or functions such as:
We, and third parties we partner with, may track some of the pages You visit through the use of: a) cookies; b) pixel tagging; or c) other technologies; and currently do not process or comply with any web browser’s “do not track” signal or similar mechanism that indicates a request to disable online tracking of individual users who visit our websites or use our services.
We will not sell or share your Personal Financial Information with anyone for purposes unrelated to our business functions without offering You the opportunity to:
We only disclose Personal Health Information with:
Our employees have access to Personal Information in the course of doing their jobs, such as: |
We use manual and electronic security procedures to maintain: a) the confidentiality; and b) the integrity of; Personal Information that we have. We use these procedures to guard against unauthorized access.
Some techniques we use to protect Personal Information include: a) secured files; b) user authentication; c) encryption; d) firewall technology; and e) the use of detection software.
We are responsible for and must: a) identify information to be protected; b) provide an adequate level of protection for that data; c) grant access to protected data only to those people who must use it in the performance of their job-related duties. Employees who violate our Privacy Policy will be subject to discipline, which may include ending their employment with us.
At the start of our business relationship, we will give You a copy of our current Privacy Policy.
We will also give You a copy of our current Privacy Policy once a year if You maintain a continuing business relationship with us.
We will continue to follow our Privacy Policy regarding Personal Information even when a business relationship no longer exists between us. | As used in this Privacy Notice:
Application means your request for our product or service.
Personal Financial Information means financial information such as:
Personal Health Information means health information such as:
Personal Information means information that identifies You personally and is not otherwise available to the public. It includes:
Transaction means your business dealings with us, such as:
You means an individual who has given us Personal Information in conjunction with: |
This Privacy Policy is being provided on behalf of the following affiliates of The Hartford Financial Services Group, Inc.:
1stAGChoice, Inc.; Access CoverageCorp, Inc.; Access CoverageCorp Technologies, Inc.; American Maturity Life Insurance Company; Archway 60 R, LLC; Business Management Group, Inc.; Catalyst360, LLC; Champlain Life Reinsurance Company; DMS R, LLC; Eloy R, LLC; Ersatz Corporation; First State Insurance Company; Hartford Accident and Indemnity Company; Hartford Administrative Services Company; Hartford Casualty General Agency, Inc.; Hartford Casualty Insurance Company; Hartford-Comprehensive Employee Benefit Service Company; Hartford Equity Sales Company, Inc.; Hartford Fire General Agency, Inc.; Hartford Fire Insurance Company; Hartford Funds Management Company, LLC; Hartford Funds Management Group, Inc.; Hartford HLS Series Fund II, Inc.; Hartford Insurance Company of Illinois; Hartford Insurance Company of the Midwest; Hartford Insurance Company of the Southeast; Hartford Integrated Technologies, Inc.; Hartford International Life Reassurance Corporation; Hartford Funds Distributors, LLC; Hartford Investment Management Company; Hartford Life and Accident Insurance Company; Hartford Life and Annuity Insurance Company; Hartford Life Insurance Company; Hartford Life Private Placement, LLC; Hartford Lloyd’s Corporation; Hartford Lloyd’s Insurance Company; Hartford Mezzanine Investors I, LLC; Hartford Residual Market, L.C.C.; Hartford Retirement Services, LLC; Hartford Securities Distribution Company, Inc.; Hartford Series Fund, Inc.; Hartford Specialty Insurance Services of Texas, LLC; Hartford Strategic Investments, LLC; Hartford Underwriters Insurance Company; Hartford Technology Services Company, L.L.C.; Hartford of Texas General Agency, Inc.; Hartford Underwriters General Agency, Inc.; HARTRE Company, L.C.C.; HL Investment Advisors, LLC; HLA LLC; Horizon Management Group, LLC; HRA Brokerage Services, Inc.; Lanidex Class B, LLC; M-CAP Insurance Agency, LLC; New England Insurance Company; New England Reinsurance Corporation; Nutmeg Insurance Agency, Inc.; Nutmeg Insurance Company; Pacific Insurance Company, Limited; Planco, LLC: Property and Casualty Insurance Company of Hartford; Revere R, LLC; RVR R, LLC; Sentinel Insurance Company, Ltd.; Sunstone R, LLC; Symphony R, LLC; The Evergreen Group Incorporated; The Hartford Alternative Strategies Fund; The Hartford Mutual Funds, Inc.; The Hartford Mutual Funds II, Inc.; Trumbull Flood Management, L.L.C.; Trumbull Insurance Company; Twin City Fire Insurance Company; White River Life Reinsurance Company.
HPP Revised December 2013
HARTFORD HLS FUNDS
c/o The Hartford Wealth Management - Global Annuities
P.O. Box 14293
Lexington, KY 40512-4293
HARTFORDFUNDS
hartfordfunds.com
Hartford Series Fund, Inc. is underwritten and distributed by Hartford Funds Distributors, LLC.
Hartford Series Fund, Inc. inception dates range from 1977 to date. Hartford Series Fund, Inc. is not a subsidiary of The Hartford Financial Services Group, Inc. ("The Hartford") but is underwritten, distributed by and advised by subsidiaries of The Hartford. Investments in Hartford Series Fund, Inc. are not guaranteed by The Hartford or any other entity.
This report is submitted for the general information of the shareholders of the Funds. It is not authorized for distribution unless preceded or accompanied by a current prospectus for the Funds.
Investors should carefully consider the investment objectives, risks, charges, and expenses of Hartford Funds before investing. This and other information can be found in the prospectus and summary prospectus, which can be obtained by calling 888-843-7824 (retail) or 877-836-5854 (institutional). Investors should read them carefully before they invest.
HLSAR-MCV13 2-14 113548-2 Printed in U.S.A ©2013 The Hartford, Hartford, CT 06115
HARTFORDFUNDS
| HARTFORD PORTFOLIO
DIVERSIFIER HLS FUND
2013 Annual Report
|
A MESSAGE FROM THE PRESIDENT
Dear Fellow Shareholders:
Thank you for investing in Hartford HLS Funds.
Market Review
U.S. equities (as represented by the S&P 500 Index) generated their strongest year since 1997 in 2013, rising 32.39% for the year. During the fourth quarter, equities rose without looking back, pushing the S&P 500 Index and the Dow Jones Industrial Average to new all-time highs. Despite previously cheering delays to quantitative-easing tapering, the stock market received an additional boost at the end of the year following the U.S. Federal Reserve’s (Fed) announcement of a $10-billion-a-month reduction in bond purchases beginning in January.
The Fed’s decision to begin tapering its bond purchases is generally considered a vote of confidence in the recovering U.S. economy. Consumer spending has stabilized, the housing market is showing steady improvement, the unemployment rate is slowly declining and economic growth clocked in at a healthy 4.1% in the third quarter. Equities have also recovered since the market low in March 2009: The S&P 500 Index has gained 173% from the market low through December 31, 2013.
Signs of improvement are also visible outside the U.S. Europe appears to have begun its own economic recovery, and emerging markets have reversed their recent lackluster performance. Fiscal policy continues to wield significant influence in today’s economy and central banks across the globe are maintaining their accommodative stances, including the appointment of Janet Yellen, who is widely expected to continue current monetary policies, to succeed Ben Bernanke as U.S. Federal Reserve chairman.
It’s important to stay abreast of domestic and international economic developments while balancing your individual investment goals. Meeting with your financial advisor on a regular basis to examine your current investment strategy can help you determine whether you are on the right track:
| • | Is your portfolio fully diversified with an appropriate mix of stocks and bonds? |
| • | Is your portfolio incorporating both domestic and international holdings to take advantage of the global economic recovery? |
| • | Are your investments still in line with your risk tolerance and investment time horizon? |
Your financial advisor can help you choose options within our fund family to navigate today’s markets with confidence.
Thank you again for investing with Hartford HLS Funds.
James Davey
President
Hartford HLS Funds
1The S&P 500 Index is a market capitalization-weighted price index composed of 500 widely held common stocks.
2The Dow Jones Industrial Average is an unmanaged, price-weighted index of 30 of the largest, most widely held stocks traded on the New York Stock Exchange.
Hartford Portfolio Diversifier HLS Fund
Table of Contents
This report is prepared for the general information of contract owners and qualified retirement plan participants. It is not an offer of contracts or of qualified retirement plans. It should not be used in connection with any offer, except in conjunction with the appropriate product prospectus which contains all pertinent information including the applicable sales, administrative and other charges.
The views expressed in the Fund’s Manager Discussion under ‘‘Why did the Fund perform this way?’’ and ‘‘What is the outlook?’’ are views of the Fund’s sub-adviser and portfolio management team through the end of the period and are subject to change based on market and other conditions. The Fund’s Manager Discussion is for informational purposes only and does not represent an offer, recommendation or solicitation to buy, hold or sell any security. The specific securities identified and described, if any, do not represent all of the securities purchased or sold and you should not assume that investments in the securities identified and discussed will be profitable.
Hartford Portfolio Diversifier HLS Fund inception 06/06/2011
(sub-advised by Hartford Investment Management Company)
Investment objective – Seeks to produce investment performance that mitigates against significant declines in the aggregate value of investment allocations to equity mutual funds under certain variable annuity contracts, while also preserving the potential for modest appreciation in the Fund’s net asset value when markets are appreciating.
Performance overview 6/06/11 - 12/31/13

The chart above represents the hypothetical growth of a $10,000 investment in Class IB.
Average Annual Total Returns (as of 12/31/13)
| 1 Year | Since Inception▲ | |||
| Portfolio Diversifier IB | -12.96% | -7.28% | ||
| Barclays U.S. Aggregate Bond Index | -2.02% | 2.56% | ||
| S&P 500 Index | 32.39% | 17.72% | ||
| ▲ | Inception: 06/06/2011 |
PERFORMANCE DATA QUOTED REPRESENTS PAST PERFORMANCE AND DOES NOT GUARANTEE FUTURE RESULTS. The investment return and principal value of the investment will fluctuate so that investors’ shares, when redeemed, may be worth more or less than their original cost. Current performance may be lower or higher than the performance data quoted. To obtain performance data current to the most recent month-end, please visit our website at www.hartfordfunds.com.
Total returns presented above were calculated using the Fund’s net asset value available to shareholders for sale or redemption of Fund shares on December 31, 2013, which may exclude investment transactions as of this date. All share class returns assume the reinvestment of all distributions at net asset value and the deduction of all fund expenses.
Barclays U.S. Aggregate Bond Index is an unmanaged index and is composed of securities from the Barclays Government/Credit Bond Index, Mortgage-Backed Securities Index, Asset-Backed Securities Index and Commercial Mortgage-Backed Securities Index.
S&P 500 Index is a market capitalization-weighted price index composed of 500 widely held common stocks.
You cannot invest directly in an index.
As of the Fund's current prospectus dated May 1, 2013, the net total annual operating expense ratio for Class IB shares was 0.85% and the gross total annual operating expense ratio for Class IB shares was 0.91%. Actual expenses may be higher. Please see the accompanying Financial Highlights for expense ratios for the year ended December 31, 2013.
Net operating expenses are the expenses paid to own the Fund. If the net operating expenses shown are lower than the gross operating expenses, then the net operating expenses reflect contractual fee waivers and expense reimbursements that may not be renewed. Contractual waivers or reimbursements remain in effect until April 30, 2014, and automatically renew for one-year terms unless terminated by the Fund’s investment adviser (Hartford Funds Management Company, LLC), or upon approval of the Board of Directors of the Fund. For more information about the fee arrangement and expiration dates, please see the expense table in the prospectus.
Gross operating expenses shown are before management fee waivers or expense caps. Performance information may reflect historical or current expense waivers or reimbursements, without which, performance would have been lower. For more information on fee waivers and/or expense reimbursements, please see the expense table in the prospectus.
The chart and table do not reflect the deductions of taxes, sales charges or other fees which may be applied at the variable life insurance, variable annuity or qualified retirement plan product level. Any such additional sales charges or other fees or expenses would lower the contract’s or plan’s performance.
All investments are subject to risk including the possible loss of principal. For a discussion of the Fund’s risks, please see the Main Risks section of this report. For more detailed information on the risks associated with an investment in the Fund, please see the prospectus.
| 2 |
| Hartford Portfolio Diversifier HLS Fund |
| Manager Discussion |
| December 31, 2013 (Unaudited) |
| Portfolio Managers | |
| Paul Bukowski, CFA | James Ong, CFA |
| Executive Vice President and Head of Quantitative Equities | Vice President |
How did the Fund perform?
The Class IB shares of the Hartford Portfolio Diversifier HLS Fund returned -12.96% for the twelve-month period ended December 31, 2013, compared to the returns of the Barclays U.S. Aggregate Bond Index and the S&P 500 Index, which returned -2.02% and 32.39%, respectively, for the same period.
Why did the Fund perform this way?
The Fund performed in line with expectations. The Fund generally invests in securities and other instruments that increase in value as the S&P 500 Index declines (protection), and securities and other instruments that are expected to approximate the performance of the Barclays U.S. Aggregate Bond and S&P 500 Indices.
Overall the Fund declined in value as it is designed to achieve performance generally “contra” to that of the S&P 500 Index, which posted strong performance appreciating over 15% during the second half of the year. The Fund’s protection securities, short S&P 500 futures and a modest short and long term S&P 500 put position declined in value, providing a headwind (i.e. negative impact) to performance during the second half of the year. The fixed income sleeve provided a very modest headwind to Fund performance as it modestly decreased.
What is your outlook?
Despite the start of tapering of bond buying by the U.S. Federal Reserve (Fed), the equity market’s performance, as measured by the S&P 500 Index, accelerated from its 5.2% third quarter pace to 10.5% in the fourth quarter. This was helped by the markets moving beyond major headwinds such as sequestration, budget battles, and possible military confrontations with Iran and Syria and leveraging tailwinds such as generally positive and improving macro and earnings data. For all of 2013, U.S. equity markets outperformed non-U.S. equities (MSCI All Country World ex USA, 15.78%), as well as other asset classes such as cash (3 Month T-Bills, 0.07%), bonds (Long Term Treasury Bonds, -13.29%), and gold (-27.79%).
Looking forward we expect improving macro, revenue, and earnings data that should support modestly positive (i.e. not the size we have seen recently) equity returns over the next quarter or so. Our major concern is that this rally is beginning to get a little long in the tooth without having to endure any significant pull back. We don’t subscribe to the equity market bubble thesis, but since June of 2012 the S&P 500 Index has had only one significant drawdown, a 6% pullback which occurred from late-May to late-June 2013. Historically, this is a fairly small drawdown for a given year. Drawdowns of 10% or greater are more typical, and we think we are due for a more typical/significant drawdown. The risk to this forecast is that earnings, sales and other fundamental factors may come in much better or worse than we currently expect.
Diversification by Security Type
as of December 31, 2013
| Category | Percentage of Net Assets | |||
| Equity Securities | ||||
| Common Stocks | 22.0 | % | ||
| Exchange Traded Funds | 0.1 | |||
| Put Options Purchased | 0.8 | |||
| Total | 22.9 | % | ||
| Fixed Income Securities | ||||
| Asset & Commercial Mortgage Backed Securities | 0.8 | % | ||
| Corporate Bonds | 10.7 | |||
| Foreign Government Obligations | 0.8 | |||
| Municipal Bonds | 0.2 | |||
| U.S. Government Agencies | 13.4 | |||
| U.S. Government Securities | 16.3 | |||
| Total | 42.2 | % | ||
| Short-Term Investments | 36.5 | % | ||
| Other Assets and Liabilities | (1.6 | ) | ||
| Total | 100.0 | % | ||
Credit Exposure
as of December 31, 2013
| Credit Rating * | Percentage of Net Assets | |||
| Aaa / AAA | 13.6 | % | ||
| Aa / AA | 18.9 | |||
| A | 4.3 | |||
| Baa / BBB | 5.3 | |||
| Ba / BB | 0.0 | |||
| Not Rated | 0.1 | |||
| Non-Debt Securities and Other Short-Term Instruments | 59.4 | |||
| Other Assets and Liabilities | (1.6 | ) | ||
| Total | 100.0 | % | ||
| * | Credit exposure is the long-term credit ratings for the Fund's holdings, as of the date noted, as provided by Standard and Poor's (S&P) or Moody's Investors Service and typically range from AAA/Aaa (highest) to C/D (lowest). If Moody's and S&P assign different ratings, the lower rating is used. Fixed income securities that are not rated by either agency are listed as "Not Rated." Ratings do not apply to the Fund itself or to Fund shares. Ratings may change. |
| 3 |
| Hartford Portfolio Diversifier HLS Fund |
| Schedule of Investments |
| December 31, 2013 |
| (000’s Omitted) |
| Shares or Principal Amount | Market Value ╪ | |||||||
| COMMON STOCKS - 22.0% | ||||||||
| Automobiles and Components - 0.3% | ||||||||
| 1 | BorgWarner, Inc. | $ | 75 | |||||
| 2 | Delphi Automotive plc | 100 | ||||||
| 23 | Ford Motor Co. | 360 | ||||||
| 7 | General Motors Co. ● | 275 | ||||||
| 1 | Goodyear (The) Tire & Rubber Co. | 35 | ||||||
| 1 | Harley-Davidson, Inc. | 91 | ||||||
| 4 | Johnson Controls, Inc. | 208 | ||||||
| 1,144 | ||||||||
| Banks - 0.6% | ||||||||
| 4 | BB&T Corp. | 156 | ||||||
| 1 | Comerica, Inc. | 51 | ||||||
| 5 | Fifth Third Bancorp | 110 | ||||||
| 3 | Hudson City Bancorp, Inc. | 26 | ||||||
| 5 | Huntington Bancshares, Inc. | 47 | ||||||
| 5 | KeyCorp | 71 | ||||||
| 1 | M&T Bank Corp. | 89 | ||||||
| 2 | People's United Financial, Inc. | 28 | ||||||
| 3 | PNC Financial Services Group, Inc. | 244 | ||||||
| 8 | Regions Financial Corp. | 81 | ||||||
| 3 | SunTrust Banks, Inc. | 117 | ||||||
| 11 | US Bancorp | 437 | ||||||
| 28 | Wells Fargo & Co. | 1,288 | ||||||
| 1 | Zions Bancorporation | 33 | ||||||
| 2,778 | ||||||||
| Capital Goods - 1.8% | ||||||||
| 4 | 3M Co. | 531 | ||||||
| 1 | AMETEK, Inc. | 77 | ||||||
| 4 | Boeing Co. | 559 | ||||||
| 4 | Caterpillar, Inc. | 342 | ||||||
| 1 | Cummins, Inc. | 146 | ||||||
| 4 | Danaher Corp. | 274 | ||||||
| 2 | Deere & Co. | 207 | ||||||
| 1 | Dover Corp. | 97 | ||||||
| 3 | Eaton Corp. plc | 214 | ||||||
| 4 | Emerson Electric Co. | 292 | ||||||
| 2 | Fastenal Co. | 77 | ||||||
| 1 | Flowserve Corp. | 65 | ||||||
| 1 | Fluor Corp. | 78 | ||||||
| 2 | General Dynamics Corp. | 189 | ||||||
| 60 | General Electric Co. | 1,679 | ||||||
| 5 | Honeywell International, Inc. | 425 | ||||||
| 2 | Illinois Tool Works, Inc. | 203 | ||||||
| 2 | Ingersoll-Rand plc | 98 | ||||||
| 1 | Jacobs Engineering Group, Inc. ● | 49 | ||||||
| 1 | Joy Global, Inc. | 37 | ||||||
| 1 | L-3 Communications Holdings, Inc. | 56 | ||||||
| 2 | Lockheed Martin Corp. | 237 | ||||||
| 2 | Masco Corp. | 48 | ||||||
| 1 | Northrop Grumman Corp. | 150 | ||||||
| 2 | PACCAR, Inc. | 124 | ||||||
| 1 | Pall Corp. | 56 | ||||||
| 1 | Parker-Hannifin Corp. | 113 | ||||||
| 1 | Pentair Ltd. | 92 | ||||||
| 1 | Precision Castparts Corp. | 231 | ||||||
| 1 | Quanta Services, Inc. ● | 40 | ||||||
| 2 | Raytheon Co. | 171 | ||||||
| 1 | Rockwell Automation, Inc. | 97 | ||||||
| 1 | Rockwell Collins, Inc. | 59 | ||||||
| 1 | Roper Industries, Inc. | 82 | ||||||
| — | Snap-On, Inc. | 38 | ||||||
| 1 | Stanley Black & Decker, Inc. | 75 | ||||||
| 2 | Textron, Inc. | 61 | ||||||
| 5 | United Technologies Corp. | 568 | ||||||
| — | W.W. Grainger, Inc. | 95 | ||||||
| 1 | Xylem, Inc. | 37 | ||||||
| 8,069 | ||||||||
| Commercial and Professional Services - 0.2% | ||||||||
| 1 | ADT (The) Corp. | 48 | ||||||
| 1 | Avery Dennison Corp. | 29 | ||||||
| 1 | Cintas Corp. | 36 | ||||||
| — | Dun & Bradstreet Corp. | 28 | ||||||
| 1 | Equifax, Inc. ● | 50 | ||||||
| 1 | Iron Mountain, Inc. | 30 | ||||||
| 1 | Nielsen Holdings N.V. | 69 | ||||||
| 1 | Pitney Bowes, Inc. | 28 | ||||||
| 2 | Republic Services, Inc. | 53 | ||||||
| 1 | Robert Half International, Inc. | 34 | ||||||
| 1 | Stericycle, Inc. ● | 59 | ||||||
| 3 | Tyco International Ltd. | 113 | ||||||
| 3 | Waste Management, Inc. | 116 | ||||||
| 693 | ||||||||
| Consumer Durables and Apparel - 0.3% | ||||||||
| 2 | Coach, Inc. | 93 | ||||||
| 2 | D.R. Horton, Inc. ● | 38 | ||||||
| — | Fossil Group, Inc. ● | 35 | ||||||
| 1 | Garmin Ltd. | 34 | ||||||
| — | Harman International Industries, Inc. | 32 | ||||||
| 1 | Hasbro, Inc. | 38 | ||||||
| 1 | Leggett & Platt, Inc. | 26 | ||||||
| 1 | Lennar Corp. | 39 | ||||||
| 2 | Mattel, Inc. | 95 | ||||||
| 1 | Michael Kors Holdings Ltd. ● | 86 | ||||||
| — | Mohawk Industries, Inc. ● | 54 | ||||||
| 2 | Newell Rubbermaid, Inc. | 55 | ||||||
| 4 | NIKE, Inc. Class B | 348 | ||||||
| 2 | Pulte Group, Inc. | 41 | ||||||
| — | PVH Corp. | 66 | ||||||
| — | Ralph Lauren Corp. | 62 | ||||||
| 2 | V.F. Corp. | 130 | ||||||
| — | Whirlpool Corp. | 72 | ||||||
| 1,344 | ||||||||
| Consumer Services - 0.4% | ||||||||
| 3 | Carnival Corp. | 104 | ||||||
| — | Chipotle Mexican Grill, Inc. ● | 96 | ||||||
| 1 | Darden Restaurants, Inc. | 42 | ||||||
| 2 | H & R Block, Inc. | 47 | ||||||
| 1 | International Game Technology | 27 | ||||||
| 1 | Marriott International, Inc. Class A | 65 | ||||||
| 6 | McDonald's Corp. | 571 | ||||||
| 4 | Starbucks Corp. | 350 | ||||||
| 1 | Starwood Hotels & Resorts, Inc. | 90 | ||||||
| 1 | Wyndham Worldwide Corp. | 57 | ||||||
| — | Wynn Resorts Ltd. | 94 | ||||||
| 3 | Yum! Brands, Inc. | 199 | ||||||
| 1,742 | ||||||||
| Diversified Financials - 1.5% | ||||||||
| 5 | American Express Co. | 495 | ||||||
| 1 | Ameriprise Financial, Inc. | 133 | ||||||
The accompanying notes are an integral part of these financial statements.
| 4 |
| Shares or Principal Amount | Market Value ╪ | |||||||
| COMMON STOCKS - 22.0% - (continued) | ||||||||
| Diversified Financials - 1.5% - (continued) | ||||||||
| 63 | Bank of America Corp. | $ | 983 | |||||
| 7 | Bank of New York Mellon Corp. | 238 | ||||||
| 1 | BlackRock, Inc. | 239 | ||||||
| 3 | Capital One Financial Corp. | 262 | ||||||
| 7 | Charles Schwab Corp. | 178 | ||||||
| 18 | Citigroup, Inc. | 936 | ||||||
| 2 | CME Group, Inc. | 146 | ||||||
| 3 | Discover Financial Services, Inc. | 158 | ||||||
| 2 | E*Trade Financial Corp. ● | 33 | ||||||
| 2 | Franklin Resources, Inc. | 138 | ||||||
| 2 | Goldman Sachs Group, Inc. | 442 | ||||||
| 1 | IntercontinentalExchange Group, Inc. | 154 | ||||||
| 3 | Invesco Ltd. | 95 | ||||||
| 22 | JP Morgan Chase & Co. | 1,301 | ||||||
| 1 | Legg Mason, Inc. | 28 | ||||||
| 2 | Leucadia National Corp. | 53 | ||||||
| 1 | Moody's Corp. | 88 | ||||||
| 8 | Morgan Stanley | 257 | ||||||
| 1 | Nasdaq OMX Group, Inc. | 27 | ||||||
| 1 | Northern Trust Corp. | 82 | ||||||
| 3 | SLM Corp. | 68 | ||||||
| 3 | State Street Corp. | 191 | ||||||
| 2 | T. Rowe Price Group, Inc. | 130 | ||||||
| 6,855 | ||||||||
| Energy - 2.3% | ||||||||
| 3 | Anadarko Petroleum Corp. | 236 | ||||||
| 2 | Apache Corp. | 203 | ||||||
| 3 | Baker Hughes, Inc. | 145 | ||||||
| 2 | Cabot Oil & Gas Corp. | 97 | ||||||
| 1 | Cameron International Corp. ● | 84 | ||||||
| 3 | Chesapeake Energy Corp. | 81 | ||||||
| 11 | Chevron Corp. | 1,422 | ||||||
| 7 | ConocoPhillips Holding Co. | 512 | ||||||
| 1 | Consol Energy, Inc. | 51 | ||||||
| 2 | Denbury Resources, Inc. ● | 36 | ||||||
| 2 | Devon Energy Corp. | 139 | ||||||
| — | Diamond Offshore Drilling, Inc. | 24 | ||||||
| 1 | Ensco plc | 79 | ||||||
| 2 | EOG Resources, Inc. | 272 | ||||||
| 1 | EQT Corp. | 80 | ||||||
| 26 | Exxon Mobil Corp. | 2,617 | ||||||
| 1 | FMC Technologies, Inc. ● | 73 | ||||||
| 5 | Halliburton Co. | 255 | ||||||
| 1 | Helmerich & Payne, Inc. | 53 | ||||||
| 2 | Hess Corp. | 140 | ||||||
| 4 | Kinder Morgan, Inc. | 143 | ||||||
| 4 | Marathon Oil Corp. | 146 | ||||||
| 2 | Marathon Petroleum Corp. | 164 | ||||||
| 1 | Murphy Oil Corp. | 68 | ||||||
| 2 | Nabors Industries Ltd. | 26 | ||||||
| 3 | National Oilwell Varco, Inc. | 201 | ||||||
| 1 | Newfield Exploration Co. ● | 20 | ||||||
| 1 | Noble Corp. plc | 56 | ||||||
| 2 | Noble Energy, Inc. | 145 | ||||||
| 5 | Occidental Petroleum Corp. | 454 | ||||||
| 2 | Peabody Energy Corp. | 31 | ||||||
| 4 | Phillips 66 | 274 | ||||||
| 1 | Pioneer Natural Resources Co. | 156 | ||||||
| 1 | QEP Resources, Inc. | 33 | ||||||
| 1 | Range Resources Corp. | 81 | ||||||
| 1 | Rowan Cos. plc Class A ● | 26 | ||||||
| 8 | Schlumberger Ltd. | 702 | ||||||
| 2 | Southwestern Energy Co. ● | 82 | ||||||
| 4 | Spectra Energy Corp. | 141 | ||||||
| 1 | Tesoro Corp. | 46 | ||||||
| 2 | Transocean, Inc. | 99 | ||||||
| 3 | Valero Energy Corp. | 161 | ||||||
| 4 | Williams Cos., Inc. | 156 | ||||||
| 1 | WPX Energy, Inc. ● | 24 | ||||||
| 10,034 | ||||||||
| Food and Staples Retailing - 0.5% | ||||||||
| 3 | Costco Wholesale Corp. | 308 | ||||||
| 7 | CVS Caremark Corp. | 504 | ||||||
| 3 | Kroger (The) Co. | 122 | ||||||
| 1 | Safeway, Inc. | 47 | ||||||
| 3 | Sysco Corp. | 124 | ||||||
| 5 | Walgreen Co. | 296 | ||||||
| 10 | Wal-Mart Stores, Inc. | 753 | ||||||
| 2 | Whole Foods Market, Inc. | 128 | ||||||
| 2,282 | ||||||||
| Food, Beverage and Tobacco - 1.2% | ||||||||
| 12 | Altria Group, Inc. | 455 | ||||||
| 4 | Archer-Daniels-Midland Co. | 169 | ||||||
| 1 | Beam, Inc. | 66 | ||||||
| 1 | Brown-Forman Corp. | 72 | ||||||
| 1 | Campbell Soup Co. | 46 | ||||||
| 22 | Coca-Cola Co. | 929 | ||||||
| 1 | Coca-Cola Enterprises, Inc. | 63 | ||||||
| 3 | ConAgra Foods, Inc. | 84 | ||||||
| 1 | Constellation Brands, Inc. Class A ● | 69 | ||||||
| 1 | Dr. Pepper Snapple Group | 58 | ||||||
| 4 | General Mills, Inc. | 187 | ||||||
| 1 | Hershey Co. | 87 | ||||||
| 1 | Hormel Foods Corp. | 36 | ||||||
| 1 | J.M. Smucker Co. | 64 | ||||||
| 2 | Kellogg Co. | 93 | ||||||
| 4 | Kraft Foods Group, Inc. | 190 | ||||||
| 2 | Lorillard, Inc. | 110 | ||||||
| 1 | McCormick & Co., Inc. | 54 | ||||||
| 1 | Mead Johnson Nutrition Co. | 100 | ||||||
| 1 | Molson Coors Brewing Co. | 53 | ||||||
| 10 | Mondelez International, Inc. | 367 | ||||||
| 1 | Monster Beverage Corp. ● | 54 | ||||||
| 9 | PepsiCo, Inc. | 753 | ||||||
| 9 | Philip Morris International, Inc. | 826 | ||||||
| 2 | Reynolds American, Inc. | 93 | ||||||
| 2 | Tyson Foods, Inc. Class A | 54 | ||||||
| 5,132 | ||||||||
| Health Care Equipment and Services - 0.9% | ||||||||
| 9 | Abbott Laboratories | 351 | ||||||
| 2 | Aetna, Inc. | 150 | ||||||
| 1 | AmerisourceBergen Corp. | 96 | ||||||
| — | Bard (C.R.), Inc. | 62 | ||||||
| 3 | Baxter International, Inc. | 224 | ||||||
| 1 | Becton, Dickinson & Co. | 127 | ||||||
| 8 | Boston Scientific Corp. ● | 95 | ||||||
| 2 | Cardinal Health, Inc. | 135 | ||||||
| 1 | CareFusion Corp. ● | 49 | ||||||
The accompanying notes are an integral part of these financial statements.
| 5 |
| Hartford Portfolio Diversifier HLS Fund |
| Schedule of Investments – (continued) |
| December 31, 2013 |
| (000’s Omitted) |
| Shares or Principal Amount | Market Value ╪ | |||||||
| COMMON STOCKS - 22.0% - (continued) | ||||||||
| Health Care Equipment and Services - 0.9% - (continued) | ||||||||
| 2 | Cerner Corp. ● | $ | 98 | |||||
| 2 | CIGNA Corp. | 143 | ||||||
| 3 | Covidien plc | 185 | ||||||
| 1 | DaVita HealthCare Partners, Inc. ● | 67 | ||||||
| 1 | Dentsply International, Inc. | 41 | ||||||
| 1 | Edwards Lifesciences Corp. ● | 42 | ||||||
| 5 | Express Scripts Holding Co. ● | 335 | ||||||
| 1 | Humana, Inc. | 95 | ||||||
| — | Intuitive Surgical, Inc. ● | 85 | ||||||
| 1 | Laboratory Corp. of America Holdings ● | 47 | ||||||
| 1 | McKesson Corp. | 220 | ||||||
| 6 | Medtronic, Inc. | 339 | ||||||
| — | Patterson Cos., Inc. | 20 | ||||||
| 1 | Quest Diagnostics, Inc. | 46 | ||||||
| 2 | St. Jude Medical, Inc. | 107 | ||||||
| 2 | Stryker Corp. | 132 | ||||||
| 1 | Tenet Healthcare Corp. ● | 25 | ||||||
| 6 | UnitedHealth Group, Inc. | 449 | ||||||
| 1 | Varian Medical Systems, Inc. ● | 49 | ||||||
| 2 | Wellpoint, Inc. | 162 | ||||||
| 1 | Zimmer Holdings, Inc. | 94 | ||||||
| 4,070 | ||||||||
| Household and Personal Products - 0.5% | ||||||||
| 3 | Avon Products, Inc. | 44 | ||||||
| 1 | Clorox Co. | 71 | ||||||
| 5 | Colgate-Palmolive Co. | 339 | ||||||
| 2 | Estee Lauder Co., Inc. | 115 | ||||||
| 2 | Kimberly-Clark Corp. | 236 | ||||||
| 16 | Procter & Gamble Co. | 1,310 | ||||||
| 2,115 | ||||||||
| Insurance - 1.0% | ||||||||
| 2 | ACE Ltd. | 212 | ||||||
| 3 | Aflac, Inc. | 194 | ||||||
| 3 | Allstate (The) Corp. | 149 | ||||||
| 9 | American International Group, Inc. | 452 | ||||||
| 2 | Aon plc | 150 | ||||||
| — | Assurant, Inc. | 29 | ||||||
| 11 | Berkshire Hathaway, Inc. Class B ● | 1,284 | ||||||
| 2 | Chubb Corp. | 146 | ||||||
| 1 | Cincinnati Financial Corp. | 46 | ||||||
| 3 | Genworth Financial, Inc. ● | 46 | ||||||
| 2 | Lincoln National Corp. | 84 | ||||||
| 2 | Loews Corp. | 89 | ||||||
| 3 | Marsh & McLennan Cos., Inc. | 157 | ||||||
| 7 | MetLife, Inc. | 376 | ||||||
| 2 | Principal Financial Group, Inc. | 84 | ||||||
| 3 | Progressive Corp. | 90 | ||||||
| 3 | Prudential Financial, Inc. | 266 | ||||||
| 1 | Torchmark Corp. | 44 | ||||||
| 2 | Travelers Cos., Inc. | 199 | ||||||
| 2 | Unum Group | 57 | ||||||
| 2 | XL Group plc | 54 | ||||||
| 4,208 | ||||||||
| Materials - 0.8% | ||||||||
| 1 | Air Products & Chemicals, Inc. | 140 | ||||||
| — | Airgas, Inc. | 44 | ||||||
| 6 | Alcoa, Inc. | 67 | ||||||
| 1 | Allegheny Technologies, Inc. | 23 | ||||||
| 1 | Ball Corp. | 44 | ||||||
| 1 | Bemis Co., Inc. | 25 | ||||||
| — | CF Industries Holdings, Inc. | 80 | ||||||
| 1 | Cliff's Natural Resources, Inc. | 23 | ||||||
| 7 | Dow Chemical Co. | 319 | ||||||
| 5 | E.I. DuPont de Nemours & Co. | 356 | ||||||
| 1 | Eastman Chemical Co. | 74 | ||||||
| 2 | Ecolab, Inc. | 167 | ||||||
| 1 | FMC Corp. | 59 | ||||||
| 6 | Freeport-McMoRan Copper & Gold, Inc. | 232 | ||||||
| — | International Flavors & Fragrances, Inc. | 42 | ||||||
| 3 | International Paper Co. | 129 | ||||||
| 3 | LyondellBasell Industries Class A | 207 | ||||||
| 1 | MeadWestvaco Corp. | 39 | ||||||
| 3 | Monsanto Co. | 362 | ||||||
| 2 | Mosaic Co. | 95 | ||||||
| 3 | Newmont Mining Corp. | 68 | ||||||
| 2 | Nucor Corp. | 101 | ||||||
| 1 | Owens-Illinois, Inc. ● | 35 | ||||||
| 1 | PPG Industries, Inc. | 160 | ||||||
| 2 | Praxair, Inc. | 226 | ||||||
| 1 | Sealed Air Corp. | 39 | ||||||
| 1 | Sherwin-Williams Co. | 93 | ||||||
| 1 | Sigma-Aldrich Corp. | 67 | ||||||
| 1 | United States Steel Corp. | 25 | ||||||
| 1 | Vulcan Materials Co. | 46 | ||||||
| 3,387 | ||||||||
| Media - 0.8% | ||||||||
| 1 | Cablevision Systems Corp. | 22 | ||||||
| 3 | CBS Corp. Class B | 210 | ||||||
| 15 | Comcast Corp. Class A | 802 | ||||||
| 3 | DirecTV ● | 200 | ||||||
| 1 | Discovery Communications, Inc. ● | 121 | ||||||
| 1 | Gannett Co., Inc. | 40 | ||||||
| — | Graham Holdings Co. ● | 17 | ||||||
| 2 | Interpublic Group of Cos., Inc. | 43 | ||||||
| 2 | McGraw Hill Financial, Inc. | 126 | ||||||
| 3 | News Corp. Class A ● | 53 | ||||||
| 2 | Omnicom Group, Inc. | 113 | ||||||
| 1 | Scripps Networks Interactive Class A | 56 | ||||||
| 2 | Time Warner Cable, Inc. | 226 | ||||||
| 5 | Time Warner, Inc. | 373 | ||||||
| 12 | Twenty-First Century Fox, Inc. | 409 | ||||||
| 2 | Viacom, Inc. Class B | 210 | ||||||
| 10 | Walt Disney Co. | 739 | ||||||
| 3,760 | ||||||||
| Pharmaceuticals, Biotechnology and Life Sciences - 1.9% | ||||||||
| 9 | AbbVie, Inc. | 497 | ||||||
| 1 | Actavis plc ● | 173 | ||||||
| 2 | Agilent Technologies, Inc. | 112 | ||||||
| 1 | Alexion Pharmaceuticals, Inc. ● | 154 | ||||||
| 2 | Allergan, Inc. | 196 | ||||||
| 4 | Amgen, Inc. | 510 | ||||||
| 1 | Biogen Idec, Inc. ● | 391 | ||||||
| 10 | Bristol-Myers Squibb Co. | 518 | ||||||
| 2 | Celgene Corp. ● | 412 | ||||||
| 6 | Eli Lilly & Co. | 299 | ||||||
| 1 | Forest Laboratories, Inc. ● | 85 | ||||||
The accompanying notes are an integral part of these financial statements.
| 6 |
| Shares or Principal Amount | Market Value ╪ | |||||||
| COMMON STOCKS - 22.0% - (continued) | ||||||||
| Pharmaceuticals, Biotechnology and Life Sciences - 1.9% - (continued) | ||||||||
| 9 | Gilead Sciences, Inc. ● | $ | 682 | |||||
| 1 | Hospira, Inc. ● | 41 | ||||||
| 17 | Johnson & Johnson | 1,530 | ||||||
| 1 | Life Technologies Corp. ● | 78 | ||||||
| 17 | Merck & Co., Inc. | 866 | ||||||
| 2 | Mylan, Inc. ● | 98 | ||||||
| 1 | PerkinElmer, Inc. | 27 | ||||||
| 1 | Perrigo Co. plc | 118 | ||||||
| 38 | Pfizer, Inc. | 1,175 | ||||||
| — | Regeneron Pharmaceuticals, Inc. ● | 128 | ||||||
| 2 | Thermo Fisher Scientific, Inc. | 239 | ||||||
| 1 | Vertex Pharmaceuticals, Inc. ● | 103 | ||||||
| 1 | Waters Corp. ● | 51 | ||||||
| 3 | Zoetis, Inc. | 97 | ||||||
| 8,580 | ||||||||
| Real Estate - 0.4% | ||||||||
| 2 | American Tower Corp. REIT | 186 | ||||||
| 1 | Apartment Investment & Management Co. Class A REIT | 22 | ||||||
| 1 | AvalonBay Communities, Inc. REIT | 85 | ||||||
| 1 | Boston Properties, Inc. REIT | 91 | ||||||
| 2 | CBRE Group, Inc. ● | 43 | ||||||
| 2 | Equity Residential Properties Trust REIT | 103 | ||||||
| 3 | General Growth Properties, Inc. REIT | 64 | ||||||
| 3 | HCP, Inc. REIT | 98 | ||||||
| 2 | Health Care, Inc. REIT | 92 | ||||||
| 4 | Host Hotels & Resorts, Inc. REIT | 87 | ||||||
| 2 | Kimco Realty Corp. REIT | 48 | ||||||
| 1 | Macerich Co. REIT | 49 | ||||||
| 1 | Plum Creek Timber Co., Inc. REIT | 49 | ||||||
| 3 | ProLogis L.P. REIT | 109 | ||||||
| 1 | Public Storage REIT | 128 | ||||||
| 2 | Simon Property Group, Inc. REIT | 280 | ||||||
| 2 | Ventas, Inc. REIT | 100 | ||||||
| 1 | Vornado Realty Trust REIT | 92 | ||||||
| 3 | Weyerhaeuser Co. REIT | 109 | ||||||
| 1,835 | ||||||||
| Retailing - 1.0% | ||||||||
| 2 | Amazon.com, Inc. ● | 877 | ||||||
| — | AutoNation, Inc. ● | 19 | ||||||
| — | AutoZone, Inc. ● | 94 | ||||||
| 1 | Bed Bath & Beyond, Inc. ● | 102 | ||||||
| 2 | Best Buy Co., Inc. | 64 | ||||||
| 1 | CarMax, Inc. ● | 62 | ||||||
| 2 | Dollar General Corp. ● | 105 | ||||||
| 1 | Dollar Tree, Inc. ● | 70 | ||||||
| 1 | Expedia, Inc. | 42 | ||||||
| 1 | Family Dollar Stores, Inc. | 37 | ||||||
| 1 | GameStop Corp. Class A | 34 | ||||||
| 2 | Gap, Inc. | 61 | ||||||
| 1 | Genuine Parts Co. | 76 | ||||||
| 8 | Home Depot, Inc. | 686 | ||||||
| 1 | Kohl's Corp. | 68 | ||||||
| 1 | L Brands, Inc. | 89 | ||||||
| 6 | Lowe's Cos., Inc. | 307 | ||||||
| 2 | Macy's, Inc. | 117 | ||||||
| — | Netflix, Inc. ● | 130 | ||||||
| 1 | Nordstrom, Inc. | 53 | ||||||
| 1 | O'Reilly Automotive, Inc. ● | 81 | ||||||
| 1 | PetSmart, Inc. | 45 | ||||||
| — | Priceline.com, Inc. ● | 349 | ||||||
| 1 | Ross Stores, Inc. | 96 | ||||||
| 4 | Staples, Inc. | 62 | ||||||
| 4 | Target Corp. | 237 | ||||||
| 1 | Tiffany & Co. | 61 | ||||||
| 4 | TJX Cos., Inc. | 268 | ||||||
| 1 | TripAdvisor, Inc. ● | 55 | ||||||
| 1 | Urban Outfitters, Inc. ● | 24 | ||||||
| 4,371 | ||||||||
| Semiconductors and Semiconductor Equipment - 0.4% | ||||||||
| 2 | Altera Corp. | 62 | ||||||
| 2 | Analog Devices, Inc. | 94 | ||||||
| 7 | Applied Materials, Inc. | 126 | ||||||
| 3 | Broadcom Corp. Class A | 95 | ||||||
| — | First Solar, Inc. ● | 23 | ||||||
| 29 | Intel Corp. | 764 | ||||||
| 1 | KLA-Tencor Corp. | 64 | ||||||
| 1 | Lam Research Corp. ● | 52 | ||||||
| 1 | Linear Technology Corp. | 63 | ||||||
| 3 | LSI Corp. | 36 | ||||||
| 1 | Microchip Technology, Inc. | 52 | ||||||
| 6 | Micron Technology, Inc. ● | 135 | ||||||
| 3 | NVIDIA Corp. | 55 | ||||||
| 6 | Texas Instruments, Inc. | 285 | ||||||
| 2 | Xilinx, Inc. | 73 | ||||||
| 1,979 | ||||||||
| Software and Services - 2.3% | ||||||||
| 4 | Accenture plc | 309 | ||||||
| 3 | Adobe Systems, Inc. ● | 165 | ||||||
| 1 | Akamai Technologies, Inc. ● | 50 | ||||||
| — | Alliance Data Systems Corp. ● | 76 | ||||||
| 1 | Autodesk, Inc. ● | 67 | ||||||
| 3 | Automatic Data Processing, Inc. | 230 | ||||||
| 2 | CA, Inc. | 65 | ||||||
| 1 | Citrix Systems, Inc. ● | 70 | ||||||
| 2 | Cognizant Technology Solutions Corp. ● | 181 | ||||||
| 1 | Computer Sciences Corp. | 49 | ||||||
| 7 | eBay, Inc. ● | 378 | ||||||
| 2 | Electronic Arts, Inc. ● | 42 | ||||||
| 10 | Facebook, Inc. ● | 532 | ||||||
| 2 | Fidelity National Information Services, Inc. | 93 | ||||||
| 2 | Fiserv, Inc. ● | 90 | ||||||
| 2 | Google, Inc. ● | 1,863 | ||||||
| 6 | IBM Corp. | 1,134 | ||||||
| 2 | Intuit, Inc. | 128 | ||||||
| 1 | Mastercard, Inc. | 514 | ||||||
| 45 | Microsoft Corp. | 1,683 | ||||||
| 21 | Oracle Corp. | 795 | ||||||
| 2 | Paychex, Inc. | 88 | ||||||
| 1 | Red Hat, Inc. ● | 63 | ||||||
| 3 | Salesforce.com, Inc. ● | 181 | ||||||
| 4 | Symantec Corp. | 97 | ||||||
| 1 | Teradata Corp. ● | 44 | ||||||
| 1 | Total System Services, Inc. | 33 | ||||||
| 1 | VeriSign, Inc. ● | 46 | ||||||
| 3 | Visa, Inc. | 670 | ||||||
| 3 | Western Union Co. | 56 | ||||||
The accompanying notes are an integral part of these financial statements.
| 7 |
| Hartford Portfolio Diversifier HLS Fund |
| Schedule of Investments – (continued) |
| December 31, 2013 |
| (000’s Omitted) |
| Shares or Principal Amount | Market Value ╪ | |||||||
| COMMON STOCKS - 22.0% - (continued) | ||||||||
| Software and Services - 2.3% - (continued) | ||||||||
| 6 | Yahoo!, Inc. ● | $ | 226 | |||||
| 10,018 | ||||||||
| Technology Hardware and Equipment - 1.4% | ||||||||
| 1 | Allegion plc ● | 24 | ||||||
| 1 | Amphenol Corp. Class A | 84 | ||||||
| 5 | Apple, Inc. | 2,990 | ||||||
| 32 | Cisco Systems, Inc. | 711 | ||||||
| 9 | Corning, Inc. | 153 | ||||||
| 12 | EMC Corp. | 306 | ||||||
| — | F5 Networks, Inc. ● | 42 | ||||||
| 1 | FLIR Systems, Inc. | 25 | ||||||
| 1 | Harris Corp. | 44 | ||||||
| 11 | Hewlett-Packard Co. | 318 | ||||||
| 1 | Jabil Circuit, Inc. | 19 | ||||||
| 3 | Juniper Networks, Inc. ● | 67 | ||||||
| 1 | Motorola Solutions, Inc. | 92 | ||||||
| 2 | NetApp, Inc. | 83 | ||||||
| 10 | Qualcomm, Inc. | 743 | ||||||
| 1 | SanDisk Corp. | 94 | ||||||
| 2 | Seagate Technology plc | 108 | ||||||
| 2 | TE Connectivity Ltd. | 134 | ||||||
| 1 | Western Digital Corp. | 105 | ||||||
| 7 | Xerox Corp. | 83 | ||||||
| 6,225 | ||||||||
| Telecommunication Services - 0.5% | ||||||||
| 31 | AT&T, Inc. | 1,097 | ||||||
| 4 | CenturyLink, Inc. | 112 | ||||||
| 2 | Crown Castle International Corp. ● | 145 | ||||||
| 6 | Frontier Communications Co. | 28 | ||||||
| 17 | Verizon Communications, Inc. | 832 | ||||||
| 4 | Windstream Holdings, Inc. | 28 | ||||||
| 2,242 | ||||||||
| Transportation - 0.4% | ||||||||
| 1 | C.H. Robinson Worldwide, Inc. | 52 | ||||||
| 6 | CSX Corp. | 173 | ||||||
| 5 | Delta Air Lines, Inc. | 139 | ||||||
| 1 | Expeditors International of Washington, Inc. | 54 | ||||||
| 2 | FedEx Corp. | 253 | ||||||
| 1 | Kansas City Southern | 81 | ||||||
| 2 | Norfolk Southern Corp. | 170 | ||||||
| — | Ryder System, Inc. | 23 | ||||||
| 4 | Southwest Airlines Co. | 78 | ||||||
| 3 | Union Pacific Corp. | 458 | ||||||
| 4 | United Parcel Service, Inc. Class B | 445 | ||||||
| 1,926 | ||||||||
| Utilities - 0.6% | ||||||||
| 4 | AES (The) Corp. | 56 | ||||||
| 1 | AGL Resources, Inc. | 33 | ||||||
| 1 | Ameren Corp. | 52 | ||||||
| 3 | American Electric Power Co., Inc. | 135 | ||||||
| 3 | CenterPoint Energy, Inc. | 59 | ||||||
| 2 | CMS Energy Corp. | 42 | ||||||
| 2 | Consolidated Edison, Inc. | 96 | ||||||
| 3 | Dominion Resources, Inc. | 222 | ||||||
| 1 | DTE Energy Co. | 70 | ||||||
| 4 | Duke Energy Corp. | 288 | ||||||
| 2 | Edison International | 89 | ||||||
| 1 | Entergy Corp. | 67 | ||||||
| 5 | Exelon Corp. | 139 | ||||||
| 2 | FirstEnergy Corp. | 82 | ||||||
| — | Integrys Energy Group, Inc. | 26 | ||||||
| 3 | NextEra Energy, Inc. | 218 | ||||||
| 2 | NiSource, Inc. | 61 | ||||||
| 2 | Northeast Utilities | 79 | ||||||
| 2 | NRG Energy, Inc. | 55 | ||||||
| 1 | Oneok, Inc. | 76 | ||||||
| 1 | Pepco Holdings, Inc. | 28 | ||||||
| 3 | PG&E Corp. | 107 | ||||||
| 1 | Pinnacle West Capital Corp. | 35 | ||||||
| 4 | PPL Corp. | 112 | ||||||
| 3 | Public Service Enterprise Group, Inc. | 96 | ||||||
| 1 | SCANA Corp. | 39 | ||||||
| 1 | Sempra Energy | 121 | ||||||
| 5 | Southern Co. | 215 | ||||||
| 1 | TECO Energy, Inc. | 21 | ||||||
| 1 | Wisconsin Energy Corp. | 55 | ||||||
| 3 | Xcel Energy, Inc. | 82 | ||||||
| 2,856 | ||||||||
| Total common stocks | ||||||||
| (cost $76,866) | $ | 97,645 | ||||||
EXCHANGE TRADED FUNDS - 0.1% | ||||||||
| Diversified Financials - 0.1% | ||||||||
| 3 | Vanguard S&P 500 ETF | $ | 448 | |||||
| Total exchange traded funds | ||||||||
| (cost $438) | $ | 448 | ||||||
ASSET & COMMERCIAL MORTGAGE BACKED SECURITIES - 0.8% | ||||||||
| Finance and Insurance - 0.8% | ||||||||
| Ally Automotive Receivables Trust | ||||||||
| $ | 13 | 0.93%, 02/16/2016 | $ | 13 | ||||
| Banc of America Commercial Mortgage, Inc. | ||||||||
| 25 | 5.41%, 09/10/2047 | 27 | ||||||
| 25 | 5.45%, 01/15/2049 | 27 | ||||||
| 20 | 5.49%, 02/10/2051 Δ | 22 | ||||||
| 60 | 5.68%, 07/10/2046 | 65 | ||||||
| 35 | 5.79%, 04/10/2049 Δ | 39 | ||||||
| 30 | 5.80%, 06/10/2049 Δ | 33 | ||||||
| 25 | 5.89%, 07/10/2044 Δ | 27 | ||||||
| 15 | 5.92%, 05/10/2045 Δ | 16 | ||||||
| 10 | 5.94%, 02/10/2051 Δ | 11 | ||||||
| Bear Stearns Commercial Mortgage Securities, Inc. | ||||||||
| 60 | 5.20%, 12/11/2038 | 66 | ||||||
| 25 | 5.33%, 02/11/2044 | 27 | ||||||
| 60 | 5.41%, 12/11/2040 | 64 | ||||||
| 25 | 5.70%, 06/13/2050 | 28 | ||||||
| 60 | 5.90%, 06/11/2040 Δ | 67 | ||||||
| Chase Issuance Trust | ||||||||
| 150 | 0.79%, 06/15/2017 | 151 | ||||||
| 100 | 1.30%, 02/18/2020 | 98 | ||||||
| Citibank Credit Card Issuance Trust | ||||||||
| 110 | 4.85%, 03/10/2017 | 116 | ||||||
| 100 | 5.65%, 09/20/2019 | 115 | ||||||
The accompanying notes are an integral part of these financial statements.
| 8 |
| Shares or Principal Amount | Market Value ╪ | |||||||
| ASSET & COMMERCIAL MORTGAGE BACKED SECURITIES - 0.8% - (continued) | ||||||||
| Finance and Insurance - 0.8% - (continued) | ||||||||
| Citigroup Commercial Mortgage Trust | ||||||||
| $ | 35 | 5.89%, 12/10/2049 Δ | $ | 39 | ||||
| 20 | 6.34%, 12/10/2049 Δ | 23 | ||||||
| Citigroup/Deutsche Bank Commercial Mortgage Trust | ||||||||
| 25 | 5.32%, 12/11/2049 | 27 | ||||||
| 35 | 5.39%, 07/15/2044 Δ | 37 | ||||||
| 25 | 5.62%, 10/15/2048 | 27 | ||||||
| 34 | 5.89%, 11/15/2044 | 38 | ||||||
| Commercial Mortgage Pass-Through Certificates | ||||||||
| 30 | 3.15%, 08/15/2045 | 29 | ||||||
| 20 | 5.31%, 12/10/2046 | 22 | ||||||
| 25 | 5.94%, 06/10/2046 Δ | 27 | ||||||
| 15 | 5.99%, 12/10/2049 Δ | 17 | ||||||
| Community or Commercial Mortgage Trust | ||||||||
| 15 | 2.94%, 01/10/2046 | 14 | ||||||
| Credit Suisse Mortgage Capital Certificates | ||||||||
| 28 | 5.47%, 09/15/2039 | 31 | ||||||
| 50 | 5.61%, 02/15/2039 Δ | 54 | ||||||
| 24 | 5.87%, 06/15/2039 Δ | 27 | ||||||
| CS First Boston Mortgage Securities Corp. | ||||||||
| 80 | 5.10%, 08/15/2038 | 84 | ||||||
| CW Capital Cobalt Ltd. | ||||||||
| 40 | 5.22%, 08/15/2048 | 43 | ||||||
| 25 | 5.48%, 04/15/2047 | 27 | ||||||
| 25 | 5.96%, 05/15/2046 Δ | 28 | ||||||
| Ford Credit Automotive Owner Trust | ||||||||
| 100 | 0.78%, 05/15/2018 | 100 | ||||||
| GE Capital Commercial Mortgage Corp. | ||||||||
| 30 | 5.54%, 12/10/2049 | 33 | ||||||
| Goldman Sachs Mortgage Securities Corp. | ||||||||
| 50 | 3.38%, 05/10/2045 | 50 | ||||||
| 45 | 5.99%, 08/10/2045 Δ | 49 | ||||||
| Goldman Sachs Mortgage Securities Corp. II | ||||||||
| 35 | 4.75%, 07/10/2039 | 36 | ||||||
| 25 | 5.56%, 11/10/2039 | 27 | ||||||
| Goldman Sachs Mortgage Securities Trust | ||||||||
| 10 | 2.94%, 02/10/2046 | 9 | ||||||
| 20 | 3.48%, 01/10/2045 | 20 | ||||||
| Greenwich Capital Commercial Funding Corp. | ||||||||
| 40 | 5.22%, 04/10/2037 Δ | 42 | ||||||
| 35 | 5.44%, 03/10/2039 Δ | 38 | ||||||
| 25 | 5.74%, 12/10/2049 | 28 | ||||||
| 49 | 6.02%, 07/10/2038 Δ | 54 | ||||||
| GS Mortgage Securities Trust | ||||||||
| 40 | 3.14%, 06/10/2046 | 38 | ||||||
| Honda Automotive Receivables Owner Trust | ||||||||
| 63 | 0.77%, 01/15/2016 | 63 | ||||||
| JP Morgan Chase Commercial Mortgage Securities Corp. | ||||||||
| 10 | 4.17%, 08/15/2046 | 11 | ||||||
| 25 | 5.34%, 05/15/2047 | 27 | ||||||
| 25 | 5.37%, 12/15/2044 Δ | 27 | ||||||
| 20 | 5.42%, 01/15/2049 | 22 | ||||||
| 35 | 5.44%, 06/12/2047 Δ | 38 | ||||||
| 20 | 5.48%, 12/12/2044 Δ | 21 | ||||||
| 38 | 5.79%, 02/12/2051 Δ | 43 | ||||||
| 25 | 6.00%, 06/15/2049 Δ | 28 | ||||||
| 100 | 6.06%, 04/15/2045 Δ | 109 | ||||||
| LB-UBS Commercial Mortgage Trust | ||||||||
| 25 | 5.37%, 09/15/2039 Δ | 27 | ||||||
| 60 | 5.42%, 02/15/2040 | 66 | ||||||
| 15 | 5.87%, 09/15/2045 | 17 | ||||||
| 10 | 6.05%, 06/15/2038 Δ | 11 | ||||||
| Merrill Lynch/Countrywide Commercial Mortgage Trust | ||||||||
| 25 | 5.17%, 12/12/2049 Δ | 27 | ||||||
| 25 | 5.38%, 08/12/2048 | 27 | ||||||
| 40 | 5.70%, 09/12/2049 | 44 | ||||||
| 35 | 6.08%, 06/12/2046 Δ | 38 | ||||||
| Morgan Stanley Capital I | ||||||||
| 80 | 4.99%, 08/13/2042 | 84 | ||||||
| 50 | 5.33%, 12/15/2043 | 54 | ||||||
| 25 | 5.69%, 04/15/2049 Δ | 28 | ||||||
| 35 | 5.84%, 10/15/2042 Δ | 37 | ||||||
| 25 | 6.11%, 06/11/2049 Δ | 28 | ||||||
| Morgan Stanley Capital Investments | ||||||||
| 25 | 5.81%, 12/12/2049 | 28 | ||||||
| Wachovia Bank Commercial Mortgage Trust | ||||||||
| 25 | 5.31%, 11/15/2048 | 27 | ||||||
| 25 | 5.34%, 12/15/2043 | 27 | ||||||
| 22 | 5.42%, 01/15/2045 Δ | 24 | ||||||
| 25 | 5.46%, 12/15/2044 Δ | 27 | ||||||
| 25 | 5.51%, 04/15/2047 | 27 | ||||||
| 40 | 5.57%, 10/15/2048 | 44 | ||||||
| 25 | 5.68%, 05/15/2046 | 28 | ||||||
| 25 | 5.92%, 06/15/2049 Δ | 28 | ||||||
| WF-RBS Commercial Mortgage Trust | ||||||||
| 40 | 2.88%, 12/15/2045 | 37 | ||||||
| 3,304 | ||||||||
| Total asset & commercial mortgage backed securities | ||||||||
| (cost $3,309) | $ | 3,304 | ||||||
| CORPORATE BONDS - 10.7% | ||||||||
| Administrative Waste Management and Remediation - 0.0% | ||||||||
| Republic Services, Inc. | ||||||||
| $ | 95 | 5.00%, 03/01/2020 | $ | 104 | ||||
| Agriculture, Forestry, Fishing and Hunting - 0.0% | ||||||||
| Weyerhaeuser Co. | ||||||||
| 40 | 7.38%, 03/15/2032 | 49 | ||||||
| Arts, Entertainment and Recreation - 0.5% | ||||||||
| CBS Corp. | ||||||||
| 25 | 7.88%, 07/30/2030 | 31 | ||||||
| Comcast Corp. | ||||||||
| 50 | 4.65%, 07/15/2042 | 47 | ||||||
| 305 | 5.15%, 03/01/2020 | 340 | ||||||
| 55 | 7.05%, 03/15/2033 | 67 | ||||||
| DirecTV Holdings LLC | ||||||||
| 30 | 3.50%, 03/01/2016 | 32 | ||||||
| 145 | 5.00%, 03/01/2021 | 152 | ||||||
| 25 | 5.15%, 03/15/2042 | 22 | ||||||
The accompanying notes are an integral part of these financial statements.
| 9 |
| Hartford Portfolio Diversifier HLS Fund |
| Schedule of Investments – (continued) |
| December 31, 2013 |
| (000’s Omitted) |
| Shares or Principal Amount | Market Value ╪ | |||||||
| CORPORATE BONDS - 10.7% - (continued) | ||||||||
| Arts, Entertainment and Recreation - 0.5% - (continued) | ||||||||
| Discovery Communications, Inc. | ||||||||
| $ | 50 | 4.88%, 04/01/2043 | $ | 46 | ||||
| 85 | 5.05%, 06/01/2020 | 93 | ||||||
| NBC Universal Media LLC | ||||||||
| 125 | 4.38%, 04/01/2021 | 132 | ||||||
| News America, Inc. | ||||||||
| 155 | 4.50%, 02/15/2021 | 166 | ||||||
| 86 | 6.40%, 12/15/2035 | 98 | ||||||
| Time Warner Cable, Inc. | ||||||||
| 345 | 4.00%, 09/01/2021 | 320 | ||||||
| 65 | 6.75%, 07/01/2018 | 73 | ||||||
| Time Warner, Inc. | ||||||||
| 130 | 4.88%, 03/15/2020 | 142 | ||||||
| 120 | 6.50%, 11/15/2036 | 136 | ||||||
| Viacom, Inc. | ||||||||
| 88 | 4.38%, 03/15/2043 | 74 | ||||||
| Walt Disney Co. | ||||||||
| 35 | 4.13%, 12/01/2041 | 32 | ||||||
| 50 | 5.63%, 09/15/2016 | 56 | ||||||
| 2,059 | ||||||||
| Beverage and Tobacco Product Manufacturing - 0.4% | ||||||||
| Altria Group, Inc. | ||||||||
| 300 | 4.75%, 05/05/2021 | 322 | ||||||
| 6 | 9.70%, 11/10/2018 | 8 | ||||||
| Anheuser-Busch InBev Worldwide, Inc. | ||||||||
| 45 | 3.75%, 07/15/2042 | 38 | ||||||
| 325 | 5.38%, 01/15/2020 | 373 | ||||||
| Coca-Cola Co. | ||||||||
| 170 | 1.65%, 03/14/2018 | 169 | ||||||
| 30 | 3.15%, 11/15/2020 | 30 | ||||||
| Diageo Capital plc | ||||||||
| 50 | 3.88%, 04/29/2043 | 43 | ||||||
| 75 | 5.50%, 09/30/2016 | 84 | ||||||
| Dr. Pepper Snapple Group | ||||||||
| 40 | 2.90%, 01/15/2016 | 41 | ||||||
| PepsiCo, Inc. | ||||||||
| 180 | 3.13%, 11/01/2020 | 180 | ||||||
| 30 | 5.50%, 01/15/2040 | 33 | ||||||
| Philip Morris International, Inc. | ||||||||
| 215 | 4.50%, 03/26/2020 - 03/20/2042 | 225 | ||||||
| 1,546 | ||||||||
| Chemical Manufacturing - 0.2% | ||||||||
| Dow Chemical Co. | ||||||||
| 200 | 4.13%, 11/15/2021 | 207 | ||||||
| 90 | 8.55%, 05/15/2019 | 116 | ||||||
| E.I. DuPont de Nemours & Co. | ||||||||
| 160 | 3.63%, 01/15/2021 | 163 | ||||||
| 20 | 5.60%, 12/15/2036 | 22 | ||||||
| Ecolab, Inc. | ||||||||
| 95 | 4.35%, 12/08/2021 | 98 | ||||||
| Potash Corp. of Saskatchewan, Inc. | ||||||||
| 35 | 6.50%, 05/15/2019 | 42 | ||||||
| PPG Industries, Inc. | ||||||||
| 20 | 3.60%, 11/15/2020 | 20 | ||||||
| Praxair, Inc. | ||||||||
| 55 | 2.45%, 02/15/2022 | 50 | ||||||
| 25 | 5.38%, 11/01/2016 | 28 | ||||||
| 746 | ||||||||
| Computer and Electronic Product Manufacturing - 0.4% | ||||||||
| Apple, Inc. | ||||||||
| 210 | 2.40%, 05/03/2023 | 189 | ||||||
| Cingular Wireless LLC | ||||||||
| 25 | 7.13%, 12/15/2031 | 30 | ||||||
| Cisco Systems, Inc. | ||||||||
| 220 | 4.45%, 01/15/2020 | 240 | ||||||
| 40 | 5.50%, 02/22/2016 | 44 | ||||||
| EMC Corp. | ||||||||
| 110 | 2.65%, 06/01/2020 | 108 | ||||||
| Hewlett-Packard Co. | ||||||||
| 45 | 4.30%, 06/01/2021 | 46 | ||||||
| 250 | 5.50%, 03/01/2018 | 278 | ||||||
| Intel Corp. | ||||||||
| 90 | 2.70%, 12/15/2022 | 83 | ||||||
| 100 | 3.30%, 10/01/2021 | 99 | ||||||
| Lockheed Martin Corp. | ||||||||
| 140 | 4.25%, 11/15/2019 | 150 | ||||||
| 15 | 4.85%, 09/15/2041 | 15 | ||||||
| Raytheon Co. | ||||||||
| 95 | 3.13%, 10/15/2020 | 95 | ||||||
| Texas Instruments, Inc. | ||||||||
| 25 | 2.38%, 05/16/2016 | 26 | ||||||
| Thermo Fisher Scientific, Inc. | ||||||||
| 155 | 2.25%, 08/15/2016 | 159 | ||||||
| 1,562 | ||||||||
| Construction - 0.0% | ||||||||
| CRH America, Inc. | ||||||||
| 125 | 6.00%, 09/30/2016 | 140 | ||||||
| Couriers and Messengers - 0.0% | ||||||||
| United Parcel Service, Inc. | ||||||||
| 110 | 3.13%, 01/15/2021 | 110 | ||||||
| Educational Services - 0.0% | ||||||||
| Princeton University | ||||||||
| 75 | 4.95%, 03/01/2019 | 85 | ||||||
| Electrical Equipment and Appliance Manufacturing - 0.1% | ||||||||
| Emerson Electric Co. | ||||||||
| 70 | 4.88%, 10/15/2019 | 78 | ||||||
| General Electric Co. | ||||||||
| 67 | 4.13%, 10/09/2042 | 62 | ||||||
| 120 | 5.25%, 12/06/2017 | 136 | ||||||
| Koninklijke Philips Electronics N.V. | ||||||||
| 58 | 6.88%, 03/11/2038 | 71 | ||||||
| 347 | ||||||||
| Finance and Insurance - 4.2% | ||||||||
| ACE INA Holdings, Inc. | ||||||||
| 65 | 2.70%, 03/13/2023 | 60 | ||||||
| Aetna, Inc. | ||||||||
| 105 | 3.95%, 09/01/2020 | 110 | ||||||
| Allstate (The) Corp. | ||||||||
| 75 | 5.55%, 05/09/2035 | 82 | ||||||
| American Express Co. | ||||||||
| 153 | 2.65%, 12/02/2022 | 142 | ||||||
| American Express Credit Corp. | ||||||||
| 195 | 2.75%, 09/15/2015 | 202 | ||||||
The accompanying notes are an integral part of these financial statements.
| 10 |
| Shares or Principal Amount | Market Value ╪ | |||||||
| CORPORATE BONDS - 10.7% - (continued) | ||||||||
| Finance and Insurance - 4.2% - (continued) | ||||||||
| American International Group, Inc. | ||||||||
| $ | 350 | 6.40%, 12/15/2020 | $ | 414 | ||||
| Aon Corp. | ||||||||
| 20 | 5.00%, 09/30/2020 | 22 | ||||||
| Asian Development Bank | ||||||||
| 100 | 1.75%, 09/11/2018 | 100 | ||||||
| 265 | 2.50%, 03/15/2016 | 276 | ||||||
| Bank of America Corp. | ||||||||
| 80 | 3.30%, 01/11/2023 | 76 | ||||||
| 445 | 5.00%, 05/13/2021 | 486 | ||||||
| 560 | 5.65%, 05/01/2018 | 637 | ||||||
| Bank of Montreal | ||||||||
| 150 | 1.45%, 04/09/2018 | 146 | ||||||
| Bank of New York Mellon Corp. | ||||||||
| 135 | 2.30%, 07/28/2016 | 140 | ||||||
| 50 | 3.55%, 09/23/2021 | 51 | ||||||
| Bank of Nova Scotia | ||||||||
| 35 | 4.38%, 01/13/2021 | 38 | ||||||
| Barclays Bank plc | ||||||||
| 100 | 5.00%, 09/22/2016 | 110 | ||||||
| BB&T Corp. | ||||||||
| 80 | 3.20%, 03/15/2016 | 84 | ||||||
| Berkshire Hathaway Finance Corp. | ||||||||
| 40 | 4.50%, 02/11/2043 | 37 | ||||||
| 225 | 5.40%, 05/15/2018 | 259 | ||||||
| BlackRock, Inc. | ||||||||
| 105 | 5.00%, 12/10/2019 | 119 | ||||||
| BP Capital Markets plc | ||||||||
| 160 | 2.25%, 11/01/2016 | 165 | ||||||
| 135 | 3.25%, 05/06/2022 | 131 | ||||||
| Capital One Financial Corp. | ||||||||
| 60 | 4.75%, 07/15/2021 | 64 | ||||||
| 110 | 6.15%, 09/01/2016 | 123 | ||||||
| Chubb Corp. | ||||||||
| 90 | 5.75%, 05/15/2018 | 103 | ||||||
| CIGNA Corp. | ||||||||
| 50 | 4.00%, 02/15/2022 | 51 | ||||||
| 10 | 5.38%, 02/15/2042 | 10 | ||||||
| Citigroup, Inc. | ||||||||
| 40 | 3.38%, 03/01/2023 | 38 | ||||||
| 100 | 4.45%, 01/10/2017 | 109 | ||||||
| 605 | 5.38%, 08/09/2020 | 688 | ||||||
| 65 | 6.63%, 06/15/2032 | 72 | ||||||
| Credit Suisse New York | ||||||||
| 110 | 5.30%, 08/13/2019 | 123 | ||||||
| Deutsche Bank AG | ||||||||
| 110 | 3.25%, 01/11/2016 | 115 | ||||||
| European Bank for Reconstruction & Development | ||||||||
| 285 | 2.50%, 03/15/2016 | 297 | ||||||
| European Investment Bank | ||||||||
| 495 | 1.25%, 10/14/2016 | 501 | ||||||
| 395 | 2.88%, 09/15/2020 | 398 | ||||||
| Fifth Third Bancorp | ||||||||
| 100 | 3.50%, 03/15/2022 | 97 | ||||||
| 35 | 3.63%, 01/25/2016 | 37 | ||||||
| Ford Motor Credit Co. LLC | ||||||||
| 270 | 6.63%, 08/15/2017 | 313 | ||||||
| General Electric Capital Corp. | ||||||||
| 455 | 4.38%, 09/16/2020 | 493 | ||||||
| 445 | 5.30%, 02/11/2021 | 498 | ||||||
| Goldman Sachs Group, Inc. | ||||||||
| 605 | 5.38%, 03/15/2020 | 673 | ||||||
| 169 | 6.25%, 02/01/2041 | 195 | ||||||
| HCP, Inc. | ||||||||
| 160 | 6.70%, 01/30/2018 | 186 | ||||||
| Health Care, Inc. | ||||||||
| 40 | 3.75%, 03/15/2023 | 37 | ||||||
| 55 | 5.25%, 01/15/2022 | 59 | ||||||
| HSBC Finance Corp. | ||||||||
| 40 | 5.00%, 06/30/2015 | 42 | ||||||
| 100 | 6.68%, 01/15/2021 | 115 | ||||||
| HSBC Holdings plc | ||||||||
| 460 | 5.10%, 04/05/2021 | 511 | ||||||
| Inter-American Development Bank | ||||||||
| 145 | 2.25%, 07/15/2015 | 149 | ||||||
| 310 | 3.88%, 02/14/2020 | 336 | ||||||
| International Bank for Reconstruction & Development | ||||||||
| 100 | 2.38%, 05/26/2015 | 103 | ||||||
| 197 | 7.63%, 01/19/2023 | 266 | ||||||
| John Deere Capital Corp. | ||||||||
| 105 | 1.85%, 09/15/2016 | 107 | ||||||
| 165 | 2.80%, 09/18/2017 | 173 | ||||||
| JP Morgan Chase & Co. | ||||||||
| 655 | 4.95%, 03/25/2020 | 726 | ||||||
| 80 | 6.00%, 01/15/2018 | 92 | ||||||
| 365 | 6.30%, 04/23/2019 | 431 | ||||||
| KeyCorp | ||||||||
| 70 | 3.75%, 08/13/2015 | 73 | ||||||
| Kreditanstalt fuer Wiederaufbau | ||||||||
| 450 | 1.25%, 10/26/2015 - 02/15/2017 | 456 | ||||||
| 185 | 2.63%, 01/25/2022 | 180 | ||||||
| 391 | 4.00%, 01/27/2020 | 426 | ||||||
| Landwirtschaftliche Rentenbank | ||||||||
| 180 | 2.50%, 02/15/2016 | 187 | ||||||
| 100 | 3.13%, 07/15/2015 | 104 | ||||||
| Lincoln National Corp. | ||||||||
| 60 | 4.00%, 09/01/2023 | 59 | ||||||
| 60 | 4.85%, 06/24/2021 | 65 | ||||||
| LYB Internantional Finance B.V. | ||||||||
| 100 | 4.00%, 07/15/2023 | 99 | ||||||
| Marsh & McLennan Cos., Inc. | ||||||||
| 35 | 4.80%, 07/15/2021 | 37 | ||||||
| MetLife, Inc. | ||||||||
| 90 | 5.70%, 06/15/2035 | 98 | ||||||
| 120 | 7.72%, 02/15/2019 | 149 | ||||||
| Morgan Stanley | ||||||||
| 200 | 5.45%, 01/09/2017 | 222 | ||||||
| 505 | 5.50%, 07/28/2021 | 564 | ||||||
| National Rural Utilities Cooperative Finance Corp. | ||||||||
| 60 | 3.05%, 02/15/2022 | 58 | ||||||
| 30 | 5.45%, 04/10/2017 | 34 | ||||||
| Nomura Holdings, Inc. | ||||||||
| 130 | 4.13%, 01/19/2016 | 137 | ||||||
| Nordic Investment Bank | ||||||||
| 100 | 2.50%, 07/15/2015 | 103 | ||||||
The accompanying notes are an integral part of these financial statements.
| 11 |
| Hartford Portfolio Diversifier HLS Fund |
| Schedule of Investments – (continued) |
| December 31, 2013 |
| (000’s Omitted) |
| Shares or Principal Amount | Market Value ╪ | |||||||
| CORPORATE BONDS - 10.7% - (continued) | ||||||||
| Finance and Insurance - 4.2% - (continued) | ||||||||
| Oesterreichische Kontrollbank AG | ||||||||
| $ | 95 | 4.88%, 02/16/2016 | $ | 103 | ||||
| PNC Funding Corp. | ||||||||
| 70 | 2.70%, 09/19/2016 | 73 | ||||||
| 70 | 3.30%, 03/08/2022 | 69 | ||||||
| 150 | 5.13%, 02/08/2020 | 168 | ||||||
| Principal Financial Group, Inc. | ||||||||
| 70 | 3.30%, 09/15/2022 | 67 | ||||||
| Prudential Financial, Inc. | ||||||||
| 205 | 5.38%, 06/21/2020 | 231 | ||||||
| 25 | 5.80%, 11/16/2041 | 28 | ||||||
| Rabobank Nederland | ||||||||
| 155 | 4.50%, 01/11/2021 | 165 | ||||||
| Royal (The) Bank of Scotland plc | ||||||||
| 35 | 6.13%, 01/11/2021 | 40 | ||||||
| Royal Bank of Canada | ||||||||
| 185 | 2.30%, 07/20/2016 | 191 | ||||||
| Simon Property Group L.P. | ||||||||
| 220 | 5.65%, 02/01/2020 | 250 | ||||||
| Toyota Motor Credit Corp. | ||||||||
| 70 | 2.00%, 10/24/2018 | 70 | ||||||
| 40 | 3.20%, 06/17/2015 | 42 | ||||||
| 140 | 3.40%, 09/15/2021 | 142 | ||||||
| Travelers Cos., Inc. | ||||||||
| 140 | 3.90%, 11/01/2020 | 148 | ||||||
| 30 | 4.60%, 08/01/2043 | 29 | ||||||
| U.S. Bancorp | ||||||||
| 110 | 2.45%, 07/27/2015 | 113 | ||||||
| 50 | 4.13%, 05/24/2021 | 53 | ||||||
| UBS AG Stamford CT | ||||||||
| 100 | 5.88%, 07/15/2016 | 111 | ||||||
| UnitedHealth Group, Inc. | ||||||||
| 125 | 6.88%, 02/15/2038 | 156 | ||||||
| Wellpoint, Inc. | ||||||||
| 65 | 4.65%, 01/15/2043 | 60 | ||||||
| 135 | 5.25%, 01/15/2016 | 146 | ||||||
| Wells Fargo & Co. | ||||||||
| 330 | 2.10%, 05/08/2017 | 336 | ||||||
| 70 | 3.50%, 03/08/2022 | 70 | ||||||
| 335 | 4.60%, 04/01/2021 | 367 | ||||||
| Westpac Banking Corp. | ||||||||
| 110 | 3.00%, 12/09/2015 | 115 | ||||||
| 18,612 | ||||||||
| Food Manufacturing - 0.2% | ||||||||
| Archer-Daniels Midland Co. | ||||||||
| 33 | 4.02%, 04/16/2043 | 28 | ||||||
| ConAgra Foods, Inc. | ||||||||
| 120 | 7.00%, 04/15/2019 | 142 | ||||||
| General Mills, Inc. | ||||||||
| 80 | 5.65%, 02/15/2019 | 93 | ||||||
| Kellogg Co. | ||||||||
| 70 | 4.00%, 12/15/2020 | 73 | ||||||
| Kraft Foods Group, Inc. | ||||||||
| 50 | 5.00%, 06/04/2042 | 49 | ||||||
| 113 | 5.38%, 02/10/2020 | 128 | ||||||
| 97 | 6.88%, 02/01/2038 | 118 | ||||||
| Unilever Capital Corp. | ||||||||
| 70 | 5.90%, 11/15/2032 | 86 | ||||||
| 717 | ||||||||
| Food Services - 0.0% | ||||||||
| McDonald's Corp. | ||||||||
| 49 | 3.70%, 02/15/2042 | 41 | ||||||
| 80 | 5.35%, 03/01/2018 | 91 | ||||||
| Yum! Brands, Inc. | ||||||||
| 7 | 6.88%, 11/15/2037 | 8 | ||||||
| 140 | ||||||||
| Health Care and Social Assistance - 0.7% | ||||||||
| AbbVie, Inc. | ||||||||
| 265 | 2.90%, 11/06/2022 | 248 | ||||||
| Amgen, Inc. | ||||||||
| 195 | 3.88%, 11/15/2021 | 200 | ||||||
| 67 | 5.75%, 03/15/2040 | 72 | ||||||
| AstraZeneca plc | ||||||||
| 130 | 5.90%, 09/15/2017 | 149 | ||||||
| Baxter International, Inc. | ||||||||
| 130 | 2.40%, 08/15/2022 | 118 | ||||||
| 30 | 4.50%, 08/15/2019 | 33 | ||||||
| Boston Scientific Corp. | ||||||||
| 70 | 6.00%, 01/15/2020 | 80 | ||||||
| Bristol-Myers Squibb Co. | ||||||||
| 25 | 3.25%, 08/01/2042 | 19 | ||||||
| 20 | 5.45%, 05/01/2018 | 23 | ||||||
| Celgene Corp. | ||||||||
| 30 | 3.25%, 08/15/2022 | 28 | ||||||
| Covidien International Finance S.A. | ||||||||
| 45 | 3.20%, 06/15/2022 | 43 | ||||||
| 25 | 6.00%, 10/15/2017 | 29 | ||||||
| CVS Caremark Corp. | ||||||||
| 110 | 6.13%, 09/15/2039 | 125 | ||||||
| Eli Lilly & Co. | ||||||||
| 20 | 5.20%, 03/15/2017 | 22 | ||||||
| Express Scripts Holding Co. | ||||||||
| 205 | 4.75%, 11/15/2021 | 217 | ||||||
| Gilead Sciences, Inc. | ||||||||
| 20 | 4.40%, 12/01/2021 | 21 | ||||||
| GlaxoSmithKline Capital, Inc. | ||||||||
| 40 | 2.80%, 03/18/2023 | 37 | ||||||
| 180 | 5.65%, 05/15/2018 | 207 | ||||||
| 27 | 6.38%, 05/15/2038 | 33 | ||||||
| Johnson & Johnson | ||||||||
| 75 | 2.15%, 05/15/2016 | 77 | ||||||
| 25 | 5.95%, 08/15/2037 | 30 | ||||||
| McKesson Corp. | ||||||||
| 50 | 4.75%, 03/01/2021 | 53 | ||||||
| Medtronic, Inc. | ||||||||
| 15 | 4.00%, 04/01/2043 | 13 | ||||||
| 120 | 4.45%, 03/15/2020 | 132 | ||||||
| Merck & Co., Inc. | ||||||||
| 65 | 3.60%, 09/15/2042 | 54 | ||||||
| 195 | 3.88%, 01/15/2021 | 205 | ||||||
| Novartis Capital Corp. | ||||||||
| 90 | 2.40%, 09/21/2022 | 83 | ||||||
| Novartis Securities Investment Ltd. | ||||||||
| 75 | 5.13%, 02/10/2019 | 85 | ||||||
The accompanying notes are an integral part of these financial statements.
| 12 |
| Shares or Principal Amount | Market Value ╪ | |||||||
| CORPORATE BONDS - 10.7% - (continued) | ||||||||
| Health Care and Social Assistance - 0.7% - (continued) | ||||||||
| Pfizer, Inc. | ||||||||
| $ | 470 | 6.20%, 03/15/2019 | $ | 557 | ||||
| Quest Diagnostics, Inc. | ||||||||
| 40 | 4.70%, 04/01/2021 | 41 | ||||||
| Sanofi-Aventis S.A. | ||||||||
| 20 | 4.00%, 03/29/2021 | 21 | ||||||
| Teva Pharmaceutical Finance IV B.V. | ||||||||
| 60 | 3.65%, 11/10/2021 | 59 | ||||||
| Walgreen Co. | ||||||||
| 30 | 3.10%, 09/15/2022 | 28 | ||||||
| 3,142 | ||||||||
| Information - 0.8% | ||||||||
| America Movil S.A.B. de C.V. | ||||||||
| 110 | 5.63%, 11/15/2017 | 124 | ||||||
| 65 | 6.13%, 11/15/2037 | 68 | ||||||
| AT&T, Inc. | ||||||||
| 310 | 2.63%, 12/01/2022 | 280 | ||||||
| 59 | 4.35%, 06/15/2045 | 50 | ||||||
| 73 | 5.35%, 09/01/2040 | 72 | ||||||
| 200 | 5.80%, 02/15/2019 | 229 | ||||||
| British Telecommunications plc | ||||||||
| 18 | 9.62%, 12/15/2030 Δ | 27 | ||||||
| Cellco Partnership - Verizon Wireless Capital LLC | ||||||||
| 90 | 8.50%, 11/15/2018 | 114 | ||||||
| Deutsche Telekom International Finance B.V. | ||||||||
| 82 | 8.75%, 06/15/2030 | 116 | ||||||
| eBay, Inc. | ||||||||
| 25 | 2.60%, 07/15/2022 | 23 | ||||||
| France Telecom S.A. | ||||||||
| 80 | 5.38%, 07/08/2019 | 89 | ||||||
| Google, Inc. | ||||||||
| 65 | 2.13%, 05/19/2016 | 67 | ||||||
| Microsoft Corp. | ||||||||
| 150 | 1.63%, 09/25/2015 | 153 | ||||||
| 135 | 5.20%, 06/01/2039 | 143 | ||||||
| Oracle Corp. | ||||||||
| 110 | 5.38%, 07/15/2040 | 117 | ||||||
| 120 | 5.75%, 04/15/2018 | 139 | ||||||
| Qwest Corp. | ||||||||
| 110 | 6.88%, 09/15/2033 | 106 | ||||||
| Rogers Communications, Inc. | ||||||||
| 30 | 4.50%, 03/15/2043 | 26 | ||||||
| 50 | 6.80%, 08/15/2018 | 60 | ||||||
| Telefonica Emisiones SAU | ||||||||
| 180 | 5.46%, 02/16/2021 | 190 | ||||||
| Verizon Communications, Inc. | ||||||||
| 140 | 3.65%, 09/14/2018 | 148 | ||||||
| 310 | 5.15%, 09/15/2023 | 333 | ||||||
| 95 | 6.00%, 04/01/2041 | 104 | ||||||
| 300 | 6.35%, 04/01/2019 | 353 | ||||||
| 200 | 6.55%, 09/15/2043 | 234 | ||||||
| Vodafone Group plc | ||||||||
| 195 | 5.45%, 06/10/2019 | 221 | ||||||
| 20 | 6.15%, 02/27/2037 | 22 | ||||||
| 3,608 | ||||||||
| Machinery Manufacturing - 0.1% | ||||||||
| Baker Hughes, Inc. | ||||||||
| 46 | 5.13%, 09/15/2040 | 49 | ||||||
| Caterpillar, Inc. | ||||||||
| 50 | 3.80%, 08/15/2042 | 42 | ||||||
| 185 | 3.90%, 05/27/2021 | 192 | ||||||
| Deere & Co. | ||||||||
| 30 | 3.90%, 06/09/2042 | 26 | ||||||
| Joy Global, Inc. | ||||||||
| 10 | 5.13%, 10/15/2021 | 10 | ||||||
| Xerox Corp. | ||||||||
| 20 | 6.35%, 05/15/2018 | 23 | ||||||
| 342 | ||||||||
| Mining - 0.3% | ||||||||
| Barrick Gold Corp. | ||||||||
| 25 | 5.25%, 04/01/2042 | 21 | ||||||
| 110 | 6.95%, 04/01/2019 | 127 | ||||||
| BHP Billiton Finance USA Ltd. | ||||||||
| 80 | 3.85%, 09/30/2023 | 80 | ||||||
| 15 | 4.13%, 02/24/2042 | 13 | ||||||
| 110 | 6.50%, 04/01/2019 | 132 | ||||||
| Freeport-McMoRan Copper & Gold, Inc. | ||||||||
| 170 | 3.88%, 03/15/2023 | 161 | ||||||
| Newmont Mining Corp. | ||||||||
| 38 | 6.25%, 10/01/2039 | 34 | ||||||
| Rio Tinto Finance USA Ltd. | ||||||||
| 145 | 3.75%, 09/20/2021 | 146 | ||||||
| 170 | 6.50%, 07/15/2018 | 201 | ||||||
| Southern Copper Corp. | ||||||||
| 55 | 6.75%, 04/16/2040 | 53 | ||||||
| Teck Resources Ltd. | ||||||||
| 40 | 4.50%, 01/15/2021 | 40 | ||||||
| 30 | 5.40%, 02/01/2043 | 28 | ||||||
| Vale Overseas Ltd. | ||||||||
| 190 | 6.25%, 01/23/2017 | 211 | ||||||
| 90 | 6.88%, 11/10/2039 | 93 | ||||||
| 1,340 | ||||||||
| Miscellaneous Manufacturing - 0.2% | ||||||||
| 3M Co. | ||||||||
| 75 | 1.38%, 09/29/2016 | 76 | ||||||
| 25 | 5.70%, 03/15/2037 | 29 | ||||||
| Boeing Co. | ||||||||
| 200 | 4.88%, 02/15/2020 | 223 | ||||||
| Honeywell International, Inc. | ||||||||
| 100 | 4.25%, 03/01/2021 | 107 | ||||||
| Northrop Grumman Corp. | ||||||||
| 20 | 5.05%, 08/01/2019 | 22 | ||||||
| United Technologies Corp. | ||||||||
| 150 | 4.50%, 04/15/2020 - 06/01/2042 | 154 | ||||||
| 195 | 6.13%, 02/01/2019 | 230 | ||||||
| 841 | ||||||||
| Motor Vehicle and Parts Manufacturing - 0.1% | ||||||||
| DaimlerChrysler NA Holdings Corp. | ||||||||
| 18 | 8.50%, 01/18/2031 | 26 | ||||||
| Ford Motor Co. | ||||||||
| 130 | 7.45%, 07/16/2031 | 159 | ||||||
| Johnson Controls, Inc. | ||||||||
| 100 | 5.00%, 03/30/2020 | 110 | ||||||
| 295 | ||||||||
The accompanying notes are an integral part of these financial statements.
| 13 |
| Hartford Portfolio Diversifier HLS Fund |
| Schedule of Investments – (continued) |
| December 31, 2013 |
| (000’s Omitted) |
| Shares or Principal Amount | Market Value ╪ | |||||||
| CORPORATE BONDS - 10.7% - (continued) | ||||||||
| Other Services - 0.0% | ||||||||
| Illinois Tool Works, Inc. | ||||||||
| $ | 15 | 3.90%, 09/01/2042 | $ | 13 | ||||
| Paper Manufacturing - 0.1% | ||||||||
| International Paper Co. | ||||||||
| 110 | 7.50%, 08/15/2021 | 135 | ||||||
| Kimberly-Clark Corp. | ||||||||
| 12 | 5.30%, 03/01/2041 | 13 | ||||||
| 90 | 6.13%, 08/01/2017 | 104 | ||||||
| 252 | ||||||||
| Petroleum and Coal Products Manufacturing - 0.9% | ||||||||
| Anadarko Petroleum Corp. | ||||||||
| 40 | 5.95%, 09/15/2016 | 45 | ||||||
| Apache Corp. | ||||||||
| 100 | 5.10%, 09/01/2040 | 102 | ||||||
| Atmos Energy Corp. | ||||||||
| 8 | 5.50%, 06/15/2041 | 9 | ||||||
| Canadian Natural Resources Ltd. | ||||||||
| 60 | 5.70%, 05/15/2017 | 68 | ||||||
| 40 | 6.50%, 02/15/2037 | 45 | ||||||
| Cenovus Energy, Inc. | ||||||||
| 15 | 4.45%, 09/15/2042 | 14 | ||||||
| 25 | 5.70%, 10/15/2019 | 28 | ||||||
| Chevron Corp. | ||||||||
| 35 | 2.36%, 12/05/2022 | 32 | ||||||
| 150 | 2.43%, 06/24/2020 | 146 | ||||||
| ConocoPhillips | ||||||||
| 128 | 6.50%, 02/01/2039 | 160 | ||||||
| Devon Financing Corp. | ||||||||
| 65 | 7.88%, 09/30/2031 | 84 | ||||||
| EnCana Corp. | ||||||||
| 50 | 6.50%, 02/01/2038 | 55 | ||||||
| Ensco plc | ||||||||
| 50 | 4.70%, 03/15/2021 | 53 | ||||||
| Hess Corp. | ||||||||
| 53 | 5.60%, 02/15/2041 | 55 | ||||||
| Kerr-McGee Corp. | ||||||||
| 100 | 6.95%, 07/01/2024 | 116 | ||||||
| Marathon Oil Corp. | ||||||||
| 15 | 6.60%, 10/01/2037 | 18 | ||||||
| Marathon Petroleum Corp. | ||||||||
| 15 | 5.13%, 03/01/2021 | 16 | ||||||
| National Oilwell Varco, Inc. | ||||||||
| 50 | 2.60%, 12/01/2022 | 46 | ||||||
| 15 | 3.95%, 12/01/2042 | 13 | ||||||
| Nexen, Inc. | ||||||||
| 50 | 7.50%, 07/30/2039 | 64 | ||||||
| Noble Corp. | ||||||||
| 45 | 3.95%, 03/15/2022 | 44 | ||||||
| Noble Energy, Inc. | ||||||||
| 20 | 6.00%, 03/01/2041 | 21 | ||||||
| Occidental Petroleum Corp. | ||||||||
| 40 | 4.10%, 02/01/2021 | 42 | ||||||
| Pemex Project Funding Master Trust | ||||||||
| 185 | 5.75%, 03/01/2018 | 206 | ||||||
| Petrobras International Finance Co. | ||||||||
| 425 | 5.38%, 01/27/2021 | 422 | ||||||
| Petroleos Mexicanos | ||||||||
| 170 | 6.50%, 06/02/2041 | 178 | ||||||
| Phillips 66 | ||||||||
| 85 | 4.30%, 04/01/2022 | 86 | ||||||
| Sempra Energy | ||||||||
| 65 | 6.00%, 10/15/2039 | 72 | ||||||
| 35 | 6.50%, 06/01/2016 | 39 | ||||||
| Shell International Finance B.V. | ||||||||
| 85 | 3.63%, 08/21/2042 | 71 | ||||||
| 170 | 4.30%, 09/22/2019 | 186 | ||||||
| Southern Natural Gas Co. LLC | ||||||||
| 60 | 5.90%, 04/01/2017 ■ | 67 | ||||||
| Statoilhydro ASA | ||||||||
| 335 | 5.25%, 04/15/2019 | 380 | ||||||
| Suncor Energy, Inc. | ||||||||
| 100 | 6.50%, 06/15/2038 | 116 | ||||||
| Talisman Energy, Inc. | ||||||||
| 25 | 7.75%, 06/01/2019 | 30 | ||||||
| Total Capital International S.A. | ||||||||
| 145 | 1.50%, 02/17/2017 | 145 | ||||||
| Total Capital S.A. | ||||||||
| 95 | 4.25%, 12/15/2021 | 101 | ||||||
| Transocean, Inc. | ||||||||
| 185 | 6.50%, 11/15/2020 | 211 | ||||||
| TXU Electric Delivery Co. | ||||||||
| 95 | 7.00%, 09/01/2022 | 113 | ||||||
| Valero Energy Corp. | ||||||||
| 200 | 6.13%, 02/01/2020 | 228 | ||||||
| Weatherford International Ltd. | ||||||||
| 110 | 5.13%, 09/15/2020 | 118 | ||||||
| Williams Partners L.P. | ||||||||
| 125 | 5.25%, 03/15/2020 | 137 | ||||||
| 4,182 | ||||||||
| Pipeline Transportation - 0.2% | ||||||||
| EL Paso Pipeling Partners Operating Co. LLC | ||||||||
| 35 | 4.70%, 11/01/2042 | 30 | ||||||
| Energy Transfer Partners L.P. | ||||||||
| 90 | 6.50%, 02/01/2042 | 97 | ||||||
| 64 | 9.00%, 04/15/2019 | 81 | ||||||
| Enterprise Products Operating LLC | ||||||||
| 65 | 4.45%, 02/15/2043 | 57 | ||||||
| 20 | 4.85%, 03/15/2044 | 19 | ||||||
| 140 | 5.20%, 09/01/2020 | 156 | ||||||
| Kinder Morgan Energy Partners L.P. | ||||||||
| 187 | 6.38%, 03/01/2041 | 202 | ||||||
| Oneok Partners L.P. | ||||||||
| 25 | 6.65%, 10/01/2036 | 27 | ||||||
| Plains All American Pipeline L.P. | ||||||||
| 65 | 6.65%, 01/15/2037 | 76 | ||||||
| TransCanada Pipelines Ltd. | ||||||||
| 75 | 3.75%, 10/16/2023 | 73 | ||||||
| 105 | 3.80%, 10/01/2020 | 108 | ||||||
| 90 | 7.13%, 01/15/2019 | 109 | ||||||
| Transcontinental Gas Pipe Corp. | ||||||||
| 20 | 4.45%, 08/01/2042 | 18 | ||||||
| 1,053 | ||||||||
The accompanying notes are an integral part of these financial statements.
| 14 |
| Shares or Principal Amount | Market Value ╪ | |||||||
| CORPORATE BONDS - 10.7% - (continued) | ||||||||
| Primary Metal Manufacturing - 0.0% | ||||||||
| Alcoa, Inc. | ||||||||
| $ | 120 | 6.15%, 08/15/2020 | $ | 129 | ||||
| Professional, Scientific and Technical Services - 0.1% | ||||||||
| IBM Corp. | ||||||||
| 95 | 5.60%, 11/30/2039 | 106 | ||||||
| 100 | 5.70%, 09/14/2017 | 115 | ||||||
| Omnicom Group, Inc. | ||||||||
| 110 | 3.63%, 05/01/2022 | 107 | ||||||
| 328 | ||||||||
| Public Administration - 0.0% | ||||||||
| Waste Management, Inc. | ||||||||
| 105 | 4.75%, 06/30/2020 | 114 | ||||||
| Rail Transportation - 0.2% | ||||||||
| Burlington Northern Santa Fe Corp. | ||||||||
| 47 | 4.38%, 09/01/2042 | 42 | ||||||
| 170 | 4.70%, 10/01/2019 | 186 | ||||||
| Canadian National Railway Co. | ||||||||
| 40 | 2.85%, 12/15/2021 | 38 | ||||||
| Canadian Pacific Railway Co. | ||||||||
| 60 | 4.45%, 03/15/2023 | 62 | ||||||
| 8 | 7.13%, 10/15/2031 | 10 | ||||||
| CSX Corp. | ||||||||
| 85 | 3.70%, 10/30/2020 | 87 | ||||||
| 105 | 4.25%, 06/01/2021 | 110 | ||||||
| Norfolk Southern Corp. | ||||||||
| 75 | 4.84%, 10/01/2041 | 72 | ||||||
| Union Pacific Corp. | ||||||||
| 34 | 4.82%, 02/01/2044 ■ | 33 | ||||||
| 640 | ||||||||
| Real Estate, Rental and Leasing - 0.0% | ||||||||
| Boston Properties L.P. | ||||||||
| 100 | 5.88%, 10/15/2019 | 115 | ||||||
| ERP Operating L.P. | ||||||||
| 70 | 5.75%, 06/15/2017 | 78 | ||||||
| 193 | ||||||||
| Retail Trade - 0.4% | ||||||||
| Eaton Corp. | ||||||||
| 115 | 2.75%, 11/02/2022 | 107 | ||||||
| Federated Retail Holdings, Inc. | ||||||||
| 128 | 5.90%, 12/01/2016 | 144 | ||||||
| Home Depot, Inc. | ||||||||
| 335 | 4.40%, 04/01/2021 | 362 | ||||||
| Kroger (The) Co. | ||||||||
| 40 | 3.90%, 10/01/2015 | 42 | ||||||
| 70 | 6.80%, 12/15/2018 | 83 | ||||||
| 40 | 7.50%, 04/01/2031 | 49 | ||||||
| Lowe's Cos., Inc. | ||||||||
| 70 | 6.65%, 09/15/2037 | 85 | ||||||
| Macy's Retail Holdings, Inc. | ||||||||
| 60 | 3.88%, 01/15/2022 | 59 | ||||||
| Target Corp. | ||||||||
| 180 | 3.88%, 07/15/2020 | 190 | ||||||
| Wal-Mart Stores, Inc. | ||||||||
| 115 | 3.25%, 10/25/2020 | 117 | ||||||
| 150 | 4.25%, 04/15/2021 | 162 | ||||||
| 148 | 5.63%, 04/15/2041 | 168 | ||||||
| 1,568 | ||||||||
| Soap, Cleaning Compound and Toilet Manufacturing - 0.0% | ||||||||
| Procter & Gamble Co. | ||||||||
| 115 | 4.70%, 02/15/2019 | 128 | ||||||
| 20 | 5.55%, 03/05/2037 | 23 | ||||||
| 151 | ||||||||
| Transportation Equipment Manufacturing - 0.0% | ||||||||
| General Dynamics Corp. | ||||||||
| 15 | 3.88%, 07/15/2021 | 16 | ||||||
| Utilities - 0.6% | ||||||||
| Alabama Power Co. | ||||||||
| 20 | 6.00%, 03/01/2039 | 24 | ||||||
| CenterPoint Energy Houston Electric LLC | ||||||||
| 15 | 3.55%, 08/01/2042 | 12 | ||||||
| CMS Energy Corp. | ||||||||
| 60 | 5.05%, 03/15/2022 | 65 | ||||||
| Consolidated Edison Co. of NY | ||||||||
| 20 | 3.95%, 03/01/2043 | 18 | ||||||
| 25 | 5.50%, 12/01/2039 | 27 | ||||||
| 40 | 6.65%, 04/01/2019 | 48 | ||||||
| Dominion Gas Holdings LLC | ||||||||
| 100 | 3.55%, 11/01/2023 ■ | 96 | ||||||
| Dominion Resources, Inc. | ||||||||
| 295 | 4.45%, 03/15/2021 | 313 | ||||||
| Duke Energy Corp. | ||||||||
| 105 | 5.30%, 02/15/2040 | 114 | ||||||
| Entergy Corp. | ||||||||
| 40 | 3.63%, 09/15/2015 | 41 | ||||||
| Exelon Generation Co. LLC | ||||||||
| 145 | 4.00%, 10/01/2020 | 145 | ||||||
| 85 | 6.25%, 10/01/2039 | 86 | ||||||
| Florida Power & Light Co. | ||||||||
| 105 | 5.69%, 03/01/2040 | 120 | ||||||
| Georgia Power Co. | ||||||||
| 100 | 2.85%, 05/15/2022 | 94 | ||||||
| 50 | 4.75%, 09/01/2040 | 48 | ||||||
| Hydro-Quebec | ||||||||
| 150 | 1.38%, 06/19/2017 | 151 | ||||||
| 70 | 8.40%, 01/15/2022 | 91 | ||||||
| Kentucky Utilities Co. | ||||||||
| 70 | 5.13%, 11/01/2040 | 74 | ||||||
| MidAmerican Energy Holdings Co. | ||||||||
| 170 | 6.13%, 04/01/2036 | 193 | ||||||
| Nevada Power Co. | ||||||||
| 55 | 6.75%, 07/01/2037 | 68 | ||||||
| Northern States Power Co. | ||||||||
| 55 | 3.40%, 08/15/2042 | 44 | ||||||
| Ohio Power Co. | ||||||||
| 155 | 5.38%, 10/01/2021 | 173 | ||||||
| Pacific Gas & Electric Co. | ||||||||
| 125 | 6.05%, 03/01/2034 | 143 | ||||||
| Progress Energy, Inc. | ||||||||
| 270 | 4.40%, 01/15/2021 | 285 | ||||||
| PSEG Power LLC | ||||||||
| 25 | 5.13%, 04/15/2020 | 27 | ||||||
| Public Service Electric & Gas Co. | ||||||||
| 50 | 3.95%, 05/01/2042 | 45 | ||||||
| San Diego Gas & Electric Co. | ||||||||
| 32 | 4.50%, 08/15/2040 | 32 | ||||||
The accompanying notes are an integral part of these financial statements.
| 15 |
| Hartford Portfolio Diversifier HLS Fund |
| Schedule of Investments – (continued) |
| December 31, 2013 |
| (000’s Omitted) |
| Shares or Principal Amount | Market Value ╪ | |||||||
| CORPORATE BONDS - 10.7% - (continued) | ||||||||
| Utilities - 0.6% - (continued) | ||||||||
| South Carolina Electric & Gas Co. | ||||||||
| $ | 40 | 6.05%, 01/15/2038 | $ | 47 | ||||
| Southern California Edison Co. | ||||||||
| 100 | 4.50%, 09/01/2040 | 97 | ||||||
| Xcel Energy, Inc. | ||||||||
| 65 | 4.70%, 05/15/2020 | 72 | ||||||
| 2,793 | ||||||||
| Wholesale Trade - 0.0% | ||||||||
| Georgia-Pacific LLC | ||||||||
| 40 | 7.75%, 11/15/2029 | 51 | ||||||
| Total corporate bonds | ||||||||
| (cost $48,088) | $ | 47,268 | ||||||
FOREIGN GOVERNMENT OBLIGATIONS - 0.8% | ||||||||
| Brazil - 0.1% | ||||||||
| Brazil (Republic of) | ||||||||
| $ | 225 | 5.88%, 01/15/2019 | $ | 252 | ||||
| 187 | 7.13%, 01/20/2037 | 214 | ||||||
| $ | 466 | |||||||
| Canada - 0.3% | ||||||||
| British Columbia (Province of) | ||||||||
| 60 | 2.10%, 05/18/2016 | 62 | ||||||
| 105 | 2.65%, 09/22/2021 | 102 | ||||||
| Canada (Government of) | ||||||||
| 135 | 0.88%, 02/14/2017 | 135 | ||||||
| Manitoba (Province of) | ||||||||
| 60 | 2.10%, 09/06/2022 | 54 | ||||||
| 75 | 2.63%, 07/15/2015 | 78 | ||||||
| Nova Scotia (Province of) | ||||||||
| 35 | 5.13%, 01/26/2017 | 39 | ||||||
| Ontario (Province of) | ||||||||
| 345 | 4.40%, 04/14/2020 | 379 | ||||||
| Quebec (Province of) | ||||||||
| 140 | 3.50%, 07/29/2020 | 145 | ||||||
| 60 | 5.13%, 11/14/2016 | 67 | ||||||
| 50 | 7.50%, 09/15/2029 | 66 | ||||||
| 1,127 | ||||||||
| Colombia - 0.1% | ||||||||
| Colombia (Republic of) | ||||||||
| 161 | 8.13%, 05/21/2024 | 207 | ||||||
| Italy - 0.0% | ||||||||
| Italy (Republic of) | ||||||||
| 45 | 5.38%, 06/15/2033 | 47 | ||||||
| Mexico - 0.1% | ||||||||
| United Mexican States | ||||||||
| 220 | 5.13%, 01/15/2020 | 244 | ||||||
| 192 | 6.05%, 01/11/2040 | 209 | ||||||
| 453 | ||||||||
| Panama - 0.0% | ||||||||
| Panama (Republic of) | ||||||||
| 50 | 6.70%, 01/26/2036 | 56 | ||||||
| Peru - 0.0% | ||||||||
| Peru (Republic of) | ||||||||
| 75 | 5.63%, 11/18/2050 | 75 | ||||||
| 30 | 7.13%, 03/30/2019 | 36 | ||||||
| 111 | ||||||||
| Philippines - 0.1% | ||||||||
| Philippines (Republic of) | ||||||||
| 120 | 4.00%, 01/15/2021 | 125 | ||||||
| 100 | 6.38%, 10/23/2034 | 119 | ||||||
| 244 | ||||||||
| Poland - 0.0% | ||||||||
| Poland (Republic of) | ||||||||
| 140 | 5.00%, 03/23/2022 | 150 | ||||||
| South Africa - 0.0% | ||||||||
| South Africa (Republic of) | ||||||||
| 100 | 6.88%, 05/27/2019 | 114 | ||||||
| Turkey - 0.1% | ||||||||
| Turkey (Republic of) | ||||||||
| 110 | 6.75%, 05/30/2040 | 106 | ||||||
| 150 | 7.25%, 03/15/2015 | 159 | ||||||
| 190 | 7.38%, 02/05/2025 | 205 | ||||||
| 470 | ||||||||
| Total foreign government obligations | ||||||||
| (cost $3,651) | $ | 3,445 | ||||||
MUNICIPAL BONDS - 0.2% | ||||||||
| Airport Revenues - 0.0% | ||||||||
| Clark County, NV, Airport Rev, | ||||||||
| $ | 5 | 6.82%, 07/01/2045 | $ | 6 | ||||
| New York & New Jersey PA, | ||||||||
| 50 | 4.93%, 10/01/2051 | 47 | ||||||
| 53 | ||||||||
| General Obligations - 0.1% | ||||||||
| California State GO, | ||||||||
| 105 | 7.60%, 11/01/2040 | 138 | ||||||
| California State GO, Taxable, | ||||||||
| 55 | 7.55%, 04/01/2039 | 71 | ||||||
| Connecticut State GO, | ||||||||
| 45 | 5.85%, 03/15/2032 | 50 | ||||||
| Illionis State, GO, | ||||||||
| 195 | 5.10%, 06/01/2033 | 181 | ||||||
| Massachusetts State GO, | ||||||||
| 15 | 5.46%, 12/01/2039 | 16 | ||||||
| Mississippi State GO, | ||||||||
| 25 | 5.25%, 11/01/2034 | 26 | ||||||
| New York, NY, GO, | ||||||||
| 15 | 5.85%, 06/01/2040 | 17 | ||||||
| Texas State GO, | ||||||||
| 30 | 5.52%, 04/01/2039 | 34 | ||||||
| 533 | ||||||||
| Higher Education (Univ., Dorms, etc.) - 0.0% | ||||||||
| University of California, Build America Bonds Rev, | ||||||||
| 50 | 5.77%, 05/15/2043 | 55 | ||||||
| University of Texas, | ||||||||
| 25 | 4.79%, 08/15/2046 | 25 | ||||||
| 80 | ||||||||
The accompanying notes are an integral part of these financial statements.
| 16 |
| Shares or Principal Amount | Market Value ╪ | |||||||
| MUNICIPAL BONDS - 0.2% - (continued) | ||||||||
| Miscellaneous - 0.0% | ||||||||
| New Jersey State Econ DA Lease Rev, | ||||||||
| $ | 15 | 7.43%, 02/15/2029 | $ | 18 | ||||
| Tax Allocation - 0.0% | ||||||||
| New York, NY, Dormitory Auth Rev, | ||||||||
| 20 | 5.60%, 03/15/2040 | 22 | ||||||
| Transportation - 0.1% | ||||||||
| Bay Area, CA, Toll Auth Bridge Rev, | ||||||||
| 30 | 6.26%, 04/01/2049 | 36 | ||||||
| Metropolitan Transportation Auth, NY, Rev, | ||||||||
| 20 | 5.87%, 11/15/2039 | 21 | ||||||
| 25 | 6.55%, 11/15/2031 | 29 | ||||||
| 15 | 6.65%, 11/15/2039 | 18 | ||||||
| New Jersey State Turnpike Auth, | ||||||||
| 45 | 7.10%, 01/01/2041 | 57 | ||||||
| New Jersey State Turnpike Auth, Taxable, | ||||||||
| 15 | 7.41%, 01/01/2040 | 20 | ||||||
| 181 | ||||||||
| Utilities - Electric - 0.0% | ||||||||
| American Municipal Power Ohio, Inc. Rev, | ||||||||
| 45 | 6.05%, 02/15/2043 | 47 | ||||||
| Municipal Elec Auth Georgia, | ||||||||
| 40 | 6.64%, 04/01/2057 | 42 | ||||||
| 89 | ||||||||
| Utilities - Water and Sewer - 0.0% | ||||||||
| New York City, NY, Municipal Water FA, | ||||||||
| 45 | 5.88%, 06/15/2044 | 51 | ||||||
| Total municipal bonds | ||||||||
| (cost $1,102) | $ | 1,027 | ||||||
U.S. GOVERNMENT AGENCIES - 13.4% | ||||||||
| FHLMC - 3.3% | ||||||||
| $ | 270 | 2.38%, 01/13/2022 | $ | 258 | ||||
| 764 | 2.50%, 07/01/2027 - 12/01/2042 | 746 | ||||||
| 760 | 2.88%, 02/09/2015 | 782 | ||||||
| 2,125 | 3.00%, 12/01/2025 - 05/01/2043 | 2,056 | ||||||
| 2,792 | 3.50%, 04/01/2026 - 06/01/2043 ☼ | 2,815 | ||||||
| 680 | 3.75%, 03/27/2019 | 741 | ||||||
| 1,831 | 4.00%, 06/01/2024 - 02/01/2042 | 1,890 | ||||||
| 2,035 | 4.50%, 03/01/2015 - 08/01/2041 ☼ | 2,159 | ||||||
| 932 | 5.00%, 05/01/2023 - 08/01/2041 | 1,008 | ||||||
| 360 | 5.13%, 10/18/2016 | 404 | ||||||
| 370 | 5.25%, 04/18/2016 | 410 | ||||||
| 937 | 5.50%, 05/01/2036 - 08/01/2038 | 1,023 | ||||||
| 170 | 6.00%, 06/01/2036 - 10/01/2037 | 188 | ||||||
| 10 | 6.25%, 07/15/2032 | 13 | ||||||
| 14,493 | ||||||||
| FNMA - 6.9% | ||||||||
| 690 | 0.88%, 08/28/2017 | 681 | ||||||
| 830 | 1.25%, 01/30/2017 | 840 | ||||||
| 1,310 | 1.63%, 10/26/2015 - 11/27/2018 | 1,331 | ||||||
| 2,212 | 2.50%, 03/01/2027 - 01/01/2043 | 2,179 | ||||||
| 6,883 | 3.00%, 12/01/2025 - 11/01/2043 | 6,715 | ||||||
| 5,057 | 3.50%, 09/01/2025 - 09/01/2043 | 5,085 | ||||||
| 4,917 | 4.00%, 05/01/2020 - 11/01/2043 | 5,091 | ||||||
| 2,989 | 4.50%, 05/01/2025 - 08/01/2041 ☼ | 3,169 | ||||||
| 3,097 | 5.00%, 02/01/2022 - 08/01/2041 | 3,372 | ||||||
| 1,359 | 5.50%, 10/01/2035 - 05/01/2040 | 1,496 | ||||||
| 130 | 5.63%, 07/15/2037 | 154 | ||||||
| 374 | 6.00%, 04/01/2036 - 07/01/2037 | 415 | ||||||
| 89 | 6.50%, 06/01/2039 | 99 | ||||||
| 53 | 6.63%, 11/15/2030 | 69 | ||||||
| 30,696 | ||||||||
| GNMA - 3.2% | ||||||||
| 153 | 2.50%, 10/15/2027 - 01/15/2043 | 144 | ||||||
| 3,185 | 3.00%, 04/15/2027 - 08/20/2043 | 3,100 | ||||||
| 3,256 | 3.50%, 09/15/2025 - 09/20/2043 | 3,291 | ||||||
| 2,666 | 4.00%, 08/15/2026 - 11/20/2043 ☼ | 2,778 | ||||||
| 2,583 | 4.50%, 05/15/2039 - 10/20/2043 ☼ | 2,772 | ||||||
| 1,348 | 5.00%, 11/20/2035 - 12/20/2041 | 1,470 | ||||||
| 297 | 5.50%, 05/20/2038 - 08/20/2041 | 326 | ||||||
| 180 | 6.00%, 02/15/2036 - 08/20/2041 | 200 | ||||||
| 14,081 | ||||||||
| Total U.S. government agencies | ||||||||
| (cost $60,572) | $ | 59,270 | ||||||
| U.S. GOVERNMENT SECURITIES - 16.3% | ||||||||
| Other Direct Federal Obligations - 0.4% | ||||||||
| FFCB - 0.0% | ||||||||
| $ | 165 | 4.88%, 12/16/2015 - 01/17/2017 | $ | 181 | ||||
| FHLB - 0.3% | ||||||||
| 540 | 4.75%, 12/16/2016 | 603 | ||||||
| 470 | 5.00%, 11/17/2017 | 536 | ||||||
| 60 | 5.50%, 07/15/2036 | 70 | ||||||
| 1,209 | ||||||||
| Tennessee Valley Authority - 0.1% | ||||||||
| 213 | 6.75%, 11/01/2025 | 270 | ||||||
| 1,660 | ||||||||
| U.S. Treasury Securities - 15.9% | ||||||||
| U.S. Treasury Bonds - 2.3% | ||||||||
| 5,626 | 3.13%, 11/15/2041 - 02/15/2043 ‡ | 4,841 | ||||||
| 305 | 3.75%, 08/15/2041 ‡ | 297 | ||||||
| 728 | 4.25%, 11/15/2040 | 775 | ||||||
| 3,320 | 5.38%, 02/15/2031 | 4,069 | ||||||
| 9,982 | ||||||||
| U.S. Treasury Notes - 13.6% | ||||||||
| 1,500 | 0.25%, 11/30/2015 | 1,497 | ||||||
| 400 | 0.50%, 07/31/2017 | 392 | ||||||
| 11,340 | 0.63%, 05/31/2017 - 04/30/2018 | 11,001 | ||||||
| 1,185 | 0.88%, 11/30/2016 | 1,189 | ||||||
| 1,912 | 1.00%, 08/31/2016 | 1,930 | ||||||
| 29,120 | 1.25%, 08/31/2015 - 11/30/2018 | 29,564 | ||||||
| 9,964 | 1.75%, 05/31/2016 - 05/15/2022 | 9,581 | ||||||
| 3,878 | 1.88%, 09/30/2017 Ø | 3,977 | ||||||
| 345 | 2.13%, 08/15/2021 | 334 | ||||||
| 1,000 | 2.75%, 11/15/2023 | 978 | ||||||
| 215 | 3.13%, 05/15/2021 | 224 | ||||||
| 60,667 | ||||||||
| 70,649 | ||||||||
| Total U.S. government securities | ||||||||
| (cost $73,946) | $ | 72,309 | ||||||
The accompanying notes are an integral part of these financial statements.
| 17 |
| Hartford Portfolio Diversifier HLS Fund |
| Schedule of Investments – (continued) |
| December 31, 2013 |
| (000’s Omitted) |
| Contracts | Market Value ╪ | |||||||
| PUT OPTIONS PURCHASED - 0.8% | ||||||||
| Equity Contracts - 0.8% | ||||||||
| S&P 500 Option | ||||||||
| 97 | Expiration: 06/06/2016, Exercise Price: $1,170.00 Я | $ | 3,740 | |||||
| Total put options purchased | ||||||||
| (cost $22,592) | $ | 3,740 | ||||||
| Total long-term investments (cost $290,564) | $ | 288,456 | ||||||
| Shares or Principal Amount | Market Value ╪ | |||||||
| SHORT-TERM INVESTMENTS - 36.5% | ||||||||
| Other Direct Federal Obligations - 5.6% | ||||||||
| Federal Home Loan Bank | ||||||||
| $ | 20,000 | 0.11%, 4/4/2014 ○ | $ | 19,997 | ||||
| 5,000 | 0.29%, 3/5/2014 ○ | 4,998 | ||||||
| 24,995 | ||||||||
| Other Investment Pools and Funds - 0.0% | ||||||||
| 1 | JP Morgan U.S. Government Money Market Fund | $ | 1 | |||||
| Repurchase Agreements - 3.0% | ||||||||
| Deutsche Bank Securities TriParty Repurchase Agreement (maturing on 01/02/2014 in the amount of $1,691, collateralized by U.S. Treasury Note 1.75%, 2023, value of $1,725) | ||||||||
| $ | 1,691 | 0.02%, 12/31/2013 | $ | 1,691 | ||||
| RBS Greenwich Capital Markets TriParty Repurchase Agreement (maturing on 01/02/2014 in the amount of $5,326, collateralized by U.S. Treasury Note 0.38% - 1.50%, 2016 - 2018, value of $5,434) | ||||||||
| 5,326 | 0.01%, 12/31/2013 | 5,326 | ||||||
| UBS Securities, Inc. TriParty Repurchase Agreement (maturing on 01/02/2014 in the amount of $6,356, collateralized by U.S. Treasury Note 0.75%, 2018, value of $6,483) | ||||||||
| 6,356 | 0.01%, 12/31/2013 | 6,356 | ||||||
| 13,373 | ||||||||
| U.S. Government Agencies - 16.5% | ||||||||
| FHLMC | ||||||||
| $ | 25,000 | 0.10%, 4/21/2014 ○ | $ | 24,996 | ||||
| 3,000 | 0.11%, 5/6/2014 ○ | 2,999 | ||||||
| 10,000 | 0.13%, 6/19/2014 ○ | 9,996 | ||||||
| FNMA | ||||||||
| 20,000 | 0.08%, 2/26/2014 ○ | 19,998 | ||||||
| 10,000 | 0.11%, 7/1/2014 ○ | 9,996 | ||||||
| 5,000 | 0.12%, 5/14/2014 ○ | 4,999 | ||||||
| 72,984 | ||||||||
| U.S. Treasury Bills - 11.4% | ||||||||||||
| 10,500 | 0.04%, 01/09/2014 □○ | 10,500 | ||||||||||
| 40,000 | 0.05%, 03/06/2014 ○ | 39,996 | ||||||||||
| 50,496 | ||||||||||||
| Total short-term investments | ||||||||||||
| (cost $161,837) | $ | 161,849 | ||||||||||
| Total investments | ||||||||||||
| (cost $452,401) ▲ | 101.6 | % | $ | 450,305 | ||||||||
| Other assets and liabilities | (1.6 | )% | (7,184 | ) | ||||||||
| Total net assets | 100.0 | % | $ | 443,121 |
The accompanying notes are an integral part of these financial statements.
| 18 |
| Hartford Portfolio Diversifier HLS Fund |
| Schedule of Investments – (continued) |
| December 31, 2013 |
| (000’s Omitted) |
| Note: | Percentage of investments as shown is the ratio of the total market value to total net assets. |
| ▲ | At December 31, 2013, the cost of securities for federal income tax purposes was $434,272 and the aggregate gross unrealized appreciation and depreciation based on that cost were: |
| Unrealized Appreciation | $ | 21,821 | ||
| Unrealized Depreciation | (5,788 | ) | ||
| Net Unrealized Appreciation | $ | 16,033 |
| ● | Non-income producing. |
| Δ | Variable rate securities; the rate reported is the coupon rate in effect at December 31, 2013. |
| ○ | The interest rate disclosed for these securities represents the effective yield on the date of the acquisition. |
| ■ | Securities issued within terms of a private placement memorandum, exempt from registration under Rule 144A under the Securities Act of 1933, as amended, and may be sold only to qualified institutional buyers. Unless otherwise indicated, these holdings are determined to be liquid. At December 31, 2013, the aggregate value of these securities was $196, which rounds to zero percent of total net assets. |
| ☼ | This security, or a portion of this security, was purchased on a when-issued, delayed-delivery or delayed-draw basis. The cost of these securities was $1,792 at December 31, 2013. |
| ‡ | This security, or a portion of this security, has been segregated to cover funding requirements on investment transactions settling in the future. |
| Я | The broker deposited securities valued at $2,895 with the custodian to serve as collateral for the options purchased by the Fund. The collateral is maintained in a segregated account at the custodian on behalf of the Fund. Since the broker retains legal title to the securities, the securities are not considered assets of the Fund and are not included in the Statement of Assets and Liabilities. |
| □ | This security, or a portion of this security, is pledged as initial margin deposit and collateral for daily variation margin loss on open futures contracts held at December 31, 2013, as listed in the table below: |
| Futures Contracts Outstanding at December 31, 2013 | ||||||||||||||||||
| Description | Number of Contracts* | Expiration Date | Notional Amount | Market Value ╪ | Unrealized Appreciation/ (Depreciation) | |||||||||||||
| Long position contracts: | ||||||||||||||||||
| S&P 500 (E-Mini) Future | 1 | 03/21/2014 | $ | 92 | $ | 92 | $ | – | ||||||||||
| Short position contracts: | ||||||||||||||||||
| S&P 500 (E-Mini) Future | 2,318 | 03/21/2014 | $ | 205,670 | $ | 213,383 | $ | (7,713 | ) | |||||||||
| $ | (7,713 | ) | ||||||||||||||||
* The number of contracts does not omit 000's.
Cash of $1,235 was pledged as initial margin deposit and collateral for daily variation margin loss on open futures contracts at December 31, 2013.
The accompanying notes are an integral part of these financial statements.
| 19 |
| Hartford Portfolio Diversifier HLS Fund |
| Schedule of Investments – (continued) |
| December 31, 2013 |
| (000’s Omitted) |
| Ø | At December 31, 2013, this security, or a portion of this security, collateralized the written put options in the table below: |
| Written Put Options Outstanding at December 31, 2013 | ||||||||||||||||||||||||
| Description (Counterparty) | Option Type | Exercise Price/ Rate | Expiration Date | Number of Contracts* | Market Value ╪ | Premiums Received | Unrealized Appreciation (Depreciation) | |||||||||||||||||
| S&P 500 Option (BCLY) | Equity | $ | 910.00 | 06/06/2016 | 32,964 | $ | 500 | $ | 4,457 | $ | 3,957 | |||||||||||||
| S&P 500 Option (JPM) | Equity | $ | 910.00 | 06/06/2016 | 31,850 | 484 | 4,300 | 3,816 | ||||||||||||||||
| S&P 500 Option (BOA) | Equity | $ | 910.00 | 06/06/2016 | 20,282 | 307 | 2,564 | 2,257 | ||||||||||||||||
| S&P 500 Option (CSI) | Equity | $ | 910.00 | 06/06/2016 | 3,348 | 51 | 509 | 458 | ||||||||||||||||
| S&P 500 Option (UBS) | Equity | $ | 910.00 | 06/06/2016 | 8,811 | 133 | 1,388 | 1,255 | ||||||||||||||||
| $ | 1,475 | $ | 13,218 | $ | 11,743 | |||||||||||||||||||
* The number of contracts does not omit 000's. Number of contracts shown in U.S. dollars unless otherwise noted.
| ╪ | See Significant Accounting Policies of accompanying Notes to Financial Statements regarding valuation of securities. |
| GLOSSARY: (abbreviations used in preceding Schedule of Investments) |
| Counterparty Abbreviations: | |
| BCLY | Barclays |
| BOA | Banc of America Securities LLC |
| CSI | Credit Suisse International |
| JPM | JP Morgan Chase & Co. |
| UBS | UBS AG |
| Index Abbreviations: | |
| S&P | Standard & Poors |
| Municipal Bond Abbreviations: | |
| DA | Development Authority |
| FA | Finance Authority |
| GO | General Obligation |
| PA | Port Authority |
| Rev | Revenue |
| Other Abbreviations: | |
| ETF | Exchange Traded Fund |
| FFCB | Federal Farm Credit Bank |
| FHLB | Federal Home Loan Bank |
| FHLMC | Federal Home Loan Mortgage Corp. |
| FNMA | Federal National Mortgage Association |
| GNMA | Government National Mortgage Association |
| REIT | Real Estate Investment Trust |
The accompanying notes are an integral part of these financial statements.
| 20 |
| Hartford Portfolio Diversifier HLS Fund |
| Investment Valuation Hierarchy Level Summary |
| December 31, 2013 |
| (000’s Omitted) |
| Total | Level 1 ♦ | Level 2 ♦ | Level 3 | |||||||||||||
| Assets: | ||||||||||||||||
| Asset & Commercial Mortgage Backed Securities | $ | 3,304 | $ | – | $ | 3,304 | $ | – | ||||||||
| Common Stocks ‡ | 97,645 | 97,645 | – | – | ||||||||||||
| Corporate Bonds | 47,268 | – | 47,268 | – | ||||||||||||
| Exchange Traded Funds | 448 | 448 | – | – | ||||||||||||
| Foreign Government Obligations | 3,445 | – | 3,445 | – | ||||||||||||
| Municipal Bonds | 1,027 | – | 1,027 | – | ||||||||||||
| Put Options Purchased | 3,740 | – | 3,740 | – | ||||||||||||
| U.S. Government Agencies | 59,270 | – | 59,270 | – | ||||||||||||
| U.S. Government Securities | 72,309 | 978 | 71,331 | – | ||||||||||||
| Short-Term Investments | 161,849 | 1 | 161,848 | – | ||||||||||||
| Total | $ | 450,305 | $ | 99,072 | $ | 351,233 | $ | – | ||||||||
| Futures * | – | – | – | – | ||||||||||||
| Total | $ | – | $ | – | $ | – | $ | – | ||||||||
| Liabilities: | ||||||||||||||||
| Written Options | 1,475 | – | 1,475 | – | ||||||||||||
| Total | $ | 1,475 | $ | – | $ | 1,475 | $ | – | ||||||||
| Futures * | 7,713 | 7,713 | – | – | ||||||||||||
| Total | $ | 7,713 | $ | 7,713 | $ | – | $ | – | ||||||||
| ♦ | For the year ended December 31, 2013, there were no transfers between Level 1 and Level 2. |
| ‡ | The Fund has all or primarily all of the equity securities categorized in a particular level. Refer to the Schedule of Investments for further industry breakout. |
| * | Derivative instruments (excluding purchased and written options, if applicable) are valued at the unrealized appreciation/depreciation on the investments. |
| Note: | For purposes of reporting transfers between different hierarchy levels, both transfers in and out of each level, as applicable, are shown as if they occurred at the beginning of the period. |
The accompanying notes are an integral part of these financial statements.
| 21 |
| Hartford Portfolio Diversifier HLS Fund |
| Statement of Assets and Liabilities |
| December 31, 2013 |
| (000’s Omitted) |
| Assets: | ||||
| Investments in securities, at market value (cost $452,401) | $ | 450,305 | ||
| Cash | 1,235 | * | ||
| Receivables: | ||||
| Investment securities sold | 1,055 | |||
| Dividends and interest | 1,319 | |||
| Variation margin on financial derivative instruments | — | |||
| Other assets | 20 | |||
| Total assets | 453,934 | |||
| Liabilities: | ||||
| Bank overdraft | 999 | |||
| Payables: | ||||
| Investment securities purchased | 7,432 | |||
| Fund shares redeemed | 28 | |||
| Variation margin on financial derivative instruments | 742 | |||
| Investment management fees | 58 | |||
| Distribution fees | 24 | |||
| Other liabilities | 30 | |||
| Accrued expenses | 25 | |||
| Written options (proceeds $13,218) | 1,475 | |||
| Total liabilities | 10,813 | |||
| Net assets | $ | 443,121 | ||
| Summary of Net Assets: | ||||
| Capital stock and paid-in-capital | $ | 508,740 | ||
| Undistributed net investment income | 9 | |||
| Accumulated net realized loss | (67,562 | ) | ||
| Unrealized appreciation of investments | 1,934 | |||
| Net assets | $ | 443,121 | ||
| Shares authorized | 1,000,000 | |||
| Par value | $ | 0.001 | ||
| Class IB: Net asset value per share | $ | 8.13 | ||
| Shares outstanding | 54,471 | |||
| Net assets | $ | 443,121 |
* Cash of $1,235 was pledged as initial margin deposit and collateral for daily variation margin loss on open financial derivative instruments at December 31, 2013.
The accompanying notes are an integral part of these financial statements.
| 22 |
| Hartford Portfolio Diversifier HLS Fund |
| Statement of Operations |
| For the Year Ended December 31, 2013 |
| (000’s Omitted) |
| Investment Income: | ||||
| Dividends | $ | 1,657 | ||
| Interest | 2,789 | |||
| Less: Foreign tax withheld | — | |||
| Total investment income, net | 4,446 | |||
| Expenses: | ||||
| Investment management fees | 2,331 | |||
| Transfer agent fees | 2 | |||
| Distribution fees - Class IB | 971 | |||
| Custodian fees | 8 | |||
| Accounting services fees | 70 | |||
| Board of Directors' fees | 10 | |||
| Audit fees | 14 | |||
| Other expenses | 58 | |||
| Total expenses (before waivers and fees paid indirectly) | 3,464 | |||
| Expense waivers | (162 | ) | ||
| Custodian fee offset | — | |||
| Total waivers and fees paid indirectly | (162 | ) | ||
| Total expenses, net | 3,302 | |||
| Net Investment Income | 1,144 | |||
| Net Realized Loss on Investments and Other Financial Instruments: | ||||
| Net realized gain on investments | 2,233 | |||
| Net realized loss on futures | (52,778 | ) | ||
| Net Realized Loss on Investments and Other Financial Instruments | (50,545 | ) | ||
| Net Changes in Unrealized Depreciation of Investments and Other Financial Instruments: | ||||
| Net unrealized appreciation of investments | 11,282 | |||
| Net unrealized depreciation of purchased options | (10,534 | ) | ||
| Net unrealized depreciation of futures | (7,839 | ) | ||
| Net unrealized appreciation of written options | 5,561 | |||
| Net Changes in Unrealized Depreciation of Investments and Other Financial Instruments | (1,530 | ) | ||
| Net Loss on Investments and Other Financial Instruments | (52,075 | ) | ||
| Net Decrease in Net Assets Resulting from Operations | $ | (50,931 | ) |
The accompanying notes are an integral part of these financial statements.
| 23 |
| Hartford Portfolio Diversifier HLS Fund |
| Statement of Changes in Net Assets |
| (000’s Omitted) |
| For the Year Ended December 31, 2013 | For the Year Ended December 31, 2012 | |||||||
| Operations: | ||||||||
| Net investment income | $ | 1,144 | $ | 567 | ||||
| Net realized loss on investments and other financial instruments | (50,545 | ) | (15,883 | ) | ||||
| Net unrealized appreciation (depreciation) of investments and other financial instruments | (1,530 | ) | 2,972 | |||||
| Net Decrease in Net Assets Resulting from Operations | (50,931 | ) | (12,344 | ) | ||||
| Distributions to Shareholders: | ||||||||
| From net investment income | ||||||||
| Class IB | (1,833 | ) | (1,025 | ) | ||||
| Total distributions | (1,833 | ) | (1,025 | ) | ||||
| Capital Share Transactions: | ||||||||
| Class IB | ||||||||
| Sold | 220,554 | 218,964 | ||||||
| Issued on reinvestment of distributions | 1,833 | 1,025 | ||||||
| Redeemed | (22,264 | ) | (17,439 | ) | ||||
| Total capital share transactions | 200,123 | 202,550 | ||||||
| Net increase from capital share transactions | 200,123 | 202,550 | ||||||
| Net Increase in Net Assets | 147,359 | 189,181 | ||||||
| Net Assets: | ||||||||
| Beginning of period | 295,762 | 106,581 | ||||||
| End of period | $ | 443,121 | $ | 295,762 | ||||
| Undistributed (distribution in excess of) net investment income | $ | 9 | $ | — | ||||
| Shares: | ||||||||
| Class IB | ||||||||
| Sold | 25,310 | 22,772 | ||||||
| Issued on reinvestment of distributions | 224 | 109 | ||||||
| Redeemed | (2,594 | ) | (1,815 | ) | ||||
| Total share activity | 22,940 | 21,066 | ||||||
The accompanying notes are an integral part of these financial statements.
| 24 |
| Hartford Portfolio Diversifier HLS Fund |
| Notes to Financial Statements |
| December 31, 2013 |
| (000’s Omitted) |
| 1. | Organization: |
Hartford Portfolio Diversifier HLS Fund (the “Fund”) serves as an underlying investment option for certain variable annuity separate accounts of Hartford Life Insurance Company (“HLIC”) and its affiliates. The Fund’s shares are available only to separate accounts of HLIC and its affiliates as a required investment option for variable annuity contracts whose holders have elected a guaranteed benefit rider subject to an allocation requiring investment in the Fund.
Hartford Series Fund, Inc. (the “Company”) is an open-end registered management investment company comprised of thirty portfolios. Financial statements for the Fund, a series of the Company, are included in this report.
The Company is organized under the laws of the State of Maryland and is registered with the Securities and Exchange Commission (“SEC”) under the Investment Company Act of 1940, as amended (“1940 Act”). The Fund is a diversified open-end management investment company.
Class IB shares of the Fund are offered at the per share net asset value (“NAV”) without a sales charge and are subject to distribution and service fees charged pursuant to a Distribution Plan adopted in accordance with Rule 12b-1 under the 1940 Act.
| 2. | Significant Accounting Policies: |
The following is a summary of significant accounting policies of the Fund in the preparation of its financial statements, which are in accordance with United States Generally Accepted Accounting Principles (“U.S. GAAP”). The preparation of financial statements in accordance with U.S. GAAP may require management to make estimates and assumptions that affect the reported amounts of assets and liabilities and disclosure of contingent assets and liabilities at the date of the financial statements and the reported amounts of increases and decreases in net assets from operations during the reporting period. Actual results could differ from those estimates.
| a) | Determination of Net Asset Value – The NAV of each class of the Fund’s shares is determined as of the close of regular trading (normally 4:00 p.m. Eastern Time) (the “NYSE Close”) on each day that the New York Stock Exchange (the “Exchange”) is open (“Valuation Date”). Information that becomes known to the Fund after the NAV has been calculated on a particular day will not generally be used to retroactively adjust the NAV determined earlier that day. |
| b) | Investment Valuation and Fair Value Measurements – For purposes of calculating the NAV, portfolio investments and other assets held by the Fund's portfolio for which market quotes are readily available are valued at market value. Market value is generally determined on the basis of last reported sales prices or official close price. If no sales are reported, market value is based on quotes obtained from a quotation reporting system, established market makers, or independent pricing services. If market prices are not readily available or are deemed unreliable, the Fund will use the fair value of the investment as determined in good faith under policies and procedures established by and under the supervision of the Company’s Board of Directors. Market quotes are considered not readily available where there is an absence of current or reliable market-based data (e.g., trade information or indicative market quotes), including where events occur after the close of the relevant market, but prior to the NYSE Close, that materially affect the values of the Fund’s portfolio investments or assets. In addition, market quotes are considered not readily available when, due to extraordinary circumstances, the exchanges or markets on which the investments trade do not open for trading for the entire day and no other market prices are available. In addition, prices of foreign equities that are principally traded on certain foreign markets may be adjusted daily pursuant to a fair value pricing service approved by the Board of Directors in order to reflect an adjustment for the factors occurring after the close of certain foreign markets but before the NYSE Close. Investments that are primarily traded on foreign markets may trade on days that are not business days of the Fund. The value of the foreign investments in which the Fund invests may change on days when a shareholder will not be able to purchase or redeem shares of the Fund. Fair value pricing is subjective in nature and the use of fair value pricing by the Fund may cause the NAV of its shares to differ significantly from the NAV that would have been calculated using market prices at the close of the exchange on which a portfolio investment is primarily traded. There can be no assurance |
| 25 |
Hartford Portfolio Diversifier HLS Fund
Notes to Financial Statements – (continued)
December 31, 2013
(000’s Omitted)
that the Fund could obtain the fair market value assigned to an investment if the Fund were to sell the investment at approximately the time at which the Fund determines its NAV.
Fixed income investments (other than short-term obligations), non-exchange traded derivatives and centrally cleared swaps held by the Fund are normally valued on the basis of quotes obtained from brokers and dealers or independent pricing services in accordance with procedures established by the Company’s Board of Directors. Prices obtained from independent pricing services use information provided by market makers or estimates of market values through accepted market modeling, trading and pricing conventions. Inputs to the models may include, but are not limited to, prepayment speeds, pricing spread, yield, trade information, dealer quotes, market color, cash flow models and the investment’s terms and conditions. Generally, the Fund may use fair valuation in regard to fixed income investments when the Fund holds defaulted or distressed investments or investments in a company in which a reorganization is pending. Short-term investments maturing in 60 days or less are generally valued at amortized cost, if their original term to maturity was 60 days or less, or by amortizing their value on the 61st day prior to maturity, if the original term to maturity exceeded 60 days.
Exchange traded options, futures and options on futures are valued at the settlement price or last trade price determined by the relevant exchange as of the NYSE Close. If the last trade price for exchange traded options does not fall between the bid and ask prices, the value will be the mean of the bid and ask prices as of the NYSE Close. If a last trade price is not available, the value will be the mean of the bid and ask prices as of the NYSE Close. If a mean of the bid and ask prices cannot be calculated for the day, the value will be the bid price as of the NYSE Close. In the case of OTC options and such instruments that do not trade on an exchange, values may be supplied by a pricing service using a formula or other objective method that may take into consideration the style, direction, expiration, strike price, notional value and volatility or other special adjustments.
Investments in open-end mutual funds are valued at the respective NAV of each open-end mutual fund on the Valuation Date.
Financial instruments for which prices are not available from an independent pricing service may be valued using market quotations obtained from one or more dealers that make markets in the respective financial instrument in accordance with procedures established by the Company’s Board of Directors.
U.S. GAAP defines fair value as the price that the Fund would receive to sell an asset or pay to transfer a liability in an orderly transaction between market participants. The U.S. GAAP fair value measurement standards require disclosure of a fair value hierarchy for each major category of assets and liabilities. Various inputs are used in determining the fair value of the Fund’s investments. These inputs are summarized into three broad hierarchy levels. This hierarchy is based on whether the valuation inputs are observable or unobservable. These levels are:
| · | Level 1 – Quoted prices in active markets for identical investments. Level 1 may include exchange traded instruments, such as domestic equities, some foreign equities, options, futures, mutual funds, exchange traded funds, rights and warrants. |
| · | Level 2 – Observable inputs other than Level 1 prices, such as quoted prices for similar investments; quoted prices in markets that are not active; or other inputs that are observable or can be corroborated by observable market data. Level 2 may include debt investments that are traded less frequently than exchange traded instruments and which are valued using independent pricing services; foreign equities, which are principally traded on certain foreign markets and are adjusted daily pursuant to a fair value pricing service in order to reflect an adjustment for the factors occurring after the close of certain foreign markets but before the NYSE Close; senior floating rate interests, which are valued using an aggregate of dealer bids; short-term investments, which are valued at amortized cost; and swaps, which are valued based upon the terms of each swap contract. |
| · | Level 3 – Significant unobservable inputs that are supported by limited or no market activity. Level 3 may include financial instruments whose values are determined using indicative market quotes or require significant management judgment or estimation. These unobservable valuation inputs may include estimates for current yields, maturity/duration, prepayment speed, and indicative market quotes for comparable investments along |
| 26 |
with other assumptions relating to credit quality, collateral value, complexity of the investment structure, general market conditions and liquidity. This category may include investments where trading has been halted or there are certain restrictions on trading. While these investments are priced using unobservable inputs, the valuation of these investments reflects the best available data and management believes the prices are a reasonable representation of exit price.
The Board of Directors of the Company generally reviews and approves the “Procedures for Valuation of Portfolio Securities” on an annual basis. These procedures define how investments are to be valued, including the formation and activities of a Valuation Committee. The Valuation Committee is responsible for determining in good faith the fair value of investments when the value cannot be obtained from primary pricing services or alternative sources or if the valuation of an investment as provided by the primary pricing service or alternative source is believed not to reflect the investment’s fair value as of the Valuation Date. Voting members of the Valuation Committee include the Fund’s Treasurer or designee and a Vice President of the investment manager or designee. An Assistant Vice President of the Fund with legal expertise or designee is also included on the Valuation Committee as a non-voting advisory member. In addition, the Fund’s Chief Compliance Officer shall designate a member of the compliance group to attend Valuation Committee meetings as a non-voting resource, to monitor for and provide guidance with respect to compliance with these procedures. Two members of the Valuation Committee or their designees, representing different departments, shall constitute a quorum for purposes of permitting the Valuation Committee to take action. The Valuation Committee will consider all relevant factors in determining an investment’s fair value, and may seek the advice of the Fund’s sub-adviser, knowledgeable brokers, and legal counsel in making such determination. The Valuation Committee reports to the Audit Committee of the Company’s Board of Directors. The Audit Committee receives quarterly written reports which include details of all fair-valued investments, including the reason for the fair valuation, and an indication, when possible, of the accuracy of the valuation by disclosing the next available reliable public price quotation or the disposition price of such investments (the “look-back” test). The Board of Directors then must consider for ratification all of the fair value determinations made during the previous quarter.
Valuation levels are not necessarily indicative of the risk associated with investing in such investments. Individual investments within any of the above mentioned asset classes may be assigned a different hierarchical level than those presented above, as individual circumstances dictate.
For additional information, refer to the Investment Valuation Hierarchy Level Summary and the Level 3 roll-forward reconciliation, if applicable, which follow the Schedule of Investments.
| c) | Investment Transactions and Investment Income – Investment transactions are recorded as of the trade date (the date the order to buy or sell is executed) for financial reporting purposes. Investments purchased or sold on a when-issued or delayed-delivery basis may be settled a month or more after the trade date. Realized gains and losses are determined on the basis of identified cost. |
Dividend income from domestic securities is accrued on the ex-dividend date. In general, dividend income from foreign securities is recorded on the ex-date; however, dividend notifications in certain foreign jurisdictions may not be available in a timely manner and as a result, the Fund will record the dividend as soon as the relevant details (i.e., rate per share, payment date, shareholders of record, etc.) are publicly available. Interest income, including amortization of premium, accretion of discounts and additional principal received in-kind in lieu of cash, is accrued on a daily basis. Paydown gains and losses on mortgage related and other asset backed securities are included in interest income in the Statement of Operations, as applicable.
| d) | Fund Share Valuation and Dividend Distributions to Shareholders – Orders for the Fund’s shares are executed in accordance with the investment instructions of the contract holders. The NAV of the Fund’s shares is determined as of the close of business on each business day of the Exchange. The NAV is determined by dividing the Fund’s net assets by the number of shares outstanding. |
| 27 |
Hartford Portfolio Diversifier HLS Fund
Notes to Financial Statements – (continued)
December 31, 2013
(000’s Omitted)
Orders for the purchase of the Fund’s shares received prior to the close of the Exchange on any day the Exchange is open for business are priced at the NAV determined as of the close of the Exchange. Orders received after the close of the Exchange, or on a day on which the Exchange and/or the Fund is not open for business, are priced at the next determined NAV.
Dividends are declared pursuant to a policy adopted by the Company’s Board of Directors based upon the investment performance of the Fund. The policy of the Fund is to pay dividends from net investment income and realized gains, if any, at least once a year.
Distributions from net investment income, net realized gains and capital are determined in accordance with federal income tax regulations, which may differ from U.S. GAAP with respect to character and timing. These differences may include, but are not limited to, losses deferred due to wash sale adjustments, foreign currency gains and losses, adjustments related to Passive Foreign Investment Companies (“PFICs”), Real Estate Investment Trusts (“REITs”), Regulated Investment Companies (“RICs”), certain derivatives and partnerships. Permanent book and federal income tax basis differences relating to shareholder distributions will result in reclassifications to certain of the Fund’s capital accounts (see Federal Income Taxes: Reclassification of Capital Accounts note).
| 3. | Securities and Other Investments: |
| a) | Repurchase Agreements – A repurchase agreement is an agreement by which a counterparty agrees to sell an investment and agrees to repurchase the investment sold from the buyer at a mutually agreed upon time and price. During the period of the repurchase agreement, the counterparty will deposit cash and or securities in a third party custodial account to serve as collateral. At the time the Fund enters into a repurchase agreement, the value of the underlying collateral, including accrued interest, will be equal to or exceed the value of the repurchase agreement. Repurchase agreements expose the Fund to counterparty risk - that is, the risk that the counterparty will not fulfill its obligations. To minimize counterparty risk, the investments that serve to collateralize the repurchase agreement are held by the Fund’s custodian in book entry or physical form in the custodial account of the Fund or in a third party custodial account. Repurchase agreements are valued at cost plus accrued interest, which approximates fair value. Repurchase agreements have master netting arrangements which allow the Fund to offset amounts owed to a counterparty with amounts owed by the counterparty, including any collateral. Upon an event of default under a master repurchase agreement, the non-defaulting party may close out all transactions traded under such agreement and net amounts owed under each transaction to one net amount payable by one party to the other. Absent an event of default, the master repurchase agreement does not result in an offset of reported amounts of assets and liabilities in the Statement of Assets and Liabilities across transactions between the Fund and the applicable counterparty. The Fund, as shown on the Schedule of Investments, had outstanding repurchase agreements and related collateral as of December 31, 2013. |
| b) | Illiquid and Restricted Investments – The Fund is permitted to invest up to 15% of its net assets in illiquid investments. Illiquid investments are those that may not be sold or disposed of in the ordinary course of business within seven days, at approximately the price used to determine the Fund’s NAV. The Fund may not be able to sell illiquid investments when its sub-adviser considers it desirable to do so or may have to sell such investments at a price that is lower than the price that could be obtained if the investments were more liquid. A sale of illiquid investments may require more time and may result in higher dealer discounts and other selling expenses than does the sale of those that are liquid. Illiquid investments also may be more difficult to value due to the unavailability of reliable market quotations for such investments, and an investment in them may have an adverse impact on the Fund’s NAV. The Fund may also purchase certain restricted investments that can only be resold to certain qualified investors and may be determined to be liquid pursuant to policies and guidelines established by the Company’s Board of Directors. The Fund, as shown on the Schedule of Investments, had illiquid and/or restricted investments as of December 31, 2013. |
| c) | Investments Purchased on a When-Issued or Delayed-Delivery Basis – Delivery and payment for investments that have been purchased by the Fund on a forward commitment, or when-issued or delayed-delivery basis, take place beyond the customary settlement period. The Fund may dispose of or renegotiate a delayed-delivery transaction after it is entered into, and may sell delayed-delivery investments before they are delivered, which may result in a realized gain or loss. |
| 28 |
During this period, such investments are subject to market fluctuations, and the Fund identifies investments segregated in its records with a value at least equal to the amount of the commitment. The Fund, as shown on the Schedule of Investments, had when-issued or delayed-delivery investments as of December 31, 2013.
| d) | Mortgage Related and Other Asset Backed Securities – The Fund may invest in mortgage related and other asset backed securities. These securities include mortgage pass-through securities, collateralized mortgage obligations, commercial mortgage backed securities, stripped mortgage backed securities, asset backed securities, collateralized debt obligations and other securities that directly or indirectly represent a participation in, or are secured by and payable from, mortgage loans on real property. Mortgage related securities are created from pools of residential or commercial mortgage loans, including mortgage loans made by savings and loan institutions, mortgage bankers, commercial banks and others. Asset backed securities are created from many types of assets, including auto loans, credit card receivables, home equity loans, and student loans. These securities provide a monthly payment that consists of both interest and principal payments. Interest payments may be determined by fixed or adjustable rates. The rate of pre-payments on underlying mortgages will affect the price and volatility of a mortgage related security, and may have the effect of shortening or extending the effective duration of the security relative to what was anticipated at the time of purchase. The timely payment of principal and interest of certain mortgage related securities is guaranteed by the full faith and credit of the United States Government. Mortgage related and other asset backed securities created and guaranteed by non-governmental issuers, including government-sponsored corporations, may be supported by various forms of insurance or guarantees, but there can be no assurance that the private insurers or guarantors can meet their obligations under the insurance policies or guarantee arrangements. The Fund, as shown on the Schedule of Investments, had mortgage related and other asset backed securities as of December 31, 2013. |
| 4. | Financial Derivative Instruments: |
The following disclosures contain information on how and why the Fund uses derivative instruments, the credit-risk-related contingent features in certain derivative instruments, and how derivative instruments affect the Fund’s financial position and results of operations. The location and fair value amounts of these instruments on the Statement of Assets and Liabilities and the realized gains and losses and changes in unrealized gains and losses on the Statement of Operations, each categorized by type of derivative contract, are included in the following Additional Derivative Instrument Information footnote. The derivative instruments outstanding as of year-end are disclosed in the notes to or within the Schedule of Investments for purchased options, if applicable. The amounts of realized gains and losses and changes in unrealized gains and losses on derivative instruments during the year are disclosed in the Statement of Operations.
| a) | Futures Contracts – The Fund may enter into futures contracts. A futures contract is an agreement between two parties to buy or sell an asset at a set price on a future date. The Fund uses futures contracts to manage or obtain exposure to the investment markets, commodities, or movements in interest rates and currency values. The primary risks associated with the use of futures contracts are the imperfect correlation between the change in market value of the investments held by the Fund and the prices of futures contracts and the possibility of an illiquid market. Upon entering into a futures contract, the Fund is required to deposit with a futures commission merchant (“FCM”) an amount of cash or U.S. Government or Agency Obligations in accordance with the initial margin requirements of the broker or exchange. Futures contracts are marked to market daily at the most recent settlement price reported by an exchange on which, over time, they are traded most extensively, and an appropriate payable or receivable for the change in value (“variation margin”) is recorded by the Fund. Gains or losses are recognized but not considered realized until the contracts expire or are closed. Futures contracts involve, to varying degrees, risk of loss in excess of the variation margin disclosed on the Statement of Assets and Liabilities; however, the Fund seeks to reduce this risk through the use of an FCM. The Fund, as shown on the Schedule of Investments, had outstanding futures contracts as of December 31, 2013. |
| b) | Options Contracts – An option contract is a contract sold by one party to another party that offers the buyer the right, but not the obligation, to buy (call) or sell (put) an investment or other financial asset at an agreed-upon price during a specific period of time or on a specific date. The Fund may write (sell) covered call and put options on futures, swaps (“swaptions”), securities or commodities. “Covered” means that so long as the Fund is obligated as the writer of an option, it will own either the underlying investments or currency or an option to purchase the same underlying |
| 29 |
Hartford Portfolio Diversifier HLS Fund
Notes to Financial Statements – (continued)
December 31, 2013
(000’s Omitted)
investments or currency having an expiration date of the covered option and an exercise price equal to or less than the exercise price of the covered option, or will pledge cash or other liquid investments having a value equal to or greater than the fluctuating market value of the option investment or currency. Writing put options increases the Fund’s exposure to the underlying instrument. Writing call options decreases the Fund’s exposure to the underlying instrument. Premiums received from writing options that expire are treated as realized gains. Premiums received from writing options that are exercised or closed are added to the proceeds or offset amounts paid on the underlying futures, swap, investment or currency transaction to determine the realized gain or loss. The Fund as a writer of an option has no control over whether the underlying instrument may be sold (call) or purchased (put) and as a result bears the market risk of an unfavorable change in the price of the instrument underlying the written option. There is the risk the Fund may not be able to enter into a closing transaction because of an illiquid market. The Fund may also purchase put and call options. Purchasing call options increases the Fund’s exposure to the underlying instrument. Purchasing put options decreases the Fund’s exposure to the underlying instrument. The Fund pays a premium, which is included on the Fund’s Statement of Assets and Liabilities as an investment and is subsequently marked to market to reflect the current value of the option. Premiums paid for purchasing options that expire are treated as realized losses. Certain options may be purchased with premiums to be determined on a future date. The premiums for these options are based upon implied volatility parameters at specified terms. The risk associated with purchasing put and call options is generally limited to the premium paid. Premiums paid for purchasing options that are exercised or closed are added to the amounts paid or offset against the proceeds on the underlying investment transaction to determine the realized gain or loss. Entering into over-the-counter options also exposes the Fund to counterparty risk. Counterparty risk is the possibility that the counterparty to the agreements may default on its obligation to perform or disagree as to the meaning of the contractual terms in the agreements. The Fund, as shown on the Schedule of Investments, had outstanding purchased options and written options contracts as of December 31, 2013. Transactions involving written options contracts during the year ended December 31, 2013, are summarized below:
| Options Contract Activity During the Year Ended December 31, 2013 | ||||||||
| Put Options Written During the Year | Number of Contracts* | Premium Amounts | ||||||
| Beginning of the year | 97,255 | $ | 13,218 | |||||
| Written | — | — | ||||||
| Expired | — | — | ||||||
| Closed | — | — | ||||||
| Exercised | — | — | ||||||
| End of year | 97,255 | $ | 13,218 | |||||
* The number of contracts does not omit 000's.
| 30 |
| c) | Additional Derivative Instrument Information: |
Fair Value of Derivative Instruments on the Statement of Assets and Liabilities as of December 31, 2013:
| Risk Exposure Category | ||||||||||||||||||||||||||||
| Interest Rate Contracts | Foreign Exchange Contracts | Credit Contracts | Equity Contracts | Commodity Contracts | Other Contracts | Total | ||||||||||||||||||||||
| Assets: | ||||||||||||||||||||||||||||
| Investments in securities, at value (purchased options), market value | $ | — | $ | — | $ | — | $ | 3,740 | $ | — | $ | — | $ | 3,740 | ||||||||||||||
| Variation margin receivable * | — | — | — | — | — | — | — | |||||||||||||||||||||
| Total | $ | — | $ | — | $ | — | $ | 3,740 | $ | — | $ | — | $ | 3,740 | ||||||||||||||
| Liabilities: | ||||||||||||||||||||||||||||
| Variation margin payable * | $ | — | $ | — | $ | — | $ | 742 | $ | — | $ | — | $ | 742 | ||||||||||||||
| Written options, market value | — | — | — | 1,475 | — | — | 1,475 | |||||||||||||||||||||
| Total | $ | — | $ | — | $ | — | $ | 2,217 | $ | — | $ | — | $ | 2,217 | ||||||||||||||
| * | Only current day's variation margin is reported within the Statement of Assets and Liabilities. The variation margin is included in the open futures cumulative depreciation of $(7,713) as reported in the Schedule of Investments. |
The volume of derivatives that is presented in the Schedule of Investments is consistent with the derivative activity during the year ended December 31, 2013.
The Effect of Derivative Instruments on the Statement of Operations for the year ended December 31, 2013:
| Risk Exposure Category | ||||||||||||||||||||||||||||
| Interest Rate Contracts | Foreign Exchange Contracts | Credit Contracts | Equity Contracts | Commodity Contracts | Other Contracts | Total | ||||||||||||||||||||||
| Realized Loss on Derivatives Recognized as a Result of Operations: | ||||||||||||||||||||||||||||
| Net realized loss on futures | $ | — | $ | — | $ | — | $ | (52,778 | ) | $ | — | $ | — | $ | (52,778 | ) | ||||||||||||
| Total | $ | — | $ | — | $ | — | $ | (52,778 | ) | $ | — | $ | — | $ | (52,778 | ) | ||||||||||||
| Net Change in Unrealized Appreciation (Depreciation) on Derivatives Recognized as a Result of Operations: | ||||||||||||||||||||||||||||
| Net change in unrealized depreciation of investments in purchased options | $ | — | $ | — | $ | — | $ | (10,534 | ) | $ | — | $ | — | $ | (10,534 | ) | ||||||||||||
| Net change in unrealized depreciation of futures | — | — | — | (7,839 | ) | — | — | (7,839 | ) | |||||||||||||||||||
| Net change in unrealized appreciation of written options | — | — | — | 5,561 | — | — | 5,561 | |||||||||||||||||||||
| Total | $ | — | $ | — | $ | — | $ | (12,812 | ) | $ | — | $ | — | $ | (12,812 | ) | ||||||||||||
| d) | Balance Sheet Offsetting Information: |
Set forth below are tables which disclose both gross information and net information about instruments and transactions eligible for offset in the financial statements, and instruments and transactions that are subject to a master netting arrangement, as well as amounts related to margin, reflected as financial collateral (including cash collateral), held at clearing brokers, counterparties and the Fund’s custodian. The master netting arrangements allow the clearing brokers to net any collateral held in or on behalf of the Fund, or liabilities or payment obligations of the clearing brokers to the Fund, against any liabilities or payment obligations of the Fund to the clearing brokers. The Fund is required to deposit financial collateral (including cash collateral) at the Fund’s custodian on behalf of clearing brokers and counterparties to continually meet the original and maintenance requirements established by the clearing brokers and counterparties. Such requirements are specific to the respective clearing broker or counterparty.
| 31 |
Hartford Portfolio Diversifier HLS Fund
Notes to Financial Statements – (continued)
December 31, 2013
(000’s Omitted)
Offsetting of Financial Assets and Derivative Assets as of December 31, 2013:
| Gross Amounts* of Assets Presented in Statement of Assets and Liabilities | Financial Instruments with Allowable Netting | Collateral Received | Net Amount (not less than $0) | |||||||||||||
| Description | ||||||||||||||||
| Purchased options at market value | $ | 3,740 | $ | (1,475 | ) | $ | (2,895 | ) | $ | — | ||||||
| Total subject to a master netting or similar arrangement | $ | 3,740 | $ | (1,475 | ) | $ | (2,895 | ) | $ | — | ||||||
Offsetting of Financial Liabilities and Derivative Liabilities as of December 31, 2013:
| Gross Amounts* of Liabilities Presented in Statement of Assets and Liabilities | Financial Instruments with Allowable Netting | Collateral Pledged | Net Amount (not less than $0) | |||||||||||||
| Description | ||||||||||||||||
| Written options at market value | $ | 1,475 | $ | (1,475 | ) | $ | — | $ | — | |||||||
| Total subject to a master netting or similar arrangement | $ | 1,475 | $ | (1,475 | ) | $ | — | $ | — | |||||||
* Gross amounts presented as no amounts are netted within the Statement of Assets and Liabilities.
Certain derivatives held by the Fund, as of December 31, 2013, are not subject to a master netting arrangement and are excluded from the table above.
| 5. | Principal Risks: |
Credit risk depends largely on the perceived financial health of bond issuers. In general, the credit rating is inversely related to the credit risk of the issuer. Higher rated bonds generally are deemed to have less credit risk, while lower or unrated bonds are deemed to have higher risk of default. The share price, yield and total return of a fund that holds securities with higher credit risk may be more volatile than those of a fund that holds bonds with lower credit risk. Similar to credit risk, the Fund may be exposed to counterparty risk, or the risk that an institution or other entity with which the Fund has unsettled or open transactions will default.
The Fund’s investments expose the Fund to various risks including, but not limited to, interest rate, prepayment, extension and equity risks. Interest rate risk is the risk that fixed income securities will decline in value because of changes in interest rates. As nominal interest rates rise, the values of certain fixed income securities held by the Fund are likely to decrease. A nominal interest rate can be described as the sum of a real interest rate and an expected inflation rate. Fixed income securities with longer durations tend to be more sensitive to changes in interest rates, usually making them more volatile than securities with shorter durations. Duration is useful primarily as a measure of the sensitivity of a fixed income security’s market price to interest rate (i.e., yield) movements. In addition, securities are subject to extension risk. Rising interest rates may cause prepayments to occur at a slower than expected rate, thereby effectively lengthening the maturity of the security and making the security more sensitive to interest rate changes. Prepayment and extension risk are major risks of mortgage backed securities and certain asset backed securities. For certain asset backed securities, the actual maturity may be less than the stated maturity shown in the Schedule of Investments, if applicable. As a result, the timing of income recognition relating to these securities may vary based upon the actual maturity.
The market values of equity securities, such as common stocks and preferred stocks, or equity related investments, such as futures and options, may decline due to general market conditions which are not specifically related to a particular company, such as real or perceived adverse economic conditions, changes in the general outlook for corporate earnings, changes in interest or currency rates or adverse investor sentiment generally. The market value of equity securities may also decline due to factors which affect a particular industry or industries, such as labor shortages or increased production costs and competitive conditions within an industry. Equity securities and equity related investments generally have greater market price volatility than fixed income securities.
| 32 |
| 6. | Federal Income Taxes: |
| a) | Federal Income Taxes – For federal income tax purposes, the Fund intends to continue to qualify as a RIC under Subchapter M of the Internal Revenue Code (“IRC”) by distributing substantially all of its taxable net investment income and net realized capital gains to its shareholders and otherwise complying with the requirements of the IRC. The Fund has distributed substantially all of its income and capital gains in prior years, if applicable, and intends to distribute substantially all of its income and capital gains prior to the next fiscal year-end. Accordingly, no provision for federal income or excise taxes has been made in the accompanying financial statements. Distributions from short-term capital gains are treated as ordinary income distributions for federal income tax purposes. |
| b) | Net Investment Income (Loss), Net Realized Gains (Losses) and Distributions – Net investment income (loss) and net realized gains (losses) may differ for financial statement and tax purposes primarily because of losses deferred due to wash sale adjustments, foreign currency gains and losses, adjustments related to PFICs, REITs, RICs, certain derivatives and partnerships. The character of distributions made during the year from net investment income or net realized gains may differ from their ultimate characterization for federal income tax purposes. Also, due to the timing of dividend distributions, the fiscal year in which amounts are distributed may differ from the year that the income or realized gains (losses) were recorded by the Fund. |
| c) | Distributions and Components of Distributable Earnings – The tax character of distributions paid by the Fund for the periods indicated is as follows (as adjusted for dividends payable, if applicable): |
| For the Year Ended December 31, 2013 | For the Year Ended December 31, 2012 | |||||||
| Ordinary Income | $ | 1,833 | $ | 1,025 | ||||
As of December 31, 2013, the Fund’s components of distributable earnings (deficit) on a tax basis were as follows:
| Amount | ||||
| Undistributed Ordinary Income | $ | 9 | ||
| Accumulated Capital and Other Losses | (81,661 | ) | ||
| Unrealized Appreciation* | 16,033 | |||
| Total Accumulated Deficit | $ | (65,619 | ) | |
| * | Differences between book-basis and tax-basis unrealized appreciation (depreciation) may be attributable to the losses deferred due to wash sale adjustments, foreign currency gains and losses, adjustments related to PFICs, REITs, RICs, certain derivatives and partnerships. |
| d) | Reclassification of Capital Accounts – The Fund may record reclassifications in its capital accounts. These reclassifications have no impact on the total net assets of the Fund. The reclassifications are a result of permanent differences between U.S. GAAP and tax accounting for such items as foreign currency, PFICs, expiration or utilization of capital loss carryforwards or net operating losses. Adjustments are made to reflect the impact these items have on current and future distributions to shareholders. Therefore, the source of the Fund’s distributions may be shown in the accompanying Statement of Changes in Net Assets as from undistributed net investment income, from accumulated net realized gains on investments or from capital depending on the type of book and tax differences that exist. For the year ended December 31, 2013, the Fund recorded reclassifications to increase (decrease) the accounts listed below: |
| Amount | ||||
| Undistributed Net Investment Income (Loss) | $ | 698 | ||
| Accumulated Net Realized Gain (Loss) | (690 | ) | ||
| Capital Stock and Paid-in-Capital | (8 | ) | ||
| 33 |
Hartford Portfolio Diversifier HLS Fund
Notes to Financial Statements – (continued)
December 31, 2013
(000’s Omitted)
| e) | Capital Loss Carryforward – On December 22, 2010, the Regulated Investment Company Modernization Act of 2010 (the “Act”) was enacted, which made changes to the capital loss carryforward rules. The changes are effective for taxable years beginning after the date of enactment. Under the Act, funds are permitted to carry forward capital losses for an unlimited period. However, any losses incurred during those future taxable years will be required to be utilized prior to the losses incurred in pre-enactment taxable years, which carry an expiration date. As a result of this ordering rule, pre-enactment capital loss carryforwards may be more likely to expire unused. Additionally, post-enactment capital loss carryforwards retain their character as either short-term or long-term capital losses rather than being considered all short-term as permitted under prior regulation. |
At December 31, 2013 (tax-year-end), the Fund had capital loss carryforwards for U.S. federal income tax purposes as follows:
Capital loss carryforwards with no expiration:
| Amount | ||||
| Short-Term Capital Loss Carryforward | $ | 36,057 | ||
| Long-Term Capital Loss Carryforward | 45,604 | |||
| Total | $ | 81,661 | ||
| f) | Accounting for Uncertainty in Income Taxes – The Fund has adopted financial reporting rules that require the Fund to analyze all open tax years, as defined by the statute of limitations, for all major jurisdictions. Generally, tax authorities can examine all tax returns filed for the last three years. The Fund does not have an examination in progress. |
The Fund has reviewed all open tax years and major jurisdictions and concluded that these financial reporting rules had no effect on the Fund’s financial position or results of operations. There is no tax liability resulting from unrecognized tax benefits relating to uncertain income tax positions taken or expected to be taken on the tax return for the fiscal year ended December 31, 2013. The Fund is also not aware of any tax positions for which it is reasonably possible that the total amounts of unrecognized tax benefits will significantly change in the next twelve months.
| 7. | Expenses: |
| a) | Investment Management Agreement – Hartford Funds Management Company, LLC (“HFMC”), an indirect wholly owned subsidiary of The Hartford Financial Services Group, Inc. (“The Hartford”), serves as investment manager to the Fund pursuant to an Investment Management Agreement with the Company. The investment manager has overall investment supervisory responsibility for the Fund. In addition, the investment manager provides administrative personnel, services, equipment, facilities and office space for proper operation of the Fund. The investment manager has contracted with Hartford Investment Management Company (“Hartford Investment Management”) under a sub-advisory agreement for the provision of day-to-day investment management services to the Fund in accordance with the Fund’s investment objective and policies. The Fund pays a fee to the investment manager, a portion of which may be used to compensate Hartford Investment Management. |
The schedule below reflects the rates of compensation paid to HFMC for investment management services rendered as of December 31, 2013; the rates are accrued daily and paid monthly.
| Average Daily Net Assets | Annual Fee | |
| On first $500 million | 0.60% | |
| On next $500 million | 0.55% | |
| On next $4 billion | 0.50% | |
| On next $5 billion | 0.48% | |
| Over $10 billion | 0.47% |
| 34 |
| b) | Accounting Services Agreement – Pursuant to the Fund Accounting Agreement between HFMC and the Company, on behalf of the Fund, HFMC provides accounting services to the Fund and receives monthly compensation based on the Fund’s average daily net assets at the rates set forth below. The Fund’s accounting services fees are accrued daily and paid monthly. |
| Average Daily Net Assets | Annual Fee | |
| On first $5 billion | 0.018% | |
| On next $5 billion | 0.016% | |
| Over $10 billion | 0.014% |
Effective January 1, 2014, the new accounting services fees schedule based on the Fund’s average daily net assets is as follows:
| Average Daily Net Assets | Annual Fee | |
| On first $5 billion | 0.018% | |
| On next $5 billion | 0.014% | |
| Over $10 billion | 0.010% |
| c) | Operating Expenses – Allocable expenses incurred by the Company are allocated to each Fund in proportion to the average daily net assets of the Fund, except where allocation of certain expenses is more fairly made directly to the Fund. HFMC has contractually agreed to reimburse expenses (exclusive of taxes, interest expense, brokerage commissions, acquired fund fees and expenses and extraordinary expenses) to the extent necessary to maintain total annual operating expenses for the Class IB shares of the Fund at the annual rate of 0.85% of the Fund’s average daily net assets. This contractual arrangement will remain in effect until April 30, 2014, and shall renew automatically for one-year terms unless HFMC provides written notice of termination prior to the start date of the next term or upon approval of the Board of Directors of the Company. |
| d) | Fees Paid Indirectly – The Fund’s custodian bank has agreed to reduce its fees when the Fund maintains cash on deposit in a non-interest-bearing custody account. For the year ended December 31, 2013, these amounts, if any, are included in the Statement of Operations. |
The ratio of expenses to average net assets in the accompanying financial highlights excludes the reduction in expenses related to fees paid indirectly. The annualized expense ratio after waivers for the period listed below reflecting the reduction for fees paid indirectly is as follows:
| Year Ended December 31, 2013 | ||||
| Class IB | 0.85 | % | ||
| e) | Distribution Plan for Class IB shares – Effective June 14, 2013, Hartford Investment Financial Services, LLC was renamed Hartford Funds Distributors, LLC (“HFD”). HFD, a wholly owned, ultimate subsidiary of The Hartford, serves as the Fund’s principal underwriter and distributor. The Company, on behalf of the Fund, has adopted a Distribution Plan pursuant to Rule 12b-1 of the 1940 Act to compensate the distributor, HFD, from assets attributable to the Class IB shares for services rendered and expenses borne in connection with activities primarily intended to result in the sale of the Class IB shares, subject to the review and approval of the Company’s Board of Directors. |
The Distribution Plan provides that the Fund may pay annually up to 0.25% of the average daily net assets of the Fund attributable to its Class IB shares for activities primarily intended to result in the sale of Class IB shares. The Board has the authority to suspend or reduce these payments at any point in time. Under the terms of the Distribution Plan and the principal underwriting agreement, the Fund is authorized to make payments monthly to the distributor that may be used to pay or compensate entities providing distribution and shareholder servicing with respect to the Class IB shares for such entities’ fees or expenses incurred or paid in that regard. These fees are accrued daily and paid monthly.
| 35 |
Hartford Portfolio Diversifier HLS Fund
Notes to Financial Statements – (continued)
December 31, 2013
(000’s Omitted)
| f) | Other Related Party Transactions – Certain officers of the Fund are directors and/or officers of the investment manager and/or The Hartford or its subsidiaries. For the year ended December 31, 2013, a portion of the Fund’s Chief Compliance Officer’s salary was paid by all the investment companies in the Hartford fund complex. The portion allocated to the Fund rounds to zero. Hartford Administrative Services Company (“HASCO”), an indirect wholly owned subsidiary of The Hartford, provides transfer agent services to the Fund. HASCO was compensated on a per account basis for providing such services. The amount paid to HASCO can be found in the Statement of Operations. These fees are accrued daily and paid monthly. |
| 8. | Affiliate Holdings: |
As of December 31, 2013, affiliates of The Hartford had ownership of shares in the Fund as follows:
| Percentage of Class | ||||
| Class IB | 11 | % | ||
| 9. | Investment Transactions: |
For the year ended December 31, 2013, the cost of purchases and proceeds from sales of investment securities (excluding short-term investments) were as follows:
| Amount | ||||
| Cost of Purchases Excluding U.S. Government Obligations | $ | 172,091 | ||
| Sales Proceeds Excluding U.S. Government Obligations | 85,831 | |||
| Cost of Purchases for U.S. Government Obligations | 65,252 | |||
| Sales Proceeds for U.S. Government Obligations | 29,992 | |||
| 10. | Industry Classifications: |
Other than the industry classifications “Other Investment Pools and Funds” and “Exchange Traded Funds,” equity industry classifications used in this report are the Global Industry Classification Standard, which was developed by and is the exclusive property and service mark of MSCI, Inc. and Standard & Poor’s.
| 11. | Indemnifications: |
Under the Company’s organizational documents, the Company shall indemnify its officers and directors to the full extent required or permitted under Maryland General Corporation Law and the federal securities laws. In addition, the Company, on behalf of the Fund, may enter into contracts that contain a variety of indemnifications. The Company’s maximum exposure under these arrangements is unknown. However, as of the date of these financial statements, the Company has not had prior claims or losses pursuant to these contracts and expects the risk of loss to be remote.
| 36 |
| 12. | Pending Legal Proceedings: |
On February 25, 2011, Jennifer L. Kasilag, Louis Mellinger, Judith M. Menendez, Jacqueline M. Robinson, and Linda A. Russell filed a derivative lawsuit against Hartford Investment Financial Services, LLC (“HIFSCO”)(now known as Hartford Funds Distributors, LLC) on behalf of six Hartford retail mutual funds in the United States District Court for the District of New Jersey, alleging that HIFSCO received excessive advisory and distribution fees in violation of its statutory fiduciary duty under Section 36(b) of the 1940 Act when serving as investment manager and principal underwriter, respectively, to the Hartford retail mutual funds. HIFSCO moved to dismiss and, in September 2011, the motion was granted in part and denied in part, with leave to amend the complaint. In November 2011, plaintiffs filed an amended complaint on behalf of certain Hartford retail mutual funds, The Hartford Global Health Fund (now known as The Hartford Healthcare Fund), The Hartford Conservative Allocation Fund, The Hartford Growth Opportunities Fund, The Hartford Inflation Plus Fund, The Hartford Advisers Fund (now known as The Hartford Balanced Fund), and The Hartford Capital Appreciation Fund. Plaintiffs seek to rescind the investment management agreements and distribution plans between HIFSCO and these funds and to recover the total fees charged thereunder or, in the alternative, to recover any improper compensation HIFSCO received, in addition to lost earnings. HIFSCO filed a partial motion to dismiss the amended complaint and, in December 2012, the court dismissed without prejudice the claims regarding distribution fees and denied the motion with respect to the advisory fees claims. HIFSCO disputes the allegations and intends to defend the advisory fee claims vigorously.
This action concerns the activities of HIFSCO in its capacity as investment manager and principal underwriter to the Hartford retail mutual funds and does not concern HIFSCO’s activities in its capacity as principal underwriter to the HLS funds. For this reason, no accrual for litigation relating to this matter has been recorded in the financial statements of the Fund.
| 37 |
Hartford Portfolio Diversifier HLS Fund
Financial Highlights
| ─ Selected Per-Share Data(A) ─ | ─Ratios and Supplemental Data ─ | |||||||||||||||||||||||||||||||||||||||||||||||||||
| Class | Net Asset Value at Beginning of Period | Net Investment Income (Loss) | Net Realized and Unrealized Gain (Loss) on Investments | Total from Investment Operations | Dividends from Net Investment Income | Distributions from Realized Capital Gains | Total Dividends and Distributions | Net Asset Value at End of Period | Total Return(B) | Net Assets at End of Period (000s) | Ratio of Expenses to Average Net Assets Before Adjust- ments(C) | Ratio of Expenses to Average Net Assets After Adjust- ments(C) | Ratio of Net Investment Income (Loss) to Average Net Assets | |||||||||||||||||||||||||||||||||||||||
| For the Year Ended December 31, 2013 | ||||||||||||||||||||||||||||||||||||||||||||||||||||
| IB | $ | 9.38 | $ | 0.03 | $ | (1.25 | ) | $ | (1.22 | ) | $ | (0.03 | ) | $ | – | $ | (0.03 | ) | $ | 8.13 | (12.96 | )% | $ | 443,121 | 0.89 | % | 0.85 | % | 0.29 | % | ||||||||||||||||||||||
| For the Year Ended December 31, 2012 (D) | ||||||||||||||||||||||||||||||||||||||||||||||||||||
| IB | $ | 10.18 | $ | 0.02 | $ | (0.79 | ) | $ | (0.77 | ) | $ | (0.03 | ) | $ | – | $ | (0.03 | ) | $ | 9.38 | (7.58 | )% | $ | 295,762 | 0.91 | % | 0.85 | % | 0.27 | % | ||||||||||||||||||||||
| From June 6, 2011 (commencement of operations) through December 31, 2011 | ||||||||||||||||||||||||||||||||||||||||||||||||||||
| IB(E) | $ | 10.00 | $ | 0.04 | $ | 0.19 | $ | 0.23 | $ | (0.03 | ) | $ | (0.02 | ) | $ | (0.05 | ) | $ | 10.18 | 2.38 | %(F) | $ | 106,581 | 0.93 | %(G) | 0.85 | %(G) | 0.58 | %(G) | |||||||||||||||||||||||
| (A) | Information presented relates to a share outstanding throughout the indicated period. Net investment income (loss) per share amounts are calculated based on average shares outstanding unless otherwise noted. |
| (B) | The figures do not include sales charges or other fees which may be applied at the variable annuity product level. Any such additional sales charges or other fees would lower the Fund's performance. |
| (C) | Adjustments include waivers and reimbursements, if applicable. Ratios do not include fees paid indirectly (see Expenses in the accompanying Notes to Financial Statements). |
| (D) | Net investment income (loss) per share amounts have been calculated using the SEC method. |
| (E) | Commenced operations on June 6, 2011. |
| (F) | Not annualized. |
| (G) | Annualized. |
| Portfolio Turnover Rate for All Share Classes | ||||
| For the Year Ended December 31, 2013 | 31% | |||
| For the Year Ended December 31, 2012 | 61 | |||
| From June 6, 2011 (commencement of operations) through December 31, 2011 | 43 | |||
| 38 |
Report of Independent Registered Public Accounting Firm
The Board of Directors and Shareholders of
Hartford Series Fund, Inc.
We have audited the accompanying statement of assets and liabilities, including the schedule of investments, of Hartford Portfolio Diversifier HLS Fund (one of the portfolios constituting Hartford Series Fund, Inc. (the Funds)) as of December 31, 2013, and the related statement of operations for the year then ended, the statements of changes in net assets for each of the two years in the period then ended, and the financial highlights for each of the two years in the period then ended and for the period from June 6, 2011 (commencement of operations) to December 31, 2011. These financial statements and financial highlights are the responsibility of the Funds’ management. Our responsibility is to express an opinion on these financial statements and financial highlights based on our audits.
We conducted our audits in accordance with the standards of the Public Company Accounting Oversight Board (United States). Those standards require that we plan and perform the audit to obtain reasonable assurance about whether the financial statements and financial highlights are free of material misstatement. We were not engaged to perform an audit of the Funds’ internal control over financial reporting. Our audits included consideration of internal control over financial reporting as a basis for designing audit procedures that are appropriate in the circumstances, but not for the purpose of expressing an opinion on the effectiveness of the Funds’ internal control over financial reporting. Accordingly, we express no such opinion. An audit also includes examining, on a test basis, evidence supporting the amounts and disclosures in the financial statements and financial highlights, assessing the accounting principles used and significant estimates made by management, and evaluating the overall financial statement presentation. Our procedures included confirmation of securities owned as of December 31, 2013, by correspondence with the custodian and brokers or by other appropriate auditing procedures where replies from brokers were not received. We believe that our audits provide a reasonable basis for our opinion.
In our opinion, the financial statements and financial highlights referred to above present fairly, in all material respects, the financial position of Hartford Portfolio Diversifier HLS Fund of the Hartford Series Fund, Inc. at December 31, 2013, the results of its operations for the year then ended, the changes in its net assets for each of the two years in the period then ended, and the financial highlights for each of the two years in the period then ended and for the period from June 6, 2011 (commencement of operations) to December 31, 2011, in conformity with U.S. generally accepted accounting principles.
Minneapolis, MN
February 17, 2014
| 39 |
Hartford Portfolio Diversifier HLS Fund
Directors and Officers (Unaudited)
The Board of Directors of the Company appoints officers who are responsible for the day-to-day operations of the Fund and who execute policies formulated by the directors. Each director serves until his or her death, resignation, or retirement or until the next annual meeting of shareholders is held or until his or her successor is elected and qualifies.
Directors and officers who are employed by or who have a financial interest in The Hartford are considered “interested” persons of the Fund pursuant to the 1940 Act. Each officer and two of the Company’s directors, as noted in the chart below, are “interested” persons of the Fund. Each director serves as a director for The Hartford Mutual Funds, Inc., The Hartford Mutual Funds II, Inc., Hartford Series Fund, Inc., Hartford HLS Series Fund II, Inc., and as a trustee for The Hartford Alternative Strategies Fund, which, as of December 31, 2013, collectively consist of 91 funds. Correspondence may be sent to directors and officers c/o Hartford Funds, 5 Radnor Corporate Center, Suite 300, 100 Matsonford Road, Radnor, Pennsylvania 19087, except that correspondence to Mr. Annoni, Mr. Dressen and Ms. Quade may be sent to 500 Bielenberg Drive, Woodbury, Minnesota 55125.
The table below sets forth, for each director and officer, his or her name, year of birth, current position with the Company and date first elected or appointed to Hartford Series Fund, Inc. (“HSF”), and Hartford HLS Series Fund II, Inc. (“HSF2”), principal occupation, and, for directors, other directorships held. The Fund’s Statement of Additional Information contains further information on the directors and is available free of charge by calling 1-800-862-6668 or writing to Hartford HLS Funds, c/o Hartford Life Insurance Company, Hartford Life and Annuity Insurance Company, P.O. Box 14293, Lexington, KY 40512-4293.
Information on the aggregate remuneration paid to the directors of the Company can be found in the Statement of Operations herein. The Fund pays to The Hartford a portion of the Chief Compliance Officer’s compensation, but does not pay salaries or compensation to any of their other officers or directors who are employed by The Hartford.
Non-Interested Directors
Lynn S. Birdsong (1946) Director since 2003, Co-Chairman of the Investment Committee since 2005
Mr. Birdsong is a private investor. Mr. Birdsong currently serves as a Director of the Sovereign High Yield Investment Company (April 2010 to current). Mr. Birdsong currently serves as an Independent Director of Nomura Partners Funds, Inc. (formerly, The Japan Fund) (April 2003 to current). From 2003 to March 2005, Mr. Birdsong was an Independent Director of the Atlantic Whitehall Funds. From 1979 to 2002, Mr. Birdsong was a Managing Director of Zurich Scudder Investments, an investment management firm. During his employment with Scudder, Mr. Birdsong was an Interested Director of The Japan Fund. From January 1981 through December 2013, Mr. Birdsong was a partner in Birdsong Company, an advertising specialty firm.
Robert M. Gavin, Jr. (1940) Director since 2002 (HSF) and 1986 (HSF2), Chairman of the Board since 2004
Dr. Gavin is an educational consultant. Prior to September 1, 2001, he was President of Cranbrook Education Community and prior to July 1996, he was President of Macalester College, St. Paul, Minnesota.
Duane E. Hill (1945) Director since 2001 (HSF) and 2002 (HSF2), Chairman of the Nominating Committee since 2003
Mr. Hill is a Partner of TSG Ventures L.P., a private equity investment company. Mr. Hill is a former partner of TSG Capital Group, a private equity investment firm that served as sponsor and lead investor in leveraged buyouts of middle market companies.
Sandra S. Jaffee (1941) Director since 2005
Ms. Jaffee is the founder and Chief Executive Officer of a private company, Homeworks Concierge, LLC, which provides residential property management services in Westchester County, New York (January 2012 to present). Ms. Jaffee served as Chairman (2008 to 2009) and Chief Executive Officer of Fortent (formerly Searchspace Group), a leading provider of compliance/regulatory technology to financial institutions from August 2005 to August 2009. Ms. Jaffee currently serves as a member of the Board of Directors of Broadridge Financial Solutions as well as a Trustee of Muhlenberg College.
| 40 |
William P. Johnston (1944) Director since 2005, Chairman of the Compliance Committee since 2005
In June 2006, Mr. Johnston was appointed as Senior Advisor to The Carlyle Group, a global private equity and alternative asset investment firm and currently serves as an Operating Executive. In July 2006, Mr. Johnston was elected to the Board of Directors of MultiPlan, Inc. and served as a Director (July 2006 to August 2010). In August 2007, Mr. Johnston was elected to the Board of Directors of LifeCare Holdings, Inc. and served as a Director (August 2007 to June 2013). In February 2008, Mr. Johnston was elected to the Board of Directors of HCR-ManorCare, Inc. In May 2006, Mr. Johnston was elected to the Supervisory Board of Fresenius Medical Care AG & Co. KGaA, after its acquisition of Renal Care Group, Inc. in March 2006. Mr. Johnston joined Renal Care Group in November 2002 as a member of the Board of Directors and served as Chairman of the Board from March 2003 through March 2006. From 2002 through 2013, Mr. Johnston served as a Board member of the Georgia O’Keefe Museum. From September 1987 to December 2002, Mr. Johnston was with Equitable Securities Corporation (and its successors, SunTrust Equitable Securities and SunTrust Robinson Humphrey) serving in various investment banking and managerial positions, including Managing Director and Head of Investment Banking, Chief Executive Officer and Vice Chairman.
Phillip O. Peterson (1944) Director since 2002 (HSF) and 2000 (HSF2), Chairman of the Audit Committee since 2002
Mr. Peterson is a mutual fund industry consultant. He was a partner of KPMG LLP (an accounting firm) until July 1999. Mr. Peterson joined William Blair Funds in February 2007 as a member of the Board of Trustees. Mr. Peterson also joined the Board of Trustees of Symetra Variable Mutual Funds Trust as a trustee in February 2012.
Lemma W. Senbet (1946) Director since 2005
Dr. Senbet is the William E. Mayer Chair Professor of Finance and Founding Director, Center for Financial Policy, at the University of Maryland, Robert H. Smith School of Business. He was chair of the Finance Department of the University of Maryland, Robert H. Smith School of Business from 1998 to 2006. Since June 2013, he has been on leave from the University to serve as Executive Director of African Economic Research Consortium which focuses on economic policy research and training. Previously, he was a chaired professor of finance at the University of Wisconsin-Madison. Also, he was a Director of the Fortis Funds from March 2000 to July 2002. Dr. Senbet served as Director of the American Finance Association and President of the Western Finance Association. In 2006, Dr. Senbet was inducted Fellow of Financial Management Association International for his career-long distinguished scholarship and professional service.
Interested Directors and Officers
James E. Davey (1964) Director since 2012, President and Chief Executive Officer since 2010
Mr. Davey serves as Executive Vice President of Hartford Life Insurance Company (“HLIC”) and The Hartford Financial Services Group, Inc. Additionally, Mr. Davey serves as Chairman of the Board, Manager and Senior Managing Director of Hartford Funds Distributors, LLC (“HFD”). He also currently serves as Director, Chairman of the Board, President and Senior Managing Director of Hartford Administrative Services Company (“HASCO”). Mr. Davey also serves as Manager, Chairman of the Board and Senior Managing Director for Hartford Funds Management Company, LLC (“HFMC”). Mr. Davey joined The Hartford in 2002.
Lowndes A. Smith (1939) Director since 1996 (HSF) and 2002 (HSF2), Co-Chairman of the Investment Committee since 2005
Mr. Smith served as Vice Chairman of The Hartford from February 1997 to January 2002, as President and Chief Executive Officer of Hartford Life, Inc. from February 1997 to January 2002, and as President and Chief Operating Officer of The Hartford Life Insurance Companies from January 1989 to January 2002. Mr. Smith serves as a Director of White Mountains Insurance Group Ltd. (October 2003 to current); One Beacon Insurance (October 2006 to current); Symetra Financial (August 2007 to current) and is a Managing Director of Whittington Gray Associates (January 2007 to current).
Other Officers
Mark A. Annoni (1964) Vice President, Controller and Treasurer since 2012
Mr. Annoni currently serves as the Assistant Vice President of HLIC (February 2004 to present).
| 41 |
Hartford Portfolio Diversifier HLS Fund
Directors and Officers (Unaudited) – (continued)
Michael R. Dressen (1963) AML Compliance Officer since 2011
Mr. Dressen currently serves as Assistant Vice President of HLIC. He also serves as Chief Compliance Officer and AML Compliance Officer of HASCO and as AML Officer of HFD. Mr. Dressen has served in various positions within The Hartford and its subsidiaries in connection with the operation of the Hartford Funds.
Edward P. Macdonald (1967) Vice President, Secretary and Chief Legal Officer since 2005
Mr. Macdonald currently serves as Assistant Secretary, Executive Vice President and Deputy General Counsel of HFD, HASCO and HFMC. He also serves as Vice President of HLIC. Mr. Macdonald has served in various positions within The Hartford and its subsidiaries in connection with the operation of the Hartford Funds. Mr. Macdonald joined The Hartford in 2005.
Joseph G. Melcher (1973) Vice President and Chief Compliance Officer since 2013
Mr. Melcher currently serves as Executive Vice President of HASCO and HFD. Mr. Melcher also currently serves as Executive Vice President and Chief Compliance Officer of HFMC. Mr. Melcher has served in various positions within The Hartford and its subsidiaries in connection with the operation of the Hartford Funds since joining The Hartford in 2012. Prior to joining The Hartford, Mr. Melcher worked at Touchstone Investments, a member of the Western & Southern Financial Group, where he held the position of Vice President and Chief Compliance Officer from 2010 through 2012 and Assistant Vice President, Compliance from 2005 to 2010.
Vernon J. Meyer (1964) Vice President since 2006
Mr. Meyer currently serves as Senior Vice President of HLIC. He also currently serves as Managing Director and Chief Investment Officer of HFMC. Mr. Meyer has served in various positions within The Hartford and its subsidiaries in connection with the operation of the Hartford Funds. Mr. Meyer joined The Hartford in 2004.
Laura S. Quade (1969) Vice President since 2012
Ms. Quade currently serves as Vice President of HASCO and HFD. She is the Head of Operations of HASCO and also serves as Director, Enterprise Operations of HLIC. Ms. Quade has served in various positions within The Hartford and its subsidiaries in connection with the operation of the Hartford Funds.
Martin A. Swanson (1962) Vice President since 2010
Mr. Swanson currently serves as Vice President of HLIC. Mr. Swanson also serves as Managing Director, Chief Marketing Officer and Principal of HFD. Mr. Swanson has served in various positions within The Hartford and its subsidiaries in connection with the operation of the Hartford Funds.
HOW TO OBTAIN A COPY OF THE FUND’S PROXY VOTING POLICIES AND VOTING RECORDS (UNAUDITED)
A description of the policies and procedures that the Fund uses to determine how to vote proxies relating to portfolio securities and information about how the Fund voted proxies relating to portfolio securities during the most recent twelve-month period ended June 30 are available (1) without charge, upon request, by calling 800-862-6668 and (2) on the SEC’s website at http://www.sec.gov.
QUARTERLY PORTFOLIO HOLDINGS INFORMATION (UNAUDITED)
The Fund files a complete schedule of portfolio holdings with the SEC for the first and third quarters of each fiscal year on Form N-Q. The Fund’s Forms N-Q are available (1) without charge, upon request, by calling 800-862-6668 and (2) on the SEC’s website at http://www.sec.gov. The Form N-Q may be reviewed and copied at the SEC’s Public Reference Room in Washington, DC. Information on the operation of the Public Reference Room may be obtained by calling 1-800-SEC-0330.
| 42 |
Hartford Portfolio Diversifier HLS Fund
Expense Example (Unaudited)
Your Fund's Expenses
As a shareholder of the Fund, you incur two types of costs: (1) transaction costs and (2) ongoing costs, including investment management fees, distribution and/or service (12b-1) fees, if any, and other fund expenses. This example is intended to help you understand your ongoing costs (in dollars) of investing in the Fund and to compare these costs with the ongoing costs of investing in other mutual funds. The example is based on an investment of $1,000 invested at the beginning of the period and held for the period of June 30, 2013 through December 31, 2013.
Actual Expenses
The first set of columns of the table below provides information about actual account values and actual expenses. You may use the information in this column, together with the amount you invested, to estimate the expenses that you paid over the period. Simply divide your account value by $1,000 (for example, an $8,600 account value divided by $1,000 = 8.6), then multiply the result by the number in the line under the heading entitled “Expenses Paid During Period” to estimate the expenses you paid on your account during this period.
Hypothetical Example for Comparison Purposes
The second set of columns of the table below provides information about hypothetical account values and hypothetical expenses based on the Fund’s actual expense ratio and an assumed rate of return of 5% per year before expenses, which is not the Fund’s actual return. The hypothetical account values and expenses may not be used to estimate the actual ending account balance or expenses you paid for the period. You may use this information to compare the ongoing costs of investing in the Fund and other funds. To do so, compare this 5% hypothetical example with the 5% hypothetical examples that appear in the shareholder reports of the other funds.
Please note that the expenses shown in the table are meant to highlight your ongoing costs only and do not reflect any transactional costs, such as sales charges (loads) and CDSC. Therefore, the second set of columns of the table is useful in comparing ongoing costs only, and will not help you determine the relative total costs of owning different funds. In addition, if these transactional costs were included, your costs would be higher. Expenses are equal to the Fund's annualized expense ratios multiplied by average account value over the period, multiplied by 184/365 (to reflect the one-half year period).
| Actual return | Hypothetical (5% return before expenses) | |||||||||||||||||||||||||||||||||||
| Beginning Account Value June 30, 2013 | Ending Account Value December 31, 2013 | Expenses paid during the period June 30, 2013 through December 31, 2013 | Beginning Account Value June 30, 2013 | Ending Account Value December 31, 2013 | Expenses paid during the period June 30, 2013 through December 31, 2013 | Annualized expense ratio | Days in the current 1/2 year | Days in the full year | ||||||||||||||||||||||||||||
| Class IB | $ | 1,000.00 | $ | 944.70 | $ | 4.16 | $ | 1,000.00 | $ | 1,020.92 | $ | 4.33 | 0.85 | % | 184 | 365 | ||||||||||||||||||||
| 43 |
Hartford Portfolio Diversifier HLS Fund
Approval of Investment Management and Investment Sub-Advisory Agreements (Unaudited)
Section 15(c) of the Investment Company Act of 1940, as amended (the “1940 Act”), requires that each mutual fund’s board of directors, including a majority of those directors who are not “interested persons” of the mutual fund, as defined in the 1940 Act (the “Independent Directors”), annually review and consider the continuation of the mutual fund’s investment advisory and sub-advisory agreements. At its meeting held on August 6-7, 2013, the Board of Directors (the “Board”) of Hartford Series Fund, Inc., including each of the Independent Directors, unanimously voted to approve the continuation of the investment management agreement for Hartford Portfolio Diversifier HLS Fund (the “Fund”) with Hartford Funds Management Company, LLC (“HFMC”) and the continuation of the investment sub-advisory agreement between HFMC and the Fund’s sub-adviser, Hartford Investment Management Company (the “Sub-adviser,” and together with HFMC, the “Advisers”) (collectively, the “Agreements”).
In the months preceding the August 6-7, 2013 meeting, the Board requested, received, and reviewed written responses from the Advisers to questions posed to them on behalf of the Independent Directors and supporting materials relating to those questions and responses. The Board considered information furnished to the Board at its meetings throughout the year, as well as information specifically prepared in connection with the annual approval of the Agreements at the Board’s meetings held on June 18-19, 2013 and August 6-7, 2013. Information provided to the Board at its meetings throughout the year included, among other things, reports on Fund performance, legal and compliance matters, sales and marketing activity, shareholder services, and the other services provided to the Fund by the Advisers and their affiliates. The Board also received in-person presentations by Fund officers and representatives of HFMC at the Board’s meetings on June 18-19, 2013 and August 6-7, 2013 concerning the Agreements.
The Independent Directors, advised by independent legal counsel, engaged two service providers to assist them with evaluating the Agreements with respect to the Fund. Lipper Inc. (“Lipper”), an independent provider of investment company data, was retained to provide the Board with reports on how the Fund’s contractual management fees, actual management fees, other non-management fees, overall expense ratios and investment performance compared to those of mutual funds with similar investment objectives. The Independent Directors also engaged an independent financial services consulting firm (the “Consultant”) to assist them in evaluating the Fund’s management fees, sub-advisory fees, other non-management fees, overall expense ratios and investment performance. In addition, the Consultant reviewed the profitability calculations utilized by HFMC in connection with the continuation of the investment management agreement.
In determining whether to continue the Agreements for the Fund, the members of the Board reviewed and evaluated information and factors they believed to be relevant and appropriate in light of the information that the Board deemed necessary and appropriate through the exercise of its reasonable business judgment. While individual members of the Board may have weighed certain factors differently, the Board’s determination to continue the Agreements was based on a comprehensive consideration of all information provided to the Board throughout the year and specifically with respect to the continuation of the Agreements. A more detailed discussion of the factors the Board considered with respect to its approval of the Agreements is provided below.
Nature, Extent, and Quality of Services Provided by the Advisers
The Board requested and considered information concerning the nature, extent, and quality of the services provided to the Fund by the Advisers. The Board considered, among other things, the terms of the Agreements and the range of services provided by the Advisers. The Board considered the Advisers’ professional personnel who provide services to the Fund, including each Adviser’s ability and experience in attracting and retaining qualified personnel to service the Fund. The Board considered each Adviser’s reputation and overall financial strength, as well as its willingness to consider and implement organizational and operational changes designed to improve services to the Fund. In addition, the Board considered the quality of each Adviser’s communications with the Board and responsiveness to Board inquiries.
The Board also requested and evaluated information concerning each Adviser’s regulatory and compliance environment. In this regard, the Board requested and reviewed information on each Adviser’s compliance policies and procedures, compliance history, and a report from the Fund’s Chief Compliance Officer on each Adviser’s compliance with applicable laws and regulations, including responses to regulatory developments and compliance issues raised by regulators. In addition, the Board noted that it had previously approved a compliance policy and procedures specific to the Fund to provide safeguards and controls designed to assure that the Fund is operated in accordance with its stated objectives and strategies, and not in a manner intended to inappropriately benefit the Advisers’ affiliates to the detriment of the Fund and its shareholders. The Board also noted the
| 44 |
Advisers’ support of the Fund’s compliance control structure, particularly the resources devoted by the Advisers in support of the Fund’s obligations pursuant to Rule 38a-1 under the 1940 Act.
With respect to HFMC, the Board noted that under the Agreements, HFMC is responsible for the management of the Fund, including overseeing fund operations and service providers, as well as investment advisory services in connection with selecting, monitoring and supervising the Sub-adviser. The Board considered HFMC’s ongoing monitoring of people, process and performance, including its quarterly reviews of each of the Hartford Funds, semi-annual meetings with the leaders of each Fund’s portfolio management team, and oversight of the Funds’ approximately 40 portfolio managers. The Board recognized that HFMC has demonstrated a record of making changes to the management and/or strategies of the Funds when warranted. The Board considered HFMC’s oversight of the Sub-adviser’s investment approach and results, process for monitoring best execution of portfolio trades by the Sub-adviser, and approach to risk management with respect to the Fund and the service providers to the Fund. The Board also considered HFMC’s oversight of compliance with the Fund’s objective and policies as well as with applicable laws and regulations, noting that regulatory and other developments had over time led to an increase in the scope of HFMC’s services in this regard.
In addition, the Board considered HFMC’s ongoing commitment to review and rationalize the Hartford Funds product line-up and the expenses that HFMC had incurred in connection with fund combinations in recent years. The Board considered that HFMC or its affiliates are responsible for providing the Fund’s officers. The Board also noted that Hartford Life Insurance Company (“HLIC”) provides administrative services to the Fund. The Board considered its experiences with HFMC and HLIC with respect to each of these services.
With respect to the Sub-adviser, who provides day-to-day portfolio management services, the Board considered the quality of the Fund’s portfolio managers, the Sub-adviser’s other investment personnel, its investment philosophy and process, investment research capabilities and resources, performance record, trade execution capabilities and experience. The Board considered the experience of the Fund’s portfolio managers, the number of accounts managed by the portfolio managers, and the Sub-adviser’s method for compensating the portfolio managers.
Based on these considerations, the Board concluded that it was satisfied with the nature, extent and quality of the services provided to the Fund by HFMC and the Sub-adviser.
Performance of the Fund and the Advisers
The Board considered the investment performance of the Fund. In this regard, the Board reviewed the performance of the Fund over different time periods presented in the materials and evaluated HFMC’s analysis of the Fund’s performance for these time periods. The Board considered information and materials provided to the Board by the Advisers concerning Fund performance, as well as information from Lipper comparing the investment performance of the Fund to an appropriate benchmark and universe of peer funds. The Board noted that the Fund’s performance was in the 5th quintile of its performance universe for the 1-year period. The Board also noted that the Fund’s performance was below its benchmark for the 1-year period.
The Board considered the detailed investment analytics reports provided by Hartford Funds’ Investment Advisory Group throughout the year. These reports include, among other things, information on the Fund’s gross and net returns, the Fund’s investment performance relative to an appropriate benchmark and peer group, various statistics concerning the Fund’s portfolio, and a narrative summary of various factors affecting Fund performance. The Board considered the Advisers’ cooperation with the Investment Committee, which assists the Board in evaluating the performance of the Fund at periodic meetings throughout the year. The Board also considered the analysis provided by the Consultant relating to the Fund’s performance track record.
In light of all the considerations noted above, the Board concluded that it had continued confidence in HFMC’s and the Sub-adviser’s overall capabilities to manage the Fund.
Costs of the Services and Profitability of the Advisers
The Board reviewed information regarding HFMC’s cost to provide investment management and related services to the Fund and HFMC’s profitability, both overall and for the Fund, on a pre-tax basis without regard to distribution expenses. The Board also requested and reviewed information about the profitability to HFMC and its affiliates from all services provided to the Fund and
| 45 |
Hartford Portfolio Diversifier HLS Fund
Approval of Investment Management and Investment Sub-Advisory Agreements (Unaudited) – (continued)
all aspects of their relationship with the Fund. The Board noted that the fees payable to the Sub-adviser are equal to its estimated costs in providing sub-advisory services. Accordingly, the costs and profitability for the Sub-adviser and HFMC were considered in the aggregate.
The Board considered the Consultant’s review of the profitability calculations utilized by HFMC in connection with the continuation of the investment management agreement, noting the Consultant’s view that Hartford Funds’ process for calculating and reporting Fund profitability is reasonable. In this regard, the Board noted that the Consultant had previously performed a full review of this process and reported that such process is sound and well within common industry practice.
Based on these considerations, the Board concluded that the profits anticipated to be realized by the Advisers and their affiliates from their relationships with the Fund would not be excessive.
Comparison of Fees and Services Provided by the Advisers
The Board considered comparative information with respect to the management fees to be paid by the Fund to HFMC and the total expense ratios of the Fund. The Board also considered comparative information with respect to the sub-advisory fees to be paid by HFMC to the Sub-adviser, to the extent applicable. In this regard, the Board requested and reviewed information from HFMC and the Sub-adviser relating to the management and sub-advisory fees and total operating expenses for the Fund. The Board considered that the management fee for the Fund includes the fee paid to HLIC for providing certain administrative services to the Fund. The Board also reviewed information from Lipper comparing the Fund’s contractual management fees, actual management fees and overall expense ratios relative to a group of funds selected by Lipper, in consultation with the Consultant, and a broader universe of funds selected by Lipper. The Board noted that the Fund’s contractual management fee, actual management fee, and total expenses (less 12b-1 and shareholder service fees) were in the 1st quintile of its expense group. The Board also noted that the Fund has an automatically renewable contractual expense cap, which resulted in reimbursement of certain expenses incurred in 2012.
While the Board recognized that comparisons between the Fund and peer funds are imprecise, given the differing service levels and characteristics of mutual funds and the different business models and cost structures of the Advisers, the comparative information provided by Lipper assisted the Board in evaluating the reasonableness of the Fund’s management and sub-advisory fees and total operating expenses. In addition, the Board considered the analysis and recommendations of the Consultant relating to the Fund’s management and sub-advisory fees and total operating expenses.
Based on these considerations, the Board concluded that the Fund’s fees and total operating expenses, in conjunction with the information about quality of services, profitability, economies of scale, and other matters discussed, were reasonable in light of the services provided.
Economies of Scale
The Board requested and considered information regarding the Advisers’ realization of economies of scale with respect to the Fund and whether the fee levels reflect these economies of scale for the benefit of the Fund’s shareholders. The Board reviewed the breakpoints in the management fee schedule for the Fund, which reduce fee rates as Fund assets grow over time. The Board recognized that a fund with assets beyond the last breakpoint level will continue to benefit from economies of scale because additional assets are charged the lowest breakpoint fee resulting in lower overall effective management fee rates. The Board also considered that expense limitations and fee waivers that reduce the Fund’s expenses at all asset levels can have the same effect as breakpoints in sharing economies of scale with shareholders and provide protection from an increase in expenses if Fund assets decline. The Board also recognized that a fee schedule that reaches a lower breakpoint quickly provides shareholders with the benefit of anticipated or potential economies of scale. The Board noted the effect of the sale and run-off of the variable annuity business on the HLS Funds and also noted that the Fund’s current low asset levels have kept the Fund from fully realizing the benefits of anticipated or potential economies of scale.
The Board reviewed and evaluated materials from Lipper showing how management fee schedules of peer funds reflect economies of scale for the benefit of shareholders as a peer fund’s assets hypothetically increase over time. Based on information provided by HFMC, Lipper, and the Consultant, the Board recognized that there is no uniform methodology for establishing breakpoints or uniform pattern in asset levels that trigger breakpoints or the amounts of breakpoints triggered.
| 46 |
After considering all of the information available to it, the Board concluded that it was satisfied with the extent to which economies of scale would be shared for the benefit of the Fund’s shareholders based on currently available information and the effective advisory fees and expense ratios for the Fund at its current and reasonably anticipated asset levels. The Board noted, however, that it would continue to monitor future growth in Fund assets and the appropriateness of additional breakpoints.
Other Benefits
The Board considered other benefits to the Advisers and their affiliates from their relationships with the Fund, including the role of the Fund in supporting the variable annuity products offered by The Hartford. The Board noted that HLIC, an affiliate of HFMC, and its affiliates benefit from the Fund’s strategy of seeking to replicate the performance of the Portfolio Diversifier Index through a reduced need to hedge their obligations under certain guaranteed benefit riders (each, a “Rider”) in their general accounts, the reduced potential risk of loss, and the potential for additional assets garnered due to the appeal to investors of the Riders combined with a particular asset allocation model. The Board also noted, on the other hand, that investors benefit from the ability to elect the Rider at a comparatively reduced guarantee price (in light of the performance profile of the Fund) and on comparatively better terms, than would be available in the absence of the Fund, while maintaining a decreased possibility of downside risk as well as decreased volatility of an investor’s overall fund allocation. The Board considered the reports of the Advisers and the Fund’s Chief Compliance Officer that demonstrated that the Fund continues to be managed in the interests of contract holders, and not in the interests of HLIC to the detriment of contract holders.
The Board reviewed information noting that HLIC receives fees for providing certain administrative services to the Fund and that HFMC receives fees for fund accounting and related services from the Fund. The Board considered information on profits to HLIC and HFMC for such services. The Board also considered that Hartford Administrative Services Company (“HASCO”), the Fund’s transfer agent and an affiliate of HFMC, receives transfer agency compensation from the Fund, and the Board reviewed information on the profitability of the Fund’s transfer agency function to HASCO. The Board considered information provided by HASCO indicating that the transfer agent fees charged by HASCO to the Fund were fair and reasonable based on publicly available information.
The Board also considered that Hartford Funds Distributors, LLC (“HFD”), an affiliate of HFMC, serves as principal underwriter of the Fund. As principal underwriter, HFD receives 12b-1 fees from the Fund. The Board also noted that certain affiliates of HFD distribute shares of the Fund and receive compensation in that connection.
The Board considered the benefits, if any, to the Sub-adviser from any use of the Fund’s brokerage commissions to obtain soft dollar research.
The Board considered the benefits to shareholders of being part of the Hartford Funds family of funds. The Board considered HFMC’s efforts to provide investors in the family with a broad range of investment styles and asset classes.
* * * *
Based upon its review of these various factors, among others, the Board concluded that it is in the best interests of the Fund and its shareholders for the Board to approve the Agreements for an additional year. In reaching this decision, the Board did not assign relative weights to the factors discussed above or deem any one or group of them to be controlling in and of themselves. In connection with their deliberations, the Independent Directors met separately in executive session on several occasions, with independent legal counsel and the Consultant, to review the relevant materials and consider their responsibilities under relevant laws and regulations.
| 47 |
Hartford Portfolio Diversifier HLS Fund
Main Risks (Unaudited)
The main risks of investing in the Fund are described below.
Market and Selection Risk: The Fund’s share price may fluctuate due to market risk and/or security selections that may underperform compared to the market or relevant benchmarks.
Derivatives Risk: Investments in derivatives can be volatile. Potential risks include currency risk, leverage risk (the risk that small market movements may result in large changes in the value of an investment), liquidity risk, index risk, pricing risk, and counterparty risk (the risk that the counterparty may be unwilling or unable to honor its obligations).
Fixed Income Risk: The Fund is subject to interest rate risk (the risk that the value of an investment decreases when interest rates rise) and credit risk (the risk that the issuing company of a security is unable to pay interest and principal when due) and call risk (the risk that an investment may be redeemed early). These risks also apply to the Fund’s investment in U.S. government securities, which may not be guaranteed by the U.S. government.
Fund Strategy Risk: The Fund is available solely to holders of variable annuity contracts issued by Hartford Life and its affiliates and by Forethought Life Insurance Company (“Forethought”) who have elected a guaranteed benefit rider subject to an allocation requiring investment in the Fund (a “Rider”). The Fund is designed to replicate the Portfolio Diversifier Index (the “Index”), which is designed to produce investment performance that may mitigate against significant declines in the values of the equity mutual funds (the “Allocated Funds”) held by Rider holders. Hartford Life and its affiliates and Forethought have financial obligations to holders of the Riders arising from guarantee obligations under the Riders. To the extent that the Fund’s strategy is successful, Hartford Life and its affiliates and Forethought will benefit from a reduction of the risk arising from their guarantee obligations under the Riders, and they will have less risk to hedge under the Riders than would be the case if holders did not allocate to the Fund.
As a holder of a Rider, you also will have exposure to changes in the values of the Allocated Funds, although your particular exposure will differ from the aggregated exposure that the Index is designed to address, depending on your allocations and investment activity, among other factors. Although the Fund may have the effect of mitigating declines in your contract value under a Rider in the event of a significant decline in equity market valuations, the strategy followed by the Fund, if successful, will also generally result in your contract value increasing to a lesser degree than the equity markets, or decreasing, when the values of equity investments are stable or rising. This may deprive you of some or all of the benefit of increases in equity market values under your contract and could also result in a decrease in the value of your variable annuity contract. Depending on future market conditions, you might benefit more from selecting alternative allocations under a guaranteed benefit rider (if available) or alternate investments. In addition, there is no guarantee that the Fund’s strategy will have its intended effect, and it may not work as effectively as is intended. Depending on your particular allocation to the Allocated Funds under a Rider, the Fund’s strategy may be more or less effective in mitigating potential losses under your variable annuity contract than may be the case for others who elect a Rider and allocate contract value differently among the Allocated Funds. In particular, the Fund’s investment strategy is not as likely to be as effective with respect to allocations that have relatively lower anticipated correlation to the investment performance of the S&P 500 Index.
Hartford Life’s and Forethought’s financial interest in reducing the volatility of overall contract value invested under the Riders, in light of their obligations under the Riders, may be deemed to present a potential conflict of interest with respect to the interests of the holders of the Riders, in that Hartford Life’s and Forethought’s interest may at times conflict with the Fund’s goal of preserving the potential for modest appreciation in the Fund’s net asset value when markets are appreciating. HFMC and the Fund have developed procedures designed to address this potential conflict by (i) specifying the processes for developing and communicating the data used to calculate the Index, calculating the Index and managing the Fund to replicate the performance of the Index and (ii) monitoring for compliance with the specified processes.
| 48 |
Index and Information Risk: The data used by HFMC to calculate the Index may not always be current. To the extent the data, and in particular the market-related data, is outdated or inaccurate, the Derivative Sleeve may fail to hedge or may hedge less effectively against equity market declines. In addition, when the values of investments are increasing, the Fund’s value could increase to a lesser extent, or decrease to a greater extent, than would be the case if the data used to calculate the Index were current.
In addition, the Index is intended to hedge against the aggregate allocations of holders of the Riders to the Allocated Funds and not the allocation of any individual contract owner. The Derivative Sleeve may not be successful in providing an effective hedge, and the hedge, even if effective, will benefit some Rider holders more than others, depending upon the allocations to funds selected by the holders. In particular, contract owners whose allocations have a relatively higher anticipated correlation to the investment performance of the S&P 500 Index will benefit to a greater extent from the hedge during periods of equity market declines.
| 49 |
THIS PRIVACY POLICY IS NOT PART OF THIS REPORT
Privacy Policy and Practices of The Hartford Financial Services Group, Inc. and its Affiliates
(herein called “we, our, and us”)
This Privacy Policy applies to our United States Operations
We value your trust. We are committed to the responsible: a) management; b) use; and c) protection; of Personal Information. This notice describes how we collect, disclose, and protect Personal Information.
We collect Personal Information to: a) service your Transactions with us; and b) support our business functions.
We may obtain Personal Information from: a) You; b) your Transactions with us; and c) third parties such as a consumer-reporting agency.
Based on the type of product or service You apply for or get from us, Personal Information such as: a) your name; b) your address; c) your income; d) your payment; or e) your credit history; may be gathered from sources such as applications, Transactions, and consumer reports.
To serve You and service our business, we may share certain Personal Information. We will share Personal Information, only as allowed by law, with affiliates such as: a) our insurance companies; b) our employee agents; c) our brokerage firms; and d) our administrators.
As allowed by law, we may share Personal Financial Information with our affiliates to: a) market our products; or b) market our services; to You without providing You with an option to prevent these disclosures. | We may also share Personal Information, only as allowed by law, with unaffiliated third parties including:
When allowed by law, we may share certain Personal Financial Information with other unaffiliated third parties who assist us by performing services or functions such as:
We, and third parties we partner with, may track some of the pages You visit through the use of: a) cookies; b) pixel tagging; or c) other technologies; and currently do not process or comply with any web browser’s “do not track” signal or similar mechanism that indicates a request to disable online tracking of individual users who visit our websites or use our services.
We will not sell or share your Personal Financial Information with anyone for purposes unrelated to our business functions without offering You the opportunity to:
We only disclose Personal Health Information with:
Our employees have access to Personal Information in the course of doing their jobs, such as: |
We use manual and electronic security procedures to maintain: a) the confidentiality; and b) the integrity of; Personal Information that we have. We use these procedures to guard against unauthorized access.
Some techniques we use to protect Personal Information include: a) secured files; b) user authentication; c) encryption; d) firewall technology; and e) the use of detection software.
We are responsible for and must: a) identify information to be protected; b) provide an adequate level of protection for that data; c) grant access to protected data only to those people who must use it in the performance of their job-related duties. Employees who violate our Privacy Policy will be subject to discipline, which may include ending their employment with us.
At the start of our business relationship, we will give You a copy of our current Privacy Policy.
We will also give You a copy of our current Privacy Policy once a year if You maintain a continuing business relationship with us.
We will continue to follow our Privacy Policy regarding Personal Information even when a business relationship no longer exists between us. | As used in this Privacy Notice:
Application means your request for our product or service.
Personal Financial Information means financial information such as:
Personal Health Information means health information such as:
Personal Information means information that identifies You personally and is not otherwise available to the public. It includes:
Transaction means your business dealings with us, such as:
You means an individual who has given us Personal Information in conjunction with: |
This Privacy Policy is being provided on behalf of the following affiliates of The Hartford Financial Services Group, Inc.:
1stAGChoice, Inc.; Access CoverageCorp, Inc.; Access CoverageCorp Technologies, Inc.; American Maturity Life Insurance Company; Archway 60 R, LLC; Business Management Group, Inc.; Catalyst360, LLC; Champlain Life Reinsurance Company; DMS R, LLC; Eloy R, LLC; Ersatz Corporation; First State Insurance Company; Hartford Accident and Indemnity Company; Hartford Administrative Services Company; Hartford Casualty General Agency, Inc.; Hartford Casualty Insurance Company; Hartford-Comprehensive Employee Benefit Service Company; Hartford Equity Sales Company, Inc.; Hartford Fire General Agency, Inc.; Hartford Fire Insurance Company; Hartford Funds Management Company, LLC; Hartford Funds Management Group, Inc.; Hartford HLS Series Fund II, Inc.; Hartford Insurance Company of Illinois; Hartford Insurance Company of the Midwest; Hartford Insurance Company of the Southeast; Hartford Integrated Technologies, Inc.; Hartford International Life Reassurance Corporation; Hartford Funds Distributors, LLC; Hartford Investment Management Company; Hartford Life and Accident Insurance Company; Hartford Life and Annuity Insurance Company; Hartford Life Insurance Company; Hartford Life Private Placement, LLC; Hartford Lloyd’s Corporation; Hartford Lloyd’s Insurance Company; Hartford Mezzanine Investors I, LLC; Hartford Residual Market, L.C.C.; Hartford Retirement Services, LLC; Hartford Securities Distribution Company, Inc.; Hartford Series Fund, Inc.; Hartford Specialty Insurance Services of Texas, LLC; Hartford Strategic Investments, LLC; Hartford Underwriters Insurance Company; Hartford Technology Services Company, L.L.C.; Hartford of Texas General Agency, Inc.; Hartford Underwriters General Agency, Inc.; HARTRE Company, L.C.C.; HL Investment Advisors, LLC; HLA LLC; Horizon Management Group, LLC; HRA Brokerage Services, Inc.; Lanidex Class B, LLC; M-CAP Insurance Agency, LLC; New England Insurance Company; New England Reinsurance Corporation; Nutmeg Insurance Agency, Inc.; Nutmeg Insurance Company; Pacific Insurance Company, Limited; Planco, LLC: Property and Casualty Insurance Company of Hartford; Revere R, LLC; RVR R, LLC; Sentinel Insurance Company, Ltd.; Sunstone R, LLC; Symphony R, LLC; The Evergreen Group Incorporated; The Hartford Alternative Strategies Fund; The Hartford Mutual Funds, Inc.; The Hartford Mutual Funds II, Inc.; Trumbull Flood Management, L.L.C.; Trumbull Insurance Company; Twin City Fire Insurance Company; White River Life Reinsurance Company.
HPP Revised December 2013
HARTFORD HLS FUNDS
c/o The Hartford Wealth Management - Global Annuities
P.O. Box 14293
Lexington, KY 40512-4293
HARTFORDFUNDS
hartfordfunds.com
Hartford Series Fund, Inc. is underwritten and distributed by Hartford Funds Distributors, LLC.
Hartford Series Fund, Inc. inception dates range from 1977 to date. Hartford Series Fund, Inc. is not a subsidiary of The Hartford Financial Services Group, Inc. ("The Hartford") but is underwritten, distributed by and advised by subsidiaries of The Hartford. Investments in Hartford Series Fund, Inc. are not guaranteed by The Hartford or any other entity.
This report is submitted for the general information of the shareholders of the Funds. It is not authorized for distribution unless preceded or accompanied by a current prospectus for the Funds.
Investors should carefully consider the investment objectives, risks, charges, and expenses of Hartford Funds before investing. This and other information can be found in the prospectus and summary prospectus, which can be obtained by calling 888-843-7824 (retail) or 877-836-5854 (institutional). Investors should read them carefully before they invest.
HLSAR-PD13 2-14 113550-2 Printed in U.S.A ©2013 The Hartford, Hartford, CT 06115
HARTFORDFUNDS
| HARTFORD
SMALL COMPANY HLS FUND
2013 Annual Report
|
A MESSAGE FROM THE PRESIDENT
Dear Fellow Shareholders:
Thank you for investing in Hartford HLS Funds.
Market Review
U.S. equities (as represented by the S&P 500 Index) generated their strongest year since 1997 in 2013, rising 32.39% for the year. During the fourth quarter, equities rose without looking back, pushing the S&P 500 Index and the Dow Jones Industrial Average to new all-time highs. Despite previously cheering delays to quantitative-easing tapering, the stock market received an additional boost at the end of the year following the U.S. Federal Reserve’s (Fed) announcement of a $10-billion-a-month reduction in bond purchases beginning in January.
The Fed’s decision to begin tapering its bond purchases is generally considered a vote of confidence in the recovering U.S. economy. Consumer spending has stabilized, the housing market is showing steady improvement, the unemployment rate is slowly declining and economic growth clocked in at a healthy 4.1% in the third quarter. Equities have also recovered since the market low in March 2009: The S&P 500 Index has gained 173% from the market low through December 31, 2013.
Signs of improvement are also visible outside the U.S. Europe appears to have begun its own economic recovery, and emerging markets have reversed their recent lackluster performance. Fiscal policy continues to wield significant influence in today’s economy and central banks across the globe are maintaining their accommodative stances, including the appointment of Janet Yellen, who is widely expected to continue current monetary policies, to succeed Ben Bernanke as U.S. Federal Reserve chairman.
It’s important to stay abreast of domestic and international economic developments while balancing your individual investment goals. Meeting with your financial advisor on a regular basis to examine your current investment strategy can help you determine whether you are on the right track:
| • | Is your portfolio fully diversified with an appropriate mix of stocks and bonds? |
| • | Is your portfolio incorporating both domestic and international holdings to take advantage of the global economic recovery? |
| • | Are your investments still in line with your risk tolerance and investment time horizon? |
Your financial advisor can help you choose options within our fund family to navigate today’s markets with confidence.
Thank you again for investing with Hartford HLS Funds.
James Davey
President
Hartford HLS Funds
1The S&P 500 Index is a market capitalization-weighted price index composed of 500 widely held common stocks.
2The Dow Jones Industrial Average is an unmanaged, price-weighted index of 30 of the largest, most widely held stocks traded on the New York Stock Exchange.
Hartford Small Company HLS Fund
Table of Contents
This report is prepared for the general information of contract owners and qualified retirement plan participants. It is not an offer of contracts or of qualified retirement plans. It should not be used in connection with any offer, except in conjunction with the appropriate product prospectus which contains all pertinent information including the applicable sales, administrative and other charges.
The views expressed in the Fund’s Manager Discussion under ‘‘Why did the Fund perform this way?’’ and ‘‘What is the outlook?’’ are views of the Fund’s sub-adviser and portfolio management team through the end of the period and are subject to change based on market and other conditions. The Fund’s Manager Discussion is for informational purposes only and does not represent an offer, recommendation or solicitation to buy, hold or sell any security. The specific securities identified and described, if any, do not represent all of the securities purchased or sold and you should not assume that investments in the securities identified and discussed will be profitable.
Hartford Small Company HLS Fund inception 08/09/1996
(sub-advised by Wellington Management Company, LLP)
| Investment objective – Seeks growth of capital. |
Performance Overview 12/31/03 - 12/31/13

The chart above represents the hypothetical growth of a $10,000 investment in Class IA. Growth results in classes other than Class IA will vary from what is seen above due to differences in the expenses charged to those share classes.
| Average Annual Total Returns (as of 12/31/13) |
| 1 Year | 5 Years | 10 Years | ||||
| Small Company IA | 44.38% | 20.96% | 10.56% | |||
| Small Company IB | 43.97% | 20.65% | 10.29% | |||
| Russell 2000 Growth Index | 43.30% | 22.58% | 9.41% |
PERFORMANCE DATA QUOTED REPRESENTS PAST PERFORMANCE AND DOES NOT GUARANTEE FUTURE RESULTS. The investment return and principal value of the investment will fluctuate so that investors’ shares, when redeemed, may be worth more or less than their original cost. Current performance may be lower or higher than the performance data quoted. To obtain performance data current to the most recent month-end, please visit our website at www.hartfordfunds.com.
Total returns presented above were calculated using the Fund’s net asset value available to shareholders for sale or redemption of Fund shares on December 31, 2013, which may exclude investment transactions as of this date. All share class returns assume the reinvestment of all distributions at net asset value and the deduction of all fund expenses.
Russell 2000 Growth Index is an unmanaged index of those Russell 2000 Index growth companies with higher price-to-book ratios and higher forecasted growth values. (The Russell 2000 Index is a broad-based unmanaged index comprised of 2,000 of the smallest U.S.-domiciled company common stocks (on the basis of capitalization) that are traded in the United States on the New York Stock Exchange, NYSE MKT LLC and Nasdaq.)
You cannot invest directly in an index.
As of the Fund's current prospectus dated May 1, 2013, the total annual operating expense ratios for Class IA and Class IB were 0.72% and 0.97%, respectively. Actual expenses may be higher. Please see the accompanying Financial Highlights for expense ratios for the year ended December 31, 2013.
For additional information regarding the prior performance history of the Fund, please see the section entitled “Performance Notes” in the Fund’s prospectus.
The chart and table do not reflect the deductions of taxes, sales charges or other fees which may be applied at the variable life insurance, variable annuity or qualified retirement plan product level. Any such additional sales charges or other fees or expenses would lower the contract’s or plan’s performance.
All investments are subject to risk including the possible loss of principal. For a discussion of the Fund’s risks, please see the Main Risks section of this report. For more detailed information on the risks associated with an investment in the Fund, please see the prospectus.
| 2 |
Hartford Small Company HLS Fund
| Manager Discussion |
| December 31, 2013 (Unaudited) |
| Portfolio Managers | ||
| Steven C. Angeli, CFA | Stephen C. Mortimer | Jamie A. Rome, CFA |
| Senior Vice President and Equity Portfolio Manager | Senior Vice President and Equity Portfolio Manager | Senior Vice President and Equity Portfolio Manager |
| Mario E. Abularach, CFA | Mammen Chally, CFA | |
| Senior Vice President and Equity Research Analyst | Vice President and Equity Portfolio Manager | |
How did the Fund perform?
The Class IA shares of the Hartford Small Company HLS Fund returned 44.38% for the twelve-month period ended December 31, 2013, outperforming the Fund’s benchmark, the Russell 2000 Growth Index, which returned 43.30% for the same period. The Fund also outperformed the 42.29% average return of the Variable Products-Underlying Funds Lipper Small-Cap Growth Funds peer group, a group of funds with investment strategies similar to those of the Fund.
Why did the Fund perform this way?
U.S. small cap growth equities reached another all-time high in December and finished 2013 with a gain of 43.3%%, as measured by the Russell 2000 Growth Index. The rally in U.S. equities began on the first trading day of the year after a last-minute compromise by the U.S. Congress averted the fiscal cliff. Optimism surrounding the fiscal reprieve was furthered during the first quarter by better-than-expected corporate earnings, a robust housing market, and a steadily improving employment picture. Solid gains in April and the first part of May paused following comments by U.S. Federal Reserve (Fed) Chairman Ben Bernanke that suggested the Fed might begin to slow quantitative easing sooner than investors anticipated. Nonetheless, equities resumed their ascent in the third quarter as the surprising “no taper” decision by the Federal Open Market Committee eased near-term concerns about rapidly rising interest rates derailing the recovery. Additionally, accommodative rhetoric from the European Central Bank, along with encouraging data in China and further evidence of a European economic recovery, contributed to a broad-based global equity rally that extended through the end of the year. In December, the year ended with an optimistic tone as investors cheered the elimination of two market overhangs: the timing of Fed tapering and the threat of another U.S. government shutdown in early 2014.
Small cap stocks (+38.2%) outperformed large cap stocks (+32.4%) during the period, as measured by the Russell 2000 and S&P 500 Indices, respectively. Value stocks (+32.7%) underperformed growth stocks (+34.2%) during the period, as measured by the Russell 3000 Value and Russell 3000 Growth Indices, respectively. All ten sectors in the Russell 2000 Growth Index had positive returns during the period. Health Care (+51.5%), Consumer Staples (+48.4%), and Telecommunication Services (+45.9%) sectors performed best, while Utilities (11.5%) and Materials (27.4%) lagged on a relative basis.
Stock selection was the main driver of relative outperformance versus the benchmark, primarily in the Health Care, Industrials, and Materials sectors. This was partially offset by weak selection in the Information Technology, Consumer Staples, and Energy sectors. Sector allocation, which is the result of bottom-up stock selection, also contributed to relative returns, primarily due to overweights to the Information Technology and Consumer Discretionary sectors. A modest cash position in an upward trending equity market environment detracted from relative returns in the period.
Top contributors to relative and absolute performance during the period included WageWorks (Industrials), NPS Pharmaceuticals (Health Care), and KapStone Paper (Materials). Shares of WageWorks, an on-demand provider of tax-advantaged programs for consumer-directed health, commuter and other employee spending account benefits, outperformed after the company posted better-than-expected quarterly revenue and earnings and management raised its 2013 revenue and earnings guidance. Strong performance in the commuter benefits division supported higher growth in revenue. Shares of NPS Pharmaceutical, a U.S.-based drug developer focused on creating and marketing “orphan drugs” for the treatment of rare diseases, rose during the period due to favorable earnings on the back of a strong launch of its drug Gattex developed for the treatment of short bowel syndrome. Packaging and containerboard manufacturer KapStone Paper shares climbed after the company announced it would purchase Longview Fiber Paper and Packaging.
Stocks that detracted the most from relative returns during the period included Angie’s List (Information Technology), VeriFone Systems (Information Technology), and Elizabeth Arden (Consumer Discretionary). Shares of Angie’s List, an internet-based home services information provider, underperformed during the period after the company released weak earnings results due to controversial discounting of membership fees. Shares of VeriFone Systems, an electronic payment solution provider, fell sharply after it was announced
| 3 |
Hartford Small Company HLS Fund
| Manager Discussion – (continued) |
| December 31, 2013 (Unaudited) |
that the company was being investigated for violations of federal securities laws. Shares of Elizabeth Arden, a beauty products company, declined after management issued disappointing earnings guidance for the fiscal second quarter. BroadSoft (Information Technology) also detracted from absolute returns during the period.
Derivatives are not used in a significant manner in this Fund and did not have a material impact on performance during the period.
What is the outlook?
We continue to challenge ourselves to discover emerging growth companies and to be opportunistic to uncover re-emerging growth companies. We believe the Fund is well positioned to succeed in an improving economy. We continue to focus the Fund on high-conviction ideas and maintain broad exposure across industries.
As a result of our bottom-up, stock-by-stock investment decisions, the Fund ended the period most overweight to the Information Technology and Industrials sectors relative to the Russell 2000 Growth Index. The Fund ended the period most underweight to the Health Care, Materials, and Financials sectors.
| Diversification by Sector | ||||
| as of December 31, 2013 | ||||
| Sector | Percentage of Net Assets | |||
| Equity Securities | ||||
| Consumer Discretionary | 16.8 | % | ||
| Consumer Staples | 3.0 | |||
| Energy | 3.5 | |||
| Financials | 5.7 | |||
| Health Care | 16.8 | |||
| Industrials | 20.7 | |||
| Information Technology | 30.5 | |||
| Materials | 2.0 | |||
| Utilities | 0.1 | |||
| Total | 99.1 | % | ||
| Short-Term Investments | 0.9 | |||
| Other Assets and Liabilities | 0.0 | |||
| Total | 100.0 | % | ||
A sector may be comprised of several industries. For Fund compliance purposes, the Fund may not use the same classification system and these sector classifications are used for reporting ease.
| 4 |
Hartford Small Company HLS Fund
| Schedule of Investments |
| December 31, 2013 |
| (000’s Omitted) |
| Shares or Principal Amount | Market Value ╪ | |||||||
| COMMON STOCKS - 98.7% | ||||||||
| Automobiles and Components - 1.2% | ||||||||
| 83 | Dana Holding Corp. | $ | 1,628 | |||||
| 12 | Standard Motor Products, Inc. | 456 | ||||||
| 275 | Tenneco Automotive, Inc. ● | 15,537 | ||||||
| 2 | Tesla Motors, Inc. ● | 261 | ||||||
| 17,882 | ||||||||
| Banks - 1.2% | ||||||||
| 106 | EverBank Financial Corp. | 1,950 | ||||||
| 62 | First Merchants Corp. | 1,401 | ||||||
| 61 | Flushing Financial Corp. | 1,265 | ||||||
| 19 | Home Loan Servicing Solutions Ltd. | 425 | ||||||
| 256 | PacWest Bancorp | 10,799 | ||||||
| 61 | Umpqua Holdings Corp. | 1,166 | ||||||
| 30 | Wintrust Financial Corp. | 1,399 | ||||||
| 18,405 | ||||||||
| Capital Goods - 12.6% | ||||||||
| 33 | A.O. Smith Corp. | 1,796 | ||||||
| 34 | AAON, Inc. | 1,089 | ||||||
| 90 | Acuity Brands, Inc. | 9,827 | ||||||
| 5 | AGCO Corp. | 320 | ||||||
| 570 | Altra Industrial Motion Corp. | 19,490 | ||||||
| 352 | Applied Industrial Technologies, Inc. | 17,290 | ||||||
| 274 | Armstrong World Industries, Inc. ● | 15,793 | ||||||
| 39 | Astronics Corp. ● | 1,985 | ||||||
| 2 | Astronics Corp. Class B ● | 88 | ||||||
| 32 | AZZ, Inc. | 1,578 | ||||||
| 16 | Belden, Inc. | 1,117 | ||||||
| 20 | CAI International, Inc. ● | 462 | ||||||
| 6 | Carlisle Cos., Inc. | 438 | ||||||
| 23 | Chart Industries, Inc. ● | 2,159 | ||||||
| 6 | Crane Co. | 434 | ||||||
| 433 | DigitalGlobe, Inc. ● | 17,824 | ||||||
| 10 | EMCOR Group, Inc. | 443 | ||||||
| 12 | Esterline Technologies Corp. ● | 1,218 | ||||||
| 8 | Franklin Electric Co., Inc. | 362 | ||||||
| 230 | Generac Holdings, Inc. | 13,053 | ||||||
| 87 | GrafTech International Ltd. ● | 973 | ||||||
| 15 | H & E Equipment Services, Inc. ● | 447 | ||||||
| 431 | HD Supply Holdings, Inc. ● | 10,339 | ||||||
| 35 | Heico Corp. | 2,054 | ||||||
| 14 | John Bean Technologies Corp. | 419 | ||||||
| 22 | Lennox International, Inc. | 1,882 | ||||||
| 15 | Lindsay Corp. | 1,222 | ||||||
| 24 | Luxfer Holdings plc | 509 | ||||||
| 250 | Moog, Inc. Class A ● | 16,967 | ||||||
| 397 | Owens Corning, Inc. ● | 16,179 | ||||||
| 27 | Sun Hydraulics Corp. | 1,122 | ||||||
| 142 | Teledyne Technologies, Inc. ● | 13,071 | ||||||
| 9 | Textainer Group Holdings Ltd. | 374 | ||||||
| 29 | Titan International, Inc. | 529 | ||||||
| 28 | Trimas Corp. ● | 1,099 | ||||||
| 170 | WESCO International, Inc. ● | 15,477 | ||||||
| 189,429 | ||||||||
| Commercial and Professional Services - 3.6% | ||||||||
| 161 | Clean Harbors, Inc. ● | 9,672 | ||||||
| 41 | Deluxe Corp. | 2,160 | ||||||
| 26 | Exponent, Inc. | 2,048 | ||||||
| 18 | Gategroup Holding AG | 475 | ||||||
| 49 | GP Strategies Corp. ● | 1,452 | ||||||
| 250 | On Assignment, Inc. ● | 8,744 | ||||||
| 31 | Performant Financial Corp. ● | 322 | ||||||
| 34 | RPX Corp. ● | 568 | ||||||
| 487 | TrueBlue, Inc. ● | 12,560 | ||||||
| 261 | Wageworks, Inc. ● | 15,514 | ||||||
| 53,515 | ||||||||
| Consumer Durables and Apparel - 4.4% | ||||||||
| 32 | Arctic Cat, Inc. | 1,827 | ||||||
| 75 | Fifth & Pacific Cos., Inc. ● | 2,392 | ||||||
| 16 | Leapfrog Enterprises, Inc. ● | 130 | ||||||
| 28 | LGI Homes, Inc. ● | 496 | ||||||
| 19 | M/I Schottenstein Homes, Inc. ● | 473 | ||||||
| 3,363 | Samsonite International S.A. | 10,258 | ||||||
| 414 | Skechers USA, Inc. Class A ● | 13,713 | ||||||
| 1,671 | Standard-Pacific Corp. ● | 15,124 | ||||||
| 228 | Steven Madden Ltd. ● | 8,325 | ||||||
| 532 | Taylor Morrison Home Corp. ● | 11,936 | ||||||
| 29 | Vince Holding Corp. ● | 881 | ||||||
| 11 | William Lyon Homes ● | 244 | ||||||
| 65,799 | ||||||||
| Consumer Services - 3.2% | ||||||||
| 696 | Bloomin' Brands, Inc. ● | 16,707 | ||||||
| 36 | Brinker International, Inc. | 1,676 | ||||||
| 78 | Buffalo Wild Wings, Inc. ● | 11,537 | ||||||
| 82 | Del Frisco's Restaurant Group, Inc. ● | 1,944 | ||||||
| 108 | Ignite Restaurant Group, Inc. ● | 1,355 | ||||||
| 38 | Marriott Vacations Worldwide Corp. ● | 2,017 | ||||||
| 61 | Panera Bread Co. Class A ● | 10,844 | ||||||
| 39 | Sotheby's Holdings | 2,053 | ||||||
| 2 | Steiner Leisure Ltd. ● | 113 | ||||||
| 48,246 | ||||||||
| Diversified Financials - 2.9% | ||||||||
| 61 | Artisan Partners Asset Management, Inc. | 3,989 | ||||||
| 75 | DFC Global Corp. ● | 858 | ||||||
| 43 | Fifth Street Finance Corp. | 394 | ||||||
| 220 | Financial Engines, Inc. | 15,279 | ||||||
| 45 | HFF, Inc. ● | 1,217 | ||||||
| 30 | Marcus & Millichap, Inc. ● | 447 | ||||||
| 3 | Marlin Business Services Corp. | 71 | ||||||
| 18 | Portfolio Recovery Associates, Inc. ● | 939 | ||||||
| 13 | Regional Management Corp. ● | 448 | ||||||
| 12 | Springleaf Holdings, Inc. ● | 306 | ||||||
| 54 | Virtus Investment Partners, Inc. ● | 10,821 | ||||||
| 495 | Wisdomtree Investment, Inc. ● | 8,763 | ||||||
| 43,532 | ||||||||
| Energy - 3.5% | ||||||||
| 184 | Athlon Energy, Inc. ● | 5,580 | ||||||
| 342 | BPZ Resources, Inc. ● | 622 | ||||||
| 19 | C&J Energy Services, Inc. ● | 437 | ||||||
| 201 | Diamondback Energy, Inc. ● | 10,622 | ||||||
| 58 | Energy XXI (Bermuda) Ltd. | 1,582 | ||||||
| 49 | EPL Oil & Gas, Inc. ● | 1,383 | ||||||
| 107 | Jones Energy, Inc. ● | 1,550 | ||||||
| 121 | Karoon Gas Australia Ltd. ● | 470 | ||||||
| 44 | PBF Energy, Inc. | 1,397 | ||||||
| 92 | PDC Energy, Inc. ● | 4,899 | ||||||
| 147 | Rex Energy Corp. ● | 2,901 | ||||||
| 258 | Rosetta Resources, Inc. ● | 12,375 | ||||||
| 119 | SemGroup Corp. | 7,790 | ||||||
The accompanying notes are an integral part of these financial statements.
| 5 |
Hartford Small Company HLS Fund
| Schedule of Investments – (continued) |
| December 31, 2013 |
| (000’s Omitted) |
| Shares or Principal Amount | Market Value ╪ | |||||||
| COMMON STOCKS - 98.7% - (continued) | ||||||||
| Energy - 3.5% - (continued) | ||||||||
| 40 | Synergy Resources Corp. ● | $ | 369 | |||||
| 51,977 | ||||||||
| Food and Staples Retailing - 0.6% | ||||||||
| 109 | Casey's General Stores, Inc. | 7,643 | ||||||
| 34 | Natural Grocers by Vitamin Cottage, Inc. ● | 1,429 | ||||||
| 9,072 | ||||||||
| Food, Beverage and Tobacco - 1.4% | ||||||||
| 19 | Alliance Grain Traders, Inc. | 301 | ||||||
| 74 | Darling International, Inc. ● | 1,537 | ||||||
| 20 | TreeHouse Foods, Inc. ● | 1,369 | ||||||
| 767 | WhiteWave Foods Co. Class A ● | 17,592 | ||||||
| 20,799 | ||||||||
| Health Care Equipment and Services - 7.7% | ||||||||
| 244 | Acadia Healthcare Co., Inc. ● | 11,572 | ||||||
| 9 | AmSurg Corp. ● | 390 | ||||||
| 4 | Atrion Corp. | 1,246 | ||||||
| 37 | Corvel Corp. ● | 1,741 | ||||||
| 26 | Cyberonics, Inc. ● | 1,681 | ||||||
| 461 | Dexcom, Inc. ● | 16,333 | ||||||
| 11 | Ensign Group, Inc. | 474 | ||||||
| 349 | Envision Healthcare Holdings ● | 12,389 | ||||||
| 320 | Examworks Group, Inc. ● | 9,550 | ||||||
| 121 | Globus Medical, Inc. ● | 2,435 | ||||||
| 11 | Greatbatch, Inc. ● | 504 | ||||||
| 67 | HealthSouth Corp. | 2,239 | ||||||
| 117 | Heartware International, Inc. ● | 10,950 | ||||||
| 29 | ICU Medical, Inc. ● | 1,858 | ||||||
| 331 | Insulet Corp. ● | 12,278 | ||||||
| 8 | MEDNAX, Inc. ● | 432 | ||||||
| 19 | Natus Medical, Inc. ● | 423 | ||||||
| 9 | Omnicell, Inc. ● | 240 | ||||||
| 12 | Photomedex, Inc. ● | 159 | ||||||
| 303 | Team Health Holdings ● | 13,823 | ||||||
| 49 | U.S. Physical Therapy, Inc. | 1,713 | ||||||
| 82 | Vascular Solutions, Inc. ● | 1,896 | ||||||
| 147 | Wellcare Health Plans, Inc. ● | 10,335 | ||||||
| 114,661 | ||||||||
| Household and Personal Products - 1.0% | ||||||||
| 39 | Elizabeth Arden, Inc. ● | 1,383 | ||||||
| 57 | Prestige Brands Holdings, Inc. ● | 2,036 | ||||||
| 170 | Spectrum Brands Holdings, Inc. | 12,001 | ||||||
| 15,420 | ||||||||
| Insurance - 0.2% | ||||||||
| 35 | Amerisafe, Inc. | 1,465 | ||||||
| 43 | Partnership Assurance Group ● | 208 | ||||||
| 29 | Protective Life Corp. | 1,465 | ||||||
| 3,138 | ||||||||
| Materials - 2.0% | ||||||||
| 8 | Advanced Emissions Solutions, Inc. ● | 456 | ||||||
| 19 | Cabot Corp. | 1,002 | ||||||
| 200 | Graphic Packaging Holding Co. ● | 1,920 | ||||||
| 144 | Headwaters, Inc. ● | 1,406 | ||||||
| 9 | Innospec, Inc. | 411 | ||||||
| 299 | KapStone Paper & Packaging Corp. ● | 16,706 | ||||||
| 11 | LSB Industries, Inc. ● | 447 | ||||||
| 22 | Myers Industries, Inc. | 467 | ||||||
| 64 | New Gold, Inc. ● | 337 | ||||||
| 36 | Olin Corp. | 1,043 | ||||||
| 116 | Omnova Solutions, Inc. ● | 1,061 | ||||||
| 73 | PolyOne Corp. | 2,586 | ||||||
| 441 | Romarco Minerals, Inc. ● | 156 | ||||||
| 31 | Silgan Holdings, Inc. | 1,479 | ||||||
| 29,477 | ||||||||
| Media - 2.3% | ||||||||
| 447 | Imax Corp. ● | 13,164 | ||||||
| 284 | Pandora Media, Inc. ● | 7,558 | ||||||
| 171 | Shutterstock, Inc. ● | 14,264 | ||||||
| 34,986 | ||||||||
| Pharmaceuticals, Biotechnology and Life Sciences - 9.1% | ||||||||
| 35 | Acorda Therapeutics, Inc. ● | 1,017 | ||||||
| 53 | Agios Pharmaceuticals, Inc. ● | 1,275 | ||||||
| 45 | Albany Molecular Research, Inc. ● | 451 | ||||||
| 43 | Alkermes plc ● | 1,760 | ||||||
| 126 | Alnylam Pharmaceuticals, Inc. ● | 8,095 | ||||||
| 88 | Arena Pharmaceuticals, Inc. ● | 514 | ||||||
| 82 | Bruker Corp. ● | 1,629 | ||||||
| 125 | Cadence Pharmaceuticals, Inc. ● | 1,134 | ||||||
| 173 | Covance, Inc. ● | 15,239 | ||||||
| 159 | Cubist Pharmaceuticals, Inc. ● | 10,960 | ||||||
| 62 | Durata Therapeutics, Inc. ● | 793 | ||||||
| 1,137 | Exelixis, Inc. ● | 6,967 | ||||||
| 13 | Foundation Medicine, Inc. ● | 317 | ||||||
| 237 | Hyperion Therapeutics, Inc. ● | 4,785 | ||||||
| 434 | Immunogen, Inc. ● | 6,373 | ||||||
| 40 | Infinity Pharmaceuticals, Inc. ● | 554 | ||||||
| 488 | Ironwood Pharmaceuticals, Inc. ● | 5,668 | ||||||
| 301 | Medicines Co. ● | 11,612 | ||||||
| 384 | NPS Pharmaceuticals, Inc. ● | 11,656 | ||||||
| 140 | Pacira Pharmaceuticals, Inc. ● | 8,024 | ||||||
| 39 | PAREXEL International Corp. ● | 1,747 | ||||||
| 330 | Portola Pharmaceuticals, Inc. ● | 8,503 | ||||||
| 12 | Puma Biotechnology, Inc. ● | 1,246 | ||||||
| 135 | Salix Pharmaceuticals Ltd. ● | 12,150 | ||||||
| 178 | Seattle Genetics, Inc. ● | 7,102 | ||||||
| 193 | Tesaro, Inc. ● | 5,437 | ||||||
| 153 | Xenoport, Inc. ● | 881 | ||||||
| 135,889 | ||||||||
| Real Estate - 1.2% | ||||||||
| 30 | Altisource Residential Corp. | 902 | ||||||
| 59 | Arbor Realty Trust | 394 | ||||||
| 43 | Armada Hoffler Properties, Inc. | 397 | ||||||
| 36 | Coresite Realty Corp. REIT | 1,145 | ||||||
| 88 | Glimcher Realty Trust REIT | 827 | ||||||
| 30 | Medical Properties Trust, Inc. REIT | 372 | ||||||
| 13 | Pebblebrook Hotel Trust REIT | 406 | ||||||
| 53 | Ramco-Gershenson Properties Trust REIT | 831 | ||||||
| 45 | Summit Hotel Properties, Inc. REIT | 406 | ||||||
| 105 | Sunstone Hotel Investors, Inc. REIT | 1,402 | ||||||
| 18 | Whitestone REIT | 241 | ||||||
| 135 | Zillow, Inc. ● | 11,014 | ||||||
| 18,337 | ||||||||
| Retailing - 5.7% | ||||||||
| 5,016 | Allstar Co. ⌂●† | 10,884 | ||||||
| 15 | Cato Corp. | 484 | ||||||
| 29 | Core-Mark Holding Co., Inc. | 2,195 | ||||||
| 248 | Debenhams plc | 300 | ||||||
| 32 | DSW, Inc. | 1,381 | ||||||
| 17 | Finish Line (The), Inc. | 476 | ||||||
The accompanying notes are an integral part of these financial statements.
| 6 |
| Shares or Principal Amount | Market Value ╪ | |||||||
COMMON STOCKS - 98.7% - (continued) | ||||||||
| Retailing - 5.7% - (continued) | ||||||||
| 187 | Five Below, Inc. ● | $ | 8,065 | |||||
| 21 | Group 1 Automotive, Inc. | 1,464 | ||||||
| 283 | HSN, Inc. | 17,643 | ||||||
| 126 | Lumber Liquidators Holdings, Inc. ● | 12,914 | ||||||
| 649 | Pier 1 Imports, Inc. | 14,979 | ||||||
| 6 | Shoe Carnival, Inc. | 182 | ||||||
| 105 | Tory Burch LLC ⌂† | 8,113 | ||||||
| 357 | Tuesday Morning Corp. ● | 5,691 | ||||||
| 84,771 | ||||||||
| Semiconductors and Semiconductor Equipment - 1.7% | ||||||||
| 177 | First Solar, Inc. ● | 9,689 | ||||||
| 126 | GT Advanced Technologies, Inc. ● | 1,097 | ||||||
| 34 | Inphi Corp. ● | 437 | ||||||
| 20 | Integrated Silicon Solution, Inc. ● | 238 | ||||||
| 1,793 | Lattice Semiconductor Corp. ● | 9,881 | ||||||
| 62 | Nanometrics, Inc. ● | 1,183 | ||||||
| 186 | SunEdison, Inc. ● | 2,422 | ||||||
| 44 | Ultratech Stepper, Inc. ● | 1,289 | ||||||
| 26,236 | ||||||||
| Software and Services - 26.9% | ||||||||
| 55 | Actuate Corp. ● | 420 | ||||||
| 281 | Acxiom Corp. ● | 10,385 | ||||||
| 639 | Angie's List, Inc. ● | 9,684 | ||||||
| 52 | Aspen Technology, Inc. ● | 2,165 | ||||||
| 898 | Bankrate, Inc. ● | 16,110 | ||||||
| 30 | Blackhawk Network Holdings, Inc. ● | 749 | ||||||
| 871 | Cadence Design Systems, Inc. ● | 12,207 | ||||||
| 81 | Carbonite, Inc. ● | 957 | ||||||
| 34 | Cass Information Systems, Inc. | 2,321 | ||||||
| 160 | Concur Technologies, Inc. ● | 16,496 | ||||||
| 500 | Constant Contact, Inc. ● | 15,532 | ||||||
| 220 | Cornerstone OnDemand, Inc. ● | 11,758 | ||||||
| 92 | CoStar Group, Inc. ● | 16,963 | ||||||
| 15 | CSG Systems International, Inc. | 432 | ||||||
| 27 | Cvent, Inc. ● | 975 | ||||||
| 337 | DealerTrack Technologies, Inc. ● | 16,193 | ||||||
| 167 | Demandware, Inc. ● | 10,719 | ||||||
| 22 | Digital River, Inc. ● | 409 | ||||||
| 38 | Ellie Mae, Inc. ● | 1,020 | ||||||
| 149 | Envestnet, Inc. ● | 5,992 | ||||||
| 9 | ePlus, Inc. ● | 512 | ||||||
| 58 | Exlservice Holdings, Inc. ● | 1,606 | ||||||
| 38 | Fair Isaac, Inc. | 2,411 | ||||||
| 570 | Fleetmatics Group Ltd. ● | 24,648 | ||||||
| 239 | Global Payments, Inc. | 15,517 | ||||||
| 376 | Heartland Payment Systems, Inc. | 18,754 | ||||||
| 115 | Higher One Holdings, Inc. ● | 1,119 | ||||||
| 25 | Imperva, Inc. ● | 1,223 | ||||||
| 55 | j2 Global, Inc. | 2,757 | ||||||
| 45 | Kofax, Ltd. ● | 331 | ||||||
| 21 | Manhattan Associates, Inc. ● | 2,484 | ||||||
| 208 | MAXIMUS, Inc. | 9,164 | ||||||
| 121 | Mitek Systems, Inc. ● | 717 | ||||||
| 60 | Model N, Inc. ● | 702 | ||||||
| 45 | Netscout Systems, Inc. ● | 1,337 | ||||||
| 29 | Nuance Communications, Inc. ● | 445 | ||||||
| 163 | Opentable, Inc. ● | 12,956 | ||||||
| 465 | PTC, Inc. ● | 16,452 | ||||||
| 125 | Sapient Corp. ● | 2,169 | ||||||
| 645 | ServiceSource International LLC ● | 5,408 | ||||||
| 20 | Silver Spring Networks, Inc. ● | 425 | ||||||
| 162 | Solera Holdings, Inc. | 11,494 | ||||||
| 141 | Tableau Software, Inc. ● | 9,702 | ||||||
| 270 | Trulia, Inc. ● | 9,508 | ||||||
| 122 | Tyler Corp. ● | 12,505 | ||||||
| 389 | Verint Systems, Inc. ● | 16,700 | ||||||
| 260 | Virtusa Corp. ● | 9,921 | ||||||
| 773 | Web.com Group, Inc. ● | 24,579 | ||||||
| 32 | WebMD Health Corp. ● | 1,271 | ||||||
| 157 | WEX, Inc. ● | 15,530 | ||||||
| 268 | Wix.com Ltd. ● | 7,195 | ||||||
| 512 | WNS Holdings Ltd. ADR ● | 11,219 | ||||||
| 402,248 | ||||||||
| Technology Hardware and Equipment - 1.9% | ||||||||
| 20 | Arris Group, Inc. ● | 483 | ||||||
| 46 | CDW Corp. of Delaware | 1,078 | ||||||
| 9 | Coherent, Inc. ● | 701 | ||||||
| 36 | Emulex Corp. ● | 258 | ||||||
| 22 | FEI Co. | 1,965 | ||||||
| 45 | Mitel Networks Corp. ● | 453 | ||||||
| 151 | Mobileye N.V. ⌂●† | 5,876 | ||||||
| 14 | Netgear, Inc. ● | 448 | ||||||
| 51 | Oplink Communications, Inc. ● | 952 | ||||||
| 193 | Palo Alto Networks, Inc. ● | 11,105 | ||||||
| 144 | ParkerVision, Inc. ● | 655 | ||||||
| 46 | Plantronics, Inc. | 2,132 | ||||||
| 33 | Polycom, Inc. ● | 372 | ||||||
| 37 | Ubiquiti Networks, Inc. ● | 1,696 | ||||||
| 28,174 | ||||||||
| Transportation - 4.3% | ||||||||
| 338 | Avis Budget Group, Inc. ● | 13,656 | ||||||
| 47 | Celadon Group, Inc. | 923 | ||||||
| 336 | Con-way, Inc. | 13,355 | ||||||
| 51 | Marten Transport Ltd. | 1,038 | ||||||
| 287 | Old Dominion Freight Line, Inc. ● | 15,202 | ||||||
| 402 | Spirit Airlines, Inc. ● | 18,253 | ||||||
| 1,069 | Telogis, Inc. ⌂●† | 1,907 | ||||||
| 64,334 | ||||||||
| Utilities - 0.1% | ||||||||
| 7 | ALLETE, Inc. | 369 | ||||||
| 14 | Pattern Energy Group, Inc. | 431 | ||||||
| 9 | Westar Energy, Inc. | 302 | ||||||
| 1,102 | ||||||||
| Total common stocks | ||||||||
| (cost $1,123,379) | $ | 1,477,429 | ||||||
PREFERRED STOCKS - 0.2% | ||||||||
| Transportation - 0.2% | ||||||||
| 1,456 | Telogis, Inc. ⌂●† | $ | 2,885 | |||||
| Total preferred stocks | ||||||||
| (cost $3,206) | $ | 2,885 | ||||||
The accompanying notes are an integral part of these financial statements.
| 7 |
| Hartford Small Company HLS Fund |
| Schedule of Investments – (continued) |
| December 31, 2013 |
| (000’s Omitted) |
| Shares or Principal Amount | Market Value ╪ | |||||||||||
| EXCHANGE TRADED FUNDS - 0.2% | ||||||||||||
| Other Investment Pools and Funds - 0.2% | ||||||||||||
| 26 | iShares Russell 2000 Growth Index Fund | $ | 3,503 | |||||||||
| Total exchange traded funds | ||||||||||||
| (cost $3,485) | $ | 3,503 | ||||||||||
| Total long-term investments | ||||||||||||
| (cost $1,130,070) | $ | 1,483,817 | ||||||||||
| SHORT-TERM INVESTMENTS - 0.9% | ||||||||||||
| Repurchase Agreements - 0.9% | ||||||||||||
| Bank of America Merrill Lynch TriParty Repurchase Agreement (maturing on 01/02/2014 in the amount of $646, collateralized by GNMA 4.00%, 2043, value of $659) | ||||||||||||
| $ | 646 | 0.005%, 12/31/2013 | $ | 646 | ||||||||
| Bank of Montreal TriParty Repurchase Agreement (maturing on 01/02/2014 in the amount of $620, collateralized by FNMA 1.58% - 4.50%, 2020 - 2043, U.S. Treasury Note 0.25% - 4.00%, 2015 - 2020, value of $633) | ||||||||||||
| 620 | 0.01%, 12/31/2013 | 620 | ||||||||||
| Bank of Montreal TriParty Repurchase Agreement (maturing on 01/02/2014 in the amount of $2,197, collateralized by FHLMC 3.00% - 5.00%, 2019 - 2043, FNMA 0.76% - 6.00%, 2016 - 2043, GNMA 1.50% - 5.25%, 2028 - 2043, value of $2,241) | ||||||||||||
| 2,197 | 0.02%, 12/31/2013 | 2,197 | ||||||||||
| Barclays Capital TriParty Repurchase Agreement (maturing on 01/02/2014 in the amount of $1,982, collateralized by U.S. Treasury Note 0.50% - 2.25%, 2017, value of $2,021) | ||||||||||||
| 1,982 | 0.01%, 12/31/2013 | 1,982 | ||||||||||
| Citigroup Global Markets, Inc. TriParty Repurchase Agreement (maturing on 01/02/2014 in the amount of $3,566, collateralized by U.S. Treasury Bond 3.88% - 8.13%, 2021 - 2040, U.S. Treasury Note 0.25% - 3.38%, 2014 - 2020, value of $3,637) | ||||||||||||
| 3,566 | 0.01%, 12/31/2013 | 3,566 | ||||||||||
| RBS Securities, Inc. TriParty Repurchase Agreement (maturing on 01/02/2014 in the amount of $1,159, collateralized by U.S. Treasury Note 0.25% - 1.00%, 2015 - 2017, value of $1,182) | ||||||||||||
| 1,159 | 0.01%, 12/31/2013 | 1,159 | ||||||||||
| TD Securities TriParty Repurchase Agreement (maturing on 01/02/2014 in the amount of $2,782, collateralized by FFCB 0.20% - 0.50%, 2015 - 2016, FHLMC 0.38% - 5.25%, 2014 - 2042, FNMA 0.50% - 7.13%, 2014 - 2043, value of $2,837) | ||||||||||||
| 2,781 | 0.01%, 12/31/2013 | 2,781 | ||||||||||
| UBS Securities, Inc. Repurchase Agreement (maturing on 01/02/2014 in the amount of $24, collateralized by U.S. Treasury Note 2.13%, 2015, value of $24) | ||||||||||||
| 24 | 0.01%, 12/31/2013 | 24 | ||||||||||
| 12,975 | ||||||||||||
| Total short-term investments | ||||||||||||
| (cost $12,975) | $ | 12,975 | ||||||||||
| Total investments | ||||||||||||
| (cost $1,143,045) ▲ | 100.0 | % | $ | 1,496,792 | ||||||||
| Other assets and liabilities | — | % | (180 | ) | ||||||||
| Total net assets | 100.0 | % | $ | 1,496,612 | ||||||||
The accompanying notes are an integral part of these financial statements.
| 8 |
| Note: | Percentage of investments as shown is the ratio of the total market value to total net assets. |
Prices of foreign equities that are principally traded on certain foreign markets may be adjusted daily pursuant to a fair value pricing service approved by the Board of Directors in order to reflect an adjustment for factors occurring after the close of certain foreign markets but before the close of the New York Stock Exchange.
| ▲ | At December 31, 2013, the cost of securities for federal income tax purposes was $1,146,607 and the aggregate gross unrealized appreciation and depreciation based on that cost were: |
| Unrealized Appreciation | $ | 373,627 | ||
| Unrealized Depreciation | (23,442 | ) | ||
| Net Unrealized Appreciation | $ | 350,185 |
| † | These securities were valued in good faith at fair value as determined under policies and procedures established by and under the supervision of the Company's Board of Directors. At December 31, 2013, the aggregate value of these securities was $29,665, which represents 2.0% of total net assets. This amount excludes securities that are principally traded in certain foreign markets and whose prices are adjusted pursuant to a third party pricing service methodology approved by the Board of Directors. |
| ● | Non-income producing. |
| ⌂ | The following securities are considered illiquid. Illiquid securities are often purchased in private placement transactions, are often not registered under the Securities Act of 1933 and may have contractual restrictions on resale. A security may also be considered illiquid if the security lacks a readily available market or if its valuation has not changed for a certain period of time. |
| Period Acquired | Shares/ Par | Security | Cost Basis | |||||||
| 08/2011 | 5,016 | Allstar Co. | $ | 2,964 | ||||||
| 08/2013 | 151 | Mobileye N.V. | 5,273 | |||||||
| 09/2013 | 1,069 | Telogis, Inc. | 2,119 | |||||||
| 09/2013 | 1,456 | Telogis, Inc. Preferred | 3,206 | |||||||
| 11/2013 | 105 | Tory Burch LLC | 8,228 | |||||||
At December 31, 2013, the aggregate value of these securities was $29,665, which represents 2.0% of total net assets.
Foreign Currency Contracts Outstanding at December 31, 2013
| Currency | Buy / Sell | Delivery Date | Counterparty | Contract Amount | Market Value ╪ | Unrealized Appreciation/ (Depreciation) | ||||||||||||
| CAD | Buy | 01/02/2014 | BOA | $ | 163 | $ | 164 | $ | 1 | |||||||||
| CAD | Sell | 01/02/2014 | SSG | 33 | 33 | – | ||||||||||||
| $ | 1 | |||||||||||||||||
| ╪ | See Significant Accounting Policies of accompanying Notes to Financial Statements regarding valuation of securities. |
| GLOSSARY: (abbreviations used in preceding Schedule of Investments) | |
| Counterparty Abbreviations: | |
| BOA | Banc of America Securities LLC |
| SSG | State Street Global Markets LLC |
| Currency Abbreviations: | |
| CAD | Canadian Dollar |
| Other Abbreviations: | |
| ADR | American Depositary Receipt |
| FFCB | Federal Farm Credit Bank |
| FHLMC | Federal Home Loan Mortgage Corp. |
| FNMA | Federal National Mortgage Association |
| GNMA | Government National Mortgage Association |
| REIT | Real Estate Investment Trust |
The accompanying notes are an integral part of these financial statements.
| 9 |
| Hartford Small Company HLS Fund |
| Investment Valuation Hierarchy Level Summary |
| December 31, 2013 |
| (000’s Omitted) |
| Total | Level 1 ♦ | Level 2 ♦ | Level 3 | |||||||||||||
| Assets: | ||||||||||||||||
| Common Stocks ‡ | $ | 1,477,429 | $ | 1,439,413 | $ | 11,236 | $ | 26,780 | ||||||||
| Exchange Traded Funds | 3,503 | 3,503 | – | – | ||||||||||||
| Preferred Stocks | 2,885 | – | – | 2,885 | ||||||||||||
| Short-Term Investments | 12,975 | – | 12,975 | – | ||||||||||||
| Total | $ | 1,496,792 | $ | 1,442,916 | $ | 24,211 | $ | 29,665 | ||||||||
| Foreign Currency Contracts * | 1 | – | 1 | – | ||||||||||||
| Total | $ | 1 | $ | – | $ | 1 | $ | – | ||||||||
| Liabilities: | ||||||||||||||||
| Foreign Currency Contracts * | – | – | – | – | ||||||||||||
| Total | $ | – | $ | – | $ | – | $ | – | ||||||||
| ♦ | For the year ended December 31, 2013, investments valued at $1,076 were transferred from Level 1 to Level 2, and investments valued at $3,550 were transferred from Level 2 to Level 1. Investments are transferred between Level 1 and Level 2 for a variety of reasons including, but not limited to: |
| 1) | Foreign equities for which a fair value price is more representative of exit value than the local market close (transfer into Level 2). Foreign equities for which the local market close is more representative of exit value (transfer into Level 1). |
| 2) | U.S. Treasury securities that no longer represent the most recent issue (transfer into Level 2). |
| 3) | Equity investments with no observable trading but a bid or close price is used (transfer into Level 2). Equity investments using observable quoted prices in an active market (transfer into Level 1). |
| ‡ | The Fund has all or primarily all of the equity securities categorized in a particular level. Refer to the Schedule of Investments for further industry breakout. |
| * | Derivative instruments (excluding purchased and written options, if applicable) are valued at the unrealized appreciation/depreciation on the investments. |
Following is a reconciliation of Level 3 assets for which significant unobservable inputs were used to determine fair value:
| Balance as of December 31, 2012 | Realized Gain (Loss) | Change in Unrealized Appreciation (Depreciation) | Net Amortization | Purchases | Sales | Transfers Into Level 3 | Transfers Out of Level 3 | Balance as of December 31, 2013 | ||||||||||||||||||||||||||||
| Assets: | ||||||||||||||||||||||||||||||||||||
| Common Stocks | $ | 7,074 | $ | — | $ | 4,086 | * | $ | — | $ | 15,620 | $ | — | $ | — | $ | — | $ | 26,780 | |||||||||||||||||
| Preferred Stocks | — | — | (321 | )† | — | 3,206 | — | — | — | 2,885 | ||||||||||||||||||||||||||
| Total | $ | 7,074 | $ | — | $ | 3,765 | $ | — | $ | 18,826 | $ | — | $ | — | $ | — | $ | 29,665 | ||||||||||||||||||
| * | Change in unrealized appreciation (depreciation) in the current period relating to assets still held at December 31, 2013 was $4,086. |
| † | Change in unrealized appreciation (depreciation) in the current period relating to assets still held at December 31, 2013 was $(321). |
| Note: | For purposes of reporting transfers between different hierarchy levels, both transfers in and out of each level, as applicable, are shown as if they occurred at the beginning of the period. |
The accompanying notes are an integral part of these financial statements.
| 10 |
| Hartford Small Company HLS Fund |
| Statement of Assets and Liabilities |
| December 31, 2013 |
| (000’s Omitted) |
| Assets: | ||||
| Investments in securities, at market value (cost $1,143,045) | $ | 1,496,792 | ||
| Cash | 2 | |||
| Foreign currency on deposit with custodian (cost $—) | — | |||
| Unrealized appreciation on foreign currency contracts | 1 | |||
| Receivables: | ||||
| Investment securities sold | 29,773 | |||
| Fund shares sold | 1,619 | |||
| Dividends and interest | 211 | |||
| Other assets | — | |||
| Total assets | 1,528,398 | |||
| Liabilities: | ||||
| Unrealized depreciation on foreign currency contracts | — | |||
| Payables: | ||||
| Investment securities purchased | 5,740 | |||
| Fund shares redeemed | 25,738 | |||
| Investment management fees | 223 | |||
| Distribution fees | 8 | |||
| Accrued expenses | 77 | |||
| Total liabilities | 31,786 | |||
| Net assets | $ | 1,496,612 | ||
| Summary of Net Assets: | ||||
| Capital stock and paid-in-capital | $ | 896,098 | ||
| Distributions in excess of net investment income | (134 | ) | ||
| Accumulated net realized gain | 246,901 | |||
| Unrealized appreciation of investments and the translations of assets and liabilities denominated in foreign currency | 353,747 | |||
| Net assets | $ | 1,496,612 | ||
| Shares authorized | 1,500,000 | |||
| Par value | $ | 0.001 | ||
| Class IA: Net asset value per share | $ | 26.43 | ||
| Shares outstanding | 51,267 | |||
| Net assets | $ | 1,354,821 | ||
| Class IB: Net asset value per share | $ | 25.46 | ||
| Shares outstanding | 5,568 | |||
| Net assets | $ | 141,791 |
The accompanying notes are an integral part of these financial statements.
| 11 |
| Hartford Small Company HLS Fund |
| Statement of Operations |
| For the Year Ended December 31, 2013 |
| (000’s Omitted) |
| Investment Income: | ||||
| Dividends | $ | 5,789 | ||
| Interest | 16 | |||
| Less: Foreign tax withheld | (54 | ) | ||
| Total investment income, net | 5,751 | |||
| Expenses: | ||||
| Investment management fees | 9,350 | |||
| Transfer agent fees | 6 | |||
| Distribution fees - Class IB | 326 | |||
| Custodian fees | 14 | |||
| Accounting services fees | 164 | |||
| Board of Directors' fees | 35 | |||
| Audit fees | 21 | |||
| Other expenses | 199 | |||
| Total expenses (before fees paid indirectly) | 10,115 | |||
| Commission recapture | (125 | ) | ||
| Custodian fee offset | — | |||
| Total fees paid indirectly | (125 | ) | ||
| Total expenses, net | 9,990 | |||
| Net Investment Loss | (4,239 | ) | ||
| Net Realized Gain on Investments and Foreign Currency Transactions: | ||||
| Net realized gain on investments | 258,218 | |||
| Net realized gain on foreign currency contracts | 73 | |||
| Net realized loss on other foreign currency transactions | (78 | ) | ||
| Net Realized Gain on Investments and Foreign Currency Transactions | 258,213 | |||
| Net Changes in Unrealized Appreciation of Investments and Foreign Currency Transactions: | ||||
| Net unrealized appreciation of investments | 244,342 | |||
| Net unrealized depreciation of foreign currency contracts | (2 | ) | ||
| Net unrealized appreciation on translation of other assets and liabilities in foreign currencies | 1 | |||
| Net Changes in Unrealized Appreciation of Investments and Foreign Currency Transactions | 244,341 | |||
| Net Gain on Investments and Foreign Currency Transactions | 502,554 | |||
| Net Increase in Net Assets Resulting from Operations | $ | 498,315 |
The accompanying notes are an integral part of these financial statements.
| 12 |
| Hartford Small Company HLS Fund |
Statement of Changes in Net Assets |
(000’s Omitted) |
| For the Year Ended December 31, 2013 | For the Year Ended December 31, 2012 | |||||||
| Operations: | ||||||||
| Net investment income (loss) | $ | (4,239 | ) | $ | 1,596 | |||
| Net realized gain on investments and foreign currency transactions | 258,213 | 105,170 | ||||||
| Net unrealized appreciation of investments and foreign currency transactions | 244,341 | 81,683 | ||||||
| Net Increase in Net Assets Resulting from Operations | 498,315 | 188,449 | ||||||
| Distributions to Shareholders: | ||||||||
| From net investment income | ||||||||
| Class IA | (1,038 | ) | — | |||||
| Total from net investment income | (1,038 | ) | — | |||||
| From net realized gain on investments | ||||||||
| Class IA | (89,056 | ) | (70 | ) | ||||
| Class IB | (9,991 | ) | (10 | ) | ||||
| Total from net realized gain on investments | (99,047 | ) | (80 | ) | ||||
| Total distributions | (100,085 | ) | (80 | ) | ||||
| Capital Share Transactions: | ||||||||
| Class IA | ||||||||
| Sold | 161,148 | 86,327 | ||||||
| Issued on reinvestment of distributions | 90,094 | 70 | ||||||
| Redeemed | (383,841 | ) | (217,332 | ) | ||||
| Total capital share transactions | (132,599 | ) | (130,935 | ) | ||||
| Class IB | ||||||||
| Sold | 27,421 | 17,856 | ||||||
| Issued on reinvestment of distributions | 9,991 | 10 | ||||||
| Redeemed | (49,914 | ) | (78,670 | ) | ||||
| Total capital share transactions | (12,502 | ) | (60,804 | ) | ||||
| Net decrease from capital share transactions | (145,101 | ) | (191,739 | ) | ||||
| Net Increase (Decrease) in Net Assets | 253,129 | (3,370 | ) | |||||
| Net Assets: | ||||||||
| Beginning of period | 1,243,483 | 1,246,853 | ||||||
| End of period | $ | 1,496,612 | $ | 1,243,483 | ||||
| Undistributed (distribution in excess of) net investment income | $ | (134 | ) | $ | 1,412 | |||
| Shares: | ||||||||
| Class IA | ||||||||
| Sold | 6,827 | 4,505 | ||||||
| Issued on reinvestment of distributions | 3,820 | 4 | ||||||
| Redeemed | (16,433 | ) | (11,366 | ) | ||||
| Total share activity | (5,786 | ) | (6,857 | ) | ||||
| Class IB | ||||||||
| Sold | 1,220 | 962 | ||||||
| Issued on reinvestment of distributions | 439 | 1 | ||||||
| Redeemed | (2,236 | ) | (4,236 | ) | ||||
| Total share activity | (577 | ) | (3,273 | ) | ||||
The accompanying notes are an integral part of these financial statements.
| 13 |
| Hartford Small Company HLS Fund |
| Notes to Financial Statements |
| December 31, 2013 |
| (000’s Omitted) |
| 1. | Organization: |
Hartford Small Company HLS Fund (the “Fund”) serves as an underlying investment option for certain variable annuity and variable life insurance separate accounts of Hartford Life Insurance Company (“HLIC”) and its affiliates and certain qualified retirement plans. The Fund may also serve as an underlying investment option for certain variable annuity and variable life separate accounts of other insurance companies. Owners of variable annuity contracts and policyholders of variable life insurance contracts may choose the funds permitted in the variable insurance contract prospectus. In addition, participants in certain qualified retirement plans may choose the Fund if permitted by their plans.
Hartford Series Fund, Inc. (the “Company”) is an open-end registered management investment company comprised of thirty portfolios. Financial statements for the Fund, a series of the Company, are included in this report.
The Company is organized under the laws of the State of Maryland and is registered with the Securities and Exchange Commission (“SEC”) under the Investment Company Act of 1940, as amended (“1940 Act”). The Fund’s portfolio managers are Steven C. Angeli (81.70%), Mammen Chally (15.72%) and Jamie A. Rome (2.58%). The portfolio management team also includes Stephen C. Mortimer and Mario E. Abularach. The Fund is a diversified open-end management investment company.
The Fund is divided into Class IA and Class IB shares. Each class is offered at the per share net asset value (“NAV”) without a sales charge and is subject to the same expenses, except that the Class IB shares are subject to distribution and service fees charged pursuant to a Distribution Plan adopted in accordance with Rule 12b-1 under the 1940 Act.
| 2. | Significant Accounting Policies: |
The following is a summary of significant accounting policies of the Fund in the preparation of its financial statements, which are in accordance with United States Generally Accepted Accounting Principles (“U.S. GAAP”). The preparation of financial statements in accordance with U.S. GAAP may require management to make estimates and assumptions that affect the reported amounts of assets and liabilities and disclosure of contingent assets and liabilities at the date of the financial statements and the reported amounts of increases and decreases in net assets from operations during the reporting period. Actual results could differ from those estimates.
| a) | Determination of Net Asset Value – The NAV of each class of the Fund’s shares is determined as of the close of regular trading (normally 4:00 p.m. Eastern Time) (the “NYSE Close”) on each day that the New York Stock Exchange (the “Exchange”) is open (“Valuation Date”). Information that becomes known to the Fund after the NAV has been calculated on a particular day will not generally be used to retroactively adjust the NAV determined earlier that day. |
| b) | Investment Valuation and Fair Value Measurements – For purposes of calculating the NAV, portfolio investments and other assets held by the Fund's portfolio for which market quotes are readily available are valued at market value. Market value is generally determined on the basis of last reported sales prices or official close price. If no sales are reported, market value is based on quotes obtained from a quotation reporting system, established market makers, or independent pricing services. If market prices are not readily available or are deemed unreliable, the Fund will use the fair value of the investment as determined in good faith under policies and procedures established by and under the supervision of the Company’s Board of Directors. Market quotes are considered not readily available where there is an absence of current or reliable market-based data (e.g., trade information or indicative market quotes), including where events occur after the close of the relevant market, but prior to the NYSE Close, that materially affect the values of the Fund’s portfolio investments or assets. In addition, market quotes are considered not readily available when, due to extraordinary circumstances, the exchanges or markets on which the investments trade do not open for trading for the entire day and no other market prices are available. In addition, prices of foreign equities that are principally traded on certain foreign markets may be adjusted daily pursuant to a fair value pricing service approved by the Board of Directors in order to reflect an adjustment for the factors occurring after the close of certain foreign markets but before the NYSE Close. Investments that are primarily traded on foreign markets may trade on days that are not business days of the Fund. The |
| 14 |
value of the foreign investments in which the Fund invests may change on days when a shareholder will not be able to purchase or redeem shares of the Fund. Fair value pricing is subjective in nature and the use of fair value pricing by the Fund may cause the NAV of its shares to differ significantly from the NAV that would have been calculated using market prices at the close of the exchange on which a portfolio investment is primarily traded. There can be no assurance that the Fund could obtain the fair market value assigned to an investment if the Fund were to sell the investment at approximately the time at which the Fund determines its NAV.
Investments valued in currencies other than U.S. dollars are converted to U.S. dollars using exchange rates obtained from independent pricing services for calculation of the NAV. As a result, the NAV of the Fund’s shares may be affected by changes in the value of currencies in relation to the U.S. dollar. The value of investments traded in markets outside the United States or denominated in currencies other than the U.S. dollar may be affected significantly on a day that the NYSE is closed and the market value may change on days when an investor is not able to purchase, redeem or exchange shares of the Fund.
Foreign currency contracts represent agreements to exchange currencies on specific future dates at predetermined rates. Foreign currency contracts are valued using foreign currency exchange rates and forward rates as provided by an independent pricing service on the Valuation Date.
Financial instruments for which prices are not available from an independent pricing service may be valued using market quotations obtained from one or more dealers that make markets in the respective financial instrument in accordance with procedures established by the Company’s Board of Directors.
U.S. GAAP defines fair value as the price that the Fund would receive to sell an asset or pay to transfer a liability in an orderly transaction between market participants. The U.S. GAAP fair value measurement standards require disclosure of a fair value hierarchy for each major category of assets and liabilities. Various inputs are used in determining the fair value of the Fund’s investments. These inputs are summarized into three broad hierarchy levels. This hierarchy is based on whether the valuation inputs are observable or unobservable. These levels are:
| · | Level 1 – Quoted prices in active markets for identical investments. Level 1 may include exchange traded instruments, such as domestic equities, some foreign equities, options, futures, mutual funds, exchange traded funds, rights and warrants. |
| · | Level 2 – Observable inputs other than Level 1 prices, such as quoted prices for similar investments; quoted prices in markets that are not active; or other inputs that are observable or can be corroborated by observable market data. Level 2 may include debt investments that are traded less frequently than exchange traded instruments and which are valued using independent pricing services; foreign equities, which are principally traded on certain foreign markets and are adjusted daily pursuant to a fair value pricing service in order to reflect an adjustment for the factors occurring after the close of certain foreign markets but before the NYSE Close; senior floating rate interests, which are valued using an aggregate of dealer bids; short-term investments, which are valued at amortized cost; and swaps, which are valued based upon the terms of each swap contract. |
| · | Level 3 – Significant unobservable inputs that are supported by limited or no market activity. Level 3 may include financial instruments whose values are determined using indicative market quotes or require significant management judgment or estimation. These unobservable valuation inputs may include estimates for current yields, maturity/duration, prepayment speed, and indicative market quotes for comparable investments along with other assumptions relating to credit quality, collateral value, complexity of the investment structure, general market conditions and liquidity. This category may include investments where trading has been halted or there are certain restrictions on trading. While these investments are priced using unobservable inputs, the valuation of these investments reflects the best available data and management believes the prices are a reasonable representation of exit price. |
| 15 |
| Hartford Small Company HLS Fund |
| Notes to Financial Statements – (continued) |
| December 31, 2013 |
| (000’s Omitted) |
The Board of Directors of the Company generally reviews and approves the “Procedures for Valuation of Portfolio Securities” on an annual basis. These procedures define how investments are to be valued, including the formation and activities of a Valuation Committee. The Valuation Committee is responsible for determining in good faith the fair value of investments when the value cannot be obtained from primary pricing services or alternative sources or if the valuation of an investment as provided by the primary pricing service or alternative source is believed not to reflect the investment’s fair value as of the Valuation Date. Voting members of the Valuation Committee include the Fund’s Treasurer or designee and a Vice President of the investment manager or designee. An Assistant Vice President of the Fund with legal expertise or designee is also included on the Valuation Committee as a non-voting advisory member. In addition, the Fund’s Chief Compliance Officer shall designate a member of the compliance group to attend Valuation Committee meetings as a non-voting resource, to monitor for and provide guidance with respect to compliance with these procedures. Two members of the Valuation Committee or their designees, representing different departments, shall constitute a quorum for purposes of permitting the Valuation Committee to take action. The Valuation Committee will consider all relevant factors in determining an investment’s fair value, and may seek the advice of the Fund’s sub-adviser, knowledgeable brokers, and legal counsel in making such determination. The Valuation Committee reports to the Audit Committee of the Company’s Board of Directors. The Audit Committee receives quarterly written reports which include details of all fair-valued investments, including the reason for the fair valuation, and an indication, when possible, of the accuracy of the valuation by disclosing the next available reliable public price quotation or the disposition price of such investments (the “look-back” test). The Board of Directors then must consider for ratification all of the fair value determinations made during the previous quarter.
Valuation levels are not necessarily indicative of the risk associated with investing in such investments. Individual investments within any of the above mentioned asset classes may be assigned a different hierarchical level than those presented above, as individual circumstances dictate.
For additional information, refer to the Investment Valuation Hierarchy Level Summary and the Level 3 roll-forward reconciliation, if applicable, which follow the Schedule of Investments.
| c) | Investment Transactions and Investment Income – Investment transactions are recorded as of the trade date (the date the order to buy or sell is executed) for financial reporting purposes. Investments purchased or sold on a when-issued or delayed-delivery basis may be settled a month or more after the trade date. Realized gains and losses are determined on the basis of identified cost. |
Dividend income from domestic securities is accrued on the ex-dividend date. In general, dividend income from foreign securities is recorded on the ex-date; however, dividend notifications in certain foreign jurisdictions may not be available in a timely manner and as a result, the Fund will record the dividend as soon as the relevant details (i.e., rate per share, payment date, shareholders of record, etc.) are publicly available. Interest income, including amortization of premium, accretion of discounts and additional principal received in-kind in lieu of cash, is accrued on a daily basis.
| d) | Foreign Currency Transactions – Assets and liabilities denominated in currencies other than U.S. dollars are translated into U.S. dollars at the exchange rates in effect on the valuation date. Purchases and sales of investments, income and expenses are translated into U.S. dollars at the exchange rates on the dates of such transactions. |
The Fund does not isolate that portion of portfolio investment valuation resulting from fluctuations in the foreign currency exchange rates from the fluctuations arising from changes in the market prices of investments held. Exchange rate fluctuations are included with the net realized and unrealized gain or loss on investments in the accompanying financial statements.
Net realized foreign exchange gains or losses arise from sales of foreign currencies and the difference between asset and liability amounts initially stated in foreign currencies and the U.S. dollar value of the amounts actually received or paid.
| 16 |
Net unrealized foreign exchange gains or losses arise from changes in the value of other assets and liabilities at the end of the reporting period, resulting from changes in the exchange rates.
| e) | Joint Trading Account – The Fund may invest cash balances into a joint trading account that may be invested in one or more repurchase agreements. |
| f) | Fund Share Valuation and Dividend Distributions to Shareholders – Orders for the Fund’s shares are executed in accordance with the investment instructions of the contract holders and plan participants. The NAV of the Fund’s shares is determined as of the close of business on each business day of the Exchange. The NAV is determined separately for each class of shares of the Fund by dividing the Fund’s net assets attributable to that class by the number of shares of the class outstanding. Each class of shares offered by the Fund has equal rights as to assets and voting privileges (except that shareholders of a class have exclusive voting rights regarding any matter relating solely to that class of shares). Income and non-class specific expenses are allocated daily to each class on the basis of the relative net assets of the class. Realized and unrealized gains and losses are allocated daily based on the relative net assets of each class of shares of the Fund. |
Orders for the purchase of the Fund’s shares received prior to the close of the Exchange on any day the Exchange is open for business are priced at the NAV determined as of the close of the Exchange. Orders received after the close of the Exchange, or on a day on which the Exchange and/or the Fund is not open for business, are priced at the next determined NAV.
Dividends are declared pursuant to a policy adopted by the Company’s Board of Directors based upon the investment performance of the Fund. The policy of the Fund is to pay dividends from net investment income and realized gains, if any, at least once a year.
Distributions from net investment income, net realized gains and capital are determined in accordance with federal income tax regulations, which may differ from U.S. GAAP with respect to character and timing. These differences may include, but are not limited to, losses deferred due to wash sale adjustments, foreign currency gains and losses, adjustments related to Passive Foreign Investment Companies (“PFICs”), Real Estate Investment Trusts (“REITs”), Regulated Investment Companies (“RICs”), certain derivatives and partnerships. Permanent book and federal income tax basis differences relating to shareholder distributions will result in reclassifications to certain of the Fund’s capital accounts (see Federal Income Taxes: Reclassification of Capital Accounts note).
| 3. | Securities and Other Investments: |
| a) | Repurchase Agreements – A repurchase agreement is an agreement by which a counterparty agrees to sell an investment and agrees to repurchase the investment sold from the buyer at a mutually agreed upon time and price. During the period of the repurchase agreement, the counterparty will deposit cash and or securities in a third party custodial account to serve as collateral. At the time the Fund enters into a repurchase agreement, the value of the underlying collateral, including accrued interest, will be equal to or exceed the value of the repurchase agreement. Repurchase agreements expose the Fund to counterparty risk - that is, the risk that the counterparty will not fulfill its obligations. To minimize counterparty risk, the investments that serve to collateralize the repurchase agreement are held by the Fund’s custodian in book entry or physical form in the custodial account of the Fund or in a third party custodial account. Repurchase agreements are valued at cost plus accrued interest, which approximates fair value. Repurchase agreements have master netting arrangements which allow the Fund to offset amounts owed to a counterparty with amounts owed by the counterparty, including any collateral. Upon an event of default under a master repurchase agreement, the non-defaulting party may close out all transactions traded under such agreement and net amounts owed under each transaction to one net amount payable by one party to the other. Absent an event of default, the master repurchase agreement does not result in an offset of reported amounts of assets and liabilities in the Statement of Assets and Liabilities across transactions |
| 17 |
| Hartford Small Company HLS Fund |
| Notes to Financial Statements – (continued) |
| December 31, 2013 |
| (000’s Omitted) |
between the Fund and the applicable counterparty. The Fund, as shown on the Schedule of Investments, had outstanding repurchase agreements and related collateral as of December 31, 2013.
| b) | Illiquid and Restricted Investments – The Fund is permitted to invest up to 15% of its net assets in illiquid investments. Illiquid investments are those that may not be sold or disposed of in the ordinary course of business within seven days, at approximately the price used to determine the Fund’s NAV. The Fund may not be able to sell illiquid investments when its sub-adviser considers it desirable to do so or may have to sell such investments at a price that is lower than the price that could be obtained if the investments were more liquid. A sale of illiquid investments may require more time and may result in higher dealer discounts and other selling expenses than does the sale of those that are liquid. Illiquid investments also may be more difficult to value due to the unavailability of reliable market quotations for such investments, and an investment in them may have an adverse impact on the Fund’s NAV. The Fund may also purchase certain restricted investments that can only be resold to certain qualified investors and may be determined to be liquid pursuant to policies and guidelines established by the Company’s Board of Directors. The Fund, as shown on the Schedule of Investments, had illiquid and/or restricted investments as of December 31, 2013. |
| c) | Investments Purchased on a When-Issued or Delayed-Delivery Basis – Delivery and payment for investments that have been purchased by the Fund on a forward commitment, or when-issued or delayed-delivery basis, take place beyond the customary settlement period. The Fund may dispose of or renegotiate a delayed-delivery transaction after it is entered into, and may sell delayed-delivery investments before they are delivered, which may result in a realized gain or loss. During this period, such investments are subject to market fluctuations, and the Fund identifies investments segregated in its records with a value at least equal to the amount of the commitment. As of December 31, 2013, the Fund had no outstanding when-issued or delayed-delivery investments. |
| 4. | Financial Derivative Instruments: |
The following disclosures contain information on how and why the Fund uses derivative instruments, the credit-risk-related contingent features in certain derivative instruments, and how derivative instruments affect the Fund’s financial position and results of operations. The location and fair value amounts of these instruments on the Statement of Assets and Liabilities and the realized gains and losses and changes in unrealized gains and losses on the Statement of Operations, each categorized by type of derivative contract, are included in the following Additional Derivative Instrument Information footnote. The derivative instruments outstanding as of year-end are disclosed in the notes to or within the Schedule of Investments for purchased options, if applicable. The amounts of realized gains and losses and changes in unrealized gains and losses on derivative instruments during the year are disclosed in the Statement of Operations.
| a) | Foreign Currency Contracts – The Fund may enter into foreign currency contracts that obligate the Fund to purchase or sell currencies at specified future dates. Foreign currency contracts are used to hedge the currency exposure associated with some or all of the Fund’s investments and/or as part of an investment strategy. Foreign currency contracts are marked to market daily and the change in value is recorded by the Fund as an unrealized gain or loss. The Fund will record a realized gain or loss when the foreign currency contract is settled. |
Foreign currency contracts involve elements of market risk in excess of the amounts reflected in the Statement of Assets and Liabilities. In addition, risks may arise upon entering into these contracts from the potential inability of the counterparties to meet the terms of the contracts and from unanticipated movements in the value of the foreign currencies relative to the U.S. dollar. The Fund had outstanding foreign currency contracts as shown on the Schedule of Investments as of December 31, 2013.
| 18 |
| b) | Additional Derivative Instrument Information: |
Fair Value of Derivative Instruments on the Statement of Assets and Liabilities as of December 31, 2013:
| Risk Exposure Category | ||||||||||||||||||||||||||||
| Interest Rate Contracts | Foreign Exchange Contracts | Credit Contracts | Equity Contracts | Commodity Contracts | Other Contracts | Total | ||||||||||||||||||||||
| Assets: | ||||||||||||||||||||||||||||
| Unrealized appreciation on foreign currency contracts | $ | — | $ | 1 | $ | — | $ | — | $ | — | $ | — | $ | 1 | ||||||||||||||
| Total | $ | — | $ | 1 | $ | — | $ | — | $ | — | $ | — | $ | 1 | ||||||||||||||
| Liabilities: | ||||||||||||||||||||||||||||
| Unrealized depreciation on foreign currency contracts | $ | — | $ | — | $ | — | $ | — | $ | — | $ | — | $ | — | ||||||||||||||
| Total | $ | — | $ | — | $ | — | $ | — | $ | — | $ | — | $ | — | ||||||||||||||
The volume of derivatives that is presented in the Schedule of Investments is consistent with the derivative activity during the year ended December 31, 2013.
The Effect of Derivative Instruments on the Statement of Operations for the year ended December 31, 2013:
| Risk Exposure Category | ||||||||||||||||||||||||||||
| Interest Rate Contracts | Foreign Exchange Contracts | Credit Contracts | Equity Contracts | Commodity Contracts | Other Contracts | Total | ||||||||||||||||||||||
| Realized Gain on Derivatives Recognized as a Result of Operations: | ||||||||||||||||||||||||||||
| Net realized gain on foreign currency contracts | $ | — | $ | 73 | $ | — | $ | — | $ | — | $ | — | $ | 73 | ||||||||||||||
| Total | $ | — | $ | 73 | $ | — | $ | — | $ | — | $ | — | $ | 73 | ||||||||||||||
| Net Change in Unrealized Appreciation (Depreciation) on Derivatives Recognized as a Result of Operations: | ||||||||||||||||||||||||||||
| Net change in unrealized depreciation of foreign currency contracts | $ | — | $ | (2 | ) | $ | — | $ | — | $ | — | $ | — | $ | (2 | ) | ||||||||||||
| Total | $ | — | $ | (2 | ) | $ | — | $ | — | $ | — | $ | — | $ | (2 | ) | ||||||||||||
The derivatives held by the Fund as of December 31, 2013 are not subject to a master netting arrangement; therefore, no balance sheet offsetting disclosure is presented.
| 5. | Principal Risks: |
The Fund may be exposed to counterparty risk, or the risk that an institution or other entity with which the Fund has unsettled or open transactions will default.
If the Fund invests directly in foreign currencies or in securities that trade in, and receive revenues in, foreign currencies, or in derivatives that provide exposure to foreign currencies, it will be subject to the risk that those currencies will decline in value relative to the base currency (U.S. dollars) of the Fund, or, in the case of hedging positions, that the Fund’s base currency will decline in value relative to the currency being hedged. Currency rates in foreign countries may fluctuate significantly over short periods of time for a number of reasons, including changes in interest rates, intervention (or the failure to intervene) by U.S. or foreign governments, central banks or supranational entities, such as the International Monetary Fund, or by the imposition of currency controls or other political developments in the United States or abroad. As a result, the Fund’s investments in foreign currency denominated securities may reduce the returns of the Fund. The market values of equity securities, such as common stocks and preferred stocks, or equity related investments, such as futures and options, may decline due to general market conditions which are not specifically related
| 19 |
| Hartford Small Company HLS Fund |
| Notes to Financial Statements – (continued) |
| December 31, 2013 |
| (000’s Omitted) |
to a particular company, such as real or perceived adverse economic conditions, changes in the general outlook for corporate earnings, changes in interest or currency rates or adverse investor sentiment generally. The market value of equity securities may also decline due to factors which affect a particular industry or industries, such as labor shortages or increased production costs and competitive conditions within an industry. Equity securities and equity related investments generally have greater market price volatility than fixed income securities.
| 6. | Federal Income Taxes: |
| a) | Federal Income Taxes – For federal income tax purposes, the Fund intends to continue to qualify as a RIC under Subchapter M of the Internal Revenue Code (“IRC”) by distributing substantially all of its taxable net investment income and net realized capital gains to its shareholders and otherwise complying with the requirements of the IRC. The Fund has distributed substantially all of its income and capital gains in prior years, if applicable, and intends to distribute substantially all of its income and capital gains prior to the next fiscal year-end. Accordingly, no provision for federal income or excise taxes has been made in the accompanying financial statements. Distributions from short-term capital gains are treated as ordinary income distributions for federal income tax purposes. |
| b) | Net Investment Income (Loss), Net Realized Gains (Losses) and Distributions – Net investment income (loss) and net realized gains (losses) may differ for financial statement and tax purposes primarily because of losses deferred due to wash sale adjustments, foreign currency gains and losses, adjustments related to PFICs, REITs, RICs, certain derivatives and partnerships. The character of distributions made during the year from net investment income or net realized gains may differ from their ultimate characterization for federal income tax purposes. Also, due to the timing of dividend distributions, the fiscal year in which amounts are distributed may differ from the year that the income or realized gains (losses) were recorded by the Fund. |
| c) | Distributions and Components of Distributable Earnings – The tax character of distributions paid by the Fund for the periods indicated is as follows (as adjusted for dividends payable, if applicable): |
| For the Year Ended December 31, 2013 | For the Year Ended December 31, 2012 | |||||||
| Ordinary Income | $ | 1,351 | $ | — | ||||
| Long-Term Capital Gains* | 98,734 | 80 | ||||||
| * | The Fund designates these distributions as long-term capital dividends pursuant to IRC Sec. 852(b)(3)(C). |
As of December 31, 2013, the Fund’s components of distributable earnings (deficit) on a tax basis were as follows:
| Amount | ||||
| Undistributed Ordinary Income | $ | 93,037 | ||
| Undistributed Long-Term Capital Gain | 157,292 | |||
| Unrealized Appreciation* | 350,185 | |||
| Total Accumulated Earnings | $ | 600,514 | ||
| * | Differences between book-basis and tax-basis unrealized appreciation (depreciation) may be attributable to the losses deferred due to wash sale adjustments, foreign currency gains and losses, adjustments related to PFICs, REITs, RICs, certain derivatives and partnerships. |
| 20 |
| d) | Reclassification of Capital Accounts – The Fund may record reclassifications in its capital accounts. These reclassifications have no impact on the total net assets of the Fund. The reclassifications are a result of permanent differences between U.S. GAAP and tax accounting for such items as foreign currency, PFICs, expiration or utilization of capital loss carryforwards or net operating losses. Adjustments are made to reflect the impact these items have on current and future distributions to shareholders. Therefore, the source of the Fund’s distributions may be shown in the accompanying Statement of Changes in Net Assets as from undistributed net investment income, from accumulated net realized gains on investments or from capital depending on the type of book and tax differences that exist. For the year ended December 31, 2013, the Fund recorded reclassifications to increase (decrease) the accounts listed below: |
| Amount | ||||
| Undistributed Net Investment Income (Loss) | $ | 3,731 | ||
| Accumulated Net Realized Gain (Loss) | (3,731 | ) | ||
| e) | Capital Loss Carryforward – On December 22, 2010, the Regulated Investment Company Modernization Act of 2010 (the “Act”) was enacted, which made changes to the capital loss carryforward rules. The changes are effective for taxable years beginning after the date of enactment. Under the Act, funds are permitted to carry forward capital losses for an unlimited period. However, any losses incurred during those future taxable years will be required to be utilized prior to the losses incurred in pre-enactment taxable years, which carry an expiration date. As a result of this ordering rule, pre-enactment capital loss carryforwards may be more likely to expire unused. Additionally, post-enactment capital loss carryforwards retain their character as either short-term or long-term capital losses rather than being considered all short-term as permitted under prior regulation. |
The Fund had no capital loss carryforward for U.S. federal income tax purposes as of December 31, 2013.
| f) | Accounting for Uncertainty in Income Taxes – The Fund has adopted financial reporting rules that require the Fund to analyze all open tax years, as defined by the statute of limitations, for all major jurisdictions. Generally, tax authorities can examine all tax returns filed for the last three years. The Fund does not have an examination in progress. |
The Fund has reviewed all open tax years and major jurisdictions and concluded that these financial reporting rules had no effect on the Fund’s financial position or results of operations. There is no tax liability resulting from unrecognized tax benefits relating to uncertain income tax positions taken or expected to be taken on the tax return for the fiscal year ended December 31, 2013. The Fund is also not aware of any tax positions for which it is reasonably possible that the total amounts of unrecognized tax benefits will significantly change in the next twelve months.
| 7. | Expenses: |
| a) | Investment Management Agreement – Hartford Funds Management Company, LLC (“HFMC”), an indirect wholly owned subsidiary of The Hartford Financial Services Group, Inc. (“The Hartford”), serves as investment manager to the Fund pursuant to an Investment Management Agreement with the Company. The investment manager has overall investment supervisory responsibility for the Fund. In addition, the investment manager provides administrative personnel, services, equipment, facilities and office space for proper operation of the Fund. The investment manager has contracted with Wellington Management Company, LLP (“Wellington Management”) under a sub-advisory agreement for the provision of day-to-day investment management services to the Fund in accordance with the Fund’s investment objective and policies. The Fund pays a fee to the investment manager, a portion of which may be used to compensate Wellington Management. |
| 21 |
| Hartford Small Company HLS Fund |
| Notes to Financial Statements – (continued) |
| December 31, 2013 |
| (000’s Omitted) |
The schedule below reflects the rates of compensation paid to HFMC for investment management services rendered as of December 31, 2013; the rates are accrued daily and paid monthly.
| Average Daily Net Assets | Annual Fee | |||
| On first $250 million | 0.7750% | |||
| On next $250 million | 0.7250% | |||
| On next $500 million | 0.6750% | |||
| On next $500 million | 0.6000% | |||
| On next $3.5 billion | 0.5500% | |||
| On next $5 billion | 0.5300% | |||
| Over $10 billion | 0.5200% | |||
| b) | Accounting Services Agreement – Pursuant to the Fund Accounting Agreement between HFMC and the Company, on behalf of the Fund, HFMC provides accounting services to the Fund and receives monthly compensation based on the Fund’s average daily net assets at the rates set forth below. The Fund’s accounting services fees are accrued daily and paid monthly. |
| Average Daily Net Assets | Annual Fee | |||
| On first $5 billion | 0.012% | |||
| Over $5 billion | 0.010% | |||
| c) | Operating Expenses – Allocable expenses incurred by the Company are allocated to each Fund and allocated to classes within a Fund in proportion to the average daily net assets of the Fund and each class, except where allocation of certain expenses is more fairly made directly to the Fund or to specific classes within a Fund. |
| d) | Fees Paid Indirectly – The Company, on behalf of the Fund, has entered into agreements with State Street Global Markets, LLC and Russell Implementation Services, Inc. to partially recapture non-discounted trade commissions. Such rebates are used to pay a portion of the Fund’s expenses. In addition, the Fund’s custodian bank has agreed to reduce its fees when the Fund maintains cash on deposit in a non-interest-bearing custody account. For the year ended December 31, 2013, these amounts, if any, are included in the Statement of Operations. |
The ratio of expenses to average net assets in the accompanying financial highlights excludes the reduction in expenses related to fees paid indirectly. The annualized expense ratio after waivers for the period listed below reflecting the reduction for fees paid indirectly is as follows:
| Year Ended December 31, 2013 | ||||
| Class IA | 0.71 | % | ||
| Class IB | 0.96 | |||
| e) | Distribution Plan for Class IB shares – Effective June 14, 2013, Hartford Investment Financial Services, LLC was renamed Hartford Funds Distributors, LLC (“HFD”). HFD, a wholly owned, ultimate subsidiary of The Hartford, serves as the Fund’s principal underwriter and distributor. The Company, on behalf of the Fund, has adopted a Distribution Plan pursuant to Rule 12b-1 of the 1940 Act to compensate the distributor, HFD, from assets attributable to the Class IB shares for services rendered and expenses borne in connection with activities primarily intended to result in the sale of the Class IB shares, subject to the review and approval of the Company’s Board of Directors. |
| 22 |
The Distribution Plan provides that the Fund may pay annually up to 0.25% of the average daily net assets of the Fund attributable to its Class IB shares for activities primarily intended to result in the sale of Class IB shares. The Board has the authority to suspend or reduce these payments at any point in time. Under the terms of the Distribution Plan and the principal underwriting agreement, the Fund is authorized to make payments monthly to the distributor that may be used to pay or compensate entities providing distribution and shareholder servicing with respect to the Class IB shares for such entities’ fees or expenses incurred or paid in that regard. These fees are accrued daily and paid monthly.
| f) | Other Related Party Transactions – Certain officers of the Fund are directors and/or officers of the investment manager and/or The Hartford or its subsidiaries. For the year ended December 31, 2013, a portion of the Fund’s Chief Compliance Officer’s salary was paid by all the investment companies in the Hartford fund complex. The portion allocated to the Fund was in the amount of $1. Hartford Administrative Services Company (“HASCO”), an indirect wholly owned subsidiary of The Hartford, provides transfer agent services to the Fund. HASCO was compensated on a per account basis for providing such services. The amount paid to HASCO can be found in the Statement of Operations. These fees are accrued daily and paid monthly. |
| g) | Payment from Affiliate – In July of 2007, The Hartford entered into a settlement with the Attorneys General of the states of New York, Connecticut and Illinois relating to market timing and the company's individual variable annuity contracts in which certain payments would be made directly to the variable annuity contract holders. The distribution plan provided that unclaimed money from the settlement would be distributed to certain HLS Funds that are investment options through a Hartford individual variable annuity contract. The unclaimed money was distributed to the Fund on September 18, 2009. |
The total return in the accompanying financial highlights includes payments from affiliates. Had the payments from the affiliates been excluded, the impact and total return for the periods listed below would have been as follows:
| For the Year Ended December 31, 2009 | ||||||||
| Class IA | Class IB | |||||||
| Impact from Payment from Affiliate for Attorneys General Settlement | 0.08 | % | 0.09 | % | ||||
| Total Return Excluding Payment from Affiliate | 29.18 | % | 28.90 | % | ||||
| 8. | Investment Transactions: |
For the year ended December 31, 2013, the Fund's aggregate purchases and sales of investment securities (excluding short-term investments) were as follows:
| Amount | ||||
| Cost of Purchases Excluding U.S. Government Obligations | $ | 1,289,293 | ||
| Sales Proceeds Excluding U.S. Government Obligations | 1,545,772 | |||
| 9. | Line of Credit: |
The Fund is one of several Hartford funds that participate in a $500 million committed revolving line of credit facility. The facility is to be used for temporary or emergency purposes. Under the arrangement, the funds are required to own securities having a market value in excess of 300% of the total bank borrowings. The interest rate on borrowings varies depending on the nature of the loan. The facility also requires a fee to be paid based on the amount of the commitment. This commitment fee is allocated to all of the funds participating in the line of credit based on the average net assets of the funds. During the year ended December 31, 2013, the Fund did not have any borrowings under this facility.
| 23 |
| Hartford Small Company HLS Fund |
| Notes to Financial Statements – (continued) |
| December 31, 2013 |
| (000’s Omitted) |
| 10. | Industry Classifications: |
Other than the industry classifications “Other Investment Pools and Funds” and “Exchange Traded Funds,” equity industry classifications used in this report are the Global Industry Classification Standard, which was developed by and is the exclusive property and service mark of MSCI, Inc. and Standard & Poor’s.
| 11. | Indemnifications: |
Under the Company’s organizational documents, the Company shall indemnify its officers and directors to the full extent required or permitted under Maryland General Corporation Law and the federal securities laws. In addition, the Company, on behalf of the Fund, may enter into contracts that contain a variety of indemnifications. The Company’s maximum exposure under these arrangements is unknown. However, as of the date of these financial statements, the Company has not had prior claims or losses pursuant to these contracts and expects the risk of loss to be remote.
| 12. | Pending Legal Proceedings: |
On February 25, 2011, Jennifer L. Kasilag, Louis Mellinger, Judith M. Menendez, Jacqueline M. Robinson, and Linda A. Russell filed a derivative lawsuit against Hartford Investment Financial Services, LLC (“HIFSCO”)(now known as Hartford Funds Distributors, LLC) on behalf of six Hartford retail mutual funds in the United States District Court for the District of New Jersey, alleging that HIFSCO received excessive advisory and distribution fees in violation of its statutory fiduciary duty under Section 36(b) of the 1940 Act when serving as investment manager and principal underwriter, respectively, to the Hartford retail mutual funds. HIFSCO moved to dismiss and, in September 2011, the motion was granted in part and denied in part, with leave to amend the complaint. In November 2011, plaintiffs filed an amended complaint on behalf of certain Hartford retail mutual funds, The Hartford Global Health Fund (now known as The Hartford Healthcare Fund), The Hartford Conservative Allocation Fund, The Hartford Growth Opportunities Fund, The Hartford Inflation Plus Fund, The Hartford Advisers Fund (now known as The Hartford Balanced Fund), and The Hartford Capital Appreciation Fund. Plaintiffs seek to rescind the investment management agreements and distribution plans between HIFSCO and these funds and to recover the total fees charged thereunder or, in the alternative, to recover any improper compensation HIFSCO received, in addition to lost earnings. HIFSCO filed a partial motion to dismiss the amended complaint and, in December 2012, the court dismissed without prejudice the claims regarding distribution fees and denied the motion with respect to the advisory fees claims. HIFSCO disputes the allegations and intends to defend the advisory fee claims vigorously.
This action concerns the activities of HIFSCO in its capacity as investment manager and principal underwriter to the Hartford retail mutual funds and does not concern HIFSCO’s activities in its capacity as principal underwriter to the HLS funds. For this reason, no accrual for litigation relating to this matter has been recorded in the financial statements of the Fund.
| 24 |
| Hartford Small Company HLS Fund |
| Financial Highlights |
| ─ Selected Per-Share Data(A) ─ | ─ Ratios and Supplemental Data ─ | |||||||||||||||||||||||||||||||||||||||||||||||||||
| Class | Net Asset Value at Beginning of Period | Net Investment Income (Loss) | Net Realized and Unrealized Gain (Loss) on Investments | Total from Investment Operations | Dividends from Net Investment Income | Distributions from Realized Capital Gains | Total Dividends and Distributions | Net Asset Value at End of Period | Total Return(B) | Net Assets at End of Period (000s) | Ratio of Expenses to Average Net Assets Before Adjust- ments(C) | Ratio of Expenses to Average Net Assets After Adjust- ments(C) | Ratio of Net Investment Income (Loss) to Average Net Assets | |||||||||||||||||||||||||||||||||||||||
| For the Year Ended December 31, 2013 | ||||||||||||||||||||||||||||||||||||||||||||||||||||
| IA | $ | 19.74 | $ | (0.07 | ) | $ | 8.60 | $ | 8.53 | $ | (0.02 | ) | $ | (1.82 | ) | $ | (1.84 | ) | $ | 26.43 | 44.38 | % | $ | 1,354,821 | 0.71 | % | 0.71 | % | (0.29 | )% | ||||||||||||||||||||||
| IB | 19.06 | (0.12 | ) | 8.34 | 8.22 | – | (1.82 | ) | (1.82 | ) | 25.46 | 44.28 | 141,791 | 0.96 | 0.96 | (0.54 | ) | |||||||||||||||||||||||||||||||||||
| For the Year Ended December 31, 2012 (D) | ||||||||||||||||||||||||||||||||||||||||||||||||||||
| IA | $ | 17.07 | $ | 0.03 | $ | 2.64 | $ | 2.67 | $ | – | $ | – | $ | – | $ | 19.74 | 15.64 | % | $ | 1,126,350 | 0.72 | % | 0.72 | % | 0.16 | % | ||||||||||||||||||||||||||
| IB | 16.56 | (0.03 | ) | 2.53 | 2.50 | – | – | – | 19.06 | 15.10 | 117,133 | 0.97 | 0.97 | (0.13 | ) | |||||||||||||||||||||||||||||||||||||
| For the Year Ended December 31, 2011 (D) | ||||||||||||||||||||||||||||||||||||||||||||||||||||
| IA | $ | 17.66 | $ | (0.02 | ) | $ | (0.57 | ) | $ | (0.59 | ) | $ | – | $ | – | $ | – | $ | 17.07 | (3.36 | )% | $ | 1,090,883 | 0.71 | % | 0.71 | % | (0.13 | )% | |||||||||||||||||||||||
| IB | 17.18 | (0.09 | ) | (0.53 | ) | (0.62 | ) | – | – | – | 16.56 | (3.62 | ) | 155,970 | 0.96 | 0.96 | (0.38 | ) | ||||||||||||||||||||||||||||||||||
| For the Year Ended December 31, 2010 (D) | ||||||||||||||||||||||||||||||||||||||||||||||||||||
| IA | $ | 14.23 | $ | (0.01 | ) | $ | 3.44 | $ | 3.43 | $ | – | $ | – | $ | – | $ | 17.66 | 24.13 | % | $ | 1,180,045 | 0.73 | % | 0.73 | % | (0.08 | )% | |||||||||||||||||||||||||
| IB | 13.88 | (0.06 | ) | 3.36 | 3.30 | – | – | – | 17.18 | 23.83 | 212,281 | 0.98 | 0.98 | (0.33 | ) | |||||||||||||||||||||||||||||||||||||
| For the Year Ended December 31, 2009 (D) | ||||||||||||||||||||||||||||||||||||||||||||||||||||
| IA | $ | 11.01 | $ | – | (E) | $ | 3.22 | $ | 3.22 | $ | – | $ | – | $ | – | $ | 14.23 | 29.29 | %(F) | $ | 1,026,150 | 0.75 | % | 0.75 | % | (0.07 | )% | |||||||||||||||||||||||||
| IB | 10.76 | (0.03 | )(E) | 3.15 | 3.12 | – | – | – | 13.88 | 29.01 | (F) | 208,358 | 1.00 | 1.00 | (0.32 | ) | ||||||||||||||||||||||||||||||||||||
| (A) | Information presented relates to a share outstanding throughout the indicated period. Net investment income (loss) per share amounts are calculated based on average shares outstanding unless otherwise noted. |
| (B) | The figures do not include sales charges or other fees which may be applied at the variable life insurance, variable annuity or qualified retirement plan product level. Any such additional sales charges or other fees would lower the Fund's performance. |
| (C) | Adjustments include waivers and reimbursements, if applicable. Ratios do not include fees paid indirectly (see Expenses in the accompanying Notes to Financial Statements). |
| (D) | Net investment income (loss) per share amounts have been calculated using the SEC method. |
| (E) | The impact of Payment from Affiliate per share was $0.01. |
| (F) | Total return without the inclusion of the Payment from (to) Affiliate can be found in Expenses in the accompanying Notes to Financial Statements. |
| Portfolio Turnover Rate for All Share Classes | ||||
| For the Year Ended December 31, 2013 | 96 | % | ||
| For the Year Ended December 31, 2012 | 110 | |||
| For the Year Ended December 31, 2011 | 99 | |||
| For the Year Ended December 31, 2010 | 171 | |||
| For the Year Ended December 31, 2009 | 184 | |||
| 25 |
| Report of Independent Registered Public Accounting Firm |
| The Board of Directors and Shareholders of |
| Hartford Series Fund, Inc. |
We have audited the accompanying statement of assets and liabilities, including the schedule of investments, of Hartford Small Company HLS Fund (one of the portfolios constituting Hartford Series Fund, Inc. (the Funds)) as of December 31, 2013, and the related statement of operations for the year then ended, the statements of changes in net assets for each of the two years in the period then ended, and the financial highlights for each of the five years in the period then ended. These financial statements and financial highlights are the responsibility of the Funds’ management. Our responsibility is to express an opinion on these financial statements and financial highlights based on our audits.
We conducted our audits in accordance with the standards of the Public Company Accounting Oversight Board (United States). Those standards require that we plan and perform the audit to obtain reasonable assurance about whether the financial statements and financial highlights are free of material misstatement. We were not engaged to perform an audit of the Funds’ internal control over financial reporting. Our audits included consideration of internal control over financial reporting as a basis for designing audit procedures that are appropriate in the circumstances, but not for the purpose of expressing an opinion on the effectiveness of the Funds’ internal control over financial reporting. Accordingly, we express no such opinion. An audit also includes examining, on a test basis, evidence supporting the amounts and disclosures in the financial statements and financial highlights, assessing the accounting principles used and significant estimates made by management, and evaluating the overall financial statement presentation. Our procedures included confirmation of securities owned as of December 31, 2013, by correspondence with the custodian and brokers or by other appropriate auditing procedures where replies from brokers were not received. We believe that our audits provide a reasonable basis for our opinion.
In our opinion, the financial statements and financial highlights referred to above present fairly, in all material respects, the financial position of Hartford Small Company HLS Fund of the Hartford Series Fund, Inc. at December 31, 2013, the results of its operations for the year then ended, the changes in its net assets for each of the two years in the period then ended, and the financial highlights for each of the five years in the period then ended, in conformity with U.S. generally accepted accounting principles.
| |
| Minneapolis, MN | |
| February 17, 2014 |
| 26 |
| Hartford Small Company HLS Fund |
| Directors and Officers (Unaudited) |
The Board of Directors of the Company appoints officers who are responsible for the day-to-day operations of the Fund and who execute policies formulated by the directors. Each director serves until his or her death, resignation, or retirement or until the next annual meeting of shareholders is held or until his or her successor is elected and qualifies.
Directors and officers who are employed by or who have a financial interest in The Hartford are considered “interested” persons of the Fund pursuant to the 1940 Act. Each officer and two of the Company’s directors, as noted in the chart below, are “interested” persons of the Fund. Each director serves as a director for The Hartford Mutual Funds, Inc., The Hartford Mutual Funds II, Inc., Hartford Series Fund, Inc., Hartford HLS Series Fund II, Inc., and as a trustee for The Hartford Alternative Strategies Fund, which, as of December 31, 2013, collectively consist of 91 funds. Correspondence may be sent to directors and officers c/o Hartford Funds, 5 Radnor Corporate Center, Suite 300, 100 Matsonford Road, Radnor, Pennsylvania 19087, except that correspondence to Mr. Annoni, Mr. Dressen and Ms. Quade may be sent to 500 Bielenberg Drive, Woodbury, Minnesota 55125.
The table below sets forth, for each director and officer, his or her name, year of birth, current position with the Company and date first elected or appointed to Hartford Series Fund, Inc. (“HSF”), and Hartford HLS Series Fund II, Inc. (“HSF2”), principal occupation, and, for directors, other directorships held. The Fund’s Statement of Additional Information contains further information on the directors and is available free of charge by calling 1-800-862-6668 or writing to Hartford HLS Funds, c/o Hartford Life Insurance Company, Hartford Life and Annuity Insurance Company, P.O. Box 14293, Lexington, KY 40512-4293.
Information on the aggregate remuneration paid to the directors of the Company can be found in the Statement of Operations herein. The Fund pays to The Hartford a portion of the Chief Compliance Officer’s compensation, but does not pay salaries or compensation to any of their other officers or directors who are employed by The Hartford.
Non-Interested Directors
Lynn S. Birdsong (1946) Director since 2003, Co-Chairman of the Investment Committee since 2005
Mr. Birdsong is a private investor. Mr. Birdsong currently serves as a Director of the Sovereign High Yield Investment Company (April 2010 to current). Mr. Birdsong currently serves as an Independent Director of Nomura Partners Funds, Inc. (formerly, The Japan Fund) (April 2003 to current). From 2003 to March 2005, Mr. Birdsong was an Independent Director of the Atlantic Whitehall Funds. From 1979 to 2002, Mr. Birdsong was a Managing Director of Zurich Scudder Investments, an investment management firm. During his employment with Scudder, Mr. Birdsong was an Interested Director of The Japan Fund. From January 1981 through December 2013, Mr. Birdsong was a partner in Birdsong Company, an advertising specialty firm.
Robert M. Gavin, Jr. (1940) Director since 2002 (HSF) and 1986 (HSF2), Chairman of the Board since 2004
Dr. Gavin is an educational consultant. Prior to September 1, 2001, he was President of Cranbrook Education Community and prior to July 1996, he was President of Macalester College, St. Paul, Minnesota.
Duane E. Hill (1945) Director since 2001 (HSF) and 2002 (HSF2), Chairman of the Nominating Committee since 2003
Mr. Hill is a Partner of TSG Ventures L.P., a private equity investment company. Mr. Hill is a former partner of TSG Capital Group, a private equity investment firm that served as sponsor and lead investor in leveraged buyouts of middle market companies.
Sandra S. Jaffee (1941) Director since 2005
Ms. Jaffee is the founder and Chief Executive Officer of a private company, Homeworks Concierge, LLC, which provides residential property management services in Westchester County, New York (January 2012 to present). Ms. Jaffee served as Chairman (2008 to 2009) and Chief Executive Officer of Fortent (formerly Searchspace Group), a leading provider of compliance/regulatory technology to financial institutions from August 2005 to August 2009. Ms. Jaffee currently serves as a member of the Board of Directors of Broadridge Financial Solutions as well as a Trustee of Muhlenberg College.
| 27 |
| Hartford Small Company HLS Fund |
| Directors and Officers (Unaudited) – (continued) |
William P. Johnston (1944) Director since 2005, Chairman of the Compliance Committee since 2005
In June 2006, Mr. Johnston was appointed as Senior Advisor to The Carlyle Group, a global private equity and alternative asset investment firm and currently serves as an Operating Executive. In July 2006, Mr. Johnston was elected to the Board of Directors of MultiPlan, Inc. and served as a Director (July 2006 to August 2010). In August 2007, Mr. Johnston was elected to the Board of Directors of LifeCare Holdings, Inc. and served as a Director (August 2007 to June 2013). In February 2008, Mr. Johnston was elected to the Board of Directors of HCR-ManorCare, Inc. In May 2006, Mr. Johnston was elected to the Supervisory Board of Fresenius Medical Care AG & Co. KGaA, after its acquisition of Renal Care Group, Inc. in March 2006. Mr. Johnston joined Renal Care Group in November 2002 as a member of the Board of Directors and served as Chairman of the Board from March 2003 through March 2006. From 2002 through 2013, Mr. Johnston served as a Board member of the Georgia O’Keefe Museum. From September 1987 to December 2002, Mr. Johnston was with Equitable Securities Corporation (and its successors, SunTrust Equitable Securities and SunTrust Robinson Humphrey) serving in various investment banking and managerial positions, including Managing Director and Head of Investment Banking, Chief Executive Officer and Vice Chairman.
Phillip O. Peterson (1944) Director since 2002 (HSF) and 2000 (HSF2), Chairman of the Audit Committee since 2002
Mr. Peterson is a mutual fund industry consultant. He was a partner of KPMG LLP (an accounting firm) until July 1999. Mr. Peterson joined William Blair Funds in February 2007 as a member of the Board of Trustees. Mr. Peterson also joined the Board of Trustees of Symetra Variable Mutual Funds Trust as a trustee in February 2012.
Lemma W. Senbet (1946) Director since 2005
Dr. Senbet is the William E. Mayer Chair Professor of Finance and Founding Director, Center for Financial Policy, at the University of Maryland, Robert H. Smith School of Business. He was chair of the Finance Department of the University of Maryland, Robert H. Smith School of Business from 1998 to 2006. Since June 2013, he has been on leave from the University to serve as Executive Director of African Economic Research Consortium which focuses on economic policy research and training. Previously, he was a chaired professor of finance at the University of Wisconsin-Madison. Also, he was a Director of the Fortis Funds from March 2000 to July 2002. Dr. Senbet served as Director of the American Finance Association and President of the Western Finance Association. In 2006, Dr. Senbet was inducted Fellow of Financial Management Association International for his career-long distinguished scholarship and professional service.
Interested Directors and Officers
James E. Davey (1964) Director since 2012, President and Chief Executive Officer since 2010
Mr. Davey serves as Executive Vice President of Hartford Life Insurance Company (“HLIC”) and The Hartford Financial Services Group, Inc. Additionally, Mr. Davey serves as Chairman of the Board, Manager and Senior Managing Director of Hartford Funds Distributors, LLC (“HFD”). He also currently serves as Director, Chairman of the Board, President and Senior Managing Director of Hartford Administrative Services Company (“HASCO”). Mr. Davey also serves as Manager, Chairman of the Board and Senior Managing Director for Hartford Funds Management Company, LLC (“HFMC”). Mr. Davey joined The Hartford in 2002.
Lowndes A. Smith (1939) Director since 1996 (HSF) and 2002 (HSF2), Co-Chairman of the Investment Committee since 2005
Mr. Smith served as Vice Chairman of The Hartford from February 1997 to January 2002, as President and Chief Executive Officer of Hartford Life, Inc. from February 1997 to January 2002, and as President and Chief Operating Officer of The Hartford Life Insurance Companies from January 1989 to January 2002. Mr. Smith serves as a Director of White Mountains Insurance Group Ltd. (October 2003 to current); One Beacon Insurance (October 2006 to current); Symetra Financial (August 2007 to current) and is a Managing Director of Whittington Gray Associates (January 2007 to current).
Other Officers
Mark A. Annoni (1964) Vice President, Controller and Treasurer since 2012
Mr. Annoni currently serves as the Assistant Vice President of HLIC (February 2004 to present).
| 28 |
Michael R. Dressen (1963) AML Compliance Officer since 2011
Mr. Dressen currently serves as Assistant Vice President of HLIC. He also serves as Chief Compliance Officer and AML Compliance Officer of HASCO and as AML Officer of HFD. Mr. Dressen has served in various positions within The Hartford and its subsidiaries in connection with the operation of the Hartford Funds.
Edward P. Macdonald (1967) Vice President, Secretary and Chief Legal Officer since 2005
Mr. Macdonald currently serves as Assistant Secretary, Executive Vice President and Deputy General Counsel of HFD, HASCO and HFMC. He also serves as Vice President of HLIC. Mr. Macdonald has served in various positions within The Hartford and its subsidiaries in connection with the operation of the Hartford Funds. Mr. Macdonald joined The Hartford in 2005.
Joseph G. Melcher (1973) Vice President and Chief Compliance Officer since 2013
Mr. Melcher currently serves as Executive Vice President of HASCO and HFD. Mr. Melcher also currently serves as Executive Vice President and Chief Compliance Officer of HFMC. Mr. Melcher has served in various positions within The Hartford and its subsidiaries in connection with the operation of the Hartford Funds since joining The Hartford in 2012. Prior to joining The Hartford, Mr. Melcher worked at Touchstone Investments, a member of the Western & Southern Financial Group, where he held the position of Vice President and Chief Compliance Officer from 2010 through 2012 and Assistant Vice President, Compliance from 2005 to 2010.
Vernon J. Meyer (1964) Vice President since 2006
Mr. Meyer currently serves as Senior Vice President of HLIC. He also currently serves as Managing Director and Chief Investment Officer of HFMC. Mr. Meyer has served in various positions within The Hartford and its subsidiaries in connection with the operation of the Hartford Funds. Mr. Meyer joined The Hartford in 2004.
Laura S. Quade (1969) Vice President since 2012
Ms. Quade currently serves as Vice President of HASCO and HFD. She is the Head of Operations of HASCO and also serves as Director, Enterprise Operations of HLIC. Ms. Quade has served in various positions within The Hartford and its subsidiaries in connection with the operation of the Hartford Funds.
Martin A. Swanson (1962) Vice President since 2010
Mr. Swanson currently serves as Vice President of HLIC. Mr. Swanson also serves as Managing Director, Chief Marketing Officer and Principal of HFD. Mr. Swanson has served in various positions within The Hartford and its subsidiaries in connection with the operation of the Hartford Funds.
HOW TO OBTAIN A COPY OF THE FUND’S PROXY VOTING POLICIES AND VOTING RECORDS (UNAUDITED)
A description of the policies and procedures that the Fund uses to determine how to vote proxies relating to portfolio securities and information about how the Fund voted proxies relating to portfolio securities during the most recent twelve-month period ended June 30 are available (1) without charge, upon request, by calling 800-862-6668 and (2) on the SEC’s website at http://www.sec.gov.
QUARTERLY PORTFOLIO HOLDINGS INFORMATION (UNAUDITED)
The Fund files a complete schedule of portfolio holdings with the SEC for the first and third quarters of each fiscal year on Form N-Q. The Fund’s Forms N-Q are available (1) without charge, upon request, by calling 800-862-6668 and (2) on the SEC’s website at http://www.sec.gov. The Form N-Q may be reviewed and copied at the SEC’s Public Reference Room in Washington, DC. Information on the operation of the Public Reference Room may be obtained by calling 1-800-SEC-0330.
| 29 |
| Hartford Small Company HLS Fund |
| Expense Example (Unaudited) |
Your Fund's Expenses
As a shareholder of the Fund, you incur two types of costs: (1) transaction costs and (2) ongoing costs, including investment management fees, distribution and/or service (12b-1) fees, if any, and other fund expenses. This example is intended to help you understand your ongoing costs (in dollars) of investing in the Fund and to compare these costs with the ongoing costs of investing in other mutual funds. The example is based on an investment of $1,000 invested at the beginning of the period and held for the period of June 30, 2013 through December 31, 2013.
Actual Expenses
The first set of columns of the table below provides information about actual account values and actual expenses. You may use the information in this column, together with the amount you invested, to estimate the expenses that you paid over the period. Simply divide your account value by $1,000 (for example, an $8,600 account value divided by $1,000 = 8.6), then multiply the result by the number in the line under the heading entitled “Expenses Paid During Period” to estimate the expenses you paid on your account during this period.
Hypothetical Example for Comparison Purposes
The second set of columns of the table below provides information about hypothetical account values and hypothetical expenses based on the Fund’s actual expense ratio and an assumed rate of return of 5% per year before expenses, which is not the Fund’s actual return. The hypothetical account values and expenses may not be used to estimate the actual ending account balance or expenses you paid for the period. You may use this information to compare the ongoing costs of investing in the Fund and other funds. To do so, compare this 5% hypothetical example with the 5% hypothetical examples that appear in the shareholder reports of the other funds.
Please note that the expenses shown in the table are meant to highlight your ongoing costs only and do not reflect any transactional costs, such as sales charges (loads) and CDSC. Therefore, the second set of columns of the table is useful in comparing ongoing costs only, and will not help you determine the relative total costs of owning different funds. In addition, if these transactional costs were included, your costs would be higher. Expenses are equal to the Fund's annualized expense ratios multiplied by average account value over the period, multiplied by 184/365 (to reflect the one-half year period).
| Actual return | Hypothetical (5% return before expenses) | |||||||||||||||||||||||||||||||||||
| Beginning Account Value June 30, 2013 | Ending Account Value December 31, 2013 | Expenses paid during the period June 30, 2013 through December 31, 2013 | Beginning Account Value June 30, 2013 | Ending Account Value December 31, 2013 | Expenses paid during the period June 30, 2013 through December 31, 2013 | Annualized expense ratio | Days in the current 1/2 year | Days in the full year | ||||||||||||||||||||||||||||
| Class IA | $ | 1,000.00 | $ | 1,213.00 | $ | 3.97 | $ | 1,000.00 | $ | 1,021.62 | $ | 3.63 | 0.71 | % | 184 | 365 | ||||||||||||||||||||
| Class IB | $ | 1,000.00 | $ | 1,211.10 | $ | 5.36 | $ | 1,000.00 | $ | 1,020.36 | $ | 4.90 | 0.96 | % | 184 | 365 | ||||||||||||||||||||
| 30 |
| Hartford Small Company HLS Fund |
| Approval of Investment Management and Investment Sub-Advisory Agreements (Unaudited) |
Section 15(c) of the Investment Company Act of 1940, as amended (the “1940 Act”), requires that each mutual fund’s board of directors, including a majority of those directors who are not “interested persons” of the mutual fund, as defined in the 1940 Act (the “Independent Directors”), annually review and consider the continuation of the mutual fund’s investment advisory and sub-advisory agreements. At its meeting held on August 6-7, 2013, the Board of Directors (the “Board”) of Hartford Series Fund, Inc., including each of the Independent Directors, unanimously voted to approve the continuation of the investment management agreement for Hartford Small Company HLS Fund (the “Fund”) with Hartford Funds Management Company, LLC (“HFMC”) and the continuation of the investment sub-advisory agreement between HFMC and the Fund’s sub-adviser, Wellington Management Company, LLP (the “Sub-adviser,” and together with HFMC, the “Advisers”) (collectively, the “Agreements”).
In the months preceding the August 6-7, 2013 meeting, the Board requested, received, and reviewed written responses from the Advisers to questions posed to them on behalf of the Independent Directors and supporting materials relating to those questions and responses. The Board considered information furnished to the Board at its meetings throughout the year, as well as information specifically prepared in connection with the annual approval of the Agreements at the Board’s meetings held on June 18-19, 2013 and August 6-7, 2013. Information provided to the Board at its meetings throughout the year included, among other things, reports on Fund performance, legal and compliance matters, sales and marketing activity, shareholder services, and the other services provided to the Fund by the Advisers and their affiliates. The Board also received in-person presentations by Fund officers and representatives of HFMC at the Board’s meetings on June 18-19, 2013 and August 6-7, 2013 concerning the Agreements.
The Independent Directors, advised by independent legal counsel, engaged two service providers to assist them with evaluating the Agreements with respect to the Fund. Lipper Inc. (“Lipper”), an independent provider of investment company data, was retained to provide the Board with reports on how the Fund’s contractual management fees, actual management fees, other non-management fees, overall expense ratios and investment performance compared to those of mutual funds with similar investment objectives. The Independent Directors also engaged an independent financial services consulting firm (the “Consultant”) to assist them in evaluating the Fund’s management fees, sub-advisory fees, other non-management fees, overall expense ratios and investment performance. In addition, the Consultant reviewed the profitability calculations utilized by HFMC in connection with the continuation of the investment management agreement.
In determining whether to continue the Agreements for the Fund, the members of the Board reviewed and evaluated information and factors they believed to be relevant and appropriate in light of the information that the Board deemed necessary and appropriate through the exercise of its reasonable business judgment. While individual members of the Board may have weighed certain factors differently, the Board’s determination to continue the Agreements was based on a comprehensive consideration of all information provided to the Board throughout the year and specifically with respect to the continuation of the Agreements. A more detailed discussion of the factors the Board considered with respect to its approval of the Agreements is provided below.
Nature, Extent, and Quality of Services Provided by the Advisers
The Board requested and considered information concerning the nature, extent, and quality of the services provided to the Fund by the Advisers. The Board considered, among other things, the terms of the Agreements and the range of services provided by the Advisers. The Board considered the Advisers’ professional personnel who provide services to the Fund, including each Adviser’s ability and experience in attracting and retaining qualified personnel to service the Fund. The Board considered each Adviser’s reputation and overall financial strength, as well as its willingness to consider and implement organizational and operational changes designed to improve services to the Fund. In addition, the Board considered the quality of each Adviser’s communications with the Board and responsiveness to Board inquiries.
The Board also requested and evaluated information concerning each Adviser’s regulatory and compliance environment. In this regard, the Board requested and reviewed information on each Adviser’s compliance policies and procedures, compliance history, and a report from the Fund’s Chief Compliance Officer on each Adviser’s compliance with applicable laws and regulations, including responses to regulatory developments and compliance issues raised by regulators. The Board also noted the Advisers’ support of the Fund’s compliance control structure, particularly the resources devoted by the Advisers in support of the Fund’s obligations pursuant to Rule 38a-1 under the 1940 Act.
With respect to HFMC, the Board noted that under the Agreements, HFMC is responsible for the management of the Fund, including overseeing fund operations and service providers, as well as investment advisory services in connection with selecting,
| 31 |
| Hartford Small Company HLS Fund |
| Approval of Investment Management and Investment Sub-Advisory Agreements (Unaudited) – (continued) |
monitoring and supervising the Sub-adviser. The Board considered HFMC’s ongoing monitoring of people, process and performance, including its quarterly reviews of each of the Hartford Funds, semi-annual meetings with the leaders of each Fund’s portfolio management team, and oversight of the Funds’ approximately 40 portfolio managers. The Board recognized that HFMC has demonstrated a record of making changes to the management and/or strategies of the Funds when warranted. The Board considered HFMC’s oversight of the Sub-adviser’s investment approach and results, process for monitoring best execution of portfolio trades by the Sub-adviser, and approach to risk management with respect to the Fund and the service providers to the Fund. The Board also considered HFMC’s oversight of compliance with the Fund’s objective and policies as well as with applicable laws and regulations, noting that regulatory and other developments had over time led to an increase in the scope of HFMC’s services in this regard.
In addition, the Board considered HFMC’s ongoing commitment to review and rationalize the Hartford Funds product line-up and the expenses that HFMC had incurred in connection with fund combinations in recent years. The Board considered that HFMC or its affiliates are responsible for providing the Fund’s officers. The Board also noted that Hartford Life Insurance Company (“HLIC”) provides administrative services to the Fund. The Board considered its experiences with HFMC and HLIC with respect to each of these services.
With respect to the Sub-adviser, who provides day-to-day portfolio management services, the Board considered the quality of the Fund’s portfolio managers, the Sub-adviser’s other investment personnel, its investment philosophy and process, investment research capabilities and resources, performance record, trade execution capabilities and experience. The Board considered the experience of the Fund’s portfolio managers, the number of accounts managed by the portfolio managers, and the Sub-adviser’s method for compensating the portfolio managers.
Based on these considerations, the Board concluded that it was satisfied with the nature, extent and quality of the services provided to the Fund by HFMC and the Sub-adviser.
Performance of the Fund and the Advisers
The Board considered the investment performance of the Fund. In this regard, the Board reviewed the performance of the Fund over different time periods presented in the materials and evaluated HFMC’s analysis of the Fund’s performance for these time periods. The Board considered information and materials provided to the Board by the Advisers concerning Fund performance, as well as information from Lipper comparing the investment performance of the Fund to an appropriate benchmark and universe of peer funds. The Board noted that the Fund’s performance was in the 3rd quintile of its performance universe for the 1- and 3-year periods and the 4th quintile for the 5-year period. The Board also noted that the Fund’s performance was below its benchmark for the 1- and 5-year periods and in line with its benchmark for the 3-year period.
The Board considered the detailed investment analytics reports provided by Hartford Funds’ Investment Advisory Group throughout the year. These reports include, among other things, information on the Fund’s gross and net returns, the Fund’s investment performance relative to an appropriate benchmark and peer group, various statistics concerning the Fund’s portfolio, and a narrative summary of various factors affecting Fund performance. The Board considered the Advisers’ cooperation with the Investment Committee, which assists the Board in evaluating the performance of the Fund at periodic meetings throughout the year. The Board also considered the analysis provided by the Consultant relating to the Fund’s performance track record.
In light of all the considerations noted above, the Board concluded that it had continued confidence in HFMC’s and the Sub-adviser’s overall capabilities to manage the Fund.
Costs of the Services and Profitability of the Advisers
The Board reviewed information regarding HFMC’s cost to provide investment management and related services to the Fund and HFMC’s profitability, both overall and for the Fund, on a pre-tax basis without regard to distribution expenses. The Board also requested and reviewed information about the profitability to HFMC and its affiliates from all services provided to the Fund and all aspects of their relationship with the Fund. The Board also requested and received information relating to the operations and profitability of the Sub-adviser.
| 32 |
The Board considered the Consultant’s review of the profitability calculations utilized by HFMC in connection with the continuation of the investment management agreement, noting the Consultant’s view that Hartford Funds’ process for calculating and reporting Fund profitability is reasonable. In this regard, the Board noted that the Consultant had previously performed a full review of this process and reported that such process is sound and well within common industry practice.
Based on these considerations, the Board concluded that the profits anticipated to be realized by the Advisers and their affiliates from their relationships with the Fund would not be excessive.
Comparison of Fees and Services Provided by the Advisers
The Board considered comparative information with respect to the management fees to be paid by the Fund to HFMC and the total expense ratios of the Fund. The Board also considered comparative information with respect to the sub-advisory fees to be paid by HFMC to the Sub-adviser. In this regard, the Board requested and reviewed information from HFMC and the Sub-adviser relating to the management and sub-advisory fees, including the sub-advisory fee schedule for the Fund, and total operating expenses for the Fund. The Board considered that the management fee for the Fund includes the fee paid to HLIC for providing certain administrative services to the Fund. With respect to the sub-advisory fee schedule, the Board considered representations from HFMC and the Sub-adviser that the Sub-adviser’s fees were negotiated at arm’s length. The Board also reviewed information from Lipper comparing the Fund’s contractual management fees, actual management fees and overall expense ratios relative to a group of funds selected by Lipper, in consultation with the Consultant, and a broader universe of funds selected by Lipper. The Board noted that the Fund’s contractual management fee was in the 2nd quintile of its expense group, while its actual management fee and total expenses (less 12b-1 and shareholder service fees) were in the 1st quintile.
While the Board recognized that comparisons between the Fund and peer funds are imprecise, given the differing service levels and characteristics of mutual funds and the different business models and cost structures of the Advisers, the comparative information provided by Lipper assisted the Board in evaluating the reasonableness of the Fund’s management and sub-advisory fees and total operating expenses. In addition, the Board considered the analysis and recommendations of the Consultant relating to the Fund’s management and sub-advisory fees and total operating expenses.
Based on these considerations, the Board concluded that the Fund’s fees and total operating expenses, in conjunction with the information about quality of services, profitability, economies of scale, and other matters discussed, were reasonable in light of the services provided.
Economies of Scale
The Board requested and considered information regarding the Advisers’ realization of economies of scale with respect to the Fund and whether the fee levels reflect these economies of scale for the benefit of the Fund’s shareholders. The Board reviewed the breakpoints in the management fee schedule for the Fund, which reduce fee rates as Fund assets grow over time. The Board recognized that a fund with assets beyond the last breakpoint level will continue to benefit from economies of scale because additional assets are charged the lowest breakpoint fee resulting in lower overall effective management fee rates. The Board also recognized that a fee schedule that reaches a lower breakpoint quickly provides shareholders with the benefit of anticipated or potential economies of scale. The Board noted the effect of the sale and run-off of the variable annuity business on the HLS Funds.
The Board reviewed and evaluated materials from Lipper showing how management fee schedules of peer funds reflect economies of scale for the benefit of shareholders as a peer fund’s assets hypothetically increase over time. Based on information provided by HFMC, Lipper, and the Consultant, the Board recognized that there is no uniform methodology for establishing breakpoints or uniform pattern in asset levels that trigger breakpoints or the amounts of breakpoints triggered.
After considering all of the information available to it, the Board concluded that it was satisfied with the extent to which economies of scale would be shared for the benefit of the Fund’s shareholders based on currently available information and the effective advisory fees and expense ratios for the Fund at its current and reasonably anticipated asset levels. The Board noted, however, that it would continue to monitor future growth in Fund assets and the appropriateness of additional breakpoints.
| 33 |
| Hartford Small Company HLS Fund |
| Approval of Investment Management and Investment Sub-Advisory Agreements (Unaudited) – (continued) |
Other Benefits
The Board considered other benefits to the Advisers and their affiliates from their relationships with the Fund, including the role of the Fund in supporting the variable life insurance and variable annuity products offered by The Hartford.
The Board reviewed information noting that HLIC, an affiliate of HFMC, receives fees for providing certain administrative services to the Fund and that HFMC receives fees for fund accounting and related services from the Fund. The Board considered information on profits to HLIC and HFMC for such services. The Board also considered that Hartford Administrative Services Company (“HASCO”), the Fund’s transfer agent and an affiliate of HFMC, receives transfer agency compensation from the Fund, and the Board reviewed information on the profitability of the Fund’s transfer agency function to HASCO. The Board considered information provided by HASCO indicating that the transfer agent fees charged by HASCO to the Fund were fair and reasonable based on publicly available information.
The Board also considered that Hartford Funds Distributors, LLC (“HFD”), an affiliate of HFMC, serves as principal underwriter of the Fund. As principal underwriter, HFD receives 12b-1 fees from the Fund. The Board also noted that certain affiliates of HFD distribute shares of the Fund and receive compensation in that connection.
The Board considered benefits to the Sub-adviser from its use of the Fund’s brokerage commissions to obtain soft dollar research, and representations from HFMC and the Sub-adviser that the Sub-adviser would not make any revenue-sharing payments or any other type of distribution payments to HFMC or its affiliates.
The Board considered the benefits to shareholders of being part of the Hartford Funds family of funds. The Board considered HFMC’s efforts to provide investors in the family with a broad range of investment styles and asset classes.
* * * *
Based upon its review of these various factors, among others, the Board concluded that it is in the best interests of the Fund and its shareholders for the Board to approve the Agreements for an additional year. In reaching this decision, the Board did not assign relative weights to the factors discussed above or deem any one or group of them to be controlling in and of themselves. In connection with their deliberations, the Independent Directors met separately in executive session on several occasions, with independent legal counsel and the Consultant, to review the relevant materials and consider their responsibilities under relevant laws and regulations.
| 34 |
| Hartford Small Company HLS Fund |
| Main Risks (Unaudited) |
The main risks of investing in the Fund are described below.
Market, Selection, and Strategy Risk: The Fund’s share price may fluctuate due to market risk and/or security selections that may underperform the market or relevant benchmarks. If the sub-adviser’s investment strategy does not perform as expected, the Fund could underperform its peers or lose money. There is no guarantee the Fund will achieve its stated objective.
Small-cap Stock Risk: Small-cap stocks are generally more volatile and risky and may be less liquid than large-cap stocks because they may have limited operating histories, narrow product lines, and focus on niche markets.
Foreign Investment Risk: Foreign investments can be riskier than U.S. investments. Potential risks include currency risk that may result from unfavorable exchange rates, liquidity risk if decreased demand for a security makes it difficult to sell at the desired price, and risks that stem from substantially lower trading volume on foreign markets.
Active Trading Risk: Actively trading investments may result in higher costs (thus affecting performance).
| 35 |
THIS PRIVACY POLICY IS NOT PART OF THIS REPORT
Privacy Policy and Practices of The Hartford Financial Services Group, Inc. and its Affiliates
(herein called “we, our, and us”)
This Privacy Policy applies to our United States Operations
We value your trust. We are committed to the responsible: a) management; b) use; and c) protection; of Personal Information. This notice describes how we collect, disclose, and protect Personal Information.
We collect Personal Information to: a) service your Transactions with us; and b) support our business functions.
We may obtain Personal Information from: a) You; b) your Transactions with us; and c) third parties such as a consumer-reporting agency.
Based on the type of product or service You apply for or get from us, Personal Information such as: a) your name; b) your address; c) your income; d) your payment; or e) your credit history; may be gathered from sources such as applications, Transactions, and consumer reports.
To serve You and service our business, we may share certain Personal Information. We will share Personal Information, only as allowed by law, with affiliates such as: a) our insurance companies; b) our employee agents; c) our brokerage firms; and d) our administrators.
As allowed by law, we may share Personal Financial Information with our affiliates to: a) market our products; or b) market our services; to You without providing You with an option to prevent these disclosures. | We may also share Personal Information, only as allowed by law, with unaffiliated third parties including:
When allowed by law, we may share certain Personal Financial Information with other unaffiliated third parties who assist us by performing services or functions such as:
We, and third parties we partner with, may track some of the pages You visit through the use of: a) cookies; b) pixel tagging; or c) other technologies; and currently do not process or comply with any web browser’s “do not track” signal or similar mechanism that indicates a request to disable online tracking of individual users who visit our websites or use our services.
We will not sell or share your Personal Financial Information with anyone for purposes unrelated to our business functions without offering You the opportunity to:
We only disclose Personal Health Information with:
Our employees have access to Personal Information in the course of doing their jobs, such as: |
We use manual and electronic security procedures to maintain: a) the confidentiality; and b) the integrity of; Personal Information that we have. We use these procedures to guard against unauthorized access.
Some techniques we use to protect Personal Information include: a) secured files; b) user authentication; c) encryption; d) firewall technology; and e) the use of detection software.
We are responsible for and must: a) identify information to be protected; b) provide an adequate level of protection for that data; c) grant access to protected data only to those people who must use it in the performance of their job-related duties. Employees who violate our Privacy Policy will be subject to discipline, which may include ending their employment with us.
At the start of our business relationship, we will give You a copy of our current Privacy Policy.
We will also give You a copy of our current Privacy Policy once a year if You maintain a continuing business relationship with us.
We will continue to follow our Privacy Policy regarding Personal Information even when a business relationship no longer exists between us. | As used in this Privacy Notice:
Application means your request for our product or service.
Personal Financial Information means financial information such as:
Personal Health Information means health information such as:
Personal Information means information that identifies You personally and is not otherwise available to the public. It includes:
Transaction means your business dealings with us, such as:
You means an individual who has given us Personal Information in conjunction with: |
This Privacy Policy is being provided on behalf of the following affiliates of The Hartford Financial Services Group, Inc.:
1stAGChoice, Inc.; Access CoverageCorp, Inc.; Access CoverageCorp Technologies, Inc.; American Maturity Life Insurance Company; Archway 60 R, LLC; Business Management Group, Inc.; Catalyst360, LLC; Champlain Life Reinsurance Company; DMS R, LLC; Eloy R, LLC; Ersatz Corporation; First State Insurance Company; Hartford Accident and Indemnity Company; Hartford Administrative Services Company; Hartford Casualty General Agency, Inc.; Hartford Casualty Insurance Company; Hartford-Comprehensive Employee Benefit Service Company; Hartford Equity Sales Company, Inc.; Hartford Fire General Agency, Inc.; Hartford Fire Insurance Company; Hartford Funds Management Company, LLC; Hartford Funds Management Group, Inc.; Hartford HLS Series Fund II, Inc.; Hartford Insurance Company of Illinois; Hartford Insurance Company of the Midwest; Hartford Insurance Company of the Southeast; Hartford Integrated Technologies, Inc.; Hartford International Life Reassurance Corporation; Hartford Funds Distributors, LLC; Hartford Investment Management Company; Hartford Life and Accident Insurance Company; Hartford Life and Annuity Insurance Company; Hartford Life Insurance Company; Hartford Life Private Placement, LLC; Hartford Lloyd’s Corporation; Hartford Lloyd’s Insurance Company; Hartford Mezzanine Investors I, LLC; Hartford Residual Market, L.C.C.; Hartford Retirement Services, LLC; Hartford Securities Distribution Company, Inc.; Hartford Series Fund, Inc.; Hartford Specialty Insurance Services of Texas, LLC; Hartford Strategic Investments, LLC; Hartford Underwriters Insurance Company; Hartford Technology Services Company, L.L.C.; Hartford of Texas General Agency, Inc.; Hartford Underwriters General Agency, Inc.; HARTRE Company, L.C.C.; HL Investment Advisors, LLC; HLA LLC; Horizon Management Group, LLC; HRA Brokerage Services, Inc.; Lanidex Class B, LLC; M-CAP Insurance Agency, LLC; New England Insurance Company; New England Reinsurance Corporation; Nutmeg Insurance Agency, Inc.; Nutmeg Insurance Company; Pacific Insurance Company, Limited; Planco, LLC: Property and Casualty Insurance Company of Hartford; Revere R, LLC; RVR R, LLC; Sentinel Insurance Company, Ltd.; Sunstone R, LLC; Symphony R, LLC; The Evergreen Group Incorporated; The Hartford Alternative Strategies Fund; The Hartford Mutual Funds, Inc.; The Hartford Mutual Funds II, Inc.; Trumbull Flood Management, L.L.C.; Trumbull Insurance Company; Twin City Fire Insurance Company; White River Life Reinsurance Company.
HPP Revised December 2013
HARTFORD HLS FUNDS
c/o The Hartford Wealth Management - Global Annuities
P.O. Box 14293
Lexington, KY 40512-4293
HARTFORDFUNDS
hartfordfunds.com
Hartford Series Fund, Inc. is underwritten and distributed by Hartford Funds Distributors, LLC.
Hartford Series Fund, Inc. inception dates range from 1977 to date. Hartford Series Fund, Inc. is not a subsidiary of The Hartford Financial Services Group, Inc. ("The Hartford") but is underwritten, distributed by and advised by subsidiaries of The Hartford. Investments in Hartford Series Fund, Inc. are not guaranteed by The Hartford or any other entity.
This report is submitted for the general information of the shareholders of the Funds. It is not authorized for distribution unless preceded or accompanied by a current prospectus for the Funds.
Investors should carefully consider the investment objectives, risks, charges, and expenses of Hartford Funds before investing. This and other information can be found in the prospectus and summary prospectus, which can be obtained by calling 888-843-7824 (retail) or 877-836-5854 (institutional). Investors should read them carefully before they invest.
HLSAR-SC13 2-14 113551-2 Printed in U.S.A ©2013 The Hartford, Hartford, CT 06115
HARTFORDFUNDS
| HARTFORD STOCK HLS FUND
2013 Annual Report
|
A MESSAGE FROM THE PRESIDENT
Dear Fellow Shareholders:
Thank you for investing in Hartford HLS Funds.
Market Review
U.S. equities (as represented by the S&P 500 Index) generated their strongest year since 1997 in 2013, rising 32.39% for the year. During the fourth quarter, equities rose without looking back, pushing the S&P 500 Index and the Dow Jones Industrial Average to new all-time highs. Despite previously cheering delays to quantitative-easing tapering, the stock market received an additional boost at the end of the year following the U.S. Federal Reserve’s (Fed) announcement of a $10-billion-a-month reduction in bond purchases beginning in January.
The Fed’s decision to begin tapering its bond purchases is generally considered a vote of confidence in the recovering U.S. economy. Consumer spending has stabilized, the housing market is showing steady improvement, the unemployment rate is slowly declining and economic growth clocked in at a healthy 4.1% in the third quarter. Equities have also recovered since the market low in March 2009: The S&P 500 Index has gained 173% from the market low through December 31, 2013.
Signs of improvement are also visible outside the U.S. Europe appears to have begun its own economic recovery, and emerging markets have reversed their recent lackluster performance. Fiscal policy continues to wield significant influence in today’s economy and central banks across the globe are maintaining their accommodative stances, including the appointment of Janet Yellen, who is widely expected to continue current monetary policies, to succeed Ben Bernanke as U.S. Federal Reserve chairman.
It’s important to stay abreast of domestic and international economic developments while balancing your individual investment goals. Meeting with your financial advisor on a regular basis to examine your current investment strategy can help you determine whether you are on the right track:
| • | Is your portfolio fully diversified with an appropriate mix of stocks and bonds? |
| • | Is your portfolio incorporating both domestic and international holdings to take advantage of the global economic recovery? |
| • | Are your investments still in line with your risk tolerance and investment time horizon? |
Your financial advisor can help you choose options within our fund family to navigate today’s markets with confidence.
Thank you again for investing with Hartford HLS Funds.
James Davey
President
Hartford HLS Funds
1The S&P 500 Index is a market capitalization-weighted price index composed of 500 widely held common stocks.
2The Dow Jones Industrial Average is an unmanaged, price-weighted index of 30 of the largest, most widely held stocks traded on the New York Stock Exchange.
Table of Contents
This report is prepared for the general information of contract owners and qualified retirement plan participants. It is not an offer of contracts or of qualified retirement plans. It should not be used in connection with any offer, except in conjunction with the appropriate product prospectus which contains all pertinent information including the applicable sales, administrative and other charges.
The views expressed in the Fund’s Manager Discussion under ‘‘Why did the Fund perform this way?’’ and ‘‘What is the outlook?’’ are views of the Fund’s sub-adviser and portfolio management team through the end of the period and are subject to change based on market and other conditions. The Fund’s Manager Discussion is for informational purposes only and does not represent an offer, recommendation or solicitation to buy, hold or sell any security. The specific securities identified and described, if any, do not represent all of the securities purchased or sold and you should not assume that investments in the securities identified and discussed will be profitable.
| Hartford Stock HLS Fund inception 08/31/1977 |
| (sub-advised by Wellington Management Company, LLP) |
| Investment objective – Seeks long-term growth of capital. |
Performance Overview 12/31/03 – 12/31/13

The chart above represents the hypothetical growth of a $10,000 investment in Class IA. Growth results in classes other than Class IA will vary from what is seen above due to differences in the expenses charged to those share classes.
Average Annual Total Returns (as of 12/31/13)
| 1 Year | 5 Years | 10 Years | ||||
| Stock IA | 32.25% | 19.44% | 6.72% | |||
| Stock IB | 31.92% | 19.14% | 6.46% | |||
| Russell 1000 Index | 33.11% | 18.59% | 7.78% |
PERFORMANCE DATA QUOTED REPRESENTS PAST PERFORMANCE AND DOES NOT GUARANTEE FUTURE RESULTS. The investment return and principal value of the investment will fluctuate so that investors’ shares, when redeemed, may be worth more or less than their original cost. Current performance may be lower or higher than the performance data quoted. To obtain performance data current to the most recent month-end, please visit our website at www.hartfordfunds.com.
Total returns presented above were calculated using the Fund’s net asset value available to shareholders for sale or redemption of Fund shares on December 31, 2013, which may exclude investment transactions as of this date. All share class returns assume the reinvestment of all distributions at net asset value and the deduction of all fund expenses.
Russell 1000 Index is an unmanaged index which measures the performance of the 1,000 largest companies in the Russell 3000 Index, which measures the performance of the 3,000 largest U.S. companies, based on total market capitalization.
You cannot invest directly in an index.
As of the Fund's current prospectus dated May 1, 2013, the total annual operating expense ratios for Class IA and Class IB were 0.51% and 0.76%, respectively. Actual expenses may be higher. Please see the accompanying Financial Highlights for expense ratios for the year ended December 31, 2013.
The chart and table do not reflect the deductions of taxes, sales charges or other fees which may be applied at the variable life insurance, variable annuity or qualified retirement plan product level. Any such additional sales charges or other fees or expenses would lower the contract’s or plan’s performance.
All investments are subject to risk including the possible loss of principal. For a discussion of the Fund’s risks, please see the Main Risks section of this report. For more detailed information on the risks associated with an investment in the Fund, please see the prospectus.
| 2 |
| Hartford Stock HLS Fund |
| Manager Discussion |
| December 31, 2013 (Unaudited) |
| Portfolio Managers |
| Donald J. Kilbride |
| Senior Vice President and Equity Portfolio Manager |
How did the Fund perform?
The Class IA shares of the Hartford Stock HLS Fund returned 32.25% for the twelve-month period ended December 31, 2013, underperforming the Fund’s benchmark, the Russell 1000 Index, which returned 33.11% for the same period. The Fund, however, outperformed the 31.34% average return of the Variable Products-Underlying Funds Lipper Large-Cap Core Funds peer group, a group of funds with investment strategies similar to those of the Fund.
Why did the Fund perform this way?
U.S. equities reached another all-time high in December and finished 2013 with a gain of 32.4%, as measured by the S&P 500 Index, the Index’s best return since 1997. The rally in U.S. equities began on the first trading day of the year after a last-minute compromise by the U.S. Congress averted the fiscal cliff. Optimism surrounding the fiscal reprieve was furthered during the first quarter by better-than-expected corporate earnings, a robust housing market, and a steadily improving employment picture. Solid gains in April and the first part of May paused following comments by U.S. Federal Reserve (Fed) Chairman Ben Bernanke that suggested the Fed might begin to slow quantitative easing sooner than investors anticipated. Nonetheless, equities resumed their ascent in the third quarter as the surprising “no taper” decision by the Federal Open Market Committee eased near-term concerns about rapidly rising interest rates derailing the recovery. Additionally, accommodative rhetoric from the European Central Bank, along with encouraging data in China and further evidence of a European economic recovery, contributed to a broad-based global equity rally that extended through the end of the year. In December, the year ended with an optimistic tone as investors cheered the elimination of two market overhangs: the timing of Fed tapering and the threat of another US government shutdown in early 2014.
Overall equity market performance was positive for the period across all market capitalizations: large cap (+33%), mid cap (+34%) and small cap equities (+39%) all rose meaningfully, as represented by the Russell 1000, S&P 400 MidCap, and Russell 2000 Indices, respectively. During the twelve-month period all ten sectors rose within the Russell 1000 Index, led by Consumer Discretionary (+44%), Industrials (+42%), and Health Care (+42%). Telecommunication Services (+14%), Utilities (+15%), and Materials (+24%) lagged on a relative basis.
The Fund’s underperformance versus the benchmark was primarily driven by weak security selection within Consumer Discretionary, Health Care, and Energy. Sector allocation, a residual of the bottom-up stock selection process, contributed positively to relative performance due to an overweight to Health Care and an underweight to Telecommunication Services. This performance was partially offset by a modest cash position in a generally rising market environment.
Stocks that detracted the most from benchmark relative returns during the period were Enbridge (Energy), Target (Consumer Discretionary) and CH Robinson Worldwide (Industrials). Shares of Enbridge, a transporter and distributor of energy across North America, underperformed during the period as some investors were disappointed by management's cautious tone for the remainder of the year (during the second quarter). Additionally, a large secondary offering added temporary pressure on the shares. Shares of Target, a discount retailer, underperformed after the company reported a third quarter miss in its Canadian operations, which overshadowed U.S. earnings that tracked within guidance. Shares of CH Robinson Worldwide, a freight transportation services and logistics solutions provider, fell after the company announced disappointing earnings, which were challenged by a slow volume recovery. IBM (Information Technology) was also among top detractors from performance on an absolute basis.
Top contributors to relative performance during the period were Apple (Information Technology), Cardinal Health (Health Care), and Lockheed Martin (Industrials). Shares of Apple, a designer, manufacturer, and retailer of a range of interconnected computing devices and personal electronic products, underperformed as the company had mixed results during the period. Apple missed revenue expectations and issued disappointing earnings guidance early in the period, and posted strong earnings due to robust iPhone sales and promising growth in China later in the period. Not holding the benchmark component during the period aided relative performance. Shares of global pharmaceutical distributor Cardinal Health surged after the firm posted a 25% year-over-year quarterly profit jump and hiked its earnings forecast for next year. Lockheed Martin, a security and aerospace company, saw its shares rise after reporting higher-than-expected profits and improved margins. Microsoft (Information Technology) also contributed to performance on an absolute basis.
| 3 |
| Hartford Stock HLS Fund |
| Manager Discussion – (continued) |
| December 31, 2013 (Unaudited) |
Derivatives are not used in a significant manner in this Fund and did not have a material impact on performance during the period.
What is the outlook?
As has been the case for much of the last few years, we remain highly cautious in our investment posture. The reasons remain the same. In our opinion, soft, underlying economic conditions globally are being masked by central bank liquidity measures. While we remain uncertain as to the virtue of such programs from a public policy perspective, we believe these measures have buoyed the markets. And when ultimately unwound, we believe they present risk to all assets, especially stocks.
We therefore have remained singularly focused on enhancing the quality of the Fund every day using dividend growth as our primary lens.
At the end of the period, our bottom-up investment approach resulted in overweight exposures in Health Care, Consumer Staples, and Consumer Discretionary as we continued to find attractive investment opportunities in these sectors. The Fund’s largest underweights, relative to the Russell 1000 Index, were in Information Technology, Financials, and Telecommunication Services.
Diversification by Sector
as of December 31, 2013
| Sector | Percentage of Net Assets | |||
| Equity Securities | ||||
| Consumer Discretionary | 17.1 | % | ||
| Consumer Staples | 13.1 | |||
| Energy | 8.4 | |||
| Financials | 10.5 | |||
| Health Care | 18.1 | |||
| Industrials | 13.8 | |||
| Information Technology | 11.3 | |||
| Materials | 4.1 | |||
| Utilities | 1.2 | |||
| Total | 97.6 | % | ||
| Short-Term Investments | 2.2 | |||
| Other Assets and Liabilities | 0.2 | |||
| Total | 100.0 | % | ||
A sector may be comprised of several industries. For Fund compliance purposes, the Fund may not use the same classification system and these sector classifications are used for reporting ease.
| 4 |
| Hartford Stock HLS Fund |
| Schedule of Investments |
| December 31, 2013 |
| (000’s Omitted) |
| Shares or Principal Amount | Market Value ╪ | |||||||
| COMMON STOCKS - 97.6% | ||||||||
| Banks - 3.4% | ||||||||
| 406 | PNC Financial Services Group, Inc. | $ | 31,490 | |||||
| 699 | Wells Fargo & Co. | 31,752 | ||||||
| 63,242 | ||||||||
| Capital Goods - 10.8% | ||||||||
| 299 | Emerson Electric Co. | 20,991 | ||||||
| 397 | General Dynamics Corp. | 37,962 | ||||||
| 332 | Honeywell International, Inc. | 30,321 | ||||||
| 302 | Lockheed Martin Corp. | 44,887 | ||||||
| 219 | Northrop Grumman Corp. | 25,044 | ||||||
| 374 | United Technologies Corp. | 42,569 | ||||||
| 201,774 | ||||||||
| Consumer Durables and Apparel - 3.5% | ||||||||
| 698 | Mattel, Inc. | 33,231 | ||||||
| 416 | NIKE, Inc. Class B | 32,694 | ||||||
| 65,925 | ||||||||
| Consumer Services - 2.8% | ||||||||
| 532 | McDonald's Corp. | 51,601 | ||||||
| Diversified Financials - 1.7% | ||||||||
| 103 | BlackRock, Inc. | 32,715 | ||||||
| Energy - 8.4% | ||||||||
| 1,505 | BG Group plc | 32,389 | ||||||
| 341 | Chevron Corp. | 42,554 | ||||||
| 763 | Enbridge, Inc. | 33,307 | ||||||
| 300 | Exxon Mobil Corp. | 30,339 | ||||||
| 194 | Occidental Petroleum Corp. | 18,405 | ||||||
| 156,994 | ||||||||
| Food and Staples Retailing - 4.6% | ||||||||
| 509 | CVS Caremark Corp. | 36,407 | ||||||
| 623 | Wal-Mart Stores, Inc. | 49,019 | ||||||
| 85,426 | ||||||||
| Food, Beverage and Tobacco - 5.2% | ||||||||
| 315 | Anheuser-Busch InBev N.V. | 33,496 | ||||||
| 763 | Coca-Cola Co. | 31,518 | ||||||
| 949 | Diageo Capital plc | 31,462 | ||||||
| 96,476 | ||||||||
| Health Care Equipment and Services - 6.8% | ||||||||
| 666 | Cardinal Health, Inc. | 44,518 | ||||||
| 684 | Medtronic, Inc. | 39,258 | ||||||
| 584 | UnitedHealth Group, Inc. | 43,968 | ||||||
| 127,744 | ||||||||
| Household and Personal Products - 3.3% | ||||||||
| 416 | Colgate-Palmolive Co. | 27,124 | ||||||
| 430 | Procter & Gamble Co. | 35,038 | ||||||
| 62,162 | ||||||||
| Insurance - 4.3% | ||||||||
| 362 | ACE Ltd. | 37,443 | ||||||
| 200 | Chubb Corp. | 19,309 | ||||||
| 499 | Marsh & McLennan Cos., Inc. | 24,152 | ||||||
| 80,904 | ||||||||
| Materials - 4.1% | ||||||||
| 298 | Ecolab, Inc. | 31,028 | ||||||
| 353 | Praxair, Inc. | 45,871 | ||||||
| 76,899 | ||||||||
| Media - 3.6% | ||||||||
| 527 | Omnicom Group, Inc. | 39,192 | ||||||
| 381 | Walt Disney Co. | 29,083 | ||||||
| 68,275 | ||||||||
| Pharmaceuticals, Biotechnology and Life Sciences - 11.3% | ||||||||
| 265 | Amgen, Inc. | 30,301 | ||||||
| 479 | Johnson & Johnson | 43,858 | ||||||
| 973 | Merck & Co., Inc. | 48,720 | ||||||
| 877 | Pfizer, Inc. | 26,865 | ||||||
| 152 | Roche Holding AG | 42,497 | ||||||
| 480 | Teva Pharmaceutical Industries Ltd. ADR | 19,227 | ||||||
| 211,468 | ||||||||
| Real Estate - 1.1% | ||||||||
| 135 | Public Storage REIT | 20,350 | ||||||
| Retailing - 7.2% | ||||||||
| 9,440 | Allstar Co. ⌂●† | 20,482 | ||||||
| 715 | Lowe's Cos., Inc. | 35,411 | ||||||
| 665 | Target Corp. | 42,092 | ||||||
| 585 | TJX Cos., Inc. | 37,271 | ||||||
| 135,256 | ||||||||
| Software and Services - 11.3% | ||||||||
| 428 | Accenture plc | 35,177 | ||||||
| 536 | Automatic Data Processing, Inc. | 43,286 | ||||||
| 220 | IBM Corp. | 41,267 | ||||||
| 1,363 | Microsoft Corp. | 51,018 | ||||||
| 1,051 | Oracle Corp. | 40,200 | ||||||
| 210,948 | ||||||||
| Transportation - 3.0% | ||||||||
| 538 | United Parcel Service, Inc. Class B | 56,502 | ||||||
| Utilities - 1.2% | ||||||||
| 360 | Dominion Resources, Inc. | 23,312 | ||||||
| Total common stocks | ||||||||
| (cost $1,403,534) | $ | 1,827,973 | ||||||
| Total long-term investments | ||||||||
| (cost $1,403,534) | $ | 1,827,973 | ||||||
| SHORT-TERM INVESTMENTS - 2.2% | ||||||||
| Repurchase Agreements - 2.2% | ||||||||
| Bank of America Merrill Lynch TriParty Repurchase Agreement (maturing on 01/02/2014 in the amount of $2,025, collateralized by GNMA 4.00%, 2043, value of $2,066) | ||||||||
| $ | 2,025 | 0.005%, 12/31/2013 | $ | 2,025 | ||||
| Bank of Montreal TriParty Repurchase Agreement (maturing on 01/02/2014 in the amount of $1,946, collateralized by FNMA 1.58% - 4.50%, 2020 - 2043, U.S. Treasury Note 0.25% - 4.00%, 2015 - 2020, value of $1,985) | ||||||||
| 1,946 | 0.01%, 12/31/2013 | 1,946 | ||||||
The accompanying notes are an integral part of these financial statements.
| 5 |
| Hartford Stock HLS Fund |
| Schedule of Investments – (continued) |
| December 31, 2013 |
| (000’s Omitted) |
| Shares or Principal Amount | Market Value ╪ | |||||||||||
| SHORT-TERM INVESTMENTS - 2.2% - (continued) | ||||||||||||
| Repurchase Agreements - 2.2% - (continued) | ||||||||||||
| Bank of Montreal TriParty Repurchase Agreement (maturing on 01/02/2014 in the amount of $6,892, collateralized by FHLMC 3.00% - 5.00%, 2019 - 2043, FNMA 0.76% - 6.00%, 2016 - 2043, GNMA 1.50% - 5.25%, 2028 - 2043, value of $7,030) | ||||||||||||
| $ | 6,892 | 0.02%, 12/31/2013 | $ | 6,892 | ||||||||
| Barclays Capital TriParty Repurchase Agreement (maturing on 01/02/2014 in the amount of $6,216, collateralized by U.S. Treasury Note 0.50% - 2.25%, 2017, value of $6,340) | ||||||||||||
| 6,216 | 0.01%, 12/31/2013 | 6,216 | ||||||||||
| Citigroup Global Markets, Inc. TriParty Repurchase Agreement (maturing on 01/02/2014 in the amount of $11,185, collateralized by U.S. Treasury Bond 3.88% - 8.13%, 2021 - 2040, U.S. Treasury Note 0.25% - 3.38%, 2014 - 2020, value of $11,408) | ||||||||||||
| 11,185 | 0.01%, 12/31/2013 | 11,185 | ||||||||||
| RBS Securities, Inc. TriParty Repurchase Agreement (maturing on 01/02/2014 in the amount of $3,634, collateralized by U.S. Treasury Note 0.25% - 1.00%, 2015 - 2017, value of $3,707) | ||||||||||||
| 3,634 | 0.01%, 12/31/2013 | 3,634 | ||||||||||
| TD Securities TriParty Repurchase Agreement (maturing on 01/02/2014 in the amount of $8,724, collateralized by FFCB 0.20% - 0.50%, 2015 - 2016, FHLMC 0.38% - 5.25%, 2014 - 2042, FNMA 0.50% - 7.13%, 2014 - 2043, value of $8,899) | ||||||||||||
| 8,724 | 0.01%, 12/31/2013 | 8,724 | ||||||||||
| UBS Securities, Inc. Repurchase Agreement (maturing on 01/02/2014 in the amount of $75, collateralized by U.S. Treasury Note 2.13%, 2015, value of $76) | ||||||||||||
| 75 | 0.01%, 12/31/2013 | 75 | ||||||||||
| 40,697 | ||||||||||||
| Total short-term investments | ||||||||||||
| (cost $40,697) | $ | 40,697 | ||||||||||
| Total investments | ||||||||||||
| (cost $1,444,231) ▲ | 99.8 | % | $ | 1,868,670 | ||||||||
| Other assets and liabilities | 0.2 | % | 3,045 | |||||||||
| Total net assets | 100.0 | % | $ | 1,871,715 | ||||||||
The accompanying notes are an integral part of these financial statements.
| 6 |
| Note: | Percentage of investments as shown is the ratio of the total market value to total net assets. |
| Prices of foreign equities that are principally traded on certain foreign markets may be adjusted daily pursuant to a fair value pricing service approved by the Board of Directors in order to reflect an adjustment for factors occurring after the close of certain foreign markets but before the close of the New York Stock Exchange. |
| ▲ | At December 31, 2013, the cost of securities for federal income tax purposes was $1,446,713 and the aggregate gross unrealized appreciation and depreciation based on that cost were: |
| Unrealized Appreciation | $ | 428,940 | ||
| Unrealized Depreciation | (6,983 | ) | ||
| Net Unrealized Appreciation | $ | 421,957 |
| † | These securities were valued in good faith at fair value as determined under policies and procedures established by and under the supervision of the Company's Board of Directors. At December 31, 2013, the aggregate value of these securities was $20,482, which represents 1.1% of total net assets. This amount excludes securities that are principally traded in certain foreign markets and whose prices are adjusted pursuant to a third party pricing service methodology approved by the Board of Directors. |
| ● | Non-income producing. |
| ⌂ | The following securities are considered illiquid. Illiquid securities are often purchased in private placement transactions, are often not registered under the Securities Act of 1933 and may have contractual restrictions on resale. A security may also be considered illiquid if the security lacks a readily available market or if its valuation has not changed for a certain period of time. |
| Period Acquired | Shares/ Par | Security | Cost Basis | |||||||
| 08/2011 | 9,440 | Allstar Co. | $ | 5,578 | ||||||
At December 31, 2013, the aggregate value of these securities was $20,482, which represents 1.1% of total net assets.
| ╪ | See Significant Accounting Policies of accompanying Notes to Financial Statements regarding valuation of securities. |
| GLOSSARY: (abbreviations used in preceding Schedule of Investments) | |
| Other Abbreviations: | |
| ADR | American Depositary Receipt |
| FFCB | Federal Farm Credit Bank |
| FHLMC | Federal Home Loan Mortgage Corp. |
| FNMA | Federal National Mortgage Association |
| GNMA | Government National Mortgage Association |
| REIT | Real Estate Investment Trust |
The accompanying notes are an integral part of these financial statements.
| 7 |
| Hartford Stock HLS Fund |
| Investment Valuation Hierarchy Level Summary |
| December 31, 2013 |
| (000’s Omitted) |
| Total | Level 1 ♦ | Level 2 ♦ | Level 3 | |||||||||||||
| Assets: | ||||||||||||||||
| Common Stocks ‡ | $ | 1,827,973 | $ | 1,667,647 | $ | 139,844 | $ | 20,482 | ||||||||
| Short-Term Investments | 40,697 | – | 40,697 | – | ||||||||||||
| Total | $ | 1,868,670 | $ | 1,667,647 | $ | 180,541 | $ | 20,482 | ||||||||
| ♦ | For the year ended December 31, 2013, there were no transfers between Level 1 and Level 2. |
| ‡ | The Fund has all or primarily all of the equity securities categorized in a particular level. Refer to the Schedule of Investments for further industry breakout. |
Following is a reconciliation of Level 3 assets for which significant unobservable inputs were used to determine fair value:
| Balance as of December 31, 2012 | Realized Gain (Loss) | Change in Unrealized Appreciation (Depreciation) | Net Amortization | Purchases | Sales | Transfers Into Level 3 | Transfers Out of Level 3 | Balance as of December 31, 2013 | ||||||||||||||||||||||||||||
| Assets: | ||||||||||||||||||||||||||||||||||||
| Common Stocks | $ | 21,169 | $ | 8,320 | $ | 1,266 | * | $ | — | $ | — | $ | (10,273 | ) | $ | — | $ | — | $ | 20,482 | ||||||||||||||||
| Total | $ | 21,169 | $ | 8,320 | $ | 1,266 | $ | — | $ | — | $ | (10,273 | ) | $ | — | $ | — | $ | 20,482 | |||||||||||||||||
| * | Change in unrealized appreciation (depreciation) in the current period relating to assets still held at December 31, 2013 was $7,170. |
| Note: | For purposes of reporting transfers between different hierarchy levels, both transfers in and out of each level, as applicable, are shown as if they occurred at the beginning of the period. |
The accompanying notes are an integral part of these financial statements.
| 8 |
| Hartford Stock HLS Fund |
| Statement of Assets and Liabilities |
| December 31, 2013 |
| (000’s Omitted) |
| Assets: | ||||
| Investments in securities, at market value (cost $1,444,231) | $ | 1,868,670 | ||
| Cash | — | |||
| Foreign currency on deposit with custodian (cost $—) | — | |||
| Receivables: | ||||
| Investment securities sold | 315 | |||
| Fund shares sold | 1,605 | |||
| Dividends and interest | 2,714 | |||
| Total assets | 1,873,304 | |||
| Liabilities: | ||||
| Payables: | ||||
| Fund shares redeemed | 1,253 | |||
| Investment management fees | 193 | |||
| Distribution fees | 11 | |||
| Accrued expenses | 132 | |||
| Total liabilities | 1,589 | |||
| Net assets | $ | 1,871,715 | ||
| Summary of Net Assets: | ||||
| Capital stock and paid-in-capital | $ | 2,010,524 | ||
| Undistributed net investment income | 927 | |||
| Accumulated net realized loss | (564,197 | ) | ||
| Unrealized appreciation of investments and the translations of assets and liabilities denominated in foreign currency | 424,461 | |||
| Net assets | $ | 1,871,715 | ||
| Shares authorized | 4,000,000 | |||
| Par value | $ | 0.001 | ||
| Class IA: Net asset value per share | $ | 58.07 | ||
| Shares outstanding | 28,709 | |||
| Net assets | $ | 1,667,278 | ||
| Class IB: Net asset value per share | $ | 58.04 | ||
| Shares outstanding | 3,522 | |||
| Net assets | $ | 204,437 |
The accompanying notes are an integral part of these financial statements.
| 9 |
| Hartford Stock HLS Fund |
| Statement of Operations |
| For the Year Ended December 31, 2013 |
| (000’s Omitted) |
| Investment Income: | ||||
| Dividends | $ | 44,237 | ||
| Interest | 23 | |||
| Less: Foreign tax withheld | (603 | ) | ||
| Total investment income, net | 43,657 | |||
| Expenses: | ||||
| Investment management fees | 8,650 | |||
| Transfer agent fees | 1 | |||
| Distribution fees - Class IB | 512 | |||
| Custodian fees | 12 | |||
| Accounting services fees | 182 | |||
| Board of Directors' fees | 48 | |||
| Audit fees | 22 | |||
| Other expenses | 308 | |||
| Total expenses (before fees paid indirectly) | 9,735 | |||
| Commission recapture | (12 | ) | ||
| Custodian fee offset | — | |||
| Total fees paid indirectly | (12 | ) | ||
| Total expenses, net | 9,723 | |||
| Net Investment Income | 33,934 | |||
| Net Realized Gain on Investments and Foreign Currency Transactions: | ||||
| Net realized gain on investments | 160,462 | |||
| Net realized gain on foreign currency contracts | 613 | |||
| Net realized loss on other foreign currency transactions | (567 | ) | ||
| Net Realized Gain on Investments and Foreign Currency Transactions | 160,508 | |||
| Net Changes in Unrealized Appreciation of Investments and Foreign Currency Transactions: | ||||
| Net unrealized appreciation of investments | 313,052 | |||
| Net unrealized appreciation on translation of other assets and liabilities in foreign currencies | 20 | |||
| Net Changes in Unrealized Appreciation of Investments and Foreign Currency Transactions | 313,072 | |||
| Net Gain on Investments and Foreign Currency Transactions | 473,580 | |||
| Net Increase in Net Assets Resulting from Operations | $ | 507,514 |
The accompanying notes are an integral part of these financial statements.
| 10 |
| Hartford Stock HLS Fund |
| Statement of Changes in Net Assets |
| (000’s Omitted) |
| For the Year Ended December 31, 2013 | For the Year Ended December 31, 2012 | |||||||
| Operations: | ||||||||
| Net investment income | $ | 33,934 | $ | 33,887 | ||||
| Net realized gain on investments and foreign currency transactions | 160,508 | 236,957 | ||||||
| Net unrealized appreciation (depreciation) of investments and foreign currency transactions | 313,072 | (18,825 | ) | |||||
| Net Increase in Net Assets Resulting from Operations | 507,514 | 252,019 | ||||||
| Distributions to Shareholders: | ||||||||
| From net investment income | ||||||||
| Class IA | (30,025 | ) | (32,577 | ) | ||||
| Class IB | (3,209 | ) | (3,720 | ) | ||||
| Total distributions | (33,234 | ) | (36,297 | ) | ||||
| Capital Share Transactions: | ||||||||
| Class IA | ||||||||
| Sold | 30,364 | 24,409 | ||||||
| Issued on reinvestment of distributions | 30,025 | 32,577 | ||||||
| Redeemed | (345,934 | ) | (328,593 | ) | ||||
| Total capital share transactions | (285,545 | ) | (271,607 | ) | ||||
| Class IB | ||||||||
| Sold | 11,893 | 8,307 | ||||||
| Issued on reinvestment of distributions | 3,209 | 3,720 | ||||||
| Redeemed | (64,391 | ) | (70,038 | ) | ||||
| Total capital share transactions | (49,289 | ) | (58,011 | ) | ||||
| Net decrease from capital share transactions | (334,834 | ) | (329,618 | ) | ||||
| Net Increase (Decrease) in Net Assets | 139,446 | (113,896 | ) | |||||
| Net Assets: | ||||||||
| Beginning of period | 1,732,269 | 1,846,165 | ||||||
| End of period | $ | 1,871,715 | $ | 1,732,269 | ||||
| Undistributed (distribution in excess of) net investment income | $ | 927 | $ | 204 | ||||
| Shares: | ||||||||
| Class IA | ||||||||
| Sold | 588 | 554 | ||||||
| Issued on reinvestment of distributions | 528 | 728 | ||||||
| Redeemed | (6,660 | ) | (7,451 | ) | ||||
| Total share activity | (5,544 | ) | (6,169 | ) | ||||
| Class IB | ||||||||
| Sold | 231 | 190 | ||||||
| Issued on reinvestment of distributions | 56 | 83 | ||||||
| Redeemed | (1,242 | ) | (1,592 | ) | ||||
| Total share activity | (955 | ) | (1,319 | ) | ||||
The accompanying notes are an integral part of these financial statements.
| 11 |
| Hartford Stock HLS Fund |
| Notes to Financial Statements |
| December 31, 2013 |
| (000’s Omitted) |
| 1. | Organization: |
Hartford Stock HLS Fund (the “Fund”) serves as an underlying investment option for certain variable annuity and variable life insurance separate accounts of Hartford Life Insurance Company (“HLIC”) and its affiliates and certain qualified retirement plans. The Fund may also serve as an underlying investment option for certain variable annuity and variable life separate accounts of other insurance companies. Owners of variable annuity contracts and policyholders of variable life insurance contracts may choose the funds permitted in the variable insurance contract prospectus. In addition, participants in certain qualified retirement plans may choose the Fund if permitted by their plans.
Hartford Series Fund, Inc. (the “Company”) is an open-end registered management investment company comprised of thirty portfolios. Financial statements for the Fund, a series of the Company, are included in this report.
The Company is organized under the laws of the State of Maryland and is registered with the Securities and Exchange Commission (“SEC”) under the Investment Company Act of 1940, as amended (“1940 Act”). The Fund is a diversified open-end management investment company.
The Fund is divided into Class IA and Class IB shares. Each class is offered at the per share net asset value (“NAV”) without a sales charge and is subject to the same expenses, except that the Class IB shares are subject to distribution and service fees charged pursuant to a Distribution Plan adopted in accordance with Rule 12b-1 under the 1940 Act.
| 2. | Significant Accounting Policies: |
The following is a summary of significant accounting policies of the Fund in the preparation of its financial statements, which are in accordance with United States Generally Accepted Accounting Principles (“U.S. GAAP”). The preparation of financial statements in accordance with U.S. GAAP may require management to make estimates and assumptions that affect the reported amounts of assets and liabilities and disclosure of contingent assets and liabilities at the date of the financial statements and the reported amounts of increases and decreases in net assets from operations during the reporting period. Actual results could differ from those estimates.
| a) | Determination of Net Asset Value – The NAV of each class of the Fund’s shares is determined as of the close of regular trading (normally 4:00 p.m. Eastern Time) (the “NYSE Close”) on each day that the New York Stock Exchange (the “Exchange”) is open (“Valuation Date”). Information that becomes known to the Fund after the NAV has been calculated on a particular day will not generally be used to retroactively adjust the NAV determined earlier that day. |
| b) | Investment Valuation and Fair Value Measurements – For purposes of calculating the NAV, portfolio investments and other assets held by the Fund's portfolio for which market quotes are readily available are valued at market value. Market value is generally determined on the basis of last reported sales prices or official close price. If no sales are reported, market value is based on quotes obtained from a quotation reporting system, established market makers, or independent pricing services. If market prices are not readily available or are deemed unreliable, the Fund will use the fair value of the investment as determined in good faith under policies and procedures established by and under the supervision of the Company’s Board of Directors. Market quotes are considered not readily available where there is an absence of current or reliable market-based data (e.g., trade information or indicative market quotes), including where events occur after the close of the relevant market, but prior to the NYSE Close, that materially affect the values of the Fund’s portfolio investments or assets. In addition, market quotes are considered not readily available when, due to extraordinary circumstances, the exchanges or markets on which the investments trade do not open for trading for the entire day and no other market prices are available. In addition, prices of foreign equities that are principally traded on certain foreign markets may be adjusted daily pursuant to a fair value pricing service approved by the Board of Directors in order to reflect an adjustment for the factors occurring after the close of certain foreign markets but before the NYSE Close. Investments that are primarily traded on foreign markets may trade on days that are not business days of the Fund. The value of the foreign investments in which the Fund invests may change on days when a shareholder will not be able to purchase or redeem shares of the Fund. Fair value pricing is subjective in nature and the use of fair value pricing by the |
| 12 |
Fund may cause the NAV of its shares to differ significantly from the NAV that would have been calculated using market prices at the close of the exchange on which a portfolio investment is primarily traded. There can be no assurance the Fund could obtain the fair market value assigned to an investment if the Fund were to sell the investment at approximately the time at which the Fund determines its NAV.
Investments valued in currencies other than U.S. dollars are converted to U.S. dollars using exchange rates obtained from independent pricing services for calculation of the NAV. As a result, the NAV of the Fund’s shares may be affected by changes in the value of currencies in relation to the U.S. dollar. The value of investments traded in markets outside the United States or denominated in currencies other than the U.S. dollar may be affected significantly on a day that the NYSE is closed and the market value may change on days when an investor is not able to purchase, redeem or exchange shares of the Fund.
Foreign currency contracts represent agreements to exchange currencies on specific future dates at predetermined rates. Foreign currency contracts are valued using foreign currency exchange rates and forward rates as provided by an independent pricing service on the Valuation Date.
Financial instruments for which prices are not available from an independent pricing service may be valued using market quotations obtained from one or more dealers that make markets in the respective financial instrument in accordance with procedures established by the Company’s Board of Directors.
U.S. GAAP defines fair value as the price that the Fund would receive to sell an asset or pay to transfer a liability in an orderly transaction between market participants. The U.S. GAAP fair value measurement standards require disclosure of a fair value hierarchy for each major category of assets and liabilities. Various inputs are used in determining the fair value of the Fund’s investments. These inputs are summarized into three broad hierarchy levels. This hierarchy is based on whether the valuation inputs are observable or unobservable. These levels are:
| · | Level 1 – Quoted prices in active markets for identical investments. Level 1 may include exchange traded instruments, such as domestic equities, some foreign equities, options, futures, mutual funds, exchange traded funds, rights and warrants. |
| · | Level 2 – Observable inputs other than Level 1 prices, such as quoted prices for similar investments; quoted prices in markets that are not active; or other inputs that are observable or can be corroborated by observable market data. Level 2 may include debt investments that are traded less frequently than exchange traded instruments and which are valued using independent pricing services; foreign equities, which are principally traded on certain foreign markets and are adjusted daily pursuant to a fair value pricing service in order to reflect an adjustment for the factors occurring after the close of certain foreign markets but before the NYSE Close; senior floating rate interests, which are valued using an aggregate of dealer bids; short-term investments, which are valued at amortized cost; and swaps, which are valued based upon the terms of each swap contract. |
| · | Level 3 – Significant unobservable inputs that are supported by limited or no market activity. Level 3 may include financial instruments whose values are determined using indicative market quotes or require significant management judgment or estimation. These unobservable valuation inputs may include estimates for current yields, maturity/duration, prepayment speed, and indicative market quotes for comparable investments along with other assumptions relating to credit quality, collateral value, complexity of the investment structure, general market conditions and liquidity. This category may include investments where trading has been halted or there are certain restrictions on trading. While these investments are priced using unobservable inputs, the valuation of these investments reflects the best available data and management believes the prices are a reasonable representation of exit price. |
| The Board of Directors of the Company generally reviews and approves the “Procedures for Valuation of Portfolio Securities” on an annual basis. These procedures define how investments are to be valued, including the formation and activities of a Valuation Committee. The Valuation Committee is responsible for determining in good faith the fair value of investments when the value cannot be obtained from primary pricing services or alternative sources or if the valuation of an investment as provided by the primary pricing service or alternative source is believed not to reflect the investment’s fair value as of the Valuation Date. Voting members of the |
| 13 |
| Hartford Stock HLS Fund |
| Notes to Financial Statements – (continued) |
| December 31, 2013 |
| (000’s Omitted) |
| Valuation Committee include the Fund’s Treasurer or designee and a Vice President of the investment manager or designee. An Assistant Vice President of the Fund with legal expertise or designee is also included on the Valuation Committee as a non-voting advisory member. In addition, the Fund’s Chief Compliance Officer shall designate a member of the compliance group to attend Valuation Committee meetings as a non-voting resource, to monitor for and provide guidance with respect to compliance with these procedures. Two members of the Valuation Committee or their designees, representing different departments, shall constitute a quorum for purposes of permitting the Valuation Committee to take action. The Valuation Committee will consider all relevant factors in determining an investment’s fair value, and may seek the advice of the Fund’s sub-adviser, knowledgeable brokers, and legal counsel in making such determination. The Valuation Committee reports to the Audit Committee of the Company’s Board of Directors. The Audit Committee receives quarterly written reports which include details of all fair-valued investments, including the reason for the fair valuation, and an indication, when possible, of the accuracy of the valuation by disclosing the next available reliable public price quotation or the disposition price of such investments (the “look-back” test). The Board of Directors then must consider for ratification all of the fair value determinations made during the previous quarter. |
Valuation levels are not necessarily indicative of the risk associated with investing in such investments. Individual investments within any of the above mentioned asset classes may be assigned a different hierarchical level than those presented above, as individual circumstances dictate.
For additional information, refer to the Investment Valuation Hierarchy Level Summary and the Level 3 roll-forward reconciliation, if applicable, which follow the Schedule of Investments.
| c) | Investment Transactions and Investment Income – Investment transactions are recorded as of the trade date (the date the order to buy or sell is executed) for financial reporting purposes. Investments purchased or sold on a when-issued or delayed-delivery basis may be settled a month or more after the trade date. Realized gains and losses are determined on the basis of identified cost. |
Dividend income from domestic securities is accrued on the ex-dividend date. In general, dividend income from foreign securities is recorded on the ex-date; however, dividend notifications in certain foreign jurisdictions may not be available in a timely manner and as a result, the Fund will record the dividend as soon as the relevant details (i.e., rate per share, payment date, shareholders of record, etc.) are publicly available. Interest income, including amortization of premium, accretion of discounts and additional principal received in-kind in lieu of cash, is accrued on a daily basis.
| d) | Foreign Currency Transactions – Assets and liabilities denominated in currencies other than U.S. dollars are translated into U.S. dollars at the exchange rates in effect on the valuation date. Purchases and sales of investments, income and expenses are translated into U.S. dollars at the exchange rates on the dates of such transactions. |
The Fund does not isolate that portion of portfolio investment valuation resulting from fluctuations in the foreign currency exchange rates from the fluctuations arising from changes in the market prices of investments held. Exchange rate fluctuations are included with the net realized and unrealized gain or loss on investments in the accompanying financial statements.
Net realized foreign exchange gains or losses arise from sales of foreign currencies and the difference between asset and liability amounts initially stated in foreign currencies and the U.S. dollar value of the amounts actually received or paid. Net unrealized foreign exchange gains or losses arise from changes in the value of other assets and liabilities at the end of the reporting period, resulting from changes in the exchange rates.
| e) | Joint Trading Account – The Fund may invest cash balances into a joint trading account that may be invested in one or more repurchase agreements. |
| 14 |
| f) | Fund Share Valuation and Dividend Distributions to Shareholders – Orders for the Fund’s shares are executed in accordance with the investment instructions of the contract holders and plan participants. The NAV of the Fund’s shares is determined as of the close of business on each business day of the Exchange. The NAV is determined separately for each class of shares of the Fund by dividing the Fund’s net assets attributable to that class by the number of shares of the class outstanding. Each class of shares offered by the Fund has equal rights as to assets and voting privileges (except that shareholders of a class have exclusive voting rights regarding any matter relating solely to that class of shares). Income and non-class specific expenses are allocated daily to each class on the basis of the relative net assets of the class. Realized and unrealized gains and losses are allocated daily based on the relative net assets of each class of shares of the Fund. |
Orders for the purchase of the Fund’s shares received prior to the close of the Exchange on any day the Exchange is open for business are priced at the NAV determined as of the close of the Exchange. Orders received after the close of the Exchange, or on a day on which the Exchange and/or the Fund is not open for business, are priced at the next determined NAV.
Dividends are declared pursuant to a policy adopted by the Company’s Board of Directors based upon the investment performance of the Fund. The policy of the Fund is to pay dividends from net investment income and realized gains, if any, at least once a year.
Distributions from net investment income, net realized gains and capital are determined in accordance with federal income tax regulations, which may differ from U.S. GAAP with respect to character and timing. These differences may include, but are not limited to, losses deferred due to wash sale adjustments, foreign currency gains and losses, adjustments related to Passive Foreign Investment Companies (“PFICs”), Real Estate Investment Trusts (“REITs”), Regulated Investment Companies (“RICs”), certain derivatives and partnerships. Permanent book and federal income tax basis differences relating to shareholder distributions will result in reclassifications to certain of the Fund’s capital accounts (see Federal Income Taxes: Reclassification of Capital Accounts note).
| 3. | Securities and Other Investments: |
| a) | Repurchase Agreements – A repurchase agreement is an agreement by which a counterparty agrees to sell an investment and agrees to repurchase the investment sold from the buyer at a mutually agreed upon time and price. During the period of the repurchase agreement, the counterparty will deposit cash and or securities in a third party custodial account to serve as collateral. At the time the Fund enters into a repurchase agreement, the value of the underlying collateral, including accrued interest, will be equal to or exceed the value of the repurchase agreement. Repurchase agreements expose the Fund to counterparty risk - that is, the risk that the counterparty will not fulfill its obligations. To minimize counterparty risk, the investments that serve to collateralize the repurchase agreement are held by the Fund’s custodian in book entry or physical form in the custodial account of the Fund or in a third party custodial account. Repurchase agreements are valued at cost plus accrued interest, which approximates fair value. Repurchase agreements have master netting arrangements which allow the Fund to offset amounts owed to a counterparty with amounts owed by the counterparty, including any collateral. Upon an event of default under a master repurchase agreement, the non-defaulting party may close out all transactions traded under such agreement and net amounts owed under each transaction to one net amount payable by one party to the other. Absent an event of default, the master repurchase agreement does not result in an offset of reported amounts of assets and liabilities in the Statement of Assets and Liabilities across transactions between the Fund and the applicable counterparty. The Fund, as shown on the Schedule of Investments, had outstanding repurchase agreements and related collateral as of December 31, 2013. |
| b) | Illiquid and Restricted Investments – The Fund is permitted to invest up to 15% of its net assets in illiquid investments. Illiquid investments are those that may not be sold or disposed of in the ordinary course of business within seven days, at approximately the price used to determine the Fund’s NAV. The Fund may not be able to sell illiquid investments when its sub-adviser considers it desirable to do so or may have to sell such investments at a price that is lower than the price that could be obtained if the investments were more liquid. A sale of illiquid investments may require more time and may result in higher dealer discounts and other selling expenses than does the sale of those that are liquid. Illiquid investments also may be more difficult to value due to the unavailability of reliable market quotations for such |
| 15 |
| Hartford Stock HLS Fund |
| Notes to Financial Statements – (continued) |
| December 31, 2013 |
| (000’s Omitted) |
| investments, and an investment in them may have an adverse impact on the Fund’s NAV. The Fund may also purchase certain restricted investments that can only be resold to certain qualified investors and may be determined to be liquid pursuant to policies and guidelines established by the Company’s Board of Directors. The Fund, as shown on the Schedule of Investments, had illiquid and/or restricted investments as of December 31, 2013. |
| 4. | Financial Derivative Instruments: |
The following disclosures contain information on how and why the Fund uses derivative instruments, the credit-risk-related contingent features in certain derivative instruments, and how derivative instruments affect the Fund’s financial position and results of operations. The location and fair value amounts of these instruments on the Statement of Assets and Liabilities and the realized gains and losses and changes in unrealized gains and losses on the Statement of Operations, each categorized by type of derivative contract, are included in the following Additional Derivative Instrument Information footnote. The derivative instruments outstanding as of year-end are disclosed in the notes to or within the Schedule of Investments for purchased options, if applicable. The amounts of realized gains and losses and changes in unrealized gains and losses on derivative instruments during the year are disclosed in the Statement of Operations.
| a) | Foreign Currency Contracts – The Fund may enter into foreign currency contracts that obligate the Fund to purchase or sell currencies at specified future dates. Foreign currency contracts are used to hedge the currency exposure associated with some or all of the Fund’s investments and/or as part of an investment strategy. Foreign currency contracts are marked to market daily and the change in value is recorded by the Fund as an unrealized gain or loss. The Fund will record a realized gain or loss when the foreign currency contract is settled. |
Foreign currency contracts involve elements of market risk in excess of the amounts reflected in the Statement of Assets and Liabilities. In addition, risks may arise upon entering into these contracts from the potential inability of the counterparties to meet the terms of the contracts and from unanticipated movements in the value of the foreign currencies relative to the U.S. dollar. The Fund had no outstanding foreign currency contracts as of December 31, 2013.
| b) | Additional Derivative Instrument Information: |
The volume of derivative activity was minimal during the year ended December 31, 2013.
The Effect of Derivative Instruments on the Statement of Operations for the year ended December 31, 2013:
| Risk Exposure Category | ||||||||||||||||||||||||||||
| Interest Rate Contracts | Foreign Exchange Contracts | Credit Contracts | Equity Contracts | Commodity Contracts | Other Contracts | Total | ||||||||||||||||||||||
| Realized Gain on Derivatives Recognized as a Result of Operations: | ||||||||||||||||||||||||||||
| Net realized gain on foreign currency contracts | $ | — | $ | 613 | $ | — | $ | — | $ | — | $ | — | $ | 613 | ||||||||||||||
| Total | $ | — | $ | 613 | $ | — | $ | — | $ | — | $ | — | $ | 613 | ||||||||||||||
| 5. | Principal Risks: |
| The Fund may be exposed to counterparty risk, or the risk that an institution or other entity with which the Fund has unsettled or open transactions will default. |
If the Fund invests directly in foreign currencies or in securities that trade in, and receive revenues in, foreign currencies, or in derivatives that provide exposure to foreign currencies, it will be subject to the risk that those currencies will decline in value relative to the base currency (U.S. dollars) of the Fund, or, in the case of hedging positions, that the Fund’s base currency will decline in value relative to the currency being hedged. Currency rates in foreign countries may fluctuate significantly over short periods of time for a number of reasons, including changes in interest rates, intervention
| 16 |
| (or the failure to intervene) by U.S. or foreign governments, central banks or supranational entities, such as the International Monetary Fund, or by the imposition of currency controls or other political developments in the United States or abroad. As a result, the Fund’s investments in foreign currency denominated securities may reduce the returns of the Fund. The market values of equity securities, such as common stocks and preferred stocks, or equity related investments, such as futures and options, may decline due to general market conditions which are not specifically related to a particular company, such as real or perceived adverse economic conditions, changes in the general outlook for corporate earnings, changes in interest or currency rates or adverse investor sentiment generally. The market value of equity securities may also decline due to factors which affect a particular industry or industries, such as labor shortages or increased production costs and competitive conditions within an industry. Equity securities and equity related investments generally have greater market price volatility than fixed income securities. |
| 6. | Federal Income Taxes: |
| a) | Federal Income Taxes – For federal income tax purposes, the Fund intends to continue to qualify as a RIC under Subchapter M of the Internal Revenue Code (“IRC”) by distributing substantially all of its taxable net investment income and net realized capital gains to its shareholders and otherwise complying with the requirements of the IRC. The Fund has distributed substantially all of its income and capital gains in prior years, if applicable, and intends to distribute substantially all of its income and capital gains prior to the next fiscal year-end. Accordingly, no provision for federal income or excise taxes has been made in the accompanying financial statements. Distributions from short-term capital gains are treated as ordinary income distributions for federal income tax purposes. |
| b) | Net Investment Income (Loss), Net Realized Gains (Losses) and Distributions – Net investment income (loss) and net realized gains (losses) may differ for financial statement and tax purposes primarily because of losses deferred due to wash sale adjustments, foreign currency gains and losses, adjustments related to PFICs, REITs, RICs, certain derivatives and partnerships. The character of distributions made during the year from net investment income or net realized gains may differ from their ultimate characterization for federal income tax purposes. Also, due to the timing of dividend distributions, the fiscal year in which amounts are distributed may differ from the year that the income or realized gains (losses) were recorded by the Fund. |
| c) | Distributions and Components of Distributable Earnings – The tax character of distributions paid by the Fund for the periods indicated is as follows (as adjusted for dividends payable, if applicable): |
| For the Year Ended December 31, 2013 | For the Year Ended December 31, 2012 | |||||||
| Ordinary Income | $ | 33,234 | $ | 36,297 | ||||
As of December 31, 2013, the Fund’s components of distributable earnings (deficit) on a tax basis were as follows:
| Amount | ||||
| Undistributed Ordinary Income | $ | 927 | ||
| Accumulated Capital and Other Losses* | (561,715 | ) | ||
| Unrealized Appreciation† | 421,979 | |||
| Total Accumulated Deficit | $ | (138,809 | ) | |
| * | The Fund has capital loss carryforwards that are identified in the Capital Loss Carryforward note that follows. |
| † | Differences between book-basis and tax-basis unrealized appreciation (depreciation) may be attributable to the losses deferred due to wash sale adjustments, foreign currency gains and losses, adjustments related to PFICs, REITs, RICs, certain derivatives and partnerships. |
| d) | Reclassification of Capital Accounts – The Fund may record reclassifications in its capital accounts. These reclassifications have no impact on the total net assets of the Fund. The reclassifications are a result of permanent differences between U.S. GAAP and tax accounting for such items as foreign currency, PFICs, expiration or utilization |
| 17 |
| Hartford Stock HLS Fund |
| Notes to Financial Statements – (continued) |
| December 31, 2013 |
| (000’s Omitted) |
of capital loss carryforwards or net operating losses. Adjustments are made to reflect the impact these items have on current and future distributions to shareholders. Therefore, the source of the Fund’s distributions may be shown in the accompanying Statement of Changes in Net Assets as from undistributed net investment income, from accumulated net realized gains on investments or from capital depending on the type of book and tax differences that exist. For the year ended December 31, 2013, the Fund recorded reclassifications to increase (decrease) the accounts listed below:
| Amount | ||||
| Undistributed Net Investment Income (Loss) | $ | 23 | ||
| Accumulated Net Realized Gain (Loss) | (23 | ) | ||
| e) | Capital Loss Carryforward – On December 22, 2010, the Regulated Investment Company Modernization Act of 2010 (the “Act”) was enacted, which made changes to the capital loss carryforward rules. The changes are effective for taxable years beginning after the date of enactment. Under the Act, funds are permitted to carry forward capital losses for an unlimited period. However, any losses incurred during those future taxable years will be required to be utilized prior to the losses incurred in pre-enactment taxable years, which carry an expiration date. As a result of this ordering rule, pre-enactment capital loss carryforwards may be more likely to expire unused. Additionally, post-enactment capital loss carryforwards retain their character as either short-term or long-term capital losses rather than being considered all short-term as permitted under prior regulation. |
At December 31, 2013 (tax-year-end), the Fund had capital loss carryforwards for U.S. federal income tax purposes as follows:
| Year of Expiration | Amount | |||
| 2017 | $ | 561,715 | ||
| Total | $ | 561,715 | ||
During the year ended December 31, 2013, the Fund utilized $156,817 of prior year capital loss carryforwards.
| f) | Accounting for Uncertainty in Income Taxes – The Fund has adopted financial reporting rules that require the Fund to analyze all open tax years, as defined by the statute of limitations, for all major jurisdictions. Generally, tax authorities can examine all tax returns filed for the last three years. The Fund does not have an examination in progress. |
| The Fund has reviewed all open tax years and major jurisdictions and concluded that these financial reporting rules had no effect on the Fund’s financial position or results of operations. There is no tax liability resulting from unrecognized tax benefits relating to uncertain income tax positions taken or expected to be taken on the tax return for the fiscal year ended December 31, 2013. The Fund is also not aware of any tax positions for which it is reasonably possible that the total amounts of unrecognized tax benefits will significantly change in the next twelve months. |
| 7. | Expenses: |
| a) | Investment Management Agreement – Hartford Funds Management Company, LLC (“HFMC”), an indirect wholly owned subsidiary of The Hartford Financial Services Group, Inc. (“The Hartford”), serves as investment manager to the Fund pursuant to an Investment Management Agreement with the Company. The investment manager has overall investment supervisory responsibility for the Fund. In addition, the investment manager provides administrative personnel, services, equipment, facilities and office space for proper operation of the Fund. The investment manager has contracted with Wellington Management Company, LLP (“Wellington Management”) under a sub-advisory agreement for the provision of day-to-day investment management services to the Fund in accordance with the Fund’s investment objective and policies. The Fund pays a fee to the investment manager, a portion of which may be used to compensate Wellington Management. |
| 18 |
The schedule below reflects the rates of compensation paid to HFMC for investment management services rendered as of December 31, 2013; the rates are accrued daily and paid monthly.
| Average Daily Net Assets | Annual Fee | |||
| On first $250 million | 0.5250% | |||
| On next $250 million | 0.5000% | |||
| On next $500 million | 0.4750% | |||
| On next $4 billion | 0.4500% | |||
| On next $5 billion | 0.4475% | |||
| Over $10 billion | 0.4450% | |||
| b) | Accounting Services Agreement – Pursuant to the Fund Accounting Agreement between HFMC and the Company, on behalf of the Fund, HFMC provides accounting services to the Fund and receives monthly compensation based on the Fund’s average daily net assets at the rates set forth below. The Fund’s accounting services fees are accrued daily and paid monthly. |
| Average Daily Net Assets | Annual Fee | |||
| All assets | 0.010% | |||
| c) | Operating Expenses – Allocable expenses incurred by the Company are allocated to each Fund and allocated to classes within a Fund in proportion to the average daily net assets of the Fund and each class, except where allocation of certain expenses is more fairly made directly to the Fund or to specific classes within a Fund. |
| d) | Fees Paid Indirectly – The Company, on behalf of the Fund, has entered into agreements with State Street Global Markets, LLC and Russell Implementation Services, Inc. to partially recapture non-discounted trade commissions. Such rebates are used to pay a portion of the Fund’s expenses. In addition, the Fund’s custodian bank has agreed to reduce its fees when the Fund maintains cash on deposit in a non-interest-bearing custody account. For the year ended December 31, 2013, these amounts, if any, are included in the Statement of Operations. |
The ratio of expenses to average net assets in the accompanying financial highlights excludes the reduction in expenses related to fees paid indirectly. The annualized expense ratio after waivers for the period listed below reflecting the reduction for fees paid indirectly is as follows:
| Year Ended December 31, 2013 | ||||
| Class IA | 0.51 | % | ||
| Class IB | 0.76 | |||
| e) | Distribution Plan for Class IB shares – Effective June 14, 2013, Hartford Investment Financial Services, LLC was renamed Hartford Funds Distributors, LLC (“HFD”). HFD, a wholly owned, ultimate subsidiary of The Hartford, serves as the Fund’s principal underwriter and distributor. The Company, on behalf of the Fund, has adopted a Distribution Plan pursuant to Rule 12b-1 of the 1940 Act to compensate the distributor, HFD, from assets attributable to the Class IB shares for services rendered and expenses borne in connection with activities primarily intended to result in the sale of the Class IB shares, subject to the review and approval of the Company’s Board of Directors. |
The Distribution Plan provides that the Fund may pay annually up to 0.25% of the average daily net assets of the Fund attributable to its Class IB shares for activities primarily intended to result in the sale of Class IB shares. The Board has the authority to suspend or reduce these payments at any point in time. Under the terms of the Distribution Plan and the principal underwriting agreement, the Fund is authorized to make payments monthly to the distributor that may be used to pay or compensate entities providing distribution and shareholder servicing with respect to the Class IB shares for such entities’ fees or expenses incurred or paid in that regard. These fees are accrued daily and paid monthly.
| 19 |
| Hartford Stock HLS Fund |
| Notes to Financial Statements – (continued) |
| December 31, 2013 |
| (000’s Omitted) |
| f) | Other Related Party Transactions – Certain officers of the Fund are directors and/or officers of the investment manager and/or The Hartford or its subsidiaries. For the year ended December 31, 2013, a portion of the Fund’s Chief Compliance Officer’s salary was paid by all the investment companies in the Hartford fund complex. The portion allocated to the Fund was in the amount of $2. Hartford Administrative Services Company (“HASCO”), an indirect wholly owned subsidiary of The Hartford, provides transfer agent services to the Fund. HASCO was compensated on a per account basis for providing such services. The amount paid to HASCO can be found in the Statement of Operations. These fees are accrued daily and paid monthly. |
| g) | Payment from Affiliate – In July of 2007, The Hartford entered into a settlement with the Attorneys General of the states of New York, Connecticut and Illinois relating to market timing and the company's individual variable annuity contracts in which certain payments would be made directly to the variable annuity contract holders. The distribution plan provided that unclaimed money from the settlement would be distributed to certain HLS Funds that are investment options through a Hartford individual variable annuity contract. The unclaimed money was distributed to the Fund on September 18, 2009. |
| The total return in the accompanying financial highlights includes a payment from an affiliate. Had the payment from the affiliate been excluded, the impact and total return for the period listed below would have been as follows: |
| For the Year Ended December 31, 2009 | ||||||||
| Class IA | Class IB | |||||||
| Impact from Payment from Affiliate for Attorneys General Settlement | — | % | — | % | ||||
| Total Return Excluding Payment from Affiliate | 41.53 | % | 41.18 | % | ||||
| 8. | Investment Transactions: |
For the year ended December 31, 2013, the Fund's aggregate purchases and sales of investment securities (excluding short-term investments) were as follows:
| Amount | ||||
| Cost of Purchases Excluding U.S. Government Obligations | $ | 484,408 | ||
| Sales Proceeds Excluding U.S. Government Obligations | 839,183 | |||
| 9. | Line of Credit: |
The Fund is one of several Hartford funds that participate in a $500 million committed revolving line of credit facility. The facility is to be used for temporary or emergency purposes. Under the arrangement, the funds are required to own securities having a market value in excess of 300% of the total bank borrowings. The interest rate on borrowings varies depending on the nature of the loan. The facility also requires a fee to be paid based on the amount of the commitment. This commitment fee is allocated to all of the funds participating in the line of credit based on the average net assets of the funds. During the year ended December 31, 2013, the Fund did not have any borrowings under this facility.
| 10. | Industry Classifications: |
Other than the industry classifications “Other Investment Pools and Funds” and “Exchange Traded Funds,” equity industry classifications used in this report are the Global Industry Classification Standard, which was developed by and is the exclusive property and service mark of MSCI, Inc. and Standard & Poor’s.
| 20 |
| 11. | Indemnifications: |
Under the Company’s organizational documents, the Company shall indemnify its officers and directors to the full extent required or permitted under Maryland General Corporation Law and the federal securities laws. In addition, the Company, on behalf of the Fund, may enter into contracts that contain a variety of indemnifications. The Company’s maximum exposure under these arrangements is unknown. However, as of the date of these financial statements, the Company has not had prior claims or losses pursuant to these contracts and expects the risk of loss to be remote.
| 12. | Pending Legal Proceedings: |
On February 25, 2011, Jennifer L. Kasilag, Louis Mellinger, Judith M. Menendez, Jacqueline M. Robinson, and Linda A. Russell filed a derivative lawsuit against Hartford Investment Financial Services, LLC (“HIFSCO”)(now known as Hartford Funds Distributors, LLC) on behalf of six Hartford retail mutual funds in the United States District Court for the District of New Jersey, alleging that HIFSCO received excessive advisory and distribution fees in violation of its statutory fiduciary duty under Section 36(b) of the 1940 Act when serving as investment manager and principal underwriter, respectively, to the Hartford retail mutual funds. HIFSCO moved to dismiss and, in September 2011, the motion was granted in part and denied in part, with leave to amend the complaint. In November 2011, plaintiffs filed an amended complaint on behalf of certain Hartford retail mutual funds, The Hartford Global Health Fund (now known as The Hartford Healthcare Fund), The Hartford Conservative Allocation Fund, The Hartford Growth Opportunities Fund, The Hartford Inflation Plus Fund, The Hartford Advisers Fund (now known as The Hartford Balanced Fund), and The Hartford Capital Appreciation Fund. Plaintiffs seek to rescind the investment management agreements and distribution plans between HIFSCO and these funds and to recover the total fees charged thereunder or, in the alternative, to recover any improper compensation HIFSCO received, in addition to lost earnings. HIFSCO filed a partial motion to dismiss the amended complaint and, in December 2012, the court dismissed without prejudice the claims regarding distribution fees and denied the motion with respect to the advisory fees claims. HIFSCO disputes the allegations and intends to defend the advisory fee claims vigorously.
This action concerns the activities of HIFSCO in its capacity as investment manager and principal underwriter to the Hartford retail mutual funds and does not concern HIFSCO’s activities in its capacity as principal underwriter to the HLS funds. For this reason, no accrual for litigation relating to this matter has been recorded in the financial statements of the Fund.
| 21 |
| Hartford Stock HLS Fund |
| Financial Highlights |
| ─ Selected Per-Share Data(A) ─ | ─ Ratios and Supplemental Data ─ | |||||||||||||||||||||||||||||||||||||||||||||||||||
| Class | Net Asset Value at Beginning of Period | Net Investment Income (Loss) | Net Realized and Unrealized Gain (Loss) on Investments | Total from Investment Operations | Dividends from Net Investment Income | Distributions from Realized Capital Gains | Total Dividends and Distributions | Net Asset Value at End of Period | Total Return(B) | Net Assets at End of Period (000s) | Ratio of Expenses to Average Net Assets Before Adjust- ments(C) | Ratio of Expenses to Average Net Assets After Adjust- ments(C) | Ratio of Net Investment Income (Loss) to Average Net Assets | |||||||||||||||||||||||||||||||||||||||
| For the Year Ended December 31, 2013 | ||||||||||||||||||||||||||||||||||||||||||||||||||||
| IA | $ | 44.73 | $ | 0.99 | $ | 13.41 | $ | 14.40 | $ | (1.06 | ) | $ | – | $ | (1.06 | ) | $ | 58.07 | 32.25 | % | $ | 1,667,278 | 0.51 | % | 0.51 | % | 1.89 | % | ||||||||||||||||||||||||
| IB | 44.71 | 0.85 | 13.40 | 14.25 | (0.92 | ) | – | (0.92 | ) | 58.04 | 31.92 | 204,437 | 0.76 | 0.76 | 1.64 | |||||||||||||||||||||||||||||||||||||
| For the Year Ended December 31, 2012 (D) | ||||||||||||||||||||||||||||||||||||||||||||||||||||
| IA | $ | 39.95 | $ | 0.91 | $ | 4.83 | $ | 5.74 | $ | (0.96 | ) | $ | – | $ | (0.96 | ) | $ | 44.73 | 14.38 | % | $ | 1,532,116 | 0.51 | % | 0.51 | % | 1.86 | % | ||||||||||||||||||||||||
| IB | 39.92 | 0.82 | 4.81 | 5.63 | (0.84 | ) | – | (0.84 | ) | 44.71 | 14.10 | 200,153 | 0.76 | 0.76 | 1.61 | |||||||||||||||||||||||||||||||||||||
| For the Year Ended December 31, 2011 (D) | ||||||||||||||||||||||||||||||||||||||||||||||||||||
| IA | $ | 40.98 | $ | 0.62 | $ | (1.07 | ) | $ | (0.45 | ) | $ | (0.58 | ) | $ | – | $ | (0.58 | ) | $ | 39.95 | (1.09 | )% | $ | 1,614,788 | 0.50 | % | 0.50 | % | 1.37 | % | ||||||||||||||||||||||
| IB | 40.94 | 0.51 | (1.06 | ) | (0.55 | ) | (0.47 | ) | – | (0.47 | ) | 39.92 | (1.34 | ) | 231,377 | 0.75 | 0.75 | 1.11 | ||||||||||||||||||||||||||||||||||
| For the Year Ended December 31, 2010 (D) | ||||||||||||||||||||||||||||||||||||||||||||||||||||
| IA | $ | 36.10 | $ | 0.44 | $ | 4.89 | $ | 5.33 | $ | (0.45 | ) | $ | – | $ | (0.45 | ) | $ | 40.98 | 14.80 | % | $ | 1,980,502 | 0.50 | % | 0.50 | % | 1.09 | % | ||||||||||||||||||||||||
| IB | 36.06 | 0.35 | 4.88 | 5.23 | (0.35 | ) | – | (0.35 | ) | 40.94 | 14.51 | 300,279 | 0.75 | 0.75 | 0.84 | |||||||||||||||||||||||||||||||||||||
| For the Year Ended December 31, 2009 (D) | ||||||||||||||||||||||||||||||||||||||||||||||||||||
| IA | $ | 25.86 | $ | 0.48 | $ | 10.25 | $ | 10.73 | $ | (0.49 | ) | $ | – | $ | (0.49 | ) | $ | 36.10 | 41.54 | %(E) | $ | 2,055,227 | 0.51 | % | 0.51 | % | 1.43 | % | ||||||||||||||||||||||||
| IB | 25.84 | 0.39 | 10.24 | 10.63 | (0.41 | ) | – | (0.41 | ) | 36.06 | 41.18 | (E) | 328,275 | 0.76 | 0.76 | 1.19 | ||||||||||||||||||||||||||||||||||||
| (A) | Information presented relates to a share outstanding throughout the indicated period. Net investment income (loss) per share amounts are calculated based on average shares outstanding unless otherwise noted. |
| (B) | The figures do not include sales charges or other fees which may be applied at the variable life insurance, variable annuity or qualified retirement plan product level. Any such additional sales charges or other fees would lower the Fund's performance. |
| (C) | Adjustments include waivers and reimbursements, if applicable. Ratios do not include fees paid indirectly (see Expenses in the accompanying Notes to Financial Statements). |
| (D) | Net investment income (loss) per share amounts have been calculated using the SEC method. |
| (E) | Total return without the inclusion of the Payment from (to) Affiliate can be found in Expenses in the accompanying Notes to Financial Statements. |
| Portfolio Turnover Rate for All Share Classes | ||||
| For the Year Ended December 31, 2013 | 27 | % | ||
| For the Year Ended December 31, 2012 | 82 | |||
| For the Year Ended December 31, 2011 | 43 | |||
| For the Year Ended December 31, 2010 | 77 | |||
| For the Year Ended December 31, 2009 | 84 | |||
| 22 |
| Report of Independent Registered Public Accounting Firm |
| The Board of Directors and Shareholders of |
| Hartford Series Fund, Inc. |
We have audited the accompanying statement of assets and liabilities, including the schedule of investments, of Hartford Stock HLS Fund (one of the portfolios constituting Hartford Series Fund, Inc. (the Funds)) as of December 31, 2013, and the related statement of operations for the year then ended, the statements of changes in net assets for each of the two years in the period then ended, and the financial highlights for each of the five years in the period then ended. These financial statements and financial highlights are the responsibility of the Funds’ management. Our responsibility is to express an opinion on these financial statements and financial highlights based on our audits.
We conducted our audits in accordance with the standards of the Public Company Accounting Oversight Board (United States). Those standards require that we plan and perform the audit to obtain reasonable assurance about whether the financial statements and financial highlights are free of material misstatement. We were not engaged to perform an audit of the Funds’ internal control over financial reporting. Our audits included consideration of internal control over financial reporting as a basis for designing audit procedures that are appropriate in the circumstances, but not for the purpose of expressing an opinion on the effectiveness of the Funds’ internal control over financial reporting. Accordingly, we express no such opinion. An audit also includes examining, on a test basis, evidence supporting the amounts and disclosures in the financial statements and financial highlights, assessing the accounting principles used and significant estimates made by management, and evaluating the overall financial statement presentation. Our procedures included confirmation of securities owned as of December 31, 2013, by correspondence with the custodian and brokers or by other appropriate auditing procedures where replies from brokers were not received. We believe that our audits provide a reasonable basis for our opinion.
In our opinion, the financial statements and financial highlights referred to above present fairly, in all material respects, the financial position of Hartford Stock HLS Fund of the Hartford Series Fund, Inc. at December 31, 2013, the results of its operations for the year then ended, the changes in its net assets for each of the two years in the period then ended, and the financial highlights for each of the five years in the period then ended, in conformity with U.S. generally accepted accounting principles.
| |
| Minneapolis, MN | |
| February 17, 2014 |
| 23 |
| Hartford Stock HLS Fund |
| Directors and Officers (Unaudited) |
The Board of Directors of the Company appoints officers who are responsible for the day-to-day operations of the Fund and who execute policies formulated by the directors. Each director serves until his or her death, resignation, or retirement or until the next annual meeting of shareholders is held or until his or her successor is elected and qualifies.
Directors and officers who are employed by or who have a financial interest in The Hartford are considered “interested” persons of the Fund pursuant to the 1940 Act. Each officer and two of the Company’s directors, as noted in the chart below, are “interested” persons of the Fund. Each director serves as a director for The Hartford Mutual Funds, Inc., The Hartford Mutual Funds II, Inc., Hartford Series Fund, Inc., Hartford HLS Series Fund II, Inc., and as a trustee for The Hartford Alternative Strategies Fund, which, as of December 31, 2013, collectively consist of 91 funds. Correspondence may be sent to directors and officers c/o Hartford Funds, 5 Radnor Corporate Center, Suite 300, 100 Matsonford Road, Radnor, Pennsylvania 19087, except that correspondence to Mr. Annoni, Mr. Dressen and Ms. Quade may be sent to 500 Bielenberg Drive, Woodbury, Minnesota 55125.
The table below sets forth, for each director and officer, his or her name, year of birth, current position with the Company and date first elected or appointed to Hartford Series Fund, Inc. (“HSF”), and Hartford HLS Series Fund II, Inc. (“HSF2”), principal occupation, and, for directors, other directorships held. The Fund’s Statement of Additional Information contains further information on the directors and is available free of charge by calling 1-800-862-6668 or writing to Hartford HLS Funds, c/o Hartford Life Insurance Company, Hartford Life and Annuity Insurance Company, P.O. Box 14293, Lexington, KY 40512-4293.
Information on the aggregate remuneration paid to the directors of the Company can be found in the Statement of Operations herein. The Fund pays to The Hartford a portion of the Chief Compliance Officer’s compensation, but does not pay salaries or compensation to any of their other officers or directors who are employed by The Hartford.
Non-Interested Directors
Lynn S. Birdsong (1946) Director since 2003, Co-Chairman of the Investment Committee since 2005
Mr. Birdsong is a private investor. Mr. Birdsong currently serves as a Director of the Sovereign High Yield Investment Company (April 2010 to current). Mr. Birdsong currently serves as an Independent Director of Nomura Partners Funds, Inc. (formerly, The Japan Fund) (April 2003 to current). From 2003 to March 2005, Mr. Birdsong was an Independent Director of the Atlantic Whitehall Funds. From 1979 to 2002, Mr. Birdsong was a Managing Director of Zurich Scudder Investments, an investment management firm. During his employment with Scudder, Mr. Birdsong was an Interested Director of The Japan Fund. From January 1981 through December 2013, Mr. Birdsong was a partner in Birdsong Company, an advertising specialty firm.
Robert M. Gavin, Jr. (1940) Director since 2002 (HSF) and 1986 (HSF2), Chairman of the Board since 2004
Dr. Gavin is an educational consultant. Prior to September 1, 2001, he was President of Cranbrook Education Community and prior to July 1996, he was President of Macalester College, St. Paul, Minnesota.
Duane E. Hill (1945) Director since 2001 (HSF) and 2002 (HSF2), Chairman of the Nominating Committee since 2003
Mr. Hill is a Partner of TSG Ventures L.P., a private equity investment company. Mr. Hill is a former partner of TSG Capital Group, a private equity investment firm that served as sponsor and lead investor in leveraged buyouts of middle market companies.
Sandra S. Jaffee (1941) Director since 2005
Ms. Jaffee is the founder and Chief Executive Officer of a private company, Homeworks Concierge, LLC, which provides residential property management services in Westchester County, New York (January 2012 to present). Ms. Jaffee served as Chairman (2008 to 2009) and Chief Executive Officer of Fortent (formerly Searchspace Group), a leading provider of compliance/regulatory technology to financial institutions from August 2005 to August 2009. Ms. Jaffee currently serves as a member of the Board of Directors of Broadridge Financial Solutions as well as a Trustee of Muhlenberg College.
| 24 |
William P. Johnston (1944) Director since 2005, Chairman of the Compliance Committee since 2005
In June 2006, Mr. Johnston was appointed as Senior Advisor to The Carlyle Group, a global private equity and alternative asset investment firm and currently serves as an Operating Executive. In July 2006, Mr. Johnston was elected to the Board of Directors of MultiPlan, Inc. and served as a Director (July 2006 to August 2010). In August 2007, Mr. Johnston was elected to the Board of Directors of LifeCare Holdings, Inc. and served as a Director (August 2007 to June 2013). In February 2008, Mr. Johnston was elected to the Board of Directors of HCR-ManorCare, Inc. In May 2006, Mr. Johnston was elected to the Supervisory Board of Fresenius Medical Care AG & Co. KGaA, after its acquisition of Renal Care Group, Inc. in March 2006. Mr. Johnston joined Renal Care Group in November 2002 as a member of the Board of Directors and served as Chairman of the Board from March 2003 through March 2006. From 2002 through 2013, Mr. Johnston served as a Board member of the Georgia O’Keefe Museum. From September 1987 to December 2002, Mr. Johnston was with Equitable Securities Corporation (and its successors, SunTrust Equitable Securities and SunTrust Robinson Humphrey) serving in various investment banking and managerial positions, including Managing Director and Head of Investment Banking, Chief Executive Officer and Vice Chairman.
Phillip O. Peterson (1944) Director since 2002 (HSF) and 2000 (HSF2), Chairman of the Audit Committee since 2002
Mr. Peterson is a mutual fund industry consultant. He was a partner of KPMG LLP (an accounting firm) until July 1999. Mr. Peterson joined William Blair Funds in February 2007 as a member of the Board of Trustees. Mr. Peterson also joined the Board of Trustees of Symetra Variable Mutual Funds Trust as a trustee in February 2012.
Lemma W. Senbet (1946) Director since 2005
Dr. Senbet is the William E. Mayer Chair Professor of Finance and Founding Director, Center for Financial Policy, at the University of Maryland, Robert H. Smith School of Business. He was chair of the Finance Department of the University of Maryland, Robert H. Smith School of Business from 1998 to 2006. Since June 2013, he has been on leave from the University to serve as Executive Director of African Economic Research Consortium which focuses on economic policy research and training. Previously, he was a chaired professor of finance at the University of Wisconsin-Madison. Also, he was a Director of the Fortis Funds from March 2000 to July 2002. Dr. Senbet served as Director of the American Finance Association and President of the Western Finance Association. In 2006, Dr. Senbet was inducted Fellow of Financial Management Association International for his career-long distinguished scholarship and professional service.
Interested Directors and Officers
James E. Davey (1964) Director since 2012, President and Chief Executive Officer since 2010
Mr. Davey serves as Executive Vice President of Hartford Life Insurance Company (“HLIC”) and The Hartford Financial Services Group, Inc. Additionally, Mr. Davey serves as Chairman of the Board, Manager and Senior Managing Director of Hartford Funds Distributors, LLC (“HFD”). He also currently serves as Director, Chairman of the Board, President and Senior Managing Director of Hartford Administrative Services Company (“HASCO”). Mr. Davey also serves as Manager, Chairman of the Board and Senior Managing Director for Hartford Funds Management Company, LLC (“HFMC”). Mr. Davey joined The Hartford in 2002.
Lowndes A. Smith (1939) Director since 1996 (HSF) and 2002 (HSF2), Co-Chairman of the Investment Committee since 2005
Mr. Smith served as Vice Chairman of The Hartford from February 1997 to January 2002, as President and Chief Executive Officer of Hartford Life, Inc. from February 1997 to January 2002, and as President and Chief Operating Officer of The Hartford Life Insurance Companies from January 1989 to January 2002. Mr. Smith serves as a Director of White Mountains Insurance Group Ltd. (October 2003 to current); One Beacon Insurance (October 2006 to current); Symetra Financial (August 2007 to current) and is a Managing Director of Whittington Gray Associates (January 2007 to current).
Other Officers
Mark A. Annoni (1964) Vice President, Controller and Treasurer since 2012
Mr. Annoni currently serves as the Assistant Vice President of HLIC (February 2004 to present).
| 25 |
| Hartford Stock HLS Fund |
| Directors and Officers (Unaudited) – (continued) |
Michael R. Dressen (1963) AML Compliance Officer since 2011
Mr. Dressen currently serves as Assistant Vice President of HLIC. He also serves as Chief Compliance Officer and AML Compliance Officer of HASCO and as AML Officer of HFD. Mr. Dressen has served in various positions within The Hartford and its subsidiaries in connection with the operation of the Hartford Funds.
Edward P. Macdonald (1967) Vice President, Secretary and Chief Legal Officer since 2005
Mr. Macdonald currently serves as Assistant Secretary, Executive Vice President and Deputy General Counsel of HFD, HASCO and HFMC. He also serves as Vice President of HLIC. Mr. Macdonald has served in various positions within The Hartford and its subsidiaries in connection with the operation of the Hartford Funds. Mr. Macdonald joined The Hartford in 2005.
Joseph G. Melcher (1973) Vice President and Chief Compliance Officer since 2013
Mr. Melcher currently serves as Executive Vice President of HASCO and HFD. Mr. Melcher also currently serves as Executive Vice President and Chief Compliance Officer of HFMC. Mr. Melcher has served in various positions within The Hartford and its subsidiaries in connection with the operation of the Hartford Funds since joining The Hartford in 2012. Prior to joining The Hartford, Mr. Melcher worked at Touchstone Investments, a member of the Western & Southern Financial Group, where he held the position of Vice President and Chief Compliance Officer from 2010 through 2012 and Assistant Vice President, Compliance from 2005 to 2010.
Vernon J. Meyer (1964) Vice President since 2006
Mr. Meyer currently serves as Senior Vice President of HLIC. He also currently serves as Managing Director and Chief Investment Officer of HFMC. Mr. Meyer has served in various positions within The Hartford and its subsidiaries in connection with the operation of the Hartford Funds. Mr. Meyer joined The Hartford in 2004.
Laura S. Quade (1969) Vice President since 2012
Ms. Quade currently serves as Vice President of HASCO and HFD. She is the Head of Operations of HASCO and also serves as Director, Enterprise Operations of HLIC. Ms. Quade has served in various positions within The Hartford and its subsidiaries in connection with the operation of the Hartford Funds.
Martin A. Swanson (1962) Vice President since 2010
Mr. Swanson currently serves as Vice President of HLIC. Mr. Swanson also serves as Managing Director, Chief Marketing Officer and Principal of HFD. Mr. Swanson has served in various positions within The Hartford and its subsidiaries in connection with the operation of the Hartford Funds.
HOW TO OBTAIN A COPY OF THE FUND’S PROXY VOTING POLICIES AND VOTING RECORDS
(UNAUDITED)
A description of the policies and procedures that the Fund uses to determine how to vote proxies relating to portfolio securities and information about how the Fund voted proxies relating to portfolio securities during the most recent twelve-month period ended June 30 are available (1) without charge, upon request, by calling 800-862-6668 and (2) on the SEC’s website at http://www.sec.gov.
QUARTERLY PORTFOLIO HOLDINGS INFORMATION (UNAUDITED)
The Fund files a complete schedule of portfolio holdings with the SEC for the first and third quarters of each fiscal year on Form N-Q. The Fund’s Forms N-Q are available (1) without charge, upon request, by calling 800-862-6668 and (2) on the SEC’s website at http://www.sec.gov. The Form N-Q may be reviewed and copied at the SEC’s Public Reference Room in Washington, DC. Information on the operation of the Public Reference Room may be obtained by calling 1-800-SEC-0330.
| 26 |
| Hartford Stock HLS Fund |
| Expense Example (Unaudited) |
Your Fund's Expenses
As a shareholder of the Fund, you incur two types of costs: (1) transaction costs and (2) ongoing costs, including investment management fees, distribution and/or service (12b-1) fees, if any, and other fund expenses. This example is intended to help you understand your ongoing costs (in dollars) of investing in the Fund and to compare these costs with the ongoing costs of investing in other mutual funds. The example is based on an investment of $1,000 invested at the beginning of the period and held for the period of June 30, 2013 through December 31, 2013.
Actual Expenses
The first set of columns of the table below provides information about actual account values and actual expenses. You may use the information in this column, together with the amount you invested, to estimate the expenses that you paid over the period. Simply divide your account value by $1,000 (for example, an $8,600 account value divided by $1,000 = 8.6), then multiply the result by the number in the line under the heading entitled “Expenses Paid During Period” to estimate the expenses you paid on your account during this period.
Hypothetical Example for Comparison Purposes
The second set of columns of the table below provides information about hypothetical account values and hypothetical expenses based on the Fund’s actual expense ratio and an assumed rate of return of 5% per year before expenses, which is not the Fund’s actual return. The hypothetical account values and expenses may not be used to estimate the actual ending account balance or expenses you paid for the period. You may use this information to compare the ongoing costs of investing in the Fund and other funds. To do so, compare this 5% hypothetical example with the 5% hypothetical examples that appear in the shareholder reports of the other funds.
Please note that the expenses shown in the table are meant to highlight your ongoing costs only and do not reflect any transactional costs, such as sales charges (loads) and CDSC. Therefore, the second set of columns of the table is useful in comparing ongoing costs only, and will not help you determine the relative total costs of owning different funds. In addition, if these transactional costs were included, your costs would be higher. Expenses are equal to the Fund's annualized expense ratios multiplied by average account value over the period, multiplied by 184/365 (to reflect the one-half year period).
| Actual return | Hypothetical (5% return before expenses) | |||||||||||||||||||||||||||||||
| Beginning Account Value June 30, 2013 | Ending Account Value December 31, 2013 | Expenses paid during the period June 30, 2013 through December 31, 2013 | Beginning Account Value June 30, 2013 | Ending Account Value December 31, 2013 | Expenses paid during the period June 30, 2013 through December 31, 2013 | Annualized expense ratio | Days in the current 1/2 year | Days in the full year | ||||||||||||||||||||||||
| Class IA | $ | 1,000.00 | $ | 1,142.60 | $ | 2.74 | $ | 1,000.00 | $ | 1,022.65 | $ | 2.58 | 0.51 | % | 184 | 365 | ||||||||||||||||
| Class IB | $ | 1,000.00 | $ | 1,141.20 | $ | 4.09 | $ | 1,000.00 | $ | 1,021.39 | $ | 3.86 | 0.76 | % | 184 | 365 | ||||||||||||||||
| 27 |
| Hartford Stock HLS Fund |
| Approval of Investment Management and Investment Sub-Advisory Agreements (Unaudited) |
Section 15(c) of the Investment Company Act of 1940, as amended (the “1940 Act”), requires that each mutual fund’s board of directors, including a majority of those directors who are not “interested persons” of the mutual fund, as defined in the 1940 Act (the “Independent Directors”), annually review and consider the continuation of the mutual fund’s investment advisory and sub-advisory agreements. At its meeting held on August 6-7, 2013, the Board of Directors (the “Board”) of Hartford Series Fund, Inc., including each of the Independent Directors, unanimously voted to approve the continuation of the investment management agreement for Hartford Stock HLS Fund (the “Fund”) with Hartford Funds Management Company, LLC (“HFMC”) and the continuation of the investment sub-advisory agreement between HFMC and the Fund’s sub-adviser, Wellington Management Company, LLP (the “Sub-adviser,” and together with HFMC, the “Advisers”) (collectively, the “Agreements”).
In the months preceding the August 6-7, 2013 meeting, the Board requested, received, and reviewed written responses from the Advisers to questions posed to them on behalf of the Independent Directors and supporting materials relating to those questions and responses. The Board considered information furnished to the Board at its meetings throughout the year, as well as information specifically prepared in connection with the annual approval of the Agreements at the Board’s meetings held on June 18-19, 2013 and August 6-7, 2013. Information provided to the Board at its meetings throughout the year included, among other things, reports on Fund performance, legal and compliance matters, sales and marketing activity, shareholder services, and the other services provided to the Fund by the Advisers and their affiliates. The Board also received in-person presentations by Fund officers and representatives of HFMC at the Board’s meetings on June 18-19, 2013 and August 6-7, 2013 concerning the Agreements.
The Independent Directors, advised by independent legal counsel, engaged two service providers to assist them with evaluating the Agreements with respect to the Fund. Lipper Inc. (“Lipper”), an independent provider of investment company data, was retained to provide the Board with reports on how the Fund’s contractual management fees, actual management fees, other non-management fees, overall expense ratios and investment performance compared to those of mutual funds with similar investment objectives. The Independent Directors also engaged an independent financial services consulting firm (the “Consultant”) to assist them in evaluating the Fund’s management fees, sub-advisory fees, other non-management fees, overall expense ratios and investment performance. In addition, the Consultant reviewed the profitability calculations utilized by HFMC in connection with the continuation of the investment management agreement.
In determining whether to continue the Agreements for the Fund, the members of the Board reviewed and evaluated information and factors they believed to be relevant and appropriate in light of the information that the Board deemed necessary and appropriate through the exercise of its reasonable business judgment. While individual members of the Board may have weighed certain factors differently, the Board’s determination to continue the Agreements was based on a comprehensive consideration of all information provided to the Board throughout the year and specifically with respect to the continuation of the Agreements. A more detailed discussion of the factors the Board considered with respect to its approval of the Agreements is provided below.
Nature, Extent, and Quality of Services Provided by the Advisers
The Board requested and considered information concerning the nature, extent, and quality of the services provided to the Fund by the Advisers. The Board considered, among other things, the terms of the Agreements and the range of services provided by the Advisers. The Board considered the Advisers’ professional personnel who provide services to the Fund, including each Adviser’s ability and experience in attracting and retaining qualified personnel to service the Fund. The Board considered each Adviser’s reputation and overall financial strength, as well as its willingness to consider and implement organizational and operational changes designed to improve services to the Fund. In addition, the Board considered the quality of each Adviser’s communications with the Board and responsiveness to Board inquiries.
The Board also requested and evaluated information concerning each Adviser’s regulatory and compliance environment. In this regard, the Board requested and reviewed information on each Adviser’s compliance policies and procedures, compliance history, and a report from the Fund’s Chief Compliance Officer on each Adviser’s compliance with applicable laws and regulations, including responses to regulatory developments and compliance issues raised by regulators. The Board also noted the Advisers’ support of the Fund’s compliance control structure, particularly the resources devoted by the Advisers in support of the Fund’s obligations pursuant to Rule 38a-1 under the 1940 Act.
| 28 |
With respect to HFMC, the Board noted that under the Agreements, HFMC is responsible for the management of the Fund, including overseeing fund operations and service providers, as well as investment advisory services in connection with selecting, monitoring and supervising the Sub-adviser. The Board considered HFMC’s ongoing monitoring of people, process and performance, including its quarterly reviews of each of the Hartford Funds, semi-annual meetings with the leaders of each Fund’s portfolio management team, and oversight of the Funds’ approximately 40 portfolio managers. The Board recognized that HFMC has demonstrated a record of making changes to the management and/or strategies of the Funds when warranted. The Board considered HFMC’s oversight of the Sub-adviser’s investment approach and results, process for monitoring best execution of portfolio trades by the Sub-adviser, and approach to risk management with respect to the Fund and the service providers to the Fund. The Board also considered HFMC’s oversight of compliance with the Fund’s objective and policies as well as with applicable laws and regulations, noting that regulatory and other developments had over time led to an increase in the scope of HFMC’s services in this regard.
In addition, the Board considered HFMC’s ongoing commitment to review and rationalize the Hartford Funds product line-up and the expenses that HFMC had incurred in connection with fund combinations in recent years. The Board considered that HFMC or its affiliates are responsible for providing the Fund’s officers. The Board also noted that Hartford Life Insurance Company (“HLIC”) provides administrative services to the Fund. The Board considered its experiences with HFMC and HLIC with respect to each of these services.
With respect to the Sub-adviser, who provides day-to-day portfolio management services, the Board considered the quality of the Fund’s portfolio manager, the Sub-adviser’s other investment personnel, its investment philosophy and process, investment research capabilities and resources, performance record, trade execution capabilities and experience. The Board considered the experience of the Fund’s portfolio manager, the number of accounts managed by the portfolio manager, and the Sub-adviser’s method for compensating the portfolio manager.
Based on these considerations, the Board concluded that it was satisfied with the nature, extent and quality of the services provided to the Fund by HFMC and the Sub-adviser.
Performance of the Fund and the Advisers
The Board considered the investment performance of the Fund. In this regard, the Board reviewed the performance of the Fund over different time periods presented in the materials and evaluated HFMC’s analysis of the Fund’s performance for these time periods. The Board considered information and materials provided to the Board by the Advisers concerning Fund performance, as well as information from Lipper comparing the investment performance of the Fund to an appropriate benchmark and universe of peer funds. The Board noted that the Fund’s performance was in the 4th quintile of its performance universe for the 1-year period, the 3rd quintile for the 3-year period and the 2nd quintile for the 5-year period. The Board also noted that the Fund’s performance was below its benchmark for the 1- and 3-year periods and in line with its benchmark for the 5-year period.
The Board considered the detailed investment analytics reports provided by Hartford Funds’ Investment Advisory Group throughout the year. These reports include, among other things, information on the Fund’s gross and net returns, the Fund’s investment performance relative to an appropriate benchmark and peer group, various statistics concerning the Fund’s portfolio, and a narrative summary of various factors affecting Fund performance. The Board considered the Advisers’ cooperation with the Investment Committee, which assists the Board in evaluating the performance of the Fund at periodic meetings throughout the year. The Board also considered the analysis provided by the Consultant relating to the Fund’s performance track record.
In light of all the considerations noted above, the Board concluded that it had continued confidence in HFMC’s and the Sub-adviser’s overall capabilities to manage the Fund.
Costs of the Services and Profitability of the Advisers
The Board reviewed information regarding HFMC’s cost to provide investment management and related services to the Fund and HFMC’s profitability, both overall and for the Fund, on a pre-tax basis without regard to distribution expenses. The Board also requested and reviewed information about the profitability to HFMC and its affiliates from all services provided to the Fund and all aspects of their relationship with the Fund. The Board also requested and received information relating to the operations and profitability of the Sub-adviser.
| 29 |
| Hartford Stock HLS Fund |
| Approval of Investment Management and Investment Sub-Advisory Agreements (Unaudited) – (continued) |
The Board considered the Consultant’s review of the profitability calculations utilized by HFMC in connection with the continuation of the investment management agreement, noting the Consultant’s view that Hartford Funds’ process for calculating and reporting Fund profitability is reasonable. In this regard, the Board noted that the Consultant had previously performed a full review of this process and reported that such process is sound and well within common industry practice.
Based on these considerations, the Board concluded that the profits anticipated to be realized by the Advisers and their affiliates from their relationships with the Fund would not be excessive.
Comparison of Fees and Services Provided by the Advisers
The Board considered comparative information with respect to the management fees to be paid by the Fund to HFMC and the total expense ratios of the Fund. The Board also considered comparative information with respect to the sub-advisory fees to be paid by HFMC to the Sub-adviser. In this regard, the Board requested and reviewed information from HFMC and the Sub-adviser relating to the management and sub-advisory fees, including the sub-advisory fee schedule for the Fund, and total operating expenses for the Fund. The Board considered that the management fee for the Fund includes the fee paid to HLIC for providing certain administrative services to the Fund. With respect to the sub-advisory fee schedule, the Board considered representations from HFMC and the Sub-adviser that the Sub-adviser’s fees were negotiated at arm’s length. The Board also reviewed information from Lipper comparing the Fund’s contractual management fees, actual management fees and overall expense ratios relative to a group of funds selected by Lipper, in consultation with the Consultant, and a broader universe of funds selected by Lipper. The Board noted that the Fund’s contractual management fee, actual management fee and total expenses (less 12b-1 and shareholder service fees) were in the 1st quintile of its expense group.
While the Board recognized that comparisons between the Fund and peer funds are imprecise, given the differing service levels and characteristics of mutual funds and the different business models and cost structures of the Advisers, the comparative information provided by Lipper assisted the Board in evaluating the reasonableness of the Fund’s management and sub-advisory fees and total operating expenses. In addition, the Board considered the analysis and recommendations of the Consultant relating to the Fund’s management and sub-advisory fees and total operating expenses.
Based on these considerations, the Board concluded that the Fund’s fees and total operating expenses, in conjunction with the information about quality of services, profitability, economies of scale, and other matters discussed, were reasonable in light of the services provided.
Economies of Scale
The Board requested and considered information regarding the Advisers’ realization of economies of scale with respect to the Fund and whether the fee levels reflect these economies of scale for the benefit of the Fund’s shareholders. The Board reviewed the breakpoints in the management fee schedule for the Fund, which reduce fee rates as Fund assets grow over time. The Board recognized that a fund with assets beyond the last breakpoint level will continue to benefit from economies of scale because additional assets are charged the lowest breakpoint fee resulting in lower overall effective management fee rates. The Board also recognized that a fee schedule that reaches a lower breakpoint quickly provides shareholders with the benefit of anticipated or potential economies of scale. The Board noted the effect of the sale and run-off of the variable annuity business on the HLS Funds.
The Board reviewed and evaluated materials from Lipper showing how management fee schedules of peer funds reflect economies of scale for the benefit of shareholders as a peer fund’s assets hypothetically increase over time. Based on information provided by HFMC, Lipper, and the Consultant, the Board recognized that there is no uniform methodology for establishing breakpoints or uniform pattern in asset levels that trigger breakpoints or the amounts of breakpoints triggered.
After considering all of the information available to it, the Board concluded that it was satisfied with the extent to which economies of scale would be shared for the benefit of the Fund’s shareholders based on currently available information and the effective advisory fees and expense ratios for the Fund at its current and reasonably anticipated asset levels. The Board noted, however, that it would continue to monitor future growth in Fund assets and the appropriateness of additional breakpoints.
| 30 |
Other Benefits
The Board considered other benefits to the Advisers and their affiliates from their relationships with the Fund, including the role of the Fund in supporting the variable life insurance and variable annuity products offered by The Hartford.
The Board reviewed information noting that HLIC, an affiliate of HFMC, receives fees for providing certain administrative services to the Fund and that HFMC receives fees for fund accounting and related services from the Fund. The Board considered information on profits to HLIC and HFMC for such services. The Board also considered that Hartford Administrative Services Company (“HASCO”), the Fund’s transfer agent and an affiliate of HFMC, receives transfer agency compensation from the Fund, and the Board reviewed information on the profitability of the Fund’s transfer agency function to HASCO. The Board considered information provided by HASCO indicating that the transfer agent fees charged by HASCO to the Fund were fair and reasonable based on publicly available information.
The Board also considered that Hartford Funds Distributors, LLC (“HFD”), an affiliate of HFMC, serves as principal underwriter of the Fund. As principal underwriter, HFD receives 12b-1 fees from the Fund. The Board also noted that certain affiliates of HFD distribute shares of the Fund and receive compensation in that connection.
The Board considered benefits to the Sub-adviser from its use of the Fund’s brokerage commissions to obtain soft dollar research, and representations from HFMC and the Sub-adviser that the Sub-adviser would not make any revenue-sharing payments or any other type of distribution payments to HFMC or its affiliates.
The Board considered the benefits to shareholders of being part of the Hartford Funds family of funds. The Board considered HFMC’s efforts to provide investors in the family with a broad range of investment styles and asset classes.
* * * *
Based upon its review of these various factors, among others, the Board concluded that it is in the best interests of the Fund and its shareholders for the Board to approve the Agreements for an additional year. In reaching this decision, the Board did not assign relative weights to the factors discussed above or deem any one or group of them to be controlling in and of themselves. In connection with their deliberations, the Independent Directors met separately in executive session on several occasions, with independent legal counsel and the Consultant, to review the relevant materials and consider their responsibilities under relevant laws and regulations.
| 31 |
| Hartford Stock HLS Fund |
| Main Risks (Unaudited) |
The main risks of investing in the Fund are described below.
Foreign Investment Risk: Foreign investments can be riskier than U.S. investments. Potential risks include currency risk that may result from unfavorable exchange rates, liquidity risk if decreased demand for a security makes it difficult to sell at the desired price, and risks that stem from substantially lower trading volume on foreign markets.
Market and Selection Risk: The Fund’s share price may fluctuate due to market risk and/or security selections that may underperform compared to the market or relevant benchmarks. If the sub-adviser’s investment strategy does not perform as expected, the Fund could underperform its peers or lose money. There is no guarantee the Fund will achieve its stated objective.
| 32 |
THIS PRIVACY POLICY IS NOT PART OF THIS REPORT
Privacy Policy and Practices of The Hartford Financial Services Group, Inc. and its Affiliates
(herein called “we, our, and us”)
This Privacy Policy applies to our United States Operations
We value your trust. We are committed to the responsible: a) management; b) use; and c) protection; of Personal Information. This notice describes how we collect, disclose, and protect Personal Information.
We collect Personal Information to: a) service your Transactions with us; and b) support our business functions.
We may obtain Personal Information from: a) You; b) your Transactions with us; and c) third parties such as a consumer-reporting agency.
Based on the type of product or service You apply for or get from us, Personal Information such as: a) your name; b) your address; c) your income; d) your payment; or e) your credit history; may be gathered from sources such as applications, Transactions, and consumer reports.
To serve You and service our business, we may share certain Personal Information. We will share Personal Information, only as allowed by law, with affiliates such as: a) our insurance companies; b) our employee agents; c) our brokerage firms; and d) our administrators.
As allowed by law, we may share Personal Financial Information with our affiliates to: a) market our products; or b) market our services; to You without providing You with an option to prevent these disclosures. | We may also share Personal Information, only as allowed by law, with unaffiliated third parties including:
When allowed by law, we may share certain Personal Financial Information with other unaffiliated third parties who assist us by performing services or functions such as:
We, and third parties we partner with, may track some of the pages You visit through the use of: a) cookies; b) pixel tagging; or c) other technologies; and currently do not process or comply with any web browser’s “do not track” signal or similar mechanism that indicates a request to disable online tracking of individual users who visit our websites or use our services.
We will not sell or share your Personal Financial Information with anyone for purposes unrelated to our business functions without offering You the opportunity to:
We only disclose Personal Health Information with:
Our employees have access to Personal Information in the course of doing their jobs, such as: |
We use manual and electronic security procedures to maintain: a) the confidentiality; and b) the integrity of; Personal Information that we have. We use these procedures to guard against unauthorized access.
Some techniques we use to protect Personal Information include: a) secured files; b) user authentication; c) encryption; d) firewall technology; and e) the use of detection software.
We are responsible for and must: a) identify information to be protected; b) provide an adequate level of protection for that data; c) grant access to protected data only to those people who must use it in the performance of their job-related duties. Employees who violate our Privacy Policy will be subject to discipline, which may include ending their employment with us.
At the start of our business relationship, we will give You a copy of our current Privacy Policy.
We will also give You a copy of our current Privacy Policy once a year if You maintain a continuing business relationship with us.
We will continue to follow our Privacy Policy regarding Personal Information even when a business relationship no longer exists between us. | As used in this Privacy Notice:
Application means your request for our product or service.
Personal Financial Information means financial information such as:
Personal Health Information means health information such as:
Personal Information means information that identifies You personally and is not otherwise available to the public. It includes:
Transaction means your business dealings with us, such as:
You means an individual who has given us Personal Information in conjunction with: |
This Privacy Policy is being provided on behalf of the following affiliates of The Hartford Financial Services Group, Inc.:
1stAGChoice, Inc.; Access CoverageCorp, Inc.; Access CoverageCorp Technologies, Inc.; American Maturity Life Insurance Company; Archway 60 R, LLC; Business Management Group, Inc.; Catalyst360, LLC; Champlain Life Reinsurance Company; DMS R, LLC; Eloy R, LLC; Ersatz Corporation; First State Insurance Company; Hartford Accident and Indemnity Company; Hartford Administrative Services Company; Hartford Casualty General Agency, Inc.; Hartford Casualty Insurance Company; Hartford-Comprehensive Employee Benefit Service Company; Hartford Equity Sales Company, Inc.; Hartford Fire General Agency, Inc.; Hartford Fire Insurance Company; Hartford Funds Management Company, LLC; Hartford Funds Management Group, Inc.; Hartford HLS Series Fund II, Inc.; Hartford Insurance Company of Illinois; Hartford Insurance Company of the Midwest; Hartford Insurance Company of the Southeast; Hartford Integrated Technologies, Inc.; Hartford International Life Reassurance Corporation; Hartford Funds Distributors, LLC; Hartford Investment Management Company; Hartford Life and Accident Insurance Company; Hartford Life and Annuity Insurance Company; Hartford Life Insurance Company; Hartford Life Private Placement, LLC; Hartford Lloyd’s Corporation; Hartford Lloyd’s Insurance Company; Hartford Mezzanine Investors I, LLC; Hartford Residual Market, L.C.C.; Hartford Retirement Services, LLC; Hartford Securities Distribution Company, Inc.; Hartford Series Fund, Inc.; Hartford Specialty Insurance Services of Texas, LLC; Hartford Strategic Investments, LLC; Hartford Underwriters Insurance Company; Hartford Technology Services Company, L.L.C.; Hartford of Texas General Agency, Inc.; Hartford Underwriters General Agency, Inc.; HARTRE Company, L.C.C.; HL Investment Advisors, LLC; HLA LLC; Horizon Management Group, LLC; HRA Brokerage Services, Inc.; Lanidex Class B, LLC; M-CAP Insurance Agency, LLC; New England Insurance Company; New England Reinsurance Corporation; Nutmeg Insurance Agency, Inc.; Nutmeg Insurance Company; Pacific Insurance Company, Limited; Planco, LLC: Property and Casualty Insurance Company of Hartford; Revere R, LLC; RVR R, LLC; Sentinel Insurance Company, Ltd.; Sunstone R, LLC; Symphony R, LLC; The Evergreen Group Incorporated; The Hartford Alternative Strategies Fund; The Hartford Mutual Funds, Inc.; The Hartford Mutual Funds II, Inc.; Trumbull Flood Management, L.L.C.; Trumbull Insurance Company; Twin City Fire Insurance Company; White River Life Reinsurance Company.
HPP Revised December 2013
HARTFORD HLS FUNDS
c/o The Hartford Wealth Management - Global Annuities
P.O. Box 14293
Lexington, KY 40512-4293
HARTFORDFUNDS
hartfordfunds.com
Hartford Series Fund, Inc. is underwritten and distributed by Hartford Funds Distributors, LLC.
Hartford Series Fund, Inc. inception dates range from 1977 to date. Hartford Series Fund, Inc. is not a subsidiary of The Hartford Financial Services Group, Inc. ("The Hartford") but is underwritten, distributed by and advised by subsidiaries of The Hartford. Investments in Hartford Series Fund, Inc. are not guaranteed by The Hartford or any other entity.
This report is submitted for the general information of the shareholders of the Funds. It is not authorized for distribution unless preceded or accompanied by a current prospectus for the Funds.
Investors should carefully consider the investment objectives, risks, charges, and expenses of Hartford Funds before investing. This and other information can be found in the prospectus and summary prospectus, which can be obtained by calling 888-843-7824 (retail) or 877-836-5854 (institutional). Investors should read them carefully before they invest.
HLSAR-S13 2-14 113554-2 Printed in U.S.A ©2013 The Hartford, Hartford, CT 06115
HARTFORDFUNDS
| HARTFORD TOTAL RETURN
BOND HLS FUND
2013 Annual Report
|
A MESSAGE FROM THE PRESIDENT
Dear Fellow Shareholders:
Thank you for investing in Hartford HLS Funds.
Market Review
U.S. equities (as represented by the S&P 500 Index) generated their strongest year since 1997 in 2013, rising 32.39% for the year. During the fourth quarter, equities rose without looking back, pushing the S&P 500 Index and the Dow Jones Industrial Average to new all-time highs. Despite previously cheering delays to quantitative-easing tapering, the stock market received an additional boost at the end of the year following the U.S. Federal Reserve’s (Fed) announcement of a $10-billion-a-month reduction in bond purchases beginning in January.
The Fed’s decision to begin tapering its bond purchases is generally considered a vote of confidence in the recovering U.S. economy. Consumer spending has stabilized, the housing market is showing steady improvement, the unemployment rate is slowly declining and economic growth clocked in at a healthy 4.1% in the third quarter. Equities have also recovered since the market low in March 2009: The S&P 500 Index has gained 173% from the market low through December 31, 2013.
Signs of improvement are also visible outside the U.S. Europe appears to have begun its own economic recovery, and emerging markets have reversed their recent lackluster performance. Fiscal policy continues to wield significant influence in today’s economy and central banks across the globe are maintaining their accommodative stances, including the appointment of Janet Yellen, who is widely expected to continue current monetary policies, to succeed Ben Bernanke as U.S. Federal Reserve chairman.
It’s important to stay abreast of domestic and international economic developments while balancing your individual investment goals. Meeting with your financial advisor on a regular basis to examine your current investment strategy can help you determine whether you are on the right track:
| • | Is your portfolio fully diversified with an appropriate mix of stocks and bonds? |
| • | Is your portfolio incorporating both domestic and international holdings to take advantage of the global economic recovery? |
| • | Are your investments still in line with your risk tolerance and investment time horizon? |
Your financial advisor can help you choose options within our fund family to navigate today’s markets with confidence.
Thank you again for investing with Hartford HLS Funds.
James Davey
President
Hartford HLS Funds
1The S&P 500 Index is a market capitalization-weighted price index composed of 500 widely held common stocks.
2The Dow Jones Industrial Average is an unmanaged, price-weighted index of 30 of the largest, most widely held stocks traded on the New York Stock Exchange.
Hartford Total Return Bond HLS Fund
Table of Contents
This report is prepared for the general information of contract owners and qualified retirement plan participants. It is not an offer of contracts or of qualified retirement plans. It should not be used in connection with any offer, except in conjunction with the appropriate product prospectus which contains all pertinent information including the applicable sales, administrative and other charges.
The views expressed in the Fund’s Manager Discussion under ‘‘Why did the Fund perform this way?’’ and ‘‘What is the outlook?’’ are views of the Fund’s sub-adviser and portfolio management team through the end of the period and are subject to change based on market and other conditions. The Fund’s Manager Discussion is for informational purposes only and does not represent an offer, recommendation or solicitation to buy, hold or sell any security. The specific securities identified and described, if any, do not represent all of the securities purchased or sold and you should not assume that investments in the securities identified and discussed will be profitable.
Hartford Total Return Bond HLS Fund inception 08/31/1977
(sub-advised by Wellington Management Company, LLP)
| Investment objective – Seeks a competitive total return, with income as a secondary objective. |
Performance Overview 12/31/03 - 12/31/13

The chart above represents the hypothetical growth of a $10,000 investment in Class IA. Growth results in classes other than Class IA will vary from what is seen above due to differences in the expenses charged to those share classes.
Average Annual Total Returns (as of 12/31/13)
| 1 Year | 5 Years | 10 Years | ||||
| Total Return Bond IA | -1.36% | 7.01% | 4.30% | |||
| Total Return Bond IB | -1.66% | 6.73% | 4.04% | |||
| Barclays U.S. Aggregate Bond Index | -2.02% | 4.44% | 4.55% |
PERFORMANCE DATA QUOTED REPRESENTS PAST PERFORMANCE AND DOES NOT GUARANTEE FUTURE RESULTS. The investment return and principal value of the investment will fluctuate so that investors’ shares, when redeemed, may be worth more or less than their original cost. Current performance may be lower or higher than the performance data quoted. To obtain performance data current to the most recent month-end, please visit our website at www.hartfordfunds.com.
Total returns presented above were calculated using the Fund’s net asset value available to shareholders for sale or redemption of Fund shares on December 31, 2013, which may exclude investment transactions as of this date. All share class returns assume the reinvestment of all distributions at net asset value and the deduction of all fund expenses.
Performance information includes performance under the Fund’s previous sub-adviser, Hartford Investment Management Company. As of March 5, 2012, Hartford Investment Management Company no longer served as the sub-adviser to the Fund.
Barclays U.S. Aggregate Bond Index is an unmanaged index and is composed of securities from the Barclays Government/Credit Bond Index, Mortgage-Backed Securities Index, Asset-Backed Securities Index and Commercial Mortgage-Backed Securities Index.
You cannot invest directly in an index.
As of the Fund's current prospectus dated May 1, 2013, the total annual operating expense ratios for Class IA and Class IB were 0.50% and 0.75%, respectively. Actual expenses may be higher. Please see the accompanying Financial Highlights for expense ratios for the year ended December 31, 2013.
The chart and table do not reflect the deductions of taxes, sales charges or other fees which may be applied at the variable life insurance, variable annuity or qualified retirement plan product level. Any such additional sales charges or other fees or expenses would lower the contract’s or plan’s performance.
All investments are subject to risk including the possible loss of principal. For a discussion of the Fund’s risks, please see the Main Risks section of this report. For more detailed information on the risks associated with an investment in the Fund, please see the prospectus.
| 2 |
| Hartford Total Return Bond HLS Fund |
| Manager Discussion |
| December 31, 2013 (Unaudited) |
| Portfolio Managers | ||
| Joseph F. Marvan, CFA | Lucius T. Hill, III | Campe Goodman, CFA |
| Senior Vice President and Fixed Income Portfolio Manager | Senior Vice President and Fixed Income Portfolio Manager | Vice President and Fixed Income Portfolio Manager |
How did the Fund perform?
The Class IA shares of the Hartford Total Return Bond HLS Fund returned -1.36% for the twelve-month period ended December 31, 2013, outperforming the Fund’s benchmark, the Barclays U.S. Aggregate Bond Index, which returned -2.02% for the same period. The Fund also outperformed the -1.87% average return of the Variable Products-Underlying Funds Lipper Intermediate Investment Grade Debt Funds peer group, a group of funds with investment strategies similar to those of the Fund.
Why did the Fund perform this way?
Global central banks’ unconventional policy measures continued to be one of the biggest influences on the market during the year. Central Bank easing and signs of gradual global economic recovery imparted a positive tone to financial markets early in the year. However, concerns about a possible pull back in U.S. Federal Reserve (Fed) stimulus were felt in the second quarter, triggered by Fed Chairman Ben Bernanke’s unexpectedly hawkish tone. Fed officials signaled a readiness to begin tapering the Fed’s asset purchases under quantitative easing (QE) by September and to end purchases by mid-2014 if the economy strengthened sufficiently. The Fed’s earlier-than-expected plan to taper asset purchases sent yields sharply higher and credit spreads gapped out in sympathy. Meanwhile, other major central banks, including the Bank of Japan, European Central Bank, and Bank of England, reiterated their commitment to easy monetary policy for as long it was needed.
Signs of economic momentum and speculation over Fed tapering weighed on U.S. Treasury prices during the year; for the full year 2013, 5-, 10-, and 30-year Treasury yields rose 1.02%, 1.27%, and 1.02%, respectively. Many of the major fixed income sectors, with the exception of high yield and bank loans, posted negative absolute returns due to the rise in yields. However, most sectors outperformed Treasuries on a duration-adjusted basis as credit spreads tightened.
The drivers of the Fund’s outperformance stemmed from its credit sector positioning. The Fund’s positioning in investment grade credit contributed the most to relative outperformance during the period largely due to the Fund’s overweight to financial institutions. The Fund’s allocation to non-agency mortgage backed securities (MBS) was a significant contributor to relative results as non-agencies performed strongly amid improving housing fundamentals and strong data. The Fund’s positioning within high yield credit contributed positively to performance overall. Positive results from an allocation to bank loans and BB-rated high yield issuers more than offset the negative impact of high yield credit default swap index positions, which were used as a source of liquidity and to manage overall portfolio risk.
The Fund’s agency MBS pass-through positioning detracted during the period due largely to an underweight to middle- and higher-coupons in favor of lower-coupon MBS. Allocations to Emerging Market Debt and Non Dollar detracted modestly during the period.
What is the outlook?
In the U.S., we maintain a moderately procyclical risk posture as we see positive economic momentum in the U.S. going forward.
In our opinion, we expect moderately stronger U.S. growth in 2014, underpinned by still extremely loose monetary policy and much less fiscal drag compared to 2013. Corporate and personal balance sheets are also as strong as they have been in years. Although valuations in many fixed income sectors have risen closer to fair value, we believe accommodative monetary policy and reasonable economic growth will bode well for credit spreads.
We ended the year favoring most credit sectors. This view is expressed through an overweight to U.S. financials within investment-grade credit, and through allocations to upper-tier high-yield bonds and bank loans. Non-agency residential MBS still appear attractive to us against the backdrop of an improving housing market. We ended the period with a neutral view on agency MBS as we believe their valuations are slightly overvalued and continue to have an overweight to commercial mortgage-backed securities based on our view of their attractive valuations.
We believe accommodative monetary policy will continue to promote moderate economic growth through 2014, which should be supportive of higher interest rates. Therefore, we have a short duration bias.
| 3 |
| Hartford Total Return Bond HLS Fund |
| Manager Discussion – (continued) |
| December 31, 2013 (Unaudited) |
Diversification by Security Type
as of December 31, 2013
| Category | Percentage of Net Assets | |||
| Equity Securities | ||||
| Call Options Purchased | 0.0 | % | ||
| Preferred Stocks | 0.1 | |||
| Put Options Purchased | 0.1 | |||
| Total | 0.2 | % | ||
| Fixed Income Securities | ||||
| Asset & Commercial Mortgage Backed Securities | 16.2 | % | ||
| Corporate Bonds | 30.3 | |||
| Foreign Government Obligations | 0.2 | |||
| Municipal Bonds | 1.7 | |||
| Senior Floating Rate Interests | 4.4 | |||
| U.S. Government Agencies | 35.3 | |||
| U.S. Government Securities | 20.1 | |||
| Total | 108.2 | % | ||
| Short-Term Investments | 13.3 | % | ||
| Other Assets and Liabilities | (21.7 | ) | ||
| Total | 100.0 | % | ||
Credit Exposure
as of December 31, 2013
| Credit Rating * | Percentage of Net Assets | |||
| Aaa / AAA | 39.5 | % | ||
| Aa / AA | 24.1 | |||
| A | 7.1 | |||
| Baa / BBB | 21.1 | |||
| Ba / BB | 6.4 | |||
| B | 3.1 | |||
| Caa / CCC or Lower | 6.0 | |||
| Not Rated | 0.9 | |||
| Non-Debt Securities and Other Short-Term Instruments | 13.5 | |||
| Other Assets and Liabilities | (21.7 | ) | ||
| Total | 100.0 | % | ||
| * | Credit exposure is the long-term credit ratings for the Fund's holdings, as of the date noted, as provided by Standard and Poor's (S&P) or Moody's Investors Service and typically range from AAA/Aaa (highest) to C/D (lowest). If Moody's and S&P assign different ratings, the lower rating is used. Fixed income securities that are not rated by either agency are listed as "Not Rated." Ratings do not apply to the Fund itself or to Fund shares. Ratings may change. |
| 4 |
| Hartford Total Return Bond HLS Fund |
| Schedule of Investments |
December 31, 2013 (000’s Omitted) |
| Shares or Principal Amount | Market Value ╪ | |||||||
| ASSET & COMMERCIAL MORTGAGE BACKED SECURITIES - 16.2% | ||||||||
| Computer and Electronic Product Manufacturing - 0.4% | ||||||||
| Computer and Peripheral Equipment Manufacturing - 0.4% | ||||||||
| SBA Tower Trust | ||||||||
| $ | 5,620 | 2.93%, 12/15/2017 ■ | $ | 5,720 | ||||
| 7,645 | 3.60%, 04/15/2043 ■ | 7,473 | ||||||
| 13,193 | ||||||||
| Finance and Insurance - 15.8% | ||||||||
| Captive Auto Finance - 1.7% | ||||||||
| Ally Automotive Receivables Trust | ||||||||
| 5,675 | 3.38%, 09/15/2017 ■ | 5,769 | ||||||
| 5,650 | 3.61%, 08/15/2016 ■ | 5,655 | ||||||
| CPS Automotive Trust | ||||||||
| 3,525 | 1.54%, 07/16/2018 ■ | 3,522 | ||||||
| 2,371 | 1.82%, 12/16/2019 ■ | 2,360 | ||||||
| Credit Acceptance Automotive Loan Trust | ||||||||
| 5,325 | 1.21%, 10/15/2020 ■ | 5,329 | ||||||
| 3,865 | 1.50%, 04/15/2021 ■ | 3,864 | ||||||
| 1,860 | 2.21%, 09/15/2020 ■ | 1,870 | ||||||
| 5,115 | 3.12%, 03/16/2020 ■ | 5,133 | ||||||
| Ford Credit Automotive Owner Trust | ||||||||
| 4,600 | 2.54%, 02/15/2016 | 4,684 | ||||||
| 3,680 | 3.21%, 07/15/2017 | 3,794 | ||||||
| 1,730 | 5.53%, 05/15/2016 ■ | 1,747 | ||||||
| Harley-Davidson Motorcycle Trust | ||||||||
| 4,180 | 2.12%, 08/15/2017 | 4,203 | ||||||
| Hyundai Automotive Receivables Trust | ||||||||
| 6,710 | 2.27%, 02/15/2017 | 6,832 | ||||||
| Prestige Automotive Receivables Trust | ||||||||
| 3,855 | 2.49%, 04/16/2018 ■ | 3,887 | ||||||
| Santander Drive Automotive Receivables Trust | ||||||||
| 4,969 | 3.89%, 07/17/2017 | 5,052 | ||||||
| SNAAC Automotive Receivables Trust | ||||||||
| 327 | 1.78%, 06/15/2016 ■ | 328 | ||||||
| 64,029 | ||||||||
| Captive Retail Finance - 0.1% | ||||||||
| CNH Equipment Trust | ||||||||
| 3,075 | 2.97%, 05/15/2017 | 3,182 | ||||||
| Real Estate Credit (Mortgage Banking) - 14.0% | ||||||||
| American Home Mortgage Assets Trust | ||||||||
| 2,498 | 1.08%, 10/25/2046 Δ | 1,759 | ||||||
| Asset Backed Funding Certificates | ||||||||
| 4,612 | 0.38%, 01/25/2037 Δ | 2,630 | ||||||
| Aventura Mall Trust | ||||||||
| 4,465 | 3.74%, 12/05/2032 ■Δ | 4,578 | ||||||
| Banc of America Commercial Mortgage, Inc. | ||||||||
| 6,965 | 5.36%, 09/10/2047 Δ | 7,414 | ||||||
| 11,725 | 5.44%, 11/10/2042 Δ | 12,156 | ||||||
| 2,780 | 5.63%, 07/10/2046 Δ | 3,014 | ||||||
| Banc of America Funding Corp. | ||||||||
| 7,063 | 0.47%, 05/20/2047 Δ | 5,874 | ||||||
| 9,328 | 5.77%, 05/25/2037 | 7,737 | ||||||
| 411 | 5.85%, 01/25/2037 | 323 | ||||||
| BB-UBS Trust | ||||||||
| 2,790 | 3.43%, 11/05/2036 ■ | 2,557 | ||||||
| BCAP LLC Trust | ||||||||
| 1,457 | 0.33%, 01/25/2037 Δ | 1,052 | ||||||
| 3,829 | 0.34%, 03/25/2037 Δ | 3,122 | ||||||
| Bear Stearns Adjustable Rate Mortgage Trust | ||||||||
| 5,823 | 2.25%, 08/25/2035 ‡Δ | 5,828 | ||||||
| 8,973 | 2.43%, 10/25/2035 ‡Δ | 8,813 | ||||||
| Bear Stearns Alt-A Trust | ||||||||
| 826 | 0.54%, 05/25/2036 Δ | 529 | ||||||
| Bear Stearns Commercial Mortgage Securities, Inc. | ||||||||
| 2,010 | 5.47%, 01/12/2045 | 2,227 | ||||||
| 3,600 | 5.54%, 10/12/2041 ‡ | 3,934 | ||||||
| Cal Funding II Ltd. | ||||||||
| 1,806 | 3.47%, 10/25/2027 ■ | 1,782 | ||||||
| Cent CLO L.P. | ||||||||
| 9,345 | 1.70%, 01/25/2026 ■☼ | 9,345 | ||||||
| Citigroup Commercial Mortgage Trust | ||||||||
| 3,480 | 3.09%, 04/10/2046 Δ | 3,283 | ||||||
| 2,160 | 4.25%, 09/10/2046 ■ | 1,567 | ||||||
| 1,430 | 5.11%, 09/10/2046 | 1,443 | ||||||
| 6,460 | 6.34%, 12/10/2049 Δ | 7,314 | ||||||
| Citigroup/Deutsche Bank Commercial Mortgage Trust | ||||||||
| 7,950 | 5.32%, 12/11/2049 ‡ | 8,706 | ||||||
| Commercial Mortgage Loan Trust | ||||||||
| 4,215 | 6.01%, 12/10/2049 Δ | 4,679 | ||||||
| Commercial Mortgage Pass-Through Certificates | ||||||||
| 27,389 | 1.50%, 07/10/2046 ■► | 1,689 | ||||||
| 650 | 2.85%, 10/15/2045 | 610 | ||||||
| 3,555 | 4.02%, 07/10/2045 | 3,604 | ||||||
| 870 | 4.40%, 07/10/2045 ■ | 732 | ||||||
| 4,190 | 4.48%, 12/10/2045 ■Δ | 3,231 | ||||||
| 8,135 | 5.94%, 06/10/2046 Δ | 8,846 | ||||||
| Commercial Mortgage Trust | ||||||||
| 2,575 | 3.42%, 03/10/2031 ■ | 2,448 | ||||||
| 2,540 | 4.75%, 11/15/2045 ■ | 2,006 | ||||||
| Community or Commercial Mortgage Trust | ||||||||
| 4,610 | 3.21%, 03/10/2046 | 4,400 | ||||||
| 685 | 4.35%, 08/10/2030 ■ | 695 | ||||||
| 2,745 | 4.38%, 07/10/2045 Δ | 2,844 | ||||||
| Countrywide Alternative Loan Trust | ||||||||
| 3,643 | 0.48%, 11/25/2035 Δ | 2,937 | ||||||
| Countrywide Home Loans, Inc. | ||||||||
| 6,807 | 2.68%, 09/25/2047 Δ | 5,623 | ||||||
| 1,190 | 2.90%, 04/20/2036 Δ | 821 | ||||||
| 3,955 | 5.06%, 11/20/2035 Δ | 3,376 | ||||||
| CPS Automotive Trust | ||||||||
| 454 | 5.01%, 06/17/2019 ■ | 467 | ||||||
| Credit Suisse Mortgage Capital Certificates | ||||||||
| 6,786 | 5.47%, 09/15/2039 | 7,382 | ||||||
| CS First Boston Mortgage Securities Corp. | ||||||||
| 6,530 | 4.88%, 04/15/2037 | 6,563 | ||||||
| 5,017 | 5.50%, 06/25/2035 | 4,778 | ||||||
| CW Capital Cobalt Ltd. | ||||||||
| 7,951 | 5.22%, 08/15/2048 | 8,579 | ||||||
| DBUBS Mortgage Trust | ||||||||
| 26,156 | 1.52%, 01/01/2021 ■► | 956 | ||||||
| Fieldstone Mortgage Investment Corp. | ||||||||
| 3,773 | 0.43%, 05/25/2036 Δ | 2,161 | ||||||
The accompanying notes are an integral part of these financial statements.
| 5 |
| Hartford Total Return Bond HLS Fund |
| Schedule of Investments – (continued) |
December 31, 2013 (000’s Omitted) |
| Shares or Principal Amount | Market Value ╪ | |||||||
| ASSET & COMMERCIAL MORTGAGE BACKED SECURITIES - 16.2% - (continued) | ||||||||
| Finance and Insurance - 15.8% - (continued) | ||||||||
| Real Estate Credit (Mortgage Banking) - 14.0% - (continued) | ||||||||
| Fieldstone Mortgage Investment Corp. - (continued) | ||||||||
| $ | 3,102 | 0.50%, 04/25/2047 Δ | $ | 1,929 | ||||
| First Franklin Mortgage Loan Trust | ||||||||
| 14,867 | 0.40%, 04/25/2036 ‡Δ | 8,619 | ||||||
| First Horizon Alternative Mortgage Securities | ||||||||
| 12,851 | 2.21%, 04/25/2036 ‡Δ | 10,515 | ||||||
| 13,942 | 2.24%, 09/25/2035 ‡Δ | 12,123 | ||||||
| FREMF Mortgage Trust | ||||||||
| 3,130 | 3.60%, 05/25/2046 ■ | 2,790 | ||||||
| 1,495 | 3.74%, 07/25/2046 ■Δ | 1,239 | ||||||
| 1,015 | 3.95%, 08/25/2023 ■Δ | 849 | ||||||
| 195 | 4.07%, 07/25/2045 ■ | 169 | ||||||
| 850 | 4.18%, 05/25/2045 ■ | 809 | ||||||
| Fremont Home Loan Trust | ||||||||
| 1,859 | 0.31%, 10/25/2036 Δ | 920 | ||||||
| GE Business Loan Trust | �� | |||||||
| 5,297 | 1.17%, 05/15/2034 ■Δ | 3,785 | ||||||
| GMAC Commercial Mortgage Securities, Inc. | ||||||||
| 905 | 5.24%, 11/10/2045 Δ | 951 | ||||||
| GMAC Mortgage Corp. Loan Trust | ||||||||
| 5,550 | 3.41%, 09/19/2035 Δ | 5,193 | ||||||
| 92 | 3.90%, 04/19/2036 Δ | 78 | ||||||
| Goldman Sachs Mortgage Securities Corp. | ||||||||
| 805 | 3.38%, 05/10/2045 | 799 | ||||||
| Goldman Sachs Mortgage Securities Trust | ||||||||
| 3,585 | 2.77%, 11/10/2045 | 3,337 | ||||||
| 3,325 | 2.95%, 11/05/2034 ■ | 3,078 | ||||||
| Greenwich Capital Commercial Funding Corp. | ||||||||
| 4,425 | 5.74%, 12/10/2049 | 4,942 | ||||||
| 4,468 | 6.02%, 07/10/2038 Δ | 4,880 | ||||||
| GSAA Home Equity Trust | ||||||||
| 4,136 | 0.20%, 03/25/2047 Δ | 2,388 | ||||||
| 16,034 | 0.24%, 02/25/2037 Δ | 8,270 | ||||||
| 3,126 | 0.25%, 12/25/2036 Δ | 1,561 | ||||||
| 11,734 | 0.26%, 03/25/2037 Δ | 5,794 | ||||||
| 2,539 | 0.32%, 07/25/2036 Δ | 1,197 | ||||||
| 1,569 | 0.39%, 04/25/2047 Δ | 894 | ||||||
| 4,435 | 5.98%, 06/25/2036 | 2,582 | ||||||
| GSAMP Trust | ||||||||
| 16,458 | 0.25%, 01/25/2037 Δ | 8,635 | ||||||
| 2,435 | 0.26%, 12/25/2046 Δ | 1,315 | ||||||
| 1,805 | 0.36%, 11/25/2036 Δ | 967 | ||||||
| GSR Mortgage Loan Trust | ||||||||
| 11,414 | 2.69%, 01/25/2036 Δ | 10,273 | ||||||
| Harborview Mortgage Loan Trust | ||||||||
| 5,533 | 0.36%, 01/19/2038 Δ | 4,498 | ||||||
| 8,253 | 0.39%, 05/19/2047 Δ | 3,685 | ||||||
| 19,277 | 0.41%, 12/19/2036 Δ | 12,682 | ||||||
| 4,523 | 0.50%, 09/19/2035 Δ | 3,468 | ||||||
| Hilton USA Trust | ||||||||
| 7,015 | 2.66%, 11/05/2030 ■ | 6,945 | ||||||
| 1,200 | 2.92%, 11/05/2030 ■ | 1,200 | ||||||
| IndyMac Index Mortgage Loan Trust | ||||||||
| 4,391 | 0.44%, 07/25/2035 Δ | 3,625 | ||||||
| 730 | 0.45%, 01/25/2036 Δ | 462 | ||||||
| 9,769 | 0.56%, 07/25/2046 Δ | 4,910 | ||||||
| 1,774 | 2.45%, 08/25/2035 Δ | 1,353 | ||||||
| 2,770 | 2.47%, 01/25/2036 Δ | 2,530 | ||||||
| 11,055 | 2.58%, 03/25/2036 Δ | 7,991 | ||||||
| 71 | 2.68%, 12/25/2036 Δ | 61 | ||||||
| JP Morgan Chase Commercial Mortgage Securities Corp. | ||||||||
| 9,350 | 1.67%, 02/12/2051 Δ | 8,897 | ||||||
| 2,070 | 2.75%, 10/15/2045 ■ | 1,360 | ||||||
| 575 | 2.83%, 10/15/2045 | 541 | ||||||
| 2,675 | 3.91%, 05/05/2030 ■Δ | 2,624 | ||||||
| 700 | 4.82%, 10/15/2045 ■Δ | 623 | ||||||
| 4,586 | 5.34%, 08/12/2037 | 4,769 | ||||||
| 9,995 | 5.37%, 12/15/2044 Δ | 10,649 | ||||||
| 6,876 | 5.42%, 01/12/2043 Δ | 7,298 | ||||||
| 1,890 | 5.49%, 08/15/2046 ■Δ | 1,866 | ||||||
| 1,057 | 5.71%, 02/12/2049 Δ | 1,174 | ||||||
| JP Morgan Mortgage Trust | ||||||||
| 763 | 2.72%, 04/25/2037 Δ | 647 | ||||||
| 3,578 | 2.74%, 09/25/2035 Δ | 3,463 | ||||||
| 4,953 | 2.75%, 05/25/2036 Δ | 4,458 | ||||||
| LB-UBS Commercial Mortgage Trust | ||||||||
| 8,647 | 4.95%, 09/15/2030 | 9,032 | ||||||
| 4,396 | 5.43%, 02/15/2040 | 4,842 | ||||||
| 2,908 | 6.05%, 06/15/2038 Δ | 3,163 | ||||||
| 2,050 | 6.32%, 04/15/2041 Δ | 2,343 | ||||||
| Lehman Brothers Small Balance Commercial | ||||||||
| 1,272 | 5.52%, 09/25/2030 ■Δ | 1,212 | ||||||
| Lehman XS Trust | ||||||||
| 2,933 | 0.37%, 07/25/2046 Δ | 2,281 | ||||||
| Luminent Mortgage Trust | ||||||||
| 4,146 | 0.36%, 02/25/2046 Δ | 2,917 | ||||||
| 2,776 | 0.42%, 11/25/2035 Δ | 2,394 | ||||||
| Merrill Lynch Mortgage Investors Trust | ||||||||
| 167 | 2.50%, 12/25/2035 Δ | 153 | ||||||
| 1,741 | 2.79%, 07/25/2035 Δ | 1,461 | ||||||
| 2,176 | 3.02%, 03/25/2036 Δ | 1,499 | ||||||
| Merrill Lynch Mortgage Trust | ||||||||
| 1,255 | 4.75%, 06/12/2043 | 1,304 | ||||||
| 5,135 | 5.20%, 09/12/2042 | 5,284 | ||||||
| Morgan Stanley Capital I | ||||||||
| 100,341 | 2.35%, 09/15/2047 ■► | 2,428 | ||||||
| 10,889 | 5.69%, 04/15/2049 ╦Δ | 12,059 | ||||||
| 780 | 5.84%, 10/15/2042 Δ | 836 | ||||||
| Morgan Stanley Mortgage Loan Trust | ||||||||
| 5,995 | 0.33%, 05/25/2036 - 11/25/2036 Δ | 2,845 | ||||||
| National Credit Union Administration | ||||||||
| 2,364 | 1.84%, 10/07/2020 Δ | 2,384 | ||||||
| Residential Accredit Loans, Inc. | ||||||||
| 9,071 | 1.42%, 11/25/2037 Δ | 5,040 | ||||||
| Residential Asset Securitization Trust | ||||||||
| 3,648 | 0.61%, 03/25/2035 Δ | 2,766 | ||||||
| RFMSI Trust | ||||||||
| 623 | 3.18%, 04/25/2037 Δ | 531 | ||||||
The accompanying notes are an integral part of these financial statements.
| 6 |
|
| Shares or Principal Amount | Market Value ╪ | |||||||
| ASSET & COMMERCIAL MORTGAGE BACKED SECURITIES - 16.2% - (continued) | ||||||||
| Finance and Insurance - 15.8% - (continued) | ||||||||
| Real Estate Credit (Mortgage Banking) - 14.0% - (continued) | ||||||||
| Securitized Asset Backed Receivables LLC | ||||||||
| $ | 2,374 | 0.25%, 07/25/2036 Δ | $ | 1,082 | ||||
| Sequoia Mortgage Trust | ||||||||
| 1,018 | 2.40%, 07/20/2037 Δ | 807 | ||||||
| Soundview Home Equity Loan Trust, Inc. | ||||||||
| 3,900 | 0.34%, 07/25/2037 Δ | 2,049 | ||||||
| 7,820 | 0.41%, 06/25/2036 Δ | 5,196 | ||||||
| Springleaf Mortgage Loan Trust | ||||||||
| 6,285 | 3.52%, 12/25/2065 ■ | 6,181 | ||||||
| Structured Adjustable Rate Mortgage Loan Trust | ||||||||
| 1,744 | 0.46%, 09/25/2034 Δ | 1,499 | ||||||
| Structured Asset Mortgage Investments Trust | ||||||||
| 3,471 | 0.38%, 05/25/2046 Δ | 1,959 | ||||||
| UBS-Barclays Commercial Mortgage Trust | ||||||||
| 5,400 | 3.18%, 03/10/2046 Δ | 5,153 | ||||||
| 2,090 | 4.23%, 03/10/2046 ■ | 1,723 | ||||||
| Wachovia Bank Commercial Mortgage Trust | ||||||||
| 1,315 | 5.42%, 01/15/2045 Δ | 1,402 | ||||||
| Wells Fargo Alternative Loan Trust | ||||||||
| 6,514 | 6.25%, 11/25/2037 | 5,860 | ||||||
| Wells Fargo Commercial Mortgage Trust | ||||||||
| 6,965 | 2.92%, 10/15/2045 | 6,570 | ||||||
| Wells Fargo Mortgage Backed Securities Trust | ||||||||
| 2,179 | 5.16%, 10/25/2035 Δ | 2,124 | ||||||
| WF-RBS Commercial Mortgage Trust | ||||||||
| 3,470 | 3.20%, 03/15/2048 | 3,312 | ||||||
| 175 | 3.44%, 04/15/2045 | 174 | ||||||
| 2,330 | 4.32%, 03/15/2045 ■Δ | 1,766 | ||||||
| 515 | 4.42%, 03/01/2048 Δ | 488 | ||||||
| 3,135 | 4.61%, 12/15/2045 ■Δ | 2,382 | ||||||
| 550 | 4.90%, 06/15/2044 ■‡ | 598 | ||||||
| 2,780 | 5.00%, 06/15/2044 ■ | 2,368 | ||||||
| 1,045 | 5.75%, 04/15/2045 ■Δ | 999 | ||||||
| 519,540 | ||||||||
| 586,751 | ||||||||
| Total asset & commercial mortgage backed securities | ||||||||
| (cost $587,757) | $ | 599,944 | ||||||
| CORPORATE BONDS - 30.3% | ||||||||
| Administrative Waste Management and Remediation - 0.1% | ||||||||
| Investigation and Security Services - 0.1% | ||||||||
| ADT Corp. | ||||||||
| $ | 2,045 | 6.25%, 10/15/2021 ■ | $ | 2,147 | ||||
| Waste Treatment and Disposal - 0.0% | ||||||||
| Clean Harbors, Inc. | ||||||||
| 345 | 5.13%, 06/01/2021 | 348 | ||||||
| 1,385 | 5.25%, 08/01/2020 | 1,427 | ||||||
| 1,775 | ||||||||
| 3,922 | ||||||||
| Air Transportation - 0.1% | ||||||||
| Scheduled Air Transportation - 0.1% | ||||||||
| Continental Airlines, Inc. | ||||||||
| 4,570 | 4.00%, 10/29/2024 ‡ | 4,547 | ||||||
| Apparel Manufacturing - 0.0% | ||||||||
| Cut and Sew Apparel Manufacturing - 0.0% | ||||||||
| Hanesbrands, Inc. | ||||||||
| 1,530 | 6.38%, 12/15/2020 | 1,672 | ||||||
| Arts, Entertainment and Recreation - 1.8% | ||||||||
| Cable and Other Subscription Programming - 1.1% | ||||||||
| DirecTV Holdings LLC | ||||||||
| 4,880 | 3.80%, 03/15/2022 ‡ | 4,688 | ||||||
| 4,000 | 5.00%, 03/01/2021 ‡ | 4,202 | ||||||
| Time Warner Cable, Inc. | ||||||||
| 2,500 | 5.88%, 11/15/2040 ╦ | 2,163 | ||||||
| Time Warner Entertainment Co., L.P. | ||||||||
| 8,175 | 8.38%, 07/15/2033 ╦ | 8,906 | ||||||
| Time Warner, Inc. | ||||||||
| 2,540 | 3.40%, 06/15/2022 | 2,479 | ||||||
| 2,550 | 4.75%, 03/29/2021 | 2,719 | ||||||
| 3,800 | 6.10%, 07/15/2040 ╦ | 4,147 | ||||||
| 2,700 | 6.50%, 11/15/2036 | 3,051 | ||||||
| Viacom, Inc. | ||||||||
| 7,000 | 5.63%, 09/15/2019 ‡ | 7,961 | ||||||
| 40,316 | ||||||||
| Data Processing, Hosting and Related Services - 0.1% | ||||||||
| NCR Corp. | ||||||||
| 1,845 | 4.63%, 02/15/2021 | 1,767 | ||||||
| Newspaper, Periodical, Book and Database Publisher - 0.3% | ||||||||
| Gannett Co., Inc. | ||||||||
| 4,570 | 5.13%, 10/15/2019 - 07/15/2020 ■ | 4,737 | ||||||
| News America, Inc. | ||||||||
| 5,500 | 6.15%, 03/01/2037 ╦ | 6,045 | ||||||
| 1,675 | 6.20%, 12/15/2034 | 1,854 | ||||||
| 12,636 | ||||||||
| Radio and Television Broadcasting - 0.3% | ||||||||
| NBC Universal Media LLC | ||||||||
| 4,630 | 5.15%, 04/30/2020 | 5,175 | ||||||
| 3,390 | 5.95%, 04/01/2041 ╦ | 3,708 | ||||||
| 2,490 | 6.40%, 04/30/2040 ╦ | 2,863 | ||||||
| 11,746 | ||||||||
| 66,465 | ||||||||
| Beverage and Tobacco Product Manufacturing - 0.2% | ||||||||
| Beverage Manufacturing - 0.2% | ||||||||
| Anheuser-Busch InBev Worldwide, Inc. | ||||||||
| 4,050 | 7.75%, 01/15/2019 ‡ | 5,057 | ||||||
| Molson Coors Brewing Co. | ||||||||
| 1,825 | 3.50%, 05/01/2022 ╦ | 1,792 | ||||||
| 6,849 | ||||||||
| Tobacco Manufacturing - 0.0% | ||||||||
| Altria Group, Inc. | ||||||||
| 1,203 | 10.20%, 02/06/2039 ‡ | 1,877 | ||||||
| 8,726 | ||||||||
The accompanying notes are an integral part of these financial statements.
| 7 |
| Hartford Total Return Bond HLS Fund |
| Schedule of Investments – (continued) |
December 31, 2013 (000’s Omitted) |
| Shares or Principal Amount | Market Value ╪ | |||||||
| CORPORATE BONDS - 30.3% - (continued) | ||||||||
| Chemical Manufacturing - 0.2% | ||||||||
| Basic Chemical Manufacturing - 0.2% | ||||||||
| Dow Chemical Co. | ||||||||
| $ | 6,000 | 8.55%, 05/15/2019 ‡ | $ | 7,747 | ||||
| Computer and Electronic Product Manufacturing - 0.3% | ||||||||
| Computer and Peripheral Equipment Manufacturing - 0.2% | ||||||||
| Hewlett-Packard Co. | ||||||||
| 2,970 | 2.65%, 06/01/2016 | 3,060 | ||||||
| 3,600 | 4.65%, 12/09/2021 | 3,707 | ||||||
| Seagate HDD Cayman | ||||||||
| 1,850 | 6.88%, 05/01/2020 ╦ | 2,001 | ||||||
| 8,768 | ||||||||
| Navigational, Measuring and Control Instruments - 0.1% | ||||||||
| Esterline Technologies Corp. | ||||||||
| 1,690 | 7.00%, 08/01/2020 ‡ | 1,825 | ||||||
| 10,593 | ||||||||
| Fabricated Metal Product Manufacturing - 0.1% | ||||||||
| Other Fabricated Metal Product Manufacturing - 0.1% | ||||||||
| Crown Americas, Inc. | ||||||||
| 2,400 | 6.25%, 02/01/2021 ‡ | 2,604 | ||||||
| Finance and Insurance - 15.9% | ||||||||
| Agencies, Brokerages and Other Insurance - 0.1% | ||||||||
| Marsh & McLennan Cos., Inc. | ||||||||
| 3,040 | 2.55%, 10/15/2018 | 3,044 | ||||||
| Captive Auto Finance - 0.4% | ||||||||
| Credit Acceptance Corp. | ||||||||
| 356 | 9.13%, 02/01/2017 | 374 | ||||||
| Ford Motor Credit Co. LLC | ||||||||
| 5,400 | 4.21%, 04/15/2016 | 5,754 | ||||||
| 2,245 | 5.00%, 05/15/2018 | 2,501 | ||||||
| 6,485 | 5.88%, 08/02/2021 | 7,352 | ||||||
| 475 | 6.63%, 08/15/2017 | 550 | ||||||
| 16,531 | ||||||||
| Commercial Banking - 1.4% | ||||||||
| Barclays Bank plc | ||||||||
| 16,740 | 6.05%, 12/04/2017 ■ | 18,715 | ||||||
| BNP Paribas | ||||||||
| 11,625 | 2.38%, 09/14/2017 | 11,869 | ||||||
| 6,000 | 2.40%, 12/12/2018 | 6,004 | ||||||
| Credit Suisse New York | ||||||||
| 6,775 | 5.40%, 01/14/2020 | 7,529 | ||||||
| State Street Corp. | ||||||||
| 7,610 | 4.96%, 03/15/2018 | 8,256 | ||||||
| 52,373 | ||||||||
| Consumer Lending - 0.0% | ||||||||
| Minerva Luxembourg S.A. | ||||||||
| 1,645 | 7.75%, 01/31/2023 ■ | 1,633 | ||||||
| Depository Credit Banking - 3.1% | ||||||||
| Bank of America Corp. | ||||||||
| 3,835 | 2.60%, 01/15/2019 | 3,852 | ||||||
| 6,500 | 5.63%, 07/01/2020 ‡ | 7,428 | ||||||
| 3,290 | 5.75%, 12/01/2017 ‡ | 3,744 | ||||||
| 3,330 | 5.88%, 01/05/2021 ‡ | 3,827 | ||||||
| 1,700 | 7.63%, 06/01/2019 | 2,109 | ||||||
| Citigroup, Inc. | ||||||||
| 4,075 | 1.30%, 04/01/2016 ‡ | 4,085 | ||||||
| 1,850 | 1.70%, 07/25/2016 | 1,867 | ||||||
| 2,200 | 2.50%, 09/26/2018 | 2,211 | ||||||
| 2,060 | 3.88%, 10/25/2023 | 2,025 | ||||||
| 4,150 | 4.59%, 12/15/2015 ‡ | 4,435 | ||||||
| 1,427 | 4.88%, 05/07/2015 | 1,497 | ||||||
| 3,570 | 5.50%, 09/13/2025 | 3,760 | ||||||
| 4,102 | 6.13%, 08/25/2036 ‡ | 4,373 | ||||||
| 3,350 | 6.63%, 06/15/2032 ‡ | 3,727 | ||||||
| 7,705 | 6.68%, 09/13/2043 | 8,866 | ||||||
| 4,839 | 8.50%, 05/22/2019 ‡ | 6,202 | ||||||
| HSBC Holdings plc | ||||||||
| 1,765 | 6.50%, 09/15/2037 | 2,088 | ||||||
| 8,500 | 6.80%, 06/01/2038 | 10,456 | ||||||
| PNC Bank NA | ||||||||
| 2,235 | 6.00%, 12/07/2017 ╦ | 2,547 | ||||||
| 1,874 | 6.88%, 04/01/2018 ╦ | 2,215 | ||||||
| PNC Funding Corp. | ||||||||
| 9,000 | 5.25%, 11/15/2015 | 9,665 | ||||||
| Santander UK plc | ||||||||
| 2,375 | 5.00%, 11/07/2023 ■ | 2,384 | ||||||
| Wells Fargo & Co. | ||||||||
| 4,165 | 3.45%, 02/13/2023 | 3,938 | ||||||
| 7,470 | 4.13%, 08/15/2023 | 7,364 | ||||||
| 8,865 | 5.38%, 11/02/2043 | 9,078 | ||||||
| 113,743 | ||||||||
| Insurance Carriers - 1.6% | ||||||||
| American International Group, Inc. | ||||||||
| 4,595 | 2.38%, 08/24/2015 ‡ | 4,694 | ||||||
| 1,300 | 3.80%, 03/22/2017 ‡ | 1,388 | ||||||
| 2,100 | 8.25%, 08/15/2018 | 2,627 | ||||||
| Massachusetts Mutual Life Insurance Co. | ||||||||
| 2,493 | 8.88%, 06/01/2039 ■ | 3,573 | ||||||
| MetLife, Inc. | ||||||||
| 6,690 | 4.37%, 09/15/2023 | 6,830 | ||||||
| Nationwide Financial Services, Inc. | ||||||||
| 4,280 | 5.38%, 03/25/2021 ■╦ | 4,589 | ||||||
| Nationwide Mutual Insurance Co. | ||||||||
| 5,925 | 9.38%, 08/15/2039 ■╦ | 8,309 | ||||||
| Prudential Financial, Inc. | ||||||||
| 5,230 | 5.10%, 08/15/2043 | 5,194 | ||||||
| Teachers Insurance & Annuity Association of America | ||||||||
| 5,748 | 6.85%, 12/16/2039 ■ | 7,095 | ||||||
| Wellpoint, Inc. | ||||||||
| 2,920 | 1.88%, 01/15/2018 ‡ | 2,887 | ||||||
| 3,670 | 2.30%, 07/15/2018 | 3,641 | ||||||
| 7,500 | 5.10%, 01/15/2044 ‡ | 7,437 | ||||||
| 58,264 | ||||||||
| International Trade Financing (Foreign Banks) - 1.6% | ||||||||
| BPCE S.A. | ||||||||
| 5,715 | 2.50%, 12/10/2018 | 5,685 | ||||||
| 6,680 | 5.70%, 10/22/2023 ■ | 6,882 | ||||||
| Royal (The) Bank of Scotland plc | ||||||||
| 5,000 | 3.95%, 09/21/2015 ╦ | 5,237 | ||||||
| Royal Bank of Scotland Group plc | ||||||||
| 7,875 | 2.55%, 09/18/2015 | 8,054 | ||||||
| 4,590 | 6.13%, 12/15/2022 | 4,691 | ||||||
The accompanying notes are an integral part of these financial statements.
| 8 |
|
| Shares or Principal Amount | Market Value ╪ | |||||||
| CORPORATE BONDS - 30.3% - (continued) | ||||||||
| Finance and Insurance - 15.9% - (continued) | ||||||||
| International Trade Financing (Foreign Banks) - 1.6% - (continued) | ||||||||
| Santander U.S. Debt S.A. | ||||||||
| $ | 8,000 | 3.72%, 01/20/2015 ■╦ | $ | 8,159 | ||||
| Societe Generale | ||||||||
| 1,250 | 8.25%, 11/29/2018 §♠ | 1,339 | ||||||
| Standard Chartered plc | ||||||||
| 13,250 | 5.20%, 01/26/2024 ■ | 13,224 | ||||||
| TSMC Global LTD | ||||||||
| 4,920 | 0.95%, 04/03/2016 ■ | 4,887 | ||||||
| 58,158 | ||||||||
| Nondepository Credit Banking - 1.8% | ||||||||
| Capital One Financial Corp. | ||||||||
| 8,063 | 2.15%, 03/23/2015 | 8,196 | ||||||
| 4,000 | 6.15%, 09/01/2016 ‡ | 4,474 | ||||||
| CIT Group, Inc. | ||||||||
| 45 | 5.00%, 05/15/2017 | 48 | ||||||
| 3,108 | 5.50%, 02/15/2019 ■ | 3,333 | ||||||
| 1,175 | 6.63%, 04/01/2018 ■‡ | 1,321 | ||||||
| Discover Financial Services, Inc. | ||||||||
| 5,970 | 5.20%, 04/27/2022 | 6,212 | ||||||
| General Electric Capital Corp. | ||||||||
| 5,000 | 4.63%, 01/07/2021 | 5,452 | ||||||
| 4,475 | 4.65%, 10/17/2021 | 4,875 | ||||||
| 11,000 | 5.30%, 02/11/2021 ‡ | 12,305 | ||||||
| 8,490 | 5.63%, 05/01/2018 ╦ | 9,750 | ||||||
| 3,900 | 6.25%, 12/15/2022 ╦♠ | 4,027 | ||||||
| SLM Corp. | ||||||||
| 1,590 | 5.50%, 01/15/2019 | 1,650 | ||||||
| 1,915 | 7.25%, 01/25/2022 ╦ | 2,025 | ||||||
| 2,830 | 8.45%, 06/15/2018 ╦ | 3,297 | ||||||
| 66,965 | ||||||||
| Other Financial Investment Activities - 0.0% | ||||||||
| Ladder Capital Finance Holdings LLC | ||||||||
| 481 | 7.38%, 10/01/2017 | 505 | ||||||
| Real Estate Investment Trust (REIT) - 1.9% | ||||||||
| Brandywine Operating Partnership L.P. | ||||||||
| 6,200 | 3.95%, 02/15/2023 | 5,812 | ||||||
| HCP, Inc. | ||||||||
| 3,000 | 2.63%, 02/01/2020 | 2,860 | ||||||
| 3,810 | 4.25%, 11/15/2023 | 3,727 | ||||||
| 4,825 | 6.00%, 01/30/2017 | 5,407 | ||||||
| Health Care, Inc. | ||||||||
| 2,305 | 2.25%, 03/15/2018 | 2,279 | ||||||
| 2,260 | 4.13%, 04/01/2019 | 2,380 | ||||||
| 8,600 | 4.50%, 01/15/2024 | 8,491 | ||||||
| Kimco Realty Corp. | ||||||||
| 8,525 | 3.13%, 06/01/2023 | 7,753 | ||||||
| 1,390 | 4.30%, 02/01/2018 | 1,495 | ||||||
| Liberty Property L.P. | ||||||||
| 2,165 | 3.38%, 06/15/2023 | 1,970 | ||||||
| 1,930 | 4.13%, 06/15/2022 | 1,900 | ||||||
| Mid-America Apartments L.P. | ||||||||
| 3,695 | 4.30%, 10/15/2023 | 3,593 | ||||||
| Realty Income Corp. | ||||||||
| 3,966 | 3.25%, 10/15/2022 | 3,629 | ||||||
| 6,315 | 4.65%, 08/01/2023 | 6,360 | ||||||
| UDR, Inc. | ||||||||
| 1,845 | 3.70%, 10/01/2020 | 1,855 | ||||||
| Ventas Realty L.P. | ||||||||
| 1,895 | 2.00%, 02/15/2018 | 1,863 | ||||||
| 3,425 | 2.70%, 04/01/2020 | 3,275 | ||||||
| 6,400 | 3.25%, 08/15/2022 ‡ | 5,929 | ||||||
| 70,578 | ||||||||
| Securities and Commodity Contracts and Brokerage - 4.0% | ||||||||
| Bear Stearns & Co., Inc. | ||||||||
| 5,192 | 5.55%, 01/22/2017 | 5,786 | ||||||
| 365 | 7.25%, 02/01/2018 | 437 | ||||||
| Goldman Sachs Group, Inc. | ||||||||
| 6,805 | 5.75%, 01/24/2022 ╦ | 7,660 | ||||||
| 6,637 | 6.00%, 06/15/2020 ╦ | 7,610 | ||||||
| 4,400 | 6.45%, 05/01/2036 ╦ | 4,712 | ||||||
| 12,370 | 6.75%, 10/01/2037 | 13,762 | ||||||
| JP Morgan Chase & Co. | ||||||||
| 7,345 | 3.38%, 05/01/2023 | 6,845 | ||||||
| 11,645 | 4.35%, 08/15/2021 ╦ | 12,273 | ||||||
| 800 | 4.50%, 01/24/2022 ╦ | 846 | ||||||
| 1,100 | 4.63%, 05/10/2021 | 1,186 | ||||||
| 9,885 | 5.63%, 08/16/2043 | 10,446 | ||||||
| 6,375 | 6.00%, 01/15/2018 ╦ | 7,341 | ||||||
| Merrill Lynch & Co., Inc. | ||||||||
| 3,006 | 5.70%, 05/02/2017 ╦ | 3,341 | ||||||
| 22,325 | 6.05%, 05/16/2016 | 24,563 | ||||||
| 5,580 | 7.75%, 05/14/2038 | 7,204 | ||||||
| Morgan Stanley | ||||||||
| 5,425 | 2.13%, 04/25/2018 | 5,378 | ||||||
| 3,685 | 4.88%, 11/01/2022 | 3,772 | ||||||
| 2,750 | 5.75%, 01/25/2021 | 3,111 | ||||||
| 15,000 | 6.25%, 08/28/2017 ╦ | 17,164 | ||||||
| 1,600 | 7.30%, 05/13/2019 | 1,943 | ||||||
| UBS AG Stamford CT | ||||||||
| 1,600 | 7.63%, 08/17/2022 | 1,833 | ||||||
| 147,213 | ||||||||
| 589,007 | ||||||||
| Health Care and Social Assistance - 1.3% | ||||||||
| General Medical and Surgical Hospitals - 0.5% | ||||||||
| HCA, Inc. | ||||||||
| 4,160 | 6.50%, 02/15/2020 | 4,571 | ||||||
| 2,135 | 7.25%, 09/15/2020 ╦ | 2,327 | ||||||
| 3,177 | 7.50%, 11/15/2095 ‡ | 2,748 | ||||||
| 120 | 8.50%, 04/15/2019 ╦ | 127 | ||||||
| Memorial Sloan-Kettering Cancer Center | ||||||||
| 4,710 | 5.00%, 07/01/2042 ╦ | 4,643 | ||||||
| Tenet Healthcare Corp. | ||||||||
| 3,695 | 6.00%, 10/01/2020 ■ | 3,857 | ||||||
| 18,273 | ||||||||
| Health and Personal Care Stores - 0.3% | ||||||||
| CVS Caremark Corp. | ||||||||
| 1,175 | 2.75%, 12/01/2022 | 1,084 | ||||||
| 7,900 | 8.35%, 07/10/2031 ■‡ | 9,904 | ||||||
| 10,988 | ||||||||
| Individual and Family Services - 0.0% | ||||||||
| Wellcare Health Plans, Inc. | ||||||||
| 720 | 5.75%, 11/15/2020 | 736 | ||||||
The accompanying notes are an integral part of these financial statements.
| 9 |
| Hartford Total Return Bond HLS Fund |
| Schedule of Investments – (continued) |
December 31, 2013 (000’s Omitted) |
| Shares or Principal Amount | Market Value ╪ | |||||||
| CORPORATE BONDS - 30.3% - (continued) | ||||||||
| Health Care and Social Assistance - 1.3% - (continued) | ||||||||
| Offices and Physicians - 0.1% | ||||||||
| Partners Healthcare System, Inc. | ||||||||
| $ | 2,815 | 3.44%, 07/01/2021 ╦ | $ | 2,757 | ||||
| Pharmaceutical and Medicine Manufacturing - 0.3% | ||||||||
| AbbVie, Inc. | ||||||||
| 4,145 | 1.75%, 11/06/2017 | 4,138 | ||||||
| Express Scripts Holding Co. | ||||||||
| 4,762 | 2.10%, 02/12/2015 | 4,831 | ||||||
| Mylan, Inc. | ||||||||
| 2,095 | 1.80%, 06/24/2016 ■ | 2,136 | ||||||
| 2,250 | 6.00%, 11/15/2018 ■ | 2,397 | ||||||
| 13,502 | ||||||||
| Specialty Hospital-Except Psychiatric & Drug Abuse - 0.1% | ||||||||
| Fresenius Medical Care U.S. Finance II, Inc. | ||||||||
| 3,185 | 5.63%, 07/31/2019 ■ | 3,440 | ||||||
| 49,696 | ||||||||
| Information - 2.7% | ||||||||
| Cable and Other Program Distribution - 0.4% | ||||||||
| Cox Communications, Inc. | ||||||||
| 10,095 | 2.95%, 06/30/2023 ■‡ | 8,821 | ||||||
| DISH DBS Corp. | ||||||||
| 4,060 | 7.88%, 09/01/2019 ‡ | 4,649 | ||||||
| TCI Communications, Inc. | ||||||||
| 2,025 | 8.75%, 08/01/2015 ╦ | 2,278 | ||||||
| 15,748 | ||||||||
| Data Processing Services - 0.1% | ||||||||
| Audatex North America, Inc. | ||||||||
| 1,850 | 6.00%, 06/15/2021 ■ | 1,938 | ||||||
| Software Publishers - 0.2% | ||||||||
| Activision Blizzard | ||||||||
| 3,415 | 5.63%, 09/15/2021 ■ | 3,534 | ||||||
| Brocade Communications Systems, Inc. | ||||||||
| 2,536 | 4.63%, 01/15/2023 ■ | 2,346 | ||||||
| 5,880 | ||||||||
| Telecommunications - Other - 0.2% | ||||||||
| Sprint Nextel Corp. | ||||||||
| 2,995 | 7.00%, 03/01/2020 ■ | 3,339 | ||||||
| 1,306 | 9.00%, 11/15/2018 ■ | 1,574 | ||||||
| Telefonica Emisiones SAU | ||||||||
| 1,775 | 3.99%, 02/16/2016 ╦ | 1,864 | ||||||
| Wind Acquisition Finance S.A. | ||||||||
| 2,275 | 7.25%, 02/15/2018 ■ | 2,385 | ||||||
| 9,162 | ||||||||
| Telecommunications - Wired Carriers - 0.1% | ||||||||
| Unitymedia Hessen GmbH & Co. | ||||||||
| 1,650 | 5.50%, 01/15/2023 ■ | 1,600 | ||||||
| 1,814 | 7.50%, 03/15/2019 ■ | 1,973 | ||||||
| 3,573 | ||||||||
| Telecommunications - Wireless Carriers - 0.4% | ||||||||
| Qwest Corp. | ||||||||
| 1,906 | 7.25%, 10/15/2035 ‡ | 1,846 | ||||||
| T-Mobile USA, Inc. | ||||||||
| 1,315 | 5.25%, 09/01/2018 ■ | 1,384 | ||||||
| 155 | 6.13%, 01/15/2022 | 158 | ||||||
| 1,995 | 6.46%, 04/28/2019 | 2,120 | ||||||
| 860 | 6.63%, 04/28/2021 | 905 | ||||||
| 2,380 | 6.73%, 04/28/2022 | 2,481 | ||||||
| Vimpelcom Holdings | ||||||||
| 3,915 | 5.95%, 02/13/2023 ■ | 3,690 | ||||||
| Vodafone Group plc | ||||||||
| 3,860 | 4.15%, 06/10/2014 | 3,921 | ||||||
| 16,505 | ||||||||
| Wireless Communications Services - 1.3% | ||||||||
| Cellco Partnership - Verizon Wireless Capital LLC | ||||||||
| 2,525 | 8.50%, 11/15/2018 | 3,197 | ||||||
| Verizon Communications, Inc. | ||||||||
| 6,220 | 3.65%, 09/14/2018 | 6,584 | ||||||
| 10,570 | 5.15%, 09/15/2023 | 11,349 | ||||||
| 5,020 | 6.40%, 02/15/2038 | 5,638 | ||||||
| 18,245 | 6.55%, 09/15/2043 ‡ | 21,346 | ||||||
| 48,114 | ||||||||
| 100,920 | ||||||||
| Machinery Manufacturing - 0.2% | ||||||||
| Agriculture, Construction, Mining and Machinery - 0.2% | ||||||||
| Case New Holland, Inc. | ||||||||
| 6,066 | 7.88%, 12/01/2017 ‡ | 7,158 | ||||||
| Mining - 0.2% | ||||||||
| Metal Ore Mining - 0.2% | ||||||||
| Glencore Funding LLC | ||||||||
| 7,605 | 1.70%, 05/27/2016 ■ | 7,611 | ||||||
| Miscellaneous Manufacturing - 0.1% | ||||||||
| Aerospace Product and Parts Manufacturing - 0.1% | ||||||||
| Rockwell Collins, Inc. | ||||||||
| 3,415 | 3.70%, 12/15/2023 | 3,371 | ||||||
| Petroleum and Coal Products Manufacturing - 2.5% | ||||||||
| Natural Gas Distribution - 0.1% | ||||||||
| Ferrellgas Partners L.P. | ||||||||
| 2,770 | 6.50%, 05/01/2021 ‡ | 2,825 | ||||||
| Oil and Gas Extraction - 2.1% | ||||||||
| Anadarko Petroleum Corp. | ||||||||
| 3,315 | 6.38%, 09/15/2017 ‡ | 3,806 | ||||||
| BG Energy Capital plc | ||||||||
| 3,675 | 4.00%, 10/15/2021 ■ | 3,770 | ||||||
| Cenovus Energy, Inc. | ||||||||
| 16,200 | 5.20%, 09/15/2043 ‡ | 16,065 | ||||||
| CNPC General Capital | ||||||||
| 9,560 | 1.45%, 04/16/2016 ■ | 9,469 | ||||||
| Continental Resources, Inc. | ||||||||
| 1,395 | 5.00%, 09/15/2022 ‡ | 1,449 | ||||||
| EDC Finance Ltd. | ||||||||
| 3,135 | 4.88%, 04/17/2020 ■ | 3,045 | ||||||
| Gazprom Neft OAO via GPN Capital S.A. | ||||||||
| 2,786 | 4.38%, 09/19/2022 ■ | 2,553 | ||||||
The accompanying notes are an integral part of these financial statements.
| 10 |
|
| Shares or Principal Amount | Market Value ╪ | |||||||
| CORPORATE BONDS - 30.3% - (continued) | ||||||||
| Petroleum and Coal Products Manufacturing - 2.5% - (continued) | ||||||||
| Oil and Gas Extraction - 2.1% - (continued) | ||||||||
| Harvest Operations Corp. | ||||||||
| $ | 1,695 | 6.88%, 10/01/2017 | $ | 1,856 | ||||
| Lukoil International Finance B.V. | ||||||||
| 8,525 | 3.42%, 04/24/2018 ■ | 8,600 | ||||||
| Nexen, Inc. | ||||||||
| 2,735 | 7.50%, 07/30/2039 | 3,488 | ||||||
| Pemex Project Funding Master Trust | ||||||||
| 6,205 | 6.63%, 06/15/2035 ╦ | 6,531 | ||||||
| Petrobras Global Finance Co. | ||||||||
| 3,810 | 3.00%, 01/15/2019 | 3,565 | ||||||
| Petrobras International Finance Co. | ||||||||
| 1,900 | 5.38%, 01/27/2021 | 1,886 | ||||||
| 6,950 | 5.75%, 01/20/2020 ╦ | 7,151 | ||||||
| Pioneer Natural Resources Co. | ||||||||
| 660 | 6.65%, 03/15/2017 | 752 | ||||||
| 2,090 | 7.50%, 01/15/2020 | 2,534 | ||||||
| 76,520 | ||||||||
| Petroleum and Coal Products Manufacturing - 0.2% | ||||||||
| Rosneft Oil Co. | ||||||||
| 1,770 | 4.20%, 03/06/2022 ■ | 1,624 | ||||||
| Valero Energy Corp. | ||||||||
| 4,791 | 9.38%, 03/15/2019 ‡ | 6,175 | ||||||
| 7,799 | ||||||||
| Support Activities For Mining - 0.1% | ||||||||
| Transocean, Inc. | ||||||||
| 4,525 | 6.38%, 12/15/2021 | 5,085 | ||||||
| 92,229 | ||||||||
| Pipeline Transportation - 0.9% | ||||||||
| Pipeline Transportation of Natural Gas - 0.9% | ||||||||
| El Paso Corp. | ||||||||
| 2,075 | 7.00%, 06/15/2017 ‡ | 2,346 | ||||||
| 287 | 7.80%, 08/01/2031 ‡ | 291 | ||||||
| Energy Transfer Equity L.P. | ||||||||
| 3,137 | 7.50%, 10/15/2020 ‡ | 3,521 | ||||||
| Energy Transfer Partners L.P. | ||||||||
| 5,965 | 3.60%, 02/01/2023 | 5,524 | ||||||
| 9,305 | 5.95%, 10/01/2043 | 9,440 | ||||||
| 6,110 | 6.50%, 02/01/2042 ‡ | 6,567 | ||||||
| Kinder Morgan Finance Co. | ||||||||
| 3,980 | 6.00%, 01/15/2018 ■ | 4,361 | ||||||
| 32,050 | ||||||||
| Primary Metal Manufacturing - 0.1% | ||||||||
| Iron and Steel Mills and Ferroalloy Manufacturing - 0.1% | ||||||||
| ArcelorMittal | ||||||||
| 2,975 | 9.50%, 02/15/2015 ‡ | 3,232 | ||||||
| Rail Transportation - 0.1% | ||||||||
| Rail Transportation - 0.1% | ||||||||
| Canadian Pacific Railway | ||||||||
| 1,780 | 9.45%, 08/01/2021 | 2,361 | ||||||
| Real Estate, Rental and Leasing - 1.1% | ||||||||
| Activities Related To Real Estate - 0.1% | ||||||||
| Duke Realty L.P. | ||||||||
| 4,000 | 3.63%, 04/15/2023 | 3,692 | ||||||
| General Rental Centers - 0.1% | ||||||||
| ERAC USA Finance Co. | ||||||||
| 4,295 | 6.38%, 10/15/2017 ■‡ | 4,970 | ||||||
| Industrial Machinery and Equipment Rental and Leasing - 0.4% | ||||||||
| International Lease Finance Corp. | ||||||||
| 9,920 | 5.88%, 04/01/2019 ╦ | 10,565 | ||||||
| 2,500 | 6.75%, 09/01/2016 ■ | 2,788 | ||||||
| 1,597 | 8.88%, 09/01/2017 ╦ | 1,900 | ||||||
| 15,253 | ||||||||
| Lessors of Real Estate - 0.5% | ||||||||
| ProLogis L.P. | ||||||||
| 16,575 | 3.35%, 02/01/2021 | 16,096 | ||||||
| 40,011 | ||||||||
| Retail Trade - 0.8% | ||||||||
| Automotive Parts, Accessories and Tire Stores - 0.2% | ||||||||
| AutoZone, Inc. | ||||||||
| 8,000 | 3.70%, 04/15/2022 ‡ | 7,719 | ||||||
| Building Material and Supplies Dealers - 0.1% | ||||||||
| Building Materials Corp. | ||||||||
| 219 | 6.75%, 05/01/2021 ■ | 237 | ||||||
| 1,962 | 7.50%, 03/15/2020 ■ | 2,119 | ||||||
| 2,356 | ||||||||
| Clothing Stores - 0.1% | ||||||||
| Carter's, Inc. | ||||||||
| 3,220 | 5.25%, 08/15/2021 ■ | 3,268 | ||||||
| Electronics and Appliance Stores - 0.1% | ||||||||
| Arcelik AS | ||||||||
| 2,810 | 5.00%, 04/03/2023 ■ | 2,425 | ||||||
| Other Miscellaneous Store Retailers - 0.3% | ||||||||
| Hutchison Whampoa International Ltd. | ||||||||
| 10,500 | 2.00%, 11/08/2017 ■ | 10,363 | ||||||
| Sotheby's | ||||||||
| 2,390 | 5.25%, 10/01/2022 ■ | 2,241 | ||||||
| 12,604 | ||||||||
| 28,372 | ||||||||
| Transportation Equipment Manufacturing - 0.1% | ||||||||
| Railroad Rolling Stock Manufacturing - 0.1% | ||||||||
| Kansas City Southern de Mexico S.A. de C.V. | ||||||||
| 3,110 | 3.00%, 05/15/2023 | 2,827 | ||||||
| Ship and Boat Building - 0.0% | ||||||||
| Huntington Ingalls Industries, Inc. | ||||||||
| 2,190 | 6.88%, 03/15/2018 ╦ | 2,365 | ||||||
| 5,192 | ||||||||
| Truck Transportation - 0.3% | ||||||||
| Specialized Freight Trucking - 0.3% | ||||||||
| Penske Truck Leasing Co. | ||||||||
| 7,625 | 2.88%, 07/17/2018 ■ | 7,670 | ||||||
| 2,840 | 4.88%, 07/11/2022 ■ | 2,913 | ||||||
| 10,583 | ||||||||
The accompanying notes are an integral part of these financial statements.
| 11 |
| Hartford Total Return Bond HLS Fund |
| Schedule of Investments – (continued) |
December 31, 2013 (000’s Omitted) |
| Shares or Principal Amount | Market Value ╪ | |||||||
| CORPORATE BONDS - 30.3% - (continued) | ||||||||
| Utilities - 0.9% | ||||||||
| Electric Generation, Transmission and Distribution - 0.9% | ||||||||
| AES (The) Corp. | ||||||||
| $ | 890 | 9.75%, 04/15/2016 ‡ | $ | 1,048 | ||||
| Calpine Corp. | ||||||||
| 3,203 | 7.50%, 02/15/2021 ■‡ | 3,495 | ||||||
| Carolina Power & Light Co. | ||||||||
| 3,240 | 4.10%, 05/15/2042 | 2,992 | ||||||
| CenterPoint Energy, Inc. | ||||||||
| 4,175 | 6.85%, 06/01/2015 ‡ | 4,514 | ||||||
| Dolphin Subsidiary II, Inc. | ||||||||
| 2,925 | 7.25%, 10/15/2021 | 2,962 | ||||||
| MidAmerican Energy Holdings Co. | ||||||||
| 7,665 | 8.48%, 09/15/2028 ‡ | 10,364 | ||||||
| Pacific Gas & Electric Co. | ||||||||
| 3,700 | 8.25%, 10/15/2018 ╦ | 4,627 | ||||||
| Xcel Energy, Inc. | ||||||||
| 3,100 | 6.50%, 07/01/2036 | 3,693 | ||||||
| 33,695 | ||||||||
| Wholesale Trade - 0.3% | ||||||||
| Beer, Wine, Distilled Alcoholic Beverage Wholesalers - 0.3% | ||||||||
| Heineken N.V. | ||||||||
| 2,880 | 1.40%, 10/01/2017 ■ | 2,826 | ||||||
| SABMiller Holdings, Inc. | ||||||||
| 6,840 | 2.45%, 01/15/2017 ■╦ | 7,004 | ||||||
| 2,425 | 3.75%, 01/15/2022 ■ | 2,434 | ||||||
| 12,264 | ||||||||
| Total corporate bonds | ||||||||
| (cost $1,097,115) | $ | 1,124,028 | ||||||
| FOREIGN GOVERNMENT OBLIGATIONS - 0.2% | ||||||||
| Brazil - 0.0% | ||||||||
| Brazil (Republic of) | ||||||||
| $ | 2,655 | 4.25%, 01/07/2025 | $ | 2,529 | ||||
| Mexico - 0.2% | ||||||||
| United Mexican States | ||||||||
| 7,260 | 4.75%, 03/08/2044 | 6,543 | ||||||
| Total foreign government obligations | ||||||||
| (cost $9,798) | $ | 9,072 | ||||||
| MUNICIPAL BONDS - 1.7% | ||||||||
| General Obligations - 0.5% | ||||||||
| California State GO | ||||||||
| $ | 3,180 | 7.50%, 04/01/2034 | $ | 4,057 | ||||
| California State GO, Taxable | ||||||||
| 10,720 | 7.55%, 04/01/2039 ‡ | 13,866 | ||||||
| 17,923 | ||||||||
| Higher Education (Univ., Dorms, etc.) - 0.4% | ||||||||
| Curators University, System Facs Rev Build America Bonds | ||||||||
| 2,020 | 5.79%, 11/01/2041 | 2,324 | ||||||
| University of California | ||||||||
| 5,580 | 4.60%, 05/15/2031 | 5,564 | ||||||
| 7,140 | 5.00%, 05/15/2038 ‡ | 7,443 | ||||||
| 15,331 | ||||||||
| Miscellaneous - 0.2% | ||||||||
| Employees Retire System Govt of Cmwlth Puerto Rico | ||||||||
| 3,575 | 6.20%, 07/01/2039 | 1,715 | ||||||
| Puerto Rico Commonwealth Govt EE Retirement System | ||||||||
| 7,965 | 6.30%, 07/01/2043 | 3,862 | ||||||
| 5,577 | ||||||||
| Tax Allocation - 0.2% | ||||||||
| Industry, CA, Urban Development Agency | ||||||||
| 275 | 6.10%, 05/01/2024 | 262 | ||||||
| New York City, NY, Transitional FA Rev | ||||||||
| 7,280 | 5.00%, 11/01/2038 - 05/01/2042 | 7,564 | ||||||
| 7,826 | ||||||||
| Utilities - Electric - 0.1% | ||||||||
| Municipal Elec Auth Georgia | ||||||||
| 3,185 | 6.64%, 04/01/2057 ╦ | 3,348 | ||||||
| Utilities - Water and Sewer - 0.3% | ||||||||
| Baltimore MD Proj Rev | ||||||||
| 1,530 | 4.53%, 07/01/2042 | 1,586 | ||||||
| 1,530 | 5.00%, 07/01/2043 | 1,583 | ||||||
| San Francisco City & County, CA, Public Utilities | ||||||||
| 7,820 | 6.00%, 11/01/2040 ╦ | 8,904 | ||||||
| 12,073 | ||||||||
| Total municipal bonds | ||||||||
| (cost $62,053) | $ | 62,078 | ||||||
| SENIOR FLOATING RATE INTERESTS♦ - 4.4% | ||||||||
| Accommodation and Food Services - 0.1% | ||||||||
| Traveler Accommodation - 0.1% | ||||||||
| Caesars Entertainment Operating Co., Inc. | ||||||||
| $ | 2,599 | 4.49%, 01/28/2018 | $ | 2,453 | ||||
| 2,648 | 5.49%, 01/28/2018 | 2,525 | ||||||
| 4,978 | ||||||||
| Administrative Waste Management and Remediation - 0.1% | ||||||||
| Business Support Services - 0.1% | ||||||||
| Audio Visual Services Group, Inc. | ||||||||
| 1,158 | 6.75%, 11/09/2018 | 1,161 | ||||||
| ISS A/S | ||||||||
| 701 | 3.75%, 04/30/2018 | 702 | ||||||
| 1,863 | ||||||||
| Air Transportation - 0.1% | ||||||||
| Scheduled Air Transportation - 0.1% | ||||||||
| Delta Air Lines, Inc. | ||||||||
| 960 | 4.00%, 10/18/2018 | 964 | ||||||
| United Airlines, Inc. | ||||||||
| 1,453 | 4.00%, 04/01/2019 | 1,460 | ||||||
| 2,424 | ||||||||
| Apparel Manufacturing - 0.0% | ||||||||
| Apparel Knitting Mills - 0.0% | ||||||||
| PVH Corp. | ||||||||
| 536 | 3.25%, 02/13/2020 | 538 | ||||||
| Arts, Entertainment and Recreation - 0.1% | ||||||||
| Cable and Other Subscription Programming - 0.0% | ||||||||
| Cequel Communications LLC | ||||||||
| 501 | 3.50%, 02/14/2019 | 501 | ||||||
The accompanying notes are an integral part of these financial statements.
| 12 |
|
| Shares or Principal Amount | Market Value ╪ | |||||||
| SENIOR FLOATING RATE INTERESTS♦ - 4.4% - (continued) | ||||||||
| Arts, Entertainment and Recreation - 0.1% - (continued) | ||||||||
| Cable and Other Subscription Programming - 0.0% - (continued) | ||||||||
| CSC Holdings, Inc. | ||||||||
| $ | 980 | 2.67%, 04/17/2020 | $ | 970 | ||||
| 1,471 | ||||||||
| Gambling Industries - 0.1% | ||||||||
| MGM Resorts International | ||||||||
| 1,371 | 3.50%, 12/20/2019 | 1,374 | ||||||
| Seminole (The) Tribe of Florida, Inc. | ||||||||
| 1,421 | 3.00%, 04/29/2020 | 1,418 | ||||||
| 2,792 | ||||||||
| Radio and Television Broadcasting - 0.0% | ||||||||
| Sinclair Television Group, Inc. | ||||||||
| 650 | 3.00%, 04/09/2020 | 645 | ||||||
| 4,908 | ||||||||
| Beverage and Tobacco Product Manufacturing - 0.1% | ||||||||
| Beverage Manufacturing - 0.1% | ||||||||
| Constellation Brands, Inc. | ||||||||
| 2,382 | 2.75%, 06/05/2020 | 2,382 | ||||||
| Chemical Manufacturing - 0.2% | ||||||||
| Basic Chemical Manufacturing - 0.2% | ||||||||
| Huntsman International LLC, Extended Term Loan B | ||||||||
| 800 | 2.71%, 04/19/2017 | 799 | ||||||
| Pinnacle Operating Corp. | ||||||||
| 2,595 | 3.25%, 04/29/2020 | 2,591 | ||||||
| 889 | 4.75%, 11/15/2018 | 892 | ||||||
| PQ Corp. | ||||||||
| 1,337 | 4.50%, 08/07/2017 | 1,345 | ||||||
| 5,627 | ||||||||
| Other Chemical and Preparations Manufacturing - 0.0% | ||||||||
| Cytec Industries, Inc. | ||||||||
| 248 | 4.50%, 10/04/2019 | 250 | ||||||
| DuPont Performance Coatings, Inc. | ||||||||
| 293 | 4.75%, 02/01/2020 | 295 | ||||||
| Monarch, Inc. | ||||||||
| 478 | 4.50%, 10/04/2019 | 482 | ||||||
| Utex Industries, Inc. | ||||||||
| 244 | 4.50%, 04/10/2020 | 244 | ||||||
| 1,271 | ||||||||
| Paint, Coating and Adhesive Manufacturing - 0.0% | ||||||||
| Tronox Pigments Holland | ||||||||
| 1,109 | 4.50%, 03/19/2020 | 1,123 | ||||||
| 8,021 | ||||||||
| Computer and Electronic Product Manufacturing - 0.1% | ||||||||
| Computer and Peripheral - 0.1% | ||||||||
| CDW LLC | ||||||||
| 2,868 | 3.25%, 04/29/2020 | 2,857 | ||||||
| Semiconductor, Electronic Components - 0.0% | ||||||||
| NXP Semiconductors Netherlands B.V. | ||||||||
| 1,573 | 3.25%, 01/11/2020 | 1,575 | ||||||
| 4,432 | ||||||||
| Educational Services - 0.0% | ||||||||
| Educational Support Services - 0.0% | ||||||||
| Bright Horizons Family Solutions, Inc. | ||||||||
| 322 | 4.00%, 01/30/2020 | 323 | ||||||
| Finance and Insurance - 0.5% | ||||||||
| Activities Related To Credit Banking - 0.1% | ||||||||
| Evertec LLC | ||||||||
| 5,099 | 3.50%, 04/17/2020 | 4,959 | ||||||
| Agencies, Brokerages and Other Insurance - 0.0% | ||||||||
| Cooper Gay Swett & Crawford Ltd. | ||||||||
| 811 | 5.00%, 04/16/2020 | 790 | ||||||
| USI Insurance Services LLC | ||||||||
| 893 | 5.00%, 12/27/2019 | 896 | ||||||
| 1,686 | ||||||||
| Captive Auto Finance - 0.1% | ||||||||
| Chrysler Group LLC | ||||||||
| 4,309 | 3.50%, 05/24/2017 | 4,335 | ||||||
| Insurance Carriers - 0.0% | ||||||||
| Asurion LLC | ||||||||
| 1,096 | 4.50%, 05/24/2019 | 1,095 | ||||||
| Other Financial Investment Activities - 0.2% | ||||||||
| Nuveen Investments, Inc. | ||||||||
| 5,975 | 4.17%, 05/13/2017 ☼ | 5,947 | ||||||
| Ocwen Financial Corp. | ||||||||
| 417 | 5.00%, 02/15/2018 | 421 | ||||||
| 6,368 | ||||||||
| Real Estate Investment Trust (REIT) - 0.1% | ||||||||
| Walter Investment Management Corp. | ||||||||
| 1,747 | 4.75%, 12/18/2020 ☼ | 1,748 | ||||||
| 20,191 | ||||||||
| Food Manufacturing - 0.2% | ||||||||
| Other Food Manufacturing - 0.2% | ||||||||
| H.J. Heinz Co. | ||||||||
| 5,084 | 3.50%, 06/05/2020 | 5,120 | ||||||
| Hostess Brands, Inc. | ||||||||
| 365 | 6.75%, 04/09/2020 | 378 | ||||||
| U.S. Foodservice, Inc. | ||||||||
| 1,147 | 4.50%, 03/31/2019 | 1,157 | ||||||
| 6,655 | ||||||||
| Food Services - 0.2% | ||||||||
| Full-Service Restaurants - 0.2% | ||||||||
| ARAMARK Corp. | ||||||||
| 2,520 | 3.75%, 07/26/2016 | 2,523 | ||||||
| 645 | 4.00%, 09/09/2019 | 649 | ||||||
| OSI Restaurant Partners, Inc. | ||||||||
| 3,728 | 3.53%, 10/28/2019 | 3,728 | ||||||
| 6,900 | ||||||||
Furniture and Related Product Manufacturing - 0.1% | ||||||||
| Household, Institution Furniture, Kitchen Cabinet - 0.1% | ||||||||
| Tempur-Pedic International, Inc. | ||||||||
| 1,013 | 3.50%, 03/18/2020 | 1,011 | ||||||
The accompanying notes are an integral part of these financial statements.
| 13 |
| Hartford Total Return Bond HLS Fund |
| Schedule of Investments – (continued) |
December 31, 2013 (000’s Omitted) |
| Shares or Principal Amount | Market Value ╪ | |||||||
| SENIOR FLOATING RATE INTERESTS♦ - 4.4% - (continued) | ||||||||
| Furniture and Related Product Manufacturing - 0.1% - (continued) | ||||||||
| Other Furniture Related Product Manufacturing - 0.0% | ||||||||
| Wilsonart International Holding LLC | ||||||||
| $ | 852 | 4.00%, 10/31/2019 | $ | 845 | ||||
| 1,856 | ||||||||
| Health Care and Social Assistance - 0.1% | ||||||||
| General Medical and Surgical Hospitals - 0.1% | ||||||||
| HCA, Inc. | ||||||||
| 1,272 | 2.92%, 03/31/2017 | 1,272 | ||||||
| 2,180 | 3.00%, 05/01/2018 | 2,179 | ||||||
| 3,451 | ||||||||
| Scientific Research and Development Services - 0.0% | ||||||||
| IMS Health, Inc. | ||||||||
| 652 | 3.75%, 09/01/2017 | 653 | ||||||
| 4,104 | ||||||||
| Information - 1.0% | ||||||||
| Cable and Other Program Distribution - 0.3% | ||||||||
| Charter Communications Operating LLC | ||||||||
| 4,162 | 3.00%, 07/01/2020 - 12/31/2020 | 4,128 | ||||||
| UPC Financing Partnership | ||||||||
| 1,165 | 3.25%, 06/30/2021 | 1,163 | ||||||
| 760 | 4.00%, 01/31/2021 | 762 | ||||||
| Virgin Media Finance plc | ||||||||
| 4,400 | 3.50%, 06/08/2020 | 4,407 | ||||||
| 10,460 | ||||||||
| Data Processing Services - 0.2% | ||||||||
| Emdeon, Inc. | ||||||||
| 1,429 | 3.75%, 11/02/2018 | 1,431 | ||||||
| First Data Corp. | ||||||||
| 1,820 | 4.16%, 03/24/2017 - 09/24/2018 | 1,821 | ||||||
| First Data Corp., Extended 1st Lien Term Loan | ||||||||
| 5,740 | 4.16%, 03/23/2018 | 5,744 | ||||||
| 8,996 | ||||||||
| Software Publishers - 0.2% | ||||||||
| Epicor Software Corp. | ||||||||
| 433 | 4.50%, 05/16/2018 | 434 | ||||||
| Infor US, Inc. | ||||||||
| 1,891 | 5.25%, 04/05/2018 | 1,895 | ||||||
| Kronos, Inc. | ||||||||
| 2,118 | 4.50%, 10/30/2019 | 2,135 | ||||||
| 410 | 9.75%, 04/30/2020 | 424 | ||||||
| Web.com Group, Inc. | ||||||||
| 901 | 4.50%, 10/27/2017 | 908 | ||||||
| 5,796 | ||||||||
| Telecommunications - Other - 0.1% | ||||||||
| Nine Entertainment Group Ltd. | ||||||||
| 1,239 | 3.25%, 02/05/2020 | 1,232 | ||||||
| Sorenson Communications, Inc. | ||||||||
| 1,757 | 9.50%, 10/31/2014 | 1,777 | ||||||
| 3,009 | ||||||||
| Telecommunications - Wireless Carriers - 0.1% | ||||||||
| Alcatel-Lucent | ||||||||
| 4,215 | 5.75%, 01/30/2019 ☼ | 4,230 | ||||||
| Light Tower Fiber LLC | ||||||||
| 537 | 4.50%, 04/13/2020 | 539 | ||||||
| Syniverse Holdings, Inc. | ||||||||
| 1,008 | 4.00%, 04/23/2019 | 1,012 | ||||||
| 5,781 | ||||||||
| Wireless Communications Services - 0.1% | ||||||||
| Leap Wireless International, Inc. | ||||||||
| 2,736 | 4.75%, 03/08/2020 | 2,746 | ||||||
| 36,788 | ||||||||
| Mining - 0.2% | ||||||||
| Metal Ore Mining - 0.1% | ||||||||
| Fortescue Metals Group Ltd. | ||||||||
| 2,624 | 4.25%, 06/28/2019 | 2,656 | ||||||
| Mining and Quarrying Nonmetallic Mineral - 0.1% | ||||||||
| Arch Coal, Inc. | ||||||||
| 3,203 | 6.25%, 05/16/2018 | 3,155 | ||||||
| 5,811 | ||||||||
| Miscellaneous Manufacturing - 0.2% | ||||||||
| Aerospace Product and Parts Manufacturing - 0.1% | ||||||||
| DigitalGlobe, Inc. | ||||||||
| 804 | 3.75%, 01/31/2020 | 807 | ||||||
| Doncasters plc | ||||||||
| 2,764 | 5.50%, 04/09/2020 | 2,790 | ||||||
| Hamilton Sundstrand Corp. | ||||||||
| 951 | 4.00%, 12/13/2019 | 952 | ||||||
| TransDigm Group, Inc. | ||||||||
| 217 | 3.75%, 02/28/2020 | 218 | ||||||
| 4,767 | ||||||||
| Miscellaneous Manufacturing - 0.1% | ||||||||
| Reynolds Group Holdings, Inc. | ||||||||
| 1,733 | 4.00%, 12/01/2018 | 1,747 | ||||||
| 6,514 | ||||||||
| Motor Vehicle and Parts Manufacturing - 0.1% | ||||||||
| Motor Vehicle Parts Manufacturing - 0.1% | ||||||||
| Federal Mogul Corp., Tranche B Term Loan | ||||||||
| 1,303 | 2.11%, 12/29/2014 | 1,287 | ||||||
| Federal Mogul Corp., Tranche C Term Loan | ||||||||
| 767 | 2.11%, 12/28/2015 | 757 | ||||||
| Tower Automotive Holdings USA LLC | ||||||||
| 1,408 | 4.75%, 04/23/2020 | 1,414 | ||||||
| 3,458 | ||||||||
| Other Services - 0.1% | ||||||||
| Commercial/Industrial Machine and Equipment - 0.1% | ||||||||
| Apex Tool Group LLC | ||||||||
| 224 | 4.50%, 01/31/2020 | 225 | ||||||
| Rexnord LLC | ||||||||
| 2,025 | 4.00%, 08/21/2020 ☼ | 2,029 | ||||||
| 2,254 | ||||||||
| Petroleum and Coal Products Manufacturing - 0.0% | ||||||||
| Oil and Gas Extraction - 0.0% | ||||||||
| Ruby Western Pipeline Holdings LLC | ||||||||
| 1,324 | 3.50%, 03/27/2020 | 1,323 | ||||||
The accompanying notes are an integral part of these financial statements.
| 14 |
|
| Shares or Principal Amount | Market Value ╪ | |||||||
| SENIOR FLOATING RATE INTERESTS♦ - 4.4% - (continued) | ||||||||
| Pipeline Transportation - 0.1% | ||||||||
| Pipeline Transportation of Crude Oil - 0.0% | ||||||||
| Philadelphia Energy Solutions LLC | ||||||||
| $ | 824 | 6.25%, 04/04/2018 | $ | 721 | ||||
| Pipeline Transportation of Natural Gas - 0.1% | ||||||||
| EP Energy LLC | ||||||||
| 1,404 | 4.50%, 04/30/2019 | 1,407 | ||||||
| 2,128 | ||||||||
| Plastics and Rubber Products Manufacturing - 0.1% | ||||||||
| Plastics Product Manufacturing - 0.1% | ||||||||
| Berry Plastics Group, Inc. | ||||||||
| 3,350 | 3.50%, 02/08/2020 | 3,336 | ||||||
| Consolidated Container Co. | ||||||||
| 1,185 | 5.00%, 07/03/2019 | 1,191 | ||||||
| 4,527 | ||||||||
| Primary Metal Manufacturing - 0.1% | ||||||||
| Alumina and Aluminum Production and Processing - 0.1% | ||||||||
| Novelis, Inc. | ||||||||
| 5,224 | 3.75%, 03/10/2017 | 5,239 | ||||||
| Professional, Scientific and Technical Services - 0.1% | ||||||||
| Professional Services - Computer System Design and Related - 0.1% | ||||||||
| MoneyGram International, Inc. | ||||||||
| 1,742 | 4.25%, 03/27/2020 | 1,757 | ||||||
| SunGard Data Systems, Inc. | ||||||||
| 794 | 4.50%, 01/31/2020 | 797 | ||||||
| 2,554 | ||||||||
| Real Estate, Rental and Leasing - 0.0% | ||||||||
| Automotive Equipment Rental and Leasing - 0.0% | ||||||||
| Hertz (The) Corp. | ||||||||
| 923 | 3.00%, 03/11/2018 | 921 | ||||||
| Retail Trade - 0.4% | ||||||||
| Automobile Dealers - 0.0% | ||||||||
| TI Automotive Ltd. | ||||||||
| 918 | 5.50%, 03/28/2019 | 929 | ||||||
| Automotive Parts, Accessories and Tire Stores - 0.0% | ||||||||
| Affinia Group, Inc. | ||||||||
| 682 | 4.75%, 04/25/2020 | 690 | ||||||
| Building Material and Supplies Dealers - 0.0% | ||||||||
| American Builders & Contractors Supply Co. | ||||||||
| 938 | 3.50%, 04/16/2020 | 939 | ||||||
| Department Stores - 0.0% | ||||||||
| J. C. Penney Co., Inc. | ||||||||
| 700 | 6.00%, 05/22/2018 ☼ | 684 | ||||||
| Grocery Stores - 0.0% | ||||||||
| Sprouts Farmers Markets Holdings LLC | ||||||||
| 491 | 4.00%, 04/23/2020 | 492 | ||||||
| Other Miscellaneous Store Retailers - 0.0% | ||||||||
| Rite Aid Corp. | ||||||||
| 705 | 4.00%, 02/21/2020 | 707 | ||||||
| 250 | 5.75%, 08/21/2020 | 256 | ||||||
| 963 | ||||||||
| Specialty Food Stores - 0.2% | ||||||||
| Weight Watchers International, Inc. | ||||||||
| 5,920 | 3.75%, 04/02/2020 | 5,264 | ||||||
| Sporting Goods, Hobby and Musical Instrument Store - 0.2% | ||||||||
| EB Sports Corp. | ||||||||
| 5,188 | 11.50%, 12/31/2015 Þ | 5,162 | ||||||
| Michaels Stores, Inc. | ||||||||
| 1,020 | 3.75%, 01/28/2020 | 1,023 | ||||||
| 6,185 | ||||||||
| 16,146 | ||||||||
| Truck Transportation - 0.0% | ||||||||
| Freight Trucking - General - 0.0% | ||||||||
| Nexeo Solutions LLC | ||||||||
| 647 | 5.00%, 09/09/2017 | 645 | ||||||
| Utilities - 0.1% | ||||||||
| Electric Generation, Transmission and Distribution - 0.1% | ||||||||
| Dynegy Power LLC | ||||||||
| 548 | 4.00%, 04/23/2020 | 550 | ||||||
| Star West Generation LLC | ||||||||
| 2,992 | 4.25%, 03/13/2020 | 3,019 | ||||||
| 3,569 | ||||||||
| Total senior floating rate interests | ||||||||
| (cost $161,442) | $ | 161,452 | ||||||
| U.S. GOVERNMENT AGENCIES - 35.3% | ||||||||
| FHLMC - 7.1% | ||||||||
| $ | 33,360 | 2.08%, 08/25/2018 ► | $ | 2,652 | ||||
| 71,222 | 2.49%, 10/25/2020 ► | 1,232 | ||||||
| 56,000 | 3.00%, 01/15/2043 ☼ | 53,042 | ||||||
| 94,124 | 4.00%, 08/01/2025 - 01/15/2040 ‡☼ | 97,218 | ||||||
| 35,700 | 4.50%, 01/15/2040 ☼ | 37,774 | ||||||
| 42,577 | 5.50%, 10/01/2018 - 06/01/2041 ‡ | 46,430 | ||||||
| 15,160 | 6.00%, 04/01/2017 - 11/01/2037 ‡ | 16,831 | ||||||
| 694 | 6.50%, 07/01/2031 - 12/01/2037 | 771 | ||||||
| 5 | 7.50%, 09/01/2029 - 11/01/2031 | 6 | ||||||
| 7,394 | 13.42%, 05/15/2037 ► | 1,250 | ||||||
| 5,377 | 14.26%, 01/15/2039 ► | 723 | ||||||
| 13,198 | 15.95%, 12/15/2036 ► | 2,177 | ||||||
| 25,890 | 16.42%, 01/15/2041 ► | 3,368 | ||||||
| 263,474 | ||||||||
| FNMA - 16.6% | ||||||||
| 7,662 | 2.14%, 11/01/2022 | 7,088 | ||||||
| 10,714 | 2.15%, 10/01/2022 | 9,994 | ||||||
| 5,138 | 2.20%, 12/01/2022 | 4,769 | ||||||
| 2,986 | 2.28%, 11/01/2022 | 2,788 | ||||||
| 2,532 | 2.34%, 11/01/2022 | 2,372 | ||||||
| 2,306 | 2.40%, 10/01/2022 | 2,173 | ||||||
| 1,994 | 2.42%, 11/01/2022 | 1,881 | ||||||
| 2,048 | 2.47%, 11/01/2022 | 1,937 | ||||||
| 57,940 | 2.50%, 01/12/2028 - 10/01/2043 ☼ | 55,429 | ||||||
| 113,620 | 3.00%, 01/15/2029 - 01/15/2043 ☼ | 110,567 | ||||||
| 160,900 | 3.50%, 01/15/2026 - 01/15/2041 ☼ | 160,607 | ||||||
| 106,448 | 4.00%, 06/01/2025 - 01/15/2040 ☼ | 109,932 | ||||||
| 2,936 | 4.02%, 11/01/2028 | 2,918 | ||||||
| 21,603 | 4.50%, 04/01/2025 - 08/01/2040 ☼ | 22,937 | ||||||
| 36,295 | 5.00%, 02/01/2018 - 01/15/2040 ☼ | 39,244 | ||||||
| 53,088 | 5.50%, 01/01/2017 - 01/15/2040 ☼ | 58,452 | ||||||
The accompanying notes are an integral part of these financial statements.
| 15 |
| Hartford Total Return Bond HLS Fund |
| Schedule of Investments – (continued) |
December 31, 2013 (000’s Omitted) |
| Shares or Principal Amount | Market Value ╪ | |||||||
| U.S. GOVERNMENT AGENCIES - 35.3% - (continued) | ||||||||
| FNMA - 16.6% - (continued) | ||||||||
| $ | 9,349 | 6.00%, 06/01/2014 - 02/01/2037 | $ | 10,419 | ||||
| 17 | 6.50%, 11/01/2014 - 07/01/2032 | 18 | ||||||
| 238 | 7.00%, 02/01/2016 - 10/01/2037 | 242 | ||||||
| 267 | 7.50%, 11/01/2015 - 05/01/2032 | 303 | ||||||
| 2 | 8.00%, 04/01/2032 | 2 | ||||||
| 8,255 | 10.11%, 06/25/2042 ► | 1,458 | ||||||
| 13,708 | 12.48%, 11/25/2039 ► | 2,114 | ||||||
| 20,004 | 15.49%, 09/25/2040 ► | 3,135 | ||||||
| 13,567 | 20.97%, 10/25/2036 ► | 2,242 | ||||||
| 613,021 | ||||||||
| GNMA - 11.6% | ||||||||
| 41,500 | 3.00%, 02/15/2043 ☼ | 40,077 | ||||||
| 83,579 | 3.50%, 01/15/2042 - 05/15/2043 ☼ | 84,335 | ||||||
| 112,354 | 4.00%, 07/20/2040 - 01/15/2041 | 117,042 | ||||||
| 96,716 | 4.50%, 11/15/2039 - 07/15/2041 ☼ | 103,540 | ||||||
| 33,827 | 5.00%, 08/15/2039 - 05/20/2040 ☼ | 36,840 | ||||||
| 8,198 | 5.50%, 03/15/2033 - 10/20/2034 | 9,194 | ||||||
| 29,024 | 6.00%, 12/15/2023 - 06/15/2041 | 32,302 | ||||||
| 5,614 | 6.50%, 06/15/2028 - 09/15/2032 | 6,278 | ||||||
| 20 | 7.00%, 06/20/2030 - 08/15/2031 | 24 | ||||||
| 1 | 8.50%, 11/15/2024 | 1 | ||||||
| 429,633 | ||||||||
| Total U.S. government agencies | ||||||||
| (cost $1,307,701) | $ | 1,306,128 | ||||||
| U.S. GOVERNMENT SECURITIES - 20.1% | ||||||||
| U.S. Treasury Securities - 20.1% | ||||||||
| U.S. Treasury Bonds - 3.3% | ||||||||
| $ | 36,975 | 0.63%, 02/15/2043 ◄‡ | $ | 28,880 | ||||
| 4,500 | 2.88%, 05/15/2043 ‡ | 3,647 | ||||||
| 70,625 | 3.63%, 08/15/2043 ‡ | 66,696 | ||||||
| 18,400 | 3.75%, 11/15/2043 ‡ | 17,785 | ||||||
| 4,702 | 4.38%, 05/15/2041 ‡ | 5,102 | ||||||
| 3 | 4.75%, 02/15/2041 ‡ | 3 | ||||||
| 122,113 | ||||||||
| U.S. Treasury Notes - 16.8% | ||||||||
| 247,500 | 0.13%, 04/15/2018 ◄‡ | 255,036 | ||||||
| 155,250 | 0.25%, 07/31/2015 □╦ | 155,244 | ||||||
| 143,663 | 0.88%, 01/31/2017 - 04/30/2017 ╦‡ | 143,245 | ||||||
| 9,319 | 1.00%, 10/31/2016 □ | 9,390 | ||||||
| 10,000 | 2.00%, 04/30/2016 ‡ | 10,345 | ||||||
| 33,315 | 2.75%, 11/15/2023 ‡ | 32,591 | ||||||
| 16,975 | 3.13%, 04/30/2017 ‡ | 18,173 | ||||||
| 624,024 | ||||||||
| 746,137 | ||||||||
| Total U.S. government securities | ||||||||
| (cost $753,578) | $ | 746,137 | ||||||
| Contracts | ||||||||
| CALL OPTIONS PURCHASED - 0.0% | ||||||||
| Interest Rate Contracts - 0.0% | ||||||||
| Interest Rate Swaption USD | ||||||||
| 19,570 | Expiration: 11/27/2023, Exercise Rate: 4.42% | $ | 1,790 | |||||
| Total call options purchased | ||||||||
| (cost $2,070) | $ | 1,790 | ||||||
| PUT OPTIONS PURCHASED - 0.1% | ||||||||
| Interest Rate Contracts - 0.1% | ||||||||
| Interest Rate Swaption USD | ||||||||
| 19,570 | Expiration: 11/27/2023, Exercise Rate: 4.42% | $ | 2,209 | |||||
| Total put options purchased | ||||||||
| (cost $2,071) | $ | 2,209 | ||||||
| Shares or Principal Amount | ||||||||
| PREFERRED STOCKS - 0.1% | ||||||||
| Diversified Banks - 0.0% | ||||||||
| 2 | U.S. Bancorp | $ | 1,646 | |||||
| Other Diversified Financial Services - 0.1% | ||||||||
| 68 | Citigroup Capital XIII | 1,861 | ||||||
| Total preferred stocks | ||||||||
| (cost $3,492) | $ | 3,507 | ||||||
| Total long-term investments (cost $3,987,077) | $ | 4,016,345 | ||||||
| SHORT-TERM INVESTMENTS - 13.3% | ||||||||
| Repurchase Agreements - 13.3% | ||||||||
| Bank of America Merrill Lynch TriParty Repurchase Agreement (maturing on 01/02/2014 in the amount of $24,483, collateralized by GNMA 4.00%, 2043, value of $24,972) | ||||||||
| $ | 24,483 | 0.005%, 12/31/2013 | $ | 24,483 | ||||
| Bank of Montreal TriParty Repurchase Agreement (maturing on 01/02/2014 in the amount of $23,522, collateralized by FNMA 1.58% - 4.50%, 2020 - 2043, U.S. Treasury Note 0.25% - 4.00%, 2015 - 2020, value of $23,993) | ||||||||
| 23,522 | 0.01%, 12/31/2013 | 23,522 | ||||||
| Bank of Montreal TriParty Repurchase Agreement (maturing on 01/02/2014 in the amount of $83,308, collateralized by FHLMC 3.00% - 5.00%, 2019 - 2043, FNMA 0.76% - 6.00%, 2016 - 2043, GNMA 1.50% - 5.25%, 2028 - 2043, value of $84,974) | ||||||||
| 83,308 | 0.02%, 12/31/2013 | 83,308 | ||||||
| Barclays Capital TriParty Repurchase Agreement (maturing on 01/02/2014 in the amount of $75,134, collateralized by U.S. Treasury Note 0.50% - 2.25%, 2017, value of $76,637) | ||||||||
| 75,134 | 0.01%, 12/31/2013 | 75,134 | ||||||
The accompanying notes are an integral part of these financial statements.
| 16 |
| Shares or Principal Amount | Market Value ╪ | |||||||||||
| SHORT-TERM INVESTMENTS - 13.3% - (continued) | ||||||||||||
| Repurchase Agreements - 13.3% - (continued) | ||||||||||||
| Citigroup Global Markets, Inc. TriParty Repurchase Agreement (maturing on 01/02/2014 in the amount of $135,194, collateralized by U.S. Treasury Bond 3.88% - 8.13%, 2021 - 2040, U.S. Treasury Note 0.25% - 3.38%, 2014 - 2020, value of $137,898) | ||||||||||||
| $ | 135,194 | 0.01%, 12/31/2013 | $ | 135,194 | ||||||||
| RBS Securities, Inc. TriParty Repurchase Agreement (maturing on 01/02/2014 in the amount of $43,928, collateralized by U.S. Treasury Note 0.25% - 1.00%, 2015 - 2017, value of $44,807) | ||||||||||||
| 43,928 | 0.01%, 12/31/2013 | 43,928 | ||||||||||
| TD Securities TriParty Repurchase Agreement (maturing on 01/02/2014 in the amount of $105,458, collateralized by FFCB 0.20% - 0.50%, 2015 - 2016, FHLMC 0.38% - 5.25%, 2014 - 2042, FNMA 0.50% - 7.13%, 2014 - 2043, value of $107,567) | ||||||||||||
| 105,458 | 0.01%, 12/31/2013 | 105,458 | ||||||||||
| UBS Securities, Inc. Repurchase Agreement (maturing on 01/02/2014 in the amount of $901, collateralized by U.S. Treasury Note 2.13%, 2015, value of $922) | ||||||||||||
| 900 | 0.01%, 12/31/2013 | 900 | ||||||||||
| 491,927 | ||||||||||||
| Total short-term investments | ||||||||||||
| (cost $491,927) | $ | 491,927 | ||||||||||
| Total investments | ||||||||||||
| (cost $4,479,004) ▲ | 121.7 | % | $ | 4,508,272 | ||||||||
| Other assets and liabilities | (21.7 | )% | (802,740 | ) | ||||||||
| Total net assets | 100.0 | % | $ | 3,705,532 | ||||||||
| Note: | Percentage of investments as shown is the ratio of the total market value to total net assets. |
| ▲ | At December 31, 2013, the cost of securities for federal income tax purposes was $4,479,870 and the aggregate gross unrealized appreciation and depreciation based on that cost were: |
| Unrealized Appreciation | $ | 79,272 | ||
| Unrealized Depreciation | (50,870 | ) | ||
| Net Unrealized Appreciation | $ | 28,402 |
| Δ | Variable rate securities; the rate reported is the coupon rate in effect at December 31, 2013. |
| Þ | This security may pay interest in additional principal instead of cash. |
| ► | Securities disclosed are interest-only strips. The interest rates represent effective yields based upon estimated future cash flows at December 31, 2013. |
| ◄ | The principal amount for this security is adjusted for inflation and the interest payments equal a fixed percentage of the inflation-adjusted principal amount. |
The accompanying notes are an integral part of these financial statements.
| 17 |
| Hartford Total Return Bond HLS Fund |
| Schedule of Investments – (continued) |
December 31, 2013 (000’s Omitted) |
| ♦ | Senior floating rate interests generally pay interest rates which are periodically adjusted by reference to a base short-term, floating lending rate plus a premium. These base lending rates are generally (i) the lending rate offered by one or more major European banks, such as the LIBOR, (ii) the prime rate offered by one or more major United States banks, or (iii) the bank's certificate of deposit rate. Senior floating rate interests often require prepayments from excess cash flows or permit the borrower to repay at its election. The rate at which the borrower repays cannot be predicted with accuracy. As a result, the actual remaining maturity may be substantially less than the stated maturities shown. Unless otherwise noted, the interest rate disclosed for these securities represents the average coupon as of December 31, 2013. |
| ■ | Securities issued within terms of a private placement memorandum, exempt from registration under Rule 144A under the Securities Act of 1933, as amended, and may be sold only to qualified institutional buyers. Unless otherwise indicated, these holdings are determined to be liquid. At December 31, 2013, the aggregate value of these securities was $372,796, which represents 10.1% of total net assets. |
| § | These securities were sold to the Fund under Regulation S, rules governing offers and sales made outside the United States without registration under the Securities Act of 1933. The Fund may only be able to resell these securities in the United States if an exemption from registration under the federal and state securities laws is available, or the Fund may only be able to sell these securities outside of the United States (such as on a foreign exchange) to a non-U.S. person. Unless otherwise indicated, these holdings are determined to be liquid. At December 31, 2013, the aggregate value of these securities was $1,339, which rounds to zero percent of total net assets. |
| ♠ | Perpetual maturity security. Maturity date shown is the next call date. |
| ☼ | This security, or a portion of this security, was purchased on a when-issued, delayed-delivery or delayed-draw basis. The cost of these securities was $811,715 at December 31, 2013. |
| ‡ | This security, or a portion of this security, has been segregated to cover funding requirements on investment transactions settling in the future. |
| ╦ | This security, or a portion of this security, has been pledged as collateral in connection with swap contracts. In addition, cash of $21,923 was received from broker(s) as collateral in connection with swap contracts. Securities valued at $9,214, held on behalf of the Fund at the custody bank, were designated by broker(s) as collateral in connection with swap contracts. Since the broker retains legal title to the securities, the securities are not considered assets of the Fund and are not included in the Statement of Assets and Liabilities. |
| □ | This security, or a portion of this security, is pledged as initial margin deposit and collateral for daily variation margin loss on open futures contracts held at December 31, 2013, as listed in the table below: |
Futures Contracts Outstanding at December 31, 2013
| Description | Number of Contracts* | Expiration Date | Notional Amount | Market Value ╪ | Unrealized Appreciation/ (Depreciation) | |||||||||||||
| Long position contracts: | ||||||||||||||||||
| 2-Year U.S. Treasury Note Future | 394 | 03/31/2014 | $ | 86,697 | $ | 86,606 | $ | (91 | ) | |||||||||
| 5-Year U.S. Treasury Note Future | 4,531 | 03/31/2014 | 546,536 | 540,605 | (5,931 | ) | ||||||||||||
| U.S. Treasury Long Bond Future | 1,484 | 03/20/2014 | 192,022 | 190,416 | (1,606 | ) | ||||||||||||
| $ | (7,628 | ) | ||||||||||||||||
| Short position contracts: | ||||||||||||||||||
| 10-Year U.S. Treasury Note Future | 4,778 | 03/20/2014 | $ | 598,445 | $ | 587,918 | $ | 10,527 | ||||||||||
| Japan 10-Year Bond Future | 76 | 03/11/2014 | 103,780 | 103,431 | 349 | |||||||||||||
| Long Gilt Future | 468 | 03/27/2014 | 83,883 | 82,583 | 1,300 | |||||||||||||
| U.S. Treasury Ultra Long Term Bond Future | 505 | 03/20/2014 | 69,887 | 68,806 | 1,081 | |||||||||||||
| $ | 13,257 | |||||||||||||||||
| $ | 5,629 | |||||||||||||||||
* The number of contracts does not omit 000's.
The accompanying notes are an integral part of these financial statements.
| 18 |
Credit Default Swap Contracts Outstanding at December 31, 2013
| Reference Entity | Counterparty/ Clearinghouse | Notional Amount (a) | (Pay)/Receive Fixed Rate | Expiration Date | Upfront Premiums Paid/ (Received) | Market Value ╪ | Unrealized Appreciation/ (Depreciation) | |||||||||||||||||||
| Credit default swaps on traded indices: | ||||||||||||||||||||||||||
| Buy protection: | ||||||||||||||||||||||||||
| ABX.HE.AA.6 | BCLY | $ | 5,855 | (0.32 | )% | 07/25/45 | $ | 2,185 | $ | 1,523 | $ | (662 | ) | |||||||||||||
| ABX.HE.AAA.6 | BCLY | 11,189 | (0.18 | )% | 07/25/45 | 1,170 | 440 | (730 | ) | |||||||||||||||||
| ABX.HE.AAA.6 | BOA | 5,610 | (0.18 | )% | 07/25/45 | 305 | 221 | (84 | ) | |||||||||||||||||
| ABX.HE.AAA.6 | GSC | 3,174 | (0.18 | )% | 07/25/45 | 260 | 125 | (135 | ) | |||||||||||||||||
| ABX.HE.AAA.6 | JPM | 2,102 | (0.18 | )% | 07/25/45 | 77 | 83 | 6 | ||||||||||||||||||
| ABX.HE.AAA.6 | JPM | 864 | (0.18 | )% | 07/25/45 | 35 | 34 | (1 | ) | |||||||||||||||||
| ABX.HE.AAA.6 | MSC | 900 | (0.18 | )% | 07/25/45 | 29 | 35 | 6 | ||||||||||||||||||
| ABX.HE.AAA.6 | MSC | 4,247 | (0.18 | )% | 07/25/45 | 347 | 167 | (180 | ) | |||||||||||||||||
| ABX.HE.PENAAA.6 | BCLY | 972 | (0.11 | )% | 05/25/46 | 159 | 183 | 24 | ||||||||||||||||||
| ABX.HE.PENAAA.6 | BOA | 2,536 | (0.11 | )% | 05/25/46 | 577 | 477 | (100 | ) | |||||||||||||||||
| ABX.HE.PENAAA.6 | GSC | 2,387 | (0.11 | )% | 05/25/46 | 597 | 449 | (148 | ) | |||||||||||||||||
| ABX.HE.PENAAA.6 | JPM | 4,309 | (0.11 | )% | 05/25/46 | 1,051 | 810 | (241 | ) | |||||||||||||||||
| ABX.HE.PENAAA.6 | MSC | 3,007 | (0.11 | )% | 05/25/46 | 729 | 566 | (163 | ) | |||||||||||||||||
| ABX.HE.PENAAA.7 | JPM | 3,337 | (0.09 | )% | 08/25/37 | 1,373 | 1,039 | (334 | ) | |||||||||||||||||
| CMBX.NA.A.1 | BOA | 2,910 | (0.35 | )% | 10/12/52 | 928 | 1,092 | 164 | ||||||||||||||||||
| CMBX.NA.A.1 | DEUT | 5,450 | (0.35 | )% | 10/12/52 | 2,517 | 2,043 | (474 | ) | |||||||||||||||||
| CMBX.NA.A.1 | GSC | 2,510 | (0.35 | )% | 10/12/52 | 1,136 | 941 | (195 | ) | |||||||||||||||||
| CMBX.NA.A.1 | JPM | 1,075 | (0.35 | )% | 10/12/52 | 407 | 403 | (4 | ) | |||||||||||||||||
| CMBX.NA.A.1 | MSC | 1,025 | (0.35 | )% | 10/12/52 | 424 | 384 | (40 | ) | |||||||||||||||||
| CMBX.NA.AA.1 | CSI | 6,640 | (0.25 | )% | 10/12/52 | 1,519 | 1,260 | (259 | ) | |||||||||||||||||
| CMBX.NA.AA.1 | DEUT | 6,550 | (0.25 | )% | 10/12/52 | 1,384 | 1,243 | (141 | ) | |||||||||||||||||
| CMBX.NA.AA.1 | JPM | 2,230 | (0.25 | )% | 10/12/52 | 429 | 423 | (6 | ) | |||||||||||||||||
| CMBX.NA.AA.1 | UBS | 17,925 | (0.25 | )% | 10/12/52 | 4,065 | 3,401 | (664 | ) | |||||||||||||||||
| CMBX.NA.AA.2 | BOA | 9,146 | (0.15 | )% | 03/15/49 | 3,480 | 3,104 | (376 | ) | |||||||||||||||||
| CMBX.NA.AA.2 | CSI | 1,593 | (0.15 | )% | 03/15/49 | 558 | 541 | (17 | ) | |||||||||||||||||
| CMBX.NA.AA.2 | DEUT | 712 | (0.15 | )% | 03/15/49 | 260 | 242 | (18 | ) | |||||||||||||||||
| CMBX.NA.AA.2 | GSC | 2,169 | (0.15 | )% | 03/15/49 | 793 | 737 | (56 | ) | |||||||||||||||||
| CMBX.NA.AA.2 | JPM | 993 | (0.15 | )% | 03/15/49 | 374 | 337 | (37 | ) | |||||||||||||||||
| CMBX.NA.AA.2 | MSC | 2,372 | (0.15 | )% | 03/15/49 | 880 | 806 | (74 | ) | |||||||||||||||||
| CMBX.NA.AJ.1 | DEUT | 1,430 | (0.84 | )% | 10/12/52 | 100 | 54 | (46 | ) | |||||||||||||||||
| CMBX.NA.AJ.1 | JPM | 915 | (0.84 | )% | 10/12/52 | 54 | 34 | (20 | ) | |||||||||||||||||
| CMBX.NA.AJ.1 | MSC | 2,550 | (0.84 | )% | 10/12/52 | 179 | 97 | (82 | ) | |||||||||||||||||
| CMBX.NA.AJ.4 | JPM | 378 | (0.96 | )% | 02/17/51 | 96 | 87 | (9 | ) | |||||||||||||||||
| CMBX.NA.AJ.4 | MSC | 4,192 | (0.96 | )% | 02/17/51 | 1,640 | 964 | (676 | ) | |||||||||||||||||
| CMBX.NA.AM.2 | CSI | 7,960 | (0.50 | )% | 03/15/49 | 488 | 197 | (291 | ) | |||||||||||||||||
| CMBX.NA.AM.2 | DEUT | 7,960 | (0.50 | )% | 03/15/49 | 458 | 197 | (261 | ) | |||||||||||||||||
| CMBX.NA.AM.2 | JPM | 1,620 | (0.50 | )% | 03/15/49 | 55 | 40 | (15 | ) | |||||||||||||||||
| CMBX.NA.AM.2 | MSC | 2,050 | (0.50 | )% | 03/15/49 | 102 | 51 | (51 | ) | |||||||||||||||||
| CMBX.NA.AM.4 | BOA | 1,910 | (0.50 | )% | 02/17/51 | 229 | 131 | (98 | ) | |||||||||||||||||
| CMBX.NA.AM.4 | CSI | 1,230 | (0.50 | )% | 02/17/51 | 143 | 85 | (58 | ) | |||||||||||||||||
| CMBX.NA.AM.4 | GSC | 1,125 | (0.50 | )% | 02/17/51 | 140 | 77 | (63 | ) | |||||||||||||||||
| CMBX.NA.AM.4 | JPM | 245 | (0.50 | )% | 02/17/51 | 21 | 17 | (4 | ) | |||||||||||||||||
| CMBX.NA.AM.4 | MSC | 4,750 | (0.50 | )% | 02/17/51 | 809 | 325 | (484 | ) | |||||||||||||||||
| ITRX.XOV.20 | ICE | EUR | 6,650 | (5.00 | )% | 12/20/18 | (623 | ) | (858 | ) | (235 | ) | ||||||||||||||
| Total | $ | 31,939 | $ | 24,607 | $ | (7,332 | ) | |||||||||||||||||||
| Sell protection: | ||||||||||||||||||||||||||
| ABX.HE.AAA.6 | CSI | $ | 884 | 0.11 | % | 05/25/46 | $ | (287 | ) | $ | (222 | ) | $ | 65 | ||||||||||||
| ABX.HE.AAA.6 | DEUT | 11,936 | 0.11 | % | 05/25/46 | (3,763 | ) | (3,003 | ) | 760 | ||||||||||||||||
| ABX.HE.AAA.6 | JPM | 321 | 0.11 | % | 05/25/46 | (87 | ) | (81 | ) | 6 | ||||||||||||||||
| CDX.EM.20 | GSC | 30,195 | 5.00 | % | 12/20/18 | 3,319 | 3,065 | (254 | ) | |||||||||||||||||
| CDX.NA.HY.21 | CME | 50,980 | 5.00 | % | 12/20/18 | 3,375 | 4,346 | 971 | ||||||||||||||||||
| CDX.NA.IG.21 | CME | 93,140 | 1.00 | % | 12/20/18 | 1,270 | 1,666 | 396 | ||||||||||||||||||
| CMBX.NA.AAA.6 | CSI | 18,190 | 0.50 | % | 05/11/63 | (405 | ) | (461 | ) | (56 | ) | |||||||||||||||
| CMBX.NA.AAA.6 | CSI | 32,370 | 0.50 | % | 05/11/63 | (1,113 | ) | (820 | ) | 293 | ||||||||||||||||
| CMBX.NA.AAA.6 | DEUT | 12,125 | 0.50 | % | 05/11/63 | (295 | ) | (307 | ) | (12 | ) | |||||||||||||||
The accompanying notes are an integral part of these financial statements.
| 19 |
| Hartford Total Return Bond HLS Fund |
| Schedule of Investments – (continued) |
December 31, 2013 (000’s Omitted) |
Credit Default Swap Contracts Outstanding at December 31, 2013 - (continued)
| Reference Entity | Counterparty/ Clearinghouse | Notional Amount (a) | (Pay)/Receive Fixed Rate | Expiration Date | Upfront Premiums Paid/ (Received) | Market Value ╪ | Unrealized Appreciation/ (Depreciation) | |||||||||||||||||||
| Credit default swaps on traded indices: - (continued) | ||||||||||||||||||||||||||
| Sell protection: - (continued) | ||||||||||||||||||||||||||
| CMBX.NA.AAA.6 | JPM | $ | 9,585 | 0.50 | % | 05/11/63 | $ | (327 | ) | $ | (243 | ) | $ | 84 | ||||||||||||
| CMBX.NA.AAA.6 | UBS | 11,130 | 0.50 | % | 05/11/63 | (257 | ) | (282 | ) | (25 | ) | |||||||||||||||
| CMBX.NA.AAA.6 | UBS | 15,710 | 0.50 | % | 05/11/63 | (419 | ) | (398 | ) | 21 | ||||||||||||||||
| CMBX.NA.BB.6 | CSI | 2,080 | 5.00 | % | 05/11/63 | (176 | ) | (45 | ) | 131 | ||||||||||||||||
| CMBX.NA.BB.6 | CSI | 2,765 | 5.00 | % | 05/11/63 | (49 | ) | (59 | ) | (10 | ) | |||||||||||||||
| CMBX.NA.BB.6 | JPM | 1,295 | 5.00 | % | 05/11/63 | (73 | ) | (28 | ) | 45 | ||||||||||||||||
| CMBX.NA.BB.6 | MSC | 4,020 | 5.00 | % | 05/11/63 | (285 | ) | (86 | ) | 199 | ||||||||||||||||
| CMBX.NA.BB.6 | UBS | 3,520 | 5.00 | % | 05/11/63 | 85 | (76 | ) | (161 | ) | ||||||||||||||||
| CMBX.NA.BB.6 | UBS | 465 | 5.00 | % | 05/11/63 | (8 | ) | (10 | ) | (2 | ) | |||||||||||||||
| CMBX.NA.BB.6 | UBS | 1,515 | 5.00 | % | 05/11/63 | (74 | ) | (32 | ) | 42 | ||||||||||||||||
| CMBX.NA.BBB-.6 | CSI | 6,715 | 3.00 | % | 05/11/63 | 17 | (111 | ) | (128 | ) | ||||||||||||||||
| CMBX.NA.BBB-.6 | CSI | 4,815 | 3.00 | % | 05/11/63 | (419 | ) | (80 | ) | 339 | ||||||||||||||||
| CMBX.NA.BBB-.6 | DEUT | 2,737 | 3.00 | % | 05/11/63 | (78 | ) | (45 | ) | 33 | ||||||||||||||||
| CMBX.NA.BBB-.6 | JPM | 1,055 | 3.00 | % | 05/11/63 | (50 | ) | (17 | ) | 33 | ||||||||||||||||
| ITRX.EUR.20 | ICE | EUR | 13,035 | 1.00 | % | 12/20/18 | 173 | 256 | 83 | |||||||||||||||||
| PrimeX.ARM.1 | JPM | 96 | 4.42 | % | 06/25/36 | 10 | 10 | – | ||||||||||||||||||
| PrimeX.ARM.1 | MSC | 1,159 | 4.42 | % | 06/25/36 | 34 | 118 | 84 | ||||||||||||||||||
| PrimeX.ARM.2 | JPM | 836 | 4.58 | % | 12/25/37 | 25 | 25 | – | ||||||||||||||||||
| PrimeX.ARM.2 | MSC | 8,105 | 4.58 | % | 06/25/36 | (595 | ) | 240 | 835 | |||||||||||||||||
| PrimeX.ARM.2 | MSC | 1,057 | 4.58 | % | 12/25/37 | 35 | 31 | (4 | ) | |||||||||||||||||
| PrimeX.FRM.1 | JPM | 82 | 4.42 | % | 07/25/36 | 8 | 8 | – | ||||||||||||||||||
| PrimeX.FRM.1 | JPM | 913 | 4.42 | % | 07/25/36 | 94 | 93 | (1 | ) | |||||||||||||||||
| Total | $ | (315 | ) | $ | 3,452 | $ | 3,767 | |||||||||||||||||||
| Total traded indices | $ | 31,624 | $ | 28,059 | $ | (3,565 | ) | |||||||||||||||||||
| (a) | The maximum potential amount the Fund could be required to pay as a seller of credit protection or receive as a buyer of credit protection if a credit event occurs as defined under the terms of that particular swap agreement. Notional shown in U.S. dollars unless otherwise noted. |
Spreadlock Swap Contracts Outstanding at December 31, 2013
| Counterparty | Strike | Notional Amount | Determination Date | Upfront Premiums Paid/ (Received) | Market Value ╪ | Unrealized Appreciation/ (Depreciation) | ||||||||||||||
| CBK† | 73.0 bps Fixed* | $ | 390,000 | 04/21/14 | $ | – | $ | 294 | $ | 294 | ||||||||||
| * | This is a spreadlock swap between the 10-Year constant maturity swap curve ("CMS") and the yield to maturity on a 30-Year FNMA. If the yield to maturity on the 30-Year FNMA minus the 10-Year CMS rate is greater than the strike, the Fund will receive money from the counterparty based on this differential on the determination date. If the yield to maturity on the 30-Year FNMA minus the 10-Year CMS rate is less than the strike, the Fund will pay the counterparty on the determination date. |
| † | These securities were valued in good faith at fair value as determined under policies and procedures established by and under the supervision of the Company's Board of Directors. At December 31, 2013, the aggregate value of these securities was $294, which rounds to zero percent of total net assets. |
The accompanying notes are an integral part of these financial statements.
| 20 |
Securities Sold Short Outstanding at December 31, 2013
| Description | Principal Amount | Maturity Date | Market Value ╪ | Unrealized Appreciation/ Depreciation | ||||||||||
| FHLMC TBA, 3.50% | $ | 28,300 | 01/15/2041 | $ | 28,079 | $ | 91 | |||||||
| FHLMC TBA, 5.50% | 46,700 | 01/15/2040 | 51,005 | (79 | ) | |||||||||
| FNMA TBA, 3.50% | 4,800 | 01/15/2026 | 5,019 | 14 | ||||||||||
| FNMA TBA, 5.00% | 12,600 | 01/15/2040 | 13,684 | (11 | ) | |||||||||
| FNMA TBA, 6.00% | 3,700 | 01/15/2043 | 4,104 | (21 | ) | |||||||||
| GNMA TBA, 3.00% | 45,600 | 01/15/2042 | 44,057 | 201 | ||||||||||
| GNMA TBA, 3.50% | 20,500 | 01/15/2041 | 20,661 | 50 | ||||||||||
| GNMA TBA, 4.00% | 74,300 | 01/15/2040 | 77,209 | 389 | ||||||||||
| GNMA TBA, 4.50% | 5,700 | 01/15/2040 | 6,082 | 29 | ||||||||||
| $ | 249,900 | $ | 663 | |||||||||||
At December 31, 2013, the aggregate value of these securities represents 6.7% of total net assets.
| ╪ | See Significant Accounting Policies of accompanying Notes to Financial Statements regarding valuation of securities. |
| GLOSSARY: (abbreviations used in preceding Schedule of Investments) | |
| Counterparty Abbreviations: | |
| BCLY | Barclays |
| BOA | Banc of America Securities LLC |
| CBK | Citibank NA |
| CME | Chicago Mercantile Exchange |
| CSI | Credit Suisse International |
| DEUT | Deutsche Bank Securities, Inc. |
| GSC | Goldman Sachs & Co. |
| ICE | Intercontinental Exchange |
| JPM | JP Morgan Chase & Co. |
| MSC | Morgan Stanley |
| UBS | UBS AG |
| Currency Abbreviations: | |
| EUR | EURO |
| Index Abbreviations: | |
| ABX.HE | Markit Asset Backed Security Home Equity |
| CDX.EM | Credit Derivatives Emerging Markets |
| CDX.NA.HY | Credit Derivatives North American High Yield |
| CDX.NA.IG | Credit Derivatives North American Investment Grade |
| CMBX.NA | Markit Commercial Mortgage Backed North American |
| ITRX.EUR | Markit iTraxx - Europe |
| ITRX.XOV | Markit iTraxx Index - Europe Crossover |
| PrimeX.ARM | Markit PrimeX Adjustable Rate Mortgage Backed Security |
| PrimeX.FRM | Markit PrimeX Fixed Rate Mortgage Backed Security |
| Municipal Bond Abbreviations: | |
| FA | Finance Authority |
| GO | General Obligation |
| Rev | Revenue |
| Other Abbreviations: | |
| FFCB | Federal Farm Credit Bank |
| FHLMC | Federal Home Loan Mortgage Corp. |
| FNMA | Federal National Mortgage Association |
| GNMA | Government National Mortgage Association |
| LIBOR | London Interbank Offered Rate |
| REIT | Real Estate Investment Trust |
The accompanying notes are an integral part of these financial statements.
| 21 |
| Hartford Total Return Bond HLS Fund |
| Investment Valuation Hierarchy Level Summary |
| December 31, 2013 (000’s Omitted) |
| Total | Level 1 ♦ | Level 2 ♦ | Level 3 | |||||||||||||
| Assets: | ||||||||||||||||
| Asset & Commercial Mortgage Backed Securities | $ | 599,944 | $ | – | $ | 498,969 | $ | 100,975 | ||||||||
| Call Options Purchased | 1,790 | – | 1,790 | – | ||||||||||||
| Corporate Bonds | 1,124,028 | – | 1,119,481 | 4,547 | ||||||||||||
| Foreign Government Obligations | 9,072 | – | 9,072 | – | ||||||||||||
| Municipal Bonds | 62,078 | – | 62,078 | – | ||||||||||||
| Preferred Stocks | 3,507 | 1,861 | 1,646 | – | ||||||||||||
| Put Options Purchased | 2,209 | – | 2,209 | – | ||||||||||||
| Senior Floating Rate Interests | 161,452 | – | 161,452 | – | ||||||||||||
| U.S. Government Agencies | 1,306,128 | – | 1,306,128 | – | ||||||||||||
| U.S. Government Securities | 746,137 | 334,292 | 411,845 | – | ||||||||||||
| Short-Term Investments | 491,927 | – | 491,927 | – | ||||||||||||
| Total | $ | 4,508,272 | $ | 336,153 | $ | 4,066,597 | $ | 105,522 | ||||||||
| Credit Default Swaps * | 4,620 | – | 4,620 | – | ||||||||||||
| Futures * | 13,257 | 13,257 | – | – | ||||||||||||
| Spreadlock Swaps * | 294 | – | – | 294 | ||||||||||||
| Total | $ | 18,171 | $ | 13,257 | $ | 4,620 | $ | 294 | ||||||||
| Liabilities: | ||||||||||||||||
| Securities Sold Short | $ | 249,900 | $ | – | $ | 249,900 | $ | – | ||||||||
| Total | $ | 249,900 | $ | – | $ | 249,900 | $ | – | ||||||||
| Credit Default Swaps * | 8,185 | – | 8,185 | – | ||||||||||||
| Futures * | 7,628 | 7,628 | – | – | ||||||||||||
| Total | $ | 15,813 | $ | 7,628 | $ | 8,185 | $ | – | ||||||||
| ♦ | For the year ended December 31, 2013, there were no transfers between Level 1 and Level 2. |
| * | Derivative instruments (excluding purchased and written options, if applicable) are valued at the unrealized appreciation/depreciation on the investments. |
Following is a reconciliation of Level 3 assets for which significant unobservable inputs were used to determine fair value:
| Balance as of December 31, 2012 | Realized Gain (Loss) | Change in Unrealized Appreciation (Depreciation) | Net Amortization | Purchases | Sales | Transfers Into Level 3 * | Transfers Out of Level 3 * | Balance as of December 31, 2013 | ||||||||||||||||||||||||||||
| Assets: | ||||||||||||||||||||||||||||||||||||
| Asset & Commercial Mortgage Backed Securities | $ | 90,626 | $ | 9,711 | $ | (2,902 | )† | $ | 7,426 | $ | 56,686 | $ | (46,666 | ) | $ | — | $ | (13,906 | ) | $ | 100,975 | |||||||||||||||
| Corporate Bonds | 8,928 | 97 | (436 | )‡ | (3 | ) | — | (3,842 | ) | — | (197 | ) | 4,547 | |||||||||||||||||||||||
| Total | $ | 99,554 | $ | 9,808 | $ | (3,338 | ) | $ | 7,423 | $ | 56,686 | $ | (50,508 | ) | $ | — | $ | (14,103 | ) | $ | 105,522 | |||||||||||||||
| Swaps§ | $ | — | $ | — | ** | $ | 294 | †† | $ | — | $ | — | $ | — | $ | — | $ | — | $ | 294 | ||||||||||||||||
| Total | $ | — | $ | — | $ | 294 | $ | — | $ | — | $ | — | $ | — | $ | — | $ | 294 | ||||||||||||||||||
| * | Investments are transferred into and out of Level 3 for a variety of reasons including, but not limited to: |
1) Investments where trading has been halted (transfer into Level 3) or investments where trading has resumed (transfer out of Level 3).
2) Broker quoted investments (transfer into Level 3) or quoted prices in active markets (transfer out of Level 3).
3) Investments that have certain restrictions on trading (transfer into Level 3) or investments where trading restrictions have expired (transfer out of Level 3).
| † | Change in unrealized appreciation (depreciation) in the current period relating to assets still held at December 31, 2013 was $(29). |
| ‡ | Change in unrealized appreciation (depreciation) in the current period relating to assets still held at December 31, 2013 was $(407). |
| § | Derivative instruments not reflected in the Schedule of Investments are valued at the unrealized appreciation/ depreciation on the investment. |
| ** | The realized gain (loss) earned for swaps during the period ended December 31, 2013 was $46. |
| †† | Change in unrealized appreciation (depreciation) in the current period relating to assets still held at December 31, 2013 was $294. |
| Note: | For purposes of reporting transfers between different hierarchy levels, both transfers in and out of each level, as applicable, are shown as if they occurred at the beginning of the period. |
The accompanying notes are an integral part of these financial statements.
| 22 |
| Hartford Total Return Bond HLS Fund |
| Statement of Assets and Liabilities |
| December 31, 2013 (000’s Omitted) |
| Assets: | ||||
| Investments in securities, at market value (cost $3,987,077) | $ | 4,016,345 | ||
| Investments in repurchase agreements, at market value (cost $491,927) | 491,927 | |||
| Foreign currency on deposit with custodian (cost $—) | — | |||
| Unrealized appreciation on OTC swap contracts | 3,464 | |||
| Receivables: | ||||
| Investment securities sold | 416,293 | |||
| Fund shares sold | 269 | |||
| Dividends and interest | 21,513 | |||
| Variation margin on financial derivative instruments | 1,484 | |||
| OTC swap premiums paid | 36,189 | |||
| Total assets | 4,987,484 | |||
| Liabilities: | ||||
| Unrealized depreciation on OTC swap contracts | 7,950 | |||
| Bank overdraft | 10,184 | |||
| Securities sold short, at market value (proceeds $250,563) | 249,900 | |||
| Payables: | ||||
| Investment securities purchased | 977,730 | |||
| Fund shares redeemed | 3,673 | |||
| Collateral received from broker | 21,923 | |||
| Variation margin on financial derivative instruments | 1,155 | |||
| Investment management fees | 372 | |||
| Distribution fees | 23 | |||
| Other liabilities | 7 | |||
| Accrued expenses | 275 | |||
| OTC swap premiums received | 8,760 | |||
| Total liabilities | 1,281,952 | |||
| Net assets | $ | 3,705,532 | ||
| Summary of Net Assets: | ||||
| Capital stock and paid-in-capital | $ | 3,606,335 | ||
| Undistributed net investment income | 107,442 | |||
| Accumulated net realized loss | (40,538 | ) | ||
| Unrealized appreciation of investments and the translations of assets and liabilities denominated in foreign currency | 32,293 | |||
| Net assets | $ | 3,705,532 | ||
| Shares authorized | 5,000,000 | |||
| Par value | $ | 0.001 | ||
| Class IA: Net asset value per share | $ | 11.35 | ||
| Shares outstanding | 289,939 | |||
| Net assets | $ | 3,290,622 | ||
| Class IB: Net asset value per share | $ | 11.27 | ||
| Shares outstanding | 36,800 | |||
| Net assets | $ | 414,910 |
The accompanying notes are an integral part of these financial statements.
| 23 |
| Hartford Total Return Bond HLS Fund |
| Statement of Operations |
| For the Year Ended December 31, 2013 (000’s Omitted) |
| Investment Income: | ||||
| Dividends | $ | 388 | ||
| Interest | 125,507 | |||
| Total investment income, net | 125,895 | |||
| Expenses: | ||||
| Investment management fees | 17,715 | |||
| Transfer agent fees | 5 | |||
| Distribution fees - Class IB | 1,217 | |||
| Custodian fees | 78 | |||
| Accounting services fees | 771 | |||
| Board of Directors' fees | 102 | |||
| Audit fees | 39 | |||
| Other expenses | 665 | |||
| Total expenses (before fees paid indirectly) | 20,592 | |||
| Custodian fee offset | — | |||
| Total fees paid indirectly | — | |||
| Total expenses, net | 20,592 | |||
| Net Investment Income | 105,303 | |||
| Net Realized Gain on Investments, Other Financial Instruments and Foreign Currency Transactions: | ||||
| Net realized loss on investments | (16,852 | ) | ||
| Net realized gain on purchased options | 2,135 | |||
| Net realized gain on securities sold short | 20,174 | |||
| Net realized gain on futures | 14,696 | |||
| Net realized gain on written options | 3,712 | |||
| Net realized loss on swap contracts | (20,732 | ) | ||
| Net realized loss on foreign currency contracts | (732 | ) | ||
| Net realized loss on other foreign currency transactions | (119 | ) | ||
| Net Realized Gain on Investments, Other Financial Instruments and Foreign Currency Transactions | 2,282 | |||
| Net Changes in Unrealized Depreciation of Investments, Other Financial Instruments and Foreign Currency Transactions: | ||||
| Net unrealized depreciation of investments | (155,708 | ) | ||
| Net unrealized depreciation of purchased options | (808 | ) | ||
| Net unrealized appreciation of securities sold short | 1,222 | |||
| Net unrealized appreciation of futures | 2,838 | |||
| Net unrealized depreciation of swap contracts | (4,844 | ) | ||
| Net unrealized depreciation of foreign currency contracts | (511 | ) | ||
| Net unrealized appreciation on translation of other assets and liabilities in foreign currencies | 5 | |||
| Net Changes in Unrealized Depreciation of Investments, Other Financial Instruments and Foreign Currency Transactions | (157,806 | ) | ||
| Net Loss on Investments, Other Financial Instruments and Foreign Currency Transactions | (155,524 | ) | ||
| Net Decrease in Net Assets Resulting from Operations | $ | (50,221 | ) |
The accompanying notes are an integral part of these financial statements.
| 24 |
| Hartford Total Return Bond HLS Fund |
| Statement of Changes in Net Assets |
(000’s Omitted) |
| For the Year Ended December 31, 2013 | For the Year Ended December 31, 2012 | |||||||
| Operations: | ||||||||
| Net investment income | $ | 105,303 | $ | 127,213 | ||||
| Net realized gain on investments, other financial instruments and foreign currency transactions | 2,282 | 150,173 | ||||||
| Net unrealized appreciation (depreciation) of investments, other financial instruments and foreign currency transactions | (157,806 | ) | 32,054 | |||||
| Net Increase (Decrease) in Net Assets Resulting from Operations | (50,221 | ) | 309,440 | |||||
| Distributions to Shareholders: | ||||||||
| From net investment income | ||||||||
| Class IA | (133,325 | ) | (149,453 | ) | ||||
| Class IB | (17,335 | ) | (22,764 | ) | ||||
| Total distributions | (150,660 | ) | (172,217 | ) | ||||
| Capital Share Transactions: | ||||||||
| Class IA | ||||||||
| Sold | 655,332 | 332,218 | ||||||
| Issued on reinvestment of distributions | 133,325 | 149,453 | ||||||
| Redeemed | (895,940 | ) | (745,553 | ) | ||||
| Total capital share transactions | (107,283 | ) | (263,882 | ) | ||||
| Class IB | ||||||||
| Sold | 52,736 | 85,231 | ||||||
| Issued on reinvestment of distributions | 17,335 | 22,764 | ||||||
| Redeemed | (195,160 | ) | (193,845 | ) | ||||
| Total capital share transactions | (125,089 | ) | (85,850 | ) | ||||
| Net decrease from capital share transactions | (232,372 | ) | (349,732 | ) | ||||
| Net Decrease in Net Assets | (433,253 | ) | (212,509 | ) | ||||
| Net Assets: | ||||||||
| Beginning of period | 4,138,785 | 4,351,294 | ||||||
| End of period | $ | 3,705,532 | $ | 4,138,785 | ||||
| Undistributed (distribution in excess of) net investment income | $ | 107,442 | $ | 150,659 | ||||
| Shares: | ||||||||
| Class IA | ||||||||
| Sold | 56,799 | 27,974 | ||||||
| Issued on reinvestment of distributions | 11,960 | 12,783 | ||||||
| Redeemed | (76,678 | ) | (62,562 | ) | ||||
| Total share activity | (7,919 | ) | (21,805 | ) | ||||
| Class IB | ||||||||
| Sold | 4,520 | 7,217 | ||||||
| Issued on reinvestment of distributions | 1,564 | 1,959 | ||||||
| Redeemed | (16,836 | ) | (16,407 | ) | ||||
| Total share activity | (10,752 | ) | (7,231 | ) | ||||
The accompanying notes are an integral part of these financial statements.
| 25 |
| Hartford Total Return Bond HLS Fund |
| Notes to Financial Statements |
December 31, 2013 (000’s Omitted) |
| 1. | Organization: |
Hartford Total Return Bond HLS Fund (the “Fund”) serves as an underlying investment option for certain variable annuity and variable life insurance separate accounts of Hartford Life Insurance Company (“HLIC”) and its affiliates and certain qualified retirement plans. The Fund may also serve as an underlying investment option for certain variable annuity and variable life separate accounts of other insurance companies. Owners of variable annuity contracts and policyholders of variable life insurance contracts may choose the funds permitted in the variable insurance contract prospectus. In addition, participants in certain qualified retirement plans may choose the Fund if permitted by their plans.
Hartford Series Fund, Inc. (the “Company”) is an open-end registered management investment company comprised of thirty portfolios. Financial statements for the Fund, a series of the Company, are included in this report.
The Company is organized under the laws of the State of Maryland and is registered with the Securities and Exchange Commission (“SEC”) under the Investment Company Act of 1940, as amended (“1940 Act”). The Fund is a diversified open-end management investment company.
The Fund is divided into Class IA and Class IB shares. Each class is offered at the per share net asset value (“NAV”) without a sales charge and is subject to the same expenses, except that the Class IB shares are subject to distribution and service fees charged pursuant to a Distribution Plan adopted in accordance with Rule 12b-1 under the 1940 Act.
| 2. | Significant Accounting Policies: |
The following is a summary of significant accounting policies of the Fund in the preparation of its financial statements, which are in accordance with United States Generally Accepted Accounting Principles (“U.S. GAAP”). The preparation of financial statements in accordance with U.S. GAAP may require management to make estimates and assumptions that affect the reported amounts of assets and liabilities and disclosure of contingent assets and liabilities at the date of the financial statements and the reported amounts of increases and decreases in net assets from operations during the reporting period. Actual results could differ from those estimates.
| a) | Determination of Net Asset Value – The NAV of each class of the Fund’s shares is determined as of the close of regular trading (normally 4:00 p.m. Eastern Time) (the “NYSE Close”) on each day that the New York Stock Exchange (the “Exchange”) is open (“Valuation Date”). Information that becomes known to the Fund after the NAV has been calculated on a particular day will not generally be used to retroactively adjust the NAV determined earlier that day. |
| b) | Investment Valuation and Fair Value Measurements – For purposes of calculating the NAV, portfolio investments and other assets held by the Fund's portfolio for which market quotes are readily available are valued at market value. Market value is generally determined on the basis of last reported sales prices or official close price. If no sales are reported, market value is based on quotes obtained from a quotation reporting system, established market makers, or independent pricing services. If market prices are not readily available or are deemed unreliable, the Fund will use the fair value of the investment as determined in good faith under policies and procedures established by and under the supervision of the Company’s Board of Directors. Market quotes are considered not readily available where there is an absence of current or reliable market-based data (e.g., trade information or indicative market quotes), including where events occur after the close of the relevant market, but prior to the NYSE Close, that materially affect the values of the Fund’s portfolio investments or assets. In addition, market quotes are considered not readily available when, due to extraordinary circumstances, the exchanges or markets on which the investments trade do not open for trading for the entire day and no other market prices are available. In addition, prices of foreign equities that are principally traded on certain foreign markets may be adjusted daily pursuant to a fair value pricing service approved by the Board of Directors in order to reflect an adjustment for the factors occurring after the close of certain foreign markets but before the NYSE Close. Investments that are primarily traded on foreign markets may trade on days that are not business days of the Fund. The value of the foreign investments in which the Fund invests may change on days when a shareholder will not be able to purchase or redeem shares of the Fund. Fair value pricing is subjective in nature and the use of fair value pricing by the Fund may cause the NAV of its shares to differ significantly from the NAV that would have been calculated using |
| 26 |
market prices at the close of the exchange on which a portfolio investment is primarily traded. There can be no assurance that the Fund could obtain the fair market value assigned to an investment if the Fund were to sell the investment at approximately the time at which the Fund determines its NAV.
Fixed income investments (other than short-term obligations), non-exchange traded derivatives and centrally cleared swaps held by the Fund are normally valued on the basis of quotes obtained from brokers and dealers or independent pricing services in accordance with procedures established by the Company’s Board of Directors. Prices obtained from independent pricing services use information provided by market makers or estimates of market values through accepted market modeling, trading and pricing conventions. Inputs to the models may include, but are not limited to, prepayment speeds, pricing spread, yield, trade information, dealer quotes, market color, cash flow models and the investment’s terms and conditions. Generally, the Fund may use fair valuation in regard to fixed income investments when the Fund holds defaulted or distressed investments or investments in a company in which a reorganization is pending. Senior floating rate interests generally trade in over-the-counter (“OTC”) markets and are priced through an independent pricing service utilizing independent market quotations from loan dealers or financial institutions. A composite bid price is used, which is an average of the dealer marks and dealer runs. Short-term investments maturing in 60 days or less are generally valued at amortized cost, if their original term to maturity was 60 days or less, or by amortizing their value on the 61st day prior to maturity, if the original term to maturity exceeded 60 days.
Exchange traded options, futures and options on futures are valued at the settlement price or last trade price determined by the relevant exchange as of the NYSE Close. If the last trade price for exchange traded options does not fall between the bid and ask prices, the value will be the mean of the bid and ask prices as of the NYSE Close. If a last trade price is not available, the value will be the mean of the bid and ask prices as of the NYSE Close. If a mean of the bid and ask prices cannot be calculated for the day, the value will be the bid price as of the NYSE Close. In the case of OTC options and such instruments that do not trade on an exchange, values may be supplied by a pricing service using a formula or other objective method that may take into consideration the style, direction, expiration, strike price, notional value and volatility or other special adjustments.
Investments valued in currencies other than U.S. dollars are converted to U.S. dollars using exchange rates obtained from independent pricing services for calculation of the NAV. As a result, the NAV of the Fund’s shares may be affected by changes in the value of currencies in relation to the U.S. dollar. The value of investments traded in markets outside the United States or denominated in currencies other than the U.S. dollar may be affected significantly on a day that the NYSE is closed and the market value may change on days when an investor is not able to purchase, redeem or exchange shares of the Fund.
Foreign currency contracts represent agreements to exchange currencies on specific future dates at predetermined rates. Foreign currency contracts are valued using foreign currency exchange rates and forward rates as provided by an independent pricing service on the Valuation Date.
Investments in open-end mutual funds are valued at the respective NAV of each open-end mutual fund on the Valuation Date.
Financial instruments for which prices are not available from an independent pricing service may be valued using market quotations obtained from one or more dealers that make markets in the respective financial instrument in accordance with procedures established by the Company’s Board of Directors.
| 27 |
| Hartford Total Return Bond HLS Fund |
| Notes to Financial Statements – (continued) |
December 31, 2013 (000’s Omitted) |
U.S. GAAP defines fair value as the price that the Fund would receive to sell an asset or pay to transfer a liability in an orderly transaction between market participants. The U.S. GAAP fair value measurement standards require disclosure of a fair value hierarchy for each major category of assets and liabilities. Various inputs are used in determining the fair value of the Fund’s investments. These inputs are summarized into three broad hierarchy levels. This hierarchy is based on whether the valuation inputs are observable or unobservable. These levels are:
| · | Level 1 – Quoted prices in active markets for identical investments. Level 1 may include exchange traded instruments, such as domestic equities, some foreign equities, options, futures, mutual funds, exchange traded funds, rights and warrants. |
| · | Level 2 – Observable inputs other than Level 1 prices, such as quoted prices for similar investments; quoted prices in markets that are not active; or other inputs that are observable or can be corroborated by observable market data. Level 2 may include debt investments that are traded less frequently than exchange traded instruments and which are valued using independent pricing services; foreign equities, which are principally traded on certain foreign markets and are adjusted daily pursuant to a fair value pricing service in order to reflect an adjustment for the factors occurring after the close of certain foreign markets but before the NYSE Close; senior floating rate interests, which are valued using an aggregate of dealer bids; short-term investments, which are valued at amortized cost; and swaps, which are valued based upon the terms of each swap contract. |
| · | Level 3 – Significant unobservable inputs that are supported by limited or no market activity. Level 3 may include financial instruments whose values are determined using indicative market quotes or require significant management judgment or estimation. These unobservable valuation inputs may include estimates for current yields, maturity/duration, prepayment speed, and indicative market quotes for comparable investments along with other assumptions relating to credit quality, collateral value, complexity of the investment structure, general market conditions and liquidity. This category may include investments where trading has been halted or there are certain restrictions on trading. While these investments are priced using unobservable inputs, the valuation of these investments reflects the best available data and management believes the prices are a reasonable representation of exit price. For more information on specific valuation techniques and unobservable inputs, please see table below titled "Quantitative Information about Level 3 Fair Value Measurements". |
The Board of Directors of the Company generally reviews and approves the “Procedures for Valuation of Portfolio Securities” on an annual basis. These procedures define how investments are to be valued, including the formation and activities of a Valuation Committee. The Valuation Committee is responsible for determining in good faith the fair value of investments when the value cannot be obtained from primary pricing services or alternative sources or if the valuation of an investment as provided by the primary pricing service or alternative source is believed not to reflect the investment’s fair value as of the Valuation Date. Voting members of the Valuation Committee include the Fund’s Treasurer or designee and a Vice President of the investment manager or designee. An Assistant Vice President of the Fund with legal expertise or designee is also included on the Valuation Committee as a non-voting advisory member. In addition, the Fund’s Chief Compliance Officer shall designate a member of the compliance group to attend Valuation Committee meetings as a non-voting resource, to monitor for and provide guidance with respect to compliance with these procedures. Two members of the Valuation Committee or their designees, representing different departments, shall constitute a quorum for purposes of permitting the Valuation Committee to take action. The Valuation Committee will consider all relevant factors in determining an investment’s fair value, and may seek the advice of the Fund’s sub-adviser, knowledgeable brokers, and legal counsel in making such determination. The Valuation Committee reports to the Audit Committee of the Company’s Board of Directors. The Audit Committee receives quarterly written reports which include details of all fair-valued investments, including the reason for the fair valuation, and an indication, when possible, of the accuracy of the valuation by disclosing the next available reliable public price quotation or the disposition price of such investments (the “look-back” test). The Board of Directors then must consider for ratification all of the fair value determinations made during the previous quarter.
| 28 |
Valuation levels are not necessarily indicative of the risk associated with investing in such investments. Individual investments within any of the above mentioned asset classes may be assigned a different hierarchical level than those presented above, as individual circumstances dictate.
For additional information, refer to the Investment Valuation Hierarchy Level Summary and the Level 3 roll-forward reconciliation, if applicable, which follow the Schedule of Investments.
Quantitative Information about Level 3 Fair Value Measurements:
| Security Type/Valuation Technique | Unobservable Input * | Range (Weighted Average) ‡ | Fair Value at December 31, 2013 | |||||
| Asset & Commercial Mortgage Backed Securities: | ||||||||
| Cost | Recent trade price | $100.00, 12/19/2013 | $ | 9,345 | ||||
| Discounted cash flow | Internal rate of return | 3.3% - 6.6% (5.3%) | 88,034 | |||||
| Life expectancy (in months) | 72 - 329 (195) | |||||||
| Independent pricing service | Prior day valuation | $95.32 | 1,212 | |||||
| Indicative market quotations | Broker Quote † | $100.82 | 2,384 | |||||
| Corporate Bonds: | ||||||||
| Indicative market quotations | Broker Quote † | $99.50 | 4,547 | |||||
| Swap Contracts: | ||||||||
| Independent pricing service | Prior day valuation | 0.075493 | 294 | |||||
| Total | $ | 105,816 | ||||||
| * | Significant changes to any observable inputs may result in a significant change to the fair value. |
| ‡ | Unless otherwise noted, inputs were weighted based on the fair value of the investments included in the range. |
| † | The broker quote represents the best available estimate of fair value per share as of December 31, 2013. |
| c) | Investment Transactions and Investment Income – Investment transactions are recorded as of the trade date (the date the order to buy or sell is executed) for financial reporting purposes. Investments purchased or sold on a when-issued or delayed-delivery basis may be settled a month or more after the trade date. Realized gains and losses are determined on the basis of identified cost. |
The trade date for senior floating rate interests purchased in the primary loan market is considered the date on which the loan allocations are determined. The trade date for senior floating rate interests purchased in the secondary loan market is the date on which the transaction is entered into.
Dividend income from domestic securities is accrued on the ex-dividend date. In general, dividend income from foreign securities is recorded on the ex-date; however, dividend notifications in certain foreign jurisdictions may not be available in a timely manner and as a result, the Fund will record the dividend as soon as the relevant details (i.e., rate per share, payment date, shareholders of record, etc.) are publicly available. Interest income, including amortization of premium, accretion of discounts and additional principal received in-kind in lieu of cash, is accrued on a daily basis. Paydown gains and losses on mortgage related and other asset backed securities are included in interest income in the Statement of Operations, as applicable.
| d) | Foreign Currency Transactions – Assets and liabilities denominated in currencies other than U.S. dollars are translated into U.S. dollars at the exchange rates in effect on the valuation date. Purchases and sales of investments, income and expenses are translated into U.S. dollars at the exchange rates on the dates of such transactions. |
The Fund does not isolate that portion of portfolio investment valuation resulting from fluctuations in the foreign currency exchange rates from the fluctuations arising from changes in the market prices of investments held. Exchange rate fluctuations are included with the net realized and unrealized gain or loss on investments in the accompanying financial statements.
| 29 |
| Hartford Total Return Bond HLS Fund |
| Notes to Financial Statements – (continued) |
| December 31, 2013 |
| (000’s Omitted) |
Net realized foreign exchange gains or losses arise from sales of foreign currencies and the difference between asset and liability amounts initially stated in foreign currencies and the U.S. dollar value of the amounts actually received or paid. Net unrealized foreign exchange gains or losses arise from changes in the value of other assets and liabilities at the end of the reporting period, resulting from changes in the exchange rates.
| e) | Joint Trading Account – The Fund may invest cash balances into a joint trading account that may be invested in one or more repurchase agreements. |
| f) | Fund Share Valuation and Dividend Distributions to Shareholders – Orders for the Fund’s shares are executed in accordance with the investment instructions of the contract holders and plan participants. The NAV of the Fund’s shares is determined as of the close of business on each business day of the Exchange. The NAV is determined separately for each class of shares of the Fund by dividing the Fund’s net assets attributable to that class by the number of shares of the class outstanding. Each class of shares offered by the Fund has equal rights as to assets and voting privileges (except that shareholders of a class have exclusive voting rights regarding any matter relating solely to that class of shares). Income and non-class specific expenses are allocated daily to each class on the basis of the relative net assets of the class. Realized and unrealized gains and losses are allocated daily based on the relative net assets of each class of shares of the Fund. |
Orders for the purchase of the Fund’s shares received prior to the close of the Exchange on any day the Exchange is open for business are priced at the NAV determined as of the close of the Exchange. Orders received after the close of the Exchange, or on a day on which the Exchange and/or the Fund is not open for business, are priced at the next determined NAV.
Dividends are declared pursuant to a policy adopted by the Company’s Board of Directors based upon the investment performance of the Fund. The policy of the Fund is to pay dividends from net investment income and realized gains, if any, at least once a year.
Distributions from net investment income, net realized gains and capital are determined in accordance with federal income tax regulations, which may differ from U.S. GAAP with respect to character and timing. These differences may include but are not limited to losses deferred due to wash sale adjustments, foreign currency gains and losses, adjustments related to Passive Foreign Investment Companies (“PFICs”), Real Estate Investment Trusts (“REITs”), Regulated Investment Companies (“RICs”), certain derivatives and partnerships. Permanent book and federal income tax basis differences relating to shareholder distributions will result in reclassifications to certain of the Fund’s capital accounts (see Federal Income Taxes: Reclassification of Capital Accounts note).
| 3. | Securities and Other Investments: |
| a) | Repurchase Agreements – A repurchase agreement is an agreement by which a counterparty agrees to sell an investment and agrees to repurchase the investment sold from the buyer at a mutually agreed upon time and price. During the period of the repurchase agreement, the counterparty will deposit cash and or securities in a third party custodial account to serve as collateral. At the time the Fund enters into a repurchase agreement, the value of the underlying collateral, including accrued interest, will be equal to or exceed the value of the repurchase agreement. Repurchase agreements expose the Fund to counterparty risk - that is, the risk that the counterparty will not fulfill its obligations. To minimize counterparty risk, the investments that serve to collateralize the repurchase agreement are held by the Fund’s custodian in book entry or physical form in the custodial account of the Fund or in a third party custodial account. Repurchase agreements are valued at cost plus accrued interest, which approximates fair value. Repurchase agreements have master netting arrangements which allow the Fund to offset amounts owed to a counterparty with amounts owed by the counterparty, including any collateral. Upon an event of default under a master repurchase agreement, the non-defaulting party may close out all transactions traded under such agreement and net amounts owed under each transaction to one net amount payable by one party to the other. Absent an event of default, the master repurchase agreement does not result in an offset of reported amounts of assets and liabilities in the Statement of Assets and Liabilities across transactions |
| 30 |
between the Fund and the applicable counterparty. The Fund, as shown on the Schedule of Investments, had outstanding repurchase agreements and related collateral as of December 31, 2013.
| b) | Illiquid and Restricted Investments – The Fund is permitted to invest up to 15% of its net assets in illiquid investments. Illiquid investments are those that may not be sold or disposed of in the ordinary course of business within seven days, at approximately the price used to determine the Fund’s NAV. The Fund may not be able to sell illiquid investments when its sub-adviser considers it desirable to do so or may have to sell such investments at a price that is lower than the price that could be obtained if the investments were more liquid. A sale of illiquid investments may require more time and may result in higher dealer discounts and other selling expenses than does the sale of those that are liquid. Illiquid investments also may be more difficult to value due to the unavailability of reliable market quotations for such investments, and an investment in them may have an adverse impact on the Fund’s NAV. The Fund may also purchase certain restricted investments that can only be resold to certain qualified investors and may be determined to be liquid pursuant to policies and guidelines established by the Company’s Board of Directors. The Fund, as shown on the Schedule of Investments, had illiquid and/or restricted investments as of December 31, 2013. |
| c) | Investments Purchased on a When-Issued or Delayed-Delivery Basis – Delivery and payment for investments that have been purchased by the Fund on a forward commitment, or when-issued or delayed-delivery basis, take place beyond the customary settlement period. The Fund may dispose of or renegotiate a delayed-delivery transaction after it is entered into, and may sell delayed-delivery investments before they are delivered, which may result in a realized gain or loss. During this period, such investments are subject to market fluctuations, and the Fund identifies investments segregated in its records with a value at least equal to the amount of the commitment. The Fund, as shown on the Schedule of Investments, had when-issued or delayed-delivery investments as of December 31, 2013. |
In connection with the Fund’s ability to purchase investments on a when-issued or forward commitment basis, the Fund may enter into to-be announced (“TBA”) commitments. TBA commitments are forward agreements for the purchase or sale of mortgage backed securities for a fixed price, with payment and delivery on an agreed-upon future settlement date. The specific securities to be delivered are not identified at the trade date; however, delivered securities must meet specified terms, including issuer, rate and mortgage terms. Although the Fund may enter into TBA commitments with the intention of acquiring or delivering securities for its portfolio, the Fund can extend the settlement date, roll the transaction, or dispose of a commitment prior to settlement if deemed appropriate to do so. If the TBA commitment is closed through the acquisition of an offsetting TBA commitment, the Fund realizes a gain or loss. In a TBA roll transaction, the Fund generally purchases or sells the initial TBA commitment prior to the agreed upon settlement date and enters into a new TBA commitment for future delivery or receipt of the mortgage backed securities. TBA commitments involve a risk of loss if the value of the security to be purchased or sold declines or increases, respectively, prior to settlement date.
The Fund may enter into “dollar rolls” in which the Fund sells securities and contracts with the same counterparty to repurchase substantially similar securities (for example, same issuer, coupon and maturity) on a specified future date at an agreed upon price. The Fund gives up the right to receive interest paid on the investments sold. The Fund would benefit to the extent of any differences between the price received for the security and the lower forward price for the future purchase. Dollar rolls involve the risk that the market value of the securities that the Fund is required to purchase may decline below the agreed upon repurchase price of those securities. The Fund records dollar roll transactions as purchases and sales and realizes gains and losses on these transactions. These transactions are excluded from the Fund’s portfolio turnover rate. The Fund had open dollar roll transactions as of December 31, 2013.
| d) | Senior Floating Rate Interests – The Fund, as shown on the Schedule of Investments, invests in senior floating rate interests. Senior floating rate interests hold the most senior position in the capital structure of a business entity (the “Borrower”), are typically secured by specific collateral and have a claim on the assets and/or stock of the Borrower that is senior to that held by subordinated debtholders and stockholders of the Borrower. Senior floating rate interests are typically structured and administered by a financial institution that acts as the agent of the lenders participating in the senior floating rate interest. The Fund may invest in multiple series or tranches of a senior floating rate interest, which |
| 31 |
| Hartford Total Return Bond HLS Fund |
| Notes to Financial Statements – (continued) |
| December 31, 2013 |
| (000’s Omitted) |
may have varying terms and carry different associated risks. The Fund may also enter into unfunded loan commitments, which are contractual obligations for future funding. Unfunded loan commitments may include revolving credit facilities, which may obligate the Fund to supply additional cash to the borrower on demand. Unfunded loan commitments represent a future obligation in full. The Fund may receive a commitment fee based on the undrawn portion of the underlying line of credit portion of a senior floating rate interest. In certain circumstances, the Fund may receive various fees upon the restructure of a senior floating rate interest by a borrower. Fees earned/paid may be recorded as a component of income or realized gain/loss in the Statement of Operations.
Senior floating rate interests are typically rated below-investment-grade, which suggests they are more likely to default and generally pay higher interest rates than investment-grade loans. A default could lead to non-payment of income, which would result in a reduction of income to the Fund, and there can be no assurance that the liquidation of any collateral would satisfy the Borrower’s obligation in the event of non-payment of scheduled interest or principal payments, or that such collateral could be readily liquidated.
| e) | Mortgage Related and Other Asset Backed Securities – The Fund may invest in mortgage related and other asset backed securities. These securities include mortgage pass-through securities, collateralized mortgage obligations, commercial mortgage backed securities, stripped mortgage backed securities, asset backed securities, collateralized debt obligations and other securities that directly or indirectly represent a participation in, or are secured by and payable from, mortgage loans on real property. Mortgage related securities are created from pools of residential or commercial mortgage loans, including mortgage loans made by savings and loan institutions, mortgage bankers, commercial banks and others. Asset backed securities are created from many types of assets, including auto loans, credit card receivables, home equity loans, and student loans. These securities provide a monthly payment that consists of both interest and principal payments. Interest payments may be determined by fixed or adjustable rates. The rate of pre-payments on underlying mortgages will affect the price and volatility of a mortgage related security, and may have the effect of shortening or extending the effective duration of the security relative to what was anticipated at the time of purchase. The timely payment of principal and interest of certain mortgage related securities is guaranteed by the full faith and credit of the United States Government. Mortgage related and other asset backed securities created and guaranteed by non-governmental issuers, including government-sponsored corporations, may be supported by various forms of insurance or guarantees, but there can be no assurance that the private insurers or guarantors can meet their obligations under the insurance policies or guarantee arrangements. The Fund, as shown on the Schedule of Investments, had mortgage related and other asset backed securities as of December 31, 2013. |
| 4. | Financial Derivative Instruments: |
The following disclosures contain information on how and why the Fund uses derivative instruments, the credit-risk-related contingent features in certain derivative instruments, and how derivative instruments affect the Fund’s financial position and results of operations. The location and fair value amounts of these instruments on the Statement of Assets and Liabilities and the realized gains and losses and changes in unrealized gains and losses on the Statement of Operations, each categorized by type of derivative contract, are included in the following Additional Derivative Instrument Information footnote. The derivative instruments outstanding as of year-end are disclosed in the notes to or within the Schedule of Investments for purchased options, if applicable. The amounts of realized gains and losses and changes in unrealized gains and losses on derivative instruments during the year are disclosed in the Statement of Operations.
| a) | Foreign Currency Contracts – The Fund may enter into foreign currency contracts that obligate the Fund to purchase or sell currencies at specified future dates. Foreign currency contracts are used to hedge the currency exposure associated with some or all of the Fund’s investments and/or as part of an investment strategy. Foreign currency contracts are marked to market daily and the change in value is recorded by the Fund as an unrealized gain or loss. The Fund will record a realized gain or loss when the foreign currency contract is settled. |
Foreign currency contracts involve elements of market risk in excess of the amounts reflected in the Statement of Assets and Liabilities. In addition, risks may arise upon entering into these contracts from the potential inability of the
| 32 |
counterparties to meet the terms of the contracts and from unanticipated movements in the value of the foreign currencies relative to the U.S. dollar. The Fund had no outstanding foreign currency contracts as of December 31, 2013.
| b) | Futures Contracts – The Fund may enter into futures contracts. A futures contract is an agreement between two parties to buy or sell an asset at a set price on a future date. The Fund uses futures contracts to manage or obtain exposure to the investment markets, commodities, or movements in interest rates and currency values. The primary risks associated with the use of futures contracts are the imperfect correlation between the change in market value of the investments held by the Fund and the prices of futures contracts and the possibility of an illiquid market. Upon entering into a futures contract, the Fund is required to deposit with a futures commission merchant (“FCM”) an amount of cash or U.S. Government or Agency Obligations in accordance with the initial margin requirements of the broker or exchange. Futures contracts are marked to market daily at the most recent settlement price reported by an exchange on which, over time, they are traded most extensively, and an appropriate payable or receivable for the change in value (“variation margin”) is recorded by the Fund. Gains or losses are recognized but not considered realized until the contracts expire or are closed. Futures contracts involve, to varying degrees, risk of loss in excess of the variation margin disclosed on the Statement of Assets and Liabilities; however, the Fund seeks to reduce this risk through the use of an FCM. The Fund, as shown on the Schedule of Investments, had outstanding futures contracts as of December 31, 2013. |
| c) | Options Contracts – An option contract is a contract sold by one party to another party that offers the buyer the right, but not the obligation, to buy (call) or sell (put) an investment or other financial asset at an agreed-upon price during a specific period of time or on a specific date. The Fund may write (sell) covered call and put options on futures, swaps (“swaptions”), securities, commodities or currencies. “Covered” means that so long as the Fund is obligated as the writer of an option, it will own either the underlying investments or currency or an option to purchase the same underlying investments or currency having an expiration date of the covered option and an exercise price equal to or less than the exercise price of the covered option, or will pledge cash or other liquid investments having a value equal to or greater than the fluctuating market value of the option investment or currency. Writing put options increases the Fund’s exposure to the underlying instrument. Writing call options decreases the Fund’s exposure to the underlying instrument. Premiums received from writing options that expire are treated as realized gains. Premiums received from writing options that are exercised or closed are added to the proceeds or offset amounts paid on the underlying futures, swap, investment or currency transaction to determine the realized gain or loss. The Fund as a writer of an option has no control over whether the underlying instrument may be sold (call) or purchased (put) and as a result bears the market risk of an unfavorable change in the price of the instrument underlying the written option. There is the risk the Fund may not be able to enter into a closing transaction because of an illiquid market. The Fund may also purchase put and call options. Purchasing call options increases the Fund’s exposure to the underlying instrument. Purchasing put options decreases the Fund’s exposure to the underlying instrument. The Fund pays a premium, which is included on the Fund’s Statement of Assets and Liabilities as an investment and is subsequently marked to market to reflect the current value of the option. Premiums paid for purchasing options that expire are treated as realized losses. Certain options may be purchased with premiums to be determined on a future date. The premiums for these options are based upon implied volatility parameters at specified terms. The risk associated with purchasing put and call options is generally limited to the premium paid. Premiums paid for purchasing options that are exercised or closed are added to the amounts paid or offset against the proceeds on the underlying investment transaction to determine the realized gain or loss. Entering into over-the-counter options also exposes the Fund to counterparty risk. Counterparty risk is the possibility that the counterparty to the agreements may default on its obligation to perform or disagree as to the meaning of the contractual terms in the agreements. The Fund, as shown on the Schedule of Investments, had outstanding purchased options contracts as of December 31, 2013. The Fund had no outstanding written options contracts as of December 31, 2013. Transactions involving written options contracts during the year ended December 31, 2013, are summarized below: |
| 33 |
| Hartford Total Return Bond HLS Fund |
| Notes to Financial Statements – (continued) |
| December 31, 2013 |
| (000’s Omitted) |
| Options Contract Activity During the Year Ended December 31, 2013 | ||||||||
| Call Options Written During the Year | Number of Contracts* | Premium Amounts | ||||||
| Beginning of the year | — | $ | — | |||||
| Written | 647,300,000 | 2,536 | ||||||
| Expired | (647,300,000 | ) | (2,536 | ) | ||||
| Closed | — | — | ||||||
| Exercised | — | — | ||||||
| End of year | — | $ | — | |||||
| Put Options Written During the Year | Number of Contracts* | Premium Amounts | ||||||
| Beginning of the year | — | $ | — | |||||
| Written | 647,300,000 | 1,176 | ||||||
| Expired | (647,300,000 | ) | (1,176 | ) | ||||
| Closed | — | — | ||||||
| Exercised | — | — | ||||||
| End of year | — | $ | — | |||||
* The number of contracts does not omit 000's.
| d) | Swap Contracts – The Fund may invest in swap contracts. Swap contracts are agreements to exchange or swap investment cash flows, assets, foreign currencies or market-linked returns at specified, future intervals. Swap contracts are either privately negotiated in the over-the-counter market (“OTC swaps”) or executed in a multilateral or other trade facility platform, such as a registered exchange (“centrally cleared swaps”). The Fund may enter into credit default, total return, cross-currency, interest rate, inflation and other forms of swap contracts to manage its exposure to credit, currency, interest rate, commodity and inflation risk. Swap contracts are also used to gain exposure to certain markets. In connection with these contracts, investments or cash may be identified as collateral or margin in accordance with the terms of the respective swap contracts and/or master netting arrangement to provide assets of value and recourse in the event of default or bankruptcy/insolvency. |
Swaps are valued based on custom valuations furnished by an independent pricing service. Swaps for which prices are not available from an independent pricing service are valued in accordance with procedures established by the Company’s Board of Directors. Changes in market value, if any, are reflected as a component of net changes in unrealized appreciation or depreciation on the Statement of Operations. Daily changes in valuation of centrally cleared swaps, if any, are recorded as a receivable or payable for the change in value as appropriate (“variation margin”) on the Statement of Assets and Liabilities. Realized gains or losses on centrally cleared swaps are recorded upon the termination of the swap. OTC swap payments received or made at the beginning of the measurement period are reflected as such on the Statement of Assets and Liabilities and represent premiums paid or received upon entering into the swap contract to compensate for differences between the stated terms of the swap contract and prevailing market conditions (credit spreads, currency exchange rates, interest rates and other relevant factors). These upfront premiums are recorded as realized gains or losses on the Statement of Operations upon termination or maturity of the swap. A liquidation payment received or made at the termination or maturity of the swap is recorded as a realized gain or loss on the Statement of Operations. Net periodic payments received or paid by the Fund are included as part of realized gains or losses on the Statement of Operations.
Entering into these contracts involves, to varying degrees, elements of liquidation, counterparty, credit and market risk in excess of the amounts recognized on the Statement of Assets and Liabilities. Such risks involve the possibility that there will be no liquid market for these contracts, that the counterparty to the contracts may default on its obligation to perform or disagree as to the meaning of contractual terms in the contracts, and that there may be unfavorable changes in market conditions (credit spreads, currency exchange rates, interest rates and other relevant factors).
The Fund’s maximum risk of loss from credit risk for OTC swaps is the net value of the discounted cash flows to be received from the counterparty over the contract’s remaining life, and current market value, to the extent that amount is
| 34 |
positive. The risk is mitigated by having a master netting arrangement between the Fund and the counterparty, which allows for the netting of payments made or received (although such amounts are presented on a gross basis within the Statement of Assets and Liabilities, as applicable) as well as the posting of collateral to the Fund to cover the Fund’s exposure to the counterparty. In a centrally cleared swap, while the Fund enters into an agreement with a clearing broker to execute contracts with a counterparty, the performance of the swap is guaranteed by the central clearinghouse, which reduces the Fund’s exposure to credit risk. The Fund is still exposed to the credit risk of the clearing broker and clearinghouse. The clearinghouse attempts to minimize this risk to all of its participants through the use of mandatory margin requirements, daily cash settlements, and other procedures designed to protect counterparties utilizing the clearinghouse. Likewise, the clearing broker reduces its risk through margin requirements and required segregation of customer balances.
Credit Default Swap Contracts – The credit default swap market allows the Fund to manage its exposure to the market or certain sectors of the market, to reduce its risk exposure to defaults of corporate and sovereign issuers, or to create exposure to corporate or sovereign issuers to which it is not otherwise exposed. Certain credit default swaps involve the exchange of a fixed rate premium for protection against the loss in value of an underlying investment or index in the event of a credit event, such as payment default or bankruptcy.
Under a credit default swap contract, one party acts as guarantor by receiving the fixed periodic payment in exchange for the commitment to purchase the underlying investment at par if the defined credit event occurs. Upon the occurrence of a defined credit event, the difference between the value of the reference obligation and the swap’s notional amount is recorded as realized gain or loss on swap transactions in the Statement of Operations. A “buyer” of credit protection agrees to pay a counterparty to assume the credit risk of an issuer upon the occurrence of certain events. The “seller” of the protection receives periodic payments and agrees to assume the credit risk of an issuer upon the occurrence of certain events. Although specified events are contract specific, credit events are generally defined as bankruptcy, failure to pay, restructuring, obligation acceleration, obligation default or repudiation/moratorium. A “seller’s” exposure is limited to the total notional amount of the credit default swap contract. These potential amounts would be partially offset by any recovery values of the respective referenced obligations or upfront payments received upon entering into the contract.
Implied credit spreads, represented in absolute terms, utilized in determining the market value of credit default swap contracts on corporate issues, sovereign government issues or U.S. municipal issues as of year-end are disclosed in the notes to the Schedule of Investments, as applicable, and serve as an indicator of the current status of the payment/performance risk and represent the likelihood or risk of default for the credit derivative. The implied credit spread of a particular referenced entity reflects the cost of buying/selling protection and may include upfront payments required to be made to enter into the contract. Wider credit spreads represent a deterioration of the referenced entity’s credit soundness and a greater likelihood or risk of default or other credit event occurring as defined under the terms of the contract. For credit default swap contracts on asset backed securities and credit indices, the quoted market prices and resulting values serve as the indicator of the current status of the payment/performance risk. Increasing market values, in absolute terms when compared to the notional amount of the swap, represent a deterioration of the referenced equity’s credit soundness and a greater likelihood or risk of default or other credit event occurring as defined under the terms of the contract. The Fund, as shown on the Schedule of Investments, had outstanding credit default swap contracts as of December 31, 2013.
Interest Rate Swap Contracts – The Fund is subject to interest rate risk exposure in the normal course of pursuing its investment objectives. Because the Fund holds fixed rate bonds, the value of these bonds may decrease if interest rates rise. To help hedge against this risk and to maintain its ability to generate income at prevailing market rates, the Fund may enter into interest rate swap contracts. In a typical interest rate swap, one party agrees to make regular payments equal to a floating interest rate, based on a specified interest rate or inflation benchmark (e.g. London Interbank Offered Rate (“LIBOR”)), multiplied by a “notional principal amount”, in return for payments equal to a fixed rate multiplied by the same amount, for a specific period of time. The net interest received or paid on interest rate swap contracts is recorded as a realized gain or loss. Interest rate swaps are marked to market daily and the change, if any, is recorded as an unrealized gain or loss in the Statement of Operations. When the interest rate swap contract is terminated early, the
| 35 |
| Hartford Total Return Bond HLS Fund |
| Notes to Financial Statements – (continued) |
| December 31, 2013 |
| (000’s Omitted) |
Fund records a realized gain or loss equal to the difference between the current realized value and the expected cash flows.
If an interest rate swap contract provides for payments in different currencies, the parties might agree to exchange the notional principal amount as well. Interest rate swaps may also depend on other prices or rates, such as the value of an index or mortgage prepayment rates. The risks of interest rate swaps include changes in market conditions which will affect the value of the contract or the cash flows and the possible inability of the counterparty to fulfill its obligations under the contract. The Fund’s maximum risk of loss from counterparty credit risk is the discounted net value of the cash flows to be received from the counterparty over the contract’s remaining life, to the extent that amount is positive. The Fund had no outstanding interest rate swap contracts as of December 31, 2013.
Spreadlock Swap Contracts – The Fund may invest in spreadlock swap contracts. These contracts involve commitments to pay or receive a settlement amount calculated as the difference between the swap spread and a fixed spread at a specific forward date. Settlement amounts paid or received are recorded as a realized gain or loss on the Statement of Operations at the determination date. The Fund, as shown on the Schedule of Investments, had outstanding spreadlock swap contracts as of December 31, 2013.
| e) | Additional Derivative Instrument Information: |
Fair Value of Derivative Instruments on the Statement of Assets and Liabilities as of December 31, 2013:
| Risk Exposure Category | ||||||||||||||||||||||||||||
| Interest Rate Contracts | Foreign Exchange Contracts | Credit Contracts | Equity Contracts | Commodity Contracts | Other Contracts | Total | ||||||||||||||||||||||
| Assets: | ||||||||||||||||||||||||||||
| Investments in securities, at value (purchased options), market value | $ | 3,999 | $ | — | $ | — | $ | — | $ | — | $ | — | $ | 3,999 | ||||||||||||||
| Unrealized appreciation on OTC swap contracts | 294 | — | 3,170 | — | — | — | 3,464 | |||||||||||||||||||||
| Variation margin receivable * | 1,280 | — | 204 | — | — | — | 1,484 | |||||||||||||||||||||
| Total | $ | 5,573 | $ | — | $ | 3,374 | $ | — | $ | — | $ | — | $ | 8,947 | ||||||||||||||
| Liabilities: | ||||||||||||||||||||||||||||
| Variation margin payable * | $ | 1,148 | $ | — | $ | 7 | $ | — | $ | — | $ | — | $ | 1,155 | ||||||||||||||
| Total | $ | 1,148 | $ | — | $ | 7,957 | $ | — | $ | — | $ | — | $ | 9,105 | ||||||||||||||
* Only current day's variation margin is reported within the Statement of Assets and Liabilities. The variation margin is included in the open futures cumulative appreciation of $5,629 and open centrally cleared swaps cumulative appreciation of $1,215 as reported in the Schedule of Investments.
The ratio of futures contracts market value to net assets at December 31, 2013 was 30.82%, compared to the one year average of 24.89% for the year ended December 31, 2013. The volume of other derivatives that are presented in the Schedule of Investments is consistent with the derivative activity during the year ended December 31, 2013.
| 36 |
The Effect of Derivative Instruments on the Statement of Operations for the year ended December 31, 2013:
| Risk Exposure Category | ||||||||||||||||||||||||||||
| Interest Rate Contracts | Foreign Exchange Contracts | Credit Contracts | Equity Contracts | Commodity Contracts | Other Contracts | Total | ||||||||||||||||||||||
| Realized Gain (Loss) on Derivatives Recognized as a Result of Operations: | ||||||||||||||||||||||||||||
| Net realized gain on purchased options | $ | 1,217 | $ | 918 | $ | — | $ | — | $ | — | $ | — | $ | 2,135 | ||||||||||||||
| Net realized gain on futures | 14,696 | — | — | — | — | — | 14,696 | |||||||||||||||||||||
| Net realized gain on written options | — | — | 3,712 | — | — | — | 3,712 | |||||||||||||||||||||
| Net realized loss on swap contracts | (971 | ) | — | (19,761 | ) | — | — | — | (20,732 | ) | ||||||||||||||||||
| Net realized loss on foreign currency contracts | — | (732 | ) | — | — | — | — | (732 | ) | |||||||||||||||||||
| Total | $ | 14,942 | $ | 186 | $ | (16,049 | ) | $ | — | $ | — | $ | — | $ | (921 | ) | ||||||||||||
| Net Change in Unrealized Appreciation (Depreciation) on Derivatives Recognized as a Result of Operations: | ||||||||||||||||||||||||||||
| Net change in unrealized depreciation of investments in purchased options | $ | (638 | ) | $ | (170 | ) | $ | — | $ | — | $ | — | $ | — | $ | (808 | ) | |||||||||||
| Net change in unrealized appreciation of futures | 2,838 | — | — | — | — | — | 2,838 | |||||||||||||||||||||
| Net change in unrealized appreciation (depreciation) of swap contracts | 251 | — | (5,095 | ) | — | — | — | (4,844 | ) | |||||||||||||||||||
| Net change in unrealized depreciation of foreign currency contracts | — | (511 | ) | — | — | — | — | (511 | ) | |||||||||||||||||||
| Total | $ | 2,451 | $ | (681 | ) | $ | (5,095 | ) | $ | — | $ | — | $ | — | $ | (3,325 | ) | |||||||||||
| f) | Balance Sheet Offsetting Information: |
Set forth below are tables which disclose both gross information and net information about instruments and transactions eligible for offset in the financial statements, and instruments and transactions that are subject to a master netting arrangement, as well as amounts related to margin, reflected as financial collateral (including cash collateral), held at clearing brokers, counterparties and the Fund’s custodian. The master netting arrangements allow the clearing brokers to net any collateral held in or on behalf of the Fund, or liabilities or payment obligations of the clearing brokers to the Fund, against any liabilities or payment obligations of the Fund to the clearing brokers. The Fund is required to deposit financial collateral (including cash collateral) at the Fund’s custodian on behalf of clearing brokers and counterparties to continually meet the original and maintenance requirements established by the clearing brokers and counterparties. Such requirements are specific to the respective clearing broker or counterparty.
Offsetting of Financial Assets and Derivative Assets as of December 31, 2013:
| Gross Amounts* of Assets Presented in Statement of Assets and Liabilities | Financial Instruments with Allowable Netting | Collateral Received | Net Amount (not less than $0) | |||||||||||||
| Description | ||||||||||||||||
| Futures contracts - Variation margin receivable | $ | 1,280 | $ | (1,148 | ) | $ | — | $ | 132 | |||||||
| Swap contracts - Variation margin receivable | 204 | (7 | ) | — | 197 | |||||||||||
| Purchased options at market value | 3,999 | — | — | 3,999 | ||||||||||||
| OTC swap contracts at market value | 29,349 | (6,406 | ) | (31,137 | ) | — | ||||||||||
| Total subject to a master netting or similar arrangement | $ | 34,832 | $ | (7,561 | ) | $ | (31,137 | ) | $ | 4,328 | ||||||
| 37 |
| Hartford Total Return Bond HLS Fund |
| Notes to Financial Statements – (continued) |
| December 31, 2013 |
| (000’s Omitted) |
Offsetting of Financial Liabilities and Derivative Liabilities as of December 31, 2013:
| Gross Amounts* of Liabilities Presented in Statement of Assets and Liabilities | Financial Instruments with Allowable Netting | Collateral Pledged | Net Amount (not less than $0) | |||||||||||||
| Description | ||||||||||||||||
| Futures contracts - Variation margin payable | $ | 1,148 | $ | (1,148 | ) | $ | (9,657 | )† | $ | — | ||||||
| Swaps contracts - Variation margin payable | 7 | (7 | ) | (3,588 | )† | — | ||||||||||
| OTC swap contracts at market value | 6,406 | (6,406 | ) | — | — | |||||||||||
| Total subject to a master netting or similar arrangement | $ | 7,561 | $ | (7,561 | ) | $ | (13,245 | ) | $ | — | ||||||
* Gross amounts presented as no amounts are netted within the Statement of Assets and Liabilities.
† Pledged as initial margin deposit and collateral for daily variation margin loss on open financial derivative contracts held at December 31, 2013.
| 5. | Principal Risks: |
Credit risk depends largely on the perceived financial health of bond issuers. In general, the credit rating is inversely related to the credit risk of the issuer. Higher rated bonds generally are deemed to have less credit risk, while lower or unrated bonds are deemed to have higher risk of default. The share price, yield and total return of a fund that holds securities with higher credit risk may be more volatile than those of a fund that holds bonds with lower credit risk. Similar to credit risk, the Fund may be exposed to counterparty risk, or the risk that an institution or other entity with which the Fund has unsettled or open transactions will default.
The Fund’s investments expose the Fund to various risks including, but not limited to, interest rate, prepayment, extension, foreign currency and equity risks. Interest rate risk is the risk that fixed income securities will decline in value because of changes in interest rates. As nominal interest rates rise, the values of certain fixed income securities held by the Fund are likely to decrease. A nominal interest rate can be described as the sum of a real interest rate and an expected inflation rate. Fixed income securities with longer durations tend to be more sensitive to changes in interest rates, usually making them more volatile than securities with shorter durations. Duration is useful primarily as a measure of the sensitivity of a fixed income security’s market price to interest rate (i.e., yield) movements. Senior floating rate interests and securities subject to prepayment and extension risk generally offer less potential for gains when interest rates decline. In addition, securities are subject to extension risk. Rising interest rates may cause prepayments to occur at a slower than expected rate, thereby effectively lengthening the maturity of the security and making the security more sensitive to interest rate changes. Prepayment and extension risk are major risks of mortgage backed securities, senior floating rate interests, and certain asset backed securities. For certain asset backed securities, the actual maturity may be less than the stated maturity shown in the Schedule of Investments, if applicable. As a result, the timing of income recognition relating to these securities may vary based upon the actual maturity.
If the Fund invests directly in foreign currencies or in securities that trade in, and receive revenues in, foreign currencies, or in derivatives that provide exposure to foreign currencies, it will be subject to the risk that those currencies will decline in value relative to the base currency (U.S. dollars) of the Fund, or, in the case of hedging positions, that the Fund’s base currency will decline in value relative to the currency being hedged. Currency rates in foreign countries may fluctuate significantly over short periods of time for a number of reasons, including changes in interest rates, intervention (or the failure to intervene) by U.S. or foreign governments, central banks or supranational entities, such as the International Monetary Fund, or by the imposition of currency controls or other political developments in the United States or abroad. As a result, the Fund’s investments in foreign currency denominated securities may reduce the returns of the Fund. The market values of equity securities, such as common stocks and preferred stocks, or equity related investments, such as futures and options, may decline due to general market conditions which are not specifically related to a particular company, such as real or perceived adverse economic conditions, changes in the general outlook for corporate earnings, changes in interest or currency rates or adverse investor sentiment generally. The market value of equity securities may also decline due to factors which affect a particular industry or industries, such as labor shortages
| 38 |
or increased production costs and competitive conditions within an industry. Equity securities and equity related investments generally have greater market price volatility than fixed income securities.
| 6. | Federal Income Taxes: |
| a) | Federal Income Taxes – For federal income tax purposes, the Fund intends to continue to qualify as a RIC under Subchapter M of the Internal Revenue Code (“IRC”) by distributing substantially all of its taxable net investment income and net realized capital gains to its shareholders and otherwise complying with the requirements of the IRC. The Fund has distributed substantially all of its income and capital gains in prior years, if applicable, and intends to distribute substantially all of its income and capital gains prior to the next fiscal year-end. Accordingly, no provision for federal income or excise taxes has been made in the accompanying financial statements. Distributions from short-term capital gains are treated as ordinary income distributions for federal income tax purposes. |
| b) | Net Investment Income (Loss), Net Realized Gains (Losses) and Distributions – Net investment income (loss) and net realized gains (losses) may differ for financial statement and tax purposes primarily because of losses deferred due to wash sale adjustments, foreign currency gains and losses, adjustments related to PFICs, REITs, RICs, certain derivatives and partnerships. The character of distributions made during the year from net investment income or net realized gains may differ from their ultimate characterization for federal income tax purposes. Also, due to the timing of dividend distributions, the fiscal year in which amounts are distributed may differ from the year that the income or realized gains (losses) were recorded by the Fund. |
| c) | Distributions and Components of Distributable Earnings – The tax character of distributions paid by the Fund for the periods indicated is as follows (as adjusted for dividends payable, if applicable): |
| For the Year Ended December 31, 2013 | For the Year Ended December 31, 2012 | |||||||
| Ordinary Income | $ | 150,660 | $ | 172,217 | ||||
As of December 31, 2013, the Fund’s components of distributable earnings (deficit) on a tax basis were as follows:
| Amount | ||||
| Undistributed Ordinary Income | $ | 108,767 | ||
| Accumulated Capital and Other Losses* | (34,392 | ) | ||
| Unrealized Appreciation† | 26,147 | |||
| Total Accumulated Earnings | $ | 100,522 | ||
| * | The Fund has capital loss carryforwards that are identified in the Capital Loss Carryforward note that follows. |
| † | Differences between book-basis and tax-basis unrealized appreciation (depreciation) may be attributable to the losses deferred due to wash sale adjustments, foreign currency gains and losses, adjustments related to PFICs, REITs, RICs, certain derivatives and partnerships. |
| 39 |
| Hartford Total Return Bond HLS Fund |
| Notes to Financial Statements – (continued) |
| December 31, 2013 |
| (000’s Omitted) |
| d) | Reclassification of Capital Accounts – The Fund may record reclassifications in its capital accounts. These reclassifications have no impact on the total net assets of the Fund. The reclassifications are a result of permanent differences between U.S. GAAP and tax accounting for such items as foreign currency, PFICs, expiration or utilization of capital loss carryforwards or net operating losses. Adjustments are made to reflect the impact these items have on current and future distributions to shareholders. Therefore, the source of the Fund’s distributions may be shown in the accompanying Statement of Changes in Net Assets as from undistributed net investment income, from accumulated net realized gains on investments or from capital depending on the type of book and tax differences that exist. For the year ended December 31, 2013, the Fund recorded reclassifications to increase (decrease) the accounts listed below: |
| Amount | ||||
| Undistributed Net Investment Income (Loss) | $ | 2,140 | ||
| Accumulated Net Realized Gain (Loss) | (2,140 | ) | ||
| e) | Capital Loss Carryforward – On December 22, 2010, the Regulated Investment Company Modernization Act of 2010 (the “Act”) was enacted, which made changes to the capital loss carryforward rules. The changes are effective for taxable years beginning after the date of enactment. Under the Act, funds are permitted to carry forward capital losses for an unlimited period. However, any losses incurred during those future taxable years will be required to be utilized prior to the losses incurred in pre-enactment taxable years, which carry an expiration date. As a result of this ordering rule, pre-enactment capital loss carryforwards may be more likely to expire unused. Additionally, post-enactment capital loss carryforwards retain their character as either short-term or long-term capital losses rather than being considered all short-term as permitted under prior regulation. |
At December 31, 2013 (tax-year-end), the Fund had capital loss carryforwards for U.S. federal income tax purposes as follows:
| Year of Expiration | Amount | |||
| 2017 | $ | 28,282 | ||
| Total | $ | 28,282 | ||
| Capital loss carryforwards with no expiration: | ||||
| Amount | ||||
| Short-Term Capital Loss Carryforward | $ | 6,110 | ||
| Total | $ | 6,110 | ||
| f) | Accounting for Uncertainty in Income Taxes – The Fund has adopted financial reporting rules that require the Fund to analyze all open tax years, as defined by the statute of limitations, for all major jurisdictions. Generally, tax authorities can examine all tax returns filed for the last three years. The Fund does not have an examination in progress. |
The Fund has reviewed all open tax years and major jurisdictions and concluded that these financial reporting rules had no effect on the Fund’s financial position or results of operations. There is no tax liability resulting from unrecognized tax benefits relating to uncertain income tax positions taken or expected to be taken on the tax return for the fiscal year ended December 31, 2013. The Fund is also not aware of any tax positions for which it is reasonably possible that the total amounts of unrecognized tax benefits will significantly change in the next twelve months.
| 7. | Expenses: |
| a) | Investment Management Agreement – Hartford Funds Management Company, LLC (“HFMC”), an indirect wholly owned subsidiary of The Hartford Financial Services Group, Inc. (“The Hartford”), serves as investment manager to the Fund pursuant to an Investment Management Agreement with the Company. The investment manager has overall investment supervisory responsibility for the Fund. In addition, the investment manager provides administrative personnel, services, equipment, facilities and office space for proper operation of the Fund. The investment manager has |
| 40 |
contracted with Wellington Management Company, LLP (“Wellington Management”) under a sub-advisory agreement for the provision of day-to-day investment management services to the Fund in accordance with the Fund’s investment objective and policies. The Fund pays a fee to the investment manager, a portion of which may be used to compensate Wellington Management.
The schedule below reflects the rates of compensation paid to HFMC for investment management services rendered as of December 31, 2013; the rates are accrued daily and paid monthly.
| Average Daily Net Assets | Annual Fee | |||
| On first $250 million | 0.5250 | % | ||
| On next $250 million | 0.5000 | % | ||
| On next $500 million | 0.4750 | % | ||
| On next $1.5 billion | 0.4500 | % | ||
| On next $2.5 billion | 0.4450 | % | ||
| On next $5 billion | 0.4300 | % | ||
| Over $10 billion | 0.4200 | % | ||
| b) | Accounting Services Agreement – Pursuant to the Fund Accounting Agreement between HFMC and the Company, on behalf of the Fund, HFMC provides accounting services to the Fund and receives monthly compensation based on the Fund’s average daily net assets at the rates set forth below. The Fund’s accounting services fees are accrued daily and paid monthly. |
| Average Daily Net Assets | Annual Fee | |||
| On first $5 billion | 0.020 | % | ||
| On next $5 billion | 0.018 | % | ||
| Over $10 billion | 0.016 | % | ||
Effective January 1, 2014, the new accounting services fees schedule based on the Fund’s average daily net assets is as follows:
| Average Daily Net Assets | Annual Fee | |||
| On first $5 billion | 0.020 | % | ||
| On next $5 billion | 0.015 | % | ||
| Over $10 billion | 0.010 | % | ||
| c) | Operating Expenses – Allocable expenses incurred by the Company are allocated to each Fund and allocated to classes within a Fund in proportion to the average daily net assets of the Fund and each class, except where allocation of certain expenses is more fairly made directly to the Fund or to specific classes within a Fund. |
| d) | Fees Paid Indirectly – The Fund’s custodian bank has agreed to reduce its fees when the Fund maintains cash on deposit in a non-interest-bearing custody account. For the year ended December 31, 2013, these amounts, if any, are included in the Statement of Operations. |
The ratio of expenses to average net assets in the accompanying financial highlights excludes the reduction in expenses related to fees paid indirectly. The annualized expense ratio after waivers for the period listed below reflecting the reduction for fees paid indirectly is as follows:
| Year Ended December 31, 2013 | ||||
| Class IA | 0.50 | % | ||
| Class IB | 0.75 | |||
| 41 |
| Hartford Total Return Bond HLS Fund |
| Notes to Financial Statements – (continued) |
| December 31, 2013 |
| (000’s Omitted) |
| e) | Distribution Plan for Class IB shares – Effective June 14, 2013, Hartford Investment Financial Services, LLC was renamed Hartford Funds Distributors, LLC (“HFD”). HFD, a wholly owned, ultimate subsidiary of The Hartford, serves as the Fund’s principal underwriter and distributor. The Company, on behalf of the Fund, has adopted a Distribution Plan pursuant to Rule 12b-1 of the 1940 Act to compensate the distributor, HFD, from assets attributable to the Class IB shares for services rendered and expenses borne in connection with activities primarily intended to result in the sale of the Class IB shares, subject to the review and approval of the Company’s Board of Directors. |
The Distribution Plan provides that the Fund may pay annually up to 0.25% of the average daily net assets of the Fund attributable to its Class IB shares for activities primarily intended to result in the sale of Class IB shares. The Board has the authority to suspend or reduce these payments at any point in time. Under the terms of the Distribution Plan and the principal underwriting agreement, the Fund is authorized to make payments monthly to the distributor that may be used to pay or compensate entities providing distribution and shareholder servicing with respect to the Class IB shares for such entities’ fees or expenses incurred or paid in that regard. These fees are accrued daily and paid monthly.
| f) | Other Related Party Transactions – Certain officers of the Fund are directors and/or officers of the investment manager and/or The Hartford or its subsidiaries. For the year ended December 31, 2013, a portion of the Fund’s Chief Compliance Officer’s salary was paid by all the investment companies in the Hartford fund complex. The portion allocated to the Fund was in the amount of $4. Hartford Administrative Services Company (“HASCO”), an indirect wholly owned subsidiary of The Hartford, provides transfer agent services to the Fund. HASCO was compensated on a per account basis for providing such services. The amount paid to HASCO can be found in the Statement of Operations. These fees are accrued daily and paid monthly. |
| 8. | Investment Transactions: |
For the year ended December 31, 2013, the Fund's aggregate purchases and sales of investment securities (excluding short-term investments) were as follows:
| Amount | ||||
| Cost of Purchases Excluding U.S. Government Obligations | $ | 21,418,843 | ||
| Sales Proceeds Excluding U.S. Government Obligations | 21,763,248 | |||
| Cost of Purchases for U.S. Government Obligations | 1,296,307 | |||
| Sales Proceeds for U.S. Government Obligations | 1,424,608 | |||
| 9. | Line of Credit: |
The Fund is one of several Hartford funds that participate in a $500 million committed revolving line of credit facility. The facility is to be used for temporary or emergency purposes. Under the arrangement, the funds are required to own securities having a market value in excess of 300% of the total bank borrowings. The interest rate on borrowings varies depending on the nature of the loan. The facility also requires a fee to be paid based on the amount of the commitment. This commitment fee is allocated to all of the funds participating in the line of credit based on the average net assets of the funds. During the year ended December 31, 2013, the Fund did not have any borrowings under this facility.
| 10. | Industry Classifications: |
Other than the industry classifications “Other Investment Pools and Funds” and “Exchange Traded Funds,” equity industry classifications used in this report are the Global Industry Classification Standard, which was developed by and is the exclusive property and service mark of MSCI, Inc. and Standard & Poor’s.
| 42 |
| 11. | Indemnifications: |
Under the Company’s organizational documents, the Company shall indemnify its officers and directors to the full extent required or permitted under Maryland General Corporation Law and the federal securities laws. In addition, the Company, on behalf of the Fund, may enter into contracts that contain a variety of indemnifications. The Company’s maximum exposure under these arrangements is unknown. However, as of the date of these financial statements, the Company has not had prior claims or losses pursuant to these contracts and expects the risk of loss to be remote.
| 12. | Pending Legal Proceedings: |
On February 25, 2011, Jennifer L. Kasilag, Louis Mellinger, Judith M. Menendez, Jacqueline M. Robinson, and Linda A. Russell filed a derivative lawsuit against Hartford Investment Financial Services, LLC (“HIFSCO”)(now known as Hartford Funds Distributors, LLC) on behalf of six Hartford retail mutual funds in the United States District Court for the District of New Jersey, alleging that HIFSCO received excessive advisory and distribution fees in violation of its statutory fiduciary duty under Section 36(b) of the 1940 Act when serving as investment manager and principal underwriter, respectively, to the Hartford retail mutual funds. HIFSCO moved to dismiss and, in September 2011, the motion was granted in part and denied in part, with leave to amend the complaint. In November 2011, plaintiffs filed an amended complaint on behalf of certain Hartford retail mutual funds, The Hartford Global Health Fund (now known as The Hartford Healthcare Fund), The Hartford Conservative Allocation Fund, The Hartford Growth Opportunities Fund, The Hartford Inflation Plus Fund, The Hartford Advisers Fund (now known as The Hartford Balanced Fund), and The Hartford Capital Appreciation Fund. Plaintiffs seek to rescind the investment management agreements and distribution plans between HIFSCO and these funds and to recover the total fees charged thereunder or, in the alternative, to recover any improper compensation HIFSCO received, in addition to lost earnings. HIFSCO filed a partial motion to dismiss the amended complaint and, in December 2012, the court dismissed without prejudice the claims regarding distribution fees and denied the motion with respect to the advisory fees claims. HIFSCO disputes the allegations and intends to defend the advisory fee claims vigorously.
This action concerns the activities of HIFSCO in its capacity as investment manager and principal underwriter to the Hartford retail mutual funds and does not concern HIFSCO’s activities in its capacity as principal underwriter to the HLS funds. For this reason, no accrual for litigation relating to this matter has been recorded in the financial statements of the Fund.
| 43 |
Hartford Total Return Bond HLS Fund
Financial Highlights
| ─ Selected Per-Share Data(A) ─ | ─ Ratios and Supplemental Data ─ | |||||||||||||||||||||||||||||||||||||||||||||||||||
| Class | Net Asset Value at Beginning of Period | Net Investment Income (Loss) | Net Realized and Unrealized Gain (Loss) on Investments | Total from Investment Operations | Dividends from Net Investment Income | Distributions from Realized Capital Gains | Total Dividends and Distributions | Net Asset Value at End of Period | Total Return(B) | Net Assets at End of Period (000s) | Ratio of Expenses to Average Net Assets Before Adjust- ments(C) | Ratio of Expenses to Average Net Assets After Adjust- ments(C) | Ratio of Net Investment Income (Loss) to Average Net Assets | |||||||||||||||||||||||||||||||||||||||
| For the Year Ended December 31, 2013 | ||||||||||||||||||||||||||||||||||||||||||||||||||||
| IA | $ | 11.99 | $ | 0.32 | $ | (0.49 | ) | $ | (0.17 | ) | $ | (0.47 | ) | $ | – | $ | (0.47 | ) | $ | 11.35 | (1.36 | )% | $ | 3,290,622 | 0.50 | % | 0.50 | % | 2.76 | % | ||||||||||||||||||||||
| IB | 11.91 | 0.29 | (0.50 | ) | (0.21 | ) | (0.43 | ) | – | (0.43 | ) | 11.27 | (1.66 | ) | 414,910 | 0.75 | 0.75 | 2.51 | ||||||||||||||||||||||||||||||||||
| For the Year Ended December 31, 2012 (D) | ||||||||||||||||||||||||||||||||||||||||||||||||||||
| IA | $ | 11.63 | $ | 0.41 | $ | 0.45 | $ | 0.86 | $ | (0.50 | ) | $ | – | $ | (0.50 | ) | $ | 11.99 | 7.54 | % | $ | 3,572,511 | 0.50 | % | 0.50 | % | 3.01 | % | ||||||||||||||||||||||||
| IB | 11.55 | 0.40 | 0.43 | 0.83 | (0.47 | ) | – | (0.47 | ) | 11.91 | 7.27 | 566,274 | 0.75 | 0.75 | 2.76 | |||||||||||||||||||||||||||||||||||||
| �� | ||||||||||||||||||||||||||||||||||||||||||||||||||||
| For the Year Ended December 31, 2011 (D) | ||||||||||||||||||||||||||||||||||||||||||||||||||||
| IA | $ | 10.90 | $ | 0.44 | $ | 0.31 | $ | 0.75 | $ | (0.02 | ) | $ | – | $ | (0.02 | ) | $ | 11.63 | 6.99 | % | $ | 3,718,609 | 0.49 | % | 0.49 | % | 3.60 | % | ||||||||||||||||||||||||
| IB | 10.84 | 0.42 | 0.31 | 0.73 | (0.02 | ) | – | (0.02 | ) | 11.55 | 6.72 | 632,685 | 0.74 | 0.74 | 3.35 | |||||||||||||||||||||||||||||||||||||
| For the Year Ended December 31, 2010 (D) | ||||||||||||||||||||||||||||||||||||||||||||||||||||
| IA | $ | 10.58 | $ | 0.45 | $ | 0.34 | $ | 0.79 | $ | (0.47 | ) | $ | – | $ | (0.47 | ) | $ | 10.90 | 7.51 | % | $ | 4,026,583 | 0.50 | % | 0.50 | % | 3.90 | % | ||||||||||||||||||||||||
| IB | 10.53 | 0.44 | 0.31 | 0.75 | (0.44 | ) | – | (0.44 | ) | 10.84 | 7.25 | 722,317 | 0.75 | 0.75 | 3.65 | |||||||||||||||||||||||||||||||||||||
| For the Year Ended December 31, 2009 (D) | ||||||||||||||||||||||||||||||||||||||||||||||||||||
| IA | $ | 9.54 | $ | 0.46 | $ | 0.98 | $ | 1.44 | $ | (0.40 | ) | $ | – | $ | (0.40 | ) | $ | 10.58 | 15.01 | % | $ | 3,902,957 | 0.51 | % | 0.51 | % | 4.67 | % | ||||||||||||||||||||||||
| IB | 9.50 | 0.46 | 0.95 | 1.41 | (0.38 | ) | – | (0.38 | ) | 10.53 | 14.72 | 789,541 | 0.76 | 0.76 | 4.42 | |||||||||||||||||||||||||||||||||||||
| (A) | Information presented relates to a share outstanding throughout the indicated period. Net investment income (loss) per share amounts are calculated based on average shares outstanding unless otherwise noted. |
| (B) | The figures do not include sales charges or other fees which may be applied at the variable life insurance, variable annuity or qualified retirement plan product level. Any such additional sales charges or other fees would lower the Fund's performance. |
| (C) | Adjustments include waivers and reimbursements, if applicable. Ratios do not include fees paid indirectly (see Expenses in the accompanying Notes to Financial Statements). |
| (D) | Net investment income (loss) per share amounts have been calculated using the SEC method. |
| Portfolio Turnover Rate for All Share Classes | ||||
| For the Year Ended December 31, 2013 | 81 | % | ||
| For the Year Ended December 31, 2012 | 88 | |||
| For the Year Ended December 31, 2011 | 107 | |||
| For the Year Ended December 31, 2010 | 188 | |||
| For the Year Ended December 31, 2009 | 215 | |||
| 44 |
| Report of Independent Registered Public Accounting Firm |
| The Board of Directors and Shareholders of |
| Hartford Series Fund, Inc. |
We have audited the accompanying statement of assets and liabilities, including the schedule of investments, of Hartford Total Return Bond HLS Fund (one of the portfolios constituting Hartford Series Fund, Inc. (the Funds)) as of December 31, 2013, and the related statement of operations for the year then ended, the statements of changes in net assets for each of the two years in the period then ended, and the financial highlights for each of the five years in the period then ended. These financial statements and financial highlights are the responsibility of the Funds’ management. Our responsibility is to express an opinion on these financial statements and financial highlights based on our audits.
We conducted our audits in accordance with the standards of the Public Company Accounting Oversight Board (United States). Those standards require that we plan and perform the audit to obtain reasonable assurance about whether the financial statements and financial highlights are free of material misstatement. We were not engaged to perform an audit of the Funds’ internal control over financial reporting. Our audits included consideration of internal control over financial reporting as a basis for designing audit procedures that are appropriate in the circumstances, but not for the purpose of expressing an opinion on the effectiveness of the Funds’ internal control over financial reporting. Accordingly, we express no such opinion. An audit also includes examining, on a test basis, evidence supporting the amounts and disclosures in the financial statements and financial highlights, assessing the accounting principles used and significant estimates made by management, and evaluating the overall financial statement presentation. Our procedures included confirmation of securities owned as of December 31, 2013, by correspondence with the custodian, agent banks and brokers or by other auditing procedures where replies from agent banks and brokers were not received. We believe that our audits provide a reasonable basis for our opinion.
In our opinion, the financial statements and financial highlights referred to above present fairly, in all material respects, the financial position of Hartford Total Return Bond HLS Fund of the Hartford Series Fund, Inc. at December 31, 2013, the results of its operations for the year then ended, the changes in its net assets for each of the two years in the period then ended, and the financial highlights for each of the five years in the period then ended, in conformity with U.S. generally accepted accounting principles.
| |
| Minneapolis, MN | |
| February 17, 2014 |
| 45 |
| Hartford Total Return Bond HLS Fund |
| Directors and Officers (Unaudited) |
The Board of Directors of the Company appoints officers who are responsible for the day-to-day operations of the Fund and who execute policies formulated by the directors. Each director serves until his or her death, resignation, or retirement or until the next annual meeting of shareholders is held or until his or her successor is elected and qualifies.
Directors and officers who are employed by or who have a financial interest in The Hartford are considered “interested” persons of the Fund pursuant to the 1940 Act. Each officer and two of the Company’s directors, as noted in the chart below, are “interested” persons of the Fund. Each director serves as a director for The Hartford Mutual Funds, Inc., The Hartford Mutual Funds II, Inc., Hartford Series Fund, Inc., Hartford HLS Series Fund II, Inc., and as a trustee for The Hartford Alternative Strategies Fund, which, as of December 31, 2013, collectively consist of 91 funds. Correspondence may be sent to directors and officers c/o Hartford Funds, 5 Radnor Corporate Center, Suite 300, 100 Matsonford Road, Radnor, Pennsylvania 19087, except that correspondence to Mr. Annoni, Mr. Dressen and Ms. Quade may be sent to 500 Bielenberg Drive, Woodbury, Minnesota 55125.
The table below sets forth, for each director and officer, his or her name, year of birth, current position with the Company and date first elected or appointed to Hartford Series Fund, Inc. (“HSF”), and Hartford HLS Series Fund II, Inc. (“HSF2”), principal occupation, and, for directors, other directorships held. The Fund’s Statement of Additional Information contains further information on the directors and is available free of charge by calling 1-800-862-6668 or writing to Hartford HLS Funds, c/o Hartford Life Insurance Company, Hartford Life and Annuity Insurance Company, P.O. Box 14293, Lexington, KY 40512-4293.
Information on the aggregate remuneration paid to the directors of the Company can be found in the Statement of Operations herein. The Fund pays to The Hartford a portion of the Chief Compliance Officer’s compensation, but does not pay salaries or compensation to any of their other officers or directors who are employed by The Hartford.
Non-Interested Directors
Lynn S. Birdsong (1946) Director since 2003, Co-Chairman of the Investment Committee since 2005
Mr. Birdsong is a private investor. Mr. Birdsong currently serves as a Director of the Sovereign High Yield Investment Company (April 2010 to current). Mr. Birdsong currently serves as an Independent Director of Nomura Partners Funds, Inc. (formerly, The Japan Fund) (April 2003 to current). From 2003 to March 2005, Mr. Birdsong was an Independent Director of the Atlantic Whitehall Funds. From 1979 to 2002, Mr. Birdsong was a Managing Director of Zurich Scudder Investments, an investment management firm. During his employment with Scudder, Mr. Birdsong was an Interested Director of The Japan Fund. From January 1981 through December 2013, Mr. Birdsong was a partner in Birdsong Company, an advertising specialty firm.
Robert M. Gavin, Jr. (1940) Director since 2002 (HSF) and 1986 (HSF2), Chairman of the Board since 2004
Dr. Gavin is an educational consultant. Prior to September 1, 2001, he was President of Cranbrook Education Community and prior to July 1996, he was President of Macalester College, St. Paul, Minnesota.
Duane E. Hill (1945) Director since 2001 (HSF) and 2002 (HSF2), Chairman of the Nominating Committee since 2003
Mr. Hill is a Partner of TSG Ventures L.P., a private equity investment company. Mr. Hill is a former partner of TSG Capital Group, a private equity investment firm that served as sponsor and lead investor in leveraged buyouts of middle market companies.
Sandra S. Jaffee (1941) Director since 2005
Ms. Jaffee is the founder and Chief Executive Officer of a private company, Homeworks Concierge, LLC, which provides residential property management services in Westchester County, New York (January 2012 to present). Ms. Jaffee served as Chairman (2008 to 2009) and Chief Executive Officer of Fortent (formerly Searchspace Group), a leading provider of compliance/regulatory technology to financial institutions from August 2005 to August 2009. Ms. Jaffee currently serves as a member of the Board of Directors of Broadridge Financial Solutions as well as a Trustee of Muhlenberg College.
| 46 |
William P. Johnston (1944) Director since 2005, Chairman of the Compliance Committee since 2005
In June 2006, Mr. Johnston was appointed as Senior Advisor to The Carlyle Group, a global private equity and alternative asset investment firm and currently serves as an Operating Executive. In July 2006, Mr. Johnston was elected to the Board of Directors of MultiPlan, Inc. and served as a Director (July 2006 to August 2010). In August 2007, Mr. Johnston was elected to the Board of Directors of LifeCare Holdings, Inc. and served as a Director (August 2007 to June 2013). In February 2008, Mr. Johnston was elected to the Board of Directors of HCR-ManorCare, Inc. In May 2006, Mr. Johnston was elected to the Supervisory Board of Fresenius Medical Care AG & Co. KGaA, after its acquisition of Renal Care Group, Inc. in March 2006. Mr. Johnston joined Renal Care Group in November 2002 as a member of the Board of Directors and served as Chairman of the Board from March 2003 through March 2006. From 2002 through 2013, Mr. Johnston served as a Board member of the Georgia O’Keefe Museum. From September 1987 to December 2002, Mr. Johnston was with Equitable Securities Corporation (and its successors, SunTrust Equitable Securities and SunTrust Robinson Humphrey) serving in various investment banking and managerial positions, including Managing Director and Head of Investment Banking, Chief Executive Officer and Vice Chairman.
Phillip O. Peterson (1944) Director since 2002 (HSF) and 2000 (HSF2), Chairman of the Audit Committee since 2002
Mr. Peterson is a mutual fund industry consultant. He was a partner of KPMG LLP (an accounting firm) until July 1999. Mr. Peterson joined William Blair Funds in February 2007 as a member of the Board of Trustees. Mr. Peterson also joined the Board of Trustees of Symetra Variable Mutual Funds Trust as a trustee in February 2012.
Lemma W. Senbet (1946) Director since 2005
Dr. Senbet is the William E. Mayer Chair Professor of Finance and Founding Director, Center for Financial Policy, at the University of Maryland, Robert H. Smith School of Business. He was chair of the Finance Department of the University of Maryland, Robert H. Smith School of Business from 1998 to 2006. Since June 2013, he has been on leave from the University to serve as Executive Director of African Economic Research Consortium which focuses on economic policy research and training. Previously, he was a chaired professor of finance at the University of Wisconsin-Madison. Also, he was a Director of the Fortis Funds from March 2000 to July 2002. Dr. Senbet served as Director of the American Finance Association and President of the Western Finance Association. In 2006, Dr. Senbet was inducted Fellow of Financial Management Association International for his career-long distinguished scholarship and professional service.
Interested Directors and Officers
James E. Davey (1964) Director since 2012, President and Chief Executive Officer since 2010
Mr. Davey serves as Executive Vice President of Hartford Life Insurance Company (“HLIC”) and The Hartford Financial Services Group, Inc. Additionally, Mr. Davey serves as Chairman of the Board, Manager and Senior Managing Director of Hartford Funds Distributors, LLC (“HFD”). He also currently serves as Director, Chairman of the Board, President and Senior Managing Director of Hartford Administrative Services Company (“HASCO”). Mr. Davey also serves as Manager, Chairman of the Board and Senior Managing Director for Hartford Funds Management Company, LLC (“HFMC”). Mr. Davey joined The Hartford in 2002.
Lowndes A. Smith (1939) Director since 1996 (HSF) and 2002 (HSF2), Co-Chairman of the Investment Committee since 2005
Mr. Smith served as Vice Chairman of The Hartford from February 1997 to January 2002, as President and Chief Executive Officer of Hartford Life, Inc. from February 1997 to January 2002, and as President and Chief Operating Officer of The Hartford Life Insurance Companies from January 1989 to January 2002. Mr. Smith serves as a Director of White Mountains Insurance Group Ltd. (October 2003 to current); One Beacon Insurance (October 2006 to current); Symetra Financial (August 2007 to current) and is a Managing Director of Whittington Gray Associates (January 2007 to current).
Other Officers
Mark A. Annoni (1964) Vice President, Controller and Treasurer since 2012
Mr. Annoni currently serves as the Assistant Vice President of HLIC (February 2004 to present).
| 47 |
| Hartford Total Return Bond HLS Fund |
| Directors and Officers (Unaudited) – (continued) |
Michael R. Dressen (1963) AML Compliance Officer since 2011
Mr. Dressen currently serves as Assistant Vice President of HLIC. He also serves as Chief Compliance Officer and AML Compliance Officer of HASCO and as AML Officer of HFD. Mr. Dressen has served in various positions within The Hartford and its subsidiaries in connection with the operation of the Hartford Funds.
Edward P. Macdonald (1967) Vice President, Secretary and Chief Legal Officer since 2005
Mr. Macdonald currently serves as Assistant Secretary, Executive Vice President and Deputy General Counsel of HFD, HASCO and HFMC. He also serves as Vice President of HLIC. Mr. Macdonald has served in various positions within The Hartford and its subsidiaries in connection with the operation of the Hartford Funds. Mr. Macdonald joined The Hartford in 2005.
Joseph G. Melcher (1973) Vice President and Chief Compliance Officer since 2013
Mr. Melcher currently serves as Executive Vice President of HASCO and HFD. Mr. Melcher also currently serves as Executive Vice President and Chief Compliance Officer of HFMC. Mr. Melcher has served in various positions within The Hartford and its subsidiaries in connection with the operation of the Hartford Funds since joining The Hartford in 2012. Prior to joining The Hartford, Mr. Melcher worked at Touchstone Investments, a member of the Western & Southern Financial Group, where he held the position of Vice President and Chief Compliance Officer from 2010 through 2012 and Assistant Vice President, Compliance from 2005 to 2010.
Vernon J. Meyer (1964) Vice President since 2006
Mr. Meyer currently serves as Senior Vice President of HLIC. He also currently serves as Managing Director and Chief Investment Officer of HFMC. Mr. Meyer has served in various positions within The Hartford and its subsidiaries in connection with the operation of the Hartford Funds. Mr. Meyer joined The Hartford in 2004.
Laura S. Quade (1969) Vice President since 2012
Ms. Quade currently serves as Vice President of HASCO and HFD. She is the Head of Operations of HASCO and also serves as Director, Enterprise Operations of HLIC. Ms. Quade has served in various positions within The Hartford and its subsidiaries in connection with the operation of the Hartford Funds.
Martin A. Swanson (1962) Vice President since 2010
Mr. Swanson currently serves as Vice President of HLIC. Mr. Swanson also serves as Managing Director, Chief Marketing Officer and Principal of HFD. Mr. Swanson has served in various positions within The Hartford and its subsidiaries in connection with the operation of the Hartford Funds.
HOW TO OBTAIN A COPY OF THE FUND’S PROXY VOTING POLICIES AND VOTING RECORDS (UNAUDITED)
A description of the policies and procedures that the Fund uses to determine how to vote proxies relating to portfolio securities and information about how the Fund voted proxies relating to portfolio securities during the most recent twelve-month period ended June 30 are available (1) without charge, upon request, by calling 800-862-6668 and (2) on the SEC’s website at http://www.sec.gov.
QUARTERLY PORTFOLIO HOLDINGS INFORMATION (UNAUDITED)
The Fund files a complete schedule of portfolio holdings with the SEC for the first and third quarters of each fiscal year on Form N-Q. The Fund’s Forms N-Q are available (1) without charge, upon request, by calling 800-862-6668 and (2) on the SEC’s website at http://www.sec.gov. The Form N-Q may be reviewed and copied at the SEC’s Public Reference Room in Washington, DC. Information on the operation of the Public Reference Room may be obtained by calling 1-800-SEC-0330.
| 48 |
| Hartford Total Return Bond HLS Fund |
| Expense Example (Unaudited) |
Your Fund's Expenses
As a shareholder of the Fund, you incur two types of costs: (1) transaction costs and (2) ongoing costs, including investment management fees, distribution and/or service (12b-1) fees, if any, and other fund expenses. This example is intended to help you understand your ongoing costs (in dollars) of investing in the Fund and to compare these costs with the ongoing costs of investing in other mutual funds. The example is based on an investment of $1,000 invested at the beginning of the period and held for the period of June 30, 2013 through December 31, 2013.
Actual Expenses
The first set of columns of the table below provides information about actual account values and actual expenses. You may use the information in this column, together with the amount you invested, to estimate the expenses that you paid over the period. Simply divide your account value by $1,000 (for example, an $8,600 account value divided by $1,000 = 8.6), then multiply the result by the number in the line under the heading entitled “Expenses Paid During Period” to estimate the expenses you paid on your account during this period.
Hypothetical Example for Comparison Purposes
The second set of columns of the table below provides information about hypothetical account values and hypothetical expenses based on the Fund’s actual expense ratio and an assumed rate of return of 5% per year before expenses, which is not the Fund’s actual return. The hypothetical account values and expenses may not be used to estimate the actual ending account balance or expenses you paid for the period. You may use this information to compare the ongoing costs of investing in the Fund and other funds. To do so, compare this 5% hypothetical example with the 5% hypothetical examples that appear in the shareholder reports of the other funds.
Please note that the expenses shown in the table are meant to highlight your ongoing costs only and do not reflect any transactional costs, such as sales charges (loads) and CDSC. Therefore, the second set of columns of the table is useful in comparing ongoing costs only, and will not help you determine the relative total costs of owning different funds. In addition, if these transactional costs were included, your costs would be higher. Expenses are equal to the Fund's annualized expense ratios multiplied by average account value over the period, multiplied by 184/365 (to reflect the one-half year period).
| Actual return | Hypothetical (5% return before expenses) | |||||||||||||||||||||||||||||||
| Beginning Account Value June 30, 2013 | Ending Account Value December 31, 2013 | Expenses paid during the period June 30, 2013 through December 31, 2013 | Beginning Account Value June 30, 2013 | Ending Account Value December 31, 2013 | Expenses paid during the period June 30, 2013 through December 31, 2013 | Annualized expense ratio | Days in the current 1/2 year | Days in the full year | ||||||||||||||||||||||||
| Class IA | $ | 1,000.00 | $ | 1,016.70 | $ | 2.55 | $ | 1,000.00 | $ | 1,022.68 | $ | 2.55 | 0.50 | % | 184 | 365 | ||||||||||||||||
| Class IB | $ | 1,000.00 | $ | 1,014.90 | $ | 3.82 | $ | 1,000.00 | $ | 1,021.42 | $ | 3.83 | 0.75 | % | 184 | 365 | ||||||||||||||||
| 49 |
| Hartford Total Return Bond HLS Fund |
| Approval of Investment Management and Investment Sub-Advisory Agreements (Unaudited) |
Section 15(c) of the Investment Company Act of 1940, as amended (the “1940 Act”), requires that each mutual fund’s board of directors, including a majority of those directors who are not “interested persons” of the mutual fund, as defined in the 1940 Act (the “Independent Directors”), annually review and consider the continuation of the mutual fund’s investment advisory and sub-advisory agreements. At its meeting held on August 6-7, 2013, the Board of Directors (the “Board”) of Hartford Series Fund, Inc., including each of the Independent Directors, unanimously voted to approve the continuation of the investment management agreement for Hartford Total Return Bond HLS Fund (the “Fund”) with Hartford Funds Management Company, LLC (“HFMC”) and the continuation of the investment sub-advisory agreement between HFMC and the Fund’s sub-adviser, Wellington Management Company, LLP (the “Sub-adviser,” and together with HFMC, the “Advisers”) (collectively, the “Agreements”).
In the months preceding the August 6-7, 2013 meeting, the Board requested, received, and reviewed written responses from the Advisers to questions posed to them on behalf of the Independent Directors and supporting materials relating to those questions and responses. The Board considered information furnished to the Board at its meetings throughout the year, as well as information specifically prepared in connection with the annual approval of the Agreements at the Board’s meetings held on June 18-19, 2013 and August 6-7, 2013. Information provided to the Board at its meetings throughout the year included, among other things, reports on Fund performance, legal and compliance matters, sales and marketing activity, shareholder services, and the other services provided to the Fund by the Advisers and their affiliates. The Board also received in-person presentations by Fund officers and representatives of HFMC at the Board’s meetings on June 18-19, 2013 and August 6-7, 2013 concerning the Agreements.
The Independent Directors, advised by independent legal counsel, engaged two service providers to assist them with evaluating the Agreements with respect to the Fund. Lipper Inc. (“Lipper”), an independent provider of investment company data, was retained to provide the Board with reports on how the Fund’s contractual management fees, actual management fees, other non-management fees, overall expense ratios and investment performance compared to those of mutual funds with similar investment objectives. The Independent Directors also engaged an independent financial services consulting firm (the “Consultant”) to assist them in evaluating the Fund’s management fees, sub-advisory fees, other non-management fees, overall expense ratios and investment performance. In addition, the Consultant reviewed the profitability calculations utilized by HFMC in connection with the continuation of the investment management agreement.
In determining whether to continue the Agreements for the Fund, the members of the Board reviewed and evaluated information and factors they believed to be relevant and appropriate in light of the information that the Board deemed necessary and appropriate through the exercise of its reasonable business judgment. While individual members of the Board may have weighed certain factors differently, the Board’s determination to continue the Agreements was based on a comprehensive consideration of all information provided to the Board throughout the year and specifically with respect to the continuation of the Agreements. A more detailed discussion of the factors the Board considered with respect to its approval of the Agreements is provided below.
Nature, Extent, and Quality of Services Provided by the Advisers
The Board requested and considered information concerning the nature, extent, and quality of the services provided to the Fund by the Advisers. The Board considered, among other things, the terms of the Agreements and the range of services provided by the Advisers. The Board considered the Advisers’ professional personnel who provide services to the Fund, including each Adviser’s ability and experience in attracting and retaining qualified personnel to service the Fund. The Board considered each Adviser’s reputation and overall financial strength, as well as its willingness to consider and implement organizational and operational changes designed to improve services to the Fund. In addition, the Board considered the quality of each Adviser’s communications with the Board and responsiveness to Board inquiries.
The Board also requested and evaluated information concerning each Adviser’s regulatory and compliance environment. In this regard, the Board requested and reviewed information on each Adviser’s compliance policies and procedures, compliance history, and a report from the Fund’s Chief Compliance Officer on each Adviser’s compliance with applicable laws and regulations, including responses to regulatory developments and compliance issues raised by regulators. The Board also noted the Advisers’ support of the Fund’s compliance control structure, particularly the resources devoted by the Advisers in support of the Fund’s obligations pursuant to Rule 38a-1 under the 1940 Act.
With respect to HFMC, the Board noted that under the Agreements, HFMC is responsible for the management of the Fund, including overseeing fund operations and service providers, as well as investment advisory services in connection with selecting,
| 50 |
monitoring and supervising the Sub-adviser. The Board considered HFMC’s ongoing monitoring of people, process and performance, including its quarterly reviews of each of the Hartford Funds, semi-annual meetings with the leaders of each Fund’s portfolio management team, and oversight of the Funds’ approximately 40 portfolio managers. The Board recognized that HFMC has demonstrated a record of making changes to the management and/or strategies of the Funds when warranted. The Board considered HFMC’s oversight of the Sub-adviser’s investment approach and results, process for monitoring best execution of portfolio trades by the Sub-adviser, and approach to risk management with respect to the Fund and the service providers to the Fund. The Board also considered HFMC’s oversight of compliance with the Fund’s objective and policies as well as with applicable laws and regulations, noting that regulatory and other developments had over time led to an increase in the scope of HFMC’s services in this regard.
In addition, the Board considered HFMC’s ongoing commitment to review and rationalize the Hartford Funds product line-up and the expenses that HFMC had incurred in connection with fund combinations in recent years. The Board considered that HFMC or its affiliates are responsible for providing the Fund’s officers. The Board also noted that Hartford Life Insurance Company (“HLIC”) provides administrative services to the Fund. The Board considered its experiences with HFMC and HLIC with respect to each of these services.
With respect to the Sub-adviser, who provides day-to-day portfolio management services, the Board considered the quality of the Fund’s portfolio managers, the Sub-adviser’s other investment personnel, its investment philosophy and process, investment research capabilities and resources, performance record, trade execution capabilities and experience. The Board considered the experience of the Fund’s portfolio managers, the number of accounts managed by the portfolio managers, and the Sub-adviser’s method for compensating the portfolio managers.
Based on these considerations, the Board concluded that it was satisfied with the nature, extent and quality of the services provided to the Fund by HFMC and the Sub-adviser.
Performance of the Fund and the Advisers
The Board considered the investment performance of the Fund. In this regard, the Board reviewed the performance of the Fund over different time periods presented in the materials and evaluated HFMC’s analysis of the Fund’s performance for these time periods. The Board considered information and materials provided to the Board by the Advisers concerning Fund performance, as well as information from Lipper comparing the investment performance of the Fund to an appropriate benchmark and universe of peer funds. The Board noted that the Fund’s performance was in the 2nd quintile of its performance universe for the 1- and 3-year periods and the 4th quintile for the 5-year period. The Board also noted that the Fund’s performance was above its benchmark for the 1-, 3- and 5-year periods. The Board noted that certain changes had recently been made to the Fund’s principal investment strategy.
The Board considered the detailed investment analytics reports provided by Hartford Funds’ Investment Advisory Group throughout the year. These reports include, among other things, information on the Fund’s gross and net returns, the Fund’s investment performance relative to an appropriate benchmark and peer group, various statistics concerning the Fund’s portfolio, and a narrative summary of various factors affecting Fund performance. The Board considered the Advisers’ cooperation with the Investment Committee, which assists the Board in evaluating the performance of the Fund at periodic meetings throughout the year. The Board also considered the analysis provided by the Consultant relating to the Fund’s performance track record.
In light of all the considerations noted above, the Board concluded that it had continued confidence in HFMC’s and the Sub-adviser’s overall capabilities to manage the Fund.
Costs of the Services and Profitability of the Advisers
The Board reviewed information regarding HFMC’s cost to provide investment management and related services to the Fund and HFMC’s profitability, both overall and for the Fund, on a pre-tax basis without regard to distribution expenses. The Board also requested and reviewed information about the profitability to HFMC and its affiliates from all services provided to the Fund and all aspects of their relationship with the Fund. The Board also requested and received information relating to the operations and profitability of the Sub-adviser.
| 51 |
| Hartford Total Return Bond HLS Fund |
| Approval of Investment Management and Investment Sub-Advisory Agreements (Unaudited) – (continued) |
The Board considered the Consultant’s review of the profitability calculations utilized by HFMC in connection with the continuation of the investment management agreement, noting the Consultant’s view that Hartford Funds’ process for calculating and reporting Fund profitability is reasonable. In this regard, the Board noted that the Consultant had previously performed a full review of this process and reported that such process is sound and well within common industry practice.
Based on these considerations, the Board concluded that the profits anticipated to be realized by the Advisers and their affiliates from their relationships with the Fund would not be excessive.
Comparison of Fees and Services Provided by the Advisers
The Board considered comparative information with respect to the management fees to be paid by the Fund to HFMC and the total expense ratios of the Fund. The Board also considered comparative information with respect to the sub-advisory fees to be paid by HFMC to the Sub-adviser. In this regard, the Board requested and reviewed information from HFMC and the Sub-adviser relating to the management and sub-advisory fees, including the sub-advisory fee schedule for the Fund, and total operating expenses for the Fund. The Board considered that the management fee for the Fund includes the fee paid to HLIC for providing certain administrative services to the Fund. With respect to the sub-advisory fee schedule, the Board considered representations from HFMC and the Sub-adviser that the Sub-adviser’s fees were negotiated at arm’s length. The Board also reviewed information from Lipper comparing the Fund’s contractual management fees, actual management fees and overall expense ratios relative to a group of funds selected by Lipper, in consultation with the Consultant, and a broader universe of funds selected by Lipper. The Board noted that the Fund’s contractual management fee, actual management fee and total expenses (less 12b-1 and shareholder service fees) were in the 2nd quintile of its expense group.
While the Board recognized that comparisons between the Fund and peer funds are imprecise, given the differing service levels and characteristics of mutual funds and the different business models and cost structures of the Advisers, the comparative information provided by Lipper assisted the Board in evaluating the reasonableness of the Fund’s management and sub-advisory fees and total operating expenses. In addition, the Board considered the analysis and recommendations of the Consultant relating to the Fund’s management and sub-advisory fees and total operating expenses.
Based on these considerations, the Board concluded that the Fund’s fees and total operating expenses, in conjunction with the information about quality of services, profitability, economies of scale, and other matters discussed, were reasonable in light of the services provided.
Economies of Scale
The Board requested and considered information regarding the Advisers’ realization of economies of scale with respect to the Fund and whether the fee levels reflect these economies of scale for the benefit of the Fund’s shareholders. The Board reviewed the breakpoints in the management fee schedule for the Fund, which reduce fee rates as Fund assets grow over time. The Board recognized that a fund with assets beyond the last breakpoint level will continue to benefit from economies of scale because additional assets are charged the lowest breakpoint fee resulting in lower overall effective management fee rates. The Board also recognized that a fee schedule that reaches a lower breakpoint quickly provides shareholders with the benefit of anticipated or potential economies of scale. The Board noted the effect of the sale and run-off of the variable annuity business on the HLS Funds.
The Board reviewed and evaluated materials from Lipper showing how management fee schedules of peer funds reflect economies of scale for the benefit of shareholders as a peer fund’s assets hypothetically increase over time. Based on information provided by HFMC, Lipper, and the Consultant, the Board recognized that there is no uniform methodology for establishing breakpoints or uniform pattern in asset levels that trigger breakpoints or the amounts of breakpoints triggered.
After considering all of the information available to it, the Board concluded that it was satisfied with the extent to which economies of scale would be shared for the benefit of the Fund’s shareholders based on currently available information and the effective advisory fees and expense ratios for the Fund at its current and reasonably anticipated asset levels. The Board noted, however, that it would continue to monitor future growth in Fund assets and the appropriateness of additional breakpoints.
| 52 |
Other Benefits
The Board considered other benefits to the Advisers and their affiliates from their relationships with the Fund, including the role of the Fund in supporting the variable life insurance and variable annuity products offered by The Hartford.
The Board reviewed information noting that HLIC, an affiliate of HFMC, receives fees for providing certain administrative services to the Fund and that HFMC receives fees for fund accounting and related services from the Fund. The Board considered information on profits to HLIC and HFMC for such services. The Board also considered that Hartford Administrative Services Company (“HASCO”), the Fund’s transfer agent and an affiliate of HFMC, receives transfer agency compensation from the Fund, and the Board reviewed information on the profitability of the Fund’s transfer agency function to HASCO. The Board considered information provided by HASCO indicating that the transfer agent fees charged by HASCO to the Fund were fair and reasonable based on publicly available information.
The Board also considered that Hartford Funds Distributors, LLC (“HFD”), an affiliate of HFMC, serves as principal underwriter of the Fund. As principal underwriter, HFD receives 12b-1 fees from the Fund. The Board also noted that certain affiliates of HFD distribute shares of the Fund and receive compensation in that connection.
The Board considered the benefits, if any, to the Sub-adviser from any use of the Fund’s brokerage commissions to obtain soft dollar research, and representations from HFMC and the Sub-adviser that the Sub-adviser would not make any revenue-sharing payments or any other type of distribution payments to HFMC or its affiliates.
The Board considered the benefits to shareholders of being part of the Hartford Funds family of funds. The Board considered HFMC’s efforts to provide investors in the family with a broad range of investment styles and asset classes.
* * * *
Based upon its review of these various factors, among others, the Board concluded that it is in the best interests of the Fund and its shareholders for the Board to approve the Agreements for an additional year. In reaching this decision, the Board did not assign relative weights to the factors discussed above or deem any one or group of them to be controlling in and of themselves. In connection with their deliberations, the Independent Directors met separately in executive session on several occasions, with independent legal counsel and the Consultant, to review the relevant materials and consider their responsibilities under relevant laws and regulations.
| 53 |
| Hartford Total Return Bond HLS Fund |
| Main Risks (Unaudited) |
The main risks of investing in the Fund are described below.
Market, Selection, and Strategy Risk: The Fund’s share price may fluctuate due to market risk and/or security selections that may underperform the market or relevant benchmarks. If the sub-adviser’s investment strategy does not perform as expected, the Fund could underperform its peers or lose money. There is no guarantee the Fund will achieve its stated objective.
Fixed Income Risk: The Fund is subject to interest rate risk (the risk that the value of an investment decreases when interest rates rise) and credit risk (the risk that the issuing company of a security is unable to pay interest and principal when due) and call risk (the risk that an investment may be redeemed early). These risks also apply to the Fund’s investments in U.S. government securities, which may not be guaranteed by the U.S. government.
Mortgage-Backed Securities Risk: Mortgage-backed securities are subject to interest rate risk, credit risk, prepayment risk, extension risk, and the risk that an investment’s value may be reduced or become worthless if it receives interest or income payments only after other investments in the same pool.
Foreign Investment and Emerging Markets Risk: Foreign investments can be riskier than U.S. investments. Potential risks include currency risk that may result from unfavorable exchange rates, liquidity risk if decreased demand for a security makes it difficult to sell at the desired price, and risks that stem from substantially lower trading volume on foreign markets. These risks are generally greater for investments in emerging markets, which are also subject to greater price volatility, and custodial and regulatory risks.
Derivatives Risk: Investments in derivatives can be volatile. Potential risks include currency risk, leverage risk (the risk that small market movements may result in large changes in the value of an investment), liquidity risk, index risk, pricing risk, and counterparty risk (the risk that the counterparty may be unwilling or unable to honor its obligations).
Active Trading Risk: Actively trading investments may result in higher costs (thus affecting performance).
| 54 |
THIS PRIVACY POLICY IS NOT PART OF THIS REPORT
Privacy Policy and Practices of The Hartford Financial Services Group, Inc. and its Affiliates
(herein called “we, our, and us”)
This Privacy Policy applies to our United States Operations
We value your trust. We are committed to the responsible: a) management; b) use; and c) protection; of Personal Information. This notice describes how we collect, disclose, and protect Personal Information.
We collect Personal Information to: a) service your Transactions with us; and b) support our business functions.
We may obtain Personal Information from: a) You; b) your Transactions with us; and c) third parties such as a consumer-reporting agency.
Based on the type of product or service You apply for or get from us, Personal Information such as: a) your name; b) your address; c) your income; d) your payment; or e) your credit history; may be gathered from sources such as applications, Transactions, and consumer reports.
To serve You and service our business, we may share certain Personal Information. We will share Personal Information, only as allowed by law, with affiliates such as: a) our insurance companies; b) our employee agents; c) our brokerage firms; and d) our administrators.
As allowed by law, we may share Personal Financial Information with our affiliates to: a) market our products; or b) market our services; to You without providing You with an option to prevent these disclosures. | We may also share Personal Information, only as allowed by law, with unaffiliated third parties including:
When allowed by law, we may share certain Personal Financial Information with other unaffiliated third parties who assist us by performing services or functions such as:
We, and third parties we partner with, may track some of the pages You visit through the use of: a) cookies; b) pixel tagging; or c) other technologies; and currently do not process or comply with any web browser’s “do not track” signal or similar mechanism that indicates a request to disable online tracking of individual users who visit our websites or use our services.
We will not sell or share your Personal Financial Information with anyone for purposes unrelated to our business functions without offering You the opportunity to:
We only disclose Personal Health Information with:
Our employees have access to Personal Information in the course of doing their jobs, such as: |
We use manual and electronic security procedures to maintain: a) the confidentiality; and b) the integrity of; Personal Information that we have. We use these procedures to guard against unauthorized access.
Some techniques we use to protect Personal Information include: a) secured files; b) user authentication; c) encryption; d) firewall technology; and e) the use of detection software.
We are responsible for and must: a) identify information to be protected; b) provide an adequate level of protection for that data; c) grant access to protected data only to those people who must use it in the performance of their job-related duties. Employees who violate our Privacy Policy will be subject to discipline, which may include ending their employment with us.
At the start of our business relationship, we will give You a copy of our current Privacy Policy.
We will also give You a copy of our current Privacy Policy once a year if You maintain a continuing business relationship with us.
We will continue to follow our Privacy Policy regarding Personal Information even when a business relationship no longer exists between us. | As used in this Privacy Notice:
Application means your request for our product or service.
Personal Financial Information means financial information such as:
Personal Health Information means health information such as:
Personal Information means information that identifies You personally and is not otherwise available to the public. It includes:
Transaction means your business dealings with us, such as:
You means an individual who has given us Personal Information in conjunction with: |
This Privacy Policy is being provided on behalf of the following affiliates of The Hartford Financial Services Group, Inc.:
1stAGChoice, Inc.; Access CoverageCorp, Inc.; Access CoverageCorp Technologies, Inc.; American Maturity Life Insurance Company; Archway 60 R, LLC; Business Management Group, Inc.; Catalyst360, LLC; Champlain Life Reinsurance Company; DMS R, LLC; Eloy R, LLC; Ersatz Corporation; First State Insurance Company; Hartford Accident and Indemnity Company; Hartford Administrative Services Company; Hartford Casualty General Agency, Inc.; Hartford Casualty Insurance Company; Hartford-Comprehensive Employee Benefit Service Company; Hartford Equity Sales Company, Inc.; Hartford Fire General Agency, Inc.; Hartford Fire Insurance Company; Hartford Funds Management Company, LLC; Hartford Funds Management Group, Inc.; Hartford HLS Series Fund II, Inc.; Hartford Insurance Company of Illinois; Hartford Insurance Company of the Midwest; Hartford Insurance Company of the Southeast; Hartford Integrated Technologies, Inc.; Hartford International Life Reassurance Corporation; Hartford Funds Distributors, LLC; Hartford Investment Management Company; Hartford Life and Accident Insurance Company; Hartford Life and Annuity Insurance Company; Hartford Life Insurance Company; Hartford Life Private Placement, LLC; Hartford Lloyd’s Corporation; Hartford Lloyd’s Insurance Company; Hartford Mezzanine Investors I, LLC; Hartford Residual Market, L.C.C.; Hartford Retirement Services, LLC; Hartford Securities Distribution Company, Inc.; Hartford Series Fund, Inc.; Hartford Specialty Insurance Services of Texas, LLC; Hartford Strategic Investments, LLC; Hartford Underwriters Insurance Company; Hartford Technology Services Company, L.L.C.; Hartford of Texas General Agency, Inc.; Hartford Underwriters General Agency, Inc.; HARTRE Company, L.C.C.; HL Investment Advisors, LLC; HLA LLC; Horizon Management Group, LLC; HRA Brokerage Services, Inc.; Lanidex Class B, LLC; M-CAP Insurance Agency, LLC; New England Insurance Company; New England Reinsurance Corporation; Nutmeg Insurance Agency, Inc.; Nutmeg Insurance Company; Pacific Insurance Company, Limited; Planco, LLC: Property and Casualty Insurance Company of Hartford; Revere R, LLC; RVR R, LLC; Sentinel Insurance Company, Ltd.; Sunstone R, LLC; Symphony R, LLC; The Evergreen Group Incorporated; The Hartford Alternative Strategies Fund; The Hartford Mutual Funds, Inc.; The Hartford Mutual Funds II, Inc.; Trumbull Flood Management, L.L.C.; Trumbull Insurance Company; Twin City Fire Insurance Company; White River Life Reinsurance Company.
HPP Revised December 2013
HARTFORD HLS FUNDS
c/o The Hartford Wealth Management - Global Annuities
P.O. Box 14293
Lexington, KY 40512-4293
HARTFORDFUNDS
hartfordfunds.com
Hartford Series Fund, Inc. is underwritten and distributed by Hartford Funds Distributors, LLC.
Hartford Series Fund, Inc. inception dates range from 1977 to date. Hartford Series Fund, Inc. is not a subsidiary of The Hartford Financial Services Group, Inc. ("The Hartford") but is underwritten, distributed by and advised by subsidiaries of The Hartford. Investments in Hartford Series Fund, Inc. are not guaranteed by The Hartford or any other entity.
This report is submitted for the general information of the shareholders of the Funds. It is not authorized for distribution unless preceded or accompanied by a current prospectus for the Funds.
Investors should carefully consider the investment objectives, risks, charges, and expenses of Hartford Funds before investing. This and other information can be found in the prospectus and summary prospectus, which can be obtained by calling 888-843-7824 (retail) or 877-836-5854 (institutional). Investors should read them carefully before they invest.
HLSAR-TRB13 2-14 113555-2 Printed in U.S.A ©2013 The Hartford, Hartford, CT 06115
HARTFORDFUNDS
| HARTFORD
ULTRASHORT BOND HLS FUND
2013 Annual Report
*Prior to October 21, 2013, Hartford Ultrashort Bond HLS Fund was known as Hartford Money Market HLS Fund
|
A MESSAGE FROM THE PRESIDENT
Dear Fellow Shareholders:
Thank you for investing in Hartford HLS Funds.
Market Review
U.S. equities (as represented by the S&P 500 Index) generated their strongest year since 1997 in 2013, rising 32.39% for the year. During the fourth quarter, equities rose without looking back, pushing the S&P 500 Index and the Dow Jones Industrial Average to new all-time highs. Despite previously cheering delays to quantitative-easing tapering, the stock market received an additional boost at the end of the year following the U.S. Federal Reserve’s (Fed) announcement of a $10-billion-a-month reduction in bond purchases beginning in January.
The Fed’s decision to begin tapering its bond purchases is generally considered a vote of confidence in the recovering U.S. economy. Consumer spending has stabilized, the housing market is showing steady improvement, the unemployment rate is slowly declining and economic growth clocked in at a healthy 4.1% in the third quarter. Equities have also recovered since the market low in March 2009: The S&P 500 Index has gained 173% from the market low through December 31, 2013.
Signs of improvement are also visible outside the U.S. Europe appears to have begun its own economic recovery, and emerging markets have reversed their recent lackluster performance. Fiscal policy continues to wield significant influence in today’s economy and central banks across the globe are maintaining their accommodative stances, including the appointment of Janet Yellen, who is widely expected to continue current monetary policies, to succeed Ben Bernanke as U.S. Federal Reserve chairman.
It’s important to stay abreast of domestic and international economic developments while balancing your individual investment goals. Meeting with your financial advisor on a regular basis to examine your current investment strategy can help you determine whether you are on the right track:
| • | Is your portfolio fully diversified with an appropriate mix of stocks and bonds? |
| • | Is your portfolio incorporating both domestic and international holdings to take advantage of the global economic recovery? |
| • | Are your investments still in line with your risk tolerance and investment time horizon? |
Your financial advisor can help you choose options within our fund family to navigate today’s markets with confidence.
Thank you again for investing with Hartford HLS Funds.
James Davey
President
Hartford HLS Funds
1The S&P 500 Index is a market capitalization-weighted price index composed of 500 widely held common stocks.
2The Dow Jones Industrial Average is an unmanaged, price-weighted index of 30 of the largest, most widely held stocks traded on the New York Stock Exchange.
Hartford Ultrashort Bond HLS Fund
(formerly Hartford Money Market HLS Fund)
Table of Contents
This report is prepared for the general information of contract owners and qualified retirement plan participants. It is not an offer of contracts or of qualified retirement plans. It should not be used in connection with any offer, except in conjunction with the appropriate product prospectus which contains all pertinent information including the applicable sales, administrative and other charges.
The views expressed in the Fund’s Manager Discussion under ‘‘Why did the Fund perform this way?’’ and ‘‘What is the outlook?’’ are views of the Fund’s sub-adviser and portfolio management team through the end of the period and are subject to change based on market and other conditions. The Fund’s Manager Discussion is for informational purposes only and does not represent an offer, recommendation or solicitation to buy, hold or sell any security. The specific securities identified and described, if any, do not represent all of the securities purchased or sold and you should not assume that investments in the securities identified and discussed will be profitable.
Hartford Ultrashort Bond HLS Fund inception 08/31/1977
(formerly Hartford Money Market HLS Fund)
(sub-advised by Wellington Management Company, LLP)
| Investment objective – Seeks total return and income consistent with preserving capital and maintaining liquidity. |
Performance Overview 10/21/13 - 12/31/13

The chart above represents the hypothetical growth of a $10,000 investment in Class IA. Growth results in classes other than Class IA will vary from what is seen above due to differences in the expenses charged to those share classes.
Average Annual Total Returns (as of 12/31/13)
| Cumulative Return* | ||||
| Ultrashort Bond IA | 0.00% | |||
| Ultrashort Bond IB | -0.10% | |||
| Barclays 9-12 Month U.S. Treasury Index | 0.04% | |||
| * | On October 21, 2013, the Fund converted from a money market fund to an ultrashort bond fund. Total returns shown are from conversion date (October 21, 2013) to December 31, 2013. |
PERFORMANCE DATA QUOTED REPRESENTS PAST PERFORMANCE AND DOES NOT GUARANTEE FUTURE RESULTS. The investment return and principal value of the investment will fluctuate so that investors’ shares, when redeemed, may be worth more or less than their original cost. Current performance may be lower or higher than the performance data quoted. To obtain performance data current to the most recent month-end, please visit our website at www.hartfordfunds.com.
Total returns presented above were calculated using the Fund’s net asset value available to shareholders for sale or redemption of Fund shares on December 31, 2013, which may exclude investment transactions as of this date. All share class returns assume the reinvestment of all distributions at net asset value and the deduction of all fund expenses.
Prior to October 21, 2013, the Fund was managed as a money market fund. Accordingly, performance of the Fund prior to October 21, 2013 is not shown. Past performance information for when the Fund was managed as a money market fund is available upon request by calling 1-800-862-6668.
Barclays 9-12 Month U.S. Treasury Index measures the performance of U.S. Treasury securities that have a remaining maturity between one and twelve months.
You cannot invest directly in an index.
As of the Fund's current prospectus dated October 21, 2013, the total annual operating expense ratios for Class IA and Class IB were 0.42% and 0.67%, respectively. Actual expenses may be higher. Please see the accompanying Financial Highlights for expense ratios for the year ended December 31, 2013.
The chart and table do not reflect the deductions of taxes, sales charges or other fees which may be applied at the variable life insurance, variable annuity or qualified retirement plan product level. Any such additional sales charges or other fees or expenses would lower the contract’s or plan’s performance.
All investments are subject to risk including the possible loss of principal. For a discussion of the Fund’s risks, please see the Main Risks section of this report. For more detailed information on the risks associated with an investment in the Fund, please see the prospectus.
| 2 |
| Hartford Ultrashort Bond HLS Fund (formerly Hartford Money Market HLS Fund) |
| Manager Discussion |
| December 31, 2013 (Unaudited) |
| Portfolio Manager |
| Timothy E. Smith* |
| Senior Vice President and Fixed Income Portfolio Manager |
| * Appointed as a Portfolio Manager for the Fund as of October 21, 2013. As of the same date, Robert Crusha and Shannon Carbray no longer served as Portfolio Managers for the Fund. |
How did the Fund perform?
The Class IA shares of the Hartford Ultrashort Bond HLS Fund (formerly Hartford Money Market HLS Fund) returned 0.00% for the period October 21, 2013 (the date of the Fund’s conversion to an ultrashort bond fund) through December 31, 2013, underperforming the Fund’s benchmark, the Barclays 9-12 Month Treasury Index, which returned 0.04% for the same period. The Fund outperformed the -0.20% average return of the Variable Products-Underlying Funds Lipper Short-Intermediate Investment Grade Debt Funds peer group, a group of funds that invest primarily in investment grade issues with dollar-weighted average maturities of one to five years.
Why did the Fund perform this way?
Global central banks’ unconventional policy measures continued to be one of the biggest influences on the market during the year. Central bank easing and signs of gradual global economic recovery imparted a positive tone to financial markets early in the year. However, concerns about a possible pull back in U.S. Federal Reserve (Fed) stimulus were felt in the second quarter, triggered by Fed Chairman Ben Bernanke’s unexpectedly hawkish tone. Fed officials signaled a readiness to begin tapering the Fed’s asset purchases under quantitative easing (QE) by September and to end purchases by mid-2014 if the economy strengthened sufficiently. The Fed’s earlier-than-expected plan to taper asset purchases sent yields sharply higher and credit spreads gapped out in sympathy. Meanwhile, other major central banks, including the Bank of Japan, European Central Bank, and Bank of England, reiterated their commitment to easy monetary policy for as long it was needed.
Signs of economic momentum and speculation over Fed tapering weighed on U.S. Treasury prices during the year; for the full year 2013, 5-, 10-, and 30-year Treasury yields rose 1.02%, 1.27%, and 1.02%, respectively. Many of the major fixed income sectors, with the exception of high yield and bank loans, posted negative absolute returns due to the rise in yields. However, most sectors outperformed Treasuries on a duration-adjusted basis as credit spreads tightened.
The Fund modestly outperformed the benchmark for the period October 21, 2013 (when the Fund converted from a money market fund) through December 31, 2013 on a gross-of-fee basis. Allocations to investment grade credit and asset backed securities contributed to relative performance during the period. Most sectors outperformed Treasuries on a duration-adjusted basis as credit spreads tightened.
Yield curve and duration positioning slightly detracted from relative returns during the period.
We use Treasury futures and interest rate swaps to manage duration and yield curve exposure. The portfolio’s slightly long duration bias, concentrated in the 2- and 3-year sector of the curve, contributed to underperformance during a rising rate and steepening curve environment.
Note that derivatives are not used in a significant manner in this Fund and did not have a material impact on performance during the period.
What is the outlook?
In the U.S., we believe there will be positive gross domestic product (GDP) growth of about 3% as the fiscal drag reverses. In our opinion, we estimate that fiscal policies reduced GDP by 1.5% in 2013 (and some of these effects may linger in early 2014), but importantly, state and local governments now appear to be moving back to expansionary mode. We believe the employment picture continues to improve and housing should remain constructive. Housing paused recently in part due to the uptick in mortgage rates but we expect it to reaccelerate in the spring selling season, in our view. While higher rates can be a hurdle to further recovery, they are still low historically and we believe early signs of wage growth should boost consumer confidence. The Fed is expected to remain accommodative throughout the year and we view the Fed’s decision to start unwinding quantitative easing as a healthy sign for the economy. We have been encouraged by recent data out of Europe that suggests Europe has stabilized. We believe the euro area economy could expand by 1 to 1.5% in 2014. We are watching France as an ongoing risk. France is Europe’s second largest economy and government policies have so far failed to revive growth as GDP is still contracting. Data out of Japan has been positive as Prime Minister Shinzo Abe’s bid to revitalize the economy appears to be rekindling growth after decades of economic malaise.
| 3 |
| Hartford Ultrashort Bond HLS Fund (formerly Hartford Money Market HLS Fund) |
| Manager Discussion – (continued) |
| December 31, 2013 (Unaudited) |
At the end of the period our duration positioning was in line with the benchmark’s as we believe short-term rates will remain range bound in the near term. We continue to be positioned with out-of-benchmark allocations to investment grade corporates and asset backed securities (ABS). Within investment grade corporates, we believe U.S. financials will perform well, as financial companies have de-leveraged significantly. Within ABS, we consider auto, credit card and equipment issuers attractive, as consumer fundamentals are supported by improving labor markets.
Diversification by Security Type
as of December 31, 2013
| Category | Percentage of Net Assets | |||
| Fixed Income Securities | ||||
| Asset & Commercial Mortgage Backed Securities | 27.5 | % | ||
| Certificates of Deposit | 0.6 | |||
| Corporate Bonds | 39.1 | |||
| Municipal Bonds | 0.1 | |||
| U.S. Government Agencies | 20.7 | |||
| U.S. Government Securities | 0.4 | |||
| Total | 88.4 | % | ||
| Short-Term Investments | 11.7 | % | ||
| Other Assets and Liabilities | (0.1 | ) | ||
| Total | 100.0 | % | ||
Credit Exposure
as of December 31, 2013
| Credit Rating * | Percentage of Net Assets | |||
| Aaa / AAA | 27.6 | % | ||
| Aa / AA | 27.4 | |||
| A | 18.7 | |||
| Baa / BBB | 13.4 | |||
| Not Rated | 1.3 | |||
| Non-Debt Securities and Other Short-Term Instruments | 11.7 | |||
| Other Assets and Liabilities | (0.1 | ) | ||
| Total | 100.0 | % | ||
| * | Credit exposure is the long-term credit ratings for the Fund's holdings, as of the date noted, as provided by Standard and Poor's (S&P) or Moody's Investors Service and typically range from AAA/Aaa (highest) to C/D (lowest). If Moody's and S&P assign different ratings, the lower rating is used. Fixed income securities that are not rated by either agency are listed as "Not Rated." Ratings do not apply to the Fund itself or to Fund shares. Ratings may change. |
| 4 |
| Hartford Ultrashort Bond HLS Fund (formerly Hartford Money Market HLS Fund) |
| Schedule of Investments |
| December 31, 2013 |
| (000’s Omitted) |
| Shares or Principal Amount | Market Value ╪ | |||||||
| ASSET & COMMERCIAL MORTGAGE BACKED SECURITIES - 27.5% | ||||||||
| Finance and Insurance - 26.0% | ||||||||
| Captive Auto Finance - 12.9% | ||||||||
| Ally Automotive Receivables Trust | ||||||||
| $ | 5,285 | 0.40%, 07/15/2016 Δ | $ | 5,285 | ||||
| 6,539 | 0.52%, 05/20/2015 | 6,538 | ||||||
| 4,395 | 0.63%, 05/15/2017 | 4,396 | ||||||
| 6,000 | 0.70%, 12/21/2015 | 6,007 | ||||||
| Ally Master Owner Trust | ||||||||
| 7,995 | 1.54%, 09/15/2016 | 8,046 | ||||||
| AmeriCredit Automobile Receivables Trust | ||||||||
| 1,975 | 0.55%, 03/08/2017 Δ | 1,976 | ||||||
| BMW Vehicle Owner Trust | ||||||||
| 2,405 | 0.41%, 02/25/2016 | 2,405 | ||||||
| Capital Automotive Receivables Asset Trust | ||||||||
| 3,910 | 0.55%, 03/21/2016 Δ | 3,911 | ||||||
| Carmax Automotive Owner Trust | ||||||||
| 4,665 | 0.52%, 11/15/2016 | 4,666 | ||||||
| Credit Acceptance Automotive Loan Trust | ||||||||
| 1,985 | 1.50%, 04/15/2021 ■ | 1,985 | ||||||
| Ford Credit Floorplan Master Owner Trust | ||||||||
| 7,000 | 0.74%, 09/15/2016 | 7,009 | ||||||
| Honda Automotive Receivables Owner Trust | ||||||||
| 5,990 | 0.45%, 04/18/2016 | 5,990 | ||||||
| 7,000 | 0.70%, 02/16/2016 | 7,014 | ||||||
| Huntington Automotive Trust | ||||||||
| 7,127 | 0.81%, 09/15/2016 | 7,145 | ||||||
| Hyundai Automotive Lease Securitization Trust | ||||||||
| 7,000 | 0.92%, 08/17/2015 ■ | 7,015 | ||||||
| M&T Bank Automotive Receivables Trust | ||||||||
| 6,535 | 1.06%, 11/15/2017 ■ | 6,573 | ||||||
| Mercedes-Benz Automotive Lease Trust | ||||||||
| 6,635 | 0.59%, 02/15/2016 | 6,639 | ||||||
| 3,980 | 0.61%, 12/17/2018 | 3,976 | ||||||
| 3,445 | 0.62%, 07/15/2016 | 3,442 | ||||||
| Nissan Automotive Lease Trust | ||||||||
| 2,450 | 0.40%, 06/15/2016 | 2,449 | ||||||
| 1,370 | 0.44%, 01/15/2016 Δ | 1,370 | ||||||
| 2,890 | 0.61%, 09/15/2015 | 2,889 | ||||||
| 925 | 0.75%, 06/15/2016 | 925 | ||||||
| 6,281 | 0.98%, 05/15/2015 | 6,289 | ||||||
| Penarth Master Issuer | ||||||||
| 4,450 | 0.55%, 11/18/2017 Δ | 4,450 | ||||||
| Porsche Innovative Lease Owner Trust | ||||||||
| 3,250 | 0.54%, 01/22/2016 ■ | 3,250 | ||||||
| Santander Drive Automotive Receivables Trust | ||||||||
| 3,730 | 0.55%, 04/17/2017 Δ | 3,732 | ||||||
| 6,500 | 1.04%, 08/15/2016 | 6,514 | ||||||
| 7,500 | 2.39%, 06/15/2017 ■ | 7,557 | ||||||
| Volkswagen Automotive Loan Enhanced Trust | ||||||||
| 5,105 | 0.42%, 06/20/2015 | 5,104 | ||||||
| Volvo Financial Equipment LLC | ||||||||
| 1,257 | 0.91%, 08/17/2015 ■ | 1,259 | ||||||
| World Omni Automotive Receivables Trust | ||||||||
| 6,535 | 0.48%, 11/15/2016 | 6,535 | ||||||
| 152,341 | ||||||||
| Captive Retail Finance - 0.3% | ||||||||
| CNH Equipment Trust | ||||||||
| 3,170 | 0.49%, 07/15/2015 | 3,169 | ||||||
| Credit Card Issuing - 7.0% | ||||||||
| American Express Credit Account Master Trust | ||||||||
| 1,520 | 0.98%, 05/15/2019 | 1,516 | ||||||
| Capital One Multi-Asset Execution Trust | ||||||||
| 6,000 | 0.35%, 02/15/2019 Δ | 5,992 | ||||||
| 3,605 | 0.96%, 09/16/2019 | 3,587 | ||||||
| Chase Issuance Trust | ||||||||
| 6,000 | 0.59%, 11/16/2020 Δ | 6,000 | ||||||
| 6,850 | 0.59%, 08/15/2017 | 6,851 | ||||||
| 6,905 | 0.79%, 06/15/2017 | 6,928 | ||||||
| Citibank Credit Card Issuance Trust | ||||||||
| 7,000 | 0.26%, 04/24/2017 Δ | 6,995 | ||||||
| 3,660 | 0.47%, 11/07/2018 Δ | 3,660 | ||||||
| 4,965 | 1.32%, 09/07/2018 | 4,999 | ||||||
| Citibank Omni Master Trust | ||||||||
| 6,567 | 4.90%, 11/15/2018 ■Δ | 6,808 | ||||||
| 7,000 | 5.35%, 08/15/2018 ■Δ | 7,204 | ||||||
| Discover Card Master Trust | ||||||||
| 7,000 | 0.81%, 08/15/2017 | 7,025 | ||||||
| 7,480 | 0.86%, 11/15/2017 | 7,510 | ||||||
| Golden Credit Card Trust | ||||||||
| 4,465 | 0.42%, 02/15/2018 ■Δ | 4,457 | ||||||
| 3,275 | 0.79%, 09/15/2017 ■ | 3,278 | ||||||
| 82,810 | ||||||||
| Real Estate Credit (Mortgage Banking) - 5.8% | ||||||||
| CNH Equipment Trust | ||||||||
| 7,000 | 0.63%, 01/17/2017 | 7,008 | ||||||
| 5,140 | 0.86%, 09/15/2017 | 5,155 | ||||||
| 2,512 | 1.19%, 12/15/2016 | 2,523 | ||||||
| First Investors Automotive Owner Trust | ||||||||
| 2,260 | 0.89%, 09/15/2017 ■ | 2,260 | ||||||
| Ford Credit Automotive Lease Trust | ||||||||
| 7,000 | 0.45%, 08/15/2016 | 6,999 | ||||||
| 1,575 | 0.76%, 09/15/2016 | 1,577 | ||||||
| Ford Credit Automotive Owner Trust | ||||||||
| 3,000 | 0.57%, 06/15/2016 | 3,004 | ||||||
| Ford Credit Floorplan Master Owner Trust | ||||||||
| 2,450 | 0.85%, 01/15/2018 | 2,450 | ||||||
| GE Capital Credit Card Master Note Trust | ||||||||
| 6,735 | 1.03%, 01/15/2018 | 6,754 | ||||||
| GE Dealer Floorplan Master Note Trust | ||||||||
| 6,500 | 0.61%, 10/20/2017 Δ | 6,505 | ||||||
| 8,345 | 0.66%, 06/20/2017 Δ | 8,367 | ||||||
| Hilton USA Trust | ||||||||
| 1,885 | 1.17%, 11/05/2030 Δ ■ | 1,887 | ||||||
| John Deere Owner Trust | ||||||||
| 6,000 | 0.69%, 01/15/2019 | 5,983 | ||||||
| 6,000 | 0.87%, 08/15/2017 | 6,018 | ||||||
| JP Morgan Chase Commercial Mortgage Securities Corp. | ||||||||
| 1,386 | 3.85%, 06/15/2043 ■ | 1,431 | ||||||
| 67,921 | ||||||||
| 306,241 | ||||||||
The accompanying notes are an integral part of these financial statements.
| 5 |
| Hartford Ultrashort Bond HLS Fund (formerly Hartford Money Market HLS Fund) |
| Schedule of Investments – (continued) |
| December 31, 2013 |
| (000’s Omitted) |
| Shares or Principal Amount | Market Value ╪ | |||||||
| ASSET & COMMERCIAL MORTGAGE BACKED SECURITIES - 27.5% - (continued) | ||||||||
| Real Estate and Rental and Leasing - 1.0% | ||||||||
| Automotive Equipment Rental and Leasing - 1.0% | ||||||||
| Enterprise Fleet Financing LLC | ||||||||
| $ | 5,970 | 0.68%, 09/20/2018 ■ | $ | 5,963 | ||||
| 2,570 | 1.06%, 03/20/2019 ■ | 2,574 | ||||||
| Hertz Fleet Lease Funding L.P. | ||||||||
| 2,735 | 0.72%, 12/10/2027 ■Δ | 2,736 | ||||||
| 11,273 | ||||||||
| Transportation Equipment Manufacturing - 0.5% | ||||||||
| Railroad Rolling Stock Manufacturing - 0.5% | ||||||||
| GE Equipment Transportation LLC | ||||||||
| 2,410 | 0.61%, 06/24/2016 | 2,410 | ||||||
| 3,000 | 0.92%, 09/25/2017 | 2,999 | ||||||
| 5,409 | ||||||||
| Total asset & commercial mortgage backed securities | ||||||||
| (cost $323,091) | $ | 322,923 | ||||||
| CERTIFICATES OF DEPOSIT - 0.6% | ||||||||
| Finance and Insurance - 0.6% | ||||||||
| Commercial Banking - 0.6% | ||||||||
| Credit Suisse New York, | ||||||||
| $ | 7,000 | 0.65%, 12/7/2015 Δ | $ | 6,997 | ||||
| Total certificates of deposit | ||||||||
| (cost $7,000) | $ | 6,997 | ||||||
| CORPORATE BONDS - 39.1% | ||||||||
| Arts, Entertainment and Recreation - 1.7% | ||||||||
| Cable and Other Subscription Programming - 1.1% | ||||||||
| Comcast Corp. | ||||||||
| $ | 3,000 | 5.85%, 11/15/2015 | $ | 3,282 | ||||
| DirecTV Holdings LLC | ||||||||
| 5,000 | 3.55%, 03/15/2015 | 5,165 | ||||||
| Time Warner Cable, Inc. | ||||||||
| 4,580 | 7.50%, 04/01/2014 | 4,656 | ||||||
| 13,103 | ||||||||
| Motion Picture and Video Industries - 0.3% | ||||||||
| Thomson Reuters Corp. | ||||||||
| 700 | 0.88%, 05/23/2016 | 695 | ||||||
| 3,000 | 1.30%, 02/23/2017 | 2,987 | ||||||
| 3,682 | ||||||||
| Radio and Television Broadcasting - 0.3% | ||||||||
| NBC Universal Enterprise | ||||||||
| 3,000 | 0.93%, 04/15/2018 ■Δ | 3,011 | ||||||
| 19,796 | ||||||||
| Beverage and Tobacco Product Manufacturing - 1.7% | ||||||||
| Beverage Manufacturing - 1.0% | ||||||||
| Anheuser-Busch InBev Worldwide, Inc. | ||||||||
| 6,000 | 0.80%, 07/15/2015 | 6,030 | ||||||
| Coca-Cola Enterprises | ||||||||
| 5,000 | 2.13%, 09/15/2015 | 5,097 | ||||||
| 11,127 | ||||||||
| Tobacco Manufacturing - 0.7% | ||||||||
| BAT International Finance plc | ||||||||
| 2,105 | 1.40%, 06/05/2015 ■ | 2,122 | ||||||
| Philip Morris International, Inc. | ||||||||
| 6,000 | 2.50%, 05/16/2016 | 6,227 | ||||||
| 8,349 | ||||||||
| 19,476 | ||||||||
| Chemical Manufacturing - 0.0% | ||||||||
| Agricultural Chemical Manufacturing - 0.0% | ||||||||
| Yara International ASA | ||||||||
| 200 | 5.25%, 12/15/2014 ■ | 207 | ||||||
| Computer and Electronic Product Manufacturing - 0.1% | ||||||||
| Navigational, Measuring, and Control Instruments - 0.1% | ||||||||
| Thermo Fisher Scientific, Inc. | ||||||||
| 1,450 | 1.30%, 02/01/2017 | 1,444 | ||||||
| Finance and Insurance - 27.1% | ||||||||
| Captive Auto Finance - 2.7% | ||||||||
| American Honda Finance Corp. | ||||||||
| 6,000 | 0.74%, 10/07/2016 Δ | 6,031 | ||||||
| Ford Motor Credit Co. LLC | ||||||||
| 2,150 | 1.02%, 01/17/2017 Δ | 2,158 | ||||||
| 5,000 | 1.49%, 05/09/2016 Δ | 5,074 | ||||||
| Nissan Motor Acceptance Corp. | ||||||||
| 6,000 | 0.95%, 09/26/2016 ■Δ | 6,032 | ||||||
| Volkswagen International Finance N.V. | ||||||||
| 6,100 | 0.68%, 11/18/2016 ■Δ | 6,114 | ||||||
| 6,000 | 0.84%, 11/20/2014 ■Δ | 6,024 | ||||||
| 31,433 | ||||||||
| Commercial Banking - 4.1% | ||||||||
| BNP Paribas | ||||||||
| 5,000 | 0.83%, 12/12/2016 Δ | 5,007 | ||||||
| Branch Banking & Trust Co. | ||||||||
| 2,500 | 0.59%, 10/28/2015 Δ | 2,504 | ||||||
| 2,500 | 0.67%, 12/01/2016 Δ | 2,502 | ||||||
| Commonwealth Bank of Australia | ||||||||
| 6,000 | 0.75%, 09/20/2016 ■Δ | 6,015 | ||||||
| HSBC Bank plc | ||||||||
| 3,000 | 0.88%, 05/15/2018 ■Δ | 3,006 | ||||||
| ING Bank N.V. | ||||||||
| 6,000 | 1.89%, 09/25/2015 ■Δ | 6,129 | ||||||
| Intesa Sanpaolo S.P.A. | ||||||||
| 5,000 | 2.66%, 02/24/2014 ■Δ | 5,015 | ||||||
| Nordea Bank AB | ||||||||
| 6,000 | 0.70%, 05/13/2016 ■Δ | 6,017 | ||||||
| Rabobank Netherlands | ||||||||
| 6,000 | 0.72%, 03/18/2016 Δ | 6,022 | ||||||
| Svenska Handelsbanken AB | ||||||||
| 6,000 | 0.72%, 09/23/2016 Δ | 6,007 | ||||||
| 48,224 | ||||||||
| Depository Credit Banking - 5.6% | ||||||||
| Bank of America Corp. | ||||||||
| 6,000 | 1.07%, 03/22/2016 Δ | 6,043 | ||||||
| 2,000 | 1.32%, 03/22/2018 Δ | 2,026 | ||||||
| Bank of Montreal | ||||||||
| 6,000 | 0.76%, 07/15/2016 Δ | 6,024 | ||||||
| Bank of New York Mellon Corp. | ||||||||
| 6,000 | 0.47%, 03/04/2016 Δ | 5,991 | ||||||
The accompanying notes are an integral part of these financial statements.
| 6 |
| Shares or Principal Amount | Market Value ╪ | |||||||
| CORPORATE BONDS - 39.1% - (continued) | ||||||||
| Finance and Insurance - 27.1% - (continued) | ||||||||
| Depository Credit Banking - 5.6% - (continued) | ||||||||
| Bank of Nova Scotia | ||||||||
| $ | 6,000 | 0.76%, 07/15/2016 Δ | $ | 6,024 | ||||
| Citigroup, Inc. | ||||||||
| 4,550 | 0.51%, 06/09/2016 Δ | 4,476 | ||||||
| 6,500 | 0.92%, 11/15/2016 Δ | 6,509 | ||||||
| Fifth Third Bancorp | ||||||||
| 4,500 | 0.75%, 11/18/2016 Δ | 4,512 | ||||||
| HSBC Bank USA | ||||||||
| 3,000 | 2.38%, 02/13/2015 | 3,061 | ||||||
| PNC Bank NA | ||||||||
| 7,500 | 1.15%, 11/01/2016 | 7,509 | ||||||
| Toronto-Dominion Bank | ||||||||
| 6,000 | 0.70%, 09/09/2016 Δ | 6,018 | ||||||
| U.S. Bancorp | ||||||||
| 3,000 | 0.73%, 11/15/2018 Δ | 3,009 | ||||||
| Wells Fargo & Co. | ||||||||
| 2,500 | 0.87%, 04/23/2018 Δ | 2,514 | ||||||
| 2,500 | 1.50%, 07/01/2015 | 2,535 | ||||||
| 66,251 | ||||||||
| Insurance Carriers - 3.8% | ||||||||
| MetLife Global Funding I | ||||||||
| 19,500 | 0.47%, 03/07/2014 ■Δ | 19,509 | ||||||
| Monumental Global Funding | ||||||||
| 6,000 | 0.44%, 01/15/2014 ■Δ | 6,001 | ||||||
| Pricoa Global Funding I | ||||||||
| 3,500 | 1.15%, 11/25/2016 ■ | 3,494 | ||||||
| Principal Life Global Funding II | ||||||||
| 1,350 | 0.61%, 05/27/2016 ■Δ | 1,352 | ||||||
| Prudential Financial, Inc. | ||||||||
| 4,000 | 1.02%, 08/15/2018 Δ | 4,013 | ||||||
| UnitedHealth Group, Inc. | ||||||||
| 6,000 | 0.85%, 10/15/2015 | 6,024 | ||||||
| Wellpoint, Inc. | ||||||||
| 4,000 | 1.25%, 09/10/2015 | 4,028 | ||||||
| 44,421 | ||||||||
| International Trade Financing (Foreign Banks) - 2.8% | ||||||||
| Australia & New Zealand Banking Group Ltd. | ||||||||
| 6,000 | 0.44%, 05/07/2015 ■Δ | 6,005 | ||||||
| BPCE S.A. | ||||||||
| 6,000 | 1.49%, 04/25/2016 Δ | 6,078 | ||||||
| Canadian Imperial Bank of Commerce | ||||||||
| 6,000 | 0.77%, 07/18/2016 Δ | 6,024 | ||||||
| Credit Agricole S.A. | ||||||||
| 6,000 | 1.10%, 10/03/2016 ■Δ | 6,016 | ||||||
| Royal Bank of Canada | ||||||||
| 6,000 | 0.61%, 03/08/2016 Δ | 6,012 | ||||||
| Societe Generale | ||||||||
| 3,000 | 1.33%, 10/01/2018 Δ | 3,017 | ||||||
| 33,152 | ||||||||
| Monetary Authorities - Central Bank - 0.2% | ||||||||
| Lloyds Banking Group plc | ||||||||
| 2,595 | 4.38%, 01/12/2015 ■ | 2,689 | ||||||
| Nondepository Credit Banking - 3.3% | ||||||||
| American Express Credit Corp. | ||||||||
| 6,000 | 0.75%, 07/29/2016 Δ | 6,029 | ||||||
| Capital One Bank | ||||||||
| 4,000 | 1.15%, 11/21/2016 | 3,983 | ||||||
| Caterpillar Financial Services Corp. | ||||||||
| 2,200 | 0.36%, 11/25/2015 Δ | 2,199 | ||||||
| 6,000 | 0.48%, 02/26/2016 Δ | 6,006 | ||||||
| General Electric Capital Corp. | ||||||||
| 3,000 | 0.96%, 04/02/2018 Δ | 3,024 | ||||||
| 1,649 | 1.11%, 05/09/2016 Δ | 1,667 | ||||||
| John Deere Capital Corp. | ||||||||
| 6,000 | 0.36%, 06/15/2015 Δ | 6,002 | ||||||
| National Rural Utilities Cooperative Finance Corp. | ||||||||
| 4,000 | 0.54%, 11/23/2016 Δ | 3,996 | ||||||
| Toyota Motor Credit Corp. | ||||||||
| 6,000 | 0.53%, 05/17/2016 Δ | 6,017 | ||||||
| 38,923 | ||||||||
| Other Financial Investment Activities - 0.6% | ||||||||
| BP Capital Markets plc | ||||||||
| 3,000 | 0.79%, 11/07/2016 Δ | 3,013 | ||||||
| 4,000 | 0.88%, 09/26/2018 Δ | 4,005 | ||||||
| 7,018 | ||||||||
| Real Estate Investment Trust (REIT) - 0.3% | ||||||||
| Ventas Realty L.P. | ||||||||
| 4,000 | 1.55%, 09/26/2016 | 4,028 | ||||||
| Securities and Commodity Contracts and Brokerage - 3.7% | ||||||||
| Goldman Sachs Group, Inc. | ||||||||
| 3,000 | 1.44%, 04/30/2018 Δ | 3,036 | ||||||
| 4,000 | 1.60%, 11/23/2015 | 4,043 | ||||||
| JP Morgan Chase & Co. | ||||||||
| 15,500 | 0.32%, 12/05/2014 Δ | 15,500 | ||||||
| 6,000 | 0.86%, 02/26/2016 Δ | 6,025 | ||||||
| Morgan Stanley | ||||||||
| 6,000 | 1.49%, 02/25/2016 Δ | 6,078 | ||||||
| UBS AG Stamford CT | ||||||||
| 7,440 | 5.88%, 07/15/2016 | 8,273 | ||||||
| 42,955 | ||||||||
| 319,094 | ||||||||
| Food Manufacturing - 0.3% | ||||||||
| Other Food Manufacturing - 0.3% | ||||||||
| Kraft Foods Group, Inc. | ||||||||
| 3,000 | 1.63%, 06/04/2015 | 3,038 | ||||||
| Health Care and Social Assistance - 1.5% | ||||||||
| Drugs and Druggists' Sundries Merchant Wholesalers - 0.4% | ||||||||
| McKesson Corp. | ||||||||
| 5,000 | 0.95%, 12/04/2015 | 4,997 | ||||||
| Health and Personal Care Stores - 0.5% | ||||||||
| CVS Caremark Corp. | ||||||||
| 2,585 | 1.20%, 12/05/2016 | 2,588 | ||||||
| Express Scripts, Inc. | ||||||||
| 3,000 | 3.13%, 05/15/2016 | 3,131 | ||||||
| 5,719 | ||||||||
| Pharmaceutical and Medicine Manufacturing - 0.6% | ||||||||
| AbbVie, Inc. | ||||||||
| 6,000 | 1.00%, 11/06/2015 Δ | 6,061 | ||||||
The accompanying notes are an integral part of these financial statements.
| 7 |
| Hartford Ultrashort Bond HLS Fund (formerly Hartford Money Market HLS Fund) |
| Schedule of Investments – (continued) |
| December 31, 2013 |
| (000’s Omitted) |
| Shares or Principal Amount | Market Value ╪ | |||||||
| CORPORATE BONDS - 39.1% - (continued) | ||||||||
| Health Care and Social Assistance - 1.5% - (continued) | ||||||||
| Pharmaceutical and Medicine Manufacturing - 0.6% - (continued) | ||||||||
| Perrigo Co Ltd | ||||||||
| $ | 935 | 1.30%, 11/08/2016 ■ | $ | 932 | ||||
| 6,993 | ||||||||
| 17,709 | ||||||||
| Information - 1.4% | ||||||||
| Telecommunications - Wired Carriers - 0.9% | ||||||||
| AT&T, Inc. | ||||||||
| 6,000 | 0.62%, 02/12/2016 Δ | 5,988 | ||||||
| British Telecommunications plc | ||||||||
| 4,180 | 1.63%, 06/28/2016 | 4,217 | ||||||
| 10,205 | ||||||||
| Wireless Communications Services - 0.5% | ||||||||
| Verizon Communications, Inc. | ||||||||
| 6,000 | 1.99%, 09/14/2018 Δ | 6,309 | ||||||
| 16,514 | ||||||||
| Miscellaneous Manufacturing - 0.7% | ||||||||
| Aerospace Product and Parts Manufacturing - 0.7% | ||||||||
| Rockwell Collins, Inc. | ||||||||
| 2,300 | 0.59%, 12/15/2016 Δ | 2,300 | ||||||
| United Technologies Corp. | ||||||||
| 6,000 | 0.74%, 06/01/2015 Δ | 6,038 | ||||||
| 8,338 | ||||||||
| Petroleum and Coal Products Manufacturing - 0.9% | ||||||||
| Oil and Gas Extraction - 0.9% | ||||||||
| Devon Energy Corp. | ||||||||
| 4,250 | 0.78%, 12/15/2016 Δ | 4,257 | ||||||
| Petrobras Global Finance | ||||||||
| 3,000 | 1.86%, 05/20/2016 Δ | 2,993 | ||||||
| Statoil ASA | ||||||||
| 3,000 | 0.70%, 11/08/2018 Δ | 3,014 | ||||||
| 10,264 | ||||||||
| Pipeline Transportation - 0.8% | ||||||||
| Pipeline Transportation of Crude Oil - 0.4% | ||||||||
| Enbridge, Inc. | ||||||||
| 4,000 | 0.90%, 10/01/2016 Δ | 4,015 | ||||||
| Pipeline Transportation of Natural Gas - 0.4% | ||||||||
| Enterprise Products Operating LLC | ||||||||
| 5,000 | 1.25%, 08/13/2015 | 5,033 | ||||||
| 9,048 | ||||||||
| Rail Transportation - 0.3% | ||||||||
| Rail Transportation - 0.3% | ||||||||
| Canadian National Railway Co. | ||||||||
| 3,860 | 0.53%, 11/06/2015 Δ | 3,863 | ||||||
| Real Estate and Rental and Leasing - 0.2% | ||||||||
| Automotive Equipment Rental and Leasing - 0.2% | ||||||||
| PACCAR Financial Services Corp. | ||||||||
| 3,000 | 0.84%, 12/06/2018 Δ | 3,004 | ||||||
| Retail Trade - 0.6% | ||||||||
| Grocery Stores - 0.4% | ||||||||
| Kroger (The) Co. | ||||||||
| 4,500 | 0.80%, 10/17/2016 Δ | 4,510 | ||||||
| Other Motor Vehicle Dealers - 0.2% | ||||||||
| Harley-Davidson Financial Services, Inc. | ||||||||
| 2,600 | 3.88%, 03/15/2016 ■ | 2,742 | ||||||
| 7,252 | ||||||||
| Transportation Equipment Manufacturing - 0.2% | ||||||||
| Railroad Rolling Stock Manufacturing - 0.2% | ||||||||
| Kansas City Southern de Mexico S.A. de C.V. | ||||||||
| 1,840 | 0.94%, 10/28/2016 Δ | 1,841 | ||||||
| Utilities - 1.1% | ||||||||
| Electric Generation, Transmission and Distribution - 1.1% | ||||||||
| Dominion Resources, Inc. | ||||||||
| 4,000 | 1.05%, 11/01/2016 ■ | 3,987 | ||||||
| Duke Energy Indiana, Inc. | ||||||||
| 6,000 | 0.60%, 07/11/2016 Δ | 6,007 | ||||||
| Nstar Electric Co. | ||||||||
| 3,165 | 0.48%, 05/17/2016 Δ | 3,161 | ||||||
| 13,155 | ||||||||
| Wholesale Trade - 0.5% | ||||||||
| Beer, Wine, Distilled Alcoholic Beverage Wholesalers - 0.5% | ||||||||
| SABMiller Holdings, Inc. | ||||||||
| 6,000 | 0.93%, 08/01/2018 ■Δ | 6,030 | ||||||
| Total corporate bonds | ||||||||
| (cost $460,034) | $ | 460,073 | ||||||
| MUNICIPAL BONDS - 0.1% | ||||||||
| Tax Allocation - 0.1% | ||||||||
| New York State Dormitory Auth Rev | ||||||||
| $ | 1,000 | 4.81%, 12/15/2014 | $ | 1,040 | ||||
| Total municipal bonds | ||||||||
| (cost $1,041) | $ | 1,040 | ||||||
| U.S. GOVERNMENT AGENCIES - 20.7% | ||||||||
| FHLMC - 3.0% | ||||||||
| $ | 9,595 | 0.35%, 03/18/2015 | $ | 9,603 | ||||
| 25,000 | 0.63%, 12/29/2014 | 25,108 | ||||||
| 34,711 | ||||||||
| FNMA - 17.7% | ||||||||
| 75,000 | 0.50%, 07/02/2015 | 75,179 | ||||||
| 100,000 | 0.75%, 12/19/2014 | 100,539 | ||||||
| 31,873 | 4.63%, 10/15/2014 | 32,987 | ||||||
| 208,705 | ||||||||
| Total U.S. government agencies | ||||||||
| (cost $243,486) | $ | 243,416 | ||||||
The accompanying notes are an integral part of these financial statements.
| 8 |
| Shares or Principal Amount | Market Value ╪ | |||||||||||
| U.S. GOVERNMENT SECURITIES - 0.4% | ||||||||||||
| Other Direct Federal Obligations - 0.4% | ||||||||||||
| FHLB - 0.4% | ||||||||||||
| $ | 4,600 | 1.63%, 09/28/2015 | $ | 4,698 | ||||||||
| Total U.S. government securities | ||||||||||||
| (cost $4,700) | $ | 4,698 | ||||||||||
| Total long-term investments | ||||||||||||
| (cost $1,039,352) | $ | 1,039,147 | ||||||||||
| SHORT-TERM INVESTMENTS - 11.7% | ||||||||||||
| Municipal Bonds - 0.5% | ||||||||||||
| County of Suffolk, NY, GO | ||||||||||||
| $ | 6,000 | 1.50%, 8/14/2014 | $ | 6,028 | ||||||||
| Repurchase Agreements - 0.1% | ||||||||||||
| Bank of America Merrill Lynch TriParty Repurchase Agreement (maturing on 01/02/2014 in the amount of $83, collateralized by GNMA 4.00%, 2043, value of $84) | ||||||||||||
| $ | 83 | 0.005%, 12/31/2013 | $ | 83 | ||||||||
| Bank of Montreal TriParty Repurchase Agreement (maturing on 01/02/2014 in the amount of $79, collateralized by FNMA 1.58% - 4.50%, 2020 - 2043, U.S. Treasury Note 0.25% - 4.00%, 2015 - 2020, value of $81) | ||||||||||||
| 79 | 0.01%, 12/31/2013 | 79 | ||||||||||
| Bank of Montreal TriParty Repurchase Agreement (maturing on 01/02/2014 in the amount of $282, collateralized by FHLMC 3.00% - 5.00%, 2019 - 2043, FNMA 0.76% - 6.00%, 2016 - 2043, GNMA 1.50% - 5.25%, 2028 - 2043, value of $287) | ||||||||||||
| 282 | 0.02%, 12/31/2013 | 282 | ||||||||||
| Barclays Capital TriParty Repurchase Agreement (maturing on 01/02/2014 in the amount of $254, collateralized by U.S. Treasury Note 0.50% - 2.25%, 2017, value of $259) | ||||||||||||
| 254 | 0.01%, 12/31/2013 | 254 | ||||||||||
| Citigroup Global Markets, Inc. TriParty Repurchase Agreement (maturing on 01/02/2014 in the amount of $457, collateralized by U.S. Treasury Bond 3.88% - 8.13%, 2021 - 2040, U.S. Treasury Note 0.25% - 3.38%, 2014 - 2020, value of $466) | ||||||||||||
| 457 | 0.01%, 12/31/2013 | 457 | ||||||||||
| RBS Securities, Inc. TriParty Repurchase Agreement (maturing on 01/02/2014 in the amount of $149, collateralized by U.S. Treasury Note 0.25% - 1.00%, 2015 - 2017, value of $152) | ||||||||||||
| 149 | 0.01%, 12/31/2013 | 149 | ||||||||||
| TD Securities TriParty Repurchase Agreement (maturing on 01/02/2014 in the amount of $357, collateralized by FFCB 0.20% - 0.50%, 2015 - 2016, FHLMC 0.38% - 5.25%, 2014 - 2042, FNMA 0.50% - 7.13%, 2014 - 2043, value of $364) | ||||||||||||
| 357 | 0.01%, 12/31/2013 | 357 | ||||||||||
| UBS Securities, Inc. Repurchase Agreement (maturing on 01/02/2014 in the amount of $3, collateralized by U.S. Treasury Note 2.13%, 2015, value of $3) | ||||||||||||
| 3 | 0.01%, 12/31/2013 | 3 | ||||||||||
| 1,664 | ||||||||||||
| U.S. Government Securities - 11.1% | ||||||||||||
| FHLB - 11.1% | ||||||||||||
| FHLB | ||||||||||||
| $ | 60,000 | 0.18%, 10/1/2014 | $ | 60,004 | ||||||||
| 38,375 | 0.16%, 11/21/2014 | 38,368 | ||||||||||
| 32,050 | 0.13%, 11/18/2014 | 32,049 | ||||||||||
| 130,421 | ||||||||||||
| Total short-term investments | ||||||||||||
| (cost $138,106) | $ | 138,113 | ||||||||||
| Total investments | ||||||||||||
| (cost $1,177,458) ▲ | 100.1 | % | $ | 1,177,260 | ||||||||
| Other assets and liabilities | (0.1 | )% | (1,092 | ) | ||||||||
| Total net assets | 100.0 | % | $ | 1,176,168 | ||||||||
The accompanying notes are an integral part of these financial statements.
| 9 |
| Hartford Ultrashort Bond HLS Fund (formerly Hartford Money Market HLS Fund) |
| Schedule of Investments – (continued) |
| December 31, 2013 |
| (000’s Omitted) |
| Note: | Percentage of investments as shown is the ratio of the total market value to total net assets. |
| ▲ | At December 31, 2013, the cost of securities for federal income tax purposes was $1,177,458 and the aggregate gross unrealized appreciation and depreciation based on that cost were: |
| Unrealized Appreciation | $ | 392 | ||
| Unrealized Depreciation | (590 | ) | ||
| Net Unrealized Depreciation | $ | (198 | ) |
| Δ | Variable rate securities; the rate reported is the coupon rate in effect at December 31, 2013. |
| ■ | Securities issued within terms of a private placement memorandum, exempt from registration under Rule 144A under the Securities Act of 1933, as amended, and may be sold only to qualified institutional buyers. Unless otherwise indicated, these holdings are determined to be liquid. At December 31, 2013, the aggregate value of these securities was $174,686, which represents 14.9% of total net assets. |
| ╪ | See Significant Accounting Policies of accompanying Notes to Financial Statements regarding valuation of securities. |
| GLOSSARY: (abbreviations used in preceding Schedule of Investments) | ||
| Municipal Bond Abbreviations: | ||
| GO | General Obligation | |
| Rev | Revenue | |
| Other Abbreviations: | ||
| FFCB | Federal Farm Credit Bank | |
| FHLB | Federal Home Loan Bank | |
| FHLMC | Federal Home Loan Mortgage Corp. | |
| FNMA | Federal National Mortgage Association | |
| GNMA | Government National Mortgage Association | |
The accompanying notes are an integral part of these financial statements.
| 10 |
| Hartford Ultrashort Bond HLS Fund (formerly Hartford Money Market HLS Fund) |
| Investment Valuation Hierarchy Level Summary |
| December 31, 2013 |
| (000’s Omitted) |
| Total | Level 1 ♦ | Level 2 ♦ | Level 3 | |||||||||||||
| Assets: | ||||||||||||||||
| Asset & Commercial Mortgage Backed Securities | $ | 322,923 | $ | – | $ | 315,737 | $ | 7,186 | ||||||||
| Certificates of Deposit | 6,997 | – | 6,997 | – | ||||||||||||
| Corporate Bonds | 460,073 | – | 460,073 | – | ||||||||||||
| Municipal Bonds | 1,040 | – | 1,040 | – | ||||||||||||
| U.S. Government Agencies | 243,416 | – | 243,416 | – | ||||||||||||
| U.S. Government Securities | 4,698 | – | 4,698 | – | ||||||||||||
| Short-Term Investments | 138,113 | – | 138,113 | – | ||||||||||||
| Total | $ | 1,177,260 | $ | – | $ | 1,170,074 | $ | 7,186 | ||||||||
| ♦ | For the year ended December 31, 2013, there were no transfers between Level 1 and Level 2. |
Following is a reconciliation of Level 3 assets for which significant unobservable inputs were used to determine fair value:
| Balance as of December 31, 2012 | Realized Gain (Loss) | Change in Unrealized Appreciation (Depreciation) | Net Amortization | Purchases | Sales | Transfers Into Level 3 | Transfers Out of Level 3 | Balance as of December 31, 2013 | ||||||||||||||||||||||||||||
| Assets: | ||||||||||||||||||||||||||||||||||||
| Asset & Commercial Mortgage Backed Securities | $ | — | $ | — | $ | 1 | * | $ | — | $ | 7,185 | $ | — | $ | — | $ | — | $ | 7,186 | |||||||||||||||||
| Total | $ | — | $ | — | $ | 1 | $ | — | $ | 7,185 | $ | — | $ | — | $ | — | $ | 7,186 | ||||||||||||||||||
| * | Change in unrealized appreciation (depreciation) in the current period relating to assets still held at December 31, 2013 was $1. |
| Note: | For purposes of reporting transfers between different hierarchy levels, both transfers in and out of each level, as applicable, are shown as if they occurred at the beginning of the period. |
The accompanying notes are an integral part of these financial statements.
| 11 |
| Hartford Ultrashort Bond HLS Fund (formerly Hartford Money Market HLS Fund) |
| Statement of Assets and Liabilities |
| December 31, 2013 |
| (000’s Omitted) |
| Assets: | ||||
| Investments in securities, at market value (cost $1,177,458) | $ | 1,177,260 | ||
| Cash | — | |||
| Receivables: | ||||
| Fund shares sold | 39 | |||
| Dividends and interest | 1,962 | |||
| Other assets | — | |||
| Total assets | 1,179,261 | |||
| Liabilities: | ||||
| Payables: | ||||
| Fund shares redeemed | 2,878 | |||
| Investment management fees | 104 | |||
| Distribution fees | 9 | |||
| Accrued expenses | 102 | |||
| Total liabilities | 3,093 | |||
| Net assets | $ | 1,176,168 | ||
| Summary of Net Assets: | ||||
| Capital stock and paid-in-capital | $ | 1,176,370 | ||
| Accumulated net realized loss | (4 | ) | ||
| Unrealized depreciation of investments | (198 | ) | ||
| Net assets | $ | 1,176,168 | ||
| Shares authorized | 14,000,000 | |||
| Par value | $ | 0.01 | ||
| Class IA: Net asset value per share | $ | 10.00 | ||
| Shares outstanding | 101,350 | |||
| Net assets | $ | 1,013,110 | ||
| Class IB: Net asset value per share | $ | 9.99 | ||
| Shares outstanding | 16,320 | |||
| Net assets | $ | 163,058 |
The accompanying notes are an integral part of these financial statements.
| 12 |
| Hartford Ultrashort Bond HLS Fund (formerly Hartford Money Market HLS Fund) |
| Statement of Operations |
| For the Year Ended December 31, 2013 |
| (000’s Omitted) |
| Investment Income: | ||||
| Interest | $ | 3,222 | ||
| Total investment income, net | 3,222 | |||
| Expenses: | ||||
| Investment management fees | 6,565 | |||
| Transfer agent fees | 3 | |||
| Distribution fees - Class IB | 89 | |||
| Custodian fees | 14 | |||
| Accounting services fees | 164 | |||
| Board of Directors' fees | 46 | |||
| Audit fees | 22 | |||
| Other expenses | 563 | |||
| Total expenses (before waivers and fees paid indirectly) | 7,466 | |||
| Expense waivers | (3,875 | ) | ||
| Custodian fee offset | — | |||
| Total waivers and fees paid indirectly | (3,875 | ) | ||
| Total expenses, net | 3,591 | |||
| Net Investment Loss | (369 | ) | ||
| Net Realized Gain on Investments: | ||||
| Net realized gain on investments | 2 | |||
| Net Realized Gain on Investments | 2 | |||
| Net Changes in Unrealized Depreciation of Investments: | ||||
| Net unrealized depreciation of investments | (198 | ) | ||
| Net Changes in Unrealized Depreciation of Investments | (198 | ) | ||
| Net Decrease in Net Assets Resulting from Operations | $ | (565 | ) |
The accompanying notes are an integral part of these financial statements.
| 13 |
| Hartford Ultrashort Bond HLS Fund (formerly Hartford Money Market HLS Fund) |
| Statement of Changes in Net Assets |
| (000’s Omitted) |
| For the Year Ended December 31, 2013 | For the Year Ended December 31, 2012 | |||||||
| Operations: | ||||||||
| Net investment loss | $ | (369 | ) | $ | (5 | ) | ||
| Net realized gain on investments | 2 | 5 | ||||||
| Net unrealized depreciation of investments | (198 | ) | — | |||||
| Net Decrease in Net Assets Resulting from Operations | (565 | ) | — | |||||
| Capital Share Transactions: | ||||||||
| Class IA | ||||||||
| Sold | 1,019,371 | 1,183,777 | ||||||
| Redeemed | (1,609,509 | ) | (1,550,432 | ) | ||||
| Total capital share transactions | (590,138 | ) | (366,655 | ) | ||||
| Class IB | ||||||||
| Sold | 142,018 | 156,549 | ||||||
| Redeemed | (251,269 | ) | (260,732 | ) | ||||
| Total capital share transactions | (109,251 | ) | (104,183 | ) | ||||
| Net decrease from capital share transactions | (699,389 | ) | (470,838 | ) | ||||
| Net Decrease in Net Assets | (699,954 | ) | (470,838 | ) | ||||
| Net Assets: | ||||||||
| Beginning of period | 1,876,122 | 2,346,960 | ||||||
| End of period | $ | 1,176,168 | $ | 1,876,122 | ||||
| Undistributed (distribution in excess of) net investment income | $ | — | $ | — | ||||
| Shares*: | ||||||||
| Class IA | ||||||||
| Sold | 1,011,310 | 1,183,777 | ||||||
| Redeemed | (2,513,617 | )† | (1,550,432 | ) | ||||
| Total share activity | (1,502,307 | ) | (366,655 | ) | ||||
| Class IB | ||||||||
| Sold | 138,053 | 156,549 | ||||||
| Redeemed | (394,198 | )† | (260,732 | ) | ||||
| Total share activity | (256,145 | ) | (104,183 | ) | ||||
| * | Please see Reverse Stock Split note in the Notes to Financial Statements for more information. The share amounts reflect actual activity during the years ended December 31, 2013 and 2012, and do not reflect the impact of the reverse stock split. |
| † | Share amounts include adjustments made for reverse stock split of 1,080,670 shares and 182,596 shares for Class IA and Class IB, respectively. |
The accompanying notes are an integral part of these financial statements.
| 14 |
| Hartford Ultrashort Bond HLS Fund (formerly Hartford Money Market HLS Fund) |
| Notes to Financial Statements |
| December 31, 2013 |
| (000’s Omitted) |
| 1. | Organization: |
Hartford Ultrashort Bond HLS Fund (the “Fund”) serves as an underlying investment option for certain variable annuity and variable life insurance separate accounts of Hartford Life Insurance Company (“HLIC”) and its affiliates and certain qualified retirement plans. The Fund may also serve as an underlying investment option for certain variable annuity and variable life separate accounts of other insurance companies. Owners of variable annuity contracts and policyholders of variable life insurance contracts may choose the funds permitted in the variable insurance contract prospectus. In addition, participants in certain qualified retirement plans may choose the Fund if permitted by their plans.
Hartford Series Fund, Inc. (the “Company”) is an open-end registered management investment company comprised of thirty portfolios. Financial statements for the Fund, a series of the Company, are included in this report.
The Company is organized under the laws of the State of Maryland and is registered with the Securities and Exchange Commission (“SEC”) under the Investment Company Act of 1940, as amended (“1940 Act”). The Fund is a diversified open-end management investment company.
The Fund is divided into Class IA and Class IB shares. Each class is offered at the per share net asset value (“NAV”) without a sales charge and is subject to the same expenses, except that the Class IB shares are subject to distribution and service fees charged pursuant to a Distribution Plan adopted in accordance with Rule 12b-1 under the 1940 Act.
Effective October 21, 2013, the Fund: (1) ceased to operate as a money market fund; (2) no longer sought to maintain a stable $1.00 NAV per share; and (3) began being managed as an ultrashort bond fund. For more detailed information regarding the Fund’s conversion to an ultrashort bond fund, please see the Fund’s prospectus.
| 2. | Significant Accounting Policies: |
The following is a summary of significant accounting policies of the Fund in the preparation of its financial statements, which are in accordance with United States Generally Accepted Accounting Principles (“U.S. GAAP”). The preparation of financial statements in accordance with U.S. GAAP may require management to make estimates and assumptions that affect the reported amounts of assets and liabilities and disclosure of contingent assets and liabilities at the date of the financial statements and the reported amounts of increases and decreases in net assets from operations during the reporting period. Actual results could differ from those estimates.
| a) | Determination of Net Asset Value – The NAV of each class of the Fund’s shares is determined as of the close of regular trading (normally 4:00 p.m. Eastern Time) (the “NYSE Close”) on each day that the New York Stock Exchange (the “Exchange”) is open (“Valuation Date”). Information that becomes known to the Fund after the NAV has been calculated on a particular day will not generally be used to retroactively adjust the NAV determined earlier that day. |
| b) | Investment Valuation and Fair Value Measurements – The Fund's investments, prior to October 21, 2013, were valued at amortized cost, which approximates market value. Effective October 21, 2013, for purposes of calculating the NAV, portfolio investments and other assets held by the Fund's portfolio for which market quotes are readily available are valued at market value. Market value is generally determined on the basis of last reported sales prices or official close price. If no sales are reported, market value is based on quotes obtained from a quotation reporting system, established market makers, or independent pricing services. If market prices are not readily available or are deemed unreliable, the Fund will use the fair value of the investment as determined in good faith under policies and procedures established by and under the supervision of the Company’s Board of Directors. Market quotes are considered not readily available where there is an absence of current or reliable market-based data (e.g., trade information or indicative market quotes), including where events occur after the close of the relevant market, but prior to the NYSE Close, that materially affect the values of the Fund’s portfolio investments or assets. In addition, market quotes are considered not readily available when, due to extraordinary circumstances, the exchanges or markets on which the investments trade do not open for trading for the entire day and no other market prices are available. In addition, prices of foreign equities that are |
| 15 |
| Hartford Ultrashort Bond HLS Fund (formerly Hartford Money Market HLS Fund) |
| Notes to Financial Statements – (continued) |
| December 31, 2013 |
| (000’s Omitted) |
principally traded on certain foreign markets may be adjusted daily pursuant to a fair value pricing service approved by the Board of Directors in order to reflect an adjustment for the factors occurring after the close of certain foreign markets but before the NYSE Close. Investments that are primarily traded on foreign markets may trade on days that are not business days of the Fund. The value of the foreign investments in which the Fund invests may change on days when a shareholder will not be able to purchase or redeem shares of the Fund. Fair value pricing is subjective in nature and the use of fair value pricing by the Fund may cause the NAV of its shares to differ significantly from the NAV that would have been calculated using market prices at the close of the exchange on which a portfolio investment is primarily traded. There can be no assurance that the Fund could obtain the fair market value assigned to an investment if the Fund were to sell the investment at approximately the time at which the Fund determines its NAV.
Fixed income investments (other than short-term obligations), non-exchange traded derivatives and centrally cleared swaps held by the Fund are normally valued on the basis of quotes obtained from brokers and dealers or independent pricing services in accordance with procedures established by the Company’s Board of Directors. Prices obtained from independent pricing services use information provided by market makers or estimates of market values through accepted market modeling, trading and pricing conventions. Inputs to the models may include, but are not limited to, prepayment speeds, pricing spread, yield, trade information, dealer quotes, market color, cash flow models and the investment’s terms and conditions. Generally, the Fund may use fair valuation in regard to fixed income investments when the Fund holds defaulted or distressed investments or investments in a company in which a reorganization is pending. Short-term investments maturing in 60 days or less are generally valued at amortized cost, if their original term to maturity was 60 days or less, or by amortizing their value on the 61st day prior to maturity, if the original term to maturity exceeded 60 days.
Investments in open-end mutual funds are valued at the respective NAV of each open-end mutual fund on the Valuation Date.
Financial instruments for which prices are not available from an independent pricing service may be valued using market quotations obtained from one or more dealers that make markets in the respective financial instrument in accordance with procedures established by the Company’s Board of Directors.
U.S. GAAP defines fair value as the price that the Fund would receive to sell an asset or pay to transfer a liability in an orderly transaction between market participants. The U.S. GAAP fair value measurement standards require disclosure of a fair value hierarchy for each major category of assets and liabilities. Various inputs are used in determining the fair value of the Fund’s investments. These inputs are summarized into three broad hierarchy levels. This hierarchy is based on whether the valuation inputs are observable or unobservable. These levels are:
| · | Level 1 – Quoted prices in active markets for identical investments. Level 1 may include exchange traded instruments, such as domestic equities, some foreign equities, options, futures, mutual funds, exchange traded funds, rights and warrants. |
| · | Level 2 – Observable inputs other than Level 1 prices, such as quoted prices for similar investments; quoted prices in markets that are not active; or other inputs that are observable or can be corroborated by observable market data. Level 2 may include debt investments that are traded less frequently than exchange traded instruments and which are valued using independent pricing services; foreign equities, which are principally traded on certain foreign markets and are adjusted daily pursuant to a fair value pricing service in order to reflect an adjustment for the factors occurring after the close of certain foreign markets but before the NYSE Close; senior floating rate interests, which are valued using an aggregate of dealer bids; short-term investments, which are valued at amortized cost; and swaps, which are valued based upon the terms of each swap contract. |
| · | Level 3 – Significant unobservable inputs that are supported by limited or no market activity. Level 3 may include financial instruments whose values are determined using indicative market quotes or require significant management judgment or estimation. These unobservable valuation inputs may include estimates for current yields, maturity/duration, prepayment speed, and indicative market quotes for comparable investments along with other assumptions relating to credit quality, collateral value, complexity of the investment structure, general market conditions and liquidity. This category may include investments where trading has been halted |
| 16 |
or there are certain restrictions on trading. While these investments are priced using unobservable inputs, the valuation of these investments reflects the best available data and management believes the prices are a reasonable representation of exit price.
The Board of Directors of the Company generally reviews and approves the “Procedures for Valuation of Portfolio Securities” on an annual basis. These procedures define how investments are to be valued, including the formation and activities of a Valuation Committee. The Valuation Committee is responsible for determining in good faith the fair value of investments when the value cannot be obtained from primary pricing services or alternative sources or if the valuation of an investment as provided by the primary pricing service or alternative source is believed not to reflect the investment’s fair value as of the Valuation Date. Voting members of the Valuation Committee include the Fund’s Treasurer or designee and a Vice President of the investment manager or designee. An Assistant Vice President of the Fund with legal expertise or designee is also included on the Valuation Committee as a non-voting advisory member. In addition, the Fund’s Chief Compliance Officer shall designate a member of the compliance group to attend Valuation Committee meetings as a non-voting resource, to monitor for and provide guidance with respect to compliance with these procedures. Two members of the Valuation Committee or their designees, representing different departments, shall constitute a quorum for purposes of permitting the Valuation Committee to take action. The Valuation Committee will consider all relevant factors in determining an investment’s fair value, and may seek the advice of the Fund’s sub-adviser, knowledgeable brokers, and legal counsel in making such determination. The Valuation Committee reports to the Audit Committee of the Company’s Board of Directors. The Audit Committee receives quarterly written reports which include details of all fair-valued investments, including the reason for the fair valuation, and an indication, when possible, of the accuracy of the valuation by disclosing the next available reliable public price quotation or the disposition price of such investments (the “look-back” test). The Board of Directors then must consider for ratification all of the fair value determinations made during the previous quarter.
Valuation levels are not necessarily indicative of the risk associated with investing in such investments. Individual investments within any of the above mentioned asset classes may be assigned a different hierarchical level than those presented above, as individual circumstances dictate.
For additional information, refer to the Investment Valuation Hierarchy Level Summary and the Level 3 roll-forward reconciliation, if applicable, which follow the Schedule of Investments.
| c) | Investment Transactions and Investment Income – Investment transactions are recorded as of the trade date (the date the order to buy or sell is executed) for financial reporting purposes. Investments purchased or sold on a when-issued or delayed-delivery basis may be settled a month or more after the trade date. Realized gains and losses are determined on the basis of identified cost. |
Interest income, including amortization of premium, accretion of discounts and additional principal received in-kind in lieu of cash, is accrued on a daily basis. Paydown gains and losses on mortgage related and other asset backed securities are included in interest income in the Statement of Operations.
| d) | Joint Trading Account – The Fund may invest cash balances into a joint trading account that may be invested in one or more repurchase agreements. |
| e) | Fund Share Valuation and Dividend Distributions to Shareholders – Orders for the Fund’s shares are executed in accordance with the investment instructions of the contract holders and plan participants. The NAV of the Fund’s shares is determined as of the close of business on each business day of the Exchange. The NAV is determined separately for each class of shares of the Fund by dividing the Fund’s net assets attributable to that class by the number of shares of the class outstanding. Each class of shares offered by the Fund has equal rights as to assets and voting privileges (except that shareholders of a class have exclusive voting rights regarding any matter relating solely to that class of shares). Income and non-class specific expenses are allocated daily to each class on the basis of the relative net assets of the class. |
| 17 |
| Hartford Ultrashort Bond HLS Fund (formerly Hartford Money Market HLS Fund) |
| Notes to Financial Statements – (continued) |
| December 31, 2013 |
| (000’s Omitted) |
Realized and unrealized gains and losses are allocated daily based on the relative net assets of each class of shares of the Fund.
Orders for the purchase of the Fund’s shares received prior to the close of the Exchange on any day the Exchange is open for business are priced at the NAV determined as of the close of the Exchange. Orders received after the close of the Exchange, or on a day on which the Exchange and/or the Fund is not open for business, are priced at the next determined NAV.
Dividends are declared pursuant to a policy adopted by the Company’s Board of Directors based upon the investment performance of the Fund. The policy of the Fund is to pay dividends from net investment income and realized gains, if any, at least once a year.
Distributions from net investment income, net realized gains and capital are determined in accordance with federal income tax regulations, which may differ from U.S. GAAP with respect to character and timing. These differences may include but are not limited to losses deferred due to wash sale adjustments, foreign currency gains and losses, adjustments related to Passive Foreign Investment Companies (“PFICs”), Real Estate Investment Trusts (“REITs”), Regulated Investment Companies (“RICs”), certain derivatives and partnerships. Permanent book and federal income tax basis differences relating to shareholder distributions will result in reclassifications to certain of the Fund’s capital accounts (see Federal Income Taxes: Reclassification of Capital Accounts note).
| 3. | Securities and Other Investments: |
| a) | Repurchase Agreements – A repurchase agreement is an agreement by which a counterparty agrees to sell an investment and agrees to repurchase the investment sold from the buyer at a mutually agreed upon time and price. During the period of the repurchase agreement, the counterparty will deposit cash and or securities in a third party custodial account to serve as collateral. At the time the Fund enters into a repurchase agreement, the value of the underlying collateral, including accrued interest, will be equal to or exceed the value of the repurchase agreement. Repurchase agreements expose the Fund to counterparty risk - that is, the risk that the counterparty will not fulfill its obligations. To minimize counterparty risk, the investments that serve to collateralize the repurchase agreement are held by the Fund’s custodian in book entry or physical form in the custodial account of the Fund or in a third party custodial account. Repurchase agreements are valued at cost plus accrued interest, which approximates fair value. Repurchase agreements have master netting arrangements which allow the Fund to offset amounts owed to a counterparty with amounts owed by the counterparty, including any collateral. Upon an event of default under a master repurchase agreement, the non-defaulting party may close out all transactions traded under such agreement and net amounts owed under each transaction to one net amount payable by one party to the other. Absent an event of default, the master repurchase agreement does not result in an offset of reported amounts of assets and liabilities in the Statement of Assets and Liabilities across transactions between the Fund and the applicable counterparty. The Fund, as shown on the Schedule of Investments, had outstanding repurchase agreements and related collateral as of December 31, 2013. |
| b) | Illiquid and Restricted Investments – The Fund is permitted to invest up to 15% of its net assets in illiquid investments. Illiquid investments are those that may not be sold or disposed of in the ordinary course of business within seven days, at approximately the price used to determine the Fund’s NAV. The Fund may not be able to sell illiquid investments when its sub-adviser considers it desirable to do so or may have to sell such investments at a price that is lower than the price that could be obtained if the investments were more liquid. A sale of illiquid investments may require more time and may result in higher dealer discounts and other selling expenses than does the sale of those that are liquid. Illiquid investments also may be more difficult to value due to the unavailability of reliable market quotations for such investments, and an investment in them may have an adverse impact on the Fund’s NAV. The Fund may also purchase certain restricted investments that can only be resold to certain qualified investors and may be determined to be liquid pursuant to policies and guidelines established by the Company’s Board of Directors. The Fund, as shown on the Schedule of Investments, had illiquid and/or restricted investments as of December 31, 2013. |
| 18 |
| c) | Investments Purchased on a When-Issued or Delayed-Delivery Basis – Delivery and payment for investments that have been purchased by the Fund on a forward commitment, or when-issued or delayed-delivery basis, take place beyond the customary settlement period. The Fund may dispose of or renegotiate a delayed-delivery transaction after it is entered into, and may sell delayed-delivery investments before they are delivered, which may result in a realized gain or loss. During this period, such investments are subject to market fluctuations, and the Fund identifies investments segregated in its records with a value at least equal to the amount of the commitment. As of December 31, 2013, the Fund had no outstanding when-issued or delayed-delivery investments. |
In connection with the Fund’s ability to purchase investments on a when-issued or forward commitment basis, the Fund may enter into to-be announced (“TBA”) commitments. TBA commitments are forward agreements for the purchase or sale of mortgage backed securities for a fixed price, with payment and delivery on an agreed-upon future settlement date. The specific securities to be delivered are not identified at the trade date; however, delivered securities must meet specified terms, including issuer, rate and mortgage terms. Although the Fund may enter into TBA commitments with the intention of acquiring or delivering securities for its portfolio, the Fund can extend the settlement date, roll the transaction, or dispose of a commitment prior to settlement if deemed appropriate to do so. If the TBA commitment is closed through the acquisition of an offsetting TBA commitment, the Fund realizes a gain or loss. In a TBA roll transaction, the Fund generally purchases or sells the initial TBA commitment prior to the agreed upon settlement date and enters into a new TBA commitment for future delivery or receipt of the mortgage backed securities. TBA commitments involve a risk of loss if the value of the security to be purchased or sold declines or increases, respectively, prior to settlement date.
The Fund may enter into “dollar rolls” in which the Fund sells securities and contracts with the same counterparty to repurchase substantially similar securities (for example, same issuer, coupon and maturity) on a specified future date at an agreed upon price. The Fund gives up the right to receive interest paid on the investments sold. The Fund would benefit to the extent of any differences between the price received for the security and the lower forward price for the future purchase. Dollar rolls involve the risk that the market value of the securities that the Fund is required to purchase may decline below the agreed upon repurchase price of those securities. The Fund records dollar roll transactions as purchases and sales and realizes gains and losses on these transactions. These transactions are excluded from the Fund’s portfolio turnover rate. The Fund had no open dollar roll transactions as of December 31, 2013.
| d) | Mortgage Related and Other Asset Backed Securities – The Fund may invest in mortgage related and other asset backed securities. These securities include mortgage pass-through securities, collateralized mortgage obligations, commercial mortgage backed securities, stripped mortgage backed securities, asset backed securities, collateralized debt obligations and other securities that directly or indirectly represent a participation in, or are secured by and payable from, mortgage loans on real property. Mortgage related securities are created from pools of residential or commercial mortgage loans, including mortgage loans made by savings and loan institutions, mortgage bankers, commercial banks and others. Asset backed securities are created from many types of assets, including auto loans, credit card receivables, home equity loans, and student loans. These securities provide a monthly payment that consists of both interest and principal payments. Interest payments may be determined by fixed or adjustable rates. The rate of pre-payments on underlying mortgages will affect the price and volatility of a mortgage related security, and may have the effect of shortening or extending the effective duration of the security relative to what was anticipated at the time of purchase. The timely payment of principal and interest of certain mortgage related securities is guaranteed by the full faith and credit of the United States Government. Mortgage related and other asset backed securities created and guaranteed by non-governmental issuers, including government-sponsored corporations, may be supported by various forms of insurance or guarantees, but there can be no assurance that the private insurers or guarantors can meet their obligations under the insurance policies or guarantee arrangements. The Fund, as shown on the Schedule of Investments, had mortgage related and other asset backed securities as of December 31, 2013. |
| 19 |
| Hartford Ultrashort Bond HLS Fund (formerly Hartford Money Market HLS Fund) |
| Notes to Financial Statements – (continued) |
| December 31, 2013 |
| (000’s Omitted) |
| 4. | Principal Risks: |
Credit risk depends largely on the perceived financial health of bond issuers. In general, the credit rating is inversely related to the credit risk of the issuer. Higher rated bonds generally are deemed to have less credit risk, while lower or unrated bonds are deemed to have higher risk of default. The share price, yield and total return of a fund that holds securities with higher credit risk may be more volatile than those of a fund that holds bonds with lower credit risk. Similar to credit risk, the Fund may be exposed to counterparty risk, or the risk that an institution or other entity with which the Fund has unsettled or open transactions will default.
The Fund’s investments expose the Fund to various risks including, but not limited to, interest rate, prepayment, extension, foreign currency and equity risks. Interest rate risk is the risk that fixed income securities will decline in value because of changes in interest rates. As nominal interest rates rise, the values of certain fixed income securities held by the Fund are likely to decrease. A nominal interest rate can be described as the sum of a real interest rate and an expected inflation rate. Fixed income securities with longer durations tend to be more sensitive to changes in interest rates, usually making them more volatile than securities with shorter durations. Duration is useful primarily as a measure of the sensitivity of a fixed income security’s market price to interest rate (i.e., yield) movements. Senior floating rate interests and securities subject to prepayment and extension risk generally offer less potential for gains when interest rates decline. In addition, securities are subject to extension risk. Rising interest rates may cause prepayments to occur at a slower than expected rate, thereby effectively lengthening the maturity of the security and making the security more sensitive to interest rate changes. Prepayment and extension risk are major risks of mortgage backed securities, senior floating rate interests, and certain asset backed securities. For certain asset backed securities, the actual maturity may be less than the stated maturity shown in the Schedule of Investments, if applicable. As a result, the timing of income recognition relating to these securities may vary based upon the actual maturity.
If the Fund invests directly in foreign currencies or in securities that trade in, and receive revenues in, foreign currencies, or in derivatives that provide exposure to foreign currencies, it will be subject to the risk that those currencies will decline in value relative to the base currency (U.S. dollars) of the Fund, or, in the case of hedging positions, that the Fund’s base currency will decline in value relative to the currency being hedged. Currency rates in foreign countries may fluctuate significantly over short periods of time for a number of reasons, including changes in interest rates, intervention (or the failure to intervene) by U.S. or foreign governments, central banks or supranational entities, such as the International Monetary Fund, or by the imposition of currency controls or other political developments in the United States or abroad. As a result, the Fund’s investments in foreign currency denominated securities may reduce the returns of the Fund. The market values of equity securities, such as common stocks and preferred stocks, or equity related investments, such as futures and options, may decline due to general market conditions which are not specifically related to a particular company, such as real or perceived adverse economic conditions, changes in the general outlook for corporate earnings, changes in interest or currency rates or adverse investor sentiment generally. The market value of equity securities may also decline due to factors which affect a particular industry or industries, such as labor shortages or increased production costs and competitive conditions within an industry. Equity securities and equity related investments generally have greater market price volatility than fixed income securities.
| 5. | Federal Income Taxes: |
| a) | Federal Income Taxes – For federal income tax purposes, the Fund intends to continue to qualify as a RIC under Subchapter M of the Internal Revenue Code (“IRC”) by distributing substantially all of its taxable net investment income and net realized capital gains to its shareholders and otherwise complying with the requirements of the IRC. The Fund has distributed substantially all of its income and capital gains in prior years, if applicable, and intends to distribute substantially all of its income and capital gains prior to the next fiscal year-end. Accordingly, no provision for federal income or excise taxes has been made in the accompanying financial statements. Distributions from short-term capital gains are treated as ordinary income distributions for federal income tax purposes. |
| b) | Net Investment Income (Loss), Net Realized Gains (Losses) and Distributions – Net investment income (loss) and net realized gains (losses) may differ for financial statement and tax purposes primarily because of losses deferred due to |
| 20 |
wash sale adjustments, foreign currency gains and losses, adjustments related to PFICs, REITs, RICs, certain derivatives and partnerships. The character of distributions made during the year from net investment income or net realized gains may differ from their ultimate characterization for federal income tax purposes. Also, due to the timing of dividend distributions, the fiscal year in which amounts are distributed may differ from the year that the income or realized gains (losses) were recorded by the Fund.
| c) | Components of Distributable Earnings – The Fund’s components of distributable earnings (deficit) on a tax basis at December 31, 2013, are as follows: |
| Amount | ||||
| Accumulated Capital and Other Losses | $ | (4 | ) | |
| Unrealized Depreciation* | (198 | ) | ||
| Total Accumulated Deficit | $ | (202 | ) | |
| * | Differences between book-basis and tax-basis unrealized appreciation (depreciation) may be attributable to the losses deferred due to wash sale adjustments, foreign currency gains and losses, adjustments related to PFICs, REITs, RICs, certain derivatives and partnerships. |
| d) | Reclassification of Capital Accounts – The Fund may record reclassifications in its capital accounts. These reclassifications have no impact on the total net assets of the Fund. The reclassifications are a result of permanent differences between U.S. GAAP and tax accounting for such items as foreign currency, PFICs, expiration or utilization of capital loss carryforwards or net operating losses. Adjustments are made to reflect the impact these items have on current and future distributions to shareholders. Therefore, the source of the Fund’s distributions may be shown in the accompanying Statement of Changes in Net Assets as from undistributed net investment income, from accumulated net realized gains on investments or from capital depending on the type of book and tax differences that exist. For the year ended December 31, 2013, the Fund recorded reclassifications to increase (decrease) the accounts listed below: |
| Amount | ||||
| Undistributed Net Investment Income (Loss) | $ | 369 | ||
| Accumulated Net Realized Gain (Loss) | (6 | ) | ||
| Capital Stock and Paid-in-Capital | (363 | ) | ||
| e) | Capital Loss Carryforward – On December 22, 2010, the Regulated Investment Company Modernization Act of 2010 (the “Act”) was enacted, which made changes to the capital loss carryforward rules. The changes are effective for taxable years beginning after the date of enactment. Under the Act, funds are permitted to carry forward capital losses for an unlimited period. However, any losses incurred during those future taxable years will be required to be utilized prior to the losses incurred in pre-enactment taxable years, which carry an expiration date. As a result of this ordering rule, pre-enactment capital loss carryforwards may be more likely to expire unused. Additionally, post-enactment capital loss carryforwards retain their character as either short-term or long-term capital losses rather than being considered all short-term as permitted under prior regulation. |
At December 31, 2013 (tax-year-end), the Fund had capital loss carryforwards for U.S. federal income tax purposes as follows:
Capital loss carryforwards with no expiration:
| Amount | ||||
| Short-Term Capital Loss Carryforward | $ | 4 | ||
| Total | $ | 4 | ||
| 21 |
| Hartford Ultrashort Bond HLS Fund (formerly Hartford Money Market HLS Fund) |
| Notes to Financial Statements – (continued) |
| December 31, 2013 |
| (000’s Omitted) |
| f) | Accounting for Uncertainty in Income Taxes – The Fund has adopted financial reporting rules that require the Fund to analyze all open tax years, as defined by the statute of limitations, for all major jurisdictions. Generally, tax authorities can examine all tax returns filed for the last three years. The Fund does not have an examination in progress. |
The Fund has reviewed all open tax years and major jurisdictions and concluded that these financial reporting rules had no effect on the Fund’s financial position or results of operations. There is no tax liability resulting from unrecognized tax benefits relating to uncertain income tax positions taken or expected to be taken on the tax return for the fiscal year ended December 31, 2013. The Fund is also not aware of any tax positions for which it is reasonably possible that the total amounts of unrecognized tax benefits will significantly change in the next twelve months.
| 6. | Expenses: |
| a) | Investment Management Agreement – Hartford Funds Management Company, LLC (“HFMC”), an indirect wholly owned subsidiary of The Hartford Financial Services Group, Inc. (“The Hartford”), serves as investment manager to the Fund pursuant to an Investment Management Agreement with the Company. The investment manager has overall investment supervisory responsibility for the Fund. In addition, the investment manager provides administrative personnel, services, equipment, facilities and office space for proper operation of the Fund. Effective October 21, 2013, the investment manager has contracted with Wellington Management Company, LLP (“Wellington Management”) under a sub-advisory agreement for the provision of day-to-day investment management services to the Fund in accordance with the Fund’s investment objective and policies. Prior to October 21, 2013, Hartford Investment Management Company was the sub-adviser for the Fund. The Fund pays a fee to the investment manager, a portion of which may be used to compensate the sub-advisers. |
The schedule below reflects the rates of compensation paid to HFMC for investment management services rendered as of December 31, 2013; the rates are accrued daily and paid monthly.
| Average Daily Net Assets | Annual Fee | |||
| On next $5 billion | 0.4000% | |||
| On next $5 billion | 0.3800% | |||
| Over $10 billion | 0.3700% | |||
| b) | Accounting Services Agreement – Pursuant to the Fund Accounting Agreement between HFMC and the Company, on behalf of the Fund, HFMC provides accounting services to the Fund and receives monthly compensation based on the Fund’s average daily net assets at the rates set forth below. The Fund’s accounting services fees are accrued daily and paid monthly. |
| Average Daily Net Assets | Annual Fee | |||
| All Assets | 0.010% | |||
| c) | Operating Expenses – Allocable expenses incurred by the Company are allocated to each Fund and allocated to classes within a Fund in proportion to the average daily net assets of the Fund and each class, except where allocation of certain expenses is more fairly made directly to the Fund or to specific classes within a Fund. |
Prior to the Fund’s October 21, 2013 conversion from a money market fund to an ultrashort bond fund, the investment manager agreed to reimburse expenses or waive fees to the extent necessary to prevent earnings from falling below the level of expenses. Any such expense reimbursement or waiver, as shown on the Statement of Operations, was voluntary and could have been changed or terminated at any time without notice. There was no guarantee that the Fund maintained a $1.00 net asset value per share or any particular level of yield. Upon the Fund’s conversion to the Hartford Ultrashort Bond HLS Fund, as of October 21, 2013, any such expense reimbursement or waiver was terminated.
| d) | Fees Paid Indirectly – The Fund’s custodian bank has agreed to reduce its fees when the Fund maintains cash on deposit in a non-interest-bearing custody account. For the year ended December 31, 2013, these amounts, if any, are included in the Statement of Operations. |
| 22 |
The ratio of expenses to average net assets in the accompanying financial highlights excludes the reduction in expenses related to fees paid indirectly. The annualized expense ratio after waivers for the period listed below reflecting the reduction for fees paid indirectly is as follows:
| Year Ended December 31, 2013 | ||||
| Class IA | 0.21 | % | ||
| Class IB | 0.25 | |||
| e) | Distribution Plan for Class IB shares – Effective June 14, 2013, Hartford Investment Financial Services, LLC was renamed Hartford Funds Distributors, LLC (“HFD”). HFD, a wholly owned, ultimate subsidiary of The Hartford, serves as the Fund’s principal underwriter and distributor. The Company, on behalf of the Fund, has adopted a Distribution Plan pursuant to Rule 12b-1 of the 1940 Act to compensate the distributor, HFD, from assets attributable to the Class IB shares for services rendered and expenses borne in connection with activities primarily intended to result in the sale of the Class IB shares, subject to the review and approval of the Company’s Board of Directors. |
The Distribution Plan provides that the Fund may pay annually up to 0.25% of the average daily net assets of the Fund attributable to its Class IB shares for activities primarily intended to result in the sale of Class IB shares. The Board has the authority to suspend or reduce these payments at any point in time. Under the terms of the Distribution Plan and the principal underwriting agreement, the Fund is authorized to make payments monthly to the distributor that may be used to pay or compensate entities providing distribution and shareholder servicing with respect to the Class IB shares for such entities’ fees or expenses incurred or paid in that regard. These fees are accrued daily and paid monthly.
At a meeting held on February 4, 2009, the Board of Directors approved the temporary reduction of distribution and service fees under the Fund’s 12b-1 Plan of Distribution to zero for Class IB for a period of six months, effective March 1, 2009. The Board of Directors extended the reduction of payment of distribution and service fees until October 21, 2013, the conversion date to the Hartford Ultrashort Bond HLS Fund. The Fund’s action resulted in a corresponding temporary reduction of 12b-1 payments of amounts paid to financial intermediaries by the Fund’s distributor to zero for Class IB until October 21, 2013.
| f) | Other Related Party Transactions – Certain officers of the Fund are directors and/or officers of the investment manager and/or The Hartford or its subsidiaries. For the year ended December 31, 2013, a portion of the Fund’s Chief Compliance Officer’s salary was paid by all the investment companies in the Hartford fund complex. The portion allocated to the Fund was in the amount of $2. Hartford Administrative Services Company (“HASCO”), an indirect wholly owned subsidiary of The Hartford, provides transfer agent services to the Fund. HASCO was compensated on a per account basis for providing such services. The amount paid to HASCO can be found in the Statement of Operations. These fees are accrued daily and paid monthly. |
| 7. | Investment Transactions: |
For the year ended December 31, 2013, the Fund's aggregate purchases and sales of investment securities (excluding short-term investments) were as follows:
| Amount | ||||
| Cost of Purchases Excluding U.S. Government Obligations | $ | 1,130,367 | ||
| Sales Proceeds Excluding U.S. Government Obligations | 344,161 | |||
| Cost of Purchases for U.S. Government Obligations | 273,945 | |||
| Sales Proceeds for U.S. Government Obligations | 625,248 | |||
| 23 |
| Hartford Ultrashort Bond HLS Fund (formerly Hartford Money Market HLS Fund) |
| Notes to Financial Statements – (continued) |
| December 31, 2013 |
| (000’s Omitted) |
| 8. | Line of Credit: |
Effective October 21, 2013, the Fund is one of several Hartford funds that participate in a $500 million committed revolving line of credit facility. The facility is to be used for temporary or emergency purposes. Under the arrangement, the funds are required to own securities having a market value in excess of 300% of the total bank borrowings. The interest rate on borrowings varies depending on the nature of the loan. The facility also requires a fee to be paid based on the amount of the commitment. This commitment fee is allocated to all of the funds participating in the line of credit based on the average net assets of the funds. During the year ended December 31, 2013, the Fund did not have any borrowings under this facility.
| 9. | Industry Classifications: |
Other than the industry classifications “Other Investment Pools and Funds” and “Exchange Traded Funds,” equity industry classifications used in this report are the Global Industry Classification Standard, which was developed by and is the exclusive property and service mark of MSCI, Inc. and Standard & Poor’s.
| 10. | Indemnifications: |
Under the Company’s organizational documents, the Company shall indemnify its officers and directors to the full extent required or permitted under Maryland General Corporation Law and the federal securities laws. In addition, the Company, on behalf of the Fund, may enter into contracts that contain a variety of indemnifications. The Company’s maximum exposure under these arrangements is unknown. However, as of the date of these financial statements, the Company has not had prior claims or losses pursuant to these contracts and expects the risk of loss to be remote.
| 11. | Pending Legal Proceedings: |
On February 25, 2011, Jennifer L. Kasilag, Louis Mellinger, Judith M. Menendez, Jacqueline M. Robinson, and Linda A. Russell filed a derivative lawsuit against Hartford Investment Financial Services, LLC (“HIFSCO”)(now known as Hartford Funds Distributors, LLC) on behalf of six Hartford retail mutual funds in the United States District Court for the District of New Jersey, alleging that HIFSCO received excessive advisory and distribution fees in violation of its statutory fiduciary duty under Section 36(b) of the 1940 Act when serving as investment manager and principal underwriter, respectively, to the Hartford retail mutual funds. HIFSCO moved to dismiss and, in September 2011, the motion was granted in part and denied in part, with leave to amend the complaint. In November 2011, plaintiffs filed an amended complaint on behalf of certain Hartford retail mutual funds, The Hartford Global Health Fund (now known as The Hartford Healthcare Fund), The Hartford Conservative Allocation Fund, The Hartford Growth Opportunities Fund, The Hartford Inflation Plus Fund, The Hartford Advisers Fund (now known as The Hartford Balanced Fund), and The Hartford Capital Appreciation Fund. Plaintiffs seek to rescind the investment management agreements and distribution plans between HIFSCO and these funds and to recover the total fees charged thereunder or, in the alternative, to recover any improper compensation HIFSCO received, in addition to lost earnings. HIFSCO filed a partial motion to dismiss the amended complaint and, in December 2012, the court dismissed without prejudice the claims regarding distribution fees and denied the motion with respect to the advisory fees claims. HIFSCO disputes the allegations and intends to defend the advisory fee claims vigorously.
This action concerns the activities of HIFSCO in its capacity as investment manager and principal underwriter to the Hartford retail mutual funds and does not concern HIFSCO’s activities in its capacity as principal underwriter to the HLS funds. For this reason, no accrual for litigation relating to this matter has been recorded in the financial statements of the Fund.
| 12. | Reverse Stock Split: |
On October 21, 2013, a reverse stock split was declared for the Class IA and Class IB shares at a ten to one ratio. The effect of the reverse stock split was to divide the number of outstanding shares by the reverse split factor, with a corresponding increase in the net asset value per share. The split was executed at the closing rounded NAV as of the prior business day. This transaction did not change the net assets of the Fund and the total value of a shareholder’s investment in the Fund did not change as a result of the reverse stock split. Prior year values represented in the Statement of Changes in Net Assets have not been adjusted. Data presented in the Financial Highlights has been adjusted retroactively to account for the reverse stock split.
| 24 |
| Hartford Ultrashort Bond HLS Fund (formerly Hartford Money Market HLS Fund) |
| Financial Highlights |
| ─ Selected Per-Share Data(A) ─ | ─ Ratios and Supplemental Data ─ | |||||||||||||||||||||||||||||||||||||||||||||||||||
| Class | Net Asset Value at Beginning of Period | Net Investment Income (Loss) | Net Realized and Unrealized Gain (Loss) on Investments | Total from Investment Operations | Dividends from Net Investment Income | Distributions from Realized Capital Gains | Total Dividends and Distributions | Net Asset Value at End of Period | Total Return(B) | Net Assets at End of Period (000s) | Ratio of Expenses to Average Net Assets Before Adjust- ments(C) | Ratio of Expenses to Average Net Assets After Adjust- ments(C) | Ratio of Net Investment Income (Loss) to Average Net Assets | |||||||||||||||||||||||||||||||||||||||
| For the Year Ended December 31, 2013 (D),(E) | ||||||||||||||||||||||||||||||||||||||||||||||||||||
| IA | $ | 10.00 | $ | – | $ | – | $ | – | $ | – | $ | – | $ | – | $ | 10.00 | – | % | $ | 1,013,110 | 0.45 | % | 0.21 | % | (0.02 | )% | ||||||||||||||||||||||||||
| IB | 10.00 | (0.01 | ) | – | (0.01 | ) | – | – | – | 9.99 | (0.10 | ) | 163,058 | 0.49 | 0.25 | (0.06 | ) | |||||||||||||||||||||||||||||||||||
| For the Year Ended December 31, 2012 (D),(E) | ||||||||||||||||||||||||||||||||||||||||||||||||||||
| IA | $ | 10.00 | $ | – | $ | – | $ | – | $ | – | $ | – | $ | – | $ | 10.00 | – | % | $ | 1,603,657 | 0.42 | % | 0.18 | % | – | % | ||||||||||||||||||||||||||
| IB | 10.00 | – | – | – | – | – | – | 10.00 | – | 272,464 | 0.42 | 0.18 | – | |||||||||||||||||||||||||||||||||||||||
| For the Year Ended December 31, 2011 (D),(E) | ||||||||||||||||||||||||||||||||||||||||||||||||||||
| IA | $ | 10.00 | $ | – | $ | – | $ | – | $ | – | $ | – | $ | – | $ | 10.00 | – | % | $ | 1,970,312 | 0.42 | % | 0.16 | % | – | % | ||||||||||||||||||||||||||
| IB | 10.00 | – | – | – | – | – | – | 10.00 | – | 376,648 | 0.42 | 0.16 | – | |||||||||||||||||||||||||||||||||||||||
| For the Year Ended December 31, 2010 (D),(E) | ||||||||||||||||||||||||||||||||||||||||||||||||||||
| IA | $ | 10.00 | $ | – | $ | – | $ | – | $ | – | $ | – | $ | – | $ | 10.00 | – | % | $ | 2,086,014 | 0.43 | % | 0.22 | % | – | % | ||||||||||||||||||||||||||
| IB | 10.00 | – | – | – | – | – | – | 10.00 | – | 419,519 | 0.43 | 0.22 | – | |||||||||||||||||||||||||||||||||||||||
| For the Year Ended December 31, 2009 (D),(E) | ||||||||||||||||||||||||||||||||||||||||||||||||||||
| IA | $ | 10.00 | $ | – | $ | – | $ | – | $ | – | $ | – | $ | – | $ | 10.00 | 0.06 | % | $ | 2,820,121 | 0.48 | % | 0.32 | % | 0.02 | % | ||||||||||||||||||||||||||
| IB | 10.00 | – | – | – | – | – | – | 10.00 | 0.05 | 548,134 | 0.53 | 0.34 | 0.00 | |||||||||||||||||||||||||||||||||||||||
| (A) | Information presented relates to a share outstanding throughout the indicated period. Net investment income (loss) per share amounts are calculated based on average shares outstanding unless otherwise noted. |
| (B) | The figures do not include sales charges or other fees which may be applied at the variable life insurance, variable annuity or qualified retirement plan product level. Any such additional sales charges or other fees would lower the Fund's performance. |
| (C) | Adjustments include waivers and reimbursements, if applicable. Ratios do not include fees paid indirectly (see Expenses in the accompanying Notes to Financial Statements). |
| (D) | Per share amounts have been restated to reflect a reverse stock split effective October 21, 2013. Please see Notes to Financial Statements. |
| (E) | Net investment income (loss) per share amounts have been calculated using the SEC method. |
Portfolio Turnover | ||||
| For the Period Ended December 31, 2013 | 6 | %(A) | ||
| For the Year Ended December 31, 2012 | N/A | (B) | ||
| For the Year Ended December 31, 2011 | N/A | (B) | ||
| For the Year Ended December 31, 2010 | N/A | (B) | ||
| For the Year Ended December 31, 2009 | N/A | (B) |
| (A) | Portfolio turnover shown is from October 21, 2013 (conversion date) through December 31, 2013. |
| (B) | The Fund was managed as a money market fund and portfolio turnover was not calculated. |
| 25 |
| Report of Independent Registered Public Accounting Firm |
| The Board of Directors and Shareholders of |
| Hartford Series Fund, Inc. |
We have audited the accompanying statement of assets and liabilities, including the schedule of investments, of Hartford Ultrashort Bond HLS Fund (formery known as Hartford Money Market HLS Fund) (one of the portfolios constituting Hartford Series Fund, Inc. (the Funds)) as of December 31, 2013, and the related statement of operations for the year then ended, the statements of changes in net assets for each of the two years in the period then ended, and the financial highlights for each of the five years in the period then ended. These financial statements and financial highlights are the responsibility of the Funds’ management. Our responsibility is to express an opinion on these financial statements and financial highlights based on our audits.
We conducted our audits in accordance with the standards of the Public Company Accounting Oversight Board (United States). Those standards require that we plan and perform the audit to obtain reasonable assurance about whether the financial statements and financial highlights are free of material misstatement. We were not engaged to perform an audit of the Funds’ internal control over financial reporting. Our audits included consideration of internal control over financial reporting as a basis for designing audit procedures that are appropriate in the circumstances, but not for the purpose of expressing an opinion on the effectiveness of the Funds’ internal control over financial reporting. Accordingly, we express no such opinion. An audit also includes examining, on a test basis, evidence supporting the amounts and disclosures in the financial statements and financial highlights, assessing the accounting principles used and significant estimates made by management, and evaluating the overall financial statement presentation. Our procedures included confirmation of securities owned as of December 31, 2013, by correspondence with the custodian and brokers or by other appropriate auditing procedures where replies from brokers were not received. We believe that our audits provide a reasonable basis for our opinion.
In our opinion, the financial statements and financial highlights referred to above present fairly, in all material respects, the financial position of Hartford Ultrashort Bond HLS Fund of the Hartford Series Fund, Inc. at December 31, 2013, the results of its operations for the year then ended, the changes in its net assets for each of the two years in the period then ended, and the financial highlights for each of the five years in the period then ended, in conformity with U.S. generally accepted accounting principles.
Minneapolis, MN
February 17, 2014
| 26 |
| Hartford Ultrashort Bond HLS Fund (formerly Hartford Money Market HLS Fund) |
| Directors and Officers (Unaudited) |
The Board of Directors of the Company appoints officers who are responsible for the day-to-day operations of the Fund and who execute policies formulated by the directors. Each director serves until his or her death, resignation, or retirement or until the next annual meeting of shareholders is held or until his or her successor is elected and qualifies.
Directors and officers who are employed by or who have a financial interest in The Hartford are considered “interested” persons of the Fund pursuant to the 1940 Act. Each officer and two of the Company’s directors, as noted in the chart below, are “interested” persons of the Fund. Each director serves as a director for The Hartford Mutual Funds, Inc., The Hartford Mutual Funds II, Inc., Hartford Series Fund, Inc., Hartford HLS Series Fund II, Inc., and as a trustee for The Hartford Alternative Strategies Fund, which, as of December 31, 2013, collectively consist of 91 funds. Correspondence may be sent to directors and officers c/o Hartford Funds, 5 Radnor Corporate Center, Suite 300, 100 Matsonford Road, Radnor, Pennsylvania 19087, except that correspondence to Mr. Annoni, Mr. Dressen and Ms. Quade may be sent to 500 Bielenberg Drive, Woodbury, Minnesota 55125.
The table below sets forth, for each director and officer, his or her name, year of birth, current position with the Company and date first elected or appointed to Hartford Series Fund, Inc. (“HSF”), and Hartford HLS Series Fund II, Inc. (“HSF2”), principal occupation, and, for directors, other directorships held. The Fund’s Statement of Additional Information contains further information on the directors and is available free of charge by calling 1-800-862-6668 or writing to Hartford HLS Funds, c/o Hartford Life Insurance Company, Hartford Life and Annuity Insurance Company, P.O. Box 14293, Lexington, KY 40512-4293.
Information on the aggregate remuneration paid to the directors of the Company can be found in the Statement of Operations herein. The Fund pays to The Hartford a portion of the Chief Compliance Officer’s compensation, but does not pay salaries or compensation to any of their other officers or directors who are employed by The Hartford.
Non-Interested Directors
Lynn S. Birdsong (1946) Director since 2003, Co-Chairman of the Investment Committee since 2005
Mr. Birdsong is a private investor. Mr. Birdsong currently serves as a Director of the Sovereign High Yield Investment Company (April 2010 to current). Mr. Birdsong currently serves as an Independent Director of Nomura Partners Funds, Inc. (formerly, The Japan Fund) (April 2003 to current). From 2003 to March 2005, Mr. Birdsong was an Independent Director of the Atlantic Whitehall Funds. From 1979 to 2002, Mr. Birdsong was a Managing Director of Zurich Scudder Investments, an investment management firm. During his employment with Scudder, Mr. Birdsong was an Interested Director of The Japan Fund. From January 1981 through December 2013, Mr. Birdsong was a partner in Birdsong Company, an advertising specialty firm.
Robert M. Gavin, Jr. (1940) Director since 2002 (HSF) and 1986 (HSF2), Chairman of the Board since 2004
Dr. Gavin is an educational consultant. Prior to September 1, 2001, he was President of Cranbrook Education Community and prior to July 1996, he was President of Macalester College, St. Paul, Minnesota.
Duane E. Hill (1945) Director since 2001 (HSF) and 2002 (HSF2), Chairman of the Nominating Committee since 2003
Mr. Hill is a Partner of TSG Ventures L.P., a private equity investment company. Mr. Hill is a former partner of TSG Capital Group, a private equity investment firm that served as sponsor and lead investor in leveraged buyouts of middle market companies.
Sandra S. Jaffee (1941) Director since 2005
Ms. Jaffee is the founder and Chief Executive Officer of a private company, Homeworks Concierge, LLC, which provides residential property management services in Westchester County, New York (January 2012 to present). Ms. Jaffee served as Chairman (2008 to 2009) and Chief Executive Officer of Fortent (formerly Searchspace Group), a leading provider of compliance/regulatory technology to financial institutions from August 2005 to August 2009. Ms. Jaffee currently serves as a member of the Board of Directors of Broadridge Financial Solutions as well as a Trustee of Muhlenberg College.
| 27 |
| Hartford Ultrashort Bond HLS Fund (formerly Hartford Money Market HLS Fund) |
| Directors and Officers (Unaudited) – (continued) |
William P. Johnston (1944) Director since 2005, Chairman of the Compliance Committee since 2005
In June 2006, Mr. Johnston was appointed as Senior Advisor to The Carlyle Group, a global private equity and alternative asset investment firm and currently serves as an Operating Executive. In July 2006, Mr. Johnston was elected to the Board of Directors of MultiPlan, Inc. and served as a Director (July 2006 to August 2010). In August 2007, Mr. Johnston was elected to the Board of Directors of LifeCare Holdings, Inc. and served as a Director (August 2007 to June 2013). In February 2008, Mr. Johnston was elected to the Board of Directors of HCR-ManorCare, Inc. In May 2006, Mr. Johnston was elected to the Supervisory Board of Fresenius Medical Care AG & Co. KGaA, after its acquisition of Renal Care Group, Inc. in March 2006. Mr. Johnston joined Renal Care Group in November 2002 as a member of the Board of Directors and served as Chairman of the Board from March 2003 through March 2006. From 2002 through 2013, Mr. Johnston served as a Board member of the Georgia O’Keefe Museum. From September 1987 to December 2002, Mr. Johnston was with Equitable Securities Corporation (and its successors, SunTrust Equitable Securities and SunTrust Robinson Humphrey) serving in various investment banking and managerial positions, including Managing Director and Head of Investment Banking, Chief Executive Officer and Vice Chairman.
Phillip O. Peterson (1944) Director since 2002 (HSF) and 2000 (HSF2), Chairman of the Audit Committee since 2002
Mr. Peterson is a mutual fund industry consultant. He was a partner of KPMG LLP (an accounting firm) until July 1999. Mr. Peterson joined William Blair Funds in February 2007 as a member of the Board of Trustees. Mr. Peterson also joined the Board of Trustees of Symetra Variable Mutual Funds Trust as a trustee in February 2012.
Lemma W. Senbet (1946) Director since 2005
Dr. Senbet is the William E. Mayer Chair Professor of Finance and Founding Director, Center for Financial Policy, at the University of Maryland, Robert H. Smith School of Business. He was chair of the Finance Department of the University of Maryland, Robert H. Smith School of Business from 1998 to 2006. Since June 2013, he has been on leave from the University to serve as Executive Director of African Economic Research Consortium which focuses on economic policy research and training. Previously, he was a chaired professor of finance at the University of Wisconsin-Madison. Also, he was a Director of the Fortis Funds from March 2000 to July 2002. Dr. Senbet served as Director of the American Finance Association and President of the Western Finance Association. In 2006, Dr. Senbet was inducted Fellow of Financial Management Association International for his career-long distinguished scholarship and professional service.
Interested Directors and Officers
James E. Davey (1964) Director since 2012, President and Chief Executive Officer since 2010
Mr. Davey serves as Executive Vice President of Hartford Life Insurance Company (“HLIC”) and The Hartford Financial Services Group, Inc. Additionally, Mr. Davey serves as Chairman of the Board, Manager and Senior Managing Director of Hartford Funds Distributors, LLC (“HFD”). He also currently serves as Director, Chairman of the Board, President and Senior Managing Director of Hartford Administrative Services Company (“HASCO”). Mr. Davey also serves as Manager, Chairman of the Board and Senior Managing Director for Hartford Funds Management Company, LLC (“HFMC”). Mr. Davey joined The Hartford in 2002.
Lowndes A. Smith (1939) Director since 1996 (HSF) and 2002 (HSF2), Co-Chairman of the Investment Committee since 2005
Mr. Smith served as Vice Chairman of The Hartford from February 1997 to January 2002, as President and Chief Executive Officer of Hartford Life, Inc. from February 1997 to January 2002, and as President and Chief Operating Officer of The Hartford Life Insurance Companies from January 1989 to January 2002. Mr. Smith serves as a Director of White Mountains Insurance Group Ltd. (October 2003 to current); One Beacon Insurance (October 2006 to current); Symetra Financial (August 2007 to current) and is a Managing Director of Whittington Gray Associates (January 2007 to current).
Other Officers
Mark A. Annoni (1964) Vice President, Controller and Treasurer since 2012
Mr. Annoni currently serves as the Assistant Vice President of HLIC (February 2004 to present).
| 28 |
Michael R. Dressen (1963) AML Compliance Officer since 2011
Mr. Dressen currently serves as Assistant Vice President of HLIC. He also serves as Chief Compliance Officer and AML Compliance Officer of HASCO and as AML Officer of HFD. Mr. Dressen has served in various positions within The Hartford and its subsidiaries in connection with the operation of the Hartford Funds.
Edward P. Macdonald (1967) Vice President, Secretary and Chief Legal Officer since 2005
Mr. Macdonald currently serves as Assistant Secretary, Executive Vice President and Deputy General Counsel of HFD, HASCO and HFMC. He also serves as Vice President of HLIC. Mr. Macdonald has served in various positions within The Hartford and its subsidiaries in connection with the operation of the Hartford Funds. Mr. Macdonald joined The Hartford in 2005.
Joseph G. Melcher (1973) Vice President and Chief Compliance Officer since 2013
Mr. Melcher currently serves as Executive Vice President of HASCO and HFD. Mr. Melcher also currently serves as Executive Vice President and Chief Compliance Officer of HFMC. Mr. Melcher has served in various positions within The Hartford and its subsidiaries in connection with the operation of the Hartford Funds since joining The Hartford in 2012. Prior to joining The Hartford, Mr. Melcher worked at Touchstone Investments, a member of the Western & Southern Financial Group, where he held the position of Vice President and Chief Compliance Officer from 2010 through 2012 and Assistant Vice President, Compliance from 2005 to 2010.
Vernon J. Meyer (1964) Vice President since 2006
Mr. Meyer currently serves as Senior Vice President of HLIC. He also currently serves as Managing Director and Chief Investment Officer of HFMC. Mr. Meyer has served in various positions within The Hartford and its subsidiaries in connection with the operation of the Hartford Funds. Mr. Meyer joined The Hartford in 2004.
Laura S. Quade (1969) Vice President since 2012
Ms. Quade currently serves as Vice President of HASCO and HFD. She is the Head of Operations of HASCO and also serves as Director, Enterprise Operations of HLIC. Ms. Quade has served in various positions within The Hartford and its subsidiaries in connection with the operation of the Hartford Funds.
Martin A. Swanson (1962) Vice President since 2010
Mr. Swanson currently serves as Vice President of HLIC. Mr. Swanson also serves as Managing Director, Chief Marketing Officer and Principal of HFD. Mr. Swanson has served in various positions within The Hartford and its subsidiaries in connection with the operation of the Hartford Funds.
HOW TO OBTAIN A COPY OF THE FUND’S PROXY VOTING POLICIES AND VOTING RECORDS (UNAUDITED)
A description of the policies and procedures that the Fund uses to determine how to vote proxies relating to portfolio securities and information about how the Fund voted proxies relating to portfolio securities during the most recent twelve-month period ended June 30 are available (1) without charge, upon request, by calling 800-862-6668 and (2) on the SEC’s website at http://www.sec.gov.
QUARTERLY PORTFOLIO HOLDINGS INFORMATION (UNAUDITED)
The Fund files a complete schedule of portfolio holdings with the SEC for the first and third quarters of each fiscal year on Form N-Q. The Fund’s Forms N-Q are available (1) without charge, upon request, by calling 800-862-6668 and (2) on the SEC’s website at http://www.sec.gov. The Form N-Q may be reviewed and copied at the SEC’s Public Reference Room in Washington, DC. Information on the operation of the Public Reference Room may be obtained by calling 1-800-SEC-0330.
| 29 |
| Hartford Ultrashort Bond HLS Fund (formerly Hartford Money Market HLS Fund) |
| Expense Example (Unaudited) |
Your Fund's Expenses
As a shareholder of the Fund, you incur two types of costs: (1) transaction costs and (2) ongoing costs, including investment management fees, distribution and/or service (12b-1) fees, if any, and other fund expenses. This example is intended to help you understand your ongoing costs (in dollars) of investing in the Fund and to compare these costs with the ongoing costs of investing in other mutual funds. The example is based on an investment of $1,000 invested at the beginning of the period and held for the period of June 30, 2013 through December 31, 2013.
Actual Expenses
The first set of columns of the table below provides information about actual account values and actual expenses. You may use the information in this column, together with the amount you invested, to estimate the expenses that you paid over the period. Simply divide your account value by $1,000 (for example, an $8,600 account value divided by $1,000 = 8.6), then multiply the result by the number in the line under the heading entitled “Expenses Paid During Period” to estimate the expenses you paid on your account during this period.
Hypothetical Example for Comparison Purposes
The second set of columns of the table below provides information about hypothetical account values and hypothetical expenses based on the Fund’s actual expense ratio and an assumed rate of return of 5% per year before expenses, which is not the Fund’s actual return. The hypothetical account values and expenses may not be used to estimate the actual ending account balance or expenses you paid for the period. You may use this information to compare the ongoing costs of investing in the Fund and other funds. To do so, compare this 5% hypothetical example with the 5% hypothetical examples that appear in the shareholder reports of the other funds.
Please note that the expenses shown in the table are meant to highlight your ongoing costs only and do not reflect any transactional costs, such as sales charges (loads) and CDSC. Therefore, the second set of columns of the table is useful in comparing ongoing costs only, and will not help you determine the relative total costs of owning different funds. In addition, if these transactional costs were included, your costs would be higher. Expenses are equal to the Fund's annualized expense ratios multiplied by average account value over the period, multiplied by 184/365 (to reflect the one-half year period).
| Actual return | Hypothetical (5% return before expenses) | |||||||||||||||||||||||||||||||
| Beginning Account Value June 30, 2013 | Ending Account Value December 31, 2013 | Expenses paid during the period June 30, 2013 through December 31, 2013 | Beginning Account Value June 30, 2013 | Ending Account Value December 31, 2013 | Expenses paid during the period June 30, 2013 through December 31, 2013 | Annualized expense ratio | Days in the current 1/2 year | Days in the full year | ||||||||||||||||||||||||
| Class IA | $ | 1,000.00 | $ | 1,000.00 | $ | 1.36 | $ | 1,000.00 | $ | 1,023.84 | $ | 1.38 | 0.27 | % | 184 | 365 | ||||||||||||||||
| Class IB | $ | 1,000.00 | $ | 999.00 | $ | 1.78 | $ | 1,000.00 | $ | 1,023.42 | $ | 1.81 | 0.35 | % | 184 | 365 | ||||||||||||||||
| 30 |
| Hartford Ultrashort Bond HLS Fund (formerly Hartford Money Market HLS Fund) |
| Approval of Investment Management and Investment Sub-Advisory Agreements (Unaudited) |
Section 15(c) of the Investment Company Act of 1940, as amended (the “1940 Act”), requires that each mutual fund’s board of directors, including a majority of those directors who are not “interested persons” of the mutual fund, as defined in the 1940 Act (the “Independent Directors”), annually review and consider the continuation of the mutual fund’s investment advisory and sub-advisory agreements. At its meeting held on August 6-7, 2013, the Board of Directors (the “Board”) of Hartford Series Fund, Inc., including each of the Independent Directors, unanimously voted to approve the continuation of the investment management agreement for Hartford Ultrashort Bond HLS Fund (formerly Hartford Money Market HLS Fund) (the “Fund”) with Hartford Funds Management Company, LLC (“HFMC”) (the “HFMC Agreement”) and the continuation of the investment sub-advisory agreement between HFMC and the Fund’s sub-adviser, Hartford Investment Management Company (“Hartford Investment Management” or the “Sub-adviser” and, together with HFMC, the “Advisers”) (the “Hartford Investment Management Agreement” and, together with the HFMC Agreement, the “Agreements”).
As disclosed in the Fund’s semi-annual report dated June 30, 2013, at its June 18, 2013 meeting, the Board approved certain changes to the Fund to convert the Fund from a money market fund to an ultra-short bond fund. To effect the conversion, the Board approved changes to the Fund’s name, investment objective and principal investment strategy, and also approved a new investment sub-advisory agreement with Wellington Management Company, LLP with respect to the Fund (the “Wellington Agreement”). Each of these changes and the Wellington Agreement took effect on October 21, 2013, the date on which the Fund’s conversion to an ultra-short bond fund occurred (the “Conversion Date”). At its August 2013 meeting, the Board considered the continuation of the Hartford Investment Management Agreement through the Conversion Date as Hartford Investment Management would no longer serve as the Fund’s sub-adviser after the Conversion Date and the Hartford Investment Management Agreement would terminate at such time.
In the months preceding the August 6-7, 2013 meeting, the Board requested, received, and reviewed written responses from the Advisers to questions posed to them on behalf of the Independent Directors and supporting materials relating to those questions and responses. The Board considered information furnished to the Board at its meetings throughout the year, as well as information specifically prepared in connection with the annual approval of the Agreements at the Board’s meetings held on June 18-19, 2013 and August 6-7, 2013. Information provided to the Board at its meetings throughout the year included, among other things, reports on Fund performance, legal and compliance matters, sales and marketing activity, shareholder services, and the other services provided to the Fund by the Advisers and their affiliates. The Board also received in-person presentations by Fund officers and representatives of HFMC at the Board’s meetings on June 18-19, 2013 and August 6-7, 2013 concerning the Agreements.
The Independent Directors, advised by independent legal counsel, engaged two service providers to assist them with evaluating the Agreements with respect to the Fund. Lipper Inc. (“Lipper”), an independent provider of investment company data, was retained to provide the Board with reports on how the Fund’s contractual management fees, actual management fees, other non-management fees, overall expense ratios and investment performance compared to those of mutual funds with similar investment objectives. The Independent Directors also engaged an independent financial services consulting firm (the “Consultant”) to assist them in evaluating the Fund’s management fees, sub-advisory fees, other non-management fees, overall expense ratios and investment performance. In addition, the Consultant reviewed the profitability calculations utilized by HFMC in connection with the continuation of the investment management agreement.
In determining whether to continue the Agreements for the Fund, the members of the Board reviewed and evaluated information and factors they believed to be relevant and appropriate in light of the information that the Board deemed necessary and appropriate through the exercise of its reasonable business judgment. While individual members of the Board may have weighed certain factors differently, the Board’s determination to continue the Agreements was based on a comprehensive consideration of all information provided to the Board throughout the year and specifically with respect to the continuation of the Agreements. A more detailed discussion of the factors the Board considered with respect to its approval of the Agreements is provided below.
Nature, Extent, and Quality of Services Provided by the Advisers
The Board requested and considered information concerning the nature, extent, and quality of the services provided to the Fund by the Advisers. The Board considered, among other things, the terms of the Agreements and the range of services provided by the Advisers. The Board considered the Advisers’ professional personnel who provide services to the Fund, including each Adviser’s ability and experience in attracting and retaining qualified personnel to service the Fund. The Board considered each Adviser’s reputation and overall financial strength, as well as its willingness to consider and implement organizational and
| 31 |
| Hartford Ultrashort Bond HLS Fund (formerly Hartford Money Market HLS Fund) |
| Approval of Investment Management and Investment Sub-Advisory Agreements (Unaudited) – (continued) |
operational changes designed to improve services to the Fund. In addition, the Board considered the quality of each Adviser’s communications with the Board and responsiveness to Board inquiries.
The Board also requested and evaluated information concerning each Adviser’s regulatory and compliance environment. In this regard, the Board requested and reviewed information on each Adviser’s compliance policies and procedures, compliance history, and a report from the Fund’s Chief Compliance Officer on each Adviser’s compliance with applicable laws and regulations, including responses to regulatory developments and compliance issues raised by regulators. The Board also noted the Advisers’ support of the Fund’s compliance control structure, particularly the resources devoted by the Advisers in support of the Fund’s obligations pursuant to Rule 38a-1 under the 1940 Act.
With respect to HFMC, the Board noted that under the Agreements, HFMC is responsible for the management of the Fund, including overseeing fund operations and service providers, as well as investment advisory services in connection with selecting, monitoring and supervising the Sub-adviser. The Board considered HFMC’s ongoing monitoring of people, process and performance, including its quarterly reviews of each of the Hartford Funds, semi-annual meetings with the leaders of each Fund’s portfolio management team, and oversight of the Funds’ approximately 40 portfolio managers. The Board recognized that HFMC has demonstrated a record of making changes to the management and/or strategies of the Funds when warranted. The Board considered HFMC’s oversight of the Sub-adviser’s investment approach and results, process for monitoring best execution of portfolio trades by the Sub-adviser, and approach to risk management with respect to the Fund and the service providers to the Fund. The Board also considered HFMC’s oversight of compliance with the Fund’s objective and policies as well as with applicable laws and regulations, noting that regulatory and other developments had over time led to an increase in the scope of HFMC’s services in this regard.
In addition, the Board considered HFMC’s ongoing commitment to review and rationalize the Hartford Funds product line-up and the expenses that HFMC had incurred in connection with fund combinations in recent years. The Board considered that HFMC or its affiliates are responsible for providing the Fund’s officers. The Board also noted that Hartford Life Insurance Company (“HLIC”) provides administrative services to the Fund. The Board considered its experiences with HFMC and HLIC with respect to each of these services.
With respect to the Sub-adviser, who provides day-to-day portfolio management services, the Board considered the quality of the Fund’s portfolio managers, the Sub-adviser’s other investment personnel, its investment philosophy and process, investment research capabilities and resources, performance record, trade execution capabilities and experience. The Board considered the experience of the Fund’s portfolio managers, the number of accounts managed by the portfolio managers, and the Sub-adviser’s method for compensating the portfolio managers.
Based on these considerations, the Board concluded that it was satisfied with the nature, extent and quality of the services provided to the Fund by HFMC and the Sub-adviser.
Performance of the Fund and the Advisers
The Board considered the investment performance of the Fund. In this regard, the Board reviewed the performance of the Fund over different time periods presented in the materials and evaluated HFMC’s analysis of the Fund’s performance for these time periods. The Board considered information and materials provided to the Board by the Advisers concerning Fund performance, as well as information from Lipper comparing the investment performance of the Fund to an appropriate benchmark and universe of peer funds. The Board noted that the Fund’s performance was in the 3rd quintile of its performance universe for the 1-year period and the 4th quintile for the 3- and 5-year periods. The Board also noted that the Fund’s performance was in line with its benchmark for the 1-, 3- and 5-year periods. The Board noted recent changes to the Fund’s portfolio management team. It was also noted that the Board had approved HFMC’s proposal to convert the Fund to an ultra-short bond fund.
The Board considered the detailed investment analytics reports provided by Hartford Funds’ Investment Advisory Group throughout the year. These reports include, among other things, information on the Fund’s gross and net returns, the Fund’s investment performance relative to an appropriate benchmark and peer group, various statistics concerning the Fund’s portfolio, and a narrative summary of various factors affecting Fund performance. The Board considered the Advisers’ cooperation with the Investment Committee, which assists the Board in evaluating the performance of the Fund at periodic meetings throughout the year. The Board also considered the analysis provided by the Consultant relating to the Fund’s performance track record.
| 32 |
In light of all the considerations noted above, the Board concluded that it had continued confidence in HFMC’s and the Sub-adviser’s overall capabilities to manage the Fund.
Costs of the Services and Profitability of the Advisers
The Board reviewed information regarding HFMC’s cost to provide investment management and related services to the Fund and HFMC’s profitability, both overall and for the Fund, on a pre-tax basis without regard to distribution expenses. The Board also requested and reviewed information about the profitability to HFMC and its affiliates from all services provided to the Fund and all aspects of their relationship with the Fund. The Board noted that the fees payable to the Sub-adviser are equal to its estimated costs in providing sub-advisory services. Accordingly, the costs and profitability for the Sub-adviser and HFMC were considered in the aggregate.
The Board considered the Consultant’s review of the profitability calculations utilized by HFMC in connection with the continuation of the investment management agreement, noting the Consultant’s view that Hartford Funds’ process for calculating and reporting Fund profitability is reasonable. In this regard, the Board noted that the Consultant had previously performed a full review of this process and reported that such process is sound and well within common industry practice.
Based on these considerations, the Board concluded that the profits anticipated to be realized by the Advisers and their affiliates from their relationships with the Fund would not be excessive.
Comparison of Fees and Services Provided by the Advisers
The Board considered comparative information with respect to the management fees to be paid by the Fund to HFMC and the total expense ratios of the Fund. The Board also considered comparative information with respect to the sub-advisory fees to be paid by HFMC to the Sub-adviser, to the extent applicable. In this regard, the Board requested and reviewed information from HFMC and the Sub-adviser relating to the management and sub-advisory fees and total operating expenses for the Fund. The Board considered that the management fee for the Fund includes the fee paid to HLIC for providing certain administrative services to the Fund. The Board also reviewed information from Lipper comparing the Fund’s contractual management fees, actual management fees and overall expense ratios relative to a group of funds selected by Lipper, in consultation with the Consultant, and a broader universe of funds selected by Lipper. The Board noted that the Fund’s contractual management fee was in the 3rd quintile of its expense group, while its actual management fee and total expenses (less 12b-1 and shareholder service fees) were in the 1st quintile. The Board noted that the Fund’s investment manager has waived a portion of the Fund’s contractual management fee and other expenses since 2008 and the Fund’s distributor has waived 12b-1 fees since 2009.
While the Board recognized that comparisons between the Fund and peer funds are imprecise, given the differing service levels and characteristics of mutual funds and the different business models and cost structures of the Advisers, the comparative information provided by Lipper assisted the Board in evaluating the reasonableness of the Fund’s management and sub-advisory fees and total operating expenses. In addition, the Board considered the analysis and recommendations of the Consultant relating to the Fund’s management and sub-advisory fees and total operating expenses.
Based on these considerations, the Board concluded that the Fund’s fees and total operating expenses, in conjunction with the information about quality of services, profitability, economies of scale, and other matters discussed, were reasonable in light of the services provided.
Economies of Scale
The Board requested and considered information regarding the Advisers’ realization of economies of scale with respect to the Fund and whether the fee levels reflect these economies of scale for the benefit of the Fund’s shareholders. The Board reviewed the breakpoints in the management fee schedule for the Fund, which reduce fee rates as Fund assets grow over time. The Board recognized that a fund with assets beyond the last breakpoint level will continue to benefit from economies of scale because additional assets are charged the lowest breakpoint fee resulting in lower overall effective management fee rates. The Board also recognized that a fee schedule that reaches a lower breakpoint quickly provides shareholders with the benefit of anticipated or
| 33 |
| Hartford Ultrashort Bond HLS Fund (formerly Hartford Money Market HLS Fund) |
| Approval of Investment Management and Investment Sub-Advisory Agreements (Unaudited) – (continued) |
potential economies of scale. The Board noted the effect of the sale and run-off of the variable annuity business on the HLS Funds.
The Board reviewed and evaluated materials from Lipper showing how management fee schedules of peer funds reflect economies of scale for the benefit of shareholders as a peer fund’s assets hypothetically increase over time. Based on information provided by HFMC, Lipper, and the Consultant, the Board recognized that there is no uniform methodology for establishing breakpoints or uniform pattern in asset levels that trigger breakpoints or the amounts of breakpoints triggered.
After considering all of the information available to it, the Board concluded that it was satisfied with the extent to which economies of scale would be shared for the benefit of the Fund’s shareholders based on currently available information and the effective advisory fees and expense ratios for the Fund at its current and reasonably anticipated asset levels. The Board noted, however, that it would continue to monitor future growth in Fund assets and the appropriateness of additional breakpoints.
Other Benefits
The Board considered other benefits to the Advisers and their affiliates from their relationships with the Fund, including the role of the Fund in supporting the variable life insurance and variable annuity products offered by The Hartford.
The Board reviewed information noting that HLIC, an affiliate of HFMC, receives fees for providing certain administrative services to the Fund and that HFMC receives fees for fund accounting and related services from the Fund. The Board considered information on profits to HLIC and HFMC for such services. The Board also considered that Hartford Administrative Services Company (“HASCO”), the Fund’s transfer agent and an affiliate of HFMC, receives transfer agency compensation from the Fund, and the Board reviewed information on the profitability of the Fund’s transfer agency function to HASCO. The Board considered information provided by HASCO indicating that the transfer agent fees charged by HASCO to the Fund were fair and reasonable based on publicly available information.
The Board also considered that Hartford Funds Distributors, LLC (“HFD”), an affiliate of HFMC, serves as principal underwriter of the Fund. As principal underwriter, HFD receives 12b-1 fees from the Fund. The Board also noted that certain affiliates of HFD distribute shares of the Fund and receive compensation in that connection.
The Board considered the benefits, if any, to the Sub-adviser from any use of the Fund’s brokerage commissions to obtain soft dollar research.
The Board considered the benefits to shareholders of being part of the Hartford Funds family of funds. The Board considered HFMC’s efforts to provide investors in the family with a broad range of investment styles and asset classes.
* * * *
Based upon its review of these various factors, among others, the Board concluded that it is in the best interests of the Fund and its shareholders for the Board to approve the Agreements for an additional year. In reaching this decision, the Board did not assign relative weights to the factors discussed above or deem any one or group of them to be controlling in and of themselves. In connection with their deliberations, the Independent Directors met separately in executive session on several occasions, with independent legal counsel and the Consultant, to review the relevant materials and consider their responsibilities under relevant laws and regulations.
| 34 |
| Hartford Ultrashort Bond HLS Fund (formerly Hartford Money Market HLS Fund) |
| Main Risks (Unaudited) |
The main risks of investing in the Fund are described below.
Market, Selection, and Strategy Risk: The Fund’s share price may fluctuate due to market risk and/or security selections that may underperform the market or relevant benchmarks. If the sub-adviser’s investment strategy does not perform as expected, the Fund could underperform its peers or lose money. There is no guarantee the Fund will achieve its stated objective.
Fixed Income Risk: The Fund is subject to interest rate risk (the risk that the value of an investment decreases when interest rates rise) and credit risk (the risk that the issuing company of a security is unable to pay interest and principal when due) and call risk (the risk that an investment may be redeemed early). These risks also apply to the Fund’s investments in U.S. government securities, which may not be guaranteed by the U.S. government.
Mortgage-Backed Securities Risk: Mortgage-backed securities are subject to interest rate risk, credit risk, prepayment risk, extension risk, and the risk that an investment’s value may be reduced or become worthless if it receives interest or income payments only after other investments in the same pool.
Derivatives Risk: Investments in derivatives can be volatile. Potential risks include currency risk, leverage risk (the risk that small market movements may result in large changes in the value of an investment), liquidity risk, index risk, pricing risk, and counterparty risk (the risk that the counterparty may be unwilling or unable to honor its obligations).
Reverse Repurchase Agreements and Dollar Rolls Risk: Reverse repurchase agreements and dollar rolls involve the risk that the market value of the securities that the Fund is committed to buy may decline below the repurchase price. These investments may also subject the Fund to the risk that the counterparty will not fulfill its obligations.
| 35 |
THIS PRIVACY POLICY IS NOT PART OF THIS REPORT
Privacy Policy and Practices of The Hartford Financial Services Group, Inc. and its Affiliates
(herein called “we, our, and us”)
This Privacy Policy applies to our United States Operations
We value your trust. We are committed to the responsible: a) management; b) use; and c) protection; of Personal Information. This notice describes how we collect, disclose, and protect Personal Information.
We collect Personal Information to: a) service your Transactions with us; and b) support our business functions.
We may obtain Personal Information from: a) You; b) your Transactions with us; and c) third parties such as a consumer-reporting agency.
Based on the type of product or service You apply for or get from us, Personal Information such as: a) your name; b) your address; c) your income; d) your payment; or e) your credit history; may be gathered from sources such as applications, Transactions, and consumer reports.
To serve You and service our business, we may share certain Personal Information. We will share Personal Information, only as allowed by law, with affiliates such as: a) our insurance companies; b) our employee agents; c) our brokerage firms; and d) our administrators.
As allowed by law, we may share Personal Financial Information with our affiliates to: a) market our products; or b) market our services; to You without providing You with an option to prevent these disclosures. | We may also share Personal Information, only as allowed by law, with unaffiliated third parties including:
When allowed by law, we may share certain Personal Financial Information with other unaffiliated third parties who assist us by performing services or functions such as:
We, and third parties we partner with, may track some of the pages You visit through the use of: a) cookies; b) pixel tagging; or c) other technologies; and currently do not process or comply with any web browser’s “do not track” signal or similar mechanism that indicates a request to disable online tracking of individual users who visit our websites or use our services.
We will not sell or share your Personal Financial Information with anyone for purposes unrelated to our business functions without offering You the opportunity to:
We only disclose Personal Health Information with:
Our employees have access to Personal Information in the course of doing their jobs, such as: |
We use manual and electronic security procedures to maintain: a) the confidentiality; and b) the integrity of; Personal Information that we have. We use these procedures to guard against unauthorized access.
Some techniques we use to protect Personal Information include: a) secured files; b) user authentication; c) encryption; d) firewall technology; and e) the use of detection software.
We are responsible for and must: a) identify information to be protected; b) provide an adequate level of protection for that data; c) grant access to protected data only to those people who must use it in the performance of their job-related duties. Employees who violate our Privacy Policy will be subject to discipline, which may include ending their employment with us.
At the start of our business relationship, we will give You a copy of our current Privacy Policy.
We will also give You a copy of our current Privacy Policy once a year if You maintain a continuing business relationship with us.
We will continue to follow our Privacy Policy regarding Personal Information even when a business relationship no longer exists between us. | As used in this Privacy Notice:
Application means your request for our product or service.
Personal Financial Information means financial information such as:
Personal Health Information means health information such as:
Personal Information means information that identifies You personally and is not otherwise available to the public. It includes:
Transaction means your business dealings with us, such as:
You means an individual who has given us Personal Information in conjunction with: |
This Privacy Policy is being provided on behalf of the following affiliates of The Hartford Financial Services Group, Inc.:
1stAGChoice, Inc.; Access CoverageCorp, Inc.; Access CoverageCorp Technologies, Inc.; American Maturity Life Insurance Company; Archway 60 R, LLC; Business Management Group, Inc.; Catalyst360, LLC; Champlain Life Reinsurance Company; DMS R, LLC; Eloy R, LLC; Ersatz Corporation; First State Insurance Company; Hartford Accident and Indemnity Company; Hartford Administrative Services Company; Hartford Casualty General Agency, Inc.; Hartford Casualty Insurance Company; Hartford-Comprehensive Employee Benefit Service Company; Hartford Equity Sales Company, Inc.; Hartford Fire General Agency, Inc.; Hartford Fire Insurance Company; Hartford Funds Management Company, LLC; Hartford Funds Management Group, Inc.; Hartford HLS Series Fund II, Inc.; Hartford Insurance Company of Illinois; Hartford Insurance Company of the Midwest; Hartford Insurance Company of the Southeast; Hartford Integrated Technologies, Inc.; Hartford International Life Reassurance Corporation; Hartford Funds Distributors, LLC; Hartford Investment Management Company; Hartford Life and Accident Insurance Company; Hartford Life and Annuity Insurance Company; Hartford Life Insurance Company; Hartford Life Private Placement, LLC; Hartford Lloyd’s Corporation; Hartford Lloyd’s Insurance Company; Hartford Mezzanine Investors I, LLC; Hartford Residual Market, L.C.C.; Hartford Retirement Services, LLC; Hartford Securities Distribution Company, Inc.; Hartford Series Fund, Inc.; Hartford Specialty Insurance Services of Texas, LLC; Hartford Strategic Investments, LLC; Hartford Underwriters Insurance Company; Hartford Technology Services Company, L.L.C.; Hartford of Texas General Agency, Inc.; Hartford Underwriters General Agency, Inc.; HARTRE Company, L.C.C.; HL Investment Advisors, LLC; HLA LLC; Horizon Management Group, LLC; HRA Brokerage Services, Inc.; Lanidex Class B, LLC; M-CAP Insurance Agency, LLC; New England Insurance Company; New England Reinsurance Corporation; Nutmeg Insurance Agency, Inc.; Nutmeg Insurance Company; Pacific Insurance Company, Limited; Planco, LLC: Property and Casualty Insurance Company of Hartford; Revere R, LLC; RVR R, LLC; Sentinel Insurance Company, Ltd.; Sunstone R, LLC; Symphony R, LLC; The Evergreen Group Incorporated; The Hartford Alternative Strategies Fund; The Hartford Mutual Funds, Inc.; The Hartford Mutual Funds II, Inc.; Trumbull Flood Management, L.L.C.; Trumbull Insurance Company; Twin City Fire Insurance Company; White River Life Reinsurance Company.
HPP Revised December 2013
HARTFORD HLS FUNDS
c/o The Hartford Wealth Management - Global Annuities
P.O. Box 14293
Lexington, KY 40512-4293
HARTFORDFUNDS
hartfordfunds.com
Hartford Series Fund, Inc. is underwritten and distributed by Hartford Funds Distributors, LLC.
Hartford Series Fund, Inc. inception dates range from 1977 to date. Hartford Series Fund, Inc. is not a subsidiary of The Hartford Financial Services Group, Inc. ("The Hartford") but is underwritten, distributed by and advised by subsidiaries of The Hartford. Investments in Hartford Series Fund, Inc. are not guaranteed by The Hartford or any other entity.
This report is submitted for the general information of the shareholders of the Funds. It is not authorized for distribution unless preceded or accompanied by a current prospectus for the Funds.
Investors should carefully consider the investment objectives, risks, charges, and expenses of Hartford Funds before investing. This and other information can be found in the prospectus and summary prospectus, which can be obtained by calling 888-843-7824 (retail) or 877-836-5854 (institutional). Investors should read them carefully before they invest.
HLSAR-USB13 2-14 113549-2 Printed in U.S.A ©2013 The Hartford, Hartford, CT 06115
HARTFORDFUNDS
| HARTFORD VALUE HLS FUND
2013 Annual Report
|
A MESSAGE FROM THE PRESIDENT
Dear Fellow Shareholders:
Thank you for investing in Hartford HLS Funds.
Market Review
U.S. equities (as represented by the S&P 500 Index) generated their strongest year since 1997 in 2013, rising 32.39% for the year. During the fourth quarter, equities rose without looking back, pushing the S&P 500 Index and the Dow Jones Industrial Average to new all-time highs. Despite previously cheering delays to quantitative-easing tapering, the stock market received an additional boost at the end of the year following the U.S. Federal Reserve’s (Fed) announcement of a $10-billion-a-month reduction in bond purchases beginning in January.
The Fed’s decision to begin tapering its bond purchases is generally considered a vote of confidence in the recovering U.S. economy. Consumer spending has stabilized, the housing market is showing steady improvement, the unemployment rate is slowly declining and economic growth clocked in at a healthy 4.1% in the third quarter. Equities have also recovered since the market low in March 2009: The S&P 500 Index has gained 173% from the market low through December 31, 2013.
Signs of improvement are also visible outside the U.S. Europe appears to have begun its own economic recovery, and emerging markets have reversed their recent lackluster performance. Fiscal policy continues to wield significant influence in today’s economy and central banks across the globe are maintaining their accommodative stances, including the appointment of Janet Yellen, who is widely expected to continue current monetary policies, to succeed Ben Bernanke as U.S. Federal Reserve chairman.
It’s important to stay abreast of domestic and international economic developments while balancing your individual investment goals. Meeting with your financial advisor on a regular basis to examine your current investment strategy can help you determine whether you are on the right track:
| • | Is your portfolio fully diversified with an appropriate mix of stocks and bonds? |
| • | Is your portfolio incorporating both domestic and international holdings to take advantage of the global economic recovery? |
| • | Are your investments still in line with your risk tolerance and investment time horizon? |
Your financial advisor can help you choose options within our fund family to navigate today’s markets with confidence.
Thank you again for investing with Hartford HLS Funds.
James Davey
President
Hartford HLS Funds
1The S&P 500 Index is a market capitalization-weighted price index composed of 500 widely held common stocks.
2The Dow Jones Industrial Average is an unmanaged, price-weighted index of 30 of the largest, most widely held stocks traded on the New York Stock Exchange.
Hartford Value HLS Fund
This report is prepared for the general information of contract owners and qualified retirement plan participants. It is not an offer of contracts or of qualified retirement plans. It should not be used in connection with any offer, except in conjunction with the appropriate product prospectus which contains all pertinent information including the applicable sales, administrative and other charges.
The views expressed in the Fund’s Manager Discussion under ‘‘Why did the Fund perform this way?’’ and ‘‘What is the outlook?’’ are views of the Fund’s sub-adviser and portfolio management team through the end of the period and are subject to change based on market and other conditions. The Fund’s Manager Discussion is for informational purposes only and does not represent an offer, recommendation or solicitation to buy, hold or sell any security. The specific securities identified and described, if any, do not represent all of the securities purchased or sold and you should not assume that investments in the securities identified and discussed will be profitable.
Hartford Value HLS Fund inception 04/30/2001
(sub-advised by Wellington Management Company, LLP)
| Investment objective – Seeks long-term total return. |
Performance Overview 12/31/03 - 12/31/13

The chart above represents the hypothetical growth of a $10,000 investment in Class IA. Growth results in classes other than Class IA will vary from what is seen above due to differences in the expenses charged to those share classes.
Average Annual Total Returns (as of 12/31/13)
| 1 Year | 5 Years | 10 Years | |||||||
| Value IA | 31.94% | 16.63% | 8.51% | ||||||
| Value IB | 31.65% | 16.35% | 8.24% | ||||||
| Russell 1000 Value Index | 32.53% | 16.67% | 7.58% | ||||||
PERFORMANCE DATA QUOTED REPRESENTS PAST PERFORMANCE AND DOES NOT GUARANTEE FUTURE RESULTS. The investment return and principal value of the investment will fluctuate so that investors’ shares, when redeemed, may be worth more or less than their original cost. Current performance may be lower or higher than the performance data quoted. To obtain performance data current to the most recent month-end, please visit our website at www.hartfordfunds.com.
Total returns presented above were calculated using the Fund’s net asset value available to shareholders for sale or redemption of Fund shares on December 31, 2013, which may exclude investment transactions as of this date. All share class returns assume the reinvestment of all distributions at net asset value and the deduction of all fund expenses.
Russell 1000 Value Index is an unmanaged index measuring the performance of those Russell 1000 Index companies with lower price-to-book ratios and lower forecasted growth values. The Russell 1000 Index is an unmanaged index that measures the performance of the 1,000 largest companies in the Russell 3000 Index, which measures the performance of the 3,000 largest U.S. companies, based on total market capitalizations.
You cannot invest directly in an index.
As of the Fund's current prospectus dated May 1, 2013, the total annual operating expense ratios for Class IA and Class IB were 0.76% and 1.01%, respectively. Actual expenses may be higher. Please see the accompanying Financial Highlights for expense ratios for the year ended December 31, 2013.
The chart and table do not reflect the deductions of taxes, sales charges or other fees which may be applied at the variable life insurance, variable annuity or qualified retirement plan product level. Any such additional sales charges or other fees or expenses would lower the contract’s or plan’s performance.
All investments are subject to risk including the possible loss of principal. For a discussion of the Fund’s risks, please see the Main Risks section of this report. For more detailed information on the risks associated with an investment in the Fund, please see the prospectus.
| 2 |
Hartford Value HLS Fund
Manager Discussion
December 31, 2013 (Unaudited)
| Portfolio Managers | ||||
| Karen H. Grimes, CFA | W. Michael Reckmeyer, III, CFA | Ian R. Link, CFA | ||
| Senior Vice President and Equity Portfolio Manager | Senior Vice President and Equity Portfolio Manager | Director and Equity Portfolio Manager | ||
How did the Fund perform?
The Class IA shares of the Hartford Value HLS Fund returned 31.94% for the twelve-month period ended December 31, 2013, underperforming the Fund’s benchmark, the Russell 1000 Value Index, which returned 32.53% for the same period. The Fund underperformed the 32.37% average return of the Variable Products-Underlying Funds Lipper Large Cap Value Funds peer group, a group of funds with investment strategies similar to those of the Fund.
Why did the Fund perform this way?
U.S. equities reached another all-time high in December and finished 2013 with a gain of 32.4%, as measured by the S&P 500 Index, the Index’s best return since 1997. The rally in U.S. equities began on the first trading day of the year after a last-minute compromise by the U.S. Congress averted the fiscal cliff. Optimism surrounding the fiscal reprieve was furthered during the first quarter by better-than-expected corporate earnings, a robust housing market, and a steadily improving employment picture. Solid gains in April and the first part of May paused following comments by U.S. Federal Reserve (Fed) Chairman Ben Bernanke that suggested the Fed might begin to slow quantitative easing sooner than investors anticipated. Nonetheless, equities resumed their ascent in the third quarter as the surprising “no taper” decision by the Federal Open Market Committee eased near-term concerns about rapidly rising interest rates derailing the recovery. Additionally, accommodative rhetoric from the European Central Bank, along with encouraging data in China and further evidence of a European economic recovery, contributed to a broad-based global equity rally that extended through the end of the year. In December, the year ended with an optimistic tone as investors cheered the elimination of two market overhangs: the timing of Fed tapering and the threat of another U.S. government shutdown in early 2014.
In this environment, all ten sectors within the Russell 1000 Value Index posted positive returns during the period. Information Technology (+48%), Consumer Discretionary (+44%), and Industrials (+43%) gained the most, while Telecommunication Services (+13%), Utilities (+14%), and Materials (+21%) lagged on a relative basis.
The Fund’s underperformance versus its benchmark was primarily driven by weak stock selection within the Information Technology, Health Care, and Consumer Discretionary sectors. This was partially offset by strong security selection within Financials and Industrials. Sector allocation, a residual of the bottom up stock selection process, contributed positively to the Fund’s relative performance largely due to an underweight allocation to the lagging Utilities sector and an overweight allocation to the Information Technology sector. This was partially offset by a modest cash position in a generally rising market environment.
Among the top detractors from benchmark-relative returns were Mosaic (Materials), Apple (Information Technology), and Baxter International (Health Care). Shares of Mosaic, one of the largest global fertilizer producers, underperformed amid a deteriorating demand and pricing environment for phosphates and potash. Shares of Apple, a designer, manufacturer, and retailer of a range of personal electronic products, surged after the company posted solid quarterly earnings led by better-than-expected iPhone sales. Not owning this benchmark component in the portfolio detracted from relative performance. Baxter International, a diversified global healthcare company, saw its shares fall in part due to concerns about competitive pressures. Barrick Gold (Materials) and Verizon Communications (Telecommunication Services) also detracted on an absolute basis.
The largest contributors to benchmark-relative returns were Spirit Aerosystems (Industrials), Ameriprise Financial (Financials), and Boeing (Industrials). Shares of Spirit Aerosystems, an aerospace and defense company, moved higher after the company reported better-than-expected quarterly earnings, driven by operating performance improvements in its mature programs. Ameriprise Financial, a diversified financial services company, saw its shares rise as asset growth in the advice and wealth management division, combined with strong equity markets, have led to solid earnings growth. Boeing, an aerospace company, saw its shares rise as concerns over electrical issues with its 787 Dreamliner subsided. The company continued to see strong demand for commercial airplanes in the U.S. and abroad. Top absolute contributors included JPMorgan Chase (Financials), Wells Fargo (Financials) and BlackRock (Financials).
| 3 |
Hartford Value HLS Fund
Manager Discussion – (continued)
December 31, 2013 (Unaudited)
Derivatives are not used in a significant manner in this Fund and did not have a material impact on performance during the period.
What is the outlook?
In the U.S., we believe there will be positive gross domestic product (GDP) growth of about 3% for 2014 as the fiscal drag reverses. In our opinion, we estimate that fiscal policies reduced GDP by 1.5% in 2013 (and some of these effects may linger in early 2014), but importantly, state and local governments now appear to be moving back to expansionary mode. We believe the employment picture continues to improve and housing should remain constructive. Housing paused recently in part due to the uptick in mortgage rates but we expect it to reaccelerate in the spring selling season. While higher rates can be a hurdle to further recovery, they are still low historically and we believe early signs of wage growth should boost consumer confidence. The Fed is expected to remain accommodative throughout the year and we view the Fed’s decision to start unwinding quantitative easing as a healthy sign for the economy.
We have been encouraged by recent data out of Europe that suggests Europe has stabilized. We believe the euro area economy could expand by 1 to 1.5% in 2014. We are watching France as an ongoing risk. France is Europe’s second largest economy and government policies have so far failed to revive growth as GDP is still contracting. Data out of Japan has been positive as Prime Minister Shinzo Abe’s bid to revitalize the economy appears to be rekindling growth after decades of economic malaise.
In terms of portfolio positioning, the Consumer Discretionary sector represented our largest overweight at the end of the period. The annual reconstitution of the Russell 1000 Value Index resulted in an increase in the benchmark’s Information Technology sector, with the inclusion of Apple as a notable highlight. This brought the Index more in-line with our positioning, as Information Technology had been the largest overweight before the Index rebalanced. We remained moderately overweight to the sector after the change.
Diversification by Sector
as of December 31, 2013
| Sector | Percentage of Net Assets | |||
| Equity Securities | ||||
| Consumer Discretionary | 12.5 | % | ||
| Consumer Staples | 5.2 | |||
| Energy | 11.9 | |||
| Financials | 27.4 | |||
| Health Care | 11.8 | |||
| Industrials | 10.3 | |||
| Information Technology | 12.0 | |||
| Materials | 4.1 | |||
| Services | 1.7 | |||
| Utilities | 2.6 | |||
| Total | 99.5 | % | ||
| Short-Term Investments | 0.8 | |||
| Other Assets and Liabilities | (0.3 | ) | ||
| Total | 100.0 | % | ||
A sector may be comprised of several industries. For Fund compliance purposes, the Fund may not use the same classification system and these sector classifications are used for reporting ease.
| 4 |
Schedule of Investments
December 31, 2013
(000’s Omitted)
| Shares or Principal Amount | Market Value ╪ | |||||||
COMMON STOCKS - 99.5% | ||||||||
| Automobiles and Components - 0.4% | ||||||||
| 61 | General Motors Co. ● | $ | 2,475 | |||||
| Banks - 7.3% | ||||||||
| 206 | BB&T Corp. | 7,698 | ||||||
| 188 | PNC Financial Services Group, Inc. | 14,553 | ||||||
| 573 | Wells Fargo & Co. | 25,997 | ||||||
| 48,248 | ||||||||
| Capital Goods - 10.3% | ||||||||
| 49 | 3M Co. | 6,930 | ||||||
| 34 | Boeing Co. | 4,706 | ||||||
| 131 | Eaton Corp. plc | 9,950 | ||||||
| 475 | General Electric Co. | 13,307 | ||||||
| 68 | Illinois Tool Works, Inc. | 5,758 | ||||||
| 107 | Ingersoll-Rand plc | 6,576 | ||||||
| 79 | PACCAR, Inc. | 4,658 | ||||||
| 215 | Spirit Aerosystems Holdings, Inc. ● | 7,329 | ||||||
| 77 | United Technologies Corp. | 8,818 | ||||||
| 68,032 | ||||||||
| Consumer Durables and Apparel - 3.3% | ||||||||
| 209 | Newell Rubbermaid, Inc. | 6,766 | ||||||
| 290 | Pulte Group, Inc. | 5,900 | ||||||
| 64 | PVH Corp. | 8,710 | ||||||
| 21,376 | ||||||||
| Diversified Financials - 11.9% | ||||||||
| 77 | Ameriprise Financial, Inc. | 8,853 | ||||||
| 33 | BlackRock, Inc. | 10,404 | ||||||
| 230 | Citigroup, Inc. | 11,978 | ||||||
| 110 | Credit Suisse Group ADR | 3,400 | ||||||
| 56 | Goldman Sachs Group, Inc. | 9,889 | ||||||
| 42 | IntercontinentalExchange Group, Inc. | 9,398 | ||||||
| 419 | JP Morgan Chase & Co. | 24,528 | ||||||
| 230 | Solar Cayman Ltd. ⌂■●† | 16 | ||||||
| 78,466 | ||||||||
| Energy - 11.9% | ||||||||
| 73 | Anadarko Petroleum Corp. | 5,802 | ||||||
| 169 | Chevron Corp. | 21,150 | ||||||
| 37 | EOG Resources, Inc. | 6,206 | ||||||
| 134 | Exxon Mobil Corp. | 13,540 | ||||||
| 190 | Halliburton Co. | 9,626 | ||||||
| 212 | Marathon Oil Corp. | 7,486 | ||||||
| 91 | Occidental Petroleum Corp. | 8,664 | ||||||
| 160 | Southwestern Energy Co. ● | 6,303 | ||||||
| 78,777 | ||||||||
| Food and Staples Retailing - 1.4% | ||||||||
| 127 | CVS Caremark Corp. | 9,118 | ||||||
| Food, Beverage and Tobacco - 3.8% | ||||||||
| 74 | Anheuser-Busch InBev N.V. ADR | 7,915 | ||||||
| 55 | Diageo plc ADR | 7,244 | ||||||
| 76 | Kraft Foods Group, Inc. | 4,103 | ||||||
| 64 | Philip Morris International, Inc. | 5,609 | ||||||
| 24,871 | ||||||||
| Health Care Equipment and Services - 4.4% | ||||||||
| 108 | Baxter International, Inc. | 7,544 | ||||||
| 131 | Covidien plc | 8,934 | ||||||
| 168 | UnitedHealth Group, Inc. | 12,681 | ||||||
| 29,159 | ||||||||
| Insurance - 7.4% | ||||||||
| 123 | ACE Ltd. | 12,691 | ||||||
| 157 | American International Group, Inc. | 8,034 | ||||||
| 61 | Chubb Corp. | 5,918 | ||||||
| 237 | Marsh & McLennan Cos., Inc. | 11,449 | ||||||
| 110 | Principal Financial Group, Inc. | 5,403 | ||||||
| 156 | Unum Group | 5,473 | ||||||
| 48,968 | ||||||||
| Materials - 4.1% | ||||||||
| 174 | Dow Chemical Co. | 7,738 | ||||||
| 65 | E.I. DuPont de Nemours & Co. | 4,229 | ||||||
| 127 | International Paper Co. | 6,215 | ||||||
| 73 | Nucor Corp. | 3,906 | ||||||
| 260 | Steel Dynamics, Inc. | 5,080 | ||||||
| 27,168 | ||||||||
| Media - 3.9% | ||||||||
| 88 | CBS Corp. Class B | 5,607 | ||||||
| 177 | Comcast Corp. Class A | 9,180 | ||||||
| 274 | Interpublic Group of Cos., Inc. | 4,850 | ||||||
| 167 | Thomson Reuters Corp. | 6,321 | ||||||
| 25,958 | ||||||||
| Pharmaceuticals, Biotechnology and Life Sciences - 7.4% | ||||||||
| 66 | Amgen, Inc. | 7,525 | ||||||
| 55 | AstraZeneca plc ADR | 3,292 | ||||||
| 70 | Johnson & Johnson | 6,392 | ||||||
| 319 | Merck & Co., Inc. | 15,969 | ||||||
| 116 | Pfizer, Inc. | 3,540 | ||||||
| 34 | Roche Holding AG | 9,550 | ||||||
| 83 | Zoetis, Inc. | 2,712 | ||||||
| 48,980 | ||||||||
| Real Estate - 0.8% | ||||||||
| 281 | Host Hotels & Resorts, Inc. REIT | 5,470 | ||||||
| Retailing - 4.9% | ||||||||
| 18 | AutoZone, Inc. ● | 8,450 | ||||||
| 82 | Home Depot, Inc. | 6,711 | ||||||
| 72 | Kohl's Corp. | 4,072 | ||||||
| 168 | Lowe's Cos., Inc. | 8,310 | ||||||
| 77 | Nordstrom, Inc. | 4,755 | ||||||
| 32,298 | ||||||||
| Semiconductors and Semiconductor Equipment - 4.9% | ||||||||
| 134 | Analog Devices, Inc. | 6,809 | ||||||
| 436 | Intel Corp. | 11,325 | ||||||
| 216 | Maxim Integrated Products, Inc. | 6,033 | ||||||
| 183 | Xilinx, Inc. | 8,389 | ||||||
| 32,556 | ||||||||
| Software and Services - 2.7% | ||||||||
| 219 | Microsoft Corp. | 8,208 | ||||||
| 395 | Symantec Corp. | 9,311 | ||||||
| 17,519 | ||||||||
| Technology Hardware and Equipment - 4.4% | ||||||||
| 786 | Cisco Systems, Inc. | 17,639 | ||||||
| 453 | EMC Corp. | 11,397 | ||||||
| 29,036 | ||||||||
| Telecommunication Services - 1.7% | ||||||||
| 227 | Verizon Communications, Inc. | 11,171 | ||||||
| Utilities - 2.6% | ||||||||
| 104 | Edison International | 4,816 | ||||||
| 61 | Entergy Corp. | 3,842 | ||||||
| 38 | NextEra Energy, Inc. | 3,248 | ||||||
The accompanying notes are an integral part of these financial statements.
| 5 |
Hartford Value HLS Fund
Schedule of Investments – (continued)
December 31, 2013
(000’s Omitted)
| Shares or Principal Amount | Market Value ╪ | |||||||||||
| COMMON STOCKS - 99.5% - (continued) | ||||||||||||
| Utilities - 2.6% - (continued) | ||||||||||||
| 126 | Northeast Utilities | $ | 5,336 | |||||||||
| 17,242 | ||||||||||||
| Total common stocks | ||||||||||||
| (cost $451,020) | $ | 656,888 | ||||||||||
| Total long-term investments | ||||||||||||
| (cost $451,020) | $ | 656,888 | ||||||||||
| SHORT-TERM INVESTMENTS - 0.8% | ||||||||||||
| Repurchase Agreements - 0.8% | ||||||||||||
| Bank of America Merrill Lynch TriParty Repurchase Agreement (maturing on 01/02/2014 in the amount of $272, collateralized by GNMA 4.00%, 2043, value of $278) | ||||||||||||
| $ | 272 | 0.005%, 12/31/2013 | $ | 272 | ||||||||
| Bank of Montreal TriParty Repurchase Agreement (maturing on 01/02/2014 in the amount of $262, collateralized by FNMA 1.58% - 4.50%, 2020 - 2043, U.S. Treasury Note 0.25% - 4.00%, 2015 - 2020, value of $267) | ||||||||||||
| 262 | 0.01%, 12/31/2013 | 262 | ||||||||||
| Bank of Montreal TriParty Repurchase Agreement (maturing on 01/02/2014 in the amount of $927, collateralized by FHLMC 3.00% - 5.00%, 2019 - 2043, FNMA 0.76% - 6.00%, 2016 - 2043, GNMA 1.50% - 5.25%, 2028 - 2043, value of $946) | ||||||||||||
| 927 | 0.02%, 12/31/2013 | 927 | ||||||||||
| Barclays Capital TriParty Repurchase Agreement (maturing on 01/02/2014 in the amount of $836, collateralized by U.S. Treasury Note 0.50% - 2.25%, 2017, value of $853) | ||||||||||||
| 836 | 0.01%, 12/31/2013 | 836 | ||||||||||
| Citigroup Global Markets, Inc. TriParty Repurchase Agreement (maturing on 01/02/2014 in the amount of $1,504, collateralized by U.S. Treasury Bond 3.88% - 8.13%, 2021 - 2040, U.S. Treasury Note 0.25% - 3.38%, 2014 - 2020, value of $1,534) | ||||||||||||
| 1,504 | 0.01%, 12/31/2013 | 1,504 | ||||||||||
| RBS Securities, Inc. TriParty Repurchase Agreement (maturing on 01/02/2014 in the amount of $489, collateralized by U.S. Treasury Note 0.25% - 1.00%, 2015 - 2017, value of $499) | ||||||||||||
| 489 | 0.01%, 12/31/2013 | 489 | ||||||||||
| TD Securities TriParty Repurchase Agreement (maturing on 01/02/2014 in the amount of $1,174, collateralized by FFCB 0.20% - 0.50%, 2015 - 2016, FHLMC 0.38% - 5.25%, 2014 - 2042, FNMA 0.50% - 7.13%, 2014 - 2043, value of $1,197) | ||||||||||||
| 1,174 | 0.01%, 12/31/2013 | 1,174 | ||||||||||
| UBS Securities, Inc. Repurchase Agreement (maturing on 01/02/2014 in the amount of $10, collateralized by U.S. Treasury Note 2.13%, 2015, value of $10) | ||||||||||||
| 10 | 0.01%, 12/31/2013 | 10 | ||||||||||
| 5,474 | ||||||||||||
| Total short-term investments | ||||||||||||
| (cost $5,474) | $ | 5,474 | ||||||||||
| Total investments | ||||||||||||
| (cost $456,494) ▲ | 100.3 | % | $ | 662,362 | ||||||||
| Other assets and liabilities | (0.3 | )% | (1,931 | ) | ||||||||
| Total net assets | 100.0 | % | $ | 660,431 | ||||||||
The accompanying notes are an integral part of these financial statements.
| 6 |
| Note: | Percentage of investments as shown is the ratio of the total market value to total net assets. |
Prices of foreign equities that are principally traded on certain foreign markets may be adjusted daily pursuant to a fair value pricing service approved by the Board of Directors in order to reflect an adjustment for factors occurring after the close of certain foreign markets but before the close of the New York Stock Exchange.
| ▲ | At December 31, 2013, the cost of securities for federal income tax purposes was $461,005 and the aggregate gross unrealized appreciation and depreciation based on that cost were: |
| Unrealized Appreciation | $ | 208,257 | ||
| Unrealized Depreciation | (6,900 | ) | ||
| Net Unrealized Appreciation | $ | 201,357 |
| † | These securities were valued in good faith at fair value as determined under policies and procedures established by and under the supervision of the Company's Board of Directors. At December 31, 2013, the aggregate value of these securities was $16, which rounds to zero percent of total net assets. This amount excludes securities that are principally traded in certain foreign markets and whose prices are adjusted pursuant to a third party pricing service methodology approved by the Board of Directors. |
| ● | Non-income producing. |
| ■ | Securities issued within terms of a private placement memorandum, exempt from registration under Rule 144A under the Securities Act of 1933, as amended, and may be sold only to qualified institutional buyers. Unless otherwise indicated, these holdings are determined to be liquid. At December 31, 2013, the aggregate value of these securities was $16, which rounds to zero percent of total net assets. |
| ⌂ | The following securities are considered illiquid. Illiquid securities are often purchased in private placement transactions, are often not registered under the Securities Act of 1933 and may have contractual restrictions on resale. A security may also be considered illiquid if the security lacks a readily available market or if its valuation has not changed for a certain period of time. |
| Period Acquired | Shares/ Par | Security | Cost Basis | |||||||
| 03/2007 | 230 | Solar Cayman Ltd. - 144A | $ | 67 | ||||||
At December 31, 2013, the aggregate value of these securities was $16, which rounds to zero percent of total net assets.
| ╪ | See Significant Accounting Policies of accompanying Notes to Financial Statements regarding valuation of securities. |
| GLOSSARY: (abbreviations used in preceding Schedule of Investments) | |
| Other Abbreviations: | |
| ADR | American Depositary Receipt |
| FFCB | Federal Farm Credit Bank |
| FHLMC | Federal Home Loan Mortgage Corp. |
| FNMA | Federal National Mortgage Association |
| GNMA | Government National Mortgage Association |
| REIT | Real Estate Investment Trust |
The accompanying notes are an integral part of these financial statements.
| 7 |
Investment Valuation Hierarchy Level Summary
December 31, 2013
(000’s Omitted)
| Total | Level 1 ♦ | Level 2 ♦ | Level 3 | |||||||||||||
| Assets: | ||||||||||||||||
| Common Stocks ‡ | $ | 656,888 | $ | 647,322 | $ | 9,550 | $ | 16 | ||||||||
| Short-Term Investments | 5,474 | – | 5,474 | – | ||||||||||||
| Total | $ | 662,362 | $ | 647,322 | $ | 15,024 | $ | 16 | ||||||||
| ♦ | For the year ended December 31, 2013, there were no transfers between Level 1 and Level 2. |
| ‡ | The Fund has all or primarily all of the equity securities categorized in a particular level. Refer to the Schedule of Investments for further industry breakout. |
Following is a reconciliation of Level 3 assets for which significant unobservable inputs were used to determine fair value:
| Balance as of December 31, 2012 | Realized Gain (Loss) | Change in Unrealized Appreciation (Depreciation) | Net Amortization | Purchases | Sales | Transfers Into Level 3 | Transfers Out of Level 3 | Balance as of December 31, 2013 | ||||||||||||||||||||||||||||
| Assets: | ||||||||||||||||||||||||||||||||||||
| Common Stocks | $ | 2,190 | $ | 2,294 | $ | (1,625 | )* | $ | — | $ | — | $ | (2,843 | ) | $ | — | $ | — | $ | 16 | ||||||||||||||||
| Total | $ | 2,190 | $ | 2,294 | $ | (1,625 | ) | $ | — | $ | — | $ | (2,843 | ) | $ | — | $ | — | $ | 16 | ||||||||||||||||
| * | Change in unrealized appreciation (depreciation) in the current period relating to assets still held at December 31, 2013 was zero. |
| Note: | For purposes of reporting transfers between different hierarchy levels, both transfers in and out of each level, as applicable, are shown as if they occurred at the beginning of the period. |
The accompanying notes are an integral part of these financial statements.
| 8 |
Statement of Assets and Liabilities
December 31, 2013
(000’s Omitted)
| Assets: | ||||
| Investments in securities, at market value (cost $456,494) | $ | 662,362 | ||
| Cash | — | |||
| Receivables: | ||||
| Investment securities sold | 15,993 | |||
| Fund shares sold | 38 | |||
| Dividends and interest | 920 | |||
| Other assets | — | |||
| Total assets | 679,313 | |||
| Liabilities: | ||||
| Payables: | ||||
| Investment securities purchased | 3,389 | |||
| Fund shares redeemed | 15,322 | |||
| Investment management fees | 108 | |||
| Distribution fees | 6 | |||
| Accrued expenses | 57 | |||
| Total liabilities | 18,882 | |||
| Net assets | $ | 660,431 | ||
| Summary of Net Assets: | ||||
| Capital stock and paid-in-capital | $ | 509,520 | ||
| Undistributed net investment income | 341 | |||
| Accumulated net realized loss | (55,302 | ) | ||
| Unrealized appreciation of investments and the translations of assets and liabilities denominated in foreign currency | 205,872 | |||
| Net assets | $ | 660,431 | ||
| Shares authorized | 800,000 | |||
| Par value | $ | 0.001 | ||
| Class IA: Net asset value per share | $ | 15.39 | ||
| Shares outstanding | 35,822 | |||
| Net assets | $ | 551,350 | ||
| Class IB: Net asset value per share | $ | 15.38 | ||
| Shares outstanding | 7,093 | |||
| Net assets | $ | 109,081 |
The accompanying notes are an integral part of these financial statements.
| 9 |
Statement of Operations
For the Year Ended December 31, 2013
(000’s Omitted)
| Investment Income: | ||||
| Dividends | $ | 16,668 | ||
| Interest | 4 | |||
| Less: Foreign tax withheld | (145 | ) | ||
| Total investment income, net | 16,527 | |||
| Expenses: | ||||
| Investment management fees | 4,981 | |||
| Transfer agent fees | 2 | |||
| Distribution fees - Class IB | 273 | |||
| Custodian fees | 5 | |||
| Accounting services fees | 68 | |||
| Board of Directors' fees | 19 | |||
| Audit fees | 15 | |||
| Other expenses | 117 | |||
| Total expenses (before fees paid indirectly) | 5,480 | |||
| Commission recapture | (3 | ) | ||
| Total fees paid indirectly | (3 | ) | ||
| Total expenses, net | 5,477 | |||
| Net Investment Income | 11,050 | |||
| Net Realized Gain on Investments and Foreign Currency Transactions: | ||||
| Net realized gain on investments | 76,594 | |||
| Net realized gain on foreign currency contracts | 39 | |||
| Net realized loss on other foreign currency transactions | (54 | ) | ||
| Net Realized Gain on Investments and Foreign Currency Transactions | 76,579 | |||
| Net Changes in Unrealized Appreciation of Investments and Foreign Currency Transactions: | ||||
| Net unrealized appreciation of investments | 100,298 | |||
| Net unrealized appreciation on translation of other assets and liabilities in foreign currencies | 4 | |||
| Net Changes in Unrealized Appreciation of Investments and Foreign Currency Transactions | 100,302 | |||
| Net Gain on Investments and Foreign Currency Transactions | 176,881 | |||
| Net Increase in Net Assets Resulting from Operations | $ | 187,931 |
The accompanying notes are an integral part of these financial statements.
| 10 |
Statement of Changes in Net Assets
(000’s Omitted)
| For the Year Ended December 31, 2013 | For the Year Ended December 31, 2012 | |||||||
| Operations: | ||||||||
| Net investment income | $ | 11,050 | $ | 13,773 | ||||
| Net realized gain on investments and foreign currency transactions | 76,579 | 45,302 | ||||||
| Net unrealized appreciation of investments and foreign currency transactions | 100,302 | 51,181 | ||||||
| Net Increase in Net Assets Resulting from Operations | 187,931 | 110,256 | ||||||
| Distributions to Shareholders: | ||||||||
| From net investment income | ||||||||
| Class IA | (9,100 | ) | (12,440 | ) | ||||
| Class IB | (1,489 | ) | (2,077 | ) | ||||
| Total distributions | (10,589 | ) | (14,517 | ) | ||||
| Capital Share Transactions: | ||||||||
| Class IA | ||||||||
| Sold | 40,796 | 29,616 | ||||||
| Issued on reinvestment of distributions | 9,100 | 12,440 | ||||||
| Redeemed | (196,892 | ) | (164,750 | ) | ||||
| Total capital share transactions | (146,996 | ) | (122,694 | ) | ||||
| Class IB | ||||||||
| Sold | 13,072 | 10,336 | ||||||
| Issued on reinvestment of distributions | 1,489 | 2,077 | ||||||
| Redeemed | (37,142 | ) | (35,556 | ) | ||||
| Total capital share transactions | (22,581 | ) | (23,143 | ) | ||||
| Net decrease from capital share transactions | (169,577 | ) | (145,837 | ) | ||||
| Net Increase (Decrease) in Net Assets | 7,765 | (50,098 | ) | |||||
| Net Assets: | ||||||||
| Beginning of period | 652,666 | 702,764 | ||||||
| End of period | $ | 660,431 | $ | 652,666 | ||||
| Undistributed (distribution in excess of) net investment income | $ | 341 | $ | — | ||||
| Shares: | ||||||||
| Class IA | ||||||||
| Sold | 2,970 | 2,604 | ||||||
| Issued on reinvestment of distributions | 602 | 1,054 | ||||||
| Redeemed | (14,071 | ) | (14,358 | ) | ||||
| Total share activity | (10,499 | ) | (10,700 | ) | ||||
| Class IB | ||||||||
| Sold | 945 | 906 | ||||||
| Issued on reinvestment of distributions | 99 | 176 | ||||||
| Redeemed | (2,682 | ) | (3,113 | ) | ||||
| Total share activity | (1,638 | ) | (2,031 | ) | ||||
The accompanying notes are an integral part of these financial statements.
| 11 |
Notes to Financial Statements
December 31, 2013
(000’s Omitted)
| 1. | Organization: |
Hartford Value HLS Fund (the “Fund”) serves as an underlying investment option for certain variable annuity and variable life insurance separate accounts of Hartford Life Insurance Company (“HLIC”) and its affiliates and certain qualified retirement plans. The Fund may also serve as an underlying investment option for certain variable annuity and variable life separate accounts of other insurance companies. Owners of variable annuity contracts and policyholders of variable life insurance contracts may choose the funds permitted in the variable insurance contract prospectus. In addition, participants in certain qualified retirement plans may choose the Fund if permitted by their plans.
Hartford Series Fund, Inc. (the “Company”) is an open-end registered management investment company comprised of thirty portfolios. Financial statements for the Fund, a series of the Company, are included in this report.
The Company is organized under the laws of the State of Maryland and is registered with the Securities and Exchange Commission (“SEC”) under the Investment Company Act of 1940, as amended (“1940 Act”). The Fund is a diversified open-end management investment company.
The Fund is divided into Class IA and Class IB shares. Each class is offered at the per share net asset value (“NAV”) without a sales charge and is subject to the same expenses, except that the Class IB shares are subject to distribution and service fees charged pursuant to a Distribution Plan adopted in accordance with Rule 12b-1 under the 1940 Act.
| 2. | Significant Accounting Policies: |
The following is a summary of significant accounting policies of the Fund in the preparation of its financial statements, which are in accordance with United States Generally Accepted Accounting Principles (“U.S. GAAP”). The preparation of financial statements in accordance with U.S. GAAP may require management to make estimates and assumptions that affect the reported amounts of assets and liabilities and disclosure of contingent assets and liabilities at the date of the financial statements and the reported amounts of increases and decreases in net assets from operations during the reporting period. Actual results could differ from those estimates.
| a) | Determination of Net Asset Value – The NAV of each class of the Fund’s shares is determined as of the close of regular trading (normally 4:00 p.m. Eastern Time) (the “NYSE Close”) on each day that the New York Stock Exchange (the “Exchange”) is open (“Valuation Date”). Information that becomes known to the Fund after the NAV has been calculated on a particular day will not generally be used to retroactively adjust the NAV determined earlier that day. |
| b) | Investment Valuation and Fair Value Measurements – For purposes of calculating the NAV, portfolio investments and other assets held by the Fund's portfolio for which market quotes are readily available are valued at market value. Market value is generally determined on the basis of last reported sales prices or official close price. If no sales are reported, market value is based on quotes obtained from a quotation reporting system, established market makers, or independent pricing services. If market prices are not readily available or are deemed unreliable, the Fund will use the fair value of the investment as determined in good faith under policies and procedures established by and under the supervision of the Company’s Board of Directors. Market quotes are considered not readily available where there is an absence of current or reliable market-based data (e.g., trade information or indicative market quotes), including where events occur after the close of the relevant market, but prior to the NYSE Close, that materially affect the values of the Fund’s portfolio investments or assets. In addition, market quotes are considered not readily available when, due to extraordinary circumstances, the exchanges or markets on which the investments trade do not open for trading for the entire day and no other market prices are available. In addition, prices of foreign equities that are principally traded on certain foreign markets may be adjusted daily pursuant to a fair value pricing service approved by the Board of Directors in order to reflect an adjustment for the factors occurring after the close of certain foreign markets but before the NYSE Close. Investments that are primarily traded on foreign markets may trade on days that are not business days of the Fund. The value of the foreign investments in which the Fund invests may change on days when a shareholder will not be able to purchase or redeem shares of the Fund. Fair value pricing is subjective in nature and the use of fair value pricing by the |
| 12 |
Fund may cause the NAV of its shares to differ significantly from the NAV that would have been calculated using market prices at the close of the exchange on which a portfolio investment is primarily traded. There can be no assurance that the Fund could obtain the fair market value assigned to an investment if the Fund were to sell the investment at approximately the time at which the Fund determines its NAV.
Investments valued in currencies other than U.S. dollars are converted to U.S. dollars using exchange rates obtained from independent pricing services for calculation of the NAV. As a result, the NAV of the Fund’s shares may be affected by changes in the value of currencies in relation to the U.S. dollar. The value of investments traded in markets outside the United States or denominated in currencies other than the U.S. dollar may be affected significantly on a day that the NYSE is closed and the market value may change on days when an investor is not able to purchase, redeem or exchange shares of the Fund.
Foreign currency contracts represent agreements to exchange currencies on specific future dates at predetermined rates. Foreign currency contracts are valued using foreign currency exchange rates and forward rates as provided by an independent pricing service on the Valuation Date.
Financial instruments for which prices are not available from an independent pricing service may be valued using market quotations obtained from one or more dealers that make markets in the respective financial instrument in accordance with procedures established by the Company’s Board of Directors.
U.S. GAAP defines fair value as the price that the Fund would receive to sell an asset or pay to transfer a liability in an orderly transaction between market participants. The U.S. GAAP fair value measurement standards require disclosure of a fair value hierarchy for each major category of assets and liabilities. Various inputs are used in determining the fair value of the Fund’s investments. These inputs are summarized into three broad hierarchy levels. This hierarchy is based on whether the valuation inputs are observable or unobservable. These levels are:
| · | Level 1 – Quoted prices in active markets for identical investments. Level 1 may include exchange traded instruments, such as domestic equities, some foreign equities, options, futures, mutual funds, exchange traded funds, rights and warrants. |
| · | Level 2 – Observable inputs other than Level 1 prices, such as quoted prices for similar investments; quoted prices in markets that are not active; or other inputs that are observable or can be corroborated by observable market data. Level 2 may include debt investments that are traded less frequently than exchange traded instruments and which are valued using independent pricing services; foreign equities, which are principally traded on certain foreign markets and are adjusted daily pursuant to a fair value pricing service in order to reflect an adjustment for the factors occurring after the close of certain foreign markets but before the NYSE Close; senior floating rate interests, which are valued using an aggregate of dealer bids; short-term investments, which are valued at amortized cost; and swaps, which are valued based upon the terms of each swap contract. |
| · | Level 3 – Significant unobservable inputs that are supported by limited or no market activity. Level 3 may include financial instruments whose values are determined using indicative market quotes or require significant management judgment or estimation. These unobservable valuation inputs may include estimates for current yields, maturity/duration, prepayment speed, and indicative market quotes for comparable investments along with other assumptions relating to credit quality, collateral value, complexity of the investment structure, general market conditions and liquidity. This category may include investments where trading has been halted or there are certain restrictions on trading. While these investments are priced using unobservable inputs, the valuation of these investments reflects the best available data and management believes the prices are a reasonable representation of exit price. |
The Board of Directors of the Company generally reviews and approves the “Procedures for Valuation of Portfolio Securities” on an annual basis. These procedures define how investments are to be valued, including the formation and activities of a Valuation Committee. The Valuation Committee is responsible for determining in good faith the fair value of investments when the value cannot be obtained from primary pricing services or
| 13 |
Hartford Value HLS Fund
Notes to Financial Statements – (continued)
December 31, 2013
(000’s Omitted)
alternative sources or if the valuation of an investment as provided by the primary pricing service or alternative source is believed not to reflect the investment’s fair value as of the Valuation Date. Voting members of the Valuation Committee include the Fund’s Treasurer or designee and a Vice President of the investment manager or designee. An Assistant Vice President of the Fund with legal expertise or designee is also included on the Valuation Committee as a non-voting advisory member. In addition, the Fund’s Chief Compliance Officer shall designate a member of the compliance group to attend Valuation Committee meetings as a non-voting resource, to monitor for and provide guidance with respect to compliance with these procedures. Two members of the Valuation Committee or their designees, representing different departments, shall constitute a quorum for purposes of permitting the Valuation Committee to take action. The Valuation Committee will consider all relevant factors in determining an investment’s fair value, and may seek the advice of the Fund’s sub-adviser, knowledgeable brokers, and legal counsel in making such determination. The Valuation Committee reports to the Audit Committee of the Company’s Board of Directors. The Audit Committee receives quarterly written reports which include details of all fair-valued investments, including the reason for the fair valuation, and an indication, when possible, of the accuracy of the valuation by disclosing the next available reliable public price quotation or the disposition price of such investments (the “look-back” test). The Board of Directors then must consider for ratification all of the fair value determinations made during the previous quarter.
Valuation levels are not necessarily indicative of the risk associated with investing in such investments. Individual investments within any of the above mentioned asset classes may be assigned a different hierarchical level than those presented above, as individual circumstances dictate.
For additional information, refer to the Investment Valuation Hierarchy Level Summary and the Level 3 roll-forward reconciliation, if applicable, which follow the Schedule of Investments.
| c) | Investment Transactions and Investment Income – Investment transactions are recorded as of the trade date (the date the order to buy or sell is executed) for financial reporting purposes. Investments purchased or sold on a when-issued or delayed-delivery basis may be settled a month or more after the trade date. Realized gains and losses are determined on the basis of identified cost. |
Dividend income from domestic securities is accrued on the ex-dividend date. In general, dividend income from foreign securities is recorded on the ex-date; however, dividend notifications in certain foreign jurisdictions may not be available in a timely manner and as a result, the Fund will record the dividend as soon as the relevant details (i.e., rate per share, payment date, shareholders of record, etc.) are publicly available. Interest income, including amortization of premium, accretion of discounts and additional principal received in-kind in lieu of cash, is accrued on a daily basis.
| d) | Foreign Currency Transactions – Assets and liabilities denominated in currencies other than U.S. dollars are translated into U.S. dollars at the exchange rates in effect on the valuation date. Purchases and sales of investments, income and expenses are translated into U.S. dollars at the exchange rates on the dates of such transactions. |
The Fund does not isolate that portion of portfolio investment valuation resulting from fluctuations in the foreign currency exchange rates from the fluctuations arising from changes in the market prices of investments held. Exchange rate fluctuations are included with the net realized and unrealized gain or loss on investments in the accompanying financial statements.
Net realized foreign exchange gains or losses arise from sales of foreign currencies and the difference between asset and liability amounts initially stated in foreign currencies and the U.S. dollar value of the amounts actually received or paid. Net unrealized foreign exchange gains or losses arise from changes in the value of other assets and liabilities at the end of the reporting period, resulting from changes in the exchange rates.
| e) | Joint Trading Account – The Fund may invest cash balances into a joint trading account that may be invested in one or more repurchase agreements. |
| 14 |
| f) | Fund Share Valuation and Dividend Distributions to Shareholders – Orders for the Fund’s shares are executed in accordance with the investment instructions of the contract holders and plan participants. The NAV of the Fund’s shares is determined as of the close of business on each business day of the Exchange. The NAV is determined separately for each class of shares of the Fund by dividing the Fund’s net assets attributable to that class by the number of shares of the class outstanding. Each class of shares offered by the Fund has equal rights as to assets and voting privileges (except that shareholders of a class have exclusive voting rights regarding any matter relating solely to that class of shares). Income and non-class specific expenses are allocated daily to each class on the basis of the relative net assets of the class. Realized and unrealized gains and losses are allocated daily based on the relative net assets of each class of shares of the Fund. |
Orders for the purchase of the Fund’s shares received prior to the close of the Exchange on any day the Exchange is open for business are priced at the NAV determined as of the close of the Exchange. Orders received after the close of the Exchange, or on a day on which the Exchange and/or the Fund is not open for business, are priced at the next determined NAV.
Dividends are declared pursuant to a policy adopted by the Company’s Board of Directors based upon the investment performance of the Fund. The policy of the Fund is to pay dividends from net investment income and realized gains, if any, at least once a year.
Distributions from net investment income, net realized gains and capital are determined in accordance with federal income tax regulations, which may differ from U.S. GAAP with respect to character and timing. These differences may include but are not limited to losses deferred due to wash sale adjustments, foreign currency gains and losses, adjustments related to Passive Foreign Investment Companies (“PFICs”), Real Estate Investment Trusts (“REITs”), Regulated Investment Companies (“RICs”), certain derivatives and partnerships. Permanent book and federal income tax basis differences relating to shareholder distributions will result in reclassifications to certain of the Fund’s capital accounts (see Federal Income Taxes: Reclassification of Capital Accounts note).
| 3. | Securities and Other Investments: |
| a) | Repurchase Agreements – A repurchase agreement is an agreement by which a counterparty agrees to sell an investment and agrees to repurchase the investment sold from the buyer at a mutually agreed upon time and price. During the period of the repurchase agreement, the counterparty will deposit cash and or securities in a third party custodial account to serve as collateral. At the time the Fund enters into a repurchase agreement, the value of the underlying collateral, including accrued interest, will be equal to or exceed the value of the repurchase agreement. Repurchase agreements expose the Fund to counterparty risk - that is, the risk that the counterparty will not fulfill its obligations. To minimize counterparty risk, the investments that serve to collateralize the repurchase agreement are held by the Fund’s custodian in book entry or physical form in the custodial account of the Fund or in a third party custodial account. Repurchase agreements are valued at cost plus accrued interest, which approximates fair value. Repurchase agreements have master netting arrangements which allow the Fund to offset amounts owed to a counterparty with amounts owed by the counterparty, including any collateral. Upon an event of default under a master repurchase agreement, the non-defaulting party may close out all transactions traded under such agreement and net amounts owed under each transaction to one net amount payable by one party to the other. Absent an event of default, the master repurchase agreement does not result in an offset of reported amounts of assets and liabilities in the Statement of Assets and Liabilities across transactions between the Fund and the applicable counterparty. The Fund, as shown on the Schedule of Investments, had outstanding repurchase agreements and related collateral as of December 31, 2013. |
| b) | Illiquid and Restricted Investments – The Fund is permitted to invest up to 15% of its net assets in illiquid investments. Illiquid investments are those that may not be sold or disposed of in the ordinary course of business within seven days, at approximately the price used to determine the Fund’s NAV. The Fund may not be able to sell illiquid investments when its sub-adviser considers it desirable to do so or may have to sell such investments at a price that is lower than the price that could be obtained if the investments were more liquid. A sale of illiquid investments may require more time and may result in higher dealer discounts and other selling expenses than does the sale of those that are liquid. Illiquid |
| 15 |
Hartford Value HLS Fund
Notes to Financial Statements – (continued)
December 31, 2013
(000’s Omitted)
investments also may be more difficult to value due to the unavailability of reliable market quotations for such investments, and an investment in them may have an adverse impact on the Fund’s NAV. The Fund may also purchase certain restricted investments that can only be resold to certain qualified investors and may be determined to be liquid pursuant to policies and guidelines established by the Company’s Board of Directors. The Fund, as shown on the Schedule of Investments, had illiquid and/or restricted investments as of December 31, 2013.
| c) | Investments Purchased on a When-Issued or Delayed-Delivery Basis – Delivery and payment for investments that have been purchased by the Fund on a forward commitment, or when-issued or delayed-delivery basis, take place beyond the customary settlement period. The Fund may dispose of or renegotiate a delayed-delivery transaction after it is entered into, and may sell delayed-delivery investments before they are delivered, which may result in a realized gain or loss. During this period, such investments are subject to market fluctuations, and the Fund identifies investments segregated in its records with a value at least equal to the amount of the commitment. As of December 31, 2013, the Fund had no outstanding when-issued or delayed-delivery investments. |
| 4. | Financial Derivative Instruments: |
The following disclosures contain information on how and why the Fund uses derivative instruments, the credit-risk-related contingent features in certain derivative instruments, and how derivative instruments affect the Fund’s financial position and results of operations. The location and fair value amounts of these instruments on the Statement of Assets and Liabilities and the realized gains and losses and changes in unrealized gains and losses on the Statement of Operations, each categorized by type of derivative contract, are included in the following Additional Derivative Instrument Information footnote. The derivative instruments outstanding as of year-end are disclosed in the notes to or within the Schedule of Investments for purchased options, if applicable. The amounts of realized gains and losses and changes in unrealized gains and losses on derivative instruments during the year are disclosed in the Statement of Operations.
| a) | Foreign Currency Contracts – The Fund may enter into foreign currency contracts that obligate the Fund to purchase or sell currencies at specified future dates. Foreign currency contracts are used to hedge the currency exposure associated with some or all of the Fund’s investments and/or as part of an investment strategy. Foreign currency contracts are marked to market daily and the change in value is recorded by the Fund as an unrealized gain or loss. The Fund will record a realized gain or loss when the foreign currency contract is settled. |
Foreign currency contracts involve elements of market risk in excess of the amounts reflected in the Statement of Assets and Liabilities. In addition, risks may arise upon entering into these contracts from the potential inability of the counterparties to meet the terms of the contracts and from unanticipated movements in the value of the foreign currencies relative to the U.S. dollar. The Fund had no outstanding foreign currency contracts as of December 31, 2013.
| b) | Additional Derivative Instrument Information: |
The volume of derivative activity was minimal during the year ended December 31, 2013.
The Effect of Derivative Instruments on the Statement of Operations for the year ended December 31, 2013:
| Risk Exposure Category | ||||||||||||||||||||||||||||
| Interest Rate Contracts | Foreign Exchange Contracts | Credit Contracts | Equity Contracts | Commodity Contracts | Other Contracts | Total | ||||||||||||||||||||||
| Realized Gain on Derivatives Recognized as a Result of Operations: | ||||||||||||||||||||||||||||
| Net realized gain on foreign currency contracts | $ | — | $ | 39 | $ | — | $ | — | $ | — | $ | — | $ | 39 | ||||||||||||||
| Total | $ | — | $ | 39 | $ | — | $ | — | $ | — | $ | — | $ | 39 | ||||||||||||||
| 16 |
| 5. | Principal Risks: |
The Fund may be exposed to counterparty risk, or the risk that an institution or other entity with which the Fund has unsettled or open transactions will default.
If the Fund invests directly in foreign currencies or in securities that trade in, and receive revenues in, foreign currencies, or in derivatives that provide exposure to foreign currencies, it will be subject to the risk that those currencies will decline in value relative to the base currency (U.S. dollars) of the Fund, or, in the case of hedging positions, that the Fund’s base currency will decline in value relative to the currency being hedged. Currency rates in foreign countries may fluctuate significantly over short periods of time for a number of reasons, including changes in interest rates, intervention (or the failure to intervene) by U.S. or foreign governments, central banks or supranational entities, such as the International Monetary Fund, or by the imposition of currency controls or other political developments in the United States or abroad. As a result, the Fund’s investments in foreign currency denominated securities may reduce the returns of the Fund. The market values of equity securities, such as common stocks and preferred stocks, or equity related investments, such as futures and options, may decline due to general market conditions which are not specifically related to a particular company, such as real or perceived adverse economic conditions, changes in the general outlook for corporate earnings, changes in interest or currency rates or adverse investor sentiment generally. The market value of equity securities may also decline due to factors which affect a particular industry or industries, such as labor shortages or increased production costs and competitive conditions within an industry. Equity securities and equity related investments generally have greater market price volatility than fixed income securities.
| 6. | Federal Income Taxes: |
| a) | Federal Income Taxes – For federal income tax purposes, the Fund intends to continue to qualify as a RIC under Subchapter M of the Internal Revenue Code (“IRC”) by distributing substantially all of its taxable net investment income and net realized capital gains to its shareholders and otherwise complying with the requirements of the IRC. The Fund has distributed substantially all of its income and capital gains in prior years, if applicable, and intends to distribute substantially all of its income and capital gains prior to the next fiscal year-end. Accordingly, no provision for federal income or excise taxes has been made in the accompanying financial statements. Distributions from short-term capital gains are treated as ordinary income distributions for federal income tax purposes. |
| b) | Net Investment Income (Loss), Net Realized Gains (Losses) and Distributions – Net investment income (loss) and net realized gains (losses) may differ for financial statement and tax purposes primarily because of losses deferred due to wash sale adjustments, foreign currency gains and losses, adjustments related to PFICs, REITs, RICs, certain derivatives and partnerships. The character of distributions made during the year from net investment income or net realized gains may differ from their ultimate characterization for federal income tax purposes. Also, due to the timing of dividend distributions, the fiscal year in which amounts are distributed may differ from the year that the income or realized gains (losses) were recorded by the Fund. |
| c) | Distributions and Components of Distributable Earnings – The tax character of distributions paid by the Fund for the periods indicated is as follows (as adjusted for dividends payable, if applicable): |
| For the Year Ended December 31, 2013 | For the Year Ended December 31, 2012 | |||||||
| Ordinary Income | $ | 10,589 | $ | 14,517 | ||||
| 17 |
Hartford Value HLS Fund
Notes to Financial Statements – (continued)
December 31, 2013
(000’s Omitted)
As of December 31, 2013, the Fund’s components of distributable earnings (deficit) on a tax basis were as follows:
| Amount | ||||
| Undistributed Ordinary Income | $ | 341 | ||
| Accumulated Capital and Other Losses* | (50,791 | ) | ||
| Unrealized Appreciation† | 201,361 | |||
| Total Accumulated Earnings | $ | 150,911 | ||
| * | The Fund has capital loss carryforwards that are identified in the Capital Loss Carryforward note that follows. |
| † | Differences between book-basis and tax-basis unrealized appreciation (depreciation) may be attributable to the losses deferred due to wash sale adjustments, foreign currency gains and losses, adjustments related to PFICs, REITs, RICs, certain derivatives and partnerships. |
| d) | Reclassification of Capital Accounts – The Fund may record reclassifications in its capital accounts. These reclassifications have no impact on the total net assets of the Fund. The reclassifications are a result of permanent differences between U.S. GAAP and tax accounting for such items as foreign currency, PFICs, expiration or utilization of capital loss carryforwards or net operating losses. Adjustments are made to reflect the impact these items have on current and future distributions to shareholders. Therefore, the source of the Fund’s distributions may be shown in the accompanying Statement of Changes in Net Assets as from undistributed net investment income, from accumulated net realized gains on investments or from capital depending on the type of book and tax differences that exist. For the year ended December 31, 2013, the Fund recorded reclassifications to increase (decrease) the accounts listed below: |
| Amount | ||||
| Undistributed Net Investment Income (Loss) | $ | (120 | ) | |
| Accumulated Net Realized Gain (Loss) | 129 | |||
| Capital Stock and Paid-in-Capital | (9 | ) | ||
| e) | Capital Loss Carryforward – On December 22, 2010, the Regulated Investment Company Modernization Act of 2010 (the “Act”) was enacted, which made changes to the capital loss carryforward rules. The changes are effective for taxable years beginning after the date of enactment. Under the Act, funds are permitted to carry forward capital losses for an unlimited period. However, any losses incurred during those future taxable years will be required to be utilized prior to the losses incurred in pre-enactment taxable years, which carry an expiration date. As a result of this ordering rule, pre-enactment capital loss carryforwards may be more likely to expire unused. Additionally, post-enactment capital loss carryforwards retain their character as either short-term or long-term capital losses rather than being considered all short-term as permitted under prior regulation. |
At December 31, 2013 (tax-year-end), the Fund had capital loss carryforwards for U.S. federal income tax purposes as follows:
| Year of Expiration | Amount | |||
| 2016 | $ | 6,782 | ||
| 2017 | 44,009 | |||
| Total | $ | 50,791 | ||
During the year ended December 31, 2013, the Fund utilized $75,456 of prior year capital loss carryforwards.
| f) | Accounting for Uncertainty in Income Taxes – The Fund has adopted financial reporting rules that require the Fund to analyze all open tax years, as defined by the statute of limitations, for all major jurisdictions. Generally, tax authorities can examine all tax returns filed for the last three years. The Fund does not have an examination in progress. |
| 18 |
The Fund has reviewed all open tax years and major jurisdictions and concluded that these financial reporting rules had no effect on the Fund’s financial position or results of operations. There is no tax liability resulting from unrecognized tax benefits relating to uncertain income tax positions taken or expected to be taken on the tax return for the fiscal year ended December 31, 2013. The Fund is also not aware of any tax positions for which it is reasonably possible that the total amounts of unrecognized tax benefits will significantly change in the next twelve months.
| 7. | Expenses: |
| a) | Investment Management Agreement – Hartford Funds Management Company, LLC (“HFMC”), an indirect wholly owned subsidiary of The Hartford Financial Services Group, Inc. (“The Hartford”), serves as investment manager to the Fund pursuant to an Investment Management Agreement with the Company. The investment manager has overall investment supervisory responsibility for the Fund. In addition, the investment manager provides administrative personnel, services, equipment, facilities and office space for proper operation of the Fund. The investment manager has contracted with Wellington Management Company, LLP (“Wellington Management”) under a sub-advisory agreement for the provision of day-to-day investment management services to the Fund in accordance with the Fund’s investment objective and policies. The Fund pays a fee to the investment manager, a portion of which may be used to compensate Wellington Management. |
The schedule below reflects the rates of compensation paid to HFMC for investment management services rendered as of December 31, 2013; the rates are accrued daily and paid monthly.
| Average Daily Net Assets | Annual Fee | |||
| On first $250 million | 0.7750% | |||
| On next $250 million | 0.7250% | |||
| On next $500 million | 0.6750% | |||
| On next $1.5 billion | 0.6250% | |||
| On next $2.5 billion | 0.6200% | |||
| On next $5 billion | 0.6150% | |||
| Over $10 billion | 0.6100% | |||
| b) | Accounting Services Agreement – Pursuant to the Fund Accounting Agreement between HFMC and the Company, on behalf of the Fund, HFMC provides accounting services to the Fund and receives monthly compensation based on the Fund’s average daily net assets at the rates set forth below. The Fund’s accounting services fees are accrued daily and paid monthly. |
| Average Daily Net Assets | Annual Fee | |||
| All Assets | 0.010% | |||
| c) | Operating Expenses – Allocable expenses incurred by the Company are allocated to each Fund and allocated to classes within a Fund in proportion to the average daily net assets of the Fund and each class, except where allocation of certain expenses is more fairly made directly to the Fund or to specific classes within a Fund. |
| d) | Fees Paid Indirectly – The Company, on behalf of the Fund, has entered into agreements with State Street Global Markets, LLC and Russell Implementation Services, Inc. to partially recapture non-discounted trade commissions. Such rebates are used to pay a portion of the Fund’s expenses. In addition, the Fund’s custodian bank has agreed to reduce its fees when the Fund maintains cash on deposit in a non-interest-bearing custody account. For the year ended December 31, 2013, these amounts, if any, are included in the Statement of Operations. |
| 19 |
Hartford Value HLS Fund
Notes to Financial Statements – (continued)
December 31, 2013
(000’s Omitted)
The ratio of expenses to average net assets in the accompanying financial highlights excludes the reduction in expenses related to fees paid indirectly. The annualized expense ratio after waivers for the period listed below reflecting the reduction for fees paid indirectly is as follows:
| Year Ended December 31, 2013 | ||||
| Class IA | 0.76 | % | ||
| Class IB | 1.01 | |||
| e) | Distribution Plan for Class IB shares – Effective June 14, 2013, Hartford Investment Financial Services, LLC was renamed Hartford Funds Distributors, LLC (“HFD”). HFD, a wholly owned, ultimate subsidiary of The Hartford, serves as the Fund’s principal underwriter and distributor. The Company, on behalf of the Fund, has adopted a Distribution Plan pursuant to Rule 12b-1 of the 1940 Act to compensate the distributor, HFD, from assets attributable to the Class IB shares for services rendered and expenses borne in connection with activities primarily intended to result in the sale of the Class IB shares, subject to the review and approval of the Company’s Board of Directors. |
The Distribution Plan provides that the Fund may pay annually up to 0.25% of the average daily net assets of the Fund attributable to its Class IB shares for activities primarily intended to result in the sale of Class IB shares. The Board has the authority to suspend or reduce these payments at any point in time. Under the terms of the Distribution Plan and the principal underwriting agreement, the Fund is authorized to make payments monthly to the distributor that may be used to pay or compensate entities providing distribution and shareholder servicing with respect to the Class IB shares for such entities’ fees or expenses incurred or paid in that regard. These fees are accrued daily and paid monthly.
| f) | Other Related Party Transactions – Certain officers of the Fund are directors and/or officers of the investment manager and/or The Hartford or its subsidiaries. For the year ended December 31, 2013, a portion of the Fund’s Chief Compliance Officer’s salary was paid by all the investment companies in the Hartford fund complex. The portion allocated to the Fund was in the amount of $1. Hartford Administrative Services Company (“HASCO”), an indirect wholly owned subsidiary of The Hartford, provides transfer agent services to the Fund. HASCO was compensated on a per account basis for providing such services. The amount paid to HASCO can be found in the Statement of Operations. These fees are accrued daily and paid monthly. |
| g) | Payment from Affiliate – In July of 2007, The Hartford entered into a settlement with the Attorneys General of the states of New York, Connecticut and Illinois relating to market timing and the company's individual variable annuity contracts in which certain payments would be made directly to the variable annuity contract holders. The distribution plan provided that unclaimed money from the settlement would be distributed to certain HLS Funds that are investment options through a Hartford individual variable annuity contract. The unclaimed money was distributed to the Fund on September 18, 2009. |
The total return in the accompanying financial highlights includes a payment from an affiliate. Had the payment from the affiliate been excluded, the impact and total return for the period listed below would have been as follows:
| For the Year Ended December 31, 2009 | ||||||||
| Class IA | Class IB | |||||||
| Impact from Payment from Affiliate for Attorneys General Settlement | — | % | — | % | ||||
| Total Return Excluding Payment from Affiliate | 24.37 | % | 24.05 | % | ||||
| 20 |
��
| 8. | Investment Transactions: |
For the year ended December 31, 2013, the Fund's aggregate purchases and sales of investment securities (excluding short-term investments) were as follows:
| Amount | ||||
| Cost of Purchases Excluding U.S. Government Obligations | $ | 125,702 | ||
| Sales Proceeds Excluding U.S. Government Obligations | 297,727 | |||
| 9. | Line of Credit: |
The Fund is one of several Hartford funds that participate in a $500 million committed revolving line of credit facility. The facility is to be used for temporary or emergency purposes. Under the arrangement, the funds are required to own securities having a market value in excess of 300% of the total bank borrowings. The interest rate on borrowings varies depending on the nature of the loan. The facility also requires a fee to be paid based on the amount of the commitment. This commitment fee is allocated to all of the funds participating in the line of credit based on the average net assets of the funds. During the year ended December 31, 2013, the Fund did not have any borrowings under this facility.
| 10. | Industry Classifications: |
Other than the industry classifications “Other Investment Pools and Funds” and “Exchange Traded Funds,” equity industry classifications used in this report are the Global Industry Classification Standard, which was developed by and is the exclusive property and service mark of MSCI, Inc. and Standard & Poor’s.
| 11. | Indemnifications: |
Under the Company’s organizational documents, the Company shall indemnify its officers and directors to the full extent required or permitted under Maryland General Corporation Law and the federal securities laws. In addition, the Company, on behalf of the Fund, may enter into contracts that contain a variety of indemnifications. The Company’s maximum exposure under these arrangements is unknown. However, as of the date of these financial statements, the Company has not had prior claims or losses pursuant to these contracts and expects the risk of loss to be remote.
| 12. | Pending Legal Proceedings: |
On February 25, 2011, Jennifer L. Kasilag, Louis Mellinger, Judith M. Menendez, Jacqueline M. Robinson, and Linda A. Russell filed a derivative lawsuit against Hartford Investment Financial Services, LLC (“HIFSCO”)(now known as Hartford Funds Distributors, LLC) on behalf of six Hartford retail mutual funds in the United States District Court for the District of New Jersey, alleging that HIFSCO received excessive advisory and distribution fees in violation of its statutory fiduciary duty under Section 36(b) of the 1940 Act when serving as investment manager and principal underwriter, respectively, to the Hartford retail mutual funds. HIFSCO moved to dismiss and, in September 2011, the motion was granted in part and denied in part, with leave to amend the complaint. In November 2011, plaintiffs filed an amended complaint on behalf of certain Hartford retail mutual funds, The Hartford Global Health Fund (now known as The Hartford Healthcare Fund), The Hartford Conservative Allocation Fund, The Hartford Growth Opportunities Fund, The Hartford Inflation Plus Fund, The Hartford Advisers Fund (now known as The Hartford Balanced Fund), and The Hartford Capital Appreciation Fund. Plaintiffs seek to rescind the investment management agreements and distribution plans between HIFSCO and these funds and to recover the total fees charged thereunder or, in the alternative, to recover any improper compensation HIFSCO received, in addition to lost earnings. HIFSCO filed a partial motion to dismiss the amended complaint and, in December 2012, the court dismissed without prejudice the claims regarding distribution fees and denied the motion with respect to the advisory fees claims. HIFSCO disputes the allegations and intends to defend the advisory fee claims vigorously.
This action concerns the activities of HIFSCO in its capacity as investment manager and principal underwriter to the Hartford retail mutual funds and does not concern HIFSCO’s activities in its capacity as principal underwriter to the HLS funds. For this reason, no accrual for litigation relating to this matter has been recorded in the financial statements of the Fund.
| 21 |
Financial Highlights
| ─ Selected Per-Share Data(A) ─ | ─ Ratios and Supplemental Data ─ | |||||||||||||||||||||||||||||||||||||||||||||||||||
| Class | Net Asset Value at Beginning of Period | Net Investment Income (Loss) | Net Realized and Unrealized Gain (Loss) on Investments | Total from Investment Operations | Dividends from Net Investment Income | Distributions from Realized Capital Gains | Total Dividends and Distributions | Net Asset Value at End of Period | Total Return(B) | Net Assets at End of Period (000s) | Ratio of Expenses to Average Net Assets Before Adjust- ments(C) | Ratio of Expenses to Average Net Assets After Adjust- ments(C) | Ratio of Net Investment Income (Loss) to Average Net Assets | |||||||||||||||||||||||||||||||||||||||
| For the Year Ended December 31, 2013 | ||||||||||||||||||||||||||||||||||||||||||||||||||||
| IA | $ | 11.86 | $ | 0.23 | $ | 3.55 | $ | 3.78 | $ | (0.25 | ) | $ | – | $ | (0.25 | ) | $ | 15.39 | 31.94 | % | $ | 551,350 | 0.76 | % | 0.76 | % | 1.66 | % | ||||||||||||||||||||||||
| IB | 11.85 | 0.20 | 3.54 | 3.74 | (0.21 | ) | – | (0.21 | ) | 15.38 | 31.65 | 109,081 | 1.01 | 1.01 | 1.41 | |||||||||||||||||||||||||||||||||||||
| For the Year Ended December 31, 2012 (D) | ||||||||||||||||||||||||||||||||||||||||||||||||||||
| IA | $ | 10.37 | $ | 0.26 | $ | 1.50 | $ | 1.76 | $ | (0.27 | ) | $ | – | $ | (0.27 | ) | $ | 11.86 | 16.99 | % | $ | 549,228 | 0.76 | % | 0.76 | % | 2.02 | % | ||||||||||||||||||||||||
| IB | 10.36 | 0.23 | 1.50 | 1.73 | (0.24 | ) | – | (0.24 | ) | 11.85 | 16.69 | 103,438 | 1.01 | 1.01 | 1.77 | |||||||||||||||||||||||||||||||||||||
| For the Year Ended December 31, 2011 (D) | ||||||||||||||||||||||||||||||||||||||||||||||||||||
| IA | $ | 10.77 | $ | 0.20 | $ | (0.41 | ) | $ | (0.21 | ) | $ | (0.19 | ) | $ | – | $ | (0.19 | ) | $ | 10.37 | (1.96 | )% | $ | 591,278 | 0.75 | % | 0.75 | % | 1.65 | % | ||||||||||||||||||||||
| IB | 10.76 | 0.17 | (0.41 | ) | (0.24 | ) | (0.16 | ) | – | (0.16 | ) | 10.36 | (2.20 | ) | 111,486 | 1.00 | 1.00 | 1.40 | ||||||||||||||||||||||||||||||||||
| For the Year Ended December 31, 2010 | ||||||||||||||||||||||||||||||||||||||||||||||||||||
| IA | $ | 9.50 | $ | 0.13 | $ | 1.26 | $ | 1.39 | $ | (0.12 | ) | $ | – | $ | (0.12 | ) | $ | 10.77 | 14.67 | % | $ | 741,230 | 0.78 | % | 0.78 | % | 1.36 | % | ||||||||||||||||||||||||
| IB | 9.50 | 0.11 | 1.25 | 1.36 | (0.10 | ) | – | (0.10 | ) | 10.76 | 14.38 | 154,731 | 1.03 | 1.03 | 1.11 | |||||||||||||||||||||||||||||||||||||
| For the Year Ended December 31, 2009 (D) | ||||||||||||||||||||||||||||||||||||||||||||||||||||
| IA | $ | 7.77 | $ | 0.14 | $ | 1.75 | $ | 1.89 | $ | (0.16 | ) | $ | – | $ | (0.16 | ) | $ | 9.50 | 24.37 | %(E) | $ | 244,909 | 0.87 | % | 0.87 | % | 1.65 | % | ||||||||||||||||||||||||
| IB | 7.77 | 0.13 | 1.74 | 1.87 | (0.14 | ) | – | (0.14 | ) | 9.50 | 24.06 | (E) | 63,003 | 1.12 | 1.12 | 1.40 | ||||||||||||||||||||||||||||||||||||
| (A) | Information presented relates to a share outstanding throughout the indicated period. Net investment income (loss) per share amounts are calculated based on average shares outstanding unless otherwise noted. |
| (B) | The figures do not include sales charges or other fees which may be applied at the variable life insurance, variable annuity or qualified retirement plan product level. Any such additional sales charges or other fees would lower the Fund's performance. |
| (C) | Adjustments include waivers and reimbursements, if applicable. Ratios do not include fees paid indirectly (see Expenses in the accompanying Notes to Financial Statements). |
| (D) | Net investment income (loss) per share amounts have been calculated using the SEC method. |
| (E) | Total return without the inclusion of the Payment from (to) Affiliate can be found in Expenses in the accompanying Notes to Financial Statements. |
| Portfolio Turnover Rate for All Share Classes | ||||
| For the Year Ended December 31, 2013 | 19 | % | ||
| For the Year Ended December 31, 2012 | 22 | |||
| For the Year Ended December 31, 2011 | 16 | |||
| For the Year Ended December 31, 2010 | 47 | (A) | ||
| For the Year Ended December 31, 2009 | 50 | |||
| (A) | During the year ended December 31, 2010, the Fund incurred $269.8 million in sales associated with the transition of assets from Hartford Equity Income HLS Fund and Hartford Value Opportunities HLS Fund, which merged into the Fund on March 19, 2010. These sales were excluded from the portfolio turnover calculation. |
| 22 |
Report of Independent Registered Public Accounting Firm
The Board of Directors and Shareholders of
Hartford Series Fund, Inc.
We have audited the accompanying statement of assets and liabilities, including the schedule of investments, of Hartford Value HLS Fund (one of the portfolios constituting Hartford Series Fund, Inc. (the Funds)) as of December 31, 2013, and the related statement of operations for the year then ended, the statements of changes in net assets for each of the two years in the period then ended, and the financial highlights for each of the five years in the period then ended. These financial statements and financial highlights are the responsibility of the Funds’ management. Our responsibility is to express an opinion on these financial statements and financial highlights based on our audits.
We conducted our audits in accordance with the standards of the Public Company Accounting Oversight Board (United States). Those standards require that we plan and perform the audit to obtain reasonable assurance about whether the financial statements and financial highlights are free of material misstatement. We were not engaged to perform an audit of the Funds’ internal control over financial reporting. Our audits included consideration of internal control over financial reporting as a basis for designing audit procedures that are appropriate in the circumstances, but not for the purpose of expressing an opinion on the effectiveness of the Funds’ internal control over financial reporting. Accordingly, we express no such opinion. An audit also includes examining, on a test basis, evidence supporting the amounts and disclosures in the financial statements and financial highlights, assessing the accounting principles used and significant estimates made by management, and evaluating the overall financial statement presentation. Our procedures included confirmation of securities owned as of December 31, 2013, by correspondence with the custodian and brokers or by other appropriate auditing procedures where replies from brokers were not received. We believe that our audits provide a reasonable basis for our opinion.
In our opinion, the financial statements and financial highlights referred to above present fairly, in all material respects, the financial position of Hartford Value HLS Fund of the Hartford Series Fund, Inc. at December 31, 2013, the results of its operations for the year then ended, the changes in its net assets for each of the two years in the period then ended, and the financial highlights for each of the five years in the period then ended, in conformity with U.S. generally accepted accounting principles.
Minneapolis, MN
February 17, 2014
| 23 |
Directors and Officers (Unaudited)
The Board of Directors of the Company appoints officers who are responsible for the day-to-day operations of the Fund and who execute policies formulated by the directors. Each director serves until his or her death, resignation, or retirement or until the next annual meeting of shareholders is held or until his or her successor is elected and qualifies.
Directors and officers who are employed by or who have a financial interest in The Hartford are considered “interested” persons of the Fund pursuant to the 1940 Act. Each officer and two of the Company’s directors, as noted in the chart below, are “interested” persons of the Fund. Each director serves as a director for The Hartford Mutual Funds, Inc., The Hartford Mutual Funds II, Inc., Hartford Series Fund, Inc., Hartford HLS Series Fund II, Inc., and as a trustee for The Hartford Alternative Strategies Fund, which, as of December 31, 2013, collectively consist of 91 funds. Correspondence may be sent to directors and officers c/o Hartford Funds, 5 Radnor Corporate Center, Suite 300, 100 Matsonford Road, Radnor, Pennsylvania 19087, except that correspondence to Mr. Annoni, Mr. Dressen and Ms. Quade may be sent to 500 Bielenberg Drive, Woodbury, Minnesota 55125.
The table below sets forth, for each director and officer, his or her name, year of birth, current position with the Company and date first elected or appointed to Hartford Series Fund, Inc. (“HSF”), and Hartford HLS Series Fund II, Inc. (“HSF2”), principal occupation, and, for directors, other directorships held. The Fund’s Statement of Additional Information contains further information on the directors and is available free of charge by calling 1-800-862-6668 or writing to Hartford HLS Funds, c/o Hartford Life Insurance Company, Hartford Life and Annuity Insurance Company, P.O. Box 14293, Lexington, KY 40512-4293.
Information on the aggregate remuneration paid to the directors of the Company can be found in the Statement of Operations herein. The Fund pays to The Hartford a portion of the Chief Compliance Officer’s compensation, but does not pay salaries or compensation to any of their other officers or directors who are employed by The Hartford.
Non-Interested Directors
Lynn S. Birdsong (1946) Director since 2003, Co-Chairman of the Investment Committee since 2005
Mr. Birdsong is a private investor. Mr. Birdsong currently serves as a Director of the Sovereign High Yield Investment Company (April 2010 to current). Mr. Birdsong currently serves as an Independent Director of Nomura Partners Funds, Inc. (formerly, The Japan Fund) (April 2003 to current). From 2003 to March 2005, Mr. Birdsong was an Independent Director of the Atlantic Whitehall Funds. From 1979 to 2002, Mr. Birdsong was a Managing Director of Zurich Scudder Investments, an investment management firm. During his employment with Scudder, Mr. Birdsong was an Interested Director of The Japan Fund. From January 1981 through December 2013, Mr. Birdsong was a partner in Birdsong Company, an advertising specialty firm.
Robert M. Gavin, Jr. (1940) Director since 2002 (HSF) and 1986 (HSF2), Chairman of the Board since 2004
Dr. Gavin is an educational consultant. Prior to September 1, 2001, he was President of Cranbrook Education Community and prior to July 1996, he was President of Macalester College, St. Paul, Minnesota.
Duane E. Hill (1945) Director since 2001 (HSF) and 2002 (HSF2), Chairman of the Nominating Committee since 2003
Mr. Hill is a Partner of TSG Ventures L.P., a private equity investment company. Mr. Hill is a former partner of TSG Capital Group, a private equity investment firm that served as sponsor and lead investor in leveraged buyouts of middle market companies.
Sandra S. Jaffee (1941) Director since 2005
Ms. Jaffee is the founder and Chief Executive Officer of a private company, Homeworks Concierge, LLC, which provides residential property management services in Westchester County, New York (January 2012 to present). Ms. Jaffee served as Chairman (2008 to 2009) and Chief Executive Officer of Fortent (formerly Searchspace Group), a leading provider of compliance/regulatory technology to financial institutions from August 2005 to August 2009. Ms. Jaffee currently serves as a member of the Board of Directors of Broadridge Financial Solutions as well as a Trustee of Muhlenberg College.
| 24 |
William P. Johnston (1944) Director since 2005, Chairman of the Compliance Committee since 2005
In June 2006, Mr. Johnston was appointed as Senior Advisor to The Carlyle Group, a global private equity and alternative asset investment firm and currently serves as an Operating Executive. In July 2006, Mr. Johnston was elected to the Board of Directors of MultiPlan, Inc. and served as a Director (July 2006 to August 2010). In August 2007, Mr. Johnston was elected to the Board of Directors of LifeCare Holdings, Inc. and served as a Director (August 2007 to June 2013). In February 2008, Mr. Johnston was elected to the Board of Directors of HCR-ManorCare, Inc. In May 2006, Mr. Johnston was elected to the Supervisory Board of Fresenius Medical Care AG & Co. KGaA, after its acquisition of Renal Care Group, Inc. in March 2006. Mr. Johnston joined Renal Care Group in November 2002 as a member of the Board of Directors and served as Chairman of the Board from March 2003 through March 2006. From 2002 through 2013, Mr. Johnston served as a Board member of the Georgia O’Keefe Museum. From September 1987 to December 2002, Mr. Johnston was with Equitable Securities Corporation (and its successors, SunTrust Equitable Securities and SunTrust Robinson Humphrey) serving in various investment banking and managerial positions, including Managing Director and Head of Investment Banking, Chief Executive Officer and Vice Chairman.
Phillip O. Peterson (1944) Director since 2002 (HSF) and 2000 (HSF2), Chairman of the Audit Committee since 2002
Mr. Peterson is a mutual fund industry consultant. He was a partner of KPMG LLP (an accounting firm) until July 1999. Mr. Peterson joined William Blair Funds in February 2007 as a member of the Board of Trustees. Mr. Peterson also joined the Board of Trustees of Symetra Variable Mutual Funds Trust as a trustee in February 2012.
Lemma W. Senbet (1946) Director since 2005
Dr. Senbet is the William E. Mayer Chair Professor of Finance and Founding Director, Center for Financial Policy, at the University of Maryland, Robert H. Smith School of Business. He was chair of the Finance Department of the University of Maryland, Robert H. Smith School of Business from 1998 to 2006. Since June 2013, he has been on leave from the University to serve as Executive Director of African Economic Research Consortium which focuses on economic policy research and training. Previously, he was a chaired professor of finance at the University of Wisconsin-Madison. Also, he was a Director of the Fortis Funds from March 2000 to July 2002. Dr. Senbet served as Director of the American Finance Association and President of the Western Finance Association. In 2006, Dr. Senbet was inducted Fellow of Financial Management Association International for his career-long distinguished scholarship and professional service.
Interested Directors and Officers
James E. Davey (1964) Director since 2012, President and Chief Executive Officer since 2010
Mr. Davey serves as Executive Vice President of Hartford Life Insurance Company (“HLIC”) and The Hartford Financial Services Group, Inc. Additionally, Mr. Davey serves as Chairman of the Board, Manager and Senior Managing Director of Hartford Funds Distributors, LLC (“HFD”). He also currently serves as Director, Chairman of the Board, President and Senior Managing Director of Hartford Administrative Services Company (“HASCO”). Mr. Davey also serves as Manager, Chairman of the Board and Senior Managing Director for Hartford Funds Management Company, LLC (“HFMC”). Mr. Davey joined The Hartford in 2002.
Lowndes A. Smith (1939) Director since 1996 (HSF) and 2002 (HSF2), Co-Chairman of the Investment Committee since 2005
Mr. Smith served as Vice Chairman of The Hartford from February 1997 to January 2002, as President and Chief Executive Officer of Hartford Life, Inc. from February 1997 to January 2002, and as President and Chief Operating Officer of The Hartford Life Insurance Companies from January 1989 to January 2002. Mr. Smith serves as a Director of White Mountains Insurance Group Ltd. (October 2003 to current); One Beacon Insurance (October 2006 to current); Symetra Financial (August 2007 to current) and is a Managing Director of Whittington Gray Associates (January 2007 to current).
Other Officers
Mark A. Annoni (1964) Vice President, Controller and Treasurer since 2012
Mr. Annoni currently serves as the Assistant Vice President of HLIC (February 2004 to present).
| 25 |
Hartford Value HLS Fund
Directors and Officers (Unaudited) – (continued)
Michael R. Dressen (1963) AML Compliance Officer since 2011
Mr. Dressen currently serves as Assistant Vice President of HLIC. He also serves as Chief Compliance Officer and AML Compliance Officer of HASCO and as AML Officer of HFD. Mr. Dressen has served in various positions within The Hartford and its subsidiaries in connection with the operation of the Hartford Funds.
Edward P. Macdonald (1967) Vice President, Secretary and Chief Legal Officer since 2005
Mr. Macdonald currently serves as Assistant Secretary, Executive Vice President and Deputy General Counsel of HFD, HASCO and HFMC. He also serves as Vice President of HLIC. Mr. Macdonald has served in various positions within The Hartford and its subsidiaries in connection with the operation of the Hartford Funds. Mr. Macdonald joined The Hartford in 2005.
Joseph G. Melcher (1973) Vice President and Chief Compliance Officer since 2013
Mr. Melcher currently serves as Executive Vice President of HASCO and HFD. Mr. Melcher also currently serves as Executive Vice President and Chief Compliance Officer of HFMC. Mr. Melcher has served in various positions within The Hartford and its subsidiaries in connection with the operation of the Hartford Funds since joining The Hartford in 2012. Prior to joining The Hartford, Mr. Melcher worked at Touchstone Investments, a member of the Western & Southern Financial Group, where he held the position of Vice President and Chief Compliance Officer from 2010 through 2012 and Assistant Vice President, Compliance from 2005 to 2010.
Vernon J. Meyer (1964) Vice President since 2006
Mr. Meyer currently serves as Senior Vice President of HLIC. He also currently serves as Managing Director and Chief Investment Officer of HFMC. Mr. Meyer has served in various positions within The Hartford and its subsidiaries in connection with the operation of the Hartford Funds. Mr. Meyer joined The Hartford in 2004.
Laura S. Quade (1969) Vice President since 2012
Ms. Quade currently serves as Vice President of HASCO and HFD. She is the Head of Operations of HASCO and also serves as Director, Enterprise Operations of HLIC. Ms. Quade has served in various positions within The Hartford and its subsidiaries in connection with the operation of the Hartford Funds.
Martin A. Swanson (1962) Vice President since 2010
Mr. Swanson currently serves as Vice President of HLIC. Mr. Swanson also serves as Managing Director, Chief Marketing Officer and Principal of HFD. Mr. Swanson has served in various positions within The Hartford and its subsidiaries in connection with the operation of the Hartford Funds.
HOW TO OBTAIN A COPY OF THE FUND’S PROXY VOTING POLICIES AND VOTING RECORDS (UNAUDITED)
A description of the policies and procedures that the Fund uses to determine how to vote proxies relating to portfolio securities and information about how the Fund voted proxies relating to portfolio securities during the most recent twelve-month period ended June 30 are available (1) without charge, upon request, by calling 800-862-6668 and (2) on the SEC’s website at http://www.sec.gov.
QUARTERLY PORTFOLIO HOLDINGS INFORMATION (UNAUDITED)
The Fund files a complete schedule of portfolio holdings with the SEC for the first and third quarters of each fiscal year on Form N-Q. The Fund’s Forms N-Q are available (1) without charge, upon request, by calling 800-862-6668 and (2) on the SEC’s website at http://www.sec.gov. The Form N-Q may be reviewed and copied at the SEC’s Public Reference Room in Washington, DC. Information on the operation of the Public Reference Room may be obtained by calling 1-800-SEC-0330.
| 26 |
Expense Example (Unaudited)
Your Fund's Expenses
As a shareholder of the Fund, you incur two types of costs: (1) transaction costs and (2) ongoing costs, including investment management fees, distribution and/or service (12b-1) fees, if any, and other fund expenses. This example is intended to help you understand your ongoing costs (in dollars) of investing in the Fund and to compare these costs with the ongoing costs of investing in other mutual funds. The example is based on an investment of $1,000 invested at the beginning of the period and held for the period of June 30, 2013 through December 31, 2013.
Actual Expenses
The first set of columns of the table below provides information about actual account values and actual expenses. You may use the information in this column, together with the amount you invested, to estimate the expenses that you paid over the period. Simply divide your account value by $1,000 (for example, an $8,600 account value divided by $1,000 = 8.6), then multiply the result by the number in the line under the heading entitled “Expenses Paid During Period” to estimate the expenses you paid on your account during this period.
Hypothetical Example for Comparison Purposes
The second set of columns of the table below provides information about hypothetical account values and hypothetical expenses based on the Fund’s actual expense ratio and an assumed rate of return of 5% per year before expenses, which is not the Fund’s actual return. The hypothetical account values and expenses may not be used to estimate the actual ending account balance or expenses you paid for the period. You may use this information to compare the ongoing costs of investing in the Fund and other funds. To do so, compare this 5% hypothetical example with the 5% hypothetical examples that appear in the shareholder reports of the other funds.
Please note that the expenses shown in the table are meant to highlight your ongoing costs only and do not reflect any transactional costs, such as sales charges (loads) and CDSC. Therefore, the second set of columns of the table is useful in comparing ongoing costs only, and will not help you determine the relative total costs of owning different funds. In addition, if these transactional costs were included, your costs would be higher. Expenses are equal to the Fund's annualized expense ratios multiplied by average account value over the period, multiplied by 184/365 (to reflect the one-half year period).
| Actual return | Hypothetical (5% return before expenses) | |||||||||||||||||||||||||||||||||||
| Beginning Account Value June 30, 2013 | Ending Account Value December 31, 2013 | Expenses paid during the period June 30, 2013 through December 31, 2013 | Beginning Account Value June 30, 2013 | Ending Account Value December 31, 2013 | Expenses paid during the period June 30, 2013 through December 31, 2013 | Annualized expense ratio | Days in the current 1/2 year | Days in the full year | ||||||||||||||||||||||||||||
| Class IA | $ | 1,000.00 | $ | 1,134.10 | $ | 4.12 | $ | 1,000.00 | $ | 1,021.35 | $ | 3.90 | 0.77 | % | 184 | 365 | ||||||||||||||||||||
| Class IB | $ | 1,000.00 | $ | 1,133.00 | $ | 5.46 | $ | 1,000.00 | $ | 1,020.09 | $ | 5.17 | 1.02 | % | 184 | 365 | ||||||||||||||||||||
| 27 |
Approval of Investment Management and Investment Sub-Advisory Agreements (Unaudited)
Section 15(c) of the Investment Company Act of 1940, as amended (the “1940 Act”), requires that each mutual fund’s board of directors, including a majority of those directors who are not “interested persons” of the mutual fund, as defined in the 1940 Act (the “Independent Directors”), annually review and consider the continuation of the mutual fund’s investment advisory and sub-advisory agreements. At its meeting held on August 6-7, 2013, the Board of Directors (the “Board”) of Hartford Series Fund, Inc., including each of the Independent Directors, unanimously voted to approve the continuation of the investment management agreement for Hartford Value HLS Fund (the “Fund”) with Hartford Funds Management Company, LLC (“HFMC”) and the continuation of the investment sub-advisory agreement between HFMC and the Fund’s sub-adviser, Wellington Management Company, LLP (the “Sub-adviser,” and together with HFMC, the “Advisers”) (collectively, the “Agreements”).
In the months preceding the August 6-7, 2013 meeting, the Board requested, received, and reviewed written responses from the Advisers to questions posed to them on behalf of the Independent Directors and supporting materials relating to those questions and responses. The Board considered information furnished to the Board at its meetings throughout the year, as well as information specifically prepared in connection with the annual approval of the Agreements at the Board’s meetings held on June 18-19, 2013 and August 6-7, 2013. Information provided to the Board at its meetings throughout the year included, among other things, reports on Fund performance, legal and compliance matters, sales and marketing activity, shareholder services, and the other services provided to the Fund by the Advisers and their affiliates. The Board also received in-person presentations by Fund officers and representatives of HFMC at the Board’s meetings on June 18-19, 2013 and August 6-7, 2013 concerning the Agreements.
The Independent Directors, advised by independent legal counsel, engaged two service providers to assist them with evaluating the Agreements with respect to the Fund. Lipper Inc. (“Lipper”), an independent provider of investment company data, was retained to provide the Board with reports on how the Fund’s contractual management fees, actual management fees, other non-management fees, overall expense ratios and investment performance compared to those of mutual funds with similar investment objectives. The Independent Directors also engaged an independent financial services consulting firm (the “Consultant”) to assist them in evaluating the Fund’s management fees, sub-advisory fees, other non-management fees, overall expense ratios and investment performance. In addition, the Consultant reviewed the profitability calculations utilized by HFMC in connection with the continuation of the investment management agreement.
In determining whether to continue the Agreements for the Fund, the members of the Board reviewed and evaluated information and factors they believed to be relevant and appropriate in light of the information that the Board deemed necessary and appropriate through the exercise of its reasonable business judgment. While individual members of the Board may have weighed certain factors differently, the Board’s determination to continue the Agreements was based on a comprehensive consideration of all information provided to the Board throughout the year and specifically with respect to the continuation of the Agreements. A more detailed discussion of the factors the Board considered with respect to its approval of the Agreements is provided below.
Nature, Extent, and Quality of Services Provided by the Advisers
The Board requested and considered information concerning the nature, extent, and quality of the services provided to the Fund by the Advisers. The Board considered, among other things, the terms of the Agreements and the range of services provided by the Advisers. The Board considered the Advisers’ professional personnel who provide services to the Fund, including each Adviser’s ability and experience in attracting and retaining qualified personnel to service the Fund. The Board considered each Adviser’s reputation and overall financial strength, as well as its willingness to consider and implement organizational and operational changes designed to improve services to the Fund. In addition, the Board considered the quality of each Adviser’s communications with the Board and responsiveness to Board inquiries.
The Board also requested and evaluated information concerning each Adviser’s regulatory and compliance environment. In this regard, the Board requested and reviewed information on each Adviser’s compliance policies and procedures, compliance history, and a report from the Fund’s Chief Compliance Officer on each Adviser’s compliance with applicable laws and regulations, including responses to regulatory developments and compliance issues raised by regulators. The Board also noted the Advisers’ support of the Fund’s compliance control structure, particularly the resources devoted by the Advisers in support of the Fund’s obligations pursuant to Rule 38a-1 under the 1940 Act.
| 28 |
With respect to HFMC, the Board noted that under the Agreements, HFMC is responsible for the management of the Fund, including overseeing fund operations and service providers, as well as investment advisory services in connection with selecting, monitoring and supervising the Sub-adviser. The Board considered HFMC’s ongoing monitoring of people, process and performance, including its quarterly reviews of each of the Hartford Funds, semi-annual meetings with the leaders of each Fund’s portfolio management team, and oversight of the Funds’ approximately 40 portfolio managers. The Board recognized that HFMC has demonstrated a record of making changes to the management and/or strategies of the Funds when warranted. The Board considered HFMC’s oversight of the Sub-adviser’s investment approach and results, process for monitoring best execution of portfolio trades by the Sub-adviser, and approach to risk management with respect to the Fund and the service providers to the Fund. The Board also considered HFMC’s oversight of compliance with the Fund’s objective and policies as well as with applicable laws and regulations, noting that regulatory and other developments had over time led to an increase in the scope of HFMC’s services in this regard.
In addition, the Board considered HFMC’s ongoing commitment to review and rationalize the Hartford Funds product line-up and the expenses that HFMC had incurred in connection with fund combinations in recent years. The Board considered that HFMC or its affiliates are responsible for providing the Fund’s officers. The Board also noted that Hartford Life Insurance Company (“HLIC”) provides administrative services to the Fund. The Board considered its experiences with HFMC and HLIC with respect to each of these services.
With respect to the Sub-adviser, who provides day-to-day portfolio management services, the Board considered the quality of the Fund’s portfolio managers, the Sub-adviser’s other investment personnel, its investment philosophy and process, investment research capabilities and resources, performance record, trade execution capabilities and experience. The Board considered the experience of the Fund’s portfolio managers, the number of accounts managed by the portfolio managers, and the Sub-adviser’s method for compensating the portfolio managers.
Based on these considerations, the Board concluded that it was satisfied with the nature, extent and quality of the services provided to the Fund by HFMC and the Sub-adviser.
Performance of the Fund and the Advisers
The Board considered the investment performance of the Fund. In this regard, the Board reviewed the performance of the Fund over different time periods presented in the materials and evaluated HFMC’s analysis of the Fund’s performance for these time periods. The Board considered information and materials provided to the Board by the Advisers concerning Fund performance, as well as information from Lipper comparing the investment performance of the Fund to an appropriate benchmark and universe of peer funds. The Board noted that the Fund’s performance was in the 4th quintile of its performance universe for the 1-year period and the 2nd quintile for the 3- and 5-year periods. The Board also noted that the Fund’s performance was below its benchmark for the 1-and 3-year periods and above its benchmark for the 5-year period.
The Board considered the detailed investment analytics reports provided by Hartford Funds’ Investment Advisory Group throughout the year. These reports include, among other things, information on the Fund’s gross and net returns, the Fund’s investment performance relative to an appropriate benchmark and peer group, various statistics concerning the Fund’s portfolio, and a narrative summary of various factors affecting Fund performance. The Board considered the Advisers’ cooperation with the Investment Committee, which assists the Board in evaluating the performance of the Fund at periodic meetings throughout the year. The Board also considered the analysis provided by the Consultant relating to the Fund’s performance track record.
In light of all the considerations noted above, the Board concluded that it had continued confidence in HFMC’s and the Sub-adviser’s overall capabilities to manage the Fund.
Costs of the Services and Profitability of the Advisers
The Board reviewed information regarding HFMC’s cost to provide investment management and related services to the Fund and HFMC’s profitability, both overall and for the Fund, on a pre-tax basis without regard to distribution expenses. The Board also requested and reviewed information about the profitability to HFMC and its affiliates from all services provided to the Fund and
| 29 |
Hartford Value HLS Fund
Approval of Investment Management and Investment Sub-Advisory Agreements (Unaudited) - (continued)
all aspects of their relationship with the Fund. The Board also requested and received information relating to the operations and profitability of the Sub-adviser.
The Board considered the Consultant’s review of the profitability calculations utilized by HFMC in connection with the continuation of the investment management agreement, noting the Consultant’s view that Hartford Funds’ process for calculating and reporting Fund profitability is reasonable. In this regard, the Board noted that the Consultant had previously performed a full review of this process and reported that such process is sound and well within common industry practice.
Based on these considerations, the Board concluded that the profits anticipated to be realized by the Advisers and their affiliates from their relationships with the Fund would not be excessive.
Comparison of Fees and Services Provided by the Advisers
The Board considered comparative information with respect to the management fees to be paid by the Fund to HFMC and the total expense ratios of the Fund. The Board also considered comparative information with respect to the sub-advisory fees to be paid by HFMC to the Sub-adviser. In this regard, the Board requested and reviewed information from HFMC and the Sub-adviser relating to the management and sub-advisory fees, including the sub-advisory fee schedule for the Fund, and total operating expenses for the Fund. The Board considered that the management fee for the Fund includes the fee paid to HLIC for providing certain administrative services to the Fund. With respect to the sub-advisory fee schedule, the Board considered representations from HFMC and the Sub-adviser that the Sub-adviser’s fees were negotiated at arm’s length. The Board also reviewed information from Lipper comparing the Fund’s contractual management fees, actual management fees and overall expense ratios relative to a group of funds selected by Lipper, in consultation with the Consultant, and a broader universe of funds selected by Lipper. The Board noted that the Fund’s contractual management fee and total expenses (less 12b-1 and shareholder service fees) were in the 2nd quintile of its expense group, while its actual management fee was in the 3rd quintile.
While the Board recognized that comparisons between the Fund and peer funds are imprecise, given the differing service levels and characteristics of mutual funds and the different business models and cost structures of the Advisers, the comparative information provided by Lipper assisted the Board in evaluating the reasonableness of the Fund’s management and sub-advisory fees and total operating expenses. In addition, the Board considered the analysis and recommendations of the Consultant relating to the Fund’s management and sub-advisory fees and total operating expenses.
Based on these considerations, the Board concluded that the Fund’s fees and total operating expenses, in conjunction with the information about quality of services, profitability, economies of scale, and other matters discussed, were reasonable in light of the services provided.
Economies of Scale
The Board requested and considered information regarding the Advisers’ realization of economies of scale with respect to the Fund and whether the fee levels reflect these economies of scale for the benefit of the Fund’s shareholders. The Board reviewed the breakpoints in the management fee schedule for the Fund, which reduce fee rates as Fund assets grow over time. The Board recognized that a fund with assets beyond the last breakpoint level will continue to benefit from economies of scale because additional assets are charged the lowest breakpoint fee resulting in lower overall effective management fee rates. The Board also recognized that a fee schedule that reaches a lower breakpoint quickly provides shareholders with the benefit of anticipated or potential economies of scale. The Board noted the effect of the sale and run-off of the variable annuity business on the HLS Funds.
The Board reviewed and evaluated materials from Lipper showing how management fee schedules of peer funds reflect economies of scale for the benefit of shareholders as a peer fund’s assets hypothetically increase over time. Based on information provided by HFMC, Lipper, and the Consultant, the Board recognized that there is no uniform methodology for establishing breakpoints or uniform pattern in asset levels that trigger breakpoints or the amounts of breakpoints triggered.
After considering all of the information available to it, the Board concluded that it was satisfied with the extent to which economies of scale would be shared for the benefit of the Fund’s shareholders based on currently available information and the
| 30 |
effective advisory fees and expense ratios for the Fund at its current and reasonably anticipated asset levels. The Board noted, however, that it would continue to monitor future growth in Fund assets and the appropriateness of additional breakpoints.
Other Benefits
The Board considered other benefits to the Advisers and their affiliates from their relationships with the Fund, including the role of the Fund in supporting the variable life insurance and variable annuity products offered by The Hartford.
The Board reviewed information noting that HLIC, an affiliate of HFMC, receives fees for providing certain administrative services to the Fund and that HFMC receives fees for fund accounting and related services from the Fund. The Board considered information on profits to HLIC and HFMC for such services. The Board also considered that Hartford Administrative Services Company (“HASCO”), the Fund’s transfer agent and an affiliate of HFMC, receives transfer agency compensation from the Fund, and the Board reviewed information on the profitability of the Fund’s transfer agency function to HASCO. The Board considered information provided by HASCO indicating that the transfer agent fees charged by HASCO to the Fund were fair and reasonable based on publicly available information.
The Board also considered that Hartford Funds Distributors, LLC (“HFD”), an affiliate of HFMC, serves as principal underwriter of the Fund. As principal underwriter, HFD receives 12b-1 fees from the Fund. The Board also noted that certain affiliates of HFD distribute shares of the Fund and receive compensation in that connection.
The Board considered benefits to the Sub-adviser from its use of the Fund’s brokerage commissions to obtain soft dollar research, and representations from HFMC and the Sub-adviser that the Sub-adviser would not make any revenue-sharing payments or any other type of distribution payments to HFMC or its affiliates.
The Board considered the benefits to shareholders of being part of the Hartford Funds family of funds. The Board considered HFMC’s efforts to provide investors in the family with a broad range of investment styles and asset classes.
* * * *
Based upon its review of these various factors, among others, the Board concluded that it is in the best interests of the Fund and its shareholders for the Board to approve the Agreements for an additional year. In reaching this decision, the Board did not assign relative weights to the factors discussed above or deem any one or group of them to be controlling in and of themselves. In connection with their deliberations, the Independent Directors met separately in executive session on several occasions, with independent legal counsel and the Consultant, to review the relevant materials and consider their responsibilities under relevant laws and regulations.
| 31 |
Main Risks (Unaudited)
The main risks of investing in the Fund are described below.
Market, Selection, and Strategy Risk: The Fund’s share price may fluctuate due to market risk and/or security selections that may underperform the market or relevant benchmarks. If the sub-adviser’s investment strategy does not perform as expected, the Fund could underperform its peers or lose money. There is no guarantee the Fund will achieve its stated objective.
Value Investing Risk: Value investments are considered to be undervalued, but they may never attain their potential value. Value-style investing falls in and out of favor, which may result in periods of underperformance.
Foreign Investment Risk: Foreign investments can be riskier than U.S. investments. Potential risks include currency risk that may result from unfavorable exchange rates, liquidity risk if decreased demand for a security makes it difficult to sell at the desired price, and risks that stem from substantially lower trading volume on foreign markets.
| 32 |
THIS PRIVACY POLICY IS NOT PART OF THIS REPORT
Privacy Policy and Practices of The Hartford Financial Services Group, Inc. and its Affiliates
(herein called “we, our, and us”)
This Privacy Policy applies to our United States Operations
We value your trust. We are committed to the responsible: a) management; b) use; and c) protection; of Personal Information. This notice describes how we collect, disclose, and protect Personal Information.
We collect Personal Information to: a) service your Transactions with us; and b) support our business functions.
We may obtain Personal Information from: a) You; b) your Transactions with us; and c) third parties such as a consumer-reporting agency.
Based on the type of product or service You apply for or get from us, Personal Information such as: a) your name; b) your address; c) your income; d) your payment; or e) your credit history; may be gathered from sources such as applications, Transactions, and consumer reports.
To serve You and service our business, we may share certain Personal Information. We will share Personal Information, only as allowed by law, with affiliates such as: a) our insurance companies; b) our employee agents; c) our brokerage firms; and d) our administrators.
As allowed by law, we may share Personal Financial Information with our affiliates to: a) market our products; or b) market our services; to You without providing You with an option to prevent these disclosures. | We may also share Personal Information, only as allowed by law, with unaffiliated third parties including:
When allowed by law, we may share certain Personal Financial Information with other unaffiliated third parties who assist us by performing services or functions such as:
We, and third parties we partner with, may track some of the pages You visit through the use of: a) cookies; b) pixel tagging; or c) other technologies; and currently do not process or comply with any web browser’s “do not track” signal or similar mechanism that indicates a request to disable online tracking of individual users who visit our websites or use our services.
We will not sell or share your Personal Financial Information with anyone for purposes unrelated to our business functions without offering You the opportunity to:
We only disclose Personal Health Information with:
Our employees have access to Personal Information in the course of doing their jobs, such as: |
We use manual and electronic security procedures to maintain: a) the confidentiality; and b) the integrity of; Personal Information that we have. We use these procedures to guard against unauthorized access.
Some techniques we use to protect Personal Information include: a) secured files; b) user authentication; c) encryption; d) firewall technology; and e) the use of detection software.
We are responsible for and must: a) identify information to be protected; b) provide an adequate level of protection for that data; c) grant access to protected data only to those people who must use it in the performance of their job-related duties. Employees who violate our Privacy Policy will be subject to discipline, which may include ending their employment with us.
At the start of our business relationship, we will give You a copy of our current Privacy Policy.
We will also give You a copy of our current Privacy Policy once a year if You maintain a continuing business relationship with us.
We will continue to follow our Privacy Policy regarding Personal Information even when a business relationship no longer exists between us. | As used in this Privacy Notice:
Application means your request for our product or service.
Personal Financial Information means financial information such as:
Personal Health Information means health information such as:
Personal Information means information that identifies You personally and is not otherwise available to the public. It includes:
Transaction means your business dealings with us, such as:
You means an individual who has given us Personal Information in conjunction with: |
This Privacy Policy is being provided on behalf of the following affiliates of The Hartford Financial Services Group, Inc.:
1stAGChoice, Inc.; Access CoverageCorp, Inc.; Access CoverageCorp Technologies, Inc.; American Maturity Life Insurance Company; Archway 60 R, LLC; Business Management Group, Inc.; Catalyst360, LLC; Champlain Life Reinsurance Company; DMS R, LLC; Eloy R, LLC; Ersatz Corporation; First State Insurance Company; Hartford Accident and Indemnity Company; Hartford Administrative Services Company; Hartford Casualty General Agency, Inc.; Hartford Casualty Insurance Company; Hartford-Comprehensive Employee Benefit Service Company; Hartford Equity Sales Company, Inc.; Hartford Fire General Agency, Inc.; Hartford Fire Insurance Company; Hartford Funds Management Company, LLC; Hartford Funds Management Group, Inc.; Hartford HLS Series Fund II, Inc.; Hartford Insurance Company of Illinois; Hartford Insurance Company of the Midwest; Hartford Insurance Company of the Southeast; Hartford Integrated Technologies, Inc.; Hartford International Life Reassurance Corporation; Hartford Funds Distributors, LLC; Hartford Investment Management Company; Hartford Life and Accident Insurance Company; Hartford Life and Annuity Insurance Company; Hartford Life Insurance Company; Hartford Life Private Placement, LLC; Hartford Lloyd’s Corporation; Hartford Lloyd’s Insurance Company; Hartford Mezzanine Investors I, LLC; Hartford Residual Market, L.C.C.; Hartford Retirement Services, LLC; Hartford Securities Distribution Company, Inc.; Hartford Series Fund, Inc.; Hartford Specialty Insurance Services of Texas, LLC; Hartford Strategic Investments, LLC; Hartford Underwriters Insurance Company; Hartford Technology Services Company, L.L.C.; Hartford of Texas General Agency, Inc.; Hartford Underwriters General Agency, Inc.; HARTRE Company, L.C.C.; HL Investment Advisors, LLC; HLA LLC; Horizon Management Group, LLC; HRA Brokerage Services, Inc.; Lanidex Class B, LLC; M-CAP Insurance Agency, LLC; New England Insurance Company; New England Reinsurance Corporation; Nutmeg Insurance Agency, Inc.; Nutmeg Insurance Company; Pacific Insurance Company, Limited; Planco, LLC: Property and Casualty Insurance Company of Hartford; Revere R, LLC; RVR R, LLC; Sentinel Insurance Company, Ltd.; Sunstone R, LLC; Symphony R, LLC; The Evergreen Group Incorporated; The Hartford Alternative Strategies Fund; The Hartford Mutual Funds, Inc.; The Hartford Mutual Funds II, Inc.; Trumbull Flood Management, L.L.C.; Trumbull Insurance Company; Twin City Fire Insurance Company; White River Life Reinsurance Company.
HPP Revised December 2013
HARTFORD HLS FUNDS
c/o The Hartford Wealth Management - Global Annuities
P.O. Box 14293
Lexington, KY 40512-4293
HARTFORDFUNDS
hartfordfunds.com
Hartford Series Fund, Inc. is underwritten and distributed by Hartford Funds Distributors, LLC.
Hartford Series Fund, Inc. inception dates range from 1977 to date. Hartford Series Fund, Inc. is not a subsidiary of The Hartford Financial Services Group, Inc. ("The Hartford") but is underwritten, distributed by and advised by subsidiaries of The Hartford. Investments in Hartford Series Fund, Inc. are not guaranteed by The Hartford or any other entity.
This report is submitted for the general information of the shareholders of the Funds. It is not authorized for distribution unless preceded or accompanied by a current prospectus for the Funds.
Investors should carefully consider the investment objectives, risks, charges, and expenses of Hartford Funds before investing. This and other information can be found in the prospectus and summary prospectus, which can be obtained by calling 888-843-7824 (retail) or 877-836-5854 (institutional). Investors should read them carefully before they invest.
HLSAR-V13 2-14 113557-2 Printed in U.S.A ©2013 The Hartford, Hartford, CT 06115
Item 2. Code of Ethics.
| (a) | The registrant, as of the end of the period covered by this report, has adopted a code of ethics that applies to the registrant’s principal executive officer, principal financial officer, principal accounting officer or controller, or persons performing similar functions, regardless of whether these individuals are employed by the registrant or a third party. A copy of the code of ethics is filed herewith. |
| (c) | There have been no amendments, during the period covered by this report, to a provision of the code of ethics that applies to the registrant’s principal executive officer, principal financial officer, principal accounting officer or controller, or persons performing similar functions, regardless of whether these individuals are employed by the registrant or a third party, and that relates to any element of the code of ethics description. |
| (d) | The registrant has not granted any waivers, including an implicit waiver, from a provision of the code of ethics that applies to the registrant’s principal executive officer, principal financial officer, principal accounting officer or controller, or persons performing similar functions, regardless of whether these individuals are employed by the registrant or a third party, that relates to one or more of the items set forth in paragraph (b) of this item’s instructions. |
Item 3. Audit Committee Financial Expert.
The Board of Directors of the Registrant has designated Phillip O. Peterson as an Audit Committee Financial Expert. Mr. Peterson is considered by the Board to be an independent director.
Item 4. Principal Accountant Fees and Services.
| (a) | Audit Fees: The aggregate fees billed for each of the last two fiscal years for professional services rendered by the principal accountant for the audit of the registrant’s annual financial statements or services that are normally provided by the accountant in connection with statutory and regulatory filings or engagements for those fiscal years were: |
$430,041 for the fiscal year ended December 31, 2012; $439,560 for the fiscal year ended December 31, 2013.
| (b) | Audit Related Fees: The aggregate fees billed in each of the last two fiscal years for assurance and related services by the principal accountant that are reasonably related to the performance of the audit of the registrant’s financial statements and are not reported under paragraph (a) of this Item were: |
$13,567 for the fiscal year ended December 31, 2012; $13,567 for the fiscal year ended December 31, 2013. Audit-related services principally in connection with Rule 17Ad-13 under the Securities and Exchange Act of 1934.
| (c) | Tax Fees: The aggregate fees billed in each of the last two fiscal years for professional services rendered by the principal accountant for tax compliance, tax advice, and tax planning were: |
$85,500 for the fiscal year ended December 31, 2012; $134,165 for the fiscal year ended December 31, 2013. Tax-related services are principally in connection with, but not limited to, general tax services and Passive Foreign Investment Company (PFIC) analysis.
| (d) | All Other Fees: The aggregate fees billed in each of the last two fiscal years for products and services provided by the principal accountant, other than the services reported in paragraphs (a) through (c) of this Item were: |
$0 for the fiscal year ended December 31, 2012; $0 for the fiscal year ended December 31, 2013.
| (e) | (1) The Pre-Approval Policies and Procedures (the “Policy”) adopted by the Audit Committee of the Registrant (also, the “Fund”) sets forth the procedures pursuant to which services performed by the Independent Auditor for the Registrant may be pre-approved. The following are some main provisions from the Policy. |
| 1. | The Audit Committee must pre-approve all audit services and non-audit services that the Independent Auditor provides to the Fund. |
| 2. | The Audit Committee must pre-approve any engagement of the Independent Auditor to provide non-audit services to any Service Affiliate (which is defined to include any entity controlling, controlled by, or under common control with the investment adviser that provides ongoing services to the Fund) during the period of the Independent Auditor’s engagement to provide audit services to the Fund, if the non-audit services to the Service Affiliate directly impact the Fund’s operations and financial reporting. |
| 3. | The Audit Committee shall pre-approve certain non-audit services to the Fund and its Service Affiliates pursuant to procedures set forth in the Policy. |
| 4. | The Audit Committee, from time to time, may designate one or more of its members who are Independent Directors (each a “Designated Member”) to consider, on the Audit Committee’s behalf, any non-audit services, whether to the Fund or to any Service Affiliate, that have not been pre-approved by the Audit Committee. In considering any requested non-audit services or proposed material change in such services, the Designated Member shall not authorize services which would exceed $50,000 in fees for such services. Any action by the Designated Member in approving a requested non-audit service shall be reported to the Audit Committee not later than at its next scheduled meeting. |
| 5. | The Independent Auditor may not provide specified prohibited non-audit services set forth in the Policy to the Fund, the Fund’s investment adviser, the Service Affiliates or any other member of the investment company complex. |
| (e) | (2) One hundred percent of the services described in items 4(b) through 4(d) were approved in accordance with the Audit Committee's Pre-Approval Policy. As a result, none of such services was approved pursuant to paragraph (c) (7) (i) (c) of Rule 2-01 of Regulation S-X. |
| (f) | None of the hours expended on the principal accountant's engagement to audit the registrant's financial statements for the year ended December 31, 2013, were attributed to work performed by persons other than the principal accountant's full-time, permanent employees. |
| (g) | The aggregate non-audit fees billed by the registrant’s accountant for services rendered to the registrant, and rendered to the registrant’s investment adviser (not including any sub-adviser whose role is primarily portfolio management and is subcontracted with or overseen by another investment adviser), and any entity controlling, controlled by, or under common control with the adviser that provides ongoing services to the registrant for each of the last two fiscal years of the registrant were: |
Non-Audit Fees: $2,267,351 for the fiscal year ended December 31, 2012; $2,701,266 for the fiscal year ended December 31, 2013.
| (h) | The registrant’s audit committee of the board of directors has considered whether the provision of non-audit services that were rendered to the registrant’s investment adviser (not including any sub-adviser whose role is primarily portfolio management and is subcontracted with or overseen by another investment adviser), and any entity controlling, controlled by, or under common control with the investment adviser that provides ongoing services to the registrant that were not pre-approved pursuant to paragraph (c)(7)(ii) of Rule 2-01 of Regulation S-X is compatible with maintaining the principal accountant’s independence. |
Item 5. Audit Committee of Listed Registrants.
Not applicable.
Item 6. Investments
| (a) | The Schedule of Investments in securities of unaffiliated issuers as of the close of the reporting period is included as part of the annual report filed under Item 1 of this form. |
| (b) | Not applicable. |
Item 7. Disclosure of Proxy Voting Policies and Procedures for Closed-End Management Investment Companies.
Not applicable.
Item 8. Portfolio Managers of Closed-End Management Investment Companies.
Not applicable.
Item 9. Purchases of Equity Securities by Closed-End Management Investment Company and Affiliated Purchasers.
Not applicable.
Item 10. Submission of Matters to a Vote of Security Holders
There have been no material changes to the procedures by which shareholders may recommend nominees to the registrant’s board of directors since registrant last provided disclosure in response to this requirement.
Item 11. Controls and Procedures.
| (a) | The registrant’s principal executive and principal financial officers, or persons performing similar functions, have concluded that the registrant’s disclosure controls and procedures (as defined in Rule 30a-3(c) under the Investment Company Act of 1940, as amended (the “1940 Act”) (17 CFR 270.30a-3(c))) are generally effective to provide reasonable assurance, as of a date within 90 days of the filing date of the report that includes the disclosure required by this paragraph, based on their evaluation of these controls and procedures required by Rule 30a-3(b) under the 1940 Act (17 CFR 270.30a-3(b)) and Rules 13a-15(b) or 15d-15(b) under the Securities Exchange Act of 1934, as amended (17 CFR 240.13a-15(b) or 240.15d-15(b)). |
| (b) | There were no changes in the registrant’s internal control over financial reporting (as defined in Rule 30a-3(d) under the 1940 Act (17 CFR 270.30a-3(d)) that occurred during the registrant’s second fiscal quarter of the period covered by this report that have materially affected, or is reasonably likely to materially affect, the registrant’s internal control over financial reporting. |
Item 12. Exhibits.
(a)(1) Code of Ethics
(a)(2) Certifications pursuant to Rule 30a-2(a) under the 1940 Act and Section 302 of the Sarbanes-Oxley Act of 2002 are attached hereto.
(a)(3) Not applicable
(b) Certifications pursuant to Rule 30a-2(b) under the 1940 Act and Section 906 of the Sarbanes-Oxley Act of 2002 are attached hereto.
SIGNATURES
Pursuant to the requirements of the Securities Exchange Act of 1934 and the Investment Company Act of 1940, the registrant has duly caused this report to be signed on its behalf by the undersigned, thereunto duly authorized.
| HARTFORD SERIES FUND, INC. | ||
| Date: February 12, 2014 | By: | /s/ James E. Davey |
| James E. Davey, President and | ||
| Chief Executive Officer | ||
Pursuant to the requirements of the Securities Exchange Act of 1934 and the Investment Company Act of 1940, this report has been signed below by the following persons on behalf of the registrant and in the capacities and on the dates indicated.
| Date: February 12, 2014 | By: | /s/ James E. Davey |
| James E. Davey, President and | ||
| Chief Executive Officer | ||
| Date: February 12, 2014 | By: | /s/ Mark A. Annoni |
| Mark A. Annoni, Vice President, | ||
| Treasurer and Controller | ||