UNITED STATES
SECURITIES AND EXCHANGE COMMISSION
Washington, D.C. 20549
FORM N-CSR
CERTIFIED SHAREHOLDER REPORT OF REGISTERED MANAGEMENT
INVESTMENT COMPANIES
Investment Company Act file number: 811-08629
HARTFORD SERIES FUND, INC.
(Exact name of registrant as specified in charter)
5 Radnor Corporate Center, Suite 300, 100 Matsonford Road, Radnor, Pennsylvania 19087
(Address of Principal Executive Offices) (Zip Code)
Alice A. Pellegrino
Hartford Funds Management Company, LLC
5 Radnor Corporate Center, Suite 300
100 Matsonford Road
Radnor, Pennsylvania 19087
(Name and Address of Agent for Service)
Registrant’s telephone number, including area code: (610) 386-1844
Date of fiscal year end: December 31
Date of reporting period: December 31, 2016
Form N-CSR is to be used by management investment companies to file reports with the Commission not later than 10 days after the transmission to stockholders of any report that is required to be transmitted to stockholders under Rule 30e-1 under the Investment Company Act of 1940 (17 CFR 270.30e-1). The Commission may use the information provided on Form N-CSR in its regulatory, disclosure review, inspection, and policymaking roles.
A registrant is required to disclose the information specified by Form N-CSR, and the Commission will make this information public. A registrant is not required to respond to the collection of information contained in Form N-CSR unless the Form displays a currently valid Office of Management and Budget (“OMB”) control number. Please direct comments concerning the accuracy of the information collection burden estimate and any suggestions for reducing the burden to Secretary, Securities and Exchange Commission, 100 F. Street, NE, Washington, DC 20549. The OMB has reviewed this collection of information under the clearance requirements of 44 U.S.C. § 3507.
Item 1. Reports to Stockholders.
A MESSAGE FROM THE PRESIDENT
Dear Fellow Shareholders:
Thank you for investing in Hartford HLS Funds.
Market Review
During the year ended December 31, 2016, the period of this report, stocks, as measured by the S&P 500 Index,1 endured a correction then recovered and,
despite periodic gyrations, managed to remain generally in positive territory for the remainder of the period. Even with the bouts of uncertainty the market experienced, the current bull market continued into its seventh year, making it the second-longest bull market on record for the S&P 500 Index. From January 1, 2016 through December 31, 2016, the S&P 500 Index generated an 11.96% total return.
The market reacted to a handful of concerns during the course of the year, including worries about low oil prices, weakness in the Chinese economy, a surprise vote for the U.K. to leave the European Union (dubbed Brexit), the beginning of a rate increase cycle by the U.S. Federal Reserve (Fed), and a contentious U.S. presidential election cycle with an unexpected outcome.
There were also more positive influences, including generally positive jobs reports over the course of the period, which helped the unemployment rate fall to pre-recession levels. In addition, growth of the domestic economy, while slow, has remained steady. This has helped limit the Fed’s actions; it has kept rate increases very gradual, which helps markets better digest and account for such changes.
Going forward, President Trump’s potential policy changes are likely to play a key role in market movements for the new year and beyond. While it is difficult to assess the full potential impact of changing political policies, markets seem to consider his positions pro-growth, which could bode well for investors. However, change to the status quo can often result in volatility in the markets.
As we enter 2017, we encourage you to maintain a strong relationship with a financial advisor who can help guide you through shifting markets with confidence. If there’s one certain thing about markets, it’s that movements can be hard to anticipate, especially in the short term. So it’s important to proactively build a portfolio that takes that unknown into account along with your unique investment goals and risk tolerances. Your financial advisor can help you find a fit within our family of mutual funds as you work toward those goals.
Thank you again for investing with Hartford HLS Funds.

James Davey
President
Hartford HLS Funds
| 1 | S&P 500 Index is a market capitalization-weighted price index composed of 500 widely held common stocks. |
Hartford HLS Funds
Table of Contents
The views expressed in each Fund’s Manager Discussion under “Why did the Fund perform this way?” and “What is the outlook?” are views of that Fund’s sub-adviser and portfolio management team through the end of the period and are subject to change based on market and other conditions. Each Fund’s Manager Discussion is for informational purposes only and does not represent an offer, recommendation or solicitation to buy, hold or sell any security. The specific securities identified and described, if any, do not represent all of the securities purchased or sold and you should not assume that investments in the securities identified and discussed will be profitable.
Hartford Balanced HLS Fund inception 03/31/1983
| | |
| (sub-advised by Wellington Management Company LLP) | | Investment objective – The Fund seeks long-term total return. |
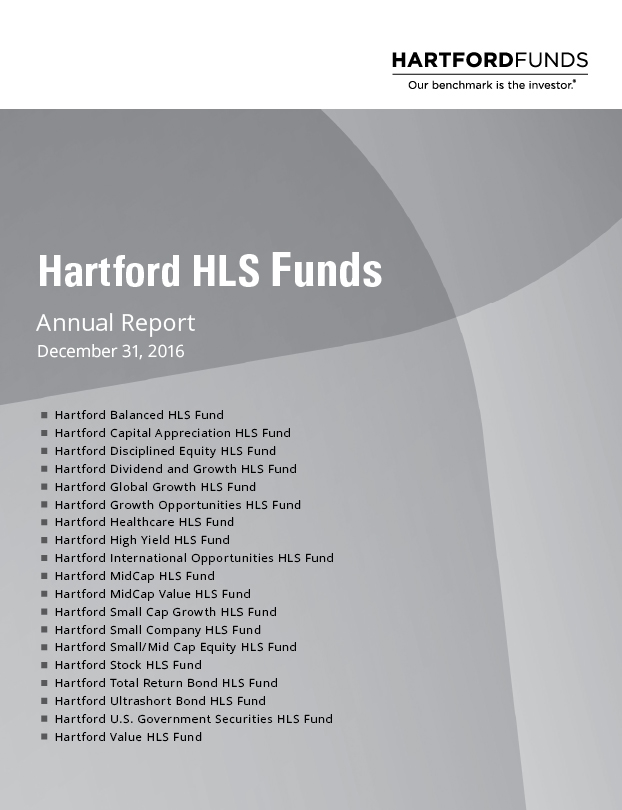
The chart above represents the hypothetical growth of a $10,000 investment in Class IA. Growth results in classes other than Class IA will vary from what is seen above due to differences in the expenses charged to those share classes.
Average Annual Total Return (as of 12/31/16)
| | | | | | | | | | | | |
| | | 1 Year | | | 5 Years | | | 10 Years | |
Balanced IA | | | 6.04% | | | | 9.63% | | | | 5.56% | |
Balanced IB | | | 5.79% | | | | 9.35% | | | | 5.30% | |
S&P 500 Index | | | 11.96% | | | | 14.66% | | | | 6.95% | |
Bloomberg Barclays Government/Credit Bond Index | | | 3.05% | | | | 2.29% | | | | 4.40% | |
Bank of America Merrill Lynch 3-Month U.S. Treasury Bill Index | | | 0.33% | | | | 0.12% | | | | 0.80% | |
Balanced HLS Fund Blended Index | | | 8.33% | | | | 9.60% | | | | 6.05% | |
PERFORMANCE DATA QUOTED REPRESENTS PAST PERFORMANCE AND DOES NOT GUARANTEE FUTURE RESULTS. The investment return and principal value of the investment will fluctuate so that investors’ shares, when redeemed, may be worth more or less than their original cost. Current performance may be lower or higher than the performance data quoted. To obtain performance data current to the most recent month-end, please visit our website www.hartfordfunds.com.
Total returns presented above were calculated using the Fund’s net asset value available to shareholders for sale or redemption of Fund shares on December 31, 2016, which may exclude investment transactions as of this date. All share class returns assume the reinvestment of all distributions at net asset value and the deduction of all fund expenses.
S&P 500 Index is a market capitalization-weighted price index composed of 500 widely held common stocks.
Bloomberg Barclays Government/Credit Bond Index is an unmanaged, market-value-weighted index of all debt obligations of the U.S. Treasury and U.S. Government agencies (excluding mortgaged-backed securities) and of all publicly-issued fixed-rate, nonconvertible, investment grade domestic corporate debt.
Bank of America Merrill Lynch 3-Month U.S. Treasury Bill Index is an unmanaged index that tracks the performance of U.S. dollar denominated U.S. Treasury bills publicly issued in the U.S. domestic markets with maturities of 90 days or less that assumes reinvestment of all income.
Balanced HLS Fund Blended Index is calculated by Hartford Funds Management Company, LLC (“HFMC”) and represents the weighted return of 60% S&P 500 Index, 35% Bloomberg Barclays Government/Credit Bond Index and 5% Bank of America Merrill Lynch 3-Month U.S. Treasury Bill Index.
On August 24, 2016, Bloomberg L.P. acquired Barclays Risk Analytics and Index Solutions Ltd. from Barclays PLC. As a result of this acquisition, the Barclays indices have been rebranded as Bloomberg Barclays indices.
The indices are unmanaged, and their results include reinvested dividends and/or distributions, but do not reflect the effect of sales charges, commissions, expenses or
taxes.
You cannot invest directly in an index.
As shown in the Fund’s current prospectus dated May 1, 2016, the total annual fund operating expense ratios for Class IA and Class IB were 0.65% and 0.90%, respectively. Actual expenses may be higher. Please see the accompanying Financial Highlights for expense ratios for the year ended December 31, 2016.
All investments are subject to risk including the possible loss of principal. For a discussion of the Fund’s risks, please see “A Word about Risk” section in the “Manager Discussion” section of this report. For more detailed information on the risks associated with an investment in the Fund, please see the prospectus.
The chart and table do not reflect the deductions of taxes, sales charges or other fees which may be applied at the variable life insurance, variable annuity or qualified retirement plan product level. Any such additional sales charges or other fees or expenses would lower the contract’s or plan’s performance.
|
| Hartford Balanced HLS Fund |
Manager Discussion
December 31, 2016 (Unaudited)
Portfolio Managers
Karen H. Grimes, CFA
Senior Managing Director and Equity Portfolio Manager
Wellington Management Company LLP
Michael E. Stack, CFA
Senior Managing Director and Fixed Income Portfolio Manager
Wellington Management Company LLP
How did the Fund perform during the period?
The Class IA shares of Hartford Balanced HLS Fund returned 6.04% for the twelve-month period ended December 31, 2016, underperforming the Fund’s blended benchmark, 60% S&P 500 Index, 35% Bloomberg Barclays Government/Credit Index, and 5% Bank of America Merrill Lynch 3-Month U.S. Treasury Bill Index, which returned 8.33% for the same period. The S&P 500, Bloomberg Barclays Government/Credit Bond, and Bank of America Merrill Lynch 3-Month U.S. Treasury Bill Indices returned 11.96%, 3.05% and 0.33%, respectively. The Fund also underperformed the 7.17% average return of the Lipper Mixed-Asset Target Allocation Growth Funds peer group, a group of funds that hold between 60%-80% in equity securities, with the remainder invested in bonds, cash, and cash equivalents.
Why did the Fund perform this way?
U.S. equities rose over the period, as measured by the S&P 500 Index, notwithstanding significant volatility during the year. Early in the first quarter of 2016, equities plunged and moved in virtual lockstep with the price of oil as fears of a recession and weakness in China weighed on investors’ minds. However, equity markets surged in late February and March as solid economic data, a stabilization in oil prices, and accommodative commentary from the Federal Reserve (Fed) helped to calm the market’s early year jitters. A better-than-feared U.S. corporate earnings season in the second quarter and an encouraging economic backdrop helped sustain the rally. At its June meeting, the Fed left rates unchanged and reduced its U.S. growth and long-run policy rate forecasts, citing mixed U.S. economic data and uncertainty about global economic and financial developments. After plunging in the two trading days following the approval of the U.K.’s exit from the E.U. (Brexit), U.S. equities staged an impressive comeback in the days following.
U.S. equities continued to climb in July, following a solid start to the corporate earnings season and encouraging housing and employment data releases. Stocks were essentially flat in August and September as investors remained focused on the Fed’s actions, specifically on the timing of the next rate increase. A confluence of worries contributed to increased volatility during September, including
uncertainty surrounding the U.S. presidential election, tepid economic data, and valuation concerns. Stocks surged following Donald Trump’s victory in the U.S. Presidential election on hopes of increased fiscal stimulus, reduced regulatory restrictions, and lower corporate taxes. Economic data released during the fourth quarter was generally encouraging, as third quarter gross domestic product (GDP) growth was revised slightly higher and the U.S. housing market continued to display healthy trends. In December, the Fed raised rates by 0.25%, a move that was anticipated by most of the market. It was only the second increase in the last decade. During the twelve-month period, nine of the eleven sectors1 within the S&P 500 Index posted positive returns, led by Energy (+27%), Telecommunication Services (+23%), and Financials (+23%), while Real Estate (-6%) and Healthcare (-3%) fell.
Over the period, global fixed income markets were influenced by global economic growth concerns, central bank monetary policy expectations, and oil prices. Early in 2016, falling oil prices, concerns over slowing growth in China, and questions about the efficacy of central bank monetary policies sparked a broad sell-off in credit markets, while government bond prices benefited from their safe-haven status. Markets reversed course in mid-February as the major central banks adopted more cautious monetary policies in an effort to ease market risk. A rebound in crude oil prices, accommodative global central bank monetary policy and signs of near-term stabilization in China further supported global financial markets through the second quarter. The U.K.’s momentous vote in June to leave the E.U. led to a spike in global financial market volatility and a flight to safety, with U.K. and European equity and credit markets bearing the brunt of the sell-off. Policy paths of major central banks appeared to diverge in the third quarter as the Bank of England unveiled a stimulus package designed to prevent a recession following the Brexit vote while the European Central Bank (ECB) kept its stimulus program unchanged and avoided making a firm commitment to further expand its bond-buying program. In the U.S., Fed rhetoric turned more focused on interest rate increases, setting up for a December rate increase. Global government bond yields moved sharply higher in the fourth quarter, particularly following the U.S. presidential election results as President-elect Trump’s
| 1 | Effective September 1, 2016, a new Real Estate sector was created under the Global Industry Classification Standard (GICS); holdings in this sector were previously classified as Financials. The attribution analysis of the Financials sector includes Real Estate for the period starting January 1, 2016 through August 31, 2016. The attribution analysis of the Real Estate sector is only for the period starting September 1, 2016 through December 31, 2016. |
|
| Hartford Balanced HLS Fund |
Manager Discussion – (continued)
December 31, 2016 (Unaudited)
proposed expansionary fiscal policy lifted inflation expectations. In December, the Fed increased rates for only the second time in ten years. While markets had largely anticipated the decision, the Fed’s post-meeting statement and press conference leaned more toward an aggressive interest rate policy than expected.
Developed markets’ government bond prices largely gained outside the U.S. over the period, as global uncertainties kept central banks in easing mode for most of the year. In the U.S., the yield curve flattened; front-end yields, which were heavily influenced by Fed monetary policy expectations, rose more than intermediate- and long-term yields. The U.S. dollar ended higher against a broad basket of currencies over the period, particularly following the U.S. presidential election results and Fed rate increase decision. Emerging market currencies also weakened significantly against the dollar following Trump’s election victory over concerns about potential U.S. trade protectionism. Meanwhile, the U.K. pound depreciated in the aftermath of Brexit.
Absolute returns in the major fixed income credit risk sectors were positive during the twelve-month period, aided by the decline in government bond yields outside the U.S. In the U.S., interest income helped offset the impact of higher Treasury yields. On an excess return basis, most credit risk sectors posted positive returns over the period, including high yield, emerging markets debt, and investment grade corporates, as credit spreads tightened during the year. However, this masked considerable volatility in credit risk sector returns, including a drawdown in many credit risk sectors in the first part of 2016 and immediately following the Brexit referendum.
During the period, the equity portion of the Fund underperformed the S&P 500 Index while the fixed income portion of the Fund outperformed the Bloomberg Barclays U.S. Government/Credit Index. Asset allocation decisions slightly contributed positively to benchmark-relative performance during the period. The Fund was generally overweight equities and fixed income and underweight cash relative to the blended benchmark.
Equity underperformance versus the S&P 500 Index was driven primarily by security selection. In particular, weak security selection in Healthcare, Financials, and Consumer Staples detracted from relative performance, which was partially offset by stronger selection in Energy and Materials. Sector allocation, which is a residual of the Fund’s bottom-up security selection process, also detracted during the period primarily due to the Fund’s overweight to Healthcare and underweight to Telecommunication Services, which was slightly offset by positive performance from an underweight to Real Estate.
Stocks that detracted the most from relative returns in the equity portion of the Fund during the period were Vertex (Healthcare), Norwegian Cruise Line (Consumer Discretionary), and UCB SA (Healthcare). Vertex, a U.S.-based pharmaceutical company, saw its shares drop after the company received notice from the FDA that it
could not approve the company’s label expansion claim for Kalydeco, a cystic fibrosis drug, based on the current application. The company also reported a higher-than-expected discontinuation rate for Orkambi, another cystic fibrosis drug. Shares of Norwegian Cruise Lines, a U.S.-based international cruise operator, fell due to uncertainty regarding how Brexit will affect the travel and leisure industry, in addition to reporting weaker than expected quarterly earnings report that cited terror attacks in Paris, Brussels, and Istanbul as a drag on European cruise revenue. UCB SA, a Belgium-based biopharmaceutical company specializing in central nervous system and immunology therapies sold off during the year, particularly during the first half of 2016, partly due to a modest disappointment in their Romosozumab osteoporosis clinical trial. Allergan (Healthcare) detracted the most on an absolute basis.
Top contributors to relative performance in the equity portion of the Fund during the period were Halliburton (Energy), UnitedHealth Group (Healthcare), and Ingersoll-Rand (Industrials). Halliburton is a U.S. energy services provider. The stock price of the company rose over the year, benefiting from the recovery in oil prices. Furthermore, the market welcomed the abandonment of the merger with Baker Hughes, which was blocked by regulators over concerns for the competitive environment. Shares of UnitedHealth Group, a U.S.-based health care benefits and services provider, rose during the period as the company continued to execute well and exceed consensus revenue and earnings expectations. Ingersoll-Rand, an Irish-based provider of industrial machinery, climate control systems, and security products, saw its shares rise over the year after announcing strong quarterly earnings and revenues and raising its dividend payout by 25% in the fourth quarter. The Fund’s holdings in JPMorgan Chase (Financials) and Microsoft (Information Technology) also contributed positively on an absolute basis.
Outperformance of the fixed income portion of the Fund relative to the Bloomberg Barclays Government/Credit Bond Index during the period was driven by security selection in investment grade (IG) corporate credit, particularly within Industrials, and an overweight allocation to taxable municipals. An out-of-benchmark allocation to asset-backed securities (ABS) and commercial mortgage-backed securities (CMBS) also modestly contributed positively to relative returns during the period. The Fund’s allocation to high yield detracted from relative returns during this period. The Fund’s duration and yield curve positioning also detracted from results relative to the Bloomberg Barclays Government/Credit Bond Index. Though rates rose in the fourth quarter, rates had been falling for most of the year. During this time, the fixed income portion of the Fund was shorter duration than its benchmark.
Derivatives were not used in a significant manner in the Fund during the period and did not have a material impact on performance during the period.
|
| Hartford Balanced HLS Fund |
Manager Discussion – (continued)
December 31, 2016 (Unaudited)
What is the outlook?
We expect the U.S. economy to maintain steady growth in 2017, supported by continued growth in consumer spending and an increase in investment levels, but the range of outcomes is wider than normal given policy uncertainty with respect to the new, incoming administration. Additionally, elevated fiscal/trade policy uncertainty in the U.S. and the rise of nationalist, populist movements in Western democracies pose longer-term risks. Inventories, which have been a headwind to growth over the last 5 quarters, appear to be in better balance heading into 2017, and should no longer be a meaningful drag on the economy. We believe decreased regulation, lower tax rates, and the potential for increased infrastructure spending should also support the economy in the coming year. On the negative side, the strong U.S. dollar and uncertainty surrounding foreign policy and global trade may weigh on growth. We expect the Fed to continue its gradual tightening trajectory, but with an awareness to both the potential inflationary impact of fiscal stimulus when the U.S. is at full employment and the risks to global growth from protectionist policies.
Financials and Consumer Discretionary represented the Fund’s largest sector overweight and underweight, respectively, in the equity portion of the Fund at the end of the period. On the fixed income side the Fund ended the period with a moderately pro-cyclical risk posture, continuing to favor financial issuers within IG credit. The Fund continued to hold out-of-benchmark allocations to high yield, agency mortgage-backed securities (MBS), commercial mortgage-backed securities (CMBS), and asset-backed securities (ABS).
At the end of the period, the Fund’s equity exposure was at 63% compared to 60% in its benchmark.
A Word about Risk
All investments are subject to risk, including the possible loss of principal. There is no guarantee the Fund will achieve its stated objective. The Fund’s share price may fluctuate due to market risk and/or security selections that may underperform the market or relevant benchmarks. If the Fund’s strategy for allocating assets among different asset classes and/or portfolio management teams does not work as intended, the Fund may not achieve its objective or may underperform other funds with similar investment strategies. Foreign investments can be riskier than U.S. investments due to the adverse effects of currency exchange rates, differences in market structure and liquidity, as well as political and economic developments in foreign countries and regions. Fixed income risks include credit, liquidity, call, duration, and interest-rate risk. As interest rates rise, bond prices generally fall; these risks are currently heightened due to the historically low interest rate environment. Mortgage- and asset-backed securities’ risks include credit, interest-rate, prepayment, and extension risk. Obligations of U.S. Government agencies are supported by varying degrees of credit but are generally not backed by the full faith and credit of the U.S. Government.
Composition by Security Type
as of December 31, 2016
| | | | |
| Category | | Percentage of
Net Assets | |
Equity Securities | | | | |
Common Stocks | | | 62.8 | % |
| | | | |
Total | | | 62.8 | % |
| | | | |
Fixed Income Securities | | | | |
Asset & Commercial Mortgage Backed Securities | | | 3.0 | % |
Corporate Bonds | | | 19.6 | |
Foreign Government Obligations | | | 0.3 | |
Municipal Bonds | | | 1.3 | |
U.S. Government Agencies | | | 0.5 | |
U.S. Government Securities | | | 11.4 | |
| | | | |
Total | | | 36.1 | % |
| | | | |
Short-Term Investments | | | 0.9 | |
Other Assets & Liabilities | | | 0.2 | |
| | | | |
Total | | | 100.0 | % |
| | | | |
Hartford Capital Appreciation HLS Fund inception 04/02/1984
| | |
| (sub-advised by Wellington Management Company LLP) | | Investment objective – The Fund seeks growth of capital. |
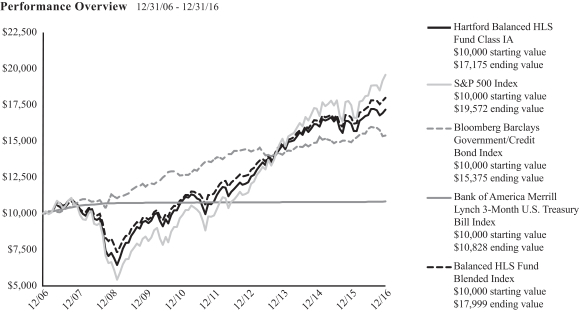
The chart above represents the hypothetical growth of a $10,000 investment in Class IA. Growth results in classes other than Class IA will vary from what is seen above due to differences in the expenses charged to those share classes.
Average Annual Total Return (as of 12/31/16)
| | | | | | | | | | | | |
| | | 1 Year | | | 5 Years | | | 10 Years | |
Capital Appreciation IA | | | 5.52% | | | | 13.49% | | | | 6.05% | |
Capital Appreciation IB | | | 5.24% | | | | 13.20% | | | | 5.78% | |
Capital Appreciation IC | | | 4.99% | | | | 12.93% | | | | 5.52% | |
Russell 3000 Index | | | 12.74% | | | | 14.67% | | | | 7.07% | |
S&P 500 Index | | | 11.96% | | | | 14.66% | | | | 6.95% | |
PERFORMANCE DATA QUOTED REPRESENTS PAST PERFORMANCE AND DOES NOT GUARANTEE FUTURE RESULTS. The investment return and principal value of the investment will fluctuate so that investors’ shares, when redeemed, may be worth more or less than their original cost. Current performance may be lower or higher than the performance data quoted. To obtain performance data current to the most recent month-end, please visit our website www.hartfordfunds.com.
Total returns presented above were calculated using the Fund’s net asset value available to shareholders for sale or redemption of Fund shares on December 31, 2016, which may exclude investment transactions as of this date. All share class returns assume the reinvestment of all distributions at net asset value and the deduction of all fund expenses.
Class IC shares commenced operations on April 30, 2014. Class IC shares performance prior to that date reflects Class IA shares performance adjusted to reflect the 12b-1 fee of 0.25% and the administrative services fee of 0.25% applicable to Class IC shares. The performance after such date reflects actual Class IC shares performance.
Russell 3000 Index is an unmanaged index that measures the performance of the 3,000 largest U.S. companies based on total market capitalization.
S&P 500 Index is a market capitalization-weighted price index composed of 500 widely held common stocks.
The indices are unmanaged, and their results include reinvested dividends and/or distributions, but do not reflect the effect of sales charges, commissions, expenses or taxes.
You cannot invest directly in an index.
As shown in the Fund’s current prospectus dated May 1, 2016, the total annual fund operating expense ratios for Class IA, Class IB and Class IC were 0.67%, 0.92% and 1.17%, respectively. Actual expenses may be higher. Please see the accompanying Financial Highlights for expense ratios for the year ended December 31, 2016.
All investments are subject to risk including the possible loss of principal. For a discussion of the Fund’s risks, please see “A Word about Risk” section in the “Manager Discussion” section of this report. For more detailed information on the risks associated with an investment in the Fund, please see the prospectus.
The chart and table do not reflect the deductions of taxes, sales charges or other fees which may be applied at the variable life insurance, variable annuity or qualified retirement plan product level. Any such additional sales charges or other fees or expenses would lower the contract’s or plan’s performance.
|
| Hartford Capital Appreciation HLS Fund |
Manager Discussion
December 31, 2016 (Unaudited)
Portfolio Managers
Saul J. Pannell, CFA
Senior Managing Director and Equity Portfolio Manager
Wellington Management Company LLP
Gregg R. Thomas, CFA
Senior Managing Director and Associate Director of Investment Strategy & Risk
Wellington Management Company LLP
Kent M. Stahl, CFA
Senior Managing Director and Director of Investment Strategy & Risk
Wellington Management Company LLP
How did the Fund perform during the period?
The Class IA shares of Hartford Capital Appreciation HLS Fund returned 5.52% for the twelve-month period ended December 31, 2016, underperforming the Fund’s benchmark, the Russell 3000 Index, which returned 12.74% for the same period, and the Fund’s other benchmark, the S&P 500 Index, which returned 11.96% for the same period. The Fund also underperformed the 10.98% average return of the Lipper Multi-Cap Core Funds peer group, a group of funds with investment strategies similar to those of the Fund.
Why did the Fund perform this way?
U.S. equities rose over the period, as measured by the S&P 500 Index, notwithstanding volatility during the year. Early in the first quarter of 2016, equities plunged and moved in virtual lockstep with the price of oil as fears of a recession and weakness in China weighed on investors’ minds. However, equity markets surged in late February and March as solid economic data, a stabilization in oil prices, and accommodative commentary from the Federal Reserve (Fed) helped to calm the market’s early year jitters. A better-than-feared U.S. corporate earnings season in the second quarter and an encouraging economic backdrop helped sustain the rally. At its June meeting, the Fed left rates unchanged and reduced its U.S. growth and long-run policy rate forecasts, citing mixed U.S. economic data and uncertainty about global economic and financial developments. After plunging in the two trading days following the approval of the U.K.’s exit from the E.U. (Brexit), U.S. equities staged an impressive comeback in the days following.
U.S. equities continued to climb in July, following a solid start to the corporate earnings season and encouraging housing and employment data releases. Stocks were essentially flat in August and September as investors remained focused on the Fed’s actions, specifically on the timing of the next rate increase. A confluence of worries contributed to increased volatility during September, including uncertainty surrounding the U.S. presidential election, tepid economic
data, and valuation concerns. Stocks surged following Donald Trump’s victory in the U.S. Presidential election on hopes of increased fiscal stimulus, reduced regulatory restrictions, and lower corporate taxes. Economic data released during the fourth quarter was generally encouraging, as third quarter gross domestic product (GDP) growth was revised slightly higher and the U.S. housing market continued to display healthy trends. In December, the Fed raised rates by 0.25%, a move that was anticipated by most of the market. It was only the second increase in the last decade.
Equity returns varied by market-cap during the period, as small- and mid-cap equities, as measured by the Russell 2000 and S&P MidCap 400 Indices, outperformed large-cap equities, as measured by the S&P 500 Index. Nine of the eleven sectors1 in the Russell 3000 Index had positive returns during the period. Energy (+27%), Financials (+25%), and Telecommunication Services (+24%) performed best, while Real Estate (-4%) and Healthcare (-3%) lagged the broader index.
Security selection was the primary detractor from performance relative to the Russell 3000 Index during the period. Selection was weakest within the Information Technology, Healthcare, and Consumer Discretionary sectors. Sector allocation, a result of our bottom-up security selection process, also detracted from performance relative to the Russell 3000 Index during the period. An overweight to the Healthcare sector and an underweight to Energy detracted most from benchmark-relative returns. This was only partially offset by an underweight to Financials in the early part of the year and an underweight to Real Estate, which contributed positively to relative performance. From a factor perspective, low volatility and yield outperformed in the first half of the year, which was a headwind for the Fund. The trend in low volatility reversed in the second half of the year and risk-seeking factors outperformed following the election. An overweight to beta (stocks that are more sensitive to market movements) and small cap, as well as an underweight to momentum
| 1 | Effective September 1, 2016, a new Real Estate sector was created under the Global Industry Classification Standard (GICS); holdings in this sector were previously classified as Financials. The attribution analysis of the Financials sector includes Real Estate for the period starting January 1, 2016 through August 31, 2016. The attribution analysis of the Real Estate sector is only for the period starting September 1, 2016 through December 31, 2016. |
|
| Hartford Capital Appreciation HLS Fund |
Manager Discussion – (continued)
December 31, 2016 (Unaudited)
(stocks with persistent positive price movements), were tailwinds for the Fund during the year, while underweight exposure to dividend yield detracted from performance.
The largest absolute and relative detractors over the period were SunPower (Information Technology), Bristol-Myers Squibb (Healthcare), and Regeneron Pharmaceuticals (Healthcare). Shares of SunPower, a U.S.-based energy company that designs and manufactures crystalline silicon photovoltaic cells, roof tiles, and solar panels, fell during the period on concerns that 2017 earnings will decline as the renewal of investment tax credits in late 2015 has elongated project demand into future years. The stock price of Bristol-Myers Squibb, a U.S.-based biopharmaceutical company, fell as the company’s trial for immuno-oncology drug Opdivo failed during the third quarter of 2016. Shares of Regeneron Pharmaceuticals, a U.S.-based biotech company, fell during the period. In February, the company announced poor quarterly earnings and conservative guidance for 2016 which adversely affected the stock price. Additionally, a verdict was reached during the period that Regeneron violated Amgen’s patent on an injectable cholesterol drug. This headline news also weighed on the stock price. Allergan (Healthcare) was a top absolute detractor during the period.
The top contributors to performance relative to the Russell 3000 Index during the period included Sberbank (Financials), Ivanhoe Mines (Materials), and Samsung (Information Technology). Shares of Sberbank, a Russian banking and financial services company, rose during the period. In May, the company reported a record profit for the first quarter of 2016, largely driven by lower borrowing costs and a decline in loan-loss provisions. The stock was additionally supported by geopolitical developments in the latter part of the year. Ivanhoe Mines, a Canadian mineral exploration and development company, saw its stock price rise after announcing a copper discovery early in 2016 and receiving unsolicited interest in the company. The share price of Samsung, a Korean-based manufacturer of consumer electronic products, rose over the period as it announced quarterly results that beat market expectations from strong mobile phone demand. Though shares pulled back slightly in September due to the recall of its Galaxy Note 7 phone, the stock price later recovered. Merck (Healthcare), JPMorgan Chase (Financials), and PNC Financial (Financials) were the top absolute contributors during the period.
Derivatives were not used in a significant manner in the Fund during the period and did not have a material impact on performance during the period.
What is the outlook?
The election of Donald Trump could prove to be a transformative event for the economy as emphasis on fiscal policies, de-regulation, and a more efficient tax code support an improved growth outlook. However, there currently are many unknowns and this leads to a broader range of potential outcomes. Additional policy detail out of
the U.S., the ability of China to extend its current economic cycle, and political developments in Germany and France are key events to watch, in our opinion. From a factor perspective, we have seen strong performance from value in the U.S. We believe we are still relatively early in the value cycle compared to past cycles. However, it’s important to note that value is normally an early cycle factor, and in our opinion, we are not in the early stages. Quality has been more correlated with low volatility recently, so we remain cautious on this exposure.
At the end of the period, the Fund’s largest overweights were to the Financials and Information Technology sectors, while the Fund’s largest underweights were to the Consumer Staples, Real Estate, and Energy sectors, relative to the Russell 3000 Index.
A Word about Risk
All investments are subject to risk, including the possible loss of principal. There is no guarantee the Fund will achieve its stated objective. The Fund’s share price may fluctuate due to market risk and/or security selections that may underperform the market or relevant benchmarks. If the Fund’s strategy for allocating assets among different asset classes and/or portfolio management teams does not work as intended, the Fund may not achieve its objective or may underperform other funds with similar investment strategies. Small- and mid-cap securities can have greater risk and volatility than large-cap securities. Foreign investments can be riskier than U.S. investments due to the adverse effects of currency exchange rates, differences in market structure and liquidity, as well as political and economic developments in foreign countries and regions. The Fund may have high portfolio turnover, which could increase the Fund’s transaction costs.
Composition by Sector
as of December 31, 2016
| | | | |
| Sector | | Percentage of
Net Assets | |
Equity Securities | |
Consumer Discretionary | | | 13.4 | % |
Consumer Staples | | | 5.6 | |
Energy | | | 5.1 | |
Financials | | | 19.0 | |
Health Care | | | 13.9 | |
Industrials | | | 9.3 | |
Information Technology | | | 21.8 | |
Materials | | | 3.7 | |
Real Estate | | | 2.2 | |
Telecommunication Services | | | 1.4 | |
Utilities | | | 2.4 | |
| | | | |
Total | | | 97.8 | % |
| | | | |
Short-Term Investments | | | 2.2 | |
Other Assets & Liabilities | | | 0.0 | |
| | | | |
Total | | | 100.0 | % |
| | | | |
A sector may be comprised of several industries. For Fund compliance purposes, the Fund may not use the same classification system and these sector classifications are used for financial reporting purposes.
Hartford Disciplined Equity HLS Fund inception 05/29/1998
| | |
| (sub-advised by Wellington Management Company LLP) | | Investment objective – The Fund seeks growth of capital. |
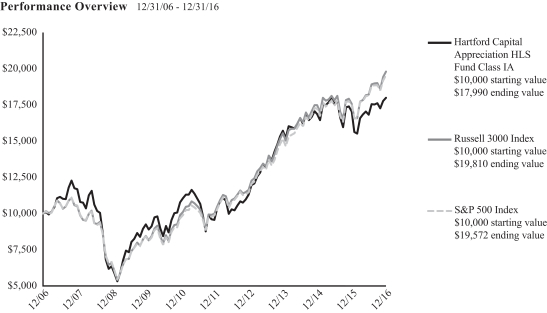
The chart above represents the hypothetical growth of a $10,000 investment in Class IA. Growth results in classes other than Class IA will vary from what is seen above due to differences in the expenses charged to those share classes.
Average Annual Total Return (as of 12/31/16)
| | | | | | | | | | | | |
| | | 1 Year | | | 5 Years | | | 10 Years | |
Disciplined Equity IA | | | 5.76 | % | | | 15.96 | % | | | 7.52 | % |
Disciplined Equity IB | | | 5.49 | % | | | 15.67 | % | | | 7.25 | % |
S&P 500 Index | | | 11.96 | % | | | 14.66 | % | | | 6.95 | % |
PERFORMANCE DATA QUOTED REPRESENTS PAST PERFORMANCE AND DOES NOT GUARANTEE FUTURE RESULTS. The investment return and principal value of the investment will fluctuate so that investors’ shares, when redeemed, may be worth more or less than their original cost. Current performance may be lower or higher than the performance data quoted. To obtain performance data current to the most recent month-end, please visit our website www.hartfordfunds.com.
Total returns presented above were calculated using the Fund’s net asset value available to shareholders for sale or redemption of Fund shares on December 31, 2016, which may exclude investment transactions as of this date. All share class returns assume the reinvestment of all distributions at net asset value and the deduction of all fund expenses.
S&P 500 Index is a market capitalization-weighted price index composed of 500 widely held common stocks.
The index is unmanaged, and its results include reinvested dividends and/or distributions, but do not reflect the effect of sales charges, commissions, expenses or taxes.
You cannot invest directly in an index.
As shown in the Fund’s current prospectus dated May 1, 2016, the total annual fund operating expense ratios for Class IA and Class IB were 0.76% and 1.01%,
respectively. Actual expenses may be higher. Please see the accompanying Financial Highlights for expense ratios for the year ended December 31, 2016.
All investments are subject to risk including the possible loss of principal. For a discussion of the Fund’s risks, please see “A Word about Risk” section in the
“Manager Discussion” section of this report. For more detailed information on the risks associated with an investment in the Fund, please see the prospectus.
The chart and table do not reflect the deductions of taxes, sales charges or other fees which may be applied at the variable life insurance, variable annuity or qualified retirement plan product level. Any such additional sales charges or other fees or expenses would lower the contract’s or plan’s performance.
|
| Hartford Disciplined Equity HLS Fund |
Manager Discussion
December 31, 2016 (Unaudited)
Portfolio Manager
Mammen Chally, CFA
Senior Managing Director and Equity Portfolio Manager
Wellington Management Company LLP
How did the Fund perform during the period?
The Class IA shares of Hartford Disciplined Equity HLS Fund returned 5.76% for the twelve-month period ended December 31, 2016, underperforming the Fund’s benchmark, the S&P 500 Index, which returned 11.96% for the same period. The Fund also underperformed the 10.33% average return of the Lipper Large-Cap Core Funds peer group, a group of funds with investment strategies similar to those of the Fund.
Why did the Fund perform this way?
U.S. equities rose over the period, as measured by the S&P 500 Index, notwithstanding significant volatility during the year. Early in the first quarter of 2016, equities plunged and moved in virtual lockstep with the price of oil as fears of a recession and weakness in China weighed on investors’ minds. However, equity markets surged in late February and March as solid economic data, a stabilization in oil prices, and accommodative commentary from the Federal Reserve (Fed) helped to calm the market’s early year jitters. A better-than-feared U.S. corporate earnings season in the second quarter and an encouraging economic backdrop helped sustain the rally. At its June meeting, the Fed left rates unchanged and reduced its U.S. growth and long-run policy rate forecasts, citing mixed U.S. economic data and uncertainty about global economic and financial developments. After plunging in the two trading days following the approval of the U.K.’s exit from the E.U. (Brexit), U.S. equities staged an impressive comeback in the days following.
U.S. equities continued to climb in July, following a solid start to the corporate earnings season and encouraging housing and employment data releases. Stocks were essentially flat in August and September as investors remained focused on the Fed’s actions, specifically on the timing of the next rate increase. A confluence of worries contributed to increased volatility during September, including uncertainty surrounding the U.S. presidential election, tepid economic data, and valuation concerns. Stocks surged following Donald Trump’s victory in the U.S. Presidential election on hopes of increased fiscal stimulus, reduced regulatory restrictions, and lower corporate taxes. Economic data released during the fourth quarter was generally encouraging, as third quarter gross domestic product (GDP) growth was revised slightly higher and the U.S. housing market continued to display healthy trends. In December, the Fed raised rates by 0.25%, a move that was anticipated by most of the market. It was only the second increase in the last decade.
Equity returns varied by market-cap, during the period, as small- and mid-cap equities, as measured by the Russell 2000 and S&P MidCap 400 Indices, outperformed large-cap equities, as measured by the S&P 500 Index. During the twelve-month period, nine of the eleven sectors1 within the Russell 1000 Index rose, led by Energy (+27%), Telecommunication Services (+24%), and Financials (+23%). Real Estate (+6%) and Healthcare (-3%) lagged on a relative basis.
The Fund underperformed the S&P 500 Index during the period primarily due to weak security selection, primarily within Information Technology, Consumer Staples, and Consumer Discretionary, which more than offset stronger selection within the Energy and Financial sectors. Sector allocation, which is a residual of the Fund’s bottom-up security selection process, also detracted from benchmark-relative returns during the period. Underweight allocations to the Energy and Telecommunication Services sectors more than offset the positive impact from an underweight to the Real Estate sector.
The largest detractors from performance relative to the S&P 500 Index over the period were Allergan (Healthcare), McKesson (Healthcare), and Signet Jewelers (Consumer Discretionary). Shares of Allergan, a U.S.-based specialty pharmaceutical company, fell during the period as Pfizer walked away from a proposed merger due to changes in the Treasury Department’s tax inversion rules. Shares of McKesson, a U.S.-based pharmaceutical distributor and health care information company, fell over the period as drug distributors generally have been under pressure due to weak generic pricing. We exited the position during the period. Shares of Signet Jewelers, a U.S.-based retailer of jewelry, fell over the period as a result of fears over the quality of their credit business and increased scrutiny around service issues. We exited the position during the period.
The largest contributors to benchmark-relative performance over the period were Bank of America (Financials), JPMorgan Chase (Financials), and UnitedHealth Group (Healthcare). Shares of Bank of America, a U.S.-based global financial services company, rose during the period as the bank has made what many investors consider to be impressive improvements to its business model. It has streamlined operations and right-sized the business so that interest rate increases can be expected to provide an increase to earnings. Shares of JPMorgan Chase, a U.S.-based global financial services company, rose during the period benefiting from the anticipation that the incoming U.S. administration would roll back some post-financial
| 1 | Effective September 1, 2016, a new Real Estate sector was created under the Global Industry Classification Standard (GICS); holdings in this sector were previously classified as Financials. The attribution analysis of the Financials sector includes Real Estate for the period starting January 1, 2016 through August 31, 2016. The attribution analysis of the Real Estate sector is only for the period starting September 1, 2016 through December 31, 2016. |
|
| Hartford Disciplined Equity HLS Fund |
Manager Discussion – (continued)
December 31, 2016 (Unaudited)
crisis regulations. Shares of UnitedHealth Group, a U.S.-based health care benefits and services provider, rose over the period as its traditional benefits business is expected to post organic enrollment growth across each of its three main business lines. Optum, the firm’s health care IT and consulting services division, may also benefit from growth of Optum Rx, OptumInsight, and OptumHealth.
Derivatives were not used in a significant manner in the Fund during the period and did not have a material impact on performance during the period.
What is the outlook?
As we enter 2017, we believe the global trend toward a return of inflation remains intact as we expect stronger global growth and higher inflation in 2017. Under a Trump administration, there is a reasonable likelihood of corporate and individual tax reform, both of which we believe would be good for reinvestment and consumption. Trump’s policies are likely to be inflationary and induce a stronger U.S. dollar. We expect that tax cuts will be a centerpiece of the new administration. We believe that corporate tax cuts, including the return of foreign earnings to the U.S. at lower tax rates, may mean a boost for corporate earnings. Several questions remain on implementation and cost. Another boost to the U.S. economy may come from deregulation in areas such as health care, financial services, and energy drilling, which would increase business confidence, lower the cost of doing business, and increase incentives to hire more workers.
However, we think a risk under a Trump presidency is that the U.S. may end up with trade tensions, which would be a hindrance for the U.S. economy, as well as the global economy. We believe there is also the risk of increased geopolitical uncertainty. The reaction of the rest of the world to Trump’s policies regarding trade and other relationships remains a wild card until we see his policies unfold.
Globally, we are encouraged by data coming out of Europe and believe nominal GDP growth and earnings will pick up given the positive economic data surprises in recent months and weakness of the euro. However, we view the French election as a near-term risk, as well as the negotiations surrounding Brexit, which will likely heat up in the first half of the year.
A Word about Risk
All investments are subject to risk, including the possible loss of principal. There is no guarantee the Fund will achieve its stated objective. The Fund’s share price may fluctuate due to market risk and/or security selections that may underperform the market or relevant benchmarks. Foreign investments can be riskier than U.S. investments due to the adverse effects of currency exchange rates, differences in market structure and liquidity, as well as political and economic developments in foreign countries and regions.
Composition by Sector
as of December 31, 2016
| | | | |
| Sector | | Percentage of
Net Assets | |
Equity Securities | | | | |
Consumer Discretionary | | | 13.5 | % |
Consumer Staples | | | 13.8 | |
Energy | | | 3.5 | |
Financials | | | 17.5 | |
Health Care | | | 12.4 | |
Industrials | | | 10.7 | |
Information Technology | | | 19.4 | |
Materials | | | 3.7 | |
Utilities | | | 5.0 | |
| | | | |
Total | | | 99.5 | % |
| | | | |
Short-Term Investments | | | 0.8 | |
Other Assets & Liabilities | | | (0.3 | ) |
| | | | |
Total | | | 100.0 | % |
| | | | |
A sector may be comprised of several industries. For Fund compliance purposes, the Fund may not use the same classification system and these sector classifications are used for financial reporting purposes.
Hartford Dividend and Growth HLS Fund inception 03/09/1994
| | |
| (sub-advised by Wellington Management Company LLP) | | Investment objective – The Fund seeks a high level of current income consistent with growth of capital. |

The chart above represents the hypothetical growth of a $10,000 investment in Class IA. Growth results in classes other than Class IA will vary from what is seen above due to differences in the expenses charged to those share classes.
Average Annual Total Return (as of 12/31/16)
| | | | | | | | | | | | |
| | | 1 Year | | | 5 Years | | | 10 Years | |
Dividend and Growth IA | | | 14.89% | | | | 13.96% | | | | 7.23% | |
Dividend and Growth IB | | | 14.58% | | | | 13.67% | | | | 6.96% | |
S&P 500 Index | | | 11.96% | | | | 14.66% | | | | 6.95% | |
Russell 1000 Value Index | | | 17.34% | | | | 14.80% | | | | 5.72% | |
PERFORMANCE DATA QUOTED REPRESENTS PAST PERFORMANCE AND DOES NOT GUARANTEE FUTURE RESULTS. The investment return and principal value of the investment will fluctuate so that investors’ shares, when redeemed, may be worth more or less than their original cost. Current performance may be lower or higher than the performance data quoted. To obtain performance data current to the most recent month-end, please visit our website www.hartfordfunds.com.
Total returns presented above were calculated using the Fund’s net asset value available to shareholders for sale or redemption of Fund shares on December 31, 2016, which may exclude investment transactions as of this date. All share class returns assume the reinvestment of all distributions at net asset value and the deduction of all fund expenses.
S&P 500 Index is a market capitalization-weighted price index composed of 500 widely held common stocks.
Russell 1000 Value Index is an unmanaged index that measures the performance of those Russell 1000 Index companies with lower price-to-book ratios and lower forecasted growth values. The Russell 1000 Index is an unmanaged index that measures the performance of the 1,000 largest companies in the Russell 3000 Index, which measures the performance of the 3,000 largest U.S. companies, based on total market capitalizations.
The indices are unmanaged, and their results include reinvested dividends and/or distributions, but do not reflect the effect of sales charges, commissions, expenses or taxes.
You cannot invest directly in an index.
As shown in the Fund’s current prospectus dated May 1, 2016, the total annual fund operating expense ratios for Class IA and Class IB were 0.67% and 0.92%, respectively. Actual expenses may be higher. Please see the accompanying Financial Highlights for expense ratios for the year ended December 31, 2016.
All investments are subject to risk including the possible loss of principal. For a discussion of the Fund’s risks, please see “A Word about Risk” section in the “Manager Discussion” section of this report. For more detailed information on the risks associated with an investment in the Fund, please see the prospectus.
The chart and table do not reflect the deductions of taxes, sales charges or other fees which may be applied at the variable life insurance, variable annuity or qualified retirement plan product level. Any such additional sales charges or other fees or expenses would lower the contract’s or plan’s performance.
|
| Hartford Dividend and Growth HLS Fund |
Manager Discussion
December 31, 2016 (Unaudited)
Portfolio Managers
Edward P. Bousa, CFA
Senior Managing Director and Equity Portfolio Manager
Wellington Management Company LLP
Donald J. Kilbride
Senior Managing Director and Equity Portfolio Manager
Wellington Management Company LLP
Matthew G. Baker
Senior Managing Director and Equity Portfolio Manager
Wellington Management Company LLP
How did the Fund perform during the period?
The Class IA shares of Hartford Dividend and Growth HLS Fund returned 14.89% for the twelve-month period ended December 31, 2016, outperforming the Fund’s benchmark, the S&P 500 Index, which returned 11.96% for the same period. The Fund underperformed the Russell 1000 Value Index, its other benchmark, which returned 17.34% for the same period. The Fund outperformed the 14.68% average return of the Lipper Equity Income Funds peer group, a group of funds with investment strategies similar to those of the Fund.
Why did the Fund perform this way?
U.S. equities rose over the period, as measured by the S&P 500 Index, notwithstanding significant volatility during the year. Early in the first quarter of 2016, equities plunged and moved in virtual lockstep with the price of oil as fears of a recession and weakness in China weighed on investors’ minds. However, equity markets surged in late February and March as solid economic data, a stabilization in oil prices, and accommodative commentary from the Federal Reserve (Fed) helped to calm the market’s early year jitters. A better-than-feared U.S. corporate earnings season in the second quarter and an encouraging economic backdrop helped sustain the rally. At its June meeting, the Fed left rates unchanged and reduced its U.S. growth and long-run policy rate forecasts, citing mixed U.S. economic data and uncertainty about global economic and financial developments. After plunging in the two trading days following the approval of the U.K.’s exit from the E.U. (Brexit), U.S. equities staged an impressive comeback in the days following.
U.S. equities continued to climb in July, following a solid start to the corporate earnings season and encouraging housing and employment data releases. Stocks were essentially flat in August and September as investors remained focused on the Fed’s actions, specifically on the timing of the next rate increase. A confluence of worries contributed to increased volatility during September, including
uncertainty surrounding the U.S. presidential election, tepid economic data, and valuation concerns. Stocks surged following Donald Trump’s victory in the U.S. Presidential election on hopes of increased fiscal stimulus, reduced regulatory restrictions, and lower corporate taxes. Economic data released during the fourth quarter was generally encouraging, as third quarter gross domestic product (GDP) growth was revised slightly higher and the U.S. housing market continued to display healthy trends. In December, the Fed raised rates by 0.25%, a move that was anticipated by most of the market. It was only the second increase in the last decade.
Equity returns varied by market-cap during the period, as small- and mid-cap equities, as measured by the Russell 2000 and S&P MidCap 400 Indices, outperformed large-cap equities, as measured by the S&P 500 Index. During the twelve-month period, nine of the eleven sectors1 within the S&P 500 Index posted positive returns, led by Energy (+27%), Telecommunication Services (+24%), and Financials (+23%), while Real Estate (-6%) and Healthcare (-3%) fell.
Sector allocation, a result of the Fund’s bottom up stock selection process, was the primary contributor to performance relative to the S&P 500 Index during the period. Overweights to the Financials and Energy sectors and an underweight to the Consumer Discretionary sector more than offset the negative impact of an overweight to Healthcare and an underweight to the Information Technology sector. Security selection also contributed positively to returns relative to the S&P 500 Index during the period. Strong selection within Healthcare, Consumer Discretionary, and Industrials was only partially offset by weaker selection within Consumer Staples and Information Technology.
The Fund’s top contributors to performance relative to the S&P 500 Index during the period were Bank of America (Financials), Prudential Financial (Financials), and JPMorgan Chase (Financials). Bank of America, a U.S.-based bank holding and financial holding company,
| 1 | Effective September 1, 2016, a new Real Estate sector was created under the Global Industry Classification Standard (GICS); holdings in this sector were previously classified as Financials. The attribution analysis of the Financials sector includes Real Estate for the period starting January 1, 2016 through August 31, 2016. The attribution analysis of the Real Estate sector is only for the period starting September 1, 2016 through December 31, 2016. |
|
| Hartford Dividend and Growth HLS Fund |
Manager Discussion – (continued)
December 31, 2016 (Unaudited)
saw its stock price rise on expectations of rising interest rates and hope that the Republican sweep of the White House and Congress might relieve regulatory pressures the banking sector has faced since the financial crisis. Prudential Financial, a U.S.-based financial services company, rose for the period after it announced strong operating results and a positive outlook. Profitability of the company was also better than expected given the low interest rate environment. JPMorgan Chase, a U.S.-based financial holding company, was another company whose share price rose following the U.S. presidential election and expectations of reduced regulations in the Financials sector. Top absolute performers during the period included Chevron (Energy).
The Fund’s top detractors from returns relative to the S&P 500 Index were AstraZeneca (Healthcare), Wells Fargo (Financials) and Bristol-Myers Squibb (Healthcare). The stock price of AstraZeneca, a U.K.-based manufacturer of pharmaceutical products, fell over the period after it reported results that disappointed investors and lowered its 2016 guidance. Shares of Wells Fargo, a U.S.-based financial services company, fell during the period, as investors became increasingly concerned that interest rates would not move higher quickly enough to support near-term profitability for the bank, and following allegations that bank employees opened more than 2 million unauthorized accounts to hit sales targets. The stock price of Bristol-Myers Squibb, a U.S.-based biopharmaceutical company, fell following the release of their Opdivo lung cancer drug trial results, which did not achieve the primary endpoint. Citigroup (Financials) and Cardinal Health (Healthcare) were also top absolute detractors during the period.
Derivatives were not used in a significant manner in the Fund during the period and did not have a material impact on performance during the period.
What is the outlook?
At the start of the year, the outlook that interest rates would remain lower for a longer than expected period led to declines in oil prices and increased pressure on bank earnings. A rising probability of Clinton being elected as president also contributed to skepticism about bank earnings as investors anticipated higher regulatory hurdles with a Democratic administration. This challenging environment reversed in November with the surprising result in which Donald Trump won over Hillary Clinton, and Republicans swept both houses of Congress.
We believe rates will rise incrementally and will at least be higher in 2017 than they were in 2016. Oil prices have gotten a boost following the Organization of the Petroleum Exporting Countries’ (OPEC) decision to cut supply. Although we do not believe that economic growth will necessarily be exceptionally robust, we do believe that these marginal improvements should lead to more rational market behavior. For example, higher rates should allow capital to be allocated in a more “normal” fashion. We believe distortions to capital
allocation were introduced when rates were so far below normal. Internationally, we expect Europe should benefit from growth in the U.S. Likewise, China should also share in positive momentum in the U.S. though debt issues could dampen the effect of tailwinds.
We are finding valuation across sectors to be compelling for a smaller group of sectors as equity markets appear to be discounting robust economic growth. As a result, we have been taking profits, selling higher multiple energy companies, and adding to companies with more compelling relative valuations and solid fundamentals. We also added to the Fund’s position in Apple, which has not participated in the “Trump rally” following the U.S. presidential election.
We continue to focus on valuations and company fundamentals. During the year, we gained confidence in this approach to company analysis as the Fund’s positioning with overweight allocations to Financials and Energy has been rewarded. Although we did not anticipate the Brexit result or the Trump victory in the U.S. presidential election, which were key events driving market performance this year, we had established downside protection prior to those events by investing in companies that had lowered their breakeven profit levels by lowering their cost bases. These companies performed best when markets rose rapidly following the U.S. elections, and the result was the strongest relative performance quarter in the recent history of the approach. The majority of the full year performance was generated in the final quarter of the year.
At the end of the period, the Fund’s largest overweights relative to the S&P 500 Index were to the Financials, Energy, and Utilities sectors, while the Fund’s largest underweights were to Information Technology and Consumer Discretionary.
A Word about Risk
All investments are subject to risk, including the possible loss of principal. There is no guarantee the Fund will achieve its stated objective. The Fund’s share price may fluctuate due to market risk and/or security selections that may underperform the market or relevant benchmarks. For dividend-paying stocks, dividends are not guaranteed and may decrease without notice. Foreign investments can be riskier than U.S. investments due to the adverse effects of currency exchange rates, differences in market structure and liquidity, as well as political and economic developments in foreign countries and regions.
|
| Hartford Dividend and Growth HLS Fund |
Manager Discussion – (continued)
December 31, 2016 (Unaudited)
Composition by Sector
as of December 31, 2016
| | | | |
| Sector | | Percentage of
Net Assets | |
Equity Securities | | | | |
Consumer Discretionary | | | 7.1 | % |
Consumer Staples | | | 6.3 | |
Energy | | | 10.1 | |
Financials | | | 24.7 | |
Health Care | | | 13.8 | |
Industrials | | | 10.5 | |
Information Technology | | | 14.0 | |
Materials | | | 3.6 | |
Real Estate | | | 0.5 | |
Telecommunication Services | | | 2.2 | |
Utilities | | | 4.7 | |
| | | | |
Total | | | 97.5 | % |
| | | | |
Short-Term Investments | | | 2.3 | |
Other Assets & Liabilities | | | 0.2 | |
| | | | |
Total | | | 100.0 | % |
| | | | |
A sector may be comprised of several industries. For Fund compliance purposes, the Fund may not use the same classification system and these sector classifications are used for financial reporting purposes.
Hartford Global Growth HLS Fund inception 09/30/1998
| | |
| (sub-advised by Wellington Management Company LLP) | | Investment objective – The Fund seeks growth of capital. |
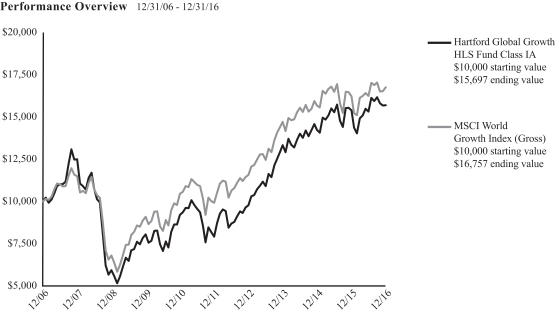
The chart above represents the hypothetical growth of a $10,000 investment in Class IA. Growth results in classes other than Class IA will vary from what is seen above due to differences in the expenses charged to those share classes.
Average Annual Total Return (as of 12/31/16)
| | | | | | | | | | | | |
| | | 1 Year | | | 5 Years | | | 10 Years | |
Global Growth IA | | | 1.95 | % | | | 14.62 | % | | | 4.61 | % |
Global Growth IB | | | 1.71 | % | | | 14.34 | % | | | 4.35 | % |
MSCI World Growth Index (Gross) | | | 3.21 | % | | | 11.04 | % | | | 5.30 | % |
PERFORMANCE DATA QUOTED REPRESENTS PAST PERFORMANCE AND DOES NOT GUARANTEE FUTURE RESULTS. The investment return and principal value of the investment will fluctuate so that investors’ shares, when redeemed, may be worth more or less than their original cost. Current performance may be lower or higher than the performance data quoted. To obtain performance data current to the most recent month-end, please visit our website www.hartfordfunds.com.
Total returns presented above were calculated using the Fund’s net asset value available to shareholders for sale or redemption of Fund shares on December 31, 2016, which may exclude investment transactions as of this date. All share class returns assume the reinvestment of all distributions at net asset value and the deduction of all fund expenses.
MSCI World Growth Index (Gross) is a broad-based unmanaged market capitalization-weighted total return index which measures the performance of growth securities in 23 developed-country global equity markets including the United States, Canada, Europe, Australia, New Zealand and the Far East.
The index is unmanaged, and its results include reinvested dividends and/or distributions, but do not reflect the effect of sales charges, commissions, expenses or taxes.
You cannot invest directly in an index.
As shown in the Fund’s current prospectus dated May 1, 2016, the total annual fund operating expense ratios for Class IA and Class IB were 0.81% and 1.06%, respectively. Actual expenses may be higher. Please see the accompanying Financial Highlights for expense ratios for the year ended December 31, 2016.
All investments are subject to risk including the possible loss of principal. For a discussion of the Fund’s risks, please see “A Word about Risk” section in the
“Manager Discussion” section of this report. For more detailed information on the risks associated with an investment in the Fund, please see the prospectus.
The chart and table do not reflect the deductions of taxes, sales charges or other fees which may be applied at the variable life insurance, variable annuity or qualified retirement plan product level. Any such additional sales charges or other fees or expenses would lower the contract’s or plan’s performance.
|
| Hartford Global Growth HLS Fund |
Manager Discussion
December 31, 2016 (Unaudited)
Portfolio Managers
Matthew D. Hudson, CFA
Managing Director and Equity Portfolio Manager
Wellington Management Company LLP
John Boselli, CFA
Senior Managing Director and Equity Portfolio Manager
Wellington Management Company LLP
How did the Fund perform during the period?
The Class IA shares of Hartford Global Growth HLS Fund returned 1.95% for the twelve-month period ended December 31, 2016, underperforming the Fund’s benchmark, the MSCI World Growth Index (Gross), which returned 3.21% for the same period. The Fund also underperformed the 2.60% average return of the Lipper Global Large-Cap Growth Funds peer group, a group of funds with investment strategies similar to those of the Fund.
Why did the Fund perform this way?
Global equities rose over the twelve-month period, as measured by the MSCI All Country World Index (Gross). 2016 got off to a volatile start as Chinese equities plunged in early January, sparking a global flight to quality trade. Along with ongoing worries about a hard landing in China, fears that yuan weakness could unleash a wave of global deflationary pressure resurfaced. Once again, extended monetary policy accommodation by major central banks helped support risk assets, such as equities. First, the Bank of Japan (BOJ) cut its benchmark rate to negative territory in January. Next, the People’s Bank of China (PBOC) lowered the reserve-requirement ratio in an effort to boost growth. Finally, European Central Bank (ECB) President Mario Draghi announced more-than-expected stimulus in March. Emerging market equities participated strongly in the market rebound. In June, the British electorate voted to leave the European Union (Brexit). The Brexit vote overshadowed a promising European economic backdrop and the ECB’s reaffirmation of its policy stance of maintaining low to near zero interest rates. In the U.S., solid economic data helped investors shrug off the Federal Reserve’s (Fed) ramped-up statements suggesting plans to further raise rates during May.
During the third quarter, expectations for continued accommodative monetary policy from central banks around the globe helped to stoke investors’ risk appetites. The Bank of England delivered a hefty stimulus package, which helped counteract the Brexit shock. Stocks rallied following Donald Trump’s victory in the U.S. Presidential election in November on expectations that Trump would reduce regulatory restrictions and increase fiscal stimulus, including corporate and individual tax cuts and a boost in infrastructure
spending. However, there was pronounced dispersion among sectors and regions. For instance, emerging market equities fell on concerns that a Trump administration would lead to trade protectionism, higher inflation, and a stronger U.S. dollar. In December, the Fed raised rates by 0.25%, a move that was anticipated by most of the market. It was only the second increase in the last decade.
During the period, U.S. equities outperformed non-U.S. equities, as measured by the S&P 500 Index and MSCI EAFE Index, respectively, and emerging market equities outperformed their developed market counterparts, as measured by the MSCI Emerging Markets Index and MSCI World Index, respectively. Within the MSCI World Growth Index (Gross), seven of eleven sectors1 posted positive returns during the period. Energy (+28%), Materials (+12%), and Industrials (+11%) gained the most, while the Healthcare (-10%), Real Estate (-6%), and Telecommunication Services (-3%) sectors lagged the most on a relative basis.
The Fund’s underperformance versus the MSCI World Growth Index (Gross) was driven by sector allocation, a result of the Fund’s bottom-up security selection process. The Fund’s underweights to Industrials and Materials and an overweight to Healthcare detracted the most from relative performance. This was partially offset by positive contribution from an overweight to Information Technology. Security selection slightly detracted from benchmark-relative results over the period. Selection within Industrials, Consumer Discretionary and Healthcare detracted the most, which was partially offset by stronger selection within Information Technology and Energy.
The top detractors from the Fund’s performance relative to the MSCI World Growth Index (Gross) were Allergan (Healthcare), Bristol-Myers Squibb (Healthcare), and Apple (Information Technology). Allergan, a U.S.-based high quality specialty pharmaceutical company, underperformed analysts’ expectations; after having announced a merger with Pfizer in the fourth quarter, the Treasury’s recent changes to tax inversion rules caused Pfizer to walk away from the deal, which led to a slump in Allergan’s stock price. The stock price of Bristol-Myers Squibb, a U.S.-based biopharmaceutical company, fell as the company’s trial for immuno-oncology drug
| 1 | Effective September 1, 2016, a new Real Estate sector was created under the Global Industry Classification Standard (GICS); holdings in this sector were previously classified as Financials. The attribution analysis of the Financials sector includes Real Estate for the period starting January 1, 2016 through August 31, 2016. The attribution analysis of the Real Estate sector is only for the period starting September 1, 2016 through December 31, 2016. |
|
| Hartford Global Growth HLS Fund |
Manager Discussion – (continued)
December 31, 2016 (Unaudited)
Opdivo failed during the third quarter of 2016. Shares of Apple, a U.S.-based mobile communication and media devices company, rose during the period after the company announced better than expected sales of its new iPhone 7 in the fourth quarter. Not owning this benchmark-constituent detracted from relative performance. Top absolute detractors also included Unione Di Banche (Financials).
Top contributors to performance relative to the MSCI World Growth Index (Gross) included Nintendo (Information Technology), Pioneer (Energy), and Assured Guaranty (Financials). Nintendo, a Japan-based gaming device and software company, saw its stock price rise during the period due to the release of its Pokemon GO game and announcing the release of Super Mario Run on the iPhone. Shares of Pioneer, a U.S.-based oil and gas exploration and production company, rose during the period as the company benefited from the recovery in commodity prices and after it raised its production growth outlook. The stock price of Assured Guaranty, a U.S.-based insurance company, rose for the year after it announced earnings results in November that beat market expectations. Comcast (Consumer Discretionary) was a top absolute contributor during the period.
Derivatives were not used in a significant manner in the Fund during the period and did not have a material impact on performance during the period.
What is the outlook?
Looking ahead, we believe that the global economy seems poised for moderate growth in 2017. Economic conditions are broadly improving. A combination of monetary and fiscal policies in the United States, Japan, and Europe should have a positive influence while policy reforms in India and a rising middle class in China are driving growth in those countries. If President-elect Trump can deliver on his promises for lower corporate taxes, less regulation, and further fiscal stimuli, we feel this should contribute to growth in the United States in particular. We believe, however, that these potential positives must be balanced with the risks associated with the possibilities of increased protectionism, the threat of trade wars, the impact of a stronger U.S. dollar, higher interest rates, and heightened geopolitical risk.
At the end of the period, the Fund’s largest sector overweights were to the Information Technology and Financials sectors while the Fund was most underweight Consumer Staples, Industrials, and Healthcare, relative to the MSCI World Growth Index (Gross).
A Word about Risk
All investments are subject to risk, including the possible loss of principal. There is no guarantee the Fund will achieve its stated objective. The Fund’s share price may fluctuate due to market risk and/or security selections that may underperform the market or relevant benchmarks. Foreign investments can be riskier than U.S. investments due to the adverse effects of currency exchange rates,
differences in market structure and liquidity, as well as political and economic developments in foreign countries and regions. These risks are generally greater for investments in emerging markets. Mid-cap securities can have greater risk and volatility than large-cap securities. Growth investing may go out of favor, which may cause the Fund to underperform the broader stock market.
Composition by Country
as of December 31, 2016
| | | | |
| Country | | Percentage of
Net Assets | |
Australia | | | 1.4 | % |
Belgium | | | 1.0 | |
Brazil | | | 0.6 | |
Canada | | | 0.7 | |
China | | | 3.2 | |
Denmark | | | 1.2 | |
France | | | 1.5 | |
Germany | | | 2.1 | |
Hong Kong | | | 1.5 | |
India | | | 1.1 | |
Indonesia | | | 1.0 | |
Ireland | | | 1.9 | |
Israel | | | 0.8 | |
Italy | | | 0.7 | |
Japan | | | 5.8 | |
Netherlands | | | 0.5 | |
Portugal | | | 0.7 | |
Russia | | | 0.6 | |
South Korea | | | 1.3 | |
Spain | | | 0.6 | |
Sweden | | | 1.2 | |
Switzerland | | | 2.4 | |
Taiwan | | | 1.4 | |
United Kingdom | | | 6.3 | |
United States | | | 59.5 | |
Short-Term Investments | | | 1.3 | |
Other Assets & Liabilities | | | (0.3 | ) |
| | | | |
Total | | | 100.0 | % |
| | | | |
Hartford Growth Opportunities HLS Fund inception 03/24/1987
| | |
| (sub-advised by Wellington Management Company LLP) | | Investment objective – The Fund seeks capital appreciation. |
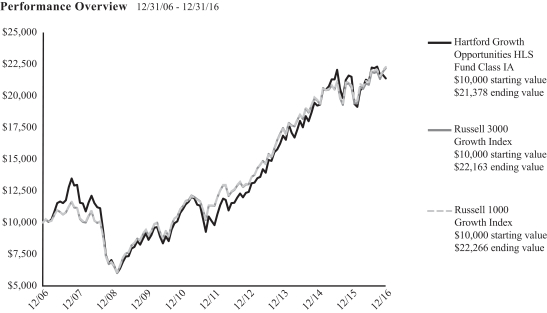
The chart above represents the hypothetical growth of a $10,000 investment in Class IA. Growth results in classes other than Class IA will vary from what is seen above due to differences in the expenses charged to those share classes.
Average Annual Total Return (as of 12/31/16)
| | | | | | | | | | | | |
| | | 1 Year | | | 5 Years | | | 10 Years | |
Growth Opportunities IA | | | -0.49% | | | | 16.93% | | | | 7.89% | |
Growth Opportunities IB | | | -0.77% | | | | 16.62% | | | | 7.62% | |
Growth Opportunities IC | | | -1.01% | | | | 16.35% | | | | 7.36% | |
Russell 3000 Growth Index | | | 7.39% | | | | 14.44% | | | | 8.28% | |
Russell 1000 Growth Index | | | 7.08% | | | | 14.50% | | | | 8.33% | |
PERFORMANCE DATA QUOTED REPRESENTS PAST PERFORMANCE AND DOES NOT GUARANTEE FUTURE RESULTS. The investment return and principal value of the investment will fluctuate so that investors’ shares, when redeemed, may be worth more or less than their original cost. Current performance may be lower or higher than the performance data quoted. To obtain performance data current to the most recent month-end, please visit our website www.hartfordfunds.com.
Total returns presented above were calculated using the Fund’s net asset value available to shareholders for sale or redemption of Fund shares on December 31, 2016, which may exclude investment transactions as of this date. All share class returns assume the reinvestment of all distributions at net asset value and the deduction of all fund expenses.
Class IC shares commenced operations on April 30, 2014. Class IC shares performance prior to that date reflects Class IA shares performance adjusted to reflect the 12b-1 fee of 0.25% and the administrative services fee of 0.25% applicable to Class IC shares. The performance after such date reflects actual Class IC shares performance.
Russell 3000 Growth Index is an unmanaged index that measures the performance of those Russell 3000 Index companies with higher price-to-book ratios and higher
forecasted growth values. The Russell 3000 Index is an unmanaged index that measures the performance of the 3,000 largest U.S. companies based on total market capitalization.
Russell 1000 Growth Index is an unmanaged index that measures the performance of those Russell 1000 Index companies with higher price-to-book ratios and higher forecasted growth values. The Russell 1000 Index is an unmanaged index that measures the performance of the 1,000 largest companies in the Russell 3000 Index, which measures the performance of the 3,000 largest U.S. companies based on total market capitalization.
The indices are unmanaged, and their results include reinvested dividends and/or distributions, but do not reflect the effect of sales charges, commissions, expenses or taxes.
You cannot invest directly in an index.
As shown in the Fund’s current prospectus dated May 1, 2016, the total annual fund operating expense ratios for Class IA, Class IB and Class IC were 0.65%, 0.90% and 1.16%, respectively. Actual expenses may be higher. Please see the accompanying Financial Highlights for expense ratios for the year ended December 31, 2016.
All investments are subject to risk including the possible loss of principal. For a discussion of the Fund’s risks, please see “A Word about Risk” section in the “Manager Discussion” section of this report. For more detailed information on the risks associated with an investment in the Fund, please see the prospectus.
The chart and table do not reflect the deductions of taxes, sales charges or other fees which may be applied at the variable life insurance, variable annuity or qualified retirement plan product level. Any such additional sales charges or other fees or expenses would lower the contract’s or plan’s performance.
|
| Hartford Growth Opportunities HLS Fund |
Manager Discussion
December 31, 2016 (Unaudited)
Portfolio Managers
Michael T. Carmen, CFA
Senior Managing Director and Equity Portfolio Manager
Wellington Management Company LLP
Mario E. Abularach, CFA
Senior Managing Director and Equity Research Analyst
Wellington Management Company LLP
Stephen Mortimer
Senior Managing Director and Equity Portfolio Manager
Wellington Management Company LLP
How did the Fund perform during the period?
The Class IA shares of Hartford Growth Opportunities HLS Fund returned -0.49% for the twelve-month period ended December 31, 2016, underperforming the Fund’s benchmarks, the Russell 3000 Growth Index and the Russell 1000 Growth Index, which returned 7.39% and 7.08%, respectively, for the same period. The Fund also underperformed the 2.81% average return of the Lipper Multi-Cap Growth Funds peer group, a group of funds with investment strategies similar to those of the Fund.
Why did the Fund perform this way?
U.S. equities rose over the period, as measured by the S&P 500 Index, notwithstanding significant volatility during the year. Early in the first quarter of 2016, equities plunged and moved in virtual lockstep with the price of oil as fears of a recession and weakness in China weighed on investors’ minds. However, equity markets surged in late February and March as solid economic data, a stabilization in oil prices, and accommodative commentary from the Federal Reserve (Fed) helped to calm the market’s early year jitters. A better-than-feared U.S. corporate earnings season in the second quarter and an encouraging economic backdrop helped sustain the rally. At its June meeting, the Fed left rates unchanged and reduced its U.S. growth and long-run policy rate forecasts, citing mixed U.S. economic data and uncertainty about global economic and financial developments. After plunging in the two trading days following the approval of the U.K.’s exit from the E.U. (Brexit), U.S. equities staged an impressive comeback in the days following.
U.S. equities continued to climb in July, following a solid start to the corporate earnings season and encouraging housing and employment data releases. Stocks were essentially flat in August and September as investors remained focused on the Fed’s actions, specifically on the timing of the next rate increase. A confluence of worries contributed to increased volatility during September, including uncertainty surrounding the U.S. presidential election, tepid economic
data, and valuation concerns. Stocks surged following Donald Trump’s victory in the U.S. Presidential election on hopes of increased fiscal stimulus, reduced regulatory restrictions, and lower corporate taxes. Economic data released during the fourth quarter was generally encouraging, as third quarter gross domestic product (GDP) growth was revised slightly higher and the U.S. housing market continued to display healthy trends. In December, the Fed raised rates by 0.25%, a move that was anticipated by most of the market. It was only the second increase in the last decade.
Equity returns varied by market-cap during the period, as small- and mid-cap equities, as measured by the Russell 2000 and S&P MidCap 400 Indices, respectively, outperformed large-cap equities, as measured by the S&P 500 Index. All three groups posted positive returns during the twelve-month period. Nine out of eleven sectors1 in the Russell 3000 Growth Index rose during the period, led by Telecommunication Services (+24%) and Utilities (+21%), while Healthcare (-7%) and Real Estate (-6%) lagged on a relative basis.
Security selection within Information Technology, Healthcare, and Financials was the primary detractor from benchmark-relative performance during the period. Positive selection in Energy and Consumer Discretionary was not enough to offset negative results elsewhere in the portfolio. Sector allocation, a result of the bottom-up stock selection process, was also a detractor from benchmark-relative performance over the period, due to an overweight to Healthcare and underweights to Telecommunication Services and Materials. This was partially offset by the positive impact from an overweight to Energy.
The top relative detractors from performance relative to the Russell 3000 Growth Index during the period included Apple (Information Technology), athenahealth (Healthcare), and McKesson (Healthcare). An underweight to Apple, a U.S.-based designer and manufacturer of consumer electronics, software, and computers,
| 1 | Effective September 1, 2016, a new Real Estate sector was created under the Global Industry Classification Standard (GICS); holdings in this sector were previously classified as Financials. The attribution analysis of the Financials sector includes Real Estate for the period starting January 1, 2016 through August 31, 2016. The attribution analysis of the Real Estate sector is only for the period starting September 1, 2016 through December 31, 2016. |
|
| Hartford Growth Opportunities HLS Fund |
Manager Discussion – (continued)
December 31, 2016 (Unaudited)
during the period detracted from relative results following stronger-than-expected pre-order numbers for the iPhone 7. We exited the position during the period. Shares of athenahealth, a U.S. cloud-based business services company focused on the health care industry, fell during the period. The company had a choppy start to the year after undergoing some recent additions to their physician interface and transitions among their management team. A significant earnings miss in the third quarter also weighed on the stock price. We exited the position during the period. Shares of McKesson, a U.S.-based pharmaceutical distributor and health care information technology company, fell during the period after the company lowered their 2017 guidance due to lower branded drug inflation and an increase in competitive pricing within the independent pharmacy space. Top absolute detractors during the period also included Tableau (Information Technology) and Allergan (Healthcare).
The top relative contributors to performance relative to the Russell 3000 Growth Index during the period were Netflix (Consumer Discretionary), Zillow (Information Technology), and Gilead Sciences (Healthcare). Shares of Netflix, a U.S.-based provider of subscription services for television shows and movies via mail and digital distribution, rose during the period following the release of strong third quarter earnings that beat consensus estimates. Shares of Zillow, a U.S. based online real estate listing company, rose as the company is reaping the benefits of its acquisition of Trulia and its accelerating revenue. Shares of Gilead Sciences, a U.S.-based research-focused biopharmaceutical firm, fell as future growth catalysts are difficult to handicap as the scientific challenges surrounding the firm’s pipeline initiatives remain formidable. Not holding this benchmark constituent contributed positively to relative returns during the period. Priceline (Consumer Discretionary) and Amazon (Consumer Discretionary) were among the top absolute contributors.
Derivatives were not used in a significant manner in the Fund during the period and did not have a material impact on performance during the period.
What is the outlook?
Following the November presidential election, the reflation trading theme related to expectations around increased fiscal stimulus dominated the narrative, leading to big equity inflows and the largest exodus from bonds since the “taper tantrum,” the 2013 surge in U.S. Treasury yields after the Federal Reserve scaled back quantitative easing. A Republican majority in Congress may result in tax reform, less business regulation, repatriation of cash from U.S. multinational companies, and more short-term fiscal stimulus, which could support near-term growth. We will continue to seek to identify companies that fit our investment criteria by employing our bottom-up investment process.
At the end of the period, the Fund was most overweight the Financials and Energy sectors and most underweight the Consumer Staples and Healthcare sectors, relative to the Russell 3000 Growth Index.
A Word about Risk
All investments are subject to risk, including the possible loss of principal. There is no guarantee the Fund will achieve its stated objective. The Fund’s share price may fluctuate due to market risk and/or security selections that may underperform the market or relevant benchmarks. Foreign investments can be riskier than U.S. investments due to the adverse effects of currency exchange rates, differences in market structure and liquidity, as well as political and economic developments in foreign countries and regions. Mid-cap securities can have greater risk and volatility than large-cap securities. The Fund may have high portfolio turnover, which could increase the Fund’s transaction costs. Growth investing may go out of favor, which may cause the Fund to underperform the broader stock market.
Composition by Sector
as of December 31, 2016
| | | | |
| Sector | | Percentage of
Net Assets | |
Equity Securities | | | | |
Consumer Discretionary | | | 16.7 | % |
Consumer Staples | | | 3.5 | |
Energy | | | 6.8 | |
Financials | | | 9.7 | |
Health Care | | | 12.4 | |
Industrials | | | 13.5 | |
Information Technology | | | 29.8 | |
Materials | | | 6.2 | |
Real Estate | | | 1.1 | |
| | | | |
Total | | | 99.7 | % |
| | | | |
Fixed Income Securities | | | | |
Corporate Bonds | | | 0.1 | % |
Short-Term Investments | | | 0.9 | |
Other Assets & Liabilities | | | (0.7 | ) |
| | | | |
Total | | | 100.0 | % |
| | | | |
A sector may be comprised of several industries. For Fund compliance purposes, the Fund may not use the same classification system and these sector classifications are used for financial reporting purposes.
Hartford Healthcare HLS Fund inception 05/01/2000
| | |
| (sub-advised by Wellington Management Company LLP) | | Investment objective – The Fund seeks long-term capital appreciation. |
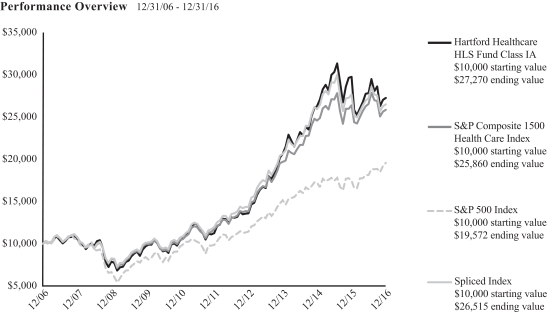
The chart above represents the hypothetical growth of a $10,000 investment in Class IA. Growth results in classes other than Class IA will vary from what is seen above due to differences in the expenses charged to those share classes.
Average Annual Total Return (as of 12/31/16)
| | | | | | | | | | | | |
| | | 1 Year | | | 5 Years | | | 10 Years | |
Healthcare IA | | | -8.39 | % | | | 19.33 | % | | | 10.55 | % |
Healthcare IB | | | -8.64 | % | | | 19.03 | % | | | 10.27 | % |
S&P Composite 1500 Health Care Index | | | -2.05 | % | | | 17.18 | % | | | 9.97 | % |
S&P 500 Index | | | 11.96 | % | | | 14.66 | % | | | 6.95 | % |
Spliced Index | | | -4.28 | % | | | 17.19 | % | | | 10.24 | % |
PERFORMANCE DATA QUOTED REPRESENTS PAST PERFORMANCE AND DOES NOT GUARANTEE FUTURE RESULTS. The investment return and principal value of the investment will fluctuate so that investors’ shares, when redeemed, may be worth more or less than their original cost. Current performance may be lower or higher than the performance data quoted. To obtain performance data current to the most recent month-end, please visit our website www.hartfordfunds.com.
Total returns presented above were calculated using the Fund’s net asset value available to shareholders for sale or redemption of Fund shares on December 31, 2016, which may exclude investment transactions as of this date. All share class returns assume the reinvestment of all distributions at net asset value and the deduction of all fund expenses.
Effective April 1, 2016, the Fund changed its benchmark to the S&P Composite 1500
Health Care Index due to S&P announcing that the S&P North American Health Care
Sector Index would be discontinued. Effective May 2, 2016, the S&P North American
Health Care Sector Index was discontinued.
S&P Composite 1500 Health Care Index is an unmanaged capitalization-weighted index comprised of those companies included in the S&P Composite 1500 that are classified as members of the Global Industry Classification Standard (GICS®) health care sector.
S&P 500 Index is a market capitalization-weighted price index composed of 500 widely held common stocks.
S&P North American Health Care Sector Index was a modified capitalization-weighted index based on United States headquartered health care companies.
Spliced Index is calculated by Hartford Funds Management Company, LLC (“HFMC”)
and returns from April 1, 2016 to December 31, 2016 represent the S&P Composite 1500 Health Care Index and returns prior to April 1, 2016 represent the S&P North American Health Care Sector Index.
The indices are unmanaged, and their results include reinvested dividends and/or distributions, but do not reflect the effect of sales charges, commissions, expenses or
taxes.
You cannot invest directly in an index.
As shown in the Fund’s current prospectus dated May 1, 2016, the total annual fund operating expense ratios for Class IA and Class IB were 0.87% and 1.12%, respectively. Actual expenses may be higher. Please see the accompanying Financial Highlights for expense ratios for the year ended December 31, 2016.
All investments are subject to risk including the possible loss of principal. For a discussion of the Fund’s risks, please see “A Word about Risk” section in the “Manager Discussion” section of this report. For more detailed information on the risks associated with an investment in the Fund, please see the prospectus.
The chart and table do not reflect the deductions of taxes, sales charges or other fees which may be applied at the variable life insurance, variable annuity or qualified retirement plan product level. Any such additional sales charges or other fees or expenses would lower the contract’s or plan’s performance.
|
| Hartford Healthcare HLS Fund |
Manager Discussion
December 31, 2016 (Unaudited)
Portfolio Managers
Jean M. Hynes, CFA
Senior Managing Director and Global Industry Analyst
Wellington Management Company LLP
Ann C. Gallo
Senior Managing Director and Global Industry Analyst
Wellington Management Company LLP
Kirk J. Mayer, CFA
Senior Managing Director and Global Industry Analyst
Wellington Management Company LLP
Robert L. Deresiewicz
Senior Managing Director and Global Industry Analyst
Wellington Management Company LLP
How did the Fund perform during the period?
The Class IA shares of Hartford Healthcare HLS Fund returned -8.39%, for the twelve-month period ended December 31, 2016, underperforming the Fund’s Spliced Index1, which returned -4.28% for the same period. The Fund also underperformed the Fund’s other benchmark, the S&P 500 Index, which returned 11.96% for the same period. The Fund outperformed the -11.21% average return of the Lipper Global Health and Biotechnology peer group, a group of funds with investment strategies similar to those of the Fund.
Why did the Fund perform this way?
Health care equities (-2%) underperformed both the broader U.S. market (+12%) and the global equity market (+8%) during the period, as measured by the S&P 1500 Healthcare, S&P 500 Index, and the MSCI World Indices, respectively. Within the Fund’s Spliced Index, small-cap biopharma returned (-23%), mid-cap biopharma returned (-42%), and large-cap biopharma returned (-7%), while medical technology returned (+6%) and health services returned (+1%).
The Fund underperformed its Spliced Index over the period due primarily to unfavorable sector allocation decisions. An overweight to mid- and small-cap biopharma detracted from relative results during the period, more than offsetting positive results from an underweight to large-cap biopharma and an overweight to medical technology. Security selection contributed positively to performance relative to the Spliced Index. Security selection was strongest in mid-cap biopharma and health care services. This was partially offset by weaker selection in large-cap biopharma and medical technology over the period.
Johnson & Johnson (biopharma), Merck (biopharma), and Allergan (biopharma) were the top detractors from performance relative to the
Spliced Index. A significant underweight to Johnson & Johnson, a U.S.-based medical device and pharmaceutical manufacturer, detracted from returns relative to the Spliced Index during the period as the stock held up well given the defensive nature of its broadly diversified business. An underweight to Merck, a U.S. pharmaceutical company, detracted from returns relative to the Spliced Index during the period as the stock saw strong performance following the surprise failure of key competitor Bristol-Myers Squibb’s immuno-oncology drug trial. We eliminated the position during the period. Shares of Allergan, an Ireland-based specialty pharmaceutical company, fell following the U.S. Treasury’s new tax inversion regulations that ultimately terminated the proposed merger between Allergan and Pfizer. Regeneron (biopharma) and McKesson (Healthcare) were top detractors from absolute performance during the period.
Gilead Sciences (biopharma), TESARO (biopharma), and Valeant Pharmaceuticals (biopharma) contributed positively to results relative to the Spliced Index over the period. Shares of Gilead Sciences, a U.S.-based research-focused biopharmaceutical firm, fell as future growth catalysts are difficult to handicap as the scientific challenges surrounding the firm’s pipeline initiatives remain formidable. Eliminating the Fund’s position during the period contributed positively to performance relative to the Spliced Index. Shares of TESARO, a U.S.-based oncology-focused biopharmaceutical company, contributed positively to performance relative to the Spliced Index during the period as the stock rose after the company posted positive phase 3 data for their ovarian cancer drug. Shares of Valeant Pharmaceuticals, a global specialty drugs manufacturer, declined significantly during the period, as lower earnings, financial forecasts, and concerns over potential bond defaults led to a sharp sell-off. Not owning this benchmark constituent contributed positively
| 1 | Effective April 1, 2016, the Fund changed its benchmark to the S&P Composite 1500 Health Care Index due to S&P announcing that the S&P North American Health Care Sector Index would be discontinued. Benchmark returns represent the S&P North American Health Care Sector Index from October 31, 2015 through March 31, 2016 and the S&P Composite 1500 Health Care Index from April 1, 2016 to December 31, 2016. |
|
| Hartford Healthcare HLS Fund |
Manager Discussion – (continued)
December 31, 2016 (Unaudited)
to performance relative to the Spliced Index. UnitedHealth Group (Healthcare) and WellCare Health Plan (Healthcare) were top contributors to absolute performance during the period.
Derivatives were not used in a significant manner in the Fund during the period and did not have a material impact on performance during the period.
What is the outlook?
The results of the U.S. presidential elections in November introduced an element of near-term uncertainty to the prospects for Healthcare equities. We await policy specifics from the new Administration and Congress on the future of the Affordable Care Act (ObamaCare), the potential regulation, or lack thereof, of drug pricing, corporate tax reform, and other relevant topics. We generally favor companies developing innovative products, and companies providing solutions to the challenges of the health care system. Such companies should be comparatively well positioned regardless of the regulatory environment. Over the long term, the tailwinds of innovation, an aging population, and the globalization of demand for cutting-edge Western-style health care should continue to drive growth of the sector, in our opinion.
A Word about Risk
All investments are subject to risk, including the possible loss of principal. There is no guarantee the Fund will achieve its stated objective. The Fund’s share price may fluctuate due to market risk and/or security selections that may underperform the market or relevant benchmarks. Risks of focusing investments on the health-care sector include regulatory and legal developments, patent considerations, intense competitive pressures, rapid technological changes, potential product obsolescence, and liquidity risk. Foreign investments can be riskier than U.S. investments due to the adverse effects of currency exchange rates, differences in market structure and liquidity, as well as political and economic developments in foreign countries and regions. These risks are generally greater for investments in emerging markets. Small- and mid-cap securities can have greater risk and volatility than large-cap securities.
Composition by Sector
as of December 31, 2016
| | | | |
| Sector | | Percentage of
Net Assets | |
Equity Securities | | | | |
Consumer Staples | | | 0.4 | % |
Health Care | | | 98.6 | |
| | | | |
Total | | | 99.0 | % |
| | | | |
Short-Term Investments | | | 1.2 | |
Other Assets & Liabilities | | | (0.2 | ) |
| | | | |
Total | | | 100.0 | % |
| | | | |
A sector may be comprised of several industries. For Fund compliance purposes, the Fund may not use the same classification system and these sector classifications are used for financial reporting purposes.
Hartford High Yield HLS Fund inception 09/30/1998
| | |
| (sub-advised by Wellington Management Company LLP) | | Investment objective – The Fund seeks to provide high current income, and long-term total return. |
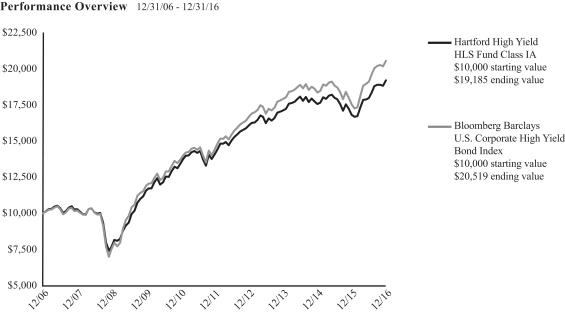
The chart above represents the hypothetical growth of a $10,000 investment in Class IA. Growth results in classes other than Class IA will vary from what is seen above due to differences in the expenses charged to those share classes.
Average Annual Total Return (as of 12/31/16)
| | | | | | | | | | | | |
| | | 1 Year | | | 5 Years | | | 10 Years | |
High Yield IA | | | 14.25% | | | | 6.41% | | | | 6.73% | |
High Yield IB | | | 13.99% | | | | 6.15% | | | | 6.47% | |
Bloomberg Barclays U.S. Corporate High Yield Bond Index | | | 17.13% | | | | 7.36% | | | | 7.45% | |
PERFORMANCE DATA QUOTED REPRESENTS PAST PERFORMANCE AND DOES NOT GUARANTEE FUTURE RESULTS. The investment return and principal value of the investment will fluctuate so that investors’ shares, when redeemed, may be worth more or less than their original cost. Current performance may be lower or higher than the performance data quoted. To obtain performance data current to the most recent month-end, please visit our website www.hartfordfunds.com.
Total returns presented above were calculated using the Fund’s net asset value available to shareholders for sale or redemption of Fund shares on December 31, 2016, which may exclude investment transactions as of this date. All share class returns assume the reinvestment of all distributions at net asset value and the deduction of all fund expenses.
Performance information through March 5, 2012 represents performance of the Fund’s previous sub-adviser, Hartford Investment Management Company (“HIMCO”). As of March 5, 2012, HIMCO no longer served as the sub-adviser to the Fund.
Bloomberg Barclays U.S. Corporate High Yield Bond Index is an unmanaged broad-based market-value-weighted index that tracks the total return performance of non-investment grade, fixed-rate, publicly placed, dollar denominated and nonconvertible debt registered with the Securities and Exchange Commission.
On August 24, 2016, Bloomberg L.P. acquired Barclays Risk Analytics and Index Solutions Ltd. from Barclays PLC. As a result of this acquisition, the Barclays indices have been rebranded as Bloomberg Barclays indices.
The index is unmanaged, and its results include reinvested dividends and/or distributions, but do not reflect the effect of sales charges, commissions, expenses or taxes.
You cannot invest directly in an index.
As shown in the Fund’s current prospectus dated May 1, 2016, the total annual fund operating expense ratios for Class IA and Class IB were 0.76% and 1.01%, respectively. Actual expenses may be higher. Please see the accompanying Financial Highlights for expense ratios for the year ended December 31, 2016.
All investments are subject to risk including the possible loss of principal. For a discussion of the Fund’s risks, please see “A Word about Risk” section in the “Manager Discussion” section of this report. For more detailed information on the risks associated with an investment in the Fund, please see the prospectus.
The chart and table do not reflect the deductions of taxes, sales charges or other fees which may be applied at the variable life insurance, variable annuity or qualified retirement plan product level. Any such additional sales charges or other fees or expenses would lower the contract’s or plan’s performance.
|
| Hartford High Yield HLS Fund |
Manager Discussion
December 31, 2016 (Unaudited)
Portfolio Managers
Christopher A. Jones, CFA
Senior Managing Director and Fixed Income Portfolio Manager
Wellington Management Company LLP
David Marshak
Managing Director and Fixed Income Portfolio Manager
Wellington Management Company LLP
How did the Fund perform during the period?
The Class IA shares of Hartford High Yield HLS Fund returned 14.25%, for the twelve-month period ended December 31, 2016, underperforming the Fund’s benchmark, the Bloomberg Barclays U.S. Corporate High Yield Bond Index, which returned 17.13% for the same period. The Fund outperformed the 13.24% average return of the Lipper High Yield Funds peer group, a group of funds with investment strategies similar to those of the Fund.
Why did the Fund perform this way?
Over the period, global fixed income markets were influenced by global economic growth concerns, central bank monetary policy expectations, and oil prices. Early in 2016, falling oil prices, concerns over slowing growth in China, and questions about the efficacy of central bank monetary policies sparked a broad sell-off in credit markets, while government bond prices benefited from their safe-haven status. Following the lead of European central banks, the Bank of Japan (BOJ) introduced negative interest rates for the first time as the volatility and instability in financial markets threatened to tip Japan back into deflation. Markets reversed course in mid-February as the major central banks adopted more cautious monetary policies in an effort to ease market risk. The People’s Bank of China resumed its easing cycle with a surprise cut in the bank’s reserve-requirement ratio and the European Central Bank (ECB) announced significant easing measures. A rebound in crude oil prices, accommodative global central bank monetary policy and signs of near-term stabilization in China further supported global financial markets through the second quarter. The U.K.’s momentous vote in June to leave the E.U. (Brexit) led to a spike in global financial market volatility and a flight to safety, with U.K. and European equity and credit markets bearing the brunt of the sell-off.
Policy paths of major central banks appeared to diverge in the third quarter as the Bank of England unveiled a stimulus package designed to prevent a recession following the Brexit vote while the ECB kept its stimulus program unchanged and avoided making a firm commitment to further expand its bond-buying program. In the U.S., Federal Reserve (Fed) rhetoric turned more focused on interest rate increases, setting up for a December rate increase. Global government bond yields moved sharply higher in the fourth quarter, particularly following the U.S. presidential election results as President-elect Trump’s proposed expansionary fiscal policy lifted
inflation expectations. In December, the Fed increased rates for only the second time in ten years. While markets had largely anticipated the decision, the Fed’s post-meeting statement and press conference leaned more toward an aggressive interest rate policy than expected.
Developed markets’ government bond prices largely gained outside the U.S. over the period, as global uncertainties kept central banks in easing mode for most of the year. In the U.S., the yield curve flattened; front-end yields, which were heavily influenced by Fed monetary policy expectations, rose more than intermediate- and long-term yields. The U.S. dollar ended higher against a broad basket of currencies over the period, particularly following the U.S. election results and Fed rate increase decision. Emerging market currencies also weakened significantly against the dollar following Trump’s election victory over concerns about potential U.S. trade protectionism. Meanwhile, the U.K. pound depreciated in the aftermath of Brexit.
Absolute returns in the major fixed income credit risk sectors were positive during the twelve-month period, aided by the decline in government bond yields outside the U.S. In the U.S., interest income helped offset the impact of higher Treasury yields. On an excess return basis, most credit risk sectors including high yield, emerging markets debt, and investment grade corporates posted positive returns over the period, as credit spreads tightened during the year. However, this masked considerable volatility in credit risk sector returns, including a drawdown in many credit risk sectors in the first part of 2016 and immediately following the Brexit referendum.
The Bloomberg Barclays U.S. Corporate High Yield Bond Index returned 17.13% for the twelve-months ended December 31, 2016 and outperformed duration equivalent treasuries by 15.73%. The Option-Adjusted Spread of the index was 4.09% on December 31, 2016, a decrease of 2.51% from December 31, 2015.
The Fund underperformed its benchmark, the Bloomberg Barclays U.S. Corporate High Yield Bond Index, primarily as a result of sector allocation, due largely to an underweight allocation to Metals and Mining and Energy, as these two sectors represented the top performing sectors in the market, returning more than 50% and 40%, respectively. Additionally, an overweight allocation to the Healthcare
|
| Hartford High Yield HLS Fund |
Manager Discussion – (continued)
December 31, 2016 (Unaudited)
sector also detracted, as the sector struggled over the uncertainty surrounding the future of the Affordable Care Act. On the other hand, an underweight allocation to the transportation industry contributed positively to relative returns over the period, as the sector lagged the overall index.
In aggregate, security selection contributed positively to performance relative to the Barclays U.S. Corporate High Yield Bond Index over the period. Security selection was positive in the cable satellite and consumer cyclical services industries. Within cable satellite, a lack of exposure to Intelsat contributed positively to performance. We continue to take a cautious approach with Intelsat and remain concerned with the company’s liquidity position. Within the consumer cyclical services, an overweight to Quad/Graphics (Industrials) helped relative performance. However, this positive selection was partially offset by negative selection within the media entertainment sector, as an overweight to Tegna (Consumer Discretionary) negatively affected relative returns. Additionally, selection within Healthcare and Financial Services detracted from relative results over the period. The Fund’s underweight to BB-rated bonds, which underperformed the broader index, contributed positively to benchmark-relative performance during the period.
The Fund’s credit default swap positions on the CDX index, which are used to tactically adjust the Fund’s exposure to the market, had a positive impact on relative performance during the period.
What is the outlook?
We remain constructive on high yield, given the current backdrop of stable company fundamentals, a supportive macroeconomic landscape, and strong demand for yield-producing assets. While we continue to monitor global political risks, we believe valuations are reasonable relative to the Fund’s outlook, particularly given our expectation that defaults will decline over the course of 2017. While we expect uncertainty to persist over the next several months, we continue to take a long-term, issuer-specific approach to finding what we view as opportunities in this market. We are most positive on the U.S. economy, and, therefore, emphasize issuers that benefit from a stable or growing U.S. domestic economy. Conversely, we are closely monitoring the Fund’s position in U.S. hospitals, given potential changes to the regulatory environment. While we continue to monitor potential impacts on global growth due to the increased political uncertainty and potential trends toward more protectionist policies, we believe strong investor demand will continue to support the high yield market. We expect the seemingly insatiable global demand for yield to persist due to low absolute levels of interest rates around much of the globe. We believe this “search for yield” is likely to provide a tailwind for high yield markets going forward.
A Word about Risk
All investments are subject to risk, including the possible loss of principal. There is no guarantee the Fund will achieve its stated objective. The Fund’s share price may fluctuate due to market risk and/or security selections that may underperform the market or relevant benchmarks. Fixed Income risks include credit, liquidity, call, duration, and interest-rate risk. As interest rates rise, bond prices generally fall; these risks are currently heightened due to the historically low interest rate environment. Investments in high-yield (“junk”) bonds involve greater risk of price volatility, illiquidity, and default than higher-rated debt securities. Derivatives may be riskier or more volatile than other types of investments because they are generally more sensitive to changes in market or economic conditions; risks include currency, leverage, liquidity, index, pricing, and counterparty risk. Foreign investments can be riskier than U.S. investments due to the adverse effects of currency exchange rates, differences in market structure and liquidity, as well as political and economic developments in foreign countries and regions. The Fund may have high portfolio turnover, which could increase the Fund’s transaction costs.
Composition by Security Type
as of December 31, 2016
| | | | |
| Category | | Percentage of
Net Assets | |
Fixed Income Securities | | | | |
Asset & Commercial Mortgage Backed Securities | | | 0.0 | % |
Convertible Bonds | | | 1.0 | |
Corporate Bonds | | | 91.7 | |
Senior Floating Rate Interests | | | 0.8 | |
| | | | |
Total | | | 93.5 | % |
| | | | |
Equity Securities | | | | |
Common Stocks | | | 1.4 | % |
| | | | |
Total | | | 1.4 | % |
| | | | |
Short-Term Investments | | | 3.6 | |
Other Assets & Liabilities | | | 1.5 | |
| | | | |
Total | | | 100.0 | % |
| | | | |
Hartford International Opportunities HLS Fund inception 07/02/1990
| | |
| (sub-advised by Wellington Management Company LLP) | | Investment objective – The Fund seeks long-term growth of capital. |
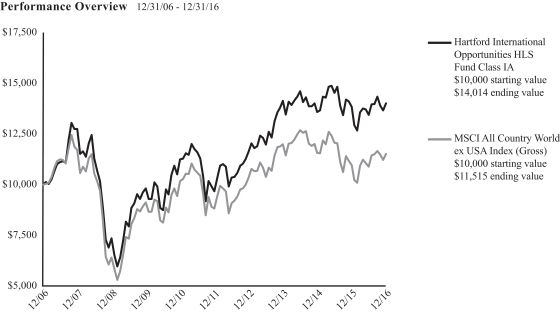
The chart above represents the hypothetical growth of a $10,000 investment in Class IA. Growth results in classes other than Class IA will vary from what is seen above due to differences in the expenses charged to those share classes.
Average Annual Total Return (as of 12/31/16)
| | | | | | | | | | | | |
| | | 1 Year | | | 5 Years | | | 10 Years | |
International Opportunities IA | | | 1.26 | % | | | 7.70 | % | | | 3.43 | % |
International Opportunities IB | | | 0.94 | % | | | 7.42 | % | | | 3.17 | % |
MSCI All Country World ex USA Index (Gross) | | | 5.01 | % | | | 5.48 | % | | | 1.42 | % |
PERFORMANCE DATA QUOTED REPRESENTS PAST PERFORMANCE AND DOES NOT GUARANTEE FUTURE RESULTS. The investment return and principal value of the investment will fluctuate so that investors’ shares, when redeemed, may be worth more or less than their original cost. Current performance may be lower or higher than the performance data quoted. To obtain performance data current to the most recent month-end, please visit our website www.hartfordfunds.com.
Total returns presented above were calculated using the Fund’s net asset value available to shareholders for sale or redemption of Fund shares on December 31, 2016, which may exclude investment transactions as of this date. All share class returns assume the reinvestment of all distributions at net asset value and the deduction of all fund expenses.
MSCI All Country World ex USA Index (Gross) is a broad-based, unmanaged, market capitalization weighted, total return index that measures the performance of both developed and emerging stock markets, excluding the U.S. The index is calculated to exclude companies and share classes which cannot be freely purchased by foreigners.
The index is unmanaged, and its results include reinvested dividends and/or distributions, but do not reflect the effect of sales charges, commissions, expenses or taxes.
You cannot invest directly in an index.
As shown in the Fund’s current prospectus dated May 1, 2016, the total annual fund operating expense ratios for Class IA and Class IB were 0.74% and 0.99%, respectively. Actual expenses may be higher. Please see the accompanying Financial Highlights for expense ratios for the year ended December 31, 2016.
All investments are subject to risk including the possible loss of principal. For a discussion of the Fund’s risks, please see “A Word about Risk” section in the “Manager Discussion” section of this report. For more detailed information on the risks associated with an investment in the Fund, please see the prospectus.
The chart and table do not reflect the deductions of taxes, sales charges or other fees which may be applied at the variable life insurance, variable annuity or qualified retirement plan product level. Any such additional sales charges or other fees or expenses would lower the contract’s or plan’s performance.
|
| Hartford International Opportunities HLS Fund |
Manager Discussion
December 31, 2016 (Unaudited)
Portfolio Managers
Nicolas M. Choumenkovitch
Senior Managing Director and Equity Portfolio Manager
Wellington Management Company LLP
Tara C. Stilwell, CFA
Senior Managing Director and Equity Portfolio Manager
Wellington Management Company LLP
How did the Fund perform during the period?
The Class IA shares of the Hartford International Opportunities HLS Fund returned 1.26% for the twelve-month period ended December 31, 2016, underperforming the Fund’s benchmark, the MSCI All Country World ex USA Index (Gross), which returned 5.01% for the same period. The Fund outperformed the -0.20% average return of the Lipper International Multi-Cap Growth Fund peer group, a group of funds with investment strategies similar to those of the Fund.
Why did the Fund perform this way?
International equities rose over the twelve-month period, as measured by the MSCI All Country World ex USA Index (Gross). 2016 got off to a volatile start as Chinese equities plunged in early January, sparking a global flight to quality trade. Along with ongoing worries about a hard landing in China, fears that yuan weakness could unleash a wave of global deflationary pressure resurfaced. Once again, extended monetary policy accommodation by major central banks helped support risk assets. First, the Bank of Japan (BOJ) cut its benchmark rate to negative territory in January. Next, the People’s Bank of China (PBOC) lowered the reserve-requirement ratio in an effort to boost growth. Finally, European Central Bank (ECB) President Mario Draghi announced more-than-expected stimulus in March. Emerging market equities participated strongly in the market rebound. In June, the British electorate voted to leave the European Union (Brexit). The Brexit vote overshadowed a promising European economic backdrop and the ECB’s reaffirmation of its cautious policy stance. In the U.S., solid economic data helped investors shrug off the Federal Reserve’s (Fed) ramped-up statements suggesting plans to further raise rates during May.
During the third quarter, expectations for continued accommodative monetary policy from central banks around the globe helped to stoke investors’ risk appetites. The Bank of England delivered a hefty stimulus package, which helped counteract the Brexit vote shock. Stocks rallied following Donald Trump’s victory in the U.S. Presidential election in November on expectations that Trump will reduce regulatory restrictions and increase fiscal stimulus, including corporate and individual tax cuts and a boost in infrastructure
spending. However, there was pronounced dispersion among sectors and regions. For instance, emerging market equities fell on concerns that a Trump administration would lead to trade protectionism, higher inflation, and a stronger U.S. dollar. In December, the Fed raised rates by 0.25%, a move that was anticipated by most of the market. It was only the second increase in the last decade.
During the twelve-month period, U.S. equities outperformed non-U.S. equities, as measured by the S&P 500 Index and MSCI All Country World ex USA Index (Gross), and emerging market equities outperformed their developed market counterparts, as measured by the MSCI Emerging Markets Index and MSCI World Index. Within the MSCI All Country World ex USA Index (Gross), five of the eleven sectors1 posted positive returns during the period; Energy (+32%), Materials (+28%), and Information Technology (+11%) rose the most, while Healthcare (-13%), Real Estate (-7%), and Telecommunication Services (-4%) fell.
The Fund underperformed the MSCI All Country World ex USA Index (Gross), due primarily to security selection, while sector allocation also detracted from performance. Security selection was weakest within the Consumer Discretionary, Consumer Staples, and Energy sectors. This was partially offset by stronger selection within the Materials and Information Technology sectors. Sector allocation, a result of our bottom-up security selection process, also detracted from benchmark-relative performance during the period. An underweight to the Materials sector early in the period and an overweight to the Healthcare sector detracted from benchmark relative returns, which was partially offset by an underweight to Telecommunication Services. On a regional basis, the Fund’s overweight to and security selection within Europe detracted the most; this was slightly offset by positive performance from security selection in Japan.
Top detractors from performance relative to the MSCI All Country World ex USA Index (Gross) during the period included Sky (Consumer Discretionary), Luxottica Group (Consumer Discretionary), and International Consolidated Air (Industrials). Sky, a U.K.-based pay TV provider, saw its stock price fall late in the period
| 1 | Effective September 1, 2016, a new Real Estate sector was created under the Global Industry Classification Standard (GICS); holdings in this sector were previously classified as Financials. The attribution analysis of the Financials sector includes Real Estate for the period starting January 1, 2016 through August 31, 2016. The attribution analysis of the Real Estate sector is only for the period starting September 1, 2016 through December 31, 2016. |
|
| Hartford International Opportunities HLS Fund |
Manager Discussion – (continued)
December 31, 2016 (Unaudited)
as the Brexit referendum results put significant downward pressure on the British pound. Sky shares were also affected by concerns around their competitive position in pay-TV to over-the-top content providers. The stock price of Luxottica Group, an Italian-based eyewear maker and retailer, has been weak due to concerns around the stability of the Italian economy as well as the company’s competitive dynamics in the U.S. Shares of International Consolidated Air, the parent company of British Airways, also fell as a result of Brexit; the referendum results have increased levels of economic uncertainty, which could put additional pressure on the company’s business. China Life (Financials) and Intesa Sanpaolo (Financials) were top absolute detractors during the period.
The largest absolute and relative contributors to returns included Taiwan Semiconductor (Information Technology), Daito Trust (Real Estate), and TransCanada (Energy). Shares of Taiwan Semiconductor, the world’s largest dedicated independent semiconductor foundry, rose as demand for high performance chips increased with the launch of the new iPhone model and high-end Android devices. Shares of Daito Trust, a Japanese real estate company, rose as their business continued to enjoy favorable market conditions as demand for low-cost rental housing remains fairly strong and the company has actively returned money to shareholders in the form of higher dividends and share buybacks. TransCanada, a Canadian energy infrastructure company, reported first quarter results in April which beat market consensus estimates for earnings and cash flow, sending the stock price of the company higher.
Derivatives were not used in a significant manner in the Fund during the period and did not have a material impact on performance during the period.
What is the outlook?
The market has slowly appeared to transition from one driven by “lower for longer” interest rates and deflationary fears to one that is now pricing in higher interest rates and inflation. The deflationary risks have slowly been abating globally throughout the course of the year, which we believe has been driven by the improving data out of China following the measures the government took to stimulate the economy earlier this year. We have been positioning the portfolio to benefit from equities that we believe had the risk of deflation overly discounted in their valuation and the management team had a credible plan to improve returns on capital. The U.S. election outcome did not materially change this reflationary trend, in our opinion. However, we believe it did increase the chance that the pervasive regulation that has depressed valuations in the Financials sector since the global financial crisis might improve, making for a better environment for security selection in the sector. The political backdrop in Europe remains stable despite growing concerns over the state of the European Union and is creating compelling opportunities in parts of the market, in our opinion.
At the end of the period, relative to the MSCI All Country World ex USA Index (Gross), the Fund was most overweight Energy, Real Estate, and Information Technology, and most underweight Consumer Discretionary, Telecommunication Services, and Utilities. On a regional basis, the Fund ended the period with an overweight to Europe, including the U.K. The Fund ended the period underweight Asia, including Japan, and Emerging Markets.
A Word about Risk
All investments are subject to risk, including the possible loss of principal. There is no guarantee the Fund will achieve its stated objective. The Fund’s share price may fluctuate due to market risk and/or security selections that may underperform the market or relevant benchmarks. Foreign investments can be riskier than U.S. investments due to the adverse effects of currency exchange rates, differences in market structure and liquidity, as well as political and economic developments in foreign countries and regions. These risks are generally greater for investments in emerging markets. Mid-cap securities can have greater risk and volatility than large-cap securities. The Fund may have high portfolio turnover, which could increase the Fund’s transaction costs.
Composition by Currency
as of December 31, 2016
| | | | |
| Description | | Percentage of
Net Assets | |
Australian Dollar | | | 0.9 | % |
Brazilian Real | | | 0.4 | |
British Pound | | | 11.4 | |
Canadian Dollar | | | 8.0 | |
Euro | | | 38.2 | |
Hong Kong Dollar | | | 2.5 | |
Indian Rupee | | | 2.3 | |
Japanese Yen | | | 11.6 | |
Mexican Peso | | | 0.7 | |
South African Rand | | | 0.4 | |
South Korean Won | | | 4.0 | |
Swedish Krona | | | 0.6 | |
Swiss Franc | | | 8.8 | |
Taiwanese Dollar | | | 2.3 | |
United States Dollar | | | 7.7 | |
Other Assets & Liabilities | | | 0.2 | |
| | | | |
Total | | | 100.0 | % |
| | | | |
|
| Hartford International Opportunities HLS Fund |
Manager Discussion – (continued)
December 31, 2016 (Unaudited)
Composition by Sector
as of December 31, 2016
| | | | |
| Sector | | Percentage of
Net Assets | |
Equity Securities | | | | |
Consumer Discretionary | | | 7.0 | % |
Consumer Staples | | | 11.5 | |
Energy | | | 10.3 | |
Financials | | | 21.2 | |
Health Care | | | 6.8 | |
Industrials | | | 13.6 | |
Information Technology | | | 11.5 | |
Materials | | | 7.5 | |
Real Estate | | | 6.1 | |
Telecommunication Services | | | 2.5 | |
Utilities | | | 1.1 | |
| | | | |
Total | | | 99.1 | % |
| | | | |
Short-Term Investments | | | 0.7 | |
Other Assets & Liabilities | | | 0.2 | |
| | | | |
Total | | | 100.0 | % |
| | | | |
A sector may be comprised of several industries. For Fund compliance purposes, the Fund may not use the same classification system and these sector classifications are used for financial reporting purposes.
Hartford MidCap HLS Fund inception 07/14/1997
| | |
| (sub-advised by Wellington Management Company LLP) | | Investment objective – The Fund seeks long-term growth of capital. |
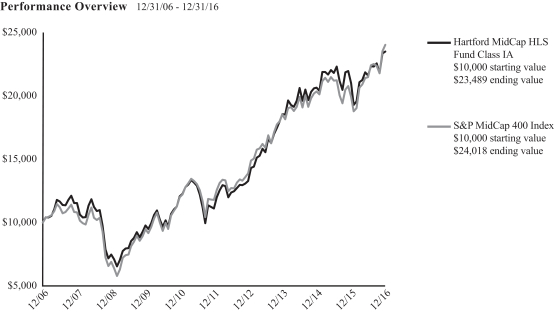
The chart above represents the hypothetical growth of a $10,000 investment in Class IA. Growth results in classes other than Class IA will vary from what is seen above due to differences in the expenses charged to those share classes.
Average Annual Total Return (as of 12/31/16)
| | | | | | | | | | | | |
| | | 1 Year | | | 5 Years | | | 10 Years | |
MidCap IA | | | 11.98% | | | | 16.17% | | | | 8.91% | |
MidCap IB | | | 11.69% | | | | 15.88% | | | | 8.64% | |
S&P MidCap 400 Index | | | 20.74% | | | | 15.33% | | | | 9.16% | |
PERFORMANCE DATA QUOTED REPRESENTS PAST PERFORMANCE AND DOES NOT GUARANTEE FUTURE RESULTS. The investment return and principal value of the investment will fluctuate so that investors’ shares, when redeemed, may be worth more or less than their original cost. Current performance may be lower or higher than the performance data quoted. To obtain performance data current to the most recent month-end, please visit our website www.hartfordfunds.com.
Total returns presented above were calculated using the Fund’s net asset value available to shareholders for sale or redemption of Fund shares on December 31, 2016, which may exclude investment transactions as of this date. All share class returns assume the reinvestment of all distributions at net asset value and the deduction of all fund expenses.
S&P MidCap 400 Index is an unmanaged index of common stocks of companies chosen by S&P designed to represent price movements in the mid-cap U.S. equity market.
The index is unmanaged, and its results include reinvested dividends and/or distributions, but do not reflect the effect of sales charges, commissions, expenses or taxes.
You cannot invest directly in an index.
As shown in the Fund’s current prospectus dated May 1, 2016, the total annual fund operating expense ratios for Class IA and Class IB were 0.70% and 0.95%, respectively. Actual expenses may be higher. Please see the accompanying Financial Highlights for expense ratios for the year ended December 31, 2016.
All investments are subject to risk including the possible loss of principal. For a discussion of the Fund’s risks, please see “A Word about Risk” section in the
“Manager Discussion” section of this report. For more detailed information on the risks associated with an investment in the Fund, please see the prospectus.
The chart and table do not reflect the deductions of taxes, sales charges or other fees which may be applied at the variable life insurance, variable annuity or qualified retirement plan product level. Any such additional sales charges or other fees or expenses would lower the contract’s or plan’s performance.
Manager Discussion
December 31, 2016 (Unaudited)
Portfolio Managers
Philip W. Ruedi, CFA
Senior Managing Director and Equity Portfolio Manager
Wellington Management Company LLP
Mark A. Whitaker, CFA
Senior Managing Director and Equity Portfolio Manager
Wellington Management Company LLP
How did the Fund perform during the period?
The Class IA shares of Hartford MidCap HLS Fund returned 11.98% for the twelve-month period ended December 31, 2016, underperforming the Fund’s benchmark, the S&P MidCap 400 Index, which returned 20.74% for the same period. The Fund outperformed the 6.62% average return of the Lipper Mid-Cap Growth Funds peer group, a group of funds with investment strategies similar to those of the Fund.
Why did the Fund perform this way?
U.S. equities rose over the period, as measured by the S&P 500 Index, notwithstanding significant volatility during the year. Early in the first quarter of 2016, equities plunged and moved in virtual lockstep with the price of oil as fears of a recession and weakness in China weighed on investors’ minds. However, equity markets surged in late February and March as solid economic data, a stabilization in oil prices, and accommodative commentary from the Federal Reserve (Fed) helped to calm the market’s early year jitters. A better-than-feared U.S. corporate earnings season in the second quarter and an encouraging economic backdrop helped sustain the rally. At its June meeting, the Fed left rates unchanged and reduced its U.S. growth and long-run policy rate forecasts, citing mixed U.S. economic data and uncertainty about global economic and financial developments. After plunging in the two trading days following the approval of the U.K.’s exit from the E.U. (Brexit), U.S. equities staged an impressive comeback in the days following.
U.S. equities continued to climb in July, following a solid start to the corporate earnings season and encouraging housing and employment data releases. Stocks were essentially flat in August and September as investors remained focused on the Fed’s actions, specifically on the timing of the next rate increase. A confluence of worries contributed to increased volatility during September, including uncertainty surrounding the U.S. presidential election, tepid economic data, and valuation concerns. Stocks surged following Donald Trump’s victory in the U.S. Presidential election on hopes of increased fiscal stimulus, reduced regulatory restrictions, and lower corporate taxes. Economic data released during the fourth quarter was generally encouraging, as third quarter gross domestic product
(GDP) growth was revised slightly higher and the U.S. housing market continued to display healthy trends. In December, the Fed raised rates by 0.25%, a move that was anticipated by most of the market. It was only the second increase in the last decade.
Equity returns varied by market-cap during the period, as small- and mid-cap equities, as measured by the Russell 2000 and S&P MidCap 400 Indices, outperformed large-cap equities, as measured by the S&P 500 Index. Within the S&P MidCap 400 Index, ten of eleven sectors1 posted positive returns during the period. The Materials (+37%), Financials (+31%), and Industrials (+29%) sectors posted the highest returns while the Real Estate (-3%) sector lagged on a relative basis.
The Fund’s underperformance relative to the S&P MidCap 400 Index during the period was driven by weak security selection. Security selection in the Information Technology, Financials, and Healthcare sectors detracted the most, which more than offset stronger selection in Energy. Sector allocation, a result of the bottom-up security selection process, contributed positively to relative returns over the period. An underweight to Real Estate and an overweight to Industrials contributed positively to relative returns, which more than offset negative performance from an overweight to Healthcare and an underweight to Materials.
Top detractors from relative and absolute performance during the period were Alkermes (Healthcare), TripAdvisor (Consumer Discretionary), and SunPower (Information Technology). The stock of Alkermes, a U.S. biopharmaceutical company, fell after the company announced discouraging results from one of its trials early in the year. TripAdvisor, a U.S. online travel company, suffered from a number of analyst downgrades in early 2016 and reported a decline in net profits in May, putting downward pressure on the share price. Shares of SunPower, a U.S.-based solar energy company, fell as Chinese competition eager to sell excess inventory drove down pricing.
Top contributors to relative performance during the period were MSC Industrial Direct (Industrials), Ionis Pharmaceuticals (Healthcare), and Jones Lang LaSalle (Real Estate). Shares of MSC Industrial
| 1 | Effective September 1, 2016, a new Real Estate sector was created under the Global Industry Classification Standard (GICS); holdings in this sector were previously classified as Financials. The attribution analysis of the Financials sector includes Real Estate for the period starting January 1, 2016 through August 31, 2016. The attribution analysis of the Real Estate sector is only for the period starting September 1, 2016 through December 31, 2016. |
Manager Discussion – (continued)
December 31, 2016 (Unaudited)
Direct, a U.S.-based retailer of industrial products including tools, hardware, fittings, valves and raw materials, rose as the company is actively investing to consolidate operations in a highly fragmented industrial supply industry. Shares of Ionis Pharmaceuticals, a U.S.-based pharmaceutical company, rose over the period as it announced positive data for its lipid-lowering drug volanesorsen in the fourth quarter. The stock price of Jones Lang LaSalle, a U.S. professional services and investment management company specializing in real estate, fell over the period, as volatile equity and credit markets at the start of the year resulted in lower sales and leasing volumes of commercial property. Not holding this benchmark constituent contributed positively to relative returns. Vantiv (Information Technology) and M&T Bank (Financials) were also top absolute contributors over the period.
Derivatives were not used in a significant manner in the Fund during the period and did not have a material impact on performance during the period.
What is the outlook?
The Fund invests in a diversified portfolio of U.S. mid cap blue-chip market leaders. The Fund’s portfolio is not designed around particular macroeconomic or political outcomes. A Republican majority in Congress may result in tax reform, less business regulation, and more short term fiscal stimulus, which could support near term growth. However, we believe the election of Donald Trump has created more uncertainty than the market is currently reflecting.
As a result of our bottom-up, company specific process based on FVE (fundamentals, valuation, and expectations), the Fund ended the period overweight the Industrials, Healthcare, and Information Technology sectors. The Fund’s Industrial holdings include market leaders across waste disposal, credit reporting agencies, and leading niche manufacturers. The Fund’s largest underweight at the end of the period was to the Real Estate sector, and more specifically real estate investment trusts (REITs), which we continued to view as unattractive.
A Word about Risk
All investments are subject to risk, including the possible loss of principal. There is no guarantee the Fund will achieve its stated objective. The Fund’s share price may fluctuate due to market risk and/or security selections that may underperform the market or relevant benchmarks. Mid-cap securities can have greater risk and volatility than large-cap securities. Foreign investments can be riskier than U.S. investments due to the adverse effects of currency exchange rates, differences in market structure and liquidity, as well as political and economic developments in foreign countries and regions.
Composition by Sector
as of December 31, 2016
| | | | |
| Sector | | Percentage of
Net Assets | |
Equity Securities | | | | |
Consumer Discretionary | | | 7.6 | % |
Consumer Staples | | | 0.7 | |
Energy | | | 6.5 | |
Financials | | | 16.0 | |
Health Care | | | 14.2 | |
Industrials | | | 25.3 | |
Information Technology | | | 23.7 | |
Materials | | | 3.4 | |
Utilities | | | 2.3 | |
| | | | |
Total | | | 99.7 | % |
| | | | |
Short-Term Investments | | | 0.3 | |
Other Assets & Liabilities | | | 0.0 | |
| | | | |
Total | | | 100.0 | % |
| | | | |
A sector may be comprised of several industries. For Fund compliance purposes, the Fund may not use the same classification system and these sector classifications are used for financial reporting purposes.
Hartford MidCap Value HLS Fund inception 04/30/2001
| | |
| (sub-advised by Wellington Management Company LLP) | | Investment objective – The Fund seeks long-term capital appreciation. |
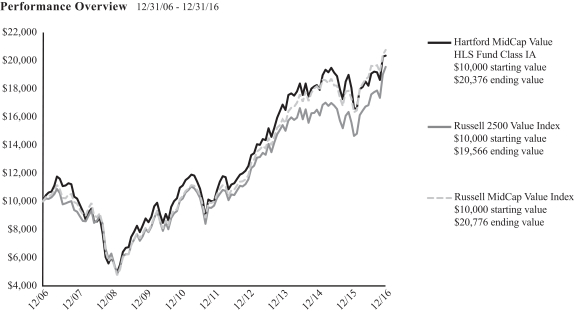
The chart above represents the hypothetical growth of a $10,000 investment in Class IA. Growth results in classes other than Class IA will vary from what is seen above due to differences in the expenses charged to those share classes.
Average Annual Total Return (as of 12/31/16)
| | | | | | | | | | | | |
| | | 1 Year | | | 5 Years | | | 10 Years | |
MidCap Value IA | | | 12.82 | % | | | 15.21 | % | | | 7.38 | % |
MidCap Value IB | | | 12.56 | % | | | 14.92 | % | | | 7.11 | % |
Russell 2500 Value Index | | | 25.20 | % | | | 15.04 | % | | | 6.94 | % |
Russell MidCap Value Index | | | 20.00 | % | | | 15.70 | % | | | 7.59 | % |
PERFORMANCE DATA QUOTED REPRESENTS PAST PERFORMANCE AND DOES NOT GUARANTEE FUTURE RESULTS. The investment return and principal value of the investment will fluctuate so that investors’ shares, when redeemed, may be worth more or less than their original cost. Current performance may be lower or higher than the performance data quoted. To obtain performance data current to the most recent month-end, please visit our website www.hartfordfunds.com.
Total returns presented above were calculated using the Fund’s net asset value available to shareholders for sale or redemption of Fund shares on December 31, 2016, which may exclude investment transactions as of this date. All share class returns assume the reinvestment of all distributions at net asset value and the deduction of all fund expenses.
Russell 2500 Value Index is an unmanaged index that measures the performance of those Russell 2500 Index companies with lower price-to-book ratios and lower forecasted growth values. The Russell 2500 Index is an unmanaged index that measures the performance of the 2,500 smallest U.S. companies based on total market capitalization.
Russell MidCap Value Index measures the performance of the mid-cap value segment of the U.S. equity universe. It includes those Russell MidCap Index companies with lower price-to-book ratios and lower forecasted growth values.
The indices are unmanaged, and their results include reinvested dividends and/or distributions, but do not reflect the effect of sales charges, commissions, expenses or taxes.
You cannot invest directly in an index.
As shown in the Fund’s current prospectus dated May 1, 2016, the total annual fund operating expense ratios for Class IA and Class IB were 0.84% and 1.09%, respectively. Actual expenses may be higher. Please see the accompanying Financial Highlights for expense ratios for the year ended December 31, 2016.
All investments are subject to risk including the possible loss of principal. For a discussion of the Fund’s risks, please see “A Word about Risk” section in the “Manager Discussion” section of this report. For more detailed information on the risks associated with an investment in the Fund, please see the prospectus.
The chart and table do not reflect the deductions of taxes, sales charges or other fees which may be applied at the variable life insurance, variable annuity or qualified retirement plan product level. Any such additional sales charges or other fees or expenses would lower the contract’s or plan’s performance.
|
| Hartford MidCap Value HLS Fund |
Manager Discussion
December 31, 2016 (Unaudited)
Portfolio Manager
James N. Mordy
Senior Managing Director and Equity Portfolio Manager
Wellington Management Company LLP
How did the Fund perform during the period?
The Class IA shares of Hartford MidCap Value HLS Fund returned 12.82% for the twelve-month period ended December 31, 2016, underperforming the Fund’s benchmark, the Russell 2500 Value Index, which returned 25.20% for the same period, and the Fund’s other benchmark, the Russell MidCap Value Index, which returned 20.00% for the same period. The Fund also underperformed the 15.62% average return of the Lipper Mid-Cap Core Fund peer group, a group of funds with investment strategies similar to those of the Fund.
Why did the Fund perform this way?
U.S. equities rose over the period, as measured by the S&P 500 Index, notwithstanding significant volatility during the year. Early in the first quarter of 2016, equities plunged and moved in virtual lockstep with the price of oil as fears of a recession and weakness in China weighed on investors’ minds. However, equity markets surged in late February and March as solid economic data, a stabilization in oil prices, and accommodative commentary from the Federal Reserve (Fed) helped to calm the market’s early year jitters. A better-than-feared U.S. corporate earnings season in the second quarter and an encouraging economic backdrop helped sustain the rally. At its June meeting, the Fed left rates unchanged and reduced its U.S. growth and long-run policy rate forecasts, citing mixed U.S. economic data and uncertainty about global economic and financial developments. After plunging in the two trading days following the approval of the U.K.’s exit from the E.U. (Brexit), U.S. equities staged an impressive comeback in the days following.
U.S. equities continued to climb in July, following a solid start to the corporate earnings season and encouraging housing and employment data releases. Stocks were essentially flat in August and September as investors remained focused on the Fed’s actions, specifically on the timing of the next rate increase. A confluence of worries contributed to increased volatility during September, including uncertainty surrounding the U.S. presidential election, tepid economic data, and valuation concerns. Stocks surged following Donald Trump’s victory in the U.S. Presidential election on hopes of increased fiscal stimulus, reduced regulatory restrictions, and lower corporate taxes. Economic data released during the fourth quarter was generally encouraging, as third quarter gross domestic product (GDP) growth was revised slightly higher and the U.S. housing market continued to display healthy trends. In December, the Fed
raised rates by 0.25%, a move that was anticipated by most of the market. It was only the second increase in the last decade.
Equity returns varied by market-cap during the period, as small- and mid-cap equities, as measured by the Russell 2000 and S&P MidCap 400 Indices, outperformed large-cap equities, as measured by the S&P 500 Index. Within the Russell 2500 Value Index, ten out of eleven sectors1 posted positive returns during the twelve-month period. The Materials (+46%), Financials (+37%), and Energy (+36%) sectors performed the best while the Real Estate (-1%) sector was the only one that fell over the period.
The Fund’s underperformance relative to the Russell 2500 Value Index was largely driven by weak security selection. Negative stock selection within the Consumer Discretionary, Industrials, and Materials sectors more than offset positive stock selection within Consumer Staples and Utilities. Sector allocation, a result of the bottom-up security selection process, contributed positively to relative results over the period, primarily due to an underweight to Real Estate and an overweight to Energy. An overweight to Consumer Discretionary and an underweight to Financials detracted from benchmark-relative performance over the period.
The largest detractors from absolute returns and returns relative to the Russell 2500 Value Index included Performance Sports Group (PSG) (Consumer Discretionary), Norwegian Cruise Lines (Consumer Discretionary), and Hertz (Industrials). Shares of Performance Sports Group (PSG), a Canada-based manufacturer of sports equipment, fell during the period as the company announced a significant sales and earnings miss in their Easton baseball equipment business. Shares of Norwegian Cruise Lines, a U.S.-based international cruise operator, fell due to uncertainty regarding how Brexit will affect the travel and leisure industry, in addition to first quarter 2016 earnings below market expectations citing recent terror attacks in Paris, Brussels, and Istanbul as a drag on European cruise revenue. The stock price of Hertz, a U.S.-based car rental company, fell as the company released quarterly earnings which were below consensus expectations.
The largest contributors to performance relative to the Russell 2500 Value Index included Comerica (Financials), Microsemi (Information Technology), and Zions Bancorporation (Financials).
| 1 | Effective September 1, 2016, a new Real Estate sector was created under the Global Industry Classification Standard (GICS); holdings in this sector were previously classified as Financials. The attribution analysis of the Financials sector includes Real Estate for the period starting January 1, 2016 through August 31, 2016. The attribution analysis of the Real Estate sector is only for the period starting September 1, 2016 through December 31, 2016. |
|
| Hartford MidCap Value HLS Fund |
Manager Discussion – (continued)
December 31, 2016 (Unaudited)
Comerica, a U.S.-based financial services company, saw its stock price rise after the U.S. election on expectations that the incoming White House administration would roll back some regulations in the financial sector. Shares of Microsemi, a U.S.-based designer and manufacturer of analog and mixed-signal semiconductor solutions, rose after it became a subject of takeout rumors. Zions Bancorporation, a U.S.-based financial holding company, was another beneficiary of the U.S. presidential election as it saw its shares rise after the Trump victory. Top absolute contributors during the period included Diamondback Energy (Energy).
Derivatives were not used in a significant manner in the Fund during the period and did not have a material impact on performance during the period.
What is the outlook?
Unlike 2016, we enter 2017 with a strong consensus around continued economic expansion. Our team projects stronger global growth, higher inflation, and three more Fed rate increases in 2017. We expect U.S. GDP growth at 2.5%, with a steady rate of consumer spending, a lift in investment spending as increased investor confidence leads to some loosening of corporate purse strings, and less drag from the inventory cycle. We believe that there is good economic momentum currently, but whether it is sustained will depend on the sequencing of events, the details of new policy, the trajectory of interest rates, the reaction of foreign governments and currency markets, and the obvious risks of a Trump presidency. The benefits from fiscal stimulus or tax reform will likely have more impact in 2018 and beyond, thus there is risk of some transitional disappointment in 2017. We acknowledge more uncertainty than usual as we try and project forward earnings for the Fund’s portfolio companies, as we consider the possibilities of trade policy, corporate tax reform (including “border adjustability”), the Affordable Care Act’s (ACA) repeal and replacement, likely continued upward pressure on the dollar, and tighter labor markets. For now we believe the Fund’s pro-cyclical positioning remains appropriate given the pro-U.S. growth priorities of the new administration, but we will need to be flexible as policy details emerge.
The Fund ended the period most overweight Information Technology, Materials, and Consumer Discretionary, and most underweight the Real Estate, Financials, and Utilities sectors, relative to the Russell 2500 Value Index.
A Word about Risk
All investments are subject to risk, including the possible loss of principal. There is no guarantee the Fund will achieve its stated objective. The Fund’s share price may fluctuate due to market risk and/or security selections that may underperform the market or relevant benchmarks. Mid-cap securities can have greater risk and volatility than large-cap securities. Foreign investments can be riskier than U.S. investments due to the adverse effects of currency exchange rates, differences in market structure and liquidity, as well
as political and economic developments in foreign countries and regions. Value investing may go out of favor, which may cause the Fund to underperform the broader stock market.
Composition by Sector
as of December 31, 2016
| | | | |
| Sector | | Percentage of
Net Assets | |
Equity Securities | |
Consumer Discretionary | | | 10.7 | % |
Consumer Staples | | | 2.3 | |
Energy | | | 8.7 | |
Financials | | | 23.7 | |
Health Care | | | 3.5 | |
Industrials | | | 12.2 | |
Information Technology | | | 14.5 | |
Materials | | | 9.5 | |
Real Estate | | | 7.9 | |
Telecommunication Services | | | 0.7 | |
Utilities | | | 4.9 | |
| | | | |
Total | | | 98.6 | % |
| | | | |
Short-Term Investments | | | 1.0 | |
Other Assets & Liabilities | | | 0.4 | |
| | | | |
Total | | | 100.0 | % |
| | | | |
A sector may be comprised of several industries. For Fund compliance purposes, the Fund may not use the same classification system and these sector classifications are used for financial reporting purposes.
Hartford Small Cap Growth HLS Fund inception 05/02/1994
| | |
| (sub-advised by Wellington Management Company LLP) | | Investment objective – The Fund seeks long-term capital appreciation. |
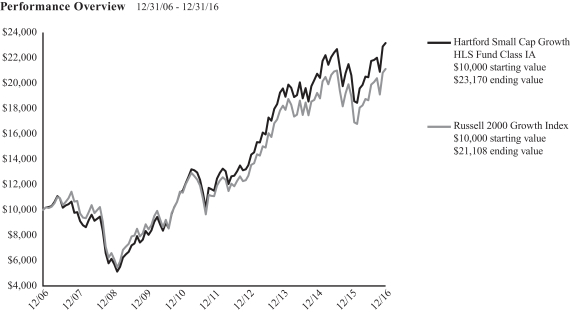
The chart above represents the hypothetical growth of a $10,000 investment in Class IA. Growth results in classes other than Class IA will vary from what is seen above due to differences in the expenses charged to those share classes.
Average Annual Total Return (as of 12/31/16)
| | | | | | | | | | | | |
| | | 1 Year | | | 5 Years | | | 10 Years | |
Small Cap Growth IA | | | 12.37 | % | | | 15.00 | % | | | 8.77 | % |
Small Cap Growth IB | | | 12.08 | % | | | 14.71 | % | | | 8.49 | % |
Russell 2000 Growth Index | | | 11.32 | % | | | 13.74 | % | | | 7.76 | % |
PERFORMANCE DATA QUOTED REPRESENTS PAST PERFORMANCE AND DOES NOT GUARANTEE FUTURE RESULTS. The investment return and principal value of the investment will fluctuate so that investors’ shares, when redeemed, may be worth more or less than their original cost. Current performance may be lower or higher than the performance data quoted. To obtain performance data current to the most recent month-end, please visit our website www.hartfordfunds.com.
Total returns presented above were calculated using the Fund’s net asset value available to shareholders for sale or redemption of Fund shares on December 31, 2016, which may exclude investment transactions as of this date. All share class returns assume the reinvestment of all distributions at net asset value and the deduction of all fund expenses.
Russell 2000 Growth Index is an unmanaged index of those Russell 2000 Index growth companies with higher price-to-book ratios and higher forecasted growth values. The Russell 2000 Index is a broad-based unmanaged index comprised of 2,000 of the smallest U.S.-domiciled company common stocks (on the basis of capitalization) that are traded in the United States on the New York Stock Exchange, NYSE MKT LLC and Nasdaq.
The index is unmanaged, and its results include reinvested dividends and/or distributions, but do not reflect the effect of sales charges, commissions, expenses or taxes.
You cannot invest directly in an index.
As shown in the Fund’s current prospectus dated May 1, 2016, the total annual fund operating expense ratios for Class IA and Class IB were 0.66% and 0.91%, respectively. Actual expenses may be higher. Please see the accompanying Financial Highlights for expense ratios for the year ended December 31, 2016.
Performance information through July 21, 2010 represents performance of the Fund’s previous additional sub-adviser, Hartford Investment Management Company (“HIMCO”). As of July 21, 2010, HIMCO no longer serves as an additional sub-adviser to the Fund.
All investments are subject to risk including the possible loss of principal. For a discussion of the Fund’s risks, please see “A Word about Risk” section in
the “Manager Discussion” section of this report. For more detailed information on the risks associated with an investment in the Fund, please see the prospectus.
The chart and table do not reflect the deductions of taxes, sales charges or other fees which may be applied at the variable life insurance, variable annuity or qualified retirement plan product level. Any such additional sales charges or other fees or expenses would lower the contract’s or plan’s performance.
Effective March 6, 2015, the Fund was closed to new investors until further notice. For more information, please see the Fund’s prospectus.
|
| Hartford Small Cap Growth HLS Fund |
Manager Discussion
December 31, 2016 (Unaudited)
Portfolio Managers
Mammen Chally, CFA
Senior Managing Director and Equity Portfolio Manager
Wellington Management Company LLP
David J. Elliott, CFA
Senior Managing Director, Co-Director, Quantitative Investments and Portfolio Manager
Wellington Management Company LLP
How did the Fund perform during the period?
The Class IA shares of Hartford Small Cap Growth HLS Fund returned 12.37% for the twelve-month period ended December 31, 2016, outperforming the Fund’s benchmark, the Russell 2000 Growth Index, which returned 11.32%. For the same period, the Fund outperformed the 10.64% average return of the Lipper Small-Cap Growth Funds peer group, a group of funds with investment strategies similar to those of the Fund.
Why did the Fund perform this way?
U.S. equities rose over the period, as measured by the S&P 500 Index, notwithstanding significant volatility during the year. Early in the first quarter of 2016, equities plunged and moved in virtual lockstep with the price of oil as fears of a recession and weakness in China weighed on investors’ minds. However, equity markets surged in late February and March as solid economic data, a stabilization in oil prices, and accommodative commentary from the Federal Reserve (Fed) helped to calm the market’s early year jitters. A better-than-feared U.S. corporate earnings season in the second quarter and an encouraging economic backdrop helped sustain the rally. At its June meeting, the Fed left rates unchanged and reduced its U.S. growth and long-run policy rate forecasts, citing mixed U.S. economic data and uncertainty about global economic and financial developments. After plunging in the two trading days following the approval of the U.K.’s exit from the E.U. (Brexit), U.S. equities staged an impressive comeback in the days following.
U.S. equities continued to climb in July, following a solid start to the corporate earnings season and encouraging housing and employment data releases. Stocks were essentially flat in August and September as investors remained focused on the Fed’s actions, specifically on the timing of the next rate increase. A confluence of worries contributed to increased volatility during September, including uncertainty surrounding the U.S. presidential election, tepid economic data, and valuation concerns. Stocks surged following Donald Trump’s victory in the U.S. Presidential election on hopes of increased fiscal stimulus, reduced regulatory restrictions, and lower corporate taxes. Economic data released during the fourth quarter was generally encouraging, as third quarter gross domestic product
(GDP) growth was revised slightly higher and the U.S. housing market continued to display healthy trends. In December, the Fed raised rates by 0.25%, a move that was anticipated by most of the market. It was only the second increase in the last decade.
Equity returns varied by market-cap during the period, as small- and mid-cap equities, as measured by the Russell 2000 and S&P MidCap 400 Indices, outperformed large-cap equities, as measured by the S&P 500 Index.
Ten of the eleven sectors1 in the Russell 2000 Growth Index had positive returns during the period. Materials (+32%), Energy (+31%), and Industrials (+29%) performed best, while Healthcare (-9%) lagged the broader index.
Security selection was the primary driver of the Fund’s outperformance relative to the Russell 2000 Growth Index. Selection was strongest within the Healthcare, Financials, and Consumer Discretionary sectors, and weakest within the Information Technology and Materials sectors. Sector allocation, which is a result of the Fund’s bottom-up security selection process, also contributed positively to relative results. An underweight to Healthcare and overweights to Financials and Energy contributed positively to benchmark-relative performance, while underweights to Industrials and Consumer Discretionary detracted from benchmark-relative performance.
Burlington Stores (Consumer Discretionary), TESARO (Healthcare), and RSP Permian (Energy) were top relative contributors to benchmark-relative results over the period. Burlington Stores, a U.S.-based off-price apparel retailer, saw its share price increase during the period. Though the company is called Burlington Stores, it is still known as Burlington Coat Factory (only 7% of their sales are actually coats). Many investors feared that the company would be overly exposed to the warm winter weather and the stock struggled late in 2015. Burlington Stores dispelled those fears after it reported strong fourth quarter earnings during the first quarter of 2016, which caused the stock to jump. Another top contributor to relative performance was TESARO, a U.S.-based oncology-focused biopharmaceutical company. TESARO’s stock prices surged after the company posted
| 1 | Effective September 1, 2016, a new Real Estate sector was created under the Global Industry Classification Standard (GICS); holdings in this sector were previously classified as Financials. The attribution analysis of the Financials sector includes Real Estate for the period starting January 1, 2016 through August 31, 2016. The attribution analysis of the Real Estate sector is only for the period starting September 1, 2016 through December 31, 2016. |
|
| Hartford Small Cap Growth HLS Fund |
Manager Discussion – (continued)
December 31, 2016 (Unaudited)
positive Phase 3 data for their ovarian cancer drug. Shares of RSP Permian, a U.S.-based oil and gas exploration and production company, rallied as crude oil prices rebounded during the period. Top absolute contributors during the period also included WellCare Health Plans (Healthcare).
The top relative detractors from performance over the period were Acadia Healthcare (Healthcare), Portola Pharmaceuticals (Healthcare), and G-III Apparel (Consumer Discretionary). The top detractor from performance was Acadia Healthcare, an operator of U.S. inpatient behavioral and healthcare services. Acadia’s stock price declined after its acquisition of assets in the U.K. was negatively impacted by Brexit fears. Shares of Portola Pharmaceuticals, a U.S.-based biopharmaceutical company, suffered during the period after the company announced disappointing data for the Phase 3 study of their anti-coagulant Betrixaban. The share price of G-III Apparel, a manufacturer and marketer of a broad range of men’s and women’s apparel to department and specialty stores, went down as a result of questionable capital allocation. We believe they made an overpriced offer for Donna Karen (a division of LVMH) and we eliminated the Fund’s position in G-III Apparel. Novavax (Healthcare) and Ophthotech (Healthcare) were among the top detractors from absolute performance over the period.
Derivatives were not used in a significant manner in the Fund during the period and did not have a material impact on performance during the period.
What is the outlook?
As we enter 2017, we believe the global reflation theme related to expectations around increased fiscal stimulus remains intact as we expect stronger global growth and higher inflation in 2017. Under a Trump administration, we believe there is a reasonable likelihood of corporate and individual tax reform, both of which would be good for reinvestment and consumption. We believe that Trump’s policies are likely to be inflationary and induce a stronger U.S. dollar. We expect that tax cuts will be a centerpiece of the new administration. Corporate tax cuts, including the return of foreign earnings to the U.S. at a lower tax rate, may mean a boost for corporate earnings. Several questions remain on implementation and cost. Another boost to the U.S. economy may come from deregulation in areas such as health care, financial services, and energy drilling, which would increase business confidence, lower the cost of doing business, and increase incentives to hire more workers.
However, a risk under a Trump presidency is that the U.S. may end up with trade tensions, which would be a hindrance for the U.S. economy, as well as the global economy. There is also the risk of increased geopolitical uncertainty. The reaction of the rest of the world to Trump’s policies regarding trade and other relationships remains a wild card until we see his policies unfold.
Globally, we are encouraged by data coming out of Europe and believe nominal GDP growth and earnings will pick up given the positive economic data surprises in recent months and weakness of the euro. However, we believe the French election will be a near-term risk, as will the negotiations surrounding Brexit, which will likely heat up in the first half of the year.
As a result of bottom-up stock selection, the Fund’s top overweights at the end of the period were to the Financials and Energy sectors. Real Estate and Healthcare represented the largest underweights relative to the Russell 2000 Growth Index at the end of the period.
A Word about Risk
All investments are subject to risk, including the possible loss of principal. There is no guarantee the Fund will achieve its stated objective. The Fund’s share price may fluctuate due to market risk and/or security selections that may underperform the market or relevant benchmarks. If the Fund’s strategy for allocating assets among different asset classes and/or portfolio management teams does not work as intended, the Fund may not achieve its objective or may underperform other funds with similar investment strategies. Small-cap securities can have greater risk and volatility than large-cap securities. Foreign investments can be riskier than U.S. investments due to the adverse effects of currency exchange rates, differences in market structure and liquidity, as well as political and economic developments in foreign countries and regions. Growth investing may go out of favor, which may cause the Fund to underperform the broader stock market.
Composition by Sector
as of December 31, 2016
| | | | |
| Sector | | Percentage of Net Assets | |
Equity Securities | | | | |
Consumer Discretionary | | | 15.2 | % |
Consumer Staples | | | 3.0 | |
Energy | | | 2.1 | |
Financials | | | 11.6 | |
Health Care | | | 18.6 | |
Industrials | | | 16.4 | |
Information Technology | | | 24.3 | |
Materials | | | 4.0 | |
Real Estate | | | 3.3 | |
Telecommunication Services | | | 0.6 | |
Utilities | | | 0.1 | |
| | | | |
Total | | | 99.2 | % |
| | | | |
Short-Term Investments | | | 1.1 | |
Other Assets & Liabilities | | | (0.3 | ) |
| | | | |
Total | | | 100.0 | % |
| | | | |
A sector may be comprised of several industries. For Fund compliance purposes, the Fund may not use the same classification system and these sector classifications are used for financial reporting purposes.
Hartford Small Company HLS Fund inception 08/09/1996
| | |
| (sub-advised by Wellington Management Company LLP) | | Investment objective – The Fund seeks growth of capital. |
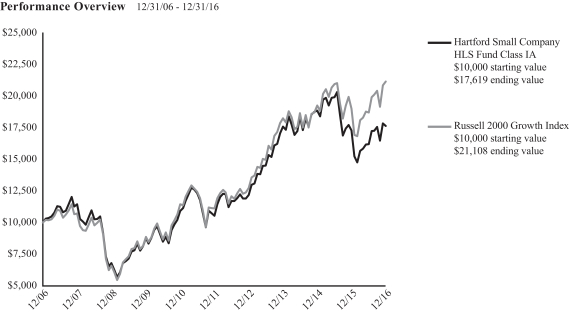
The chart above represents the hypothetical growth of a $10,000 investment in Class IA. Growth results in classes other than Class IA will vary from what is seen above due to differences in the expenses charged to those share classes.
Average Annual Total Return (as of 12/31/16)
| | | | | | | | | | | | |
| | | 1 Year | | | 5 Years | | | 10 Years | |
Small Company IA | | | 2.04% | | | | 10.86% | | | | 5.83% | |
Small Company IB | | | 1.81% | | | | 10.59% | | | | 5.57% | |
Russell 2000 Growth Index | | | 11.32% | | | | 13.74% | | | | 7.76% | |
PERFORMANCE DATA QUOTED REPRESENTS PAST PERFORMANCE AND DOES NOT GUARANTEE FUTURE RESULTS. The investment return and principal value of the investment will fluctuate so that investors’ shares, when redeemed, may be worth more or less than their original cost. Current performance may be lower or higher than the performance data quoted. To obtain performance data current to the most recent month-end, please visit our website www.hartfordfunds.com.
Total returns presented above were calculated using the Fund’s net asset value available to shareholders for sale or redemption of Fund shares on December 31, 2016, which may exclude investment transactions as of this date. All share class returns assume the reinvestment of all distributions at net asset value and the deduction of all fund expenses.
Russell 2000 Growth Index is an unmanaged index of those Russell 2000 Index growth companies with higher price-to-book ratios and higher forecasted growth values. The Russell 2000 Index is a broad-based unmanaged index comprised of 2,000 of the smallest U.S.-domiciled company common stocks (on the basis of capitalization) that are traded in the United States on the New York Stock Exchange, NYSE MKT LLC and Nasdaq.
The index is unmanaged, and its results include reinvested dividends and/or distributions, but do not reflect the effect of sales charges, commissions, expenses or taxes.
You cannot invest directly in an index.
As shown in the Fund’s current prospectus dated May 1, 2016, the total annual fund operating expense ratios for Class IA and Class IB were 0.72% and 0.97%,
respectively. Actual expenses may be higher. Please see the accompanying Financial Highlights for expense ratios for the year ended December 31, 2016.
Performance information through July 21, 2010 represents performance of the Fund’s previous additional sub-adviser, Hartford Investment Management Company (“HIMCO”). As of July 21, 2010, HIMCO no longer serves as an additional sub-adviser to the Fund.
All investments are subject to risk including the possible loss of principal. For a discussion of the Fund’s risks, please see “A Word about Risk” section in the “Manager Discussion” section of this report. For more detailed information on the risks associated with an investment in the Fund, please see the prospectus.
The chart and table do not reflect the deductions of taxes, sales charges or other fees which may be applied at the variable life insurance, variable annuity or qualified retirement plan product level. Any such additional sales charges or other fees or expenses would lower the contract’s or plan’s performance.
Effective June 26, 2015, the Fund was closed to new investors until further notice. For more information, please see the Fund’s prospectus.
|
| Hartford Small Company HLS Fund |
Manager Discussion
December 31, 2016 (Unaudited)
Portfolio Managers
Steven C. Angeli, CFA
Senior Managing Director and Equity Portfolio Manager
Wellington Management Company LLP
Mammen Chally, CFA
Senior Managing Director and Equity Portfolio Manager
Wellington Management Company LLP
How did the Fund perform during the period?
The Class IA shares of Hartford Small Company HLS Fund returned 2.04% for the twelve-month period ended December 31, 2016, underperforming the Fund’s benchmark, the Russell 2000 Growth Index, which returned 11.32% for the same period. The Fund also underperformed the 10.64% average return of the Lipper Small-Cap Growth Funds peer group, a group of funds with investment strategies similar to those of the Fund.
Why did the Fund perform this way?
U.S. equities rose over the period, as measured by the S&P 500 Index, notwithstanding significant volatility during the year. Early in the first quarter of 2016, equities plunged and moved in virtual lockstep with the price of oil as fears of a recession and weakness in China weighed on investors’ minds. However, equity markets surged in late February and March as solid economic data, a stabilization in oil prices, and accommodative commentary from the Federal Reserve (Fed) helped to calm the market’s early year jitters. A better-than-feared U.S. corporate earnings season in the second quarter and an encouraging economic backdrop helped sustain the rally. At its June meeting, the Fed left rates unchanged and reduced its U.S. growth and long-run policy rate forecasts, citing mixed U.S. economic data and uncertainty about global economic and financial developments. After plunging in the two trading days following the approval of the U.K.’s exit from the E.U. (Brexit), U.S. equities staged an impressive comeback in the days following.
U.S. equities continued to climb in July, following a solid start to the corporate earnings season and encouraging housing and employment data releases. Stocks were essentially flat in August and September as investors remained focused on the Fed’s actions, specifically on the timing of the next rate increase. A confluence of worries contributed to increased volatility during September, including uncertainty surrounding the U.S. presidential election, tepid economic data, and valuation concerns. Stocks surged following Donald Trump’s victory in the U.S. Presidential election on hopes of increased fiscal stimulus, reduced regulatory restrictions, and lower corporate taxes. Economic data released during the fourth quarter was generally encouraging, as third quarter gross domestic product (GDP) growth was revised slightly higher and the U.S. housing
market continued to display healthy trends. In December, the Fed raised rates by 0.25%, a move that was anticipated by most of the market. It was only the second increase in the last decade.
Equity returns varied by market-cap during the period, as small- and mid-cap equities, as measured by the Russell 2000 and S&P MidCap 400 Indices, outperformed large-cap equities, as measured by the S&P 500 Index. Ten of the eleven sectors1 in the Russell 2000 Growth Index had positive returns during the period. Materials (+32%), Energy (+31%), and Industrials (+29%) performed the best, while Healthcare (-9%) was the only sector that fell.
Stock selection was the main driver of underperformance relative to the Russell 2000 Growth Index, primarily due to weak selection within the Information Technology, Materials, and Industrials sectors. This was partially offset by stronger selection in the Energy sector. Sector allocation, which is the result of bottom-up stock selection, contributed positively to relative returns, primarily due to an underweight to Healthcare and an overweight to the Financials sector. This more than offset the negative impacts of underweight allocations to the Telecommunication Services and Industrials sectors.
Top detractors from returns relative to the Russell 2000 Growth Index during the period included Acadia Healthcare (Healthcare), SunPower (Information Technology), and KapStone Paper (Materials). Acadia Healthcare, an operator of U.S. inpatient behavioral and healthcare services, saw its stock price decline after its acquisition of assets in the U.K. was negatively impacted by Brexit. Shares of SunPower, a U.S.-based solar energy company that designs and manufactures crystalline silicon photovoltaic cells, roof tiles, and solar panels, fell during the period on concerns that 2017 earnings will decline as the renewal of investment tax credits late in 2015 has elongated project demand into future years. Shares of KapStone Paper, a U.S.-based producer of paper and corrugated packaging products, fell as the company faced difficult conditions from price erosion, a strong U.S. dollar, and higher than planned maintenance costs. Advisory Board (Industrials) was a top detractor from absolute performance.
| 1 | Effective September 1, 2016, a new Real Estate sector was created under the Global Industry Classification Standard (GICS); holdings in this sector were previously classified as Financials. The attribution analysis of the Financials sector includes Real Estate for the period starting January 1, 2016 through August 31, 2016. The attribution analysis of the Real Estate sector is only for the period starting September 1, 2016 through December 31, 2016. |
|
| Hartford Small Company HLS Fund |
Manager Discussion – (continued)
December 31, 2016 (Unaudited)
Top contributors to performance relative to the Russell 2000 Growth Index during the period included TESARO (Healthcare), Headwaters (Materials), and United Community Bank (Financials). The stock price of TESARO, a U.S.-based oncology-focused biopharmaceutical company, rose after the company posted positive phase 3 data for their ovarian cancer drug. Headwaters, a U.S.-based producer of light building products and fly ash, saw its stock price rise as markets anticipated an increase in infrastructure spending under the new Republican controlled government. Shares of United Community Bank, a bank holding company with operations primarily in the Southeastern U.S., rose after it reported stronger than expected third quarter earnings due to higher than expected mortgage fees and loan growth. Knight Transportation (Industrials) was a top absolute contributor during the period.
Derivatives were not used in a significant manner in the Fund during the period and did not have a material impact on performance during the period.
What is the outlook?
As we look forward into 2017, we believe tax reform, reduced regulation, increased investment spending, and revised trade rules are all likely under the Trump administration. The new Republican majority across both the Senate and House of Representatives should reduce legislative gridlock and facilitate implementation of these policies. These policies can reasonably be expected to support U.S. growth and interest rates.
While we retain conviction in the performance potential of the Fund’s existing holdings with structural growth tailwinds, we have also begun to hunt for new re-emerging growth opportunities within sectors including Financials and Industrials. Financials, where the Fund has added over the course of 2016 in anticipation of rate normalization, are likely to continue to benefit from both lower regulation and increased interest rates. Hotels are another industry that should benefit from broad economic acceleration and recently appear to have experienced a turning point in unit revenue. Finally, we believe domestically-oriented Industrials leveraged to the economic cycle are well positioned going into 2017.
As a result of our bottom-up, stock-by-stock investment decisions, the Fund ended the period most overweight the Information Technology, Financials, and Energy sectors relative to the Russell 2000 Growth Index. The Fund ended the period most underweight the Healthcare, Consumer Staples, and Materials sectors relative to the Russell 2000 Growth Index.
A Word about Risk
All investments are subject to risk, including the possible loss of principal. There is no guarantee the Fund will achieve its stated objective. The Fund’s share price may fluctuate due to market risk and/or security selections that may underperform the market or relevant benchmarks. If the Fund’s strategy for allocating assets among different asset classes and/or portfolio management teams does not work as intended, the Fund may not achieve its objective or may underperform other funds with similar investment strategies. Small-cap securities can have greater risk and volatility than large-cap securities. Foreign investments can be riskier than U.S. investments due to the adverse effects of currency exchange rates, differences in market structure and liquidity, as well as political and economic developments in foreign countries and regions. The Fund may have high portfolio turnover, which could increase the Fund’s transaction costs. Growth investing may go out of favor, which may cause the Fund to underperform the broader stock market.
Composition by Sector
as of December 31, 2016
| | | | |
| Sector | | Percentage of Net Assets | |
Equity Securities | | | | |
Consumer Discretionary | | | 14.8 | % |
Consumer Staples | | | 0.4 | |
Energy | | | 3.2 | |
Financials | | | 11.0 | |
Health Care | | | 15.7 | |
Industrials | | | 16.8 | |
Information Technology | | | 30.1 | |
Materials | | | 2.8 | |
Real Estate | | | 3.8 | |
Telecommunication Services | | | 0.2 | |
| | | | |
Total | | | 98.8 | % |
| | | | |
Short-Term Investments | | | 1.0 | |
Other Assets & Liabilities | | | 0.2 | |
| | | | |
Total | | | 100.0 | % |
| | | | |
A sector may be comprised of several industries. For Fund compliance purposes, the Fund may not use the same classification system and these sector classifications are used for financial reporting purposes.
Hartford Small/Mid Cap Equity HLS Fund inception 05/01/1998
| | |
| (sub-advised by Wellington Management Company LLP) | | Investment objective – The Fund seeks long-term growth of capital. |
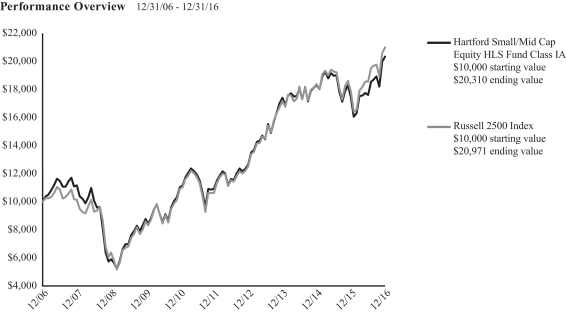
The chart above represents the hypothetical growth of a $10,000 investment in Class IA. Growth results in classes other than Class IA will vary from what is seen above due to differences in the expenses charged to those share classes.
Average Annual Total Return (as of 12/31/16)
| | | | | | | | | | | | |
| | | 1 Year | | | 5 Years | | | 10 Years | |
Small/Mid Cap Equity IA | | | 16.48% | | | | 13.22% | | | | 7.34% | |
Small/Mid Cap Equity IB | | | 16.33% | | | | 12.96% | | | | 7.09% | |
Russell 2500 Index | | | 17.59% | | | | 14.54% | | | | 7.69% | |
PERFORMANCE DATA QUOTED REPRESENTS PAST PERFORMANCE AND DOES NOT GUARANTEE FUTURE RESULTS. The investment return and principal value of the investment will fluctuate so that investors’ shares, when redeemed, may be worth more or less than their original cost. Current performance may be lower or higher than the performance data quoted. To obtain performance data current to the most recent month-end, please visit our website www.hartfordfunds.com.
Total returns presented above were calculated using the Fund’s net asset value available to shareholders for sale or redemption of Fund shares on December 31, 2016, which may exclude investment transactions as of this date. All share class returns assume the reinvestment of all distributions at net asset value and the deduction of all fund expenses.
Performance information through June 4, 2012 represents performance of the Fund’s previous sub-adviser, Hartford Investment Management Company (“HIMCO”). As of June 4, 2012, HIMCO no longer served as the sub-adviser to the Fund.
Includes the Fund’s performance when it invested, prior to February 1, 2010, at least 80% of its assets in common stocks of mid-capitalization companies.
Class IB shares commenced on March 31, 2008. Class IB shares performance prior to that date reflects Class IA shares performance adjusted to reflect the 12b-1 fee of 0.25% applicable to Class IB shares. The performance after such date reflects actual Class IB shares performance.
Russell 2500 Index measures the performance of the small to mid-cap segment of the U.S. equity universe, commonly referred to as “smid” cap. The Russell 2500 Index is a subset of the Russell 3000 Index and includes approximately 2,500 of the
smallest securities based on a combination of their market capitalization and current index membership.
The index is unmanaged, and its results include reinvested dividends and/or distributions, but do not reflect the effect of sales charges, commissions, expenses or taxes.
You cannot invest directly in an index.
As shown in the Fund’s current prospectus dated May 1, 2016, the total annual fund operating expense ratios for Class IA and Class IB were 0.96% and 1.21%, respectively. Actual expenses may be higher. Please see the accompanying Financial Highlights for expense ratios for the year ended December 31, 2016.
All investments are subject to risk including the possible loss of principal. For a discussion of the Fund’s risks, please see “A Word about Risk” section in the “Manager Discussion” section of this report. For more detailed information on the risks associated with an investment in the Fund, please see the prospectus.
The chart and table do not reflect the deductions of taxes, sales charges or other fees which may be applied at the variable life insurance, variable annuity or qualified retirement plan product level. Any such additional sales charges or other fees or expenses would lower the contract’s or plan’s performance.
|
| Hartford Small/Mid Cap Equity HLS Fund |
Manager Discussion
December 31, 2016 (Unaudited)
Portfolio Manager
David J. Elliott, CFA
Senior Managing Director, Co-Director, Quantitative Investments and Portfolio Manager
Wellington Management Company LLP
How did the Fund perform during the period?
The Class IA shares of Hartford Small/Mid Cap Equity HLS Fund returned 16.48% for the twelve-month period ended December 31, 2016, underperforming the Fund’s benchmark, the Russell 2500 Index, which returned 17.59%. For the same period, the Fund also underperformed the 20.56% average return of the Lipper Small-Cap Core Funds peer group, a group of funds with investment strategies similar to those of the Fund.
Why did the Fund perform this way?
U.S. equities rose over the period, as measured by the S&P 500 Index, notwithstanding significant volatility during the year. Early in the first quarter of 2016, equities plunged and moved in virtual lockstep with the price of oil as fears of a recession and weakness in China weighed on investors’ minds. However, equity markets surged in late February and March as solid economic data, a stabilization in oil prices, and accommodative commentary from the Federal Reserve (Fed) helped to calm the market’s early year jitters. A better-than-feared U.S. corporate earnings season in the second quarter and an encouraging economic backdrop helped sustain the rally. At its June meeting, the Fed left rates unchanged and reduced its U.S. growth and long-run policy rate forecasts, citing mixed U.S. economic data and uncertainty about global economic and financial developments. After plunging in the two trading days following the approval of the U.K.’s exit from the E.U. (Brexit), U.S. equities staged an impressive comeback in the days following.
U.S. equities continued to climb in July, following a solid start to the corporate earnings season and encouraging housing and employment data releases. Stocks were essentially flat in August and September as investors remained focused on the Fed’s actions, specifically on the timing of the next rate increase. A confluence of worries contributed to increased volatility during September, including uncertainty surrounding the U.S. presidential election, tepid economic data, and valuation concerns. Stocks surged following Donald Trump’s victory in the U.S. Presidential election on hopes of increased fiscal stimulus, reduced regulatory restrictions, and lower corporate taxes. Economic data released during the fourth quarter was generally encouraging, as third quarter gross domestic product (GDP) growth was revised slightly higher and the U.S. housing market continued to display healthy trends. In December, the Fed raised rates by 0.25%, a move that was anticipated by most of the market. It was only the second increase in the last decade.
Equity returns varied by market-cap during the period, as small- and mid-cap equities, as measured by the Russell 2000 and S&P MidCap 400 Indices, outperformed large-cap equities, as measured by the S&P 500 Index, though all three groups posted positive returns during the twelve-month period. Nine of the eleven sectors1 in the Russell 2500 Index posted positive absolute returns during the period. Financials (+33%), Materials (+32%), and Energy (+29%) rose the most while Healthcare (-5%) and Real Estate (-3%) posted negative returns.
The Fund’s underperformance relative to the Russell 2500 Index was driven by weak stock selection, particularly in the Energy, Financials, and Real Estate sectors. This was partially offset by stronger selection in Information Technology and Materials. Sector allocation, a product of the Fund’s quantitative stock-selection process, contributed positively to relative returns during the period. An underweight to Real Estate and overweights to Healthcare and Energy contributed positively to performance relative to the Russell 2500 Index, more than offsetting the negative impact from the Fund’s underweight exposure to Utilities.
The largest detractors from performance relative to the Russell 2500 Index during the period were Jazz Pharmaceuticals (Healthcare), Valero Energy (Energy), and Quality Systems (Healthcare). Shares of Jazz Pharmaceuticals declined as earnings growth slowed from higher Research and Development (R&D) and administrative expenses, higher net interest expense and the impact of global supply constraints. The stock price of U.S.-based Valero Energy, an independent oil refiner, declined during the period as profit margins across the oil refining industry have tightened considerably relative to their 2015 highs. A decline in operating margins resulted in reduced year-over-year revenue and income during the first half of the year. Shares of Quality Systems slumped as the company reported disappointing earnings from continued declining sales of soft licenses and hardware. Jones Lang LaSalle (Real Estate) was among the top absolute detractors during the period.
The largest contributors to performance relative to the Russell 2500 Index during the period were Mentor Graphics (Information Technology), Endurance Specialty (Financials), and Wix.com (Information Technology). Shares of Mentor Graphics jumped as Siemens AG announced plans to acquire the automation and industrial software provider. Shares of Endurance Specialty surged
| 1 | Effective September 1, 2016, a new Real Estate sector was created under the Global Industry Classification Standard (GICS); holdings in this sector were previously classified as Financials. The attribution analysis of the Financials sector includes Real Estate for the period starting January 1, 2016 through August 31, 2016. The attribution analysis of the Real Estate sector is only for the period starting September 1, 2016 through December 31, 2016. |
|
| Hartford Small/Mid Cap Equity HLS Fund |
Manager Discussion – (continued)
December 31, 2016 (Unaudited)
after Sompo Japan announced plans to acquire the U.S. insurer. Shares of Wix.com and Domino’s Pizza (Consumer Discretionary) were among the top absolute contributors to performance during the period.
Derivatives were not used in a significant manner in the Fund during the period and did not have a material impact on performance during the period.
What is the outlook?
We seek to add value by utilizing Wellington Management’s proprietary quantitative research and investment tools in a highly disciplined framework. We focus on stock selection as the key driver of returns and use quantitative portfolio optimization techniques to seek to minimize unintended and uncompensated risks. Based on individual stock decisions, the Fund ended the period most overweight the Telecommunication Services, Healthcare and Energy sectors and most underweight the Materials, Financials and Real Estate sectors, relative to the Russell 2500 Index.
A Word about Risk
All investments are subject to risk, including the possible loss of principal. There is no guarantee the Fund will achieve its stated objective. The Fund’s share price may fluctuate due to market risk and/or security selections that may underperform the market or relevant benchmarks. Small- and mid-cap securities can have greater risk and volatility than large-cap securities. Foreign investments can be riskier than U.S. investments due to the adverse effects of currency exchange rates, differences in market structure and liquidity, as well as political and economic developments in foreign countries and regions. The Fund may have high portfolio turnover, which could increase the Fund’s transaction costs.
Composition by Sector
as of December 31, 2016
| | | | |
| Sector | | Percentage of
Net Assets | |
Equity Securities | | | | |
Consumer Discretionary | | | 12.4 | % |
Consumer Staples | | | 3.9 | |
Energy | | | 5.6 | |
Financials | | | 16.1 | |
Health Care | | | 11.3 | |
Industrials | | | 17.9 | |
Information Technology | | | 13.8 | |
Materials | | | 5.2 | |
Real Estate | | | 9.1 | |
Telecommunication Services | | | 0.8 | |
Utilities | | | 2.5 | |
| | | | |
Total | | | 98.6 | % |
| | | | |
Short-Term Investments | | | 2.8 | |
Other Assets & Liabilities | | | (1.4 | ) |
| | | | |
Total | | | 100.0 | % |
| | | | |
A sector may be comprised of several industries. For Fund compliance purposes, the Fund may not use the same classification system and these sector classifications are used for financial reporting purposes.
Hartford Stock HLS Fund inception 08/31/1977
| | |
| (sub-advised by Wellington Management Company LLP) | | Investment objective – The Fund seeks long-term growth of capital. |
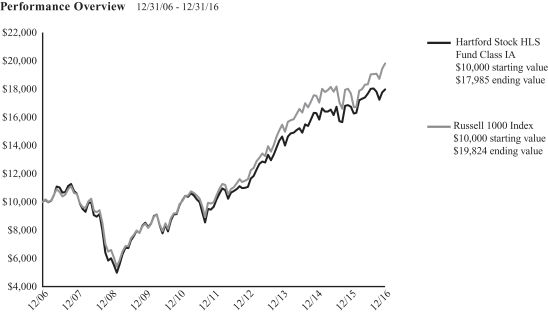
The chart above represents the hypothetical growth of a $10,000 investment in Class IA. Growth results in classes other than Class IA will vary from what is seen above due to differences in the expenses charged to those share classes.
Average Annual Total Return (as of 12/31/16)
| | | | | | | | | | | | |
| | | 1 Year | | | 5 Years | | | 10 Years | |
Stock IA | | | 7.41% | | | | 13.19% | | | | 6.05% | |
Stock IB | | | 7.14% | | | | 12.91% | | | | 5.78% | |
Russell 1000 Index | | | 12.05% | | | | 14.69% | | | | 7.08% | |
PERFORMANCE DATA QUOTED REPRESENTS PAST PERFORMANCE AND DOES NOT GUARANTEE FUTURE RESULTS. The investment return and principal value of the investment will fluctuate so that investors’ shares, when redeemed, may be worth more or less than their original cost. Current performance may be lower or higher than the performance data quoted. To obtain performance data current to the most recent month-end, please visit our website www.hartfordfunds.com.
Total returns presented above were calculated using the Fund’s net asset value available to shareholders for sale or redemption of Fund shares on December 31, 2016, which may exclude investment transactions as of this date. All share class returns assume the reinvestment of all distributions at net asset value and the deduction of all fund expenses.
Russell 1000 Index is an unmanaged index that measures the performance of the 1,000 largest companies in the Russell 3000 Index, which measures the performance of the 3,000 largest U.S. companies, based on total market capitalizations.
The index is unmanaged, and its results include reinvested dividends and/or distributions, but do not reflect the effect of sales charges, commissions, expenses or taxes.
You cannot invest directly in an index.
As shown in the Fund’s current prospectus dated May 1, 2016, the total annual fund operating expense ratios for Class IA and Class IB were 0.51% and 0.76%, respectively. Actual expenses may be higher. Please see the accompanying Financial Highlights for expense ratios for the year ended December 31, 2016.
All investments are subject to risk including the possible loss of principal. For a discussion of the Fund’s risks, please see “A Word about Risk” section in the
“Manager Discussion” section of this report. For more detailed information on the risks associated with an investment in the Fund, please see the prospectus.
The chart and table do not reflect the deductions of taxes, sales charges or other fees which may be applied at the variable life insurance, variable annuity or qualified retirement plan product level. Any such additional sales charges or other fees or expenses would lower the contract’s or plan’s performance.
Manager Discussion
December 31, 2016 (Unaudited)
Portfolio Manager
Donald J. Kilbride
Senior Managing Director and Equity Portfolio Manager
Wellington Management Company LLP
How did the Fund perform during the period?
The Class IA shares of Hartford Stock HLS Fund returned 7.41% for the twelve-month period ended December 31, 2016, underperforming the Russell 1000 Index, which returned 12.05% for the same period. The Fund also underperformed the 10.33% average return of the Lipper Large-Cap Core Funds peer group, a group of funds with investment strategies similar to those of the Fund.
Why did the Fund perform this way?
U.S. equities rose over the period, as measured by the S&P 500 Index, notwithstanding significant volatility during the year. Early in the first quarter of 2016, equities plunged and moved in virtual lockstep with the price of oil as fears of a recession and weakness in China weighed on investors’ minds. However, equity markets surged in late February and March as solid economic data, a stabilization in oil prices, and accommodative commentary from the Federal Reserve (Fed) helped to calm the market’s early year jitters. A better-than-feared U.S. corporate earnings season in the second quarter and an encouraging economic backdrop helped sustain the rally. At its June meeting, the Federal Reserve (Fed) left rates unchanged and reduced its U.S. growth and long-run policy rate forecasts, citing mixed U.S. economic data and uncertainty about global economic and financial developments. After plunging in the two trading days following the approval of the U.K.’s exit from the E.U. (Brexit), U.S. equities staged an impressive comeback in the days following.
U.S. equities continued to climb in July, following a solid start to the corporate earnings season and encouraging housing and employment data releases. Stocks were essentially flat in August and September as investors remained focused on the Fed’s actions, specifically on the timing of the next rate increase. A confluence of worries contributed to increased volatility during September, including uncertainty surrounding the U.S. presidential election, tepid economic data, and valuation concerns. Stocks surged following Donald Trump’s victory in the U.S. Presidential election on hopes of increased fiscal stimulus, reduced regulatory restrictions, and lower corporate taxes. Economic data released during the fourth quarter was generally encouraging, as third quarter gross domestic product (GDP) growth was revised slightly higher and the U.S. housing market continued to display healthy trends. In December, the Fed raised rates by 0.25%, a move that was anticipated by most of the market. It was only the second increase in the last decade.
Equity returns varied by market-cap during the period, as small- and mid-cap equities, as measured by the Russell 2000 and S&P MidCap 400 Indices, outperformed large-cap equities, as measured by the S&P 500 Index. During the twelve-month period, nine of the eleven sectors1 within the Russell 1000 Index rose, led by Energy (+27%), Telecommunication Services (+24%), and Financials (+23%). Real Estate (+6%) and Healthcare (-3%) lagged on a relative basis.
The Fund’s underperformance versus the Russell 1000 Index was primarily driven by poor security selection within Consumer Discretionary, Consumer Staples, and Financials, which was partially offset by stronger selection within Healthcare and Industrials. Sector allocation, a residual of the bottom-up stock selection process, detracted from benchmark-relative returns due primarily to overweight allocations to Consumer Staples and Healthcare and an underweight allocation to Energy. This was partially offset by an overweight to the Industrials sector, which contributed positively to performance.
Stocks that detracted the most from returns relative to the Russell 1000 Index during the period were Nike (Consumer Discretionary), Cardinal Health (Healthcare), and McKesson Corporation (Healthcare). Shares of Nike, a U.S.-based sporting apparel and equipment company, fell during the period due to a back-up of inventory that they were dealing with due to the Sports Authority bankruptcy. We believe this is a short-term issue and we added to the position. Shares of Cardinal Health, a U.S.-based distributor of pharmaceuticals, fell as investors worried about a slowdown in generic pricing. Shares of McKesson Corporation, a U.S.-based health care supply provider, also fell over the period due to concerns about drug price pressure and an increase in competitive pricing within the independent pharmacy space.
Top contributors to performance relative to the Russell 1000 Index during the period included Union Pacific (Industrials), UnitedHealth Group (Healthcare), and PNC Financial (Financials). Shares of Union Pacific, a U.S.-based freight hauling railroad, rose after the company announced stronger-than-expected earnings results and raised its outlook on the volume the company expects to transport. Shares of UnitedHealth Group, a U.S.-based health care benefits and services provider, rose during the period as the company continued to execute well and exceed consensus revenue and earnings expectations. Shares of PNC Financial, a U.S.-based diversified financial services
| 1 | Effective September 1, 2016, a new Real Estate sector was created under the Global Industry Classification Standard (GICS); holdings in this sector were previously classified as Financials. The attribution analysis of the Financials sector includes Real Estate for the period starting January 1, 2016 through August 31, 2016. The attribution analysis of the Real Estate sector is only for the period starting September 1, 2016 through December 31, 2016. |
Manager Discussion – (continued)
December 31, 2016 (Unaudited)
company, rose following the election of Donald Trump as investors believed Trump’s incoming administration would decrease regulation in the Financials sector. United Parcel Services (Industrials) also contributed positively to performance on an absolute basis.
Derivatives were not used in a significant manner in the Fund during the period and did not have a material impact on performance during the period.
What is the outlook?
We remain mindful of the global backdrop: tepid growth, heavy government indebtedness, growing geopolitical instability, and a growing absence of global economic cooperation. This can all certainly change, but we believe it’s unlikely to in a timeframe that is consistent with the markets’ highly bullish response. Indeed, we believe the only thing harder than coordinating policy in Washington D.C., is coordinating policy globally.
We remain careful, but not dogmatic. For example, we think it is likely government regulation of the financial services industry will moderate. That, combined with rising rates, should create a much more investable backdrop for our approach in the banking sector. To be clear, we have not (and will not) rush gleefully into a sector on the promise of a better day driven by government policy. But, we will be far more open to the question of investing in those companies where we see a new narrative on dividend growth.
Ultimately, our goal remains unchanged. That is, to look for investments in companies where we have high confidence in long term dividend growth. Indeed, changes in market environment are expected and perhaps inevitable. But our strategy for seeking long term wealth creation has not changed.
At the end of the period, the Fund’s bottom-up investment approach resulted in overweight exposures to Consumer Staples, Industrials, and Healthcare. The Fund’s largest underweights relative to the Russell 1000 Index were to Information Technology, Financials, and Energy.
A Word about Risk
All investments are subject to risk, including the possible loss of principal. There is no guarantee the Fund will achieve its stated objective. The Fund’s share price may fluctuate due to market risk and/or security selections that may underperform the market or relevant benchmarks. Foreign investments can be riskier than U.S. investments due to the adverse effects of currency exchange rates, differences in market structure and liquidity, as well as political and economic developments in foreign countries and regions.
Composition by Sector
as of December 31, 2016
| | | | |
| Sector | | Percentage of Net Assets | |
Equity Securities | | | | |
Consumer Discretionary | | | 13.8 | % |
Consumer Staples | | | 18.0 | |
Energy | | | 4.1 | |
Financials | | | 10.7 | |
Health Care | | | 16.8 | |
Industrials | | | 16.9 | |
Information Technology | | | 11.2 | |
Materials | | | 3.4 | |
Real Estate | | | 3.9 | |
| | | | |
Total | | | 98.8 | % |
| | | | |
Short-Term Investments | | | 1.6 | |
Other Assets & Liabilities | | | (0.4 | ) |
| | | | |
Total | | | 100.0 | % |
| | | | |
A sector may be comprised of several industries. For Fund compliance purposes, the Fund may not use the same classification system and these sector classifications are used for financial reporting purposes.
Hartford Total Return Bond HLS Fund inception 08/31/1977
| | |
| (sub-advised by Wellington Management Company LLP) | | Investment objective – The Fund seeks a competitive total return, with income as a secondary objective. |
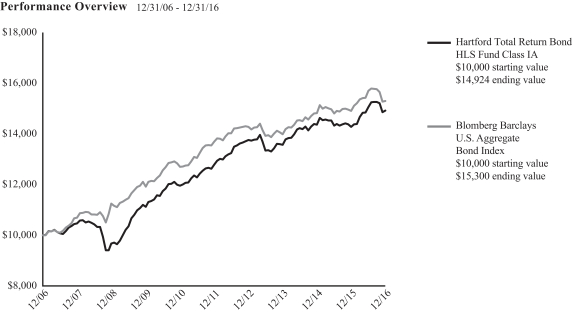
The chart above represents the hypothetical growth of a $10,000 investment in Class IA. Growth results in classes other than Class IA will vary from what is seen above due to differences in the expenses charged to those share classes.
Average Annual Total Return (as of 12/31/16)
| | | | | | | | | | | | |
| | | 1 Year | | | 5 Years | | | 10 Years | |
Total Return Bond IA | | | 4.49% | | | | 3.13% | | | | 4.09% | |
Total Return Bond IB | | | 4.22% | | | | 2.88% | | | | 3.83% | |
Bloomberg Barclays U.S. Aggregate Bond Index | | | 2.65% | | | | 2.23% | | | | 4.34% | |
PERFORMANCE DATA QUOTED REPRESENTS PAST PERFORMANCE AND DOES NOT GUARANTEE FUTURE RESULTS. The investment return and principal value of the investment will fluctuate so that investors’ shares, when redeemed, may be worth more or less than their original cost. Current performance may be lower or higher than the performance data quoted. To obtain performance data current to the most recent month-end, please visit our website www.hartfordfunds.com.
Total returns presented above were calculated using the Fund’s net asset value available to shareholders for sale or redemption of Fund shares on December 31, 2016, which may exclude investment transactions as of this date. All share class returns assume the reinvestment of all distributions at net asset value and the deduction of all fund expenses.
Performance information through March 5, 2012 represents performance of the Fund’s previous sub-adviser, Hartford Investment Management Company (“HIMCO”). As of March 5, 2012, HIMCO no longer served as the sub-adviser to the Fund.
Bloomberg Barclays U.S. Aggregate Bond Index is an unmanaged index and is composed of securities that are SEC-registered, taxable, and dollar denominated. The index covers the U.S. investment grade fixed rate bond market, with index components for government and corporate securities, mortgage pass-through securities, and asset-backed securities. These major sectors are subdivided into more specific indices that are calculated and reported on a regular basis.
On August 24, 2016, Bloomberg L.P. acquired Barclays Risk Analytics and Index Solutions Ltd. from Barclays PLC. As a result of this acquisition, the Barclays indices have been rebranded as Bloomberg Barclays indices.
The index is unmanaged, and its results include reinvested dividends and/or distributions, but do not reflect the effect of sales charges, commissions, expenses or taxes.
You cannot invest directly in an index.
As shown in the Fund’s current prospectus dated May 1, 2016, the total annual fund operating expense ratios for Class IA and Class IB were 0.52% and 0.77%, respectively. Actual expenses may be higher. Please see the accompanying Financial Highlights for expense ratios for the year ended December 31, 2016.
All investments are subject to risk including the possible loss of principal. For a discussion of the Fund’s risks, please see “A Word about Risk” section in the “Manager Discussion” section of this report. For more detailed information on the risks associated with an investment in the Fund, please see the prospectus.
The chart and table do not reflect the deductions of taxes, sales charges or other fees which may be applied at the variable life insurance, variable annuity or qualified retirement plan product level. Any such additional sales charges or other fees or expenses would lower the contract’s or plan’s performance.
|
| Hartford Total Return Bond HLS Fund |
Manager Discussion
December 31, 2016 (Unaudited)
Portfolio Managers
Joseph F. Marvan, CFA
Senior Managing Director and Fixed Income Portfolio Manager
Wellington Management Company LLP
Campe Goodman, CFA
Senior Managing Director and Fixed Income Portfolio Manager
Wellington Management Company LLP
Robert D. Burn, CFA
Managing Director and Fixed Income Portfolio Manager
Wellington Management Company LLP
How did the Fund perform during the period?
The Class IA shares of Hartford Total Return Bond HLS Fund returned 4.49%, for the twelve-month period ended December 31, 2016, outperforming the Fund’s benchmark, the Bloomberg Barclays U.S. Aggregate Bond Index, which returned 2.65% for the same period. The Fund also outperformed the 3.09% average return of the Lipper Core Bond Funds peer group, a group of funds with investment strategies similar to those of the Fund.
Why did the Fund perform this way?
Over the period, global fixed income markets were influenced by global economic growth concerns, central bank monetary policy expectations, and oil prices. Early in 2016, falling oil prices, concerns over slowing growth in China, and questions about the efficacy of central bank monetary policies sparked a broad sell-off in credit markets, while government bond prices benefited from their safe-haven status. Following the lead of European central banks, the Bank of Japan introduced negative interest rates for the first time as the volatility and instability in financial markets threatened to tip Japan back into deflation. Markets reversed course in mid-February as the major central banks adopted more cautious monetary policies in an effort to ease market risk. The People’s Bank of China resumed its easing cycle with a surprise cut in the bank’s reserve-requirement ratio and the European Central Bank (ECB) announced significant easing measures. A rebound in crude oil prices, accommodative global central bank monetary policy and signs of near-term stabilization in China further supported global financial markets through the second quarter. The U.K.’s momentous vote in June to leave the E.U. (Brexit) led to a spike in global financial market volatility and a flight to safety, with U.K. and European equity and credit markets bearing the brunt of the sell-off.
Policy paths of major central banks appeared to diverge in the third quarter as the Bank of England unveiled a stimulus package designed to prevent a recession following the Brexit vote while the ECB kept its stimulus program unchanged and avoided making a firm commitment to further expand its bond-buying program. In the U.S., Federal Reserve (Fed) rhetoric turned more focused on
interest rate increases, setting up for a December rate increase. Global government bond yields moved sharply higher in the fourth quarter, particularly following the U.S. presidential election results as President-elect Trump’s proposed expansionary fiscal policy lifted inflation expectations. In December, the Fed increased rates for only the second time in ten years. While markets had largely anticipated the decision, the Fed’s post-meeting statement and press conference leaned more toward an aggressive interest rate policy than expected.
Developed markets’ government bond prices largely gained outside the U.S. over the period, as global uncertainties kept central banks in easing mode for most of the year. In the U.S., the yield curve flattened; front-end yields, which were heavily influenced by Fed monetary policy expectations, rose more than yields on intermediate- and long-term bonds. The U.S. dollar ended higher against a broad basket of currencies over the period, particularly following the U.S. presidential election results and Fed rate increase decision. Emerging market currencies also weakened significantly against the dollar following Trump’s election victory over concerns about potential U.S. trade protectionism. Meanwhile, the U.K. pound depreciated in the aftermath of Brexit.
Absolute returns in the major fixed income credit risk sectors were positive during the twelve-month period, aided by the decline in government bond yields outside the U.S. In the U.S., interest income helped offset the impact of higher Treasury yields. On an excess return basis, most credit risk sectors, including high yield, emerging markets debt, and investment grade corporates posted positive returns over the period as credit spreads tightened during the year. However, this performance masked considerable volatility in credit risk sector returns, including a drawdown in many credit risk sectors in the first part of 2016 and immediately following the Brexit referendum.
The primary driver of the Fund’s outperformance versus the benchmark was the Fund’s out-of-benchmark allocation to bank loans, in particular in the Industrials sector. Investment grade credit
|
| Hartford Total Return Bond HLS Fund |
Manager Discussion – (continued)
December 31, 2016 (Unaudited)
positioning, in particular security selection within Energy and Financials, also contributed positively to outperformance. The Fund’s allocations to non-agency mortgage backed securities (MBS), commercial mortgage backed securities (CMBS) and collateralized loan obligations (CLOs) were also additive throughout the year. The Fund’s long inflation position benefited relative performance, including positions initiated through Consumer Price Index (CPI) swaps. An allocation to high yield credit was additive, though the strong contribution from holding high yield bonds was somewhat offset by the portfolio’s credit hedges that were implemented through index credit default swaps (CDX). The Fund’s tactical yield curve and duration positions had an overall positive contribution to performance for the year.
What is the outlook?
We continue to position the Fund with a moderately pro-cyclical risk posture in credit markets. U.S. economic growth remains positive, monetary policy is still accommodative, and we believe valuations are attractive. The Fund is positioned for an increase in inflation expectations as we continue to believe capacity constraints will pressure inflation higher. The Fund ended the period with neutral exposure to investment grade credit and continued to favor Financials. The Fund maintained an overweight to agency MBS pass-throughs and continued to hold an out-of-benchmark allocation to non-agency residential MBS (RMBS). The Fund also held high quality CMBS and CLOs based on what we consider to be attractive valuations. Within high yield, we continued to favor BB-rated securities, bank loans, and hold contingent convertibles (CoCo’s) of large European banks. We also believe that emerging market (EM) relative value has improved and we have been opportunistically adding EM exposure.
A Word about Risk
All investments are subject to risk, including the possible loss of principal. There is no guarantee the Fund will achieve its stated objective. The Fund’s share price may fluctuate due to market risk and/or security selections that may underperform the market or relevant benchmarks. Fixed Income risks include credit, liquidity, call, duration, and interest-rate risk. As interest rates rise, bond prices generally fall; these risks are currently heightened due to the historically low interest rate environment. Investments in high-yield (“junk”) bonds involve greater risk of price volatility, illiquidity, and default than higher-rated debt securities. Obligations of U.S. Government agencies are supported by varying degrees of credit but are generally not backed by the full faith and credit of the U.S. Government. Mortgage- and asset-backed securities’ risks include credit, interest-rate, prepayment, and extension risk. The Fund may purchase securities in the To-Be-Announced (TBA) market, which can subject the Fund to additional price and counterparty risk. Derivatives may be riskier or more volatile than other types of investments because they are generally more sensitive to changes in market or economic conditions; risks include currency, leverage, liquidity, index, pricing, and counterparty risk. The Fund has the
ability to invest in foreign, emerging-market, and high-yield (“junk”) bonds. Investments in these securities generally involve greater risk, volatility, and possibility of loss. Privately placed, restricted (Rule 144A) securities may be more difficult to sell and value than publicly traded securities, thus they may be potentially illiquid. The Fund may have high portfolio turnover, which could increase the Fund’s transaction costs.
Composition by Security Type
as of December 31, 2016
| | | | |
| Category | | Percentage of
Net Assets | |
Fixed Income Securities | | | | |
Asset & Commercial Mortgage Backed Securities | | | 30.0 | % |
Corporate Bonds | | | 33.7 | |
Foreign Government Obligations | | | 4.1 | |
Municipal Bonds | | | 1.3 | |
Senior Floating Rate Interests | | | 5.1 | |
U.S. Government Agencies | | | 44.0 | |
U.S. Government Securities | | | 4.4 | |
| | | | |
Total | | | 122.6 | % |
| | | | |
Equity Securities | | | | |
Common Stocks | | | 0.0 | % |
Preferred Stocks | | | 0.1 | |
| | | | |
Total | | | 0.1 | % |
| | | | |
Short-Term Investments | | | 6.7 | |
Purchased Options | | | 0.0 | |
Other Assets & Liabilities | | | (29.4 | ) |
| | | | |
Total | | | 100.0 | % |
| | | | |
Hartford Ultrashort Bond HLS Fund inception 08/31/1977
| | |
| (sub-advised by Wellington Management Company LLP) | | Investment objective – The Fund seeks total return and income consistent with preserving capital and maintaining liquidity. |
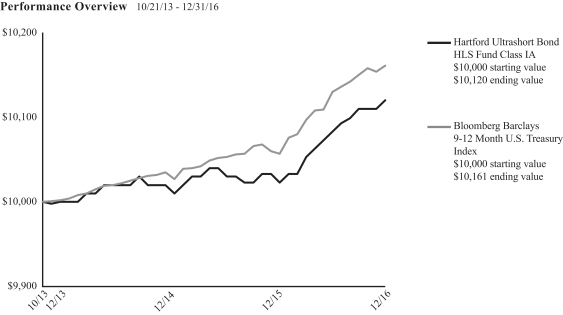
The chart above represents the hypothetical growth of a $10,000 investment in Class IA. Growth results in classes other than Class IA will vary from what is seen above due to differences in the expenses charged to those share classes.
Average Annual Total Return (as of 12/31/16)
| | | | | | | | |
| | | 1 Year | | | Since
Inception1 | |
Ultrashort Bond IA | | | 0.97% | | | | 0.37% | |
Ultrashort Bond IB | | | 0.64% | | | | 0.11% | |
Bloomberg Barclays 9-12 Month U.S. Treasury Index | | | 1.03% | | | | 0.50% | |
| 1 | On October 21, 2013, the Fund converted from a money market fund to an ultrashort bond fund. Total returns shown are from conversion date (October 21, 2013) to December 31, 2016. |
PERFORMANCE DATA QUOTED REPRESENTS PAST PERFORMANCE AND DOES NOT GUARANTEE FUTURE RESULTS. The investment return and principal value of the investment will fluctuate so that investors’ shares, when redeemed, may be worth more or less than their original cost. Current performance may be lower or higher than the performance data quoted. To obtain performance data current to the most recent month-end, please visit our website www.hartfordfunds.com.
Total returns presented above were calculated using the Fund’s net asset value available to shareholders for sale or redemption of Fund shares on December 31, 2016, which may exclude investment transactions as of this date. All share class returns assume the reinvestment of all distributions at net asset value and the deduction of all fund expenses.
Prior to October 21, 2013, the Fund was managed as a money market fund. Accordingly, performance of the Fund prior to October 21, 2013 is not shown. Past performance information for when the Fund was managed as a money market fund is available upon request by calling 1-888-843-7824.
Bloomberg Barclays 9-12 Month U.S. Treasury Index measures the performance of U.S. Treasury securities that have a remaining maturity between one and twelve months.
On August 24, 2016, Bloomberg L.P. acquired Barclays Risk Analytics and Index Solutions Ltd. from Barclays PLC. As a result of this acquisition, the Barclays indices have been rebranded as Bloomberg Barclays indices.
The index is unmanaged, and its results include reinvested dividends and/or distributions, but do not reflect the effect of sales charges, commissions, expenses or taxes.
You cannot invest directly in an index.
As shown in the Fund’s current prospectus dated May 1, 2016, the total annual fund operating expense ratios for Class IA and Class IB were 0.43% and 0.68%, respectively. Actual expenses may be higher. Please see the accompanying Financial Highlights for expense ratios for the year ended December 31, 2016.
All investments are subject to risk including the possible loss of principal. For a discussion of the Fund’s risks, please see “A Word about Risk” section in the “Manager Discussion” section of this report. For more detailed information on the risks associated with an investment in the Fund, please see the prospectus.
The chart and table do not reflect the deductions of taxes, sales charges or other fees which may be applied at the variable life insurance, variable annuity or qualified retirement plan product level. Any such additional sales charges or other fees or expenses would lower the contract’s or plan’s performance.
|
| Hartford Ultrashort Bond HLS Fund |
Manager Discussion
December 31, 2016 (Unaudited)
Portfolio Manager
Timothy E. Smith
Senior Managing Director and Fixed Income Portfolio Manager
Wellington Management Company LLP
How did the Fund perform during the period?
The Class IA shares of Hartford Ultrashort Bond HLS Fund returned 0.97%, for the twelve-month period ended December 31, 2016, underperforming the Fund’s benchmark, the Bloomberg Barclays 9-12 Month U.S. Treasury Index, which returned 1.03% for the same period. The Fund underperformed the average return of the Lipper Short Investment Grade Debt Funds peer group 1.97%, a group of funds that invest primarily in investment grade issues with dollar-weighted average maturities of one to five years.
Why did the Fund perform this way?
Over the period, global fixed income markets were influenced by global economic growth concerns, central bank monetary policy expectations, and oil prices. Early in 2016, falling oil prices, concerns over slowing growth in China, and questions about the efficacy of central bank monetary policies sparked a broad sell-off in credit markets, while government bond prices benefited from their safe-haven status. Following the lead of European central banks, the Bank of Japan introduced negative interest rates for the first time as the volatility and instability in financial markets threatened to tip Japan back into deflation. Markets reversed course in mid-February as the major central banks adopted more cautious monetary policies in an effort to ease market risk. The People’s Bank of China resumed its easing cycle with a surprise cut in the bank’s reserve-requirement ratio and the European Central Bank (ECB) announced significant easing measures. A rebound in crude oil prices, accommodative global central bank monetary policy and signs of near-term stabilization in China further supported global financial markets through the second quarter. The U.K.’s momentous vote in June to leave the E.U. (Brexit) led to a spike in global financial market volatility and a flight to safety, with U.K. and European equity and credit markets bearing the brunt of the sell-off.
Policy paths of major central banks appeared to diverge in the third quarter as the Bank of England unveiled a stimulus package designed to prevent a recession following the Brexit vote while the ECB kept its stimulus program unchanged and avoided making a firm commitment to further expand its bond-buying program. In the U.S., the Federal Reserve (Fed) rhetoric turned more focused on interest rate increases, setting up for a December rate increase. Global government bond yields moved sharply higher in the fourth quarter, particularly following the U.S presidential election results as President-elect Trump’s proposed expansionary fiscal policy lifted inflation expectations. In December, the Fed increased rates for only the second time in ten years. While markets had largely anticipated
the decision, the Fed’s post-meeting statement and press conference leaned more toward an aggressive interest rate policy than expected.
Developed markets’ government bond prices largely gained outside the U.S. over the period, as global uncertainties kept central banks in easing mode for most of the year. In the U.S., the yield curve flattened; front-end yields, which were heavily influenced by Fed monetary policy expectations, rose more than intermediate- and long-term yields. The U.S. dollar ended higher against a broad basket of currencies over the period, particularly following the U.S. election results and Fed rate increase decision. Emerging market currencies also weakened significantly against the dollar following Trump’s election victory over concerns about potential U.S. trade protectionism. Meanwhile, the U.K. pound depreciated in the aftermath of Brexit.
Absolute returns in the major fixed income credit risk sectors were positive during the twelve-month period, aided by the decline in government bond yields outside the U.S. In the U.S., interest income helped offset the impact of higher Treasury yields. On an excess return basis, most credit risk sectors posted positive returns over the period, including high yield, emerging markets debt, and investment grade corporates, as credit spreads tightened during the year. However, this performance masked considerable volatility in credit risk sector returns, including a drawdown in many credit risk sectors in the first part of 2016 and immediately following the Brexit referendum.
The Fund underperformed the Bloomberg Barclays 9-12 Month U.S. Treasury Index, primarily due to out-of-benchmark allocations to investment grade corporate credit, particularly within Industrials and Financial Institutions, and Asset Backed Securities (ABS), specifically within auto and credit card ABS. The Fund’s allocation to commercial mortgage-backed securities (CMBS) also contributed positively during the year. Duration and yield curve positioning detracted from benchmark relative performance during the period.
Derivatives were not used in a significant manner in the Fund during the period and did not have a material impact on performance during the period.
What is the outlook?
We are positioned with a moderately pro-cyclical risk posture, favoring the credit and securitized sectors. Our view is based on expectations of steady U.S. economic growth, but we believe the range of outcomes is wider than normal given policy uncertainty
|
| Hartford Ultrashort Bond HLS Fund |
Manager Discussion – (continued)
December 31, 2016 (Unaudited)
under the new, incoming administration. Higher infrastructure and defense spending, tax cuts, and a rising deficit all point to higher growth and inflation in the coming years. However, the impact on growth could be mitigated by trade restrictions and protectionist policies. We believe core inflation should remain stable with domestic factors posing upside potential and external factors posing downside risk.
We believe the Fed will likely continue its gradual tightening trajectory, but with an awareness to both the potential inflationary impact of fiscal stimulus when the U.S. is at full employment and the risks to global growth from protectionist policies. Our expectations for steady U.S. economic growth and a continued moderate rise in inflation appears to support the case for an additional Fed rate increase in 2017. As a result, the Fund is positioned with a short duration bias, relative to the Bloomberg Barclays 9-12 Month U.S. Treasury Index.
The Fund continued to be positioned with out-of-benchmark allocations to investment grade corporates and ABS at the end of 2016. Within investment grade corporates, we favor U.S. banks, as higher interest rates should benefit net interest margins going forward, and the possibility of some regulatory relief under the new U.S. administration would also be supportive. Within ABS, we favor auto, credit card and student loans. We also continued to hold government agency debt based on what we consider to be their attractive valuations versus U.S. Treasuries.
A Word about Risk
All investments are subject to risk, including the possible loss of principal. There is no guarantee the Fund will achieve its stated objective. The Fund’s share price may fluctuate due to market risk and/or security selections that may underperform the market or relevant benchmarks. Fixed Income risks include credit, liquidity, call, duration, and interest-rate risk. As interest rates rise, bond prices generally fall; these risks are currently heightened due to the historically low interest rate environment. Mortgage- and asset-backed securities’ risks include credit, interest-rate, prepayment, and extension risk. Obligations of U.S. Government agencies are supported by varying degrees of credit but are generally not backed by the full faith and credit of the U.S. Government. Mortgage- and asset-backed securities’ risks include credit, interest-rate, prepayment, and extension risk. Derivatives may be riskier or more volatile than other types of investments because they are generally more sensitive to changes in market or economic conditions; risks include currency, leverage, liquidity, index, pricing, and counterparty risk. The Fund may use repurchase agreements, which can increase risk and volatility. Privately placed, restricted (Rule 144A) securities may be more difficult to sell and value than publicly traded securities, thus they may be potentially illiquid.
Composition by Security Type
as of December 31, 2016
| | | | |
| Category | | Percentage of
Net Assets | |
Fixed Income Securities | |
Asset & Commercial Mortgage Backed Securities | | | 23.8 | % |
Corporate Bonds | | | 45.1 | |
Foreign Government Obligations | | | 0.5 | |
Municipal Bonds | | | 0.3 | |
U.S. Government Agencies | | | 13.5 | |
U.S. Government Securities | | | 16.0 | |
| | | | |
Total | | | 99.2 | % |
| | | | |
Short-Term Investments | | | 0.7 | |
Other Assets & Liabilities | | | 0.1 | |
| | | | |
Total | | | 100.0 | % |
| | | | |
Hartford U.S. Government Securities HLS Fund inception 03/24/1987
| | |
| (sub-advised by Wellington Management Company LLP) | | Investment objective – The Fund seeks to maximize total return while providing shareholders with a high level of current income consistent with prudent investment risk. |
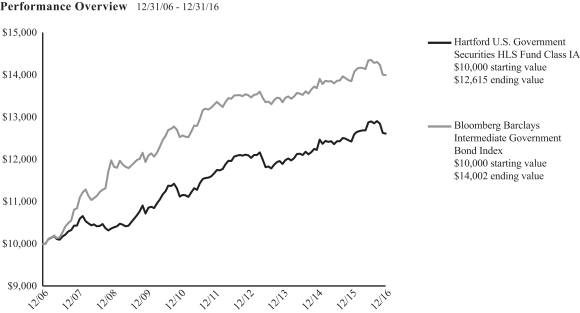
The chart above represents the hypothetical growth of a $10,000 investment in Class IA. Growth results in classes other than Class IA will vary from what is seen above due to differences in the expenses charged to those share classes.
Average Annual Total Return (as of 12/31/16)
| | | | | | | | | | | | |
| | | 1 Year | | | 5 Years | | | 10 Years | |
U.S. Government Securities IA | | | 1.54% | | | | 1.57% | | | | 2.35% | |
U.S. Government Securities IB | | | 1.27% | | | | 1.32% | | | | 2.10% | |
Bloomberg Barclays Intermediate Government Bond Index | | | 1.05% | | | | 1.04% | | | | 3.42% | |
PERFORMANCE DATA QUOTED REPRESENTS PAST PERFORMANCE AND DOES NOT GUARANTEE FUTURE RESULTS. The investment return and principal value of the investment will fluctuate so that investors’ shares, when redeemed, may be worth more or less than their original cost. Current performance may be lower or higher than the performance data quoted. To obtain performance data current to the most recent month-end, please visit our website www.hartfordfunds.com.
Total returns presented above were calculated using the Fund’s net asset value available to shareholders for sale or redemption of Fund shares on December 31, 2016, which may exclude investment transactions as of this date. All share class returns assume the reinvestment of all distributions at net asset value and the deduction of all fund expenses.
Performance information through March 5, 2012 represents performance of the Fund’s previous sub-adviser, Hartford Investment Management Company (“HIMCO”). As of March 5, 2012, HIMCO no longer served as the sub-adviser to the Fund.
Bloomberg Barclays Intermediate Government Bond Index is an unmanaged index of government bonds with maturities of between one and ten years.
On August 24, 2016, Bloomberg L.P. acquired Barclays Risk Analytics and Index Solutions Ltd. from Barclays PLC. As a result of this acquisition, the Barclays indices have been rebranded as Bloomberg Barclays indices.
The index is unmanaged, and its results include reinvested dividends and/or distributions, but do not reflect the effect of sales charges, commissions, expenses or taxes.
You cannot invest directly in an index.
As shown in the Fund’s current prospectus dated May 1, 2016, the total annual fund operating expense ratios for Class IA and Class IB were 0.51% and 0.76%, respectively. Actual expenses may be higher. Please see the accompanying Financial Highlights for expense ratios for the year ended December 31, 2016.
All investments are subject to risk including the possible loss of principal. For a discussion of the Fund’s risks, please see “A Word about Risk” section in the “Manager Discussion” section of this report. For more detailed information on the risks associated with an investment in the Fund, please see the prospectus.
The chart and table do not reflect the deductions of taxes, sales charges or other fees which may be applied at the variable life insurance, variable annuity or qualified retirement plan product level. Any such additional sales charges or other fees or expenses would lower the contract’s or plan’s performance.
|
| Hartford U.S. Government Securities HLS Fund |
Manager Discussion
December 31, 2016 (Unaudited)
Portfolio Manager
Michael F. Garrett
Senior Managing Director and Fixed Income Portfolio Manager
Wellington Management Company LLP
How did the Fund perform during the period?
The Class IA shares of Hartford U.S. Government Securities HLS Fund returned 1.54%, for the twelve-month period ended December 31, 2016, outperforming the Fund’s benchmark, the Bloomberg Barclays Intermediate Government Bond Index, which returned 1.05% for the same period. The Fund outperformed the 1.08% average return of the Lipper Intermediate U.S. Government Funds peer group, a group of funds that invest primarily in U.S. government and agency issues.
Why did the Fund perform this way?
Over the period, global fixed income markets were influenced by global economic growth concerns, central bank monetary policy expectations, and oil prices. Early in 2016, falling oil prices, concerns over slowing growth in China, and questions about the efficacy of central bank monetary policies sparked a broad sell-off in credit markets, while government bond prices benefited from their safe-haven status. Following the lead of European central banks, the Bank of Japan (BOJ) introduced negative interest rates for the first time as the volatility and instability in financial markets threatened to tip Japan back into deflation. Markets reversed course in mid-February as the major central banks adopted more cautious monetary policies in an effort to ease market risk. The People’s Bank of China resumed its easing cycle with a surprise cut in the bank’s reserve-requirement ratio and the European Central Bank (ECB) announced significant easing measures. A rebound in crude oil prices, accommodative global central bank monetary policy and signs of near-term stabilization in China further supported global financial markets through the second quarter. The U.K.’s momentous vote in June to leave the E.U. (Brexit) led to a spike in global financial market volatility and a flight to safety, with U.K. and European equity and credit markets bearing the brunt of the sell-off.
Policy paths of major central banks appeared to diverge in the third quarter as the Bank of England unveiled a stimulus package designed to prevent a recession following the Brexit vote while the ECB kept its stimulus program unchanged and avoided making a firm commitment to further expand its bond-buying program. In the U.S., the Federal Reserve (Fed) rhetoric turned more focused on interest rate increases, setting up for a December rate increase. Global government bond yields moved sharply higher in the fourth quarter, particularly following the U.S. presidential election results as President-elect Trump’s proposed expansionary fiscal policy lifted inflation expectations. In December, the Fed increased rates for only the second time in ten years. While markets had largely anticipated
the decision, the Fed’s post-meeting statement and press conference leaned more toward an aggressive interest rate policy than expected.
Developed markets’ government bond prices largely gained outside the U.S. over the period, as global uncertainties kept central banks in easing mode for most of the year. In the U.S., the yield curve flattened; front-end yields, which were heavily influenced by Fed monetary policy expectations, rose more than intermediate- and long-term yields. The U.S. dollar ended higher against a broad basket of currencies over the period, particularly following the U.S. election results and Fed rate increase decision. Emerging market currencies also weakened significantly against the dollar following Trump’s election victory over concerns about potential U.S. trade protectionism. Meanwhile, the U.K. pound depreciated in the aftermath of Brexit.
Absolute returns in the major fixed income credit risk sectors were positive during the twelve-month period, aided by the decline in government bond yields outside the U.S. In the U.S., interest income helped offset the impact of higher Treasury yields. On an excess return basis, most credit risk sectors, including high yield, emerging markets debt, and investment grade corporates posted positive returns over the period, as credit spreads tightened during the year. However, this masked considerable volatility in credit risk sector returns, including a drawdown in many credit risk sectors in the first part of 2016 and immediately following the Brexit referendum.
Out-of-benchmark allocations to agency mortgage-backed securities (MBS), asset-backed securities (ABS), non-agency residential mortgage-backed securities (RMBS), and commercial mortgage-backed securities (CMBS) were the main drivers of outperformance relative to the Bloomberg Barclays Intermediate Government Bond Index over the period. Within agency MBS, allocations to agency pass-throughs, Delegated Underwriting Servicing bonds (DUS), and agency collateralized mortgage obligations (CMOs) contributed positively to the Fund’s relative outperformance over the period. In addition, an allocation to 30 year conventional mortgages also contributed positively. An allocation to U.S. Treasury Inflation-Protected Securities (TIPS) also contributed positively as inflation expectations rose. Conversely, exposure to equipment leases in ABS modestly detracted from benchmark-relative returns over the period.
During the period, the Fund used Treasury futures and interest rate swaps to manage duration and yield curve exposures; overall these derivative instruments had a positive impact on absolute performance over the period.
|
| Hartford U.S. Government Securities HLS Fund |
Manager Discussion – (continued)
December 31, 2016 (Unaudited)
What is the outlook?
We are neutral on agency MBS spreads in the near term. Following the surprise U.S. presidential election result and new expectations of fiscal stimulus, markets (rates, equity, credit) seem to be pricing in bullish outcomes. We believe many risks remain, however, including continued uncertainty about global central bank policy, the ability of the economy to deliver on growth expectations, future Fed chair appointment uncertainty, reexamination of reform of Government Sponsored Entities, and possible adjustments to the Fed’s purchase program exit strategy. Current MBS spreads do not seem to compensate investors for all the uncertainty. Still, fundamental factors are supportive, so we view current MBS spreads within a reasonable valuation range given the environment.
Over the intermediate term, we are concerned about MBS. Pro-growth policies at a time when the U.S. economy is close to full employment may lead to a further rise in inflation. Higher inflation will likely lead to a faster pace of interest rate increases and therefore, may bring forward conversations at the Fed about paring reinvestment of MBS paydowns. We would expect this to be accompanied by additional MBS spread widening. We believe such widening may come sooner than anticipated, implying less time to earn carry to offset the eventual widening.
Over the longer term, we still expect MBS spreads to remain toward the tight end of their range relative to long-term history given their favorable supply relative to U.S. Treasuries, the reduced leverage prevalent in the system, a shift in the MBS buyer-base to long term investors, a constrained mortgage credit environment, and lower refinancing risk.
We have a constructive outlook on most non-agency RMBS, given the continuing recovery of the U.S. housing market supporting credit and the positive technical tailwinds. Given the recent spread tightening, we believe near term return potential is primarily driven by income, especially in the pre-2008 non-agency RMBS and Agency credit risk transfer sectors where spreads tightened significantly in 2016. We think securitizations in non-traditional sectors, such as, non- and re-performing loans and re-securitizations are also attractive opportunities to provide financing on assets historically financed on bank balance sheets.
Our longer term CMBS outlook is constructive due to what we consider favorable commercial real estate (CRE) fundamentals and attractive valuations, both outright and relative to other credit risk sectors. However, given pockets of structural weakness such as retail, we believe investors will need to be judicious in their credit analysis and security selection. We believe that a functional CMBS market post the upcoming risk-retention regulations, alongside capital available from banks and insurance companies, will be important in refinancing the upcoming wave of securities expected to mature at the same time estimated between $8-12 billion through much of 2017. The impact of rising U.S. rates on property valuations and the
reaction of foreign demand to a strong U.S. Dollar are two risks we are watching closely in 2017. We favor up-in-quality new issues, seasoned (2010 – 2013) credit bonds, select single-borrower deals, and certain interest-only (IO) bonds.
We are constructive on ABS driven by what appear to be strong consumer fundamentals, balanced somewhat by the later stage of the cycle. Within consumer ABS, we favor senior and subordinate bonds of select subprime auto issuers. We remain confident in the sector but are becoming marginally more cautious on specific issues. We see opportunity in niche subsectors, including unsecured consumer loans, fleet lease deals, and select credit tranches.
A Word about Risk
All investments are subject to risk, including the possible loss of principal. There is no guarantee the Fund will achieve its stated objective. The Fund’s share price may fluctuate due to market risk and/or security selections that may underperform the market or relevant benchmarks. Fixed Income risks include credit, liquidity, call, duration, and interest-rate risk. As interest rates rise, bond prices generally fall; these risks are currently heightened due to the historically low interest rate environment. The purchase of securities in the To-Be-Announced (TBA) market can result in additional price and counterparty risk. Mortgage- and asset-backed securities’ risks include credit, interest-rate, prepayment, and extension risk. Derivatives may be riskier or more volatile than other types of investments because they are generally more sensitive to changes in market or economic conditions; risks include currency, leverage, liquidity, index, pricing, and counterparty risk. Obligations of U.S. Government agencies are supported by varying degrees of credit but are generally not backed by the full faith and credit of the U.S. Government. Privately placed, restricted (Rule 144A) securities may be more difficult to sell and value than publicly traded securities, thus they may be potentially illiquid. The Fund may have high portfolio turnover, which could increase the Fund’s transaction costs.
Composition by Security Type
as of December 31, 2016
| | | | |
| Category | | Percentage of
Net Assets | |
Fixed Income Securities | | | | |
Asset & Commercial Mortgage Backed Securities | | | 18.3 | % |
U.S. Government Agencies | | | 72.9 | |
U.S. Government Securities | | | 25.2 | |
| | | | |
Total | | | 116.4 | % |
| | | | |
Short-Term Investments | | | 6.1 | |
Other Assets & Liabilities | | | (22.5 | ) |
| | | | |
Total | | | 100.0 | % |
| | | | |
Hartford Value HLS Fund inception 04/30/2001
| | |
| (sub-advised by Wellington Management Company LLP) | | Investment objective – The Fund seeks long-term total return. |
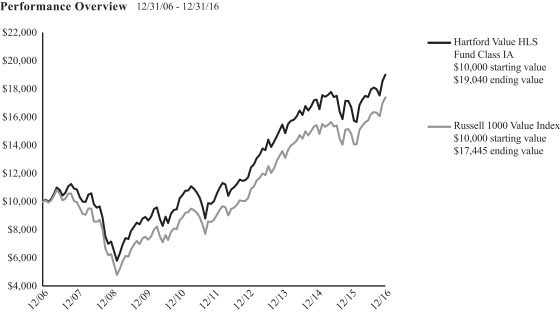
The chart above represents the hypothetical growth of a $10,000 investment in Class IA. Growth results in classes other than Class IA will vary from what is seen above due to differences in the expenses charged to those share classes.
Average Annual Total Return (as of 12/31/16)
| | | | | | | | | | | | |
| | | 1 Year | | | 5 Years | | | 10 Years | |
Value IA | | | 13.69 | % | | | 13.63 | % | | | 6.65 | % |
Value IB | | | 13.46 | % | | | 13.35 | % | | | 6.39 | % |
Russell 1000 Value Index | | | 17.34 | % | | | 14.80 | % | | | 5.72 | % |
PERFORMANCE DATA QUOTED REPRESENTS PAST PERFORMANCE AND DOES NOT GUARANTEE FUTURE RESULTS. The investment return and principal value of the investment will fluctuate so that investors’ shares, when redeemed, may be worth more or less than their original cost. Current performance may be lower or higher than the performance data quoted. To obtain performance data current to the most recent month-end, please visit our website www.hartfordfunds.com.
Total returns presented above were calculated using the Fund’s net asset value available to shareholders for sale or redemption of Fund shares on December 31, 2016, which may exclude investment transactions as of this date. All share class returns assume the reinvestment of all distributions at net asset value and the deduction of all fund expenses.
Russell 1000 Value Index is an unmanaged index that measures the performance of those Russell 1000 Index companies with lower price-to-book ratios and lower forecasted growth values. The Russell 1000 Index is an unmanaged index that measures the performance of the 1,000 largest companies in the Russell 3000 Index, which measures the performance of the 3,000 largest U.S. companies, based on total market capitalizations.
The index is unmanaged, and its results include reinvested dividends and/or distributions, but do not reflect the effect of sales charges, commissions, expenses or taxes.
You cannot invest directly in an index.
As shown in the Fund’s current prospectus dated May 1, 2016, the total annual fund operating expense ratios for Class IA and Class IB were 0.78% and 1.03%, respectively. Actual expenses may be higher. Please see the accompanying Financial Highlights for expense ratios for the year ended December 31, 2016.
All investments are subject to risk including the possible loss of principal. For a discussion of the Fund’s risks, please see “A Word about Risk” section in
the “Manager Discussion” section of this report. For more detailed information on the risks associated with an investment in the Fund, please see the prospectus.
The chart and table do not reflect the deductions of taxes, sales charges or other fees which may be applied at the variable life insurance, variable annuity or qualified retirement plan product level. Any such additional sales charges or other fees or expenses would lower the contract’s or plan’s performance.
Manager Discussion
December 31, 2016 (Unaudited)
Portfolio Managers
Karen H. Grimes, CFA
Senior Managing Director and Equity Portfolio Manager
Wellington Management Company LLP
W. Michael Reckmeyer, III, CFA
Senior Managing Director and Equity Portfolio Manager
Wellington Management Company LLP
Ian R. Link, CFA
Senior Managing Director and Equity Portfolio Manager
Wellington Management Company LLP
How did the Fund perform during the period?
The Class IA shares of Hartford Value HLS Fund returned 13.69% for the twelve-month period ended December 31, 2016, underperforming the Fund’s benchmark, the Russell 1000 Value Index, which returned 17.34% for the same period. The Fund underperformed the 14.95% average return of the Lipper Large Cap Value Funds peer group, a group of funds with investment strategies similar to those of the Fund.
Why did the Fund perform this way?
U.S. equities rose over the period, as measured by the S&P 500 Index, notwithstanding significant volatility during the year. Early in the first quarter of 2016, equities plunged and moved in virtual lockstep with the price of oil as fears of a recession and weakness in China weighed on investors’ minds. However, equity markets surged in late February and March as solid economic data, a stabilization in oil prices, and accommodative commentary from the Federal Reserve (Fed) helped to calm the market’s early year jitters. A better-than-feared U.S. corporate earnings season in the second quarter and an encouraging economic backdrop helped sustain the rally. At its June meeting, the Fed left rates unchanged and reduced its U.S. growth and long-run policy rate forecasts, citing mixed U.S. economic data and uncertainty about global economic and financial developments. After plunging in the two trading days following the approval of the U.K.’s exit from the E.U. (Brexit), U.S. equities staged an impressive comeback in the days following.
U.S. equities continued to climb in July, following a solid start to the corporate earnings season and encouraging housing and employment data releases. Stocks were essentially flat in August and September as investors remained focused on the Fed’s actions, specifically on the timing of the next rate increase. A confluence of worries contributed to increased volatility during September, including uncertainty surrounding the U.S. presidential election, tepid economic data, and valuation concerns. Stocks surged following Donald Trump’s victory in the U.S. Presidential election on hopes of
increased fiscal stimulus, reduced regulatory restrictions, and lower corporate taxes. Economic data released during the fourth quarter was generally encouraging, as third quarter gross domestic product (GDP) growth was revised slightly higher and the U.S. housing market continued to display healthy trends. In December, the Fed raised rates by 0.25%, a move that was anticipated by most of the market. It was only the second increase in the last decade.
Equity returns varied by market-cap during the period, as small- and mid-cap equities, as measured by the Russell 2000 and S&P MidCap 400 Indices, outperformed large-cap equities, as measured by the S&P 500 Index.
During the twelve-month period, ten of the eleven sectors1 within the Russell 1000 Value Index rose, led by Materials (+31%), Energy (+27%), and Telecommunication Services (+25%). Real estate (-5%) lagged on a relative basis.
The Fund’s underperformance versus its benchmark, the Russell 1000 Value Index, during the period was primarily driven by security selection within the Financials, Industrials, and Healthcare sectors. This was partially offset by positive stock selection in the Energy sector. Sector allocation, a residual of the bottom-up stock selection process, contributed positively to benchmark-relative results. This was largely due to a benchmark-relative underweight to the Real Estate and Financials sectors, which was only partially offset by the negative impact of an overweight to Consumer Discretionary.
The top detractors from returns relative to the Russell 1000 Value Index over the period were Norwegian Cruise Lines (Consumer Discretionary), Bristol-Myers Squibb (Healthcare), and Roche (Healthcare). Shares of Norwegian Cruise Lines, a U.S.-based international cruise operator, fell due to uncertainty regarding how Brexit will affect the travel and leisure industry, in addition to announcing poor quarterly earnings. The stock price of Bristol-Myers
| 1 | Effective September 1, 2016, a new Real Estate sector was created under the Global Industry Classification Standard (GICS); holdings in this sector were previously classified as Financials. The attribution analysis of the Financials sector includes Real Estate for the period starting January 1, 2016 through August 31, 2016. The attribution analysis of the Real Estate sector is only for the period starting September 1, 2016 through December 31, 2016. |
Manager Discussion – (continued)
December 31, 2016 (Unaudited)
Squibb, a U.S.-based biopharmaceutical company, fell as the company’s trial for immuno-oncology drug Opdivo failed during the third quarter of 2016. Shares of Switzerland-based pharmaceutical company Roche Holdings fell as disappointing trial results for its Alzheimer and breast cancer treatments dampened investor enthusiasm and shares lagged as a result. Top absolute detractors during the period included Allergan (Healthcare) and Signet Jewelers (Consumer Discretionary).
The largest contributors to returns relative to the Russell 1000 Value Index were Halliburton (Energy), JP Morgan Chase (Financials), and UnitedHealth Group (Healthcare). Shares of Halliburton, a U.S.-based energy services provider, rose during the period as oil prices recovered and the Organization of the Petroleum Exporting Countries (OPEC) announced an agreement among members to cut oil supply. Shares of JP Morgan Chase, a U.S.-based global financial services firm, rose as equities benefited from the anticipation that the Trump administration would roll back some post-financial crisis regulations. Shares of U.S.-based health care benefits and services provider UnitedHealth Group rose as rapid growth of its technology-enabled health services segment, Optum, has boosted earnings throughout the year. Top absolute contributors during the period included Chevron (Energy).
Derivatives were not used in a significant manner in the Fund during the period and did not have a material impact on performance during the period.
What is the outlook?
We anticipate solid growth in the U.S. economy in 2017, supported by continued growth in consumer spending and an increase in investment levels. Inventories, which have been a headwind to growth over the last 5 quarters, appear to be in better balance heading into 2017, and should no longer be a meaningful drag on the economy. Decreased regulation, lower tax rates, and the potential for increased infrastructure spending should also support the economy in the coming year. On the negative side, the strong U.S. dollar and uncertainty surrounding foreign policy and global trade may weigh on growth.
Based on individual stock decisions, the Fund ended the period most overweight the Consumer Discretionary, Information Technology, and Financials sectors, and most underweight the Real Estate, Consumer Staples, and Utilities sectors, relative to the Russell 1000 Value Index.
A Word about Risk
All investments are subject to risk, including the possible loss of principal. There is no guarantee the Fund will achieve its stated objective. The Fund’s share price may fluctuate due to market risk and/or security selections that may underperform the market or relevant benchmarks. Foreign investments can be riskier than U.S. investments due to the adverse effects of currency exchange rates,
differences in market structure and liquidity, as well as political and economic developments in foreign countries and regions. Value investing may go out of favor, which may cause the Fund to underperform the broader stock market.
Composition by Sector
as of December 31, 2016
| | | | |
| Sector | | Percentage of
Net Assets | |
Equity Securities | | | | |
Consumer Discretionary | | | 9.2 | % |
Consumer Staples | | | 5.0 | |
Energy | | | 12.4 | |
Financials | | | 29.0 | |
Health Care | | | 11.2 | |
Industrials | | | 11.9 | |
Information Technology | | | 12.7 | |
Materials | | | 2.7 | |
Telecommunication Services | | | 1.6 | |
Utilities | | | 3.4 | |
| | | | |
Total | | | 99.1 | % |
| | | | |
Short-Term Investments | | | 1.2 | |
Other Assets & Liabilities | | | (0.3 | ) |
| | | | |
Total | | | 100.0 | % |
| | | | |
A sector may be comprised of several industries. For Fund compliance purposes, the Fund may not use the same classification system and these sector classifications are used for financial reporting purposes.
Expense Examples (Unaudited)
Your Fund’s Expenses
As a shareholder of a Fund, you incur two types of costs: (1) transaction costs and (2) ongoing costs, including investment management fees, distribution and/or service (12b-1) fees, if any, and other fund expenses. This example is intended to help you understand your ongoing costs (in dollars) of investing in a Fund and to compare these costs with the ongoing costs of investing in other mutual funds. The example is based on an investment of $1,000 invested at the beginning of the period and held for the entire period of July 1, 2016 through December 31, 2016.
Actual Expenses
The first set of columns of the table below provides information about actual account values and actual expenses. You may use this information, together with the amount you invested, to estimate the expenses that you paid over the period. Simply divide your account value by $1,000 (for example, an $8,600 account value divided by $1,000 = 8.6), then multiply the result by the number in the line under the heading entitled “Expenses Paid During Period” to estimate the expenses you paid on your account during this period.
Hypothetical Example for Comparison Purposes
The second set of columns of the table below provides information about hypothetical account values and hypothetical expenses based on a Fund’s actual expense ratio and an assumed rate of return of 5% per year before expenses, which is not the Fund’s actual return. The hypothetical account values and expenses may not be used to estimate the actual ending account balance or expenses you paid for the period. You may use this information to compare the ongoing costs of investing in a Fund and other funds. To do so, compare this 5% hypothetical example with the 5% hypothetical examples that appear in the shareholder reports of the other funds.
Please note that the expenses shown in the table are meant to highlight your ongoing costs only and do not reflect any transactional costs, such as sales charges (loads) or fees which may be applied at the variable life insurance, variable annuity, or qualified retirement plan product level. Therefore, the second set of columns of the table is useful in comparing ongoing costs only, and will not help you determine the relative total costs of owning different funds. In addition, if these transactional costs were included, your costs would be higher. Expenses are equal to a Fund’s annualized expense ratios multiplied by average account value over the period, multiplied by 184/366 (to reflect the one-half year period).
Hartford Balanced HLS Fund
| | | | | | | | | | | | | | | | | | | | | | | | | | | | | | | | | | | | |
| | | Actual Return | | | Hypothetical (5% return before expenses) | | | | | | | | | | |
| | | Beginning
Account
Value
July 1,
2016 | | | Ending
Account
Value
December 31,
2016 | | | Expenses paid
during the period
July 1, 2016 through December 31, 2016 | | | Beginning
Account
Value
July 1, 2016 | | | Ending
Account
Value
December 31,
2016 | | | Expenses paid
during the period
July 1, 2016 through December 31,
2016 | | | Annualized
expense
ratio | | | Days in
the
current
1/2 year | | | Days in
the full
year | |
Class IA | | $ | 1,000.00 | | | $ | 1,023.10 | | | $ | 3.25 | | | $ | 1,000.00 | | | $ | 1,021.92 | | | $ | 3.25 | | | | 0.64 | % | | | 184 | | | | 366 | |
Class IB | | $ | 1,000.00 | | | $ | 1,022.00 | | | $ | 4.52 | | | $ | 1,000.00 | | | $ | 1,020.66 | | | $ | 4.52 | | | | 0.89 | % | | | 184 | | | | 366 | |
Hartford Capital Appreciation HLS Fund
| | | | | | | | | | | | | | | | | | | | | | | | | | | | | | | | | | | | |
| | | Actual Return | | | Hypothetical (5% return before expenses) | | | | | | | | | | |
| | | Beginning
Account
Value
July 1,
2016 | | | Ending
Account
Value
December 31,
2016 | | | Expenses paid
during the period
July 1, 2016 through December 31, 2016 | | | Beginning
Account
Value
July 1, 2016 | | | Ending
Account
Value
December 31,
2016 | | | Expenses paid
during the period
July 1, 2016 through December 31,
2016 | | | Annualized
expense
ratio | | | Days in
the
current
1/2 year | | | Days in
the full
year | |
Class IA | | $ | 1,000.00 | | | $ | 1,069.70 | | | $ | 3.54 | | | $ | 1,000.00 | | | $ | 1,021.72 | | | $ | 3.46 | | | | 0.68 | % | | | 184 | | | | 366 | |
Class IB | | $ | 1,000.00 | | | $ | 1,068.50 | | | $ | 4.84 | | | $ | 1,000.00 | | | $ | 1,020.46 | | | $ | 4.72 | | | | 0.93 | % | | | 184 | | | | 366 | |
Class IC | | $ | 1,000.00 | | | $ | 1,067.30 | | | $ | 6.13 | | | $ | 1,000.00 | | | $ | 1,019.20 | | | $ | 5.99 | | | | 1.18 | % | | | 184 | | | | 366 | |
Expense Examples (Unaudited) – (continued)
Hartford Disciplined Equity HLS Fund
| | | | | | | | | | | | | | | | | | | | | | | | | | | | | | | | | | | | |
| | | Actual Return | | | Hypothetical (5% return before expenses) | | | | | | | | | | |
| | | Beginning
Account
Value
July 1,
2016 | | | Ending
Account
Value
December 31,
2016 | | | Expenses paid
during the period
July 1, 2016 through December 31, 2016 | | | Beginning
Account
Value
July 1, 2016 | | | Ending
Account
Value
December 31,
2016 | | | Expenses paid
during the period
July 1, 2016 through December 31,
2016 | | | Annualized
expense
ratio | | | Days in
the
current
1/2 year | | | Days in
the full
year | |
Class IA | | $ | 1,000.00 | | | $ | 1,033.10 | | | $ | 4.04 | | | $ | 1,000.00 | | | $ | 1,021.17 | | | $ | 4.01 | | | | 0.79 | % | | | 184 | | | | 366 | |
Class IB | | $ | 1,000.00 | | | $ | 1,031.50 | | | $ | 5.31 | | | $ | 1,000.00 | | | $ | 1,019.91 | | | $ | 5.28 | | | | 1.04 | % | | | 184 | | | | 366 | |
Hartford Dividend and Growth HLS Fund
| | | | | | | | | | | | | | | | | | | | | | | | | | | | | | | | | | | | |
| | | Actual Return | | | Hypothetical (5% return before expenses) | | | | | | | | | | |
| | | Beginning
Account
Value
July 1,
2016 | | | Ending
Account
Value
December 31,
2016 | | | Expenses paid
during the period
July 1, 2016 through December 31, 2016 | | | Beginning
Account
Value
July 1, 2016 | | | Ending
Account
Value
December 31,
2016 | | | Expenses paid
during the period
July 1, 2016 through December 31,
2016 | | | Annualized
expense
ratio | | | Days in
the
current
1/2 year | | | Days in
the full
year | |
Class IA | | $ | 1,000.00 | | | $ | 1,103.90 | | | $ | 3.65 | | | $ | 1,000.00 | | | $ | 1,021.67 | | | $ | 3.51 | | | | 0.69 | % | | | 184 | | | | 366 | |
Class IB | | $ | 1,000.00 | | | $ | 1,102.30 | | | $ | 4.97 | | | $ | 1,000.00 | | | $ | 1,020.41 | | | $ | 4.77 | | | | 0.94 | % | | | 184 | | | | 366 | |
Hartford Global Growth HLS Fund
| | | | | | | | | | | | | | | | | | | | | | | | | | | | | | | | | | | | |
| | | Actual Return | | | Hypothetical (5% return before expenses) | | | | | | | | | | |
| | | Beginning
Account
Value
July 1,
2016 | | | Ending
Account
Value
December 31,
2016 | | | Expenses paid
during the period
July 1, 2016 through December 31, 2016 | | | Beginning
Account
Value
July 1, 2016 | | | Ending
Account
Value
December 31,
2016 | | | Expenses paid
during the period
July 1, 2016 through December 31,
2016 | | | Annualized
expense
ratio | | | Days in
the
current
1/2 year | | | Days in
the full
year | |
Class IA | | $ | 1,000.00 | | | $ | 1,024.60 | | | $ | 4.17 | | | $ | 1,000.00 | | | $ | 1,021.01 | | | $ | 4.17 | | | | 0.82 | % | | | 184 | | | | 366 | |
Class IB | | $ | 1,000.00 | | | $ | 1,023.50 | | | $ | 5.44 | | | $ | 1,000.00 | | | $ | 1,019.76 | | | $ | 5.43 | | | | 1.07 | % | | | 184 | | | | 366 | |
Hartford Growth Opportunities HLS Fund
| | | | | | | | | | | | | | | | | | | | | | | | | | | | | | | | | | | | |
| | | Actual Return | | | Hypothetical (5% return before expenses) | | | | | | | | | | |
| | | Beginning
Account
Value
July 1,
2016 | | | Ending
Account
Value
December 31,
2016 | | | Expenses paid
during the period
July 1, 2016 through December 31, 2016 | | | Beginning
Account
Value
July 1, 2016 | | | Ending
Account
Value
December 31,
2016 | | | Expenses paid
during the period
July 1, 2016 through December 31,
2016 | | | Annualized
expense
ratio | | | Days in
the
current
1/2 year | | | Days in
the full
year | |
Class IA | | $ | 1,000.00 | | | $ | 1,012.50 | | | $ | 3.29 | | | $ | 1,000.00 | | | $ | 1,021.87 | | | $ | 3.30 | | | | 0.65 | % | | | 184 | | | | 366 | |
Class IB | | $ | 1,000.00 | | | $ | 1,011.10 | | | $ | 4.55 | | | $ | 1,000.00 | | | $ | 1,020.61 | | | $ | 4.57 | | | | 0.90 | % | | | 184 | | | | 366 | |
Class IC | | $ | 1,000.00 | | | $ | 1,010.10 | | | $ | 5.81 | | | $ | 1,000.00 | | | $ | 1,019.36 | | | $ | 5.84 | | | | 1.15 | % | | | 184 | | | | 366 | |
Expense Examples (Unaudited) – (continued)
Hartford Healthcare HLS Fund
| | | | | | | | | | | | | | | | | | | | | | | | | | | | | | | | | | | | |
| | | Actual Return | | | Hypothetical (5% return before expenses) | | | | | | | | | | |
| | | Beginning
Account
Value
July 1,
2016 | | | Ending
Account
Value
December 31,
2016 | | | Expenses paid
during the period
July 1, 2016 through December 31, 2016 | | | Beginning
Account
Value
July 1, 2016 | | | Ending
Account
Value
December 31,
2016 | | | Expenses paid
during the period
July 1, 2016 through December 31,
2016 | | | Annualized
expense
ratio | | | Days in
the
current
1/2 year | | | Days in
the full
year | |
Class IA | | $ | 1,000.00 | | | $ | 979.10 | | | $ | 4.43 | | | $ | 1,000.00 | | | $ | 1,020.66 | | | $ | 4.52 | | | | 0.89 | % | | | 184 | | | | 366 | |
Class IB | | $ | 1,000.00 | | | $ | 977.90 | | | $ | 5.67 | | | $ | 1,000.00 | | | $ | 1,019.41 | | | $ | 5.79 | | | | 1.14 | % | | | 184 | | | | 366 | |
Hartford High Yield HLS Fund
| | | | | | | | | | | | | | | | | | | | | | | | | | | | | | | | | | | | |
| | | Actual Return | | | Hypothetical (5% return before expenses) | | | | | | | | | | |
| | | Beginning
Account
Value
July 1,
2016 | | | Ending
Account
Value
December 31,
2016 | | | Expenses paid
during the period
July 1, 2016 through December 31, 2016 | | | Beginning
Account
Value
July 1, 2016 | | | Ending
Account
Value
December 31,
2016 | | | Expenses paid
during the period
July 1, 2016 through December 31,
2016 | | | Annualized
expense
ratio | | | Days in
the
current
1/2 year | | | Days in
the full
year | |
Class IA | | $ | 1,000.00 | | | $ | 1,067.60 | | | $ | 4.11 | | | $ | 1,000.00 | | | $ | 1,021.17 | | | $ | 4.01 | | | | 0.79 | % | | | 184 | | | | 366 | |
Class IB | | $ | 1,000.00 | | | $ | 1,066.70 | | | $ | 5.40 | | | $ | 1,000.00 | | | $ | 1,019.91 | | | $ | 5.28 | | | | 1.04 | % | | | 184 | | | | 366 | |
Hartford International Opportunities HLS Fund
| | | | | | | | | | | | | | | | | | | | | | | | | | | | | | | | | | | | |
| | | Actual Return | | | Hypothetical (5% return before expenses) | | | | | | | | | | |
| | | Beginning
Account
Value
July 1,
2016 | | | Ending
Account
Value
December 31,
2016 | | | Expenses paid
during the period
July 1, 2016 through December 31, 2016 | | | Beginning
Account
Value
July 1, 2016 | | | Ending
Account
Value
December 31,
2016 | | | Expenses paid
during the period
July 1, 2016 through December 31,
2016 | | | Annualized
expense
ratio | | | Days in
the
current
1/2 year | | | Days in
the full
year | |
Class IA | | $ | 1,000.00 | | | $ | 1,042.70 | | | $ | 3.90 | | | $ | 1,000.00 | | | $ | 1,021.32 | | | $ | 3.86 | | | | 0.76 | % | | | 184 | | | | 366 | |
Class IB | | $ | 1,000.00 | | | $ | 1,041.30 | | | $ | 5.18 | | | $ | 1,000.00 | | | $ | 1,020.06 | | | $ | 5.13 | | | | 1.01 | % | | | 184 | | | | 366 | |
Hartford MidCap HLS Fund
| | | | | | | | | | | | | | | | | | | | | | | | | | | | | | | | | | | | |
| | | Actual Return | | | Hypothetical (5% return before expenses) | | | | | | | | | | |
| | | Beginning
Account
Value
July 1,
2016 | | | Ending
Account
Value
December 31,
2016 | | | Expenses paid
during the period
July 1, 2016 through December 31, 2016 | | | Beginning
Account
Value
July 1, 2016 | | | Ending
Account
Value
December 31,
2016 | | | Expenses paid
during the period
July 1, 2016 through December 31,
2016 | | | Annualized
expense
ratio | | | Days in
the
current
1/2 year | | | Days in
the full
year | |
Class IA | | $ | 1,000.00 | | | $ | 1,087.80 | | | $ | 3.67 | | | $ | 1,000.00 | | | $ | 1,021.62 | | | $ | 3.56 | | | | 0.70 | % | | | 184 | | | | 366 | |
Class IB | | $ | 1,000.00 | | | $ | 1,086.40 | | | $ | 4.98 | | | $ | 1,000.00 | | | $ | 1,020.36 | | | $ | 4.82 | | | | 0.95 | % | | | 184 | | | | 366 | |
Expense Examples (Unaudited) – (continued)
Hartford MidCap Value HLS Fund
| | | | | | | | | | | | | | | | | | | | | | | | | | | | | | | | | | | | |
| | | Actual Return | | | Hypothetical (5% return before expenses) | | | | | | | | | | |
| | | Beginning
Account
Value
July 1,
2016 | | | Ending
Account
Value
December 31,
2016 | | | Expenses paid
during the period
July 1, 2016 through December 31, 2016 | | | Beginning
Account
Value
July 1, 2016 | | | Ending
Account
Value
December 31,
2016 | | | Expenses paid
during the period
July 1, 2016 through December 31,
2016 | | | Annualized
expense
ratio | | | Days in
the
current
1/2 year | | | Days in
the full
year | |
Class IA | | $ | 1,000.00 | | | $ | 1,117.30 | | | $ | 4.58 | | | $ | 1,000.00 | | | $ | 1,020.81 | | | $ | 4.37 | | | | 0.86 | % | | | 184 | | | | 366 | |
Class IB | | $ | 1,000.00 | | | $ | 1,115.50 | | | $ | 5.90 | | | $ | 1,000.00 | | | $ | 1,019.56 | | | $ | 5.63 | | | | 1.11 | % | | | 184 | | | | 366 | |
Hartford Small Cap Growth HLS Fund
| | | | | | | | | | | | | | | | | | | | | | | | | | | | | | | | | | | | |
| | | Actual Return | | | Hypothetical (5% return before expenses) | | | | | | | | | | |
| | | Beginning
Account
Value
July 1,
2016 | | | Ending
Account
Value
December 31,
2016 | | | Expenses paid
during the period
July 1, 2016 through December 31, 2016 | | | Beginning
Account
Value
July 1, 2016 | | | Ending
Account
Value
December 31,
2016 | | | Expenses paid
during the period
July 1, 2016 through December 31,
2016 | | | Annualized
expense
ratio | | | Days in
the
current
1/2 year | | | Days in
the full
year | |
Class IA | | $ | 1,000.00 | | | $ | 1,132.40 | | | $ | 3.48 | | | $ | 1,000.00 | | | $ | 1,021.87 | | | $ | 3.30 | | | | 0.65 | % | | | 184 | | | | 366 | |
Class IB | | $ | 1,000.00 | | | $ | 1,131.00 | | | $ | 4.82 | | | $ | 1,000.00 | | | $ | 1,020.61 | | | $ | 4.57 | | | | 0.90 | % | | | 184 | | | | 366 | |
Hartford Small Company HLS Fund
| | | | | | | | | | | | | | | | | | | | | | | | | | | | | | | | | | | | |
| | | Actual Return | | | Hypothetical (5% return before expenses) | | | | | | | | | | |
| | | Beginning
Account
Value
July 1,
2016 | | | Ending
Account
Value
December 31,
2016 | | | Expenses paid
during the period
July 1, 2016 through December 31, 2016 | | | Beginning
Account
Value
July 1, 2016 | | | Ending
Account
Value
December 31,
2016 | | | Expenses paid
during the period
July 1, 2016 through December 31,
2016 | | | Annualized
expense
ratio | | | Days in
the
current
1/2 year | | | Days in
the full
year | |
Class IA | | $ | 1,000.00 | | | $ | 1,089.50 | | | $ | 3.99 | | | $ | 1,000.00 | | | $ | 1,021.32 | | | $ | 3.86 | | | | 0.76 | % | | | 184 | | | | 366 | |
Class IB | | $ | 1,000.00 | | | $ | 1,088.10 | | | $ | 5.30 | | | $ | 1,000.00 | | | $ | 1,020.06 | | | $ | 5.13 | | | | 1.01 | % | | | 184 | | | | 366 | |
Hartford Small/Mid Cap Equity HLS Fund
| | | | | | | | | | | | | | | | | | | | | | | | | | | | | | | | | | | | |
| | | Actual Return | | | Hypothetical (5% return before expenses) | | | | | | | | | | |
| | | Beginning
Account
Value
July 1,
2016 | | | Ending
Account
Value
December 31,
2016 | | | Expenses paid
during the period
July 1, 2016 through December 31, 2016 | | | Beginning
Account
Value
July 1, 2016 | | | Ending
Account
Value
December 31,
2016 | | | Expenses paid
during the period
July 1, 2016 through December 31,
2016 | | | Annualized
expense
ratio | | | Days in
the
current
1/2 year | | | Days in
the full
year | |
Class IA | | $ | 1,000.00 | | | $ | 1,154.00 | | | $ | 4.98 | | | $ | 1,000.00 | | | $ | 1,020.51 | | | $ | 4.67 | | | | 0.92 | % | | | 184 | | | | 366 | |
Class IB | | $ | 1,000.00 | | | $ | 1,154.00 | | | $ | 6.33 | | | $ | 1,000.00 | | | $ | 1,019.26 | | | $ | 5.94 | | | | 1.17 | % | | | 184 | | | | 366 | |
Expense Examples (Unaudited) – (continued)
Hartford Stock HLS Fund
| | | | | | | | | | | | | | | | | | | | | | | | | | | | | | | | | | | | |
| | | Actual Return | | | Hypothetical (5% return before expenses) | | | | | | | | | | |
| | | Beginning
Account
Value
July 1,
2016 | | | Ending
Account
Value
December 31,
2016 | | | Expenses paid
during the period
July 1, 2016 through December 31, 2016 | | | Beginning
Account
Value
July 1, 2016 | | | Ending
Account
Value
December 31,
2016 | | | Expenses paid
during the period
July 1, 2016 through December 31,
2016 | | | Annualized
expense
ratio | | | Days in
the
current
1/2 year | | | Days in
the full
year | |
Class IA | | $ | 1,000.00 | | | $ | 1,017.30 | | | $ | 2.64 | | | $ | 1,000.00 | | | $ | 1,022.52 | | | $ | 2.64 | | | | 0.52 | % | | | 184 | | | | 366 | |
Class IB | | $ | 1,000.00 | | | $ | 1,016.00 | | | $ | 3.90 | | | $ | 1,000.00 | | | $ | 1,021.27 | | | $ | 3.91 | | | | 0.77 | % | | | 184 | | | | 366 | |
Hartford Total Return Bond HLS Fund
| | | | | | | | | | | | | | | | | | | | | | | | | | | | | | | | | | | | |
| | | Actual Return | | | Hypothetical (5% return before expenses) | | | | | | | | | | |
| | | Beginning
Account
Value
July 1,
2016 | | | Ending
Account
Value
December 31,
2016 | | | Expenses paid
during the period
July 1, 2016 through December 31, 2016 | | | Beginning
Account
Value
July 1, 2016 | | | Ending
Account
Value
December 31,
2016 | | | Expenses paid
during the period
July 1, 2016 through December 31,
2016 | | | Annualized
expense
ratio | | | Days in
the
current
1/2 year | | | Days in
the full
year | |
Class IA | | $ | 1,000.00 | | | $ | 990.60 | | | $ | 2.55 | | | $ | 1,000.00 | | | $ | 1,022.57 | | | $ | 2.59 | | | | 0.51 | % | | | 184 | | | | 366 | |
Class IB | | $ | 1,000.00 | | | $ | 989.40 | | | $ | 3.80 | | | $ | 1,000.00 | | | $ | 1,021.32 | | | $ | 3.86 | | | | 0.76 | % | | | 184 | | | | 366 | |
Hartford Ultrashort Bond HLS Fund
| | | | | | | | | | | | | | | | | | | | | | | | | | | | | | | | | | | | |
| | | Actual Return | | | Hypothetical (5% return before expenses) | | | | | | | | | | |
| | | Beginning
Account
Value
July 1,
2016 | | | Ending
Account
Value
December 31,
2016 | | | Expenses paid
during the period
July 1, 2016 through December 31, 2016 | | | Beginning
Account
Value
July 1, 2016 | | | Ending
Account
Value
December 31,
2016 | | | Expenses paid
during the period
July 1, 2016 through December 31,
2016 | | | Annualized
expense
ratio | | | Days in
the
current
1/2 year | | | Days in
the full
year | |
Class IA | | $ | 1,000.00 | | | $ | 1,003.60 | | | $ | 2.27 | | | $ | 1,000.00 | | | $ | 1,022.87 | | | $ | 2.29 | | | | 0.45 | % | | | 184 | | | | 366 | |
Class IB | | $ | 1,000.00 | | | $ | 1,001.40 | | | $ | 3.52 | | | $ | 1,000.00 | | | $ | 1,021.62 | | | $ | 3.56 | | | | 0.70 | % | | | 184 | | | | 366 | |
Hartford U.S. Government Securities HLS Fund
| | | | | | | | | | | | | | | | | | | | | | | | | | | | | | | | | | | | |
| | | Actual Return | | | Hypothetical (5% return before expenses) | | | | | | | | | | |
| | | Beginning
Account
Value
July 1,
2016 | | | Ending
Account
Value
December 31,
2016 | | | Expenses paid
during the period
July 1, 2016 through December 31, 2016 | | | Beginning
Account
Value
July 1, 2016 | | | Ending
Account
Value
December 31,
2016 | | | Expenses paid
during the period
July 1, 2016 through December 31,
2016 | | | Annualized
expense
ratio | | | Days in
the
current
1/2 year | | | Days in
the full
year | |
Class IA | | $ | 1,000.00 | | | $ | 979.40 | | | $ | 2.54 | | | $ | 1,000.00 | | | $ | 1,022.57 | | | $ | 2.59 | | | | 0.51 | % | | | 184 | | | | 366 | |
Class IB | | $ | 1,000.00 | | | $ | 978.50 | | | $ | 3.78 | | | $ | 1,000.00 | | | $ | 1,021.32 | | | $ | 3.86 | | | | 0.76 | % | | | 184 | | | | 366 | |
Expense Examples (Unaudited) – (continued)
Hartford Value HLS Fund
| | | | | | | | | | | | | | | | | | | | | | | | | | | | | | | | | | | | |
| | | Actual Return | | | Hypothetical (5% return before expenses) | | | | | | | | | | |
| | | Beginning
Account
Value
July 1,
2016 | | | Ending
Account
Value
December 31,
2016 | | | Expenses paid
during the period
July 1, 2016 through December 31, 2016 | | | Beginning
Account
Value
July 1, 2016 | | | Ending
Account
Value
December 31,
2016 | | | Expenses paid
during the period
July 1, 2016 through December 31,
2016 | | | Annualized
expense
ratio | | | Days in
the
current
1/2 year | | | Days in
the full
year | |
Class IA | | $ | 1,000.00 | | | $ | 1,090.70 | | | $ | 4.20 | | | $ | 1,000.00 | | | $ | 1,021.12 | | | $ | 4.06 | | | | 0.80 | % | | | 184 | | | | 366 | |
Class IB | | $ | 1,000.00 | | | $ | 1,089.80 | | | $ | 5.52 | | | $ | 1,000.00 | | | $ | 1,019.86 | | | $ | 5.33 | | | | 1.05 | % | | | 184 | | | | 366 | |
|
| Hartford Balanced HLS Fund |
Schedule of Investments
December 31, 2016
| | | | | | | | |
Shares or Principal Amount | | Market Value† | |
| Common Stocks - 62.8% | | | |
| | | | Banks - 7.0% | | | |
| | 906,070 | | | Bank of America Corp. | | $ | 20,024,147 | |
| | 548,590 | | | Citigroup, Inc. | | | 32,602,704 | |
| | 485,870 | | | JP Morgan Chase & Co. | | | 41,925,722 | |
| | 220,880 | | | PNC Financial Services Group, Inc. | | | 25,834,125 | |
| | 756,140 | | | Wells Fargo & Co. | | | 41,670,875 | |
| | | | | | | | |
| | | | | | | 162,057,573 | |
| | | | | | | | |
| | | | Capital Goods - 4.8% | | | |
| | 185,530 | | | 3M Co. | | | 33,130,092 | |
| | 362,060 | | | Eaton Corp. plc | | | 24,290,606 | |
| | 352,730 | | | Fortune Brands Home & Security, Inc. | | | 18,856,946 | |
| | 250,760 | | | Ingersoll-Rand plc | | | 18,817,030 | |
| | 138,640 | | | United Technologies Corp. | | | 15,197,717 | |
| | | | | | | | |
| | | | | | | 110,292,391 | |
| | | | | | | | |
| | | | Commercial & Professional Services - 0.5% | | | |
| | 297,750 | | | Nielsen Holdings plc | | | 12,490,613 | |
| | | | | | | | |
| | | | Consumer Durables & Apparel - 1.3% | | | |
| | 296,300 | | | NIKE, Inc. Class B | | | 15,060,929 | |
| | 794,630 | | | PulteGroup, Inc. | | | 14,605,299 | |
| | | | | | | | |
| | | | | | | 29,666,228 | |
| | | | | | | | |
| | | | Consumer Services - 1.6% | | | |
| | 809,900 | | | Hilton Worldwide Holdings, Inc. | | | 22,029,280 | |
| | 333,020 | | | Norwegian Cruise Line Holdings Ltd.* | | | 14,163,341 | |
| | | | | | | | |
| | | | | | | 36,192,621 | |
| | | | | | | | |
| | | | Diversified Financials - 2.2% | | | |
| | 45,050 | | | BlackRock, Inc. | | | 17,143,327 | |
| | 601,400 | | | Invesco Ltd. | | | 18,246,476 | |
| | 369,870 | | | Thomson Reuters Corp. | | | 16,192,909 | |
| | | | | | | | |
| | | | | | | 51,582,712 | |
| | | | | | | | |
| | | | Energy - 5.0% | | | |
| | 162,260 | | | Anadarko Petroleum Corp. | | | 11,314,390 | |
| | 228,185 | | | Chevron Corp. | | | 26,857,374 | |
| | 150,530 | | | EOG Resources, Inc. | | | 15,218,583 | |
| | 229,230 | | | Exxon Mobil Corp. | | | 20,690,300 | |
| | 352,070 | | | Halliburton Co. | | | 19,043,466 | |
| | 568,460 | | | Marathon Oil Corp. | | | 9,840,043 | |
| | 383,910 | | | Suncor Energy, Inc. | | | 12,550,018 | |
| | | | | | | | |
| | | | | | | 115,514,174 | |
| | | | | | | | |
| | | | Food & Staples Retailing - 0.4% | | | |
| | 111,830 | | | CVS Health Corp. | | | 8,824,505 | |
| | | | | | | | |
| | | | Food, Beverage & Tobacco - 3.6% | | | |
| | 105,930 | | | Anheuser-Busch InBev N.V. ADR | | | 11,169,259 | |
| | 310,834 | | | British American Tobacco plc | | | 17,616,630 | |
| | 182,866 | | | Kraft Heinz Co. | | | 15,967,859 | |
| | 443,880 | | | Mondelez International, Inc. Class A | | | 19,677,200 | |
| | 222,330 | | | Philip Morris International, Inc. | | | 20,340,972 | |
| | | | | | | | |
| | | | | | | 84,771,920 | |
| | | | | | | | |
| | | | Health Care Equipment & Services - 2.8% | | | |
| | 475,895 | | | Medtronic plc | | | 33,898,001 | |
| | 193,860 | | | UnitedHealth Group, Inc. | | | 31,025,354 | |
| | | | | | | | |
| | | | | | | 64,923,355 | |
| | | | | | | | |
| | | | Insurance - 2.5% | | | |
| | 353,830 | | | American International Group, Inc. | | | 23,108,637 | |
| | 358,090 | | | Marsh & McLennan Cos., Inc. | | | 24,203,303 | |
| | 228,580 | | | Unum Group | | | 10,041,520 | |
| | | | | | | | |
| | | | | | | 57,353,460 | |
| | | | | | | | |
| | | | | | | | |
Shares or Principal Amount | | Market Value† | |
| Common Stocks - 62.8% - (continued) | | | |
| | | | Materials - 1.7% | | | |
| | 393,310 | | | Dow Chemical Co. | | $ | 22,505,198 | |
| | 305,280 | | | International Paper Co. | | | 16,198,157 | |
| | | | | | | | |
| | | | | | | 38,703,355 | |
| | | | | | | | |
| | | | Media - 1.9% | | | |
| | 362,180 | | | CBS Corp. Class B | | | 23,041,892 | |
| | 300,590 | | | Comcast Corp. Class A | | | 20,755,739 | |
| | | | | | | | |
| | | | | | | 43,797,631 | |
| | | | | | | | |
| | | | Pharmaceuticals, Biotechnology & Life Sciences - 7.6% | |
| | 105,140 | | | Allergan plc* | | | 22,080,451 | |
| | 143,330 | | | Amgen, Inc. | | | 20,956,279 | |
| | 609,960 | | | AstraZeneca plc ADR | | | 16,664,107 | |
| | 504,280 | | | Bristol-Myers Squibb Co. | | | 29,470,123 | |
| | 174,400 | | | Eisai Co., Ltd. | | | 9,994,403 | |
| | 592,930 | | | Merck & Co., Inc. | | | 34,905,789 | |
| | 79,844 | | | Roche Holding AG | | | 18,200,645 | |
| | 198,337 | | | UCB S.A. | | | 12,689,789 | |
| | 153,500 | | | Vertex Pharmaceuticals, Inc.* | | | 11,308,345 | |
| | | | | | | | |
| | | | | | | 176,269,931 | |
| | | | | | | | |
| | | | Retailing - 2.6% | | | |
| | 11,702,200 | | | Allstar Co.*(1)(2)(3) | | | 12,170,288 | |
| | 209,290 | | | Home Depot, Inc. | | | 28,061,603 | |
| | 570,700 | | | Liberty Interactive Corp. QVC Group Class A* | | | 11,402,586 | |
| | 163,241 | | | Tory Burch LLC*(1)(2)(3) | | | 7,713,116 | |
| | | | | | | | |
| | | | | | | 59,347,593 | |
| | | | | | | | |
| | | | Semiconductors & Semiconductor Equipment - 4.0% | |
| | 335,450 | | | Analog Devices, Inc. | | | 24,360,379 | |
| | 907,330 | | | Intel Corp. | | | 32,908,859 | |
| | 366,300 | | | Maxim Integrated Products, Inc. | | | 14,128,191 | |
| | 328,760 | | | QUALCOMM, Inc. | | | 21,435,152 | |
| | | | | | | | |
| | | | | | | 92,832,581 | |
| | | | | | | | |
| | | | Software & Services - 5.8% | | | |
| | 61,075 | | | Alphabet, Inc. Class C* | | | 47,138,906 | |
| | 299,500 | | | Cognizant Technology Solutions Corp. Class A* | | | 16,780,985 | |
| | 512,840 | | | eBay, Inc.* | | | 15,226,220 | |
| | 886,450 | | | Microsoft Corp. | | | 55,084,003 | |
| | | | | | | | |
| | | | | | | 134,230,114 | |
| | | | | | | | |
| | | | Technology Hardware & Equipment - 4.8% | |
| | 583,110 | | | Apple, Inc. | | | 67,535,800 | |
| | 1,474,030 | | | Cisco Systems, Inc. | | | 44,545,187 | |
| | | | | | | | |
| | | | | | | 112,080,987 | |
| | | | | | | | |
| | | | Telecommunication Services - 0.4% | | | |
| | 180,690 | | | Verizon Communications, Inc. | | | 9,645,232 | |
| | | | | | | | |
| | | | Transportation - 0.9% | | | | |
| | 212,500 | | | Union Pacific Corp. | | | 22,032,000 | |
| | | | | | | | |
| | | | Utilities - 1.4% | | | | |
| | 282,140 | | | NextEra Energy, Inc. | | | 33,704,444 | |
| | | | | | | | |
| | | | Total Common Stocks
(cost $1,074,514,531) | | $ | 1,456,313,420 | |
| | | | | | | | |
| Asset & Commercial Mortgage Backed Securities - 3.0% | |
| | | | Asset-Backed-Automobile - 0.7% | | | |
| $ | 225,000 | | | CarMax Auto Owner Trust
1.95%, 09/16/2019 | | $ | 226,181 | |
| | 2,320,000 | | | Chesapeake Funding II LLC
1.70%, 06/15/2028(1)(4) | | | 2,332,760 | |
The accompanying notes are an integral part of these financial statements.
|
| Hartford Balanced HLS Fund |
Schedule of Investments – (continued)
December 31, 2016
| | | | | | | | |
Shares or Principal Amount | | Market Value† | |
| Asset & Commercial Mortgage Backed Securities - 3.0% - (continued) | |
| | | | Asset-Backed-Automobile - 0.7% - (continued) | |
| $ | 690,722 | | | Chesapeake Funding LLC
1.15%, 02/07/2027(1)(4) | | $ | 689,829 | |
| | 465,584 | | | Drive Auto Receivables Trust
2.12%, 06/17/2019(1) | | | 466,083 | |
| | 422,860 | | | Exeter Automobile Receivables Trust
1.54%, 11/15/2019(1) | | | 422,938 | |
| | 1,311,330 | | | First Investors Auto Owner Trust
1.67%, 11/16/2020(1) | | | 1,311,907 | |
| | 515,000 | | | Hyundai Automotive Receivables Trust
2.48%, 03/15/2019 | | | 520,882 | |
| | 600,000 | | | Prestige Automotive Receivables Trust
1.91%, 04/15/2020(1) | | | 601,308 | |
| | | | Santander Drive Auto Receivables Trust | | | | |
| | 1,630,000 | | | 1.97%, 11/15/2019 | | | 1,633,420 | |
| | 504,602 | | | 2.25%, 06/17/2019 | | | 506,258 | |
| | 400,000 | | | 2.33%, 11/15/2019 | | | 402,000 | |
| | 2,154,589 | | | 2.36%, 04/15/2020 | | | 2,163,697 | |
| | 655,000 | | | 2.57%, 03/15/2019 | | | 659,911 | |
| | 1,785,000 | | | Securitized Term Auto Receivables Trust
1.52%, 03/25/2020(1) | | | 1,774,586 | |
| | | | Westlake Automobile Receivables Trust | | | | |
| | 730,000 | | | 1.57%, 06/17/2019(1) | | | 730,639 | |
| | 1,355,000 | | | 1.83%, 01/15/2021(1) | | | 1,357,101 | |
| | 390,000 | | | Wheels SPV LLC
1.59%, 05/20/2025(1) | | | 388,674 | |
| | | | | | | | |
| | | | | | | 16,188,174 | |
| | | | | | | | |
| | | | Asset-Backed-Credit Card - 0.4% | | | |
| | 2,665,000 | | | CARDS II Trust
1.40%, 07/15/2021(1)(4) | | | 2,675,188 | |
| | 3,275,000 | | | Evergreen Credit Card Trust
1.42%, 04/15/2020(1)(4) | | | 3,289,542 | |
| | 4,330,000 | | | Trillium Credit Card Trust II
1.48%, 05/26/2021(1)(4) | | | 4,340,933 | |
| | | | | | | | |
| | | | | | | 10,305,663 | |
| | | | | | | | |
| | | | Asset-Backed-Finance & Insurance - 0.9% | | | |
| | | | Ally Master Owner Trust | | | | |
| | 4,885,000 | | | 1.54%, 09/15/2019 | | | 4,891,948 | |
| | 4,890,000 | | | 1.60%, 10/15/2019 | | | 4,897,551 | |
| | 430,000 | | | Ford Credit Floorplan Master Owner Trust
2.09%, 03/15/2022(1) | | | 429,934 | |
| | | | MMAF Equipment Finance LLC | | | | |
| | 1,345,000 | | | 1.39%, 12/17/2018(1) | | | 1,345,481 | |
| | 1,000,000 | | | 2.21%, 12/15/2032(1) | | | 980,284 | |
| | | | OneMain Financial Issuance Trust | | | | |
| | 440,000 | | | 3.66%, 02/20/2029(1) | | | 445,989 | |
| | 870,000 | | | 4.10%, 03/20/2028(1) | | | 885,764 | |
| | 1,565,000 | | | SBA Tower Trust
2.90%, 10/15/2044(1) | | | 1,576,877 | |
| | | | Springleaf Funding Trust | | | | |
| | 1,765,000 | | | 3.16%, 11/15/2024(1) | | | 1,778,944 | |
| | 755,000 | | | 3.48%, 05/15/2028(1) | | | 758,014 | |
| | 1,965,000 | | | SPS Servicer Advance Receivables Trust
2.53%, 11/16/2048(1) | | | 1,959,919 | |
| | | | | | | | |
| | | | | | | 19,950,705 | |
| | | | | | | | |
| | | | Asset-Backed-Home Equity - 0.0% | | | |
| | 7,906 | | | New Century Home Equity Loan Trust
1.34%, 03/25/2035(4) | | | 7,896 | |
| | | | | | | | |
| | | | | | | | |
Shares or Principal Amount | | Market Value† | |
| Asset & Commercial Mortgage Backed Securities - 3.0% - (continued) | |
| | | | Commercial Mortgage-Backed Securities - 0.9% | |
| $ | 1,575,000 | | | Commercial Mortgage Trust
3.18%, 02/10/2048 | | $ | 1,586,042 | |
| | | | CSAIL Commercial Mortgage Trust | | | | |
| | 3,200,000 | | | 3.50%, 06/15/2057 | | | 3,276,107 | |
| | 3,400,000 | | | 3.51%, 04/15/2050 | | | 3,492,189 | |
| | | | JP Morgan Chase Commercial Mortgage Securities Trust | | | | |
| | 710,000 | | | 3.91%, 01/15/2049 | | | 748,391 | |
| | 1,356,692 | | | 5.71%, 02/12/2049(4) | | | 1,364,846 | |
| | 783,472 | | | LB-UBS Commercial Mortgage Trust
6.11%, 04/15/2041(4) | | | 812,239 | |
| | | | Merrill Lynch/Countrywide Commercial Mortgage Trust | | | | |
| | 2,896,919 | | | 5.73%, 06/12/2050(4) | | | 2,915,415 | |
| | | | Morgan Stanley Bank of America Merrill Lynch Trust | | | | |
| | 3,100,000 | | | 3.31%, 04/15/2048 | | | 3,123,043 | |
| | | | SFAVE Commercial Mortgage Securities Trust | | | | |
| | 2,500,000 | | | 4.14%, 01/05/2043(1)(4) | | | 2,483,092 | |
| | | | SG Commercial Mortgage Securities Trust | | | | |
| | 1,800,000 | | | 3.06%, 10/10/2048 | | | 1,746,518 | |
| | | | | | | | |
| | | | | | | 21,547,882 | |
| | | | | | | | |
| | | | Whole Loan Collateral CMO - 0.1% | |
| | | | Mill City Mortgage Loan Trust | | | | |
| | 588,690 | | | 2.50%, 04/25/2057(1)(4) | | | 586,030 | |
| | | | Towd Point Mortgage Trust | | | | |
| | 1,310,763 | | | 2.25%, 08/25/2055(1)(4) | | | 1,300,220 | |
| | | | | | | | |
| | | | | | | 1,886,250 | |
| | | | | | | | |
| | | | Total Asset & Commercial Mortgage Backed Securities (cost $70,679,704) | | $ | 69,886,570 | |
| | | | | | | | |
| Corporate Bonds - 19.6% | |
| | | | Advertising - 0.0% | |
| | | | Omnicom Group, Inc. | | | | |
| | 1,065,000 | | | 3.60%, 04/15/2026 | | $ | 1,054,000 | |
| | | | | | | | |
| | | | Aerospace/Defense - 0.2% | |
| | 850,000 | | | BAE Systems Holdings, Inc. 3.85%, 12/15/2025(1) | | | 866,895 | |
| | | | Lockheed Martin Corp. | |
| | 470,000 | | | 2.50%, 11/23/2020 | | | 473,972 | |
| | 1,625,000 | | | 4.07%, 12/15/2042 | | | 1,603,959 | |
| | 256,000 | | | 4.50%, 05/15/2036 | | | 272,174 | |
| | 640,000 | | | 4.70%, 05/15/2046 | | | 696,145 | |
| | 560,000 | | | 4.85%, 09/15/2041 | | | 616,282 | |
| | | | | | | | |
| | | | | | | 4,529,427 | |
| | | | | | | | |
| | | | Agriculture - 0.4% | |
| | | | Altria Group, Inc. | |
| | 560,000 | | | 4.50%, 05/02/2043 | | | 569,169 | |
| | 1,995,000 | | | 4.75%, 05/05/2021 | | | 2,174,147 | |
| | | | BAT International Finance plc | |
| | 685,000 | | | 2.75%, 06/15/2020(1) | | | 688,664 | |
| | 2,775,000 | | | 3.25%, 06/07/2022(1) | | | 2,815,978 | |
| | 290,000 | | | 3.50%, 06/15/2022(1) | | | 297,232 | |
| | 1,065,000 | | | Imperial Brands Finance plc 3.75%, 07/21/2022(1) | | | 1,093,298 | |
The accompanying notes are an integral part of these financial statements.
|
| Hartford Balanced HLS Fund |
Schedule of Investments – (continued)
December 31, 2016
| | | | | | | | |
Shares or Principal Amount | | Market Value† | |
| Corporate Bonds - 19.6% - (continued) | |
| | | | Agriculture - 0.4% - (continued) | |
| | | | Philip Morris International, Inc. | |
| $ | 325,000 | | | 4.88%, 11/15/2043 | | $ | 349,579 | |
| | 270,000 | | | 5.65%, 05/16/2018 | | | 284,578 | |
| | | | | | | | |
| | | | | | | 8,272,645 | |
| | | | | | | | |
| | | | Airlines - 0.3% | |
| | | | Continental Airlines, Inc. | | | | |
| | 3,123,418 | | | 5.98%, 10/19/2023 | | | 3,451,377 | |
| | 2,331,987 | | | Southwest Airlines Co. 6.15%, 02/01/2024 | | | 2,588,506 | |
| | | | | | | | |
| | | | | | | 6,039,883 | |
| | | | | | | | |
| | | | Auto Manufacturers - 0.4% | |
| | | | Daimler Finance North America LLC | | | | |
| | 150,000 | | | 2.25%, 07/31/2019(1) | | | 150,198 | |
| | | | Ford Motor Co. | | | | |
| | 665,000 | | | 4.35%, 12/08/2026 | | | 671,981 | |
| | | | Ford Motor Credit Co. LLC | |
| | 2,985,000 | | | 2.38%, 03/12/2019 | | | 2,983,230 | |
| | 1,725,000 | | | 3.16%, 08/04/2020 | | | 1,737,824 | |
| | | | General Motors Financial Co., Inc. | |
| | 1,400,000 | | | 3.70%, 05/09/2023 | | | 1,377,582 | |
| | 1,785,000 | | | 4.20%, 03/01/2021 | | | 1,841,668 | |
| | 580,000 | | | Volkswagen Group of America Finance LLC 2.45%, 11/20/2019(1) | | | 578,557 | |
| | | | | | | | |
| | | | | | | 9,341,040 | |
| | | | | | | | |
| | | | Beverages - 0.5% | |
| | | | Anheuser-Busch InBev Finance, Inc. | |
| | 1,750,000 | | | 3.65%, 02/01/2026 | | | 1,776,582 | |
| | 2,360,000 | | | 4.70%, 02/01/2036 | | | 2,482,408 | |
| | 280,000 | | | 4.90%, 02/01/2046 | | | 302,644 | |
| | | | Anheuser-Busch InBev Worldwide, Inc. | |
| | 480,000 | | | 3.75%, 07/15/2042 | | | 431,709 | |
| | 3,205,000 | | | 7.75%, 01/15/2019 | | | 3,569,947 | |
| | | | Coca-Cola Femsa S.A.B. de C.V. | |
| | 1,176,000 | | | 2.38%, 11/26/2018 | | | 1,184,167 | |
| | 1,300,000 | | | 3.88%, 11/26/2023 | | | 1,326,884 | |
| | | | Molson Coors Brewing Co. | |
| | 765,000 | | | 3.50%, 05/01/2022 | | | 787,469 | |
| | 215,000 | | | 5.00%, 05/01/2042 | | | 224,751 | |
| | | | | | | | |
| | | | | | | 12,086,561 | |
| | | | | | | | |
| | | | Biotechnology - 0.2% | |
| | | | Amgen, Inc. | | | | |
| | 265,000 | | | 4.56%, 06/15/2048(1) | | | 256,323 | |
| | | | Biogen, Inc. | |
| | 1,340,000 | | | 2.90%, 09/15/2020 | | | 1,357,090 | |
| | | | Celgene Corp. | |
| | 230,000 | | | 2.25%, 05/15/2019 | | | 230,131 | |
| | 770,000 | | | 3.55%, 08/15/2022 | | | 789,704 | |
| | 535,000 | | | 3.63%, 05/15/2024 | | | 537,615 | |
| | | | Gilead Sciences, Inc. | |
| | 335,000 | | | 2.55%, 09/01/2020 | | | 338,531 | |
| | 930,000 | | | 3.70%, 04/01/2024 | | | 954,575 | |
| | | | | | | | |
| | | | | | | 4,463,969 | |
| | | | | | | | |
| | | | Chemicals - 0.2% | |
| | | | Agrium, Inc. | | | | |
| | 2,750,000 | | | 3.15%, 10/01/2022 | | | 2,734,017 | |
| | | | LyondellBasell Industries N.V. | | | | |
| | 1,145,000 | | | 4.63%, 02/26/2055 | | | 1,063,984 | |
| | | | | | | | |
Shares or Principal Amount | | Market Value† | |
| Corporate Bonds - 19.6% - (continued) | |
| | | | Chemicals - 0.2% - (continued) | |
| | | | Monsanto Co. | | | | |
| $ | 300,000 | | | 4.70%, 07/15/2064 | | $ | 270,210 | |
| | | | | | | | |
| | | | | | | 4,068,211 | |
| | | | | | | | |
| | | | Commercial Banks - 4.9% | |
| | | | American Express Centurion Bank | | | | |
| | 4,300,000 | | | 6.00%, 09/13/2017 | | | 4,432,930 | |
| | | | Bank of America Corp. | |
| | 1,220,000 | | | 2.63%, 10/19/2020 | | | 1,220,697 | |
| | 2,950,000 | | | 4.20%, 08/26/2024 | | | 3,005,177 | |
| | 1,655,000 | | | 5.00%, 05/13/2021 | | | 1,802,358 | |
| | 1,000,000 | | | 6.40%, 08/28/2017 | | | 1,030,665 | |
| | 6,000,000 | | | 6.88%, 04/25/2018 | | | 6,377,460 | |
| | | | Bank of New York Mellon Corp. | | | | |
| | 2,020,000 | | | 2.15%, 02/24/2020 | | | 2,014,051 | |
| | | | Banque Federative du Credit Mutuel S.A. | | | | |
| | 2,830,000 | | | 2.75%, 10/15/2020(1) | | | 2,839,520 | |
| | | | Barclays Bank plc | | | | |
| | 800,000 | | | 6.05%, 12/04/2017(1) | | | 826,470 | |
| | | | Barclays plc | | | | |
| | 2,740,000 | | | 3.20%, 08/10/2021 | | | 2,708,191 | |
| | | | BNP Paribas S.A. | | | | |
| | 2,075,000 | | | 2.40%, 12/12/2018 | | | 2,091,295 | |
| | | | BPCE S.A. | |
| | 365,000 | | | 2.50%, 12/10/2018 | | | 368,202 | |
| | 1,075,000 | | | 4.00%, 04/15/2024 | | | 1,115,864 | |
| | 1,475,000 | | | 5.15%, 07/21/2024(1) | | | 1,499,494 | |
| | | | Capital One Financial Corp. | |
| | 2,875,000 | | | 3.75%, 04/24/2024 | | | 2,912,432 | |
| | 815,000 | | | 4.20%, 10/29/2025 | | | 817,711 | |
| | | | Citigroup, Inc. | |
| | 1,220,000 | | | 2.50%, 07/29/2019 | | | 1,228,363 | |
| | 533,000 | | | 5.30%, 05/06/2044 | | | 574,134 | |
| | 290,000 | | | 8.13%, 07/15/2039 | | | 430,921 | |
| | | | Citizens Bank NA | | | | |
| | 1,695,000 | | | 2.55%, 05/13/2021 | | | 1,684,594 | |
| | | | Compass Bank | | | | |
| �� | 505,000 | | | 2.75%, 09/29/2019 | | | 502,251 | |
| | | | Credit Agricole S.A. | |
| | 950,000 | | | 2.50%, 04/15/2019(1) | | | 955,243 | |
| | 790,000 | | | 4.38%, 03/17/2025(1) | | | 774,745 | |
| | | | Credit Suisse AG | |
| | 945,000 | | | 2.30%, 05/28/2019 | | | 947,312 | |
| | 855,000 | | | 3.00%, 10/29/2021 | | | 863,170 | |
| | 250,000 | | | 3.63%, 09/09/2024 | | | 251,670 | |
| | | | Credit Suisse Group Funding Guernsey Ltd. | |
| | 1,425,000 | | | 3.75%, 03/26/2025 | | | 1,403,343 | |
| | 1,885,000 | | | 3.80%, 09/15/2022 | | | 1,901,716 | |
| | | | Deutsche Bank AG | | | | |
| | 2,210,000 | | | 4.25%, 10/14/2021(1) | | | 2,218,522 | |
| | | | Goldman Sachs Group, Inc. | |
| | 3,335,000 | | | 2.38%, 01/22/2018 | | | 3,354,827 | |
| | 1,700,000 | | | 6.15%, 04/01/2018 | | | 1,788,255 | |
| | 2,590,000 | | | 6.25%, 02/01/2041 | | | 3,210,479 | |
| | | | HSBC Holdings plc | |
| | 1,030,000 | | | 3.40%, 03/08/2021 | | | 1,047,385 | |
| | 4,625,000 | | | 3.60%, 05/25/2023 | | | 4,651,816 | |
| | | | Huntington National Bank | |
| | 2,120,000 | | | 2.20%, 11/06/2018 | | | 2,126,000 | |
| | 760,000 | | | 2.20%, 04/01/2019 | | | 760,666 | |
| | 1,490,000 | | | 2.40%, 04/01/2020 | | | 1,482,613 | |
The accompanying notes are an integral part of these financial statements.
|
| Hartford Balanced HLS Fund |
Schedule of Investments – (continued)
December 31, 2016
| | | | | | | | |
Shares or Principal Amount | | Market Value† | |
| Corporate Bonds - 19.6% - (continued) | |
| | | | Commercial Banks - 4.9% - (continued) | |
| | | | ING Bank N.V. | | | | |
| $ | 5,200,000 | | | 3.75%, 03/07/2017(1) | | $ | 5,221,991 | |
| | | | JP Morgan Chase & Co. | |
| | 2,240,000 | | | 3.25%, 09/23/2022 | | | 2,265,290 | |
| | 2,000,000 | | | 4.95%, 03/25/2020 | | | 2,154,916 | |
| | 705,000 | | | 5.40%, 01/06/2042 | | | 826,041 | |
| | | | Korea Development Bank | | | | |
| | 2,600,000 | | | 2.50%, 03/11/2020 | | | 2,591,527 | |
| | | | Macquarie Bank Ltd. | | | | |
| | 470,000 | | | 2.40%, 01/21/2020(1) | | | 465,761 | |
| | | | Morgan Stanley | |
| | 4,875,000 | | | 2.50%, 01/24/2019 | | | 4,926,246 | |
| | 1,450,000 | | | 3.13%, 07/27/2026 | | | 1,385,295 | |
| | 1,000,000 | | | 3.70%, 10/23/2024 | | | 1,011,912 | |
| | 515,000 | | | 4.30%, 01/27/2045 | | | 513,233 | |
| | 250,000 | | | 5.63%, 09/23/2019 | | | 270,990 | |
| | | | National City Corp. | | | | |
| | 4,250,000 | | | 6.88%, 05/15/2019 | | | 4,677,911 | |
| | | | Santander Bank NA | | | | |
| | 4,795,000 | | | 8.75%, 05/30/2018 | | | 5,160,791 | |
| | | | Santander Issuances SAU | | | | |
| | 1,000,000 | | | 5.18%, 11/19/2025 | | | 1,009,403 | |
| | | | Santander UK plc | |
| | 2,200,000 | | | 2.50%, 03/14/2019 | | | 2,212,848 | |
| | 2,150,000 | | | 5.00%, 11/07/2023(1) | | | 2,187,247 | |
| | | | SunTrust Bank | | | | |
| | 640,000 | | | 3.30%, 05/15/2026 | | | 617,725 | |
| | | | UBS Group Funding Jersey Ltd. | |
| | 1,665,000 | | | 2.95%, 09/24/2020(1) | | | 1,665,734 | |
| | 1,900,000 | | | 3.00%, 04/15/2021(1) | | | 1,901,001 | |
| | | | Wachovia Corp. | | | | |
| | 1,000,000 | | | 5.75%, 06/15 /2017 | | | 1,019,045 | |
| | | | Wells Fargo & Co. | |
| | 4,344,000 | | | 4.48%, 01/16/2024 | | | 4,572,755 | |
| | 850,000 | | | 4.75%, 12/07/2046 | | | 862,628 | |
| | | | | | | | |
| | | | | | | 114,740,832 | |
| | | | | | | | |
| | | | Commercial Services - 0.4% | | | |
| | | | Catholic Health Initiatives | | | | |
| | 765,000 | | | 2.60%, 08/01/2018 | | | 772,482 | |
| | 1,340,000 | | | 2.95%, 11/01/2022 | | | 1,303,713 | |
| | 245,000 | | | 4.35%, 11/01/2042 | | | 217,621 | |
| | | | ERAC USA Finance LLC | | | | |
| | 655,000 | | | 2.35%, 10/15/2019(1) | | | 654,418 | |
| | 340,000 | | | 2.75%, 03/15/2017(1) | | | 340,911 | |
| | 1,800,000 | | | 4.50%, 08/16/2021(1) | | | 1,920,289 | |
| | 1,500,000 | | | 5.63%, 03/15/2042(1) | | | 1,653,417 | |
| | | | Total System Services, Inc. | | | | |
| | 2,545,000 | | | 3.80%, 04/01/2021 | | | 2,626,814 | |
| | | | | | | | |
| | | | | | | 9,489,665 | |
| | | | | | | | |
| | | | Construction Materials - 0.0% | | | |
| | | | LafargeHolcim Finance US LLC | | | | |
| | 656,000 | | | 4.75%, 09/22/2046(1) | | | 634,450 | |
| | | | | | | | |
| | | | Diversified Financial Services - 1.3% | | | |
| | | | Capital One Bank USA NA | | | | |
| | 1,655,000 | | | 2.15%, 11/21/2018 | | | 1,657,991 | |
| | | | CDP Financial, Inc. | | | | |
| | 2,475,000 | | | 4.40%, 11/25/2019(1) | | | 2,640,362 | |
| | | | | | | | |
Shares or Principal Amount | | Market Value† | |
| Corporate Bonds - 19.6% - (continued) | |
| | | | Diversified Financial Services - 1.2% - (continued) | |
| | | | Discover Financial Services | | | | |
| $ | 3,620,000 | | | 6.45%, 06/12/2017 | | $ | 3,694,203 | |
| | | | Eaton Vance Corp. | | | | |
| | 614,000 | | | 6.50%, 10/02/2017 | | | 637,105 | |
| | | | GE Capital International Funding Co. | | | | |
| | 1,989,000 | | | 2.34%, 11/15/2020 | | | 1,988,051 | |
| | 3,397,000 | | | 4.42%, 11/15/2035 | | | 3,559,740 | |
| | | | LeasePlan Corp. N.V. | | | | |
| | 1,910,000 | | | 2.88%, 01/22/2019(1) | | | 1,909,396 | |
| | | | Postal Square L.P. | | | | |
| | 8,963,643 | | | 8.95%, 06/15/2022 | | | 10,563,689 | |
| | | | Synchrony Financial | | | | |
| | 2,045,000 | | | 2.60%, 01/15/2019 | | | 2,055,344 | |
| | 520,000 | | | 2.70%, 02/03/2020 | | | 518,458 | |
| | 355,000 | | | 3.00%, 08/15/2019 | | | 359,601 | |
| | | | | | | | |
| | | | | | | 29,583,940 | |
| | | | | | | | |
| | | | Electric - 1.5% | | | |
| | | | Berkshire Hathaway Energy Co. | | | | |
| | 1,300,000 | | | 4.50%, 02/01/2045 | | | 1,348,645 | |
| | | | Dominion Resources, Inc. | | | | |
| | 725,000 | | | 2.96%, 07/01/2019 | | | 733,995 | |
| | 2,850,000 | | | 3.63%, 12/01/2024 | | | 2,867,832 | |
| | 1,750,000 | | | 4.10%, 04/01/2021 | | | 1,822,919 | |
| | | | Duke Energy Carolinas LLC | | | | |
| | 1,200,000 | | | 6.10%, 06/01/2037 | | | 1,476,622 | |
| | | | Duke Energy Corp. | | | | |
| | 855,000 | | | 2.65%, 09/01/2026 | | | 797,995 | |
| | | | Electricite de France S.A. | | | | |
| | 2,375,000 | | | 5.63%, 01/22/2024(1)(4)(5) | | | 2,250,312 | |
| | | | Emera US Finance L.P. | | | | |
| | 365,000 | | | 2.70%, 06/15/2021(1) | | | 361,293 | |
| | | | Entergy Corp. | | | | |
| | 1,305,000 | | | 2.95%, 09/01/2026 | | | 1,220,752 | |
| | | | Eversource Energy | | | | |
| | 285,000 | | | 3.15%, 01/15/2025 | | | 281,384 | |
| | | | Fortis, Inc. | | | | |
| | 1,705,000 | | | 3.06%, 10/04/2026(1) | | | 1,594,647 | |
| | | | Indianapolis Power and Light Co. | | | | |
| | 1,275,000 | | | 6.60%, 06/01/2037(1) | | | 1,591,223 | |
| | | | NextEra Energy Capital Holdings, Inc. | | | | |
| | 4,750,000 | | | 2.06%, 09/01/2017 | | | 4,770,924 | |
| | | | NiSource Finance Corp. | | | | |
| | 340,000 | | | 4.80%, 02/15/2044 | | | 357,950 | |
| | | | Oncor Electric Delivery Co. LLC | | | | |
| | 385,000 | | | 2.95%, 04/01/2025 | | | 381,267 | |
| | 1,185,000 | | | 4.10%, 06/01/2022 | | | 1,265,553 | |
| | | | Pacific Gas & Electric Co. | | | | |
| | 695,000 | | | 3.85%, 11/15/2023 | | | 733,249 | |
| | 435,000 | | | 5.13%, 11/15/2043 | | | 495,767 | |
| | | | SCANA Corp. | | | | |
| | 1,046,000 | | | 4.13%, 02/01/2022 | | | 1,056,868 | |
| | 305,000 | | | 4.75%, 05/15/2021 | | | 318,939 | |
| | | | Southern California Edison Co. | | | | |
| | 4,000,000 | | | 5.55%, 01/15/2037 | | | 4,779,504 | |
| | | | Southern Co. | | | | |
| | 1,450,000 | | | 2.75%, 06/15/2020 | | | 1,462,425 | |
| | 2,050,000 | | | 2.95%, 07/01/2023 | | | 2,023,535 | |
| | | | State Grid Overseas Investment Ltd. | | | | |
| | 1,795,000 | | | 2.75%, 05/07/2019(1) | | | 1,818,394 | |
| | | | | | | | |
| | | | | | | 35,811,994 | |
| | | | | | | | |
The accompanying notes are an integral part of these financial statements.
|
| Hartford Balanced HLS Fund |
Schedule of Investments – (continued)
December 31, 2016
| | | | | | | | |
Shares or Principal Amount | | Market Value† | |
| Corporate Bonds - 19.6% - (continued) | |
| | | | Engineering & Construction - 0.1% | | | |
| | | | SBA Tower Trust | | | | |
| $ | 1,235,000 | | | 2.88%, 07/15/2021(1) | | $ | 1,224,478 | |
| | | | | | | | |
| | | | Food - 0.2% | | | |
| | | | Kraft Heinz Foods Co. | | | | |
| | 555,000 | | | 2.25%, 06/05/2017 | | | 556,772 | |
| | 2,030,000 | | | 3.50%, 07/15/2022 | | | 2,060,663 | |
| | 490,000 | | | 4.38%, 06/01/2046 | | | 461,080 | |
| | | | Kroger Co. | | | | |
| | 620,000 | | | 3.30%, 01/15/2021 | | | 637,067 | |
| | 1,065,000 | | | 4.00%, 02/01/2024 | | | 1,111,338 | |
| | | | Sigma Alimentos S.A. de CV | | | | |
| | 880,000 | | | 4.13%, 05/02/2026(1) | | | 836,000 | |
| | | | | | | | |
| | | | | | | 5,662,920 | |
| | | | | | | | |
| | | | Gas - 0.5% | | | |
| | | | Atmos Energy Corp. | | | | |
| | 5,875,000 | | | 6.35%, 06/15/2017 | | | 6,008,944 | |
| | | | KeySpan Gas East Corp. | | | | |
| | 1,870,000 | | | 2.74%, 08/15/2026(1) | | | 1,775,260 | |
| | | | NiSource Finance Corp. | | | | |
| | 2,746,000 | | | 6.40%, 03/15/2018 | | | 2,891,964 | |
| | | | | | | | |
| | | | | | | 10,676,168 | |
| | | | | | | | |
| | | | Healthcare-Products - 0.1% | | | |
| | | | Medtronic, Inc. | | | | |
| | 545,000 | | | 2.50%, 03/15/2020 | | | 551,099 | |
| | 775,000 | | | 3.15%, 03/15/2022 | | | 793,772 | |
| | 1,230,000 | | | 3.50%, 03/15/2025 | | | 1,266,549 | |
| | 310,000 | | | 3.63%, 03/15/2024 | | | 322,602 | |
| | 192,000 | | | 4.38%, 03/15/2035 | | | 203,122 | |
| | | | | | | | |
| | | | | | | 3,137,144 | |
| | | | | | | | |
| | | | Healthcare-Services - 0.4% | | | |
| | | | Aetna, Inc. | | | | |
| | 1,655,000 | | | 2.80%, 06/15/2023 | | | 1,630,190 | |
| | 725,000 | | | 4.25%, 06/15/2036 | | | 726,918 | |
| | | | Anthem, Inc. | | | | |
| | 421,000 | | | 3.30%, 01/15/2023 | | | 420,290 | |
| | | | Cigna Corp. | | | | |
| | 2,125,000 | | | 3.25%, 04/15/2025 | | | 2,069,635 | |
| | | | Dignity Health | | | | |
| | 180,000 | | | 2.64%, 11/01/2019 | | | 181,568 | |
| | 380,000 | | | 3.81%, 11/01/2024 | | | 378,180 | |
| | | | Kaiser Foundation Hospitals | | | | |
| | 521,000 | | | 3.50%, 04/01/2022 | | | 537,643 | |
| | | | Memorial Sloan-Kettering Cancer Center | | | | |
| | 530,000 | | | 4.20%, 07/01/2055 | | | 514,238 | |
| | | | UnitedHealth Group, Inc. | | | | |
| | 920,000 | | | 3.35%, 07/15/2022 | | | 947,882 | |
| | 1,440,000 | | | 3.75%, 07/15/2025 | | | 1,490,737 | |
| | | | | | | | |
| | | | | | | 8,897,281 | |
| | | | | | | | |
| | | | Household Products - 0.3% | | | |
| | | | Procter & Gamble Co. | | | | |
| | 5,867,136 | | | 9.36%, 01/01/2021 | | | 6,785,489 | |
| | | | | | | | |
| | | | Insurance - 0.4% | | | |
| | | | Berkshire Hathaway, Inc. | | | | |
| | 1,445,000 | | | 2.75%, 03/15/2023 | | | 1,439,575 | |
| | | | Chubb INA Holdings, Inc. | | | | |
| | 495,000 | | | 2.30%, 11/03/2020 | | | 494,887 | |
| | 840,000 | | | 3.35%, 05/15/2024 | | | 855,786 | |
| | | | | | | | |
Shares or Principal Amount | | Market Value† | |
| Corporate Bonds - 19.6% - (continued) | |
| | | | Insurance - 0.4% - (continued) | | | |
| | | | Five Corners Funding Trust | | | | |
| $ | 200,000 | | | 4.42%, 11/15/2023(1) | | $ | 211,443 | |
| | | | Liberty Mutual Group, Inc. | | | | |
| | 550,000 | | | 4.25%, 06/15/2023(1) | | | 575,836 | |
| | | | MetLife, Inc. | | | | |
| | 305,000 | | | 1.90%, 12/15/2017 | | | 305,787 | |
| | 2,205,000 | | | 3.60%, 04/10/2024 | | | 2,263,488 | |
| | 795,000 | | | 4.88%, 11/13/2043 | | | 860,715 | |
| | | | Trinity Acquisition plc | | | | |
| | 2,220,000 | | | 4.40%, 03/15/2026 | | | 2,247,204 | |
| | | | | | | | |
| | | | | | | 9,254,721 | |
| | | | | | | | |
| | | | Internet - 0.3% | | | |
| | | | Alibaba Group Holding Ltd. | | | | |
| | 200,000 | | | 2.50%, 11/28/2019 | | | 200,899 | |
| | 1,045,000 | | | 3.60%, 11/28/2024 | | | 1,034,660 | |
| | | | Amazon.com, Inc. | | | | |
| | 1,250,000 | | | 2.50%, 11/29/2022 | | | 1,236,983 | |
| | 1,020,000 | | | 4.80%, 12/05/2034 | | | 1,122,673 | |
| | 480,000 | | | 4.95%, 12/05/2044 | | | 547,462 | |
| | | | Expedia, Inc. | | | | |
| | 2,275,000 | | | 5.00%, 02/15/2026 | | | 2,345,311 | |
| | | | | | | | |
| | | | | | | 6,487,988 | |
| | | | | | | | |
| | | | IT Services - 0.1% | | | |
| | | | Apple, Inc. | | | | |
| | 80,000 | | | 2.45%, 08/04/2026 | | | 75,084 | |
| | 546,000 | | | 3.25%, 02/23/2026 | | | 546,290 | |
| | 1,360,000 | | | 3.45%, 05/06/2024 | | | 1,400,851 | |
| | | | | | | | |
| | | | | | | 2,022,225 | |
| | | | | | | | |
| | | | Lodging - 0.2% | | | |
| | | | Marriott International, Inc. | | | | |
| | 2,310,000 | | | 2.30%, 01/15/2022 | | | 2,240,809 | |
| | 1,900,000 | | | 2.88%, 03/01/2021 | | | 1,908,567 | |
| | | | | | | | |
| | | | | | | 4,149,376 | |
| | | | | | | | |
| | | | Machinery-Construction & Mining - 0.1% | | | |
| | | | Caterpillar Financial Services Corp. | | | | |
| | 1,500,000 | | | 3.30%, 06/09/2024 | | | 1,520,375 | |
| | | | Caterpillar, Inc. | | | | |
| | 835,000 | | | 3.40%, 05/15/2024 | | | 859,870 | |
| | 135,000 | | | 4.30%, 05/15/2044 | | | 139,986 | |
| | | | | | | | |
| | | | | | | 2,520,231 | |
| | | | | | | | |
| | | | Media - 0.8% | | | |
| | | | 21st Century Fox America, Inc. | | | | |
| | 385,000 | | | 4.00%, 10/01/2023 | | | 397,702 | |
| | 1,275,000 | | | 4.50%, 02/15/2021 | | | 1,363,153 | |
| | | | Charter Communications Operating LLC / Charter Communications | | | | |
| | 645,000 | | | 6.48%, 10/23/2045 | | | 745,671 | |
| | | | Comcast Corp. | | | | |
| | 2,450,000 | | | 4.40%, 08/15/2035 | | | 2,563,038 | |
| | | | Cox Communications, Inc. | | | | |
| | 2,320,000 | | | 4.80%, 02/01/2035(1) | | | 2,161,024 | |
| | | | Grupo Televisa S.A.B. | |
| | 420,000 | | | 5.00%, 05/13/2045 | | | 356,408 | |
| | 700,000 | | | 6.13%, 01/31/2046 | | | 694,670 | |
| | | | Sky plc | |
| | 1,265,000 | | | 2.63%, 09/16/2019(1) | | | 1,270,155 | |
| | 2,386,000 | | | 3.75%, 09/16/2024(1) | | | 2,393,573 | |
The accompanying notes are an integral part of these financial statements.
|
| Hartford Balanced HLS Fund |
Schedule of Investments – (continued)
December 31, 2016
| | | | | | | | |
Shares or Principal Amount | | Market Value† | |
| Corporate Bonds - 19.6% - (continued) | |
| | | | Media - 0.8% - (continued) | | | |
| | | | Time Warner Cable, Inc. | |
| $ | 4,120,000 | | | 5.85%, 05/01/2017 | | $ | 4,178,467 | |
| | 395,000 | | | 6.55%, 05/01/2037 | | | 447,161 | |
| | 250,000 | | | 7.30%, 07/01/2038 | | | 307,536 | |
| | 480,000 | | | 8.25%, 04/01/2019 | | | 539,376 | |
| | 40,000 | | | 8.75%, 02/14/2019 | | | 45,078 | |
| | | | Time Warner Entertainment Co., L.P. | | | | |
| | 130,000 | | | 8.38%, 03/15/2023 | | | 163,512 | |
| | | | Viacom, Inc. | | | | |
| | 835,000 | | | 3.88%, 12/15/2021 | | | 843,477 | |
| | | | | | | | |
| | | | | | | 18,470,001 | |
| | | | | | | | |
| | | | Miscellaneous Manufacturing - 0.1% | |
| | | | Pentair Finance S.A. | | | | |
| | 2,375,000 | | | 2.90%, 09/15/2018 | | | 2,402,448 | |
| | | | | | | | |
| | | | Oil & Gas - 1.4% | |
| | | | Anadarko Petroleum Corp. | | | | |
| | 1,665,000 | | | 4.85%, 03/15/2021 | | | 1,785,276 | |
| | | | BG Energy Capital plc | | | | |
| | 1,200,000 | | | 4.00%, 10/15/2021(1) | | | 1,275,536 | |
| | | | BP Capital Markets plc | |
| | 655,000 | | | 2.32%, 02/13/2020 | | | 655,092 | |
| | 140,000 | | | 3.99%, 09/26/2023 | | | 147,156 | |
| | 2,850,000 | | | 4.75%, 03/10/2019 | | | 3,021,188 | |
| | | | ConocoPhillips Co. | |
| | 565,000 | | | 2.88%, 11/15/2021 | | | 569,308 | |
| | 795,000 | | | 3.35%, 05/15/2025 | | | 784,479 | |
| | 395,000 | | | 4.30%, 11/15/2044 | | | 392,910 | |
| | 130,000 | | | 4.95%, 03/15/2026 | | | 143,520 | |
| | 230,000 | | | 5.75%, 02/01/2019 | | | 247,104 | |
| | 115,000 | | | 6.00%, 01/15/2020 | | | 126,999 | |
| | | | Devon Energy Corp. | | | | |
| | 2,695,000 | | | 3.25%, 05/15/2022 | | | 2,677,900 | |
| | | | Marathon Oil Corp. | | | | |
| | 920,000 | | | 2.70%, 06/01/2020 | | | 921,225 | |
| | | | Noble Energy, Inc. | | | | |
| | 1,231,000 | | | 4.15%, 12/15/2021 | | | 1,281,086 | |
| | | | Petroleos Mexicanos | |
| | 40,000 | | | 5.38%, 03/13/2022(1) | | | 40,959 | |
| | 1,590,000 | | | 5.50%, 02/04/2019(1) | | | 1,647,065 | |
| | 2,900,000 | | | 5.50%, 01/21/2021 | | | 2,983,375 | |
| | | | Pioneer Natural Resources Co. | | | | |
| | 3,540,000 | | | 7.50%, 01/15/2020 | | | 4,024,169 | |
| | | | Shell International Finance B.V. | |
| | 691,000 | | | 3.25%, 05/11/2025 | | | 690,433 | |
| | 500,000 | | | 4.38%, 03/25/2020 | | | 534,129 | |
| | 3,950,000 | | | Sinopec Group Overseas Development Ltd.
2.50%, 04/28/2020(1) | | | 3,923,816 | |
| | | | Statoil ASA | |
| | 340,000 | | | 2.25%, 11/08/2019 | | | 342,823 | |
| | 160,000 | | | 2.45%, 01/17/2023 | | | 156,181 | |
| | 495,000 | | | 2.75%, 11/10/2021 | | | 499,933 | |
| | 1,850,000 | | | 2.90%, 11/08/2020 | | | 1,889,773 | |
| | 210,000 | | | 3.25%, 11/10/2024 | | | 212,850 | |
| | 45,000 | | | 3.70%, 03/01/2024 | | | 47,101 | |
| | | | Suncor Energy, Inc. | | | | |
| | 925,000 | | | 6.10%, 06/01/2018 | | | 979,330 | �� |
| | | | Total Capital International S.A. | | | | |
| | 1,375,000 | | | 2.70%, 01/25/2023 | | | 1,360,736 | |
| | | | | | | | |
| | | | | | | 33,361,452 | |
| | | | | | | | |
| | | | | | | | |
Shares or Principal Amount | | Market Value† | |
| Corporate Bonds - 19.6% - (continued) | |
| | | | Oil & Gas Services - 0.1% | |
| | | | Schlumberger Holdings Corp. | | | | |
| $ | 940,000 | | | 3.00%, 12/21/2020(1) | | $ | 959,884 | |
| | | | Schlumberger Investment S.A. | | | | |
| | 1,625,000 | | | 3.65%, 12/01/2023 | | | 1,702,152 | |
| | | | | | | | |
| | | | | | | 2,662,036 | |
| | | | | | | | |
| | | | Pharmaceuticals - 1.2% | |
| | | | AbbVie, Inc. | | | | |
| | 270,000 | | | 3.20%, 11/06/2022 | | | 270,178 | |
| | | | Actavis Funding SCS | |
| | 1,195,000 | | | 3.00%, 03/12/2020 | | | 1,211,566 | |
| | 1,170,000 | | | 3.45%, 03/15/2022 | | | 1,187,560 | |
| | 1,000,000 | | | 4.55%, 03/15/2035 | | | 989,792 | |
| | 600,000 | | | 4.85%, 06/15/2044 | | | 594,899 | |
| | | | Bayer US Finance LLC | |
| | 260,000 | | | 2.38%, 10/08/2019(1) | | | 260,460 | |
| | 1,215,000 | | | 3.00%, 10/08/2021(1) | | | 1,221,672 | |
| | 395,000 | | | 3.38%, 10/08/2024(1) | | | 393,021 | |
| | | | Cardinal Health, Inc. | |
| | 990,000 | | | 2.40%, 11/15/2019 | | | 997,216 | |
| | 880,000 | | | 3.50%, 11/15/2024 | | | 889,751 | |
| | 1,035,000 | | | 4.50%, 11/15/2044 | | | 1,025,998 | |
| | | | EMD Finance LLC | |
| | 2,015,000 | | | 2.95%, 03/19/2022(1) | | | 2,006,454 | |
| | 3,000,000 | | | 3.25%, 03/19/2025(1) | | | 2,932,680 | |
| | 1,525,000 | | | Express Scripts Holding Co.
2.25%, 06/15/2019 | | | 1,524,828 | |
| | | | Forest Laboratories LLC | |
| | 305,000 | | | 4.88%, 02/15/2021(1) | | | 327,657 | |
| | 800,000 | | | 5.00%, 12/15/2021(1) | | | 864,946 | |
| | | | McKesson Corp. | |
| | 100,000 | | | 2.85%, 03/15/2023 | | | 97,839 | |
| | 650,000 | | | 3.80%, 03/15/2024 | | | 669,936 | |
| | | | Merck & Co., Inc. | |
| | 1,960,000 | | | 2.75%, 02/10/2025 | | | 1,924,449 | |
| | 1,640,000 | | | 2.80%, 05/18/2023 | | | 1,646,347 | |
| | | | Mylan N.V. | | | | |
| | 1,925,000 | | | 3.00%, 12/15/2018(1) | | | 1,938,922 | |
| | | | Teva Pharmaceutical Finance Co. B.V. | | | | |
| | 755,000 | | | 3.65%, 11/10/2021 | | | 764,699 | |
| | | | Teva Pharmaceutical Finance Netherlands III B.V. | |
| | 5,215,000 | | | 2.80%, 07/21/2023 | | | 4,936,472 | |
| | 380,000 | | | 4.10%, 10/01/2046 | | | 325,608 | |
| | | | | | | | |
| | | | | | | 29,002,950 | |
| | | | | | | | |
| | | | Pipelines - 0.7% | |
| | | | Columbia Pipeline Group, Inc. | | | | |
| | 990,000 | | | 2.45%, 06/01/2018 | | | 994,838 | |
| | | | Energy Transfer Partners L.P. | |
| | 2,040,000 | | | 3.60%, 02/01/2023 | | | 2,006,354 | |
| | 1,300,000 | | | 5.15%, 03/15/2045 | | | 1,246,804 | |
| | | | Enterprise Products Operating LLC | | | | |
| | 865,000 | | | 3.95%, 02/15/2027 | | | 886,100 | |
| | | | Kinder Morgan Energy Partners L.P. | | | | |
| | 1,875,000 | | | 6.95%, 01/15/2038 | | | 2,174,942 | |
| | | | Phillips 66 Partners L.P. | | | | |
| | 2,425,000 | | | 3.61%, 02/15/2025 | | | 2,374,975 | |
| | | | Regency Energy Partners L.P. | |
| | 375,000 | | | 4.50%, 11/01/2023 | | | 380,522 | |
| | 100,000 | | | 5.88%, 03/01/2022 | | | 110,006 | |
The accompanying notes are an integral part of these financial statements.
|
| Hartford Balanced HLS Fund |
Schedule of Investments – (continued)
December 31, 2016
| | | | | | | | |
Shares or Principal Amount | | Market Value† | |
| Corporate Bonds - 19.6% - (continued) | |
| | | | Pipelines - 0.7% - (continued) | |
| | | | Sunoco Logistics Partners Operations L.P. | |
| $ | 610,000 | | | 3.45%, 01/15/2023 | | $ | 595,894 | |
| | 1,724,000 | | | 4.40%, 04/01/2021 | | | 1,815,544 | |
| | | | TransCanada PipeLines Ltd. | | | | |
| | 1,036,000 | | | 4.88%, 01/15/2026 | | | 1,151,145 | |
| | | | Western Gas Partners L.P. | | | | |
| | 2,470,000 | | | 4.00%, 07/01/2022 | | | 2,510,301 | |
| | | | | | | | |
| | | | | | | 16,247,425 | |
| | | | | | | | |
| | | | Real Estate - 0.1% | |
| | | | WEA Finance LLC / Westfield UK & Europe Finance plc | |
| | 480,000 | | | 1.75%, 09/15/2017(1) | | | 480,299 | |
| | 730,000 | | | 2.70%, 09/17/2019(1) | | | 738,356 | |
| | 1,400,000 | | | 3.25%, 10/05/2020(1) | | | 1,423,803 | |
| | | | | | | | |
| | | | | | | 2,642,458 | |
| | | | | | | | |
| | | | Real Estate Investment Trusts - 0.4% | |
| | | | American Tower Corp. | |
| | 975,000 | | | 3.45%, 09/15/2021 | | | 987,615 | |
| | 1,110,000 | | | 5.00%, 02/15/2024 | | | 1,195,097 | |
| | | | AvalonBay Communities, Inc. | | | | |
| | 760,000 | | | 3.63%, 10/01/2020 | | | 789,172 | |
| | | | Crown Castle International Corp. | | | | |
| | 940,000 | | | 3.70%, 06/15/2026 | | | 922,639 | |
| | | | HCP, Inc. | | | | |
| | 2,960,000 | | | 4.00%, 06/01/2025 | | | 2,942,412 | |
| | | | Scentre Group | | | | |
| | 1,735,000 | | | 2.38%, 11/05/2019(1) | | | 1,734,080 | |
| | | | | | | | |
| | | | | | | 8,571,015 | |
| | | | | | | | |
| | | | Retail - 0.5% | |
| | | | AutoZone, Inc. | |
| | 900,000 | | | 3.13%, 07/15/2023 | | | 891,179 | |
| | 1,908,000 | | | 3.70%, 04/15/2022 | | | 1,971,708 | |
| | | | CVS Health Corp. | |
| | 2,100,000 | | | 4.00%, 12/05/2023 | | | 2,212,654 | |
| | 685,000 | | | 4.88%, 07/20/2035 | | | 736,670 | |
| | 1,185,000 | | | 5.13%, 07/20/2045 | | | 1,320,620 | |
| | | | Home Depot, Inc. | | | | |
| | 325,000 | | | 4.40%, 03/15/2045 | | | 346,351 | |
| | | | Lowe’s Cos., Inc. | | | | |
| | 1,850,000 | | | 4.63%, 04/15/2020 | | | 1,982,614 | |
| | | | O’Reilly Automotive, Inc. | | | | |
| | 1,435,000 | | | 3.80%, 09/01/2022 | | | 1,484,793 | |
| | | | | | | | |
| | | | | | | 10,946,589 | |
| | | | | | | | |
| | | | Savings & Loans - 0.1% | |
| | | | Nationwide Building Society | | | | |
| | 1,610,000 | | | 2.35%, 01/21/2020(1) | | | 1,606,168 | |
| | | | | | | | |
| | | | Software - 0.1% | |
| | | | Microsoft Corp. | |
| | 1,605,000 | | | 2.40%, 08/08/2026 | | | 1,516,239 | |
| | 1,230,000 | | | 3.70%, 08/08/2046 | | | 1,158,002 | |
| | | | | | | | |
| | | | | | | 2,674,241 | |
| | | | | | | | |
| | | | Telecommunications - 0.9% | |
| | | | America Movil S.A.B. de C.V. | |
| | 635,000 | | | 3.13%, 07/16/2022 | | | 625,289 | |
| | 390,000 | | | 6.13%, 03/30/2040 | | | 445,089 | |
| | | | | | | | |
Shares or Principal Amount | | Market Value† | |
| Corporate Bonds - 19.6% - (continued) | |
| | | | Telecommunications - 0.9% - (continued) | |
| | | | AT&T, Inc. | |
| $ | 355,000 | | | 3.95%, 01/15/2025 | | $ | 355,615 | |
| | 2,185,000 | | | 4.45%, 04/01/2024 | | | 2,277,723 | |
| | 1,340,000 | | | 4.50%, 03/09/2048 | | | 1,204,088 | |
| | 390,000 | | | 4.75%, 05/15/2046 | | | 369,493 | |
| | | | GTP Acquisition Partners I LLC | | | | |
| | 715,000 | | | 2.35%, 06/15/2045(1) | | | 696,796 | |
| | | | Orange S.A. | | | | |
| | 3,200,000 | | | 4.13%, 09/14/2021 | | | 3,378,928 | |
| | 576,000 | | | 9.00%, 03/01/2031 | | | 866,030 | |
| | | | Verizon Communications, Inc. | | | | |
| | 425,000 | | | 3.45%, 03/15/2021 | | | 438,771 | |
| | 2,415,000 | | | 3.50%, 11/01/2021 | | | 2,492,700 | |
| | 4,795,000 | | | 4.50%, 09/15/2020 | | | 5,131,192 | |
| | 1,911,000 | | | 4.52%, 09/15/2048 | | | 1,832,481 | |
| | 715,000 | | | 4.75%, 11/01/2041 | | | 706,023 | |
| | 263,000 | | | 6.40%, 09/15/2033 | | | 317,313 | |
| | | | | | | | |
| | | | | | | 21,137,531 | |
| | | | | | | | |
| | | | Transportation - 0.2% | | | |
| | | | FedEx Corp. | | | | |
| | 845,000 | | | 4.90%, 01/15/2034 | | | 900,734 | |
| | 1,435,000 | | | 5.10%, 01/15/2044 | | | 1,557,027 | |
| | | | Penske Truck Leasing Co. L.P. / PTL Finance Corp. | | | | |
| | 1,685,000 | | | 3.20%, 07/15/2020(1) | | | 1,703,686 | |
| | 1,100,000 | | | 3.38%, 02/01/2022(1) | | | 1,109,305 | |
| | | | | | | | |
| | | | | | | 5,270,752 | |
| | | | | | | | |
| | |
| | | | Total Corporate Bonds
(cost $444,468,414) | | $ | 455,929,704 | |
| | | | | | | | |
|
| Foreign Government Obligations - 0.3% | |
| | | | Mexico - 0.1% | | | |
| | | | Mexico Government International Bond | | | | |
| | 1,674,000 | | | 3.50%, 01/21/2021 | | $ | 1,700,784 | |
| | 1,185,000 | | | 3.60%, 01/30/2025 | | | 1,142,340 | |
| | 150,000 | | | 4.75%, 03/08/2044 | | | 136,395 | |
| | | | | | | | |
| | | | | | | 2,979,519 | |
| | | | | | | | |
| | | | Saudi Arabia - 0.1% | | | |
| | | | Saudi Government International Bond | | | | |
| | 935,000 | | | 2.38%, 10/26/2021(1) | | | 907,825 | |
| | | | | | | | |
| | | | South Korea - 0.1% | | | |
| | | | Export-Import Bank of Korea | | | | |
| | 2,300,000 | | | 1.75%, 05/26/2019 | | | 2,291,812 | |
| | | | | | | | |
| | |
| | | | Total Foreign Government Obligations
(cost $6,194,625) | | | 6,179,156 | |
| | | | | | | | |
|
| Municipal Bonds - 1.3% | |
| | | | General - 0.3% | | | |
| | | | Chicago Transit Auth | | | | |
| | 1,985,000 | | | 6.90%, 12/01/2040 | | | 2,494,806 | |
| | | | Commonwealth Financing Auth | | | | |
| | 980,000 | | | 4.01%, 06/01/2033 | | | 956,715 | |
| | 805,000 | | | 4.14%, 06/01/2038 | | | 768,485 | |
| | | | Kansas Dev Finance Auth | | | | |
| | 1,345,000 | | | 4.93%, 04/15/2045 | | | 1,438,356 | |
| | | | New Jersey State, Economic Auth Rev | | | | |
| | 2,400,000 | | | 3.80%, 06/15/2018 | | | 2,445,456 | |
| | | | | | | | |
| | | | | | | 8,103,818 | |
| | | | | | | | |
The accompanying notes are an integral part of these financial statements.
|
| Hartford Balanced HLS Fund |
Schedule of Investments – (continued)
December 31, 2016
| | | | | | | | |
Shares or Principal Amount | | Market Value† | |
| Municipal Bonds - 1.3% - (continued) | |
| | | | General Obligation - 0.3% | | | |
| | | | California State, GO Taxable | | | | |
| $ | 1,235,000 | | | 7.55%, 04/01/2039 | | $ | 1,827,368 | |
| | | | Chicago, IL, Metropolitan Water Reclamation GO | | | | |
| | 685,000 | | | 5.72%, 12/01/2038 | | | 819,876 | |
| | | | Illinois State, GO | | | | |
| | 1,640,000 | | | 5.10%, 06/01/2033 | | | 1,449,465 | |
| | | | Los Angeles, CA, USD GO | | | | |
| | 2,200,000 | | | 5.75%, 07/01/2034 | | | 2,717,044 | |
| | | | | | | | |
| | | | | | | 6,813,753 | |
| | | | | | | | |
| | | | Higher Education - 0.1% | | | |
| | | | University of California, Build America Bonds Rev | | | | |
| | 1,460,000 | | | 5.77%, 05/15/2043 | | | 1,770,717 | |
| | | | | | | | |
| | | | Medical - 0.1% | | | |
| | | | University of California, Regents MedCenter Pooled Rev | | | | |
| | 1,935,000 | | | 6.58%, 05/15/2049 | | | 2,515,965 | |
| | | | | | | | |
| | | | Power - 0.0% | | | |
| | | | Utility Debt Securitization Auth, New York | | | | |
| | 485,000 | | | 3.44%, 12/15/2025 | | | 501,417 | |
| | | | | | | | |
| | | | Transportation - 0.4% | | | |
| | | | Illinois State Toll Highway Auth, Taxable Rev | | | | |
| | 1,875,000 | | | 6.18%, 01/01/2034 | | | 2,345,775 | |
| | | | Maryland State Transportation Auth | | | | |
| | 1,050,000 | | | 5.89%, 07/01/2043 | | | 1,303,449 | |
| | | | New York and New Jersey PA, Taxable Rev | | | | |
| | 685,000 | | | 4.81%, 10/15/2065 | | | 737,211 | |
| | 570,000 | | | 6.04%, 12/01/2029 | | | 713,224 | |
| | | | North Texas Tollway Auth Rev | | | | |
| | 2,400,000 | | | 6.72%, 01/01/2049 | | | 3,367,752 | |
| | | | | | | | |
| | | | | | | 8,467,411 | |
| | | | | | | | |
| | | | Utility-Electric - 0.1% | | | |
| | | | Municipal Electric Auth. Georgia | | | | |
| | 1,105,000 | | | 6.64%, 04/01/2057 | | | 1,370,432 | |
| | | | | | | | |
| | |
| | | | Total Municipal Bonds
(cost $25,865,388) | | $ | 29,543,513 | |
| | | | | | | | |
|
| U.S. Government Agencies - 0.5% | |
| | | | FHLMC - 0.0% | | | |
| | 49,434 | | | 2.75%, 04/01/2029(4) | | $ | 50,830 | |
| | 37,849 | | | 4.00%, 03/01/2041 | | | 39,956 | |
| | | | | | | | |
| | | | | | | 90,786 | |
| | | | | | | | |
| | | | FNMA - 0.2% | | | |
| | 104,516 | | | 4.50%, 11/01/2023 | | | 112,412 | |
| | 166,474 | | | 4.50%, 03/01/2038 | | | 179,094 | |
| | 101,067 | | | 4.50%, 11/01/2039 | | | 108,843 | |
| | 62,047 | | | 4.50%, 04/01/2040 | | | 67,174 | |
| | 156,501 | | | 4.50%, 08/01/2040 | | | 168,549 | |
| | 60,465 | | | 4.50%, 02/01/2041 | | | 65,132 | |
| | 705,860 | | | 4.50%, 04/01/2041 | | | 761,118 | |
| | 489,009 | | | 4.50%, 06/01/2041 | | | 528,056 | |
| | 727,793 | | | 4.50%, 07/01/2041 | | | 786,055 | |
| | 266,006 | | | 4.50%, 09/01/2041 | | | 286,776 | |
| | 163,320 | | | 4.50%, 07/01/2044 | | | 175,744 | |
| | 1,850,000 | | | 4.50%, 01/01/2047(6)(7) | | | 1,989,834 | |
| | 2,802 | | | 5.00%, 02/01/2019 | | | 2,868 | |
| | 31,861 | | | 5.00%, 04/01/2019 | | | 32,607 | |
| | | | | | | | |
| | | | | | | 5,264,262 | |
| | | | | | | | |
| | | | | | | | |
Shares or Principal Amount | | Market Value† | |
| U.S. Government Agencies - 0.5% - (continued) | |
| | | | GNMA - 0.3% | | | |
| $ | 133,011 | | | 5.00%, 07/15/2037 | | $ | 146,939 | |
| | 19,980 | | | 6.00%, 06/15/2024 | | | 22,652 | |
| | 6,375 | | | 6.00%, 07/15/2026 | | | 7,227 | |
| | 10,098 | | | 6.00%, 01/15/2028 | | | 11,447 | |
| | 2,599 | | | 6.00%, 03/15/2028 | | | 2,997 | |
| | 76,668 | | | 6.00%, 04/15/2028 | | | 87,028 | |
| | 105,817 | | | 6.00%, 05/15/2028 | | | 119,959 | |
| | 22,303 | | | 6.00%, 06/15/2028 | | | 25,283 | |
| | 58,200 | | | 6.00%, 07/15/2028 | | | 65,996 | |
| | 20,375 | | | 6.00%, 08/15/2028 | | | 23,100 | |
| | 89,868 | | | 6.00%, 09/15/2028 | | | 101,881 | |
| | 149,567 | | | 6.00%, 10/15/2028 | | | 169,598 | |
| | 243,340 | | | 6.00%, 11/15/2028 | | | 276,100 | |
| | 149,275 | | | 6.00%, 12/15/2028 | | | 169,299 | |
| | 4,281 | | | 6.00%, 12/15/2031 | | | 4,906 | |
| | 32,547 | | | 6.00%, 09/15/2032 | | | 38,604 | |
| | 11,006 | | | 6.00%, 11/15/2032 | | | 12,947 | |
| | 20,315 | | | 6.00%, 01/15/2033 | | | 23,040 | |
| | 2,130 | | | 6.00%, 04/15/2033 | | | 2,416 | |
| | 131,437 | | | 6.00%, 06/15/2033 | | | 155,475 | |
| | 46,986 | | | 6.00%, 10/15/2033 | | | 54,423 | |
| | 6,457 | | | 6.00%, 11/15/2033 | | | 7,417 | |
| | 110,027 | | | 6.00%, 10/15/2034 | | | 126,286 | |
| | 62,207 | | | 6.00%, 01/15/2035 | | | 70,548 | |
| | 7,985 | | | 6.00%, 05/15/2035 | | | 9,052 | |
| | 19,750 | | | 6.00%, 06/15/2035 | | | 22,782 | |
| | 1,120 | | | 6.50%, 03/15/2026 | | | 1,279 | |
| | 5,444 | | | 6.50%, 01/15/2028 | | | 6,219 | |
| | 84,678 | | | 6.50%, 03/15/2028 | | | 96,726 | |
| | 157,086 | | | 6.50%, 04/15/2028 | | | 179,431 | |
| | 55,897 | | | 6.50%, 05/15/2028 | | | 63,848 | |
| | 217,972 | | | 6.50%, 06/15/2028 | | | 248,982 | |
| | 14,161 | | | 6.50%, 10/15/2028 | | | 16,176 | |
| | 4,219 | | | 6.50%, 02/15/2035 | | | 4,819 | |
| | 27,940 | | | 7.00%, 11/15/2031 | | | 32,024 | |
| | 13,504 | | | 7.00%, 03/15/2032 | | | 15,515 | |
| | 1,548,313 | | | 7.00%, 11/15/2032 | | | 1,853,461 | |
| | 221,446 | | | 7.00%, 01/15/2033 | | | 262,167 | |
| | 241,014 | | | 7.00%, 05/15/2033 | | | 284,298 | |
| | 45,814 | | | 7.00%, 07/15/2033 | | | 53,228 | |
| | 284,838 | | | 7.00%, 11/15/2033 | | | 335,248 | |
| | 114,603 | | | 7.50%, 09/16/2035 | | | 131,468 | |
| | 228 | | | 8.00%, 09/15/2026 | | | 253 | |
| | 141 | | | 8.00%, 11/15/2026 | | | 157 | |
| | 13,305 | | | 8.00%, 12/15/2026 | | | 15,645 | |
| | 166 | | | 8.00%, 09/15/2027 | | | 175 | |
| | 8,709 | | | 8.00%, 07/15/2029 | | | 10,396 | |
| | 3,844 | | | 8.00%, 11/15/2029 | | | 3,859 | |
| | 22,090 | | | 8.00%, 12/15/2029 | | | 23,593 | |
| | 4,800 | | | 8.00%, 01/15/2030 | | | 5,041 | |
| | 6,681 | | | 8.00%, 02/15/2030 | | | 6,916 | |
| | 1,137 | | | 8.00%, 03/15/2030 | | | 1,161 | |
| | 58,970 | | | 8.00%, 04/15/2030 | | | 59,964 | |
| | 11,270 | | | 8.00%, 05/15/2030 | | | 11,680 | |
| | 48,586 | | | 8.00%, 06/15/2030 | | | 51,712 | |
| | 3,818 | | | 8.00%, 07/15/2030 | | | 4,210 | |
| | 76,616 | | | 8.00%, 08/15/2030 | | | 79,101 | |
| | 17,133 | | | 8.00%, 09/15/2030 | | | 17,713 | |
| | 9,753 | | | 8.00%, 11/15/2030 | | | 10,038 | |
| | 175,090 | | | 8.00%, 12/15/2030 | | | 196,623 | |
The accompanying notes are an integral part of these financial statements.
|
| Hartford Balanced HLS Fund |
Schedule of Investments – (continued)
December 31, 2016
| | | | | | | | | | | | |
Shares or Principal Amount | | | | | Market Value† | |
| U.S. Government Agencies - 0.5% - (continued) | |
| | | | GNMA - 0.3% - (continued) | | | | | | |
| $ | 273 | | | 8.00%, 02/15/2031 | | | | | | $ | 289 | |
| | 8,037 | | | 9.00%, 06/15/2022 | | | | | | | 8,168 | |
| | | | | | | | | | | | |
| | | | | | | | | | | 5,848,985 | |
| | | | | | | | | | | | |
| | | |
| | | | Total U.S. Government Agencies
(cost $10,489,070) | | | | | | $ | 11,204,033 | |
| | | | | | | | | | | | |
|
| U.S. Government Securities - 11.4% | |
| | | | U.S. Treasury Securities - 11.4% | | | | | | |
| | | | U.S. Treasury Bonds - 4.2% | | | | | | |
| | 16,163,391 | | | 2.38%, 01/15/2027(8) | | | | | | $ | 18,934,620 | |
| | 20,850,000 | | | 2.50%, 02/15/2045(9) | | | | | | | 18,571,971 | |
| | 6,600,000 | | | 2.50%, 05/15/2046 | | | | | | | 5,865,235 | |
| | 10,450,800 | | | 2.88%, 05/15/2043 | | | | | | | 10,094,407 | |
| | 8,995,000 | | | 3.13%, 08/15/2044 | | | | | | | 9,103,920 | |
| | 4,630,000 | | | 3.38%, 05/15/2044 | | | | | | | 4,909,791 | |
| | 22,000,000 | | | 4.38%, 02/15/2038 | | | | | | | 27,338,432 | |
| | 1,750,000 | | | 6.00%, 02/15/2026 | | | | | | | 2,262,901 | |
| | | | | | | | | | | | |
| | | | | | | | | | | 97,081,277 | |
| | | | | | | | | | | | |
| | | | U.S. Treasury Notes - 7.2% | | | | | | |
| | 15,685,000 | | | 1.25%, 03/31/2021 | | | | | | | 15,322,896 | |
| | 2,025,000 | | | 1.38%, 09/30/2020 | | | | | | | 2,002,061 | |
| | 5,570,000 | | | 1.38%, 01/31/2021 | | | | | | | 5,481,008 | |
| | 43,220,000 | | | 1.50%, 03/31/2023 | | | | | | | 41,528,326 | |
| | 37,000,000 | | | 1.63%, 07/31/2019 | | | | | | | 37,258,704 | |
| | 16,835,000 | | | 1.75%, 09/30/2019 | | | | | | | 17,000,724 | |
| | 4,130,000 | | | 2.00%, 02/15/2025 | | | | | | | 4,019,650 | |
| | 16,670,000 | | | 2.25%, 11/15/2024 | | | | | | | 16,567,763 | |
| | 11,935,000 | | | 2.38%, 08/15/2024 | | | | | | | 11,990,474 | |
| | 4,550,000 | | | 2.75%, 02/15/2019 | | | | | | | 4,692,897 | |
| | 7,650,000 | | | 2.75%, 11/15/2023 | | | | | | | 7,902,213 | |
| | 3,390,000 | | | 2.75%, 02/15/2024 | | | | | | | 3,501,233 | |
| | | | | | | | | | | | |
| | | | | | | | | | | 167,267,949 | |
| | | | | | | | | | | | |
| | | |
| | | | Total U.S. Government Securities
(cost $261,170,251) | | | | | | $ | 264,349,226 | |
| | | | | | | | | | | | |
| | | |
| | | | Total Long-Term Investments
(cost $1,893,381,983) | | | | | | $ | 2,293,405,622 | |
| | | | | | | | | | | | |
|
| Short-Term Investments - 0.9% | |
| | | | Other Investment Pools & Funds - 0.9% | |
| | 21,966,161 | | | Morgan Stanley Institutional Liquidity Funds, Institutional Class | | | | | | $ | 21,966,161 | |
| | | | | | | | | | | | |
| | | |
| | | | Total Short-Term Investments
(cost $21,966,161) | | | | | | $ | 21,966,161 | |
| | | | | | | | | | | | |
| | | | | | | | | | | | |
| | | |
| | | | Total Investments
(cost $1,915,348,144)^ | | | 99.8 | % | | $ | 2,315,371,783 | |
| | | | Other Assets and Liabilities | | | 0.2 | % | | | 4,109,332 | |
| | | | | | | | | | | | |
| | | | Total Net Assets | | | 100.0 | % | | $ | 2,319,481,115 | |
| | | | | | | | | | | | |
The accompanying notes are an integral part of these financial statements.
|
| Hartford Balanced HLS Fund |
Schedule of Investments – (continued)
December 31, 2016
| Note: | Percentage of investments as shown is the ratio of the total market value to total net assets. |
| | Prices of foreign equities that are principally traded on certain foreign markets will generally be adjusted daily pursuant to a fair value pricing service approved by the Board of Directors in order to reflect an adjustment for factors occurring after the close of certain foreign markets but before the close of the New York Stock Exchange. |
| | The Fund may refer to any one or more of the industry classifications used by one or more widely recognized market indices, ratings group indices and/or as defined by Fund management. Industry classifications may not be identical across all security types. |
| | Equity industry classifications used in this report are the Global Industry Classification Standard, which was developed by and is the exclusive property and service mark of MSCI, Inc. and Standard & Poor’s. |
| | For Fund compliance purposes, the Fund may not use the same classification system shown in this report as these classifications are used for financial reporting purposes. |
| ^ | At December 31, 2016, the cost of securities for federal income tax purposes was $1,928,022,134 and the aggregate gross unrealized appreciation and depreciation based on that cost were: |
| | | | |
Unrealized Appreciation | | $ | 439,302,328 | |
Unrealized Depreciation | | | (51,952,679 | ) |
| | | | |
Net Unrealized Appreciation | | $ | 387,349,649 | |
| | | | |
| (1) | Securities issued within terms of a private placement memorandum and exempt from registration under Rule 144A under the Securities Act of 1933, as amended, and may be sold only to qualified institutional buyers. Unless otherwise indicated, these holdings are determined to be liquid. At December 31, 2016, the aggregate value of these securities was $138,108,584, which represents 6.0% of total net assets. |
| (2) | The following securities are considered illiquid. Illiquid securities are often purchased in private placement transactions, are often not registered under the Securities Act of 1933, as amended, and may have contractual restrictions on resale. A security may also be considered illiquid if the security lacks a readily available market or if its valuation has not changed for a certain period of time. |
| | | | | | | | | | | | |
Period
Acquired | | | | Shares/Par | | | Security | | Cost | |
| 08/2011 | | | | | 11,702,200 | | | Allstar Co. | | $ | 5,090,681 | |
| 11/2013 | | | | | 163,241 | | | Tory Burch LLC | | | 12,794,224 | |
| | | | | | | | | | | | |
| | | | | | | | | | $ | 17,884,905 | |
| | | | | | | | | | | | |
| | At December 31, 2016, the aggregate value of these securities was $19,883,404, which represents 0.9% of total net assets. |
| (3) | These securities are valued in good faith at fair value as determined under policies and procedures established by and under the supervision of the Board of Directors. At December 31, 2016, the aggregate fair value of these securities was $19,883,404, which represents 0.9% of total net assets. This amount excludes securities that are principally traded in certain foreign markets and whose prices are adjusted pursuant to a third party pricing service methodology approved by the Board of Directors. |
| (4) | Variable rate securities; the rate reported is the coupon rate in effect at December 31, 2016. |
| (5) | Perpetual maturity security. Maturity date shown is the next call date or final legal maturity date, whichever comes first. |
| (6) | Represents or includes a TBA transaction. |
| (7) | This security, or a portion of this security, was purchased on a when-issued, delayed-delivery or delayed-draw basis. The cost of this security was $1,989,039 at December 31, 2016. |
| (8) | The principal amount for this security is adjusted for inflation and the interest payments equal a fixed percentage of the inflation-adjusted principal amount. |
| (9) | This security, or a portion of this security, has been pledged as collateral in connection with futures contracts. |
The accompanying notes are an integral part of these financial statements.
|
| Hartford Balanced HLS Fund |
Schedule of Investments – (continued)
December 31, 2016
Futures Contracts Outstanding at December 31, 2016
| | | | | | | | | | | | | | | | | | | | |
Description | | Number of
Contracts | | | Expiration
Date | | | Notional
Amount | | | Market
Value† | | | Unrealized
Appreciation/
(Depreciation) | |
Short position contracts: | |
U.S. Treasury 10-Year Note Future | | | 129 | | | | 03/22/2017 | | | $ | 15,871,157 | | | $ | 16,032,281 | | | $ | (161,124 | ) |
| | | | | | | | | | | | | | | | | | | | |
Total futures contracts | | | $ | (161,124 | ) |
| | | | | | | | | | | | | | | | | | | | |
| † | See Significant Accounting Policies of accompanying Notes to Financial Statements regarding valuation of investments. |
| | |
| GLOSSARY: (abbreviations used in preceding Schedule of Investments) |
|
| Other Abbreviations: |
|
ADR | | American Depositary Receipt |
CMO | | Collateralized Mortgage Obligation |
FHLMC | | Federal Home Loan Mortgage Corp. |
FNMA | | Federal National Mortgage Association |
GNMA | | Government National Mortgage Association |
TBA | | To Be Announced |
| | |
| Municipal Abbreviations: |
|
GO | | General Obligation |
PA | | Port Authority |
Rev | | Revenue |
USD | | United School District |
The accompanying notes are an integral part of these financial statements.
|
| Hartford Balanced HLS Fund |
Schedule of Investments – (continued)
December 31, 2016
Fair Valuation Summary
The following is a summary of the fair valuations according to the inputs used as of December 31, 2016 in valuing the Fund’s investments.
| | | | | | | | | | | | | | | | |
| | | Total | | | Level 1(1) | | | Level 2(1) | | | Level 3(1) | |
Assets | |
Common Stocks | |
Banks | | $ | 162,057,573 | | | $ | 162,057,573 | | | $ | — | | | $ | — | |
Capital Goods | | | 110,292,391 | | | | 110,292,391 | | | | — | | | | — | |
Commercial & Professional Services | | | 12,490,613 | | | | 12,490,613 | | | | — | | | | — | |
Consumer Durables & Apparel | | | 29,666,228 | | | | 29,666,228 | | | | — | | | | — | |
Consumer Services | | | 36,192,621 | | | | 36,192,621 | | | | — | | | | — | |
Diversified Financials | | | 51,582,712 | | | | 51,582,712 | | | | — | | | | — | |
Energy | | | 115,514,174 | | | | 115,514,174 | | | | — | | | | — | |
Food & Staples Retailing | | | 8,824,505 | | | | 8,824,505 | | | | — | | | | — | |
Food, Beverage & Tobacco | | | 84,771,920 | | | | 67,155,290 | | | | 17,616,630 | | | | — | |
Health Care Equipment & Services | | | 64,923,355 | | | | 64,923,355 | | | | — | | | | — | |
Insurance | | | 57,353,460 | | | | 57,353,460 | | | | — | | | | — | |
Materials | | | 38,703,355 | | | | 38,703,355 | | | | — | | | | — | |
Media | | | 43,797,631 | | | | 43,797,631 | | | | — | | | | — | |
Pharmaceuticals, Biotechnology & Life Sciences | | | 176,269,931 | | | | 135,385,094 | | | | 40,884,837 | | | | — | |
Retailing | | | 59,347,593 | | | | 39,464,189 | | | | — | | | | 19,883,404 | |
Semiconductors & Semiconductor Equipment | | | 92,832,581 | | | | 92,832,581 | | | | — | | | | — | |
Software & Services | | | 134,230,114 | | | | 134,230,114 | | | | — | | | | — | |
Technology Hardware & Equipment | | | 112,080,987 | | | | 112,080,987 | | | | — | | | | — | |
Telecommunication Services | | | 9,645,232 | | | | 9,645,232 | | | | — | | | | — | |
Transportation | | | 22,032,000 | | | | 22,032,000 | | | | — | | | | — | |
Utilities | | | 33,704,444 | | | | 33,704,444 | | | | — | | | | — | |
Asset & Commercial Mortgage Backed Securities | | | 69,886,570 | | | | — | | | | 69,886,570 | | | | — | |
Corporate Bonds | | | 455,929,704 | | | | — | | | | 455,929,704 | | | | — | |
Foreign Government Obligations | | | 6,179,156 | | | | — | | | | 6,179,156 | | | | — | |
Municipal Bonds | | | 29,543,513 | | | | — | | | | 29,543,513 | | | | — | |
U.S. Government Agencies | | | 11,204,033 | | | | — | | | | 11,204,033 | | | | — | |
U.S. Government Securities | | | 264,349,226 | | | | — | | | | 264,349,226 | | | | — | |
Short-Term Investments | | | 21,966,161 | | | | 21,966,161 | | | | — | | | | — | |
| | | | | | | | | | | | | | | | |
Total | | $ | 2,315,371,783 | | | $ | 1,399,894,710 | | | $ | 895,593,669 | | | $ | 19,883,404 | |
| | | | | | | | | | | | | | | | |
Liabilities | |
Futures Contracts(2) | | $ | (161,124 | ) | | $ | (161,124 | ) | | $ | — | | | $ | — | |
| | | | | | | | | | | | | | | | |
Total | | $ | (161,124 | ) | | $ | (161,124 | ) | | $ | — | | | $ | — | |
| | | | | | | | | | | | | | | | |
| (1) | For the year ended December 31, 2016, there were no transfers between any levels. |
| (2) | Derivative instruments (excluding purchased and written options, if applicable) are valued at the unrealized appreciation/depreciation on the investments. |
The following is a rollforward of the Fund’s investments that were valued using unobservable inputs (Level 3) for the year ended December 31, 2016:
| | | | | | | | |
| | | Common
Stocks | | | Total | |
Beginning balance | | $ | 19,755,780 | | | $ | 19,755,780 | |
Purchases | | | — | | | | — | |
Sales | | | — | | | | — | |
Accrued discounts/(premiums) | | | — | | | | — | |
Total realized gain/(loss) | | | — | | | | — | |
Net change in unrealized appreciation/depreciation | | | 127,624 | | | | 127,624 | |
Transfers into Level 3 | | | — | | | | — | |
Transfers out of Level 3 | | | — | | | | — | |
| | | | | | | | |
Ending balance | | $ | 19,883,404 | | | $ | 19,883,404 | |
| | | | | | | | |
The change in net unrealized appreciation/depreciation relating to the Level 3 investments held at December 31, 2016 was $127,624.
The accompanying notes are an integral part of these financial statements.
|
| Hartford Capital Appreciation HLS Fund |
Schedule of Investments
December 31, 2016
| | | | | | | | |
Shares or Principal Amount | | Market Value† | |
| COMMON STOCKS - 96.6% | |
| | | | Automobiles & Components - 1.9% | |
| | 733,440 | | | Delphi Automotive plc | | $ | 49,397,184 | |
| | 969,524 | | | Goodyear Tire & Rubber Co. | | | 29,929,206 | |
| | 240,260 | | | Magna International, Inc. | | | 10,432,471 | |
| | 30,978 | | | Tesla Motors, Inc.* | | | 6,619,689 | |
| | | | | | | | |
| | | | | | | 96,378,550 | |
| | | | | | | | |
| | | | Banks - 8.8% | |
| | 4,329,353 | | | Banco Santander S.A. | | | 22,522,467 | |
| | 2,672,216 | | | Bank of America Corp. | | | 59,055,974 | |
| | 142,377 | | | BB&T Corp. | | | 6,694,566 | |
| | 2,648,611 | | | CaixaBank S.A. | | | 8,729,228 | |
| | 1,345,555 | | | Citigroup, Inc. | | | 79,966,334 | |
| | 1,411,126 | | | FinecoBank Banca Fineco S.p.A. | | | 7,889,867 | |
| | 3,321,489 | | | ICICI Bank Ltd. ADR | | | 24,877,953 | |
| | 2,258,596 | | | Itau Unibanco Holding S.A. ADR | | | 23,218,367 | |
| | 608,771 | | | JP Morgan Chase & Co. | | | 52,530,850 | |
| | 76,467 | | | M&T Bank Corp. | | | 11,961,733 | |
| | 773,558 | | | PNC Financial Services Group, Inc. | | | 90,475,344 | |
| | 2,023,400 | | | Sberbank of Russia PJSC ADR | | | 23,297,450 | |
| | 242,200 | | | Sumitomo Mitsui Financial Group, Inc. | | | 9,223,693 | |
| | 237,571 | | | US Bancorp | | | 12,204,022 | |
| | 373,845 | | | Wells Fargo & Co. | | | 20,602,598 | |
| | | | | | | | |
| | | | | | | 453,250,446 | |
| | | | | | | | |
| | | | Capital Goods - 3.4% | |
| | 691,475 | | | AerCap Holdings N.V.* | | | 28,772,275 | |
| | 185,664 | | | Airbus Group SE | | | 12,262,860 | |
| | 247,835 | | | Eaton Corp. plc | | | 16,627,250 | |
| | 210,850 | | | Fastenal Co. | | | 9,905,733 | |
| | 49,296 | | | General Dynamics Corp. | | | 8,511,447 | |
| | 350,600 | | | Harry’s, Inc.*(1)(2)(3) | | | 4,691,028 | |
| | 97,568 | | | Honeywell International, Inc. | | | 11,303,253 | |
| | 1,651,000 | | | Kawasaki Heavy Industries Ltd. | | | 5,167,903 | |
| | 78,076 | | | Lockheed Martin Corp. | | | 19,514,316 | |
| | 83,986 | | | Middleby Corp.* | | | 10,818,237 | |
| | 163,297 | | | Owens Corning | | | 8,419,593 | |
| | 47,721 | | | Rockwell Automation, Inc. | | | 6,413,702 | |
| | 781,530 | | | Sanwa Holdings Corp. | | | 7,433,110 | |
| | 148,011 | | | Siemens AG | | | 18,122,458 | |
| | 29,518 | | | TransDigm Group, Inc. | | | 7,348,801 | |
| | | | | | | | |
| | | | | | | 175,311,966 | |
| | | | | | | | |
| | | | Commercial & Professional Services - 1.2% | |
| | 94,936 | | | Clean Harbors, Inc.* | | | 5,283,188 | |
| | 120,195 | | | Equifax, Inc. | | | 14,210,655 | |
| | 222,200 | | | Herman Miller, Inc. | | | 7,599,240 | |
| | 527,040 | | | IHS Markit Ltd.* | | | 18,662,486 | |
| | 118,283 | | | Nielsen Holdings plc | | | 4,961,972 | |
| | 340,900 | | | Steelcase, Inc. Class A | | | 6,102,110 | |
| | 187,922 | | | TransUnion* | | | 5,812,428 | |
| | | | | | | | |
| | | | | | | 62,632,079 | |
| | | | | | | | |
| | | | Consumer Durables & Apparel - 3.2% | |
| | 39,057,860 | | | Global Brands Group Holding Ltd.* | | | 5,166,507 | |
| | 297,562 | | | Kate Spade & Co.* | | | 5,555,483 | |
| | 305,016 | | | Lennar Corp. Class A | | | 13,094,337 | |
| | 161,243 | | | Newell Brands, Inc. | | | 7,199,500 | |
| | 921,634 | | | NIKE, Inc. Class B | | | 46,846,656 | |
| | 164,536 | | | Pandora A/S | | | 21,478,525 | |
| | 91,169 | | | Ralph Lauren Corp. | | | 8,234,384 | |
| | 896,500 | | | Sony Corp. | | | 25,049,933 | |
| | 382,503 | | | Toll Brothers, Inc.* | | | 11,857,593 | |
| | | | | | | | |
Shares or Principal Amount | | Market Value† | |
| COMMON STOCKS - 96.6% - (continued) | |
| | | | Consumer Durables & Apparel - 3.2% - (continued) | |
| | 195,536 | | | Under Armour, Inc. Class C* | | $ | 4,921,641 | |
| | 235,100 | | | VF Corp. | | | 12,542,585 | |
| | | | | | | | |
| | | | | | | 161,947,144 | |
| | | | | | | | |
| | | | Consumer Services - 1.8% | |
| | 1,183,700 | | | Hilton Worldwide Holdings, Inc. | | | 32,196,640 | |
| | 195,274 | | | Las Vegas Sands Corp. | | | 10,429,584 | |
| | 76,483 | | | Marriott International, Inc. Class A | | | 6,323,615 | |
| | 74,071 | | | Marriott Vacations Worldwide Corp. | | | 6,284,924 | |
| | 192,218 | | | McDonald’s Corp. | | | 23,396,775 | |
| | 71,024 | | | Panera Bread Co. Class A* | | | 14,566,312 | |
| | | | | | | | |
| | | | | | | 93,197,850 | |
| | | | | | | | |
| | | | Diversified Financials - 3.6% | |
| | 425,808 | | | American Express Co. | | | 31,543,857 | |
| | 242,885 | | | Banca Generali S.p.A. | | | 5,776,952 | |
| | 55,284 | | | BlackRock, Inc. | | | 21,037,773 | |
| | 595,630 | | | Blackstone Group L.P. | | | 16,099,879 | |
| | 297,539 | | | Capital One Financial Corp. | | | 25,957,302 | |
| | 213,464 | | | Credit Suisse Group AG* | | | 3,050,620 | |
| | 54,000 | | | Goldman Sachs Group, Inc. | | | 12,930,300 | |
| | 180,758 | | | Intercontinental Exchange, Inc. | | | 10,198,366 | |
| | 136,776 | | | Macquarie Group Ltd. | | | 8,567,923 | |
| | 443,960 | | | OneMain Holdings, Inc.* | | | 9,829,274 | |
| | 204,856 | | | Raymond James Financial, Inc. | | | 14,190,375 | |
| | 21,202 | | | S&P Global, Inc. | | | 2,280,063 | |
| | 750,000 | | | Saban Capital Acquisition Corp. UNIT* | | | 7,777,500 | |
| | 184,285 | | | Synchrony Financial | | | 6,684,017 | |
| | 147,505 | | | TD Ameritrade Holding Corp. | | | 6,431,218 | |
| | 382,441 | | | WisdomTree Investments, Inc. | | | 4,260,393 | |
| | | | | | | | |
| | | | | | | 186,615,812 | |
| | | | | | | | |
| | | | Energy - 5.1% | |
| | 386,838 | | | Anadarko Petroleum Corp. | | | 26,974,214 | |
| | 229,657 | | | Baker Hughes, Inc. | | | 14,920,815 | |
| | 495,850 | | | Cabot Oil & Gas Corp. | | | 11,583,056 | |
| | 291,409 | | | Canadian Natural Resources Ltd. | | | 9,290,119 | |
| | 49,942 | | | Centennial Resource Development, Inc. PIPE*(1)(2)(3) | | | 889,709 | |
| | 267,799 | | | Continental Resources, Inc.* | | | 13,802,360 | |
| | 175,832 | | | Diamondback Energy, Inc.* | | | 17,769,582 | |
| | 507,276 | | | Eni S.p.A. | | | 8,223,489 | |
| | 77,678 | | | EOG Resources, Inc. | | | 7,853,246 | |
| | 352,344 | | | Halliburton Co. | | | 19,058,287 | |
| | 93,319 | | | Helmerich & Payne, Inc. | | | 7,222,891 | |
| | 99,094 | | | Hess Corp. | | | 6,172,565 | |
| | 380,486 | | | HollyFrontier Corp. | | | 12,464,721 | |
| | 719,232 | | | Kinder Morgan, Inc. | | | 14,895,295 | |
| | 628,536 | | | Marathon Oil Corp. | | | 10,879,958 | |
| | 145,327 | | | Newfield Exploration Co.* | | | 5,885,744 | |
| | 504,375 | | | Petroleo Brasileiro S.A. ADR* | | | 5,099,231 | |
| | 210,572 | | | Pioneer Natural Resources Co. | | | 37,917,700 | |
| | 3,646,446 | | | Rosneft Oil Co. PJSC GDR | | | 23,681,964 | |
| | 185,610 | | | Transocean Ltd.* | | | 2,735,891 | |
| | 381,270 | | | WPX Energy, Inc.* | | | 5,555,104 | |
| | | | | | | | |
| | | | | | | 262,875,941 | |
| | | | | | | | |
| | | | Food & Staples Retailing - 1.3% | |
| | 371,303 | | | Costco Wholesale Corp. | | | 59,449,324 | |
| | 172,845 | | | Seven & I Holdings Co., Ltd. | | | 6,573,152 | |
| | | | | | | | |
| | | | | | | 66,022,476 | |
| | | | | | | | |
The accompanying notes are an integral part of these financial statements.
|
| Hartford Capital Appreciation HLS Fund |
Schedule of Investments – (continued)
December 31, 2016
| | | | | | | | |
Shares or Principal Amount | | Market Value† | |
| COMMON STOCKS - 96.6% - (continued) | |
| | | | Food, Beverage & Tobacco - 2.9% | |
| | 670,395 | | | BRF S.A. ADR | | $ | 9,895,030 | |
| | 280,937 | | | British American Tobacco plc | | | 15,922,207 | |
| | 564,685 | | | Coca-Cola Co. | | | 23,411,840 | |
| | 479,963 | | | Hostess Brands, Inc.* | | | 6,239,519 | |
| | 39,212 | | | JM Smucker Co. | | | 5,021,489 | |
| | 310,875 | | | Molson Coors Brewing Co. Class B | | | 30,251,246 | |
| | 345,116 | | | Mondelez International, Inc. Class A | | | 15,298,992 | |
| | 682,493 | | | Monster Beverage Corp.* | | | 30,261,740 | |
| | 145,390 | | | Post Holdings, Inc.* | | | 11,687,902 | |
| | | | | | | | |
| | | | | | | 147,989,965 | |
| | | | | | | | |
| | | | Health Care Equipment & Services - 5.4% | |
| | 70,048 | | | ABIOMED, Inc.* | | | 7,893,009 | |
| | 503,800 | | | Acadia Healthcare Co., Inc.* | | | 16,675,780 | |
| | 69,018 | | | Align Technology, Inc.* | | | 6,634,700 | |
| | 27,936 | | | Becton Dickinson and Co. | | | 4,624,805 | |
| | 542,299 | | | Boston Scientific Corp.* | | | 11,729,927 | |
| | 319,746 | | | Cardinal Health, Inc. | | | 23,012,120 | |
| | 203,399 | | | DENTSPLY SIRONA, Inc. | | | 11,742,224 | |
| | 95,267 | | | DexCom, Inc.* | | | 5,687,440 | |
| | 127,410 | | | Edwards Lifesciences Corp.* | | | 11,938,317 | |
| | 218,023 | | | Envision Healthcare Corp.* | | | 13,798,676 | |
| | 588,870 | | | HCA Holdings, Inc.* | | | 43,588,158 | |
| | 212,103 | | | Hologic, Inc.* | | | 8,509,572 | |
| | 142,130 | | | Insulet Corp.* | | | 5,355,458 | |
| | 132,400 | | | Invuity, Inc.* | | | 761,300 | |
| | 36,847 | | | Laboratory Corp. of America Holdings* | | | 4,730,418 | |
| | 270,345 | | | McKesson Corp. | | | 37,969,955 | |
| | 455,319 | | | Medtronic plc | | | 32,432,372 | |
| | 51,118 | | | Quest Diagnostics, Inc. | | | 4,697,744 | |
| | 122,406 | | | UnitedHealth Group, Inc. | | | 19,589,856 | |
| | 173,231 | | | Veeva Systems, Inc. Class A* | | | 7,050,502 | |
| | | | | | | | |
| | | | | | | 278,422,333 | |
| | | | | | | | |
| | | | Household & Personal Products - 1.4% | |
| | 114,911 | | | Beiersdorf AG | | | 9,733,866 | |
| | 531,368 | | | Colgate-Palmolive Co. | | | 34,772,722 | |
| | 919,770 | | | Coty, Inc. Class A | | | 16,840,989 | |
| | 144,659 | | | Estee Lauder Cos., Inc. Class A | | | 11,064,967 | |
| | | | | | | | |
| | | | | | | 72,412,544 | |
| | | | | | | | |
| | | | Insurance - 6.6% | |
| | 99,685 | | | Aflac, Inc. | | | 6,938,076 | |
| | 94,110 | | | Allstate Corp. | | | 6,975,433 | |
| | 328,715 | | | American International Group, Inc. | | | 21,468,377 | |
| | 62,721 | | | Aon plc | | | 6,995,273 | |
| | 397,449 | | | Arthur J Gallagher & Co. | | | 20,651,450 | |
| | 671,719 | | | Assicurazioni Generali S.p.A. | | | 9,956,458 | |
| | 446,641 | | | AXA S.A. | | | 11,259,278 | |
| | 49,298 | | | Axis Capital Holdings Ltd. | | | 3,217,680 | |
| | 632,145 | | | Chubb Ltd. | | | 83,518,997 | |
| | 18,311 | | | Everest Re Group Ltd. | | | 3,962,500 | |
| | 102,636 | | | Loews Corp. | | | 4,806,444 | |
| | 368,528 | | | Marsh & McLennan Cos., Inc. | | | 24,908,808 | |
| | 810,868 | | | MetLife, Inc. | | | 43,697,677 | |
| | 309,682 | | | Principal Financial Group, Inc. | | | 17,918,201 | |
| | 235,323 | | | Prudential Financial, Inc. | | | 24,487,711 | |
| | 29,580 | | | Reinsurance Group of America, Inc. | | | 3,722,051 | |
| | 23,050 | | | RenaissanceRe Holdings Ltd. | | | 3,139,871 | |
| | 357,300 | | | Sony Financial Holdings, Inc. | | | 5,569,743 | |
| | 42,030 | | | Tokio Marine Holdings, Inc. | | | 1,720,836 | |
| | 51,443 | | | Torchmark Corp. | | | 3,794,436 | |
| | | | | | | | |
Shares or Principal Amount | | Market Value† | |
| COMMON STOCKS - 96.6% - (continued) | |
| | | | Insurance - 6.6% - (continued) | |
| | 64,506 | | | Travelers Cos., Inc. | | $ | 7,896,825 | |
| | 287,287 | | | Unum Group | | | 12,620,518 | |
| | 207,408 | | | XL Group Ltd. | | | 7,728,022 | |
| | | | | | | | |
| | | | | | | 336,954,665 | |
| | | | | | | | |
| | | | Materials - 3.7% | |
| | 234,754 | | | Anglo American plc* | | | 3,316,800 | |
| | 1,063,782 | | | BHP Billiton plc | | | 16,938,615 | |
| | 293,464 | | | Celanese Corp. Series A | | | 23,107,355 | |
| | 398,669 | | | CF Industries Holdings, Inc. | | | 12,550,100 | |
| | 328,509 | | | Dow Chemical Co. | | | 18,797,285 | |
| | 776,355 | | | Freeport-McMoRan, Inc.* | | | 10,240,123 | |
| | 7,131,814 | | | Glencore plc* | | | 24,097,564 | |
| | 306,305 | | | International Paper Co. | | | 16,252,543 | |
| | 363,300 | | | Ivanhoe Mines Ltd. Class A* | | | 687,284 | |
| | 267,141 | | | LafargeHolcim Ltd.* | | | 14,022,784 | |
| | 353,900 | | | Methanex Corp. | | | 15,522,415 | |
| | 396,169 | | | Platform Specialty Products Corp.* | | | 3,886,418 | |
| | 127,058 | | | Praxair, Inc. | | | 14,889,927 | |
| | 196,944 | | | Reliance Steel & Aluminum Co. | | | 15,664,926 | |
| | | | | | | | |
| | | | | | | 189,974,139 | |
| | | | | | | | |
| | | | Media - 1.4% | |
| | 172,598 | | | John Wiley & Sons, Inc. Class A | | | 9,406,591 | |
| | 735,476 | | | SES S.A. | | | 16,182,523 | |
| | 497,387 | | | Sky plc | | | 6,063,609 | |
| | 96,200 | | | Time Warner, Inc. | | | 9,286,186 | |
| | 599,789 | | | Twenty-First Century Fox, Inc. Class A | | | 16,818,083 | |
| | 158,832 | | | Walt Disney Co. | | | 16,553,471 | |
| | 29,800 | | | Weinstein Co. LLC*(1)(2)(3) | | | — | |
| | | | | | | | |
| | | | | | | 74,310,463 | |
| | | | | | | | |
| | | | Pharmaceuticals, Biotechnology & Life Sciences - 8.5% | |
| | 291,422 | | | Alkermes plc* | | | 16,197,235 | |
| | 258,353 | | | Allergan plc* | | | 54,256,713 | |
| | 31,551 | | | Biogen, Inc.* | | | 8,947,233 | |
| | 2,103,023 | | | Bristol-Myers Squibb Co. | | | 122,900,664 | |
| | 196,502 | | | Celgene Corp.* | | | 22,745,106 | |
| | 102,360 | | | Eisai Co., Ltd. | | | 5,865,981 | |
| | 489,475 | | | Hikma Pharmaceuticals plc | | | 11,408,525 | |
| | 181,010 | | | Incyte Corp.* | | | 18,149,873 | |
| | 104,203 | | | Ionis Pharmaceuticals, Inc.* | | | 4,984,029 | |
| | 591,580 | | | Merck & Co., Inc. | | | 34,826,315 | |
| | 35,574 | | | Mettler-Toledo International, Inc.* | | | 14,889,853 | |
| | 475,599 | | | Mylan N.V.* | | | 18,144,102 | |
| | 607,600 | | | Ono Pharmaceutical Co., Ltd. | | | 13,242,409 | |
| | 567,698 | | | Pfizer, Inc. | | | 18,438,831 | |
| | 98,930 | | | Regeneron Pharmaceuticals, Inc.* | | | 36,316,214 | |
| | 69,279 | | | TESARO, Inc.* | | | 9,316,640 | |
| | 234,641 | | | Teva Pharmaceutical Industries Ltd. ADR | | | 8,505,736 | |
| | 118,600 | | | Thermo Fisher Scientific, Inc. | | | 16,734,460 | |
| | | | | | | | |
| | | | | | | 435,869,919 | |
| | | | | | | | |
| | | | Real Estate - 2.2% | |
| | 185,304 | | | American Tower Corp. REIT | | | 19,582,927 | |
| | 518,051 | | | Columbia Property Trust, Inc. REIT | | | 11,189,901 | |
| | 20,254 | | | Equinix, Inc. REIT | | | 7,238,982 | |
| | 802,226 | | | Host Hotels & Resorts, Inc. REIT | | | 15,113,938 | |
| | 143,977 | | | Public Storage REIT | | | 32,178,859 | |
| | 40,200 | | | Simon Property Group, Inc. REIT | | | 7,142,334 | |
| | 422,277 | | | STORE Capital Corp. REIT | | | 10,434,465 | |
The accompanying notes are an integral part of these financial statements.
|
| Hartford Capital Appreciation HLS Fund |
Schedule of Investments – (continued)
December 31, 2016
| | | | | | | | |
Shares or Principal Amount | | Market Value† | |
| COMMON STOCKS - 96.6% - (continued) | |
| | | | Real Estate - 2.2% - (continued) | |
| | 256,951 | | | Vonovia SE | | $ | 8,342,520 | |
| | | | | | | | |
| | | | | | | 111,223,926 | |
| | | | | | | | |
| | | | Retailing - 4.9% | |
| | 35,269 | | | Advance Auto Parts, Inc. | | | 5,964,693 | |
| | 8,451,700 | | | Allstar Co.*(1)(2)(3) | | | 8,789,768 | |
| | 37,778 | | | Amazon.com, Inc.* | | | 28,328,589 | |
| | 248,043 | | | CarMax, Inc.* | | | 15,971,489 | |
| | 149,926 | | | Dick’s Sporting Goods, Inc. | | | 7,961,071 | |
| | 227,551 | | | Expedia, Inc. | | | 25,776,977 | |
| | 17,385 | | | Honest Co.*(1)(2)(3) | | | 600,130 | |
| | 87,800 | | | L Brands, Inc. | | | 5,780,752 | |
| | 263,242 | | | Lowe’s Cos., Inc. | | | 18,721,771 | |
| | 559,391 | | | Netflix, Inc.* | | | 69,252,606 | |
| | 17,836 | | | Priceline Group, Inc.* | | | 26,148,646 | |
| | 301,319 | | | TJX Cos., Inc. | | | 22,638,096 | |
| | 280,504 | | | Tory Burch LLC*(1)(2)(3) | | | 13,253,791 | |
| | 19,292 | | | Wayfair, Inc. Class A* | | | 676,185 | |
| | | | | | | | |
| | | | | | | 249,864,564 | |
| | | | | | | | |
| | | | Semiconductors & Semiconductor Equipment - 2.3% | |
| | 270,631 | | | Analog Devices, Inc. | | | 19,653,223 | |
| | 165,743 | | | Broadcom Ltd. | | | 29,298,390 | |
| | 98,948 | | | Cavium, Inc.* | | | 6,178,313 | |
| | 461,838 | | | Intel Corp. | | | 16,750,864 | |
| | 377,643 | | | Micron Technology, Inc.* | | | 8,277,934 | |
| | 111,418 | | | Silicon Motion Technology Corp. ADR | | | 4,733,037 | |
| | 154,575 | | | SK Hynix, Inc. | | | 5,687,754 | |
| | 245,960 | | | Skyworks Solutions, Inc. | | | 18,363,374 | |
| | 1,376,467 | | | SunPower Corp.* | | | 9,098,447 | |
| | | | | | | | |
| | | | | | | 118,041,336 | |
| | | | | | | | |
| | | | Software & Services - 14.9% | |
| | 188,048 | | | Accenture plc Class A | | | 22,026,062 | |
| | 411,469 | | | Activision Blizzard, Inc. | | | 14,858,146 | |
| | 187,342 | | | Adobe Systems, Inc.* | | | 19,286,859 | |
| | 230,977 | | | Akamai Technologies, Inc.* | | | 15,401,546 | |
| | 404,854 | | | Alibaba Group Holding Ltd. ADR* | | | 35,550,230 | |
| | 39,147 | | | Alliance Data Systems Corp. | | | 8,945,090 | |
| | 22,108 | | | Alphabet, Inc. Class A* | | | 17,519,485 | |
| | 108,381 | | | Alphabet, Inc. Class C* | | | 83,650,623 | |
| | 117,204 | | | Aspen Technology, Inc.* | | | 6,408,715 | |
| | 226,505 | | | Autodesk, Inc.* | | | 16,763,635 | |
| | 219,676 | | | Automatic Data Processing, Inc. | | | 22,578,299 | |
| | 1,089,362 | | | Cadence Design Systems, Inc.* | | | 27,473,710 | |
| | 117,156 | | | Capgemini S.A. | | | 9,870,289 | |
| | 32,555 | | | CoStar Group, Inc.* | | | 6,136,292 | |
| | 184,967 | | | Dropbox, Inc. Class B*(1)(2)(3) | | | 1,781,232 | |
| | 195,967 | | | Envestnet, Inc.* | | | 6,907,837 | |
| | 653,909 | | | Facebook, Inc. Class A* | | | 75,232,230 | |
| | 92,295 | | | FleetCor Technologies, Inc.* | | | 13,061,588 | |
| | 976,240 | | | Genpact Ltd.* | | | 23,761,682 | |
| | 735,179 | | | Global Payments, Inc. | | | 51,028,774 | |
| | 193,480 | | | GoDaddy, Inc. Class A* | | | 6,762,126 | |
| | 97,603 | | | IBM Corp. | | | 16,201,122 | |
| | 2,296,502 | | | Just Eat plc* | | | 16,501,582 | |
| | 834,842 | | | Microsoft Corp. | | | 51,877,082 | |
| | 532,364 | | | Mobileye N.V.* | | | 20,293,716 | |
| | 36,100 | | | Nintendo Co., Ltd. | | | 7,504,301 | |
| | 362,359 | | | Oracle Corp. | | | 13,932,704 | |
| | 159,018 | | | PayPal Holdings, Inc.* | | | 6,276,440 | |
| | 129,789 | | | Salesforce.com, Inc.* | | | 8,885,355 | |
| | | | | | | | |
Shares or Principal Amount | | Market Value† | |
| COMMON STOCKS - 96.6% - (continued) | |
| | | | Software & Services - 14.9% - (continued) | |
| | 492,738 | | | ServiceNow, Inc.* | | $ | 36,630,143 | |
| | 157,074 | | | SS&C Technologies Holdings, Inc. | | | 4,492,316 | |
| | 3,800 | | | Trade Desk, Inc. Class A* | | | 105,146 | |
| | 37,790 | | | Ultimate Software Group, Inc.* | | | 6,891,007 | |
| | 199,576 | | | VeriSign, Inc.* | | | 15,181,746 | |
| | 297,743 | | | Visa, Inc. Class A | | | 23,229,909 | |
| | 442,724 | | | Workday, Inc. Class A* | | | 29,259,629 | |
| | 407,453 | | | Zillow Group, Inc. Class A* | | | 14,851,662 | |
| | 284,047 | | | Zillow Group, Inc. Class C* | | | 10,359,194 | |
| | | | | | | | |
| | | | | | | 767,477,504 | |
| | | | | | | | |
| | | | Technology Hardware & Equipment - 3.6% | |
| | 193,360 | | | Amphenol Corp. Class A | | | 12,993,792 | |
| | 107,842 | | | Arista Networks, Inc.* | | | 10,435,870 | |
| | 1,047,918 | | | Cisco Systems, Inc. | | | 31,668,082 | |
| | 1,916,500 | | | Flex Ltd.* | | | 27,540,105 | |
| | 129,091 | | | Motorola Solutions, Inc. | | | 10,700,353 | |
| | 113,416 | | | Pure Storage, Inc. Class A* | | | 1,282,735 | |
| | 34,066 | | | Samsung Electronics Co., Ltd. | | | 50,700,839 | |
| | 734,698 | | | Trimble, Inc.* | | | 22,151,145 | |
| | 242,535 | | | Western Digital Corp. | | | 16,480,253 | |
| | | | | | | | |
| | | | | | | 183,953,174 | |
| | | | | | | | |
| | | | Telecommunication Services - 1.4% | |
| | 516,182 | | | AT&T, Inc. | | | 21,953,220 | |
| | 179,900 | | | Nippon Telegraph & Telephone Corp. | | | 7,572,915 | |
| | 682,671 | | | Verizon Communications, Inc. | | | 36,440,978 | |
| | 3,646,942 | | | Zegona Communications plc | | | 5,446,770 | |
| | | | | | | | |
| | | | | | | 71,413,883 | |
| | | | | | | | |
| | | | Transportation - 4.7% | |
| | 182,593 | | | Alaska Air Group, Inc. | | | 16,201,477 | |
| | 318,950 | | | American Airlines Group, Inc. | | | 14,891,775 | |
| | 373,253 | | | Canadian National Railway Co. | | | 25,119,831 | |
| | 472,162 | | | CSX Corp. | | | 16,964,781 | |
| | 245,891 | | | FedEx Corp. | | | 45,784,904 | |
| | 198,399 | | | Genesee & Wyoming, Inc. Class A* | | | 13,770,874 | |
| | 349,511 | | | J.B. Hunt Transport Services, Inc. | | | 33,927,033 | |
| | 170,835 | | | Knight Transportation, Inc. | | | 5,646,097 | |
| | 96,244 | | | Southwest Airlines Co. | | | 4,796,801 | |
| | 21,264 | | | Swift Transportation Co.* | | | 517,991 | |
| | 266,854 | | | Union Pacific Corp. | | | 27,667,423 | |
| | 294,373 | | | United Parcel Service, Inc. Class B | | | 33,746,921 | |
| | | | | | | | |
| | | | | | | 239,035,908 | |
| | | | | | | | |
| | | | Utilities - 2.4% | |
| | 117,360 | | | American Electric Power Co., Inc. | | | 7,388,986 | |
| | 17,957,000 | | | China Longyuan Power Group Corp. Ltd. Class H | | | 13,953,484 | |
| | 125,052 | | | Duke Energy Corp. | | | 9,706,536 | |
| | 65,796 | | | Entergy Corp. | | | 4,834,032 | |
| | 449,002 | | | Exelon Corp. | | | 15,935,081 | |
| | 1,064,087 | | | Iberdrola S.A. | | | 6,967,518 | |
| | 353,403 | | | OGE Energy Corp. | | | 11,821,330 | |
| | 397,160 | | | PG&E Corp. | | | 24,135,413 | |
| | 184,814 | | | PPL Corp. | | | 6,292,917 | |
| | 141,814 | | | Public Service Enterprise Group, Inc. | | | 6,222,798 | |
| | 85,248 | | | Sempra Energy | | | 8,579,359 | |
| | 186,763 | | | Southern Co. | | | 9,186,872 | |
| | | | | | | | |
| | | | | | | 125,024,326 | |
| | | | | | | | |
| | |
| | | | Total Common Stocks
(cost $4,675,369,824) | | $ | 4,960,200,913 | |
| | | | | | | | |
The accompanying notes are an integral part of these financial statements.
|
| Hartford Capital Appreciation HLS Fund |
Schedule of Investments – (continued)
December 31, 2016
| | | | | | | | |
Shares or Principal Amount | | Market Value† | |
| PREFERRED STOCKS - 1.2% | |
| | | | Consumer Durables & Apparel - 0.0% | |
| | 127,917 | | | One Kings Lane, Inc.*(1)(2)(3) | | $ | 133,034 | |
| | | | | | | | |
| | | | Consumer Services - 0.1% | |
| | 16,619 | | | Airbnb, Inc. Series E*(1)(2)(3) | | | 1,744,995 | |
| | 161,097 | | | DraftKings, Inc. Series D*(1)(2)(3) | | | 639,555 | |
| | 139,659 | | | DraftKings, Inc. Series D-1*(1)(2)(3) | | | 729,020 | |
| | | | | | | | |
| | | | | | | 3,113,570 | |
| | | | | | | | |
| | | | Diversified Financials - 0.1% | |
| | 284,119 | | | Social Finance, Inc.*(1)(2)(3) | | | 4,482,347 | |
| | | | | | | | |
| | | | Software & Services - 1.0% | |
| | 56,702 | | | Cloudera, Inc.*(1)(2)(3) | | | 976,975 | |
| | 29,504 | | | Magic Leap, Inc. Series C*(1)(2)(3) | | | 679,566 | |
| | 50,200 | | | Nanigans, Inc.*(1)(2)(3) | | | 341,360 | |
| | 793,410 | | | Pinterest, Inc. Series G*(1)(2)(3) | | | 4,585,910 | |
| | 20,891 | | | Sharecare*(1)(2)(3) | | | 5,220,034 | |
| | 815,160 | | | Uber Technologies, Inc.*(1)(2)(3) | | | 39,757,169 | |
| | 293,655 | | | Zuora, Inc. Series F*(1)(2)(3) | | | 1,089,460 | |
| | | | | | | | |
| | | | | | | 52,650,474 | |
| | | | | | | | |
| | | | Telecommunication Services - 0.0% | |
| | 3,739 | | | DocuSign, Inc. Series B*(1)(2)(3) | | | 60,385 | |
| | 1,120 | | | DocuSign, Inc. Series B-1*(1)(2)(3) | | | 18,088 | |
| | 2,687 | | | DocuSign, Inc. Series D*(1)(2)(3) | | | 43,395 | |
| | 58,183 | | | DocuSign, Inc. Series E*(1)(2)(3) | | | 939,655 | |
| | | | | | | | |
| | | | | | | 1,061,523 | |
| | | | | | | | |
| | |
| | | | Total Preferred Stocks
(cost $37,533,508) | | $ | 61,440,948 | |
| | | | | | | | |
| |
| CONVERTIBLE PREFERRED STOCKS - 0.0% | | | |
| | | | Retailing - 0.0% | | | |
| | 40,566 | | | Honest Co. Series C*(1)(2)(3) | | $ | 1,400,338 | |
| | | | | | | | |
| | |
| | | | Total Convertible Preferred Stocks
(cost $1,097,606) | | $ | 1,400,338 | |
| | | | | | | | |
| | |
| | | | Total Long-Term Investments
(cost $4,714,000,938) | | $ | 5,023,042,199 | |
| | | | | | | | |
| |
| SHORT-TERM INVESTMENTS - 2.2% | | | |
| | | | Other Investment Pools & Funds - 2.2% | | | |
| | 112,629,057 | | | BlackRock Liquidity Funds TempFund Portfolio, Institutional Class | | $ | 112,629,057 | |
| | | | | | | | |
| | |
| | | | Total Short-Term Investments
(cost $112,629,057) | | $ | 112,629,057 | |
| | | | | | | | |
| | | | | | | | | | | | |
| | | |
| | | | Total Investments
(cost $4,826,629,995)^ | | | 100.0 | % | | $ | 5,135,671,256 | |
| | | | Other Assets and Liabilities | | | 0.0 | % | | | (616,783 | ) |
| | | | | | | | | | | | |
| | | | Total Net Assets | | | 100.0 | % | | $ | 5,135,054,473 | |
| | | | | | | | | | | | |
The accompanying notes are an integral part of these financial statements.
|
| Hartford Capital Appreciation HLS Fund |
Schedule of Investments – (continued)
December 31, 2016
| Note: | Percentage of investments as shown is the ratio of the total market value to total net assets. |
| | Prices of foreign equities that are principally traded on certain foreign markets will generally be adjusted daily pursuant to a fair value pricing service approved by the Board of Directors in order to reflect an adjustment for factors occurring after the close of certain foreign markets but before the close of the New York Stock Exchange. |
| | Equity industry classifications used in this report are the Global Industry Classification Standard, which was developed by and is the exclusive property and service mark of MSCI, Inc. and Standard & Poor’s. |
| | For Fund compliance purposes, the Fund may not use the same classification system shown in this report as these classifications are used for financial reporting purposes. |
| ^ | At December 31, 2016, the cost of securities for federal income tax purposes was $4,885,317,570 and the aggregate gross unrealized appreciation and depreciation based on that cost were: |
| | | | |
Unrealized Appreciation | | $ | 447,497,910 | |
Unrealized Depreciation | | | (197,144,224 | ) |
| | | | |
Net Unrealized Appreciation | | $ | 250,353,686 | |
| | | | |
| (1) | These securities are valued in good faith at fair value as determined under policies and procedures established by and under the supervision of the Board of Directors. At December 31, 2016, the aggregate fair value of these securities was $92,846,944, which represents 1.8% of total net assets. This amount excludes securities that are principally traded in certain foreign markets and whose prices are adjusted pursuant to a third party pricing service methodology approved by the Board of Directors. |
| (2) | The following securities are considered illiquid. Illiquid securities are often purchased in private placement transactions, are often not registered under the Securities Act of 1933, as amended, and may have contractual restrictions on resale. A security may also be considered illiquid if the security lacks a readily available market or if its valuation has not changed for a certain period of time. |
| | | | | | | | | | | | |
Period
Acquired | | | Shares/Par | | | Security | | Cost | |
| | 06/2015 | | | | 16,619 | | | Airbnb, Inc. Series E Preferred | | $ | 1,547,136 | |
| | 08/2011 | | | | 8,451,700 | | | Allstar Co. | | | 3,676,649 | |
| | 12/2016 | | | | 49,942 | | | Centennial Resource Development, Inc. PIPE | | | 726,157 | |
| | 02/2014 | | | | 56,702 | | | Cloudera, Inc. Preferred | | | 825,581 | |
| | 02/2014 | | | | 3,739 | | | DocuSign, Inc. Series B Preferred | | | 49,102 | |
| | 02/2014 | | | | 1,120 | | | DocuSign, Inc. Series B-1 Preferred | | | 14,708 | |
| | 02/2014 | | | | 2,687 | | | DocuSign, Inc. Series D Preferred | | | 35,287 | |
| | 02/2014 | | | | 58,183 | | | DocuSign, Inc. Series E Preferred | | | 764,083 | |
| | 07/2015 | | | | 161,097 | | | DraftKings, Inc. Series D Preferred | | | 867,652 | |
| | 08/2015 | | | | 139,659 | | | DraftKings, Inc. Series D-1 Preferred | | | 1,070,543 | |
| | 05/2012 | | | | 184,967 | | | Dropbox, Inc. Class B | | | 1,674,267 | |
| | 06/2015 | | | | 350,600 | | | Harry’s, Inc. | | | 4,713,607 | |
| | 08/2014 | | | | 17,385 | | | Honest Co. | | | 470,391 | |
| | 08/2014 | | | | 40,566 | | | Honest Co. Series C Convertible Preferred | | | 1,097,606 | |
| | 12/2015 | | | | 29,504 | | | Magic Leap, Inc. Series C Preferred | | | 679,566 | |
| | 03/2015 | | | | 50,200 | | | Nanigans, Inc. Preferred | | | 548,109 | |
| | 01/2014 | | | | 127,917 | | | One Kings Lane, Inc. Preferred | | | 1,972,096 | |
| | 03/2015 | | | | 793,410 | | | Pinterest, Inc. Series G Preferred | | | 5,695,963 | |
| | 03/2015 | | | | 20,891 | | | Sharecare Preferred | | | 5,220,034 | |
| | 09/2015 | | | | 284,119 | | | Social Finance, Inc. Preferred | | | 4,482,347 | |
| | 11/2013 | | | | 280,504 | | | Tory Burch LLC | | | 21,984,886 | |
| | 06/2014 | | | | 815,160 | | | Uber Technologies, Inc. Preferred | | | 12,645,618 | |
| | 10/2005 | | | | 29,800 | | | Weinstein Co. LLC | | | 27,950,957 | |
| | 01/2015 | | | | 293,655 | | | Zuora, Inc. Series F Preferred | | | 1,115,683 | |
| | | | | | | | | | | | |
| | | | | | | | | | $ | 99,828,028 | |
| | | | | | | | | | | | |
| | At December 31, 2016, the aggregate value of these securities was $92,846,944, which represents 1.8% of total net assets. |
| (3) | Securities issued within terms of a private placement memorandum and exempt from registration under Rule 144A under the Securities Act of 1933, as amended, and may be sold only to qualified institutional buyers. Unless otherwise indicated, these holdings are determined to be liquid. At December 31, 2016, the aggregate value of these securities was $92,846,944, which represents 1.8% of total net assets. |
The accompanying notes are an integral part of these financial statements.
|
| Hartford Capital Appreciation HLS Fund |
Schedule of Investments – (continued)
December 31, 2016
| | | | | | | | | | | | | | | | | | | | |
Foreign Currency Contracts Outstanding at December 31, 2016 | |
Currency | | Buy/Sell | | Delivery
Date | | | Counterparty | | Contract
Amount | | | Market
Value† | | | Unrealized
Appreciation/
(Depreciation) | |
EUR | | Sell | | | 03/15/17 | | | MSC | | $ | 27,603,559 | | | $ | 27,295,889 | | | $ | 307,670 | |
GBP | | Buy | | | 03/15/17 | | | BCLY | | | 4,461,173 | | | | 4,453,670 | | | | (7,503 | ) |
GBP | | Sell | | | 03/15/17 | | | BCLY | | | 4,593,486 | | | | 4,453,671 | | | | 139,815 | |
JPY | | Sell | | | 03/15/17 | | | CBK | | | 34,855,382 | | | | 34,240,468 | | | | 614,914 | |
JPY | | Sell | | | 03/15/17 | | | BCLY | | | 6,719,467 | | | | 6,783,789 | | | | (64,322 | ) |
| | | | | | | | | | | | | | | | | | | | |
Total | | | $ | 990,574 | |
| | | | | | | | | | | | | | | | | | | | |
| † | See Significant Accounting Policies of accompanying Notes to Financial Statements regarding valuation of investments. |
| | |
| GLOSSARY: (abbreviations used in preceding Schedule of Investments) |
|
| Counterparty Abbreviations: |
| BCLY | | Barclays |
| CBK | | Citibank NA |
| MSC | | Morgan Stanley |
|
| Currency Abbreviations: |
| EUR | | Euro |
| GBP | | British Pound |
| JPY | | Japanese Yen |
| | |
| Other Abbreviations: |
| ADR | | American Depositary Receipt |
| GDR | | Global Depositary Receipt |
| PIPE | | Private Investment in Public Equity |
| PJSC | | Private Joint Stock Company |
| REIT | | Real Estate Investment Trust |
The accompanying notes are an integral part of these financial statements.
|
| Hartford Capital Appreciation HLS Fund |
Schedule of Investments – (continued)
December 31, 2016
Fair Valuation Summary
The following is a summary of the fair valuations according to the inputs used as of December 31, 2016 in valuing the Fund’s investments.
| | | | | | | | | | | | | | | | |
| | | Total | | | Level 1(1) | | | Level 2(1) | | | Level 3(1) | |
Assets | | | | | | | | | | | | | | | | |
Common Stocks | | | | | | | | | | | | | | | | |
Automobiles & Components | | $ | 96,378,550 | | | $ | 96,378,550 | | | $ | — | | | $ | — | |
Banks | | | 453,250,446 | | | | 381,587,741 | | | | 71,662,705 | | | | — | |
Capital Goods | | | 175,311,966 | | | | 127,634,607 | | | | 42,986,331 | | | | 4,691,028 | |
Commercial & Professional Services | | | 62,632,079 | | | | 62,632,079 | | | | — | | | | — | |
Consumer Durables & Apparel | | | 161,947,144 | | | | 110,252,179 | | | | 51,694,965 | | | | — | |
Consumer Services | | | 93,197,850 | | | | 93,197,850 | | | | — | | | | — | |
Diversified Financials | | | 186,615,812 | | | | 169,220,317 | | | | 17,395,495 | | | | — | |
Energy | | | 262,875,941 | | | | 230,080,779 | | | | 31,905,453 | | | | 889,709 | |
Food & Staples Retailing | | | 66,022,476 | | | | 59,449,324 | | | | 6,573,152 | | | | — | |
Food, Beverage & Tobacco | | | 147,989,965 | | | | 132,067,758 | | | | 15,922,207 | | | | — | |
Health Care Equipment & Services | | | 278,422,333 | | | | 278,422,333 | | | | — | | | | — | |
Household & Personal Products | | | 72,412,544 | | | | 62,678,678 | | | | 9,733,866 | | | | — | |
Insurance | | | 336,954,665 | | | | 308,448,350 | | | | 28,506,315 | | | | — | |
Materials | | | 189,974,139 | | | | 131,598,376 | | | | 58,375,763 | | | | — | |
Media | | | 74,310,463 | | | | 52,064,331 | | | | 22,246,132 | | | | — | |
Pharmaceuticals, Biotechnology & Life Sciences | | | 435,869,919 | | | | 405,353,004 | | | | 30,516,915 | | | | — | |
Real Estate | | | 111,223,926 | | | | 102,881,406 | | | | 8,342,520 | | | | — | |
Retailing | | | 249,864,564 | | | | 227,220,875 | | | | — | | | | 22,643,689 | |
Semiconductors & Semiconductor Equipment | | | 118,041,336 | | | | 112,353,582 | | | | 5,687,754 | | | | — | |
Software & Services | | | 767,477,504 | | | | 731,820,100 | | | | 33,876,172 | | | | 1,781,232 | |
Technology Hardware & Equipment | | | 183,953,174 | | | | 133,252,335 | | | | 50,700,839 | | | | — | |
Telecommunication Services | | | 71,413,883 | | | | 58,394,198 | | | | 13,019,685 | | | | — | |
Transportation | | | 239,035,908 | | | | 239,035,908 | | | | — | | | | — | |
Utilities | | | 125,024,326 | | | | 104,103,324 | | | | 20,921,002 | | | | — | |
Preferred Stocks | | | 61,440,948 | | | | — | | | | — | | | | 61,440,948 | |
Convertible Preferred Stocks | | | 1,400,338 | | | | — | | | | — | | | | 1,400,338 | |
Short-Term Investments | | | 112,629,057 | | | | 112,629,057 | | | | — | | | | — | |
Foreign Currency Contracts(2) | | | 1,062,399 | | | | — | | | | 1,062,399 | | | | — | |
| | | | | | | | | | | | | | | | |
Total | | $ | 5,136,733,655 | | | $ | 4,522,757,041 | | | $ | 521,129,670 | | | $ | 92,846,944 | |
| | | | | | | | | | | | | | | | |
Liabilities | |
Foreign Currency Contracts(2) | | $ | (71,825 | ) | | $ | — | | | $ | (71,825 | ) | | $ | — | |
| | | | | | | | | | | | | | | | |
Total | | $ | (71,825 | ) | | $ | — | | | $ | (71,825 | ) | | $ | — | |
| | | | | | | | | | | | | | | | |
| (1) | For the year ended December 31, 2016, investments valued at $8,147,027 were transferred from Level 1 to Level 2 due to the application of a fair valuation factor, there were no transfers from Level 2 to Level 1 and investments valued at $6,886,563 were transferred from Level 3 to Level 1 due to the expiration of trading restrictions. |
| (2) | Derivative instruments (excluding purchased and written options, if applicable) are valued at the unrealized appreciation/depreciation on the investments. |
The following is a rollforward of the Fund’s investments that were valued using unobservable inputs (Level 3) for the year ended December 31, 2016:
| | | | | | | | | | | | | | | | |
| | | Common
Stocks | | | Preferred
Stocks | | | Convertible
Preferred
Stocks | | | Total | |
Beginning balance | | $ | 37,711,677 | | | $ | 63,535,697 | | | $ | 1,838,857 | | | $ | 103,086,231 | |
Purchases | | | 810,920 | | | | — | | | | — | | | | 810,920 | |
Sales | | | (199,950 | ) | | | (332,175 | ) | | | — | | | | (532,125 | ) |
Accrued discounts/(premiums) | | | — | | | | — | | | | — | | | | — | |
Total realized gain/(loss) | | | 8,530 | | | | (23,226 | ) | | | — | | | | (14,696 | ) |
Net change in unrealized appreciation/depreciation | | | (1,438,956 | ) | | | (1,739,348 | ) | | | (438,519 | ) | | | (3,616,823 | ) |
Transfers into Level 3 | | | — | | | | — | | | | — | | | | — | |
Transfers out of Level 3 | | | (6,886,563 | ) | | | — | | | | — | | | | (6,886,563 | ) |
| | | | | | | | | | | | | | | | |
Ending balance | | $ | 30,005,658 | | | $ | 61,440,948 | | | $ | 1,400,338 | | | $ | 92,846,944 | |
| | | | | | | | | | | | | | | | |
The change in net unrealized appreciation/depreciation relating to the Level 3 investments held at December 31, 2016 was $(3,616,965).
| Note: | For purposes of reporting transfers between different hierarchy levels, both transfers in and out of each level, as applicable, are shown as if they occurred at the beginning of the period. |
The accompanying notes are an integral part of these financial statements.
|
| Hartford Disciplined Equity HLS Fund |
Schedule of Investments
December 31, 2016
| | | | | | | | |
Shares or Principal Amount | | Market Value† | |
| COMMON STOCKS - 99.5% | | | |
| | | | Banks - 11.1% | |
| | 820,277 | | | Bank of America Corp. | | $ | 18,128,122 | |
| | 225,410 | | | Citigroup, Inc. | | | 13,396,116 | |
| | 257,355 | | | JP Morgan Chase & Co. | | | 22,207,163 | |
| | 28,568 | | | M&T Bank Corp. | | | 4,468,892 | |
| | 136,055 | | | PNC Financial Services Group, Inc. | | | 15,912,993 | |
| | | | | | | | |
| | | | | | | 74,113,286 | |
| | | | | | | | |
| | | | Capital Goods - 7.1% | |
| | 195,481 | | | AMETEK, Inc. | | | 9,500,377 | |
| | 96,779 | | | Fortune Brands Home & Security, Inc. | | | 5,173,805 | |
| | 26,218 | | | General Dynamics Corp. | | | 4,526,800 | |
| | 107,312 | | | Honeywell International, Inc. | | | 12,432,095 | |
| | 63,661 | | | Illinois Tool Works, Inc. | | | 7,795,926 | |
| | 45,909 | | | Snap-on, Inc. | | | 7,862,834 | |
| | | | | | | | |
| | | | | | | 47,291,837 | |
| | | | | | | | |
| | | | Commercial & Professional Services - 2.3% | |
| | 64,520 | | | Equifax, Inc. | | | 7,628,200 | |
| | 94,089 | | | Verisk Analytics, Inc. Class A* | | | 7,637,204 | |
| | | | | | | | |
| | | | | | | 15,265,404 | |
| | | | | | | | |
| | | | Consumer Durables & Apparel - 2.4% | |
| | 142,230 | | | NIKE, Inc. Class B | | | 7,229,551 | |
| | 171,623 | | | VF Corp. | | | 9,156,087 | |
| | | | | | | | |
| | | | | | | 16,385,638 | |
| | | | | | | | |
| | | | Consumer Services - 3.0% | |
| | 254,949 | | | Aramark | | | 9,106,778 | |
| | 201,549 | | | Starbucks Corp. | | | 11,190,001 | |
| | | | | | | | |
| | | | | | | 20,296,779 | |
| | | | | | | | |
| | | | Diversified Financials - 2.0% | |
| | 79,055 | | | Capital One Financial Corp. | | | 6,896,758 | |
| | 171,726 | | | Synchrony Financial | | | 6,228,502 | |
| | | | | | | | |
| | | | | | | 13,125,260 | |
| | | | | | | | |
| | | | Energy - 3.5% | |
| | 84,871 | | | Baker Hughes, Inc. | | | 5,514,069 | |
| | 56,191 | | | Concho Resources, Inc.* | | | 7,450,927 | |
| | 100,731 | | | EOG Resources, Inc. | | | 10,183,904 | |
| | | | | | | | |
| | | | | | | 23,148,900 | |
| | | | | | | | |
| | | | Food & Staples Retailing - 3.7% | |
| | 96,740 | | | Costco Wholesale Corp. | | | 15,489,041 | |
| | 268,425 | | | Kroger Co. | | | 9,263,347 | |
| | | | | | | | |
| | | | | | | 24,752,388 | |
| | | | | | | | |
| | | | Food, Beverage & Tobacco - 6.7% | |
| | 226,412 | | | Altria Group, Inc. | | | 15,309,980 | |
| | 86,671 | | | Molson Coors Brewing Co. Class B | | | 8,433,955 | |
| | 316,031 | | | Mondelez International, Inc. Class A | | | 14,009,654 | |
| | 152,253 | | | Monster Beverage Corp.* | | | 6,750,898 | |
| | | | | | | | |
| | | | | | | 44,504,487 | |
| | | | | | | | |
| | | | Health Care Equipment & Services - 5.5% | |
| | 132,240 | | | HCA Holdings, Inc.* | | | 9,788,405 | |
| | 110,754 | | | Hologic, Inc.* | | | 4,443,450 | |
| | 134,891 | | | Medtronic plc | | | 9,608,286 | |
| | 79,083 | | | UnitedHealth Group, Inc. | | | 12,656,443 | |
| | | | | | | | |
| | | | | | | 36,496,584 | |
| | | | | | | | |
| | | | Household & Personal Products - 3.4% | |
| | 184,330 | | | Colgate-Palmolive Co. | | | 12,062,555 | |
| | | | | | | | |
Shares or Principal Amount | | Market Value† | |
| COMMON STOCKS - 99.5% - (continued) | | | |
| | | | Household & Personal Products - 3.4% - (continued) | |
| | 137,243 | | | Estee Lauder Cos., Inc. Class A | | $ | 10,497,717 | |
| | | | | | | | |
| | | | | | | 22,560,272 | |
| | | | | | | | |
| | | | Insurance - 4.4% | |
| | 94,443 | | | Allstate Corp. | | | 7,000,115 | |
| | 108,866 | | | Chubb Ltd. | | | 14,383,376 | |
| | 219,251 | | | XL Group Ltd. | | | 8,169,292 | |
| | | | | | | | |
| | | | | | | 29,552,783 | |
| | | | | | | | |
| | | | Materials - 3.7% | |
| | 163,102 | | | Crown Holdings, Inc.* | | | 8,574,272 | |
| | 118,299 | | | Dow Chemical Co. | | | 6,769,069 | |
| | 82,209 | | | Ecolab, Inc. | | | 9,636,539 | |
| | | | | | | | |
| | | | | | | 24,979,880 | |
| | | | | | | | |
| | | | Media - 2.3% | |
| | 227,523 | | | Comcast Corp. Class A | | | 15,710,463 | |
| | | | | | | | |
| | | | Pharmaceuticals, Biotechnology & Life Sciences - 6.9% | |
| | 44,535 | | | Allergan plc* | | | 9,352,795 | |
| | 187,407 | | | Bristol-Myers Squibb Co. | | | 10,952,065 | |
| | 119,392 | | | Eli Lilly & Co. | | | 8,781,282 | |
| | 175,356 | | | Merck & Co., Inc. | | | 10,323,208 | |
| | 49,773 | | | Thermo Fisher Scientific, Inc. | | | 7,022,970 | |
| | | | | | | | |
| | | | | | | 46,432,320 | |
| | | | | | | | |
| | | | Retailing - 5.8% | |
| | 11,578 | | | AutoZone, Inc.* | | | 9,144,189 | |
| | 102,152 | | | Dollar Tree, Inc.* | | | 7,884,091 | |
| | 148,197 | | | Lowe’s Cos., Inc. | | | 10,539,771 | |
| | 145,495 | | | TJX Cos., Inc. | | | 10,931,039 | |
| | | | | | | | |
| | | | | | | 38,499,090 | |
| | | | | | | | |
| | | | Semiconductors & Semiconductor Equipment - 2.5% | |
| | 93,460 | | | Analog Devices, Inc. | | | 6,787,065 | |
| | 32,732 | | | Broadcom Ltd. | | | 5,786,036 | |
| | 61,940 | | | QUALCOMM, Inc. | | | 4,038,488 | |
| | | | | | | | |
| | | | | | | 16,611,589 | |
| | | | | | | | |
| | | | Software & Services - 11.9% | |
| | 42,627 | | | Accenture plc Class A | | | 4,992,900 | |
| | 20,642 | | | Alphabet, Inc. Class A* | | | 16,357,753 | |
| | 4,607 | | | Alphabet, Inc. Class C* | | | 3,555,775 | |
| | 107,597 | | | Automatic Data Processing, Inc. | | | 11,058,820 | |
| | 173,053 | | | eBay, Inc.* | | | 5,137,944 | |
| | 63,748 | | | Electronic Arts, Inc.* | | | 5,020,792 | |
| | 160,146 | | | GoDaddy, Inc. Class A* | | | 5,597,103 | |
| | 118,529 | | | Mastercard, Inc. Class A | | | 12,238,119 | |
| | 185,035 | | | Microsoft Corp. | | | 11,498,075 | |
| | 108,565 | | | PayPal Holdings, Inc.* | | | 4,285,060 | |
| | | | | | | | |
| | | | | | | 79,742,341 | |
| | | | | | | | |
| | | | Technology Hardware & Equipment - 5.0% | |
| | 182,723 | | | Apple, Inc. | | | 21,162,978 | |
| | 136,708 | | | Keysight Technologies, Inc.* | | | 4,999,411 | |
| | 28,829 | | | SYNNEX Corp. | | | 3,488,886 | |
| | 52,441 | | | Western Digital Corp. | | | 3,563,366 | |
| | | | | | | | |
| | | | | | | 33,214,641 | |
| | | | | | | | |
| | | | Transportation - 1.3% | |
| | 48,394 | | | FedEx Corp. | | | 9,010,963 | |
| | | | | | | | |
| | | | Utilities - 5.0% | | | |
| | 181,952 | | | American Electric Power Co., Inc. | | | 11,455,698 | |
| | 108,782 | | | NextEra Energy, Inc. | | | 12,995,098 | |
The accompanying notes are an integral part of these financial statements.
|
| Hartford Disciplined Equity HLS Fund |
Schedule of Investments – (continued)
December 31, 2016
| | | | | | | | |
Shares or Principal Amount | | Market Value† | |
| COMMON STOCKS - 99.5% - (continued) | | | |
| | | | Utilities - 5.0% - (continued) | | | |
| | 116,040 | | | Pinnacle West Capital Corp. | | $ | 9,054,601 | |
| | | | | | | | |
| | | | | | | 33,505,397 | |
| | | | | | | | |
| | |
| | | | Total Common Stocks
(cost $541,162,937) | | $ | 665,200,302 | |
| | | | | | | | |
| | |
| | | | Total Long-Term Investments
(cost $541,162,937) | | $ | 665,200,302 | |
| | | | | | | | |
|
| SHORT-TERM INVESTMENTS - 0.8% | |
| | | | Other Investment Pools & Funds - 0.8% | |
| | 4,864,319 | | | BlackRock Liquidity Funds TempFund Portfolio, Institutional Class | | $ | 4,864,319 | |
| | | | | | | | |
| | |
| | | | Total Short-Term Investments
(cost $4,864,319) | | $ | 4,864,319 | |
| | | | | | | | |
| | | | | | | | | | | | |
| | | |
| | | | Total Investments
(cost $546,027,256)^ | | | 100.3 | % | | $ | 670,064,621 | |
| | | | Other Assets and Liabilities | | | (0.3 | )% | | | (1,671,111 | ) |
| | | | | | | | | | | | |
| | | | Total Net Assets | | | 100.0 | % | | $ | 668,393,510 | |
| | | | | | | | | | | | |
The accompanying notes are an integral part of these financial statements.
|
| Hartford Disciplined Equity HLS Fund |
Schedule of Investments – (continued)
December 31, 2016
| Note: | Percentage of investments as shown is the ratio of the total market value to total net assets. |
| | Equity industry classifications used in this report are the Global Industry Classification Standard, which was developed by and is the exclusive property and service mark of MSCI, Inc. and Standard & Poor’s. |
| | For Fund compliance purposes, the Fund may not use the same classification system shown in this report as these classifications are used for financial reporting purposes. |
| ^ | At December 31, 2016, the cost of securities for federal income tax purposes was $546,651,192 and the aggregate gross unrealized appreciation and depreciation based on that cost were: |
| | | | |
Unrealized Appreciation | | $ | 130,820,477 | |
Unrealized Depreciation | | | (7,407,048 | ) |
| | | | |
Net Unrealized Appreciation | | $ | 123,413,429 | |
| | | | |
| † | See Significant Accounting Policies of accompanying Notes to Financial Statements regarding valuation of investments. |
The accompanying notes are an integral part of these financial statements.
|
| Hartford Disciplined Equity HLS Fund |
Schedule of Investments – (continued)
December 31, 2016
Fair Valuation Summary
The following is a summary of the fair valuations according to the inputs used as of December 31, 2016 in valuing the Fund’s investments.
| | | | | | | | | | | | | | | | |
| | | Total | | | Level 1(1) | | | Level 2(1) | | | Level 3(1) | |
| Assets | |
Common Stocks | |
Banks | | $ | 74,113,286 | | | $ | 74,113,286 | | | $ | — | | | $ | — | |
Capital Goods | | | 47,291,837 | | | | 47,291,837 | | | | — | | | | — | |
Commercial & Professional Services | | | 15,265,404 | | | | 15,265,404 | | | | — | | | | — | |
Consumer Durables & Apparel | | | 16,385,638 | | | | 16,385,638 | | | | — | | | | — | |
Consumer Services | | | 20,296,779 | | | | 20,296,779 | | | | — | | | | — | |
Diversified Financials | | | 13,125,260 | | | | 13,125,260 | | | | — | | | | — | |
Energy | | | 23,148,900 | | | | 23,148,900 | | | | — | | | | — | |
Food & Staples Retailing | | | 24,752,388 | | | | 24,752,388 | | | | — | | | | — | |
Food, Beverage & Tobacco | | | 44,504,487 | | | | 44,504,487 | | | | — | | | | — | |
Health Care Equipment & Services | | | 36,496,584 | | | | 36,496,584 | | | | — | | | | — | |
Household & Personal Products | | | 22,560,272 | | | | 22,560,272 | | | | — | | | | — | |
Insurance | | | 29,552,783 | | | | 29,552,783 | | | | — | | | | — | |
Materials | | | 24,979,880 | | | | 24,979,880 | | | | — | | | | — | |
Media | | | 15,710,463 | | | | 15,710,463 | | | | — | | | | — | |
Pharmaceuticals, Biotechnology & Life Sciences | | | 46,432,320 | | | | 46,432,320 | | | | — | | | | — | |
Retailing | | | 38,499,090 | | | | 38,499,090 | | | | — | | | | — | |
Semiconductors & Semiconductor Equipment | | | 16,611,589 | | | | 16,611,589 | | | | — | | | | — | |
Software & Services | | | 79,742,341 | | | | 79,742,341 | | | | — | | | | — | |
Technology Hardware & Equipment | | | 33,214,641 | | | | 33,214,641 | | | | — | | | | — | |
Transportation | | | 9,010,963 | | | | 9,010,963 | | | | — | | | | — | |
Utilities | | | 33,505,397 | | | | 33,505,397 | | | | — | | | | — | |
Short-Term Investments | | | 4,864,319 | | | | 4,864,319 | | | | — | | | | — | |
| | | | | | | | | | | | | | | | |
Total | | $ | 670,064,621 | | | $ | 670,064,621 | | | $ | — | | | $ | — | |
| | | | | | | | | | | | | | | | |
| (1) | For the year ended December 31, 2016, there were no transfers between any levels. |
The accompanying notes are an integral part of these financial statements.
|
| Hartford Dividend and Growth HLS Fund |
Schedule of Investments
December 31, 2016
| | | | | | | | |
Shares or Principal Amount | | Market Value† | |
| COMMON STOCKS - 97.5% | | | |
| | | | Automobiles & Components - 1.1% | | | |
| | 3,255,586 | | | Ford Motor Co. | | $ | 39,490,258 | |
| | | | | | | | |
| | | | Banks - 12.3% | | | |
| | 4,216,813 | | | Bank of America Corp. | | | 93,191,567 | |
| | 399,639 | | | Bank of Nova Scotia | | | 22,251,899 | |
| | 152,730 | | | Citigroup, Inc. | | | 9,076,744 | |
| | 1,290,000 | | | JP Morgan Chase & Co. | | | 111,314,100 | |
| | 608,284 | | | PNC Financial Services Group, Inc. | | | 71,144,897 | |
| | 256,689 | | | US Bancorp | | | 13,186,114 | |
| | 1,872,414 | | | Wells Fargo & Co. | | | 103,188,736 | |
| | | | | | | | |
| | | | | | | 423,354,057 | |
| | | | | | | | |
| | | | Capital Goods - 4.5% | | | |
| | 165,850 | | | Boeing Co. | | | 25,819,528 | |
| | 314,850 | | | Caterpillar, Inc. | | | 29,199,189 | |
| | 512,731 | | | Eaton Corp. plc | | | 34,399,123 | |
| | 307,678 | | | Honeywell International, Inc. | | | 35,644,496 | |
| | 115,076 | | | Lockheed Martin Corp. | | | 28,762,095 | |
| | | | | | | | |
| | | | | | | 153,824,431 | |
| | | | | | | | |
| | | | Commercial & Professional Services - 0.9% | | | |
| | 59,720 | | | Equifax, Inc. | | | 7,060,695 | |
| | 568,825 | | | Nielsen Holdings plc | | | 23,862,209 | |
| | | | | | | | |
| | | | | | | 30,922,904 | |
| | | | | | | | |
| | | | Consumer Services - 0.9% | | | |
| | 1,108,554 | | | Hilton Worldwide Holdings, Inc. | | | 30,152,669 | |
| | | | | | | | |
| | | | Diversified Financials - 4.5% | | | |
| | 89,262 | | | BlackRock, Inc. | | | 33,967,762 | |
| | 94,070 | | | Goldman Sachs Group, Inc. | | | 22,525,062 | |
| | 387,470 | | | Intercontinental Exchange, Inc. | | | 21,861,057 | |
| | 386,686 | | | Invesco Ltd. | | | 11,732,053 | |
| | 344,340 | | | Northern Trust Corp. | | | 30,663,477 | |
| | 920,631 | | | Synchrony Financial | | | 33,391,286 | |
| | | | | | | | |
| | | | | | | 154,140,697 | |
| | | | | | | | |
| | | | Energy - 10.1% | | | |
| | 364,745 | | | Anadarko Petroleum Corp. | | | 25,433,669 | |
| | 790,746 | | | Chevron Corp. | | | 93,070,804 | |
| | 129,889 | | | EOG Resources, Inc. | | | 13,131,778 | |
| | 650,493 | | | Exxon Mobil Corp. | | | 58,713,498 | |
| | 173,240 | | | Halliburton Co. | | | 9,370,552 | |
| | 875,890 | | | Hess Corp. | | | 54,559,188 | |
| | 155,825 | | | Marathon Petroleum Corp. | | | 7,845,789 | |
| | 367,603 | | | Royal Dutch Shell plc Class B | | | 10,561,932 | |
| | 1,101,610 | | | Suncor Energy, Inc. | | | 36,011,631 | |
| | 816,023 | | | Total S.A. ADR | | | 41,592,692 | |
| | | | | | | | |
| | | | | | | 350,291,533 | |
| | | | | | | | |
| | | | Food & Staples Retailing - 2.3% | | | |
| | 156,100 | | | Costco Wholesale Corp. | | | 24,993,171 | |
| | 372,701 | | | CVS Health Corp. | | | 29,409,836 | |
| | 287,386 | | | Walgreens Boots Alliance, Inc. | | | 23,784,065 | |
| | | | | | | | |
| | | | | | | 78,187,072 | |
| | | | | | | | |
| | | | Food, Beverage & Tobacco - 3.7% | | | |
| | 467,750 | | | Coca-Cola Co. | | | 19,392,915 | |
| | 837,219 | | | Mondelez International, Inc. Class A | | | 37,113,918 | |
| | 345,340 | | | PepsiCo, Inc. | | | 36,132,924 | |
| | 373,642 | | | Philip Morris International, Inc. | | | 34,184,507 | |
| | | | | | | | |
| | | | | | | 126,824,264 | |
| | | | | | | | |
| | | | | | | | |
Shares or Principal Amount | | Market Value† | |
| COMMON STOCKS - 97.5% - (continued) | | | |
| | | | Health Care Equipment & Services - 3.9% | | | |
| | 480,939 | | | Cardinal Health, Inc. | | $ | 34,613,180 | |
| | 90,690 | | | McKesson Corp. | | | 12,737,410 | |
| | 693,059 | | | Medtronic plc | | | 49,366,593 | |
| | 244,377 | | | UnitedHealth Group, Inc. | | | 39,110,095 | |
| | | | | | | | |
| | | | | | | 135,827,278 | |
| | | | | | | | |
| | | | Household & Personal Products - 0.3% | | | |
| | 182,190 | | | Colgate-Palmolive Co. | | | 11,922,514 | |
| | | | | | | | |
| | | | Insurance - 7.9% | | | |
| | 619,973 | | | Chubb Ltd. | | | 81,910,833 | |
| | 604,325 | | | Marsh & McLennan Cos., Inc. | | | 40,846,327 | |
| | 521,381 | | | MetLife, Inc. | | | 28,097,222 | |
| | 840,780 | | | Principal Financial Group, Inc. | | | 48,647,531 | |
| | 696,656 | | | Prudential Financial, Inc. | | | 72,494,023 | |
| | | | | | | | |
| | | | | | | 271,995,936 | |
| | | | | | | | |
| | | | Materials - 3.6% | | | |
| | 141,610 | | | Ball Corp. | | | 10,630,663 | |
| | 371,540 | | | BHP Billiton plc ADR | | | 11,688,648 | |
| | 447,360 | | | Celanese Corp. Series A | | | 35,225,127 | |
| | 542,610 | | | Dow Chemical Co. | | | 31,048,144 | |
| | 654,169 | | | International Paper Co. | | | 34,710,207 | |
| | | | | | | | |
| | | | | | | 123,302,789 | |
| | | | | | | | |
| | | | Media - 3.2% | | | |
| | 1,249,973 | | | Comcast Corp. Class A | | | 86,310,636 | |
| | 848,782 | | | Twenty-First Century Fox, Inc. Class A | | | 23,799,847 | |
| | | | | | | | |
| | | | | | | 110,110,483 | |
| | | | | | | | |
| | | | Pharmaceuticals, Biotechnology & Life Sciences - 9.9% | |
| | 1,823,726 | | | AstraZeneca plc ADR | | | 49,824,194 | |
| | 1,172,456 | | | Bristol-Myers Squibb Co. | | | 68,518,329 | |
| | 491,495 | | | Eli Lilly & Co. | | | 36,149,457 | |
| | 488,495 | | | Johnson & Johnson | | | 56,279,509 | |
| | 1,546,023 | | | Merck & Co., Inc. | | | 91,014,374 | |
| | 1,222,959 | | | Pfizer, Inc. | | | 39,721,708 | |
| | | | | | | | |
| | | | | | | 341,507,571 | |
| | | | | | | | |
| | | | Real Estate - 0.5% | | | |
| | 157,450 | | | American Tower Corp. REIT | | | 16,639,316 | |
| | | | | | | | |
| | | | Retailing - 1.9% | | | |
| | 180,650 | | | Expedia, Inc. | | | 20,464,032 | |
| | 229,550 | | | L Brands, Inc. | | | 15,113,572 | |
| | 408,311 | | | Lowe’s Cos., Inc. | | | 29,039,078 | |
| | | | | | | | |
| | | | | | | 64,616,682 | |
| | | | | | | | |
| | | | Semiconductors & Semiconductor Equipment - 3.0% | |
| | 2,412,761 | | | Intel Corp. | | | 87,510,841 | |
| | 240,404 | | | Texas Instruments, Inc. | | | 17,542,280 | |
| | | | | | | | |
| | | | | | | 105,053,121 | |
| | | | | | | | |
| | | | Software & Services - 6.9% | | | |
| | 298,144 | | | Accenture plc Class A | | | 34,921,607 | |
| | 104,900 | | | Alphabet, Inc. Class A* | | | 83,128,005 | |
| | 241,190 | | | eBay, Inc.* | | | 7,160,931 | |
| | 1,828,735 | | | Microsoft Corp. | | | 113,637,593 | |
| | | | | | | | |
| | | | | | | 238,848,136 | |
| | | | | | | | |
| | | | Technology Hardware & Equipment - 4.1% | |
| | 577,065 | | | Apple, Inc. | | | 66,835,668 | |
| | 121,260 | | | Avnet, Inc. | | | 5,773,189 | |
| | 1,240,705 | | | Cisco Systems, Inc. | | | 37,494,105 | |
The accompanying notes are an integral part of these financial statements.
|
| Hartford Dividend and Growth HLS Fund |
Schedule of Investments – (continued)
December 31, 2016
| | | | | | | | |
Shares or Principal Amount | | Market Value† | |
| COMMON STOCKS - 97.5% - (continued) | | | |
| | | | Technology Hardware & Equipment - 4.1% - (continued) | |
| | 382,410 | | | Motorola Solutions, Inc. | | $ | 31,697,965 | |
| | | | | | | | |
| | | | | | | 141,800,927 | |
| | | | | | | | |
| | | | Telecommunication Services - 2.2% | | | |
| | 1,430,149 | | | Verizon Communications, Inc. | | | 76,341,354 | |
| | | | | | | | |
| | | | Transportation - 5.1% | | | |
| | 193,851 | | | Canadian National Railway Co. | | | 13,065,557 | |
| | 1,290,705 | | | CSX Corp. | | | 46,375,031 | |
| | 609,097 | | | Delta Air Lines, Inc. | | | 29,961,482 | |
| | 142,037 | | | FedEx Corp. | | | 26,447,289 | |
| | 537,038 | | | United Parcel Service, Inc. Class B | | | 61,566,036 | |
| | | | | | | | |
| | | | | | | 177,415,395 | |
| | | | | | | | |
| | | | Utilities - 4.7% | | | |
| | 561,856 | | | Dominion Resources, Inc. | | | 43,032,551 | |
| | 521,246 | | | Edison International | | | 37,524,499 | |
| | 845,612 | | | Exelon Corp. | | | 30,010,770 | |
| | 431,658 | | | NextEra Energy, Inc. | | | 51,565,865 | |
| | | | | | | | |
| | | | | | | 162,133,685 | |
| | | | | | | | |
| | |
| | | | Total Common Stocks
(cost $2,367,713,361) | | $ | 3,364,703,072 | |
| | | | | | | | |
| | |
| | | | Total Long-Term Investments
(cost $2,367,713,361) | | $ | 3,364,703,072 | |
| | | | | | | | |
|
| SHORT-TERM INVESTMENTS - 2.3% | |
| | | | Other Investment Pools & Funds - 2.3% | |
| | 79,679,432 | | | Fidelity Institutional Government Fund, Institutional Class | | $ | 79,679,432 | |
| | | | | | | | |
| | |
| | | | Total Short-Term Investments
(cost $79,679,432) | | $ | 79,679,432 | |
| | | | | | | | |
| | | | | | | | | | | | |
| | | |
| | | | Total Investments
(cost $2,447,392,793)^ | | | 99.8 | % | | $ | 3,444,382,504 | |
| | | | Other Assets and Liabilities | | | 0.2 | % | | | 7,605,749 | |
| | | | | | | | | | | | |
| | | | Total Net Assets | | | 100.0 | % | | $ | 3,451,988,253 | |
| | | | | | | | | | | | |
The accompanying notes are an integral part of these financial statements.
|
| Hartford Dividend and Growth HLS Fund |
Schedule of Investments – (continued)
December 31, 2016
| Note: | Percentage of investments as shown is the ratio of the total market value to total net assets. |
| | Equity industry classifications used in this report are the Global Industry Classification Standard, which was developed by and is the exclusive property and service mark of MSCI, Inc. and Standard & Poor’s. |
| | For Fund compliance purposes, the Fund may not use the same classification system shown in this report as these classifications are used for financial reporting purposes. |
| ^ | At December 31, 2016, the cost of securities for federal income tax purposes was $2,446,646,781 and the aggregate gross unrealized appreciation and depreciation based on that cost were: |
| | | | |
Unrealized Appreciation | | $ | 1,015,561,454 | |
Unrealized Depreciation | | | (17,825,731 | ) |
| | | | |
Net Unrealized Appreciation | | $ | 997,735,723 | |
| | | | |
| † | See Significant Accounting Policies of accompanying Notes to Financial Statements regarding valuation of investments. |
| | |
| GLOSSARY: (abbreviations used in preceding Schedule of Investments) |
|
| Other Abbreviations: |
| ADR | | American Depositary Receipt |
| REIT | | Real Estate Investment Trust |
The accompanying notes are an integral part of these financial statements.
|
| Hartford Dividend and Growth HLS Fund |
Schedule of Investments – (continued)
December 31, 2016
Fair Valuation Summary
The following is a summary of the fair valuations according to the inputs used as of December 31, 2016 in valuing the Fund’s investments.
| | | | | | | | | | | | | | | | |
| | | Total | | | Level 1(1) | | | Level 2(1) | | | Level 3(1) | |
Assets | |
Common Stocks | | | | | | | | | | | | | | | | |
Automobiles & Components | | $ | 39,490,258 | | | $ | 39,490,258 | | | $ | — | | | $ | — | |
Banks | | | 423,354,057 | | | | 423,354,057 | | | | — | | | | — | |
Capital Goods | | | 153,824,431 | | | | 153,824,431 | | | | — | | | | — | |
Commercial & Professional Services | | | 30,922,904 | | | | 30,922,904 | | | | — | | | | — | |
Consumer Services | | | 30,152,669 | | | | 30,152,669 | | | | — | | | | — | |
Diversified Financials | | | 154,140,697 | | | | 154,140,697 | | | | — | | | | — | |
Energy | | | 350,291,533 | | | | 339,729,601 | | | | 10,561,932 | | | | — | |
Food & Staples Retailing | | | 78,187,072 | | | | 78,187,072 | | | | — | | | | — | |
Food, Beverage & Tobacco | | | 126,824,264 | | | | 126,824,264 | | | | — | | | | — | |
Health Care Equipment & Services | | | 135,827,278 | | | | 135,827,278 | | | | — | | | | — | |
Household & Personal Products | | | 11,922,514 | | | | 11,922,514 | | | | — | | | | — | |
Insurance | | | 271,995,936 | | | | 271,995,936 | | | | — | | | | — | |
Materials | | | 123,302,789 | | | | 123,302,789 | | | | — | | | | — | |
Media | | | 110,110,483 | | | | 110,110,483 | | | | — | | | | — | |
Pharmaceuticals, Biotechnology & Life Sciences | | | 341,507,571 | | | | 341,507,571 | | | | — | | | | — | |
Real Estate | | | 16,639,316 | | | | 16,639,316 | | | | — | | | | — | |
Retailing | | | 64,616,682 | | | | 64,616,682 | | | | — | | | | — | |
Semiconductors & Semiconductor Equipment | | | 105,053,121 | | | | 105,053,121 | | | | — | | | | — | |
Software & Services | | | 238,848,136 | | | | 238,848,136 | | | | — | | | | — | |
Technology Hardware & Equipment | | | 141,800,927 | | | | 141,800,927 | | | | — | | | | — | |
Telecommunication Services | | | 76,341,354 | | | | 76,341,354 | | | | — | | | | — | |
Transportation | | | 177,415,395 | | | | 177,415,395 | | | | — | | | | — | |
Utilities | | | 162,133,685 | | | | 162,133,685 | | | | — | | | | — | |
Short-Term Investments | | | 79,679,432 | | | | 79,679,432 | | | | — | | | | — | |
| | | | | | | | | | | | | | | | |
Total | | $ | 3,444,382,504 | | | $ | 3,433,820,572 | | | $ | 10,561,932 | | | $ | — | |
| | | | | | | | | | | | | | | | |
| (1) | For the year ended December 31, 2016, there were no transfers between any levels. |
The accompanying notes are an integral part of these financial statements.
|
| Hartford Global Growth HLS Fund |
Schedule of Investments
December 31, 2016
| | | | | | | | |
Shares or Principal Amount | | Market Value† | |
| COMMON STOCKS - 99.0% | |
| | | | Banks - 5.3% | |
| | 1,957,000 | | | Bank Central Asia Tbk PT | | $ | 2,245,303 | |
| | 302,628 | | | Bank of America Corp. | | | 6,688,079 | |
| | 56,446 | | | BNP Paribas S.A. | | | 3,592,106 | |
| | 38,870 | | | HDFC Bank Ltd. ADR | | | 2,358,631 | |
| | 289,587 | | | ICICI Bank Ltd. ADR | | | 2,169,007 | |
| | 249,880 | | | Itau Unibanco Holding S.A. ADR | | | 2,568,766 | |
| | 21,962 | | | PNC Financial Services Group, Inc. | | | 2,568,675 | |
| | | | | | | | |
| | | | | | | 22,190,567 | |
| | | | | | | | |
| | | | Capital Goods - 4.7% | |
| | 141,582 | | | Assa Abloy AB Class B | | | 2,619,781 | |
| | 77,777 | | | Atlas Copco AB Class A | | | 2,359,486 | |
| | 47,544 | | | Fortune Brands Home & Security, Inc. | | | 2,541,702 | |
| | 94,200 | | | Komatsu Ltd. | | | 2,133,643 | |
| | 12,652 | | | Lockheed Martin Corp. | | | 3,162,241 | |
| | 30,600 | | | Nidec Corp. | | | 2,634,374 | |
| | 35,890 | | | Pentair plc | | | 2,012,352 | |
| | 10,122 | | | SMC Corp. | | | 2,408,271 | |
| | | | | | | | |
| | | | | | | 19,871,850 | |
| | | | | | | | |
| | | | Commercial & Professional Services - 3.4% | |
| | 130,714 | | | Edenred | | | 2,588,205 | |
| | 23,183 | | | Equifax, Inc. | | | 2,740,926 | |
| | 162,284 | | | Experian plc | | | 3,142,081 | |
| | 78,505 | | | IHS Markit Ltd.* | | | 2,779,862 | |
| | 71,300 | | | Recruit Holdings Co., Ltd. | | | 2,857,446 | |
| | | | | | | | |
| | | | | | | 14,108,520 | |
| | | | | | | | |
| | | | Consumer Durables & Apparel - 2.0% | |
| | 25,520 | | | Pandora A/S | | | 3,331,380 | |
| | 101,600 | | | Sony Corp. | | | 2,838,899 | |
| | 48,489 | | | Under Armour, Inc. Class A* | | | 1,408,606 | |
| | 26,361 | | | Under Armour, Inc. Class C* | | | 663,506 | |
| | | | | | | | |
| | | | | | | 8,242,391 | |
| | | | | | | | |
| | | | Consumer Services - 3.4% | |
| | 198,369 | | | Compass Group plc | | | 3,666,165 | |
| | 102,188 | | | MGM Resorts International* | | | 2,946,080 | |
| | 58,096 | | | New Oriental Education & Technology Group, Inc. ADR* | | | 2,445,841 | |
| | 667,262 | | | Sands China Ltd. | | | 2,878,684 | |
| | 45,090 | | | Starbucks Corp. | | | 2,503,397 | |
| | | | | | | | |
| | | | | | | 14,440,167 | |
| | | | | | | | |
| | | | Diversified Financials - 6.5% | |
| | 6,212 | | | BlackRock, Inc. | | | 2,363,915 | |
| | 30,488 | | | Capital One Financial Corp. | | | 2,659,773 | |
| | 38,438 | | | Discover Financial Services | | | 2,770,995 | |
| | 46,301 | | | Intercontinental Exchange, Inc. | | | 2,612,302 | |
| | 110,590 | | | Julius Baer Group Ltd.* | | | 4,899,328 | |
| | 30,123 | | | MSCI, Inc. | | | 2,373,090 | |
| | 26,100 | | | Northern Trust Corp. | | | 2,324,205 | |
| | 5,246 | | | Partners Group Holding AG | | | 2,455,850 | |
| | 22,179 | | | S&P Global, Inc. | | | 2,385,130 | |
| | 64,875 | | | Synchrony Financial | | | 2,353,016 | |
| | | | | | | | |
| | | | | | | 27,197,604 | |
| | | | | | | | |
| | | | Energy - 2.5% | |
| | 57,624 | | | Baker Hughes, Inc. | | | 3,743,831 | |
| | 210,522 | | | Galp Energia SGPS S.A. | | | 3,138,512 | |
| | 20,542 | | | Pioneer Natural Resources Co. | | | 3,698,998 | |
| | | | | | | | |
| | | | | | | 10,581,341 | |
| | | | | | | | |
| | | | | | | | |
Shares or Principal Amount | | Market Value† | |
| COMMON STOCKS - 99.0% - (continued) | |
| | | | Food & Staples Retailing - 0.8% | |
| | 21,481 | | | Costco Wholesale Corp. | | $ | 3,439,323 | |
| | | | | | | | |
| | | | Food, Beverage & Tobacco - 5.0% | |
| | 20,175 | | | Anheuser-Busch InBev N.V. | | | 2,135,403 | |
| | 121,425 | | | British American Tobacco plc | | | 6,881,806 | |
| | 283,039 | | | Davide Campari-Milano S.p.A. | | | 2,767,873 | |
| | 59,075 | | | Mondelez International, Inc. Class A | | | 2,618,795 | |
| | 64,848 | | | Monster Beverage Corp.* | | | 2,875,360 | |
| | 34,383 | | | PepsiCo, Inc. | | | 3,597,493 | |
| | | | | | | | |
| | | | | | | 20,876,730 | |
| | | | | | | | |
| | | | Health Care Equipment & Services - 5.7% | |
| | 26,635 | | | Align Technology, Inc.* | | | 2,560,422 | |
| | 252,228 | | | Boston Scientific Corp.* | | | 5,455,692 | |
| | 31,558 | | | Edwards Lifesciences Corp.* | | | 2,956,985 | |
| | 36,088 | | | HCA Holdings, Inc.* | | | 2,671,234 | |
| | 34,952 | | | Medtronic plc | | | 2,489,631 | |
| | 23,746 | | | Stryker Corp. | | | 2,845,008 | |
| | 31,349 | | | UnitedHealth Group, Inc. | | | 5,017,094 | |
| | | | | | | | |
| | | | | | | 23,996,066 | |
| | | | | | | | |
| | | | Household & Personal Products - 2.1% | |
| | 27,001 | | | Estee Lauder Cos., Inc. Class A | | | 2,065,307 | |
| | 78,960 | | | Reckitt Benckiser Group plc | | | 6,688,537 | |
| | | | | | | | |
| | | | | | | 8,753,844 | |
| | | | | | | | |
| | | | Insurance - 3.1% | |
| | 97,885 | | | Admiral Group plc | | | 2,201,342 | |
| | 582,800 | | | AIA Group Ltd. | | | 3,264,752 | |
| | 35,222 | | | Allstate Corp. | | | 2,610,655 | |
| | 58,051 | | | Assured Guaranty Ltd. | | | 2,192,586 | |
| | 151,900 | | | Manulife Financial Corp. | | | 2,705,045 | |
| | | | | | | | |
| | | | | | | 12,974,380 | |
| | | | | | | | |
| | | | Materials - 2.6% | |
| | 210,088 | | | Amcor Ltd. | | | 2,261,139 | |
| | 227,077 | | | BHP Billiton plc | | | 3,615,750 | |
| | 30,263 | | | HeidelbergCement AG | | | 2,816,879 | |
| | 136,701 | | | James Hardie Industries plc | | | 2,157,884 | |
| | | | | | | | |
| | | | | | | 10,851,652 | |
| | | | | | | | |
| | | | Media - 1.2% | |
| | 39,074 | | | Comcast Corp. Class A | | | 2,698,060 | |
| | 84,530 | | | Twenty-First Century Fox, Inc. Class A | | | 2,370,221 | |
| | | | | | | | |
| | | | | | | 5,068,281 | |
| | | | | | | | |
| | | | Pharmaceuticals, Biotechnology & Life Sciences - 6.2% | |
| | 10,885 | | | Allergan plc* | | | 2,285,959 | |
| | 71,268 | | | Bristol-Myers Squibb Co. | | | 4,164,902 | |
| | 19,327 | | | Celgene Corp.* | | | 2,237,100 | |
| | 49,000 | | | Eisai Co., Ltd. | | | 2,808,060 | |
| | 36,794 | | | ICON plc* | | | 2,766,909 | |
| | 20,792 | | | Incyte Corp.* | | | 2,084,814 | |
| | 6,223 | | | Regeneron Pharmaceuticals, Inc.* | | | 2,284,401 | |
| | 11,571 | | | Roche Holding AG | | | 2,637,639 | |
| | 20,457 | | | Thermo Fisher Scientific, Inc. | | | 2,886,483 | |
| | 31,632 | | | UCB S.A. | | | 2,023,845 | |
| | | | | | | | |
| | | | | | | 26,180,112 | |
| | | | | | | | |
| | | | Real Estate - 2.0% | |
| | 57,407 | | | American Tower Corp. REIT | | | 6,066,772 | |
| | 16,900 | | | Daito Trust Construction Co., Ltd. | | | 2,540,707 | |
| | | | | | | | |
| | | | | | | 8,607,479 | |
| | | | | | | | |
The accompanying notes are an integral part of these financial statements.
|
| Hartford Global Growth HLS Fund |
Schedule of Investments – (continued)
December 31, 2016
| | | | | | | | |
Shares or Principal Amount | | Market Value† | |
| COMMON STOCKS - 99.0% - (continued) | |
| | | | Retailing - 9.8% | |
| | 15,939 | | | Amazon.com, Inc.* | | $ | 11,952,178 | |
| | 3,865 | | | AutoZone, Inc.* | | | 3,052,538 | |
| | 36,321 | | | Home Depot, Inc. | | | 4,869,920 | |
| | 68,206 | | | Industria de Diseno Textil S.A. | | | 2,323,504 | |
| | 35,762 | | | Lowe’s Cos., Inc. | | | 2,543,393 | |
| | 31,395 | | | Netflix, Inc.* | | | 3,886,701 | |
| | 3,953 | | | Priceline Group, Inc.* | | | 5,795,335 | |
| | 49,775 | | | Ross Stores, Inc. | | | 3,265,240 | |
| | 87,320 | | | Zalando SE*(1) | | | 3,326,387 | |
| | | | | | | | |
| | | | | | | 41,015,196 | |
| | | | | | | | |
| | | | Semiconductors & Semiconductor Equipment - 3.0% | |
| | 35,708 | | | Analog Devices, Inc. | | | 2,593,115 | |
| | 155,584 | | | Infineon Technologies AG | | | 2,691,210 | |
| | 21,562 | | | NXP Semiconductors N.V.* | | | 2,113,291 | |
| | 36,500 | | | QUALCOMM, Inc. | | | 2,379,800 | |
| | 509,000 | | | Taiwan Semiconductor Manufacturing Co., Ltd. | | | 2,851,038 | |
| | | | | | | | |
| | | | | | | 12,628,454 | |
| | | | | | | | |
| | | | Software & Services - 25.3% | | | |
| | 32,444 | | | Accenture plc Class A | | | 3,800,166 | |
| | 67,215 | | | Adobe Systems, Inc.* | | | 6,919,784 | |
| | 31,387 | | | Alibaba Group Holding Ltd. ADR* | | | 2,756,092 | |
| | 22,317 | | | Alphabet, Inc. Class C* | | | 17,224,707 | |
| | 38,066 | | | Automatic Data Processing, Inc. | | | 3,912,424 | |
| | 3,575 | | | Dropbox, Inc. Class B*(1)(2)(3) | | | 34,427 | |
| | 37,889 | | | Electronic Arts, Inc.* | | | 2,984,138 | |
| | 96,932 | | | Facebook, Inc. Class A* | | | 11,152,027 | |
| | 34,715 | | | Gartner, Inc. Class A* | | | 3,508,645 | |
| | 38,365 | | | Global Payments, Inc. | | | 2,662,915 | |
| | 22,520 | | | Intuit, Inc. | | | 2,581,017 | |
| | 323,579 | | | Just Eat plc* | | | 2,325,086 | |
| | 74,848 | | | Mastercard, Inc. Class A | | | 7,728,056 | |
| | 42,651 | | | Microsoft Corp. | | | 2,650,333 | |
| | 82,797 | | | Mobileye N.V.* | | | 3,156,222 | |
| | 3,037 | | | NAVER Corp. | | | 1,944,826 | |
| | 10,212 | | | NetEase, Inc. ADR | | | 2,199,052 | |
| | 13,300 | | | Nintendo Co., Ltd. | | | 2,764,743 | |
| | 69,686 | | | PayPal Holdings, Inc.* | | | 2,750,506 | |
| | 45,402 | | | Salesforce.com, Inc.* | | | 3,108,221 | |
| | 43,484 | | | ServiceNow, Inc.* | | | 3,232,601 | |
| | 241,300 | | | Tencent Holdings Ltd. | | | 5,850,827 | |
| | 42,412 | | | Vantiv, Inc. Class A* | | | 2,528,603 | |
| | 50,640 | | | Visa, Inc. Class A | | | 3,950,933 | |
| | 119,410 | | | Yandex N.V. Class A* | | | 2,403,723 | |
| | 57,735 | | | Zillow Group, Inc. Class C* | | | 2,105,595 | |
| | | �� | | | | | |
| | | | | | | 106,235,669 | |
| | | | | | | | |
| | | | Technology Hardware & Equipment - 2.7% | |
| | 119,800 | | | Alps Electric Co., Ltd. | | | 2,878,549 | |
| | 70,366 | | | Cisco Systems, Inc. | | | 2,126,461 | |
| | 24,000 | | | Largan Precision Co., Ltd. | | | 2,797,472 | |
| | 2,424 | | | Samsung Electronics Co., Ltd. | | | 3,607,668 | |
| | | | | | | | |
| | | | | | | 11,410,150 | |
| | | | | | | | |
| | | | Telecommunication Services - 1.3% | | | |
| | 54,269 | | | T-Mobile US, Inc.* | | | 3,121,010 | |
| | 7,251,810 | | | Telekomunikasi Indonesia Persero Tbk PT | | | 2,133,425 | |
| | | | | | | | |
| | | | | | | 5,254,435 | |
| | | | | | | | |
| | | | | | | | |
Shares or Principal Amount | | Market Value† | |
| COMMON STOCKS - 99.0% - (continued) | |
| | | | Transportation - 0.4% | | | |
| | 39,193 | | | DSV A/S | | $ | 1,740,571 | |
| | | | | | | | |
| | |
| | | | Total Common Stocks
(cost $362,196,616) | | $ | 415,664,782 | |
| | | | | | | | |
|
| WARRANTS - 0.0% | |
| | | | Diversified Financials - 0.0% | | | |
| | 1,035 | | | Emergent Capital, Inc. Expires 4/11/19*(3) | | $ | — | |
| | | | | | | | |
| | |
| | | | Total Warrants
(cost $—) | | $ | — | |
| | | | | | | | |
| | |
| | | | Total Long-Term Investments
(cost $362,196,616) | | $ | 415,664,782 | |
| | | | | | | | |
|
| SHORT-TERM INVESTMENTS - 1.3% | |
| | | | Other Investment Pools & Funds - 1.3% | | | |
| | 5,543,109 | | | Fidelity Institutional Government Fund, Institutional Class | | $ | 5,543,109 | |
| | | | | | | | |
| | |
| | | | Total Short-Term Investments
(cost $5,543,109) | | $ | 5,543,109 | |
| | | | | | | | |
| | | | | | | | | | | | |
| | | |
| | | | Total Investments
(cost $367,739,725)^ | | | 100.3 | % | | $ | 421,207,891 | |
| | | | Other Assets and Liabilities | | | (0.3 | )% | | | (1,301,785 | ) |
| | | | | | | | | | | | |
| | | | Total Net Assets | | | 100.0 | % | | $ | 419,906,106 | |
| | | | | | | | | | | | |
The accompanying notes are an integral part of these financial statements.
|
| Hartford Global Growth HLS Fund |
Schedule of Investments – (continued)
December 31, 2016
| Note: | Percentage of investments as shown is the ratio of the total market value to total net assets. |
| | Prices of foreign equities that are principally traded on certain foreign markets will generally be adjusted daily pursuant to a fair value pricing service approved by the Board of Directors in order to reflect an adjustment for factors occurring after the close of certain foreign markets but before the close of the New York Stock Exchange. |
| | Equity industry classifications used in this report are the Global Industry Classification Standard, which was developed by and is the exclusive property and service mark of MSCI, Inc. and Standard & Poor’s. |
| | For Fund compliance purposes, the Fund may not use the same classification system shown in this report as these classifications are used for financial reporting purposes. |
| ^ | At December 31, 2016, the cost of securities for federal income tax purposes was $368,281,674 and the aggregate gross unrealized appreciation and depreciation based on that cost were: |
| | | | |
Unrealized Appreciation | | $ | 59,568,158 | |
Unrealized Depreciation | | | (6,641,941 | ) |
| | | | |
Net Unrealized Appreciation | | $ | 52,926,217 | |
| | | | |
| (1) | Securities issued within terms of a private placement memorandum and exempt from registration under Rule 144A under the Securities Act of 1933, as amended, and may be sold only to qualified institutional buyers. Unless otherwise indicated, these holdings are determined to be liquid. At December 31, 2016, the aggregate value of these securities was $3,360,814, which represents 0.8% of total net assets. |
| (2) | This security is valued in good faith at fair value as determined under policies and procedures established by and under the supervision of the Board of Directors. At December 31, 2016, the aggregate fair value of this security was $34,427, which represents 0.0% of total net assets. This amount excludes securities that are principally traded in certain foreign markets and whose prices are adjusted pursuant to a third party pricing service methodology approved by the Board of Directors. |
| (3) | The following security is considered illiquid. Illiquid securities are often purchased in private placement transactions, are often not registered under the Securities Act of 1933, as amended, and may have contractual restrictions on resale. A security may also be considered illiquid if the security lacks a readily available market or if its valuation has not changed for a certain period of time. |
| | | | | | | | | | | | |
Period
Acquired | | | Shares/Par | | | Security | | Cost | |
| | 05/2012 | | | | 3,575 | | | Dropbox, Inc. Class B | | $ | 32,360 | |
| | 04/2014 | | | | 1,035 | | | Emergent Capital, Inc. Warrants | | | — | |
| | | | | | | | | | | | |
| | | | | | | | | | $ | 32,360 | |
| | | | | | | | | | | | |
| | At December 31, 2016, the aggregate value of these securities was $34,427, which represents 0.0% of total net assets. |
| † | See Significant Accounting Policies of accompanying Notes to Financial Statements regarding valuation of investments. |
| | |
| GLOSSARY: (abbreviations used in preceding Schedule of Investments) |
|
| Other Abbreviations: |
ADR | | American Depositary Receipt |
| MSCI | | Morgan Stanley Capital International |
| REIT | | Real Estate Investment Trust |
The accompanying notes are an integral part of these financial statements.
|
| Hartford Global Growth HLS Fund |
Schedule of Investments – (continued)
December 31, 2016
Fair Valuation Summary
The following is a summary of the fair valuations according to the inputs used as of December 31, 2016 in valuing the Fund’s investments.
| | | | | | | | | | | | | | | | |
| | | Total | | | Level 1(1) | | | Level 2(1) | | | Level 3(1) | |
Assets | | | | | | | | | | | | | | | | |
Common Stocks | | | | | | | | | | | | | | | | |
Banks | | $ | 22,190,567 | | | $ | 16,353,158 | | | $ | 5,837,409 | | | $ | — | |
Capital Goods | | | 19,871,850 | | | | 7,716,295 | | | | 12,155,555 | | | | — | |
Commercial & Professional Services | | | 14,108,520 | | | | 5,520,788 | | | | 8,587,732 | | | | — | |
Consumer Durables & Apparel | | | 8,242,391 | | | | 2,072,112 | | | | 6,170,279 | | | | — | |
Consumer Services | | | 14,440,167 | | | | 7,895,318 | | | | 6,544,849 | | | | — | |
Diversified Financials | | | 27,197,604 | | | | 19,842,426 | | | | 7,355,178 | | | | — | |
Energy | | | 10,581,341 | | | | 7,442,829 | | | | 3,138,512 | | | | — | |
Food & Staples Retailing | | | 3,439,323 | | | | 3,439,323 | | | | — | | | | — | |
Food, Beverage & Tobacco | | | 20,876,730 | | | | 13,994,924 | | | | 6,881,806 | | | | — | |
Health Care Equipment & Services | | | 23,996,066 | | | | 23,996,066 | | | | — | | | | — | |
Household & Personal Products | | | 8,753,844 | | | | 2,065,307 | | | | 6,688,537 | | | | — | |
Insurance | | | 12,974,380 | | | | 7,508,286 | | | | 5,466,094 | | | | — | |
Materials | | | 10,851,652 | | | | — | | | | 10,851,652 | | | | — | |
Media | | | 5,068,281 | | | | 5,068,281 | | | | — | | | | — | |
Pharmaceuticals, Biotechnology & Life Sciences | | | 26,180,112 | | | | 18,710,568 | | | | 7,469,544 | | | | — | |
Real Estate | | | 8,607,479 | | | | 6,066,772 | | | | 2,540,707 | | | | — | |
Retailing | | | 41,015,196 | | | | 35,365,305 | | | | 5,649,891 | | | | — | |
Semiconductors & Semiconductor Equipment | | | 12,628,454 | | | | 7,086,206 | | | | 5,542,248 | | | | — | |
Software & Services | | | 106,235,669 | | | | 93,315,760 | | | | 12,885,482 | | | | 34,427 | |
Technology Hardware & Equipment | | | 11,410,150 | | | | 2,126,461 | | | | 9,283,689 | | | | — | |
Telecommunication Services | | | 5,254,435 | | | | 3,121,010 | | | | 2,133,425 | | | | — | |
Transportation | | | 1,740,571 | | | | — | | | | 1,740,571 | | | | — | |
Warrants | | | — | | | | — | | | | — | | | | — | |
Short-Term Investments | | | 5,543,109 | | | | 5,543,109 | | | | — | | | | — | |
| | | | | | | | | | | | | | | | |
Total | | $ | 421,207,891 | | | $ | 294,250,304 | | | $ | 126,923,160 | | | $ | 34,427 | |
| | | | | | | | | | | | | | | | |
| (1) | For the year ended December 31, 2016, investments valued at $3,144,243 were transferred from Level 1 to Level 2 due to the application of a fair valuation factor, there were no transfers from Level 2 to Level 1 and investments valued at $34,983 were transferred from Level 3 to Level 1 due to the expiration of trading restrictions. |
The following is a rollforward of the Fund’s investments that were valued using unobservable inputs (Level 3) for the year ended December 31, 2016:
| | | | | | | | | | | | |
| | | Common
Stocks | | | Warrants | | | Total | |
Beginning balance | | $ | 89,323 | | | $ | — | | | $ | 89,323 | |
Purchases | | | — | | | | — | | | | — | |
Sales | | | — | | | | — | | | | — | |
Accrued discounts/(premiums) | | | — | | | | — | | | | — | |
Total realized gain/(loss) | | | — | | | | — | | | | — | |
Net change in unrealized appreciation/depreciation | | | (19,913 | ) | | | — | | | | (19,913 | ) |
Transfers into Level 3 | | | — | | | | — | | | | — | |
Transfers out of Level 3 | | | (34,983 | ) | | | — | | | | (34,983 | ) |
| | | | | | | | | | | | |
Ending balance | | $ | 34,427 | | | $ | — | | | $ | 34,427 | |
| | | | | | | | | | | | |
The change in net unrealized appreciation/depreciation relating to the Level 3 investments held at December 31, 2016 was $(19,913).
| Note: | For purposes of reporting transfers between different hierarchy levels, both transfers in and out of each level, as applicable, are shown as if they occurred at the beginning of the period. |
The accompanying notes are an integral part of these financial statements.
|
| Hartford Growth Opportunities HLS Fund |
Schedule of Investments
December 31, 2016
| | | | | | | | |
Shares or Principal Amount | | Market Value† | |
| COMMON STOCKS - 91.2% | |
| | | | Automobiles & Components - 1.0% | |
| | 62,786 | | | Tesla Motors, Inc.* | | $ | 13,416,740 | |
| | | | | | | | |
| | | | Banks - 3.5% | | | |
| | 72,300 | | | BB&T Corp. | | | 3,399,546 | |
| | 242,977 | | | Citigroup, Inc. | | | 14,440,123 | |
| | 143,066 | | | PNC Financial Services Group, Inc. | | | 16,732,999 | |
| | 193,725 | | | Wells Fargo & Co. | | | 10,676,185 | |
| | | | | | | | |
| | | | | | | 45,248,853 | |
| | | | | | | | |
| | | | Capital Goods - 7.2% | |
| | 237,468 | | | AerCap Holdings N.V.* | | | 9,881,044 | |
| | 162,410 | | | Deere & Co. | | | 16,734,726 | |
| | 548,323 | | | Fastenal Co. | | | 25,760,215 | |
| | 216,148 | | | Middleby Corp.* | | | 27,842,024 | |
| | 101,158 | | | Rockwell Automation, Inc. | | | 13,595,635 | |
| | | | | | | | |
| | | | | | | 93,813,644 | |
| | | | | | | | |
| | | | Commercial & Professional Services - 1.5% | |
| | 18,785 | | | Klarna Holding AB*(1)(2)(3) | | | 1,985,347 | |
| | 562,033 | | | TransUnion* | | | 17,383,681 | |
| | | | | | | | |
| | | | | | | 19,369,028 | |
| | | | | | | | |
| | | | Consumer Durables & Apparel - 0.7% | |
| | 69,924 | | | Pandora A/S | | | 9,127,877 | |
| | 14,630 | | | Under Armour, Inc. Class C* | | | 368,237 | |
| | | | | | | | |
| | | | | | | 9,496,114 | |
| | | | | | | | |
| | | | Consumer Services - 4.5% | |
| | 1,011,156 | | | Hilton Worldwide Holdings, Inc. | | | 27,503,443 | |
| | 796,900 | | | Kroton Educacional S.A. | | | 3,263,796 | |
| | 162,273 | | | Marriott International, Inc. Class A | | | 13,416,732 | |
| | 71,686 | | | Panera Bread Co. Class A* | | | 14,702,082 | |
| | | | | | | | |
| | | | | | | 58,886,053 | |
| | | | | | | | |
| | | | Diversified Financials - 4.9% | |
| | 164,960 | | | Capital One Financial Corp. | | | 14,391,110 | |
| | 621,393 | | | Double Eagle Acquisition Corp.* | | | 6,555,696 | |
| | 310,301 | | | Intercontinental Exchange, Inc. | | | 17,507,182 | |
| | 299,400 | | | Synchrony Financial | | | 10,859,238 | |
| | 352,075 | | | Voya Financial, Inc. | | | 13,808,382 | |
| | | | | | | | |
| | | | | | | 63,121,608 | |
| | | | | | | | |
| | | | Energy - 6.8% | |
| | 344,622 | | | Baker Hughes, Inc. | | | 22,390,091 | |
| | 53,299 | | | Centennial Resource Development, Inc. PIPE*(1)(2)(3) | | | 949,514 | |
| | 94,153 | | | Cimarex Energy Co. | | | 12,795,393 | |
| | 87,129 | | | Diamondback Energy, Inc.* | | | 8,805,257 | |
| | 293,938 | | | Newfield Exploration Co.* | | | 11,904,489 | |
| | 64,307 | | | Pioneer Natural Resources Co. | | | 11,579,761 | |
| | 273,500 | | | Seven Generations Energy Ltd. Class A* | | | 6,377,898 | |
| | 909,355 | | | WPX Energy, Inc.* | | | 13,249,302 | |
| | | | | | | | |
| | | | | | | 88,051,705 | |
| | | | | | | | |
| | | | Food & Staples Retailing - 1.7% | |
| | 136,046 | | | Costco Wholesale Corp. | | | 21,782,325 | |
| | | | | | | | |
| | | | Food, Beverage & Tobacco - 1.8% | |
| | 512,725 | | | Monster Beverage Corp.* | | | 22,734,227 | |
| | | | | | | | |
| | | | Health Care Equipment & Services - 6.4% | |
| | 253,934 | | | Align Technology, Inc.* | | | 24,410,675 | |
| | 189,512 | | | DexCom, Inc.* | | | 11,313,866 | |
| | 247,190 | | | Edwards Lifesciences Corp.* | | | 23,161,703 | |
| | 329,746 | | | Hologic, Inc.* | | | 13,229,410 | |
| | | | | | | | |
Shares or Principal Amount | | Market Value† | |
| COMMON STOCKS - 91.2% - (continued) | |
| | | | Health Care Equipment & Services - 6.4% - (continued) | |
| | 273,075 | | | Veeva Systems, Inc. Class A* | | $ | 11,114,153 | |
| | | | | | | | |
| | | | | | | 83,229,807 | |
| | | | | | | | |
| | | | Insurance - 1.0% | |
| | 247,394 | | | MetLife, Inc. | | | 13,332,063 | |
| | | | | | | | |
| | | | Materials - 6.2% | |
| | 3,665,775 | | | Glencore plc* | | | 12,386,224 | |
| | 248,696 | | | International Paper Co. | | | 13,195,810 | |
| | 1,876,931 | | | Platform Specialty Products Corp.* | | | 18,412,693 | |
| | 279,113 | | | Steel Dynamics, Inc. | | | 9,930,841 | |
| | 1,836,328 | | | Vale S.A. ADR | | | 13,992,819 | |
| | 254,284 | | | WestRock Co. | | | 12,909,999 | |
| | | | | | | | |
| | | | | | | 80,828,386 | |
| | | | | | | | |
| | | | Pharmaceuticals, Biotechnology & Life Sciences - 6.0% | |
| | 611,708 | | | Bristol-Myers Squibb Co. | | | 35,748,216 | |
| | 112,100 | | | Celgene Corp.* | | | 12,975,575 | |
| | 217,580 | | | Eisai Co., Ltd. | | | 12,468,934 | |
| | 62,470 | | | Incyte Corp.* | | | 6,263,867 | |
| | 152,700 | | | Ionis Pharmaceuticals, Inc.* | | | 7,303,641 | |
| | 29,330 | | | TESARO, Inc.* | | | 3,944,298 | |
| | | | | | | | |
| | | | | | | 78,704,531 | |
| | | | | | | | |
| | | | Real Estate - 1.2% | |
| | 38,929 | | | Equinix, Inc. REIT | | | 13,913,614 | |
| | 29,318 | | | WeWork Companies, Inc. Class A, REIT*(1)(2)(3) | | | 1,471,536 | |
| | | | | | | | |
| | | | | | | 15,385,150 | |
| | | | | | | | |
| | | | Retailing - 9.4% | |
| | 63,922 | | | Amazon.com, Inc.* | | | 47,933,190 | |
| | 43,732 | | | Honest Co.*(1)(2)(3) | | | 1,509,629 | |
| | 41,578 | | | JAND, Inc. Class A*(1)(2)(3) | | | 392,080 | |
| | 312,380 | | | Netflix, Inc.* | | | 38,672,644 | |
| | 20,393 | | | Priceline Group, Inc.* | | | 29,897,362 | |
| | 94,537 | | | Tory Burch LLC*(1)(2)(3) | | | 4,466,868 | |
| | | | | | | | |
| | | | | | | 122,871,773 | |
| | | | | | | | |
| | | | Semiconductors & Semiconductor Equipment - 0.9% | |
| | 167,260 | | | Analog Devices, Inc. | | | 12,146,421 | |
| | | | | | | | |
| | | | Software & Services - 22.0% | |
| | 198,638 | | | Alibaba Group Holding Ltd. ADR* | | | 17,442,403 | |
| | 34,972 | | | Alphabet, Inc. Class C* | | | 26,992,089 | |
| | 71,211 | | | CoStar Group, Inc.* | | | 13,422,561 | |
| | 446,483 | | | Facebook, Inc. Class A* | | | 51,367,869 | |
| | 280,622 | | | Global Payments, Inc. | | | 19,477,973 | |
| | 637,259 | | | Mobileye N.V.* | | | 24,292,313 | |
| | 472,080 | | | PayPal Holdings, Inc.* | | | 18,632,998 | |
| | 272,342 | | | ServiceNow, Inc.* | | | 20,245,904 | |
| | 457,514 | | | SS&C Technologies Holdings, Inc. | | | 13,084,901 | |
| | 18,600 | | | Trade Desk, Inc. Class A* | | | 514,662 | |
| | 88,825 | | | Ultimate Software Group, Inc.* | | | 16,197,239 | |
| | 336,145 | | | Visa, Inc. Class A | | | 26,226,033 | |
| | 309,967 | | | Workday, Inc. Class A* | | | 20,485,719 | |
| | 511,860 | | | Zillow Group, Inc. Class C* | | | 18,667,534 | |
| | | | | | | | |
| | | | | | | 287,050,198 | |
| | | | | | | | |
| | | | Technology Hardware & Equipment - 1.1% | |
| | 148,599 | | | Arista Networks, Inc.* | | | 14,379,925 | |
| | | | | | | | |
| | | | Transportation - 3.4% | |
| | 70,064 | | | FedEx Corp. | | | 13,045,917 | |
| | 191,584 | | | J.B. Hunt Transport Services, Inc. | | | 18,597,059 | |
The accompanying notes are an integral part of these financial statements.
|
| Hartford Growth Opportunities HLS Fund |
Schedule of Investments – (continued)
December 31, 2016
| | | | | | | | |
Shares or Principal Amount | | Market Value† | |
| COMMON STOCKS - 91.2% - (continued) | |
| | | | Transportation - 3.4% - (continued) | |
| | 155,663 | | | Kansas City Southern | | $ | 13,208,005 | |
| | | | | | | | |
| | | | | | | 44,850,981 | |
| | | | | | | | |
| | |
| | | | Total Common Stocks
(cost $1,122,166,125) | | $ | 1,188,699,532 | |
| | | | | | | | |
|
| CORPORATE BONDS - 0.1% | |
| | | | Internet - 0.1% | |
| $ | 705,896 | | | DraftKings, Inc.
5.00%, 12/23/2017*(1)(2)(3) | | $ | 705,896 | |
| | | | | | | | |
| | |
| | | | Total Corporate Bonds
(cost $705,896) | | $ | 705,896 | |
| | | | | | | | |
|
| PREFERRED STOCKS - 8.2% | |
| | | | Capital Goods - 0.5% | |
| | 1,458,400 | | | Lithium Technology Corp.*(1)(2)(3) | | $ | 6,941,984 | |
| | | | | | | | |
| | | | Consumer Services - 0.1% | |
| | 874,073 | | | DraftKings, Inc.*(1)(2)(3) | | | 1,678,220 | |
| | | | | | | | |
| | | | Real Estate - 1.3% | |
| | 879,569 | | | Redfin Corp. Series G*(1)(2)(3) | | | 3,615,029 | |
| | 145,709 | | | WeWork Companies, Inc. Class D-1*(1)(2)(3) | | | 7,313,462 | |
| | 114,486 | | | WeWork Companies, Inc. Class D-2*(1)(2)(3) | | | 5,746,310 | |
| | | | | | | | |
| | | | | | | 16,674,801 | |
| | | | | | | | |
| | | | Retailing - 0.6% | |
| | 1,605,750 | | | Forward Ventures, Inc.*(1)(2)(3) | | | 7,036,397 | |
| | 92,843 | | | JAND, Inc. Series D*(1)(2)(3) | | | 875,509 | |
| | | | | | | | |
| | | | | | | 7,911,906 | |
| | | | | | | | |
| | | | Software & Services - 5.5% | |
| | 535,139 | | | Birst, Inc. Series F*(1)(2)(3) | | | 2,761,317 | |
| | 1,871,878 | | | Essence Group Holdings Corp.*(1)(2)(3) | | | 3,388,099 | |
| | 236,310 | | | ForeScout Technologies, Inc.*(1)(2)(3) | | | 2,686,845 | |
| | 50,806 | | | General Assembly Space, Inc.*(1)(2)(3) | | | 2,490,556 | |
| | 287,204 | | | Lookout, Inc. Series F*(1)(2)(3) | | | 2,197,111 | |
| | 366,944 | | | MarkLogic Corp. Series F*(1)(2)(3) | | | 3,783,193 | |
| | 227,914 | | | Nutanix, Inc.*(1)(2)(3) | | | 5,754,089 | |
| | 488,790 | | | Pinterest, Inc. Series G*(1)(2)(3) | | | 2,825,206 | |
| | 759,876 | | | Uber Technologies, Inc.*(1)(2)(3) | | | 37,060,845 | |
| | 210,735 | | | Veracode, Inc.*(1)(2)(3) | | | 4,322,175 | |
| | 1,160,072 | | | Zuora, Inc. Series F*(1)(2)(3) | | | 4,303,867 | |
| | | | | | | | |
| | | | | | | 71,573,303 | |
| | | | | | | | |
| | | | Telecommunication Services - 0.2% | |
| | 7,944 | | | DocuSign, Inc. Series B*(1)(2)(3) | | | 128,296 | |
| | 2,379 | | | DocuSign, Inc. Series B-1*(1)(2)(3) | | | 38,421 | |
| | 5,708 | | | DocuSign, Inc. Series D*(1)(2)(3) | | | 92,184 | |
| | 123,606 | | | DocuSign, Inc. Series E*(1)(2)(3) | | | 1,996,237 | |
| | | | | | | | |
| | | | | | | 2,255,138 | |
| | | | | | | | |
| | |
| | | | Total Preferred Stocks
(cost $69,387,037) | | $ | 107,035,352 | |
| | | | | | | | |
| | | | | | | | |
Shares or Principal Amount | | Market Value† | |
| CONVERTIBLE PREFERRED STOCKS - 0.3% | |
| | | | Retailing - 0.3% | |
| | 102,040 | | | Honest Co. Series C*(1)(2)(3) | | $ | 3,522,420 | |
| | | | | | | | |
| | |
| | | | Total Convertible Preferred Stocks
(cost $2,760,927) | | $ | 3,522,420 | |
| | | | | | | | |
| | |
| | | | Total Long-Term Investments
(cost $1,195,019,985) | | $ | 1,299,963,200 | |
| | | | | | | | |
|
| SHORT-TERM INVESTMENTS - 0.9% | |
| | | | Other Investment Pools & Funds - 0.9% | |
| | 11,989,623 | | | Morgan Stanley Institutional Liquidity Funds, Institutional Class | | $ | 11,989,623 | |
| | | | | | | | |
| | |
| | | | Total Short-Term Investments
(cost $11,989,623) | | $ | 11,989,623 | |
| | | | | | | | |
| | | | | | | | | | | | |
| | | |
| | | | Total Investments
(cost $1,207,009,608)^ | | | 100.7 | % | | $ | 1,311,952,823 | |
| | | | Other Assets and Liabilities | | | (0.7 | )% | | | (9,077,066 | ) |
| | | | | | | | | | | | |
| | | | Total Net Assets | | | 100.0 | % | | $ | 1,302,875,757 | |
| | | | | | | | | | | | |
The accompanying notes are an integral part of these financial statements.
|
| Hartford Growth Opportunities HLS Fund |
Schedule of Investments – (continued)
December 31, 2016
| Note: | Percentage of investments as shown is the ratio of the total market value to total net assets. |
| | Prices of foreign equities that are principally traded on certain foreign markets will generally be adjusted daily pursuant to a fair value pricing service approved by the Board of Directors in order to reflect an adjustment for factors occurring after the close of certain foreign markets but before the close of the New York Stock Exchange. |
| | Equity industry classifications used in this report are the Global Industry Classification Standard, which was developed by and is the exclusive property and service mark of MSCI, Inc. and Standard & Poor’s. |
| | For Fund compliance purposes, the Fund may not use the same classification system shown in this report as these classifications are used for financial reporting purposes. |
| ^ | At December 31, 2016, the cost of securities for federal income tax purposes was $1,220,165,767 and the aggregate gross unrealized appreciation and depreciation based on that cost were: |
| | | | |
Unrealized Appreciation | | $ | 118,362,538 | |
Unrealized Depreciation | | | (26,575,482 | ) |
| | | | |
Net Unrealized Appreciation | | $ | 91,787,056 | |
| | | | |
| (1) | These securities are valued in good faith at fair value as determined under policies and procedures established by and under the supervision of the Board of Directors. At December 31, 2016, the aggregate fair value of these securities was $122,038,642, which represents 9.4% of total net assets. This amount excludes securities that are principally traded in certain foreign markets and whose prices are adjusted pursuant to a third party pricing service methodology approved by the Board of Directors. |
| (2) | The following securities are considered illiquid. Illiquid securities are often purchased in private placement transactions, are often not registered under the Securities Act of 1933, as amended, and may have contractual restrictions on resale. A security may also be considered illiquid if the security lacks a readily available market or if its valuation has not changed for a certain period of time. |
| | | | | | | | | | | | |
Period
Acquired | | | Shares/Par | | | Security | | Cost Basis | |
| | 03/2015 | | | | 535,139 | | | Birst, Inc. Series F Preferred | | $ | 3,125,693 | |
| | 12/2016 | | | | 53,299 | | | Centennial Resource Development, Inc. PIPE | | | 774,967 | |
| | 02/2014 | | | | 7,944 | | | DocuSign, Inc. Series B Preferred | | | 104,324 | |
| | 02/2014 | | | | 2,379 | | | DocuSign, Inc. Series B-1 Preferred | | | 31,242 | |
| | 02/2014 | | | | 5,708 | | | DocuSign, Inc. Series D Preferred | | | 74,960 | |
| | 02/2014 | | | | 123,606 | | | DocuSign, Inc. Series E Preferred | | | 1,623,243 | |
| | 12/2015 | | | | 705,896 | | | DraftKings, Inc. | | | 705,896 | |
| | 12/2014 | | | | 874,073 | | | DraftKings, Inc. Preferred | | | 1,574,452 | |
| | 05/2014 | | | | 1,871,878 | | | Essence Group Holdings Corp. Preferred | | | 2,960,001 | |
| | 11/2015 | | | | 236,310 | | | ForeScout Technologies, Inc. Preferred | | | 2,804,291 | |
| | 11/2014 | | | | 1,605,750 | | | Forward Ventures, Inc. Preferred | | | 4,998,894 | |
| | 07/2015 | | | | 50,806 | | | General Assembly Space, Inc. Preferred | | | 2,490,556 | |
| | 08/2014 | | | | 43,732 | | | Honest Co. | | | 1,183,270 | |
| | 08/2014 | | | | 102,040 | | | Honest Co. Series C Convertible Preferred | | | 2,760,927 | |
| | 04/2015 | | | | 41,578 | | | JAND, Inc. Class A | | | 477,536 | |
| | 04/2015 | | | | 92,843 | | | JAND, Inc. Series D Preferred | | | 1,066,330 | |
| | 08/2015 | | | | 18,785 | | | Klarna Holding AB | | | 2,060,349 | |
| | 08/2013 | | | | 1,458,400 | | | Lithium Technology Corp. Preferred | | | 7,108,242 | |
| | 07/2014 | | | | 287,204 | | | Lookout, Inc. Series F Preferred | | | 3,280,760 | |
| | 04/2015 | | | | 366,944 | | | MarkLogic Corp. Series F Preferred | | | 4,261,761 | |
| | 08/2014 | | | | 227,914 | | | Nutanix, Inc. Preferred | | | 3,053,250 | |
| | 03/2015 | | | | 488,790 | | | Pinterest, Inc. Series G Preferred | | | 3,509,068 | |
| | 12/2014 | | | | 879,569 | | | Redfin Corp. Series G Preferred | | | 2,900,554 | |
| | 11/2013 | | | | 94,537 | | | Tory Burch LLC | | | 7,409,472 | |
| | 06/2014 | | | | 759,876 | | | Uber Technologies, Inc. Preferred | | | 11,787,994 | |
| | 08/2014 | | | | 210,735 | | | Veracode, Inc. Preferred | | | 3,891,411 | |
| | 12/2014 | | | | 29,318 | | | WeWork Companies, Inc. Class A, REIT | | | 488,179 | |
| | 12/2014 | | | | 145,709 | | | WeWork Companies, Inc. Class D-1 Preferred | | | 2,426,224 | |
| | 12/2014 | | | | 114,486 | | | WeWork Companies, Inc. Class D-2 Preferred | | | 1,906,325 | |
| | 01/2015 | | | | 1,160,072 | | | Zuora, Inc. Series F Preferred | | | 4,407,462 | |
| | | | | | | | | | | | |
| | | | | | | | | | $ | 85,247,633 | |
| | | | | | | | | | | | |
| | At December 31, 2016, the aggregate value of these securities was $122,038,642, which represents 9.4% of total net assets. |
| (3) | Securities issued within terms of a private placement memorandum and exempt from registration under Rule 144A under the Securities Act of 1933, as amended, and may be sold only to qualified institutional buyers. Unless otherwise indicated, these holdings are determined to be liquid. At December 31, 2016, the aggregate value of these securities was $122,038,642, which represents 9.4% of total net assets. |
| † | See Significant Accounting Policies of accompanying Notes to Financial Statements regarding valuation of investments. |
The accompanying notes are an integral part of these financial statements.
|
| Hartford Growth Opportunities HLS Fund |
Schedule of Investments – (continued)
December 31, 2016
| | |
| GLOSSARY: (abbreviations used in preceding Schedule of Investments) |
|
| Other Abbreviations: |
| ADR | | American Depositary Receipt |
| PIPE | | Private Investment in Public Equity |
| REIT | | Real Estate Investment Trust |
The accompanying notes are an integral part of these financial statements.
|
| Hartford Growth Opportunities HLS Fund |
Schedule of Investments – (continued)
December 31, 2016
Fair Valuation Summary
The following is a summary of the fair valuations according to the inputs used as of December 31, 2016 in valuing the Fund’s investments.
| | | | | | | | | | | | | | | | |
| | | Total | | | Level 1(1) | | | Level 2(1) | | | Level 3(1) | |
Assets | | | | | | | | | | | | | | | | |
Common Stocks | | | | | | | | | | | | | | | | |
Automobiles & Components | | $ | 13,416,740 | | | $ | 13,416,740 | | | $ | — | | | $ | — | |
Banks | | | 45,248,853 | | | | 45,248,853 | | | | — | | | | — | |
Capital Goods | | | 93,813,644 | | | | 93,813,644 | | | | — | | | | — | |
Commercial & Professional Services | | | 19,369,028 | | | | 17,383,681 | | | | — | | | | 1,985,347 | |
Consumer Durables & Apparel | | | 9,496,114 | | | | 368,237 | | | | 9,127,877 | | | | — | |
Consumer Services | | | 58,886,053 | | | | 58,886,053 | | | | — | | | | — | |
Diversified Financials | | | 63,121,608 | | | | 63,121,608 | | | | — | | | | — | |
Energy | | | 88,051,705 | | | | 87,102,191 | | | | — | | | | 949,514 | |
Food & Staples Retailing | | | 21,782,325 | | | | 21,782,325 | | | | — | | | | — | |
Food, Beverage & Tobacco | | | 22,734,227 | | | | 22,734,227 | | | | — | | | | — | |
Health Care Equipment & Services | | | 83,229,807 | | | | 83,229,807 | | | | — | | | | — | |
Insurance | | | 13,332,063 | | | | 13,332,063 | | | | — | | | | — | |
Materials | | | 80,828,386 | | | | 68,442,162 | | | | 12,386,224 | | | | — | |
Pharmaceuticals, Biotechnology & Life Sciences | | | 78,704,531 | | | | 66,235,597 | | | | 12,468,934 | | | | — | |
Real Estate | | | 15,385,150 | | | | 13,913,614 | | | | — | | | | 1,471,536 | |
Retailing | | | 122,871,773 | | | | 116,503,196 | | | | — | | | | 6,368,577 | |
Semiconductors & Semiconductor Equipment | | | 12,146,421 | | | | 12,146,421 | | | | — | | | | — | |
Software & Services | | | 287,050,198 | | | | 287,050,198 | | | | — | | | | — | |
Technology Hardware & Equipment | | | 14,379,925 | | | | 14,379,925 | | | | — | | | | — | |
Transportation | | | 44,850,981 | | | | 44,850,981 | | | | — | | | | — | |
Corporate Bonds | | | 705,896 | | | | — | | | | — | | | | 705,896 | |
Preferred Stocks | | | 107,035,352 | | | | — | | | | — | | | | 107,035,352 | |
Convertible Preferred Stocks | | | 3,522,420 | | | | — | | | | — | | | | 3,522,420 | |
Short-Term Investments | | | 11,989,623 | | | | 11,989,623 | | | | — | | | | — | |
| | | | | | | | | | | | | | | | |
Total | | $ | 1,311,952,823 | | | $ | 1,155,931,146 | | | $ | 33,983,035 | | | $ | 122,038,642 | |
| | | | | | | | | | | | | | | | |
| (1) | For the year ended December 31, 2016, there were no transfers between Level 1 and Level 2, and investments valued at $3,957,884 were transferred from Level 3 to Level 1 due to the expiration of trading restrictions. |
The following is a rollforward of the Fund’s investments that were valued using unobservable inputs (Level 3) for the year ended December 31, 2016:
| | | | | | | | | | | | | | | | | | | | |
| | | Common
Stocks | | | Preferred
Stocks | | | Corporate
Bonds | | | Convertible
Preferred
Stocks | | | Total | |
Beginning balance | | $ | 14,516,321 | | | $ | 106,827,213 | | | $ | 705,896 | | | $ | 4,625,473 | | | $ | 126,674,903 | |
Purchases | | | 774,967 | | | | — | | | | — | | | | — | | | | 774,967 | |
Sales | | | — | | | | (736,890 | ) | | | — | | | | — | | | | (736,890 | ) |
Accrued discounts/(premiums) | | | — | | | | — | | | | — | | | | — | | | | — | |
Total realized gain/(loss) | | | — | | | | (57,854 | ) | | | — | | | | — | | | | (57,854 | ) |
Net change in unrealized appreciation/depreciation | | | (558,430 | ) | | | 1,002,883 | | | | — | | | | (1,103,053 | ) | | | (658,600 | ) |
Transfers into Level 3 | | | — | | | | — | | | | — | | | | — | | | | — | |
Transfers out of Level 3 | | | (3,957,884 | ) | | | — | | | | — | | | | — | | | | (3,957,884 | ) |
| | | | | | | | | | | | | | | | | | | | |
Ending balance | | $ | 10,774,974 | | | $ | 107,035,352 | | | $ | 705,896 | | | $ | 3,522,420 | | | $ | 122,038,642 | |
| | | | | | | | | | | | | | | | | | | | |
The change in net unrealized appreciation/depreciation relating to the Level 3 investments held at December 31, 2016 was $444,125.
| Note: | For purposes of reporting transfers between different hierarchy levels, both transfers in and out of each level, as applicable, are shown as if they occurred at the beginning of the period. |
The accompanying notes are an integral part of these financial statements.
|
| Hartford Healthcare HLS Fund |
Schedule of Investments
December 31, 2016
| | | | | | | | |
Shares or Principal Amount | | Market Value† | |
| COMMON STOCKS - 99.0% | |
| | | | Biotechnology - 24.0% | |
| | 191,910 | | | Aduro Biotech, Inc.* | | $ | 2,187,774 | |
| | 36,080 | | | Alder Biopharmaceuticals, Inc.* | | | 750,464 | |
| | 131,932 | | | Alkermes plc* | | | 7,332,781 | |
| | 40,000 | | | Alnylam Pharmaceuticals, Inc.* | | | 1,497,600 | |
| | 457,465 | | | Arena Pharmaceuticals, Inc.* | | | 649,600 | |
| | 262,050 | | | ARIAD Pharmaceuticals, Inc.* | | | 3,259,902 | |
| | 22,240 | | | Biogen, Inc.* | | | 6,306,819 | |
| | 38,650 | | | Bluebird Bio, Inc.* | | | 2,384,705 | |
| | 106,740 | | | Celgene Corp.* | | | 12,355,155 | |
| | 189,030 | | | Cytokinetics, Inc.* | | | 2,296,714 | |
| | 29,997 | | | Galapagos N.V.* | | | 1,921,163 | |
| | 112,612 | | | GlycoMimetics, Inc.* | | | 686,933 | |
| | 49,343 | | | Incyte Corp.* | | | 4,947,623 | |
| | 26,798 | | | Innate Pharma S.A.* | | | 411,328 | |
| | 138,403 | | | Ironwood Pharmaceuticals, Inc.* | | | 2,116,182 | |
| | 88,940 | | | Karyopharm Therapeutics, Inc.* | | | 836,036 | |
| | 84,470 | | | Loxo Oncology, Inc.* | | | 2,712,754 | |
| | 140,661 | | | Portola Pharmaceuticals, Inc.* | | | 3,156,433 | |
| | 38,800 | | | PTC Therapeutics, Inc.* | | | 423,308 | |
| | 10,641 | | | Regeneron Pharmaceuticals, Inc.* | | | 3,906,205 | |
| | 384,075 | | | Rigel Pharmaceuticals, Inc.* | | | 914,099 | |
| | 131,640 | | | Syndax Pharmaceuticals, Inc.* | | | 943,859 | |
| | 33,720 | | | T2 Biosystems, Inc.* | | | 177,367 | |
| | 26,090 | | | TESARO, Inc.* | | | 3,508,583 | |
| | 187,124 | | | Trevena, Inc.* | | | 1,100,289 | |
| | 41,510 | | | Ultragenyx Pharmaceutical, Inc.* | | | 2,918,568 | |
| | | | | | | | |
| | | | | | | 69,702,244 | |
| | | | | | | | |
| | | | Drug Retail - 0.4% | |
| | 13,575 | | | Walgreens Boots Alliance, Inc. | | | 1,123,467 | |
| | | | | | | | |
| | | | Health Care Distributors - 3.2% | |
| | 49,560 | | | Cardinal Health, Inc. | | | 3,566,833 | |
| | 40,220 | | | McKesson Corp. | | | 5,648,899 | |
| | | | | | | | |
| | | | | | | 9,215,732 | |
| | | | | | | | |
| | | | Health Care Equipment - 24.5% | |
| | 210,930 | | | Abbott Laboratories | | | 8,101,821 | |
| | 24,760 | | | ABIOMED, Inc.* | | | 2,789,957 | |
| | 99,970 | | | AtriCure, Inc.* | | | 1,956,413 | |
| | 80,829 | | | Baxter International, Inc. | | | 3,583,958 | |
| | 30,708 | | | Becton Dickinson and Co. | | | 5,083,709 | |
| | 379,210 | | | Boston Scientific Corp.* | | | 8,202,312 | |
| | 145,451 | | | ConforMIS, Inc.* | | | 1,178,153 | |
| | 25,440 | | | Edwards Lifesciences Corp.* | | | 2,383,728 | |
| | 150,862 | | | Globus Medical, Inc. Class A* | | | 3,742,886 | |
| | 27,535 | | | Invuity, Inc.* | | | 158,326 | |
| | 141,045 | | | K2M Group Holdings, Inc.* | | | 2,826,542 | |
| | 209,562 | | | Medtronic plc | | | 14,927,101 | |
| | 74,158 | | | St. Jude Medical, Inc. | | | 5,946,730 | |
| | 66,045 | | | Stryker Corp. | | | 7,912,852 | |
| | 15,510 | | | Teleflex, Inc. | | | 2,499,437 | |
| | | | | | | | |
| | | | | | | 71,293,925 | |
| | | | | | | | |
| | | | Health Care Facilities - 3.5% | |
| | 29,792 | | | Acadia Healthcare Co., Inc.* | | | 986,115 | |
| | 82,770 | | | Community Health Systems, Inc.* | | | 462,684 | |
| | 160,312 | | | Georgia Healthcare Group plc*(1) | | | 705,567 | |
| | 71,480 | | | HCA Holdings, Inc.* | | | 5,290,950 | |
| | 26,860 | | | LifePoint Health, Inc.* | | | 1,525,648 | |
| | 12,030 | | | Universal Health Services, Inc. Class B | | | 1,279,751 | |
| | | | | | | | |
| | | | | | | 10,250,715 | |
| | | | | | | | |
| | | | | | | | |
Shares or Principal Amount | | Market Value† | |
| COMMON STOCKS - 99.0% - (continued) | |
| | | | Health Care Services - 1.3% | |
| | 36,765 | | | Envision Healthcare Corp.* | | $ | 2,326,857 | |
| | 88,582 | | | Teladoc, Inc.* | | | 1,461,603 | |
| | | | | | | | |
| | | | | | | 3,788,460 | |
| | | | | | | | |
| | | | Health Care Supplies - 1.0% | |
| | 236,190 | | | ConvaTec Group plc*(1) | | | 680,837 | |
| | 27,034 | | | DENTSPLY SIRONA, Inc. | | | 1,560,673 | |
| | 116,161 | | | Endologix, Inc.* | | | 664,441 | |
| | | | | | | | |
| | | | | | | 2,905,951 | |
| | | | | | | | |
| | | | Health Care Technology - 2.1% | |
| | 59,235 | | | Allscripts Healthcare Solutions, Inc.* | | | 604,789 | |
| | 22,650 | | | athenahealth, Inc.* | | | 2,382,101 | |
| | 64,039 | | | Cerner Corp.* | | | 3,033,527 | |
| | | | | | | | |
| | | | | | | 6,020,417 | |
| | | | | | | | |
| | | | Life Sciences Tools & Services - 4.6% | |
| | 20,465 | | | ICON plc* | | | 1,538,968 | |
| | 17,420 | | | Illumina, Inc.* | | | 2,230,457 | |
| | 7,700 | | | Medpace Holdings, Inc.* | | | 277,739 | |
| | 61,830 | | | Patheon N.V.* | | | 1,775,139 | |
| | 6,230 | | | Samsung Biologics Co., Ltd.* | | | 778,879 | |
| | 48,275 | | | Thermo Fisher Scientific, Inc. | | | 6,811,603 | |
| | | | | | | | |
| | | | | | | 13,412,785 | |
| | | | | | | | |
| | | | Managed Health Care - 9.9% | |
| | 36,830 | | | Aetna, Inc. | | | 4,567,288 | |
| | 24,081 | | | Cigna Corp. | | | 3,212,165 | |
| | 110,750 | | | UnitedHealth Group, Inc. | | | 17,724,430 | |
| | 24,190 | | | WellCare Health Plans, Inc.* | | | 3,315,965 | |
| | | | | | | | |
| | | | | | | 28,819,848 | |
| | | | | | | | |
| | | | Pharmaceuticals - 24.5% | |
| | 64,652 | | | Allergan plc* | | | 13,577,567 | |
| | 248,150 | | | AstraZeneca plc ADR | | | 6,779,458 | |
| | 241,750 | | | Bristol-Myers Squibb Co. | | | 14,127,870 | |
| | 33,060 | | | Chugai Pharmaceutical Co., Ltd. | | | 948,294 | |
| | 53,930 | | | Eisai Co., Ltd. | | | 3,090,586 | |
| | 120,590 | | | Eli Lilly & Co. | | | 8,869,394 | |
| | 17,489 | | | Hikma Pharmaceuticals plc | | | 407,628 | |
| | 45,330 | | | Intersect ENT, Inc.* | | | 548,493 | |
| | 13,785 | | | Johnson & Johnson | | | 1,588,170 | |
| | 107,500 | | | Medicines Co.* | | | 3,648,550 | |
| | 160,355 | | | MediWound Ltd.* | | | 729,615 | |
| | 132,035 | | | Mylan N.V.* | | | 5,037,135 | |
| | 98,300 | | | MyoKardia, Inc.* | | | 1,272,985 | |
| | 147,299 | | | Nabriva Therapeutics AG ADR* | | | 876,429 | |
| | 103,660 | | | Ono Pharmaceutical Co., Ltd. | | | 2,259,230 | |
| | 66,289 | | | Revance Therapeutics, Inc.* | | | 1,372,182 | |
| | 41,670 | | | Shionogi & Co., Ltd. | | | 1,991,531 | |
| | 916,760 | | | Sino Biopharmaceutical Ltd. | | | 642,859 | |
| | 19,740 | | | Takeda Pharmaceutical Co., Ltd. | | | 818,934 | |
| | 39,887 | | | UCB S.A. | | | 2,552,008 | |
| | | | | | | | |
| | | | | | | 71,138,918 | |
| | | | | | | | |
| | |
| | | | Total Common Stocks
(cost $270,304,726) | | $ | 287,672,462 | |
| | | | | | | | |
| | |
| | | | Total Long-Term Investments
(cost $270,304,726) | | $ | 287,672,462 | |
| | | | | | | | |
The accompanying notes are an integral part of these financial statements.
|
| Hartford Healthcare HLS Fund |
Schedule of Investments – (continued)
December 31, 2016
| | | | | | | | |
Shares or Principal Amount | | Market Value† | |
| SHORT-TERM INVESTMENTS - 1.2% | |
| | | | Other Investment Pools & Funds - 1.2% | |
| | 3,587,569 | | | Fidelity Institutional Government Fund, Institutional Class | | $ | 3,587,569 | |
| | | | | | | | |
| | |
| | | | Total Short-Term Investments
(cost $3,587,569) | | $ | 3,587,569 | |
| | | | | | | | |
| | | | | | | | | | | | |
| | | |
| | | | Total Investments
(cost $273,892,295)^ | | | 100.2 | % | | $ | 291,260,031 | |
| | | | Other Assets and Liabilities | | | (0.2 | )% | | | (616,953 | ) |
| | | | | | | | | | | | |
| | | | Total Net Assets | | | 100.0 | % | | $ | 290,643,078 | |
| | | | | | | | | | | | |
The accompanying notes are an integral part of these financial statements.
|
| Hartford Healthcare HLS Fund |
Schedule of Investments – (continued)
December 31, 2016
| Note: | Percentage of investments as shown is the ratio of the total market value to total net assets. |
| | Prices of foreign equities that are principally traded on certain foreign markets will generally be adjusted daily pursuant to a fair value pricing service approved by the Board of Directors in order to reflect an adjustment for factors occurring after the close of certain foreign markets but before the close of the New York Stock Exchange. |
| | Equity industry classifications used in this report are the Global Industry Classification Standard, which was developed by and is the exclusive property and service mark of MSCI, Inc. and Standard & Poor’s. |
| | For Fund compliance purposes, the Fund may not use the same classification system shown in this report as these classifications are used for financial reporting purposes. |
| ^ | At December 31, 2016, the cost of securities for federal income tax purposes was $280,105,094 and the aggregate gross unrealized appreciation and depreciation based on that cost were: |
| | | | |
Unrealized Appreciation | | $ | 37,610,106 | |
Unrealized Depreciation | | | (26,455,169 | ) |
| | | | |
Net Unrealized Appreciation | | $ | 11,154,937 | |
| | | | |
| (1) | Securities issued within terms of a private placement memorandum and exempt from registration under Rule 144A under the Securities Act of 1933, as amended, and may be sold only to qualified institutional buyers. Unless otherwise indicated, these holdings are determined to be liquid. At December 31, 2016, the aggregate value of these securities was $1,386,404, which represents 0.5% of total net assets. |
| † | See Significant Accounting Policies of accompanying Notes to Financial Statements regarding valuation of investments. |
| | |
| GLOSSARY: (abbreviations used in preceding Schedule of Investments) |
|
| Other Abbreviations: |
ADR | | American Depositary Receipt |
The accompanying notes are an integral part of these financial statements.
|
| Hartford Healthcare HLS Fund |
Schedule of Investments – (continued)
December 31, 2016
Fair Valuation Summary
The following is a summary of the fair valuations according to the inputs used as of December 31, 2016 in valuing the Fund’s investments.
| | | | | | | | | | | | | | | | |
| | | Total | | | Level 1(1) | | | Level 2(1) | | | Level 3(1) | |
Assets | | | | | | | | | | | | | | | | |
Common Stocks | | | | | | | | | | | | | | | | |
Biotechnology | | $ | 69,702,244 | | | $ | 67,369,753 | | | $ | 2,332,491 | | | $ | — | |
Drug Retail | | | 1,123,467 | | | | 1,123,467 | | | | — | | | | — | |
Health Care Distributors | | | 9,215,732 | | | | 9,215,732 | | | | — | | | | — | |
Health Care Equipment | | | 71,293,925 | | | | 71,293,925 | | | | — | | | | — | |
Health Care Facilities | | | 10,250,715 | | | | 10,250,715 | | | | — | | | | — | |
Health Care Services | | | 3,788,460 | | | | 3,788,460 | | | | — | | | | — | |
Health Care Supplies | | | 2,905,951 | | | | 2,905,951 | | | | — | | | | — | |
Health Care Technology | | | 6,020,417 | | | | 6,020,417 | | | | — | | | | — | |
Life Sciences Tools & Services | | | 13,412,785 | | | | 13,412,785 | | | | — | | | | — | |
Managed Health Care | | | 28,819,848 | | | | 28,819,848 | | | | — | | | | — | |
Pharmaceuticals | | | 71,138,918 | | | | 58,427,848 | | | | 12,711,070 | | | | — | |
Short-Term Investments | | | 3,587,569 | | | | 3,587,569 | | | | — | | | | — | |
| | | | | | | | | | | | | | | | |
Total | | $ | 291,260,031 | | | $ | 276,216,470 | | | $ | 15,043,561 | | | $ | — | |
| | | | | | | | | | | | | | | | |
| (1) | For the year ended December 31, 2016, there were no transfers between any levels. |
The accompanying notes are an integral part of these financial statements.
|
| Hartford High Yield HLS Fund |
Schedule of Investments
December 31, 2016
| | | | | | | | | | | | |
Shares or Principal Amount | | Market Value† | |
| ASSET & COMMERCIAL MORTGAGE BACKED SECURITIES - 0.0% | |
| | | | | | | Asset-Backed-Finance & Insurance - 0.0% | |
| | $ | | | | 2,490,000 | | | Soundview NIM Trust
8.25%, 12/25/2036(1)(2)(3) | | $ | — | |
| | | | | | | | | | | | |
| | | |
| | | | | | | | Total Asset & Commercial Mortgage Backed Securities
(cost $2,478,959) | | $ | — | |
| | | | | | | | | | | | |
|
| CORPORATE BONDS - 91.7% | |
| | | | | | | Chemicals - 0.7% | | | |
| | | | | | | | Chemours Co. | | | | |
| | $ | | | | 1,645,000 | | | 6.63%, 05/15/2023 | | $ | 1,628,550 | |
| | | | | 305,000 | | | 7.00%, 05/15/2025 | | | 300,425 | |
| | | | | 335,000 | | | Platform Specialty Products Corp.
6.50%, 02/01/2022(1) | | | 337,513 | |
| | | | | | | | | | | | |
| | | | | | | | | | | 2,266,488 | |
| | | | | | | | | | | | |
| | | | | | | Coal - 0.3% | | | |
| | | | | 305,000 | | | Cloud Peak Energy Resources LLC / Cloud Peak Energy Finance Corp.
12.00%, 11/01/2021 | | | 317,200 | |
| | | | | 665,000 | | | Foresight Energy LLC / Foresight Energy Finance Corp.
(9% cash, 1% PIK) 10.00%, 08/15/2021(1)(4) | | | 648,375 | |
| | | | | | | | | | | | |
| | | | | | | | | | | 965,575 | |
| | | | | | | | | | | | |
| | | | | | | Commercial Banks - 5.5% | | | |
| | | | | | | | Banco Bilbao Vizcaya Argentaria S.A. | | | | |
| | EUR | | | | 2,600,000 | | | 7.00%, 02/19/2019(5)(6)(7) | | | 2,624,788 | |
| | | | | 400,000 | | | 8.88%, 04/14/2021(5)(6)(7) | | | 452,682 | |
| | | | | | | | Barclays plc | | | | |
| | $ | | | | 800,000 | | | 7.88%, 03/15/2022(5)(6)(7) | | | 810,000 | |
| | | | | 1,665,000 | | | 8.25%, 12/15/2018(5)(7) | | | 1,732,139 | |
| | | | | 1,080,000 | | | BNP Paribas S.A.
7.63%, 03/30/2021(1)(5)(7) | | | 1,139,508 | |
| | | | | 1,555,000 | | | CIT Group, Inc.
5.38%, 05/15/2020 | | | 1,652,188 | |
| | | | | 1,015,000 | | | Credit Agricole S.A.
7.88%, 01/23/2024(1)(5)(7) | | | 1,025,241 | |
| | | | | 2,055,000 | | | Credit Suisse Group AG
6.25%, 12/18/2024(5)(6)(7) | | | 1,999,926 | |
| | | | | 730,000 | | | Intesa Sanpaolo S.p.A.
7.70%, 09/17/2025(1)(5)(7) | | | 685,288 | |
| | | | | 1,675,000 | | | Radian Group, Inc.
7.00%, 03/15/2021 | | | 1,863,437 | |
| | | | | | | | Royal Bank of Scotland Group plc | | | | |
| | | | | 1,505,000 | | | 6.99%, 10/05/2017(1)(5)(7) | | | 1,621,638 | |
| | | | | 1,000,000 | | | 7.64%, 09/30/2017(5)(7) | | | 927,500 | |
| | | | | 385,000 | | | 8.63%, 08/15/2021(5)(7) | | | 392,700 | |
| | | | | 640,000 | | | Societe Generale S.A.
8.25%, 11/29/2018(5)(6)(7) | | | 665,638 | |
| | | | | | | | | | | | |
| | | | | | | | | | | 17,592,673 | |
| | | | | | | | | | | | |
| | | | | | | Commercial Services - 1.5% | | | |
| | | | | 1,035,000 | | | APX Group, Inc.
7.88%, 12/01/2022 | | | 1,120,387 | |
| | | | | 1,460,000 | | | Hertz Corp.
5.50%, 10/15/2024(1) | | | 1,275,675 | |
| | | | | 2,385,000 | | | Quad/Graphics, Inc.
7.00%, 05/01/2022 | | | 2,325,375 | |
| | | | | | | | | | | | |
| | | | | | | | | | | 4,721,437 | |
| | | | | | | | | | | | |
| | | | | | | | | | | | |
Shares or Principal Amount | | Market Value† | |
| CORPORATE BONDS - 91.7% - (continued) | |
| | | | | | | Construction Materials - 2.4% | | | |
| | $ | | | | 2,380,000 | | | Cemex Finance LLC
6.00%, 04/01/2024(1) | | $ | 2,445,450 | |
| | | | | 1,875,000 | | | Ply Gem Industries, Inc.
6.50%, 02/01/2022 | | | 1,935,937 | |
| | | | | 3,210,000 | | | Standard Industries, Inc.
5.38%, 11/15/2024(1) | | | 3,298,275 | |
| | | | | | | | | | | | |
| | | | | | | | | | | 7,679,662 | |
| | | | | | | | | | | | |
| | | | | | | Distribution/Wholesale - 0.2% | | | |
| | | | | 625,000 | | | American Builders & Contractors Supply Co., Inc.
5.75%, 12/15/2023(1) | | | 643,750 | |
| | | | | | | | | | | | |
| | | | | | | Diversified Financial Services - 3.0% | | | |
| | | | | 665,000 | | | FBM Finance, Inc.
8.25%, 08/15/2021(1) | | | 701,575 | |
| | | | | 665,000 | | | International Lease Finance Corp.
5.88%, 08/15/2022 | | | 721,525 | |
| | | | | 2,760,000 | | | Nationstar Mortgage LLC / Nationstar Capital Corp.
6.50%, 07/01/2021 | | | 2,794,500 | |
| | | | | | | | Navient Corp. | | | | |
| | | | | 305,000 | | | 5.50%, 01/25/2023 | | | 295,850 | |
| | | | | 335,000 | | | 5.88%, 10/25/2024 | | | 318,250 | |
| | | | | 1,510,000 | | | 6.13%, 03/25/2024 | | | 1,466,587 | |
| | | | | 280,000 | | | OneMain Financial Holdings LLC
6.75%, 12/15/2019(1) | | | 291,900 | |
| | | | | | | | Springleaf Finance Corp. | | | | |
| | | | | 490,000 | | | 5.25%, 12/15/2019 | | | 493,675 | |
| | | | | 675,000 | | | 7.75%, 10/01/2021 | | | 712,125 | |
| | | | | 1,730,000 | | | 8.25%, 12/15/2020 | | | 1,881,375 | |
| | | | | | | | | | | | |
| | | | | | | | | | | 9,677,362 | |
| | | | | | | | | | | | |
| | | | | | | Electric - 0.0% | | | |
| | | | | 415,000 | | | Texas Competitive Electric Holdings Co. LLC
11.50%, 10/01/2020(1)(2)(3)(8) | �� | | — | |
| | | | | | | | | | | | |
| | | | | | | Entertainment - 1.2% | | | |
| | | | | | | | GLP Capital L.P. / GLP Financing II, Inc. | | | | |
| | | | | 75,000 | | | 4.38%, 04/15/2021 | | | 77,813 | |
| | | | | 1,295,000 | | | 5.38%, 04/15/2026 | | | 1,350,555 | |
| | | | | 1,225,000 | | | Pinnacle Entertainment, Inc.
5.63%, 05/01/2024(1) | | | 1,228,062 | |
| | | | | 835,000 | | | Rivers Pittsburgh Borrower L.P. / Rivers Pittsburgh Finance Corp.
6.13%, 08/15/2021(1) | | | 853,788 | |
| | | | | 325,000 | | | WMG Acquisition Corp.
5.00%, 08/01/2023(1) | | | 326,625 | |
| | | | | | | | | | | | |
| | | | | | | | | | | 3,836,843 | |
| | | | | | | | | | | | |
| | | | | | | Environmental Control - 0.3% | | | |
| | | | | 835,000 | | | Clean Harbors, Inc.
5.13%, 06/01/2021 | | | 853,955 | |
| | | | | 160,000 | | | Tervita Escrow Corp.
7.63%, 12/01/2021(1) | | | 163,200 | |
| | | | | | | | | | | | |
| | | | | | | | | | | 1,017,155 | |
| | | | | | | | | | | | |
| | | | | | | Food - 1.7% | | | |
| | | | | 380,000 | | | Pinnacle Foods Finance LLC / Pinnacle Foods Finance Corp.
5.88%, 01/15/2024 | | | 402,800 | |
| | | | | 2,510,000 | | | Post Holdings, Inc.
5.00%, 08/15/2026(1) | | | 2,403,325 | |
The accompanying notes are an integral part of these financial statements.
|
| Hartford High Yield HLS Fund |
Schedule of Investments – (continued)
December 31, 2016
| | | | | | | | | | | | |
Shares or Principal Amount | | Market Value† | |
| CORPORATE BONDS - 91.7% - (continued) | |
| | | | | | | Food - 1.7% - (continued) | | | |
| | | | | | | | TreeHouse Foods, Inc. | | | | |
| | $ | | | | 2,045,000 | | | 4.88%, 03/15/2022 | | $ | 2,096,125 | |
| | | | | 660,000 | | | 6.00%, 02/15/2024(1) | | | 693,000 | |
| | | | | | | | | | | | |
| | | | | | | | | | | 5,595,250 | |
| | | | | | | | | | | | |
| | | | | | | Healthcare-Products - 2.3% | | | |
| | | | | | | | Alere, Inc. | | | | |
| | | | | 1,685,000 | | | 6.38%, 07/01/2023(1) | | | 1,674,469 | |
| | | | | 2,725,000 | | | 6.50%, 06/15/2020 | | | 2,684,125 | |
| | | | | 2,895,000 | | | Sterigenics-Nordion Holdings LLC
6.50%, 05/15/2023(1) | | | 2,945,662 | |
| | | | | | | | | | | | |
| | | | | | | | | | | 7,304,256 | |
| | | | | | | | | | | | |
| | | | | | | Healthcare-Services - 6.9% | |
| | | | | 1,890,000 | | | Amsurg Corp.
5.63%, 07/15/2022 | | | 1,948,590 | |
| | | | | | | | Community Health Systems, Inc. | | | | |
| | | | | 261,000 | | | 5.13%, 08/15/2018 | | | 255,780 | |
| | | | | 4,305,000 | | | 6.88%, 02/01/2022 | | | 2,991,975 | |
| | | | | 1,565,000 | | | 7.13%, 07/15/2020 | | | 1,189,869 | |
| | | | | 1,040,000 | | | Envision Healthcare Corp.
5.13%, 07/01/2022(1) | | | 1,036,100 | |
| | | | | 1,835,000 | | | HCA Holdings, Inc.
6.25%, 02/15/2021 | | | 1,974,919 | |
| | | | | | | | HCA, Inc. | | | | |
| | | | | 1,340,000 | | | 5.25%, 06/15/2026 | | | 1,385,225 | |
| | | | | 1,085,000 | | | 5.38%, 02/01/2025 | | | 1,087,713 | |
| | | | | 2,104,000 | | | 7.50%, 11/15/2095 | | | 2,014,580 | |
| | | | | 535,000 | | | inVentiv Health, Inc.
9.00%, 01/15/2018(1) | | | 536,070 | |
| | | | | 830,000 | | | LifePoint Health, Inc.
5.88%, 12/01/2023 | | | 840,375 | |
| | | | | 945,000 | | | MEDNAX, Inc.
5.25%, 12/01/2023(1) | | | 973,350 | |
| | | | | 350,000 | | | MPH Acquisition Holdings LLC
7.13%, 06/01/2024(1) | | | 368,410 | |
| | | | | | | | Tenet Healthcare Corp. | |
| | | | | 3,305,000 | | | 5.00%, 03/01/2019 | | | 3,222,375 | |
| | | | | 500,000 | | | 6.75%, 06/15/2023 | | | 441,250 | |
| | | | | 1,955,000 | | | 8.13%, 04/01/2022 | | | 1,844,542 | |
| | | | | | | | | | | | |
| | | | | | | | | | | 22,111,123 | |
| | | | | | | | | | | | |
| | | | | | | Home Builders - 2.1% | |
| | | | | 1,120,000 | | | Beazer Homes USA, Inc.
8.75%, 03/15/2022(1) | | | 1,209,600 | |
| | | | | 2,930,000 | | | KB Home
8.00%, 03/15/2020 | | | 3,223,000 | |
| | | | | 2,115,000 | | | M/I Homes, Inc.
6.75%, 01/15/2021 | | | 2,204,887 | |
| | | | | | | | | | | | |
| | | | | | | | | | | 6,637,487 | |
| | | | | | | | | | | | |
| | | | | | | Household Products - 1.0% | |
| | | | | 1,255,000 | | | Avon International Operations, Inc.
7.88%, 08/15/2022(1) | | | 1,327,163 | |
| | | | | 1,760,000 | | | Revlon Consumer Products Corp.
6.25%, 08/01/2024 | | | 1,804,000 | |
| | | | | | | | | | | | |
| | | | | | | | | | | 3,131,163 | |
| | | | | | | | | | | | |
| | | | | | | Household Products/Wares - 0.2% | |
| | | | | 615,000 | | | ACCO Brands Corp.
5.25%, 12/15/2024(1) | | | 619,231 | |
| | | | | | | | | | | | |
| | | | | | | | | | | | |
Shares or Principal Amount | | Market Value† | |
| CORPORATE BONDS - 91.7% - (continued) | |
| | | | | | | Insurance - 0.1% | |
| | $ | | | | 415,000 | | | MGIC Investment Corp.
5.75%, 08/15/2023 | | $ | 432,638 | |
| | | | | | | | | | | | |
| | | | | | | Internet - 1.9% | |
| | | | | 2,905,000 | | | Netflix, Inc.
5.88%, 02/15/2025 | | | 3,133,769 | |
| | | | | | | | Zayo Group LLC / Zayo Capital, Inc. | |
| | | | | 2,145,000 | | | 6.00%, 04/01/2023 | | | 2,230,800 | |
| | | | | 605,000 | | | 6.38%, 05/15/2025 | | | 632,225 | |
| | | | | | | | | | | | |
| | | | | | | | | | | 5,996,794 | |
| | | | | | | | | | | | |
| | | | | | | Iron/Steel - 2.6% | |
| | | | | | | | AK Steel Corp. | | | | |
| | | | | 760,000 | | | 7.63%, 05/15/2020 | | | 775,200 | |
| | | | | 1,015,000 | | | 7.63%, 10/01/2021 | | | 1,089,856 | |
| | | | | 840,000 | | | 8.38%, 04/01/2022 | | | 884,100 | |
| | | | | 705,000 | | | ArcelorMittal
7.25%, 02/25/2022 | | | 794,887 | |
| | | | | 650,000 | | | Signode Industrial Group U.S., Inc.
6.38%, 05/01/2022(1) | | | 648,375 | |
| | | | | 1,130,000 | | | Steel Dynamics, Inc.
5.50%, 10/01/2024 | | | 1,197,800 | |
| | | | | | | | United States Steel Corp. | | | | |
| | | | | 191,000 | | | 6.88%, 04/01/2021 | | | 192,910 | |
| | | | | 499,000 | | | 7.38%, 04/01/2020 | | | 535,178 | |
| | | | | 315,000 | | | 7.50%, 03/15/2022 | | | 325,238 | |
| | | | | 1,645,000 | | | 8.38%, 07/01/2021(1) | | | 1,818,597 | |
| | | | | | | | | | | | |
| | | | | | | | | | | 8,262,141 | |
| | | | | | | | | | | | |
| | | | | | | IT Services - 0.5% | |
| | | | | 1,480,000 | | | Conduent Finance, Inc. / Xerox Business Services LLC
10.50%, 12/15/2024(1) | | | 1,583,600 | |
| | | | | | | | | | | | |
| | | | | | | Lodging - 1.2% | |
| | | | | 920,000 | | | Boyd Gaming Corp.
6.38%, 04/01/2026(1) | | | 990,840 | |
| | | | | 1,210,000 | | | FelCor Lodging L.P.
6.00%, 06/01/2025 | | | 1,258,400 | |
| | | | | 1,630,000 | | | Jack Ohio Finance LLC / Jack Ohio Finance Corp.
6.75%, 11/15/2021(1) | | | 1,650,375 | |
| | | | | | | | | | | | |
| | | | | | | | | | | 3,899,615 | |
| | | | | | | | | | | | |
| | | | | | | Machinery-Diversified - 0.7% | |
| | | | | 1,705,000 | | | Cloud Crane LLC
10.13%, 08/01/2024(1) | | | 1,824,350 | |
| | | | | 536,000 | | | Gardner Denver, Inc.
6.88%, 08/15/2021(1) | | | 533,320 | |
| | | | | | | | | | | | |
| | | | | | | | | | | 2,357,670 | |
| | | | | | | | | | | | |
| | | | | | | Media - 10.6% | |
| | | | | 635,000 | | | CBS Radio, Inc.
7.25%, 11/01/2024(1) | | | 666,750 | |
| | | | | | | | CCO Holdings LLC / CCO Holdings Capital Corp. | |
| | | | | 120,000 | | | 5.13%, 02/15/2023 | | | 123,300 | |
| | | | | 245,000 | | | 5.13%, 05/01/2023(1) | | | 252,350 | |
| | | | | 95,000 | | | 5.25%, 09/30/2022 | | | 98,325 | |
| | | | | 545,000 | | | 5.75%, 09/01/2023 | | | 569,525 | |
| | | | | 105,000 | | | 5.75%, 01/15/2024 | | | 109,725 | |
| | | | | 1,355,000 | | | 5.75%, 02/15/2026(1) | | | 1,402,425 | |
| | | | | 3,675,000 | | | Cequel Communications Holdings I LLC / Cequel Capital Corp.
5.13%, 12/15/2021(1) | | | 3,739,313 | |
The accompanying notes are an integral part of these financial statements.
|
| Hartford High Yield HLS Fund |
Schedule of Investments – (continued)
December 31, 2016
| | | | | | | | | | | | |
Shares or Principal Amount | | Market Value† | |
| CORPORATE BONDS - 91.7% - (continued) | |
| | | | | | | Media - 10.6% - (continued) | |
| | $ | | | | 520,000 | | | Clear Channel Worldwide Holdings, Inc.
7.63%, 03/15/2020 | | $ | 519,672 | |
| | | | | | | | CSC Holdings LLC | |
| | | | | 1,560,000 | | | 5.25%, 06/01/2024 | | | 1,524,900 | |
| | | | | 760,000 | | | 10.13%, 01/15/2023(1) | | | 877,800 | |
| | | | | 750,000 | | | 10.88%, 10/15/2025(1) | | | 892,500 | |
| | | | | | | | DISH DBS Corp. | |
| | | | | 2,170,000 | | | 5.00%, 03/15/2023 | | | 2,159,150 | |
| | | | | 1,095,000 | | | 5.88%, 07/15/2022 | | | 1,152,487 | |
| | | | | 945,000 | | | 6.75%, 06/01/2021 | | | 1,025,325 | |
| | | | | 1,191,000 | | | 7.88%, 09/01/2019 | | | 1,322,010 | |
| | | | | | | | Gray Television, Inc. | |
| | | | | 515,000 | | | 5.13%, 10/15/2024(1) | | | 498,263 | |
| | | | | 380,000 | | | 5.88%, 07/15/2026(1) | | | 377,150 | |
| | | | | 2,625,000 | | | Liberty Interactive LLC
8.25%, 02/01/2030 | | | 2,795,625 | |
| | | | | 1,130,000 | | | NBCUniversal Enterprise, Inc.
5.25%, 03/19/2021(1)(5) | | | 1,186,500 | |
| | | | | 2,370,000 | | | SFR Group S.A.
7.38%, 05/01/2026(1) | | | 2,429,250 | |
| | | | | | | | Sinclair Television Group, Inc. | |
| | | | | 520,000 | | | 5.13%, 02/15/2027(1) | | | 494,000 | |
| | | | | 1,055,000 | | | 5.88%, 03/15/2026(1) | | | 1,057,637 | |
| | | | | | | | TEGNA, Inc. | |
| | | | | 1,515,000 | | | 4.88%, 09/15/2021(1) | | | 1,541,512 | |
| | | | | 2,865,000 | | | 5.13%, 10/15/2019 | | | 2,940,206 | |
| | | | | 750,000 | | | 6.38%, 10/15/2023 | | | 793,613 | |
| | | | | 3,495,000 | | | Tribune Media Co.
5.88%, 07/15/2022 | | | 3,551,794 | |
| | | | | | | | | | | | |
| | | | 34,101,107 | |
| | | | | | | | | | | | |
| | | | Metal Fabricate/Hardware - 0.5% | |
| | | | Novelis Corp. | |
| | | | | 605,000 | | | 5.88%, 09/30/2026(1) | | | 611,050 | |
| | | | | 1,115,000 | | | 6.25%, 08/15/2024(1) | | | 1,181,900 | |
| | | | | | | | | | | | |
| | | | 1,792,950 | |
| | | | | | | | | | | | |
| | | | Mining - 2.0% | |
| | | | Anglo American Capital plc | |
| | | | | 260,000 | | | 4.13%, 04/15/2021(1) | | | 264,550 | |
| | | | | 1,330,000 | | | 4.88%, 05/14/2025(1) | | | 1,348,287 | |
| | | | | 395,000 | | | 9.38%, 04/08/2019(1) | | | 451,288 | |
| | | | | 1,345,000 | | | Constellium N.V.
7.88%, 04/01/2021(1) | | | 1,445,875 | |
| | | | | 1,290,000 | | | Kaiser Aluminum Corp.
5.88%, 05/15/2024 | | | 1,335,150 | |
| | | | | 105,000 | | | New Gold, Inc.
6.25%, 11/15/2022(1) | | | 107,625 | |
| | | | Teck Resources Ltd. | |
| | | | | 465,000 | | | 8.00%, 06/01/2021(1) | | | 511,500 | |
| | | | | 970,000 | | | 8.50%, 06/01/2024(1) | | | 1,117,925 | |
| | | | | | | | | | | | |
| | | | 6,582,200 | |
| | | | | | | | | | | | |
| | | | Miscellaneous Manufacturing - 0.8% | |
| | | | | 2,665,000 | | | Bombardier, Inc.
6.13%, 01/15/2023(1) | | | 2,540,811 | |
| | | | | | | | | | | | |
| | | | Office/Business Equipment - 0.6% | |
| | | | CDW LLC / CDW Finance Corp. | |
| | | | | 885,000 | | | 5.00%, 09/01/2023 | | | 886,106 | |
| | | | | 970,000 | | | 5.50%, 12/01/2024 | | | 991,825 | |
| | | | | | | | | | | | |
| | | | 1,877,931 | |
| | | | | | | | | | | | |
| | | | | | | | | | | | |
Shares or Principal Amount | | Market Value† | |
| CORPORATE BONDS - 91.7% - (continued) | |
| | | | Oil & Gas - 13.4% | |
| | | | Anadarko Petroleum Corp. | |
| | $ | | | | 130,000 | | | 4.85%, 03/15/2021 | | $ | 139,391 | |
| | | | | 90,000 | | | 5.55%, 03/15/2026 | | | 100,733 | |
| | | | Antero Resources Corp. | |
| | | | | 810,000 | | | 5.63%, 06/01/2023 | | | 829,237 | |
| | | | | 1,470,000 | | | 6.00%, 12/01/2020 | | | 1,514,100 | |
| | | | | 2,120,000 | | | Blue Racer Midstream LLC / Blue Racer Finance Corp.
6.13%, 11/15/2022(1) | | | 2,120,000 | |
| | | | | 3,720,000 | | | California Resources Corp.
8.00%, 12/15/2022(1) | | | 3,310,800 | |
| | | | | 345,000 | | | Callon Petroleum Co.
6.13%, 10/01/2024(1) | | | 355,350 | |
| | | | Concho Resources, Inc. | |
| | | | | 1,910,000 | | | 5.50%, 10/01/2022 | | | 1,979,237 | |
| | | | | 325,000 | | | 5.50%, 04/01/2023 | | | 336,798 | |
| | | | Continental Resources, Inc. | |
| | | | | 475,000 | | | 3.80%, 06/01/2024 | | | 438,188 | |
| | | | | 265,000 | | | 4.50%, 04/15/2023 | | | 259,700 | |
| | | | | 2,015,000 | | | 4.90%, 06/01/2044 | | | 1,722,825 | |
| | | | | 1,005,000 | | | 5.00%, 09/15/2022 | | | 1,014,437 | |
| | | | | 2,100,000 | | | Denbury Resources, Inc.
9.00%, 05/15/2021(1) | | | 2,273,250 | |
| | | | | 190,000 | | | Diamondback Energy, Inc.
4.75%, 11/01/2024(1) | | | 186,200 | |
| | | | | 1,430,000 | | | Energen Corp.
4.63%, 09/01/2021 | | | 1,433,575 | |
| | | | | 1,540,000 | | | Ensco plc
5.75%, 10/01/2044 | | | 1,116,500 | |
| | | | Laredo Petroleum, Inc. | |
| | | | | 740,000 | | | 5.63%, 01/15/2022 | | | 745,550 | |
| | | | | 1,360,000 | | | 6.25%, 03/15/2023 | | | 1,407,600 | |
| | | | | 670,000 | | | 7.38%, 05/01/2022 | | | 694,288 | |
| | | | Matador Resources Co. | |
| | | | | 315,000 | | | 6.88%, 04/15/2023(1) | | | 330,750 | |
| | | | | 1,320,000 | | | 6.88%, 04/15/2023 | | | 1,386,000 | |
| | | | MEG Energy Corp. | |
| | | | | 900,000 | | | 6.38%, 01/30/2023(1) | | | 801,000 | |
| | | | | 1,545,000 | | | 7.00%, 03/31/2024(1) | | | 1,398,225 | |
| | | | Noble Holding International Ltd. | |
| | | | | 1,230,000 | | | 6.20%, 08/01/2040 | | | 879,450 | |
| | | | | 1,220,000 | | | 7.75%, 01/15/2024 | | | 1,147,532 | |
| | | | | 390,000 | | | PDC Energy, Inc.
6.13%, 09/15/2024(1) | | | 398,775 | |
| | | | QEP Resources, Inc. | |
| | | | | 2,185,000 | | | 5.25%, 05/01/2023 | | | 2,190,462 | |
| | | | | 205,000 | | | 5.38%, 10/01/2022 | | | 205,513 | |
| | | | | 245,000 | | | 6.80%, 03/01/2020 | | | 254,800 | |
| | | | Rice Energy, Inc. | |
| | | | | 635,000 | | | 6.25%, 05/01/2022 | | | 652,463 | |
| | | | | 515,000 | | | 7.25%, 05/01/2023 | | | 545,900 | |
| | | | | 870,000 | | | Rowan Cos., Inc.
5.85%, 01/15/2044 | | | 674,250 | |
| | | | | 1,140,000 | | | RSP Permian, Inc.
6.63%, 10/01/2022 | | | 1,205,550 | |
| | | | SM Energy Co. | |
| | | | | 1,755,000 | | | 5.00%, 01/15/2024 | | | 1,654,087 | |
| | | | | 15,000 | | | 5.63%, 06/01/2025 | | | 14,475 | |
| | | | | 240,000 | | | 6.13%, 11/15/2022 | | | 243,000 | |
| | | | | 115,000 | | | 6.50%, 11/15/2021 | | | 117,300 | |
| | | | | 150,000 | | | 6.75%, 09/15/2026 | | | 154,500 | |
The accompanying notes are an integral part of these financial statements.
|
| Hartford High Yield HLS Fund |
Schedule of Investments – (continued)
December 31, 2016
| | | | | | | | | | | | |
Shares or Principal Amount | | Market Value† | |
| CORPORATE BONDS - 91.7% - (continued) | |
| | | | Oil & Gas - 13.4% - (continued) | |
| | | | Transocean, Inc. | |
| | $ | | | | 355,000 | | | 6.80%, 03/15/2038 | | $ | 275,125 | |
| | | | | 110,000 | | | 7.50%, 04/15/2031 | | | 92,950 | |
| | | | | 435,000 | | | 9.10%, 12/15/2041 | | | 393,675 | |
| | | | Tullow Oil plc | |
| | | | | 1,015,000 | | | 6.00%, 11/01/2020(1) | | | 966,787 | |
| | | | | 1,755,000 | | | 6.25%, 04/15/2022(1) | | | 1,632,150 | |
| | | | WPX Energy, Inc. | |
| | | | | 2,000,000 | | | 5.25%, 09/15/2024 | | | 1,940,000 | |
| | | | | 1,420,000 | | | 6.00%, 01/15/2022 | | | 1,455,500 | |
| | | | | 295,000 | | | 8.25%, 08/01/2023 | | | 329,663 | |
| | | | | | | | | | | | |
| | | | 43,317,641 | |
| | | | | | | | | | | | |
| | | | Oil & Gas Services - 0.1% | |
| | | | Weatherford International Ltd. | |
| | | | | 250,000 | | | 5.95%, 04/15/2042 | | | 188,750 | |
| | | | | 100,000 | | | 6.50%, 08/01/2036 | | | 80,250 | |
| | | | | 250,000 | | | 7.00%, 03/15/2038 | | | 208,125 | |
| | | | | | | | | | | | |
| | | | 477,125 | |
| | | | | | | | | | | | |
| | | | Packaging & Containers - 4.5% | |
| | | | | 1,700,000 | | | ARD Finance S.A.
(cash) 7.13%, 09/15/2023(1)(4) | | | 1,678,750 | |
| | | | Ardagh Packaging Finance plc / Ardagh Holdings USA, Inc. | |
| | | | | 2,065,000 | | | 6.00%, 06/30/2021(1) | | | 2,101,137 | |
| | | | | 550,000 | | | 6.75%, 01/31/2021(1) | | | 566,500 | |
| | | | | 305,000 | | | 7.25%, 05/15/2024(1) | | | 321,394 | |
| | EUR | | | | 315,000 | | | Ball Corp.
3.50%, 12/15/2020 | | | 366,242 | |
| | $ | | | | 2,060,000 | | | Berry Plastics Corp.
6.00%, 10/15/2022 | | | 2,178,450 | |
| | | | Owens-Brockway Glass Container, Inc. | |
| | | | | 1,795,000 | | | 5.88%, 08/15/2023(1) | | | 1,871,288 | |
| | | | | 2,215,000 | | | 6.38%, 08/15/2025(1) | | | 2,336,825 | |
| | | | Reynolds Group Issuer, Inc. | |
| | | | | 2,070,000 | | | 5.13%, 07/15/2023(1) | | | 2,113,987 | |
| | | | | 805,000 | | | 7.00%, 07/15/2024(1) | | | 855,816 | |
| | | | | 156,057 | | | 8.25%, 02/15/2021 | | | 161,129 | |
| | | | | | | | | | | | |
| | | | | | | | 14,551,518 | |
| | | | | | | | | | | | |
| | | | | | | Pharmaceuticals - 4.3% | |
| | | | | | | | Endo Finance LLC | |
| | | | | 1,161,000 | | | 6.00%, 07/15/2023(1) | | | 1,017,326 | |
| | | | | 3,075,000 | | | 6.50%, 02/01/2025(1) | | | 2,575,312 | |
| | | | | 1,908,000 | | | PRA Holdings, Inc.
9.50%, 10/01/2023(1) | | | 2,089,260 | |
| | | | | 2,050,000 | | | Quintiles IMS, Inc.
4.88%, 05/15/2023(1) | | | 2,080,750 | |
| | | | | | | | Valeant Pharmaceuticals International, Inc. | |
| | | | | 1,320,000 | | | 5.50%, 03/01/2023(1) | | | 990,000 | |
| | | | | 4,930,000 | | | 5.88%, 05/15/2023(1) | | | 3,722,150 | |
| | | | | 1,230,000 | | | 6.13%, 04/15/2025(1) | | | 924,038 | |
| | | | | 445,000 | | | Vizient, Inc.
10.38%, 03/01/2024(1) | | | 503,963 | |
| | | | | | | | | | | | |
| | | | | | | | 13,902,799 | |
| | | | | | | | | | | | |
| | | | | | | Pipelines - 1.5% | |
| | | | | | | | Energy Transfer Equity L.P. | |
| | | | | 1,615,000 | | | 5.50%, 06/01/2027 | | | 1,574,625 | |
| | | | | 1,773,000 | | | 7.50%, 10/15/2020 | | | 1,976,895 | |
| | | | | | | | | | | | |
Shares or Principal Amount | | Market Value† | |
| CORPORATE BONDS - 91.7% - (continued) | |
| | | | | | | Pipelines - 1.5% - (continued) | |
| | $ | | | | 1,100,000 | | | Targa Resources Partners L.P. / Targa Resources Partners Finance Corp.
6.75%, 03/15/2024 | | $ | 1,179,750 | |
| | | | | | | | | | | | |
| | | | | | | | 4,731,270 | |
| | | | | | | | | | | | |
| | | | | | | REITS - 0.4% | |
| | | | | 1,110,000 | | | Equinix, Inc.
5.88%, 01/15/2026 | | | 1,168,275 | |
| | | | | | | | | | | | |
| | | | | | | Retail - 2.3% | |
| | | | | 1,945,000 | | | CEC Entertainment, Inc.
8.00%, 02/15/2022 | | | 1,983,900 | |
| | | | | 1,480,000 | | | L Brands, Inc.
6.88%, 11/01/2035 | | | 1,509,600 | |
| | | | | 2,315,000 | | | Michaels Stores, Inc.
5.88%, 12/15/2020(1) | | | 2,384,450 | |
| | | | | 1,440,000 | | | Party City Holdings, Inc.
6.13%, 08/15/2023(1) | | | 1,504,800 | |
| | | | | | | | | | | | |
| | | | | | | | 7,382,750 | |
| | | | | | | | | | | | |
| | | | | | | Semiconductors - 1.8% | |
| | | | | 1,625,000 | | | Entegris, Inc.
6.00%, 04/01/2022(1) | | | 1,690,000 | |
| | | | | 1,865,000 | | | Micron Technology, Inc.
5.50%, 02/01/2025 | | | 1,855,675 | |
| | | | | | | | Sensata Technologies B.V. | |
| | | | | 1,221,000 | | | 5.00%, 10/01/2025(1) | | | 1,196,580 | |
| | | | | 900,000 | | | 5.63%, 11/01/2024(1) | | | 938,250 | |
| | | | | | | | | | | | |
| | | | | | | | 5,680,505 | |
| | | | | | | | | | | | |
| | | | | | | Software - 4.2% | |
| | | | | 1,060,000 | | | Camelot Finance S.A.
7.88%, 10/15/2024(1) | | | 1,097,100 | |
| | | | | | | | Change Healthcare Holdings, Inc. | |
| | | | | 1,140,000 | | | 6.00%, 02/15/2021(1) | | | 1,191,300 | |
| | | | | 1,640,000 | | | 11.00%, 12/31/2019 | | | 1,693,300 | |
| | | | | | | | First Data Corp. | |
| | | | | 1,425,000 | | | 5.38%, 08/15/2023(1) | | | 1,478,437 | |
| | | | | 2,391,000 | | | 5.75%, 01/15/2024(1) | | | 2,467,225 | |
| | | | | 1,580,000 | | | 7.00%, 12/01/2023(1) | | | 1,682,700 | |
| | | | | 684,000 | | | Infor Software Parent LLC
(cash) 7.13%, 05/01/2021(1)(4) | | | 704,520 | |
| | | | | 2,075,000 | | | Infor US, Inc.
6.50%, 05/15/2022 | | | 2,163,187 | |
| | | | | 625,000 | | | MSCI, Inc.
5.75%, 08/15/2025(1) | | | 664,063 | |
| | | | | 445,000 | | | RP Crown Parent LLC
7.38%, 10/15/2024(1) | | | 461,688 | |
| | | | | | | | | | | | |
| | | | | | | | 13,603,520 | |
| | | | | | | | | | | | |
| | | | | | | Telecommunications - 8.4% | |
| | | | | | | | Alcatel-Lucent USA, Inc. | |
| | | | | 2,681,000 | | | 6.45%, 03/15/2029 | | | 2,794,942 | |
| | | | | 765,000 | | | 6.50%, 01/15/2028 | | | 789,863 | |
| | | | | | | | Altice Financing S.A. | |
| | | | | 485,000 | | | 6.50%, 01/15/2022(1) | | | 505,613 | |
| | | | | 380,000 | | | 6.63%, 02/15/2023(1) | | | 390,450 | |
| | | | | 2,840,000 | | | 7.50%, 05/15/2026(1) | | | 2,953,600 | |
| | | | | | | | Frontier Communications Corp. | |
| | | | | 840,000 | | | 10.50%, 09/15/2022 | | | 883,092 | |
| | | | | 1,085,000 | | | 11.00%, 09/15/2025 | | | 1,120,263 | |
| | | | | | | | Level 3 Financing, Inc. | |
| | | | | 970,000 | | | 5.13%, 05/01/2023 | | | 973,638 | |
The accompanying notes are an integral part of these financial statements.
|
| Hartford High Yield HLS Fund |
Schedule of Investments – (continued)
December 31, 2016
| | | | | | | | | | | | |
Shares or Principal Amount | | Market Value† | |
| CORPORATE BONDS - 91.7% - (continued) | |
| | | | | | | Telecommunications - 8.4% - (continued) | |
| | | | | | | | Level 3 Financing, Inc. - (continued) | | | | |
| | $ | | | | 1,080,000 | | | 5.25%, 03/15/2026(1) | | $ | 1,069,200 | |
| | | | | 2,515,000 | | | 5.38%, 08/15/2022 | | | 2,596,737 | |
| | | | | 920,000 | | | 5.63%, 02/01/2023 | | | 943,000 | |
| | | | | | | | Sprint Communications, Inc. | |
| | | | | 507,000 | | | 7.00%, 03/01/2020(1) | | | 550,095 | |
| | | | | 3,092,000 | | | 9.00%, 11/15/2018(1) | | | 3,408,930 | |
| | | | | | | | Sprint Corp. | |
| | | | | 100,000 | | | 7.13%, 06/15/2024 | | | 103,000 | |
| | | | | 2,495,000 | | | 7.25%, 09/15/2021 | | | 2,650,937 | |
| | | | | 2,005,000 | | | 7.88%, 09/15/2023 | | | 2,140,337 | |
| | | | | 1,600,000 | | | T-Mobile USA, Inc.
6.46%, 04/28/2019 | | | 1,628,000 | |
| | | | | | | | Wind Acquisition Finance S.A. | |
| | EUR | | | | 1,395,000 | | | 4.00%, 07/15/2020(1) | | | 1,495,423 | |
| | $ | | | | 215,000 | | | 6.50%, 04/30/2020(1) | | | 223,600 | |
| | | | | | | | | | | | |
| | | | | | | | 27,220,720 | |
| | | | | | | | | | | | |
| | | |
| | | | | | | | Total Corporate Bonds
(cost $288,789,405) | | $ | 295,263,035 | |
| | | | | | | | | | | | |
|
| SENIOR FLOATING RATE INTERESTS - 0.8%(9) | |
| | | | | | | Insurance - 0.2% | |
| | $ | | | | 550,000 | | | Asurion LLC
8.50%, 03/03/2021 | | $ | 558,596 | |
| | | | | | | | | | | | |
| | | | | | | Internet - 0.3% | |
| | | | | 1,273,091 | | | Lands’ End, Inc.
4.25%, 04/04/2021 | | | 950,579 | |
| | | | | | | | | | | | |
| | | | | | | Machinery-Diversified - 0.3% | |
| | | | | 969,653 | | | Gardner Denver, Inc.
4.57%, 07/30/2020 | | | 958,968 | |
| | | | | | | | | | | | |
| | | |
| | | | | | | | Total Senior Floating Rate Interests
(cost $2,773,280) | | $ | 2,468,143 | |
| | | | | | | | | | | | |
|
| CONVERTIBLE BONDS - 1.0% | |
| | | | | | | Home Builders - 0.2% | |
| | $ | | | | 566,000 | | | M/I Homes, Inc.
3.00%, 03/01/2018 | | $ | 576,613 | |
| | | | | | | | | | | | |
| | | | | | | Insurance - 0.3% | |
| | | | | 680,000 | | | MGIC Investment Corp.
2.00%, 04/01/2020 | | | 1,008,100 | |
| | | | | | | | | | | | |
| | | | | | | Internet - 0.3% | |
| | | | | 790,000 | | | Zillow Group, Inc.
2.00%, 12/01/2021(1) | | | 811,231 | |
| | | | | | | | | | | | |
| | | | | | | Oil & Gas - 0.2% | |
| | | | | 1,790,000 | | | Cobalt International Energy, Inc.
2.63%, 12/01/2019 | | | 702,575 | |
| | | | | | | | | | | | |
| | | |
| | | | | | | | Total Convertible Bonds
(cost $4,065,260) | | $ | 3,098,519 | |
| | | | | | | | | |
|
| COMMON STOCKS - 1.4% | |
| | | | | | | Energy - 0.8% | | | |
| | | | | 206,275,142 | | | KCA Deutag*(1)(3)(8) | | $ | 2,652,079 | |
| | | | | | | | | | | | |
| | | | | | | Pharmaceuticals, Biotechnology & Life Sciences - 0.2% | |
| | | | | 33,000 | | | Endo International plc* | | | 543,510 | |
| | | | | | | | | | | | |
| | | | | | | | | | | | |
Shares or Principal Amount | | Market Value† | |
| COMMON STOCKS - 1.4% - (continued) | |
| | | | | | | Utilities - 0.4% | | | |
| | | | | 4,525,000 | | | TCEH Corp.*(3)(8) | | $ | 5 | |
| | | | | 82,554 | | | Vistra Energy Corp. | | | 1,279,587 | |
| | | | | | | | | | | | |
| | | | | | | | | | | 1,279,592 | |
| | | | | | | | | | | | |
| | | |
| | | | | | | | Total Common Stocks
(cost $5,093,571) | | $ | 4,475,181 | |
| | | | | | | | | | | | |
| | | |
| | | | | | | | Total Long-Term Investments
(cost $303,200,475) | | $ | 305,304,878 | |
| | | | | | | | | | | | |
|
| SHORT-TERM INVESTMENTS - 3.6% | |
| | | | | | | Other Investment Pools & Funds - 3.6% | | | |
| | | | | 11,751,273 | | | Fidelity Institutional Government Fund, Institutional Class | | $ | 11,751,273 | |
| | | | | | | | | | | | |
| | | |
| | | | | | | | Total Short-Term Investments
(cost $11,751,273) | | $ | 11,751,273 | |
| | | | | | | | | | | | |
| | | | | | | | | | | | | | |
| | | | | | | | | | | |
| | | | |
| | | | | | Total Investments
(cost $314,951,748)^ | | | 98.5 | % | | $ | 317,056,151 | |
| | | | | | Other Assets and Liabilities | | | 1.5 | % | | | 4,728,843 | |
| | | | | | | | | | | | | | |
| | | | | | Total Net Assets | | | 100.0 | % | | $ | 321,784,994 | |
| | | | | | | | | | | | | | |
The accompanying notes are an integral part of these financial statements.
|
| Hartford High Yield HLS Fund |
Schedule of Investments – (continued)
December 31, 2016
| Note: | Percentage of investments as shown is the ratio of the total market value to total net assets. |
| | The Fund may refer to any one or more of the industry classifications used by one or more widely recognized market indices, ratings group indices and/or as defined by Fund management. Industry classifications may not be identical across all security types. |
| | Equity Industry classifications used in this report are the Global Industry Classification Standard, which was developed by and is the exclusive property and service mark of MSCI, Inc. and Standard & Poor’s. |
| | For Fund compliance purposes, the Fund may not use the same classification system shown in this report as these classifications are used for financial reporting purposes. |
| ^ | At December 31, 2016, the cost of securities for federal income tax purposes was $315,099,797 and the aggregate gross unrealized appreciation and depreciation based on that cost were: |
| | | | |
Unrealized Appreciation | | $ | 12,468,593 | |
Unrealized Depreciation | | | (10,512,239 | ) |
| | | | |
Net Unrealized Appreciation | | $ | 1,956,354 | |
| | | | |
| (1) | Securities issued within terms of a private placement memorandum and exempt from registration under Rule 144A under the Securities Act of 1933, as amended, and may be sold only to qualified institutional buyers. Unless otherwise indicated, these holdings are determined to be liquid. At December 31, 2016, the aggregate value of these securities was $135,561,078, which represents 42.1% of total net assets. |
| (2) | Non-income producing. For long-term debt securities, items identified are in default as to payment of interest and/or principal. |
| (3) | These securities are valued in good faith at fair value as determined under policies and procedures established by and under the supervision of the Board of Directors. At December 31, 2016, the aggregate fair value of these securities was $2,652,084, which represents 0.8% of total net assets. This amount excludes securities that are principally traded in certain foreign markets and whose prices are adjusted pursuant to a third party pricing service methodology approved by the Board of Directors. |
| (4) | Security has the ability to pay in kind (“PIK”) or pay income in cash. When applicable, separate rates of such payments are disclosed. |
| (5) | Perpetual maturity security. Maturity date shown is the next call date or final legal maturity date, whichever comes first. |
| (6) | These securities were sold to the Fund under Regulation S, rules governing offers and sales made outside the United States without registration under the Securities Act of 1933, as amended. The Fund may only be able to resell these securities in the United States if an exemption from registration under the federal and state securities laws is available, or the Fund may only be able to sell these securities outside of the United States (such as on a foreign exchange) to a non-U.S. person. Unless otherwise indicated, these holdings are determined to be liquid. At December 31, 2016, the aggregate value of these securities was $6,553,034, which represents 2.0% of total net assets. |
| (7) | Variable rate securities; the rate reported is the coupon rate in effect at December 31, 2016. |
| (8) | The following securities are considered illiquid. Illiquid securities are often purchased in private placement transactions, are often not registered under the Securities Act of 1933, as amended, and may have contractual restrictions on resale. A security may also be considered illiquid if the security lacks a readily available market or if its valuation has not changed for a certain period of time. |
| | | | | | | | | | |
Period
Acquired | | Shares/ Par | | | Security | | Cost Basis | |
| 03/2011 | | | 206,275,142 | | | KCA Deutag | | $ | 2,795,441 | |
| 10/2016 | | | 4,525,000 | | | TCEH Corp. | | | — | |
| 10/2016 | | $ | 415,000 | | | Texas Competitive Electric Holdings Co. LLC | | | — | |
| | | | | | | | | | |
| | | | | | | | $ | 2,795,441 | |
| | | | | | | | | | |
At December 31, 2016, the aggregate value of these securities was $2,652,084, which represents 0.8% of total net assets.
| (9) | Senior floating rate interests generally pay interest rates which are periodically adjusted by reference to a base short-term, floating lending rate plus a premium. The base lending rates are primarily the LIBOR, and secondarily the prime rate offered by one or more major United States banks (the “Prime Rate”) and the certificate of deposit rate or other base lending rates used by commercial lenders. Senior floating rate interests often require prepayments from excess cash flows or permit the borrower to repay at its election. The rate at which the borrower repays cannot be predicted with accuracy. As a result, the actual remaining maturity may be substantially less than the stated maturities shown. Unless otherwise noted, the interest rate disclosed for these securities represents the average coupon as of December 31, 2016. |
The accompanying notes are an integral part of these financial statements.
|
| Hartford High Yield HLS Fund |
Schedule of Investments – (continued)
December 31, 2016
| | | | | | | | | | | | | | | | | | | | | | | | |
| Centrally Cleared Credit Default Swap Contracts Outstanding at December 31, 2016 | |
Reference Entity | | Notional
Amount(a) | | | (Pay)/Receive
Fixed Rate | | | Expiration
Date | | Cost Basis | | | Market
Value† | | | Unrealized
Appreciation/
(Depreciation) | |
Credit default swaps on indices: | |
Sell protection: | |
CDX.NA.HY.27 | | USD | | | 11,290,000 | | | | 5.00 | % | | 12/20/21 | | $ | 396,196 | | | $ | 698,698 | | | $ | 302,502 | |
| | | | | | | | | | | | | | | | | | | | | | | | |
Total | | $ | 396,196 | | | $ | 698,698 | | | $ | 302,502 | |
| | | | | | | | | | | | | | | | | | | | | | | | |
| (a) | The maximum potential amount the Fund could be required to pay as a seller of credit protection or receive as a buyer of credit protection if a credit event occurs as defined under the terms of that particular swap agreement. |
| | | | | | | | | | | | | | | | | | | | |
| Foreign Currency Contracts Outstanding at December 31, 2016 | |
Currency | | Buy/Sell | | Delivery
Date | | | Counterparty | | Contract
Amount | | | Market
Value† | | | Unrealized
Appreciation/
(Depreciation) | |
EUR | | Sell | | | 01/31/17 | | | BCLY | | $ | 4,736,005 | | | $ | 4,777,443 | | | $ | (41,438 | ) |
| | | | | | | | | | | | | | | | | | | | |
| † | See Significant Accounting Policies of accompanying Notes to Financial Statements regarding valuation of investments. |
| | |
| GLOSSARY: (abbreviations used in preceding Schedule of Investments) |
|
| Counterparty Abbreviations: |
BCLY | | Barclays |
|
| Currency Abbreviations: |
EUR | | Euro |
USD | | United States Dollar |
| | |
| Index Abbreviations: |
CDX.NA.HY | | Credit Derivatives North American High Yield |
|
| Other Abbreviations: |
MSCI | | Morgan Stanley Capital International |
PIK | | Pay in kind |
The accompanying notes are an integral part of these financial statements.
|
| Hartford High Yield HLS Fund |
Schedule of Investments – (continued)
December 31, 2016
Fair Valuation Summary
The following is a summary of the fair valuations according to the inputs used as of December 31, 2016 in valuing the Fund’s investments.
| | | | | | | | | | | | | | | | |
| | | Total | | | Level 1(1) | | | Level 2(1) | | | Level 3(1) | |
Assets | |
Asset & Commercial Mortgage Backed Securities | | $ | — | | | $ | — | | | $ | — | | | $ | — | |
Corporate Bonds | | | 295,263,035 | | | | — | | | | 295,263,035 | | | | — | |
Senior Floating Rate Interests | | | 2,468,143 | | | | — | | | | 2,468,143 | | | | — | |
Convertible Bonds | | | 3,098,519 | | | | — | | | | 3,098,519 | | | | — | |
Common Stocks | |
Energy | | | 2,652,079 | | | | — | | | | — | | | | 2,652,079 | |
Pharmaceuticals, Biotechnology & Life Sciences | | | 543,510 | | | | 543,510 | | | | — | | | | — | |
Utilities | | | 1,279,592 | | | | 1,279,587 | | | | — | | | | 5 | |
Short-Term Investments | | | 11,751,273 | | | | 11,751,273 | | | | — | | | | — | |
Swaps - Credit Default(2) | | | 302,502 | | | | — | | | | 302,502 | | | | — | |
| | | | | | | | | | | | | | | | |
Total | | $ | 317,358,653 | | | $ | 13,574,370 | | | $ | 301,132,199 | | | $ | 2,652,084 | |
| | | | | | | | | | | | | | | | |
Liabilities | |
Foreign Currency Contracts(2) | | $ | (41,438 | ) | | $ | — | | | $ | (41,438 | ) | | $ | — | |
| | | | | | | | | | | | | | | | |
Total | | $ | (41,438 | ) | | $ | — | | | $ | (41,438 | ) | | $ | — | |
| | | | | | | | | | | | | | | | |
| (1) | For the year ended December 31, 2016, there were no transfers between any levels. |
| (2) | Derivative instruments (excluding purchased and written options, if applicable) are valued at the unrealized appreciation/depreciation on the investments. |
The following is a rollforward of the Fund’s investments that were valued using unobservable inputs (Level 3) for the year ended December 31, 2016:
| | | | | | | | | | | | |
| | | Common
Stocks | | | Corporate
Bonds | | | Total | |
Beginning balance | | $ | 921,843 | | | $ | — | | | $ | 921,843 | |
Purchases | | | — | | | | — | | | | — | |
Sales | | | — | | | | — | | | | — | |
Accrued discounts/(premiums) | | | — | | | | — | | | | — | |
Total realized gain/(loss) | | | — | | | | — | | | | — | |
Net change in unrealized appreciation/depreciation | | | 1,730,241 | | | | — | | | | 1,730,241 | |
Transfers into Level 3 | | | — | | | | — | | | | — | |
Transfers out of Level 3 | | | — | | | | — | | | | — | |
| | | | | | | | | | | | |
Ending balance | | $ | 2,652,084 | | | $ | — | | | $ | 2,652,084 | |
| | | | | | | | | | | | |
The change in net unrealized appreciation/depreciation relating to the Level 3 investments held at December 31, 2016 was $1,730,241.
The accompanying notes are an integral part of these financial statements.
|
| Hartford International Opportunities HLS Fund |
Schedule of Investments
December 31, 2016
| | | | | | | | |
Shares or Principal Amount | | Market Value† | |
| COMMON STOCKS - 99.1% | |
| | | | Australia - 1.4% | |
| | 345,936 | | | BHP Billiton plc | | $ | 5,508,344 | |
| | 1,873,205 | | | South32 Ltd. | | | 3,687,501 | |
| | 1,119,417 | | | Westfield Corp. REIT | | | 7,568,866 | |
| | | | | | | | |
| | | | | | | 16,764,711 | |
| | | | | | | | |
| | | | Belgium - 1.9% | | | |
| | 225,819 | | | Anheuser-Busch InBev N.V. | | | 23,901,586 | |
| | | | | | | | |
| | | | Brazil - 1.5% | | | |
| | 570,560 | | | BB Seguridade Participacoes S.A. | | | 4,961,087 | |
| | 1,336,094 | | | Petroleo Brasileiro S.A. ADR* | | | 13,507,910 | |
| | | | | | | | |
| | | | | | | 18,468,997 | |
| | | | | | | | |
| | | | Canada - 8.0% | | | |
| | 49,430 | | | Alimentation Couche-Tard, Inc. Class B | | | 2,241,313 | |
| | 501,935 | | | Canadian National Railway Co. | | | 33,780,097 | |
| | 410,490 | | | Imperial Oil Ltd. | | | 14,280,704 | |
| | 536,150 | | | Magna International, Inc. | | | 23,280,486 | |
| | 582,860 | | | Manulife Financial Corp. | | | 10,379,609 | |
| | 330,160 | | | TransCanada Corp. | | | 14,886,893 | |
| | | | | | | | |
| | | | | | | 98,849,102 | |
| | | | | | | | |
| | | | China - 4.4% | | | |
| | 277,091 | | | Alibaba Group Holding Ltd. ADR* | | | 24,331,361 | |
| | 64,849 | | | Baidu, Inc. ADR* | | | 10,661,824 | |
| | 7,001,190 | | | CNOOC Ltd. | | | 8,700,620 | |
| | 6,868,000 | | | PICC Property & Casualty Co., Ltd. Class H | | | 10,622,540 | |
| | | | | | | | |
| | | | | | | 54,316,345 | |
| | | | | | | | |
| | | | France - 15.0% | | | |
| | 355,787 | | | Airbus Group SE | | | 23,499,257 | |
| | 950,482 | | | AXA S.A. | | | 23,960,498 | |
| | 416,411 | | | BNP Paribas S.A. | | | 26,499,527 | |
| | 272,586 | | | Capgemini S.A. | | | 22,965,129 | |
| | 67,404 | | | Cie de Saint-Gobain | | | 3,135,456 | |
| | 116,004 | | | Essilor International S.A. | | | 13,088,525 | |
| | 34,363 | | | LVMH Moet Hennessy Louis Vuitton SE | | | 6,552,049 | |
| | 296,983 | | | Schneider Electric SE | | | 20,630,948 | |
| | 72,622 | | | Technip S.A. | | | 5,172,993 | |
| | 446,766 | | | Total S.A. | | | 22,915,567 | |
| | 70,723 | | | Unibail-Rodamco SE REIT | | | 16,853,621 | |
| | | | | | | | |
| | | | | | | 185,273,570 | |
| | | | | | | | |
| | | | Germany - 7.9% | | | |
| | 287,835 | | | Beiersdorf AG | | | 24,381,891 | |
| | 161,312 | | | Brenntag AG | | | 8,941,333 | |
| | 61,887 | | | Continental AG | | | 11,922,951 | |
| | 403,311 | | | Deutsche Wohnen AG | | | 12,650,448 | |
| | 1,403,704 | | | E.ON SE | | | 9,874,976 | |
| | 105,789 | | | Siemens AG | | | 12,952,799 | |
| | 509,407 | | | Vonovia SE | | | 16,539,099 | |
| | | | | | | | |
| | | | | | | 97,263,497 | |
| | | | | | | | |
| | | | Hong Kong - 1.0% | | | |
| | 499,107 | | | Hong Kong Exchanges and Clearing Ltd. | | | 11,738,184 | |
| | | | | | | | |
| | | | India - 2.3% | | | |
| | 1,781,012 | | | Bharti Infratel Ltd. | | | 9,000,582 | |
| | 71,708 | | | Divi’s Laboratories Ltd. | | | 826,011 | |
| | 4,154,534 | | | ICICI Bank Ltd. | | | 15,554,930 | |
| | 898,487 | | | Power Grid Corp. of India Ltd. | | | 2,424,258 | |
| | | | | | | | |
| | | | | | | 27,805,781 | |
| | | | | | | | |
| | | | | | | | |
Shares or Principal Amount | | Market Value† | |
| COMMON STOCKS - 99.1% - (continued) | |
| | | | Ireland - 0.7% | | | |
| | 234,114 | | | CRH plc | | $ | 8,118,885 | |
| | | | | | | | |
| | | | Israel - 0.3% | | | |
| | 111,730 | | | Mobileye N.V.* | | | 4,259,148 | |
| | | | | | | | |
| | | | Italy - 5.4% | | | |
| | 758,478 | | | Assicurazioni Generali S.p.A. | | | 11,242,431 | |
| | 293,963 | | | Banca Generali S.p.A. | | | 6,991,827 | |
| | 1,530,130 | | | Eni S.p.A. | | | 24,805,051 | |
| | 930,080 | | | FinecoBank Banca Fineco S.p.A. | | | 5,200,250 | |
| | 125,620 | | | Luxottica Group S.p.A. | | | 6,751,627 | |
| | 9,244,952 | | | Saipem S.p.A.* | | | 5,170,814 | |
| | 4,135,580 | | | Telecom Italia S.p.A.* | | | 3,651,460 | |
| | 784,500 | | | UniCredit S.p.A. | | | 2,252,872 | |
| | | | | | | | |
| | | | | | | 66,066,332 | |
| | | | | | | | |
| | | | Japan - 11.6% | | | |
| | 10,210 | | | Daito Trust Construction Co., Ltd. | | | 1,534,948 | |
| | 347,065 | | | Daiwa House Industry Co., Ltd. | | | 9,464,589 | |
| | 94,522 | | | Eisai Co., Ltd. | | | 5,416,806 | |
| | 71,900 | | | FANUC Corp. | | | 12,028,466 | |
| | 705,000 | | | ITOCHU Corp. | | | 9,334,732 | |
| | 806,700 | | | Kawasaki Heavy Industries Ltd. | | | 2,525,104 | |
| | 975,800 | | | Mitsubishi Heavy Industries Ltd. | | | 4,436,027 | |
| | 480,560 | | | Mitsui Fudosan Co., Ltd. | | | 11,125,202 | |
| | 61,930 | | | Murata Manufacturing Co., Ltd. | | | 8,269,929 | |
| | 208,490 | | | Nippon Telegraph & Telephone Corp. | | | 8,776,415 | |
| | 589,000 | | | Nomura Holdings, Inc. | | | 3,482,264 | |
| | 77,195 | | | Olympus Corp. | | | 2,659,734 | |
| | 169,490 | | | Omron Corp. | | | 6,477,054 | |
| | 304,374 | | | Ono Pharmaceutical Co., Ltd. | | | 6,633,714 | |
| | 434,300 | | | Seven & I Holdings Co., Ltd. | | | 16,516,070 | |
| | 261,380 | | | Sony Financial Holdings, Inc. | | | 4,074,502 | |
| | 694,130 | | | Sumitomo Mitsui Financial Group, Inc. | | | 26,434,526 | |
| | 97,043 | | | Tokio Marine Holdings, Inc. | | | 3,973,236 | |
| | | | | | | | |
| | | | | | | 143,163,318 | |
| | | | | | | | |
| | | | Luxembourg - 0.6% | | | |
| | 325,461 | | | SES S.A. | | | 7,161,050 | |
| | | | | | | | |
| | | | Mexico - 1.5% | | | |
| | 776,070 | | | America Movil S.A.B. de C.V. Class L, ADR | | | 9,755,200 | |
| | 1,153,300 | | | Grupo Financiero Banorte S.A.B. de C.V. Series O | | | 5,680,363 | |
| | 204,500 | | | Infraestructura Energetica Nova, S.A.B. de C.V. | | | 890,818 | |
| | 1,135,300 | | | Wal-Mart de Mexico S.A.B. de C.V. | | | 2,031,854 | |
| | | | | | | | |
| | | | | | | 18,358,235 | |
| | | | | | | | |
| | | | Netherlands - 2.8% | | | |
| | 300,471 | | | AerCap Holdings N.V.* | | | 12,502,599 | |
| | 138,508 | | | Akzo Nobel N.V. | | | 8,654,918 | |
| | 646,449 | | | Koninklijke Ahold Delhaize N.V. | | | 13,616,153 | |
| | | | | | | | |
| | | | | | | 34,773,670 | |
| | | | | | | | |
| | | | Russia - 0.9% | | | |
| | 1,707,910 | | | Rosneft Oil Co. PJSC GDR | | | 11,092,078 | |
| | | | | | | | |
| | | | South Africa - 0.4% | | | |
| | 1,419,611 | | | FirstRand Ltd. | | | 5,478,008 | |
| | | | | | | | |
| | | | South Korea - 4.0% | | | |
| | 49,246 | | | Hyundai Motor Co. | | | 5,940,914 | |
| | 5,483 | | | LG Household & Health Care Ltd. | | | 3,890,141 | |
| | 26,051 | | | Samsung Biologics Co., Ltd.* | | | 3,256,914 | |
| | 19,635 | | | Samsung Electronics Co., Ltd. | | | 29,223,007 | |
The accompanying notes are an integral part of these financial statements.
|
| Hartford International Opportunities HLS Fund |
Schedule of Investments – (continued)
December 31, 2016
| | | | | | | | |
Shares or Principal Amount | | Market Value† | |
| COMMON STOCKS - 99.1% - (continued) | |
| | | | South Korea - 4.0% - (continued) | | | |
| | 188,590 | | | SK Hynix, Inc. | | $ | 6,939,373 | |
| | | | | | | | |
| | | | | | | 49,250,349 | |
| | | | | | | | |
| | | | Spain - 3.1% | | | |
| | 4,459,169 | | | Banco Santander S.A. | | | 23,197,805 | |
| | 2,316,646 | | | CaixaBank S.A. | | | 7,635,146 | |
| | 32,554 | | | Industria de Diseno Textil S.A. | | | 1,108,984 | |
| | 448,123 | | | Repsol S.A. | | | 6,297,534 | |
| | | | | | | | |
| | | | | | | 38,239,469 | |
| | | | | | | | |
| | | | Sweden - 0.6% | | | |
| | 430,682 | | | SKF AB Class B | | | 7,897,056 | |
| | | | | | | | |
| | | | Switzerland - 8.8% | | | |
| | 467,516 | | | ABB Ltd.* | | | 9,837,335 | |
| | 257,463 | | | Credit Suisse Group AG* | | | 3,679,411 | |
| | 293,458 | | | Julius Baer Group Ltd.* | | | 13,000,696 | |
| | 495,637 | | | LafargeHolcim Ltd.* | | | 26,017,012 | |
| | 462,113 | | | Novartis AG | | | 33,606,447 | |
| | 83,036 | | | Zurich Insurance Group AG* | | | 22,819,938 | |
| | | | | | | | |
| | | | | | | 108,960,839 | |
| | | | | | | | |
| | | | Taiwan - 2.3% | | | |
| | 5,164,255 | | | Taiwan Semiconductor Manufacturing Co., Ltd. | | | 28,926,302 | |
| | | | | | | | |
| | | | United Kingdom - 12.7% | | | |
| | 698,028 | | | Anglo American plc* | | | 9,862,321 | |
| | 407,079 | | | Antofagasta plc | | | 3,370,472 | |
| | 196,006 | | | AstraZeneca plc | | | 10,703,443 | |
| | 2,108,723 | | | Aviva plc | | | 12,560,876 | |
| | 1,073,688 | | | Barclays plc | | | 2,946,571 | |
| | 441,729 | | | British American Tobacco plc | | | 25,035,152 | |
| | 207,186 | | | Compass Group plc | | | 3,829,117 | |
| | 7,458,165 | | | Glencore plc* | | | 25,200,266 | |
| | 295,978 | | | Hikma Pharmaceuticals plc | | | 6,898,560 | |
| | 1,153,094 | | | International Consolidated Airlines Group S.A. | | | 6,247,928 | |
| | 343,763 | | | Sky plc | | | 4,190,790 | |
| | 754,968 | | | Unilever N.V. | | | 31,013,189 | |
| | 674,782 | | | WPP plc | | | 15,016,204 | |
| | | | | | | | |
| | | | | | | 156,874,889 | |
| | | | | | | | |
| | |
| | | | Total Common Stocks
(cost $1,188,971,766) | | $ | 1,223,001,401 | |
| | | | | | | | |
| |
| RIGHTS - 0.0% | | | |
| | | | Spain - 0.0% | | | |
| | 448,123 | | | Repsol S.A.* | | $ | 166,044 | |
| | | | | | | | |
| | |
| | | | Total Rights
(cost $156,764) | | $ | 166,044 | |
| | | | | | | | |
| | |
| | | | Total Long-Term Investments
(cost $1,189,128,530) | | $ | 1,223,167,445 | |
| | | | | | | | |
| | | | | | | | |
Shares or Principal Amount | | Market Value† | |
| SHORT-TERM INVESTMENTS - 0.7% | | | |
| | | | Other Investment Pools & Funds - 0.7% | | | | |
| | 8,259,175 | | | BlackRock Liquidity Funds TempFund Portfolio, Institutional Class | | $ | 8,259,175 | |
| | | | | | | | |
| | |
| | | | Total Short-Term Investments
(cost $8,259,175) | | $ | 8,259,175 | |
| | | | | | | | |
| | | | | | | | | | | | |
| | | |
| | | | Total Investments
(cost $1,197,387,705)^ | | | 99.8 | % | | $ | 1,231,426,620 | |
| | | | Other Assets and Liabilities | | | 0.2 | % | | | 2,678,572 | |
| | | | | | | | | | | | |
| | | | Total Net Assets | | | 100.0 | % | | $ | 1,234,105,192 | |
| | | | | | | | | | | | |
The accompanying notes are an integral part of these financial statements.
|
| Hartford International Opportunities HLS Fund |
Schedule of Investments – (continued)
December 31, 2016
| Note: | Percentage of investments as shown is the ratio of the total market value to total net assets. |
| | Prices of foreign equities that are principally traded on certain foreign markets will generally be adjusted daily pursuant to a fair value pricing service approved by the Board of Directors in order to reflect an adjustment for factors occurring after the close of certain foreign markets but before the close of the New York Stock Exchange. |
| | Equity industry classifications used in this report are the Global Industry Classification Standard, which was developed by and is the exclusive property and service mark of MSCI, Inc. and Standard & Poor’s. |
| | For Fund compliance purposes, the Fund may not use the same classification system shown in this report as these classifications are used for financial reporting purposes. |
| ^ | At December 31, 2016, the cost of securities for federal income tax purposes was $1,204,375,613 and the aggregate gross unrealized appreciation and depreciation based on that cost were: |
| | | | |
Unrealized Appreciation | | $ | 68,655,757 | |
Unrealized Depreciation | | | (41,604,750 | ) |
| | | | |
Net Unrealized Appreciation | | $ | 27,051,007 | |
| | | | |
| † | See Significant Accounting Policies of accompanying Notes to Financial Statements regarding valuation of investments. |
| | |
| GLOSSARY: (abbreviations used in preceding Schedule of Investments) |
|
| Other Abbreviations: |
ADR | | American Depositary Receipt |
GDR | | Global Depositary Receipt |
PJSC | | Private Joint Stock Company |
REIT | | Real Estate Investment Trust |
The accompanying notes are an integral part of these financial statements.
|
| Hartford International Opportunities HLS Fund |
Schedule of Investments – (continued)
December 31, 2016
Fair Valuation Summary
The following is a summary of the fair valuations according to the inputs used as of December 31, 2016 in valuing the Fund’s investments.
| | | | | | | | | | | | | | | | |
| | | Total | | | Level 1(1) | | | Level 2(1) | | | Level 3(1) | |
Assets | | | | | | | | | | | | | | | | |
Common Stocks | | | | | | | | | | | | | | | | |
Australia | | $ | 16,764,711 | | | $ | — | | | $ | 16,764,711 | | | $ | — | |
Belgium | | | 23,901,586 | | | | 23,901,586 | | | | — | | | | — | |
Brazil | | | 18,468,997 | | | | 18,468,997 | | | | — | | | | — | |
Canada | | | 98,849,102 | | | | 98,849,102 | | | | — | | | | — | |
China | | | 54,316,345 | | | | 34,993,185 | | | | 19,323,160 | | | | — | |
France | | | 185,273,570 | | | | — | | | | 185,273,570 | | | | — | |
Germany | | | 97,263,497 | | | | — | | | | 97,263,497 | | | | — | |
Hong Kong | | | 11,738,184 | | | | — | | | | 11,738,184 | | | | — | |
India | | | 27,805,781 | | | | — | | | | 27,805,781 | | | | — | |
Ireland | | | 8,118,885 | | | | — | | | | 8,118,885 | | | | — | |
Israel | | | 4,259,148 | | | | 4,259,148 | | | | — | | | | — | |
Italy | | | 66,066,332 | | | | — | | | | 66,066,332 | | | | — | |
Japan | | | 143,163,318 | | | | — | | | | 143,163,318 | | | | — | |
Luxembourg | | | 7,161,050 | | | | — | | | | 7,161,050 | | | | — | |
Mexico | | | 18,358,235 | | | | 18,358,235 | | | | — | | | | — | |
Netherlands | | | 34,773,670 | | | | 12,502,599 | | | | 22,271,071 | | | | — | |
Russia | | | 11,092,078 | | | | — | | | | 11,092,078 | | | | — | |
South Africa | | | 5,478,008 | | | | — | | | | 5,478,008 | | | | — | |
South Korea | | | 49,250,349 | | | | 3,256,914 | | | | 45,993,435 | | | | — | |
Spain | | | 38,239,469 | | | | — | | | | 38,239,469 | | | | — | |
Sweden | | | 7,897,056 | | | | — | | | | 7,897,056 | | | | — | |
Switzerland | | | 108,960,839 | | | | — | | | | 108,960,839 | | | | — | |
Taiwan | | | 28,926,302 | | | | — | | | | 28,926,302 | | | | — | |
United Kingdom | | | 156,874,889 | | | | — | | | | 156,874,889 | | | | — | |
Rights | | | 166,044 | | | | 166,044 | | | | — | | | | — | |
Short-Term Investments | | | 8,259,175 | | | | 8,259,175 | | | | — | | | | — | |
| | | | | | | | | | | | | | | | |
Total | | $ | 1,231,426,620 | | | $ | 223,014,985 | | | $ | 1,008,411,635 | | | $ | — | |
| | | | | | | | | | | | | | | | |
| (1) | For the year ended December 31, 2016, investments valued at $25,101,348 were transferred from Level 1 to Level 2 due to the application of a fair valuation factor; there were no transfers from Level 2 to Level 1 and there were no transfers in and out of Level 3. |
| Note: | For purposes of reporting transfers between different hierarchy levels, both transfers in and out of each level, as applicable, are shown as if they occurred at the beginning of the period. |
The accompanying notes are an integral part of these financial statements.
Schedule of Investments
December 31, 2016
| | | | | | | | |
Shares or Principal Amount | | Market Value† | |
| COMMON STOCKS - 99.7% | |
| | | | Automobiles & Components - 1.5% | |
| | 459,793 | | | Harley-Davidson, Inc. | | $ | 26,824,324 | |
| | | | | | | | |
| | | | Banks - 5.4% | |
| | 83,459 | | | Cullen/Frost Bankers, Inc. | | | 7,363,588 | |
| | 153,490 | | | East West Bancorp, Inc. | | | 7,801,897 | |
| | 33,096 | | | First Citizens BancShares, Inc. Class A | | | 11,749,080 | |
| | 291,288 | | | First Republic Bank | | | 26,839,276 | |
| | 286,664 | | | M&T Bank Corp. | | | 44,842,849 | |
| | | | | | | | |
| | | | | | | 98,596,690 | |
| | | | | | | | |
| | | | Capital Goods - 9.8% | |
| | 619,942 | | | Allison Transmission Holdings, Inc. | | | 20,885,846 | |
| | 326,554 | | | Fastenal Co. | | | 15,341,507 | |
| | 180,140 | | | Heico Corp. Class A | | | 12,231,506 | |
| | 353,294 | | | IDEX Corp. | | | 31,817,658 | |
| | 226,182 | | | Lennox International, Inc. | | | 34,644,297 | |
| | 73,326 | | | Middleby Corp.* | | | 9,445,122 | |
| | 210,484 | | | MSC Industrial Direct Co., Inc. Class A | | | 19,446,617 | |
| | 475,880 | | | NOW, Inc.* | | | 9,741,263 | |
| | 274,478 | | | PACCAR, Inc. | | | 17,539,144 | |
| | 181,265 | | | Sensata Technologies Holding N.V.* | | | 7,060,272 | |
| | | | | | | | |
| | | | | | | 178,153,232 | |
| | | | | | | | |
| | | | Commercial & Professional Services - 8.0% | |
| | 135,955 | | | Cintas Corp. | | | 15,710,960 | |
| | 110,881 | | | Dun & Bradstreet Corp. | | | 13,452,083 | |
| | 221,442 | | | Equifax, Inc. | | | 26,181,088 | |
| | 595,179 | | | Robert Half International, Inc. | | | 29,032,831 | |
| | 918,327 | | | TransUnion* | | | 28,403,854 | |
| | 73,241 | | | UniFirst Corp. | | | 10,521,070 | |
| | 269,179 | | | Waste Connections, Inc. | | | 21,154,777 | |
| | | | | | | | |
| | | | | | | 144,456,663 | |
| | | | | | | | |
| | | | Consumer Durables & Apparel - 1.5% | |
| | 15,807 | | | NVR, Inc.* | | | 26,381,883 | |
| | | | | | | | |
| | | | Consumer Services - 1.0% | |
| | 337,837 | | | Choice Hotels International, Inc. | | | 18,935,764 | |
| | | | | | | | |
| | | | Diversified Financials - 5.2% | |
| | 137,714 | | | Factset Research Systems, Inc. | | | 22,506,599 | |
| | 191,184 | | | Invesco Ltd. | | | 5,800,523 | |
| | 120,251 | | | Moody’s Corp. | | | 11,336,062 | |
| | 231,324 | | | MSCI, Inc. | | | 18,223,705 | |
| | 246,021 | | | Northern Trust Corp. | | | 21,908,170 | |
| | 304,757 | | | SEI Investments Co. | | | 15,042,805 | |
| | | | | | | | |
| | | | | | | 94,817,864 | |
| | | | | | | | |
| | | | Energy - 6.5% | |
| | 94,216 | | | Cimarex Energy Co. | | | 12,803,954 | |
| | 127,955 | | | Diamondback Energy, Inc.* | | | 12,931,132 | |
| | 162,257 | | | Energen Corp. | | | 9,357,361 | |
| | 300,762 | | | Newfield Exploration Co.* | | | 12,180,861 | |
| | 325,043 | | | Parsley Energy, Inc. Class A* | | | 11,454,515 | |
| | 541,418 | | | Patterson-UTI Energy, Inc. | | | 14,574,973 | |
| | 719,698 | | | QEP Resources, Inc. | | | 13,249,640 | |
| | 249,993 | | | SM Energy Co. | | | 8,619,759 | |
| | 209,426 | | | World Fuel Services Corp. | | | 9,614,748 | |
| | 963,139 | | | WPX Energy, Inc.* | | | 14,032,935 | |
| | | | | | | | |
| | | | | | | 118,819,878 | |
| | | | | | | | |
| | | | Food & Staples Retailing - 0.7% | |
| | 148,155 | | | PriceSmart, Inc. | | | 12,370,943 | |
| | | | | | | | |
| | | | | | | | |
Shares or Principal Amount | | Market Value† | |
| COMMON STOCKS - 99.7% - (continued) | |
| | | | Health Care Equipment & Services - 4.1% | |
| | 242,865 | | | DENTSPLY SIRONA, Inc. | | $ | 14,020,596 | |
| | 375,461 | | | Patterson Cos., Inc. | | | 15,405,165 | |
| | 248,167 | | | STERIS plc | | | 16,723,974 | |
| | 59,514 | | | Teleflex, Inc. | | | 9,590,681 | |
| | 202,623 | | | Varian Medical Systems, Inc.* | | | 18,191,493 | |
| | | | | | | | |
| | | | | | | 73,931,909 | |
| | | | | | | | |
| | | | Insurance - 5.4% | |
| | 29,304 | | | Alleghany Corp.* | | | 17,820,349 | |
| | 38,198 | | | Fairfax Financial Holdings Ltd. | | | 18,449,635 | |
| | 38,271 | | | Markel Corp.* | | | 34,616,120 | |
| | 15,268 | | | White Mountains Insurance Group Ltd. | | | 12,764,811 | |
| | 212,420 | | | WR Berkley Corp. | | | 14,128,054 | |
| | | | | | | | |
| | | | | | | 97,778,969 | |
| | | | | | | | |
| | | | Materials - 3.4% | |
| | 264,170 | | | Ball Corp. | | | 19,831,242 | |
| | 256,074 | | | Packaging Corp. of America | | | 21,720,197 | |
| | 39,898 | | | Sherwin-Williams Co. | | | 10,722,188 | |
| | 200,051 | | | Silgan Holdings, Inc. | | | 10,238,610 | |
| | | | | | | | |
| | | | | | | 62,512,237 | |
| | | | | | | | |
| | | | Pharmaceuticals, Biotechnology & Life Sciences - 10.1% | |
| | 220,419 | | | Agios Pharmaceuticals, Inc.* | | | 9,198,085 | |
| | 485,052 | | | Alkermes plc* | | | 26,959,190 | |
| | 172,133 | | | Alnylam Pharmaceuticals, Inc.* | | | 6,444,660 | |
| | 1,165,710 | | | ARIAD Pharmaceuticals, Inc.* | | | 14,501,432 | |
| | 174,261 | | | Bluebird Bio, Inc.* | | | 10,751,904 | |
| | 417,556 | | | Ionis Pharmaceuticals, Inc.* | | | 19,971,703 | |
| | 935,617 | | | Ironwood Pharmaceuticals, Inc.* | | | 14,305,584 | |
| | 61,942 | | | Mettler-Toledo International, Inc.* | | | 25,926,444 | |
| | 356,089 | | | Puma Biotechnology, Inc.* | | | 10,931,932 | |
| | 123,861 | | | TESARO, Inc.* | | | 16,656,827 | |
| | 187,268 | | | Ultragenyx Pharmaceutical, Inc.* | | | 13,166,813 | |
| | 112,277 | | | Waters Corp.* | | | 15,088,906 | |
| | | | | | | | |
| | | | | | | 183,903,480 | |
| | | | | | | | |
| | | | Retailing - 3.6% | |
| | 213,959 | | | Advance Auto Parts, Inc. | | | 36,184,746 | |
| | 440,564 | | | CarMax, Inc.* | | | 28,367,916 | |
| | | | | | | | |
| | | | | | | 64,552,662 | |
| | | | | | | | |
| | | | Semiconductors & Semiconductor Equipment - 0.9% | |
| | 261,049 | | | MKS Instruments, Inc. | | | 15,506,311 | |
| | | | | | | | |
| | | | Software & Services - 16.6% | |
| | 400,524 | | | Akamai Technologies, Inc.* | | | 26,706,940 | |
| | 265,119 | | | Blackbaud, Inc. | | | 16,967,616 | |
| | 749,380 | | | Cadence Design Systems, Inc.* | | | 18,899,364 | |
| | 14,373 | | | CoStar Group, Inc.* | | | 2,709,167 | |
| | 1,495,712 | | | Genpact Ltd.* | | | 36,405,630 | |
| | 436,635 | | | Global Payments, Inc. | | | 30,306,835 | |
| | 411,108 | | | Guidewire Software, Inc.* | | | 20,279,958 | |
| | 197,364 | | | ServiceNow, Inc.* | | | 14,672,040 | |
| | 442,924 | | | Total System Services, Inc. | | | 21,716,564 | |
| | 504,066 | | | Vantiv, Inc. Class A* | | | 30,052,415 | |
| | 352,260 | | | VeriSign, Inc.* | | | 26,796,418 | |
| | 261,947 | | | WEX, Inc.* | | | 29,233,285 | |
| | 269,182 | | | Zillow Group, Inc. Class A* | | | 9,811,684 | |
| | 469,111 | | | Zillow Group, Inc. Class C* | | | 17,108,478 | |
| | | | | | | | |
| | | | | | | 301,666,394 | |
| | | | | | | | |
The accompanying notes are an integral part of these financial statements.
Schedule of Investments – (continued)
December 31, 2016
| | | | | | | | |
Shares or Principal Amount | | Market Value† | |
| COMMON STOCKS - 99.7% - (continued) | |
| | | | Technology Hardware & Equipment - 6.2% | |
| | 269,951 | | | Amphenol Corp. Class A | | $ | 18,140,707 | |
| | 474,797 | | | CDW Corp. of Delaware | | | 24,732,176 | |
| | 124,134 | | | CommScope Holding Co., Inc.* | | | 4,617,785 | |
| | 930,634 | | | National Instruments Corp. | | | 28,682,140 | |
| | 1,181,924 | | | Trimble, Inc.* | | | 35,635,008 | |
| | | | | | | | |
| | | | | | | 111,807,816 | |
| | | | | | | | |
| | | | Transportation - 7.5% | |
| | 256,757 | | | Alaska Air Group, Inc. | | | 22,782,049 | |
| | 44,007 | | | AMERCO | | | 16,264,547 | |
| | 157,035 | | | CH Robinson Worldwide, Inc. | | | 11,504,384 | |
| | 334,986 | | | Genesee & Wyoming, Inc. Class A* | | | 23,251,378 | |
| | 215,478 | | | J.B. Hunt Transport Services, Inc. | | | 20,916,449 | |
| | 1,025,192 | | | JetBlue Airways Corp.* | | | 22,984,805 | |
| | 324,636 | | | Spirit Airlines, Inc.* | | | 18,783,439 | |
| | | | | | | | |
| | | | | | | 136,487,051 | |
| | | | | | | | |
| | | | Utilities - 2.3% | |
| | 144,753 | | | Black Hills Corp. | | | 8,879,149 | |
| | 262,102 | | | NiSource, Inc. | | | 5,802,938 | |
| | 585,431 | �� | | UGI Corp. | | | 26,976,661 | |
| | | | | | | | |
| | | | | | | 41,658,748 | |
| | | | | | | | |
| | |
| | | | Total Common Stocks
(cost $1,425,490,820) | | $ | 1,809,162,818 | |
| | | | | | | | |
| | |
| | | | Total Long-Term Investments
(cost $1,425,490,820) | | $ | 1,809,162,818 | |
| | | | | | | | |
|
| SHORT-TERM INVESTMENTS - 0.3% | |
| | | | Other Investment Pools & Funds - 0.3% | |
| | 5,219,877 | | | Fidelity Institutional Government Fund, Institutional Class | | $ | 5,219,877 | |
| | | | | | | | |
| | |
| | | | Total Short-Term Investments
(cost $5,219,877) | | $ | 5,219,877 | |
| | | | | | | | |
| | | | | | | | | | | | |
| | | |
| | | | Total Investments
(cost $1,430,710,697)^ | | | 100.0 | % | | $ | 1,814,382,695 | |
| | | | Other Assets and Liabilities | | | 0.0 | % | | | 213,563 | |
| | | | | | | | | | | | |
| | | | Total Net Assets | | | 100.0 | % | | $ | 1,814,596,258 | |
| | | | | | | | | | | | |
The accompanying notes are an integral part of these financial statements.
Schedule of Investments – (continued)
December 31, 2016
| Note: | Percentage of investments as shown is the ratio of the total market value to total net assets. |
| | Prices of foreign equities that are principally traded on certain foreign markets will generally be adjusted daily pursuant to a fair value pricing service approved by the Board of Directors in order to reflect an adjustment for factors occurring after the close of certain foreign markets but before the close of the New York Stock Exchange. |
| | Equity industry classifications used in this report are the Global Industry Classification Standard, which was developed by and is the exclusive property and service mark of MSCI, Inc. and Standard & Poor’s. |
| | For Fund compliance purposes, the Fund may not use the same classification system shown in this report as these classifications are used for financial reporting purposes. |
| ^ | At December 31, 2016, the cost of securities for federal income tax purposes was $1,433,582,282 and the aggregate gross unrealized appreciation and depreciation based on that cost were: |
| | | | |
Unrealized Appreciation | | $ | 416,571,993 | |
Unrealized Depreciation | | | (35,771,580 | ) |
| | | | |
Net Unrealized Appreciation | | $ | 380,800,413 | |
| | | | |
| † | See Significant Accounting Policies of accompanying Notes to Financial Statements regarding valuation of investments. |
| | |
| GLOSSARY: (abbreviations used in preceding Schedule of Investments) |
|
| Other Abbreviations: |
MSCI | | Morgan Stanley Capital International |
The accompanying notes are an integral part of these financial statements.
Schedule of Investments – (continued)
December 31, 2016
Fair Valuation Summary
The following is a summary of the fair valuations according to the inputs used as of December 31, 2016 in valuing the Fund’s investments.
| | | | | | | | | | | | | | | | |
| | | Total | | | Level 1(1) | | | Level 2(1) | | | Level 3(1) | |
Assets | |
Common Stocks | |
Automobiles & Components | | $ | 26,824,324 | | | $ | 26,824,324 | | | $ | — | | | $ | — | |
Banks | | | 98,596,690 | | | | 98,596,690 | | | | — | | | | — | |
Capital Goods | | | 178,153,232 | | | | 178,153,232 | | | | — | | | | — | |
Commercial & Professional Services | | | 144,456,663 | | | | 144,456,663 | | | | — | | | | — | |
Consumer Durables & Apparel | | | 26,381,883 | | | | 26,381,883 | | | | — | | | | — | |
Consumer Services | | | 18,935,764 | | | | 18,935,764 | | | | — | | | | — | |
Diversified Financials | | | 94,817,864 | | | | 94,817,864 | | | | — | | | | — | |
Energy | | | 118,819,878 | | | | 118,819,878 | | | | — | | | | — | |
Food & Staples Retailing | | | 12,370,943 | | | | 12,370,943 | | | | — | | | | — | |
Health Care Equipment & Services | | | 73,931,909 | | | | 73,931,909 | | | | — | | | | — | |
Insurance | | | 97,778,969 | | | | 97,778,969 | | | | — | | | | — | |
Materials | | | 62,512,237 | | | | 62,512,237 | | | | — | | | | — | |
Pharmaceuticals, Biotechnology & Life Sciences | | | 183,903,480 | | | | 183,903,480 | | | | — | | | | — | |
Retailing | | | 64,552,662 | | | | 64,552,662 | | | | — | | | | — | |
Semiconductors & Semiconductor Equipment | | | 15,506,311 | | | | 15,506,311 | | | | — | | | | — | |
Software & Services | | | 301,666,394 | | | | 301,666,394 | | | | — | | | | — | |
Technology Hardware & Equipment | | | 111,807,816 | | | | 111,807,816 | | | | — | | | | — | |
Transportation | | | 136,487,051 | | | | 136,487,051 | | | | — | | | | — | |
Utilities | | | 41,658,748 | | | | 41,658,748 | | | | — | | | | — | |
Short-Term Investments | | | 5,219,877 | | | | 5,219,877 | | | | — | | | | — | |
| | | | | | | | | | | | | | | | |
Total | | $ | 1,814,382,695 | | | $ | 1,814,382,695 | | | $ | — | | | $ | — | |
| | | | | | | | | | | | | | | | |
| (1) | For the year ended December 31, 2016, there were no transfers between any levels. |
The accompanying notes are an integral part of these financial statements.
|
| Hartford MidCap Value HLS Fund |
Schedule of Investments
December 31, 2016
| | | | | | | | |
Shares or Principal Amount | | Market Value† | |
| COMMON STOCKS - 98.6% | |
| | | | Automobiles & Components - 1.4% | |
| | 170,847 | | | Goodyear Tire & Rubber Co. | | $ | 5,274,047 | |
| | | | | | | | |
| | | | Banks - 13.7% | |
| | 95,304 | | | Bank of the Ozarks, Inc. | | | 5,012,037 | |
| | 107,767 | | | BankUnited, Inc. | | | 4,061,738 | |
| | 172,739 | | | Comerica, Inc. | | | 11,765,253 | |
| | 68,141 | | | IBERIABANK Corp. | | | 5,706,809 | |
| | 86,625 | | | MB Financial, Inc. | | | 4,091,299 | |
| | 113,568 | | | Provident Financial Services, Inc. | | | 3,213,975 | |
| | 48,293 | | | South State Corp. | | | 4,220,808 | |
| | 79,463 | | | Sterling Bancorp | | | 1,859,434 | |
| | 19,700 | | | Western Alliance Bancorp* | | | 959,587 | |
| | 260,044 | | | Zions Bancorp | | | 11,192,294 | |
| | | | | | | | |
| | | | | | | 52,083,234 | |
| | | | | | | | |
| | | | Capital Goods - 7.5% | |
| | 80,851 | | | Generac Holdings, Inc.* | | | 3,293,870 | |
| | 5,048 | | | Herc Holdings, Inc.* | | | 202,728 | |
| | 37,826 | | | Hubbell, Inc. Class B | | | 4,414,294 | |
| | 86,745 | | | Moog, Inc. Class A* | | | 5,697,412 | |
| | 131,904 | | | NOW, Inc.* | | | 2,700,075 | |
| | 543,344 | | | Sanwa Holdings Corp. | | | 5,167,729 | |
| | 81,599 | | | Sensata Technologies Holding N.V.* | | | 3,178,281 | |
| | 59,084 | | | WESCO International, Inc.* | | | 3,932,040 | |
| | | | | | | | |
| | | | | | | 28,586,429 | |
| | | | | | | | |
| | | | Commercial & Professional Services - 1.3% | |
| | 136,200 | | | IHS Markit Ltd.* | | | 4,822,842 | |
| | | | | | | | |
| | | | Consumer Durables & Apparel - 4.2% | |
| | 115,367 | | | D.R. Horton, Inc. | | | 3,152,980 | |
| | 35,537,573 | | | Global Brands Group Holding Ltd.* | | | 4,700,849 | |
| | 131,278 | | | Lennar Corp. Class A | | | 5,635,765 | |
| | 78,448 | | | Toll Brothers, Inc.* | | | 2,431,888 | |
| | | | | | | | |
| | | | | | | 15,921,482 | |
| | | | | | | | |
| | | | Consumer Services - 1.7% | |
| | 54,925 | | | Bloomin’ Brands, Inc. | | | 990,298 | |
| | 130,736 | | | Norwegian Cruise Line Holdings Ltd.* | | | 5,560,202 | |
| | | | | | | | |
| | | | | | | 6,550,500 | |
| | | | | | | | |
| | | | Diversified Financials - 1.0% | |
| | 19,081 | | | MSCI, Inc. | | | 1,503,201 | |
| | 33,383 | | | Raymond James Financial, Inc. | | | 2,312,441 | |
| | | | | | | | |
| | | | | | | 3,815,642 | |
| | | | | | | | |
| | | | Energy - 8.7% | |
| | 415,600 | | | Cobalt International Energy, Inc.* | | | 507,032 | |
| | 112,600 | | | Delek US Holdings, Inc. | | | 2,710,282 | |
| | 106,907 | | | Diamondback Energy, Inc.* | | | 10,804,021 | |
| | 76,394 | | | Energen Corp. | | | 4,405,642 | |
| | 35,610 | | | HollyFrontier Corp. | | | 1,166,584 | |
| | 177,697 | | | Newfield Exploration Co.* | | | 7,196,729 | |
| | 266,930 | | | QEP Resources, Inc. | | | 4,914,181 | |
| | 323,895 | | | Trican Well Service Ltd.* | | | 1,109,684 | |
| | | | | | | | |
| | | | | | | 32,814,155 | |
| | | | | | | | |
| | | | Food, Beverage & Tobacco - 2.3% | |
| | 26,808 | | | Ingredion, Inc. | | | 3,349,927 | |
| | 64,789 | | | Post Holdings, Inc.* | | | 5,208,388 | |
| | | | | | | | |
| | | | | | | 8,558,315 | |
| | | | | | | | |
| | | | | | | | |
Shares or Principal Amount | | Market Value† | |
| COMMON STOCKS - 98.6% - (continued) | |
| | | | Health Care Equipment & Services - 2.7% | |
| | 87,693 | | | Acadia Healthcare Co., Inc.* | | $ | 2,902,638 | |
| | 174,640 | | | Brookdale Senior Living, Inc.* | | | 2,169,029 | |
| | 82,183 | | | Envision Healthcare Corp.* | | | 5,201,362 | |
| | | | | | | | |
| | | | | | | 10,273,029 | |
| | | | | | | | |
| | | | Insurance - 9.0% | |
| | 36,078 | | | Assurant, Inc. | | | 3,350,203 | |
| | 205,375 | | | CNO Financial Group, Inc. | | | 3,932,931 | |
| | 37,965 | | | Hanover Insurance Group, Inc. | | | 3,455,195 | |
| | 79,965 | | | Reinsurance Group of America, Inc. | | | 10,061,996 | |
| | 135,570 | | | Unum Group | | | 5,955,590 | |
| | 201,024 | | | XL Group Ltd. | �� | | 7,490,154 | |
| | | | | | | | |
| | | | | | | 34,246,069 | |
| | | | | | | | |
| | | | Materials - 9.5% | |
| | 90,392 | | | Bemis Co., Inc. | | | 4,322,545 | |
| | 65,524 | | | Cabot Corp. | | | 3,311,583 | |
| | 84,558 | | | Celanese Corp. Series A | | | 6,658,097 | |
| | 97,773 | | | CF Industries Holdings, Inc. | | | 3,077,894 | |
| | 40,333 | | | Crown Holdings, Inc.* | | | 2,120,306 | |
| | 274,204 | | | Louisiana-Pacific Corp.* | | | 5,190,682 | |
| | 176,838 | | | Methanex Corp. | | | 7,745,504 | |
| | 66,600 | | | Westlake Chemical Corp. | | | 3,728,934 | |
| | | | | | | | |
| | | | | | | 36,155,545 | |
| | | | | | | | |
| | | | Media - 2.5% | |
| | 155,657 | | | Interpublic Group of Cos., Inc. | | | 3,643,930 | |
| | 64,731 | | | John Wiley & Sons, Inc. Class A | | | 3,527,840 | |
| | 76,048 | | | Quebecor, Inc. Class B | | | 2,113,813 | |
| | | | | | | | |
| | | | | | | 9,285,583 | |
| | | | | | | | |
| | | | Pharmaceuticals, Biotechnology & Life Sciences - 0.8% | |
| | 183,233 | | | Endo International plc* | | | 3,017,847 | |
| | | | | | | | |
| | | | Real Estate - 7.9% | |
| | 61,989 | | | American Assets Trust, Inc. REIT | | | 2,670,486 | |
| | 65,877 | | | Equity LifeStyle Properties, Inc. REIT | | | 4,749,732 | |
| | 47,065 | | | Extra Space Storage, Inc. REIT | | | 3,635,301 | |
| | 74,794 | | | Forest City Realty Trust, Inc. Class A REIT | | | 1,558,707 | |
| | 136,733 | | | LaSalle Hotel Properties REIT | | | 4,166,254 | |
| | 35,544 | | | Life Storage, Inc. REIT | | | 3,030,481 | |
| | 54,119 | | | PS Business Parks, Inc. REIT | | | 6,305,946 | |
| | 158,923 | | | STORE Capital Corp. REIT | | | 3,926,987 | |
| | | | | | | | |
| | | | | | | 30,043,894 | |
| | | | | | | | |
| | | | Retailing - 0.9% | |
| | 151,229 | | | DSW, Inc. Class A | | | 3,425,337 | |
| | | | | | | | |
| | | | Semiconductors & Semiconductor Equipment - 5.9% | |
| | 207,050 | | | Microsemi Corp.* | | | 11,174,489 | |
| | 102,228 | | | Qorvo, Inc.* | | | 5,390,482 | |
| | 137,238 | | | Silicon Motion Technology Corp. ADR | | | 5,829,870 | |
| | | | | | | | |
| | | | | | | 22,394,841 | |
| | | | | | | | |
| | | | Software & Services - 2.6% | |
| | 143,569 | | | Booz Allen Hamilton Holding Corp. | | | 5,178,534 | |
| | 156,759 | | | SS&C Technologies Holdings, Inc. | | | 4,483,307 | |
| | 8,619 | | | Verint Systems, Inc.* | | | 303,820 | |
| | | | | | | | |
| | | | | | | 9,965,661 | |
| | | | | | | | |
The accompanying notes are an integral part of these financial statements.
|
| Hartford MidCap Value HLS Fund |
Schedule of Investments – (continued)
December 31, 2016
| | | | | | | | |
Shares or Principal Amount | | Market Value† | |
| COMMON STOCKS - 98.6% - (continued) | |
| | | | Technology Hardware & Equipment - 6.0% | |
| | 130,743 | | | Arrow Electronics, Inc.* | | $ | 9,321,976 | |
| | 103,316 | | | CommScope Holding Co., Inc.* | | | 3,843,355 | |
| | 54,745 | | | Harris Corp. | | | 5,609,720 | |
| | 112,613 | | | Keysight Technologies, Inc.* | | | 4,118,258 | |
| | | | | | | | |
| | | | | | | 22,893,309 | |
| | | | | | | | |
| | | | Telecommunication Services - 0.7% | |
| | 62,072 | | | Millicom International Cellular S.A. | | | 2,645,160 | |
| | | | | | | | |
| | | | Transportation - 3.4% | |
| | 82,977 | | | Genesee & Wyoming, Inc. Class A* | | | 5,759,434 | |
| | 171,339 | | | Knight Transportation, Inc. | | | 5,662,754 | |
| | 17,241 | | | Ryder System, Inc. | | | 1,283,420 | |
| | | | | | | | |
| | | | | | | 12,705,608 | |
| | | | | | | | |
| | | | Utilities - 4.9% | |
| | 162,370 | | | Alliant Energy Corp. | | | 6,152,199 | |
| | 131,392 | | | Great Plains Energy, Inc. | | | 3,593,571 | |
| | 193,681 | | | UGI Corp. | | | 8,924,821 | |
| | | | | | | | |
| | | | | | | 18,670,591 | |
| | | | | | | | |
| | |
| | | | Total Common Stocks
(cost $310,461,920) | | $ | 374,149,120 | |
| | | | | | | | |
| | |
| | | | Total Long-Term Investments
(cost $310,461,920) | | $ | 374,149,120 | |
| | | | | | | | |
|
| SHORT-TERM INVESTMENTS - 1.0% | |
| | | | Other Investment Pools & Funds - 1.0% | |
| | 3,772,166 | | | Morgan Stanley Institutional Liquidity Funds, Institutional Class | | $ | 3,772,166 | |
| | | | | | | | |
| | |
| | | | Total Short-Term Investments
(cost $3,772,166) | | $ | 3,772,166 | |
| | | | | | | | |
| | | | | | | | | | | | |
| | | |
| | | | Total Investments
(cost $314,234,086)^ | | | 99.6 | % | | $ | 377,921,286 | |
| | | | Other Assets and Liabilities | | | 0.4 | % | | | 1,654,750 | |
| | | | | | | | | | | | |
| | | | Total Net Assets | | | 100.0 | % | | $ | 379,576,036 | |
| | | | | | | | | | | | |
The accompanying notes are an integral part of these financial statements.
|
| Hartford MidCap Value HLS Fund |
Schedule of Investments – (continued)
December 31, 2016
| Note: | Percentage of investments as shown is the ratio of the total market value to total net assets. |
| | Prices of foreign equities that are principally traded on certain foreign markets will generally be adjusted daily pursuant to a fair value pricing service approved by the Board of Directors in order to reflect an adjustment for factors occurring after the close of certain foreign markets but before the close of the New York Stock Exchange. |
| | Equity industry classifications used in this report are the Global Industry Classification Standard, which was developed by and is the exclusive property and service mark of MSCI, Inc. and Standard & Poor’s. |
| | For Fund compliance purposes, the Fund may not use the same classification system shown in this report as these classifications are used for financial reporting purposes. |
| ^ | At December 31, 2016, the cost of securities for federal income tax purposes was $315,428,716 and the aggregate gross unrealized appreciation and depreciation based on that cost were: |
| | | | |
Unrealized Appreciation | | $ | 81,967,065 | |
Unrealized Depreciation | | | (19,474,495 | ) |
| | | | |
Net Unrealized Appreciation | | $ | 62,492,570 | |
| | | | |
| † | See Significant Accounting Policies of accompanying Notes to Financial Statements regarding valuation of investments. |
| | |
| GLOSSARY: (abbreviations used in preceding Schedule of Investments) |
|
| Other Abbreviations: |
ADR | | American Depositary Receipt |
MSCI | | Morgan Stanley Capital International |
REIT | | Real Estate Investment Trust |
The accompanying notes are an integral part of these financial statements.
|
| Hartford MidCap Value HLS Fund |
Schedule of Investments – (continued)
December 31, 2016
Fair Valuation Summary
The following is a summary of the fair valuations according to the inputs used as of December 31, 2016 in valuing the Fund’s investments.
| | | | | | | | | | | | | | | | |
| | | Total | | | Level 1(1) | | | Level 2(1) | | | Level 3(1) | |
Assets | |
Common Stocks | |
Automobiles & Components | | $ | 5,274,047 | | | $ | 5,274,047 | | | $ | — | | | $ | — | |
Banks | | | 52,083,234 | | | | 52,083,234 | | | | — | | | | — | |
Capital Goods | | | 28,586,429 | | | | 23,418,700 | | | | 5,167,729 | | | | — | |
Commercial & Professional Services | | | 4,822,842 | | | | 4,822,842 | | | | — | | | | — | |
Consumer Durables & Apparel | | | 15,921,482 | | | | 11,220,633 | | | | 4,700,849 | | | | — | |
Consumer Services | | | 6,550,500 | | | | 6,550,500 | | | | — | | | | — | |
Diversified Financials | | | 3,815,642 | | | | 3,815,642 | | | | — | | | | — | |
Energy | | | 32,814,155 | | | | 32,814,155 | | | | — | | | | — | |
Food, Beverage & Tobacco | | | 8,558,315 | | | | 8,558,315 | | | | — | | | | — | |
Health Care Equipment & Services | | | 10,273,029 | | | | 10,273,029 | | | | — | | | | — | |
Insurance | | | 34,246,069 | | | | 34,246,069 | | | | — | | | | — | |
Materials | | | 36,155,545 | | | | 36,155,545 | | | | — | | | | — | |
Media | | | 9,285,583 | | | | 9,285,583 | | | | — | | | | — | |
Pharmaceuticals, Biotechnology & Life Sciences | | | 3,017,847 | | | | 3,017,847 | | | | — | | | | — | |
Real Estate | | | 30,043,894 | | | | 30,043,894 | | | | — | | | | — | |
Retailing | | | 3,425,337 | | | | 3,425,337 | | | | — | | | | — | |
Semiconductors & Semiconductor Equipment | | | 22,394,841 | | | | 22,394,841 | | | | — | | | | — | |
Software & Services | | | 9,965,661 | | | | 9,965,661 | | | | — | | | | — | |
Technology Hardware & Equipment | | | 22,893,309 | | | | 22,893,309 | | | | — | | | | — | |
Telecommunication Services | | | 2,645,160 | | | | — | | | | 2,645,160 | | | | — | |
Transportation | | | 12,705,608 | | | | 12,705,608 | | | | — | | | | — | |
Utilities | | | 18,670,591 | | | | 18,670,591 | | | | — | | | | — | |
Short-Term Investments | | | 3,772,166 | | | | 3,772,166 | | | | — | | | | — | |
| | | | | | | | | | | | | | | | |
Total | | $ | 377,921,286 | | | $ | 365,407,548 | | | $ | 12,513,738 | | | $ | — | |
| | | | | | | | | | | | | | | | |
| (1) | For the year ended December 31, 2016, there were no transfers between any levels. |
The following is a rollforward of the Fund’s investments that were valued using unobservable inputs (Level 3) for the year ended December 31, 2016:
| | | | | | | | |
| | | Common
Stocks | | | Total | |
Beginning balance | | $ | 97,610 | | | $ | 97,610 | |
Purchases | | | — | | | �� | — | |
Sales | | | (108,456 | ) | | | (108,456 | ) |
Accrued discounts/(premiums) | | | — | | | | — | |
Total realized gain/(loss) | | | (23,990 | ) | | | (23,990 | ) |
Net change in unrealized appreciation/depreciation | | | 34,836 | | | | 34,836 | |
Transfers into Level 3 | | | — | | | | — | |
Transfers out of Level 3 | | | — | | | | — | |
| | | | | | | | |
Ending balance | | $ | — | | | $ | — | |
| | | | | | | | |
The change in net unrealized appreciation/depreciation relating to the Level 3 investments held at December 31, 2016 was $0.
The accompanying notes are an integral part of these financial statements.
|
| Hartford Small Cap Growth HLS Fund |
Schedule of Investments
December 31, 2016
| | | | | | | | |
Shares or Principal Amount | | Market Value† | |
| COMMON STOCKS - 95.3% | |
| | | | Automobiles & Components - 2.0% | |
| | 28,100 | | | American Axle & Manufacturing Holdings, Inc.* | | $ | 542,330 | |
| | 13,116 | | | Cooper Tire & Rubber Co. | | | 509,557 | |
| | 13,285 | | | Cooper-Standard Holding, Inc.* | | | 1,373,403 | |
| | 5,982 | | | LCI Industries | | | 644,560 | |
| | 246,060 | | | Tenneco, Inc.* | | | 15,371,368 | |
| | 60,543 | | | Visteon Corp. | | | 4,864,025 | |
| | 14,700 | | | Winnebago Industries, Inc. | | | 465,255 | |
| | | | | | | | |
| | | | | | | 23,770,498 | |
| | | | | | | | |
| | | | Banks - 4.8% | |
| | 20,504 | | | Banc of California, Inc. | | | 355,744 | |
| | 21,784 | | | Enterprise Financial Services Corp. | | | 936,712 | |
| | 41,441 | | | Essent Group Ltd.* | | | 1,341,445 | |
| | 103,499 | | | FCB Financial Holdings, Inc. Class A* | | | 4,936,902 | |
| | 173,600 | | | First Hawaiian, Inc. | | | 6,044,752 | |
| | 314,777 | | | First Merchants Corp. | | | 11,851,354 | |
| | 123,845 | | | Great Western Bancorp, Inc. | | | 5,398,404 | |
| | 13,638 | | | HomeStreet, Inc.* | | | 430,961 | |
| | 84,773 | | | IBERIABANK Corp. | | | 7,099,739 | |
| | 571,825 | | | MGIC Investment Corp.* | | | 5,826,897 | |
| | 122,561 | | | Sandy Spring Bancorp, Inc. | | | 4,901,214 | |
| | 317,652 | | | Sterling Bancorp | | | 7,433,057 | |
| | 18,827 | | | Walker & Dunlop, Inc.* | | | 587,402 | |
| | | | | | | | |
| | | | | | | 57,144,583 | |
| | | | | | | | |
| | | | Capital Goods - 9.7% | |
| | 237,380 | | | AAON, Inc. | | | 7,845,409 | |
| | 21,800 | | | Aegion Corp.* | | | 516,660 | |
| | 209,450 | | | Altra Industrial Motion Corp. | | | 7,728,705 | |
| | 90,521 | | | American Woodmark Corp.* | | | 6,811,705 | |
| | 13,131 | | | Argan, Inc. | | | 926,392 | |
| | 136,966 | | | Armstrong World Industries, Inc.* | | | 5,725,179 | |
| | 159,539 | | | Astronics Corp.* | | | 5,398,800 | |
| | 143,589 | | | AZZ, Inc. | | | 9,175,337 | |
| | 10,522 | | | Comfort Systems USA, Inc. | | | 350,383 | |
| | 59,206 | | | Continental Building Products, Inc.* | | | 1,367,659 | |
| | 14,604 | | | Encore Wire Corp. | | | 633,083 | |
| | 49,100 | | | Energy Recovery, Inc.* | | | 508,185 | |
| | 8,200 | | | EnerSys | | | 640,420 | |
| | 73,206 | | | Esterline Technologies Corp.* | | | 6,529,975 | |
| | 219,700 | | | Generac Holdings, Inc.* | | | 8,950,578 | |
| | 27,596 | | | Gibraltar Industries, Inc.* | | | 1,149,373 | |
| | 33,202 | | | Global Brass & Copper Holdings, Inc. | | | 1,138,829 | |
| | 14,900 | | | Greenbrier Cos., Inc. | | | 619,095 | |
| | 92,967 | | | Heico Corp. Class A | | | 6,312,459 | |
| | 13,459 | | | Hyster-Yale Materials Handling, Inc. | | | 858,281 | |
| | 15,228 | | | Insteel Industries, Inc. | | | 542,726 | |
| | 42,342 | | | Lennox International, Inc. | | | 6,485,524 | |
| | 12,500 | | | Lydall, Inc.* | | | 773,125 | |
| | 186,924 | | | Manitowoc Foodservice, Inc.* | | | 3,613,241 | |
| | 49,956 | | | MasTec, Inc.* | | | 1,910,817 | |
| | 123,924 | | | Meritor, Inc.* | | | 1,539,136 | |
| | 53,300 | | | MRC Global, Inc.* | | | 1,079,858 | |
| | 25,163 | | | Navistar International Corp.* | | | 789,363 | |
| | 31,434 | | | NCI Building Systems, Inc.* | | | 491,942 | |
| | 130,128 | | | SiteOne Landscape Supply, Inc.* | | | 4,519,346 | |
| | 73,510 | | | TASER International, Inc.* | | | 1,781,882 | |
| | 74,262 | | | Teledyne Technologies, Inc.* | | | 9,134,226 | |
| | 102,556 | | | Toro Co. | | | 5,738,008 | |
| | 46,147 | | | Trex Co., Inc.* | | | 2,971,867 | |
| | 14,767 | | | Universal Forest Products, Inc. | | | 1,508,892 | |
| | 22,845 | | | Wabash National Corp.* | | | 361,408 | |
| | | | | | | | |
| | | | | | | 116,427,868 | |
| | | | | | | | |
| | | | | | | | |
Shares or Principal Amount | | Market Value† | |
| COMMON STOCKS - 95.3% - (continued) | |
| | | | Commercial & Professional Services - 4.4% | |
| | 37,941 | | | Brink’s Co. | | $ | 1,565,066 | |
| | 137,972 | | | Deluxe Corp. | | | 9,880,175 | |
| | 135,427 | | | Exponent, Inc. | | | 8,166,248 | |
| | 83,805 | | | GP Strategies Corp.* | | | 2,396,823 | |
| | 54,873 | | | Herman Miller, Inc. | | | 1,876,657 | |
| | 8,620 | | | HNI Corp. | | | 482,030 | |
| | 124,732 | | | Huron Consulting Group, Inc.* | | | 6,317,676 | |
| | 19,779 | | | Insperity, Inc. | | | 1,403,320 | |
| | 192,411 | | | On Assignment, Inc.* | | | 8,496,870 | |
| | 21,500 | | | Quad/Graphics, Inc. | | | 577,920 | |
| | 60,523 | | | RPX Corp.* | | | 653,648 | |
| | 53,153 | | | TriNet Group, Inc.* | | | 1,361,780 | |
| | 131,747 | | | WageWorks, Inc.* | | | 9,551,658 | |
| | | | | | | | |
| | | | | | | 52,729,871 | |
| | | | | | | | |
| | | | Consumer Durables & Apparel - 3.4% | |
| | 18,377 | | | American Outdoor Brands Corp.* | | | 387,387 | |
| | 38,100 | | | Callaway Golf Co. | | | 417,576 | |
| | 68,802 | | | Carter’s, Inc. | | | 5,943,805 | |
| | 18,601 | | | iRobot Corp.* | | | 1,087,228 | |
| | 433,490 | | | Kate Spade & Co.* | | | 8,093,258 | |
| | 16,809 | | | La-Z-Boy, Inc. | | | 521,919 | |
| | 19,297 | | | Movado Group, Inc. | | | 554,789 | |
| | 256,270 | | | Steven Madden Ltd.* | | | 9,161,653 | |
| | 8,601 | | | Sturm Ruger & Co., Inc. | | | 453,273 | |
| | 221,800 | | | TopBuild Corp.* | | | 7,896,080 | |
| | 168,243 | | | Vista Outdoor, Inc.* | | | 6,208,167 | |
| | | | | | | | |
| | | | | | | 40,725,135 | |
| | | | | | | | |
| | | | Consumer Services - 5.1% | |
| | 19,500 | | | American Public Education, Inc.* | | | 478,725 | |
| | 8,565 | | | BJ’s Restaurants, Inc.* | | | 336,605 | |
| | 472,590 | | | Bloomin’ Brands, Inc. | | | 8,520,798 | |
| | 27,748 | | | Capella Education Co. | | | 2,436,274 | |
| | 39,300 | | | Cheesecake Factory, Inc. | | | 2,353,284 | |
| | 8,908 | | | Dave & Buster’s Entertainment, Inc.* | | | 501,520 | |
| | 43,700 | | | DeVry Education Group, Inc. | | | 1,363,440 | |
| | 10,785 | | | Domino’s Pizza, Inc. | | | 1,717,403 | |
| | 158,507 | | | Dunkin’ Brands Group, Inc. | | | 8,312,107 | |
| | 27,742 | | | Grand Canyon Education, Inc.* | | | 1,621,520 | |
| | 482,228 | | | La Quinta Holdings, Inc.* | | | 6,852,460 | |
| | 115,573 | | | Marriott Vacations Worldwide Corp. | | | 9,806,369 | |
| | 74,769 | | | Papa John’s International, Inc. | | | 6,398,731 | |
| | 31,291 | | | Scientific Games Corp. Class A* | | | 438,074 | |
| | 29,939 | | | Sotheby’s* | | | 1,193,369 | |
| | 15,289 | | | Strayer Education, Inc.* | | | 1,232,752 | |
| | 18,384 | | | Texas Roadhouse, Inc. | | | 886,844 | |
| | 219,378 | | | Wingstop, Inc. | | | 6,491,395 | |
| | | | | | | | |
| | | | | | | 60,941,670 | |
| | | | | | | | |
| | | | Diversified Financials - 1.2% | |
| | 156,296 | | | Evercore Partners, Inc. Class A | | | 10,737,535 | |
| | 32,170 | | | Green Dot Corp. Class A* | | | 757,604 | |
| | 91,381 | | | KCG Holdings, Inc. Class A* | | | 1,210,798 | |
| | 99,249 | | | OneMain Holdings, Inc.* | | | 2,197,373 | |
| | | | | | | | |
| | | | | | | 14,903,310 | |
| | | | | | | | |
| | | | Energy - 2.1% | |
| | 103,500 | | | Bill Barrett Corp.* | | | 723,465 | |
| | 8,200 | | | Carrizo Oil & Gas, Inc.* | | | 306,270 | |
| | 164,370 | | | PBF Energy, Inc. Class A | | | 4,582,635 | |
| | 61,322 | | | PDC Energy, Inc.* | | | 4,450,751 | |
| | 48,858 | | | Pioneer Energy Services Corp.* | | | 334,677 | |
| | 20,315 | | | REX American Resources Corp.* | | | 2,006,106 | |
The accompanying notes are an integral part of these financial statements.
|
| Hartford Small Cap Growth HLS Fund |
Schedule of Investments – (continued)
December 31, 2016
| | | | | | | | |
Shares or Principal Amount | | Market Value† | |
| COMMON STOCKS - 95.3% - (continued) | |
| | | | Energy - 2.1% - (continued) | |
| | 160,069 | | | RSP Permian, Inc.* | | $ | 7,142,279 | |
| | 117,220 | | | Sanchez Energy Corp.* | | | 1,058,497 | |
| | 283,900 | | | WildHorse Resource Development Corp.* | | | 4,144,940 | |
| | | | | | | | |
| | | | | | | 24,749,620 | |
| | | | | | | | |
| | | | Food & Staples Retailing - 1.4% | |
| | 66,940 | | | Casey’s General Stores, Inc. | | | 7,957,827 | |
| | 6,429 | | | Ingles Markets, Inc. Class A | | | 309,235 | |
| | 94,739 | | | PriceSmart, Inc. | | | 7,910,707 | |
| | | | | | | | |
| | | | | | | 16,177,769 | |
| | | | | | | | |
| | | | Food, Beverage & Tobacco - 1.5% | |
| | 22,315 | | | Fresh Del Monte Produce, Inc. | | | 1,352,959 | |
| | 20,076 | | | National Beverage Corp. | | | 1,025,482 | |
| | 69,591 | | | Pilgrim’s Pride Corp. | | | 1,321,533 | |
| | 99,170 | | | Post Holdings, Inc.* | | | 7,972,276 | |
| | 10,255 | | | Sanderson Farms, Inc. | | | 966,431 | |
| | 77,526 | | | TreeHouse Foods, Inc.* | | | 5,596,602 | |
| | | | | | | | |
| | | | | | | 18,235,283 | |
| | | | | | | | |
| | | | Health Care Equipment & Services - 9.2% | |
| | 101,000 | | | Acadia Healthcare Co., Inc.* | | | 3,343,100 | |
| | 164,721 | | | Anika Therapeutics, Inc.* | | | 8,064,740 | |
| | 15,485 | | | Atrion Corp. | | | 7,853,992 | |
| | 161,513 | | | Cardiovascular Systems, Inc.* | | | 3,910,230 | |
| | 6,047 | | | Chemed Corp. | | | 969,999 | |
| | 158,113 | | | Cynosure, Inc. Class A* | | | 7,209,953 | |
| | 24,517 | | | Glaukos Corp.* | | | 840,933 | |
| | 305,694 | | | Globus Medical, Inc. Class A* | | | 7,584,268 | |
| | 36,162 | | | HealthEquity, Inc.* | | | 1,465,284 | |
| | 93,217 | | | HMS Holdings Corp.* | | | 1,692,821 | |
| | 66,973 | | | ICU Medical, Inc.* | | | 9,868,472 | |
| | 10,719 | | | Inogen, Inc.* | | | 719,995 | |
| | 74,974 | | | Integra LifeSciences Holdings Corp.* | | | 6,432,020 | |
| | 20,521 | | | Magellan Health, Inc.* | | | 1,544,205 | |
| | 47,281 | | | Masimo Corp.* | | | 3,186,739 | |
| | 28,730 | | | Medidata Solutions, Inc.* | | | 1,427,019 | |
| | 199,734 | | | Natus Medical, Inc.* | | | 6,950,743 | |
| | 181,776 | | | Omnicell, Inc.* | | | 6,162,207 | |
| | 19,700 | | | Surgical Care Affiliates, Inc.* | | | 911,519 | |
| | 36,526 | | | Triple-S Management Corp. Class B* | | | 756,088 | |
| | 93,230 | | | U.S. Physical Therapy, Inc. | | | 6,544,746 | |
| | 186,425 | | | Vascular Solutions, Inc.* | | | 10,458,443 | |
| | 91,428 | | | WellCare Health Plans, Inc.* | | | 12,532,950 | |
| | | | | | | | |
| | | | | | | 110,430,466 | |
| | | | | | | | |
| | | | Household & Personal Products - 0.1% | |
| | 15,542 | | | Medifast, Inc. | | | 647,013 | |
| | 15,815 | | | Usana Health Sciences, Inc.* | | | 967,878 | |
| | | | | | | | |
| | | | | | | 1,614,891 | |
| | | | | | | | |
| | | | Insurance - 1.7% | |
| | 71,157 | | | Ambac Financial Group, Inc.* | | | 1,601,032 | |
| | 127,076 | | | AMERISAFE, Inc. | | | 7,923,188 | |
| | 6,727 | | | Federated National Holding Co. | | | 125,728 | |
| | 55,411 | | | Greenlight Capital Re Ltd. Class A* | | | 1,263,371 | |
| | 152,465 | | | James River Group Holdings Ltd. | | | 6,334,921 | |
| | 87,473 | | | Maiden Holdings Ltd. | | | 1,526,404 | |
| | 40,721 | | | MBIA, Inc.* | | | 435,715 | |
| | 6,797 | | | Primerica, Inc. | | | 470,012 | |
| | 44,255 | | | Universal Insurance Holdings, Inc. | | | 1,256,842 | |
| | | | | | | | |
| | | | | | | 20,937,213 | |
| | | | | | | | |
| | | | | | | | |
Shares or Principal Amount | | Market Value† | |
| COMMON STOCKS - 95.3% - (continued) | |
| | | | Materials - 4.0% | |
| | 254,177 | | | Boise Cascade Co.* | | $ | 5,718,982 | |
| | 68,658 | | | Chemours Co. | | | 1,516,655 | |
| | 27,590 | | | Clearwater Paper Corp.* | | | 1,808,525 | |
| | 80,100 | | | Cliffs Natural Resources, Inc.* | | | 673,641 | |
| | 65,253 | | | Coeur Mining, Inc.* | | | 593,150 | |
| | 632,156 | | | Graphic Packaging Holding Co. | | | 7,889,307 | |
| | 248,570 | | | Headwaters, Inc.* | | | 5,846,366 | |
| | 5,202 | | | Innospec, Inc. | | | 356,337 | |
| | 31,338 | | | Koppers Holdings, Inc.* | | | 1,262,921 | |
| | 198,500 | | | Louisiana-Pacific Corp.* | | | 3,757,605 | |
| | 538,957 | | | OMNOVA Solutions, Inc.* | | | 5,389,570 | |
| | 261,917 | | | PolyOne Corp. | | | 8,391,821 | |
| | 23,260 | | | Stepan Co. | | | 1,895,225 | |
| | 31,905 | | | Trinseo S.A. | | | 1,891,967 | |
| | 22,271 | | | Worthington Industries, Inc. | | | 1,056,536 | |
| | | | | | | | |
| | | | | | | 48,048,608 | |
| | | | | | | | |
| | | | Media - 0.1% | |
| | 16,816 | | | MSG Networks, Inc. Class A* | | | 361,544 | |
| | 33,218 | | | New Media Investment Group, Inc. | | | 531,156 | |
| | | | | | | | |
| | | | | | | 892,700 | |
| | | | | | | | |
| | | | Pharmaceuticals, Biotechnology & Life Sciences - 9.4% | |
| | 165,127 | | | Aerie Pharmaceuticals, Inc.* | | | 6,250,057 | |
| | 48,779 | | | Agios Pharmaceuticals, Inc.* | | | 2,035,548 | |
| | 203,760 | | | Alder Biopharmaceuticals, Inc.* | | | 4,238,208 | |
| | 14,000 | | | AMAG Pharmaceuticals, Inc.* | | | 487,200 | |
| | 309,390 | | | Amicus Therapeutics, Inc.* | | | 1,537,668 | |
| | 342,340 | | | Aratana Therapeutics, Inc.* | | | 2,458,001 | |
| | 244,140 | | | ARIAD Pharmaceuticals, Inc.* | | | 3,037,102 | |
| | 30,132 | | | BioSpecifics Technologies Corp.* | | | 1,678,352 | |
| | 68,847 | | | Bluebird Bio, Inc.* | | | 4,247,860 | |
| | 31,543 | | | Cambrex Corp.* | | | 1,701,745 | |
| | 168,454 | | | Coherus Biosciences, Inc.* | | | 4,741,980 | |
| | 36,400 | | | Depomed, Inc.* | | | 655,928 | |
| | 54,382 | | | Emergent Biosolutions, Inc.* | | | 1,785,905 | |
| | 13,634 | | | Enanta Pharmaceuticals, Inc.* | | | 456,739 | |
| | 202,495 | | | Exelixis, Inc.* | | | 3,019,201 | |
| | 32,058 | | | FibroGen, Inc.* | | | 686,041 | |
| | 170,780 | | | Five Prime Therapeutics, Inc.* | | | 8,557,786 | |
| | 181,520 | | | Flexion Therapeutics, Inc.* | | | 3,452,510 | |
| | 125,885 | | | GlycoMimetics, Inc.* | | | 767,899 | |
| | 36,000 | | | Impax Laboratories, Inc.* | | | 477,000 | |
| | 29,065 | | | INC Research Holdings, Inc. Class A* | | | 1,528,819 | |
| | 43,157 | | | Innoviva, Inc.* | | | 461,780 | |
| | 28,219 | | | Insys Therapeutics, Inc.* | | | 259,615 | |
| | 201,231 | | | Intersect ENT, Inc.* | | | 2,434,895 | |
| | 118,764 | | | Ionis Pharmaceuticals, Inc.* | | | 5,680,482 | |
| | 90,829 | | | Ironwood Pharmaceuticals, Inc.* | | | 1,388,775 | |
| | 94,101 | | | Lexicon Pharmaceuticals, Inc.* | | | 1,301,417 | |
| | 50,544 | | | Luminex Corp.* | | | 1,022,505 | |
| | 159,247 | | | Medicines Co.* | | | 5,404,843 | |
| | 19,902 | | | Myriad Genetics, Inc.* | | | 331,766 | |
| | 106,456 | | | Neurocrine Biosciences, Inc.* | | | 4,119,847 | |
| | 228,888 | | | Otonomy, Inc.* | | | 3,639,319 | |
| | 14,328 | | | Pacira Pharmaceuticals, Inc.* | | | 462,794 | |
| | 17,157 | | | PAREXEL International Corp.* | | | 1,127,558 | |
| | 644,362 | | | PDL BioPharma, Inc. | | | 1,366,047 | |
| | 155,227 | | | Portola Pharmaceuticals, Inc.* | | | 3,483,294 | |
| | 46,917 | | | PRA Health Sciences, Inc.* | | | 2,586,065 | |
| | 41,087 | | | Prestige Brands Holdings, Inc.* | | | 2,140,633 | |
| | 144,541 | | | PTC Therapeutics, Inc.* | | | 1,576,942 | |
The accompanying notes are an integral part of these financial statements.
|
| Hartford Small Cap Growth HLS Fund |
Schedule of Investments – (continued)
December 31, 2016
| | | | | | | | |
Shares or Principal Amount | | Market Value† | |
| COMMON STOCKS - 95.3% - (continued) | |
| | | | Pharmaceuticals, Biotechnology & Life Sciences - 9.4% - (continued) | |
| | 10,200 | | | Puma Biotechnology, Inc.* | | $ | 313,140 | |
| | 69,600 | | | Seres Therapeutics, Inc.* | | | 689,040 | |
| | 75,519 | | | Supernus Pharmaceuticals, Inc.* | | | 1,906,855 | |
| | 78,304 | | | TESARO, Inc.* | | | 10,530,322 | |
| | 27,362 | | | Trevena, Inc.* | | | 160,889 | |
| | 78,337 | | | Ultragenyx Pharmaceutical, Inc.* | | | 5,507,875 | |
| | 67,586 | | | Vanda Pharmaceuticals, Inc.* | | | 1,077,997 | |
| | | | | | | | |
| | | | | | | 112,776,244 | |
| | | | | | | | |
| | | | Real Estate - 3.3% | |
| | 83,065 | | | CareTrust, Inc. REIT | | | 1,272,556 | |
| | 132,889 | | | Coresite Realty Corp. REIT | | | 10,547,400 | |
| | 45,500 | | | Gramercy Property Trust REIT | | | 417,690 | |
| | 236,978 | | | HFF, Inc. Class A REIT | | | 7,168,585 | |
| | 219,994 | | | LaSalle Hotel Properties REIT | | | 6,703,217 | |
| | 28,800 | | | Medical Properties Trust, Inc. REIT | | | 354,240 | |
| | 111,163 | | | Pennsylvania REIT | | | 2,107,650 | |
| | 19,452 | | | Physicians Realty Trust REIT | | | 368,810 | |
| | 46,394 | | | RLJ Lodging Trust REIT | | | 1,136,189 | |
| | 17,400 | | | Sabra Healthcare, Inc. REIT | | | 424,908 | |
| | 18,000 | | | STAG Industrial, Inc. REIT | | | 429,660 | |
| | 419,061 | | | Sunstone Hotel Investors, Inc. REIT | | | 6,390,680 | |
| | 12,100 | | | Urban Edge Properties REIT | | | 332,871 | |
| | 168,751 | | | Washington Prime Group, Inc. REIT | | | 1,756,698 | |
| | | | | | | | |
| | | | | | | 39,411,154 | |
| | | | | | | | |
| | | | Retailing - 4.6% | |
| | 97,176 | | | American Eagle Outfitters, Inc. | | | 1,474,160 | |
| | 15,296 | | | Big Lots, Inc. | | | 768,012 | |
| | 25,689 | | | Buckle, Inc. | | | 585,709 | |
| | 100,115 | | | Burlington Stores, Inc.* | | | 8,484,746 | |
| | 8,142 | | | Cato Corp. Class A | | | 244,911 | |
| | 57,100 | | | Chico’s FAS, Inc. | | | 821,669 | |
| | 21,300 | | | Children’s Place, Inc. | | | 2,150,235 | |
| | 187,485 | | | Core-Mark Holding Co., Inc. | | | 8,074,979 | |
| | 98,026 | | | DSW, Inc. Class A | | | 2,220,289 | |
| | 24,910 | | | Finish Line, Inc. Class A | | | 468,557 | |
| | 155,456 | | | Five Below, Inc.* | | | 6,212,022 | |
| | 68,010 | | | Francescas Holding Corp.* | | | 1,226,220 | |
| | 9,571 | | | Hibbett Sports, Inc.* | | | 356,998 | |
| | 114,338 | | | HSN, Inc. | | | 3,921,793 | |
| | 15,139 | | | Liberty TripAdvisor Holdings, Inc. Class A* | | | 227,842 | |
| | 118,643 | | | Monro Muffler Brake, Inc. | | | 6,786,380 | |
| | 19,063 | | | Overstock.com, Inc.* | | | 333,603 | |
| | 29,525 | | | PetMed Express, Inc. | | | 681,142 | |
| | 72,596 | | | Pier 1 Imports, Inc. | | | 619,970 | |
| | 56,733 | | | Select Comfort Corp.* | | | 1,283,301 | |
| | 31,400 | | | Shutterfly, Inc.* | | | 1,575,652 | |
| | 19,900 | | | Tailored Brands, Inc. | | | 508,445 | |
| | 63,960 | | | Tile Shop Holdings, Inc.* | | | 1,250,418 | |
| | 147,805 | | | Wayfair, Inc. Class A* | | | 5,180,565 | |
| | | | | | | | |
| | | | | | | 55,457,618 | |
| | | | | | | | |
| | | | Semiconductors & Semiconductor Equipment - 4.4% | |
| | 49,111 | | | Advanced Energy Industries, Inc.* | | | 2,688,827 | |
| | 98,411 | | | Advanced Micro Devices, Inc.* | | | 1,115,981 | |
| | 20,648 | | | Ambarella, Inc.* | | | 1,117,676 | |
| | 92,774 | | | Amkor Technology, Inc.* | | | 978,766 | |
| | 130,574 | | | Cirrus Logic, Inc.* | | | 7,382,654 | |
| | 37,689 | | | Inphi Corp.* | | | 1,681,683 | |
| | 380,838 | | | Integrated Device Technology, Inc.* | | | 8,972,543 | |
| | 80,550 | | | Kulicke & Soffa Industries, Inc.* | | | 1,284,772 | |
| | 138,835 | | | MACOM Technology Solutions Holdings, Inc.* | | | 6,425,284 | |
| | | | | | | | |
Shares or Principal Amount | | Market Value† | |
| COMMON STOCKS - 95.3% - (continued) | |
| | | | Semiconductors & Semiconductor Equipment - 4.4% - (continued) | |
| | 338,386 | | | MaxLinear, Inc. Class A* | | $ | 7,376,815 | |
| | 177,987 | | | MKS Instruments, Inc. | | | 10,572,428 | |
| | 6,263 | | | Synaptics, Inc.* | | | 335,572 | |
| | 71,437 | | | Tessera Holding Corp. | | | 3,157,515 | |
| | | | | | | | |
| | | | | | | 53,090,516 | |
| | | | | | | | |
| | | | Software & Services - 16.4% | |
| | 135,522 | | | Aspen Technology, Inc.* | | | 7,410,343 | |
| | 56,259 | | | Barracuda Networks, Inc.* | | | 1,205,630 | |
| | 110,224 | | | Blackbaud, Inc. | | | 7,054,336 | |
| | 200,773 | | | Blackhawk Network Holdings, Inc.* | | | 7,564,123 | |
| | 105,040 | | | Bottomline Technologies de, Inc.* | | | 2,628,101 | |
| | 125,461 | | | BroadSoft, Inc.* | | | 5,175,266 | |
| | 51,922 | | | CACI International, Inc. Class A* | | | 6,453,905 | |
| | 296,996 | | | Cardtronics plc Class A* | | | 16,207,072 | |
| | 77,726 | | | Cass Information Systems, Inc. | | | 5,718,302 | |
| | 13,500 | | | CommVault Systems, Inc.* | | | 693,900 | |
| | 85,407 | | | comScore, Inc.* | | | 2,697,153 | |
| | 62,872 | | | Convergys Corp. | | | 1,544,136 | |
| | 10,300 | | | Cornerstone OnDemand, Inc.* | | | 435,793 | |
| | 58,736 | | | CSG Systems International, Inc. | | | 2,842,822 | |
| | 278,734 | | | Envestnet, Inc.* | | | 9,825,374 | |
| | 48,161 | | | EPAM Systems, Inc.* | | | 3,097,234 | |
| | 156,651 | | | Exlservice Holdings, Inc.* | | | 7,901,477 | |
| | 78,287 | | | Fair Isaac Corp. | | | 9,333,376 | |
| | 374,038 | | | Five9, Inc.* | | | 5,307,599 | |
| | 19,977 | | | Gigamon, Inc.* | | | 909,952 | |
| | 212,299 | | | GrubHub, Inc.* | | | 7,986,688 | |
| | 85,361 | | | Guidewire Software, Inc.* | | | 4,210,858 | |
| | 138,894 | | | HubSpot, Inc.* | | | 6,528,018 | |
| | 175,882 | | | j2 Global, Inc. | | | 14,387,148 | |
| | 14,326 | | | LogMeIn, Inc. | | | 1,383,175 | |
| | 40,014 | | | Manhattan Associates, Inc.* | | | 2,121,942 | |
| | 130,652 | | | MAXIMUS, Inc. | | | 7,289,075 | |
| | 13,200 | | | New Relic, Inc. PIPE* | | | 372,900 | |
| | 16,200 | | | NIC, Inc. | | | 387,180 | |
| | 24,193 | | | Paycom Software, Inc.* | | | 1,100,540 | |
| | 165,256 | | | Pegasystems, Inc. | | | 5,949,216 | |
| | 116,078 | | | PTC, Inc.* | | | 5,370,929 | |
| | 81,680 | | | Q2 Holdings, Inc.* | | | 2,356,468 | |
| | 5,629 | | | Science Applications International Corp. | | | 477,339 | |
| | 34,315 | | | Shutterstock, Inc.* | | | 1,630,649 | |
| | 69,836 | | | Sykes Enterprises, Inc.* | | | 2,015,467 | |
| | 140,198 | | | Take-Two Interactive Software, Inc.* | | | 6,910,360 | |
| | 34,246 | | | Tyler Technologies, Inc.* | | | 4,889,302 | |
| | 66,741 | | | WebMD Health Corp.* | | | 3,308,351 | |
| | 71,990 | | | WEX, Inc.* | | | 8,034,084 | |
| | 41,697 | | | Wix.com Ltd.* | | | 1,857,601 | |
| | 213,290 | | | Zendesk, Inc.* | | | 4,521,748 | |
| | | | | | | | |
| | | | | | | 197,094,932 | |
| | | | | | | | |
| | | | Technology Hardware & Equipment - 3.5% | |
| | 85,000 | | | 3D Systems Corp.* | | | 1,129,650 | |
| | 4,578 | | | Belden, Inc. | | | 342,297 | |
| | 261,716 | | | Ciena Corp.* | | | 6,388,488 | |
| | 58,435 | | | ePlus, Inc.* | | | 6,731,712 | |
| | 10,000 | | | Fabrinet* | | | 403,000 | |
| | 15,738 | | | InterDigital, Inc. | | | 1,437,666 | |
| | 77,680 | | | Itron, Inc.* | | | 4,882,188 | |
| | 39,629 | | | Ixia* | | | 638,027 | |
| | 15,300 | | | Lumentum Holdings, Inc.* | | | 591,345 | |
| | 18,473 | | | NETGEAR, Inc.* | | | 1,004,007 | |
| | 140,186 | | | NetScout Systems, Inc.* | | | 4,415,859 | |
The accompanying notes are an integral part of these financial statements.
|
| Hartford Small Cap Growth HLS Fund |
Schedule of Investments – (continued)
December 31, 2016
| | | | | | | | |
Shares or Principal Amount | | Market Value† | |
| COMMON STOCKS - 95.3% - (continued) | |
| | | | Technology Hardware & Equipment - 3.5% - (continued) | |
| | 6,693 | | | Plantronics, Inc. | | $ | 366,509 | |
| | 92,646 | | | Rogers Corp.* | | | 7,116,139 | |
| | 36,051 | | | Sanmina Corp.* | | | 1,321,269 | |
| | 51,489 | | | Ubiquiti Networks, Inc.* | | | 2,976,064 | |
| | 110,458 | | | Vishay Intertechnology, Inc. | | | 1,789,420 | |
| | | | | | | | |
| | | | | | | 41,533,640 | |
| | | | | | | | |
| | | | Telecommunication Services - 0.6% | |
| | 43,254 | | | IDT Corp. Class B | | | 801,929 | |
| | 405,558 | | | ORBCOMM, Inc.* | | | 3,353,965 | |
| | 504,030 | | | Vonage Holdings Corp.* | | | 3,452,605 | |
| | | | | | | | |
| | | | | | | 7,608,499 | |
| | | | | | | | |
| | | | Transportation - 2.3% | |
| | 4,372 | | | Alaska Air Group, Inc. | | | 387,928 | |
| | 11,683 | | | Allegiant Travel Co. | | | 1,944,051 | |
| | 256,308 | | | Celadon Group, Inc. | | | 1,832,602 | |
| | 80,997 | | | Genesee & Wyoming, Inc. Class A* | | | 5,622,002 | |
| | 54,900 | | | Hawaiian Holdings, Inc.* | | | 3,129,300 | |
| | 294,620 | | | Knight Transportation, Inc. | | | 9,737,191 | |
| | 162,161 | | | Marten Transport Ltd. | | | 3,778,351 | |
| | 51,630 | | | Swift Transportation Co.* | | | 1,257,707 | |
| | | | | | | | |
| | | | 27,689,132 | |
| | | | | | | | |
| | | | Utilities - 0.1% | |
| | 7,400 | | | Southwest Gas Corp. | | | 566,988 | |
| | | | | | | | |
| | |
| | | | Total Common Stocks
(cost $995,868,189) | | $ | 1,142,958,208 | |
| | | | | | | | |
| |
| WARRANTS - 0.0% | | | |
| | | | Diversified Financials - 0.0% | |
| | 891 | | | Emergent Capital, Inc. Expires 4/11/19*(1) | | $ | — | |
| | | | | | | | |
| | |
| | | | Total Warrants
(cost $—) | | $ | — | |
| | | | | | | | |
| |
| EXCHANGE TRADED FUNDS - 3.9% | | | |
| | | | Other Investment Pools & Funds - 3.9% | |
| | 299,511 | | | iShares Russell 2000 Growth ETF | | $ | 46,106,723 | |
| | | | | | | | |
| | |
| | | | Total Exchange Traded Funds
(cost $42,523,705) | | $ | 46,106,723 | |
| | | | | | | | |
| | |
| | | | Total Long-Term Investments
(cost $1,038,391,894) | | $ | 1,189,064,931 | |
| | | | | | | | |
| |
| SHORT-TERM INVESTMENTS - 1.1% | | | |
| | | | Other Investment Pools & Funds - 1.1% | |
| | 13,139,763 | | | Morgan Stanley Institutional Liquidity Funds, Institutional Class | | $ | 13,139,763 | |
| | | | | | | | |
| | |
| | | | Total Short-Term Investments
(cost $13,139,763) | | $ | 13,139,763 | |
| | | | | | | | |
| | | | | | | | | | | | |
| | | |
| | | | Total Investments
(cost $1,051,531,657)^ | | | 100.3 | % | | $ | 1,202,204,694 | |
| | | | Other Assets and Liabilities | | | (0.3 | )% | | | (3,072,387 | ) |
| | | | | | | | | | | | |
| | | | Total Net Assets | | | 100.0 | % | | $ | 1,199,132,307 | |
| | | | | | | | | | | | |
The accompanying notes are an integral part of these financial statements.
|
| Hartford Small Cap Growth HLS Fund |
Schedule of Investments – (continued)
December 31, 2016
| Note: | Percentage of investments as shown is the ratio of the total market value to total net assets. |
| | Other than the industry classifications “Other Investment Pools & Funds,” equity industry classifications used in this report are the Global Industry Classification Standard, which was developed by and is the exclusive property and service mark of MSCI, Inc. and Standard & Poor’s. |
| | For Fund compliance purposes, the Fund may not use the same classification system shown in this report as these classifications are used for financial reporting purposes. |
| ^ | At December 31, 2016, the cost of securities for federal income tax purposes was $1,055,764,789 and the aggregate gross unrealized appreciation and depreciation based on that cost were: |
| | | | |
Unrealized Appreciation | | $ | 211,603,681 | |
Unrealized Depreciation | | | (65,163,776 | ) |
| | | | |
Net Unrealized Appreciation | | $ | 146,439,905 | |
| | | | |
| (1) | The following security is considered illiquid. Illiquid securities are often purchased in private placement transactions, are often not registered under the Securities Act of 1933, as amended, and may have contractual restrictions on resale. A security may also be considered illiquid if the security lacks a readily available market or if its valuation has not changed for a certain period of time. |
| | | | | | | | | | | | |
Period
Acquired | | | Shares/Par | | | Security | | Cost | |
| | 04/2014 | | | | 891 | | | Emergent Capital, Inc., Warrants | | $ | — | |
| † | See Significant Accounting Policies of accompanying Notes to Financial Statements regarding valuation of investments. |
| | |
| GLOSSARY: (abbreviations used in preceding Schedule of Investments) |
|
| Other Abbreviations: |
ETF | | Exchange Traded Fund |
PIPE | | Private Investment in Public Equity |
REIT | | Real Estate Investment Trust |
The accompanying notes are an integral part of these financial statements.
|
| Hartford Small Cap Growth HLS Fund |
Schedule of Investments – (continued)
December 31, 2016
Fair Valuation Summary
The following is a summary of the fair valuations according to the inputs used as of December 31, 2016 in valuing the Fund’s investments.
| | | | | | | | | | | | | | | | |
| | | Total | | | Level 1(1) | | | Level 2(1) | | | Level 3(1) | |
Assets | |
Common Stocks | |
Automobiles & Components | | $ | 23,770,498 | | | $ | 23,770,498 | | | $ | — | | | $ | — | |
Banks | | | 57,144,583 | | | | 57,144,583 | | | | — | | | | — | |
Capital Goods | | | 116,427,868 | | | | 116,427,868 | | | | — | | | | — | |
Commercial & Professional Services | | | 52,729,871 | | | | 52,729,871 | | | | — | | | | — | |
Consumer Durables & Apparel | | | 40,725,135 | | | | 40,725,135 | | | | — | | | | — | |
Consumer Services | | | 60,941,670 | | | | 60,941,670 | | | | — | | | | — | |
Diversified Financials | | | 14,903,310 | | | | 14,903,310 | | | | — | | | | — | |
Energy | | | 24,749,620 | | | | 24,749,620 | | | | — | | | | — | |
Food & Staples Retailing | | | 16,177,769 | | | | 16,177,769 | | | | — | | | | — | |
Food, Beverage & Tobacco | | | 18,235,283 | | | | 18,235,283 | | | | — | | | | — | |
Health Care Equipment & Services | | | 110,430,466 | | | | 110,430,466 | | | | — | | | | — | |
Household & Personal Products | | | 1,614,891 | | | | 1,614,891 | | | | — | | | | — | |
Insurance | | | 20,937,213 | | | | 20,937,213 | | | | — | | | | — | |
Materials | | | 48,048,608 | | | | 48,048,608 | | | | — | | | | — | |
Media | | | 892,700 | | | | 892,700 | | | | — | | | | — | |
Pharmaceuticals, Biotechnology & Life Sciences | | | 112,776,244 | | | | 112,776,244 | | | | — | | | | — | |
Real Estate | | | 39,411,154 | | | | 39,411,154 | | | | — | | | | — | |
Retailing | | | 55,457,618 | | | | 55,457,618 | | | | — | | | | — | |
Semiconductors & Semiconductor Equipment | | | 53,090,516 | | | | 53,090,516 | | | | — | | | | — | |
Software & Services | | | 197,094,932 | | | | 197,094,932 | | | | — | | | | — | |
Technology Hardware & Equipment | | | 41,533,640 | | | | 41,533,640 | | | | — | | | | — | |
Telecommunication Services | | | 7,608,499 | | | | 7,608,499 | | | | — | | | | — | |
Transportation | | | 27,689,132 | | | | 27,689,132 | | | | — | | | | — | |
Utilities | | | 566,988 | | | | 566,988 | | | | — | | | | — | |
Warrants | | | — | | | | — | | | | — | | | | — | |
Exchange Traded Funds | | | 46,106,723 | | | | 46,106,723 | | | | — | | | | — | |
Short-Term Investments | | | 13,139,763 | | | | 13,139,763 | | | | — | | | | — | |
| | | | | | | | | | | | | | | | |
Total | | $ | 1,202,204,694 | | | $ | 1,202,204,694 | | | $ | — | | | $ | — | |
| | | | | | | | | | | | | | | | |
| (1) | For the year ended December 31, 2016, there were no transfers between any levels. |
The accompanying notes are an integral part of these financial statements.
|
| Hartford Small Company HLS Fund |
Schedule of Investments
December 31, 2016
| | | | | | | | |
Shares or Principal Amount | | Market Value† | |
| COMMON STOCKS - 93.2% | |
| | | | Automobiles & Components - 1.1% | |
| | 334,716 | | | Fox Factory Holding Corp.* | | $ | 9,288,369 | |
| | 4,850 | | | Tenneco, Inc.* | | | 302,979 | |
| | 1,458 | | | Visteon Corp. | | | 117,136 | |
| | | | | | | | |
| | | | | | | 9,708,484 | |
| | | | | | | | |
| | | | Banks - 6.1% | |
| | 600 | | | Enterprise Financial Services Corp. | | | 25,800 | |
| | 2,426 | | | FCB Financial Holdings, Inc. Class A* | | | 115,720 | |
| | 4,100 | | | First Hawaiian, Inc. | | | 142,762 | |
| | 7,244 | | | First Merchants Corp. | | | 272,737 | |
| | 2,964 | | | Great Western Bancorp, Inc. | | | 129,201 | |
| | 64,022 | | | IBERIABANK Corp. | | | 5,361,843 | |
| | 272,297 | | | MB Financial, Inc. | | | 12,860,587 | |
| | 15,458 | | | MGIC Investment Corp.* | | | 157,517 | |
| | 2,990 | | | Sandy Spring Bancorp, Inc. | | | 119,570 | |
| | 622,366 | | | Sterling Bancorp | | | 14,563,364 | |
| | 467,189 | | | United Community Banks, Inc. | | | 13,838,138 | |
| | 149,719 | | | Western Alliance Bancorp* | | | 7,292,813 | |
| | | | | | | | |
| | | | | | | 54,880,052 | |
| | | | | | | | |
| | | | Capital Goods - 10.0% | |
| | 5,600 | | | AAON, Inc. | | | 185,080 | |
| | 470,591 | | | Advanced Drainage Systems, Inc. | | | 9,694,174 | |
| | 388,442 | | | Altra Industrial Motion Corp. | | | 14,333,510 | |
| | 1,646 | | | American Woodmark Corp.* | | | 123,861 | |
| | 170,852 | | | Applied Industrial Technologies, Inc. | | | 10,148,609 | |
| | 3,182 | | | Armstrong World Industries, Inc.* | | | 133,008 | |
| | 168,540 | | | Astronics Corp.* | | | 5,703,393 | |
| | 2,913 | | | AZZ, Inc. | | | 186,141 | |
| | 1,714 | | | Esterline Technologies Corp.* | | | 152,889 | |
| | 4,554 | | | Generac Holdings, Inc.* | | | 185,530 | |
| | 88,080 | | | Heico Corp. Class A | | | 5,980,632 | |
| | 984 | | | Lennox International, Inc. | | | 150,719 | |
| | 4,327 | | | Manitowoc Foodservice, Inc.* | | | 83,641 | |
| | 177,317 | | | Masonite International Corp.* | | | 11,667,458 | |
| | 160,444 | | | Middleby Corp.* | | | 20,666,792 | |
| | 65,957 | | | Regal-Beloit Corp. | | | 4,567,522 | |
| | 3,041 | | | SiteOne Landscape Supply, Inc.* | | | 105,614 | |
| | 1,708 | | | Teledyne Technologies, Inc.* | | | 210,084 | |
| | 2,504 | | | Toro Co. | | | 140,099 | |
| | 99,643 | | | WESCO International, Inc.* | | | 6,631,242 | |
| | | | | | | | |
| | | | | | | 91,049,998 | |
| | | | | | | | |
| | | | Commercial & Professional Services - 1.7% | |
| | 125,222 | | | Clean Harbors, Inc.* | | | 6,968,604 | |
| | 2,637 | | | Deluxe Corp. | | | 188,836 | |
| | 3,170 | | | Exponent, Inc. | | | 191,151 | |
| | 2,079 | | | GP Strategies Corp.* | | | 59,459 | |
| | 2,535 | | | Huron Consulting Group, Inc.* | | | 128,398 | |
| | 4,539 | | | On Assignment, Inc.* | | | 200,442 | |
| | 110,595 | | | WageWorks, Inc.* | | | 8,018,138 | |
| | | | | | | | |
| | | | | | | 15,755,028 | |
| | | | | | | | |
| | | | Consumer Durables & Apparel - 2.2% | |
| | 1,617 | | | Carter’s, Inc. | | | 139,692 | |
| | 492,016 | | | Kate Spade & Co.* | | | 9,185,939 | |
| | 288,592 | | | Steven Madden Ltd.* | | | 10,317,164 | |
| | 5,158 | | | TopBuild Corp.* | | | 183,625 | |
| | 3,899 | | | Vista Outdoor, Inc.* | | | 143,873 | |
| | | | | | | | |
| | | | | | | 19,970,293 | |
| | | | | | | | |
| | | | | | | | |
Shares or Principal Amount | | Market Value† | |
| COMMON STOCKS - 93.2% - (continued) | |
| | | | Consumer Services - 8.1% | |
| | 10,977 | | | Bloomin’ Brands, Inc. | | $ | 197,915 | |
| | 933,619 | | | ClubCorp Holdings, Inc. | | | 13,397,433 | |
| | 3,742 | | | Dunkin’ Brands Group, Inc. | | | 196,230 | |
| | 182,038 | | | Hyatt Hotels Corp. Class A* | | | 10,059,420 | |
| | 11,686 | | | La Quinta Holdings, Inc.* | | | 166,058 | |
| | 109,383 | | | Marriott Vacations Worldwide Corp. | | | 9,281,148 | |
| | 84,410 | | | Panera Bread Co. Class A* | | | 17,311,647 | |
| | 1,648 | | | Papa John’s International, Inc. | | | 141,036 | |
| | 674,133 | | | Planet Fitness, Inc. Class A | | | 13,550,073 | |
| | 322,931 | | | Wingstop, Inc. | | | 9,555,528 | |
| | | | | | | | |
| | | | | | | 73,856,488 | |
| | | | | | | | |
| | | | Diversified Financials - 2.0% | |
| | 3,532 | | | Evercore Partners, Inc. Class A | | | 242,649 | |
| | 487,666 | | | Hannon Armstrong Sustainable Infrastructure Capital, Inc. REIT | | | 9,260,777 | |
| | 1,200 | | | OneMain Holdings, Inc.* | | | 26,568 | |
| | 773,684 | | | WisdomTree Investments, Inc. | | | 8,618,840 | |
| | | | | | | | |
| | | | | | | 18,148,834 | |
| | | | | | | | |
| | | | Energy - 3.2% | |
| | 44,489 | | | Centennial Resource Development, Inc. PIPE*(1)(2)(3) | | | 792,565 | |
| | 299,291 | | | Centennial Resource Development, Inc. Class A* | | | 5,902,019 | |
| | 465,699 | | | Ensco plc Class A | | | 4,526,594 | |
| | 3,945 | | | PBF Energy, Inc. Class A | | | 109,987 | |
| | 1,367 | | | PDC Energy, Inc.* | | | 99,217 | |
| | 360,384 | | | QEP Resources, Inc. | | | 6,634,669 | |
| | 3,823 | | | RSP Permian, Inc.* | | | 170,582 | |
| | 6,600 | | | WildHorse Resource Development Corp.* | | | 96,360 | |
| | 726,735 | | | WPX Energy, Inc.* | | | 10,588,529 | |
| | | | | | | | |
| | | | | | | 28,920,522 | |
| | | | | | | | |
| | | | Food & Staples Retailing - 0.0% | |
| | 1,557 | | | Casey’s General Stores, Inc. | | | 185,096 | |
| | 2,179 | | | PriceSmart, Inc. | | | 181,947 | |
| | | | | | | | |
| | | | | | | 367,043 | |
| | | | | | | | |
| | | | Food, Beverage & Tobacco - 0.4% | |
| | 66,531 | | | MGP Ingredients, Inc. | | | 3,325,220 | |
| | 2,283 | | | Post Holdings, Inc.* | | | 183,530 | |
| | 1,783 | | | TreeHouse Foods, Inc.* | | | 128,715 | |
| | | | | | | | |
| | | | | | | 3,637,465 | |
| | | | | | | | |
| | | | Health Care Equipment & Services - 8.3% | |
| | 60,766 | | | ABIOMED, Inc.* | | | 6,847,113 | |
| | 208,136 | | | Acadia Healthcare Co., Inc.* | | | 6,889,302 | |
| | 141,823 | | | Align Technology, Inc.* | | | 13,633,445 | |
| | 3,368 | | | Anika Therapeutics, Inc.* | | | 164,897 | |
| | 362 | | | Atrion Corp. | | | 183,606 | |
| | 3,778 | | | Cardiovascular Systems, Inc.* | | | 91,465 | |
| | 3,637 | | | Cynosure, Inc. Class A* | | | 165,847 | |
| | 15,566 | | | DexCom, Inc.* | | | 929,290 | |
| | 7,137 | | | Globus Medical, Inc. Class A* | | | 177,069 | |
| | 1,559 | | | ICU Medical, Inc.* | | | 229,719 | |
| | 76,674 | | | Inogen, Inc.* | | | 5,150,193 | |
| | 532,060 | | | Insulet Corp.* | | | 20,048,021 | |
| | 1,751 | | | Integra LifeSciences Holdings Corp.* | | | 150,218 | |
| | 4,328 | | | Natus Medical, Inc.* | | | 150,614 | |
| | 123,713 | | | Nevro Corp.* | | | 8,988,987 | |
The accompanying notes are an integral part of these financial statements.
|
| Hartford Small Company HLS Fund |
Schedule of Investments – (continued)
December 31, 2016
| | | | | | | | |
Shares or Principal Amount | | Market Value† | |
| COMMON STOCKS - 93.2% - (continued) | |
| | | | Health Care Equipment & Services - 8.3% - (continued) | |
| | 3,989 | | | Omnicell, Inc.* | | $ | 135,227 | |
| | 2,175 | | | U.S. Physical Therapy, Inc. | | | 152,685 | |
| | 4,304 | | | Vascular Solutions, Inc.* | | | 241,455 | |
| | 252,406 | | | Veeva Systems, Inc. Class A* | | | 10,272,924 | |
| | 1,770 | | | WellCare Health Plans, Inc.* | | | 242,632 | |
| | | | | | | | |
| | | | | | | 74,844,709 | |
| | | | | | | | |
| | | | Insurance - 0.9% | |
| | 2,965 | | | AMERISAFE, Inc. | | | 184,868 | |
| | 83,205 | | | Assurant, Inc. | | | 7,726,416 | |
| | 3,557 | | | James River Group Holdings Ltd. | | | 147,793 | |
| | | | | | | | |
| | | | | | | 8,059,077 | |
| | | | | | | | |
| | | | Materials - 2.8% | |
| | 5,998 | | | Boise Cascade Co.* | | | 134,955 | |
| | 14,542 | | | Graphic Packaging Holding Co. | | | 181,484 | |
| | 5,831 | | | Headwaters, Inc.* | | | 137,145 | |
| | 105,028 | | | Ingevity Corp.* | | | 5,761,836 | |
| | 215,408 | | | KapStone Paper & Packaging Corp. | | | 4,749,747 | |
| | 4,641 | | | Louisiana-Pacific Corp.* | | | 87,854 | |
| | 12,416 | | | OMNOVA Solutions, Inc.* | | | 124,160 | |
| | 1,420,313 | | | Platform Specialty Products Corp.* | | | 13,933,271 | |
| | 6,085 | | | PolyOne Corp. | | | 194,963 | |
| | | | | | | | |
| | | | | | | 25,305,415 | |
| | | | | | | | |
| | | | Pharmaceuticals, Biotechnology & Life Sciences - 7.4% | |
| | 229,945 | | | Aerie Pharmaceuticals, Inc.* | | | 8,703,418 | |
| | 1,192 | | | Agios Pharmaceuticals, Inc.* | | | 49,742 | |
| | 196,229 | | | Alder Biopharmaceuticals, Inc.* | | | 4,081,563 | |
| | 7,563 | | | Amicus Therapeutics, Inc.* | | | 37,588 | |
| | 8,369 | | | Aratana Therapeutics, Inc.* | | | 60,089 | |
| | 6,020 | | | ARIAD Pharmaceuticals, Inc.* | | | 74,889 | |
| | 97,361 | | | Bluebird Bio, Inc.* | | | 6,007,174 | |
| | 98,186 | | | Coherus Biosciences, Inc.* | | | 2,763,936 | |
| | 157,770 | | | Five Prime Therapeutics, Inc.* | | | 7,905,855 | |
| | 4,424 | | | Flexion Therapeutics, Inc.* | | | 84,144 | |
| | 96,006 | | | Galapagos N.V. ADR* | | | 6,162,625 | |
| | 182,406 | | | Global Blood Therapeutics, Inc.* | | | 2,635,767 | |
| | 4,333 | | | GlycoMimetics, Inc.* | | | 26,431 | |
| | 4,919 | | | Intersect ENT, Inc.* | | | 59,520 | |
| | 118,496 | | | Ionis Pharmaceuticals, Inc.* | | | 5,667,664 | |
| | 295,468 | | | Ironwood Pharmaceuticals, Inc.* | | | 4,517,706 | |
| | 3,861 | | | Medicines Co.* | | | 131,042 | |
| | 2,468 | | | Neurocrine Biosciences, Inc.* | | | 95,512 | |
| | 247,235 | | | Otonomy, Inc.* | | | 3,931,037 | |
| | 3,794 | | | Portola Pharmaceuticals, Inc.* | | | 85,137 | |
| | 3,746 | | | PTC Therapeutics, Inc.* | | | 40,869 | |
| | 61,913 | | | TESARO, Inc.* | | | 8,326,060 | |
| | 641 | | | Trevena, Inc.* | | | 3,769 | |
| | 85,064 | | | Ultragenyx Pharmaceutical, Inc.* | | | 5,980,850 | |
| | | | | | | | |
| | | | | | | 67,432,387 | |
| | | | | | | | |
| | | | Real Estate - 3.8% | |
| | 140,542 | | | Coresite Realty Corp. REIT | | | 11,154,819 | |
| | 5,580 | | | HFF, Inc. Class A REIT | | | 168,795 | |
| | 615,281 | | | Kennedy-Wilson Holdings, Inc. REIT | | | 12,613,260 | |
| | 336,447 | | | LaSalle Hotel Properties REIT | | | 10,251,540 | |
| | 10,194 | | | Sunstone Hotel Investors, Inc. REIT | | | 155,459 | |
| | | | | | | | |
| | | | | | | 34,343,873 | |
| | | | | | | | |
| | | | | | | | |
Shares or Principal Amount | | Market Value† | |
| COMMON STOCKS - 93.2% - (continued) | |
| | | | Retailing - 3.1% | |
| | 5,016,400 | | | Allstar Co.*(1)(2)(3) | | $ | 5,217,056 | |
| | 2,051 | | | Burlington Stores, Inc.* | | | 173,822 | |
| | 4,366 | | | Core-Mark Holding Co., Inc. | | | 188,044 | |
| | 126,936 | | | Dick’s Sporting Goods, Inc. | | | 6,740,301 | |
| | 2,288 | | | DSW, Inc. Class A | | | 51,823 | |
| | 77,181 | | | Five Below, Inc.* | | | 3,084,153 | |
| | 2,656 | | | HSN, Inc. | | | 91,101 | |
| | 136,937 | | | Monro Muffler Brake, Inc. | | | 7,832,796 | |
| | 104,986 | | | Tory Burch LLC*(1)(2)(3) | | | 4,960,576 | |
| | 3,452 | | | Wayfair, Inc. Class A* | | | 120,993 | |
| | | | | | | | |
| | | | | | | 28,460,665 | |
| | | | | | | | |
| | | | Semiconductors & Semiconductor Equipment - 5.3% | |
| | 129,703 | | | Cavium, Inc.* | | | 8,098,655 | |
| | 2,642 | | | Cirrus Logic, Inc.* | | | 149,379 | |
| | 390,451 | | | Entegris, Inc.* | | | 6,989,073 | |
| | 208,054 | | | Impinj, Inc.* | | | 7,352,628 | |
| | 8,954 | | | Integrated Device Technology, Inc.* | | | 210,956 | |
| | 216,585 | | | MACOM Technology Solutions Holdings, Inc.* | | | 10,023,554 | |
| | 24,231 | | | MaxLinear, Inc. Class A* | | | 528,236 | |
| | 4,165 | | | MKS Instruments, Inc. | | | 247,401 | |
| | 757,260 | | | Tower Semiconductor Ltd.* | | | 14,410,658 | |
| | | | | | | | |
| | | | | | | 48,010,540 | |
| | | | | | | | |
| | | | Software & Services - 18.2% | |
| | 133,497 | | | 2U, Inc.* | | | 4,024,935 | |
| | 3,173 | | | Aspen Technology, Inc.* | | | 173,500 | |
| | 2,568 | | | Blackbaud, Inc. | | | 164,352 | |
| | 226,548 | | | Blackhawk Network Holdings, Inc.* | | | 8,535,196 | |
| | 2,480 | | | Bottomline Technologies de, Inc.* | | | 62,050 | |
| | 201,538 | | | BroadSoft, Inc.* | | | 8,313,442 | |
| | 1,269 | | | CACI International, Inc. Class A* | | | 157,737 | |
| | 5,995 | | | Cardtronics plc Class A* | | | 327,147 | |
| | 1,805 | | | Cass Information Systems, Inc. | | | 132,794 | |
| | 114,407 | | | CommVault Systems, Inc.* | | | 5,880,520 | |
| | 1,994 | | | comScore, Inc.* | | | 62,970 | |
| | 46,752 | | | CoStar Group, Inc.* | | | 8,812,284 | |
| | 138,741 | | | Envestnet, Inc.* | | | 4,890,620 | |
| | 1,131 | | | EPAM Systems, Inc.* | | | 72,735 | |
| | 3,655 | | | Exlservice Holdings, Inc.* | | | 184,358 | |
| | 111,995 | | | Fair Isaac Corp. | | | 13,352,044 | |
| | 334,556 | | | Five9, Inc.* | | | 4,747,350 | |
| | 224,690 | | | Gigamon, Inc.* | | | 10,234,629 | |
| | 318,402 | | | GoDaddy, Inc. Class A* | | | 11,128,150 | |
| | 4,674 | | | GrubHub, Inc.* | | | 175,836 | |
| | 84,003 | | | Guidewire Software, Inc.* | | | 4,143,868 | |
| | 229,510 | | | HubSpot, Inc.* | | | 10,786,970 | |
| | 3,675 | | | j2 Global, Inc. | | | 300,615 | |
| | 871,441 | | | Just Eat plc* | | | 6,261,765 | |
| | 2,997 | | | MAXIMUS, Inc. | | | 167,203 | |
| | 286,346 | | | Mimecast Ltd.* | | | 5,125,593 | |
| | 3,862 | | | Pegasystems, Inc. | | | 139,032 | |
| | 93,117 | | | Proofpoint, Inc.* | | | 6,578,716 | |
| | 2,727 | | | PTC, Inc.* | | | 126,178 | |
| | 2,002 | | | Q2 Holdings, Inc.* | | | 57,758 | |
| | 114,963 | | | SS&C Technologies Holdings, Inc. | | | 3,287,942 | |
| | 70,849 | | | Stamps.com, Inc.* | | | 8,122,838 | |
| | 3,230 | | | Take-Two Interactive Software, Inc.* | | | 159,207 | |
| | 1,069,389 | | | Telogis, Inc.*(1)(2)(3) | | | 3,400,657 | |
| | 8,845 | | | Trade Desk, Inc. Class A* | | | 244,741 | |
| | 802 | | | Tyler Technologies, Inc.* | | | 114,501 | |
|
| Hartford Small Company HLS Fund |
Schedule of Investments – (continued)
December 31, 2016
| | | | | | | | |
Shares or Principal Amount | | Market Value† | |
| COMMON STOCKS - 93.2% - (continued) | |
| | | | Software & Services - 18.2% - (continued) | |
| | 40,301 | | | Ultimate Software Group, Inc.* | | $ | 7,348,887 | |
| | 1,549 | | | WebMD Health Corp.* | | | 76,784 | |
| | 79,486 | | | WEX, Inc.* | | | 8,870,638 | |
| | 251,770 | | | Wix.com Ltd.* | | | 11,216,353 | |
| | 5,097 | | | Zendesk, Inc.* | | | 108,056 | |
| | 192,608 | | | Zillow Group, Inc. Class C* | | | 7,024,414 | |
| | | | | | | | |
| | | | | | | 165,095,365 | |
| | | | | | | | |
| | | | Technology Hardware & Equipment - 3.3% | |
| | 89,223 | | | Arista Networks, Inc.* | | | 8,634,110 | |
| | 6,131 | | | Ciena Corp.* | | | 149,658 | |
| | 52,524 | | | Coherent, Inc.* | | | 7,216,010 | |
| | 1,348 | | | ePlus, Inc.* | | | 155,289 | |
| | 1,807 | | | Itron, Inc.* | | | 113,570 | |
| | 3,368 | | | NetScout Systems, Inc.* | | | 106,092 | |
| | 781,870 | | | Oclaro, Inc.* | | | 6,997,736 | |
| | 2,001 | | | Rogers Corp.* | | | 153,697 | |
| | 71,441 | | | Zebra Technologies Corp. Class A* | | | 6,126,780 | |
| | | | | | | | |
| | | | | | | 29,652,942 | |
| | | | | | | | |
| | | | Telecommunication Services - 0.2% | |
| | 174,750 | | | ORBCOMM, Inc.* | | | 1,445,182 | |
| | 12,321 | | | Vonage Holdings Corp.* | | | 84,399 | |
| | | | | | | | |
| | | | | | | 1,529,581 | |
| | | | | | | | |
| | | | Transportation - 5.1% | |
| | 6,246 | | | Celadon Group, Inc. | | | 44,659 | |
| | 1,836 | | | Genesee & Wyoming, Inc. Class A* | | | 127,437 | |
| | 119,131 | | | Kirby Corp.* | | | 7,922,211 | |
| | 472,287 | | | Knight Transportation, Inc. | | | 15,609,085 | |
| | 3,912 | | | Marten Transport Ltd. | | | 91,149 | |
| | 159,109 | | | Spirit Airlines, Inc.* | | | 9,206,047 | |
| | 537,799 | | | Swift Transportation Co.* | | | 13,100,784 | |
| | | | | | | | |
| | | | | | | 46,101,372 | |
| | | | | | | | |
| | |
| | | | Total Common Stocks
(cost $769,499,828) | | $ | 845,130,133 | |
| | | | | | | | |
|
| EXCHANGE TRADED FUNDS - 2.0% | |
| | | | Other Investment Pools & Funds - 2.0% | |
| | 121,262 | | | iShares Russell 2000 Growth ETF | | $ | 18,667,072 | |
| | | | | | | | |
| | |
| | | | Total Exchange Traded Funds
(cost $18,931,365) | | $ | 18,667,072 | |
| | | | | | | | |
|
| PREFERRED STOCKS - 3.6% | |
| | | | Consumer Services - 0.3% | |
| | 277,018 | | | DraftKings, Inc. Series D*(1)(2)(3) | | $ | 1,099,761 | |
| | 252,844 | | | DraftKings, Inc. Series D-1*(1)(2)(3) | | | 1,319,846 | |
| | | | | | | | |
| | | | | | | 2,419,607 | |
| | | | | | | | |
| | | | Pharmaceuticals, Biotechnology & Life Sciences - 0.0% | |
| | 92,420 | | | Sancilio & Co., Inc.*(1)(2)(3) | | | 290,199 | |
| | | | | | | | |
| | | | Retailing - 0.3% | |
| | 74,004 | | | Honest Co.*(1)(2)(3) | | | 2,554,618 | |
| | | | | | | | |
| | | | Software & Services - 2.8% | |
| | 169,989 | | | Cloudera, Inc.*(1)(2)(3) | | | 2,928,910 | |
| | 410,300 | | | MarkLogic Corp. Series F*(1)(2)(3) | | | 4,230,193 | |
| | 206,888 | | | Nutanix, Inc.*(1)(2)(3) | | | 5,223,251 | |
| | | | | | | | |
Shares or Principal Amount | | Market Value† | |
| PREFERRED STOCKS - 3.6% - (continued) | |
| | | | Software & Services - 2.8% - (continued) | |
| | 1,456,330 | | | Telogis, Inc.*(1)(2)(3) | | $ | 6,411,347 | |
| | 157,023 | | | Veracode, Inc.*(1)(2)(3) | | | 3,220,542 | |
| | 1,026,132 | | | Zuora, Inc. Series F*(1)(2)(3) | | | 3,806,950 | |
| | | | | | | | |
| | | | | | | 25,821,193 | |
| | | | | | | | |
| | | | Telecommunication Services - 0.2% | |
| | 6,478 | | | DocuSign, Inc. Series B*(1)(2)(3) | | | 104,620 | |
| | 1,940 | | | DocuSign, Inc. Series B-1*(1)(2)(3) | | | 31,331 | |
| | 4,655 | | | DocuSign, Inc. Series D*(1)(2)(3) | | | 75,178 | |
| | 100,799 | | | DocuSign, Inc. Series E*(1)(2)(3) | | | 1,627,904 | |
| | | | | | | | |
| | | | | | | 1,839,033 | |
| | | | | | | | |
| | |
| | | | Total Preferred Stocks
(cost $28,676,424) | | $ | 32,924,650 | |
| | | | | | | | |
| | |
| | | | Total Long-Term Investments
(cost $817,107,617) | | $ | 896,721,855 | |
| | | | | | | | |
|
| SHORT-TERM INVESTMENTS - 1.0% | |
| | | | Other Investment Pools & Funds - 1.0% | |
| | 8,865,629 | | | BlackRock Liquidity Funds TempFund Portfolio, Institutional Class | | $ | 8,865,629 | |
| | | | | | | | |
| | |
| | | | Total Short-Term Investments
(cost $8,865,629) | | $ | 8,865,629 | |
| | | | | | | | |
| | | | | | | | | | |
| | | |
| | Total Investments
(cost $825,973,246)^ | | | 99.8 | % | | $ | 905,587,484 | |
| | Other Assets and Liabilities | | | 0.2 | % | | | 1,564,930 | |
| | | | | | | | | | |
| | Total Net Assets | | | 100.0 | % | | $ | 907,152,414 | |
| | | | | | | | | | |
The accompanying notes are an integral part of these financial statements.
|
| Hartford Small Company HLS Fund |
Schedule of Investments – (continued)
December 31, 2016
| Note: | Percentage of investments as shown is the ratio of the total market value to total net assets. |
| | Prices of foreign equities that are principally traded on certain foreign markets will generally be adjusted daily pursuant to a fair value pricing service approved by the Board of Directors in order to reflect an adjustment for factors occurring after the close of certain foreign markets but before the close of the New York Stock Exchange. |
| | Equity industry classifications used in this report are the Global Industry Classification Standard, which was developed by and is the exclusive property and service mark of MSCI, Inc. and Standard & Poor’s. |
| | For Fund compliance purposes, the Fund may not use the same classification system shown in this report as these classifications are used for financial reporting purposes. |
| ^ | At December 31, 2016, the cost of securities for federal income tax purposes was $833,882,672 and the aggregate gross unrealized appreciation and depreciation based on that cost were: |
| | | | |
Unrealized Appreciation | | $ | 111,140,429 | |
Unrealized Depreciation | | | (39,435,617 | ) |
| | | | |
Net Unrealized Appreciation | | $ | 71,704,812 | |
| | | | |
| (1) | The following securities are considered illiquid. Illiquid securities are often purchased in private placement transactions, are often not registered under the Securities Act of 1933, as amended, and may have contractual restrictions on resale. A security may also be considered illiquid if the security lacks a readily available market or if its valuation has not changed for a certain period of time. |
| | | | | | | | | | | | |
Period
Acquired | | | Shares/Par | | | Security | | Cost | |
| | 08/2011 | | | | 5,016,400 | | | Allstar Co. | | $ | 2,182,229 | |
| | 12/2016 | | | | 44,489 | | | Centennial Resource Development, Inc. PIPE | | | 646,870 | |
| | 02/2014 | | | | 169,989 | | | Cloudera, Inc. Preferred | | | 2,475,040 | |
| | 02/2014 | | | | 6,478 | | | DocuSign, Inc. Series B Preferred | | | 85,072 | |
| | 02/2014 | | | | 1,940 | | | DocuSign, Inc. Series B-1 Preferred | | | 25,477 | |
| | 02/2014 | | | | 4,655 | | | DocuSign, Inc. Series D Preferred | | | 61,131 | |
| | 02/2014 | | | | 100,799 | | | DocuSign, Inc. Series E Preferred | | | 1,323,733 | |
| | 07/2015 | | | | 277,018 | | | DraftKings, Inc. Series D Preferred | | | 1,491,990 | |
| | 08/2015 | | | | 252,844 | | | DraftKings, Inc. Series D-1 Preferred | | | 1,938,153 | |
| | 08/2015 | | | | 74,004 | | | Honest Co. Preferred | | | 3,386,053 | |
| | 04/2015 | | | | 410,300 | | | MarkLogic Corp. Series F Preferred | | | 4,765,306 | |
| | 08/2014 | | | | 206,888 | | | Nutanix, Inc. Preferred | | | 2,771,575 | |
| | 07/2015 | | | | 92,420 | | | Sancilio & Co., Inc. Preferred | | | 349,066 | |
| | 09/2013 | | | | 1,069,389 | | | Telogis, Inc. | | | 2,118,567 | |
| | 09/2013 | | | | 1,456,330 | | | Telogis, Inc. Preferred | | | 3,205,674 | |
| | 11/2013 | | | | 104,986 | | | Tory Burch LLC | | | 8,228,416 | |
| | 08/2014 | | | | 157,023 | | | Veracode, Inc. Preferred | | | 2,899,571 | |
| | 01/2015 | | | | 1,026,132 | | | Zuora, Inc. Series F Preferred | | | 3,898,583 | |
| | | | | | | | | | | | |
| | | $ | 41,852,506 | |
| | | | | | | | | | | | |
| | At December 31, 2016, the aggregate value of these securities was $47,295,504, which represents 5.2% of total net assets. |
| (2) | Securities issued within terms of a private placement memorandum and exempt from registration under Rule 144A under the Securities Act of 1933, as amended, and may be sold only to qualified institutional buyers. Unless otherwise indicated, these holdings are determined to be liquid. At December 31, 2016, the aggregate value of these securities was $47,295,504, which represents 5.2% of total net assets. |
| (3) | These securities are valued in good faith at fair value as determined under policies and procedures established by and under the supervision of the Board of Directors. At December 31, 2016, the aggregate fair value of these securities was $47,295,504, which represents 5.2% of total net assets. This amount excludes securities that are principally traded in certain foreign markets and whose prices are adjusted pursuant to a third party pricing service methodology approved by the Board of Directors. |
| † | See Significant Accounting Policies of accompanying Notes to Financial Statements regarding valuation of investments. |
| | |
| GLOSSARY: (abbreviations used in preceding Schedule of Investments) |
|
| Other Abbreviations: |
ADR | | American Depositary Receipt |
ETF | | Exchange Traded Fund |
PIPE | | Private Investment in Public Equity |
REIT | | Real Estate Investment Trust |
The accompanying notes are an integral part of these financial statements.
|
| Hartford Small Company HLS Fund |
Schedule of Investments – (continued)
December 31, 2016
Fair Valuation Summary
The following is a summary of the fair valuations according to the inputs used as of December 31, 2016 in valuing the Fund’s investments.
| | | | | | | | | | | | | | | | |
| | | Total | | | Level 1(1) | | | Level 2(1) | | | Level 3(1) | |
Assets | | | | | | | | | | | | | | | | |
Common Stocks | | | | | | | | | | | | | | | | |
Automobiles & Components | | $ | 9,708,484 | | | $ | 9,708,484 | | | $ | — | | | $ | — | |
Banks | | | 54,880,052 | | | | 54,880,052 | | | | — | | | | — | |
Capital Goods | | | 91,049,998 | | | | 91,049,998 | | | | — | | | | — | |
Commercial & Professional Services | | | 15,755,028 | | | | 15,755,028 | | | | — | | | | — | |
Consumer Durables & Apparel | | | 19,970,293 | | | | 19,970,293 | | | | — | | | | — | |
Consumer Services | | | 73,856,488 | | | | 73,856,488 | | | | — | | | | — | |
Diversified Financials | | | 18,148,834 | | | | 18,148,834 | | | | — | | | | — | |
Energy | | | 28,920,522 | | | | 28,127,957 | | | | — | | | | 792,565 | |
Food & Staples Retailing | | | 367,043 | | | | 367,043 | | | | — | | | | — | |
Food, Beverage & Tobacco | | | 3,637,465 | | | | 3,637,465 | | | | — | | | | — | |
Health Care Equipment & Services | | | 74,844,709 | | | | 74,844,709 | | | | — | | | | — | |
Insurance | | | 8,059,077 | | | | 8,059,077 | | | | — | | | | — | |
Materials | | | 25,305,415 | | | | 25,305,415 | | | | — | | | | — | |
Pharmaceuticals, Biotechnology & Life Sciences | | | 67,432,387 | | | | 67,432,387 | | | | — | | | | — | |
Real Estate | | | 34,343,873 | | | | 34,343,873 | | | | — | | | | — | |
Retailing | | | 28,460,665 | | | | 18,283,033 | | | | — | | | | 10,177,632 | |
Semiconductors & Semiconductor Equipment | | | 48,010,540 | | | | 48,010,540 | | | | — | | | | — | |
Software & Services | | | 165,095,365 | | | | 155,432,943 | | | | 6,261,765 | | | | 3,400,657 | |
Technology Hardware & Equipment | | | 29,652,942 | | | | 29,652,942 | | | | — | | | | — | |
Telecommunication Services | | | 1,529,581 | | | | 1,529,581 | | | | — | | | | — | |
Transportation | | | 46,101,372 | | | | 46,101,372 | | | | — | | | | — | |
Exchange Traded Funds | | | 18,667,072 | | | | 18,667,072 | | | | — | | | | — | |
Preferred Stocks | | | 32,924,650 | | | | — | | | | — | | | | 32,924,650 | |
Short-Term Investments | | | 8,865,629 | | | | 8,865,629 | | | | — | | | | — | |
| | | | | | | | | | | | | | | | |
Total | | $ | 905,587,484 | | | $ | 852,030,215 | | | $ | 6,261,765 | | | $ | 47,295,504 | |
| | | | | | | | | | | | | | | | |
| (1) | For the year ended December 31, 2016, there were no transfers between Level 1 and Level 2, and investments valued at $2,905,494 were transferred from Level 3 to Level 1 due to the expiration of trading restrictions. |
The following is a rollforward of the Fund’s investments that were valued using unobservable inputs (Level 3) for the year ended December 31, 2016:
| | | | | | | | | | | | |
| | | Common
Stocks | | | Preferred
Stocks | | | Total | |
Beginning balance | | $ | 15,248,065 | | | $ | 36,283,004 | | | $ | 51,531,069 | |
Purchases | | | 646,870 | | | | — | | | | 646,870 | |
Sales | | | — | | | | (622,830 | ) | | | (622,830 | ) |
Accrued discounts/(premiums) | | | — | | | | — | | | | — | |
Total realized gain/(loss) | | | — | | | | (53,160 | ) | | | (53,160 | ) |
Net change in unrealized appreciation/depreciation | | | 1,381,413 | | | | (2,682,364 | ) | | | (1,300,951 | ) |
Transfers into Level 3 | | | — | | | | — | | | | — | |
Transfers out of Level 3 | | | (2,905,494 | ) | | | — | | | | (2,905,494 | ) |
| | | | | | | | | | | | |
Ending balance | | $ | 14,370,854 | | | $ | 32,924,650 | | | $ | 47,295,504 | |
| | | | | | | | | | | | |
The change in net unrealized appreciation/depreciation relating to the Level 3 investments held at December 31, 2016 was $(1,301,239).
| Note: | For purposes of reporting transfers between different hierarchy levels, both transfers in and out of each level, as applicable, are shown as if they occurred at the beginning of the period. |
The accompanying notes are an integral part of these financial statements.
|
| Hartford Small/Mid Cap Equity HLS Fund |
Schedule of Investments
December 31, 2016
| | | | | | | | |
Shares or Principal Amount | | Market Value† | |
| COMMON STOCKS - 98.6% | |
| | | | Automobiles & Components - 1.8% | | | |
| | 7,510 | | | Cooper Tire & Rubber Co. | | $ | 291,763 | |
| | 3,388 | | | Horizon Global Corp.* | | | 81,312 | |
| | 9,423 | | | Lear Corp. | | | 1,247,323 | |
| | 2,968 | | | Thor Industries, Inc. | | | 296,948 | |
| | | | | | | | |
| | | | | | | 1,917,346 | |
| | | | | | | | |
| | | | Banks - 6.0% | | | |
| | 12,700 | | | Banco Latinoamericano de Comercio Exterior S.A. ADR | | | 373,888 | |
| | 12,305 | | | Berkshire Hills Bancorp, Inc. | | | 453,439 | |
| | 9,096 | | | Essent Group Ltd.* | | | 294,438 | |
| | 19,183 | | | Fidelity Southern Corp. | | | 454,062 | |
| | 47,006 | | | Fifth Third Bancorp | | | 1,267,752 | |
| | 51,550 | | | First BanCorp* | | | 340,746 | |
| | 7,388 | | | First NBC Bank Holding Co.* | | | 53,932 | |
| | 16,500 | | | Flagstar Bancorp, Inc.* | | | 444,510 | |
| | 15,349 | | | HomeStreet, Inc.* | | | 485,028 | |
| | 7,903 | | | MainSource Financial Group, Inc. | | | 271,863 | |
| | 15,556 | | | NMI Holdings, Inc. Class A* | | | 165,671 | |
| | 19,446 | | | OFG Bancorp | | | 254,743 | |
| | 26,198 | | | Popular, Inc. | | | 1,147,996 | |
| | 9,659 | | | Walker & Dunlop, Inc.* | | | 301,361 | |
| | | | | | | | |
| | | | | | | 6,309,429 | |
| | | | | | | | |
| | | | Capital Goods - 11.4% | | | |
| | 6,076 | | | American Railcar Industries, Inc. | | | 275,182 | |
| | 4,058 | | | American Woodmark Corp.* | | | 305,365 | |
| | 3,200 | | | Argan, Inc. | | | 225,760 | |
| | 13,715 | | | Briggs & Stratton Corp. | | | 305,296 | |
| | 7,140 | | | Chart Industries, Inc.* | | | 257,183 | |
| | 11,550 | | | Continental Building Products, Inc.* | | | 266,805 | |
| | 8,243 | | | DigitalGlobe, Inc.* | | | 236,162 | |
| | 4,300 | | | Douglas Dynamics, Inc. | | | 144,695 | |
| | 18,567 | | | Energy Recovery, Inc.* | | | 192,168 | |
| | 3,100 | | | EnerSys | | | 242,110 | |
| | 8,700 | | | Generac Holdings, Inc.* | | | 354,438 | |
| | 6,726 | | | Gibraltar Industries, Inc.* | | | 280,138 | |
| | 4,200 | | | Greenbrier Cos., Inc. | | | 174,510 | |
| | 11,428 | | | Harsco Corp. | | | 155,421 | |
| | 4,691 | | | Huntington Ingalls Industries, Inc. | | | 864,035 | |
| | 7,198 | | | Insteel Industries, Inc. | | | 256,537 | |
| | 7,900 | | | Jacobs Engineering Group, Inc.* | | | 450,300 | |
| | 20,416 | | | Kratos Defense & Security Solutions, Inc.* | | | 151,078 | |
| | 3,028 | | | Lydall, Inc.* | | | 187,282 | |
| | 11,706 | | | MasTec, Inc.* | | | 447,755 | |
| | 27,439 | | | Meritor, Inc.* | | | 340,792 | |
| | 19,118 | | | MRC Global, Inc.* | | | 387,331 | |
| | 4,038 | | | MYR Group, Inc.* | | | 152,152 | |
| | 7,703 | | | Navistar International Corp.* | | | 241,643 | |
| | 8,402 | | | Oshkosh Corp. | | | 542,853 | |
| | 6,983 | | | Owens Corning | | | 360,043 | |
| | 2,129 | | | Patrick Industries, Inc.* | | | 162,443 | |
| | 7,000 | | | Regal-Beloit Corp. | | | 484,750 | |
| | 17,043 | | | Spirit Aerosystems Holdings, Inc. Class A | | | 994,459 | |
| | 6,765 | | | Supreme Industries, Inc. Class A | | | 106,211 | |
| | 17,387 | | | TASER International, Inc.* | | | 421,461 | |
| | 5,309 | | | Timken Co. | | | 210,767 | |
| | 15,387 | | | Titan International, Inc. | | | 172,488 | |
| | 6,238 | | | Trex Co., Inc.* | | | 401,727 | |
| | 9,404 | | | Triumph Group, Inc. | | | 249,206 | |
| | 6,312 | | | United Rentals, Inc.* | | | 666,421 | |
| | 3,100 | | | Universal Forest Products, Inc. | | | 316,758 | |
| | | | | | | | |
| | | | | | | 11,983,725 | |
| | | | | | | | |
| | | | | | | | |
Shares or Principal Amount | | Market Value† | |
| COMMON STOCKS - 98.6% - (continued) | |
| | | | Commercial & Professional Services - 3.9% | | | |
| | 11,932 | | | ACCO Brands Corp.* | | $ | 155,713 | |
| | 3,035 | | | Barrett Business Services, Inc. | | | 194,544 | |
| | 6,281 | | | Brink’s Co. | | | 259,091 | |
| | 1,338 | | | Deluxe Corp. | | | 95,814 | |
| | 5,354 | | | Dun & Bradstreet Corp. | | | 649,547 | |
| | 6,100 | | | Essendant, Inc. | | | 127,490 | |
| | 11,664 | | | Herman Miller, Inc. | | | 398,909 | |
| | 5,953 | | | Huron Consulting Group, Inc.* | | | 301,519 | |
| | 3,206 | | | Insperity, Inc. | | | 227,466 | |
| | 7,800 | | | Kimball International, Inc. Class B | | | 136,968 | |
| | 4,028 | | | Mistras Group, Inc.* | | | 103,439 | |
| | 6,882 | | | Quad/Graphics, Inc. | | | 184,988 | |
| | 4,416 | | | Robert Half International, Inc. | | | 215,413 | |
| | 24,059 | | | RPX Corp.* | | | 259,837 | |
| | 14,166 | | | RR Donnelley & Sons Co. | | | 231,189 | |
| | 8,331 | | | TriNet Group, Inc.* | | | 213,440 | |
| | 5,092 | | | WageWorks, Inc.* | | | 369,170 | |
| | | | | | | | |
| | | | | | | 4,124,537 | |
| | | | | | | | |
| | | | Consumer Durables & Apparel - 1.8% | | | |
| | 11,090 | | | American Outdoor Brands Corp.* | | | 233,777 | |
| | 25,500 | | | Callaway Golf Co. | | | 279,480 | |
| | 5,097 | | | CSS Industries, Inc. | | | 137,976 | |
| | 865 | | | Helen of Troy Ltd.* | | | 73,049 | |
| | 5,691 | | | Hooker Furniture Corp. | | | 215,973 | |
| | 2,900 | | | iRobot Corp.* | | | 169,505 | |
| | 6,037 | | | La-Z-Boy, Inc. | | | 187,449 | |
| | 7,395 | | | lululemon athletica, Inc.* | | | 480,601 | |
| | 3,460 | | | Perry Ellis International, Inc.* | | | 86,189 | |
| | | | | | | | |
| | | | | | | 1,863,999 | |
| | | | | | | | |
| | | | Consumer Services - 4.1% | | | |
| | 8,500 | | | American Public Education, Inc.* | | | 208,675 | |
| | 8,338 | | | Brinker International, Inc. | | | 412,981 | |
| | 19,600 | | | Caesars Entertainment Corp.* | | | 166,600 | |
| | 4,984 | | | Capella Education Co. | | | 437,595 | |
| | 6,587 | | | Cheesecake Factory, Inc. | | | 394,430 | |
| | 7,800 | | | DeVry Education Group, Inc. | | | 243,360 | |
| | 8,115 | | | Domino’s Pizza, Inc. | | | 1,292,233 | |
| | 9,987 | | | International Game Technology plc | | | 254,868 | |
| | 10,608 | | | International Speedway Corp. Class A | | | 390,374 | |
| | 16,197 | | | Scientific Games Corp. Class A* | | | 226,758 | |
| | 3,811 | | | Sotheby’s* | | | 151,907 | |
| | 3,064 | | | Texas Roadhouse, Inc. | | | 147,807 | |
| | | | | | | | |
| | | | | | | 4,327,588 | |
| | | | | | | | |
| | | | Diversified Financials - 1.5% | | | |
| | 12,001 | | | Enova International, Inc.* | | | 150,613 | |
| | 12,600 | | | Ezcorp, Inc. Class A* | | | 134,190 | |
| | 13,085 | | | KCG Holdings, Inc. Class A* | | | 173,376 | |
| | 20,600 | | | Navient Corp. | | | 338,458 | |
| | 11,090 | | | Nelnet, Inc. Class A | | | 562,817 | |
| | 3,479 | | | World Acceptance Corp.* | | | 223,630 | |
| | | | | | | | |
| | | | | | | 1,583,084 | |
| | | | | | | | |
| | | | Energy - 5.6% | | | |
| | 12,200 | | | Archrock, Inc. | | | 161,040 | |
| | 32,900 | | | Bill Barrett Corp.* | | | 229,971 | |
| | 1,648 | | | Clayton Williams Energy, Inc.* | | | 196,540 | |
| | 17,913 | | | Consol Energy, Inc. | | | 326,554 | |
| | 20,282 | | | Diamond Offshore Drilling, Inc. | | | 358,991 | |
| | 11,226 | | | Energen Corp. | | | 647,403 | |
The accompanying notes are an integral part of these financial statements.
|
| Hartford Small/Mid Cap Equity HLS Fund |
Schedule of Investments – (continued)
December 31, 2016
| | | | | | | | |
Shares or Principal Amount | | Market Value† | |
| COMMON STOCKS - 98.6% - (continued) | |
| | | | Energy - 5.6% - (continued) | | | |
| | 21,375 | | | Ensco plc Class A | | $ | 207,765 | |
| | 16,486 | | | Newfield Exploration Co.* | | | 667,683 | |
| | 82,525 | | | Northern Oil and Gas, Inc.* | | | 226,944 | |
| | 45,720 | | | Overseas Shipholding Group, Inc. Class A | | | 175,108 | |
| | 18,689 | | | Patterson-UTI Energy, Inc. | | | 503,108 | |
| | 33,661 | | | Pioneer Energy Services Corp.* | | | 230,578 | |
| | 20,138 | | | Renewable Energy Group, Inc.* | | | 195,339 | |
| | 3,177 | | | REX American Resources Corp.* | | | 313,729 | |
| | 37,152 | | | Sanchez Energy Corp.* | | | 335,483 | |
| | 19,061 | | | Southwestern Energy Co.* | | | 206,240 | |
| | 81,643 | | | Teekay Tankers Ltd. Class A | | | 184,513 | |
| | 7,600 | | | Unit Corp.* | | | 204,212 | |
| | 8,180 | | | Westmoreland Coal Co.* | | | 144,541 | |
| | 26,720 | | | WPX Energy, Inc.* | | | 389,310 | |
| | | | | | | | |
| | | | | | | 5,905,052 | |
| | | | | | | | |
| | | | Food & Staples Retailing - 0.2% | | | |
| | 2,500 | | | Weis Markets, Inc. | | | 167,100 | |
| | | | | | | | |
| | | | Food, Beverage & Tobacco - 2.7% | | | |
| | 16,079 | | | Blue Buffalo Pet Products, Inc.* | | | 386,539 | |
| | 3,495 | | | Fresh Del Monte Produce, Inc. | | | 211,902 | |
| | 3,308 | | | Ingredion, Inc. | | | 413,368 | |
| | 3,006 | | | John B Sanfilippo & Son, Inc. | | | 211,592 | |
| | 4,163 | | | National Beverage Corp. | | | 212,646 | |
| | 5,700 | | | Omega Protein Corp.* | | | 142,785 | |
| | 31,200 | | | Pilgrim’s Pride Corp. | | | 592,488 | |
| | 2,928 | | | Sanderson Farms, Inc. | | | 275,935 | |
| | 6,267 | | | Universal Corp. | | | 399,521 | |
| | | | | | | | |
| | | | | | | 2,846,776 | |
| | | | | | | | |
| | | | Health Care Equipment & Services - 4.7% | | | |
| | 10,846 | | | Align Technology, Inc.* | | | 1,042,626 | |
| | 5,345 | | | Cardiovascular Systems, Inc.* | | | 129,403 | |
| | 796 | | | Chemed Corp. | | | 127,686 | |
| | 4,548 | | | Glaukos Corp.* | | | 155,996 | |
| | 4,869 | | | HealthEquity, Inc.* | | | 197,292 | |
| | 5,569 | | | Healthways, Inc.* | | | 126,695 | |
| | 7,050 | | | Hill-Rom Holdings, Inc. | | | 395,787 | |
| | 11,017 | | | HMS Holdings Corp.* | | | 200,069 | |
| | 3,333 | | | LifePoint Health, Inc.* | | | 189,314 | |
| | 3,332 | | | Magellan Health, Inc.* | | | 250,733 | |
| | 7,408 | | | Masimo Corp.* | | | 499,299 | |
| | 27,950 | | | OraSure Technologies, Inc.* | | | 245,401 | |
| | 10,537 | | | Triple-S Management Corp. Class B* | | | 218,116 | |
| | 16,500 | | | Veeva Systems, Inc. Class A* | | | 671,550 | |
| | 3,273 | | | WellCare Health Plans, Inc.* | | | 448,663 | |
| | | | | | | | |
| | | | | | | 4,898,630 | |
| | | | | | | | |
| | | | Household & Personal Products - 1.0% | | | |
| | 4,779 | | | Central Garden & Pet Co.* | | | 158,137 | |
| | 5,513 | | | Medifast, Inc. | | | 229,506 | |
| | 4,565 | | | Nu Skin Enterprises, Inc. Class A | | | 218,116 | |
| | 7,000 | | | Usana Health Sciences, Inc.* | | | 428,400 | |
| | | | | | | | |
| | | | | | | 1,034,159 | |
| | | | | | | | |
| | | | Insurance - 5.1% | | | |
| | 9,688 | | | Ambac Financial Group, Inc.* | | | 217,980 | |
| | 8,807 | | | Aspen Insurance Holdings Ltd. | | | 484,385 | |
| | 20,550 | | | Assured Guaranty Ltd. | | | 776,173 | |
| | 12,600 | | | CNO Financial Group, Inc. | | | 241,290 | |
| | 5,594 | | | Everest Re Group Ltd. | | | 1,210,541 | |
| | 23,936 | | | Greenlight Capital Re Ltd. Class A* | | | 545,741 | |
| | | | | | | | |
Shares or Principal Amount | | Market Value† | |
| COMMON STOCKS - 98.6% - (continued) | |
| | | | Insurance - 5.1% - (continued) | | | |
| | 12,817 | | | Maiden Holdings Ltd. | | $ | 223,657 | |
| | 24,227 | | | MBIA, Inc.* | | | 259,229 | |
| | 6,426 | | | National General Holdings Corp. | | | 160,586 | |
| | 9,690 | | | Reinsurance Group of America, Inc. | | | 1,219,293 | |
| | | | | | | | |
| | | | | | | 5,338,875 | |
| | | | | | | | |
| | | | Materials - 5.2% | | | |
| | 4,433 | | | A Schulman, Inc. | | | 148,284 | |
| | 8,300 | | | American Vanguard Corp. | | | 158,945 | |
| | 4,703 | | | Cabot Corp. | | | 237,690 | |
| | 26,100 | | | Chemours Co. | | | 576,549 | |
| | 7,944 | | | Clearwater Paper Corp.* | | | 520,729 | |
| | 25,335 | | | Cliffs Natural Resources, Inc.* | | | 213,067 | |
| | 6,400 | | | Commercial Metals Co. | | | 139,392 | |
| | 15,515 | | | Domtar Corp. | | | 605,550 | |
| | 5,979 | | | Greif, Inc. Class A | | | 306,783 | |
| | 4,300 | | | Innophos Holdings, Inc. | | | 224,718 | |
| | 5,100 | | | Koppers Holdings, Inc.* | | | 205,530 | |
| | 10,636 | | | Rayonier Advanced Materials, Inc. | | | 164,433 | |
| | 20,754 | | | Steel Dynamics, Inc. | | | 738,427 | |
| | 7,881 | | | Stepan Co. | | | 642,144 | |
| | 4,577 | | | Trinseo S.A. | | | 271,416 | |
| | 19,441 | | | Tronox Ltd. Class A | | | 200,437 | |
| | 2,744 | | | Worthington Industries, Inc. | | | 130,175 | |
| | | | | | | | |
| | | | | | | 5,484,269 | |
| | | | | | | | |
| | | | Media - 0.6% | | | |
| | 30,200 | | | Gannett Co., Inc. | | | 293,242 | |
| | 21,603 | | | New Media Investment Group, Inc. | | | 345,432 | |
| | | | | | | | |
| | | | | | | 638,674 | |
| | | | | | | | |
| | | | Pharmaceuticals, Biotechnology & Life Sciences - 6.6% | |
| | 7,247 | | | AMAG Pharmaceuticals, Inc.* | | | 252,196 | |
| | 9,400 | | | Amphastar Pharmaceuticals, Inc.* | | | 173,148 | |
| | 4,257 | | | BioSpecifics Technologies Corp.* | | | 237,115 | |
| | 7,392 | | | Blueprint Medicines Corp.* | | | 207,346 | |
| | 26,288 | | | Bruker Corp. | | | 556,780 | |
| | 2,900 | | | Cambrex Corp.* | | | 156,455 | |
| | 18,698 | | | Corcept Therapeutics, Inc.* | | | 135,748 | |
| | 7,468 | | | Enanta Pharmaceuticals, Inc.* | | | 250,178 | |
| | 32,786 | | | Exelixis, Inc.* | | | 488,839 | |
| | 5,292 | | | Five Prime Therapeutics, Inc.* | | | 265,182 | |
| | 2,194 | | | INC Research Holdings, Inc. Class A* | | | 115,404 | |
| | 13,104 | | | Lexicon Pharmaceuticals, Inc.* | | | 181,228 | |
| | 14,300 | | | OncoMed Pharmaceuticals, Inc.* | | | 110,253 | |
| | 98,244 | | | PDL BioPharma, Inc. | | | 208,277 | |
| | 48,006 | | | PharmAthene, Inc.* | | | 156,020 | |
| | 4,225 | | | PRA Health Sciences, Inc.* | | | 232,882 | |
| | 23,356 | | | Progenics Pharmaceuticals, Inc.* | | | 201,796 | |
| | 15,323 | | | Quintiles IMS Holdings, Inc.* | | | 1,165,314 | |
| | 18,200 | | | Seres Therapeutics, Inc.* | | | 180,180 | |
| | 7,774 | | | Supernus Pharmaceuticals, Inc.* | | | 196,294 | |
| | 6,800 | | | United Therapeutics Corp.* | | | 975,324 | |
| | 9,853 | | | Vanda Pharmaceuticals, Inc.* | | | 157,155 | |
| | 11,242 | | | Xencor, Inc.* | | | 295,889 | |
| | | | | | | | |
| | | | | | | 6,899,003 | |
| | | | | | | | |
| | | | Real Estate - 12.6% | | | |
| | 14,900 | | | AG Mortgage Investment Trust, Inc. REIT | | | 254,939 | |
| | 23,500 | | | AGNC Investment Corp. REIT | | | 426,055 | |
| | 32,691 | | | American Homes 4 Rent Class A, REIT | | | 685,857 | |
| | 14,129 | | | Apollo Commercial Real Estate Finance, Inc. REIT | | | 234,824 | |
The accompanying notes are an integral part of these financial statements.
|
| Hartford Small/Mid Cap Equity HLS Fund |
Schedule of Investments – (continued)
December 31, 2016
| | | | | | | | |
Shares or Principal Amount | | Market Value† | |
| COMMON STOCKS - 98.6% - (continued) | |
| | | | Real Estate - 12.6% - (continued) | | | |
| | 9,697 | | | ARMOUR Residential, Inc. REIT | | $ | 210,328 | |
| | 55,800 | | | Brandywine Realty Trust REIT | | | 921,258 | |
| | 45,967 | | | Brixmor Property Group, Inc. REIT | | | 1,122,514 | |
| | 7,550 | | | Care Capital Properties, Inc. REIT | | | 188,750 | |
| | 9,600 | | | CareTrust, Inc. REIT | | | 147,072 | |
| | 26,053 | | | CBL & Associates Properties, Inc. REIT | | | 299,609 | |
| | 19,554 | | | Chimera Investment Corp. REIT | | | 332,809 | |
| | 4,583 | | | CorEnergy Infrastructure Trust, Inc. REIT | | | 159,855 | |
| | 26,328 | | | CYS Investments, Inc. REIT | | | 203,515 | |
| | 57,155 | | | DDR Corp. REIT | | | 872,757 | |
| | 10,540 | | | Four Corners Property Trust, Inc. REIT | | | 216,281 | |
| | 34,319 | | | Gramercy Property Trust REIT | | | 315,048 | |
| | 27,312 | | | Hospitality Properties Trust REIT | | | 866,883 | |
| | 15,317 | | | Invesco Mortgage Capital, Inc. REIT | | | 223,628 | |
| | 42,630 | | | Mack-Cali Realty Corp. REIT | | | 1,237,123 | |
| | 28,370 | | | MFA Financial, Inc. REIT | | | 216,463 | |
| | 25,714 | | | MTGE Investment Corp. REIT | | | 403,710 | |
| | 13,700 | | | Pennsylvania REIT | | | 259,752 | |
| | 9,754 | | | PennyMac Mortgage Investment Trust REIT | | | 159,673 | |
| | 13,809 | | | Physicians Realty Trust REIT | | | 261,819 | |
| | 7,446 | | | Piedmont Office Realty Trust, Inc. Class A, REIT | | | 155,696 | |
| | 31,400 | | | Ramco-Gershenson Properties Trust REIT | | | 520,612 | |
| | 28,151 | | | Redwood Trust, Inc. REIT | | | 428,177 | |
| | 26,297 | | | Select Income REIT | | | 662,684 | |
| | 13,500 | | | Summit Hotel Properties, Inc. REIT | | | 216,405 | |
| | 47,300 | | | Two Harbors Investment Corp. REIT | | | 412,456 | |
| | 20,673 | | | Washington Prime Group, Inc. REIT | | | 215,206 | |
| | 16,400 | | | Western Asset Mortgage Capital Corp. REIT | | | 165,148 | |
| | 11,600 | | | Xenia Hotels & Resorts, Inc. REIT | | | 225,272 | |
| | | | | | | | |
| | | | | | | 13,222,178 | |
| | | | | | | | |
| | | | Retailing - 4.1% | |
| | 21,824 | | | American Eagle Outfitters, Inc. | | | 331,070 | |
| | 7,151 | | | Big 5 Sporting Goods Corp. | | | 124,070 | |
| | 9,600 | | | Big Lots, Inc. | | | 482,016 | |
| | 9,000 | | | Buckle, Inc. | | | 205,200 | |
| | 4,885 | | | Burlington Stores, Inc.* | | | 414,004 | |
| | 9,503 | | | Chico’s FAS, Inc. | | | 136,748 | |
| | 2,302 | | | Children’s Place, Inc. | | | 232,387 | |
| | 7,184 | | | Dick’s Sporting Goods, Inc. | | | 381,470 | |
| | 6,100 | | | Finish Line, Inc. Class A | | | 114,741 | |
| | 5,090 | | | Foot Locker, Inc. | | | 360,830 | |
| | 11,821 | | | Francescas Holding Corp.* | | | 213,133 | |
| | 15,457 | | | Overstock.com, Inc.* | | | 270,498 | |
| | 6,200 | | | PetMed Express, Inc. | | | 143,034 | |
| | 14,200 | | | Select Comfort Corp.* | | | 321,204 | |
| | 16,373 | | | Tile Shop Holdings, Inc.* | | | 320,092 | |
| | 7,788 | | | Urban Outfitters, Inc.* | | | 221,802 | |
| | | | | | | | |
| | | | | | | 4,272,299 | |
| | | | | | | | |
| | | | Semiconductors & Semiconductor Equipment - 2.6% | |
| | 21,163 | | | Advanced Micro Devices, Inc.* | | | 239,988 | |
| | 4,744 | | | Ambarella, Inc.* | | | 256,793 | |
| | 19,800 | | | Amkor Technology, Inc.* | | | 208,890 | |
| | 4,414 | | | Inphi Corp.* | | | 196,953 | |
| | 10,395 | | | MaxLinear, Inc. Class A* | | | 226,611 | |
| | 20,330 | | | Photronics, Inc.* | | | 229,729 | |
| | 37,521 | | | Teradyne, Inc. | | | 953,033 | |
| | 10,441 | | | Tessera Holding Corp. | | | 461,492 | |
| | | | | | | | |
| | | | | | | 2,773,489 | |
| | | | | | | | |
| | | | | | | | |
Shares or Principal Amount | | Market Value† | |
| COMMON STOCKS - 98.6% - (continued) | |
| | | | Software & Services - 5.5% | |
| | 29,293 | | | A10 Networks, Inc.* | | $ | 243,425 | |
| | 7,162 | | | Alarm.com Holdings, Inc.* | | | 199,318 | |
| | 9,460 | | | Amdocs Ltd. | | | 551,045 | |
| | 5,800 | | | Barracuda Networks, Inc.* | | | 124,294 | |
| | 47,411 | | | Bazaarvoice, Inc.* | | | 229,943 | |
| | 14,700 | | | Brightcove, Inc.* | | | 118,335 | |
| | 3,900 | | | Cardtronics plc Class A* | | | 212,823 | |
| | 16,558 | | | Convergys Corp. | | | 406,665 | |
| | 5,190 | | | CSG Systems International, Inc. | | | 251,196 | |
| | 10,442 | | | Manhattan Associates, Inc.* | | | 553,739 | |
| | 6,524 | | | Progress Software Corp. | | | 208,311 | |
| | 12,188 | | | PROS Holdings, Inc.* | | | 262,286 | |
| | 24,139 | | | RetailMeNot, Inc.* | | | 224,493 | |
| | 5,600 | | | Shutterstock, Inc.* | | | 266,112 | |
| | 5,600 | | | Sykes Enterprises, Inc.* | | | 161,616 | |
| | 18,813 | | | Synopsys, Inc.* | | | 1,107,333 | |
| | 16,547 | | | Teradata Corp.* | | | 449,582 | |
| | 4,474 | | | Wix.com Ltd.* | | | 199,317 | |
| | | | | | | | |
| | | | | | | 5,769,833 | |
| | | | | | | | |
| | | | Technology Hardware & Equipment - 5.7% | |
| | 14,200 | | | 3D Systems Corp.* | | | 188,718 | |
| | 7,310 | | | Arista Networks, Inc.* | | | 707,389 | |
| | 26,376 | | | AVX Corp. | | | 412,257 | |
| | 13,400 | | | Benchmark Electronics, Inc.* | | | 408,700 | |
| | 12,631 | | | CommScope Holding Co., Inc.* | | | 469,873 | |
| | 15,100 | | | Daktronics, Inc. | | | 161,570 | |
| | 7,900 | | | Dolby Laboratories, Inc. Class A | | | 357,001 | |
| | 31,083 | | | Extreme Networks, Inc.* | | | 156,348 | |
| | 12,824 | | | Finisar Corp.* | | | 388,183 | |
| | 3,892 | | | InterDigital, Inc. | | | 355,534 | |
| | 5,400 | | | NETGEAR, Inc.* | | | 293,490 | |
| | 12,308 | | | Sanmina Corp.* | | | 451,088 | |
| | 7,272 | | | ScanSource, Inc.* | | | 293,425 | |
| | 20,678 | | | Sonus Networks, Inc.* | | | 130,271 | |
| | 13,243 | | | TTM Technologies, Inc.* | | | 180,502 | |
| | 10,140 | | | Ubiquiti Networks, Inc.* | | | 586,092 | |
| | 24,331 | | | Vishay Intertechnology, Inc. | | | 394,162 | |
| | | | | | | | |
| | | | | | | 5,934,603 | |
| | | | | | | | |
| | | | Telecommunication Services - 0.8% | |
| | 3,700 | | | ATN International, Inc. | | | 296,481 | |
| | 17,796 | | | Telephone & Data Systems, Inc. | | | 513,771 | |
| | | | | | | | |
| | | | | | | 810,252 | |
| | | | | | | | |
| | | | Transportation - 2.6% | |
| | 16,729 | | | Alaska Air Group, Inc. | | | 1,484,364 | |
| | 1,383 | | | Allegiant Travel Co. | | | 230,131 | |
| | 2,126 | | | Copa Holdings S.A. Class A | | | 193,105 | |
| | 7,225 | | | Hawaiian Holdings, Inc.* | | | 411,825 | |
| | 17,275 | | | Swift Transportation Co.* | | | 420,819 | |
| | | | | | | | |
| | | | | | | 2,740,244 | |
| | | | | | | | |
| | | | Utilities - 2.5% | |
| | 58,048 | | | Atlantic Power Corp. | | | 145,120 | |
| | 9,643 | | | OGE Energy Corp. | | | 322,558 | |
| | 4,887 | | | ONE Gas, Inc. | | | 312,572 | |
| | 16,895 | | | Pinnacle West Capital Corp. | | | 1,318,317 | |
The accompanying notes are an integral part of these financial statements.
|
| Hartford Small/Mid Cap Equity HLS Fund |
Schedule of Investments – (continued)
December 31, 2016
| | | | | | | | |
Shares or Principal Amount | | Market Value† | |
| COMMON STOCKS - 98.6% - (continued) | |
| | | | Utilities - 2.5% - (continued) | |
| | 3,200 | | | Southwest Gas Corp. | | $ | 245,184 | |
| | 7,572 | | | Spark Energy, Inc. Class A | | | 229,432 | |
| | | | | | | | |
| | | | | | | 2,573,183 | |
| | | | | | | | |
| | | | Total Common Stocks
(cost $89,071,868) | | $ | 103,418,327 | |
| | | | | | | | |
| | |
| | | | Total Long-Term Investments
(cost $89,071,868) | | $ | 103,418,327 | |
| | | | | | | | |
|
| SHORT-TERM INVESTMENTS - 2.8% | |
| | | | Other Investment Pools & Funds - 2.8% | |
| | 2,887,193 | | | Morgan Stanley Institutional Liquidity Funds, Institutional Class | | $ | 2,887,193 | |
| | | | | | | | |
| | |
| | | | Total Short-Term Investments
(cost $2,887,193) | | $ | 2,887,193 | |
| | | | | | | | |
| | | | | | | | | | | | |
| | | |
| | | | Total Investments
(cost $91,959,061)^ | | | 101.4 | % | | $ | 106,305,520 | |
| | | | Other Assets and Liabilities | | | (1.4 | )% | | | (1,428,692 | ) |
| | | | | | | | | | | | |
| | | | Total Net Assets | | | 100.0 | % | | $ | 104,876,828 | |
| | | | | | | | | | | | |
The accompanying notes are an integral part of these financial statements.
|
| Hartford Small/Mid Cap Equity HLS Fund |
Schedule of Investments – (continued)
December 31, 2016
| Note: | Percentage of investments as shown is the ratio of the total market value to total net assets. |
| | Equity industry classifications used in this report are the Global Industry Classification Standard, which was developed by and is the exclusive property and service mark of MSCI, Inc. and Standard & Poor’s. |
| | For Fund compliance purposes, the Fund may not use the same classification system shown in this report as these classifications are used for financial reporting purposes. |
| ^ | At December 31, 2016, the cost of securities for federal income tax purposes was $91,971,737 and the aggregate gross unrealized appreciation and depreciation based on that cost were: |
| | | | |
Unrealized Appreciation | | $ | 17,926,310 | |
Unrealized Depreciation | | | (3,592,527 | ) |
| | | | |
Net Unrealized Appreciation | | $ | 14,333,783 | |
| | | | |
| † | See Significant Accounting Policies of accompanying Notes to Financial Statements regarding valuation of investments. |
| | |
| GLOSSARY: (abbreviations used in preceding Schedule of Investments) |
|
| Other Abbreviations: |
ADR | | American Depositary Receipt |
REIT | | Real Estate Investment Trust |
The accompanying notes are an integral part of these financial statements.
|
| Hartford Small/Mid Cap Equity HLS Fund |
Schedule of Investments – (continued)
December 31, 2016
Fair Valuation Summary
The following is a summary of the fair valuations according to the inputs used as of December 31, 2016 in valuing the Fund’s investments.
| | | | | | | | | | | | | | | | |
| | | Total | | | Level 1(1) | | | Level 2(1) | | | Level 3(1) | |
Assets | | | | | | | | | | | | | | | | |
Common Stocks | | | | | | | | | | | | | | | | |
Automobiles & Components | | $ | 1,917,346 | | | $ | 1,917,346 | | | $ | — | | | $ | — | |
Banks | | | 6,309,429 | | | | 6,309,429 | | | | — | | | | — | |
Capital Goods | | | 11,983,725 | | | | 11,983,725 | | | | — | | | | — | |
Commercial & Professional Services | | | 4,124,537 | | | | 4,124,537 | | | | — | | | | — | |
Consumer Durables & Apparel | | | 1,863,999 | | | | 1,863,999 | | | | — | | | | — | |
Consumer Services | | | 4,327,588 | | | | 4,327,588 | | | | — | | | | — | |
Diversified Financials | | | 1,583,084 | | | | 1,583,084 | | | | — | | | | — | |
Energy | | | 5,905,052 | | | | 5,905,052 | | | | — | | | | — | |
Food & Staples Retailing | | | 167,100 | | | | 167,100 | | | | — | | | | — | |
Food, Beverage & Tobacco | | | 2,846,776 | | | | 2,846,776 | | | | — | | | | — | |
Health Care Equipment & Services | | | 4,898,630 | | | | 4,898,630 | | | | — | | | | — | |
Household & Personal Products | | | 1,034,159 | | | | 1,034,159 | | | | — | | | | — | |
Insurance | | | 5,338,875 | | | | 5,338,875 | | | | — | | | | — | |
Materials | | | 5,484,269 | | | | 5,484,269 | | | | — | | | | — | |
Media | | | 638,674 | | | | 638,674 | | | | — | | | | — | |
Pharmaceuticals, Biotechnology & Life Sciences | | | 6,899,003 | | | | 6,899,003 | | | | — | | | | — | |
Real Estate | | | 13,222,178 | | | | 13,222,178 | | | | — | | | | — | |
Retailing | | | 4,272,299 | | | | 4,272,299 | | | | — | | | | — | |
Semiconductors & Semiconductor Equipment | | | 2,773,489 | | | | 2,773,489 | | | | — | | | | — | |
Software & Services | | | 5,769,833 | | | | 5,769,833 | | | | — | | | | — | |
Technology Hardware & Equipment | | | 5,934,603 | | | | 5,934,603 | | | | — | | | | — | |
Telecommunication Services | | | 810,252 | | | | 810,252 | | | | — | | | | — | |
Transportation | | | 2,740,244 | | | | 2,740,244 | | | | — | | | | — | |
Utilities | | | 2,573,183 | | | | 2,573,183 | | | | — | | | | — | |
Short-Term Investments | | | 2,887,193 | | | | 2,887,193 | | | | — | | | | — | |
| | | | | | | | | | | | | | | | |
Total | | $ | 106,305,520 | | | $ | 106,305,520 | | | $ | — | | | $ | — | |
| | | | | | | | | | | | | | | | |
| (1) | For the year ended December 31, 2016, there were no transfers between any levels. |
The accompanying notes are an integral part of these financial statements.
Schedule of Investments
December 31, 2016
| | | | | | | | |
Shares or Principal Amount | | Market Value† | |
| COMMON STOCKS - 98.8% | |
| | | | Banks - 2.4% | | | |
| | 292,593 | | | PNC Financial Services Group, Inc. | | $ | 34,221,677 | |
| | | | | | | | |
| | | | Capital Goods - 9.1% | | | |
| | 102,231 | | | General Dynamics Corp. | | | 17,651,204 | |
| | 282,705 | | | Honeywell International, Inc. | | | 32,751,374 | |
| | 130,864 | | | Lockheed Martin Corp. | | | 32,708,148 | |
| | 88,344 | | | Northrop Grumman Corp. | | | 20,547,048 | |
| | 266,537 | | | United Technologies Corp. | | | 29,217,786 | |
| | | | | | | | |
| | | | | | | 132,875,560 | |
| | | | | | | | |
| | | | Consumer Durables & Apparel - 5.3% | | | |
| | 1,059,084 | | | NIKE, Inc. Class B | | | 53,833,240 | |
| | 446,258 | | | VF Corp. | | | 23,807,864 | |
| | | | | | | | |
| | | | | | | 77,641,104 | |
| | | | | | | | |
| | | | Consumer Services - 2.0% | | | |
| | 243,445 | | | McDonald’s Corp. | | | 29,632,125 | |
| | | | | | | | |
| | | | Diversified Financials - 3.3% | | | |
| | 345,933 | | | American Express Co. | | | 25,626,717 | |
| | 57,980 | | | BlackRock, Inc. | | | 22,063,709 | |
| | | | | | | | |
| | | | | | | 47,690,426 | |
| | | | | | | | |
| | | | Energy - 4.1% | | | |
| | 333,456 | | | Exxon Mobil Corp. | | | 30,097,739 | |
| | 344,858 | | | Schlumberger Ltd. | | | 28,950,829 | |
| | | | | | | | |
| | | | | | | 59,048,568 | |
| | | | | | | | |
| | | | Food & Staples Retailing - 7.4% | | | |
| | 335,239 | | | Costco Wholesale Corp. | | | 53,675,116 | |
| | 316,309 | | | CVS Health Corp. | | | 24,959,943 | |
| | 343,631 | | | Walgreens Boots Alliance, Inc. | | | 28,438,902 | |
| | | | | | | | |
| | | | | | | 107,073,961 | |
| | | | | | | | |
| | | | Food, Beverage & Tobacco - 6.9% | | | |
| | 874,288 | | | Coca-Cola Co. | | | 36,247,980 | |
| | 1,149,745 | | | Diageo plc | | | 29,835,692 | |
| | 320,127 | | | PepsiCo, Inc. | | | 33,494,888 | |
| | | | | | | | |
| | | | | | | 99,578,560 | |
| | | | | | | | |
| | | | Health Care Equipment & Services - 9.5% | | | |
| | 524,283 | | | Cardinal Health, Inc. | | | 37,732,647 | |
| | 218,048 | | | McKesson Corp. | | | 30,624,842 | |
| | 506,129 | | | Medtronic plc | | | 36,051,569 | |
| | 207,156 | | | UnitedHealth Group, Inc. | | | 33,153,246 | |
| | | | | | | | |
| | | | | | | 137,562,304 | |
| | | | | | | | |
| | | | Household & Personal Products - 3.7% | | | |
| | 559,150 | | | Colgate-Palmolive Co. | | | 36,590,776 | |
| | 211,904 | | | Procter & Gamble Co. | | | 17,816,888 | |
| | | | | | | | |
| | | | | | | 54,407,664 | |
| | | | | | | | |
| | | | Insurance - 5.0% | | | |
| | 304,891 | | | Chubb Ltd. | | | 40,282,199 | |
| | 473,430 | | | Marsh & McLennan Cos., Inc. | | | 31,999,134 | |
| | | | | | | | |
| | | | | | | 72,281,333 | |
| | | | | | | | |
| | | | Materials - 3.4% | | | |
| | 186,131 | | | Ecolab, Inc. | | | 21,818,276 | |
| | 240,940 | | | Praxair, Inc. | | | 28,235,759 | |
| | | | | | | | |
| | | | | | | 50,054,035 | |
| | | | | | | | |
| | | | | | | | |
Shares or Principal Amount | | Market Value† | |
| COMMON STOCKS - 98.8% - (continued) | |
| | | | Media - 1.5% | | | |
| | 215,236 | | | Walt Disney Co. | | $ | 22,431,896 | |
| | | | | | | | |
| | | | Pharmaceuticals, Biotechnology & Life Sciences - 7.3% | |
| | 182,222 | | | Amgen, Inc. | | | 26,642,679 | |
| | 264,276 | | | Johnson & Johnson | | | 30,447,238 | |
| | 552,097 | | | Merck & Co., Inc. | | | 32,501,950 | |
| | 72,627 | | | Roche Holding AG | | | 16,555,511 | |
| | | | | | | | |
| | | | 106,147,378 | |
| | | | | | | | |
| | | | Real Estate - 3.9% | |
| | 214,935 | | | American Tower Corp. REIT | | | 22,714,331 | |
| | 148,541 | | | Public Storage REIT | | | 33,198,913 | |
| | | | | | | | |
| | | | 55,913,244 | |
| | | | | | | | |
| | | | Retailing - 5.0% | |
| | 9,440,100 | | | Allstar Co.*(1)(2)(3) | | | 9,817,704 | |
| | 389,173 | | | Lowe’s Cos., Inc. | | | 27,677,984 | |
| | 467,004 | | | TJX Cos., Inc. | | | 35,086,010 | |
| | | | | | | | |
| | | | 72,581,698 | |
| | | | | | | | |
| | | | Software & Services - 11.2% | |
| | 301,977 | | | Accenture plc Class A | | | 35,370,566 | |
| | 376,378 | | | Automatic Data Processing, Inc. | | | 38,684,131 | |
| | 846,825 | | | Microsoft Corp. | | | 52,621,706 | |
| | 466,824 | | | Visa, Inc. Class A | | | 36,421,608 | |
| | | | | | | | |
| | | | 163,098,011 | |
| | | | | | | | |
| | | | Transportation - 7.8% | |
| | 531,283 | | | Canadian National Railway Co. | | | 35,755,210 | |
| | 345,491 | | | Union Pacific Corp. | | | 35,820,507 | |
| | 369,855 | | | United Parcel Service, Inc. Class B | | | 42,400,177 | |
| | | | | | | | |
| | | | 113,975,894 | |
| | | | | | | | |
| | |
| | | | Total Common Stocks
(cost $1,187,459,514) | | $ | 1,436,215,438 | |
| | | | | | | | |
| | |
| | | | Total Long-Term Investments
(cost $1,187,459,514) | | $ | 1,436,215,438 | |
| | | | | | | | |
|
| SHORT-TERM INVESTMENTS - 1.6% | |
| | | | Other Investment Pools & Funds - 1.6% | |
| | 22,506,659 | | | Fidelity Institutional Government Fund, Institutional Class | | $ | 22,506,659 | |
| | | | | | | | |
| | |
| | | | Total Short-Term Investments
(cost $22,506,659) | | $ | 22,506,659 | |
| | | | | | | | |
| | | | | | | | | | | | |
| | | |
| | | | Total Investments
(cost $1,209,966,173)^ | | | 100.4 | % | | $ | 1,458,722,097 | |
| | | | Other Assets and Liabilities | | | (0.4 | )% | | | (5,778,810 | ) |
| | | | | | | | | | | | |
| | | | Total Net Assets | | | 100.0 | % | | $ | 1,452,943,287 | |
| | | | | | | | | | | | |
The accompanying notes are an integral part of these financial statements.
Schedule of Investments – (continued)
December 31, 2016
| Note: | Percentage of investments as shown is the ratio of the total market value to total net assets. |
| | Prices of foreign equities that are principally traded on certain foreign markets will generally be adjusted daily pursuant to a fair value pricing service approved by the Board of Directors in order to reflect an adjustment for factors occurring after the close of certain foreign markets but before the close of the New York Stock Exchange. |
| | Equity industry classifications used in this report are the Global Industry Classification Standard, which was developed by and is the exclusive property and service mark of MSCI, Inc. and Standard & Poor’s. |
| | For Fund compliance purposes, the Fund may not use the same classification system shown in this report as these classifications are used for financial reporting purposes. |
| ^ | At December 31, 2016, the cost of securities for federal income tax purposes was $1,214,840,138 and the aggregate gross unrealized appreciation and depreciation based on that cost were: |
| | | | |
Unrealized Appreciation | | $ | 262,973,197 | |
Unrealized Depreciation | | | (19,091,238 | ) |
| | | | |
Net Unrealized Appreciation | | $ | 243,881,959 | |
| | | | |
| (1) | This security is valued in good faith at fair value as determined under policies and procedures established by and under the supervision of the Board of Directors. At December 31, 2016, the aggregate fair value of this security was $9,817,704, which represents 0.7% of total net assets. This amount excludes securities that are principally traded in certain foreign markets and whose prices are adjusted pursuant to a third party pricing service methodology approved by the Board of Directors. |
| (2) | The following security is considered illiquid. Illiquid securities are often purchased in private placement transactions, are often not registered under the Securities Act of 1933, as amended, and may have contractual restrictions on resale. A security may also be considered illiquid if the security lacks a readily available market or if its valuation has not changed for a certain period of time. |
| | | | | | | | | | |
Period
Acquired | | | Shares/Par | | Security | | Cost | |
| | 08/2011 | | | 9,440,100 | | Allstar Co. | | $ | 4,106,619 | |
| | At December 31, 2016, the aggregate value of these securities was $9,817,704, which represents 0.7% of total net assets. |
| (3) | Securities issued within terms of a private placement memorandum and exempt from registration under Rule 144A under the Securities Act of 1933, as amended, and may be sold only to qualified institutional buyers. Unless otherwise indicated, this holding is determined to be liquid. At December 31, 2016, the aggregate value of this security was $9,817,704, which represents 0.7% of total net assets. |
| † | See Significant Accounting Policies of accompanying Notes to Financial Statements regarding valuation of investments. |
| | | | | | | | |
| GLOSSARY: (abbreviations used in preceding Schedule of Investments) |
|
| Other Abbreviations: |
REIT | | Real Estate Investment Trust |
The accompanying notes are an integral part of these financial statements.
Schedule of Investments – (continued)
December 31, 2016
Fair Valuation Summary
The following is a summary of the fair valuations according to the inputs used as of December 31, 2016 in valuing the Fund’s investments.
| | | | | | | | | | | | | | | | |
| | | Total | | | Level 1(1) | | | Level 2(1) | | | Level 3(1) | |
Assets | | | | | | | | | | | | | | | | |
Common Stocks | | | | | | | | | | | | | | | | |
Banks | | $ | 34,221,677 | | | $ | 34,221,677 | | | $ | — | | | $ | — | |
Capital Goods | | | 132,875,560 | | | | 132,875,560 | | | | — | | | | — | |
Consumer Durables & Apparel | | | 77,641,104 | | | | 77,641,104 | | | | — | | | | — | |
Consumer Services | | | 29,632,125 | | | | 29,632,125 | | | | — | | | | — | |
Diversified Financials | | | 47,690,426 | | | | 47,690,426 | | | | — | | | | — | |
Energy | | | 59,048,568 | | | | 59,048,568 | | | | — | | | | — | |
Food & Staples Retailing | | | 107,073,961 | | | | 107,073,961 | | | | — | | | | — | |
Food, Beverage & Tobacco | | | 99,578,560 | | | | 69,742,868 | | | | 29,835,692 | | | | — | |
Health Care Equipment & Services | | | 137,562,304 | | | | 137,562,304 | | | | — | | | | — | |
Household & Personal Products | | | 54,407,664 | | | | 54,407,664 | | | | — | | | | — | |
Insurance | | | 72,281,333 | | | | 72,281,333 | | | | — | | | | — | |
Materials | | | 50,054,035 | | | | 50,054,035 | | | | — | | | | — | |
Media | | | 22,431,896 | | | | 22,431,896 | | | | — | | | | — | |
Pharmaceuticals, Biotechnology & Life Sciences | | | 106,147,378 | | | | 89,591,867 | | | | 16,555,511 | | | | — | |
Real Estate | | | 55,913,244 | | | | 55,913,244 | | | | — | | | | — | |
Retailing | | | 72,581,698 | | | | 62,763,994 | | | | — | | | | 9,817,704 | |
Software & Services | | | 163,098,011 | | | | 163,098,011 | | | | — | | | | — | |
Transportation | | | 113,975,894 | | | | 113,975,894 | | | | — | | | | — | |
Short-Term Investments | | | 22,506,659 | | | | 22,506,659 | | | | — | | | | — | |
| | | | | | | | | | | | | | | | |
Total | | $ | 1,458,722,097 | | | $ | 1,402,513,190 | | | $ | 46,391,203 | | | $ | 9,817,704 | |
| | | | | | | | | | | | | | | | |
| (1) | For the year ended December 31, 2016, there were no transfers between any levels. |
The following is a rollforward of the Fund’s investments that were valued using unobservable inputs (Level 3) for the year ended December 31, 2016:
| | | | | | | | |
| | | Common
Stocks | | | Total | |
Beginning balance | | $ | 8,968,095 | | | $ | 8,968,095 | |
Purchases | | | — | | | | — | |
Sales | | | — | | | | — | |
Accrued discounts/(premiums) | | | — | | | | — | |
Total realized gain/(loss) | | | — | | | | — | |
Net change in unrealized appreciation/depreciation | | | 849,609 | | | | 849,609 | |
Transfers into Level 3 | | | — | | | | — | |
Transfers out of Level 3 | | | — | | | | — | |
| | | | | | | | |
Ending balance | | $ | 9,817,704 | | | $ | 9,817,704 | |
| | | | | | | | |
The change in net unrealized appreciation/depreciation relating to the Level 3 investments held at December 31, 2016 was $849,609.
The accompanying notes are an integral part of these financial statements.
|
| Hartford Total Return Bond HLS Fund |
Schedule of Investments
December 31, 2016
| | | | | | | | | | | | |
Shares or Principal Amount | | Market Value† | |
| ASSET & COMMERCIAL MORTGAGE BACKED SECURITIES - 30.0% | |
| | | | | | | Asset-Backed-Automobile - 1.2% | |
| | $ | | | | 3,800,000 | | | AmeriCredit Automobile Receivables Trust
2.72%, 09/09/2019 | | $ | 3,825,369 | |
| | | | | 5,619,625 | | | Credit Acceptance Auto Loan Trust
1.88%, 03/15/2022(1) | | | 5,627,460 | |
| | | | | | | | First Investors Auto Owner Trust | | | | |
| | | | | 5,241,283 | | | 1.67%, 11/16/2020(1) | | | 5,243,589 | |
| | | | | 1,750,000 | | | 2.39%, 11/16/2020(1) | | | 1,754,612 | |
| | | | | 1,260,000 | | | GM Financial Automobile Leasing Trust
1.96%, 03/20/2018(1) | | | 1,263,367 | |
| | | | | 5,990,000 | | | Honor Automobile Trust Securitization
2.94%, 11/15/2019(1) | | | 5,983,924 | |
| | | | | | | | Santander Drive Auto Receivables Trust | |
| | | | | 1,092,821 | | | 1.82%, 05/15/2019 | | | 1,093,799 | |
| | | | | 1,035,369 | | | 2.25%, 06/17/2019 | | | 1,038,767 | |
| | | | | 4,006,468 | | | 2.36%, 04/15/2020 | | | 4,023,404 | |
| | | | | | | | | | | | |
| | | | | | | | | | | 29,854,291 | |
| | | | | | | | | | | | |
| | | | | | | Asset-Backed-Finance & Insurance - 14.2% | |
| | | | | 9,180,000 | | | American Money Management Corp.
2.33%, 07/27/2026(1)(2) | | | 9,188,895 | |
| | | | | | | | Apidos CLO | |
| | | | | 6,015,000 | | | 2.33%, 01/19/2025(1)(2) | | | 6,014,946 | |
| | | | | 2,555,000 | | | 2.73%, 07/15/2023(1)(2) | | | 2,558,930 | |
| | | | | 10,350,000 | | | Ares CLO Ltd.
2.40%, 04/17/2026(1)(2) | | | 10,371,083 | |
| | | | | 7,610,000 | | | Atlas Senior Loan Fund Ltd.
2.42%, 10/15/2026(1)(2) | | | 7,606,157 | |
| | | | | 790,000 | | | Atrium CDO Corp.
2.00%, 07/16/2025(1)(2) | | | 789,603 | |
| | | | | 10,050,000 | | | Avery Point IV CLO Ltd.
2.40%, 04/25/2026(1)(2) | | | 10,091,929 | |
| | | | | 2,330,000 | | | Babson CLO Ltd.
2.37%, 07/20/2025(1)(2) | | | 2,324,783 | |
| | | | | 1,192,917 | | | Cal Funding II Ltd.
3.47%, 10/25/2027(1) | | | 1,155,120 | |
| | | | | 7,890,000 | | | Carlyle Global Market Strategies Ltd.
2.36%, 04/27/2027(1)(2) | | | 7,900,541 | |
| | | | | | | | Cent CLO Ltd. | |
| | | | | 9,345,000 | | | 2.36%, 01/25/2026(1)(2) | | | 9,340,271 | |
| | | | | 8,090,000 | | | 2.37%, 04/17/2026(1)(2) | | | 8,083,107 | |
| | | | | 6,305,000 | | | 2.38%, 07/27/2026(1)(2) | | | 6,307,371 | |
| | | | | 3,115,000 | | | 2.93%, 04/17/2026(1)(2) | | | 3,111,863 | |
| | | | | | | | CIFC Funding Ltd. | |
| | | | | 7,240,000 | | | 2.41%, 08/14/2024(1)(2) | | | 7,235,301 | |
| | | | | 8,965,000 | | | 2.41%, 05/24/2026(1)(2) | | | 8,983,289 | |
| | | | | 198,695 | | | Consumer Credit Origination Loan Trust
2.82%, 03/15/2021(1) | | | 198,819 | |
| | | | | | | | Dryden Senior Loan Fund | |
| | | | | 6,710,000 | | | 2.31%, 07/15/2027(1)(2) | | | 6,706,618 | |
| | | | | 7,852,000 | | | 2.32%, 10/15/2028(1)(2) | | | 7,848,859 | |
| | | | | 1,569,018 | | | Fieldstone Mortgage Investment Corp.
1.03%, 05/25/2036(2) | | | 1,077,311 | |
| | | | | 3,267,261 | | | First Franklin Mortgage Loan Trust
1.00%, 04/25/2036(2) | | | 2,161,538 | |
| | | | | 2,210,000 | | | Flatiron CLO Ltd.
2.78%, 07/17/2026(1)(2) | | | 2,199,668 | |
| | | | | 3,795,000 | | | Green Tree Agency Advance Funding Trust
3.10%, 10/15/2048(1) | | | 3,795,000 | |
| | | | | 4,032,379 | | | GSAMP Trust
0.85%, 01/25/2037(2) | | | 2,425,833 | |
| | | | | | | | | | | | |
Shares or Principal Amount | | Market Value† | |
| ASSET & COMMERCIAL MORTGAGE BACKED SECURITIES - 30.0% - (continued) | |
| | | | | | | Asset-Backed-Finance & Insurance - 14.2% - (continued) | |
| | $ | | | | 4,965,000 | | | Highbridge Loan Management Ltd.
2.33%, 05/05/2027(1)(2) | | $ | 4,958,848 | |
| | | | | 1,345,000 | | | LCM L.P.
2.22%, 04/15/2022(1)(2) | | | 1,352,034 | |
| | | | | 4,590,000 | | | Lendmark Funding Trust
3.26%, 04/21/2025(1) | | | 4,560,411 | |
| | | | | 11,335,000 | | | Limerock CLO Ltd.
2.38%, 04/18/2026(1)(2) | | | 11,332,404 | |
| | | | | | | | Madison Park Funding Ltd. | |
| | | | | 7,200,000 | | | 2.16%, 10/23/2025(1)(2) | | | 7,208,806 | |
| | | | | 6,520,000 | | | 2.33%, 01/19/2025(1)(2) | | | 6,533,060 | |
| | | | | 9,860,000 | | | 2.38%, 07/20/2026(1)(2) | | | 9,915,640 | |
| | | | | | | | Magnetite CLO Ltd. | |
| | | | | 8,310,000 | | | 2.30%, 07/25/2026(1)(2) | | | 8,313,424 | |
| | | | | 6,695,000 | | | 2.83%, 07/25/2026(1)(2) | | | 6,697,973 | |
| | | | | | | | Nationstar HECM Loan Trust | |
| | | | | 781,487 | | | 2.24%, 06/25/2026(1) | | | 784,174 | |
| | | | | 2,383,073 | | | 2.98%, 02/25/2026(1) | | | 2,385,451 | |
| | | | | 8,265,000 | | | Neuberger Berman CLO Ltd.
2.35%, 08/04/2025(1)(2) | | | 8,294,969 | |
| | | | | 6,250,000 | | | NRZ Advance Receivables Trust
3.11%, 12/15/2050(1) | | | 6,224,319 | |
| | | | | 3,030,000 | | | Oak Hill Credit Partners X Ltd.
2.35%, 07/20/2026(1)(2) | | | 3,030,309 | |
| | | | | 7,885,000 | | | Oaktree EIF II Ltd.
2.46%, 02/15/2026(1)(2) | | | 7,883,502 | |
| | | | | 6,780,000 | | | OCP CLO Ltd.
2.41%, 04/17/2027(1)(2) | | | 6,786,000 | |
| | | | | 8,960,000 | | | OneMain Financial Issuance Trust
4.10%, 03/20/2028(1) | | | 9,122,355 | |
| | | | | | | | OZLM Funding Ltd. | |
| | | | | 7,495,000 | | | 2.34%, 04/30/2027(1)(2) | | | 7,504,369 | |
| | | | | 10,530,000 | | | 2.43%, 04/17/2026(1)(2) | | | 10,565,497 | |
| | | | | 9,700,000 | | | Race Point CLO Ltd.
2.39%, 04/15/2027(1)(2) | | | 9,719,332 | |
| | | | | 5,250,000 | | | SBA Tower Trust
2.90%, 10/15/2044(1)(3) | | | 5,289,843 | |
| | | | | 504,653 | | | Securitized Asset Backed Receivables LLC
0.85%, 07/25/2036(2) | | | 244,178 | |
| | | | | 7,325,000 | | | Shackleton CLO Ltd.
2.36%, 07/17/2026(1)(2) | | | 7,342,976 | |
| | | | | | | | SoFi Consumer Loan Program LLC | |
| | | | | 4,917,192 | | | 3.05%, 12/26/2025(1) | | | 4,899,873 | |
| | | | | 4,564,848 | | | 3.09%, 10/27/2025(1) | | | 4,560,906 | |
| | | | | | | | Sound Point CLO Ltd. | |
| | | | | 6,354,000 | | | 2.25%, 01/21/2026(1)(2) | | | 6,350,785 | |
| | | | | 7,680,000 | | | 2.41%, 04/15/2027(1)(2) | | | 7,695,752 | |
| | | | | 2,137,000 | | | 5.48%, 07/15/2025(1)(2) | | | 1,993,738 | |
| | | | | | | | Springleaf Funding Trust | |
| | | | | 2,464,990 | | | 2.41%, 12/15/2022(1) | | | 2,465,897 | |
| | | | | 4,985,000 | | | 2.90%, 11/15/2029(1) | | | 4,966,555 | |
| | | | | 5,340,000 | | | SPS Servicer Advance Receivables Trust
2.75%, 11/15/2049(1) | | | 5,311,704 | |
| | | | | 8,660,000 | | | Symphony CLO Ltd.
2.36%, 07/14/2026(1)(2) | | | 8,663,196 | |
| | | | | 7,660,000 | | | Treman Park CLO Ltd.
2.25%, 04/20/2027(1)(2) | | | 7,656,170 | |
| | | | | | | | Voya CLO Ltd. | |
| | | | | 4,905,000 | | | 2.02%, 04/18/2026(1)(2) | | | 4,902,547 | |
The accompanying notes are an integral part of these financial statements.
|
| Hartford Total Return Bond HLS Fund |
Schedule of Investments – (continued)
December 31, 2016
| | | | | | | | | | | | |
Shares or Principal Amount | | Market Value† | |
| ASSET & COMMERCIAL MORTGAGE BACKED SECURITIES - 30.0% - (continued) | |
| | | | | | | Asset-Backed-Finance & Insurance - 14.2% - (continued) | |
| | | | | | | | Voya CLO Ltd. - (continued) | |
| | $ | | | | 2,915,000 | | | 2.33%, 07/17/2026(1)(2) | | $ | 2,917,017 | |
| | | | | 7,550,000 | | | 2.36%, 04/18/2027(1)(2) | | | 7,556,984 | |
| | | | | 2,670,000 | | | 2.98%, 04/18/2027(1)(2) | | | 2,668,686 | |
| | | | | 10,785,000 | | | York CLO Ltd.
2.73%, 01/20/2030(1)(2) | | | 10,779,607 | |
| | | | | | | | | | | | |
| | | | | | | | | | | 356,916,126 | |
| | | | | | | | | | | | |
| | | | | | | Asset-Backed-Home Equity - 1.0% | |
| | | | | | | | GSAA Home Equity Trust | |
| | | | | 1,418,442 | | | 0.83%, 12/25/2046(2) | | | 768,214 | |
| | | | | 12,121,299 | | | 0.84%, 02/25/2037(2) | | | 6,696,449 | |
| | | | | 6,415,282 | | | 0.86%, 03/25/2037(2) | | | 3,423,173 | |
| | | | | 4,431,410 | | | 0.94%, 11/25/2036(2) | | | 2,160,679 | |
| | | | | 145,781 | | | 1.00%, 11/25/2036(2) | | | 81,319 | |
| | | | | 1,171,511 | | | 1.06%, 03/25/2036(2) | | | 784,670 | |
| | | | | 709,841 | | | 5.88%, 09/25/2036(3) | | | 366,275 | |
| | | | | 728,977 | | | 5.99%, 06/25/2036(2) | | | 359,542 | |
| | | | | 1,000,687 | | | 6.30%, 06/25/2036 | | | 493,302 | |
| | | | | 418,899 | | | Morgan Stanley Asset-Backed Securities Capital I, Inc. Trust
0.91%, 06/25/2036(2) | | | 360,974 | |
| | | | | 1,670,958 | | | Morgan Stanley Mortgage Loan Trust
0.93%, 11/25/2036(2) | | | 730,411 | |
| | | | | 6,531,000 | | | NRZ Advance Receivables Trust
2.58%, 10/15/2049(1) | | | 6,462,758 | |
| | | | | 433,355 | | | Renaissance Home Equity Loan Trust
5.91%, 04/25/2037(3) | | | 214,338 | |
| | | | | | | | Soundview Home Loan Trust | |
| | | | | 3,225,000 | | | 0.94%, 07/25/2037(2) | | | 2,240,227 | |
| | | | | 1,090,000 | | | 1.01%, 11/25/2036(2) | | | 781,716 | |
| | | | | | | | | | | | |
| | | | | | | | | | | 25,924,047 | |
| | | | | | | | | | | | |
| | | | | | | Commercial Mortgage-Backed Securities - 7.1% | |
| | | | | | | | Banc of America Commercial Mortgage Trust | |
| | | | | 2,860,000 | | | 3.12%, 09/15/2048(1)(2) | | | 1,527,043 | |
| | | | | 770,000 | | | 3.71%, 09/15/2048 | | | 798,426 | |
| | | | | 3,080,376 | | | 5.49%, 02/10/2051 | | | 3,133,418 | |
| | | | | 1,105,000 | | | Bear Stearns Commercial Mortgage Securities, Inc.
5.12%, 10/12/2042(2) | | | 1,074,538 | |
| | | | | | | | Citigroup Commercial Mortgage Trust | |
| | | | | 25,198,334 | | | 1.12%, 07/10/2047(2)(4) | | | 1,493,024 | |
| | | | | 27,321,388 | | | 1.17%, 04/10/2048(2)(4) | | | 1,765,377 | |
| | | | | 465,000 | | | 2.94%, 04/10/2048 | | | 457,573 | |
| | | | | 1,300,000 | | | 3.11%, 04/10/2048(1) | | | 896,882 | |
| | | | | 1,535,000 | | | 3.76%, 06/10/2048 | | | 1,599,762 | |
| | | | | 970,000 | | | 3.82%, 11/10/2048 | | | 1,010,029 | |
| | | | | 230,000 | | | 3.86%, 05/10/2047 | | | 242,079 | |
| | | | | 1,175,000 | | | 4.40%, 03/10/2047(1)(2) | | | 802,695 | |
| | | | | 445,000 | | | 4.90%, 03/10/2047(1)(2) | | | 386,711 | |
| | | | | 1,962,622 | | | Commercial Mortgage Loan Trust
6.10%, 12/10/2049(2) | | | 2,000,779 | |
| | | | | | | | Commercial Mortgage Pass-Through Certificates | |
| | | | | 9,918,220 | | | 0.84%, 02/10/2047(2)(4) | | | 332,753 | |
| | | | | 970,000 | | | 2.82%, 10/15/2045 | | | 981,968 | |
| | | | | 535,000 | | | 4.24%, 02/10/2047(2) | | | 577,687 | |
| | | | | 1,315,000 | | | 4.75%, 10/15/2045(1)(2) | | | 799,849 | |
| | | | | | | | Commercial Mortgage Trust | |
| | | | | 8,089,294 | | | 1.97%, 07/10/2046(1)(2)(4) | | | 453,970 | |
| | | | | 1,035,000 | | | 2.54%, 12/10/2045 | | | 1,029,783 | |
| | | | | | | | | | | | |
Shares or Principal Amount | | Market Value† | |
| ASSET & COMMERCIAL MORTGAGE BACKED SECURITIES - 30.0% - (continued) | |
| | | | | | | Commercial Mortgage-Backed Securities - 7.1% - (continued) | |
| | | | | | | | Commercial Mortgage Trust - (continued) | |
| | $ | | | | 1,670,000 | | | 2.85%, 10/15/2045 | | $ | 1,687,844 | |
| | | | | 785,000 | | | 3.10%, 03/10/2046 | | | 798,846 | |
| | | | | 350,000 | | | 3.18%, 02/10/2048 | | | 352,454 | |
| | | | | 930,000 | | | 3.21%, 03/10/2046 | | | 951,436 | |
| | | | | 1,760,000 | | | 3.35%, 02/10/2048 | | | 1,774,381 | |
| | | | | 6,780,000 | | | 3.42%, 03/10/2031(1) | | | 6,963,591 | |
| | | | | 1,260,000 | | | 3.61%, 06/10/2046(2) | | | 1,317,964 | |
| | | | | 705,000 | | | 3.62%, 07/10/2050 | | | 723,209 | |
| | | | | 2,120,000 | | | 3.69%, 08/10/2047 | | | 2,193,745 | |
| | | | | 1,150,133 | | | 3.80%, 08/10/2047 | | | 1,205,018 | |
| | | | | 1,140,000 | | | 3.90%, 07/10/2050 | | | 1,191,274 | |
| | | | | 575,125 | | | 3.96%, 03/10/2047 | | | 605,568 | |
| | | | | 1,955,000 | | | 4.02%, 07/10/2045 | | | 2,086,925 | |
| | | | | 630,000 | | | 4.07%, 02/10/2047(2) | | | 672,661 | |
| | | | | 1,045,000 | | | 4.21%, 08/10/2046(2) | | | 1,127,497 | |
| | | | | 615,085 | | | 4.23%, 07/10/2045(2) | | | 666,807 | |
| | | | | 264,117 | | | Credit Suisse Commercial Mortgage Trust
5.69%, 06/15/2039(2) | | | 265,134 | |
| | | | | 1,040,951 | | | Credit Suisse First Boston Mortgage Securities Corp.
4.88%, 04/15/2037 | | | 1,012,916 | |
| | | | | | | | CSAIL Commercial Mortgage Trust | |
| | | | | 64,999,002 | | | 0.88%, 06/15/2057(2)(4) | | | 3,263,444 | |
| | | | | 3,914,022 | | | 1.06%, 11/15/2048(2)(4) | | | 244,047 | |
| | | | | 920,000 | | | 3.36%, 08/15/2048(2) | | | 682,192 | |
| | | | | 545,000 | | | 3.54%, 11/15/2048 | | | 557,699 | |
| | | | | 8,373,000 | | | 3.72%, 08/15/2048 | | | 8,732,572 | |
| | | | | 8,360,176 | | | DBUBS Mortgage Trust
0.75%, 11/10/2046(1)(2)(4) | | | 184,317 | |
| | | | | 3,169,081 | | | Four Times Square Trust Commercial Mortgage Pass-Through Certificates 5.40%, 12/13/2028(1) | | | 3,483,232 | |
| | | | | | | | FREMF Mortgage Trust | |
| | | | | 4,680,000 | | | 3.00%, 10/25/2047(1)(2) | | | 4,682,215 | |
| | | | | 5,485,000 | | | 5.25%, 09/25/2043(1)(2) | | | 5,894,318 | |
| | | | | 1,798,848 | | | GE Business Loan Trust
1.70%, 05/15/2034(1)(2) | | | 1,556,605 | |
| | | | | | | | GS Mortgage Securities Trust | |
| | | | | 51,145,371 | | | 0.21%, 07/10/2046(2)(4) | | | 308,979 | |
| | | | | 6,868,568 | | | 1.37%, 08/10/2044(1)(2)(4) | | | 340,944 | |
| | | | | 100,000 | | | 2.94%, 02/10/2046 | | | 101,403 | |
| | | | | 4,340,000 | | | 2.95%, 11/05/2034(1) | | | 4,340,400 | |
| | | | | 1,060,000 | | | 3.58%, 06/10/2047(1) | | | 612,475 | |
| | | | | 1,580,166 | | | 3.67%, 04/10/2047(1) | | | 803,878 | |
| | | | | 4,110,000 | | | 4.00%, 04/10/2047 | | | 4,364,414 | |
| | | | | 785,121 | | | 4.07%, 01/10/2047 | | | 836,058 | |
| | | | | 1,115,000 | | | 4.51%, 11/10/2047(1)(2) | | | 899,124 | |
| | | | | 2,960,000 | | | 4.87%, 04/10/2047(1)(2) | | | 2,051,880 | |
| | | | | 1,675,924 | | | JP Morgan Chase Commercial Mortgage Securities Corp.
4.42%, 12/15/2047(1)(2) | | | 1,268,110 | |
| | | | | | | | JP Morgan Chase Commercial Mortgage
Securities Trust | |
| | | | | 8,392,207 | | | 2.16%, 02/12/2051(2) | | | 8,026,717 | |
| | | | | 2,185,000 | | | 2.73%, 10/15/2045(1)(2) | | | 1,204,787 | |
| | | | | 3,441,113 | | | 3.91%, 05/05/2030(1) | | | 3,575,231 | |
| | | | | 470,000 | | | 4.00%, 08/15/2046(1)(2) | | | 368,833 | |
| | | | | | | | JPMBB Commercial Mortgage Securities Trust | |
| | | | | 29,474,841 | | | 0.85%, 09/15/2047(2)(4) | | | 1,063,196 | |
| | | | | 8,288,070 | | | 0.95%, 05/15/2048(2)(4) | | | 336,190 | |
The accompanying notes are an integral part of these financial statements.
|
| Hartford Total Return Bond HLS Fund |
Schedule of Investments – (continued)
December 31, 2016
| | | | | | | | | | | | |
Shares or Principal Amount | | Market Value† | |
| ASSET & COMMERCIAL MORTGAGE BACKED SECURITIES - 30.0% - (continued) | |
| | | | | | | Commercial Mortgage-Backed Securities - 7.1% - (continued) | |
| | | | | | | | JPMBB Commercial Mortgage Securities Trust - (continued) | |
| | $ | | | | 825,000 | | | 2.91%, 10/15/2048 | | $ | 812,650 | |
| | | | | 810,060 | | | 3.61%, 05/15/2048 | | | 835,516 | |
| | | | | 1,300,000 | | | 3.74%, 10/15/2048(1)(2) | | | 933,172 | |
| | | | | 700,000 | | | 3.78%, 08/15/2047 | | | 733,382 | |
| | | | | 290,429 | | | JPMDB Commercial Mortgage Securities Trust
3.10%, 12/15/2049(1)(2) | | | 210,164 | |
| | | | | | | | LB-UBS Commercial Mortgage Trust | |
| | | | | 2,136,760 | | | 5.86%, 07/15/2040(2) | | | 2,151,503 | |
| | | | | 1,074,536 | | | 6.11%, 04/15/2041(2) | | | 1,113,989 | |
| | | | | 230,509 | | | Lehman Brothers Small Balance Commercial
5.52%, 09/25/2030(1)(2) | | | 225,048 | |
| | | | | | | | Merrill Lynch/Countrywide Commercial Mortgage
Trust | |
| | | | | 3,724,271 | | | 5.70%, 09/12/2049 | | | 3,798,541 | |
| | | | | 5,025,189 | | | 5.73%, 06/12/2050(2) | | | 5,057,273 | |
| | | | | | | | Morgan Stanley Bank of America Merrill Lynch Trust | |
| | | | | 1,608,417 | | | 1.12%, 10/15/2048(2)(4) | | | 110,587 | |
| | | | | 16,161,753 | | | 1.15%, 12/15/2047(2)(4) | | | 897,877 | |
| | | | | 940,000 | | | 3.06%, 10/15/2048(1) | | | 655,421 | |
| | | | | 890,000 | | | 3.10%, 11/15/2049 | | | 872,332 | |
| | | | | 1,080,000 | | | 3.13%, 12/15/2048 | | | 1,094,761 | |
| | | | | 1,320,000 | | | 3.18%, 08/15/2045 | | | 1,358,077 | |
| | | | | 4,320,000 | | | 3.74%, 08/15/2047 | | | 4,504,597 | |
| | | | | 795,172 | | | 4.26%, 10/15/2046(2) | | | 856,600 | |
| | | | | 1,605,000 | | | 4.50%, 08/15/2045(1) | | | 1,096,732 | |
| | | | | | | | Morgan Stanley Capital I Trust | |
| | | | | 43,332,546 | | | 0.46%, 09/15/2047(1)(2)(4) | | | 626,944 | |
| | | | | 625,000 | | | 2.78%, 08/15/2049 | | | 602,625 | |
| | | | | 4,920,000 | | | 3.47%, 08/11/2029(1) | | | 5,099,409 | |
| | | | | 1,460,000 | | | 5.16%, 07/15/2049(1)(2) | | | 1,092,573 | |
| | | | | 920,000 | | | 5.33%, 10/12/2052(1)(2) | | | 642,250 | |
| | | | | 1,213,002 | | | 5.81%, 12/12/2049 | | | 1,230,849 | |
| | | | | 570,000 | | | 6.28%, 01/11/2043(1)(2) | | | 565,400 | |
| | | | | | | | Morgan Stanley Re-Remic Trust | |
| | | | | 776,632 | | | 5.79%, 08/12/2045(1)(2) | | | 778,507 | |
| | | | | 776,632 | | | 5.79%, 08/15/2045(1)(2) | | | 778,573 | |
| | | | | 1,365,000 | | | SFAVE Commercial Mortgage Securities Trust
3.87%, 01/05/2043(1)(2) | | | 1,342,477 | |
| | | | | | | | UBS-Barclays Commercial Mortgage Trust | |
| | | | | 1,930,000 | | | 3.09%, 08/10/2049 | | | 1,976,091 | |
| | | | | 2,065,000 | | | 3.19%, 03/10/2046 | | | 2,105,251 | |
| | | | | 975,000 | | | 3.24%, 04/10/2046 | | | 997,054 | |
| | | | | 985,000 | | | 4.09%, 03/10/2046(1)(2) | | | 676,210 | |
| | | | | | | | Wells Fargo Commercial Mortgage Trust | |
| | | | | 21,618,447 | | | 1.19%, 05/15/2048(2)(4) | | | 1,422,157 | |
| | | | | 1,665,000 | | | 2.92%, 10/15/2045 | | | 1,694,384 | |
| | | | | 440,000 | | | 3.41%, 12/15/2047 | | | 447,297 | |
| | | | | 790,000 | | | 3.56%, 01/15/2059 | | | 809,881 | |
| | | | | 975,000 | | | 3.64%, 06/15/2048 | | | 1,005,982 | |
| | | | | 390,000 | | | 3.96%, 12/15/2047(1)(2) | | | 301,069 | |
| | | | | 430,000 | | | 4.10%, 05/15/2048(2) | | | 339,703 | |
| | | | | 665,000 | | | 4.23%, 06/15/2048(2) | | | 507,739 | |
| | | | | | | | WF-RBS Commercial Mortgage Trust | |
| | | | | 255,115 | | | 2.88%, 12/15/2045 | | | 258,034 | |
| | | | | 550,000 | | | 3.07%, 03/15/2045 | | | 560,435 | |
| | | | | 450,000 | | | 3.35%, 05/15/2045 | | | 454,011 | |
| | | | | | | | | | | | |
Shares or Principal Amount | | Market Value† | |
| ASSET & COMMERCIAL MORTGAGE BACKED SECURITIES - 30.0% - (continued) | |
| | | | | | | Commercial Mortgage-Backed Securities - 7.1% - (continued) | |
| | | | | | | | WF-RBS Commercial Mortgage Trust - (continued) | |
| | $ | | | | 175,000 | | | 3.44%, 04/15/2045 | | $ | 182,810 | |
| | | | | 955,000 | | | 3.61%, 11/15/2047 | | | 984,538 | |
| | | | | 895,000 | | | 3.67%, 11/15/2044 | | | 943,824 | |
| | | | | 990,000 | | | 3.72%, 05/15/2047 | | | 1,032,905 | |
| | | | | 120,000 | | | 3.88%, 08/15/2046 | | | 126,596 | |
| | | | | 4,775,000 | | | 4.00%, 05/15/2047 | | | 5,063,589 | |
| | | | | 4,375,000 | | | 4.05%, 03/15/2047 | | | 4,649,102 | |
| | | | | 755,286 | | | 4.10%, 03/15/2047 | | | 805,667 | |
| | | | | 315,000 | | | 4.35%, 03/15/2048(1)(2) | | | 289,945 | |
| | | | | 710,000 | | | 5.00%, 06/15/2044(1)(2) | | | 587,648 | |
| | | | | 815,000 | | | 5.00%, 04/15/2045(1)(2) | | | 480,844 | |
| | | | | 1,045,000 | | | 5.59%, 04/15/2045(1)(2) | | | 1,046,496 | |
| | | | | | | | | | | | |
| | | | | | | | | | | 176,571,967 | |
| | | | | | | | | | | | |
| | | | | | | Whole Loan Collateral CMO - 6.5% | |
| | | | | | | | Adjustable Rate Mortgage Trust | |
| | | | | 1,243,838 | | | 0.84%, 01/25/2036(2) | | | 1,032,577 | |
| | | | | 732,913 | | | 1.03%, 11/25/2035(2) | | | 677,488 | |
| | | | | 1,271,109 | | | 1.26%, 01/25/2036(2) | | | 1,091,698 | |
| | | | | | | | Alternative Loan Trust | |
| | | | | 2,333,407 | | | 0.90%, 11/25/2035(2) | | | 1,955,056 | |
| | | | | 319,744 | | | 1.03%, 01/25/2036(2) | | | 263,573 | |
| | | | | 2,126,942 | | | 5.75%, 05/25/2036 | | | 1,636,133 | |
| | | | | | | | American Home Mortgage Assets Trust | |
| | | | | 1,129,453 | | | 0.95%, 09/25/2046(2) | | | 851,497 | |
| | | | | 1,918,594 | | | 1.51%, 10/25/2046(2) | | | 1,521,812 | |
| | | | | | | | Banc of America Funding Trust | |
| | | | | 607,185 | | | 0.97%, 02/20/2047(2) | | | 535,031 | |
| | | | | 4,804,850 | | | 1.04%, 05/20/2047(2) | | | 3,935,605 | |
| | | | | 5,866,393 | | | 5.77%, 05/25/2037(2) | | | 5,229,275 | |
| | | | | 240,534 | | | 5.85%, 01/25/2037(3) | | | 203,655 | |
| | | | | | | | BCAP LLC Trust | |
| | | | | 1,065,314 | | | 0.93%, 01/25/2037(2) | | | 878,107 | |
| | | | | 2,905,955 | | | 0.94%, 03/25/2037(2) | | | 2,696,742 | |
| | | | | 775,893 | | | Bear Stearns Adjustable Rate Mortgage Trust
2.83%, 10/25/2035(2) | | | 747,036 | |
| | | | | 3,127,155 | | | Bear Stearns Alt-A Trust
1.26%, 01/25/2036(2) | | | 2,750,713 | |
| | | | | 1,884,977 | | | Bear Stearns Mortgage Funding Trust
0.94%, 10/25/2036(2) | | | 1,531,018 | |
| | | | | | | | Countrywide Home Loans, Inc. | |
| | | | | 768,815 | | | 2.99%, 11/20/2035(2) | | | 643,570 | |
| | | | | 483,349 | | | 3.09%, 03/20/2036(2) | | | 393,686 | |
| | | | | 4,509,016 | | | 3.13%, 09/25/2047(2) | | | 4,141,706 | |
| | | | | 846,519 | | | 3.13%, 04/20/2036(2) | | | 609,691 | |
| | | | | 2,900,801 | | | Credit Suisse First Boston Mortgage Securities Corp.
5.50%, 06/25/2035 | | | 2,693,081 | |
| | | | | 2,013,341 | | | DSLA Mortgage Loan Trust
1.46%, 03/19/2046(2) | | | 1,726,869 | |
| | | | | 4,065,143 | | | Fannie Mae Connecticut Avenue Securities
5.11%, 04/25/2029(2) | | | 4,180,837 | |
| | | | | | | | GMAC Mortgage Corp. Loan Trust | |
| | | | | 56,989 | | | 3.42%, 04/19/2036(2) | | | 50,751 | |
| | | | | 2,719,093 | | | 3.42%, 09/19/2035(2) | | | 2,483,815 | |
| | | | | 1,616,287 | | | GreenPoint Mortgage Funding Trust
1.94%, 10/25/2045(2) | | | 1,242,226 | |
The accompanying notes are an integral part of these financial statements.
|
| Hartford Total Return Bond HLS Fund |
Schedule of Investments – (continued)
December 31, 2016
| | | | | | | | | | | | |
Shares or Principal Amount | | Market Value† | |
| ASSET & COMMERCIAL MORTGAGE BACKED SECURITIES - 30.0% - (continued) | |
| | | | | | | Whole Loan Collateral CMO - 6.5% - (continued) | |
| | | | | | | | GSR Mortgage Loan Trust | |
| | $ | | | | 3,663,421 | | | 1.06%, 01/25/2037(2) | | $ | 2,234,164 | |
| | | | | 3,836,289 | | | 3.29%, 01/25/2036(2) | | | 3,544,126 | |
| | | | | | | | HarborView Mortgage Loan Trust | |
| | | | | 2,643,857 | | | 0.93%, 01/19/2038(2) | | | 2,285,911 | |
| | | | | 7,476,033 | | | 0.98%, 12/19/2036(2) | | | 5,771,104 | |
| | | | | 1,034,929 | | | 1.44%, 01/19/2035(2) | | | 675,088 | |
| | | | | | | | IndyMac Index Mortgage Loan Trust | |
| | | | | 3,459,780 | | | 1.04%, 07/25/2035(2) | | | 2,778,733 | |
| | | | | 2,030,418 | | | 1.05%, 01/25/2036(2) | | | 1,286,037 | |
| | | | | 2,997,876 | | | 1.16%, 07/25/2046(2) | | | 1,798,541 | |
| | | | | 3,501,022 | | | 3.02%, 03/25/2036(2) | | | 2,910,235 | |
| | | | | 1,260,975 | | | 3.08%, 08/25/2035(2) | | | 1,008,881 | |
| | | | | 1,532,475 | | | 3.09%, 01/25/2036(2) | | | 1,428,707 | |
| | | | | | | | JP Morgan Mortgage Trust | |
| | | | | 1,232,808 | | | 3.10%, 05/25/2036(2) | | | 1,109,645 | |
| | | | | 534,396 | | | 3.10%, 04/25/2037(2) | | | 472,031 | |
| | | | | 1,992,178 | | | 3.19%, 09/25/2035(2) | | | 1,902,391 | |
| | | | | 1,982,674 | | | Lehman XS Trust
0.97%, 07/25/2046(2) | | | 1,578,817 | |
| | | | | | | | LSTAR Securities Investment Trust | |
| | | | | 6,031,763 | | | 2.53%, 01/01/2020(1)(2) | | | 6,026,938 | |
| | | | | 5,151,311 | | | 2.62%, 04/01/2020(1)(2) | | | 5,141,652 | |
| | | | | 7,286,928 | | | 2.62%, 10/01/2020(1)(2) | | | 7,208,630 | |
| | | | | 2,862,095 | | | 2.62%, 09/01/2021(1)(2) | | | 2,801,467 | |
| | | | | 3,756,384 | | | 3.62%, 11/01/2021(1)(2) | | | 3,707,833 | |
| | | | | | | | Luminent Mortgage Trust | |
| | | | | 290,122 | | | 0.96%, 10/25/2046(2) | | | 247,718 | |
| | | | | 1,232,445 | | | 1.02%, 11/25/2035(2) | | | 1,109,493 | |
| | | | | | | | Merrill Lynch Mortgage Investors Trust | |
| | | | | 1,030,037 | | | 3.08%, 07/25/2035(2) | | | 792,163 | |
| | | | | 95,462 | | | 3.09%, 12/25/2035(2) | | | 90,257 | |
| | | | | 204,721 | | | Morgan Stanley Mortgage Loan Trust
3.12%, 05/25/2036(2) | | | 142,853 | |
| | | | | 8,753,000 | | | Mortgage Repurchase Agreement Financing Trust
1.87%, 06/10/2019(1)(2)(5) | | | 8,753,000 | |
| | | | | | | | New Residential Mortgage Loan Trust | |
| | | | | 7,199,828 | | | 3.75%, 11/26/2035(1)(2) | | | 7,453,132 | |
| | | | | 6,273,747 | | | 3.75%, 11/25/2056(1)(2) | | | 6,488,598 | |
| | | | | 106,626 | | | Nomura Asset Acceptance Corp. Alternative Loan Trust
3.90%, 06/25/2036(2) | | | 79,695 | |
| | | | | 2,097,328 | | | RBSGC Mortgage Pass-Through Certificates
6.25%, 01/25/2037 | | | 1,976,773 | |
| | | | | | | | Residential Accredit Loans, Inc. | |
| | | | | 369,008 | | | 0.98%, 02/25/2046(2) | | | 160,544 | |
| | | | | 805,656 | | | 1.06%, 04/25/2036(2) | | | 574,009 | |
| | | | | 4,921,618 | | | 1.85%, 11/25/2037(2) | | | 3,373,538 | |
| | | | | 1,208,199 | | | 6.00%, 12/25/2035 | | | 1,118,133 | |
| | | | | 2,650,915 | | | Residential Asset Securitization Trust
1.21%, 03/25/2035(2) | | | 2,082,517 | |
| | | | | 696,288 | | | Sequoia Mortgage Trust
3.10%, 07/20/2037(2) | | | 576,685 | |
| | | | | 1,225,837 | | | Structured Adjustable Rate Mortgage Loan Trust
1.06%, 09/25/2034(2) | | | 949,798 | |
| | | | | 258,979 | | | TBW Mortgage-Backed Trust
6.00%, 07/25/2036 | | | 206,589 | |
| | | | | | | | | | | | |
Shares or Principal Amount | | Market Value† | |
| ASSET & COMMERCIAL MORTGAGE BACKED SECURITIES - 30.0% - (continued) | |
| | | | | | | Whole Loan Collateral CMO - 6.5% - (continued) | |
| | | | | | | | Towd Point Mortgage Trust | |
| | $ | | | | 6,337,562 | | | 2.25%, 08/25/2055(1)(2) | | $ | 6,286,587 | |
| | | | | 1,716,893 | | | 2.75%, 02/25/2055(1)(2) | | | 1,713,108 | |
| | | | | 5,168,717 | | | 2.75%, 08/25/2055(1)(2) | | | 5,140,186 | |
| | | | | 1,379,940 | | | 3.00%, 03/25/2054(1)(2) | | | 1,394,439 | |
| | | | | | | | WaMu Mortgage Pass-Through Certificates Trust | |
| | | | | 1,033,162 | | | 1.18%, 06/25/2044(2) | | | 957,806 | |
| | | | | 587,566 | | | 2.10%, 11/25/2046(2) | | | 527,514 | |
| | | | | 1,869,596 | | | 2.58%, 06/25/2037(2) | | | 1,673,098 | |
| | | | | | | | Wells Fargo Commercial Mortgage Trust | |
| | | | | 46,544,836 | | | 1.18%, 09/15/2057(2)(4) | | | 2,916,146 | |
| | | | | 3,250,000 | | | 2.88%, 05/15/2048(1)(2) | | | 1,621,361 | |
| | | | | 1,685,000 | | | 3.36%, 09/15/2058(1) | | | 946,161 | |
| | | | | 1,015,000 | | | 3.84%, 09/15/2058 | | | 1,062,373 | |
| | | | | | | | | | | | |
| | | | | | | | | | | 161,788,453 | |
| | | | | | | | | | | | |
| | | |
| | | | | | | | Total Asset & Commercial Mortgage Backed Securities
(cost $752,495,570) | | $ | 751,054,884 | |
| | | | | | | | | | | | |
| | | |
| | | | | | | | | | | | |
| CORPORATE BONDS - 33.7% | |
| | | | | | | Advertising - 0.0% | |
| | | | | 100,000 | | | Lamar Media Corp.
5.75%, 02/01/2026 | | $ | 105,250 | |
| | | | | | | | | | | | |
| | | | | | | Aerospace/Defense - 0.2% | |
| | | | | 690,000 | | | BAE Systems Holdings, Inc.
2.85%, 12/15/2020(1) | | | 691,008 | |
| | | | | 730,000 | | | BAE Systems plc
4.75%, 10/11/2021(1) | | | 789,355 | |
| | | | | 370,000 | | | L-3 Communications Corp.
3.85%, 12/15/2026 | | | 367,785 | |
| | | | | | | | Lockheed Martin Corp. | |
| | | | | 1,385,000 | | | 2.50%, 11/23/2020 | | | 1,396,703 | |
| | | | | 1,931,000 | | | 4.70%, 05/15/2046 | | | 2,100,399 | |
| | | | | | | | | | | | |
| | | | | | | | | | | 5,345,250 | |
| | | | | | | | | | | | |
| | | | | | | Agriculture - 0.5% | |
| | | | | | | | Altria Group, Inc. | |
| | | | | 1,320,000 | | | 2.85%, 08/09/2022 | | | 1,321,617 | |
| | | | | 945,000 | | | 3.88%, 09/16/2046 | | | 872,134 | |
| | | | | 2,515,000 | | | BAT International Finance plc
2.75%, 06/15/2020(1) | | | 2,528,453 | |
| | | | | | | | Imperial Brands Finance plc | |
| | | | | 1,420,000 | | | 2.05%, 07/20/2018(1) | | | 1,419,679 | |
| | | | | 3,000,000 | | | 2.95%, 07/21/2020(1) | | | 3,018,354 | |
| | | | | 2,640,000 | | | Reynolds American, Inc.
3.25%, 06/12/2020 | | | 2,705,113 | |
| | | | | | | | | | | | |
| | | | | | | | | | | 11,865,350 | |
| | | | | | | | | | | | |
| | | | | | | Airlines - 0.0% | |
| | | | | 210,000 | | | Aircastle Ltd.
5.00%, 04/01/2023 | | | 214,200 | |
| | | | | | | | | | | | |
| | | | | | | Apparel - 0.1% | |
| | | | | 540,000 | | | Hanesbrands, Inc.
4.88%, 05/15/2026(1) | | | 527,850 | |
| | | | | 860,000 | | | William Carter Co.
5.25%, 08/15/2021 | | | 891,175 | |
| | | | | | | | | | | | |
| | | | 1,419,025 | |
| | | | | | | | | | | | |
The accompanying notes are an integral part of these financial statements.
|
| Hartford Total Return Bond HLS Fund |
Schedule of Investments – (continued)
December 31, 2016
| | | | | | | | | | | | |
Shares or Principal Amount | | Market Value† | |
| CORPORATE BONDS - 33.7% - (continued) | |
| | | | Auto Manufacturers - 1.5% | |
| | $ | | | | 4,875,000 | | | Daimler Finance North America LLC
1.65%, 03/02/2018(1) | | $ | 4,868,653 | |
| | | | | 1,280,000 | | | Ford Motor Co.
4.35%, 12/08/2026 | | | 1,293,437 | |
| | | | Ford Motor Credit Co. LLC | |
| | | | | 7,530,000 | | | 1.46%, 03/27/2017 | | | 7,531,205 | |
| | | | | 1,070,000 | | | 4.13%, 08/04/2025 | | | 1,071,286 | |
| | | | | 1,295,000 | | | 4.25%, 02/03/2017 | | | 1,297,550 | |
| | | | | 1,695,000 | | | 4.39%, 01/08/2026 | | | 1,717,840 | |
| | | | General Motors Co. | |
| | | | | 2,045,000 | | | 6.60%, 04/01/2036 | | | 2,337,449 | |
| | | | | 480,000 | | | 6.75%, 04/01/2046 | | | 562,891 | |
| | | | General Motors Financial Co., Inc. | |
| | | | | 2,650,000 | | | 2.40%, 04/10/2018 | | | 2,652,833 | |
| | | | | 4,985,000 | | | 3.50%, 07/10/2019 | | | 5,076,001 | |
| | | | | 1,950,000 | | | 3.70%, 05/09/2023 | | | 1,918,775 | |
| | | | | 3,025,000 | | | 4.75%, 08/15/2017 | | | 3,082,378 | |
| | | | | 2,810,000 | | | 5.25%, 03/01/2026 | | | 2,951,880 | |
| | | | | | | | | | | | |
| | | | 36,362,178 | |
| | | | | | | | | | | | |
| | | | Auto Parts & Equipment - 0.0% | |
| | | | | 245,000 | | | Adient Global Holdings Ltd.
4.88%, 08/15/2026(1) | | | 240,100 | |
| | | | | | | | | | | | |
| | | | Beverages - 1.5% | |
| | | | Anheuser-Busch InBev Finance, Inc. | |
| | | | | 4,320,000 | | | 1.90%, 02/01/2019 | | | 4,326,199 | |
| | | | | 850,000 | | | 2.15%, 02/01/2019 | | | 855,261 | |
| | | | | 13,640,000 | | | 3.30%, 02/01/2023 | | | 13,881,864 | |
| | | | | 610,000 | | | 3.65%, 02/01/2026 | | | 619,266 | |
| | | | | 4,245,000 | | | 4.70%, 02/01/2036 | | | 4,465,180 | |
| | | | | 6,435,000 | | | 4.90%, 02/01/2046 | | | 6,955,398 | |
| | | | Anheuser-Busch InBev Worldwide, Inc. | |
| | | | | 1,440,000 | | | 2.50%, 07/15/2022 | | | 1,417,257 | |
| | | | | 2,220,000 | | | 3.75%, 07/15/2042 | | | 1,996,652 | |
| | | | | 1,485,000 | | | Molson Coors Brewing Co.
4.20%, 07/15/2046 | | | 1,384,503 | |
| | | | | 2,650,000 | | | Pernod Ricard S.A.
3.25%, 06/08/2026(1) | | | 2,542,752 | |
| | | | | | | | | | | | |
| | | | 38,444,332 | |
| | | | | | | | | | | | |
| | | | Biotechnology - 0.1% | |
| | | | | 1,065,000 | | | Celgene Corp.
4.63%, 05/15/2044 | | | 1,042,762 | |
| | | | Gilead Sciences, Inc. | |
| | | | | 615,000 | | | 2.50%, 09/01/2023 | | | 593,057 | |
| | | | | 1,095,000 | | | 3.25%, 09/01/2022 | | | 1,117,696 | |
| | | | | | | | | | | | |
| | | | 2,753,515 | |
| | | | | | | | | | | | |
| | | | Chemicals - 0.1% | |
| | | | Methanex Corp. | |
| | | | | 1,280,000 | | | 4.25%, 12/01/2024 | | | 1,231,333 | |
| | | | | 1,170,000 | | | 5.65%, 12/01/2044 | | | 1,026,421 | |
| | | | | 95,000 | | | Versum Materials, Inc.
5.50%, 09/30/2024(1) | | | 97,138 | |
| | | | | | | | | | | | |
| | | | 2,354,892 | |
| | | | | | | | | | | | |
| | | | Commercial Banks - 10.8% | |
| | EUR | | | | 3,095,000 | | | Allied Irish Banks plc
7.38%, 12/03/2020(2)(6)(7) | | | 3,212,329 | |
| | | | Banco Bilbao Vizcaya Argentaria S.A. | |
| | | | | 3,600,000 | | | 7.00%, 02/19/2019(2)(6)(7) | | | 3,634,322 | |
| | | | | 600,000 | | | 8.88%, 04/14/2021(2)(6)(7) | | | 679,023 | |
| | | | | | | | | | | | |
Shares or Principal Amount | | Market Value† | |
| CORPORATE BONDS - 33.7% - (continued) | |
| | | | Commercial Banks - 10.8% - (continued) | |
| | | | Banco Bilbao Vizcaya Argentaria S.A. - (continued) | |
| | $ | | | | 4,000,000 | | | 9.00%, 05/09/2018(2)(6)(7) | | $ | 4,163,984 | |
| | | | Banco Santander S.A. | | | | |
| | EUR | | | | 2,000,000 | | | 6.25%, 03/12/2019(2)(6)(7) | | | 1,968,456 | |
| | | | | 1,000,000 | | | 6.25%, 09/11/2021(2)(6)(7) | | | 986,123 | |
| | | | | | | | Bank of America Corp. | | | | |
| | $ | | | | 7,000,000 | | | 2.50%, 10/21/2022 | | | 6,769,889 | |
| | | | | 3,670,000 | | | 2.63%, 04/19/2021 | | | 3,644,817 | |
| | | | | 3,000,000 | | | 4.00%, 01/22/2025 | | | 3,003,768 | |
| | | | | 2,080,000 | | | 4.18%, 11/25/2027 | | | 2,081,329 | |
| | | | | 5,570,000 | | | 4.20%, 08/26/2024 | | | 5,674,181 | |
| | | | | 735,000 | | | 5.00%, 01/21/2044 | | | 804,893 | |
| | | | | 750,000 | | | 6.11%, 01/29/2037 | | | 879,222 | |
| | | | | 4,725,000 | | | 7.75%, 05/14/2038 | | | 6,505,399 | |
| | EUR | | | | 2,925,000 | | | Bank of Ireland
7.38%, 06/18/2020(2)(6)(7) | | | 3,133,809 | |
| | $ | | | | 2,415,000 | | | Bank of Nova Scotia
4.50%, 12/16/2025 | | | 2,480,898 | |
| | | | | 5,970,000 | | | Barclays Bank plc
6.05%, 12/04/2017(1) | | | 6,167,529 | |
| | | | | | | | Barclays plc | | | | |
| | | | | 1,450,000 | | | 7.88%, 03/15/2022(2)(6)(7) | | | 1,468,125 | |
| | EUR | | | | 2,895,000 | | | 8.00%, 12/15/2020(2)(7) | | | 3,213,934 | |
| | $ | | | | 1,940,000 | | | BNP Paribas S.A.
7.63%, 03/30/2021(1)(2)(7) | | | 2,046,894 | |
| | | | | 200,000 | | | BPCE S.A.
5.15%, 07/21/2024(1) | | | 203,321 | |
| | | | | | | | Capital One NA/Mclean VA | | | | |
| | | | | 9,410,000 | | | 1.65%, 02/05/2018 | | | 9,391,726 | |
| | | | | 2,645,000 | | | 2.35%, 08/17/2018 | | | 2,660,193 | |
| | | | | 1,408,000 | | | CIT Group, Inc.
5.50%, 02/15/2019(1) | | | 1,485,440 | |
| | | | | | | | Citigroup, Inc. | | | | |
| | | | | 1,195,000 | | | 1.85%, 11/24/2017 | | | 1,197,259 | |
| | | | | 1,025,000 | | | 2.50%, 09/26/2018 | | | 1,034,804 | |
| | | | | 2,675,000 | | | 2.70%, 03/30/2021 | | | 2,668,880 | |
| | | | | 1,550,000 | | | 4.30%, 11/20/2026 | | | 1,564,148 | |
| | | | | 6,495,000 | | | 4.45%, 09/29/2027 | | | 6,597,920 | |
| | | | | 2,955,000 | | | 4.60%, 03/09/2026 | | | 3,054,238 | |
| | | | | 871,000 | | | 4.65%, 07/30/2045 | | | 918,076 | |
| | | | | 2,115,000 | | | 4.75%, 05/18/2046 | | | 2,117,441 | |
| | | | | 1,015,000 | | | 5.50%, 09/13/2025 | | | 1,115,496 | |
| | | | | 5,650,000 | | | Credit Agricole S.A.
8.13%, 12/23/2025(1)(2)(7) | | | 5,946,399 | |
| | | | | 5,760,000 | | | Credit Suisse Group AG
6.25%, 12/18/2024(1)(2)(7) | | | 5,605,632 | |
| | | | | 2,475,000 | | | Credit Suisse Group Funding Guernsey Ltd.
3.13%, 12/10/2020 | | | 2,467,263 | |
| | | | | | | | Goldman Sachs Group, Inc. | | | | |
| | | | | 590,000 | | | 2.00%, 04/25/2019 | | | 587,657 | |
| | | | | 550,000 | | | 2.04%, 04/23/2020(2) | | | 555,256 | |
| | | | | 3,835,000 | | | 2.35%, 11/15/2021 | | | 3,725,933 | |
| | | | | 1,290,000 | | | 2.38%, 01/22/2018 | | | 1,297,669 | |
| | | | | 2,215,000 | | | 2.75%, 09/15/2020 | | | 2,224,569 | |
| | | | | 2,720,000 | | | 2.88%, 02/25/2021 | | | 2,732,577 | |
| | | | | 1,115,000 | | | 4.75%, 10/21/2045 | | | 1,177,042 | |
| | | | | 3,490,000 | | | 5.15%, 05/22/2045 | | | 3,670,293 | |
| | | | | 3,687,000 | | | 6.00%, 06/15/2020 | | | 4,088,666 | |
| | | | | 2,655,000 | | | 6.25%, 02/01/2041 | | | 3,291,050 | |
| | | | | 3,680,000 | | | 6.45%, 05/01/2036 | | | 4,385,721 | |
| | | | | 2,720,000 | | | 6.75%, 10/01/2037 | | | 3,358,784 | |
The accompanying notes are an integral part of these financial statements.
|
| Hartford Total Return Bond HLS Fund |
Schedule of Investments – (continued)
December 31, 2016
| | | | | | | | | | | | |
Shares or Principal Amount | | Market Value† | |
| CORPORATE BONDS - 33.7% - (continued) | |
| | | | Commercial Banks - 10.8% - (continued) | |
| | | | | | | | HSBC Holdings plc | |
| | $ | | | | 1,305,000 | | | 2.95%, 05/25/2021 | | $ | 1,304,505 | |
| | | | | 4,335,000 | | | 3.40%, 03/08/2021 | | | 4,408,171 | |
| | | | | 1,335,000 | | | 3.60%, 05/25/2023 | | | 1,342,740 | |
| | | | | 4,820,000 | | | 4.25%, 08/18/2025 | | | 4,864,093 | |
| | | | | 1,800,000 | | | 5.25%, 03/14/2044 | | | 1,927,557 | |
| | | | | 1,350,000 | | | HSBC USA, Inc.
2.75%, 08/07/2020 | | | 1,352,680 | |
| | | | | 4,225,000 | | | Intesa Sanpaolo S.p.A.
7.70%, 09/17/2025 (1)(2)(7) | | | 3,966,219 | |
| | | | | | | | JP Morgan Chase & Co. | |
| | | | | 955,000 | | | 2.11%, 10/24/2023 (2) | | | 974,070 | |
| | | | | 1,840,000 | | | 2.30%, 08/15/2021 | | | 1,805,912 | |
| | | | | 7,865,000 | | | 2.40%, 06/07/2021 | | | 7,792,752 | |
| | | | | 1,055,000 | | | 2.55%, 10/29/2020 | | | 1,054,221 | |
| | | | | 3,620,000 | | | 2.70%, 05/18/2023 | | | 3,541,768 | |
| | | | | 2,875,000 | | | 4.25%, 10/01/2027 | | | 2,953,856 | |
| | | | | 3,820,000 | | | 4.35%, 08/15/2021 | | | 4,086,617 | |
| | | | | 55,000 | | | 5.60%, 07/15/2041 | | | 65,769 | |
| | GBP | | | | 895,000 | | | Lloyds Banking Group plc
7.00%, 06/27/2019 (2)(6)(7) | | | 1,115,418 | |
| | | | | | | | Morgan Stanley | |
| | $ | | | | 6,760,000 | | | 2.50%, 04/21/2021 | | | 6,686,505 | |
| | | | | 5,085,000 | | | 3.13%, 07/27/2026 | | | 4,858,087 | |
| | | | | 2,980,000 | | | 3.95%, 04/23/2027 | | | 2,949,929 | |
| | | | | 3,275,000 | | | 4.00%, 07/23/2025 | | | 3,356,931 | |
| | | | | 1,400,000 | | | 4.35%, 09/08/2026 | | | 1,434,647 | |
| | | | | 5,925,000 | | | 5.55%, 04/27/2017 | | | 6,003,417 | |
| | | | | 2,675,000 | | | 6.25%, 08/28/2017 | | | 2,756,210 | |
| | | | | 1,600,000 | | | 7.30%, 05/13/2019 | | | 1,782,845 | |
| | | | | 2,215,000 | | | PNC Bank NA
1.45%, 07/29/2019 | | | 2,184,865 | |
| | | | | 510,000 | | | Radian Group, Inc.
7.00%, 03/15/2021 | | | 567,375 | |
| | | | | | | | Royal Bank of Scotland Group plc | |
| | | | | 6,680,000 | | | 3.88%, 09/12/2023 | | | 6,414,510 | |
| | | | | 650,000 | | | 6.13%, 12/15/2022 | | | 691,166 | |
| | | | | 3,570,000 | | | 7.50%, 08/10/2020 (2)(7) | | | 3,382,575 | |
| | | | | 1,160,000 | | | 8.63%, 08/15/2021 (2)(7) | | | 1,183,200 | |
| | | | | 4,400,000 | | | Santander Issuances SAU
5.18%, 11/19/2025 | | | 4,441,373 | |
| | GBP | | | | 475,000 | | | Santander UK Group Holdings plc
7.38%, 06/24/2022 (2)(6)(7) | | | 585,420 | |
| | | | | | | | Societe Generale S.A. | |
| | $ | | | | 3,275,000 | | | 7.38%, 09/13/2021 (1)(2)(7) | | | 3,269,498 | |
| | | | | 4,535,000 | | | 8.25%, 11/29/2018 (2)(6)(7) | | | 4,716,672 | |
| | | | | | | | UBS Group AG | |
| | | | | 3,950,000 | | | 6.88%, 03/22/2021 (2)(6)(7) | | | 4,019,125 | |
| | | | | 3,145,000 | | | 7.13%, 02/19/2020 (2)(6)(7) | | | 3,234,236 | |
| | | | | 3,350,000 | | | UBS Group Funding Jersey Ltd.
2.65%, 02/01/2022 (1) | | | 3,255,848 | |
| | | | | | | | Wells Fargo & Co. | |
| | | | | 1,655,000 | | | 3.00%, 04/22/2026 | | | 1,579,254 | |
| | | | | 1,200,000 | | | 3.00%, 10/23/2026 | | | 1,142,876 | |
| | | | | 3,340,000 | | | 4.40%, 06/14/2046 | | | 3,196,560 | |
| | | | | 3,285,000 | | | 4.90%, 11/17/2045 | | | 3,374,093 | |
| | | | | 74,000 | | | 5.38%, 11/02/2043 | | | 81,670 | |
| | | | | 4,760,000 | | | 5.61%, 01/15/2044 | | | 5,393,275 | |
| | | | | | | | | | | | |
Shares or Principal Amount | | Market Value† | |
| CORPORATE BONDS - 33.7% - (continued) | |
| | | | Commercial Banks - 10.8% - (continued) | |
| | $ | | | | 4,875,000 | | | Wells Fargo Bank NA
2.15%, 12/06/2019 | | $ | 4,871,978 | |
| | | | | | | | | | | | |
| | | | 271,612,865 | |
| | | | | | | | | | | | |
| | | | | | | Commercial Services - 0.2% | |
| | | | | 670,000 | | | Cardtronics, Inc.
5.13%, 08/01/2022 | | | 675,025 | |
| | | | | 2,915,000 | | | ERAC USA Finance LLC
2.60%, 12/01/2021(1) | | | 2,868,692 | |
| | | | | | | | United Rentals North America, Inc. | |
| | | | | 470,000 | | | 4.63%, 07/15/2023 | | | 479,400 | |
| | | | | 400,000 | | | 5.50%, 07/15/2025 | | | 408,000 | |
| | | | | | | | | | | | |
| | | | 4,431,117 | |
| | | | | | | | | | | | |
| | | | | | | Construction Materials - 0.2% | |
| | | | | 190,000 | | | Boise Cascade Co.
5.63%, 09/01/2024 (1) | | | 188,575 | |
| | | | | 3,000,000 | | | CRH America, Inc.
5.13%, 05/18/2045 (1) | | | 3,124,086 | |
| | | | | 395,000 | | | Eagle Materials, Inc.
4.50%, 08/01/2026 | | | 394,013 | |
| | | | | 660,000 | | | Norbord, Inc.
6.25%, 04/15/2023 (1) | | | 683,100 | |
| | | | | | | | Standard Industries, Inc. | |
| | | | | 815,000 | | | 5.38%, 11/15/2024 (1) | | | 837,412 | |
| | | | | 930,000 | | | 6.00%, 10/15/2025 (1) | | | 978,825 | |
| | | | | | | | | | | | |
| | | | | | | | | | | 6,206,011 | |
| | | | | | | | | | | | |
| | | | | | | Diversified Financial Services - 0.7% | |
| | | | | 255,000 | | | Aircastle Ltd.
5.50%, 02/15/2022 | | | 270,300 | |
| | | | | 3,217,000 | | | Bear Stearns Cos LLC
5.55%, 01/22/2017 | | | 3,223,296 | |
| | | | | 2,285,000 | | | Intercontinental Exchange, Inc.
2.75%, 12/01/2020 | | | 2,309,728 | |
| | | | | 580,000 | | | Nasdaq, Inc.
3.85%, 06/30/2026 | | | 576,173 | |
| | | | | | | | Navient Corp. | |
| | | | | 680,000 | | | 5.50%, 01/15/2019 | | | 705,500 | |
| | | | | 1,005,000 | | | 7.25%, 01/25/2022 | | | 1,064,044 | |
| | | | | 3,925,000 | | | Synchrony Financial
2.60%, 01/15/2019 | | | 3,944,853 | |
| | | | | | | | Visa, Inc. | |
| | | | | 1,825,000 | | | 2.80%, 12/14/2022 | | | 1,835,225 | |
| | | | | 2,980,000 | | | 4.30%, 12/14/2045 | | | 3,145,432 | |
| | | | | | | | | | | | |
| | | | | | | | | | | 17,074,551 | |
| | | | | | | | | | | | |
| | | | | | | Electric - 1.1% | |
| | | | | | | | AES Corp. | |
| | | | | 1,360,000 | | | 4.88%, 05/15/2023 | | | 1,343,272 | |
| | | | | 460,000 | | | 5.50%, 03/15/2024 | | | 468,050 | |
| | | | | 1,770,000 | | | Dominion Resources, Inc.
2.85%, 08/15/2026 | | | 1,657,129 | |
| | | | | 1,605,000 | | | DTE Energy Co.
1.50%, 10/01/2019 | | | 1,578,322 | |
| | | | | 1,525,000 | | | Duke Energy Carolinas LLC
4.25%, 12/15/2041 | | | 1,560,063 | |
| | | | | 705,000 | | | Duke Energy Corp.
2.65%, 09/01/2026 | | | 657,996 | |
The accompanying notes are an integral part of these financial statements.
|
| Hartford Total Return Bond HLS Fund |
Schedule of Investments – (continued)
December 31, 2016
| | | | | | | | | | | | |
Shares or Principal Amount | | Market Value† | |
| CORPORATE BONDS - 33.7% - (continued) | |
| | | | | | | Electric - 1.1% - (continued) | |
| | $ | | | | 2,230,000 | | | Duke Energy Florida LLC
3.40%, 10/01/2046 | | $ | 1,984,198 | |
| | | | | 1,880,000 | | | Duke Energy Progress LLC
4.38%, 03/30/2044 | | | 1,948,114 | |
| | | | | 2,400,000 | | | Electricite de France S.A.
4.95%, 10/13/2045 (1) | | | 2,428,267 | |
| | | | | | | | Emera US Finance L.P. | |
| | | | | 435,000 | | | 2.70%, 06/15/2021 (1) | | | 430,582 | |
| | | | | 475,000 | | | 4.75%, 06/15/2046 (1) | | | 479,011 | |
| | | | | 3,070,000 | | | Exelon Corp.
2.85%, 06/15/2020 | | | 3,102,772 | |
| | | | | 2,470,000 | | | FirstEnergy Corp.
4.25%, 03/15/2023 | | | 2,553,474 | |
| | | | | | | | Fortis, Inc. | |
| | | | | 800,000 | | | 2.10%, 10/04/2021 (1) | | | 773,212 | |
| | | | | 1,710,000 | | | 3.06%, 10/04/2026 (1) | | | 1,599,324 | |
| | | | | 1,005,000 | | | NextEra Energy Capital Holdings, Inc.
1.65%, 09/01/2018 | | | 1,001,845 | |
| | | | | 700,000 | | | NRG Energy, Inc.
7.25%, 05/15/2026 (1) | | | 696,500 | |
| | | | | 690,000 | | | Oncor Electric Delivery Co. LLC
7.00%, 09/01/2022 | | | 842,193 | |
| | | | | | | | Southern Co. | |
| | | | | 1,625,000 | | | 1.85%, 07/01/2019 | | | 1,619,969 | |
| | | | | 665,000 | | | 2.95%, 07/01/2023 | | | 656,415 | |
| | | | | 805,000 | | | 4.40%, 07/01/2046 | | | 796,237 | |
| | | | | | | | | | | | |
| | | | | | | | | | | 28,176,945 | |
| | | | | | | | | | | | |
| | | | | | | Electrical Components & Equipment - 0.0% | |
| | | | | 685,000 | | | EnerSys
5.00%, 04/30/2023 (1) | | | 688,425 | |
| | | | | | | | | | | | |
| | | | | | | Electronics - 0.1% | |
| | | | | 1,555,000 | | | Fortive Corp.
2.35%, 06/15/2021 (1) | | | 1,534,205 | |
| | | | | | | | | | | | |
| | | | | | | Engineering & Construction - 0.5% | |
| | | | | | | | SBA Tower Trust | |
| | | | | 5,620,000 | | | 2.93%, 12/09/2042 (1) | | | 5,625,826 | |
| | | | | 7,645,000 | | | 3.60%, 04/15/2043 (1) | | | 7,673,206 | |
| | | | | | | | | | | | |
| | | | | | | | | | | 13,299,032 | |
| | | | | | | | | | | | |
| | | | | | | Entertainment - 0.1% | |
| | | | | | | | GLP Capital L.P. / GLP Financing II, Inc. | |
| | | | | 20,000 | | | 4.38%, 04/15/2021 | | | 20,750 | |
| | | | | 335,000 | | | 5.38%, 04/15/2026 | | | 349,372 | |
| | | | | | | | WMG Acquisition Corp. | |
| | | | | 760,000 | | | 4.88%, 11/01/2024 (1) | | | 756,200 | |
| | | | | 260,000 | | | 5.00%, 08/01/2023 (1) | | | 261,300 | |
| | | | | | | | | | | | |
| | | | | | | | | | | 1,387,622 | |
| | | | | | | | | | | | |
| | | | | | | Environmental Control - 0.0% | |
| | | | | | | | Clean Harbors, Inc. | |
| | | | | 345,000 | | | 5.13%, 06/01/2021 | | | 352,832 | |
| | | | | 820,000 | | | 5.25%, 08/01/2020 | | | 839,475 | |
| | | | | | | | | | | | |
| | | | | | | | | | | 1,192,307 | |
| | | | | | | | | | | | |
| | | | | | | Food - 0.6% | |
| | | | | 3,800,000 | | | Danone S.A.
1.69%, 10/30/2019 (1) | | | 3,752,424 | |
| | | | | | | | Kraft Heinz Foods Co. | |
| | | | | 2,050,000 | | | 2.00%, 07/02/2018 | | | 2,050,461 | |
| | | | | | | | | | | | |
Shares or Principal Amount | | Market Value† | |
| CORPORATE BONDS - 33.7% - (continued) | |
| | | | | | | Food - 0.6% - (continued) | |
| | | | | | | | Kraft Heinz Foods Co. - (continued) | |
| | $ | | | | 855,000 | | | 2.80%, 07/02/2020 | | $ | 863,124 | |
| | | | | 615,000 | | | 4.38%, 06/01/2046 | | | 578,702 | |
| | | | | | | | Kroger Co. | |
| | | | | 940,000 | | | 1.50%, 09/30/2019 | | | 925,716 | |
| | | | | 1,325,000 | | | 2.65%, 10/15/2026 | | | 1,231,001 | |
| | | | | 160,000 | | | 3.88%, 10/15/2046 | | | 145,659 | |
| | | | | | | | Lamb Weston Holdings, Inc. | |
| | | | | 345,000 | | | 4.63%, 11/01/2024 (1) | | | 345,863 | |
| | | | | 345,000 | | | 4.88%, 11/01/2026 (1) | | | 341,334 | |
| | | | | 2,285,000 | | | Sigma Alimentos S.A. de CV
4.13%, 05/02/2026 (1) | | | 2,170,750 | |
| | | | | 2,320,000 | | | Sysco Corp.
2.50%, 07/15/2021 | | | 2,295,241 | |
| | | | | | | | | | | | |
| | | | | | | | | | | 14,700,275 | |
| | | | | | | | | | | | |
| | | | | | | Forest Products & Paper - 0.1% | |
| | | | | 500,000 | | | Cascades, Inc.
5.75%, 07/15/2023 (1) | | | 507,500 | |
| | | | | 1,415,000 | | | Clearwater Paper Corp.
5.38%, 02/01/2025 (1) | | | 1,400,850 | |
| | | | | | | | | | | | |
| | | | | | | | | | | 1,908,350 | |
| | | | | | | | | | | | |
| | | | | | | Gas - 0.1% | |
| | | | | | | | AmeriGas Partners L.P. / AmeriGas Finance Corp. | |
| | | | | 375,000 | | | 5.63%, 05/20/2024 | | | 383,437 | |
| | | | | 375,000 | | | 5.88%, 08/20/2026 | | | 380,625 | |
| | | | | 505,000 | | | Southern Co. Gas Capital Corp.
2.45%, 10/01/2023 | | | 484,343 | |
| | | | | 160,000 | | | Southern Star Central Corp.
5.13%, 07/15/2022 (1) | | | 162,000 | |
| | | | | | | | | | | | |
| | | | | | | | | | | 1,410,405 | |
| | | | | | | | | | | | |
| | | | | | | Healthcare-Products - 0.4% | |
| | | | | 640,000 | | | Kinetic Concepts, Inc. / KCI USA, Inc.
7.88%, 02/15/2021 (1) | | | 694,400 | |
| | | | | | | | Medtronic, Inc. | |
| | | | | 2,138,000 | | | 4.38%, 03/15/2035 | | | 2,261,850 | |
| | | | | 645,000 | | | 4.63%, 03/15/2045 | | | 697,517 | |
| | | | | | | | Thermo Fisher Scientific, Inc. | |
| | | | | 410,000 | | | 2.95%, 09/19/2026 | | | 387,142 | |
| | | | | 2,430,000 | | | 3.00%, 04/15/2023 | | | 2,388,367 | |
| | | | | 3,900,000 | | | Zimmer Biomet Holdings, Inc.
1.45%, 04/01/2017 | | | 3,900,940 | |
| | | | | | | | | | | | |
| | | | | | | | | | | 10,330,216 | |
| | | | | | | | | | | | |
| | | | | | | Healthcare-Services - 0.8% | |
| | | | | | | | Aetna, Inc. | |
| | | | | 925,000 | | | 2.80%, 06/15/2023 | | | 911,133 | |
| | | | | 425,000 | | | 4.25%, 06/15/2036 | | | 426,124 | |
| | | | | | | | Anthem, Inc. | |
| | | | | 4,120,000 | | | 3.50%, 08/15/2024 | | | 4,108,303 | |
| | | | | 720,000 | | | 4.63%, 05/15/2042 | | | 723,434 | |
| | | | | 645,000 | | | Community Health Systems, Inc.
5.13%, 08/01/2021 | | | 598,238 | |
| | | | | 1,040,000 | | | HCA, Inc.
7.50%, 02/15/2022 | | | 1,180,400 | |
| | | | | 900,000 | | | LifePoint Health, Inc.
5.88%, 12/01/2023 | | | 911,250 | |
| | | | | 220,000 | | | MEDNAX, Inc.
5.25%, 12/01/2023 (1) | | | 226,600 | |
| | | | | 1,725,000 | | | Tenet Healthcare Corp.
6.00%, 10/01/2020 | | | 1,806,937 | |
The accompanying notes are an integral part of these financial statements.
|
| Hartford Total Return Bond HLS Fund |
Schedule of Investments – (continued)
December 31, 2016
| | | | | | | | | | | | |
Shares or Principal Amount | | Market Value† | |
| CORPORATE BONDS - 33.7% - (continued) | |
| | | | | | | Healthcare-Services - 0.8% - (continued) | |
| | | | | | | | UnitedHealth Group, Inc. | |
| | $ | | | | 2,880,000 | | | 1.70%, 02/15/2019 | | $ | 2,871,343 | |
| | | | | 2,250,000 | | | 3.35%, 07/15/2022 | | | 2,318,188 | |
| | | | | 2,255,000 | | | 3.75%, 07/15/2025 | | | 2,334,453 | |
| | | | | 670,000 | | | 4.75%, 07/15/2045 | | | 738,084 | |
| | | | | | | | | | | | |
| | | | | | | | | | | 19,154,487 | |
| | | | | | | | | | | | |
| | | | | | | Home Builders - 0.0% | |
| | | | | 655,000 | | | Meritage Homes Corp.
6.00%, 06/01/2025 | | | 663,187 | |
| | | | | 65,000 | | | Toll Brothers Finance Corp.
4.88%, 11/15/2025 | | | 63,863 | |
| | | | | | | | | | | | |
| | | | | | | | | | | 727,050 | |
| | | | | | | | | | | | |
| | | | | | | Household Products/Wares - 0.0% | |
| | | | | 95,000 | | | ACCO Brands Corp.
5.25%, 12/15/2024(1) | | | 95,654 | |
| | | | | | | | | | | | |
| | | | | | | Insurance - 0.3% | |
| | | | | 1,335,000 | | | American International Group, Inc.
4.70%, 07/10/2035 | | | 1,383,622 | |
| | | | | | | | CNO Financial Group, Inc. | |
| | | | | 55,000 | | | 4.50%, 05/30/2020 | | | 56,375 | |
| | | | | 440,000 | | | 5.25%, 05/30/2025 | | | 439,450 | |
| | | | | 1,830,000 | | | Marsh & McLennan Cos., Inc.
3.50%, 03/10/2025 | | | 1,842,466 | |
| | | | | 2,133,000 | | | Massachusetts Mutual Life Insurance Co.
8.88%, 06/01/2039 (1) | | | 3,201,972 | |
| | | | | 255,000 | | | MGIC Investment Corp.
5.75%, 08/15/2023 | | | 265,838 | |
| | | | | | | | | | | | |
| | | | | | | | | | | 7,189,723 | |
| | | | | | | | | | | | |
| | | | | | | Internet - 0.0% | | | |
| | | | | 365,000 | | | Netflix, Inc.
4.38%, 11/15/2026 (1) | | | 354,050 | |
| | | | | | | | | | | | |
| | | | | | | Iron/Steel - 0.0% | |
| | | | | | | | ArcelorMittal | |
| | | | | 380,000 | | | 5.13%, 06/01/2020 | | | 398,050 | |
| | | | | 320,000 | | | 6.13%, 06/01/2025 | | | 350,400 | |
| | | | | 255,000 | | | Steel Dynamics, Inc.
5.50%, 10/01/2024 | | | 270,300 | |
| | | | | | | | | | | | |
| | | | | | | | | | | 1,018,750 | |
| | | | | | | | | | | | |
| | | | | | | IT Services - 0.2% | |
| | | | | | | | Apple, Inc. | |
| | | | | 2,825,000 | | | 3.45%, 02/09/2045 | | | 2,493,480 | |
| | | | | 515,000 | | | 3.85%, 08/04/2046 | | | 493,443 | |
| | | | | | | | Diamond 1 Finance Corp. / Diamond 2 Finance Corp. | |
| | | | | 1,335,000 | | | 3.48%, 06/01/2019 (1) | | | 1,362,776 | |
| | | | | 1,060,000 | | | 4.42%, 06/15/2021 (1) | | | 1,096,830 | |
| | | | | 650,000 | | | 8.35%, 07/15/2046 (1) | | | 800,337 | |
| | | | | | | | | | | | |
| | | | | | | | | | | 6,246,866 | |
| | | | | | | | | | | | |
| | | | | | | Lodging - 0.0% | |
| | | | | 880,000 | | | Wynn Las Vegas LLC / Wynn Las Vegas Capital Corp.
5.38%, 03/15/2022 | | | 902,000 | |
| | | | | | | | | | | | |
| | | | | | | Machinery-Construction & Mining - 0.0% | |
| | | | | 525,000 | | | Oshkosh Corp.
5.38%, 03/01/2025 | | | 535,500 | |
| | | | | | | | | | | | |
| | | | | | | | | | | | |
Shares or Principal Amount | | Market Value† | |
| CORPORATE BONDS - 33.7% - (continued) | |
| | | | | | | Machinery-Diversified - 0.0% | |
| | $ | | | | 300,000 | | | CNH Industrial N.V.
4.50%, 08/15/2023 | | $ | 296,250 | |
| | | | | | | | | | | | |
| | | | | | | Media - 2.5% | |
| | | | | | | | 21st Century Fox America, Inc. | |
| | | | | 1,450,000 | | | 3.38%, 11/15/2026 (1) | | | 1,421,403 | |
| | | | | 270,000 | | | 4.75%, 11/15/2046 (1) | | | 270,806 | |
| | | | | 2,775,000 | | | 6.15%, 03/01/2037 | | | 3,247,483 | |
| | | | | 1,175,000 | | | 6.20%, 12/15/2034 | | | 1,380,367 | |
| | | | | 705,000 | | | Altice US Finance I Corp.
5.50%, 05/15/2026 (1) | | | 719,100 | |
| | | | | 815,000 | | | CBS Corp.
4.00%, 01/15/2026 | | | 828,891 | |
| | | | | | | | CCO Holdings LLC / CCO Holdings Capital Corp. | |
| | | | | 80,000 | | | 5.13%, 02/15/2023 | | | 82,200 | |
| | | | | 385,000 | | | 5.75%, 09/01/2023 | | | 402,325 | |
| | | | | 145,000 | | | 5.75%, 02/15/2026 (1) | | | 150,075 | |
| | | | | | | | Charter Communications Operating LLC / Charter Communications | |
| | | | | 1,405,000 | | | 3.58%, 07/23/2020 | | | 1,433,430 | |
| | | | | 4,125,000 | | | 4.46%, 07/23/2022 | | | 4,310,753 | |
| | | | | 4,040,000 | | | 4.91%, 07/23/2025 | | | 4,257,877 | |
| | | | | 7,030,000 | | | 6.48%, 10/23/2045 | | | 8,127,235 | |
| | | | | 475,000 | | | Columbus Cable Barbados Ltd.
7.38%, 03/30/2021 (1) | | | 505,467 | |
| | | | | | | | Comcast Corp. | |
| | | | | 321,000 | | | 1.63%, 01/15/2022 | | | 307,684 | |
| | | | | 5,770,000 | | | 2.75%, 03/01/2023 | | | 5,728,750 | |
| | | | | 2,405,000 | | | 3.40%, 07/15/2046 | | | 2,100,315 | |
| | | | | 490,000 | | | 4.75%, 03/01/2044 | | | 525,537 | |
| | | | | | | | Cox Communications, Inc. | |
| | | | | 415,000 | | | 3.25%, 12/15/2022 (1) | | | 404,245 | |
| | | | | 500,000 | | | 3.35%, 09/15/2026 (1) | | | 477,469 | |
| | | | | 1,985,000 | | | 3.85%, 02/01/2025 (1) | | | 1,946,789 | |
| | | | | 690,000 | | | CSC Holdings LLC
5.50%, 04/15/2027 (1) | | | 698,625 | |
| | | | | 860,000 | | | DISH DBS Corp.
5.88%, 11/15/2024 | | | 884,940 | |
| | | | | 1,905,000 | | | Grupo Televisa S.A.B.
6.13%, 01/31/2046 | | | 1,890,495 | |
| | | | | 1,720,000 | | | Liberty Interactive LLC
8.25%, 02/01/2030 | | | 1,831,800 | |
| | | | | 1,715,000 | | | NBC Universal Media LLC
5.95%, 04/01/2041 | | | 2,113,034 | |
| | | | | 340,000 | | | SFR Group S.A.
7.38%, 05/01/2026 (1) | | | 348,500 | |
| | | | | 1,670,000 | | | Sky plc
3.13%, 11/26/2022 (1) | | | 1,656,431 | |
| | | | | | | | TEGNA, Inc. | |
| | | | | 1,430,000 | | | 5.13%, 10/15/2019 | | | 1,467,538 | |
| | | | | 320,000 | | | 5.13%, 07/15/2020 | | | 332,000 | |
| | | | | 1,350,000 | | | Time Warner Cable, Inc.
8.75%, 02/14/2019 | | | 1,521,374 | |
| | | | | 6,040,000 | | | Time Warner Entertainment Co. L.P.
8.38%, 07/15/2033 | | | 7,913,674 | |
| | | | | 2,725,000 | | | Time Warner, Inc.
6.10%, 07/15/2040 | | | 3,110,672 | |
| | | | | 345,000 | | | Viacom, Inc.
3.45%, 10/04/2026 | | | 318,849 | |
| | | | | | | | | | | | |
| | | | | | | | | | | 62,716,133 | |
| | | | | | | | | | | | |
The accompanying notes are an integral part of these financial statements.
|
| Hartford Total Return Bond HLS Fund |
Schedule of Investments – (continued)
December 31, 2016
| | | | | | | | | | | | |
Shares or Principal Amount | | Market Value† | |
| CORPORATE BONDS - 33.7% - (continued) | |
| | | | | | | Mining - 0.1% | |
| | | | | | | | Anglo American Capital plc | |
| | $ | | | | 350,000 | | | 4.13%, 04/15/2021 (1) | | $ | 356,125 | |
| | | | | 310,000 | | | 4.13%, 09/27/2022 (1) | | | 312,328 | |
| | | | | 200,000 | | | 4.88%, 05/14/2025 (1) | | | 202,750 | |
| | | | | | | | Freeport-McMoRan, Inc. | |
| | | | | 95,000 | | | 3.88%, 03/15/2023 | | | 87,163 | |
| | | | | 130,000 | | | 4.55%, 11/14/2024 | | | 121,875 | |
| | | | | 320,000 | | | 5.40%, 11/14/2034 | | | 268,800 | |
| | | | | 300,000 | | | 5.45%, 03/15/2043 | | | 248,256 | |
| | | | | 485,000 | | | Kaiser Aluminum Corp.
5.88%, 05/15/2024 | | | 501,975 | |
| | | | | 900,000 | | | Rio Tinto Finance USA Ltd.
3.75%, 06/15/2025 | | | 926,826 | |
| | | | | 555,000 | | | Teck Resources Ltd.
8.50%, 06/01/2024 (1) | | | 639,637 | |
| | | | | | | | | | | | |
| | | | | | | | | | | 3,665,735 | |
| | | | | | | | | | | | |
| | | | | | | Oil & Gas - 2.9% | |
| | | | | | | | Anadarko Petroleum Corp. | |
| | | | | 1,935,000 | | | 3.45%, 07/15/2024 | | | 1,899,483 | |
| | | | | 1,250,000 | | | 4.50%, 07/15/2044 | | | 1,174,439 | |
| | | | | 2,100,000 | | | 4.85%, 03/15/2021 | | | 2,251,700 | |
| | | | | 30,000 | | | 5.55%, 03/15/2026 | | | 33,578 | |
| | | | | 2,205,000 | | | 6.60%, 03/15/2046 | | | 2,719,557 | |
| | | | | 410,000 | | | 6.95%, 06/15/2019 | | | 454,874 | |
| | | | | 255,000 | | | Antero Resources Corp.
5.63%, 06/01/2023 | | | 261,056 | |
| | | | | | | | BP Capital Markets plc | |
| | | | | 2,425,000 | | | 2.11%, 09/16/2021 | | | 2,379,289 | |
| | | | | 2,665,000 | | | 2.75%, 05/10/2023 | | | 2,616,358 | |
| | | | | | | | Cenovus Energy, Inc. | |
| | | | | 4,672,000 | | | 3.00%, 08/15/2022 | | | 4,516,782 | |
| | | | | 585,000 | | | 3.80%, 09/15/2023 | | | 570,979 | |
| | | | | 1,270,000 | | | 5.20%, 09/15/2043 | | | 1,209,676 | |
| | | | | 765,000 | | | Concho Resources, Inc.
5.50%, 04/01/2023 | | | 792,770 | |
| | | | | 3,195,000 | | | ConocoPhillips Co.
4.95%, 03/15/2026 | | | 3,527,286 | |
| | | | | | | | Continental Resources, Inc. | |
| | | | | 35,000 | | | 3.80%, 06/01/2024 | | | 32,288 | |
| | | | | 395,000 | | | 4.50%, 04/15/2023 | | | 387,100 | |
| | | | | 80,000 | | | 4.90%, 06/01/2044 | | | 68,400 | |
| | | | | 260,000 | | | 5.00%, 09/15/2022 | | | 262,441 | |
| | | | | 4,645,000 | | | Devon Energy Corp.
3.25%, 05/15/2022 | | | 4,615,528 | |
| | | | | 540,000 | | | Devon Financing Corp. LLC
7.88%, 09/30/2031 | | | 685,176 | |
| | | | | 60,000 | | | Diamondback Energy, Inc.
4.75%, 11/01/2024(1) | | | 58,800 | |
| | | | | 1,335,000 | | | EnCana Corp.
3.90%, 11/15/2021 | | | 1,344,585 | |
| | | | | 1,145,000 | | | EOG Resources, Inc.
4.15%, 01/15/2026 | | | 1,198,237 | |
| | | | | | | | Hess Corp. | | | | |
| | | | | 1,845,000 | | | 4.30%, 04/01/2027 | | | 1,836,554 | |
| | | | | 1,245,000 | | | 5.60%, 02/15/2041 | | | 1,258,868 | |
| | | | | 1,590,000 | | | 5.80%, 04/01/2047 | | | 1,650,134 | |
| | | | | 1,370,000 | | | 6.00%, 01/15/2040 | | | 1,413,271 | |
| | | | | 2,425,000 | | | Kerr-McGee Corp.
6.95%, 07/01/2024 | | | 2,860,998 | |
| | | | | | | | | | | | |
Shares or Principal Amount | | Market Value† | |
| CORPORATE BONDS - 33.7% - (continued) | |
| | | | | | | Oil & Gas - 2.9% - (continued) | |
| | | | | | | | Marathon Oil Corp. | | | | |
| | $ | | | | 1,005,000 | | | 2.70%, 06/01/2020 | | $ | 1,006,338 | |
| | | | | 2,005,000 | | | 2.80%, 11/01/2022 | | | 1,917,303 | |
| | | | | 525,000 | | | 3.85%, 06/01/2025 | | | 509,109 | |
| | | | | 145,000 | | | 5.20%, 06/01/2045 | | | 136,670 | |
| | | | | 115,000 | | | 6.60%, 10/01/2037 | | | 125,675 | |
| | | | | 95,000 | | | 6.80%, 03/15/2032 | | | 105,802 | |
| | | | | | | | Petroleos Mexicanos | | | | |
| | | | | 1,800,000 | | | 5.50%, 02/04/2019(1) | | | 1,864,602 | |
| | | | | 955,000 | | | 6.38%, 02/04/2021(1) | | | 1,017,075 | |
| | | | | 390,000 | | | 6.50%, 03/13/2027(1) | | | 402,285 | |
| | | | | 2,730,000 | | | 6.63%, 06/15/2035 | | | 2,689,050 | |
| | | | | 646,000 | | | 6.75%, 09/21/2047(1) | | | 610,341 | |
| | | | | | | | Pioneer Natural Resources Co. | | | | |
| | | | | 795,000 | | | 3.45%, 01/15/2021 | | | 812,399 | |
| | | | | 655,000 | | | 3.95%, 07/15/2022 | | | 679,582 | |
| | | | | 2,260,000 | | | 4.45%, 01/15/2026 | | | 2,394,612 | |
| | | | | 660,000 | | | 6.65%, 03/15/2017 | | | 666,733 | |
| | | | | 2,090,000 | | | 7.50%, 01/15/2020 | | | 2,375,851 | |
| | | | | | | | QEP Resources, Inc. | | | | |
| | | | | 10,000 | | | 5.25%, 05/01/2023 | | | 10,025 | |
| | | | | 45,000 | | | 5.38%, 10/01/2022 | | | 45,113 | |
| | | | | 55,000 | | | 6.80%, 03/01/2020 | | | 57,200 | |
| | | | | | | | Shell International Finance B.V. | | | | |
| | | | | 1,185,000 | | | 2.50%, 09/12/2026 | | | 1,111,843 | |
| | | | | 2,440,000 | | | 3.25%, 05/11/2025 | | | 2,437,999 | |
| | | | | 2,295,000 | | | 4.38%, 05/11/2045 | | | 2,324,782 | |
| | | | | 255,000 | | | SM Energy Co.
6.13%, 11/15/2022 | | | 258,188 | |
| | | | | | | | Statoil ASA | | | | |
| | | | | 15,000 | | | 3.70%, 03/01/2024 | | | 15,700 | |
| | | | | 2,555,000 | | | 3.95%, 05/15/2043 | | | 2,437,048 | |
| | | | | 250,000 | | | Tesoro Corp.
5.13%, 04/01/2024 | | | 255,625 | |
| | | | | | | | Valero Energy Corp. | | | | |
| | | | | 3,150,000 | | | 3.40%, 09/15/2026 | | | 3,017,744 | |
| | | | | 435,000 | | | 4.90%, 03/15/2045 | | | 433,496 | |
| | | | | 190,000 | | | WPX Energy, Inc.
5.25%, 09/15/2024 | | | 184,300 | |
| | | | | | | | | | | | |
| | | | | | | | | | | 71,982,697 | |
| | | | | | | | | | | | |
| | | | | | | Packaging & Containers - 0.1% | | | |
| | | | | 285,000 | | | Crown Americas LLC / Crown Americas Capital Corp.
4.25%, 09/30/2026(1) | | | 268,613 | |
| | | | | 505,000 | | | Owens-Brockway Glass Container, Inc.
5.88%, 08/15/2023(1) | | | 526,462 | |
| | | | | 870,000 | | | Reynolds Group Issuer, Inc.
5.13%, 07/15/2023(1) | | | 888,487 | |
| | | | | | | | | | | | |
| | | | | | | | | | | 1,683,562 | |
| | | | | | | | | | | | |
| | | | | | | Pharmaceuticals - 1.3% | |
| | | | | 1,335,000 | | | AbbVie, Inc.
3.20%, 05/14/2026 | | | 1,270,155 | |
| | | | | | | | Actavis Funding SCS | |
| | | | | 6,815,000 | | | 2.35%, 03/12/2018 | | | 6,854,397 | |
| | | | | 5,755,000 | | | 3.00%, 03/12/2020 | | | 5,834,782 | |
| | | | | 316,000 | | | Baxalta, Inc.
3.60%, 06/23/2022 | | | 318,418 | |
| | | | | 3,155,000 | | | EMD Finance LLC
2.95%, 03/19/2022(1) | | | 3,141,620 | |
The accompanying notes are an integral part of these financial statements.
|
| Hartford Total Return Bond HLS Fund |
Schedule of Investments – (continued)
December 31, 2016
| | | | | | | | | | | | |
Shares or Principal Amount | | Market Value† | |
| CORPORATE BONDS - 33.7% - (continued) | |
| | | | | | | Pharmaceuticals - 1.3% - (continued) | |
| | | | | | | | Mylan N.V. | |
| | $ | | | | 1,485,000 | | | 3.00%, 12/15/2018(1) | | $ | 1,495,740 | |
| | | | | 1,375,000 | | | 3.15%, 06/15/2021(1) | | | 1,349,407 | |
| | | | | 1,705,000 | | | 3.75%, 12/15/2020(1) | | | 1,721,673 | |
| | | | | 395,000 | | | Quintiles IMS, Inc.
4.88%, 05/15/2023(1) | | | 400,925 | |
| | | | | 2,440,000 | | | Shire Acquisitions Investments Ireland DAC
2.40%, 09/23/2021 | | | 2,357,008 | |
| | | | | | | | Teva Pharmaceutical Finance Netherlands III B.V. | |
| | | | | 4,560,000 | | | 1.70%, 07/19/2019 | | | 4,480,328 | |
| | | | | 3,680,000 | | | 2.20%, 07/21/2021 | | | 3,520,608 | |
| | | | | | | | | | | | |
| | | | | | | | | | | 32,745,061 | |
| | | | | | | | | | | | |
| | | | | | | Pipelines - 1.6% | |
| | | | | | | | DCP Midstream Operating L.P. | |
| | | | | 200,000 | | | 2.70%, 04/01/2019 | | | 197,500 | |
| | | | | 100,000 | | | 3.88%, 03/15/2023 | | | 96,188 | |
| | | | | 326,000 | | | 4.95%, 04/01/2022 | | | 334,150 | |
| | | | | 215,000 | | | 5.60%, 04/01/2044 | | | 196,187 | |
| | | | | 1,612,000 | | | Energy Transfer Equity L.P.
7.50%, 10/15/2020 | | | 1,797,380 | |
| | | | | | | | Energy Transfer Partners L.P. | |
| | | | | 50,000 | | | 3.60%, 02/01/2023 | | | 49,175 | |
| | | | | 455,000 | | | 4.05%, 03/15/2025 | | | 450,408 | |
| | | | | 6,810,000 | | | 5.95%, 10/01/2043 | | | 7,018,570 | |
| | | | | 1,295,000 | | | Enterprise Products Operating LLC
3.95%, 02/15/2027 | | | 1,326,589 | |
| | | | | | | | Kinder Morgan Energy Partners L.P. | |
| | | | | 750,000 | | | 5.30%, 09/15/2020 | | | 805,595 | |
| | | | | 260,000 | | | 6.50%, 04/01/2020 | | | 287,789 | |
| | | | | 515,000 | | | 6.85%, 02/15/2020 | | | 574,106 | |
| | | | | 2,885,000 | | | Kinder Morgan, Inc.
5.05%, 02/15/2046 | | | 2,855,876 | |
| | | | | 795,000 | | | Magellan Midstream Partners L.P.
5.00%, 03/01/2026 | | | 871,771 | |
| | | | | 595,000 | | | Phillips 66 Partners L.P.
3.55%, 10/01/2026 | | | 575,824 | |
| | | | | | | | Plains All American Pipeline L.P. / PAA Finance Corp. | |
| | | | | 2,490,000 | | | 2.85%, 01/31/2023 | | | 2,353,899 | |
| | | | | 2,450,000 | | | 3.65%, 06/01/2022 | | | 2,463,522 | |
| | | | | 1,430,000 | | | 4.50%, 12/15/2026 | | | 1,450,658 | |
| | | | | | | | Regency Energy Partners L.P. | |
| | | | | 1,435,000 | | | 4.50%, 11/01/2023 | | | 1,456,130 | |
| | | | | 315,000 | | | 5.88%, 03/01/2022 | | | 346,518 | |
| | | | | | | | Sunoco Logistics Partners Operations L.P. | |
| | | | | 125,000 | | | 3.90%, 07/15/2026 | | | 120,992 | |
| | | | | 1,550,000 | | | 4.25%, 04/01/2024 | | | 1,561,978 | |
| | | | | 565,000 | | | Tesoro Logistics L.P. / Tesoro Logistics Finance Corp.
6.25%, 10/15/2022 | | | 598,900 | |
| | | | | 2,235,000 | | | Texas Eastern Transmission L.P.
2.80%, 10/15/2022(1) | | | 2,175,453 | |
| | | | | | | | Williams Cos., Inc. | |
| | | | | 385,000 | | | 3.70%, 01/15/2023 | | | 371,525 | |
| | | | | 70,000 | | | 4.55%, 06/24/2024 | | | 69,475 | |
| | | | | 135,000 | | | 7.88%, 09/01/2021 | | | 154,238 | |
| | | | | | | | Williams Partners L.P. | |
| | | | | 4,900,000 | | | 3.60%, 03/15/2022 | | | 4,925,926 | |
| | | | | 1,125,000 | | | 4.00%, 11/15/2021 | | | 1,154,628 | |
| | | | | 1,140,000 | | | 4.30%, 03/04/2024 | | | 1,151,185 | |
| | | | | | | | | | | | |
Shares or Principal Amount | | Market Value† | |
| CORPORATE BONDS - 33.7% - (continued) | |
| | | | | | | Pipelines - 1.6% - (continued) | |
| | | | | | | | Williams Partners L.P. - (continued) | |
| | $ | | | | 1,440,000 | | | 5.25%, 03/15/2020 | | $ | 1,538,523 | |
| | | | | | | | | | | | |
| | | | 39,330,658 | |
| | | | | | | | | | | | |
| | | | Real Estate - 0.1% | |
| | | | | 3,090,000 | | | ProLogis L.P.
3.35%, 02/01/2021 | | | 3,179,743 | |
| | | | | | | | | | | | |
| | | | Real Estate Investment Trusts - 0.6% | |
| | | | American Tower Corp. | |
| | | | | 3,065,000 | | | 3.40%, 02/15/2019 | | | 3,132,274 | |
| | | | | 415,000 | | | 3.45%, 09/15/2021 | | | 420,369 | |
| | | | | 700,000 | | | 4.50%, 01/15/2018 | | | 718,475 | |
| | | | | 2,065,000 | | | Brandywine Operating Partnership L.P.
3.95%, 02/15/2023 | | | 2,057,004 | |
| | | | | 380,000 | | | CoreCivic, Inc.
4.13%, 04/01/2020 | | | 379,050 | |
| | | | Crown Castle International Corp. | |
| | | | | 340,000 | | | 3.40%, 02/15/2021 | | | 345,015 | |
| | | | | 1,305,000 | | | 3.70%, 06/15/2026 | | | 1,280,898 | |
| | | | | 710,000 | | | HCP, Inc.
4.25%, 11/15/2023 | | | 729,091 | |
| | | | | 3,490,000 | | | Kimco Realty Corp.
3.13%, 06/01/2023 | | | 3,455,257 | |
| | | | | 1,275,000 | | | Ventas Realty L.P. / Ventas Capital Corp.
3.25%, 08/15/2022 | | | 1,287,057 | |
| | | | | | | | | | | | |
| | | | 13,804,490 | |
| | | | | | | | | | | | |
| | | | Retail - 0.8% | |
| | | | | 755,000 | | | AutoZone, Inc.
1.63%, 04/21/2019 | | | 748,108 | |
| | | | CVS Health Corp. | |
| | | | | 725,000 | | | 2.13%, 06/01/2021 | | | 710,894 | |
| | | | | 4,230,000 | | | 2.80%, 07/20/2020 | | | 4,291,779 | |
| | | | | 883,000 | | | 3.88%, 07/20/2025 | | | 910,903 | |
| | | | | 3,360,000 | | | 5.13%, 07/20/2045 | | | 3,744,542 | |
| | | | | 2,115,000 | | | Home Depot, Inc.
3.50%, 09/15/2056 | | | 1,851,363 | |
| | | | | 575,000 | | | KFC Holding Co. / Pizza Hut Holdings LLC
5.25%, 06/01/2026 (1) | | | 583,625 | |
| | | | Lowe’s Cos., Inc. | |
| | | | | 3,725,000 | | | 2.50%, 04/15/2026 | | | 3,537,499 | |
| | | | | 2,870,000 | | | 3.70%, 04/15/2046 | | | 2,678,990 | |
| | | | | 1,035,000 | | | Walgreens Boots Alliance, Inc.
2.60%, 06/01/2021 | | | 1,028,501 | |
| | | | | | | | | | | | |
| | | | 20,086,204 | |
| | | | | | | | | | | | |
| | | | Savings & Loans - 0.1% | |
| | GBP | | | | 1,535,000 | | | Nationwide Building Society
6.88%, 06/20/2019 (2)(6)(7) | | | 1,897,783 | |
| | | | | | | | | | | | |
| | | | Semiconductors - 0.2% | |
| | $ | | | | 1,225,000 | | | Intel Corp.
4.10%, 05/19/2046 | | | 1,214,192 | |
| | | | | 2,175,000 | | | Lam Research Corp.
2.80%, 06/15/2021 | | | 2,163,285 | |
| | | | | 525,000 | | | Sensata Technologies B.V.
5.00%, 10/01/2025 (1) | | | 514,500 | |
| | | | | 310,000 | | | Sensata Technologies UK Financing Co. plc
6.25%, 02/15/2026 (1) | | | 323,950 | |
| | | | | | | | | | | | |
| | | | 4,215,927 | |
| | | | | | | | | | | | |
The accompanying notes are an integral part of these financial statements.
|
| Hartford Total Return Bond HLS Fund |
Schedule of Investments – (continued)
December 31, 2016
| | | | | | | | | | | | |
Shares or Principal Amount | | Market Value† | |
| CORPORATE BONDS - 33.7% - (continued) | |
| | | | Shipbuilding - 0.0% | |
| | $ | | | | 145,000 | | | Huntington Ingalls Industries, Inc.
5.00%, 11/15/2025(1) | | $ | 150,619 | |
| | | | | | | | | | | | |
| | | | | | | Software - 0.6% | |
| | | | | 100,000 | | | First Data Corp.
5.00%, 01/15/2024(1) | | | 100,532 | |
| | | | | 1,055,000 | | | 5.38%, 08/15/2023(1) | | | 1,094,563 | |
| | | | | 3,450,000 | | | Microsoft Corp.
1.55%, 08/08/2021 | | | 3,346,196 | |
| | | | | 1,340,000 | | | 2.40%, 08/08/2026 | | | 1,265,894 | |
| | | | | 2,025,000 | | | 3.70%, 08/08/2046 | | | 1,906,467 | |
| | | | | 1,795,000 | | | 3.95%, 08/08/2056 | | | 1,695,345 | |
| | | | | 385,000 | | | MSCI, Inc.
5.25%, 11/15/2024(1) | | | 404,250 | |
| | | | | 465,000 | | | 5.75%, 08/15/2025(1) | | | 494,063 | |
| | | | | 350,000 | | | Open Text Corp.
5.63%, 01/15/2023(1) | | | 365,750 | |
| | | | | 30,000 | | | 5.88%, 06/01/2026(1) | | | 31,650 | |
| | | | | 4,525,000 | | | Oracle Corp.
1.90%, 09/15/2021 | | | 4,421,798 | |
| | | | | | | | | | | | |
| | | | | | | | | | | 15,126,508 | |
| | | | | | | | | | | | |
| | | | | | | Telecommunications - 2.0% | |
| | | | | 345,000 | | | Altice Financing S.A.
6.63%, 02/15/2023(1) | | | 354,488 | |
| | | | | 2,685,000 | | | AT&T, Inc. 3.60%,
02/17/2023 | | | 2,707,876 | |
| | | | | 1,985,000 | | | 3.80%, 03/15/2022 | | | 2,034,901 | |
| | | | | 350,000 | | | 4.13%, 02/17/2026 | | | 354,398 | |
| | | | | 1,245,000 | | | 4.50%, 05/15/2035 | | | 1,202,877 | |
| | | | | 5,365,000 | | | 4.75%, 05/15/2046 | | | 5,082,903 | |
| | | | | 205,000 | | | 5.80%, 02/15/2019 | | | 220,422 | |
| | | | | 4,000,000 | | | Cisco Systems, Inc.
1.40%, 09/20/2019 | | | 3,956,380 | |
| | | | | 2,465,000 | | | 2.20%, 02/28/2021 | | | 2,459,688 | |
| | | | | 610,000 | | | CommScope, Inc.
4.38%, 06/15/2020(1) | | | 623,725 | |
| | | | | 370,000 | | | Frontier Communications Corp.
10.50%, 09/15/2022 | | | 388,981 | |
| | | | | 7,400,000 | | | GTP Acquisition Partners I LLC
3.48%, 06/15/2050(1) | | | 7,188,656 | |
| | | | | 745,000 | | | Nokia Oyj
6.63%, 05/15/2039 | | | 785,975 | |
| | | | | 1,645,000 | | | Sprint Communications, Inc.
7.00%, 03/01/2020(1) | | | 1,784,825 | |
| | | | | 6,440,000 | | | Sprint Spectrum Co. LLC / Sprint Spectrum Co. II LLC / Sprint Spectrum Co. III LLC
3.36%, 03/20/2023(1) | | | 6,452,043 | |
| | | | | 730,000 | | | T-Mobile USA, Inc.
6.46%, 04/28/2019 | | | 742,775 | |
| | | | | 265,000 | | | Telecom Italia Capital S.A.
6.00%, 09/30/2034 | | | 245,125 | |
| | | | | 90,000 | | | 6.38%, 11/15/2033 | | | 85,950 | |
| | | | | 310,000 | | | 7.72%, 06/04/2038 | | | 322,292 | |
| | | | | 6,123,000 | | | Verizon Communications, Inc.
4.27%, 01/15/2036 | | | 5,860,482 | |
| | | | | 3,185,000 | | | 4.40%, 11/01/2034 | | | 3,143,550 | |
| | | | | 4,339,000 | | | 4.67%, 03/15/2055 | | | 4,074,798 | |
| | | | | 675,000 | | | Wind Acquisition Finance S.A.
4.75%, 07/15/2020(1) | | | 680,062 | |
| | | | | | | | | | | | |
| | | | | | | | | | | 50,753,172 | |
| | | | | | | | | | | | |
| | | | | | | | | | | | |
Shares or Principal Amount | | Market Value† | |
| CORPORATE BONDS - 33.7% - (continued) | |
| | | | | | | Transportation - 0.6% | |
| | $ | | | | 1,180,000 | | | Canadian Pacific Railway Co.
9.45%, 08/01/2021 | | $ | 1,481,042 | |
| | | | | 1,705,000 | | | FedEx Corp.
4.55%, 04/01/2046 | | | 1,718,144 | |
| | | | | 615,000 | | | 4.75%, 11/15/2045 | | | 636,939 | |
| | | | | 2,100,000 | | | Norfolk Southern Corp.
2.90%, 06/15/2026 | | | 2,020,826 | |
| | | | | | | | Penske Truck Leasing Co. L.P. / PTL Finance Corp. | | | | |
| | | | | 4,370,000 | | | 2.88%, 07/17/2018(1) | | | 4,426,403 | |
| | | | | 630,000 | | | 3.30%, 04/01/2021(1) | | | 637,080 | |
| | | | | 265,000 | | | 3.38%, 02/01/2022(1) | | | 267,242 | |
| | | | | 1,490,000 | | | 4.88%, 07/11/2022(1) | | | 1,598,935 | |
| | | | | 1,435,000 | | | Ryder System, Inc.
2.55%, 06/01/2019 | | | 1,445,800 | |
| | | | | | | | | | | | |
| | | | | | | | | | | 14,232,411 | |
| | | | | | | | | | | | |
| | | |
| | | | | | | | Total Corporate Bonds
(cost $840,772,553) | | $ | 845,147,451 | |
| | | | | | | | | | | | |
| FOREIGN GOVERNMENT OBLIGATIONS - 4.1% | | | |
| | | | | | | Argentina - 0.2% | |
| | EUR | | | | 7,040,187 | | | Argentine Republic Government International Bond
2.26%, 12/31/2038(3) | | $ | 4,124,141 | |
| | | | | | | | | | | | |
| | | | | | | Brazil - 0.8% | |
| | | | | | | | Brazil Notas do Tesouro Nacional | | | | |
| | BRL | | | | 47,454,027 | | | 6.00%, 05/15/2017(8) | | | 14,569,069 | |
| | | | | 8,780,000 | | | 10.00%, 01/01/2023 | | | 2,534,694 | |
| | | | | | | | Brazilian Government International Bond | | | | |
| | $ | | | | 2,820,000 | | | 5.00%, 01/27/2045 | | | 2,287,584 | |
| | | | | 1,180,000 | | | 5.63%, 01/07/2041 | | | 1,049,846 | |
| | | | | | | | | | | | |
| | | | | | | | | | | 20,441,193 | |
| | | | | | | | | | | | |
| | | | | | | Colombia - 0.3% | |
| | | | | 5,160,000 | | | Colombia Government International Bond
5.00%, 06/15/2045 | | | 4,895,550 | |
| | COP | | | | 11,225,495,190 | | | Colombian TES
4.25%, 05/17/2017(8) | | | 3,791,764 | |
| | | | | | | | | | | | |
| | | | | | | | | | | 8,687,314 | |
| | | | | | | | | | | | |
| | | | | | | Japan - 0.9% | |
| | JPY | | | | 2,750,000,000 | | | Japan Treasury Discount Bill
0.21%, 01/11/2017(9) | | | 23,531,477 | |
| | | | | | | | | | | | |
| | | | | | | Mexico - 0.3% | |
| | MXN | | | | 95,973,400 | | | Mexican Bonos
5.00%, 12/11/2019 | | | 4,392,846 | |
| | $ | | | | 3,254,000 | | | Mexico Government International Bond
5.75%, 10/12/2110 | | | 3,001,815 | |
| | | | | | | | | | | | |
| | | | | | | | | | | 7,394,661 | |
| | | | | | | | | | | | |
| | | | | | | Qatar - 0.1% | |
| | | | | 1,480,000 | | | Qatar Government International Bond
4.63%, 06/02/2046(1) | | | 1,478,141 | |
| | | | | | | | | | | | |
| | | | | | | Romania - 0.6% | |
| | | | | | | | Romania Treasury Bills | | | | |
| | RON | | | | 7,860,000 | | | 0.55%, 08/28/2017 | | | 1,812,675 | |
| | | | | 13,005,000 | | | 0.56%, 08/28/2017 | | | 2,999,215 | |
| | | | | 42,615,000 | | | 0.58%, 06/26/2017 | | | 9,841,024 | |
| | | | | | | | | | | | |
| | | | | | | | | | | 14,652,914 | |
| | | | | | | | | | | | |
The accompanying notes are an integral part of these financial statements.
|
| Hartford Total Return Bond HLS Fund |
Schedule of Investments – (continued)
December 31, 2016
| | | | | | | | | | | | |
Shares or Principal Amount | | Market Value† | |
| FOREIGN GOVERNMENT OBLIGATIONS - 4.1% - (continued) | | | |
| | | | | | | Russia - 0.2% | |
| | RUB | | | | 314,597,000 | | | Russian Federal Bond
11.70%, 01/29/2020(2) | | $ | 5,291,148 | |
| | | | | | | | | | | | |
| | | | | | | Saudi Arabia - 0.1% | |
| | | | | | | | Saudi Government International Bond | | | | |
| | $ | | | | 2,335,000 | | | 2.38%, 10/26/2021(1) | | | 2,267,135 | |
| | | | | 1,745,000 | | | 4.50%, 10/26/2046(1) | | | 1,671,417 | |
| | | | | | | | | | | | |
| | | | | | | | | | | 3,938,552 | |
| | | | | | | | | | | | |
| | | | | | | Thailand - 0.3% | |
| | THB | | | | 232,840,000 | | | Bank of Thailand
1.49%, 02/23/2018 | | | 6,487,166 | |
| | | | | | | | | | | | |
| | | | | | | Turkey - 0.1% | |
| | $ | | | | 3,309,000 | | | Turkey Government International Bond
6.00%, 01/14/2041 | | | 3,061,619 | |
| | | | | | | | | | | | |
| | | | | | | Uruguay - 0.2% | |
| | | | | 5,220,000 | | | Uruguay Government International Bond
5.10%, 06/18/2050 | | | 4,698,000 | |
| | | | | | | | | | | | |
| | | |
| | | | | | | | Total Foreign Government Obligations
(cost $108,802,578) | | $ | 103,786,326 | |
| | | | | | | | | | | | |
| MUNICIPAL BONDS - 1.3% | |
| | | | | | | Development - 0.1% | |
| | | | | | | | State of California | | | | |
| | $ | | | | 860,000 | | | 7.60%, 11/01/2040 | | $ | 1,295,401 | |
| | | | | 175,000 | | | 7.63%, 03/01/2040 | | | 258,916 | |
| | | | | | | | | | | | |
| | | | | | | | | | | 1,554,317 | |
| | | | | | | | | | | | |
| | | | | | | General - 0.5% | |
| | | | | 4,560,000 | | | Chicago Transit Auth
6.90%, 12/01/2040 | | | 5,709,807 | |
| | | | | | | | Puerto Rico Commonwealth Government Employees Retirement System | | | | |
| | | | | 4,575,000 | | | 6.15%, 07/01/2038 | | | 1,818,562 | |
| | | | | 2,075,000 | | | 6.20%, 07/01/2039 | | | 824,813 | |
| | | | | 7,965,000 | | | 6.30%, 07/01/2043 | | | 3,166,087 | |
| | | | | 1,995,000 | | | 6.55%, 07/01/2058 | | | 793,013 | |
| | | | | | | | | | | | |
| | | | | | | | | | | 12,312,282 | |
| | | | | | | | | | | | |
| | | | | | | General Obligation - 0.4% | |
| | | | | 6,650,000 | | | California State, GO Taxable
7.55%, 04/01/2039 | | | 9,839,673 | |
| | | | | 970,000 | | | Illinois State, GO
5.10%, 06/01/2033 | | | 857,305 | |
| | | | | | | | | | | | |
| | | | | | | | | | | 10,696,978 | |
| | | | | | | | | | | | |
| | | | | | | Higher Education - 0.2% | |
| | | | | 5,580,000 | | | University of California
4.60%, 05/15/2031 | | | 6,153,010 | |
| | | | | | | | | | | | |
| | | | | | | Utility-Electric - 0.1% | |
| | | | | 1,485,000 | | | Municipal Electric Auth. Georgia
6.64%, 04/01/2057 | | | 1,841,712 | |
| | | | | | | | | | | | |
| | | |
| | | | | | | | Total Municipal Bonds
(cost $33,111,758) | | $ | 32,558,299 | |
| | | | | | | | | | | | |
| SENIOR FLOATING RATE INTERESTS - 5.1%(10) | |
| | | | | | | Advertising - 0.0% | |
| | $ | | | | 866,627 | | | Acosta Holdco, Inc.
4.25%, 09/26/2021 | | $ | 843,878 | |
| | | | | | | | | | | | |
| | | | | | | | | | | | |
Shares or Principal Amount | | Market Value† | |
| SENIOR FLOATING RATE INTERESTS - 5.1%(10) - (continued) | |
| | | | | | | Aerospace/Defense - 0.2% | |
| | $ | | | | 1,759,091 | | | BE Aerospace, Inc.
3.89%, 12/16/2021 | | $ | 1,767,007 | |
| | | | | 285,000 | | | DigitalGlobe, Inc.
3.51%, 01/15/2024 | | | 286,781 | |
| | | | | | | | TransDigm, Inc. | | | | |
| | | | | 1,336,642 | | | 3.77%, 06/09/2023 | | | 1,349,340 | |
| | | | | 983,341 | | | 3.85%, 05/14/2022 | | | 991,159 | |
| | | | | | | | | | | | |
| | | | | | | | | | | 4,394,287 | |
| | | | | | | | | | | | |
| | | | | | | Agriculture - 0.0% | |
| | | | | 714,221 | | | Pinnacle Operating Corp.
4.75%, 11/15/2018 | | | 587,447 | |
| | | | | | | | | | | | |
| | | | | | | Airlines - 0.0% | |
| | | | | 933,625 | | | Delta Air Lines, Inc.
3.25%, 10/18/2018 | | | 942,961 | |
| | | | | | | | | | | | |
| | | | | | | Auto Manufacturers - 0.0% | |
| | | | | 697,256 | | | Jaguar Holding Co.
4.25%, 08/18/2022 | | | 704,402 | |
| | | | | | | | | | | | |
| | | | | | | Chemicals - 0.2% | |
| | | | | 1,093,552 | | | Chemours Co.
3.77%, 05/12/2022 | | | 1,086,039 | |
| | | | | 2,584,013 | | | Ineos U.S. Finance LLC
3.75%, 05/04/2018 | | | 2,589,388 | |
| | | | | 626,850 | | | Nexeo Solutions LLC
5.25%, 06/09/2023 | | | 631,551 | |
| | | | | 675,012 | | | Univar, Inc.
4.25%, 07/01/2022 | | | 680,777 | |
| | | | | | | | | | | | |
| | | | | | | | | | | 4,987,755 | |
| | | | | | | | | | | | |
| | | | | | | Coal - 0.0% | |
| | | | | 540,000 | | | American Energy - Marcellus LLC
5.25%, 08/04/2020 | | | 292,502 | |
| | | | | 494,849 | | | Arch Coal, Inc.
10.00%, 06/15/2021 | | | 501,242 | |
| | | | | | | | | | | | |
| | | | | | | | | | | 793,744 | |
| | | | | | | | | | | | |
| | | | | | | Commercial Services - 0.2% | |
| | | | | 530,000 | | | Conduent, Inc.
6.25%, 12/07/2023 | | | 535,962 | |
| | | | | 233,238 | | | KAR Auction Services, Inc.
4.50%, 03/09/2023 | | | 236,153 | |
| | | | | 588,412 | | | ON Assignment, Inc.
3.52%, 06/03/2022 | | | 593,855 | |
| | | | | 630,000 | | | Quikrete Holdings, Inc.
4.00%, 11/15/2023 | | | 635,777 | |
| | | | | 676,600 | | | Russell Investment Group
6.75%, 06/01/2023 | | | 686,749 | |
| | | | | 1,078,292 | | | ServiceMaster Co.
3.27%, 11/03/2023 | | | 1,080,988 | |
| | | | | | | | | | | | |
| | | | | | | | | | | 3,769,484 | |
| | | | | | | | | | | | |
| | | | | | | Construction Materials - 0.1% | |
| | | | | 1,474,450 | | | ABC Supply Co., Inc.
3.52%, 10/31/2023 | | | 1,486,939 | |
| | | | | | | | | | | | |
| | | | | | | Diversified Financial Services - 0.1% | |
| | | | | 285,000 | | | RP Crown Parent LLC
4.50%, 10/12/2023 | | | 287,779 | |
| | | | | 1,465,000 | | | Telenet International Finance S.a.r.l.
3.70%, 01/31/2025 | | | 1,475,709 | |
| | | | | | | | | | | | |
| | | | | | | | | | | 1,763,488 | |
| | | | | | | | | | | | |
The accompanying notes are an integral part of these financial statements.
|
| Hartford Total Return Bond HLS Fund |
Schedule of Investments – (continued)
December 31, 2016
| | | | | | | | | | | | |
Shares or Principal Amount | | Market Value† | |
| SENIOR FLOATING RATE INTERESTS - 5.1%(10) - (continued) | |
| | | | | | | Electric - 0.2% | |
| | | | | | | | Calpine Corp. | |
| | $ | | | | 1,353,029 | | | 3.27%, 01/31/2022 | | $ | 1,351,757 | |
| | | | | 552,225 | | | 3.75%, 05/31/2023 | | | 554,798 | |
| | | | | 625,000 | | | Chief Exploration & Development LLC
7.75%, 05/16/2021 | | | 610,937 | |
| | | | | 600,000 | | | Energy Future Intermediate Holding
Co. LLC
4.25%, 06/30/2017 | | | 603,450 | |
| | | | | 1,859,043 | | | Seadrill Partners Finco LLC
4.00%, 02/21/2021 | | | 1,266,009 | |
| | | | | | | | | | | | |
| | | | | | | | | | | 4,386,951 | |
| | | | | | | | | | | | |
| | | | | | | Energy-Alternate Sources - 0.0% | |
| | | | | 596,000 | | | TEX Operations Co. LLC
5.00%, 08/04/2023 | | | 602,800 | |
| | | | | | | | | | | | |
| | | | | | | Entertainment - 0.1% | |
| | | | | 507,275 | | | Eldorado Resorts LLC
4.25%, 07/23/2022 | | | 509,968 | |
| | | | | 902,293 | | | Hilton Worldwide Finance LLC
3.26%, 10/25/2023 | | | 911,993 | |
| | | | | 573,300 | | | Scientific Games International, Inc.
6.00%, 10/01/2021 | | | 580,111 | |
| | | | | | | | | | | | |
| | | | | | | | | | | 2,002,072 | |
| | | | | | | | | | | | |
| | | | | | | Food - 0.1% | |
| | | | | | | | Albertsons LLC | |
| | | | | 683,705 | | | 3.77%, 08/22/2021 | | | 691,253 | |
| | | | | 308,452 | | | 4.25%, 12/22/2022 | | | 312,308 | |
| | | | | 989,513 | | | Aramark Services, Inc.
3.50%, 02/24/2021 | | | 997,815 | |
| | | | | 337,125 | | | B&G Foods, Inc.
3.75%, 11/02/2022 | | | 341,099 | |
| | | | | 503,444 | | | Hostess Brands LLC
4.00%, 08/03/2022 | | | 508,227 | |
| | | | | | | | | | | | |
| | | | | | | | | | | 2,850,702 | |
| | | | | | | | | | | | |
| | | | | | | Food Service - 0.0% | |
| | | | | 585,000 | | | Hearthside Food Solutions
4.50%, 06/02/2021 | | | 590,850 | |
| | | | | | | | | | | | |
| | | | | | | Healthcare-Products - 0.0% | |
| | | | | 372,166 | | | Alere, Inc.
4.25%, 06/18/2022 | | | 371,701 | |
| | | | | 299,250 | | | Revlon Consumer Products Corp.
4.31%, 09/07/2023 | | | 302,057 | |
| | | | | 429,563 | | | Sterigenics-Nordion Holdings LLC
4.25%, 05/15/2022 | | | 430,907 | |
| | | | | | | | | | | | |
| | | | | | | | | | | 1,104,665 | |
| | | | | | | | | | | | |
| | | | | | | Healthcare-Services - 0.4% | |
| | | | | 386,100 | | | Acadia Healthcare Company, Inc.
3.76%, 02/16/2023 | | | 388,996 | |
| | | | | 1,163,695 | | | American Renal Holdings, Inc.
4.75%, 09/20/2019 | | | 1,163,695 | |
| | | | | 366,563 | | | CDRH Parent, Inc.
5.25%, 07/01/2021 | | | 332,960 | |
| | | | | | | | Community Health Systems, Inc. | |
| | | | | 471,399 | | | 3.75%, 12/31/2019 | | | 456,376 | |
| | | | | 867,368 | | | 4.00%, 01/27/2021 | | | 838,459 | |
| | | | | 1,443,450 | | | 4.18%, 12/31/2018 | | | 1,418,189 | |
| | | | | 1,013,700 | | | Envision Healthcare Corp.
4.00%, 12/01/2023 | | | 1,023,208 | |
| | | | | | | | | | | | |
Shares or Principal Amount | | Market Value† | |
| SENIOR FLOATING RATE INTERESTS - 5.1%(10) - (continued) | |
| | | | | | | Healthcare-Services - 0.4% - (continued) | |
| | $ | | | | 259,350 | | | Genoa, a QoL Healthcare Company LLC
4.75%, 10/28/2023 | | $ | 261,943 | |
| | | | | 905,000 | | | inVentiv Health, Inc.
4.75%, 11/09/2023 | | | 912,430 | |
| | | | | 890,836 | | | MPH Acquisition Holdings LLC
5.00%, 06/07/2023 | | | 905,633 | |
| | | | | 423,280 | | | Opal Acquisition, Inc.
5.00%, 11/27/2020 | | | 402,116 | |
| | | | | 413,643 | | | Ortho-Clinical Diagnostics, Inc.
4.75%, 06/30/2021 | | | 409,656 | |
| | | | | 509,603 | | | Surgery Center Holdings, Inc.
4.75%, 11/03/2020 | | | 512,788 | |
| | | | | 1,381,050 | | | U.S. Renal Care, Inc.
5.25%, 12/31/2022 | | | 1,287,829 | |
| | | | | | | | | | | | |
| | | | | | | | | | | 10,314,278 | |
| | | | | | | | | | | | |
| | | | | | | Household Products/Wares - 0.0% | |
| | | | | 410,000 | | | Galleria Co.
3.75%, 09/29/2023 | | | 411,538 | |
| | | | | | | | | | | | |
| | | | | | | Insurance - 0.6% | |
| | | | | | | | Asurion LLC | |
| | | | | 119,353 | | | 4.02%, 07/08/2020 | | | 120,285 | |
| | | | | 458,850 | | | 4.75%, 11/03/2023 | | | 465,159 | |
| | | | | 1,772,790 | | | 5.00%, 08/04/2022 | | | 1,795,393 | |
| | | | | 1,870,000 | | | 8.50%, 03/03/2021 | | | 1,899,228 | |
| | | | | 4,556,708 | | | Evertec Group LLC
3.25%, 04/17/2020 | | | 4,528,229 | |
| | | | | 408,985 | | | National Financial Partners Corp.
6.25%, 07/01/2020 | | | 412,224 | |
| | | | | | | | Sedgwick Claims Management Services, Inc. | |
| | | | | 2,892,716 | | | 3.75%, 03/01/2021 | | | 2,896,852 | |
| | | | | 1,250,000 | | | 6.75%, 02/28/2022 | | | 1,246,875 | |
| | | | | 966,492 | | | USI, Inc.
4.25%, 12/27/2019 | | | 970,523 | |
| | | | | | | | | | | | |
| | | | | | | | | | | 14,334,768 | |
| | | | | | | | | | | | |
| | | | | | | Internet - 0.1% | |
| | | | | 724,021 | | | Lands’ End, Inc.
4.25%, 04/04/2021 | | | 540,605 | |
| | | | | 1,624,255 | | | Zayo Group LLC
3.75%, 05/06/2021 | | | 1,640,725 | |
| | | | | | | | | | | | |
| | | | | | | | | | | 2,181,330 | |
| | | | | | | | | | | | |
| | | | | | | Leisure Time - 0.2% | |
| | | | | | | | Delta 2 (LUX) S.a.r.l. | |
| | | | | 2,675,000 | | | 5.07%, 07/30/2021 | | | 2,700,921 | |
| | | | | 1,140,000 | | | 8.07%, 07/31/2022 | | | 1,146,646 | |
| | | | | | | | | | | | |
| | | | | | | | | | | 3,847,567 | |
| | | | | | | | | | | | |
| | | | | | | Lodging - 0.2% | |
| | | | | 628,425 | | | Boyd Gaming Corp.
3.76%, 09/15/2023 | | | 635,269 | |
| | | | | 3,266,547 | | | Caesars Entertainment Operating Co.
0.00%, 03/01/2017(11) | | | 3,620,412 | |
| | | | | 775,125 | | | Caesars Growth Properties Holdings LLC
6.25%, 05/08/2021 | | | 779,729 | |
| | | | | 626,138 | | | La Quinta Intermediate Holdings LLC
3.75%, 04/14/2021 | | | 625,944 | |
| | | | | | | | | | | | |
| | | | | | | | | | | 5,661,354 | |
| | | | | | | | | | | | |
The accompanying notes are an integral part of these financial statements.
|
| Hartford Total Return Bond HLS Fund |
Schedule of Investments – (continued)
December 31, 2016
| | | | | | | | | | | | |
Shares or Principal Amount | | Market Value† | |
| SENIOR FLOATING RATE INTERESTS - 5.1%(10) - (continued) | |
| | | | | | | Machinery-Construction & Mining - 0.1% | |
| | $ | | | | 1,531,671 | | | American Rock Salt Holdings LLC
4.75%, 05/20/2021 | | $ | 1,527,842 | |
| | | | | 528,127 | | | Headwaters, Inc.
4.00%, 03/24/2022 | | | 530,604 | |
| | | | | 603,871 | | | Neff Rental LLC
7.54%, 06/09/2021 | | | 598,967 | |
| | | | | | | | | | | | |
| | | | | | | | | | | 2,657,413 | |
| | | | | | | | | | | | |
| | | | | | | Machinery-Diversified - 0.1% | |
| | | | | 1,830,292 | | | Gates Global, Inc.
4.25%, 07/06/2021 | | | 1,830,292 | |
| | | | | | | | | | | | |
| | | | | | | Media - 0.5% | |
| | | | | 929,358 | | | Advantage Sales & Marketing, Inc.
4.25%, 07/23/2021 | | | 931,914 | |
| | | | | 1,760,864 | | | AVSC Holding Corp.
4.50%, 01/24/2021 | | | 1,760,864 | |
| | | | | 563,588 | | | Camelot UK Holdings Co., Ltd.
4.75%, 10/03/2023 | | | 569,810 | |
| | | | | 285,283 | | | CBS Radio, Inc.
4.50%, 10/17/2023 | | | 287,779 | |
| | | | | 2,967,375 | | | Charter Communications Operating LLC
3.02%, 07/01/2020 | | | 2,979,749 | |
| | | | | 386,878 | | | Media General, Inc.
4.00%, 07/31/2020 | | | 386,940 | |
| | | | | 1,161 | | | Mission Broadcasting, Inc.
0.00%, 09/26/2023(12) | | | 1,170 | |
| | | | | | | | Numericable U.S. LLC | |
| | | | | 710,000 | | | 4.04%, 01/14/2025 | | | 715,502 | |
| | | | | 233,825 | | | 5.14%, 01/15/2024 | | | 236,582 | |
| | | | | 1,798,310 | | | Tribune Media Co.
3.77%, 12/27/2020 | | | 1,811,347 | |
| | | | | 1,055,000 | | | UPC Financing Partnership
4.08%, 08/31/2024 | | | 1,065,550 | |
| | | | | 1,252,632 | | | Virgin Media Investment Holdings Ltd.
0.00%, 01/31/2025(12) | | | 1,257,492 | |
| | | | | | | | | | | | |
| | | | | | | | | | | 12,004,699 | |
| | | | | | | | | | | | |
| | | | | | | Metal Fabricate/Hardware - 0.0% | |
| | | | | 1,100,758 | | | Rexnord LLC
3.75%, 08/21/2023 | | | 1,104,610 | |
| | | | | | | | | | | | |
| | | | | | | Mining - 0.0% | |
| | | | | 433,724 | | | Ardagh Holdings USA, Inc.
4.00%, 12/17/2021 | | | 438,169 | |
| | | | | 515,231 | | | Minerals Technologies, Inc.
3.75%, 05/09/2021 | | | 519,956 | |
| | | | | | | | | | | | |
| | | | | | | | | | | 958,125 | |
| | | | | | | | | | | | |
| | | | | | | Oil & Gas - 0.1% | |
| | | | | 455,000 | | | California Resources Corp.
11.38%, 12/31/2021 | | | 504,290 | |
| | | | | 470,000 | | | Chesapeake Energy Corp.
8.50%, 08/23/2021 | | | 510,928 | |
| | | | | 527,850 | | | Drillships Ocean Ventures, Inc.
5.50%, 07/25/2021 | | | 414,911 | |
| | | | | 1,514,040 | | | Fieldwood Energy LLC
3.88%, 10/01/2018 | | | 1,423,197 | |
| | | | | | | | | | | | |
| | | | | | | | | | | 2,853,326 | |
| | | | | | | | | | | | |
| | | | | | | Packaging & Containers - 0.3% | |
| | | | | 3,248,438 | | | Berry Plastics Holding Corp.
3.50%, 02/08/2020 | | | 3,270,592 | |
| | | | | | | | | | | | |
Shares or Principal Amount | | Market Value† | |
| SENIOR FLOATING RATE INTERESTS - 5.1%(10) - (continued) | |
| | | | | | | Packaging & Containers - 0.3% - (continued) | |
| | $ | | | | 510,928 | | | Mauser U.S. Corp.
4.50%, 07/31/2021 | | $ | 514,121 | |
| | | | | 205,000 | | | Prolampac Intermediate, Inc.
5.00%, 11/18/2023 | | | 207,179 | |
| | | | | 2,669,880 | | | Reynolds Group Holdings, Inc.
4.25%, 02/05/2023 | | | 2,702,640 | |
| | | | | 570,208 | | | Signode Industrial Group U.S., Inc.
4.00%, 05/01/2021 | | | 574,485 | |
| | | | | | | | | | | | |
| | | | | | | | | | | 7,269,017 | |
| | | | | | | | | | | | |
| | | | | | | Pharmaceuticals - 0.1% | |
| | | | | 1,386,000 | | | Endo Luxembourg Finance Company I S.a r.l.
3.81%, 09/26/2022 | | | 1,391,946 | |
| | | | | 830,563 | | | Valeant Pharmaceuticals International, Inc.
5.50%, 04/01/2022 | | | 830,720 | |
| | | | | | | | | | | | |
| | | | | | | | | | | 2,222,666 | |
| | | | | | | | | | | | |
| | | | | | | Pipelines - 0.0% | |
| | | | | 798,875 | | | Philadelphia Energy Solutions LLC
6.25%, 04/04/2018 | | | 631,111 | |
| | | | | | | | | | | | |
| | | | | | | Real Estate - 0.1% | |
| | | | | | | | DTZ U.S. Borrower LLC | |
| | | | | 1,488,722 | | | 4.25%, 11/04/2021 | | | 1,495,793 | |
| | | | | 35,319 | | | 9.25%, 11/04/2022 | | | 35,319 | |
| | | | | | | | | | | | |
| | | | | | | | | | | 1,531,112 | |
| | | | | | | | | | | | |
| | | | | | | REITS - 0.0% | |
| | | | | 609,265 | | | MGM Growth Properties LLC
3.52%, 04/25/2023 | | | 615,791 | |
| | | | | | | | | | | | |
| | | | | | | Retail - 0.3% | |
| | | | | | | | Bass Pro Group LLC | |
| | | | | 1,495,000 | | | 0.00%, 12/16/2023(12) | | | 1,480,050 | |
| | | | | 505,988 | | | 4.00%, 06/05/2020 | | | 504,090 | |
| | | | | 608,475 | | | Harbor Freight Tools USA, Inc.
3.89%, 08/19/2023 | | | 616,586 | |
| | | | | 625,531 | | | Michaels Stores, Inc.
3.75%, 01/30/2023 | | | 632,374 | |
| | | | | 1,239,893 | | | Neiman Marcus Group, Inc.
4.25%, 10/25/2020 | | | 1,074,677 | |
| | | | | 522,112 | | | Party City Holdings, Inc.
4.21%, 08/19/2022 | | | 526,519 | |
| | | | | 250,000 | | | Rite Aid Corp.
5.75%, 08/21/2020 | | | 251,458 | |
| | | | | 1,115,661 | | | US Foods, Inc.
3.77%, 06/27/2023 | | | 1,126,817 | |
| | | | | | | | | | | | |
| | | | | | | | | | | 6,212,571 | |
| | | | | | | | | | | | |
| | | | | | | Semiconductors - 0.1% | |
| | | | | 613,910 | | | Avago Technologies Cayman Ltd.
3.70%, 02/01/2023 | | | 622,351 | |
| | | | | 410,000 | | | Flex Acquisition Company, Inc.
0.00%, 12/13/2023(12) | | | 413,415 | |
| | | | | 855,307 | | | Lattice Semiconductor Corp.
5.25%, 03/10/2021 | | | 853,169 | |
| | | | | 498,750 | | | ON Semiconductor Corp.
4.02%, 03/31/2023 | | | 504,805 | |
| | | | | | | | | | | | |
| | | | | | | | | | | 2,393,740 | |
| | | | | | | | | | | | |
The accompanying notes are an integral part of these financial statements.
|
| Hartford Total Return Bond HLS Fund |
Schedule of Investments – (continued)
December 31, 2016
| | | | | | | | | | | | |
Shares or Principal Amount | | Market Value† | |
| SENIOR FLOATING RATE INTERESTS - 5.1%(10) - (continued) | |
| | | | | | | Software - 0.5% | |
| | $ | | | | 430,000 | | | Dell, Inc.
4.02%, 09/07/2023 | | $ | 437,082 | |
| | | | | 349,518 | | | Epicor Software Corp.
4.75%, 06/01/2022 | | | 350,518 | |
| | | | | 4,897,159 | | | First Data Corp.
3.76%, 03/24/2021 | | | 4,952,252 | |
| | | | | 827,096 | | | Hyland Software, Inc.
4.75%, 07/01/2022 | | | 831,058 | |
| | | | | 1,582,423 | | | Infor US, Inc.
3.75%, 06/03/2020 | | | 1,583,736 | |
| | | | | | | | SS&C Technologies, Inc. | |
| | | | | 935,291 | | | 4.00%, 07/08/2022 | | | 947,571 | |
| | | | | 95,788 | | | 4.00%, 07/08/2022 | | | 97,045 | |
| | | | | 821,282 | | | Verint Systems, Inc.
3.57%, 09/06/2019 | | | 823,680 | |
| | | | | 1,676,575 | | | WEX, Inc.
4.27%, 07/01/2023 | | | 1,698,840 | |
| | | | | | | | | | | | |
| | | | | | | | | | | 11,721,782 | |
| | | | | | | | | | | | |
| | | | | | | Telecommunications - 0.2% | |
| | | | | 2,020,000 | | | Level 3 Financing, Inc.
3.50%, 05/31/2022 | | | 2,042,725 | |
| | | | | 667,785 | | | LTS Buyer LLC
4.25%, 04/13/2020 | | | 670,917 | |
| | | | | | | | Ziggo Financing Partnership | |
| | | | | 851,279 | | | 3.50%, 01/15/2022 | | | 854,829 | |
| | | | | 98,429 | | | 3.70%, 01/15/2022 | | | 98,840 | |
| | | | | | | | | | | | |
| | | | | | | | | | | 3,667,311 | |
| | | | | | | | | | | | |
| | | | | | | Trucking & Leasing - 0.0% | |
| | | | | 1,146,457 | | | Consolidated Container Co.
5.00%, 07/03/2019 | | | 1,152,190 | |
| | | | | | | | | | | | |
| | | | | | | | Total Senior Floating Rate Interests
(cost $127,559,592) | | $ | 127,389,016 | |
| | | | | | | | | | | | |
| U.S. GOVERNMENT AGENCIES - 44.0% | |
| | | | | | | FHLMC - 20.2% | |
| | | | | 229,056 | | | 0.00%, 11/15/2036(13) | | $ | 205,221 | |
| | | | | 63,711,331 | | | 0.30%, 10/25/2020(2)(4) | | | 418,915 | |
| | | | | 30,599,466 | | | 1.96%, 08/25/2018(2)(4) | | | 756,615 | |
| | | | | 66,100,000 | | | 2.50%, 01/01/2032(14)(15) | | | 66,218,775 | |
| | | | | 4,843,166 | | | 3.00%, 03/15/2028(4) | | | 428,732 | |
| | | | | 3,976,336 | | | 3.00%, 08/01/2029 | | | 4,091,949 | |
| | | | | 53,475,000 | | | 3.00%, 01/01/2032(14)(15) | | | 54,870,660 | |
| | | | | 1,245,492 | | | 3.00%, 03/15/2033(4) | | | 155,513 | |
| | | | | 7,133,887 | | | 3.00%, 11/01/2036 | | | 7,219,331 | |
| | | | | 11,170,254 | | | 3.00%, 11/01/2046 | | | 11,106,828 | |
| | | | | 2,126,460 | | | 3.00%, 12/01/2046 | | | 2,115,019 | |
| | | | | 62,775,000 | | | 3.00%, 01/01/2047(14)(15) | | | 62,333,968 | |
| | | | | 9,200,000 | | | 3.50%, 01/01/2032(14)(15) | | | 9,594,432 | |
| | | | | 7,313,577 | | | 3.50%, 08/01/2034 | | | 7,563,007 | |
| | | | | 4,978,225 | | | 3.50%, 03/15/2041(4) | | | 640,222 | |
| | | | | 1,789,527 | | | 3.50%, 06/01/2046 | | | 1,834,154 | |
| | | | | 118,450,000 | | | 3.50%, 01/01/2047(14)(15) | | | 121,286,037 | |
| | | | | 7,368,653 | | | 4.00%, 08/01/2025 | | | 7,752,976 | |
| | | | | 3,415,266 | | | 4.00%, 12/15/2026(4) | | | 336,975 | |
| | | | | 5,995,925 | | | 4.00%, 07/15/2027(4) | | | 667,030 | |
| | | | | 5,681,695 | | | 4.00%, 05/01/2042 | | | 5,996,617 | |
| | | | | 1,769,486 | | | 4.00%, 08/01/2042 | | | 1,875,936 | |
| | | | | 2,707,565 | | | 4.00%, 09/01/2042 | | | 2,870,453 | |
| | | | | 616,282 | | | 4.00%, 07/01/2044 | | | 647,396 | |
| | | | | 436,341 | | | 4.00%, 06/01/2045 | | | 459,453 | |
| | | | | | | | | | | | |
Shares or Principal Amount | | Market Value† | |
| U.S. GOVERNMENT AGENCIES - 44.0% - (continued) | |
| | | | | | | FHLMC - 20.2% - (continued) | |
| | $ | | | | 3,742,390 | | | 4.00%, 01/01/2046 | | $ | 3,933,521 | |
| | | | | 2,038,921 | | | 4.00%, 02/01/2046 | | | 2,143,180 | |
| | | | | 54,875,000 | | | 4.00%, 01/01/2047(14)(15) | | | 57,636,968 | |
| | | | | 1,651,003 | | | 4.50%, 03/15/2041 | | | 1,846,821 | |
| | | | | 1,467,402 | | | 4.50%, 09/01/2044 | | | 1,576,201 | |
| | | | | 26,350,000 | | | 4.50%, 01/01/2047(14)(15) | | | 28,283,373 | |
| | | | | 4,262,954 | | | 4.75%, 07/15/2039 | | | 4,598,210 | |
| | | | | 7,875,000 | | | 5.00%, 01/01/2047(14)(15) | | | 8,574,521 | |
| | | | | 1,104 | | | 5.50%, 10/01/2018 | | | 1,127 | |
| | | | | 81,261 | | | 5.50%, 03/01/2028 | | | 90,008 | |
| | | | | 122,356 | | | 5.50%, 04/01/2033 | | | 135,551 | |
| | | | | 1,525,837 | | | 5.50%, 05/01/2034 | | | 1,716,142 | |
| | | | | 1,917 | | | 5.50%, 11/01/2035 | | | 2,144 | |
| | | | | 36,114 | | | 5.50%, 05/01/2037 | | | 40,145 | |
| | | | | 84,853 | | | 5.50%, 11/01/2037 | | | 94,571 | |
| | | | | 153,834 | | | 5.50%, 02/01/2038 | | | 171,628 | |
| | | | | 63,150 | | | 5.50%, 04/01/2038 | | | 70,444 | |
| | | | | 77,656 | | | 5.50%, 06/01/2038 | | | 86,419 | |
| | | | | 8,670,907 | | | 5.50%, 08/01/2038 | | | 9,661,016 | |
| | | | | 816,263 | | | 5.50%, 09/01/2038 | | | 909,002 | |
| | | | | 16,597 | | | 5.50%, 12/01/2039 | | | 18,487 | |
| | | | | 221,345 | | | 5.50%, 02/01/2040 | | | 246,508 | |
| | | | | 710,650 | | | 5.50%, 05/01/2040 | | | 792,735 | |
| | | | | 715,997 | | | 5.50%, 08/01/2040 | | | 797,352 | |
| | | | | 2,917,321 | | | 5.50%, 06/01/2041 | | | 3,255,724 | |
| | | | | 8 | | | 6.00%, 04/01/2017 | | | 8 | |
| | | | | 13 | | | 6.00%, 05/01/2017 | | | 13 | |
| | | | | 34 | | | 6.00%, 07/01/2017 | | | 34 | |
| | | | | 1,695 | | | 6.00%, 07/01/2029 | | | 1,915 | |
| | | | | 365,295 | | | 6.00%, 10/01/2032 | | | 418,929 | |
| | | | | 436,882 | | | 6.00%, 11/01/2032 | | | 500,695 | |
| | | | | 450,819 | | | 6.00%, 12/01/2032 | | | 517,389 | |
| | | | | 28,189 | | | 6.00%, 11/01/2033 | | | 32,251 | |
| | | | | 50,050 | | | 6.00%, 01/01/2034 | | | 56,897 | |
| | | | | 32,094 | | | 6.00%, 02/01/2034 | | | 36,719 | |
| | | | | 377,663 | | | 6.00%, 08/01/2034 | | | 430,972 | |
| | | | | 412,595 | | | 6.00%, 09/01/2034 | | | 470,478 | |
| | | | | 295,350 | | | 6.00%, 01/01/2035 | | | 334,833 | |
| | | | | 3,037,814 | | | 6.00%, 11/01/2037 | | | 3,453,668 | |
| | | | | 133 | | | 6.50%, 07/01/2031 | | | 150 | |
| | | | | 361 | | | 6.50%, 08/01/2032 | | | 408 | |
| | | | | 1,453,968 | | | 6.50%, 07/15/2036 | | | 1,633,314 | |
| | | | | 249,103 | | | 6.50%, 12/01/2037 | | | 287,217 | |
| | | | | 170 | | | 7.50%, 09/01/2029 | | | 188 | |
| | | | | 2,718 | | | 7.50%, 11/01/2031 | | | 3,017 | |
| | | | | | | | | | | | |
| | | | | | | | | | | 506,307,107 | |
| | | | | | | | | | | | |
| | | | | | | FNMA - 17.1% | |
| | | | | 218,624 | | | 0.00%, 03/25/2036(13) | | | 189,496 | |
| | | | | 1,881,634 | | | 0.00%, 06/25/2036(13) | | | 1,649,658 | |
| | | | | 6,731,683 | | | 1.94%, 04/25/2055(2)(4) | | | 390,307 | |
| | | | | 6,664,756 | | | 1.97%, 08/25/2044(2)(4) | | | 431,170 | |
| | | | | 7,240,885 | | | 1.97%, 05/25/2046(2)(4) | | | 404,699 | |
| | | | | 3,994,897 | | | 2.09%, 06/25/2055(2)(4) | | | 265,836 | |
| | | | | 1,421,110 | | | 2.50%, 06/25/2028(4) | | | 118,385 | |
| | | | | 66,200,000 | | | 2.50%, 01/01/2032(14)(15) | | | 66,304,728 | |
| | | | | 288,665 | | | 2.50%, 01/01/2043 | | | 276,108 | |
| | | | | 5,851,325 | | | 2.50%, 02/01/2043 | | | 5,596,796 | |
| | | | | 2,289,785 | | | 2.50%, 03/01/2043 | | | 2,190,248 | |
| | | | | 4,732,347 | | | 2.50%, 05/01/2043 | | | 4,526,621 | |
| | | | | 3,082,024 | | | 2.50%, 06/01/2043 | | | 2,943,794 | |
The accompanying notes are an integral part of these financial statements.
|
| Hartford Total Return Bond HLS Fund |
Schedule of Investments – (continued)
December 31, 2016
| | | | | | | | | | | | |
Shares or Principal Amount | | Market Value† | |
| U.S. GOVERNMENT AGENCIES - 44.0% - (continued) | |
| | | | | | | FNMA - 17.1% - (continued) | |
| | $ | | | | 2,164,744 | | | 2.50%, 04/01/2045 | | $ | 2,061,803 | |
| | | | | 9,780,000 | | | 2.65%, 06/01/2025 | | | 9,624,366 | |
| | | | | 13,400,000 | | | 2.69%, 04/01/2025 | | | 13,227,900 | |
| | | | | 1,253,937 | | | 3.00%, 09/25/2027(4) | | | 117,340 | |
| | | | | 9,385,476 | | | 3.00%, 01/25/2028(4) | | | 895,780 | |
| | | | | 4,070,926 | | | 3.00%, 04/25/2028(4) | | | 392,976 | |
| | | | | 12,007,000 | | | 3.00%, 01/01/2032(14)(15) | | | 12,321,246 | |
| | | | | 67,200,000 | | | 3.00%, 01/01/2047(14)(15) | | | 66,757,407 | |
| | | | | 540,000 | | | 3.16%, 12/01/2026 | | | 545,807 | |
| | | | | 497,556 | | | 3.24%, 12/01/2026 | | | 506,296 | |
| | | | | 569,348 | | | 3.34%, 04/01/2024 | | | 589,686 | |
| | | | | 213,646 | | | 3.45%, 01/01/2024 | | | 222,565 | |
| | | | | 225,282 | | | 3.47%, 01/01/2024 | | | 234,957 | |
| | | | | 2,294,685 | | | 3.50%, 10/25/2027(4) | | | 262,388 | |
| | | | | 2,310,722 | | | 3.50%, 05/25/2030(4) | | | 313,585 | |
| | | | | 2,662,775 | | | 3.50%, 10/01/2044 | | | 2,740,207 | |
| | | | | 3,323,154 | | | 3.50%, 02/01/2045 | | | 3,408,278 | |
| | | | | 5,427,020 | | | 3.50%, 09/01/2046 | | | 5,567,599 | |
| | | | | 2,493,044 | | | 3.50%, 10/01/2046 | | | 2,557,620 | |
| | | | | 1,790,066 | | | 3.50%, 11/01/2046 | | | 1,842,527 | |
| | | | | 115,350,000 | | | 3.50%, 01/01/2047(14)(15) | | | 118,224,741 | |
| | | | | 563,453 | | | 3.67%, 08/01/2023 | | | 596,419 | |
| | | | | 155,000 | | | 3.70%, 10/01/2023 | | | 163,743 | |
| | | | | 2,021,053 | | | 3.74%, 06/01/2026 | | | 2,130,249 | |
| | | | | 210,000 | | | 3.76%, 03/01/2024 | | | 223,047 | |
| | | | | 315,000 | | | 3.86%, 12/01/2025 | | | 334,878 | |
| | | | | 165,000 | | | 3.86%, 11/01/2023 | | | 176,111 | |
| | | | | 534,245 | | | 3.87%, 10/01/2025 | | | 567,244 | |
| | | | | 686,924 | | | 3.89%, 05/01/2030 | | | 714,974 | |
| | | | | 728,773 | | | 3.93%, 10/01/2023 | | | 775,379 | |
| | | | | 299,045 | | | 3.96%, 05/01/2034 | | | 311,277 | |
| | | | | 193,484 | | | 3.97%, 05/01/2029 | | | 207,760 | |
| | | | | 3,551,587 | | | 4.00%, 06/01/2025 | | | 3,746,675 | |
| | | | | 1,025,873 | | | 4.00%, 10/01/2025 | | | 1,083,310 | |
| | | | | 6,045,986 | | | 4.00%, 10/01/2040 | | | 6,361,354 | |
| | | | | 2,628,583 | | | 4.00%, 11/01/2040 | | | 2,773,574 | |
| | | | | 1,913,535 | | | 4.00%, 12/01/2040 | | | 2,019,194 | |
| | | | | 958,255 | | | 4.00%, 02/01/2041 | | | 1,011,961 | |
| | | | | 2,324,114 | | | 4.00%, 03/01/2041 | | | 2,453,478 | |
| | | | | 1,023,051 | | | 4.00%, 03/25/2042(4) | | | 145,494 | |
| | | | | 1,016,999 | | | 4.00%, 08/01/2042 | | | 1,072,878 | |
| | | | | 2,114,780 | | | 4.00%, 09/01/2042 | | | 2,222,939 | |
| | | | | 594,252 | | | 4.00%, 11/25/2042(4) | | | 88,809 | |
| | | | | 507,240 | | | 4.00%, 03/01/2045 | | | 533,504 | |
| | | | | 4,046,460 | | | 4.00%, 05/01/2046 | | | 4,258,758 | |
| | | | | 2,126,898 | | | 4.00%, 06/01/2046 | | | 2,238,148 | |
| | | | | 10,330,000 | | | 4.00%, 01/01/2047(14)(15) | | | 10,860,018 | |
| | | | | 443,494 | | | 4.06%, 10/01/2028 | | | 478,623 | |
| | | | | 1,111,712 | | | 4.50%, 04/01/2025 | | | 1,166,997 | |
| | | | | 1,346,843 | | | 4.50%, 07/25/2027(4) | | | 141,016 | |
| | | | | 1,721,010 | | | 4.50%, 09/01/2035 | | | 1,854,892 | |
| | | | | 6,018,141 | | | 4.50%, 08/01/2040 | | | 6,503,216 | |
| | | | | 5,838,142 | | | 4.50%, 10/01/2040 | | | 6,291,747 | |
| | | | | 2,633,824 | | | 4.50%, 10/01/2041 | | | 2,838,055 | |
| | | | | 2,230,229 | | | 4.50%, 09/01/2043 | | | 2,401,011 | |
| | | | | 3,000,000 | | | 4.50%, 01/01/2047(14)(15) | | | 3,226,758 | |
| | | | | 1,539 | | | 5.00%, 02/01/2018 | | | 1,575 | |
| | | | | 37,896 | | | 5.00%, 04/01/2018 | | | 38,783 | |
| | | | | 263,982 | | | 5.00%, 05/01/2018 | | | 270,220 | |
| | | | | 309,217 | | | 5.00%, 06/01/2018 | | | 316,454 | |
| | | | | 9,037 | | | 5.00%, 07/01/2018 | | | 9,249 | |
| | | | | | | | | | | | |
Shares or Principal Amount | | Market Value† | |
| U.S. GOVERNMENT AGENCIES - 44.0% - (continued) | |
| | | | | | | FNMA - 17.1% - (continued) | |
| | $ | | | | 94,690 | | | 5.00%, 09/01/2018 | | $ | 96,906 | |
| | | | | 240,199 | | | 5.00%, 01/01/2020 | | | 245,821 | |
| | | | | 1,279,010 | | | 5.00%, 06/01/2022 | | | 1,362,575 | |
| | | | | 446,605 | | | 5.00%, 06/01/2025 | | | 478,814 | |
| | | | | 1,079,468 | | | 5.00%, 04/25/2038 | | | 1,162,716 | |
| | | | | 798,359 | | | 5.46%, 05/25/2042(2)(4) | | | 92,997 | |
| | | | | 123 | | | 5.50%, 01/01/2017 | | | 123 | |
| | | | | 34,675 | | | 5.50%, 02/01/2018 | | | 35,104 | |
| | | | | 1,261 | | | 5.50%, 06/01/2018 | | | 1,285 | |
| | | | | 6,123 | | | 5.50%, 11/01/2018 | | | 6,219 | |
| | | | | 58,730 | | | 5.50%, 08/01/2019 | | | 60,766 | |
| | | | | 106,661 | | | 5.50%, 09/01/2019 | | | 110,100 | |
| | | | | 23,847 | | | 5.50%, 10/01/2019 | | | 24,581 | |
| | | | | 12,580 | | | 5.50%, 01/01/2020 | | | 12,983 | |
| | | | | 3,729 | | | 5.50%, 03/01/2020 | | | 3,861 | |
| | | | | 510,390 | | | 5.50%, 05/01/2020 | | | 531,193 | |
| | | | | 284,158 | | | 5.50%, 06/01/2022 | | | 299,789 | |
| | | | | 369,740 | | | 5.50%, 06/01/2033 | | | 414,179 | |
| | | | | 395,607 | | | 5.50%, 08/01/2033 | | | 443,657 | |
| | | | | 1,769,664 | | | 5.50%, 09/01/2033 | | | 1,985,282 | |
| | | | | 1,681,377 | | | 5.50%, 12/01/2033 | | | 1,903,052 | |
| | | | | 1,443,773 | | | 5.50%, 01/01/2034 | | | 1,619,268 | |
| | | | | 6,156,461 | | | 5.50%, 11/01/2035 | | | 6,908,092 | |
| | | | | 1,968,549 | | | 5.50%, 04/01/2036 | | | 2,201,941 | |
| | | | | 1,511,636 | | | 5.50%, 09/01/2036 | | | 1,694,630 | |
| | | | | 165,749 | | | 5.50%, 01/01/2037 | | | 184,812 | |
| | | | | 982,323 | | | 5.50%, 04/25/2037 | | | 1,090,852 | |
| | | | | 4,095,623 | | | 5.50%, 06/25/2042(4) | | | 983,528 | |
| | | | | 4,433 | | | 6.00%, 03/01/2022 | | | 4,529 | |
| | | | | 717,509 | | | 6.00%, 12/01/2032 | | | 826,207 | |
| | | | | 761,084 | | | 6.00%, 01/01/2033 | | | 871,714 | |
| | | | | 144,360 | | | 6.00%, 02/01/2033 | | | 163,965 | |
| | | | | 781,321 | | | 6.00%, 03/01/2033 | | | 896,084 | |
| | | | | 1,893,615 | | | 6.00%, 02/01/2037 | | | 2,147,550 | |
| | | | | 109 | | | 6.50%, 05/01/2017 | | | 110 | |
| | | | | 1,451 | | | 6.50%, 05/01/2031 | | | 1,642 | |
| | | | | 1,420 | | | 6.50%, 09/01/2031 | | | 1,633 | |
| | | | | 2,346 | | | 6.50%, 07/01/2032 | | | 2,724 | |
| | | | | 2,109 | | | 7.00%, 07/01/2029 | | | 2,434 | |
| | | | | 100 | | | 7.00%, 12/01/2030 | | | 103 | |
| | | | | 851 | | | 7.00%, 02/01/2032 | | | 929 | |
| | | | | 358 | | | 7.00%, 03/01/2032 | | | 425 | |
| | | | | 2,137 | | | 7.00%, 09/01/2032 | | | 2,291 | |
| | | | | 64,375 | | | 7.00%, 10/01/2037 | | | 68,082 | |
| | | | | 3,344 | | | 7.50%, 10/01/2022 | | | 3,703 | |
| | | | | 2,288 | | | 7.50%, 06/01/2027 | | | 2,704 | |
| | | | | 3,044 | | | 7.50%, 10/01/2029 | | | 3,177 | |
| | | | | 19,873 | | | 7.50%, 03/01/2030 | | | 22,456 | |
| | | | | 9,069 | | | 7.50%, 04/01/2030 | | | 9,491 | |
| | | | | 1,419 | | | 7.50%, 06/01/2030 | | | 1,626 | |
| | | | | 2,607 | | | 7.50%, 07/01/2030 | | | 2,991 | |
| | | | | 786 | | | 7.50%, 08/01/2030 | | | 904 | |
| | | | | 6,172 | | | 7.50%, 10/01/2030 | | | 6,276 | |
| | | | | 8,357 | | | 7.50%, 01/01/2031 | | | 8,584 | |
| | | | | 4,817 | | | 7.50%, 02/01/2031 | | | 4,987 | |
| | | | | 31,735 | | | 7.50%, 05/01/2031 | | | 36,363 | |
| | | | | 9,184 | | | 7.50%, 06/01/2031 | | | 9,472 | |
| | | | | 2,512 | | | 7.50%, 08/01/2031 | | | 2,885 | |
| | | | | 41,835 | | | 7.50%, 09/01/2031 | | | 43,967 | |
| | | | | 365 | | | 7.50%, 05/01/2032 | | | 428 | |
| | | | | | | | | | | | |
| | | | | | | | | | | 429,418,253 | |
| | | | | | | | | | | | |
The accompanying notes are an integral part of these financial statements.
|
| Hartford Total Return Bond HLS Fund |
Schedule of Investments – (continued)
December 31, 2016
| | | | | | | | | | | | |
Shares or Principal Amount | | Market Value† | |
| U.S. GOVERNMENT AGENCIES - 44.0% - (continued) | |
| | | | | | | GNMA - 6.7% | |
| | $ | | | | 10,272,843 | | | 3.00%, 03/15/2045 | | $ | 10,394,967 | |
| | | | | 488,283 | | | 3.00%, 04/15/2045 | | | 494,088 | |
| | | | | 6,214,232 | | | 3.00%, 07/15/2045 | | | 6,288,108 | |
| | | | | 135,529 | | | 3.00%, 08/15/2045 | | | 137,140 | |
| | | | | 4,675,000 | | | 3.00%, 01/01/2047(14)(15) | | | 4,733,529 | |
| | | | | 540,839 | | | 3.50%, 11/15/2042 | | | 568,562 | |
| | | | | 17,461 | | | 3.50%, 12/15/2042 | | | 18,227 | |
| | | | | 386,349 | | | 3.50%, 02/15/2043 | | | 403,275 | |
| | | | | 17,669 | | | 3.50%, 03/15/2043 | | | 18,443 | |
| | | | | 2,377,521 | | | 3.50%, 04/15/2043 | | | 2,481,568 | |
| | | | | 7,247,671 | | | 3.50%, 05/15/2043 | | | 7,551,510 | |
| | | | | 23,574,304 | | | 3.50%, 10/20/2046 | | | 24,536,810 | |
| | | | | 700,000 | | | 3.50%, 01/01/2047(14)(15) | | | 727,658 | |
| | | | | 8,201,903 | | | 4.00%, 07/20/2040 | | | 8,747,984 | |
| | | | | 9,381,254 | | | 4.00%, 09/20/2040 | | | 10,061,797 | |
| | | | | 13,935,324 | | | 4.00%, 10/20/2040 | | | 14,939,050 | |
| | | | | 2,144,642 | | | 4.00%, 12/20/2040 | | | 2,309,474 | |
| | | | | 716,073 | | | 4.00%, 05/16/2042(4) | | | 108,538 | |
| | | | | 449,436 | | | 4.00%, 01/20/2044(4) | | | 88,923 | |
| | | | | 20,000,000 | | | 4.00%, 01/01/2047(14)(15) | | | 21,239,452 | |
| | | | | 337,058 | | | 4.50%, 11/15/2039 | | | 365,963 | |
| | | | | 3,013,950 | | | 4.50%, 05/15/2040 | | | 3,299,929 | |
| | | | | 9,868,215 | | | 4.50%, 05/20/2040 | | | 10,630,143 | |
| | | | | 419,350 | | | 4.50%, 07/15/2041 | | | 456,507 | |
| | | | | 1,041,194 | | | 4.50%, 01/20/2046 | | | 1,112,349 | |
| | | | | 1,650,000 | | | 4.50%, 01/01/2047(14)(15) | | | 1,761,053 | |
| | | | | 1,060,357 | | | 5.00%, 05/20/2040 | | | 1,168,096 | |
| | | | | 2,564,194 | | | 5.00%, 06/15/2041 | | | 2,821,439 | |
| | | | | 3,327,713 | | | 5.00%, 10/16/2041(4) | | | 566,555 | |
| | | | | 4,106,513 | | | 5.00%, 03/15/2044 | | | 4,530,524 | |
| | | | | 4,400,000 | | | 5.00%, 01/01/2047(14)(15) | | | 4,805,625 | |
| | | | | 676,007 | | | 5.50%, 03/15/2033 | | | 777,526 | |
| | | | | 1,049,084 | | | 5.50%, 04/15/2033 | | | 1,205,193 | |
| | | | | 1,108,788 | | | 5.50%, 05/15/2033 | | | 1,279,041 | |
| | | | | 1,773,632 | | | 5.50%, 10/20/2034 | | | 1,994,257 | |
| | | | | 2,084 | | | 6.00%, 12/15/2023 | | | 2,362 | |
| | | | | 1,218 | | | 6.00%, 01/15/2029 | | | 1,381 | |
| | | | | 1,979 | | | 6.00%, 04/15/2029 | | | 2,296 | |
| | | | | 61,854 | | | 6.00%, 12/15/2031 | | | 70,504 | |
| | | | | 1,209 | | | 6.00%, 10/15/2032 | | | 1,402 | |
| | | | | 32,526 | | | 6.00%, 06/15/2033 | | | 37,714 | |
| | | | | 3,253 | | | 6.00%, 03/15/2034 | | | 3,772 | |
| | | | | 73,486 | | | 6.00%, 08/15/2034 | | | 83,526 | |
| | | | | 91,154 | | | 6.00%, 09/15/2034 | | | 104,067 | |
| | | | | 59,400 | | | 6.00%, 02/15/2035 | | | 67,833 | |
| | | | | 435,693 | | | 6.00%, 12/15/2035 | | | 500,618 | |
| | | | | 77,211 | | | 6.00%, 02/15/2036 | | | 87,529 | |
| | | | | 255,304 | | | 6.00%, 03/15/2036 | | | 291,353 | |
| | | | | 33,645 | | | 6.00%, 04/15/2036 | | | 38,141 | |
| | | | | 205,071 | | | 6.00%, 05/15/2036 | | | 236,059 | |
| | | | | 430,244 | | | 6.00%, 06/15/2036 | | | 494,544 | |
| | | | | 272,771 | | | 6.00%, 07/15/2036 | | | 311,431 | |
| | | | | 44,689 | | | 6.00%, 08/15/2036 | | | 50,674 | |
| | | | | 267,058 | | | 6.00%, 02/15/2037 | | | 305,698 | |
| | | | | 1,697 | | | 6.00%, 05/15/2037 | | | 1,924 | |
| | | | | 586,599 | | | 6.00%, 06/15/2037 | | | 674,248 | |
| | | | | 451,943 | | | 6.00%, 07/15/2037 | | | 512,338 | |
| | | | | 99,512 | | | 6.00%, 08/15/2037 | | | 112,875 | |
| | | | | 91,741 | | | 6.00%, 09/15/2037 | | | 104,002 | |
| | | | | 150,530 | | | 6.00%, 10/15/2037 | | | 170,732 | |
| | | | | 153,702 | | | 6.00%, 11/15/2037 | | | 174,332 | |
| | | | | | | | | | | | |
Shares or Principal Amount | | Market Value† | |
| U.S. GOVERNMENT AGENCIES - 44.0% - (continued) | |
| | | | | | | GNMA - 6.7% - (continued) | |
| | $ | | | | 159,350 | | | 6.00%, 12/15/2037 | | $ | 183,269 | |
| | | | | 240,101 | | | 6.00%, 01/15/2038 | | | 275,257 | |
| | | | | 22,587 | | | 6.00%, 02/15/2038 | | | 25,605 | |
| | | | | 49,802 | | | 6.00%, 05/15/2038 | | | 56,457 | |
| | | | | 10,792 | | | 6.00%, 06/15/2038 | | | 12,252 | |
| | | | | 69,515 | | | 6.00%, 08/15/2038 | | | 78,895 | |
| | | | | 172,593 | | | 6.00%, 09/15/2038 | | | 196,035 | |
| | | | | 201,336 | | | 6.00%, 10/15/2038 | | | 234,132 | |
| | | | | 437,063 | | | 6.00%, 11/15/2038 | | | 495,639 | |
| | | | | 251,409 | | | 6.00%, 12/15/2038 | | | 285,311 | |
| | | | | 2,856 | | | 6.00%, 01/15/2039 | | | 3,242 | |
| | | | | 44,088 | | | 6.00%, 08/15/2039 | | | 49,983 | |
| | | | | 132,179 | | | 6.00%, 11/15/2039 | | | 149,843 | |
| | | | | 141,273 | | | 6.00%, 02/15/2040 | | | 160,154 | |
| | | | | 1,432,751 | | | 6.00%, 06/15/2040 | | | 1,624,233 | |
| | | | | 267,139 | | | 6.00%, 07/15/2040 | | | 302,837 | |
| | | | | 1,496,035 | | | 6.00%, 06/15/2041 | | | 1,701,227 | |
| | | | | 27,467 | | | 6.50%, 06/15/2028 | | | 31,375 | |
| | | | | 940 | | | 6.50%, 07/15/2028 | | | 1,073 | |
| | | | | 4,290 | | | 6.50%, 08/15/2028 | | | 4,901 | |
| | | | | 20,558 | | | 6.50%, 09/15/2028 | | | 23,483 | |
| | | | | 3,576 | | | 6.50%, 10/15/2028 | | | 3,825 | |
| | | | | 6,288 | | | 6.50%, 11/15/2028 | | | 7,183 | |
| | | | | 12,941 | | | 6.50%, 12/15/2028 | | | 14,782 | |
| | | | | 18,801 | | | 6.50%, 01/15/2029 | | | 21,477 | |
| | | | | 30,551 | | | 6.50%, 02/15/2029 | | | 34,897 | |
| | | | | 334,180 | | | 6.50%, 03/15/2029 | | | 381,721 | |
| | | | | 50,419 | | | 6.50%, 04/15/2029 | | | 57,593 | |
| | | | | 30,716 | | | 6.50%, 05/15/2029 | | | 35,086 | |
| | | | | 210,540 | | | 6.50%, 06/15/2029 | | | 240,493 | |
| | | | | 9,959 | | | 6.50%, 07/15/2029 | | | 11,376 | |
| | | | | 368 | | | 6.50%, 03/15/2031 | | | 420 | |
| | | | | 261,672 | | | 6.50%, 04/15/2031 | | | 298,897 | |
| | | | | 80,329 | | | 6.50%, 05/15/2031 | | | 92,650 | |
| | | | | 13,743 | | | 6.50%, 06/15/2031 | | | 15,845 | |
| | | | | 237,615 | | | 6.50%, 07/15/2031 | | | 271,419 | |
| | | | | 122,885 | | | 6.50%, 08/15/2031 | | | 140,368 | |
| | | | | 168,323 | | | 6.50%, 09/15/2031 | | | 192,269 | |
| | | | | 165,095 | | | 6.50%, 10/15/2031 | | | 188,583 | |
| | | | | 502,268 | | | 6.50%, 11/15/2031 | | | 573,723 | |
| | | | | 89,915 | | | 6.50%, 12/15/2031 | | | 102,707 | |
| | | | | 377,687 | | | 6.50%, 01/15/2032 | | | 431,421 | |
| | | | | 82,012 | | | 6.50%, 02/15/2032 | | | 94,716 | |
| | | | | 60,486 | | | 6.50%, 03/15/2032 | | | 69,092 | |
| | | | | 279,267 | | | 6.50%, 04/15/2032 | | | 321,231 | |
| | | | | 1,040 | | | 6.50%, 05/15/2032 | | | 1,187 | |
| | | | | 39,572 | | | 6.50%, 06/15/2032 | | | 45,202 | |
| | | | | 1,105 | | | 6.50%, 09/15/2032 | | | 1,284 | |
| | | | | 10,791 | | | 7.00%, 06/20/2030 | | | 11,997 | |
| | | | | 991 | | | 7.00%, 02/15/2031 | | | 1,097 | |
| | | | | 208 | | | 7.00%, 06/15/2031 | | | 223 | |
| | | | | 224 | | | 7.00%, 08/15/2031 | | | 254 | |
| | | | | 819 | | | 8.50%, 11/15/2024 | | | 822 | |
| | | | | | | | | | | | |
| | | | | | | | | | | 166,623,701 | |
| | | | | | | | | | | | |
| | | |
| | | | | | | | Total U.S. Government Agencies
(cost $1,094,889,219) | | $ | 1,102,349,061 | |
| | | | | | | | | | | | |
The accompanying notes are an integral part of these financial statements.
|
| Hartford Total Return Bond HLS Fund |
Schedule of Investments – (continued)
December 31, 2016
| | | | | | | | | | | | |
Shares or Principal Amount | | Market Value† | |
| U.S. GOVERNMENT SECURITIES - 4.4% | |
| | | | | | | U.S. Treasury Securities - 4.4% | |
| | | | | | | U.S. Treasury Bonds - 1.4% | |
| | $ | | | | 1,350,000 | | | 2.50%, 02/15/2045 | | $ | 1,202,502 | |
| | | | | 7,439,000 | | | 2.50%, 02/15/2046(16) | | | 6,610,251 | |
| | | | | 2,800,000 | | | 3.00%, 11/15/2044(16)(17) | | | 2,765,986 | |
| | | | | 5,595,000 | | | 3.00%, 05/15/2045(16) | | | 5,519,378 | |
| | | | | 9,544,000 | | | 3.00%, 11/15/2045(16) | | | 9,413,514 | |
| | | | | 9,260,000 | | | 3.13%, 08/15/2044(16)(17) | | | 9,372,129 | |
| | | | | | | | | | | | |
| | | | | | | | | | | 34,883,760 | |
| | | | | | | | | | | | |
| | | | | | | U.S. Treasury Notes - 3.0% | |
| | | | | 43,972,007 | | | 0.25%, 01/15/2025(8)(16) | | | 43,245,721 | |
| | | | | 31,835,000 | | | 2.00%, 11/15/2026 | | | 30,629,981 | |
| | | | | 200,000 | | | 2.38%, 08/15/2024 | | | 200,930 | |
| | | | | | | | | | | | |
| | | | | | | | | | | 74,076,632 | |
| | | | | | | | | | | | |
| | | |
| | | | | | | | Total U.S. Government Securities
(cost $112,196,131) | | $ | 108,960,392 | |
| | | | | | | | | | | | |
|
| COMMON STOCKS - 0.0% | |
| | | | Energy - 0.0% | |
| | | | | 5,966 | | | Arch Coal, Inc.* | | $ | 465,646 | |
| | | | | 14,557 | | | Templar Energy LLC Class A*(5)(18) | | | 145,573 | |
| | | | | | | | | | | | |
| | | | 611,219 | |
| | | | | | | | | | | | |
| | | | Utilities - 0.0% | |
| | | | | 800,000 | | | TCEH Corp.*(5)(18) | | | 1 | |
| | | | | 13,339 | | | Vistra Energy Corp. | | | 206,754 | |
| | | | | | | | | | | | |
| | | | 206,755 | |
| | | | | | | | | | | | |
| | |
| | | | Total Common Stocks
(cost $732,502) | | $ | 817,974 | |
| | | | | | | | | | | | |
|
| PREFERRED STOCKS - 0.1% | |
| | | | Banks - 0.1% | |
| | | | | 2,242 | | | U.S. Bancorp Series A 3.50%(2)(7) | | $ | 1,950,495 | |
| | | | | | | | | | | | |
| | | | Diversified Financials - 0.0% | |
| | | | | 30,000 | | | Citigroup Capital XIII 7.26%(2) | | | 774,600 | |
| | | | | | | | | | | | |
| | |
| | | | Total Preferred Stocks
(cost $2,426,720) | | $ | 2,725,095 | |
| | | | | | | | | | | | |
| | |
| | | | Total Long-Term Investments
(cost $3,072,986,623) | | $ | 3,074,788,498 | |
| | | | | | | | | | | | |
|
| SHORT-TERM INVESTMENTS - 6.7% | |
| | | | Commercial Paper - 1.0% | |
| | | | Auto Manufacturers - 0.5% | |
| | $ | | | | 13,195,000 | | | Toyota Motor Credit Corp.
1.22%, 06/29/2017(9) | | $ | 13,120,034 | |
| | | | | | | | | | | | |
| | | | Diversified Financial Services - 0.5% | |
| | | | | 13,230,000 | | | KFW International Finance, Inc.
0.81%, 02/01/2017(9) | | | 13,220,658 | |
| | | | | | | | | | | | |
| | | | 26,340,692 | |
| | | | | | | | | | | | |
| | | | | | | | | | | | |
Shares or Principal Amount | | Market Value† | |
| SHORT-TERM INVESTMENTS - 6.7% - (continued) | |
| | | | Other Investment Pools & Funds - 5.7% | |
| | | | | 142,599,666 | | | Morgan Stanley Institutional Liquidity Funds, Institutional Class | | $ | 142,599,666 | |
| | | | | | | | | | | | |
| | |
| | | | Total Short-Term Investments
(cost $168,936,594) | | $ | 168,940,358 | |
| | | | | | | | | | | | |
| | | | | | | | | | | | |
| | | |
| | Total Investments Excluding Purchased Options
(cost $3,241,923,217) | | | 129.4 | % | | $ | 3,243,728,856 | |
| | | | | | | | | | | | |
| | | |
| | Total Purchased Options
(cost $135,072) | | | 0.0 | % | | $ | 13,338 | |
| | | | | | | | | | | | |
| | | |
| | Total Investments
(cost $3,242,058,289)^ | | | 129.4 | % | | $ | 3,243,742,194 | |
| | Other Assets and Liabilities | | | (29.4 | )% | | | (737,049,836 | ) |
| | | | | | | | | | | | |
| | Total Net Assets | | | 100.0 | % | | $ | 2,506,692,358 | |
| | | | | | | | | | | | |
The accompanying notes are an integral part of these financial statements.
|
| Hartford Total Return Bond HLS Fund |
Schedule of Investments – (continued)
December 31, 2016
| Note: | Percentage of investments as shown is the ratio of the total market value to total net assets. |
| | The Fund may refer to any one or more of the industry classifications used by one or more widely recognized market indices, ratings group indices and/or as defined by Fund management. Industry classifications may not be identical across all security types. |
| | Equity Industry classifications used in this report are the Global Industry Classification Standard, which was developed by and is the exclusive property and service mark of MSCI, Inc. and Standard & Poor’s. |
| | For Fund compliance purposes, the Fund may not use the same classification system shown in this report as these classifications are used for financial reporting purposes. |
| ^ | At December 31, 2016, the cost of securities for federal income tax purposes was $3,243,684,155 and the aggregate gross unrealized appreciation and depreciation based on that cost were: |
| | | | |
Unrealized Appreciation | | $ | 41,435,835 | |
Unrealized Depreciation | | | (41,377,796 | ) |
| | | | |
Net Unrealized Appreciation | | $ | 58,039 | |
| | | | |
| (1) | Securities issued within terms of a private placement memorandum and exempt from registration under Rule 144A under the Securities Act of 1933, as amended, and may be sold only to qualified institutional buyers. Unless otherwise indicated, these holdings are determined to be liquid. At December 31, 2016, the aggregate value of these securities was $658,887,137, which represents 26.3% of total net assets. |
| (2) | Variable rate securities; the rate reported is the coupon rate in effect at December 31, 2016. |
| (3) | Security is a “step-up” bond where coupon increases or steps up at a predetermined date. Rate shown is current coupon rate. |
| (4) | Securities disclosed are interest-only strips. |
| (5) | These securities are valued in good faith at fair value as determined under policies and procedures established by and under the supervision of the Board of Directors. At December 31, 2016, the aggregate fair value of these securities was $8,898,574, which represents 0.4% of total net assets. This amount excludes securities that are principally traded in certain foreign markets and whose prices are adjusted pursuant to a third party pricing service methodology approved by the Board of Directors. |
| (6) | These securities were sold to the Fund under Regulation S, rules governing offers and sales made outside the United States without registration under the Securities Act of 1933, as amended. The Fund may only be able to resell these securities in the United States if an exemption from registration under the federal and state securities laws is available, or the Fund may only be able to sell these securities outside of the United States (such as on a foreign exchange) to a non-U.S. person. Unless otherwise indicated, these holdings are determined to be liquid. At December 31, 2016, the aggregate value of these securities was $34,814,825, which represents 1.4% of total net assets. |
| (7) | Perpetual maturity security. Maturity date shown is the next call date or final legal maturity date, whichever comes first. |
| (8) | The principal amount for these securities are adjusted for inflation and the interest payments equal a fixed percentage of the inflation-adjusted principal amount. |
| (9) | The rate shown represents current yield to maturity. |
| (10) | Senior floating rate interests generally pay interest rates which are periodically adjusted by reference to a base short-term, floating lending rate plus a premium. The base lending rates are primarily the LIBOR, and secondarily the prime rate offered by one or more major United States banks (the “Prime Rate”) and the certificate of deposit rate or other base lending rates used by commercial lenders. Senior floating rate interests often require prepayments from excess cash flows or permit the borrower to repay at its election. The rate at which the borrower repays cannot be predicted with accuracy. As a result, the actual remaining maturity may be substantially less than the stated maturities shown. Unless otherwise noted, the interest rate disclosed for these securities represents the average coupon as of December 31, 2016. |
| (11) | Non-income producing. For long-term debt securities, items identified are in default as to payment of interest and/or principal. |
| (12) | Represents an unsettled loan commitment. The coupon rate will be determined at time of settlement. |
| (13) | Securities disclosed are principal-only strips. |
| (14) | Represents or includes a TBA transaction. |
| (15) | This security, or a portion of this security, was purchased on a when-issued, delayed-delivery or delayed-draw basis. The cost of these securities was $717,643,265 at December 31, 2016. |
| (16) | This security, or a portion of this security, has been pledged as collateral in connection with OTC swap contracts. |
| (17) | This security, or a portion of this security, has been pledged as collateral in connection with futures contracts. |
The accompanying notes are an integral part of these financial statements.
|
| Hartford Total Return Bond HLS Fund |
Schedule of Investments – (continued)
December 31, 2016
| (18) | The following securities are considered illiquid. Illiquid securities are often purchased in private placement transactions, are often not registered under the Securities Act of 1933, as amended, and may have contractual restrictions on resale. A security may also be considered illiquid if the security lacks a readily available market or if its valuation has not changed for a certain period of time. |
| | | | | | | | | | | | |
Period
Acquired | | | | Shares/Par | | | Security | | Cost | |
10/2016 | | | | | 800,000 | | | TCEH Corp. | | $ | — | |
09/2016 | | | | | 14,557 | | | Templar Energy LLC Class A | | | 124,644 | |
| | | | | | | | | | | | |
| | | | | | | | | | $ | 124,644 | |
| | | | | | | | | | | | |
At December 31, 2016, the aggregate value of these securities was $145,573, which represents 0.0% of total net assets.
OTC Option Contracts Outstanding at December 31, 2016
| | | | | | | | | | | | | | | | | | | | | | | | | | | | | | | | | | | | |
Description | | Counter-
party | | | Exercise Price/FX
Rate/Rate | | | Expiration
Date | | | Number of
Contracts | | | Market
Value† | | | Premiums
Paid
(Received)
by Fund | | | Unrealized
Appreciation/
(Depreciation) | |
Purchased option contracts: | | | | | | | | | | | | | | | | | | | | | | | | | | | | | | | | | | | | |
Puts | | | | | | | | | | | | | | | | | | | | | | | | | | | | | | | | | | | | |
CNH Put/JPY Call | | | GSC | | | | 16.49 | | | | CNH | | | | 01/05/17 | | | | CNH | | | | 60,157,000 | | | $ | 13,338 | | | $ | 135,072 | | | $ | (121,734 | ) |
| | | | | | | | | | | | | | | | | | | | | | | | | | | | | | | | | | | | |
Total purchased option contracts | | | | | | | | | | | | | | | | | | | | | | | 60,157,000 | | | $ | 13,338 | | | $ | 135,072 | | | $ | (121,734 | ) |
| | | | | | | | | | | | | | | | | | | | | | | | | | | | | | | | | | | | |
Futures Contracts Outstanding at December 31, 2016
| | | | | | | | | | | | | | | | | | | | |
Description | | Number of
Contracts | | | Expiration
Date | | | Notional
Amount | | | Market
Value† | | | Unrealized
Appreciation/
(Depreciation) | |
Long position contracts: | | | | | | | | | | | | | | | | | | | | |
Australian 10-Year Bond Future | | | 400 | | | | 03/15/2017 | | | $ | 36,708,625 | | | $ | 36,874,169 | | | $ | 165,544 | |
U.S. Treasury 10-Year Note Future | | | 59 | | | | 03/22/2017 | | | | 7,787,527 | | | | 7,909,688 | | | | 122,161 | |
U.S. Treasury 2-Year Note Future | | | 250 | | | | 03/31/2017 | | | | 54,115,605 | | | | 54,171,875 | | | | 56,270 | |
U.S. Treasury 5-Year Note Future | | | 3,525 | | | | 03/31/2017 | | | | 415,335,872 | | | | 414,765,822 | | | | (570,050 | ) |
U.S. Treasury Long Bond Future | | | 194 | | | | 03/22/2017 | | | | 29,520,538 | | | | 29,227,313 | | | | (293,225 | ) |
U.S. Ultra Bond Future | | | 332 | | | | 03/22/2017 | | | | 53,389,686 | | | | 53,203,000 | | | | (186,686 | ) |
| | | | | | | | | | | | | | | | | | | | |
Total | | | | | | | | | | | | | | | | | | $ | (705,986 | ) |
| | | | | | | | | | | | | | | | | | | | |
Short position contracts: | | | | | | | | | | | | | | | | | | | | |
U.S. Treasury 10-Year Note Future | | | 1,912 | | | | 03/22/2017 | | | $ | 238,335,501 | | | $ | 237,625,750 | | | $ | 709,751 | |
| | | | | | | | | | | | | | | | | | | | |
Total futures contracts | | | | | | | | | | | | | | | | | | $ | 3,765 | |
| | | | | | | | | | | | | | | | | | | | |
TBA Sale Commitments Outstanding at December 31, 2016
| | | | | | | | | | | | | | | | |
Description | | Principal
Amount | | | Maturity
Date | | | Market
Value† | | | Unrealized
Appreciation/
(Depreciation) | |
FHLMC, 5.50% | | $ | 5,100,000 | | | | 01/01/2047 | | | $ | (5,654,625 | ) | | $ | 7,969 | |
FNMA, 3.50% | | | 6,850,000 | | | | 01/01/2032 | | | | (7,136,442 | ) | | | (11,372 | ) |
FNMA, 4.00% | | | 9,400,000 | | | | 01/01/2032 | | | | (9,676,859 | ) | | | (30,109 | ) |
FNMA, 4.50% | | | 17,400,000 | | | | 01/01/2047 | | | | (18,715,195 | ) | | | 3,165 | |
FNMA, 5.50% | | | 16,400,000 | | | | 01/01/2047 | | | | (18,230,906 | ) | | | 11,532 | |
FNMA, 6.00% | | | 3,300,000 | | | | 01/01/2047 | | | | (3,736,735 | ) | | | 2,062 | |
GNMA, 3.00% | | | 21,800,000 | | | | 01/01/2047 | | | | (22,072,925 | ) | | | (17,457 | ) |
GNMA, 4.00% | | | 53,499,000 | | | | 01/01/2047 | | | | (56,814,472 | ) | | | (5,222 | ) |
| | | | | | | | | | | | | | | | |
Total (proceeds $141,998,727) | | | | | | | | | | | $ (142,038,159 | ) | | | $ (39,432 | ) |
| | | | | | | | | | | | | | | | |
At December 31, 2016, the aggregate market value of TBA Sale Commitments Outstanding represents (5.7)% of total net assets.
|
| Hartford Total Return Bond HLS Fund |
Schedule of Investments – (continued)
December 31, 2016
| | | | | | | | | | | | | | | | | | | | | | | | | | | | | | | | | | | | |
| OTC Credit Default Swap Contracts Outstanding at December 31, 2016 | |
Reference Entity | | Counter-
party | | | Notional
Amount(a) | | | (Pay)/Receive
Fixed
Rate/Implied
Credit Spread(b) | | | Expiration
Date | | | Upfront
Premiums
Paid | | | Upfront
Premiums
Received | | | Market
Value† | | | Unrealized
Appreciation/
(Depreciation) | |
Credit default swaps on indices: | | | | | | | | | | | | | | | | | | | | | | | | | | | | | |
Buy protection: | |
ABX.HE.AA.06 | | | MSC | | | | USD | | | | 2,043,195 | | | | (0.32 | %) | | | 07/25/45 | | | $ | 385,317 | | | $ | — | | | $ | 336,472 | | | $ | (48,845 | ) |
ABX.HE.AAA.06 | | | JPM | | | | USD | | | | 110,365 | | | | (0.18 | %) | | | 07/25/45 | | | | 2,438 | | | | — | | | | 2,463 | | | | 25 | |
ABX.HE.AAA.06 | | | MSC | | | | USD | | | | 369,956 | | | | (0.18 | %) | | | 07/25/45 | | | | 8,242 | | | | — | | | | 8,256 | | | | 14 | |
ABX.HE.AAA.06 | | | GSC | | | | USD | | | | 13,213 | | | | (0.18 | %) | | | 07/25/45 | | | | 1,082 | | | | — | | | | 295 | | | | (787 | ) |
ABX.HE.AAA.06 | | | BOA | | | | USD | | | | 134,459 | | | | (0.18 | %) | | | 07/25/45 | | | | 7,311 | | | | — | | | | 3,000 | | | | (4,311 | ) |
ABX.HE.AAA.07 | | | GSC | | | | USD | | | | 1,607,485 | | | | (0.09 | %) | | | 08/25/37 | | | | 369,315 | | | | — | | | | 373,593 | | | | 4,278 | |
ABX.HE.AAA.07 | | | MSC | | | | USD | | | | 2,343,053 | | | | (0.09 | %) | | | 08/25/37 | | | | 569,955 | | | | — | | | | 544,544 | | | | (25,411 | ) |
ABX.HE.AAA.07 | | | CSI | | | | USD | | | | 3,907,480 | | | | (0.09 | %) | | | 08/25/37 | | | | 1,032,228 | | | | — | | | | 908,129 | | | | (124,099 | ) |
ABX.HE.PENAAA.06 | | | MSC | | | | USD | | | | 1,813,720 | | | | (0.11 | %) | | | 05/25/46 | | | | 209,579 | | | | — | | | | 190,237 | | | | (19,342 | ) |
ABX.HE.PENAAA.06 | | | JPM | | | | USD | | | | 2,651,207 | | | | (0.11 | %) | | | 05/25/46 | | | | 305,625 | | | | — | | | | 278,071 | | | | (27,554 | ) |
ABX.HE.PENAAA.06 | | | BOA | | | | USD | | | | 1,155,933 | | | | (0.11 | %) | | | 05/25/46 | | | | 262,975 | | | | — | | | | 121,240 | | | | (141,735 | ) |
ABX.HE.PENAAA.06 | | | GSC | | | | USD | | | | 1,088,232 | | | | (0.11 | %) | | | 05/25/46 | | | | 272,058 | | | | — | | | | 114,142 | | | | (157,916 | ) |
CMBX.NA.A.7 | | | JPM | | | | USD | | | | 2,710,000 | | | | (2.00 | %) | | | 01/17/47 | | | | 105,670 | | | | — | | | | 61,561 | | | | (44,109 | ) |
CMBX.NA.A.9 | | | DEUT | | | | USD | | | | 955,000 | | | | (2.00 | %) | | | 09/17/58 | | | | 48,730 | | | | — | | | | 53,591 | | | | 4,861 | |
CMBX.NA.AA.7 | | | CSI | | | | USD | | | | 110,000 | | | | (1.50 | %) | | | 01/17/47 | | | | 3,458 | | | | — | | | | 1,307 | | | | (2,151 | ) |
CMBX.NA.AA.7 | | | CSI | | | | USD | | | | 3,315,000 | | | | (1.50 | %) | | | 01/17/47 | | | | 104,198 | | | | — | | | | 39,384 | | | | (64,814 | ) |
CMBX.NA.AA.7 | | | CSI | | | | USD | | | | 3,315,000 | | | | (1.50 | %) | | | 01/17/47 | | | | 104,198 | | | | — | | | | 39,384 | | | | (64,814 | ) |
CMBX.NA.AA.7 | | | CSI | | | | USD | | | | 3,845,000 | | | | (1.50 | %) | | | 01/17/47 | | | | 120,857 | | | | — | | | | 45,680 | | | | (75,177 | ) |
CMBX.NA.AA.8 | | | MSC | | | | USD | | | | 1,410,000 | | | | (1.50 | %) | | | 10/17/57 | | | | 57,115 | | | | — | | | | 33,123 | | | | (23,992 | ) |
CMBX.NA.AAA.8 | | | MSC | | | | USD | | | | 665,000 | | | | (0.50 | %) | | | 10/17/57 | | | | 17,554 | | | | — | | | | 7,590 | | | | (9,964 | ) |
CMBX.NA.AAA.8 | | | MSC | | | | USD | | | | 1,545,000 | | | | (0.50 | %) | | | 10/17/57 | | | | 40,182 | | | | — | | | | 17,632 | | | | (22,550 | ) |
CMBX.NA.AJ.4 | | | DEUT | | | | USD | | | | 2,933,974 | | | | (0.96 | %) | | | 02/17/51 | | | | 538,185 | | | | — | | | | 688,029 | | | | 149,844 | |
CMBX.NA.AJ.4 | | | CBK | | | | USD | | | | 2,352,110 | | | | (0.96 | %) | | | 02/17/51 | | | | 418,966 | | | | — | | | | 551,579 | | | | 132,613 | |
CMBX.NA.AJ.4 | | | GSC | | | | USD | | | | 1,074,969 | | | | (0.96 | %) | | | 02/17/51 | | | | 173,507 | | | | — | | | | 251,225 | | | | 77,718 | |
CMBX.NA.AJ.4 | | | CSI | | | | USD | | | | 3,062,181 | | | | (0.96 | %) | | | 02/17/51 | | | | 758,133 | | | | — | | | | 718,093 | | | | (40,040 | ) |
CMBX.NA.AJ.4 | | | MSC | | | | USD | | | | 7,174,677 | | | | (0.96 | %) | | | 02/17/51 | | | | 1,776,486 | | | | — | | | | 1,682,490 | | | | (93,996 | ) |
CMBX.NA.AS.6 | | | CSI | | | | USD | | | | 3,405,000 | | | | (1.00 | %) | | | 05/11/63 | | | | 36,635 | | | | — | | | | (17,355 | ) | | | (53,990 | ) |
CMBX.NA.AS.6 | | | CSI | | | | USD | | | | 4,150,000 | | | | (1.00 | %) | | | 05/11/63 | | | | 44,650 | | | | — | | | | (21,153 | ) | | | (65,803 | ) |
CMBX.NA.AS.7 | | | CBK | | | | USD | | | | 2,900,000 | | | | (1.00 | %) | | | 01/17/47 | | | | 63,826 | | | | — | | | | (428 | ) | | | (64,254 | ) |
CMBX.NA.AS.7 | | | GSC | | | | USD | | | | 2,340,000 | | | | (1.00 | %) | | | 01/17/47 | | | | 66,544 | | | | — | | | | (216 | ) | | | (66,760 | ) |
CMBX.NA.AS.7 | | | CSI | | | | USD | | | | 4,140,000 | | | | (1.00 | %) | | | 01/17/47 | | | | 75,957 | | | | — | | | | (611 | ) | | | (76,568 | ) |
CMBX.NA.AS.8 | | | DEUT | | | | USD | | | | 1,115,000 | | | | (1.00 | %) | | | 10/17/57 | | | | 82,139 | | | | — | | | | 7,671 | | | | (74,468 | ) |
CMBX.NA.BBB.7 | | | GSC | | | | USD | | | | 1,240,000 | | | | (3.00 | %) | | | 01/17/47 | | | | 107,628 | | | | — | | | | 69,809 | | | | (37,819 | ) |
CMBX.NA.BBB.7 | | | CSI | | | | USD | | | | 1,700,000 | | | | (3.00 | %) | | | 01/17/47 | | | | 166,127 | | | | — | | | | 95,706 | | | | (70,421 | ) |
CMBX.NA.BBB.7 | | | CSI | | | | USD | | | | 1,985,000 | | | | (3.00 | %) | | | 01/17/47 | | | | 193,977 | | | | — | | | | 111,750 | | | | (82,227 | ) |
CMBX.NA.BBB.7 | | | MSC | | | | USD | | | | 2,075,000 | | | | (3.00 | %) | | | 01/17/47 | | | | 214,704 | | | | — | | | | 116,817 | | | | (97,887 | ) |
CMBX.NA.BBB.7 | | | CSI | | | | USD | | | | 265,000 | | | | (3.00 | %) | | | 01/17/47 | | | | 22,787 | | | | — | | | | 14,919 | | | | (7,868 | ) |
CMBX.NA.BBB.7 | | | DEUT | | | | USD | | | | 900,000 | | | | (3.00 | %) | | | 01/17/47 | | | | 66,133 | | | | — | | | | 50,667 | | | | (15,466 | ) |
CMBX.NA.BBB.7 | | | GSC | | | | USD | | | | 705,000 | | | | (3.00 | %) | | | 01/17/47 | | | | 63,986 | | | | — | | | | 39,807 | | | | (24,179 | ) |
CMBX.NA.BBB.7 | | | MSC | | | | USD | | | | 1,250,000 | | | | (3.00 | %) | | | 01/17/47 | | | | 104,245 | | | | — | | | | 70,372 | | | | (33,873 | ) |
CMBX.NA.BBB.7 | | | DEUT | | | | USD | | | | 920,000 | | | | (3.00 | %) | | | 01/17/47 | | | | 88,210 | | | | — | | | | 51,793 | | | | (36,417 | ) |
CMBX.NA.BBB.7 | | | GSC | | | | USD | | | | 1,410,000 | | | | (3.00 | %) | | | 01/17/47 | | | | 135,433 | | | | — | | | | 79,379 | | | | (56,054 | ) |
CMBX.NA.BBB.7 | | | GSC | | | | USD | | | | 1,555,000 | | | | (3.00 | %) | | | 01/17/47 | | | | 145,922 | | | | — | | | | 87,543 | | | | (58,379 | ) |
CMBX.NA.BBB.7 | | | DEUT | | | | USD | | | | 950,000 | | | | (3.00 | %) | | | 01/17/47 | | | | 118,828 | | | | — | | | | 53,482 | | | | (65,346 | ) |
CMBX.NA.BBB.7 | | | CSI | | | | USD | | | | 2,020,000 | | | | (3.00 | %) | | | 01/17/47 | | | | 182,307 | | | | — | | | | 113,720 | | | | (68,587 | ) |
CMBX.NA.BBB.7 | | | GSC | | | | USD | | | | 905,000 | | | | (3.00 | %) | | | 01/17/47 | | | | 126,975 | | | | — | | | | 50,949 | | | | (76,026 | ) |
CMBX.NA.BBB.7 | | | MSC | | | | USD | | | | 7,150,000 | | | | (3.00 | %) | | | 01/17/47 | | | | 698,772 | | | | — | | | | 402,525 | | | | (296,247 | ) |
| | | | | | | | | | | | | | | | | | | | | | | | | | | | | | | | | | | | |
Total | | | | | | | | | | | | | | | | | | | | | | $ | 10,499,149 | | | $ | — | | | $ | 8,448,256 | | | $ | (2,050,893 | ) |
| | | | | | | | | | | | | | | | | | | | | | | | | | | | | | | | | | | | |
Sell protection: | |
CDX.EM.26 | | | BCLY | | | | USD | | | | 7,710,000 | | | | 1.00 | % | | | 12/20/21 | | | $ | — | | | $ | (589,515 | ) | | $ | (477,238 | ) | | $ | 112,277 | |
CDX.EM.26 | | | BCLY | | | | USD | | | | 5,143,000 | | | | 1.00 | % | | | 12/20/21 | | | | — | | | | (426,021 | ) | | | (318,344 | ) | | | 107,677 | |
CDX.EM.26 | | | BCLY | | | | USD | | | | 7,719,000 | | | | 1.00 | % | | | 12/20/21 | | | | — | | | | (572,889 | ) | | | (477,794 | ) | | | 95,095 | |
CMBX.NA.A.6 | | | GSC | | | | USD | | | | 1,915,000 | | | | 2.00 | % | | | 05/11/63 | | | | 24,998 | | | | — | | | | (39,356 | ) | | | (64,354 | ) |
CMBX.NA.AAA.6 | | | JPM | | | | USD | | | | 30,046,676 | | | | 0.50 | % | | | 05/11/63 | | | | — | | | | (1,224,770 | ) | | | (9,432 | ) | | | 1,215,338 | |
CMBX.NA.AAA.6 | | | UBS | | | | USD | | | | 15,702,514 | | | | 0.50 | % | | | 05/11/63 | | | | — | | | | (418,343 | ) | | | (4,929 | ) | | | 413,414 | |
The accompanying notes are an integral part of these financial statements.
|
| Hartford Total Return Bond HLS Fund |
Schedule of Investments – (continued)
December 31, 2016
| | | | | | | | | | | | | | | | | | | | | | | | | | | | | | | | | | | | |
| OTC Credit Default Swap Contracts Outstanding at December 31, 2016 - (continued) | |
Reference Entity | | Counter-
party | | | Notional
Amount(a) | | | (Pay)/Receive
Fixed
Rate/Implied
Credit Spread(b) | | | Expiration
Date | | | Upfront
Premiums
Paid | | | Upfront
Premiums
Received | | | Market Value† | | | Unrealized
Appreciation/
(Depreciation) | |
Credit default swaps on indices: – (continued) | | | | | | | | | |
Sell protection: – (continued) | | | | | | | | | | | | | | | | | | | | | | | | | | | | | |
CMBX.NA.AAA.6 | | | JPM | | | | USD | | | | 8,146,117 | | | | 0.50 | % | | | 05/11/63 | | | $ | — | | | $ | (256,157 | ) | | $ | (2,557 | ) | | $ | 253,600 | |
CMBX.NA.AAA.6 | | | UBS | | | | USD | | | | 6,626,841 | | | | 0.50 | % | | | 05/11/63 | | | | — | | | | (212,245 | ) | | | (2,080 | ) | | | 210,165 | |
CMBX.NA.AAA.6 | | | MLI | | | | USD | | | | 5,847,212 | | | | 0.50 | % | | | 05/11/63 | | | | — | | | | (190,863 | ) | | | (1,835 | ) | | | 189,028 | |
CMBX.NA.AAA.6 | | | MLI | | | | USD | | | | 5,975,152 | | | | 0.50 | % | | | 05/11/63 | | | | — | | | | (190,618 | ) | | | (1,875 | ) | | | 188,743 | |
CMBX.NA.AAA.6 | | | MLI | | | | USD | | | | 5,707,279 | | | | 0.50 | % | | | 05/11/63 | | | | — | | | | (188,669 | ) | | | (1,791 | ) | | | 186,878 | |
CMBX.NA.AAA.6 | | | GSC | | | | USD | | | | 14,802,943 | | | | 0.50 | % | | | 05/11/63 | | | | — | | | | (171,134 | ) | | | (4,647 | ) | | | 166,487 | |
CMBX.NA.AAA.6 | | | MLI | | | | USD | | | | 5,502,377 | | | | 0.50 | % | | | 05/11/63 | | | | — | | | | (126,089 | ) | | | (1,727 | ) | | | 124,362 | |
CMBX.NA.AAA.6 | | | MLI | | | | USD | | | | 2,853,640 | | | | 0.50 | % | | | 05/11/63 | | | | — | | | | (96,814 | ) | | | (895 | ) | | | 95,919 | |
CMBX.NA.AAA.6 | | | DEUT | | | | USD | | | | 3,608,280 | | | | 0.50 | % | | | 05/11/63 | | | | — | | | | (87,951 | ) | | | (1,133 | ) | | | 86,818 | |
CMBX.NA.AAA.6 | | | CSI | | | | USD | | | | 2,633,744 | | | | 0.50 | % | | | 05/11/63 | | | | — | | | | (61,956 | ) | | | (827 | ) | | | 61,129 | |
CMBX.NA.AAA.6 | | | CSI | | | | USD | | | | 2,633,744 | | | | 0.50 | % | | | 05/11/63 | | | | — | | | | (61,880 | ) | | | (826 | ) | | | 61,054 | |
CMBX.NA.AAA.6 | | | CSI | | | | USD | | | | 1,659,209 | | | | 0.50 | % | | | 05/11/63 | | | | — | | | | (60,682 | ) | | | (521 | ) | | | 60,161 | |
CMBX.NA.AAA.6 | | | GSC | | | | USD | | | | 1,829,128 | | | | 0.50 | % | | | 05/11/63 | | | | — | | | | (58,317 | ) | | | (574 | ) | | | 57,743 | |
CMBX.NA.AAA.6 | | | MSC | | | | USD | | | | 2,518,799 | | | | 0.50 | % | | | 05/11/63 | | | | — | | | | (58,521 | ) | | | (791 | ) | | | 57,730 | |
CMBX.NA.AAA.6 | | | DEUT | | | | USD | | | | 1,569,252 | | | | 0.50 | % | | | 05/11/63 | | | | — | | | | (52,818 | ) | | | (493 | ) | | | 52,325 | |
CMBX.NA.AAA.6 | | | MSC | | | | USD | | | | 1,334,364 | | | | 0.50 | % | | | 05/11/63 | | | | — | | | | (44,912 | ) | | | (419 | ) | | | 44,493 | |
CMBX.NA.AAA.6 | | | MLI | | | | USD | | | | 1,718,181 | | | | 0.50 | % | | | 05/11/63 | | | | — | | | | (40,369 | ) | | | (539 | ) | | | 39,830 | |
CMBX.NA.AAA.6 | | | MSC | | | | USD | | | | 989,528 | | | | 0.50 | % | | | 05/11/63 | | | | — | | | | (32,873 | ) | | | (310 | ) | | | 32,563 | |
CMBX.NA.AAA.6 | | | GSC | | | | USD | | | | 819,609 | | | | 0.50 | % | | | 05/11/63 | | | | — | | | | (27,569 | ) | | | (257 | ) | | | 27,312 | |
CMBX.NA.AAA.6 | | | MSC | | | | USD | | | | 3,468,347 | | | | 0.50 | % | | | 05/11/63 | | | | — | | | | (27,638 | ) | | | (1,089 | ) | | | 26,549 | |
CMBX.NA.AAA.6 | | | MSC | | | | USD | | | | 1,064,493 | | | | 0.50 | % | | | 05/11/63 | | | | — | | | | (25,011 | ) | | | (335 | ) | | | 24,676 | |
CMBX.NA.AAA.6 | | | GSC | | | | USD | | | | 609,709 | | | | 0.50 | % | | | 05/11/63 | | | | — | | | | (20,079 | ) | | | (192 | ) | | | 19,887 | |
CMBX.NA.AAA.6 | | | MSC | | | | USD | | | | 1,734,173 | | | | 0.50 | % | | | 05/11/63 | | | | — | | | | (14,321 | ) | | | (544 | ) | | | 13,777 | |
CMBX.NA.BB.6 | | | MSC | | | | USD | | | | 5,315,000 | | | | 5.00 | % | | | 05/11/63 | | | | — | | | | (983,643 | ) | | | (698,610 | ) | | | 285,033 | |
CMBX.NA.BB.6 | | | CSI | | | | USD | | | | 2,800,000 | | | | 5.00 | % | | | 05/11/63 | | | | — | | | | (518,164 | ) | | | (368,036 | ) | | | 150,128 | |
CMBX.NA.BB.6 | | | CSI | | | | USD | | | | 2,795,000 | | | | 5.00 | % | | | 05/11/63 | | | | — | | | | (517,238 | ) | | | (367,378 | ) | | | 149,860 | |
CMBX.NA.BB.6 | | | CSI | | | | USD | | | | 2,795,000 | | | | 5.00 | % | | | 05/11/63 | | | | — | | | | (517,238 | ) | | | (367,378 | ) | | | 149,860 | |
CMBX.NA.BB.6 | | | CSI | | | | USD | | | | 2,795,000 | | | | 5.00 | % | | | 05/11/63 | | | | — | | | | (517,238 | ) | | | (367,378 | ) | | | 149,860 | |
CMBX.NA.BB.6 | | | GSC | | | | USD | | | | 881,000 | | | | 5.00 | % | | | 05/11/63 | | | | — | | | | (102,868 | ) | | | (115,800 | ) | | | (12,932 | ) |
CMBX.NA.BB.6 | | | GSC | | | | USD | | | | 2,855,000 | | | | 5.00 | % | | | 05/11/63 | | | | — | | | | (314,143 | ) | | | (375,264 | ) | | | (61,121 | ) |
CMBX.NA.BB.8 | | | MSC | | | | USD | | | | 5,083,000 | | | | 5.00 | % | | | 10/17/57 | | | | — | | | | (1,432,970 | ) | | | (1,267,833 | ) | | | 165,137 | |
CMBX.NA.BB.8 | | | CSI | | | | USD | | | | 2,507,000 | | | | 5.00 | % | | | 10/17/57 | | | | — | | | | (706,712 | ) | | | (625,311 | ) | | | 81,401 | |
CMBX.NA.BB.8 | | | CSI | | | | USD | | | | 2,490,000 | | | | 5.00 | % | | | 10/17/57 | | | | — | | | | (701,920 | ) | | | (621,071 | ) | | | 80,849 | |
CMBX.NA.BB.8 | | | GSC | | | | USD | | | | 910,000 | | | | 5.00 | % | | | 10/17/57 | | | | — | | | | (278,905 | ) | | | (226,978 | ) | | | 51,927 | |
CMBX.NA.BB.8 | | | MSC | | | | USD | | | | 865,000 | | | | 5.00 | % | | | 10/17/57 | | | | — | | | | (250,719 | ) | | | (215,753 | ) | | | 34,966 | |
CMBX.NA.BB.8 | | | CSI | | | | USD | | | | 1,070,000 | | | | 5.00 | % | | | 10/17/57 | | | | — | | | | (301,628 | ) | | | (266,886 | ) | | | 34,742 | |
CMBX.NA.BB.8 | | | GSC | | | | USD | | | | 655,000 | | | | 5.00 | % | | | 10/17/57 | | | | — | | | | (195,086 | ) | | | (163,375 | ) | | | 31,711 | |
CMBX.NA.BB.8 | | | MSC | | | | USD | | | | 740,000 | | | | 5.00 | % | | | 10/17/57 | | | | — | | | | (214,175 | ) | | | (184,575 | ) | | | 29,600 | |
CMBX.NA.BB.8 | | | GSC | | | | USD | | | | 360,000 | | | | 5.00 | % | | | 10/17/57 | | | | — | | | | (101,024 | ) | | | (89,793 | ) | | | 11,231 | |
CMBX.NA.BB.8 | | | JPM | | | | USD | | | | 770,000 | | | | 5.00 | % | | | 10/17/57 | | | | — | | | | (171,387 | ) | | | (192,058 | ) | | | (20,671 | ) |
CMBX.NA.BB.8 | | | GSC | | | | USD | | | | 915,000 | | | | 5.00 | % | | | 10/17/57 | | | | — | | | | (145,605 | ) | | | (228,226 | ) | | | (82,621 | ) |
CMBX.NA.BB.8 | | | GSC | | | | USD | | | | 965,000 | | | | 5.00 | % | | | 10/17/57 | | | | — | | | | (97,902 | ) | | | (240,696 | ) | | | (142,794 | ) |
CMBX.NA.BB.8 | | | MLI | | | | USD | | | | 1,350,000 | | | | 5.00 | % | | | 10/17/57 | | | | — | | | | (171,451 | ) | | | (336,726 | ) | | | (165,275 | ) |
CMBX.NA.BB.8 | | | GSC | | | | USD | | | | 1,280,000 | | | | 5.00 | % | | | 10/17/57 | | | | — | | | | (149,633 | ) | | | (319,265 | ) | | | (169,632 | ) |
CMBX.NA.BB.8 | | | UBS | | | | USD | | | | 1,455,000 | | | | 5.00 | % | | | 10/17/57 | | | | — | | | | (166,297 | ) | | | (362,915 | ) | | | (196,618 | ) |
CMBX.NA.BB.8 | | | BOA | | | | USD | | | | 2,095,000 | | | | 5.00 | % | | | 10/17/57 | | | | — | | | | (145,445 | ) | | | (522,548 | ) | | | (377,103 | ) |
CMBX.NA.BB.9 | | | GSC | | | | USD | | | | 1,350,000 | | | | 5.00 | % | | | 09/15/58 | | | | — | | | | (373,815 | ) | | | (295,244 | ) | | | 78,571 | |
CMBX.NA.BB.9 | | | GSC | | | | USD | | | | 675,000 | | | | 5.00 | % | | | 09/15/58 | | | | — | | | | (186,908 | ) | | | (147,622 | ) | | | 39,286 | |
CMBX.NA.BB.9 | | | GSC | | | | USD | | | | 675,000 | | | | 5.00 | % | | | 09/15/58 | | | | — | | | | (185,294 | ) | | | (147,622 | ) | | | 37,672 | |
CMBX.NA.BB.9 | | | MLI | | | | USD | | | | 675,000 | | | | 5.00 | % | | | 09/17/58 | | | | — | | | | (188,829 | ) | | | (147,622 | ) | | | 41,207 | |
CMBX.NA.BB.9 | | | JPM | | | | USD | | | | 720,000 | | | | 5.00 | % | | | 09/17/58 | | | | — | | | | (195,999 | ) | | | (157,464 | ) | | | 38,535 | |
CMBX.NA.BB.9 | | | MLI | | | | USD | | | | 665,000 | | | | 5.00 | % | | | 09/17/58 | | | | — | | | | (181,026 | ) | | | (145,435 | ) | | | 35,591 | |
CMBX.NA.BBB.6 | | | MSC | | | | USD | | | | 465,000 | | | | 3.00 | % | | | 05/11/63 | | | | — | | | | (41,209 | ) | | | (26,171 | ) | | | 15,038 | |
CMBX.NA.BBB.8 | | | GSC | | | | USD | | | | 2,850,000 | | | | 3.00 | % | | | 10/17/57 | | | | — | | | | (415,919 | ) | | | (402,289 | ) | | | 13,630 | |
PrimeX.ARM.2 | | | MSC | | | | USD | | | | 3,283,895 | | | | 4.58 | % | | | 12/25/37 | | | | 121,039 | | | | — | | | | 45,809 | | | | (75,230 | ) |
| | | | | | | | | | | | | | | | | | | | | | | | | | | | | | | | | | | | |
Total | | | | | | | | | | | | | | | | | | | | | | $ | 146,037 | | | $ | (15,809,414 | ) | | $ | (11,300,863 | ) | | $ | 4,362,514 | |
| | | | | | | | | | | | | | | | | | | | | | | | | | | | | | | | | | | | |
Total traded indices | | | | | | | | | | | $ | 10,645,186 | | | $ | (15,809,414 | ) | | $ | (2,852,607 | ) | | $ | 2,311,621 | |
| | | | | | | | | | | | | | | | | | | | | | | | | | | | | | | | | | | | |
|
| Hartford Total Return Bond HLS Fund |
Schedule of Investments – (continued)
December 31, 2016
| | | | | | | | | | | | | | | | | | | | | | | | | | | | | | | | | | | | |
| OTC Credit Default Swap Contracts Outstanding at December 31, 2016 - (continued) | |
Reference Entity | | Counter-
party | | | Notional
Amount(a) | | | (Pay)/Receive
Fixed
Rate/Implied
Credit Spread(b) | | | Expiration
Date | | | Upfront
Premiums
Paid | | | Upfront
Premiums
Received | | | Market
Value† | | | Unrealized
Appreciation/
(Depreciation) | |
Credit default swaps on single-name issues: | | | | | | | | | | | | | | | | | | | | | | | | | |
Sell protection: | | | | | | | | | | | | | | | | | | | | | | | | | |
Brazil (Federated Republic of) | | | GSC | | | | USD | | | | 1,495,000 | | | | 1.00%/2.74% | | | | 12/20/21 | | | $ | — | | | $ | (121,502 | ) | | $ | (117,706 | ) | | $ | 3,796 | |
Brazil (Federated Republic of) | | | GSC | | | | USD | | | | 1,490,000 | | | | 1.00%/2.74% | | | | 12/20/21 | | | | — | | | | (120,650 | ) | | | (117,312 | ) | | | 3,338 | |
| | | | | | | | | | | | | | | | | | | | | | | | | | | | | | | | | | | | |
Total | | | | | | | | | | | | | | | | | | | | | | $ | — | | | $ | (242,152 | ) | | $ | (235,018 | ) | | $ | 7,134 | |
| | | | | | | | | | | | | | | | | | | | | | | | | | | | | | | | | | | | |
Total single-name issues | | | $ | — | | | $ | (242,152 | ) | | $ | (235,018 | ) | | $ | 7,134 | |
| | | | | | | | | | | | | | | | | | | | | | | | | | | | | | | | | | | | |
Total OTC contracts | | | $ | 10,645,186 | | | $ | (16,051,566 | ) | | $ | (3,087,625 | ) | | $ | 2,318,755 | |
| | | | | | | | | | | | | | | | | | | | | | | | | | | | | | | | | | | | |
| (a) | The maximum potential amount the Fund could be required to pay as a seller of credit protection or receive as a buyer of credit protection if a credit event occurs as defined under the terms of that particular swap agreement. |
| (b) | Implied credit spreads, represented in absolute terms, utilized in determining the market value of credit default swap agreements on corporate issues, U.S. municipal issues or sovereign government issues as of period end serve as an indicator of the current status of the payment/performance risk and represent the likelihood or risk of default for the credit derivative. The implied credit spread of a particular entity reflects the cost of buying/selling protection and may include upfront payments required to be made to enter into the agreement. Wider credit spreads represent a deterioration of the reference entity’s credit soundness and a greater likelihood or risk of default or other credit event occurring as defined under the terms of the agreement. The percentage shown is the implied credit spread on December 31, 2016. For credit default swap agreements on indices, the quoted market prices and resulting values serve as the indicator of the current status of the payment/performance risk. Credit spreads are unaudited. |
| | | | | | | | | | | | | | | | | | | | | | | | | | | | |
| Centrally Cleared Credit Default Swap Contracts Outstanding at December 31, 2016 | |
Reference Entity | | Notional
Amount(a) | | | (Pay)/Receive
Fixed Rate | | | Expiration
Date | | | Cost Basis | | | Market
Value† | | | Unrealized
Appreciation/
(Depreciation) | |
Credit default swaps on indices: | | | | | | | | | | | | | | | | | |
Buy protection: | | | | | | | | | | | | | | | | | |
CDX.NA.HY.27 | | | USD | | | | 50,515,000 | | | | (5.00 | %) | | | 12/20/21 | | | $ | (1,774,633 | ) | | $ | (3,126,196 | ) | | $ | (1,351,563 | ) |
| | | | | | | | | | | | | | | | | | | | | | | | | | | | |
Credit default swaps on indices: | | | | | | | | | | | | | | | | | |
Sell protection: | | | | | | | | | | | | | | | | | |
CDX.NA.HY.27 | | | USD | | | | 11,409,000 | | | | 5.00 | % | | | 12/20/21 | | | $ | 678,096 | | | $ | 706,062 | | | $ | 27,966 | |
CDX.NA.IG.27 | | | USD | | | | 25,897,000 | | | | 1.00 | % | | | 12/20/21 | | | | 331,506 | | | | 397,359 | | | | 65,853 | |
ITRAXX.EUR.26 | | | EUR | | | | 36,290,000 | | | | 1.00 | % | | | 12/20/21 | | | | 389,617 | | | | 525,350 | | | | 135,733 | |
ITRAXX.XOV.26 | | | EUR | | | | 15,123,000 | | | | 5.00 | % | | | 12/20/21 | | | | 1,130,141 | | | | 1,501,034 | | | | 370,893 | |
| | | | | | | | | | | | | | | | | | | | | | | | | | | | |
Total | | | $ | 2,529,360 | | | $ | 3,129,805 | | | $ | 600,445 | |
| | | | | | | | | | | | | | | | | | | | | | | | | | | | |
Total | | | $ | 754,727 | | | $ | 3,609 | | | $ | (751,118 | ) |
| | | | | | | | | | | | | | | | | | | | | | | | | | | | |
| (a) | The maximum potential amount the Fund could be required to pay as a seller of credit protection or receive as a buyer of credit protection if a credit event occurs as defined under the terms of that particular swap agreement. |
| | | | | | | | | | | | | | | | | | | | | | | | | | | | | | | | | | | | |
| OTC Interest Rate Swap Contracts Outstanding at December 31, 2016 | |
Counterparty | | Payments made
by Fund | | Payments received
by Fund | | Notional Amount | | | Expiration
Date | | | Upfront
Premiums
Paid | | | Upfront
Premiums
Received | | | Market
Value† | | | Unrealized
Appreciation/
(Depreciation) | |
BOA | | 1.81% Fixed | | CPURNSA | | USD | | | 35,710,000 | | | | 09/04/25 | | | $ | — | | | $ | — | | | $ | 1,031,036 | | | $ | 1,031,036 | |
BOA | | 1.82% Fixed | | CPURNSA | | USD | | | 39,085,000 | | | | 09/22/25 | | | | — | | | | — | | | | 1,107,612 | | | | 1,107,612 | |
GSC | | CPURNSA | | 6.26% Fixed | | INR | | | 348,020,000 | | | | 09/12/21 | | | | — | | | | — | | | | 6,568 | | | | 6,568 | |
| | | | | | | | | | | | | | | | | | | | | | | | | | | | | | | | | | | | |
Total | | | $ | — | | | $ | — | | | $ | 2,145,216 | | | $ | 2,145,216 | |
| | | | | | | | | | | | | | | | | | | | | | | | | | | | | | | | | | | | |
The accompanying notes are an integral part of these financial statements.
|
| Hartford Total Return Bond HLS Fund |
Schedule of Investments – (continued)
December 31, 2016
| | | | | | | | | | | | | | | | | | | | | | | | | | | | | | | | |
| Centrally Cleared Interest Rate Swap Contracts Outstanding at December 31, 2016 | |
Payments made
by Fund | | Payments received
by Fund | | Notional Amount | | Expiration
Date | | | Upfront
Premiums
Paid | | | Upfront
Premiums
Received | | | Market
Value† | | | Unrealized
Appreciation/
(Depreciation) | |
12M Federal Funds Rate | | 1.62% Fixed | | USD | | 13,700,000 | | | 11/14/26 | | | $ | — | | | $ | — | | | $ | 170,826 | | | $ | 170,826 | |
3M USD LIBOR | | 1.75% Fixed | | USD | | 15,625,000 | | | 03/15/27 | | | | — | | | | (442,500 | ) | | | 885,292 | | | | 1,327,792 | |
| | | | | | | | | | | | | | | | | | | | | | | | | | | | | | | | |
Total | | | $ | — | | | $ | (442,500 | ) | | $ | 1,056,118 | | | $ | 1,498,618 | |
| | | | | | | | | | | | | | | | | |
| | | | | | | | | | | | | | | | | | | | |
|
| Foreign Currency Contracts Outstanding at December 31, 2016 | |
Currency | | Buy / Sell | | Delivery Date | | | Counterparty | | Contract
Amount | | | Market Value† | | | Unrealized
Appreciation/
(Depreciation) | |
BRL | | Sell | | | 03/15/17 | | | GSC | | $ | 2,532,431 | | | $ | 2,590,575 | | | $ | (58,144 | ) |
BRL | | Sell | | | 03/15/17 | | | SSG | | | 13,866,856 | | | | 14,403,888 | | | | (537,032 | ) |
COP | | Sell | | | 03/15/17 | | | SSG | | | 3,775,876 | | | | 3,778,856 | | | | (2,980 | ) |
EUR | | Buy | | | 03/15/17 | | | BOA | | | 962,014 | | | | 887,602 | | | | (74,412 | ) |
EUR | | Buy | | | 03/15/17 | | | BOA | | | 1,283,414 | | | | 1,183,470 | | | | (99,944 | ) |
EUR | | Buy | | | 03/15/17 | | | CBK | | | 2,369,850 | | | | 2,255,990 | | | | (113,860 | ) |
EUR | | Buy | | | 03/15/17 | | | UBS | | | 1,622,468 | | | | 1,495,188 | | | | (127,280 | ) |
EUR | | Sell | | | 01/31/17 | | | NAB | | | 544,217 | | | | 543,011 | | | | 1,206 | |
EUR | | Sell | | | 01/31/17 | | | BCLY | | | 16,270,284 | | | | 16,412,642 | | | | (142,358 | ) |
EUR | | Sell | | | 03/15/17 | | | BOA | | | 5,923,641 | | | | 5,822,249 | | | | 101,392 | |
EUR | | Sell | | | 03/15/17 | | | MSC | | | 4,501,927 | | | | 4,451,748 | | | | 50,179 | |
GBP | | Sell | | | 01/31/17 | | | BOA | | | 3,604,469 | | | | 3,588,193 | | | | 16,276 | |
JPY | | Sell | | | 01/11/17 | | | CBK | | | 26,563,632 | | | | 23,548,585 | | | | 3,015,047 | |
MXN | | Sell | | | 03/15/17 | | | JPM | | | 4,734,909 | | | | 4,536,848 | | | | 198,061 | |
RON | | Sell | | | 06/26/17 | | | CBK | | | 10,639,254 | | | | 9,921,580 | | | | 717,674 | |
RON | | Sell | | | 08/28/17 | | | JPM | | | 3,319,296 | | | | 3,029,985 | | | | 289,311 | |
RON | | Sell | | | 08/28/17 | | | BNP | | | 2,003,824 | | | | 1,831,271 | | | | 172,553 | |
RUB | | Sell | | | 03/15/17 | | | BCLY | | | 5,086,057 | | | | 5,373,493 | | | | (287,436 | ) |
THB | | Sell | | | 03/15/17 | | | JPM | | | 6,566,751 | | | | 6,527,706 | | | | 39,045 | |
TRY | | Buy | | | 03/15/17 | | | GSC | | | 2,229,453 | | | | 2,217,390 | | | | (12,063 | ) |
TRY | | Buy | | | 03/15/17 | | | BCLY | | | 2,275,699 | | | | 2,217,111 | | | | (58,588 | ) |
TRY | | Sell | | | 03/15/17 | | | HSBC | | | 982,832 | | | | 893,596 | | | | 89,236 | |
TRY | | Sell | | | 03/15/17 | | | BNP | | | 977,654 | | | | 888,574 | | | | 89,080 | |
TRY | | Sell | | | 03/15/17 | | | BCLY | | | 973,909 | | | | 886,621 | | | | 87,288 | |
TRY | | Sell | | | 03/15/17 | | | HSBC | | | 961,112 | | | | 884,668 | | | | 76,444 | |
TRY | | Sell | | | 03/15/17 | | | JPM | | | 947,057 | | | | 881,041 | | | | 66,016 | |
ZAR | | Sell | | | 03/15/17 | | | CBK | | | 720 | | | | 718 | | | | 2 | |
| | | | | | | | | | | | | | | | | | | | |
Total | | | $ | 3,494,713 | |
| | | | | | | | | | | | | | | | | | | | |
| † | See Significant Accounting Policies of accompanying Notes to Financial Statements regarding valuation of investments. |
The accompanying notes are an integral part of these financial statements.
|
| Hartford Total Return Bond HLS Fund |
Schedule of Investments – (continued)
December 31, 2016
| | |
| GLOSSARY: (abbreviations used in preceding Schedule of Investments) |
|
| Counterparty Abbreviations: |
BCLY | | Barclays |
BNP | | BNP Paribas Securities Services |
BOA | | Banc of America Securities LLC |
CBK | | Citibank NA |
CSI | | Credit Suisse International |
DEUT | | Deutsche Bank Securities, Inc. |
GSC | | Goldman Sachs & Co. |
HSBC | | HSBC Bank USA |
JPM | | JP Morgan Chase & Co. |
MLI | | Merrill Lynch International |
MSC | | Morgan Stanley |
NAB | | National Australia Bank Limited |
SSG | | State Street Global Markets LLC |
UBS | | UBS AG |
|
| Currency Abbreviations: |
BRL | | Brazilian Real |
COP | | Colombian Peso |
EUR | | Euro |
GBP | | British Pound |
INR | | Indian Rupee |
JPY | | Japanese Yen |
MXN | | Mexican Peso |
RON | | New Romanian Leu |
RUB | | Russian Ruble |
THB | | Thai Baht |
TRY | | Turkish Lira |
USD | | United States Dollar |
ZAR | | South African Rand |
| | |
| Index Abbreviations: |
ABX.HE | | Markit Asset Backed Security Home Equity |
CDX.EM | | Credit Derivatives Emerging Markets |
CDX.NA.HY | | Credit Derivatives North American High Yield |
CDX.NA.IG | | Credit Derivatives North American Investment Grade |
CMBX.NA | | Markit Commercial Mortgage Backed North American |
CPURNSA | | Consumer Price All Urban Non-Seasonally Adjusted |
ITRAXX.EUR | | Markit iTraxx - Europe |
ITRAXX.XOV | | Markit iTraxx Index - Europe Crossover |
PrimeX.ARM | | Markit PrimeX Adjustable Rate Mortgage Backed Security |
|
| Other Abbreviations: |
CDO | | Collateralized Debt Obligation |
CLO | | Collateralized Loan Obligation |
CMO | | Collateralized Mortgage Obligation |
EM | | Emerging Markets |
FHLMC | | Federal Home Loan Mortgage Corp. |
FNMA | | Federal National Mortgage Association |
GNMA | | Government National Mortgage Association |
LIBOR | | London Interbank Offered Rate |
MSCI | | Morgan Stanley Capital International |
OTC | | Over-the-Counter |
TBA | | To Be Announced |
|
| Municipal Abbreviations: |
GO | | General Obligation |
The accompanying notes are an integral part of these financial statements.
|
| Hartford Total Return Bond HLS Fund |
Schedule of Investments – (continued)
December 31, 2016
Fair Valuation Summary
The following is a summary of the fair valuations according to the inputs used as of December 31, 2016 in valuing the Fund’s investments.
| | | | | | | | | | | | | | | | |
| | | Total | | | Level 1(1) | | | Level 2(1) | | | Level 3(1) | |
Assets | | | | | | | | | | | | | | | | |
Asset & Commercial Mortgage Backed Securities | | $ | 751,054,884 | | | $ | — | | | $ | 742,301,884 | | | $ | 8,753,000 | |
Corporate Bonds | | | 845,147,451 | | | | — | | | | 845,147,451 | | | | — | |
Foreign Government Obligations | | | 103,786,326 | | | | — | | | | 103,786,326 | | | | — | |
Municipal Bonds | | | 32,558,299 | | | | — | | | | 32,558,299 | | | | — | |
Senior Floating Rate Interests | | | 127,389,016 | | | | — | | | | 127,389,016 | | | | — | |
U.S. Government Agencies | | | 1,102,349,061 | | | | — | | | | 1,102,349,061 | | | | — | |
U.S. Government Securities | | | 108,960,392 | | | | — | | | | 108,960,392 | | | | — | |
Common Stocks | | | | | | | | | | | | | | | | |
Energy | | | 611,219 | | | | 465,646 | | | | — | | | | 145,573 | |
Utilities | | | 206,755 | | | | 206,754 | | | | — | | | | 1 | |
Preferred Stocks | | | 2,725,095 | | | | 2,725,095 | | | | — | | | | — | |
Short-Term Investments | | | 168,940,358 | | | | 142,599,666 | | | | 26,340,692 | | | | — | |
Purchased Options | | | 13,338 | | | | — | | | | 13,338 | | | | — | |
Foreign Currency Contracts (2) | | | 5,008,810 | | | | — | | | | 5,008,810 | | | | — | |
Futures Contracts (2) | | | 1,053,726 | | | | 1,053,726 | | | | — | | | | — | |
Swaps - Credit Default (2) | | | 6,707,797 | | | | — | | | | 6,707,797 | | | | — | |
Swaps - Interest Rate (2) | | | 3,643,834 | | | | — | | | | 3,643,834 | | | | — | |
| | | | | | | | | | | | | | | | |
Total | | $ | 3,260,156,361 | | | $ | 147,050,887 | | | $ | 3,104,206,900 | | | $ | 8,898,574 | |
| | | | | | | | | | | | | | | | |
Liabilities | | | | | | | | | | | | | | | | |
Foreign Currency Contracts (2) | | $ | (1,514,097 | ) | | $ | — | | | $ | (1,514,097 | ) | | $ | — | |
Futures Contracts (2) | | | (1,049,961 | ) | | | (1,049,961 | ) | | | — | | | | — | |
Swaps - Credit Default (2) | | | (5,140,160 | ) | | | — | | | | (5,140,160 | ) | | | — | |
TBA Sale Commitments | | | (142,038,159 | ) | | | — | | | | (142,038,159 | ) | | | — | |
| | | | | | | | | | | | | | | | |
Total | | $ | (149,742,377 | ) | | $ | (1,049,961 | ) | | $ | (148,692,416 | ) | | $ | — | |
| | | | | | | | | | | | | | | | |
| (1) | For the year ended December 31, 2016, there were no transfers between any levels. |
| (2) | Derivative instruments (excluding purchased and written options, if applicable) are valued at the unrealized appreciation/depreciation on the investments. |
The following is a rollforward of the Fund’s investments that were valued using unobservable inputs (Level 3) for the year ended December 31, 2016:
| | | | | | | | | | | | |
| | | Asset &
Commercial
Mortgage Backed
Securities | | | Common Stocks | | | Total | |
Beginning balance | | $ | — | | | $ | — | | | $ | — | |
Purchases | | | 8,753,000 | | | | 124,644 | | | | 8,877,644 | |
Sales | | | — | | | | — | | | | — | |
Accrued discounts/(premiums) | | | — | | | | — | | | | — | |
Total realized gain/(loss) | | | — | | | | — | | | | — | |
Net change in unrealized appreciation/depreciation | | | — | | | | 20,930 | | | | 20,930 | |
Transfers into Level 3 | | | — | | | | — | | | | — | |
Transfers out of Level 3 | | | — | | | | — | | | | — | |
| | | | | | | | | | | | |
Ending balance | | $ | 8,753,000 | | | $ | 145,574 | | | $ | 8,898,574 | |
| | | | | | | | | | | | |
The change in net unrealized appreciation/depreciation relating to the Level 3 investments held at December 31, 2016 was $20,930.
The accompanying notes are an integral part of these financial statements.
|
| Hartford Ultrashort Bond HLS Fund |
Schedule of Investments
December 31, 2016
| | | | | | | | | | | | |
Shares or Principal Amount | | Market Value† | |
| ASSET & COMMERCIAL MORTGAGE BACKED SECURITIES - 23.8% | |
| | | | | | | Asset-Backed-Automobile - 10.7% | |
| | | | | | | | AmeriCredit Automobile Receivables | |
| | $ | | | | 765,039 | | | 1.26%, 04/08/2019 | | $ | 765,092 | |
| | | | | 1,022,722 | | | 1.26%, 11/08/2019 | | | 1,022,716 | |
| | | | | 1,226,376 | | | 1.42%, 10/08/2019 | | | 1,227,271 | |
| | | | | 505,000 | | | 1.46%, 05/10/2021 | | | 502,468 | |
| | | | | 337,876 | | | 1.52%, 06/10/2019 | | | 338,246 | |
| | | | | | | | Capital Auto Receivables Asset Trust | |
| | | | | 105,922 | | | 0.99%, 10/20/2017 | | | 105,876 | |
| | | | | 2,200,000 | | | 1.62%, 03/20/2019 | | | 2,204,019 | |
| | | | | | | | CarMax Auto Owner Trust | |
| | | | | 887,578 | | | 1.09%, 04/15/2019 | | | 887,477 | |
| | | | | 3,060,000 | | | 1.21%, 11/15/2019 | | | 3,053,927 | |
| | | | | 1,794,587 | | | 1.24%, 06/17/2019 | | | 1,794,788 | |
| | | | | 2,400,000 | | | 1.32%, 07/15/2019 | | | 2,399,841 | |
| | | | | 2,000,000 | | | 1.56%, 11/16/2020 | | | 2,000,761 | |
| | | | | | | | Chesapeake Funding LLC | |
| | | | | 894,297 | | | 1.07%, 03/07/2026(1)(2) | | | 891,224 | |
| | | | | 1,545,000 | | | 1.67%, 03/15/2028(1)(2) | | | 1,555,645 | |
| | | | | | | | Chrysler Capital Auto Receivables Trust | |
| | | | | 805,000 | | | 1.36%, 01/15/2020(2) | | | 803,923 | |
| | | | | 2,000,000 | | | 1.76%, 12/16/2019(2) | | | 2,006,317 | |
| | | | | | | | Enterprise Fleet Financing LLC | |
| | | | | 52,939 | | | 0.87%, 09/20/2019(2) | | | 52,900 | |
| | | | | 635,000 | | | 1.74%, 02/22/2022(2) | | | 633,202 | |
| | | | | | | | Fifth Third Auto Trust | | | | |
| | | | | 1,750,000 | | | 1.42%, 03/16/2020 | | | 1,751,042 | |
| | | | | | | | Ford Credit Auto Lease Trust | | | | |
| | | | | 3,000,000 | | | 1.38%, 12/15/2018 | | | 3,002,861 | |
| | | | | | | | Ford Credit Auto Owner Trust | |
| | | | | 262,586 | | | 0.95%, 08/15/2018 | | | 262,515 | |
| | | | | 2,335,000 | | | 1.04%, 09/15/2019 | | | 2,329,984 | |
| | | | | | | | GM Financial Automobile Leasing Trust | |
| | | | | 957,631 | | | 1.28%, 10/22/2018 | | | 957,382 | |
| | | | | 2,945,000 | | | 1.53%, 09/20/2018 | | | 2,948,979 | |
| | | | | 590,000 | | | 1.61%, 12/20/2019 | | | 588,265 | |
| | | | | 1,010,000 | | | 1.68%, 12/20/2018 | | | 1,012,737 | |
| | | | | 2,000,000 | | | Harley-Davidson Motorcycle Trust
1.41%, 06/15/2020 | | | 2,001,270 | |
| | | | | 1,745,000 | | | Huntington Auto Trust
1.29%, 05/15/2019 | | | 1,744,387 | |
| | | | | 810,000 | | | Hyundai Auto Lease Securitization Trust
1.52%, 10/15/2019(2) | | | 810,139 | |
| | | | | 2,191,722 | | | M&T Bank Automotive Receivables Trust
1.57%, 08/15/2018(2) | | | 2,192,695 | |
| | | | | 1,060,000 | | | Mercedes-Benz Auto Lease Trust
1.15%, 01/15/2019 | | | 1,058,706 | |
| | | | | 1,205,000 | | | Mercedes-Benz Auto Receivables Trust
1.26%, 02/16/2021 | | | 1,195,304 | |
| | | | | | | | Nissan Auto Lease Trust | |
| | | | | 1,258,338 | | | 1.18%, 12/15/2017 | | | 1,258,715 | |
| | | | | 2,939,293 | | | 1.22%, 08/15/2018 | | | 2,939,162 | |
| | | | | 3,000,000 | | | 1.29%, 03/16/2020 | | | 3,001,350 | |
| | | | | 1,315,000 | | | Nissan Auto Receivables Owner Trust
1.05%, 04/15/2019 | | | 1,313,713 | |
| | | | | | | | Prestige Auto Receivables Trust | |
| | | | | 1,635,000 | | | 1.46%, 07/15/2020(2) | | | 1,632,221 | |
| | | | | 1,190,616 | | | 1.78%, 08/15/2019(2) | | | 1,192,286 | |
| | | | | 450,000 | | | Toyota Auto Receivables Owner Trust
1.30%, 04/15/2020 | | | 448,557 | |
| | | | | 1,840,000 | | | Volkswagen Auto Loan Enhanced Trust
1.16%, 03/20/2020 | | | 1,837,805 | |
| | | | | | | | | | | | |
Shares or Principal Amount | | Market Value† | |
| ASSET & COMMERCIAL MORTGAGE BACKED SECURITIES -23.8% - (continued) | |
| | | | | | | Asset-Backed-Automobile - 10.7% - (continued) | |
| | | | | | | | Westlake Automobile Receivables Trust | |
| | $ | | | | 439,031 | | | 1.28%, 07/16/2018(2) | | $ | 439,000 | |
| | | | | 1,245,000 | | | 1.57%, 06/17/2019(2) | | | 1,246,090 | |
| | | | | | | | Wheels SPV LLC | | | | |
| | | | | 66,870 | | | 0.84%, 03/20/2023(2) | | | 66,828 | |
| | | | | 420,000 | | | 1.59%, 05/20/2025(2) | | | 418,572 | |
| | | | | | | | World Omni Auto Receivables Trust | | | | |
| | | | | 829,073 | | | 0.96%, 07/15/2019 | | | 828,574 | |
| | | | | 1,340,000 | | | 1.10%, 01/15/2020 | | | 1,337,006 | |
| | | | | | | | World Omni Automobile Lease Securitization Trust | | | | |
| | | | | 1,374,879 | | | 1.06%, 05/15/2018 | | | 1,373,956 | |
| | | | | 1,635,000 | | | 1.37%, 01/15/2020 | | | 1,635,790 | |
| | | | | | | | | | | | |
| | | | | | | | | | | 65,071,584 | |
| | | | | | | | | | | | |
| | | | | | | Asset-Backed-Credit Card - 6.4% | | | |
| | | | | 1,485,000 | | | American Express Credit Account Master Trust
1.26%, 01/15/2020 | | | 1,485,939 | |
| | | | | 2,995,000 | | | BA Credit Card Trust
1.08%, 06/15/2021(1) | | | 3,002,531 | |
| | | | | | | | Cabela’s Credit Card Master Note Trust | | | | |
| | | | | 1,085,000 | | | 1.05%, 03/16/2020(1) | | | 1,085,099 | |
| | | | | 1,785,000 | | | 1.78%, 06/15/2022 | | | 1,779,902 | |
| | | | | 2,500,000 | | | Capital One Multi-Asset Execution Trust
1.15%, 02/15/2022(1) | | | 2,510,156 | |
| | | | | 2,480,000 | | | CARDS II Trust
1.40%, 07/15/2021(1)(2) | | | 2,489,481 | |
| | | | | | | | Chase Issuance Trust | | | | |
| | | | | 6,000,000 | | | 1.12%, 11/16/2020(1) | | | 6,017,921 | |
| | | | | 2,250,000 | | | 1.27%, 07/15/2021 | | | 2,219,996 | |
| | | | | 2,045,000 | | | Citibank Credit Card Issuance Trust
1.02%, 02/22/2019 | | | 2,044,921 | |
| | | | | 4,750,000 | | | Evergreen Credit Card Trust
1.42%, 04/15/2020(1)(2) | | | 4,771,091 | |
| | | | | 3,125,000 | | | Golden Credit Card Trust
1.20%, 03/15/2019(1)(2) | | | 3,123,986 | |
| | | | | | | | Synchrony Credit Card Master Note Trust | | | | |
| | | | | 2,855,000 | | | 1.60%, 04/15/2021 | | | 2,857,409 | |
| | | | | 3,500,000 | | | 1.61%, 11/15/2020 | | | 3,506,569 | |
| | | | | 2,380,000 | | | Trillium Credit Card Trust II
1.48%, 05/26/2021(1)(2) | | | 2,386,010 | |
| | | | | | | | | | | | |
| | | | | | | | | | | 39,281,011 | |
| | | | | | | | | | | | |
| | | | | | | Asset-Backed-Finance & Insurance - 5.2% | |
| | | | | | | | Ally Master Owner Trust | | | | |
| | | | | 4,380,000 | | | 1.17%, 01/15/2019(1) | | | 4,380,463 | |
| | | | | 2,500,000 | | | 1.19%, 10/15/2019(1) | | | 2,507,343 | |
| | | | | 2,000,000 | | | 1.54%, 09/15/2019 | | | 2,002,845 | |
| | | | | 3,275,000 | | | 1.60%, 10/15/2019 | | | 3,280,057 | |
| | | | | | | | CNH Equipment Trust | | | | |
| | | | | 1,520,000 | | | 1.26%, 02/18/2020 | | | 1,517,736 | |
| | | | | 1,185,000 | | | 1.31%, 10/15/2019 | | | 1,185,100 | |
| | | | | | | | Ford Credit Floorplan Master Owner Trust | | | | |
| | | | | 2,105,000 | | | 1.10%, 02/15/2019(1) | | | 2,105,360 | |
| | | | | 1,745,000 | | | 1.23%, 07/15/2020(1) | | | 1,749,260 | |
| | | | | 1,380,000 | | | 1.30%, 08/15/2020(1) | | | 1,385,921 | |
| | | | | 1,150,000 | | | GMF Floorplan Owner Revolving Trust
1.04%, 05/15/2020(1)(2) | | | 1,150,501 | |
The accompanying notes are an integral part of these financial statements.
|
| Hartford Ultrashort Bond HLS Fund |
Schedule of Investments – (continued)
December 31, 2016
| | | | | | | | | | | | |
Shares or Principal Amount | | Market Value† | |
| ASSET & COMMERCIAL MORTGAGE BACKED SECURITIES - 23.8% - (continued) | |
| | | | | | | Asset-Backed-Finance & Insurance - 5.2% - (continued) | |
| | | | | | | | John Deere Owner Trust | | | | |
| | $ | | | | 1,515,000 | | | 1.09%, 02/15/2019 | | $ | 1,513,257 | |
| | | | | 530,219 | | | 1.39%, 12/16/2019 | | | 530,253 | |
| | | | | | | | Kubota Credit Owner Trust | | | | |
| | | | | 719,075 | | | 1.16%, 05/15/2018(2) | | | 719,100 | |
| | | | | 780,000 | | | 1.25%, 04/15/2019(2) | | | 778,380 | |
| | | | | | | | New York City Tax Lien | | | | |
| | | | | 768,730 | | | 1.34%, 11/10/2028(2) | | | 764,886 | |
| | | | | 687,223 | | | 1.47%, 11/10/2029(2) | | | 687,911 | |
| | | | | 2,250,000 | | | Verizon Owner Trust
1.42%, 01/20/2021(2) | | | 2,234,341 | |
| | | | | 533,511 | | | Volvo Financial Equipment LLC
0.82%, 04/16/2018(2) | | | 533,165 | |
| | | | | 3,000,000 | | | Wells Fargo Dealer Floorplan Master Note Trust
1.49%, 04/22/2019(1) | | | 3,003,444 | |
| | | | | | | | | | | | |
| | | | | | | | | | | 32,029,323 | |
| | | | | | | | | | | | |
| | | | | | | Asset-Backed-Student Loan - 0.3% | |
| | | | | 939,827 | | | Navient Student Loan Trust
1.24%, 03/25/2066(1)(2) | | | 940,315 | |
| | | | | 1,112,104 | | | SLM Student Loan Trust
1.00%, 01/25/2027(1) | | | 1,100,354 | |
| | | | | | | | | | | | |
| | | | | | | | | | | 2,040,669 | |
| | | | | | | | | | | | |
| | | | | | | Commercial Mortgage-Backed Securities - 1.2% | |
| | | | | | | | Community or Commercial Mortgage Trust | |
| | | | | 1,130,000 | | | 1.50%, 03/15/2029(1)(2) | | | 1,125,083 | |
| | | | | 1,300,000 | | | 1.91%, 01/10/2046 | | | 1,304,379 | |
| | | | | 3,635,703 | | | LB-UBS Commercial Mortgage Trust
6.11%, 04/15/2041(1) | | | 3,769,192 | |
| | | | | 425,410 | | | Morgan Stanley Capital I Trust
2.11%, 03/15/2045 | | | 425,286 | |
| | | | | 390,852 | | | WFRBS Commercial Mortgage Trust
2.19%, 04/15/2045 | | | 390,921 | |
| | | | | | | | | | | | |
| | | | | | | | | | | 7,014,861 | |
| | | | | | | | | | | | |
| | | | | | | | Total Asset & Commercial Mortgage Backed Securities
(cost $145,556,006) | | $ | 145,437,448 | |
| | | | | | | | | | | | |
| CORPORATE BONDS - 45.1% | |
| | | | | | | Agriculture - 0.6% | |
| | $ | | | | 2,000,000 | | | BAT International Finance plc
1.47%, 06/15/2018(1)(2) | | $ | 2,000,384 | |
| | | | | 1,425,000 | | | Reynolds American, Inc.
2.30%, 06/12/2018 | | | 1,434,033 | |
| | | | | | | | | | | | |
| | | | | | | | | | | 3,434,417 | |
| | | | | | | | | | | | |
| | | | | | | Auto Manufacturers - 4.6% | |
| | | | | 2,500,000 | | | American Honda Finance Corp.
1.34%, 07/13/2018(1) | | | 2,508,345 | |
| | | | | | | | Daimler Finance North America LLC | |
| | | | | 1,750,000 | | | 1.50%, 07/05/2019(2) | | | 1,721,781 | |
| | | | | 2,000,000 | | | 1.65%, 05/18/2018(2) | | | 1,996,300 | |
| | | | | | | | Ford Motor Credit Co. LLC | |
| | | | | 2,150,000 | | | 1.66%, 01/17/2017(1) | | | 2,150,467 | |
| | | | | 2,000,000 | | | 1.72%, 12/06/2017 | | | 1,998,488 | |
| | | | | 2,500,000 | | | 1.78%, 03/12/2019(1) | | | 2,503,657 | |
| | | | | 1,500,000 | | | Harley-Davidson Financial Services, Inc.
2.25%, 01/15/2019(2) | | | 1,506,452 | |
| | | | | | | | | | | | |
Shares or Principal Amount | | Market Value† | |
| CORPORATE BONDS - 45.1% - (continued) | |
| | | | | | | Auto Manufacturers - 4.6% - (continued) | |
| | | | | | | | Nissan Motor Acceptance Corp. | |
| | $ | | | | 1,375,000 | | | 1.49%, 03/03/2017(1)(2) | | $ | 1,376,218 | |
| | | | | 2,000,000 | | | 1.50%, 03/02/2018(2) | | | 1,994,500 | |
| | | | | | | | PACCAR Financial Corp. | |
| | | | | 1,000,000 | | | 1.40%, 05/18/2018 | | | 998,904 | |
| | | | | 1,500,000 | | | 1.55%, 12/06/2018(1) | | | 1,509,599 | |
| | | | | | | | Toyota Motor Credit Corp. | |
| | | | | 2,000,000 | | | 1.13%, 05/16/2017 | | | 1,998,962 | |
| | | | | 1,850,000 | | | 1.19%, 01/12/2018(1) | | | 1,852,568 | |
| | | | | 1,250,000 | | | 1.20%, 04/06/2018 | | | 1,244,446 | |
| | | | | 3,000,000 | | | Volkswagen Group of America Finance LLC
1.39%, 05/22/2018(1)(2) | | | 2,985,726 | |
| | | | | | | | | | | | |
| | | | | | | | | | | 28,346,413 | |
| | | | | | | | | | | | |
| | | | | | | Beverages - 1.8% | |
| | | | | 5,000,000 | | | Anheuser-Busch InBev Finance, Inc.
1.29%, 02/01/2019(1) | | | 5,005,540 | |
| | | | | 6,000,000 | | | Anheuser-Busch InBev Worldwide, Inc.
1.58%, 08/01/2018(1) | | | 6,036,846 | |
| | | | | | | | | | | | |
| | | | | | | | | | | 11,042,386 | |
| | | | | | | | | | | | |
| | | | | | | Chemicals - 0.5% | |
| | | | | 1,250,000 | | | Air Liquide Finance S.A.
1.38%, 09/27/2019(2) | | | 1,228,790 | |
| | | | | 2,000,000 | | | Monsanto Co.
1.15%, 06/30/2017 | | | 1,998,496 | |
| | | | | | | | | | | | |
| | | | | | | | | | | 3,227,286 | |
| | | | | | | | | | | | |
| | | | | | | Commercial Banks - 20.8% | |
| | | | | 3,000,000 | | | Australia & New Zealand Banking Group Ltd.
1.26%, 01/10/2017(1)(2) | | | 3,000,243 | |
| | | | | | | | Bank of America Corp. | |
| | | | | 2,000,000 | | | 1.70%, 08/25/2017 | | | 2,002,674 | |
| | | | | 2,000,000 | | | 1.92%, 01/15/2019(1) | | | 2,017,894 | |
| | | | | 1,280,000 | | | 2.00%, 01/11/2018 | | | 1,282,945 | |
| | | | | 2,000,000 | | | 2.07%, 03/22/2018(1) | | | 2,013,462 | |
| | | | | 720,000 | | | 5.65%, 05/01/2018 | | | 754,389 | |
| | | | | | | | Bank of Montreal | |
| | | | | 1,350,000 | | | 1.35%, 08/28/2018 | | | 1,343,601 | |
| | | | | 2,000,000 | | | 1.40%, 04/10/2018 | | | 1,994,834 | |
| | | | | 1,750,000 | | | Bank of Nova Scotia
1.65%, 06/14/2019 | | | 1,733,963 | |
| | | | | 2,000,000 | | | Bank of Tokyo-Mitsubishi UFJ Ltd.
1.26%, 09/08/2017(1)(2) | | | 1,998,040 | |
| | | | | 2,815,000 | | | Barclays Bank plc
1.49%, 02/17/2017(1) | | | 2,815,966 | |
| | | | | | | | BB&T Corp. | |
| | | | | 2,500,000 | | | 1.55%, 02/01/2019(1) | | | 2,510,695 | |
| | | | | 1,500,000 | | | 1.57%, 06/15/2020(1) | | | 1,501,944 | |
| | | | | 6,000,000 | | | BPCE S.A.
1.73%, 02/10/2017(1) | | | 6,005,034 | |
| | | | | 4,000,000 | | | Citigroup, Inc.
1.64%, 04/08/2019(1) | | | 4,004,864 | |
| | | | | 2,000,000 | | | Commonwealth Bank of Australia
1.52%, 11/07/2019(1)(2) | | | 2,000,902 | |
| | | | | | | | Credit Agricole S.A. | |
| | | | | 1,775,000 | | | 1.50%, 06/12/2017(1)(2) | | | 1,777,128 | |
| | | | | 2,500,000 | | | 1.92%, 06/10/2020(1)(2) | | | 2,508,540 | |
| | | | | | | | Credit Suisse AG | |
| | | | | 1,700,000 | | | 1.38%, 05/26/2017 | | | 1,700,394 | |
| | | | | 2,250,000 | | | 1.57%, 04/27/2018(1) | | | 2,249,048 | |
| | | | | 2,250,000 | | | 1.70%, 04/27/2018 | | | 2,245,041 | |
The accompanying notes are an integral part of these financial statements.
|
| Hartford Ultrashort Bond HLS Fund |
Schedule of Investments – (continued)
December 31, 2016
| | | | | | | | | | | | |
Shares or Principal Amount | | Market Value† | |
| CORPORATE BONDS - 45.1% - (continued) | |
| | | | | | | Commercial Banks - 20.8% - (continued) | |
| | $ | | | | 2,000,000 | | | Danske Bank A/S
1.53%, 09/06/2019(1)(2) | | $ | 2,001,300 | |
| | | | | | | | Deutsche Bank AG London | |
| | | | | 2,000,000 | | | 1.35%, 05/30/2017 | | | 1,995,668 | |
| | | | | 2,000,000 | | | 1.51%, 02/13/2017(1) | | | 1,999,524 | |
| | | | | | | | Fifth Third Bank | |
| | | | | 2,350,000 | | | 1.59%, 09/27/2019(1) | | | 2,350,623 | |
| | | | | 2,000,000 | | | 1.82%, 08/20/2018(1) | | | 2,012,824 | |
| | | | | | | | Goldman Sachs Group, Inc. | |
| | | | | 2,000,000 | | | 2.04%, 04/23/2020(1) | | | 2,019,112 | |
| | | | | 1,000,000 | | | 2.09%, 04/30/2018(1) | | | 1,008,710 | |
| | | | | 3,500,000 | | | 2.24%, 11/15/2021(1) | | | 3,518,914 | |
| | | | | 3,000,000 | | | HSBC Bank plc
1.55%, 05/15/2018(1)(2) | | | 3,001,014 | |
| | | | | 1,000,000 | | | Huntington National Bank
1.31%, 04/24/2017(1) | | | 1,000,149 | |
| | | | | | | | ING Bank N.V. | |
| | | | | 2,300,000 | | | 1.52%, 03/16/2018(1)(2) | | | 2,303,825 | |
| | | | | 1,000,000 | | | 1.65%, 08/15/2019(2) | | | 986,474 | |
| | | | | | | | JP Morgan Chase & Co. | |
| | | | | 1,500,000 | | | 1.44%, 03/01/2018(1) | | | 1,502,792 | |
| | | | | 3,000,000 | | | 1.52%, 01/28/2019(1) | | | 3,009,633 | |
| | | | | | | | KeyBank NA | |
| | | | | 1,600,000 | | | 1.45%, 06/01/2018(1) | | | 1,601,994 | |
| | | | | 1,000,000 | | | 1.60%, 08/22/2019 | | | 986,306 | |
| | | | | | | | Manufacturers & Traders Trust Co. | |
| | | | | 3,000,000 | | | 1.26%, 01/30/2017(1) | | | 3,000,717 | |
| | | | | 1,500,000 | | | 1.40%, 07/25/2017 | | | 1,500,792 | |
| | | | | | | | Morgan Stanley | |
| | | | | 3,000,000 | | | 1.73%, 01/24/2019(1) | | | 3,018,720 | |
| | | | | 1,275,000 | | | 5.95%, 12/28/2017 | | | 1,327,058 | |
| | | | | 3,000,000 | | | Nordea Bank AB
1.36%, 04/04/2017(1)(2) | | | 3,002,172 | |
| | | | | | | | PNC Bank NA | |
| | | | | 2,000,000 | | | 1.45%, 07/29/2019 | | | 1,972,790 | |
| | | | | 870,000 | | | 1.70%, 12/07/2018 | | | 868,425 | |
| | | | | 3,000,000 | | | Royal Bank of Canada
1.21%, 01/23/2017(1) | | | 3,000,540 | |
| | | | | 2,000,000 | | | Santander Bank NA
1.80%, 01/12/2018(1) | | | 2,001,250 | |
| | | | | | | | Santander UK plc | |
| | | | | 1,500,000 | | | 1.41%, 09/29/2017(1) | | | 1,497,369 | |
| | | | | 2,500,000 | | | 1.78%, 08/24/2018(1) | | | 2,504,155 | |
| | | | | 3,000,000 | | | Societe Generale S.A.
2.08%, 10/01/2018(1) | | | 3,025,572 | |
| | | | | 2,000,000 | | | Standard Chartered plc
1.52%, 04/17/2018(1)(2) | | | 1,992,332 | |
| | | | | | | | Sumitomo Mitsui Banking Corp. | |
| | | | | 3,000,000 | | | 1.31%, 01/10/2017(1) | | | 3,000,150 | |
| | | | | 1,250,000 | | | 1.55%, 10/19/2018(1) | | | 1,254,151 | |
| | | | | 3,000,000 | | | SunTrust Banks, Inc.
1.35%, 02/15/2017(1) | | | 3,000,333 | |
| | | | | 1,665,000 | | | Svenska Handelsbanken AB
1.44%, 09/06/2019(1) | | | 1,665,000 | |
| | | | | | | | Toronto-Dominion Bank | |
| | | | | 3,000,000 | | | 1.12%, 05/02/2017(1) | | | 3,001,140 | |
| | | | | 2,250,000 | | | 1.45%, 08/13/2019 | | | 2,217,667 | |
| | | | | 875,000 | | | U.S. Bancorp
1.40%, 11/15/2018(1) | | | 876,897 | |
| | | | | 1,500,000 | | | UBS AG
1.70%, 03/26/2018(1) | | | 1,504,989 | |
| | | | | | | | | | | | |
Shares or Principal Amount | | Market Value† | |
| CORPORATE BONDS - 45.1% - (continued) | |
| | | | | | | Commercial Banks - 20.8% - (continued) | |
| | | | | | | | Wells Fargo Bank NA | |
| | $ | | | | 2,000,000 | | | 1.60%, 12/06/2019(1) | | $ | 2,004,852 | |
| | | | | 1,500,000 | | | 1.65%, 01/22/2018 | | | 1,499,960 | |
| | | | | | | | | | | | |
| | | | | | | | | | | 127,497,494 | |
| | | | | | | | | | | | |
| | | | | | | Commercial Services - 0.2% | |
| | | | | 1,370,000 | | | Catholic Health Initiatives
1.60%, 11/01/2017 | | | 1,375,994 | |
| | | | | | | | | | | | |
| | | | | | | Diversified Financial Services - 2.8% | |
| | | | | | | | American Express Credit Corp. | |
| | | | | 1,500,000 | | | 1.13%, 06/05/2017 | | | 1,499,764 | |
| | | | | 2,500,000 | | | 1.54%, 03/18/2019(1) | | | 2,504,770 | |
| | | | | 1,500,000 | | | Capital One Bank USA NA
1.30%, 06/05/2017 | | | 1,498,934 | |
| | | | | | | | General Electric Co. | |
| | | | | 2,000,000 | | | 1.19%, 05/15/2017(1) | | | 2,001,574 | |
| | | | | 3,000,000 | | | 1.71%, 04/02/2018(1) | | | 3,021,618 | |
| | | | | 3,750,000 | | | Macquarie Group Ltd.
1.89%, 01/31/2017(1)(2) | | | 3,752,786 | |
| | | | | 1,465,000 | | | Protective Life Global Funding
1.72%, 04/15/2019(2) | | | 1,453,279 | |
| | | | | 1,700,000 | | | Synchrony Financial
2.11%, 02/03/2020(1) | | | 1,680,763 | |
| | | | | | | | | | | | |
| | | | | | | | | | | 17,413,488 | |
| | | | | | | | | | | | |
| | | | | | | Electric - 0.3% | |
| | | | | 905,000 | | | Exelon Corp.
1.55%, 06/09/2017 | | | 903,353 | |
| | | | | 1,080,000 | | | Pacific Gas & Electric Co.
1.13%, 11/30/2017(1) | | | 1,080,342 | |
| | | | | | | | | | | | |
| | | | | | | | | | | 1,983,695 | |
| | | | | | | | | | | | |
| | | | | | | Electronics - 0.3% | |
| | | | | 2,000,000 | | | Honeywell International, Inc.
1.17%, 10/30/2019(1) | | | 2,003,120 | |
| | | | | | | | | | | | |
| | | | | | | Healthcare-Products - 0.6% | |
| | | | | 1,820,000 | | | Medtronic, Inc.
1.50%, 03/15/2018 | | | 1,820,027 | |
| | | | | 1,750,000 | | | Zimmer Biomet Holdings, Inc.
1.45%, 04/01/2017 | | | 1,750,422 | |
| | | | | | | | | | | | |
| | | | | | | | | | | 3,570,449 | |
| | | | | | | | | | | | |
| | | | | | | Healthcare-Services - 0.9% | |
| | | | | 2,500,000 | | | Roche Holdings, Inc.
1.34%, 09/30/2019(1)(2) | | | 2,502,225 | |
| | | | | 2,700,000 | | | UnitedHealth Group, Inc.
1.33%, 01/17/2017(1) | | | 2,700,467 | |
| | | | | | | | | | | | |
| | | | | | | | | | | 5,202,692 | |
| | | | | | | | | | | | |
| | | | | | | Home Furnishings - 0.4% | |
| | | | | 2,645,000 | | | Whirlpool Corp.
1.35%, 03/01/2017 | | | 2,645,513 | |
| | | | | | | | | | | | |
| | | | | | | | Insurance - 2.8% | |
| | | | | 2,000,000 | | | Berkshire Hathaway, Inc.
1.15%, 08/15/2018 | | | 1,989,962 | |
| | | | | 1,500,000 | | | MassMutual Global Funding II
1.55%, 10/11/2019(2) | | | 1,482,260 | |
| | | | | 2,460,000 | | | Metropolitan Life Global Funding I
1.75%, 12/19/2018(2) | | | 2,460,841 | |
| | | | | 3,500,000 | | | New York Life Global Funding
1.13%, 03/01/2017(2) | | | 3,499,765 | |
The accompanying notes are an integral part of these financial statements.
|
| Hartford Ultrashort Bond HLS Fund |
Schedule of Investments – (continued)
December 31, 2016
| | | | | | | | | | | | |
Shares or Principal Amount | | Market Value† | |
| CORPORATE BONDS - 45.1% - (continued) | |
| | | | | | | Home Furnishings - 0.4% - (continued) | |
| | $ | | | | 2,000,000 | | | Principal Life Global Funding II
1.13%, 02/24/2017(2) | | $ | 1,999,904 | |
| | | | | 1,450,000 | | | 1.20%, 05/19/2017(2) | | | 1,449,867 | |
| | | | | 4,000,000 | | | Prudential Financial, Inc.
1.69%, 08/15/2018(1) | | | 4,013,952 | |
| | | | | | | | | | | | |
| | | | | | | | | | | 16,896,551 | |
| | | | | | | | | | | | |
| | | | | | | IT Services - 0.6% | |
| | | | | 3,500,000 | | | Hewlett Packard Enterprise Co.
2.45%, 10/05/2017 | | | 3,519,460 | |
| | | | | | | | | | | | |
| | | | | | | Machinery-Construction & Mining - 0.4% | |
| | | | | 2,175,000 | | | Caterpillar Financial Services Corp.
1.17%, 03/03/2017(1) | | | 2,176,007 | |
| | | | | | | | | | | | |
| | | | | | | Media - 1.2% | |
| | | | | 3,000,000 | | | NBCUniversal Enterprise, Inc.
1.57%, 04/15/2018(1)(2) | | | 3,018,453 | |
| | | | | 3,000,000 | | | Thomson Reuters Corp.
1.30%, 02/23/2017 | | | 3,000,126 | |
| | | | | 1,315,000 | | | Walt Disney Co.
0.88%, 07/12/2019 | | | 1,288,566 | |
| | | | | | | | | | | | |
| | | | | | | | | | | 7,307,145 | |
| | | | | | | | | | | | |
| | | | | | | Oil & Gas - 2.4% | |
| | | | | 4,000,000 | | | BP Capital Markets plc
1.63%, 09/26/2018(1) | | | 4,015,204 | |
| | | | | 2,345,000 | | | 1.67%, 02/13/2018 | | | 2,347,369 | |
| | | | | 3,000,000 | | | ConocoPhillips Co.
1.24%, 05/15/2018(1) | | | 2,991,180 | |
| | | | | 2,500,000 | | | Exxon Mobil Corp.
1.44%, 03/01/2018 | | | 2,503,005 | |
| | | | | 3,000,000 | | | Statoil ASA
1.34%, 11/08/2018(1) | | | 3,003,615 | |
| | | | | | | | | | | | |
| | | | | | | | | | | 14,860,373 | |
| | | | | | | | | | | | |
| | | | | | | Oil & Gas Services - 0.3% | |
| | | | | 1,800,000 | | | Schlumberger Holdings Corp.
1.90%, 12/21/2017(2) | | | 1,806,773 | |
| | | | | | | | | | | | |
| | | | | | | Pharmaceuticals - 2.5% | |
| | | | | 2,000,000 | | | Actavis Funding SCS
1.30%, 06/15/2017 | | | 1,998,916 | |
| | | | | 4,700,000 | | | 2.03%, 03/12/2018(1) | | | 4,727,302 | |
| | | | | 1,750,000 | | | Baxalta, Inc.
1.78%, 06/22/2018(1) | | | 1,750,432 | |
| | | | | 2,000,000 | | | Bayer US Finance LLC
1.14%, 10/06/2017(1)(2) | | | 1,996,912 | |
| | | | | 1,500,000 | | | Express Scripts Holding Co.
1.25%, 06/02/2017 | | | 1,494,422 | |
| | | | | 3,300,000 | | | McKesson Corp.
1.29%, 03/10/2017 | | | 3,300,795 | |
| | | | | | | | | | | | |
| | | | | | | | | | | 15,268,779 | |
| | | | | | | | | | | | |
| | | | | | | Pipelines - 0.3% | |
| | | | | 1,800,000 | | | Enbridge, Inc.
1.38%, 06/02/2017(1) | | | 1,800,167 | |
| | | | | | | | | | | | |
| | | | | | | REITS - 0.1% | |
| | | | | 570,000 | | | Ventas Realty L.P.
1.25%, 04/17/2017 | | | 569,735 | |
| | | | | | | | | | | | |
| | | | | | | Retail - 0.2% | |
| | | | | 1,500,000 | | | CVS Health Corp.
1.90%, 07/20/2018 | | | 1,505,765 | |
| | | | | | | | | | | | |
| | | | | | | | | | | | |
Shares or Principal Amount | | Market Value† | |
| CORPORATE BONDS - 45.1% - (continued) | |
| | | | | | | Software - 0.1% | |
| | $ | | | | 405,000 | | | Fidelity National Information Services, Inc.
1.45%, 06/05/2017 | | $ | 405,160 | |
| | | | | | | | | | | | |
| | | | | | | Telecommunications - 0.2% | |
| | | | | 1,190,000 | | | British Telecommunications plc
1.25%, 02/14/2017 | | | 1,190,061 | |
| | | | | | | | | | | | |
| | | | | | | Trucking & Leasing - 0.2% | |
| | | | | 1,145,000 | | | GATX Corp.
1.25%, 03/04/2017 | | | 1,144,685 | |
| | | | | | | | | | | | |
| | | |
| | | | | | | | Total Corporate Bonds
(cost $276,100,972) | | $ | 276,193,608 | |
| | | | | | | | | | | | |
| FOREIGN GOVERNMENT OBLIGATIONS - 0.5% | | | |
| | | | | | | | Switzerland - 0.5% | |
| | $ | | | | 3,200,000 | | | Credit Suisse NY
1.75%, 11/14/2017 | | $ | 3,200,199 | |
| | | | | | | | | | | | |
| | | |
| | | | | | | | Total Foreign Government Obligations
(cost $3,200,000) | | $ | 3,200,199 | |
| | | | | | | | | | | | |
| MUNICIPAL BONDS - 0.3% | | | |
| | | | | | | General - 0.3% | |
| | $ | | | | 1,750,000 | | | State of Illinois
5.13%, 07/01/2017 | | $ | 1,777,877 | |
| | | | | | | | | | | | |
| | | |
| | | | | | | | Total Municipal Bonds
(cost $1,778,915) | | $ | 1,777,877 | |
| | | | | | | | | | | | |
| U.S. GOVERNMENT AGENCIES - 13.5% | | | |
| | | | | | | FFCB - 5.1% | |
| | $ | | | | 25,000,000 | | | 0.67%, 10/18/2017 | | $ | 24,973,850 | |
| | | | | 6,000,000 | | | 0.90%, 06/08/2017 | | | 6,004,722 | |
| | | | | | | | | | | | |
| | | | | | | | | | | 30,978,572 | |
| | | | | | | | | | | | |
| | | | | | | FHLB - 2.4% | |
| | | | | 15,000,000 | | | 0.75%, 09/08/2017 | | | 14,992,620 | |
| | | | | | | | | | | | |
| | | | | | | FHLMC - 6.0% | |
| | | | | 1,500,000 | | | 0.75%, 05/25/2017 | | | 1,500,708 | |
| | | | | 20,000,000 | | | 0.88%, 02/22/2017 | | | 20,008,960 | |
| | | | | 15,000,000 | | | 1.00%, 09/29/2017 | | | 15,014,535 | |
| | | | | | | | | | | | |
| | | | | | | | | | | 36,524,203 | |
| | | | | | | | | | | | |
| | | |
| | | | | | | | Total U.S. Government Agencies
(cost $82,525,764) | | $ | 82,495,395 | |
| | | | | | | | | | | | |
| U.S. GOVERNMENT SECURITIES - 16.0% | |
| | | | | | | Other Direct Federal Obligations - 12.1% | |
| | | | | | | FHLB - 12.1% | | | |
| | $ | | | | 10,000,000 | | | 0.75%, 02/13/2017 | | $ | 10,002,490 | |
| | | | | 5,000,000 | | | 0.63%, 04/26/2017 | | | 4,999,430 | |
| | | | | 31,800,000 | | | 1.00%, 06/09/2017 | | | 31,842,962 | |
| | | | | 26,955,000 | | | 0.88%, 05/24/2017 | | | 26,968,612 | |
| | | | | | | | | | | | |
| | | | | | | | | | | 73,813,494 | |
| | | | | | | | | | | | |
| | | | | | | | | | | 73,813,494 | |
| | | | | | | | | | | | |
The accompanying notes are an integral part of these financial statements.
|
| Hartford Ultrashort Bond HLS Fund |
Schedule of Investments – (continued)
December 31, 2016
| | | | | | | | | | | | |
Shares or Principal Amount | | Market Value† | |
| U.S. GOVERNMENT SECURITIES - 16.0% - (continued) | |
| | | | | | | U.S. Treasury Securities - 3.9% | | | |
| | | | | | | U.S. Treasury Notes - 3.9% | | | |
| | $ | | | | 10,000,000 | | | 0.75%, 10/31/2017 | | $ | 9,991,020 | |
| | | | | 14,000,000 | | | 0.75%, 01/31/2018 | | | 13,970,474 | |
| | | | | | | | | | | | |
| | | | | | | | | | | 23,961,494 | |
| | | | | | | | | | | | |
| | | | | | | | | | | 23,961,494 | |
| | | | | | | | | | | | |
| | | |
| | | | | | | | Total U.S. Government Securities
(cost $97,798,697) | | $ | 97,774,988 | |
| | | | | | | | | | | | |
| | | |
| | | | | | | | Total Long-Term Investments
(cost $606,960,354) | | $ | 606,879,515 | |
| | | | | | | | | | | | |
|
| SHORT-TERM INVESTMENTS - 0.7% | |
| | | | | | | Other Investment Pools & Funds - 0.7% | |
| | | | | 4,368,377 | | | Fidelity Institutional Government Fund, Institutional Class | | $ | 4,368,377 | |
| | | | | | | | | | | | |
| | | |
| | | | | | | | Total Short-Term Investments
(cost $4,368,377) | | $ | 4,368,377 | |
| | | | | | | | | | | | |
| | | | | | | | | | | | | | |
| | | | |
| | | | | | Total Investments
(cost $611,328,731) ^ | | | 99.9 | % | | $ | 611,247,892 | |
| | | | | | Other Assets and Liabilities | | | 0.1 | % | | | 501,405 | |
| | | | | | | | | | | | | | |
| | | | | | Total Net Assets | | | 100.0 | % | | $ | 611,749,297 | |
| | | | | | | | | | | | | | |
The accompanying notes are an integral part of these financial statements.
|
| Hartford Ultrashort Bond HLS Fund |
Schedule of Investments – (continued)
December 31, 2016
| Note: | Percentage of investments as shown is the ratio of the total market value to total net assets. |
| | The Fund may refer to any one or more of the industry classifications used by one or more widely recognized market indices, ratings group indices and/or as defined by Fund management. Industry classifications may not be identical across all security types. |
| | For Fund compliance purposes, the Fund may not use the same classification system shown in this report as these classifications are used for financial reporting purposes. |
| ^ | At December 31, 2016, the cost of securities for federal income tax purposes was $611,328,731 and the aggregate gross unrealized appreciation and depreciation based on that cost were: |
| | | | |
Unrealized Appreciation | | $ | 533,800 | |
Unrealized Depreciation | | | (614,639 | ) |
| | | | |
Net Unrealized Depreciation | | $ | (80,839 | ) |
| | | | |
| (1) | Variable rate securities; the rate reported is the coupon rate in effect at December 31, 2016. |
| (2) | Securities issued within terms of a private placement memorandum and exempt from registration under Rule 144A under the Securities Act of 1933, as amended, and may be sold only to qualified institutional buyers. Unless otherwise indicated, these holdings are determined to be liquid. At December 31, 2016, the aggregate value of these securities was $100,450,478, which represents 16.4% of total net assets. |
| † | See Significant Accounting Policies of accompanying Notes to Financial Statements regarding valuation of investments. |
| | |
| GLOSSARY: (abbreviations used in preceding Schedule of Investments) |
|
| Other Abbreviations: |
FFCB | | Federal Farm Credit Bank |
FHLB | | Federal Home Loan Bank |
FHLMC | | Federal Home Loan Mortgage Corp. |
The accompanying notes are an integral part of these financial statements.
|
| Hartford Ultrashort Bond HLS Fund |
Schedule of Investments – (continued)
December 31, 2016
Fair Valuation Summary
The following is a summary of the fair valuations according to the inputs used as of December 31, 2016 in valuing the Fund’s investments.
| | | | | | | | | | | | | | | | |
| | | Total | | | Level 1(1) | | | Level 2(1) | | | Level 3(1) | |
Assets | | | | | | | | | | | | | | | | |
Asset & Commercial Mortgage Backed Securities | | $ | 145,437,448 | | | $ | — | | | $ | 145,437,448 | | | $ | — | |
Corporate Bonds | | | 276,193,608 | | | | — | | | | 276,193,608 | | | | — | |
Foreign Government Obligations | | | 3,200,199 | | | | — | | | | 3,200,199 | | | | — | |
Municipal Bonds | | | 1,777,877 | | | | — | | | | 1,777,877 | | | | — | |
U.S. Government Agencies | | | 82,495,395 | | | | — | | | | 82,495,395 | | | | — | |
U.S. Government Securities | | | 97,774,988 | | | | — | | | | 97,774,988 | | | | — | |
Short-Term Investments | | | 4,368,377 | | | | 4,368,377 | | | | — | | | | — | |
| | | | | | | | | | | | | | | | |
Total | | $ | 611,247,892 | | | $ | 4,368,377 | | | $ | 606,879,515 | | | $ | — | |
| | | | | | | | | | | | | | | | |
| (1) | For the year ended December 31, 2016, there were no transfers between any levels. |
The accompanying notes are an integral part of these financial statements.
|
| Hartford U.S. Government Securities HLS Fund |
Schedule of Investments
December 31, 2016
| | | | | | | | | | | | |
Shares or Principal Amount | | Market Value† | |
| ASSET & COMMERCIAL MORTGAGE BACKED SECURITIES - 18.3% | |
| | | | | | | Asset-Backed-Automobile - 0.8% | |
| | $ | | | | 149,585 | | | Drive Auto Receivables Trust
2.12%, 06/17/2019(1) | | $ | 149,746 | |
| | | | | 3,350,000 | | | Westlake Automobile Receivables Trust
3.40%, 01/15/2021(1) | | | 3,362,239 | |
| | | | | | | | | | | | |
| | | | | | | | 3,511,985 | |
| | | | | | | | | | | | |
| | | | | | | Asset-Backed-Finance & Insurance - 6.7% | |
| | | | | | | | Ares CLO Ltd. | | | | |
| | | | | 4,755,000 | | | 2.33%, 04/20/2023(1)(2) | | | 4,724,202 | |
| | | | | 3,135,000 | | | 2.40%, 04/17/2026(1)(2) | | | 3,141,386 | |
| | | | | | | | Cent CLO Ltd. | | | | |
| | | | | 1,530,000 | | | 2.00%, 07/23/2025(1)(2) | | | 1,526,198 | |
| | | | | 1,000,000 | | | 2.28%, 07/27/2026(1)(2) | | | 999,494 | |
| | | | | 4,085,000 | | | Dryden Senior Loan Fund
2.23%, 04/18/2026(1)(2) | | | 4,085,229 | |
| | | | | 695,000 | | | Ford Credit Floorplan Master Owner Trust
2.32%, 01/15/2019 | | | 695,271 | |
| | | | | 580,000 | | | Green Tree Agency Advance Funding Trust
2.38%, 10/15/2048(1) | | | 575,285 | |
| | | | | 1,700,000 | | | Limerock CLO Ltd.
2.38%, 04/18/2026(1)(2) | | | 1,699,611 | |
| | | | | 3,400,000 | | | Madison Park Funding Ltd.
2.16%, 10/23/2025(1)(2) | | | 3,404,158 | |
| | | | | 1,285,000 | | | Shackleton CLO Ltd.
2.92%, 04/15/2027(1)(2)(3) | | | 1,285,000 | |
| | | | | | | | Springleaf Funding Trust | | | | |
| | | | | 912,725 | | | 2.41%, 12/15/2022(1) | | | 913,061 | |
| | | | | 4,720,000 | | | 3.16%, 11/15/2024(1) | | | 4,757,288 | |
| | | | | 893,536 | | | Structured Asset Securities Corp.
2.26%, 02/25/2033(2) | | | 887,147 | |
| | | | | 1,370,000 | | | Voya CLO Ltd.
2.33%, 07/17/2026(1)(2) | | | 1,370,948 | |
| | | | | | | | | | | | |
| | | | | | | | | | | 30,064,278 | |
| | | | | | | | | | | | |
| | | | | | | Asset-Backed-Home Equity - 1.0% | |
| | | | | 904,116 | | | Morgan Stanley Asset Backed Securities Capital I, Inc. Trust
2.26%, 11/25/2032(2) | | | 891,932 | |
| | | | | 3,606,000 | | | NRZ Advance Receivables Trust
2.58%, 10/15/2049(1) | | | 3,568,321 | |
| | | | | | | | | | | | |
| | | | | | | | | | | 4,460,253 | |
| | | | | | | | | | | | |
| | | | | | | Commercial Mortgage-Backed Securities - 1.9% | |
| | | | | | | | FREMF Mortgage Trust | | | | |
| | | | | 460,000 | | | 3.08%, 03/25/2045(1)(2) | | | 460,678 | |
| | | | | 1,500,000 | | | 3.81%, 08/25/2045(1)(2) | | | 1,537,893 | |
| | | | | 2,645,000 | | | 3.82%, 06/25/2047(1)(2) | | | 2,713,074 | |
| | | | | 1,665,000 | | | 4.17%, 11/25/2044(1)(2) | | | 1,714,532 | |
| | | | | 1,990,000 | | | 5.63%, 04/25/2020(1)(2) | | | 2,160,888 | |
| | | | | | | | | | | | |
| | | | | | | | 8,587,065 | |
| | | | | | | | | | | | |
| | | | | | | Whole Loan Collateral CMO - 7.9% | |
| | | | | 1,469,060 | | | COLT Mortgage Loan Trust
2.75%, 09/25/2046(1)(2) | | | 1,476,764 | |
| | | | | | | | LSTAR Securities Investment Trust | | | | |
| | | | | 1,072,910 | | | 2.62%, 04/01/2020(1)(2) | | | 1,070,898 | |
| | | | | 2,374,827 | | | 2.62%, 10/01/2021(1)(2) | | | 2,348,783 | |
| | | | | 3,733,826 | | | 2.77%, 05/01/2020(1)(2) | | | 3,709,590 | |
| | | | | 3,185,987 | | | 2.77%, 08/01/2020(1)(2) | | | 3,161,843 | |
| | | | | 784,920 | | | Mill City Mortgage Loan Trust
2.50%, 04/25/2057(1)(2) | | | 781,373 | |
| | | | | | | | | | | | |
Shares or Principal Amount | | Market Value† | |
| ASSET & COMMERCIAL MORTGAGE BACKED SECURITIES - 18.3% - (continued) | |
| | | | | | | Whole Loan Collateral CMO - 7.9% - (continued) | |
| | | | | | | | New Residential Mortgage Loan Trust | |
| | $ | | | | 1,640,611 | | | 3.25%, 09/25/2056(1)(2) | | $ | 1,659,396 | |
| | | | | 2,168,685 | | | 3.75%, 03/25/2056(1)(2) | | | 2,200,227 | |
| | | | | 1,566,117 | | | Sequoia Mortgage Trust
1.20%, 02/20/2035(2) | | | 1,532,282 | |
| | | | | 2,151,666 | | | Thornburg Mortgage Securities Trust
2.63%, 04/25/2045(2) | | | 2,156,838 | |
| | | | | | | | Towd Point Mortgage Trust | |
| | | | | 2,209,122 | | | 2.75%, 02/25/2055(1)(2) | | | 2,204,251 | |
| | | | | 2,076,228 | | | 2.75%, 04/25/2055(1)(2) | | | 2,082,045 | |
| | | | | 100,908 | | | 2.75%, 05/25/2055(1)(2) | | | 101,152 | |
| | | | | 592,703 | | | 2.75%, 08/25/2055(1)(2) | | | 589,431 | |
| | | | | 2,538,568 | | | 3.00%, 03/25/2054(1)(2) | | | 2,565,241 | |
| | | | | 2,399,000 | | | 3.75%, 04/25/2055(1)(2) | | | 2,345,991 | |
| | | | | | | | WaMu Mortgage Pass-Through Certificates | |
| | | | | 1,862,308 | | | 2.50%, 03/25/2033(2) | | | 1,861,670 | |
| | | | | 2,053,687 | | | 2.75%, 10/25/2035(2) | | | 1,994,693 | |
| | | | | 1,588,880 | | | Wells Fargo Mortgage Backed Securities Trust
2.88%, 09/25/2033(2) | | | 1,574,862 | |
| | | | | | | | | | | | |
| | | | | | | | 35,417,330 | |
| | | | | | | | | | | | |
| | | |
| | | | | | | | Total Asset & Commercial Mortgage Backed Securities
(cost $81,694,768) | | $ | 82,040,911 | |
| | | | | | | | | | | | |
| | | |
| | | | | | | | | | | | |
| U.S. GOVERNMENT AGENCIES - 72.9% | |
| | | | | | | FHLMC - 32.9% | |
| | $ | | | | 4,346,615 | | | 1.14%, 04/25/2020(2) | | $ | 4,341,736 | |
| | | | | 9,515,709 | | | 1.57%, 01/25/2022 | | | 9,450,755 | |
| | | | | 8,375,000 | | | 3.00%, 01/01/2032(4) | | | 8,593,582 | |
| | | | | 791,235 | | | 3.00%, 03/15/2033(5) | | | 98,794 | |
| | | | | 4,656,220 | | | 3.00%, 11/01/2036 | | | 4,711,988 | |
| | | | | 188,444 | | | 3.00%, 09/01/2045 | | | 187,328 | |
| | | | | 703,530 | | | 3.00%, 10/01/2046 | | | 699,753 | |
| | | | | 53,047,171 | | | 3.00%, 12/01/2046 | | | 52,729,516 | |
| | | | | 10,600,000 | | | 3.00%, 01/01/2047(4) | | | 10,525,529 | |
| | | | | 6,205,000 | | | 3.50%, 11/15/2025 | | | 6,533,140 | |
| | | | | 13,900,000 | | | 3.50%, 01/01/2047(4) | | | 14,232,806 | |
| | | | | 520,451 | | | 4.00%, 07/15/2027(5) | | | 58,257 | |
| | | | | 384,694 | | | 4.00%, 06/01/2044 | | | 404,329 | |
| | | | | 42,120 | | | 4.50%, 12/01/2018 | | | 43,214 | |
| | | | | 3,246,470 | | | 4.50%, 02/15/2027(5) | | | 375,109 | |
| | | | | 3,333,082 | | | 4.50%, 05/15/2034 | | | 3,504,963 | |
| | | | | 18,400,000 | | | 4.50%, 01/01/2047(4) | | | 19,750,060 | |
| | | | | 7,251 | | | 5.50%, 06/01/2034 | | | 8,150 | |
| | | | | 48,833 | | | 5.50%, 10/01/2035 | | | 54,800 | |
| | | | | 76,091 | | | 5.50%, 04/01/2037 | | | 84,314 | |
| | | | | 1,003,413 | | | 5.50%, 12/01/2037 | | | 1,119,520 | |
| | | | | 392,544 | | | 5.50%, 04/01/2038 | | | 438,068 | |
| | | | | 23,775 | | | 5.50%, 05/01/2038 | | | 26,458 | |
| | | | | 1,943,098 | | | 5.50%, 08/01/2038 | | | 2,165,157 | |
| | | | | 3,787 | | | 5.50%, 12/01/2039 | | | 4,218 | |
| | | | | 51,247 | | | 6.00%, 10/01/2021 | | | 57,895 | |
| | | | | 68,466 | | | 6.00%, 10/01/2022 | | | 77,348 | |
| | | | | 96,064 | | | 6.00%, 01/01/2028 | | | 109,678 | |
| | | | | 25,744 | | | 6.00%, 04/15/2028 | | | 29,185 | |
| | | | | 53,808 | | | 6.00%, 05/15/2028(6) | | | 60,098 | |
| | | | | 64,171 | | | 6.00%, 11/15/2028 | | | 72,842 | |
| | | | | 117,120 | | | 6.00%, 12/15/2028 | | | 133,142 | |
| | | | | 258,276 | | | 6.00%, 01/15/2029 | | | 294,668 | |
| | | | | 58,065 | | | 6.00%, 02/15/2029 | | | 66,189 | |
The accompanying notes are an integral part of these financial statements.
|
| Hartford U.S. Government Securities HLS Fund |
Schedule of Investments – (continued)
December 31, 2016
| | | | | | | | | | | | |
Shares or Principal Amount | | Market Value† | |
| U.S. GOVERNMENT AGENCIES - 72.9% - (continued) | |
| | | | | | | FHLMC - 32.9% - (continued) | |
| | $ | | | | 70,079 | | | 6.00%, 03/15/2029 | | $ | 79,585 | |
| | | | | 40,284 | | | 6.00%, 05/15/2029 | | | 46,001 | |
| | | | | 10,256 | | | 6.00%, 06/15/2029 | | | 11,429 | |
| | | | | 2,785 | | | 6.00%, 03/15/2031 | | | 3,189 | |
| | | | | 115,899 | | | 6.00%, 04/15/2031 | | | 131,867 | |
| | | | | 56,818 | | | 6.00%, 10/15/2031 | | | 64,145 | |
| | | | | 64,851 | | | 6.00%, 12/01/2031 | | | 74,426 | |
| | | | | 414,369 | | | 6.00%, 12/15/2031(6) | | | 473,524 | |
| | | | | 506,124 | | | 6.00%, 12/15/2031 | | | 578,077 | |
| | | | | 19,969 | | | 6.00%, 05/15/2032 | | | 22,662 | |
| | | | | 1,117,677 | | | 6.00%, 06/15/2032 | | | 1,268,694 | |
| | | | | 976,241 | | | 6.00%, 09/15/2032 | | | 1,092,296 | |
| | | | | 89,118 | | | 6.00%, 10/15/2032 | | | 102,616 | |
| | | | | 689 | | | 6.00%, 11/01/2032 | | | 790 | |
| | | | | 62,695 | | | 6.00%, 11/15/2032 | | | 70,293 | |
| | | | | 15,784 | | | 6.00%, 04/01/2033 | | | 17,832 | |
| | | | | 23,629 | | | 6.00%, 09/01/2034 | | | 27,210 | |
| | | | | 914 | | | 6.50%, 02/01/2017 | | | 915 | |
| | | | | 7,969 | | | 6.50%, 04/01/2028 | | | 9,000 | |
| | | | | 365,751 | | | 6.50%, 08/15/2028 | | | 400,819 | |
| | | | | 920,406 | | | 6.50%, 05/15/2032 | | | 1,042,873 | |
| | | | | 127,608 | | | 6.50%, 08/01/2032 | | | 146,594 | |
| | | | | 285,164 | | | 6.50%, 09/01/2032 | | | 331,295 | |
| | | | | 26,953 | | | 7.00%, 10/01/2026 | | | 28,037 | |
| | | | | 4,799 | | | 7.00%, 03/01/2027 | | | 5,263 | |
| | | | | 4,346 | | | 7.00%, 12/01/2027 | | | 4,484 | |
| | | | | 1,300 | | | 7.00%, 02/01/2029 | | | 1,518 | |
| | | | | 806 | | | 7.00%, 05/01/2029 | | | 919 | |
| | | | | 1,677 | | | 7.00%, 09/01/2029 | | | 1,828 | |
| | | | | 679 | | | 7.00%, 02/01/2031 | | | 798 | |
| | | | | 100,328 | | | 7.00%, 04/01/2032 | | | 117,484 | |
| | | | | 61,464 | | | 7.00%, 05/01/2032 | | | 63,108 | |
| | | | | 70,038 | | | 7.00%, 06/01/2032 | | | 82,704 | |
| | | | | 123,647 | | | 7.00%, 11/01/2032 | | | 141,118 | |
| | | | | 3,542 | | | 7.50%, 05/01/2024 | | | 4,036 | |
| | | | | 567 | | | 7.50%, 06/01/2024 | | | 575 | |
| | | | | 1,283 | | | 7.50%, 06/01/2025 | | | 1,369 | |
| | | | | 5,644 | | | 8.00%, 08/01/2024 | | | 5,854 | |
| | | | | 5,371 | | | 8.00%, 09/01/2024 | | | 5,591 | |
| | | | | 7,759 | | | 8.00%, 10/01/2024 | | | 8,111 | |
| | | | | 644 | | | 10.00%, 11/01/2020 | | | 647 | |
| | | | | | | | | | | | |
| | | | | | | | 147,512,165 | |
| | | | | | | | | | | | |
| | | | | | | FNMA - 38.5% | |
| | | | | 4,404,946 | | | 1.97%, 08/25/2044(2)(5) | | | 284,974 | |
| | | | | 6,400,000 | | | 1.97%, 11/01/2023 | | | 6,194,142 | |
| | | | | 698,923 | | | 2.05%, 11/01/2023 | | | 681,217 | |
| | | | | 2,623,747 | | | 2.09%, 06/25/2055(2)(5) | | | 174,594 | |
| | | | | 3,468,821 | | | 2.22%, 10/01/2022 | | | 3,436,279 | |
| | | | | 2,300,000 | | | 2.23%, 11/01/2023 | | | 2,253,969 | |
| | | | | 6,182,888 | | | 2.25%, 10/01/2022 | | | 6,123,301 | |
| | | | | 3,493,850 | | | 2.31%, 10/01/2022 | | | 3,473,567 | |
| | | | | 139,212 | | | 2.34%, 11/01/2022 | | | 138,597 | |
| | | | | 144,209 | | | 2.40%, 10/01/2022 | | | 143,464 | |
| | | | | 200,000 | | | 2.45%, 11/01/2022 | | | 198,868 | |
| | | | | 17,800,000 | | | 2.50%, 01/01/2032(4) | | | 17,828,160 | |
| | | | | 28,893 | | | 2.50%, 01/01/2043 | | | 27,636 | |
| | | | | 285,842 | | | 2.50%, 01/01/2046 | | | 272,250 | |
| | | | | 3,721,230 | | | 2.50%, 05/01/2046 | | | 3,544,263 | |
| | | | | 2,157,575 | | | 2.50%, 06/01/2046 | | | 2,054,984 | |
| | | | | 273,187 | | | 2.50%, 07/01/2046 | | | 260,195 | |
| | | | | | | | | | | | |
Shares or Principal Amount | | Market Value† | |
| U.S. GOVERNMENT AGENCIES - 72.9% - (continued) | |
| | | | | | | FNMA - 38.5% - (continued) | |
| | $ | | | | 1,251,872 | | | 2.50%, 08/01/2046 | | $ | 1,192,334 | |
| | | | | 7,084,369 | | | 2.50%, 09/01/2046 | | | 6,747,436 | |
| | | | | 100,000 | | | 2.50%, 01/01/2047(4) | | | 95,135 | |
| | | | | 280,240 | | | 2.54%, 03/01/2023 | | | 280,023 | |
| | | | | 1,995,634 | | | 2.56%, 01/01/2019(7) | | | 2,026,703 | |
| | | | | 2,500,000 | | | 2.68%, 05/01/2025 | | | 2,463,323 | |
| | | | | 104,511 | | | 2.74%, 04/01/2022 | | | 107,213 | |
| | | | | 91,430 | | | 2.83%, 06/01/2022 | | | 93,618 | |
| | | | | 250,000 | | | 2.94%, 06/01/2022 | | | 255,980 | |
| | | | | 2,395,260 | | | 3.00%, 07/25/2027(5) | | | 216,795 | |
| | | | | 815,141 | | | 3.00%, 09/25/2027(5) | | | 76,279 | |
| | | | | 3,388,946 | | | 3.00%, 01/01/2030 | | | 3,480,709 | |
| | | | | 88,721 | | | 3.00%, 12/01/2030 | | | 91,123 | |
| | | | | 5,925,000 | | | 3.00%, 01/01/2032(4) | | | 6,080,068 | |
| | | | | 185,529 | | | 3.02%, 04/01/2022 | | | 191,502 | |
| | | | | 7,640,559 | | | 3.11%, 10/01/2021 | | | 7,915,249 | |
| | | | | 1,900,000 | | | 3.21%, 05/01/2023 | | | 1,961,734 | |
| | | | | 595,553 | | | 3.25%, 12/01/2021 | | | 620,283 | |
| | | | | 444,041 | | | 3.26%, 01/01/2022 | | | 462,778 | |
| | | | | 268,964 | | | 3.41%, 11/01/2020 | | | 281,006 | |
| | | | | 189,481 | | | 3.46%, 09/01/2023 | | | 197,411 | |
| | | | | 225,749 | | | 3.50%, 11/01/2020 | | | 237,182 | |
| | | | | 5,453,517 | | | 3.50%, 04/25/2027(5) | | | 600,750 | |
| | | | | 1,534,087 | | | 3.50%, 10/25/2027(5) | | | 175,417 | |
| | | | | 15,052,846 | | | 3.50%, 04/25/2044 | | | 15,575,085 | |
| | | | | 2,123,127 | | | 3.50%, 02/01/2045 | | | 2,177,511 | |
| | | | | 4,317,738 | | | 3.50%, 01/01/2046 | | | 4,429,021 | |
| | | | | 501,470 | | | 3.51%, 11/01/2021 | | | 527,429 | |
| | | | | 1,035,050 | | | 3.59%, 09/01/2030 | | | 1,072,287 | |
| | | | | 1,793,402 | | | 3.65%, 11/01/2021 | | | 1,897,312 | |
| | | | | 205,566 | | | 3.65%, 08/01/2023 | | | 217,338 | |
| | | | | 1,240,884 | | | 3.73%, 07/01/2022 | | | 1,317,280 | |
| | | | | 6,732,263 | | | 3.74%, 06/01/2018 | | | 6,862,731 | |
| | | | | 1,044,136 | | | 3.75%, 09/01/2023 | | | 1,104,651 | |
| | | | | 95,591 | | | 3.81%, 11/01/2023 | | | 101,535 | |
| | | | | 192,947 | | | 3.83%, 07/01/2021 | | | 205,713 | |
| | | | | 288,720 | | | 3.85%, 01/01/2024 | | | 307,591 | |
| | | | | 383,950 | | | 3.87%, 01/01/2024 | | | 409,469 | |
| | | | | 389,553 | | | 3.89%, 10/01/2023 | | | 412,801 | |
| | | | | 2,700,000 | | | 3.98%, 07/01/2021 | | | 2,889,099 | |
| | | | | 181,756 | | | 3.99%, 07/01/2021 | | | 194,569 | |
| | | | | 2,051,941 | | | 4.00%, 11/01/2044 | | | 2,158,035 | |
| | | | | 23,975,000 | | | 4.00%, 01/01/2047(4) | | | 25,205,124 | |
| | | | | 550,355 | | | 4.01%, 08/01/2021 | | | 590,168 | |
| | | | | 1,869,732 | | | 4.50%, 10/01/2040 | | | 2,015,004 | |
| | | | | 843,512 | | | 4.50%, 10/01/2041 | | | 908,920 | |
| | | | | 2,388,437 | | | 4.50%, 01/01/2043 | | | 2,574,511 | |
| | | | | 714,257 | | | 4.50%, 09/01/2043 | | | 768,952 | |
| | | | | 2,336,671 | | | 4.50%, 08/01/2044 | | | 2,516,031 | |
| | | | | 48,191 | | | 5.00%, 08/01/2018 | | | 49,361 | |
| | | | | 131,108 | | | 5.00%, 10/01/2018 | | | 134,176 | |
| | | | | 182,374 | | | 5.00%, 06/01/2025 | | | 195,527 | |
| | | | | 270,997 | | | 5.24%, 07/01/2019 | | | 291,359 | |
| | | | | 505,168 | | | 5.46%, 05/25/2042(2)(5) | | | 58,845 | |
| | | | | 9,143 | | | 5.50%, 10/01/2017 | | | 9,255 | |
| | | | | 8,194 | | | 5.50%, 12/01/2017 | | | 8,281 | |
| | | | | 50,441 | | | 5.50%, 04/01/2018 | | | 51,087 | |
| | | | | 34,902 | | | 5.50%, 06/01/2018 | | | 35,410 | |
| | | | | 3,721 | | | 5.50%, 07/01/2018 | | | 3,795 | |
| | | | | 707,961 | | | 5.50%, 08/01/2019 | | | 736,832 | |
| | | | | 284,132 | | | 6.00%, 10/01/2023 | | | 321,447 | |
The accompanying notes are an integral part of these financial statements.
|
| Hartford U.S. Government Securities HLS Fund |
Schedule of Investments – (continued)
December 31, 2016
| | | | | | | | | | | | |
Shares or Principal Amount | | Market Value† | |
| U.S. GOVERNMENT AGENCIES - 72.9% - (continued) | |
| | | | | | | FNMA - 38.5% - (continued) | |
| | $ | | | | 36,907 | | | 6.00%, 10/25/2028 | | $ | 41,768 | |
| | | | | 13,901 | | | 6.00%, 11/25/2028 | | | 15,769 | |
| | | | | 53,972 | | | 6.00%, 04/25/2029 | | | 60,423 | |
| | | | | 891 | | | 6.00%, 05/01/2029 | | | 1,013 | |
| | | | | 44,020 | | | 6.00%, 05/25/2029 | | | 49,814 | |
| | | | | 37,051 | | | 6.00%, 06/25/2029 | | | 41,943 | |
| | | | | 83,223 | | | 6.00%, 07/25/2029 | | | 94,266 | |
| | | | | 435,462 | | | 6.00%, 05/25/2031(6) | | | 495,701 | |
| | | | | 146,088 | | | 6.00%, 09/25/2031 | | | 166,710 | |
| | | | | 34,025 | | | 6.00%, 11/25/2031 | | | 38,559 | |
| | | | | 573,614 | | | 6.00%, 12/25/2031 | | | 641,370 | |
| | | | | 244,799 | | | 6.00%, 01/01/2032 | | | 279,246 | |
| | | | | 265 | | | 6.00%, 04/01/2032 | | | 300 | |
| | | | | 452 | | | 6.00%, 05/01/2032 | | | 518 | |
| | | | | 2,219 | | | 6.00%, 09/25/2032 | | | 2,416 | |
| | | | | 98,613 | | | 6.00%, 11/01/2032 | | | 111,620 | |
| | | | | 55,682 | | | 6.00%, 02/01/2033 | | | 63,795 | |
| | | | | 311,153 | | | 6.00%, 03/01/2033 | | | 357,624 | |
| | | | | 1,019,275 | | | 6.00%, 05/01/2033 | | | 1,170,448 | |
| | | | | 8,287 | | | 6.00%, 08/01/2034 | | | 9,383 | |
| | | | | 174,092 | | | 6.00%, 01/01/2035 | | | 198,334 | |
| | | | | 3,384,646 | | | 6.00%, 02/01/2037 | | | 3,838,529 | |
| | | | | 41 | | | 6.50%, 04/01/2024 | | | 46 | |
| | | | | 218 | | | 6.50%, 04/01/2027 | | | 246 | |
| | | | | 17,049 | | | 6.50%, 04/01/2028 | | | 19,288 | |
| | | | | 136 | | | 6.50%, 05/01/2028 | | | 154 | |
| | | | | 9,056 | | | 6.50%, 10/01/2028 | | | 10,313 | |
| | | | | 158,217 | | | 6.50%, 11/01/2028 | | | 179,934 | |
| | | | | 94,332 | | | 6.50%, 12/01/2028 | | | 108,017 | |
| | | | | 454,613 | | | 6.50%, 06/25/2029(6) | | | 495,700 | |
| | | | | 279,521 | | | 6.50%, 08/01/2029 | | | 316,241 | |
| | | | | 928 | | | 6.50%, 11/01/2030 | | | 1,050 | |
| | | | | 6,304 | | | 6.50%, 05/01/2031 | | | 7,293 | |
| | | | | 230,411 | | | 6.50%, 10/25/2031 | | | 255,853 | |
| | | | | 1,483,898 | | | 6.50%, 08/01/2032 | | | 1,720,469 | |
| | | | | 55,648 | | | 6.50%, 09/01/2032 | | | 62,958 | |
| | | | | 5,720 | | | 7.00%, 06/01/2017 | | | 5,744 | |
| | | | | 932 | | | 7.00%, 11/01/2031 | | | 981 | |
| | | | | 341 | | | 7.00%, 12/01/2031 | | | 350 | |
| | | | | 271,313 | | | 7.00%, 02/01/2032 | | | 314,960 | |
| | | | | 9,129 | | | 7.50%, 06/01/2023 | | | 10,122 | |
| | | | | 2,379 | | | 8.00%, 10/01/2029 | | | 2,814 | |
| | | | | 109 | | | 8.00%, 03/01/2030 | | | 112 | |
| | | | | 7,914 | | | 8.00%, 04/01/2030 | | | 9,323 | |
| | | | | 29 | | | 8.00%, 06/01/2030 | | | 29 | |
| | | | | 18,655 | | | 8.00%, 10/01/2030 | | | 21,851 | |
| | | | | 27,672 | | | 8.00%, 12/01/2030 | | | 31,444 | |
| | | | | 45 | | | 8.50%, 04/01/2017 | | | 45 | |
| | | | | 206 | | | 9.00%, 08/01/2020 | | | 220 | |
| | | | | 19,054 | | | 9.00%, 09/01/2021 | | | 19,193 | |
| | | | | | | | | | | | |
| | | | | | | | 172,548,352 | |
| | | | | | | | | | | | |
| | | | | | | GNMA - 1.5% | |
| | | | | 299,624 | | | 4.00%, 01/20/2044(5) | | | 59,282 | |
| | | | | 1,075,634 | | | 5.00%, 01/20/2034 | | | 1,185,770 | |
| | | | | 780,364 | | | 5.00%, 05/20/2040(5) | | | 184,632 | |
| | | | | 1,267,362 | | | 5.50%, 09/20/2033 | | | 1,387,073 | |
| | | | | 572,884 | | | 6.00%, 01/15/2033 | | | 663,414 | |
| | | | | 396,040 | | | 6.00%, 02/15/2033 | | | 459,327 | |
| | | | | 47,114 | | | 6.50%, 12/15/2028 | | | 54,243 | |
| | | | | 36,453 | | | 6.50%, 05/15/2029 | | | 42,231 | |
| | | | | | | | | | | | |
Shares or Principal Amount | | Market Value† | |
| U.S. GOVERNMENT AGENCIES - 72.9% - (continued) | |
| | | | | | | GNMA - 1.5% - (continued) | |
| | $ | | | | 567,709 | | | 6.50%, 05/16/2031 | | $ | 656,480 | |
| | | | | 50,561 | | | 6.50%, 09/15/2031 | | | 57,754 | |
| | | | | 245,252 | | | 6.50%, 10/15/2031 | | | 280,144 | |
| | | | | 260,003 | | | 6.50%, 11/15/2031 | | | 296,993 | |
| | | | | 299,883 | | | 6.50%, 01/15/2032 | | | 342,547 | |
| | | | | 19,941 | | | 7.00%, 06/20/2030 | | | 22,168 | |
| | | | | 17,303 | | | 7.00%, 05/15/2032 | | | 20,756 | |
| | | | | 47,292 | | | 7.00%, 07/15/2032 | | | 52,505 | |
| | | | | 116,848 | | | 7.00%, 09/15/2032 | | | 125,019 | |
| | | | | 651,041 | | | 7.00%, 10/15/2032 | | | 740,941 | |
| | | | | 1,852 | | | 7.50%, 04/15/2022 | | | 1,858 | |
| | | | | 3,874 | | | 7.50%, 01/15/2023 | | | 3,896 | |
| | | | | 793 | | | 7.50%, 05/15/2023 | | | 846 | |
| | | | | 5,873 | | | 7.50%, 06/15/2023 | | | 6,342 | |
| | | | | 1,586 | | | 7.50%, 07/15/2023 | | | 1,592 | |
| | | | | 16,912 | | | 7.50%, 08/15/2023 | | | 17,229 | |
| | | | | 6,965 | | | 7.50%, 09/15/2023 | | | 6,990 | |
| | | | | 10,587 | | | 7.50%, 10/15/2023 | | | 11,052 | |
| | | | | 17,258 | | | 7.50%, 11/15/2023 | | | 18,208 | |
| | | | | 4,817 | | | 7.50%, 12/15/2023 | | | 4,834 | |
| | | | | 9,449 | | | 7.50%, 02/15/2024 | | | 9,806 | |
| | | | | 2,615 | | | 7.50%, 04/15/2024 | | | 2,639 | |
| | | | | 177 | | | 7.50%, 05/15/2024 | | | 192 | |
| | | | | 67,161 | | | 7.50%, 07/15/2027 | | | 74,384 | |
| | | | | 46,975 | | | 7.50%, 04/20/2030 | | | 55,075 | |
| | | | | 81 | | | 8.50%, 09/15/2019 | | | 82 | |
| | | | | 9,527 | | | 8.50%, 09/15/2024 | | | 10,619 | |
| | | | | 1,161 | | | 8.50%, 06/15/2029 | | | 1,226 | |
| | | | | 134 | | | 8.50%, 09/15/2029 | | | 134 | |
| | | | | 6,212 | | | 8.50%, 10/15/2029 | | | 6,657 | |
| | | | | 2,659 | | | 8.50%, 01/15/2030 | | | 3,020 | |
| | | | | 8,598 | | | 8.50%, 02/15/2030 | | | 8,706 | |
| | | | | 941 | | | 8.50%, 03/15/2030 | | | 1,010 | |
| | | | | | | | | | | | |
| | | | | | | | | | | 6,877,676 | |
| | | | | | | | | | | | |
| | | |
| | | | | | | | Total U.S. Government Agencies
(cost $328,099,354) | | $ | 326,938,193 | |
| | | | | | | | | | | | |
| | | |
| | | | | | | | | | | | |
| U.S. GOVERNMENT SECURITIES - 25.2% | |
| | | | | | | Other Direct Federal Obligations - 1.1% | |
| | | | | | | FHLB - 1.1% | | | |
| | $ | | | | 4,825,000 | | | 1.88%, 08/01/2019 | | $ | 4,869,969 | |
| | | | | | | | | | | | |
| | | | | | | U.S. Treasury Securities - 24.1% | |
| | | | | | | U.S. Treasury Notes - 24.1% | | | |
| | | | | 11,702,572 | | | 0.13%, 01/15/2023(8) | | | 11,616,137 | |
| | | | | 24,200,000 | | | 0.75%, 08/31/2018(7) | | | 24,050,638 | |
| | | | | 35,300,000 | | | 0.75%, 10/31/2018 | | | 35,046,264 | |
| | | | | 19,533,555 | | | 1.38%, 01/15/2020(8) | | | 20,543,713 | |
| | | | | 17,125,000 | | | 2.25%, 11/15/2025 | | | 16,905,593 | |
| | | | | | | | | | | | |
| | | | | | | | | | | 108,162,345 | |
| | | | | | | | | | | | |
| | | |
| | | | | | | | Total U.S. Government Securities
(cost $114,397,741) | | $ | 113,032,314 | |
| | | | | | | | | | | | |
| | | |
| | | | | | | | Total Long-Term Investments
(cost $524,191,863) | | $ | 522,011,418 | |
| | | | | | | | | | | | |
| | | |
| | | | | | | | | | | | |
The accompanying notes are an integral part of these financial statements.
|
| Hartford U.S. Government Securities HLS Fund |
Schedule of Investments – (continued)
December 31, 2016
| | | | | | | | | | | | |
Shares or Principal Amount | | Market Value† | |
| SHORT-TERM INVESTMENTS - 6.1% | |
| | | | | | | Other Investment Pools & Funds - 6.1% | |
| | | | | 27,174,185 | | | Fidelity Institutional Government Fund, Institutional Class | | $ | 27,174,185 | |
| | | | | | | | | | | | |
| | | | | | | | | | | | | | | | |
| | | | |
| | | | | | | | Total Short-Term Investments
(cost $27,174,185) | | | | | | $ | 27,174,185 | |
| | | | | | | | | | | | | | | | |
| | | | |
| | | | | | | | Total Investments
(cost $551,366,048)^ | | | 122.5 | % | | $ | 549,185,603 | |
| | | | | | | | Other Assets and Liabilities | | | (22.5 | )% | | | (100,957,476 | ) |
| | | | | | | | | | | | | | | | |
| | | | | | | | Total Net Assets | | | 100.0 | % | | $ | 448,228,127 | |
| | | | | | | | | | | | | | | | |
The accompanying notes are an integral part of these financial statements.
|
| Hartford U.S. Government Securities HLS Fund |
Schedule of Investments – (continued)
December 31, 2016
| Note: | Percentage of investments as shown is the ratio of the total market value to total net assets. |
| | The Fund may refer to any one or more of the industry classifications used by one or more widely recognized market indices, ratings group indices and/or as defined by Fund management. Industry classifications may not be identical across all security types. |
| | For Fund compliance purposes, the Fund may not use the same classification system shown in this report as these classifications are used for financial reporting purposes. |
| ^ | At December 31, 2016, the cost of securities for federal income tax purposes was $551,437,071 and the aggregate gross unrealized appreciation and depreciation based on that cost were: |
| | | | |
Unrealized Appreciation | | $ | 3,647,034 | |
Unrealized Depreciation | | | (5,898,502 | ) |
| | | | |
Net Unrealized Depreciation | | $ | (2,251,468 | ) |
| | | | |
| (1) | Securities issued within terms of a private placement memorandum and exempt from registration under Rule 144A under the Securities Act of 1933, as amended, and may be sold only to qualified institutional buyers. Unless otherwise indicated, these holdings are determined to be liquid. At December 31, 2016, the aggregate value of these securities was $70,446,216, which represents 15.7% of total net assets. |
| (2) | Variable rate securities; the rate reported is the coupon rate in effect at December 31, 2016. |
| (3) | This security is valued in good faith at fair value as determined under policies and procedures established by and under the supervision of the Board of Directors. At December 31, 2016, the aggregate fair value of this security was $1,285,000, which represents 0.3% of total net assets. This amount excludes securities that are principally traded in certain foreign markets and whose prices are adjusted pursuant to a third party pricing service methodology approved by the Board of Directors. |
| (4) | Represents or includes a TBA transaction. |
| (5) | Securities disclosed are interest-only strips. |
| (6) | These securities pay no principal or interest during their initial accrual period, but accrue additional principal at a specified coupon rate. |
| (7) | This security, or a portion of this security, has been pledged as collateral in connection with futures contracts. |
| (8) | The principal amount for these securities are adjusted for inflation and the interest payments equal a fixed percentage of the inflation-adjusted principal amount. |
Futures Contracts Outstanding at December 31, 2016
| | | | | | | | | | | | | | | | | | | | |
Description | | Number of
Contracts | | | Expiration
Date | | | Notional
Amount | | | Market Value† | | | Unrealized
Appreciation/
(Depreciation) | |
Long position contracts: | |
U.S. Treasury 2-Year Note Future | | | 238 | | | | 03/31/2017 | | | $ | 51,580,337 | | | $ | 51,571,625 | | | $ | (8,712 | ) |
U.S. Treasury 5-Year Note Future | | | 874 | | | | 03/31/2017 | | | | 102,983,564 | | | | 102,838,391 | | | | (145,173 | ) |
| | | | | | | | | | | | | | | | | | | | |
Total | | | $ | (153,885 | ) |
| | | | | | | | | | | | | | | | | | | | |
Short position contracts: | |
U.S. Treasury 10-Year Note Future | | | 347 | | | | 03/22/2017 | | | $ | 42,902,971 | | | $ | 43,125,594 | | | $ | (222,623 | ) |
| | | | | | | | | | | | | | | | | | | | |
Total futures contracts | | | $ | (376,508 | ) |
| | | | | | | | | | | | | | | | | | | | |
TBA Sale Commitments Outstanding at December 31, 2016
| | | | | | | | | | | | | | | | | | |
Description | | Principal
Amount | | | Maturity
Date | | | Market
Value† | | | Unrealized
Appreciation/
(Depreciation) | |
FHLMC, 3.00% | | $ | 12,000,000 | | | | 01/01/2047 | | | $ | (11,915,693 | ) | | $ | (34,755 | ) |
FHLMC, 5.50% | | | 3,700,000 | | | | 01/01/2047 | | | | (4,102,375 | ) | | | 5,781 | |
FNMA, 2.50% | | | 14,900,000 | | | | 01/01/2047 | | | | (14,175,119 | ) | | | 5,490 | |
FNMA, 3.00% | | | 12,825,000 | | | | 01/01/2047 | | | | (12,740,532 | ) | | | (8,206 | ) |
FNMA, 3.50% | | | 9,975,000 | | | | 01/01/2047 | | | | (10,223,596 | ) | | | 8,419 | |
FNMA, 4.50% | | | 21,750,000 | | | | 01/01/2047 | | | | (23,393,993 | ) | | | (631 | ) |
| | | | | | | | | | | | | | | | | | |
Total (proceeds $76,527,406) | | | $ | (76,551,308 | ) | | $ | (23,902 | ) |
| | | | | | | | | | | | | | | | | | |
The accompanying notes are an integral part of these financial statements.
|
| Hartford U.S. Government Securities HLS Fund |
Schedule of Investments – (continued)
December 31, 2016
At December 31, 2016, the aggregate market value of TBA Sale Commitments Outstanding represents (17.1)% of total net assets.
Centrally Cleared Interest Rate Swap Contracts Outstanding at December 31, 2016
| | | | | | | | | | | | | | | | | | | | | | | | | | | | | | |
Payments made by Fund | | Payments received
by Fund | | Notional
Amount | | | Expiration
Date | | | Upfront
Premiums
Paid | | | Upfront
Premiums
Received | | | Market
Value† | | | Unrealized
Appreciation/
(Depreciation) | |
3M USD LIBOR | | 1.75% Fixed | | | USD | | | | 5,050,000 | | | | 03/15/27 | | | $ | — | | | $ | (140,168) | | | $ | 286,126 | | | $ | 426,294 | |
| | | | | | | | | | | | | | | | | | | | | | | | | | | | | | |
| † | See Significant Accounting Policies of accompanying Notes to Financial Statements regarding valuation of investments. |
| | |
| GLOSSARY: (abbreviations used in preceding Schedule of Investments) |
|
| Other Abbreviations: |
CLO | | Collateralized Loan Obligation |
CMO | | Collateralized Mortgage Obligation |
FHLB | | Federal Home Loan Bank |
FHLMC | | Federal Home Loan Mortgage Corp. |
FNMA | | Federal National Mortgage Association |
GNMA | | Government National Mortgage Association |
LIBOR | | London Interbank Offered Rate |
TBA | | To Be Announced |
The accompanying notes are an integral part of these financial statements.
|
| Hartford U.S. Government Securities HLS Fund |
Schedule of Investments – (continued)
December 31, 2016
Fair Valuation Summary
The following is a summary of the fair valuations according to the inputs used as of December 31, 2016 in valuing the Fund’s investments.
| | | | | | | | | | | | | | | | |
| | | Total | | | Level 1(1) | | | Level 2(1) | | | Level 3(1) | |
Assets | | | | | | | | | | | | | | | | |
Asset & Commercial Mortgage Backed Securities | | $ | 82,040,911 | | | $ | — | | | $ | 80,755,911 | | | $ | 1,285,000 | |
U.S. Government Agencies | | | 326,938,193 | | | | — | | | | 326,938,193 | | | | — | |
U.S. Government Securities | | | 113,032,314 | | | | — | | | | 113,032,314 | | | | — | |
Short-Term Investments | | | 27,174,185 | | | | 27,174,185 | | | | — | | | | — | |
Swaps - Interest Rate(2) | | | 426,294 | | | | — | | | | 426,294 | | | | — | |
| | | | | | | | | | | | | | | | |
Total | | $ | 549,611,897 | | | $ | 27,174,185 | | | $ | 521,152,712 | | | $ | 1,285,000 | |
| | | | | | | | | | | | | | | | |
Liabilities | | | | | | | | | | | | | | | | |
Futures Contracts(2) | | $ | (376,508 | ) | | $ | (376,508 | ) | | $ | — | | | $ | — | |
TBA Sale Commitments | | | (76,551,308 | ) | | | — | | | | (76,551,308 | ) | | | — | |
| | | | | | | | | | | | | | | | |
Total | | $ | (76,927,816 | ) | | $ | (376,508 | ) | | $ | (76,551,308 | ) | | $ | — | |
| | | | | | | | | | | | | | | | |
| (1) | For the year ended December 31, 2016, there were no transfers between any levels. |
| (2) | Derivative instruments (excluding purchased and written options, if applicable) are valued at the unrealized appreciation/depreciation on the investments. |
The following is a rollforward of the Fund’s investments that were valued using unobservable inputs (Level 3) for the year ended December 31, 2016:
| | | | | | | | |
| | | Asset & Commercial
Mortgage Backed
Securities | | | Total | |
Beginning balance | | $ | — | | | $ | — | |
Purchases | | | 1,285,000 | | | | 1,285,000 | |
Sales | | | — | | | | — | |
Accrued discounts/(premiums) | | | — | | | | — | |
Total realized gain/(loss) | | | — | | | | — | |
Net change in unrealized appreciation/depreciation | | | — | | | | — | |
Transfers into Level 3 | | | — | | | | — | |
Transfers out of Level 3 | | | — | | | | — | |
| | | | | | | | |
Ending balance | | $ | 1,285,000 | | | $ | 1,285,000 | |
| | | | | | | | |
The change in net unrealized appreciation/depreciation relating to the Level 3 investments held at December 31, 2016 was $0.
The accompanying notes are an integral part of these financial statements.
Schedule of Investments
December 31, 2016
| | | | | | | | |
Shares or Principal Amount | | Market Value† | |
| COMMON STOCKS - 99.1% | |
| | | | Banks - 16.4% | |
| | 268,800 | | | Bank of America Corp. | | $ | 5,940,480 | |
| | 229,485 | | | Citigroup, Inc. | | | 13,638,294 | |
| | 291,652 | | | JP Morgan Chase & Co. | | | 25,166,651 | |
| | 48,770 | | | M&T Bank Corp. | | | 7,629,091 | |
| | 116,920 | | | PNC Financial Services Group, Inc. | | | 13,674,963 | |
| | 365,535 | | | Wells Fargo & Co. | | | 20,144,634 | |
| | | | | | | | |
| | | | | | | 86,194,113 | |
| | | | | | | | |
| | | | Capital Goods - 9.8% | |
| | 34,475 | | | 3M Co. | | | 6,156,201 | |
| | 49,790 | | | Caterpillar, Inc. | | | 4,617,525 | |
| | 122,655 | | | Eaton Corp. plc | | | 8,228,924 | |
| | 95,370 | | | Fortune Brands Home & Security, Inc. | | | 5,098,480 | |
| | 299,500 | | | General Electric Co. | | | 9,464,200 | |
| | 98,975 | | | Ingersoll-Rand plc | | | 7,427,084 | |
| | 100,770 | | | Triumph Group, Inc. | | | 2,670,405 | |
| | 71,020 | | | United Technologies Corp. | | | 7,785,212 | |
| | | | | | | | |
| | | | | | | 51,448,031 | |
| | | | | | | | |
| | | | Commercial & Professional Services - 0.8% | |
| | 103,850 | | | Nielsen Holdings plc | | | 4,356,507 | |
| | | | | | | | |
| | | | Consumer Durables & Apparel - 1.0% | |
| | 280,605 | | | PulteGroup, Inc. | | | 5,157,520 | |
| | | | | | | | |
| | | | Consumer Services - 2.6% | |
| | 319,390 | | | Hilton Worldwide Holdings, Inc. | | | 8,687,408 | |
| | 112,530 | | | Norwegian Cruise Line Holdings Ltd.* | | | 4,785,901 | |
| | | | | | | | |
| | | | | | | 13,473,309 | |
| | | | | | | | |
| | | | Diversified Financials - 5.9% | |
| | 19,405 | | | BlackRock, Inc. | | | 7,384,379 | |
| | 29,890 | | | Goldman Sachs Group, Inc. | | | 7,157,160 | |
| | 91,625 | | | Intercontinental Exchange, Inc. | | | 5,169,483 | |
| | 206,430 | | | Invesco Ltd. | | | 6,263,086 | |
| | 116,400 | | | Thomson Reuters Corp. | | | 5,095,992 | |
| | | | | | | | |
| | | | | | | 31,070,100 | |
| | | | | | | | |
| | | | Energy - 12.4% | |
| | 50,765 | | | Anadarko Petroleum Corp. | | | 3,539,843 | |
| | 123,520 | | | Canadian Natural Resources Ltd. | | | 3,937,818 | |
| | 116,055 | | | Chevron Corp. | | | 13,659,673 | |
| | 82,850 | | | EOG Resources, Inc. | | | 8,376,135 | |
| | 93,085 | | | Exxon Mobil Corp. | | | 8,401,852 | |
| | 153,335 | | | Halliburton Co. | | | 8,293,890 | |
| | 398,599 | | | Marathon Oil Corp. | | | 6,899,749 | |
| | 52,390 | | | Occidental Petroleum Corp. | | | 3,731,740 | |
| | 32,190 | | | Pioneer Natural Resources Co. | | | 5,796,453 | |
| | 230,530 | | | Southwestern Energy Co.* | | | 2,494,335 | |
| | | | | | | | |
| | | | | | | 65,131,488 | |
| | | | | | | | |
| | | | Food & Staples Retailing - 0.4% | |
| | 23,370 | | | CVS Health Corp. | | | 1,844,127 | |
| | | | | | | | |
| | | | Food, Beverage & Tobacco - 4.6% | |
| | 112,188 | | | British American Tobacco plc | | | 6,358,296 | |
| | 50,453 | | | Kraft Heinz Co. | | | 4,405,556 | |
| | 126,740 | | | Mondelez International, Inc. Class A | | | 5,618,384 | |
| | 83,480 | | | Philip Morris International, Inc. | | | 7,637,585 | |
| | | | | | | | |
| | | | | | | 24,019,821 | |
| | | | | | | | |
| | | | | | | | |
Shares or Principal Amount | | Market Value† | |
| COMMON STOCKS - 99.1% - (continued) | |
| | | | Health Care Equipment & Services - 2.9% | |
| | 104,086 | | | Medtronic plc | | $ | 7,414,046 | |
| | 47,255 | | | UnitedHealth Group, Inc. | | | 7,562,690 | |
| | | | | | | | |
| | | | | | | 14,976,736 | |
| | | | | | | | |
| | | | Insurance - 6.7% | |
| | 87,135 | | | American International Group, Inc. | | | 5,690,787 | |
| | 64,210 | | | Chubb Ltd. | | | 8,483,425 | |
| | 94,430 | | | Marsh & McLennan Cos., Inc. | | | 6,382,524 | |
| | 124,520 | | | MetLife, Inc. | | | 6,710,383 | |
| | 76,505 | | | Principal Financial Group, Inc. | | | 4,426,579 | |
| | 80,945 | | | Unum Group | | | 3,555,914 | |
| | | | | | | | |
| | | | | | | 35,249,612 | |
| | | | | | | | |
| | | | Materials - 2.7% | |
| | 35,710 | | | Agrium, Inc. | | | 3,590,641 | |
| | 121,240 | | | Dow Chemical Co. | | | 6,937,353 | |
| | 67,205 | | | International Paper Co. | | | 3,565,897 | |
| | | | | | | | |
| | | | | | | 14,093,891 | |
| | | | | | | | |
| | | | Media - 2.5% | |
| | 112,020 | | | CBS Corp. Class B | | | 7,126,713 | |
| | 89,345 | | | Comcast Corp. Class A | | | 6,169,272 | |
| | | | | | | | |
| | | | | | | 13,295,985 | |
| | | | | | | | |
| | | | Pharmaceuticals, Biotechnology & Life Sciences - 8.3% | |
| | 27,860 | | | Allergan plc* | | | 5,850,879 | |
| | 31,950 | | | Amgen, Inc. | | | 4,671,409 | |
| | 179,860 | | | AstraZeneca plc ADR | | | 4,913,775 | |
| | 110,250 | | | Bristol-Myers Squibb Co. | | | 6,443,010 | |
| | 222,010 | | | Merck & Co., Inc. | | | 13,069,729 | |
| | 80,274 | | | Pfizer, Inc. | | | 2,607,299 | |
| | 25,174 | | | Roche Holding AG | | | 5,738,478 | |
| | | | | | | | |
| | | | | | | 43,294,579 | |
| | | | | | | | |
| | | | Retailing - 3.1% | |
| | 34,750 | | | Home Depot, Inc. | | | 4,659,280 | |
| | 193,450 | | | Liberty Interactive Corp. QVC Group Class A* | | | 3,865,131 | |
| | 58,520 | | | Lowe’s Cos., Inc. | | | 4,161,943 | |
| | 39,190 | | | Signet Jewelers Ltd. | | | 3,694,049 | |
| | | | | | | | |
| | | | | | | 16,380,403 | |
| | | | | | | | |
| | | | Semiconductors & Semiconductor Equipment - 5.6% | |
| | 43,850 | | | Analog Devices, Inc. | | | 3,184,387 | |
| | 303,990 | | | Intel Corp. | | | 11,025,717 | |
| | 173,265 | | | Maxim Integrated Products, Inc. | | | 6,682,831 | |
| | 131,670 | | | QUALCOMM, Inc. | | | 8,584,884 | |
| | | | | | | | |
| | | | | | | 29,477,819 | |
| | | | | | | | |
| | | | Software & Services - 2.8% | |
| | 105,860 | | | Cognizant Technology Solutions Corp. Class A* | | | 5,931,336 | |
| | 90,020 | | | eBay, Inc.* | | | 2,672,694 | |
| | 93,305 | | | Microsoft Corp. | | | 5,797,972 | |
| | | | | | | | |
| | | | | | | 14,402,002 | |
| | | | | | | | |
| | | | Technology Hardware & Equipment - 4.3% | |
| | 31,340 | | | Apple, Inc. | | | 3,629,799 | |
| | 501,520 | | | Cisco Systems, Inc. | | | 15,155,934 | |
| | 794,210 | | | Nokia Oyj ADR | | | 3,820,150 | |
| | | | | | | | |
| | | | | | | 22,605,883 | |
| | | | | | | | |
The accompanying notes are an integral part of these financial statements.
Schedule of Investments – (continued)
December 31, 2016
| | | | | | | | |
Shares or Principal Amount | | Market Value† | |
| COMMON STOCKS - 99.1% - (continued) | |
| | | | Telecommunication Services - 1.6% | | | |
| | 159,550 | | | Verizon Communications, Inc. | | $ | 8,516,779 | |
| | | | | | | | |
| | | | Transportation - 1.3% | |
| | 65,020 | | | Union Pacific Corp. | | | 6,741,274 | |
| | | | | | | | |
| | | | Utilities - 3.4% | |
| | 37,740 | | | Dominion Resources, Inc. | | | 2,890,507 | |
| | 71,980 | | | Edison International | | | 5,181,840 | |
| | 120,805 | | | Eversource Energy | | | 6,672,060 | |
| | 26,415 | | | NextEra Energy, Inc. | | | 3,155,536 | |
| | | | | | | | |
| | | | | | | 17,899,943 | |
| | | | | | | | |
| | |
| | | | Total Common Stocks
(cost $395,373,015) | | $ | 519,629,922 | |
| | | | | | | | |
| | |
| | | | Total Long-Term Investments
(cost $395,373,015) | | $ | 519,629,922 | |
| | | | | | | | |
|
| SHORT-TERM INVESTMENTS - 1.2% | |
| | | | Other Investment Pools & Funds - 1.2% | |
| | 5,944,317 | | | BlackRock Liquidity Funds TempFund Portfolio, Institutional Class | | $ | 5,944,317 | |
| | | | | | | | |
| | |
| | | | Total Short-Term Investments
(cost $5,944,317) | | $ | 5,944,317 | |
| | | | | | | | |
| | | | | | | | | | | | |
| | | |
| | | | Total Investments
(cost $401,317,332)^ | | | 100.3 | % | | $ | 525,574,239 | |
| | | | Other Assets and Liabilities | | | (0.3 | )% | | | (1,367,566 | ) |
| | | | | | | | | | | | |
| | | | Total Net Assets | | | 100.0 | % | | $ | 524,206,673 | |
| | | | | | | | | | | | |
The accompanying notes are an integral part of these financial statements.
Schedule of Investments – (continued)
December 31, 2016
| Note: | Percentage of investments as shown is the ratio of the total market value to total net assets. |
| | Prices of foreign equities that are principally traded on certain foreign markets will generally be adjusted daily pursuant to a fair value pricing service approved by the Board of Directors in order to reflect an adjustment for factors occurring after the close of certain foreign markets but before the close of the New York Stock Exchange. |
| | Equity industry classifications used in this report are the Global Industry Classification Standard, which was developed by and is the exclusive property and service mark of MSCI, Inc. and Standard & Poor’s. |
| | For Fund compliance purposes, the Fund may not use the same classification system shown in this report as these classifications are used for financial reporting purposes. |
| ^ | At December 31, 2016, the cost of securities for federal income tax purposes was $403,345,300 and the aggregate gross unrealized appreciation and depreciation based on that cost were: |
| | | | |
Unrealized Appreciation | | $ | 140,526,736 | |
Unrealized Depreciation | | | (18,297,797 | ) |
| | | | |
Net Unrealized Appreciation | | $ | 122,228,939 | |
| | | | |
| † | See Significant Accounting Policies of accompanying Notes to Financial Statements regarding valuation of investments. |
| | |
| GLOSSARY: (abbreviations used in preceding Schedule of Investments) |
|
| Other Abbreviations: |
ADR | | American Depositary Receipt |
The accompanying notes are an integral part of these financial statements.
Schedule of Investments – (continued)
December 31, 2016
Fair Valuation Summary
The following is a summary of the fair valuations according to the inputs used as of December 31, 2016 in valuing the Fund’s investments.
| | | | | | | | | | | | | | | | |
| | | Total | | | Level 1(1) | | | Level 2(1) | | | Level 3(1) | |
Assets | | | | | | | | | | | | | | | | |
Common Stocks | | | | | | | | | | | | | | | | |
Banks | | $ | 86,194,113 | | | $ | 86,194,113 | | | $ | — | | | $ | — | |
Capital Goods | | | 51,448,031 | | | | 51,448,031 | | | | — | | | | — | |
Commercial & Professional Services | | | 4,356,507 | | | | 4,356,507 | | | | — | | | | — | |
Consumer Durables & Apparel | | | 5,157,520 | | | | 5,157,520 | | | | — | | | | — | |
Consumer Services | | | 13,473,309 | | | | 13,473,309 | | | | — | | | | — | |
Diversified Financials | | | 31,070,100 | | | | 31,070,100 | | | | — | | | | — | |
Energy | | | 65,131,488 | | | | 65,131,488 | | | | — | | | | — | |
Food & Staples Retailing | | | 1,844,127 | | | | 1,844,127 | | | | — | | | | — | |
Food, Beverage & Tobacco | | | 24,019,821 | | | | 17,661,525 | | | | 6,358,296 | | | | — | |
Health Care Equipment & Services | | | 14,976,736 | | | | 14,976,736 | | | | — | | | | — | |
Insurance | | | 35,249,612 | | | | 35,249,612 | | | | — | | | | — | |
Materials | | | 14,093,891 | | | | 14,093,891 | | | | — | | | | — | |
Media | | | 13,295,985 | | | | 13,295,985 | | | | — | | | | — | |
Pharmaceuticals, Biotechnology & Life Sciences | | | 43,294,579 | | | | 37,556,101 | | | | 5,738,478 | | | | — | |
Retailing | | | 16,380,403 | | | | 16,380,403 | | | | — | | | | — | |
Semiconductors & Semiconductor Equipment | | | 29,477,819 | | | | 29,477,819 | | | | — | | | | — | |
Software & Services | | | 14,402,002 | | | | 14,402,002 | | | | — | | | | — | |
Technology Hardware & Equipment | | | 22,605,883 | | | | 22,605,883 | | | | — | | | | — | |
Telecommunication Services | | | 8,516,779 | | | | 8,516,779 | | | | — | | | | — | |
Transportation | | | 6,741,274 | | | | 6,741,274 | | | | — | | | | — | |
Utilities | | | 17,899,943 | | | | 17,899,943 | | | | — | | | | — | |
Short-Term Investments | | | 5,944,317 | | | | 5,944,317 | | | | — | | | | — | |
| | | | | | | | | | | | | | | | |
Total | | $ | 525,574,239 | | | $ | 513,477,465 | | | $ | 12,096,774 | | | $ | — | |
| | | | | | | | | | | | | | | | |
| (1) | For the year ended December 31, 2016, there were no transfers between any levels. |
The following is a rollforward of the Fund’s investments that were valued using unobservable inputs (Level 3) for the year ended December 31, 2016:
| | | | | | | | |
| | | Common
Stocks | | | Total | |
Beginning balance | | $ | 49,723 | | | $ | 49,723 | |
Purchases | | | — | | | | — | |
Sales | | | (55,248 | ) | | | (55,248 | ) |
Accrued discounts/(premiums) | | | — | | | | — | |
Total realized gain/(loss) | | | (12,221 | ) | | | (12,221 | ) |
Net change in unrealized appreciation/depreciation | | | 17,746 | | | | 17,746 | |
Transfers into Level 3 | | | — | | | | — | |
Transfers out of Level 3 | | | — | | | | — | |
| | | | | | | | |
Ending balance | | $ | — | | | $ | — | |
| | | | | | | | |
The change in net unrealized appreciation/depreciation relating to the Level 3 investments held at December 31, 2016 was $0.
The accompanying notes are an integral part of these financial statements.
Statements of Assets and Liabilities
December 31, 2016
| | | | | | | | | | | | |
| | |
Hartford
Balanced HLS
Fund | | | Hartford
Capital Appreciation
HLS Fund | | | Hartford
Disciplined Equity
HLS Fund | |
Assets: | | | | | | | | | | | | |
Investments in securities, at market value | | $ | 2,315,371,783 | | | $ | 5,135,671,256 | | | $ | 670,064,621 | |
Cash | | | 106,316 | | | | — | | | | — | |
Cash collateral due from broker | | | — | | | | — | | | | — | |
Foreign currency | | | — | | | | 140,619 | | | | — | |
Unrealized appreciation on foreign currency contracts | | | — | | | | 1,062,399 | | | | — | |
Receivables: | | | | | | | | | | | | |
Investment securities sold | | | — | | | | 59,817,734 | | | | 2,372,603 | |
Fund shares sold | | | 52,542 | | | | 129,304 | | | | 4,149 | |
Dividends and interest | | | 9,328,744 | | | | 6,180,591 | | | | 789,702 | |
Other assets | | | 5,016 | | | | 22,967 | | | | 13,479 | |
| | | | | | | | | | | | |
Total assets | | | 2,324,864,401 | | | | 5,203,024,870 | | | | 673,244,554 | |
| | | | | | | | | | | | |
Liabilities: | | | | | | | | | | | | |
Unrealized depreciation on foreign currency contracts | | | — | | | | 71,825 | | | | — | |
Payables: | | | | | | | | | | | | |
Investment securities purchased | | | 1,989,039 | | | | 24,878,355 | | | | 3,665,457 | |
Fund shares redeemed | | | 1,817,424 | | | | 39,487,513 | | | | 615,260 | |
Investment management fees | | | 1,187,387 | | | | 2,862,126 | | | | 418,825 | |
Transfer agent fees | | | 477 | | | | 865 | | | | 455 | |
Accounting services fees | | | 31,597 | | | | 79,684 | | | | 6,881 | |
Board of Directors’ fees | | | 8,871 | | | | 20,463 | | | | 2,516 | |
Variation margin on financial derivative instruments | | | 44,334 | | | | — | | | | — | |
Distribution fees | | | 58,709 | | | | 124,330 | | | | 17,401 | |
Accrued expenses | | | 245,448 | | | | 445,236 | | | | 124,249 | |
| | | | | | | | | | | | |
Total liabilities | | | 5,383,286 | | | | 67,970,397 | | | | 4,851,044 | |
| | | | | | | | | | | | |
Net assets | | $ | 2,319,481,115 | | | $ | 5,135,054,473 | | | $ | 668,393,510 | |
| | | | | | | | | | | | |
Summary of Net Assets: | | | | | | | | | | | | |
Capital stock and paid-in-capital | | $ | 2,002,160,844 | | | $ | 4,825,800,705 | | | $ | 479,083,247 | |
Undistributed (distributions in excess of) net investment income | | | 11,750,519 | | | | 9,234,251 | | | | 181,803 | |
Accumulated net realized gain (loss) | | | (94,210,916 | ) | | | (9,741,799 | ) | | | 65,091,095 | |
Unrealized appreciation (depreciation) of investments and the translation of assets and liabilities denominated in foreign currency | | | 399,780,668 | | | | 309,761,316 | | | | 124,037,365 | |
| | | | | | | | | | | | |
Net assets | | $ | 2,319,481,115 | | | $ | 5,135,054,473 | | | $ | 668,393,510 | |
| | | | | | | | | | | | |
Shares authorized | | | 9,700,000,000 | | | | 5,450,000,000 | | | | 3,500,000,000 | |
| | | | | | | | | | | | |
Par value | | $ | 0.0010 | | | $ | 0.0010 | | | $ | 0.0010 | |
| | | | | | | | | | | | |
Class IA: Net asset value per share | | $ | 27.46 | | | $ | 42.05 | | | $ | 14.30 | |
| | | | | | | | | | | | |
Shares outstanding | | | 74,418,785 | | | | 108,337,344 | | | | 41,050,983 | |
| | | | | | | | | | | | |
Net Assets | | $ | 2,043,555,682 | | | $ | 4,555,454,163 | | | $ | 587,089,046 | |
| | | | | | | | | | | | |
Class IB: Net asset value per share | | $ | 27.86 | | | $ | 41.50 | | | $ | 14.17 | |
| | | | | | | | | | | | |
Shares outstanding | | | 9,905,552 | | | | 13,447,299 | | | | 5,736,550 | |
| | | | | | | | | | | | |
Net Assets | | $ | 275,925,433 | | | $ | 558,021,549 | | | $ | 81,304,464 | |
| | | | | | | | | | | | |
Class IC: Net asset value per share | | $ | — | | | $ | 41.76 | | | $ | — | |
| | | | | | | | | | | | |
Shares outstanding | | | — | | | | 516,780 | | | | — | |
| | | | | | | | | | | | |
Net Assets | | $ | — | | | $ | 21,578,761 | | | $ | — | |
| | | | | | | | | | | | |
Cost of investments | | $ | 1,915,348,144 | | | $ | 4,826,629,995 | | | $ | 546,027,256 | |
Cost of foreign currency | | $ | — | | | $ | 139,915 | | | $ | — | |
The accompanying notes are an integral part of these financial statements.
Statements of Assets and Liabilities – (continued)
December 31, 2016
| | | | | | | | | | | | | | | | | | | | | | | | | | |
Hartford
Dividend and
Growth HLS
Fund | | | Hartford
Global Growth HLS
Fund | | | Hartford
Growth Opportunities
HLS Fund | | | Hartford
Healthcare HLS
Fund | | | Hartford
High Yield
HLS Fund | | | Hartford
International
Opportunities
HLS Fund | | | Hartford
MidCap HLS
Fund | |
| | | | | | | | | | | | | | | | | | | | | | | | | | |
| $ | 3,444,382,504 | | | $ | 421,207,891 | | | $ | 1,311,952,823 | | | $ | 291,260,031 | | | $ | 317,056,151 | | | $ | 1,231,426,620 | | | $ | 1,814,382,695 | |
| | 44,710 | | | | — | | | | — | | | | — | | | | — | | | | — | | | | — | |
| | — | | | | — | | | | — | | | | — | | | | 606,416 | | | | — | | | | — | |
| | — | | | | 116,076 | | | | — | | | | — | | | | — | | | | 745,302 | | | | — | |
| | — | | | | — | | | | — | | | | — | | | | — | | | | — | | | | — | |
| | | | | | | | | | | | | | | | | | | | | | | | | | |
| | 9,131,161 | | | | — | | | | 1,550,757 | | | | 7,451 | | | | 5,778 | | | | 1,371,980 | | | | — | |
| | 237,846 | | | | 83,659 | | | | 541,182 | | | | 6,378 | | | | 2,115 | | | | 407,689 | | | | 1,082,503 | |
| | 4,691,618 | | | | 731,329 | | | | 401,353 | | | | 185,034 | | | | 5,144,875 | | | | 3,063,769 | | | | 976,233 | |
| | 3,475 | | | | 14,531 | | | | 18,926 | | | | 14,618 | | | | 14,994 | | | | 11,179 | | | | 8,898 | |
| | | | | | | | | | | | | | | | | | | | | | | | | | |
| | 3,458,491,314 | | | | 422,153,486 | | | | 1,314,465,041 | | | | 291,473,512 | | | | 322,830,329 | | | | 1,237,026,539 | | | | 1,816,450,329 | |
| | | | | | | | | | | | | | | | | | | | | | | | | | |
| | | | | | | | | | | | | | | | | | | | | | | | | | |
| | — | | | | — | | | | — | | | | — | | | | 41,438 | | | | — | | | | — | |
| | | | | | | | | | | | | | | | | | | | | | | | | | |
| | 2,430,458 | | | | 214,477 | | | | 9,746,398 | | | | — | | | | — | | | | 1,429,946 | | | | — | |
| | 1,756,257 | | | | 1,632,081 | | | | 944,922 | | | | 562,974 | | | | 678,768 | | | | 484,697 | | | | 673,742 | |
| | 1,890,480 | | | | 272,682 | | | | 682,794 | | | | 209,362 | | | | 190,613 | | | | 726,431 | | | | 1,042,366 | |
| | 518 | | | | 453 | | | | 689 | | | | 455 | | | | 485 | | | | 592 | | | | 529 | |
| | 34,951 | | | | 5,061 | | | | 11,239 | | | | 2,485 | | | | 5,446 | | | | 16,699 | | | | 15,492 | |
| | 12,117 | | | | 1,666 | | | | 5,310 | | | | 1,158 | | | | 1,263 | | | | 4,826 | | | | 6,536 | |
| | — | | | | — | | | | — | | | | — | | | | 7,861 | | | | — | | | | — | |
| | 93,592 | | | | 15,609 | | | | 34,139 | | | | 9,396 | | | | 16,409 | | | | 31,251 | | | | 19,981 | |
| | 284,688 | | | | 105,351 | | | | 163,793 | | | | 44,604 | | | | 103,052 | | | | 226,905 | | | | 95,425 | |
| | | | | | | | | | | | | | | | | | | | | | | | | | |
| | 6,503,061 | | | | 2,247,380 | | | | 11,589,284 | | | | 830,434 | | | | 1,045,335 | | | | 2,921,347 | | | | 1,854,071 | |
| | | | | | | | | | | | | | | | | | | | | | | | | | |
| $ | 3,451,988,253 | | | $ | 419,906,106 | | | $ | 1,302,875,757 | | | $ | 290,643,078 | | | $ | 321,784,994 | | | $ | 1,234,105,192 | | | $ | 1,814,596,258 | |
| | | | | | | | | | | | | | | | | | | | | | | | | | |
| | | | | | | | | | | | | | | | | | | | | | | | | | |
| $ | 2,231,683,923 | | | $ | 342,225,921 | | | $ | 1,192,705,484 | | | $ | 229,747,909 | | | $ | 331,774,594 | | | $ | 1,486,503,957 | | | $ | 1,365,912,325 | |
| | 406,191 | | | | 2,331,234 | | | | (341,766 | ) | | | (207,735 | ) | | | 18,064,801 | | | | 20,907,509 | | | | 20,852 | |
| | 222,907,602 | | | | 21,938,593 | | | | 5,582,361 | | | | 43,736,684 | | | | (30,418,372 | ) | | | (307,025,978 | ) | | | 64,991,083 | |
|
996,990,537 |
| | | 53,410,358 | | | | 104,929,678 | | | | 17,366,220 | | | | 2,363,971 | | | | 33,719,704 | | | | 383,671,998 | |
| | | | | | | | | | | | | | | | | | | | | | | | | | |
| $ | 3,451,988,253 | | | $ | 419,906,106 | | | $ | 1,302,875,757 | | | $ | 290,643,078 | | | $ | 321,784,994 | | | $ | 1,234,105,192 | | | $ | 1,814,596,258 | |
| | | | | | | | | | | | | | | | | | | | | | | | | | |
| | 4,200,000,000 | | | | 3,600,000,000 | | | | 900,000,000 | | | | 800,000,000 | | | | 2,800,000,000 | | | | 2,825,000,000 | | | | 2,600,000,000 | |
| | | | | | | | | | | | | | | | | | | | | | | | | | |
| $ | 0.0010 | | | $ | 0.0010 | | | $ | 0.0010 | | | $ | 0.0010 | | | $ | 0.0010 | | | $ | 0.0010 | | | $ | 0.0010 | |
| | | | | | | | | | | | | | | | | | | | | | | | | | |
| $ | 22.10 | | | $ | 22.14 | | | $ | 29.83 | | | $ | 21.46 | | | $ | 8.11 | | | $ | 14.14 | | | $ | 33.83 | |
| | | | | | | | | | | | | | | | | | | | | | | | | | |
| | 136,399,643 | | | | 15,688,211 | | | | 38,393,394 | | | | 11,488,265 | | | | 30,109,759 | | | | 76,870,243 | | | | 50,877,900 | |
| | | | | | | | | | | | | | | | | | | | | | | | | | |
| $ | 3,013,788,222 | | | $ | 347,375,312 | | | $ | 1,145,176,230 | | | $ | 246,494,398 | | | $ | 244,211,667 | | | $ | 1,086,762,263 | | | $ | 1,721,028,936 | |
| | | | | | | | | | | | | | | | | | | | | | | | | | |
| $ | 22.01 | | | $ | 21.95 | | | $ | 28.74 | | | $ | 20.60 | | | $ | 7.98 | | | $ | 14.31 | | | $ | 33.17 | |
| | | | | | | | | | | | | | | | | | | | | | | | | | |
| | 19,909,496 | | | | 3,304,936 | | | | 4,597,373 | | | | 2,143,553 | | | | 9,720,355 | | | | 10,295,311 | | | | 2,820,875 | |
| | | | | | | | | | | | | | | | | | | | | | | | | | |
| $ | 438,200,031 | | | $ | 72,530,794 | | | $ | 132,149,487 | | | $ | 44,148,680 | | | $ | 77,573,327 | | | $ | 147,342,929 | | | $ | 93,567,322 | |
| | | | | | | | | | | | | | | | | | | | | | | | | | |
| $ | — | | | $ | — | | | $ | 29.43 | | | $ | — | | | $ | — | | | $ | — | | | $ | — | |
| | | | | | | | | | | | | | | | | | | | | | | | | | |
| | — | | | | — | | | | 868,147 | | | | — | | | | — | | | | — | | | | — | |
| | | | | | | | | | | | | | | | | | | | | | | | | | |
| $ | — | | | $ | — | | | $ | 25,550,040 | | | $ | — | | | $ | — | | | $ | — | | | $ | — | |
| | | | | | | | | | | | | | | | | | | | | | | | | | |
| $ | 2,447,392,793 | | | $ | 367,739,725 | | | $ | 1,207,009,608 | | | $ | 273,892,295 | | | $ | 314,951,748 | | | $ | 1,197,387,705 | | | $ | 1,430,710,697 | |
| $ | — | | | $ | 116,289 | | | $ | — | | | $ | — | | | $ | — | | | $ | 746,684 | | | $ | — | |
The accompanying notes are an integral part of these financial statements.
Statements of Assets and Liabilities – (continued)
December 31, 2016
| | | | | | | | | | | | |
| | |
Hartford
MidCap Value
HLS Fund | | | Hartford
Small Cap Growth
HLS Fund | | | Hartford
Small Company
HLS Fund | |
Assets: | | | | | | | | | | | | |
Investments in securities, at market value | | $ | 377,921,286 | | | $ | 1,202,204,694 | | | $ | 905,587,484 | |
Cash | | | — | | | | 412,997 | | | | — | |
Cash collateral due from broker | | | — | | | | — | | | | — | |
Foreign currency | | | 11 | | | | — | | | | 4 | |
Unrealized appreciation on OTC swap contracts | | | — | | | | — | | | | — | |
Unrealized appreciation on foreign currency contracts | | | — | | | | — | | | | — | |
Receivables: | | | | | | | | | | | | |
Investment securities sold | | | 2,842,917 | | | | 2,083,558 | | | | 1,610,064 | |
Fund shares sold | | | 32 | | | | 363,872 | | | | 865,542 | |
Dividends and interest | | | 383,229 | | | | 786,565 | | | | 724,838 | |
Variation margin on financial derivative instruments | | | — | | | | — | | | | — | |
OTC swap premiums paid | | | — | | | | — | | | | — | |
Other assets | | | 14,872 | | | | 17,557 | | | | 11,360 | |
| | | | | | | | | | | | |
Total assets | | | 381,162,347 | | | | 1,205,869,243 | | | | 908,799,292 | |
| | | | | | | | | | | | |
Liabilities: | | | | | | | | | | | | |
Unrealized depreciation on foreign currency contracts | | | — | | | | — | | | | — | |
Bank overdraft - foreign cash | | | — | | | | — | | | | — | |
Unrealized depreciation on OTC swap contracts | | | — | | | | — | | | | — | |
Cash collateral due to broker | | | — | | | | — | | | | — | |
TBA sale commitments, at market value | | | — | | | | — | | | | — | |
Payables: | | | | | | | | | | | | |
Investment securities purchased | | | 756,760 | | | | 2,983,849 | | | | 638,633 | |
Fund shares redeemed | | | 470,461 | | | | 2,974,545 | | | | 317,531 | |
Investment management fees | | | 261,893 | | | | 622,770 | | | | 561,454 | |
Transfer agent fees | | | 431 | | | | 695 | | | | 592 | |
Accounting services fees | | | 3,274 | | | | 12,286 | | | | 9,417 | |
Board of Directors’ fees | | | 1,346 | | | | 4,230 | | | | 3,350 | |
Variation margin on financial derivative instruments | | | — | | | | — | | | | — | |
Distribution fees | | | 19,321 | | | | 48,409 | | | | 15,793 | |
Accrued expenses | | | 72,825 | | | | 90,152 | | | | 100,108 | |
OTC swap premiums received | | | — | | | | — | | | | — | |
| | | | | | | | | | | | |
Total liabilities | | | 1,586,311 | | | | 6,736,936 | | | | 1,646,878 | |
| | | | | | | | | | | | |
Net assets | | $ | 379,576,036 | | | $ | 1,199,132,307 | | | $ | 907,152,414 | |
| | | | | | | | | | | | |
Summary of Net Assets: | | | | | | | | | | | | |
Capital stock and paid-in-capital | | $ | 290,745,141 | | | $ | 1,065,768,438 | | | $ | 927,301,015 | |
Undistributed (distributions in excess of) net investment income | | | 1,962,506 | | | | 1,097,782 | | | | — | |
Accumulated net realized gain (loss) | | | 23,183,268 | | | | (18,406,950 | ) | | | (99,762,839 | ) |
Unrealized appreciation (depreciation) of investments and the translation of assets and liabilities denominated in foreign currency | | | 63,685,121 | | | | 150,673,037 | | | | 79,614,238 | |
| | | | | | | | | | | | |
Net assets | | $ | 379,576,036 | | | $ | 1,199,132,307 | | | $ | 907,152,414 | |
| | | | | | | | | | | | |
Shares authorized | | | 1,200,000,000 | | | | 700,000,000 | | | | 1,500,000,000 | |
| | | | | | | | | | | | |
Par value | | $ | 0.0010 | | | $ | 0.0010 | | | $ | 0.0010 | |
| | | | | | | | | | | | |
Class IA: Net asset value per share | | $ | 12.00 | | | $ | 26.77 | | | $ | 16.16 | |
| | | | | | | | | | | | |
Shares outstanding | | | 24,162,720 | | | | 36,333,816 | | | | 51,596,463 | |
| | | | | | | | | | | | |
Net Assets | | $ | 289,871,754 | | | $ | 972,575,785 | | | $ | 834,043,936 | |
| | | | | | | | | | | | |
Class IB: Net asset value per share | | $ | 11.91 | | | $ | 26.12 | | | $ | 15.05 | |
| | | | | | | | | | | | |
Shares outstanding | | | 7,533,394 | | | | 8,673,976 | | | | 4,856,554 | |
| | | | | | | | | | | | |
Net Assets | | $ | 89,704,282 | | | $ | 226,556,522 | | | $ | 73,108,478 | |
| | | | | | | | | | | | |
Cost of investments | | $ | 314,234,086 | | | $ | 1,051,531,657 | | | $ | 825,973,246 | |
Cost of foreign currency | | $ | 12 | | | $ | — | | | $ | 4 | |
Cost of bank overdraft - foreign cash | | $ | — | | | $ | — | | | $ | — | |
Proceeds of TBA sale commitments | | $ | — | | | $ | — | | | $ | — | |
The accompanying notes are an integral part of these financial statements.
Statements of Assets and Liabilities – (continued)
December 31, 2016
| | | | | | | | | | | | | | | | | | | | | | |
Hartford
Small/Mid Cap
Equity HLS Fund | | | Hartford
Stock HLS Fund | | | Hartford
Total Return Bond
HLS Fund | | | Hartford
Ultrashort Bond
HLS Fund | | | Hartford
U.S. Government
Securities HLS
Fund | | | Hartford
Value HLS Fund | |
| | | | | | | | | | | | | | | | | | | | | | |
| $ | 106,305,520 | | | $ | 1,458,722,097 | | | $ | 3,243,742,194 | | | $ | 611,247,892 | | | $ | 549,185,603 | | | $ | 525,574,239 | |
| | — | | | | — | | | | 357,168 | | | | 14,284 | | | | — | | | | 40,110 | |
| | — | | | | — | | | | 250,000 | | | | — | | | | 292,105 | | | | — | |
| | — | | | | 130,544 | | | | 20,421 | | | | — | | | | — | | | | — | |
| | — | | | | — | | | | 8,252,568 | | | | — | | | | — | | | | — | |
| | — | | | | — | | | | 5,008,810 | | | | — | | | | — | | | | — | |
| | | | | | | | | | | | | | | | | | | | | | |
| | — | | | | — | | | | 850,430,314 | | | | — | | | | 100,103,894 | | | | — | |
| | 275,911 | | | | 4,319 | | | | 167,051 | | | | 5,381 | | | | 38,483 | | | | 31,154 | |
| | 169,659 | | | | 3,172,179 | | | | 15,467,776 | | | | 1,222,259 | | | | 1,238,508 | | | | 843,366 | |
| | — | | | | — | | | | 455,817 | | | | — | | | | 21,723 | | | | — | |
| | — | | | | — | | | | 10,645,186 | | | | — | | | | — | | | | — | |
| | 19,020 | | | | 8,561 | | | | 5,422 | | | | 13,823 | | | | 15,086 | | | | 17,584 | |
| | | | | | | | | | | | | | | | | | | | | | |
| | 106,770,110 | | | | 1,462,037,700 | | | | 4,134,802,727 | | | | 612,503,639 | | | | 650,895,402 | | | | 526,506,453 | |
| | | | | | | | | | | | | | | | | | | | | | |
| | | | | | | | | | | | | | | | | | | | | | |
| | — | | | | — | | | | 1,514,097 | | | | — | | | | — | | | | — | |
| | — | | | | — | | | | 20,368 | | | | — | | | | — | | | | — | |
| | — | | | | — | | | | 3,788,597 | | | | — | | | | — | | | | — | |
| | — | | | | — | | | | 2,659,000 | | | | — | | | | — | | | | — | |
| | — | | | | — | | | | 142,038,159 | | | | — | | | | 76,551,308 | | | | — | |
| | | | | | | | | | | | | | | | | | | | | | |
| | 1,706,905 | | | | — | | | | 1,459,336,341 | | | | — | | | | 125,615,594 | | | | 1,466,696 | |
| | 82,926 | | | | 8,265,061 | | | | 1,259,988 | | | | 416,048 | | | | 197,455 | | | | 388,109 | |
| | 69,292 | | | | 599,335 | | | | 985,659 | | | | 208,793 | | | | 172,639 | | | | 334,502 | |
| | 417 | | | | 448 | | | | 514 | | | | 459 | | | | 439 | | | | 493 | |
| | 1,213 | | | | 12,495 | | | | 42,160 | | | | 5,220 | | | | 4,604 | | | | 4,485 | |
| | 340 | | | | 5,494 | | | | 9,870 | | | | 2,366 | | | | 1,803 | | | | 1,894 | |
| | — | | | | — | | | | 66,593 | | | | — | | | | — | | | | — | |
| | 3,633 | | | | 30,116 | | | | 55,544 | | | | 16,831 | | | | 16,927 | | | | 16,591 | |
| | 28,556 | | | | 181,464 | | | | 281,913 | | | | 104,625 | | | | 106,506 | | | | 87,010 | |
| | — | | | | — | | | | 16,051,566 | | | | — | | | | — | | | | — | |
| | | | | | | | | | | | | | | | | | | | | | |
| | 1,893,282 | | | | 9,094,413 | | | | 1,628,110,369 | | | | 754,342 | | | | 202,667,275 | | | | 2,299,780 | |
| | | | | | | | | | | | | | | | | | | | | | |
| $ | 104,876,828 | | | $ | 1,452,943,287 | | | $ | 2,506,692,358 | | | $ | 611,749,297 | | | $ | 448,228,127 | | | $ | 524,206,673 | |
| | | | | | | | | | | | | | | | | | | | | | |
| | | | | | | | | | | | | | | | | | | | | | |
| $ | 86,636,668 | | | $ | 1,342,250,796 | | | $ | 2,445,371,135 | | | $ | 608,281,570 | | | $ | 549,105,645 | | | $ | 366,188,394 | |
| | 1,102,708 | | | | 724,929 | | | | 69,347,138 | | | | 4,216,358 | | | | 8,912,051 | | | | 879,487 | |
| | 2,790,993 | | | | (138,692,964 | ) | | | (18,396,409 | ) | | | (667,792 | ) | | | (107,635,008 | ) | | | 32,897,439 | |
|
14,346,459 |
| | | 248,660,526 | | | | 10,370,494 | | | | (80,839 | ) | | | (2,154,561 | ) | | | 124,241,353 | |
| | | | | | | | | | | | | | | | | | | | | | |
| $ | 104,876,828 | | | $ | 1,452,943,287 | | | $ | 2,506,692,358 | | | $ | 611,749,297 | | | $ | 448,228,127 | | | $ | 524,206,673 | |
| | | | | | | | | | | | | | | | | | | | | | |
| | 900,000,000 | | | | 4,200,000,000 | | | | 5,000,000,000 | | | | 14,000,000,000 | | | | 700,000,000 | | | | 800,000,000 | |
| | | | | | | | | | | | | | | | | | | | | | |
| $ | 0.0010 | | | $ | 0.0010 | | | $ | 0.0010 | | | $ | 0.0010 | | | $ | 0.0010 | | | $ | 0.0010 | |
| | | | | | | | | | | | | | | | | | | | | | |
| $ | 8.03 | | | $ | 67.55 | | | $ | 11.09 | | | $ | 10.04 | | | $ | 10.30 | | | $ | 15.27 | |
| | | | | | | | | | | | | | | | | | | | | | |
| | 10,921,897 | | | | 19,431,615 | | | | 202,418,104 | | | | 53,102,329 | | | | 35,786,830 | | | | 29,231,994 | |
| | | | | | | | | | | | | | | | | | | | | | |
| $ | 87,752,302 | | | $ | 1,312,626,125 | | | $ | 2,244,505,181 | | | $ | 533,091,199 | | | $ | 368,739,611 | | | $ | 446,410,935 | |
| | | | | | | | | | | | | | | | | | | | | | |
| $ | 7.99 | | | $ | 67.53 | | | $ | 11.03 | | | $ | 10.02 | | | $ | 10.28 | | | $ | 15.26 | |
| | | | | | | | | | | | | | | | | | | | | | |
| | 2,144,309 | | | | 2,077,852 | | | | 23,777,106 | | | | 7,848,297 | | | | 7,730,044 | | | | 5,099,682 | |
| | | | | | | | | | | | | | | | | | | | | | |
| $ | 17,124,526 | | | $ | 140,317,162 | | | $ | 262,187,177 | | | $ | 78,658,098 | | | $ | 79,488,516 | | | $ | 77,795,738 | |
| | | | | | | | | | | | | | | | | | | | | | |
| $ | 91,959,061 | | | $ | 1,209,966,173 | | | $ | 3,242,058,289 | | | $ | 611,328,731 | | | $ | 551,366,048 | | | $ | 401,317,332 | |
| $ | — | | | $ | 129,766 | | | $ | — | | | $ | — | | | $ | — | | | $ | — | |
| $ | — | | | $ | — | | | $ | 20,368 | | | $ | — | | | $ | — | | | $ | — | |
| $ | — | | | $ | — | | | $ | 141,998,727 | | | $ | — | | | $ | 76,527,406 | | | $ | — | |
The accompanying notes are an integral part of these financial statements.
Statements of Operations
For the Year Ended December 31, 2016
| | | | | | | | | | | | |
| | |
Hartford
Balanced HLS
Fund | | | Hartford
Capital Appreciation
HLS Fund | | | Hartford
Disciplined Equity
HLS Fund | |
Investment Income: | | | | | | | | | | | | |
Dividends | | $ | 37,389,238 | | | $ | 95,413,491 | | | $ | 10,637,394 | |
Interest | | | 27,571,701 | | | | 422,393 | | | | 36,146 | |
Other income | | | 1,499 | | | | 4,347 | | | | 583 | |
Less: Foreign tax withheld | | | (317,753 | ) | | | (1,904,883 | ) | | | — | |
| | | | | | | | | | | | |
Total investment income, net | | | 64,644,685 | | | | 93,935,348 | | | | 10,674,123 | |
| | | | | | | | | | | | |
Expenses: | | | | | | | | | | | | |
Investment management fees | | | 14,915,455 | | | | 36,276,293 | | | | 5,023,811 | |
Administrative services fees | | | | | | | | | | | | |
Class IC | | | — | | | | 46,666 | | | | — | |
Transfer agent fees | | | | | | | | | | | | |
Class IA | | | 5,046 | | | | 8,691 | | | | 4,780 | |
Class IB | | | 687 | | | | 990 | | | | 673 | |
Class IC | | | — | | | | 32 | | | | — | |
Distribution fees | | | | | | | | | | | | |
Class IB | | | 719,863 | | | | 1,450,231 | | | | 212,510 | |
Class IC | | | — | | | | 46,666 | | | | — | |
Custodian fees | | | 19,529 | | | | 172,588 | | | | 4,444 | |
Registration and filing fees | | | 32,987 | | | | 48,665 | | | | 30,468 | |
Accounting services fees | | | 384,617 | | | | 997,347 | | | | 82,646 | |
Board of Directors’ fees | | | 70,656 | | | | 166,886 | | | | 20,567 | |
Audit fees | | | 52,327 | | | | 55,471 | | | | 32,504 | |
Other expenses | | | 435,089 | | | | 997,953 | | | | 214,923 | |
| | | | | | | | | | | | |
Total expenses (before waivers and fees paid indirectly) | | | 16,636,256 | | | | 40,268,479 | | | | 5,627,326 | |
Management fee waivers | | | (480,772 | ) | | | — | | | | — | |
Commission recapture | | | (18,211 | ) | | | (129,072 | ) | | | (5,632 | ) |
| | | | | | | | | | | | |
Total waivers and fees paid indirectly | | | (498,983 | ) | | | (129,072 | ) | | | (5,632 | ) |
| | | | | | | | | | | | |
Total expenses, net | | | 16,137,273 | | | | 40,139,407 | | | | 5,621,694 | |
| | | | | | | | | | | | |
Net Investment Income (Loss) | | | 48,507,412 | | | | 53,795,941 | | | | 5,052,429 | |
| | | | | | | | | | | | |
Net Realized Gain (Loss) on Investments, Other Financial Instruments and Foreign Currency Transactions: | | | | | | | | | | | | |
Net realized gain (loss) on investments | | | 121,865,525 | | | | 77,125,176 | | | | 65,687,219 | |
Net realized gain (loss) on futures contracts | | | (329,910 | ) | | | — | | | | 15,267 | |
Net realized gain (loss) on written options contracts | | | — | | | | 538,384 | | | | — | |
Net realized gain (loss) on swap contracts | | | — | | | | — | | | | — | |
Net realized gain (loss) on foreign currency contracts | | | — | | | | 2,299,913 | | | | — | |
Net realized gain (loss) on other foreign currency transactions | | | 124 | | | | (685,610 | ) | | | — | |
| | | | | | | | | | | | |
Net Realized Gain (Loss) on Investments, Other Financial Instruments and Foreign Currency Transactions | | | 121,535,739 | | | | 79,277,863 | | | | 65,702,486 | |
| | | | | | | | | | | | |
Net Changes in Unrealized Appreciation (Depreciation) of Investments, Other Financial Instruments and Foreign Currency Transactions: | | | | | | | | | | | | |
Net unrealized appreciation (depreciation) of investments | | | (31,265,570 | ) | | | 144,947,818 | | | | (33,088,388 | ) |
Net unrealized appreciation (depreciation) of futures contracts | | | (100,278 | ) | | | — | | | | (281,759 | ) |
Net unrealized appreciation (depreciation) of swap contracts | | | — | | | | — | | | | — | |
Net unrealized appreciation (depreciation) of foreign currency contracts | | | — | | | | 207,549 | | | | — | |
Net unrealized appreciation (depreciation) of translation of other assets and liabilities in foreign currencies | | | (15,085 | ) | | | (54,587 | ) | | | (6 | ) |
| | | | | | | | | | | | |
Net Changes in Unrealized Appreciation (Depreciation) of Investments, Other Financial Instruments and Foreign Currency Transactions | | | (31,380,933 | ) | | | 145,100,780 | | | | (33,370,153 | ) |
| | | | | | | | | | | | |
Net Gain (Loss) on Investments, Other Financial Instruments and Foreign Currency Transactions | | | 90,154,806 | | | | 224,378,643 | | | | 32,332,333 | |
| | | | | | | | | | | | |
Net Increase (Decrease) in Net Assets Resulting from Operations | | $ | 138,662,218 | | | $ | 278,174,584 | | | $ | 37,384,762 | |
| | | | | | | | | | | | |
The accompanying notes are an integral part of these financial statements.
Statements of Operations – (continued)
For the Year Ended December 31, 2016
| | | | | | | | | | | | | | | | | | | | | | | | | | |
Hartford
Dividend and
Growth HLS
Fund | | | Hartford
Global Growth HLS
Fund | | | Hartford
Growth Opportunities
HLS Fund | | | Hartford
Healthcare HLS
Fund | | | Hartford
High Yield
HLS Fund | | | Hartford
International
Opportunities
HLS Fund | | | Hartford
MidCap HLS
Fund | |
| | | | | | | | | | | | | | | | | | | | | | | | | | |
| $ | 87,826,715 | | | $ | 6,265,805 | | | $ | 7,144,353 | | | $ | 3,188,349 | | | $ | 254,547 | | | $ | 34,198,434 | | | $ | 15,012,232 | |
| | 216,453 | | | | 8,938 | | | | 64,494 | | | | 19,717 | | | | 20,449,873 | | | | 109,141 | | | | 11,678 | |
| | 764 | | | | 928 | | | | 1,247 | | | | 929 | | | | 1,836 | | | | 1,889 | | | | 863 | |
| | (573,680 | ) | | | (239,067 | ) | | | (49,885 | ) | | | (28,149 | ) | | | — | | | | (3,070,324 | ) | | | (81,224 | ) |
| | | | | | | | | | | | | | | | | | | | | | | | | | |
| | 87,470,252 | | | | 6,036,604 | | | | 7,160,209 | | | | 3,180,846 | | | | 20,706,256 | | | | 31,239,140 | | | | 14,943,549 | |
| | | | | | | | | | | | | | | | | | | | | | | | | | |
| | | | | | | | | | | | | | | | | | | | | | | | | | |
| | 21,368,550 | | | | 3,320,308 | | | | 7,976,427 | | | | 2,845,240 | | | | 2,297,473 | | | | 8,678,242 | | | | 11,646,320 | |
| | | | | | | | | | | | | | | | | | | | | | | | | | |
| | — | | | | — | | | | 60,157 | | | | — | | | | — | | | | — | | | | — | |
| | | | | | | | | | | | | | | | | | | | | | | | | | |
| | 5,485 | | | | 4,486 | | | | 7,164 | | | | 4,647 | | | | 4,338 | | | | 6,207 | | | | 6,032 | |
| | 822 | | | | 970 | | | | 877 | | | | 815 | | | | 1,333 | | | | 876 | | | | 349 | |
| | — | | | | — | | | | 150 | | | | — | | | | — | | | | — | | | | — | |
| | | | | | | | | | | | | | | | | | | | | | | | | | |
| | 1,070,270 | | | | 196,038 | | | | 350,861 | | | | 126,737 | | | | 192,874 | | | | 386,690 | | | | 235,675 | |
| | — | | | | — | | | | 60,157 | | | | — | | | | — | | | | — | | | | — | |
| | 17,072 | | | | 12,997 | | | | 18,854 | | | | 4,687 | | | | 5,675 | | | | 95,475 | | | | 11,648 | |
| | 35,348 | | | | 30,205 | | | | 50,765 | | | | 31,067 | | | | 30,047 | | | | 31,619 | | | | 32,748 | |
| | 394,230 | | | | 61,702 | | | | 131,274 | | | | 34,003 | | | | 65,642 | | | | 199,763 | | | | 172,341 | |
| | 95,291 | | | | 13,374 | | | | 38,658 | | | | 10,524 | | | | 10,099 | | | | 37,012 | | | | 50,009 | |
| | 39,084 | | | | 43,578 | | | | 30,747 | | | | 32,785 | | | | 46,600 | | | | 63,061 | | | | 34,619 | |
| | 639,112 | | | | 140,345 | | | | 342,526 | | | | 51,510 | | | | 125,974 | | | | 381,983 | | | | 235,538 | |
| | | | | | | | | | | | | | | | | | | | | | | | | | |
| | 23,665,264 | | | | 3,824,003 | | | | 9,068,617 | | | | 3,142,015 | | | | 2,780,055 | | | | 9,880,928 | | | | 12,425,279 | |
| | — | | | | — | | | | — | | | | — | | | | — | | | | — | | | | — | |
| | (26,565 | ) | | | (7,411 | ) | | | (20,230 | ) | | | (4,451 | ) | | | — | | | | (16,977 | ) | | | (26,642 | ) |
| | | | | | | | | | | | | | | | | | | | | | | | | | |
| | (26,565 | ) | | | (7,411 | ) | | | (20,230 | ) | | | (4,451 | ) | | | — | | | | (16,977 | ) | | | (26,642 | ) |
| | | | | | | | | | | | | | | | | | | | | | | | | | |
| | 23,638,699 | | | | 3,816,592 | | | | 9,048,387 | | | | 3,137,564 | | | | 2,780,055 | | | | 9,863,951 | | | | 12,398,637 | |
| | | | | | | | | | | | | | | | | | | | | | | | | | |
| | 63,831,553 | | | | 2,220,012 | | | | (1,888,178 | ) | | | 43,282 | | | | 17,926,201 | | | | 21,375,189 | | | | 2,544,912 | |
| | | | | | | | | | | | | | | | | | | | | | | | | | |
| | | | | | | | | | | | | | | | | | | | | | | | | | |
| | 221,863,510 | | | | 22,270,510 | | | | 13,116,401 | | | | 51,925,872 | | | | (9,219,360 | ) | | | (16,906,376 | ) | | | 67,771,808 | |
| | — | | | | — | | | | — | | | �� | — | | | | — | | | | — | | | | — | |
| | — | | | | — | | | | — | | | | — | | | | — | | | | — | | | | — | |
| | — | | | | — | | | | — | | | | — | | | | 589,795 | | | | — | | | | — | |
| | — | | | | — | | | | — | | | | — | | | | 72,216 | | | | — | | | | — | |
| | (36,394 | ) | | | (60,632 | ) | | | 13,550 | | | | (20,521 | ) | | | 199,461 | | | | (646,629 | ) | | | 403 | |
| | | | | | | | | | | | | | | | | | | | | | | | | | |
| 221,827,116 | | | | 22,209,878 | | | | 13,129,951 | | | | 51,905,351 | | | | (8,357,888 | ) | | | (17,553,005 | ) | | | 67,772,211 | |
| | | | | | | | | | | | | | | | | | | | | | | | | | |
| | | | | | | | | | | | | | | | | | | | | | | | | | |
| | 165,885,299 | | | | (17,150,341 | ) | | | (18,176,994 | ) | | | (87,832,829 | ) | | | 33,673,053 | | | | 9,364,739 | | | | 125,224,671 | |
| | — | | | | — | | | | — | | | | — | | | | — | | | | — | | | | — | |
| | — | | | | — | | | | — | | | | — | | | | 370,758 | | | | — | | | | — | |
| | — | | | | — | | | | | | | | — | | | | (105,268 | ) | | | — | | | | — | |
| | 1,985 | | | | (14,476 | ) | | | (812 | ) | | | (744 | ) | | | (567 | ) | | | (62,623 | ) | | | — | |
| | | | | | | | | | | | | | | | | | | | | | | | | | |
|
165,887,284 |
| | | (17,164,817 | ) | | | (18,177,806 | ) | | | (87,833,573 | ) | | | 33,937,976 | | | | 9,302,116 | | | | 125,224,671 | |
| | | | | | | | | | | | | | | | | | | | | | | | | | |
| | 387,714,400 | | | | 5,045,061 | | | | (5,047,855 | ) | | | (35,928,222 | ) | | | 25,580,088 | | | | (8,250,889 | ) | | | 192,996,882 | |
| | | | | | | | | | | | | | | | | | | | | | | | | | |
| $ | 451,545,953 | | | $ | 7,265,073 | | | $ | (6,936,033 | ) | | $ | (35,884,940 | ) | | $ | 43,506,289 | | | $ | 13,124,300 | | | $ | 195,541,794 | |
| | | | | | | | | | | | | | | | | | | | | | | | | | |
The accompanying notes are an integral part of these financial statements.
Statements of Operations – (continued)
For the Year Ended December 31, 2016
| | | | | | | | | | | | |
| | |
Hartford
MidCap Value
HLS Fund | | | Hartford
Small Cap Growth
HLS Fund | | | Hartford
Small Company
HLS Fund | |
Investment Income: | | | | | | | | | | | | |
Dividends | | $ | 5,382,033 | | | $ | 8,963,578 | | | $ | 6,710,631 | |
Interest | | | 22,016 | | | | 58,082 | | | | 73,030 | |
Other income | | | 1,738 | | | | 1,342 | | | | 3,007 | |
Less: Foreign tax withheld | | | (72,785 | ) | | | (1,356 | ) | | | (3,390 | ) |
| | | | | | | | | | | | |
Total investment income, net | | | 5,333,002 | | | | 9,021,646 | | | | 6,783,278 | |
| | | | | | | | | | | | |
Expenses: | | | | | | | | | | | | |
Investment management fees | | | 2,906,969 | | | | 6,706,525 | | | | 7,224,353 | |
Transfer agent fees | | | | | | | | | | | | |
Class IA | | | 3,911 | | | | 6,529 | | | | 6,099 | |
Class IB | | | 1,219 | | | | 1,512 | | | | 563 | |
Distribution fees | | | | | | | | | | | | |
Class IB | | | 215,937 | | | | 517,841 | | | | 215,174 | |
Custodian fees | | | 3,874 | | | | 8,228 | | | | 14,383 | |
Registration and filing fees | | | 30,081 | | | | 93,272 | | | | 30,986 | |
Accounting services fees | | | 36,337 | | | | 132,131 | | | | 122,339 | |
Board of Directors’ fees | | | 10,972 | | | | 32,490 | | | | 30,256 | |
Audit fees | | | 32,688 | | | | 25,864 | | | | 34,845 | |
Other expenses | | | 98,012 | | | | 178,564 | | | | 231,349 | |
| | | | | | | | | | | | |
Total expenses (before waivers and fees paid indirectly) | | | 3,340,000 | | | | 7,702,956 | | | | 7,910,347 | |
Commission recapture | | | (3,768 | ) | | | (16,304 | ) | | | (46,731 | ) |
| | | | | | | | | | | | |
Total waivers and fees paid indirectly | | | (3,768 | ) | | | (16,304 | ) | | | (46,731 | ) |
| | | | | | | | | | | | |
Total expenses, net | | | 3,336,232 | | | | 7,686,652 | | | | 7,863,616 | |
| | | | | | | | | | | | |
Net Investment Income (Loss) | | | 1,996,770 | | | | 1,334,994 | | | | (1,080,338 | ) |
| | | | | | | | | | | | |
Net Realized Gain (Loss) on Investments, Other Financial Instruments and Foreign Currency Transactions: | | | | | | | | | | | | |
Net realized gain (loss) on investments | | | 25,072,414 | | | | (13,449,629 | ) | | | (87,561,121 | ) |
Less: Foreign taxes paid on realized capital gains | | | — | | | | — | | | | — | |
Net realized gain (loss) on purchased options contracts | | | — | | | | — | | | | — | |
Net realized gain (loss) on futures contracts | | | — | | | | — | | | | — | |
Net realized gain (loss) on written options contracts | | | — | | | | — | | | | — | |
Net realized gain (loss) on swap contracts | | | — | | | | — | | | | — | |
Net realized gain (loss) on foreign currency contracts | | | — | | | | — | | | | — | |
Net realized gain (loss) on other foreign currency transactions | | | 12,084 | | | | — | | | | (19,426 | ) |
| | | | | | | | | | | | |
Net Realized Gain (Loss) on Investments, Other Financial Instruments and Foreign Currency Transactions | | | 25,084,498 | | | | (13,449,629 | ) | | | (87,580,547 | ) |
| | | | | | | | | | | | |
Net Changes in Unrealized Appreciation (Depreciation) of Investments, Other Financial Instruments and Foreign Currency Transactions: | | | | | | | | | | | | |
Net unrealized appreciation (depreciation) of investments | | | 16,075,070 | | | | 143,613,864 | | | | 85,593,119 | |
Net unrealized appreciation (depreciation) of purchased options contracts | | | — | | | | — | | | | — | |
Net unrealized appreciation (depreciation) of futures contracts | | | — | | | | — | | | | — | |
Net unrealized appreciation (depreciation) of written options contracts | | | — | | | | — | | | | — | |
Net unrealized appreciation (depreciation) of swap contracts | | | — | | | | — | | | | — | |
Net unrealized appreciation (depreciation) of foreign currency contracts | | | — | | | | — | | | | — | |
Net unrealized appreciation (depreciation) of translation of other assets and liabilities in foreign currencies | | | 549 | | | | — | | | | 2,894 | |
| | | | | | | | | | | | |
Net Changes in Unrealized Appreciation (Depreciation) of Investments, Other Financial Instruments and Foreign Currency Transactions | | | 16,075,619 | | | | 143,613,864 | | | | 85,596,013 | |
| | | | | | | | | | | | |
Net Gain (Loss) on Investments, Other Financial Instruments and Foreign Currency Transactions | | | 41,160,117 | | | | 130,164,235 | | | | (1,984,534 | ) |
| | | | | | | | | | | | |
Net Increase (Decrease) in Net Assets Resulting from Operations | | $ | 43,156,887 | | | $ | 131,499,229 | | | $ | (3,064,872 | ) |
| | | | | | | | | | | | |
The accompanying notes are an integral part of these financial statements.
Statements of Operations – (continued)
For the Year Ended December 31, 2016
| | | | | | | | | | | | | | | | | | | | | | |
Hartford
Small/Mid Cap
Equity HLS Fund | | | Hartford
Stock HLS Fund | | | Hartford
Total Return Bond
HLS Fund | | | Hartford
Ultrashort Bond
HLS Fund | | | Hartford
U.S. Government
Securities HLS
Fund | | | Hartford
Value HLS Fund | |
| | | | | | | | | | | | | | | | | | | | | | |
| $ | 1,975,504 | | | $ | 33,733,581 | | | $ | 178,371 | | | $ | — | | | $ | — | | | $ | 13,586,829 | |
| | 3,445 | | | | 95,698 | | | | 96,562,376 | | | | 6,934,616 | | | | 10,833,299 | | | | 21,990 | |
| | 832 | | | | 660 | | | | 2,652 | | | | 795 | | | | 1,028 | | | | 711 | |
| | (2,270 | ) | | | (241,657 | ) | | | — | | | | (389 | ) | | | — | | | | (85,941 | ) |
| | | | | | | | | | | | | | | | | | | | | | |
| | 1,977,511 | | | | 33,588,282 | | | | 96,743,399 | | | | 6,935,022 | | | | 10,834,327 | | | | 13,523,589 | |
| | | | | | | | | | | | | | | | | | | | | | |
| | | | | | | | | | | | | | | | | | | | | | |
| | 727,567 | | | | 7,184,617 | | | | 12,279,076 | | | | 2,625,907 | | | | 2,229,979 | | | | 3,840,032 | |
| | | | | | | | | | | | | | | | | | | | | | |
| | 4,176 | | | | 4,837 | | | | 5,492 | | | | 4,768 | | | | 4,301 | | | | 4,983 | |
| | 835 | | | | 530 | | | | 662 | | | | 737 | | | | 947 | | | | 874 | |
| | | | | | | | | | | | | | | | | | | | | | |
| | 37,909 | | | | 369,984 | | | | 708,597 | | | | 219,780 | | | | 223,646 | | | | 191,571 | |
| | 1,254 | | | | 9,675 | | | | 51,717 | | | | 5,211 | | | | 4,785 | | | | 3,907 | |
| | 28,945 | | | | 31,026 | | | | 33,894 | | | | 28,747 | | | | 30,536 | | | | 27,830 | |
| | 12,732 | | | | 149,936 | | | | 526,590 | | | | 65,648 | | | | 59,474 | | | | 51,354 | |
| | 3,118 | | | | 44,127 | | | | 77,997 | | | | 19,775 | | | | 15,147 | | | | 15,366 | |
| | 25,108 | | | | 34,314 | | | | 51,969 | | | | 38,782 | | | | 43,455 | | | | 32,386 | |
| | 33,153 | | | | 344,795 | | | | 535,850 | | | | 167,608 | | | | 148,597 | | | | 136,477 | |
| | | | | | | | | | | | | | | | | | | | | | |
| | 874,797 | | | | 8,173,841 | | | | 14,271,844 | | | | 3,176,963 | | | | 2,760,867 | | | | 4,304,780 | |
| | — | | | | (3,099 | ) | | | — | | | | — | | | | — | | | | (3,808 | ) |
| | | | | | | | | | | | | | | | | | | | | | |
| | — | | | | (3,099 | ) | | | — | | | | — | | | | — | | | | (3,808 | ) |
| | | | | | | | | | | | | | | | | | | | | | |
| | 874,797 | | | | 8,170,742 | | | | 14,271,844 | | | | 3,176,963 | | | | 2,760,867 | | | | 4,300,972 | |
| | | | | | | | | | | | | | | | | | | | | | |
| | 1,102,714 | | | | 25,417,540 | | | | 82,471,555 | | | | 3,758,059 | | | | 8,073,460 | | | | 9,222,617 | |
| | | | | | | | | | | | | | | | | | | | | | |
| | | | | | | | | | | | | | | | | | | | | | |
| | 2,737,265 | | | | 123,130,600 | | | | (6,133,901 | ) | | | 133,001 | | | | 6,942,126 | | | | 35,940,404 | |
| | — | | | | — | | | | (65,134 | ) | | | — | | | | — | | | | — | |
| | — | | | | — | | | | (108,902 | ) | | | — | | | | — | | | | — | |
| | — | | | | — | | | | 2,768,682 | | | | — | | | | (38,912 | ) | | | — | |
| | — | | | | — | | | | 3,762,060 | | | | — | | | | — | | | | — | |
| | — | | | | — | | | | (27,972,976 | ) | | | — | | | | (280 | ) | | | — | |
| | — | | | | — | | | | (4,597,065 | ) | | | — | | | | — | | | | — | |
| | — | | | | (13,156 | ) | | | 205,441 | | | | — | | | | — | | | | (1,738 | ) |
| | | | | | | | | | | | | | | | | | | | | | |
| | 2,737,265 | | | | 123,117,444 | | | | (32,141,795 | ) | | | 133,001 | | | | 6,902,934 | | | | 35,938,666 | |
| | | | | | | | | | | | | | | | | | | | | | |
| | | | | | | | | | | | | | | | | | | | | | |
| | 9,923,513 | | | | (42,554,733 | ) | | | 54,880,637 | | | | 1,981,446 | | | | (6,725,029 | ) | | | 20,360,625 | |
| | — | | | | — | | | | (109,680 | ) | | | — | | | | — | | | | — | |
| | — | | | | — | | | | 205,230 | | | | — | | | | (254,974 | ) | | | — | |
| | — | | | | — | | | | 6,972 | | | | — | | | | — | | | | — | |
| | — | | | | — | | | | 9,842,268 | | | | — | | | | 426,294 | | | | — | |
| | — | | | | — | | | | 3,047,281 | | | | — | | | | — | | | | — | |
| | — | | | | (21,377 | ) | | | 53,335 | | | | — | | | | — | | | | (3,820 | ) |
| | | | | | | | | | | | | | | | | | | | | | |
|
9,923,513 |
| | | (42,576,110 | ) | | | 67,926,043 | | | | 1,981,446 | | | | (6,553,709 | ) | | | 20,356,805 | |
| | | | | | | | | | | | | | | | | | | | | | |
| | 12,660,778 | | | | 80,541,334 | | | | 35,784,248 | | | | 2,114,447 | | | | 349,225 | | | | 56,295,471 | |
| | | | | | | | | | | | | | | | | | | | | | |
| $ | 13,763,492 | | | $ | 105,958,874 | | | $ | 118,255,803 | | | $ | 5,872,506 | | | $ | 8,422,685 | | | $ | 65,518,088 | |
| | | | | | | | | | | | | | | | | | | | | | |
The accompanying notes are an integral part of these financial statements.
Statements of Changes in Net Assets
| | | | | | | | |
| | |
Hartford Balanced HLS Fund | |
| | | For the
Year Ended
December 31,
2016 | | | For the
Year Ended
December 31,
2015 | |
Operations: | | | | | | | | |
Net investment income (loss) | | $ | 48,507,412 | | | $ | 50,414,982 | |
Net realized gain (loss) on investments, other financial instruments and foreign currency transactions | | | 121,535,739 | | | | 218,419,541 | |
Net changes in unrealized appreciation (depreciation) of investments, other financial instruments and foreign currency transactions | | | (31,380,933 | ) | | | (261,214,650 | ) |
| | | | | | | | |
Net Increase (Decrease) in Net Assets Resulting from Operations | | | 138,662,218 | | | | 7,619,873 | |
| | | | | | | | |
Distributions to Shareholders: | | | | | | | | |
From net investment income | | | | | | | | |
Class IA | | | (57,374,388 | ) | | | (43,115,909 | ) |
Class IB | | | (6,967,476 | ) | | | (4,997,202 | ) |
Class IC | | | — | | | | — | |
| | | | | | | | |
Total from net investment income | | | (64,341,864 | ) | | | (48,113,111 | ) |
| | | | | | | | |
From net realized gain on investments | | | | | | | | |
Class IA | | | — | | | | — | |
Class IB | | | — | | | | — | |
Class IC | | | — | | | | — | |
| | | | | | | | |
Total from net realized gain on investments | | | — | | | | — | |
| | | | | | | | |
Total distributions | | | (64,341,864 | ) | | | (48,113,111 | ) |
| | | | | | | | |
Capital Share Transactions: | | | | | | | | |
Sold | | | 16,656,289 | | | | 16,708,307 | |
Issued on reinvestment of distributions | | | 64,341,864 | | | | 48,113,111 | |
Redeemed | | | (347,720,604 | ) | | | (436,469,018 | ) |
| | | | | | | | |
Net increase (decrease) from capital share transactions | | | (266,722,451 | ) | | | (371,647,600 | ) |
| | | | | | | | |
Net Increase (Decrease) in Net Assets | | | (192,402,097 | ) | | | (412,140,838 | ) |
| | | | | | | | |
Net Assets: | | | | | | | | |
Beginning of period | | | 2,511,883,212 | | | | 2,924,024,050 | |
| | | | | | | | |
End of period | | $ | 2,319,481,115 | | | $ | 2,511,883,212 | |
| | | | | | | | |
Undistributed (distributions in excess of) net investment income | | $ | 11,750,519 | | | $ | 28,777,300 | |
| | | | | | | | |
The accompanying notes are an integral part of these financial statements.
Statements of Changes in Net Assets – (continued)
| | | | | | | | | | | | | | | | | | | | | | | | | | | | | | |
| Hartford Capital Appreciation HLS Fund | | | Hartford Disciplined Equity
HLS Fund | | | Hartford Dividend and Growth
HLS Fund | | | Hartford Global Growth HLS Fund | |
For the
Year Ended
December 31,
2016 | | | For the
Year Ended
December 31,
2015 | | | For the
Year Ended
December 31,
2016 | | | For the
Year Ended
December 31,
2015 | | | For the
Year Ended
December 31,
2016 | | | For the
Year Ended
December 31,
2015 | | | For the
Year Ended
December 31,
2016 | | | For the
Year Ended
December 31,
2015 | |
| | | | | | | | | | | | | | | | | | | | | | | | | | | | | | |
| $ | 53,795,941 | | | $ | 55,803,044 | | | $ | 5,052,429 | | | $ | 5,732,568 | | | $ | 63,831,553 | | | $ | 67,717,712 | | | $ | 2,220,012 | | | $ | 2,810,204 | |
| | 79,277,863 | | | | 499,190,946 | | | | 65,702,486 | | | | 86,358,959 | | | | 221,827,116 | | | | 382,559,504 | | | | 22,209,878 | | | | 46,843,135 | |
| | 145,100,780 | | | | (466,258,274 | ) | | | (33,370,153 | ) | | | (39,562,393 | ) | | | 165,887,284 | | | | (492,429,493 | ) | | | (17,164,817 | ) | | | (12,495,589 | ) |
| | | | | | | | | | | | | | | | | | | | | | | | | | | | | | |
| | 278,174,584 | | | | 88,735,716 | | | | 37,384,762 | | | | 52,529,134 | | | | 451,545,953 | | | | (42,152,277 | ) | | | 7,265,073 | | | | 37,157,750 | |
| | | | | | | | | | | | | | | | | | | | | | | | | | | | | | |
| | | | | | | | | | | | | | | | | | | | | | | | | | | | | | |
| | | | | | | | | | | | | | | | | | | | | | | | | | | | | | |
| | (50,908,581 | ) | | | (52,995,203 | ) | | | (5,255,939 | ) | | | (5,191,407 | ) | | | (58,859,706 | ) | | | (56,949,781 | ) | | | (2,421,454 | ) | | | (2,064,712 | ) |
| | (4,835,762 | ) | | | (4,290,700 | ) | | | (523,839 | ) | | | (493,379 | ) | | | (7,559,424 | ) | | | (7,355,049 | ) | | | (298,138 | ) | | | (265,636 | ) |
| | (145,082 | ) | | | (91,794 | ) | | | — | | | | — | | | | — | | | | — | | | | — | | | | — | |
| | | | | | | | | | | | | | | | | | | | | | | | | | | | | | |
| | (55,889,425 | ) | | | (57,377,697 | ) | | | (5,779,778 | ) | | | (5,684,786 | ) | | | (66,419,130 | ) | | | (64,304,830 | ) | | | (2,719,592 | ) | | | (2,330,348 | ) |
| | | | | | | | | | | | | | | | | | | | | | | | | | | | | | |
| | | | | | | | | | | | | | | | | | | | | | | | | | | | | | |
| | (479,266,149 | ) | | | (1,143,708,705 | ) | | | (75,833,496 | ) | | | (208,795,133 | ) | | | (321,363,600 | ) | | | (446,508,332 | ) | | | (38,316,082 | ) | | | (17,807,958 | ) |
| | (55,348,578 | ) | | | (133,658,050 | ) | | | (10,746,897 | ) | | | (29,781,590 | ) | | | (48,363,667 | ) | | | (67,944,325 | ) | | | (8,316,510 | ) | | | (4,152,455 | ) |
| | (1,930,573 | ) | | | (2,343,239 | ) | | | — | | | | — | | | | — | | | | — | | | | — | | | | — | |
| | | | | | | | | | | | | | | | | | | | | | | | | | | | | | |
| | (536,545,300 | ) | | | (1,279,709,994 | ) | | | (86,580,393 | ) | | | (238,576,723 | ) | | | (369,727,267 | ) | | | (514,452,657 | ) | | | (46,632,592 | ) | | | (21,960,413 | ) |
| | | | | | | | | | | | | | | | | | | | | | | | | | | | | | |
| | (592,434,725 | ) | | | (1,337,087,691 | ) | | | (92,360,171 | ) | | | (244,261,509 | ) | | | (436,146,397 | ) | | | (578,757,487 | ) | | | (49,352,184 | ) | | | (24,290,761 | ) |
| | | | | | | | | | | | | | | | | | | | | | | | | | | | | | |
| | | | | | | | | | | | | | | | | | | | | | | | | | | | | | |
| | 92,295,115 | | | | 188,886,238 | | | | 20,699,516 | | | | 13,385,373 | | | | 134,212,828 | | | | 66,003,700 | | | | 16,810,513 | | | | 30,124,439 | |
| | 592,434,725 | | | | 1,337,087,691 | | | | 92,360,171 | | | | 244,261,509 | | | | 436,146,397 | | | | 578,757,487 | | | | 49,352,184 | | | | 24,290,761 | |
| | (1,594,446,333 | ) | | | (1,157,183,786 | ) | | | (130,281,451 | ) | | | (167,010,558 | ) | | | (575,274,237 | ) | | | (630,845,783 | ) | | | (83,230,273 | ) | | | (69,742,484 | ) |
| | | | | | | | | | | | | | | | | | | | | | | | | | | | | | |
| | (909,716,493 | ) | | | 368,790,143 | | | | (17,221,764 | ) | | | 90,636,324 | | | | (4,915,012 | ) | | | 13,915,404 | | | | (17,067,576 | ) | | | (15,327,284 | ) |
| | | | | | | | | | | | | | | | | | | | | | | | | | | | | | |
| (1,223,976,634
| )
| | | (879,561,832 | ) | | | (72,197,173 | ) | | | (101,096,051 | ) | | | 10,484,544 | | | | (606,994,360 | ) | | | (59,154,687 | ) | | | (2,460,295 | ) |
| | | | | | | | | | | | | | | | | | | | | | | | | | | | | | |
| | | | | | | | | | | | | | | | | | | | | | | | | | | | | | |
| | 6,359,031,107 | | | | 7,238,592,939 | | | | 740,590,683 | | | | 841,686,734 | | | | 3,441,503,709 | | | | 4,048,498,069 | | | | 479,060,793 | | | | 481,521,088 | |
| | | | | | | | | | | | | | | | | | | | | | | | | | | | | | |
| $ | 5,135,054,473 | | | $ | 6,359,031,107 | | | $ | 668,393,510 | | | $ | 740,590,683 | | | $ | 3,451,988,253 | | | $ | 3,441,503,709 | | | $ | 419,906,106 | | | $ | 479,060,793 | |
| | | | | | | | | | | | | | | | | | | | | | | | | | | | | | |
| $ | 9,234,251 | | | $ | 5,652,191 | | | $ | 181,803 | | | $ | 979,743 | | | $ | 406,191 | | | $ | 5,287,312 | | | $ | 2,331,234 | | | $ | 2,754,031 | |
| | | | | | | | | | | | | | | | | | | | | | | | | | | | | | |
The accompanying notes are an integral part of these financial statements.
Statements of Changes in Net Assets – (continued)
| | | | | | | | |
| | | Hartford Growth Opportunities
HLS Fund | |
| | | For the
Year Ended
December 31,
2016 | | | For the
Year Ended
December 31,
2015 | |
Operations: | | | | | | | | |
Net investment income (loss) | | $ | (1,888,178 | ) | | $ | 235,777 | |
Net realized gain (loss) on investments, other financial instruments and foreign currency transactions | | | 13,129,951 | | | | 195,529,079 | |
Net changes in unrealized appreciation (depreciation) of investments, other financial instruments and foreign currency transactions | | | (18,177,806 | ) | | | (41,501,855 | ) |
| | | | | | | | |
Net Increase (Decrease) in Net Assets Resulting from Operations | | | (6,936,033 | ) | | | 154,263,001 | |
| | | | | | | | |
Distributions to Shareholders: | | | | | | | | |
From net investment income | | | | | | | | |
Class IA | | | (5,137,102 | ) | | | (1,563,969 | ) |
Class IB | | | (207,347 | ) | | | — | |
Class IC | | | (63,822 | ) | | | — | |
| | | | | | | | |
Total from net investment income | | | (5,408,271 | ) | | | (1,563,969 | ) |
| | | | | | | | |
From net realized gain on investments | | | | | | | | |
Class IA | | | (169,379,777 | ) | | | (246,075,850 | ) |
Class IB | | | (20,295,840 | ) | | | (33,542,514 | ) |
Class IC | | | (3,608,835 | ) | | | (2,276,630 | ) |
| | | | | | | | |
Total from net realized gain on investments | | | (193,284,452 | ) | | | (281,894,994 | ) |
| | | | | | | | |
Total distributions | | | (198,692,723 | ) | | | (283,458,963 | ) |
| | | | | | | | |
Capital Share Transactions: | | | | | | | | |
Sold | | | 160,464,745 | | | | 73,681,828 | |
Issued on reinvestment of distributions | | | 198,692,723 | | | | 283,458,963 | |
Redeemed | | | (226,639,753 | ) | | | (217,081,410 | ) |
| | | | | | | | |
Net increase (decrease) from capital share transactions | | | 132,517,715 | | | | 140,059,381 | |
| | | | | | | | |
Net Increase (Decrease) in Net Assets | | | (73,111,041 | ) | | | 10,863,419 | |
| | | | | | | | |
Net Assets: | | | | | | | | |
Beginning of period | | | 1,375,986,798 | | | | 1,365,123,379 | |
| | | | | | | | |
End of period | | $ | 1,302,875,757 | | | $ | 1,375,986,798 | |
| | | | | | | | |
Undistributed (distributions in excess of) net investment income | | $ | (341,766 | ) | | $ | 5,172,640 | |
| | | | | | | | |
The accompanying notes are an integral part of these financial statements.
Statements of Changes in Net Assets – (continued)
| | | | | | | | | | | | | | | | | | | | | | | | | | | | | | |
| Hartford Healthcare HLS Fund | | | Hartford High Yield HLS Fund | | | Hartford International Opportunities
HLS Fund | | | Hartford MidCap HLS Fund | |
For the
Year Ended
December 31,
2016 | | | For the
Year Ended
December 31,
2015 | | | For the
Year Ended
December 31,
2016 | | | For the
Year Ended
December 31,
2015 | | | For the
Year Ended
December 31,
2016 | | | For the
Year Ended
December 31,
2015 | | | For the
Year Ended
December 31,
2016 | | | For the
Year Ended
December 31,
2015 | |
| | | | | | | | | | | | | | | | | | | | | | | | | | | | | | |
| $ | 43,282 | | | $ | (189,398 | ) | | $ | 17,926,201 | | | $ | 21,098,919 | | | $ | 21,375,189 | | | $ | 20,581,447 | | | $ | 2,544,912 | | | $ | 1,151,367 | |
| | 51,905,351 | | | | 69,042,842 | | | | (8,357,888 | ) | | | (12,670,641 | ) | | | (17,553,005 | ) | | | 44,603,449 | | | | 67,772,211 | | | | 179,588,938 | |
| | (87,833,573 | ) | | | (21,660,295 | ) | | | 33,937,976 | | | | (22,857,170 | ) | | | 9,302,116 | | | | (34,352,453 | ) | | | 125,224,671 | | | | (152,431,577 | ) |
| | | | | | | | | | | | | | | | | | | | | | | | | | | | | | |
| | (35,884,940 | ) | | | 47,193,149 | | | | 43,506,289 | | | | (14,428,892 | ) | | | 13,124,300 | | | | 30,832,443 | | | | 195,541,794 | | | | 28,308,728 | |
| | | | | | | | | | | | | | | | | | | | | | | | | | | | | | |
| | | | | | | | | | | | | | | | | | | | | | | | | | | | | | |
| | | | | | | | | | | | | | | | | | | | | | | | | | | | | | |
| | (9,786,913 | ) | | | — | | | | (15,598,376 | ) | | | (18,980,813 | ) | | | (17,922,412 | ) | | | (17,879,578 | ) | | | (2,990,801 | ) | | | (1,399,724 | ) |
| | (1,640,493 | ) | | | — | | | | (4,574,775 | ) | | | (5,933,685 | ) | | | (2,012,534 | ) | | | (2,176,492 | ) | | | (27,743 | ) | | | (90,171 | ) |
| | — | | | | — | | | | — | | | | — | | | | — | | | | — | | | | — | | | | — | |
| | | | | | | | | | | | | | | | | | | | | | | | | | | | | | |
| | (11,427,406 | ) | | | — | | | | (20,173,151 | ) | | | (24,914,498 | ) | | | (19,934,946 | ) | | | (20,056,070 | ) | | | (3,018,544 | ) | | | (1,489,895 | ) |
| | | | | | | | | | | | | | | | | | | | | | | | | | | | | | |
| | | | | | | | | | | | | | | | | | | | | | | | | | | | | | |
| | (54,644,064 | ) | | | (41,644,271 | ) | | | — | | | | — | | | | — | | | | — | | | | (170,188,177 | ) | | | (197,172,246 | ) |
| | (10,078,753 | ) | | | (7,763,435 | ) | | | — | | | | — | | | | — | | | | — | | | | (9,620,889 | ) | | | (12,701,934 | ) |
| | — | | | | — | | | | — | | | | — | | | | — | | | | — | | | | — | | | | — | |
| | | | | | | | | | | | | | | | | | | | | | | | | | | | | | |
| | (64,722,817 | ) | | | (49,407,706 | ) | | | — | | | | — | | | | — | | | | — | | | | (179,809,066 | ) | | | (209,874,180 | ) |
| | | | | | | | | | | | | | | | | | | | | | | | | | | | | | |
| | (76,150,223 | ) | | | (49,407,706 | ) | | | (20,173,151 | ) | | | (24,914,498 | ) | | | (19,934,946 | ) | | | (20,056,070 | ) | | | (182,827,610 | ) | | | (211,364,075 | ) |
| | | | | | | | | | | | | | | | | | | | | | | | | | | | | | |
| | | | | | | | | | | | | | | | | | | | | | | | | | | | | | |
| | 39,480,807 | | | | 117,587,462 | | | | 30,368,396 | | | | 26,601,652 | | | | 118,384,245 | | | | 79,856,988 | | | | 147,356,841 | | | | 287,047,471 | |
| | 76,150,223 | | | | 49,407,706 | | | | 20,173,151 | | | | 24,914,498 | | | | 19,934,946 | | | | 20,056,070 | | | | 182,827,610 | | | | 211,364,075 | |
| | (136,380,062 | ) | | | (103,345,971 | ) | | | (80,415,801 | ) | | | (111,075,638 | ) | | | (215,191,291 | ) | | | (221,900,580 | ) | | | (280,412,628 | ) | | | (316,201,121 | ) |
| | | | | | | | | | | | | | | | | | | | | | | | | | | | | | |
| | (20,749,032 | ) | | | 63,649,197 | | | | (29,874,254 | ) | | | (59,559,488 | ) | | | (76,872,100 | ) | | | (121,987,522 | ) | | | 49,771,823 | | | | 182,210,425 | |
| | | | | | | | | | | | | | | | | | | | | | | | | | | | | | |
| | (132,784,195 | ) | | | 61,434,640 | | | | (6,541,116 | ) | | | (98,902,878 | ) | | | (83,682,746 | ) | | | (111,211,149 | ) | | | 62,486,007 | | | | (844,922 | ) |
| | | | | | | | | | | | | | | | | | | | | | | | | | | | | | |
| | | | | | | | | | | | | | | | | | | | | | | | | | | | | | |
| | 423,427,273 | | | | 361,992,633 | | | | 328,326,110 | | | | 427,228,988 | | | | 1,317,787,938 | | | | 1,428,999,087 | | | | 1,752,110,251 | | | | 1,752,955,173 | |
| | | | | | | | | | | | | | | | | | | | | | | | | | | | | | |
| $ | 290,643,078 | | | $ | 423,427,273 | | | $ | 321,784,994 | | | $ | 328,326,110 | | | $ | 1,234,105,192 | | | $ | 1,317,787,938 | | | $ | 1,814,596,258 | | | $ | 1,752,110,251 | |
| | | | | | | | | | | | | | | | | | | | | | | | | | | | | | |
| $ | (207,735 | ) | | $ | 11,704,604 | | | $ | 18,064,801 | | | $ | 20,098,553 | | | $ | 20,907,509 | | | $ | 19,001,664 | | | $ | 20,852 | | | $ | 777,579 | |
| | | | | | | | | | | | | | | | | | | | | | | | | | | | | | |
The accompanying notes are an integral part of these financial statements.
Statements of Changes in Net Assets – (continued)
| | | | | | | | |
| | |
Hartford MidCap Value HLS Fund | |
| | | For the
Year Ended
December 31,
2016 | | | For the
Year Ended
December 31,
2015 | |
Operations: | | | | | | | | |
Net investment income (loss) | | $ | 1,996,770 | | | $ | 1,867,941 | |
Net realized gain (loss) on investments, other financial instruments and foreign currency transactions | | | 25,084,498 | | | | 49,312,834 | |
Net changes in unrealized appreciation (depreciation) of investments and foreign currency transactions | | | 16,075,619 | | | | (53,904,920 | ) |
| | | | | | | | |
Net Increase (Decrease) in Net Assets Resulting from Operations | | | 43,156,887 | | | | (2,724,145 | ) |
| | | | | | | | |
Distributions to Shareholders: | | | | | | | | |
From net investment income | | | | | | | | |
Class IA | | | (1,470,383 | ) | | | (1,833,760 | ) |
Class IB | | | (198,851 | ) | | | (310,161 | ) |
| | | | | | | | |
Total from net investment income | | | (1,669,234 | ) | | | (2,143,921 | ) |
| | | | | | | | |
From net realized gain on investments | | | | | | | | |
Class IA | | | (37,432,863 | ) | | | (44,253,137 | ) |
Class IB | | | (11,765,923 | ) | | | (14,602,875 | ) |
| | | | | | | | |
Total from net realized gain on investments | | | (49,198,786 | ) | | | (58,856,012 | ) |
| | | | | | | | |
Total distributions | | | (50,868,020 | ) | | | (60,999,933 | ) |
| | | | | | | | |
Capital Share Transactions: | | | | | | | | |
Sold | | | 6,844,502 | | | | 8,423,245 | |
Issued on reinvestment of distributions | | | 50,868,020 | | | | 60,999,933 | |
Redeemed | | | (53,319,463 | ) | | | (78,708,045 | ) |
| | | | | | | | |
Net increase (decrease) from capital share transactions | | | 4,393,059 | | | | (9,284,867 | ) |
| | | | | | | | |
Net Increase (Decrease) in Net Assets | | | (3,318,074 | ) | | | (73,008,945 | ) |
| | | | | | | | |
Net Assets: | | | | | | | | |
Beginning of period | | | 382,894,110 | | | | 455,903,055 | |
| | | | | | | | |
End of period | | $ | 379,576,036 | | | $ | 382,894,110 | |
| | | | | | | | |
Undistributed (distributions in excess of) net investment income | | $ | 1,962,506 | | | $ | 890,780 | |
| | | | | | | | |
The accompanying notes are an integral part of these financial statements.
Statements of Changes in Net Assets – (continued)
| | | | | | | | | | | | | | | | | | | | | | | | | | | | | | |
Hartford Small Cap Growth HLS Fund | | | Hartford Small Company HLS Fund | | | Hartford Small/Mid Cap Equity
HLS Fund | | | Hartford Stock HLS Fund | |
For the
Year Ended
December 31,
2016 | | | For the
Year Ended
December 31,
2015 | | | For the
Year Ended
December 31,
2016 | | | For the
Year Ended
December 31,
2015 | | | For the
Year Ended
December 31,
2016 | | | For the
Year Ended
December 31,
2015 | | | For the
Year Ended
December 31,
2016 | | | For the
Year Ended
December 31,
2015 | |
| | | | | | | | | | | | | | | | | | | | | | | | | | | | | | |
| $ | 1,334,994 | | | $ | 1,700,575 | | | $ | (1,080,338 | ) | | $ | (1,780,496 | ) | | $ | 1,102,714 | | | $ | 1,511,474 | | | $ | 25,417,540 | | | $ | 29,935,718 | |
| | (13,449,629 | ) | | | 46,029,721 | | | | (87,580,547 | ) | | | 88,028,225 | | | | 2,737,265 | | | | 5,335,316 | | | | 123,117,444 | | | | 154,995,290 | |
| | 143,613,864 | | | | (76,627,391 | ) | | | 85,596,013 | | | | (198,111,583 | ) | | | 9,923,513 | | | | (11,517,750 | ) | | | (42,576,110 | ) | | | (142,060,258 | ) |
| | | | | | | | | | | | | | | | | | | | | | | | | | | | | | |
| | 131,499,229 | | | | (28,897,095 | ) | | | (3,064,872 | ) | | | (111,863,854 | ) | | | 13,763,492 | | | | (4,670,960 | ) | | | 105,958,874 | | | | 42,870,750 | |
| | | | | | | | | | | | | | | | | | | | | | | | | | | | | | |
| | | | | | | | | | | | | | | | | | | | | | | | | | | | | | |
| | | | | | | | | | | | | | | | | | | | | | | | | | | | | | |
| | (1,321,239 | ) | | | (562,638 | ) | | | — | | | | — | | | | (1,054,630 | ) | | | (1,119,387 | ) | | | (24,394,377 | ) | | | (25,254,549 | ) |
| | — | | | | — | | | | — | | | | — | | | | (154,757 | ) | | | (189,421 | ) | | | (2,241,103 | ) | | | (2,429,965 | ) |
| | | | | | | | | | | | | | | | | | | | | | | | | | | | | | |
| | (1,321,239 | ) | | | (562,638 | ) | | | — | | | | — | | | | (1,209,387 | ) | | | (1,308,808 | ) | | | (26,635,480 | ) | | | (27,684,514 | ) |
| | | | | | | | | | | | | | | | | | | | | | | | | | | | | | |
| | | | | | | | | | | | | | | | | | | | | | | | | | | | | | |
| | (40,160,906 | ) | | | (74,730,595 | ) | | | (87,123,722 | ) | | | (235,415,969 | ) | | | (4,735,022 | ) | | | (14,586,015 | ) | | | — | | | | — | |
| | (9,586,481 | ) | | | (23,707,028 | ) | | | (9,078,306 | ) | | | (22,082,672 | ) | | | (928,660 | ) | | | (3,233,544 | ) | | | — | | | | — | |
| | | | | | | | | | | | | | | | | | | | | | | | | | | | | | |
| | (49,747,387 | ) | | | (98,437,623 | ) | | | (96,202,028 | ) | | | (257,498,641 | ) | | | (5,663,682 | ) | | | (17,819,559 | ) | | | — | | | | — | |
| | | | | | | | | | | | | | | | | | | | | | | | | | | | | | |
| | (51,068,626 | ) | | | (99,000,261 | ) | | | (96,202,028 | ) | | | (257,498,641 | ) | | | (6,873,069 | ) | | | (19,128,367 | ) | | | (26,635,480 | ) | | | (27,684,514 | ) |
| | | | | | | | | | | | | | | | | | | | | | | | | | | | | | |
| | | | | | | | | | | | | | | | | | | | | | | | | | | | | | |
| | 187,804,800 | | | | 681,534,004 | | | | 83,849,278 | | | | 166,334,124 | | | | 13,915,582 | | | | 4,931,280 | | | | 17,279,764 | | | | 9,402,151 | |
| | 45,817,119 | | | | 99,000,261 | | | | 96,202,028 | | | | 257,498,641 | | | | 6,873,069 | | | | 19,128,367 | | | | 26,635,480 | | | | 27,684,514 | |
| | (238,282,637 | ) | | | (201,704,918 | ) | | | (389,910,318 | ) | | | (241,524,090 | ) | | | (18,682,136 | ) | | | (25,688,609 | ) | | | (214,128,274 | ) | | | (243,328,995 | ) |
| | | | | | | | | | | | | | | | | | | | | | | | | | | | | | |
| | (4,660,718 | ) | | | 578,829,347 | | | | (209,859,012 | ) | | | 182,308,675 | | | | 2,106,515 | | | | (1,628,962 | ) | | | (170,213,030 | ) | | | (206,242,330 | ) |
| | | | | | | | | | | | | | | | | | | | | | | | | | | | | | |
| | 75,769,885 | | | | 450,931,991 | | | | (309,125,912 | ) | | | (187,053,820 | ) | | | 8,996,938 | | | | (25,428,289 | ) | | | (90,889,636 | ) | | | (191,056,094 | ) |
| | | | | | | | | | | | | | | | | | | | | | | | | | | | | | |
| | | | | | | | | | | | | | | | | | | | | | | | | | | | | | |
| | 1,123,362,422 | | | | 672,430,431 | | | | 1,216,278,326 | | | | 1,403,332,146 | | | | 95,879,890 | | | | 121,308,179 | | | | 1,543,832,923 | | | | 1,734,889,017 | |
| | | | | | | | | | | | | | | | | | | | | | | | | | | | | | |
| $ | 1,199,132,307 | | | $ | 1,123,362,422 | | | $ | 907,152,414 | | | $ | 1,216,278,326 | | | $ | 104,876,828 | | | $ | 95,879,890 | | | $ | 1,452,943,287 | | | $ | 1,543,832,923 | |
| | | | | | | | | | | | | | | | | | | | | | | | | | | | | | |
| $ | 1,097,782 | | | $ | 1,318,657 | | | $ | — | | | $ | — | | | $ | 1,102,708 | | | $ | 1,254,573 | | | $ | 724,929 | | | $ | 2,566,050 | |
| | | | | | | | | | | | | | | | | | | | | | | | | | | | | | |
The accompanying notes are an integral part of these financial statements.
Statements of Changes in Net Assets – (continued)
| | | | | | | | |
| | | Hartford Total Return Bond
HLS Fund | |
| | | For the
Year Ended
December 31,
2016 | | | For the
Year Ended
December 31,
2015 | |
Operations: | | | | | | | | |
Net investment income (loss) | | $ | 82,471,555 | | | $ | 86,322,024 | |
Net realized gain (loss) on investments, other financial instruments and foreign currency transactions | | | (32,141,795 | ) | | | (4,544,619 | ) |
Net changes in unrealized appreciation (depreciation) of investments, other financial instruments and foreign currency transactions | | | 67,926,043 | | | | (96,333,497 | ) |
| | | | | | | | |
Net Increase (Decrease) in Net Assets Resulting from Operations | | | 118,255,803 | | | | (14,556,092 | ) |
| | | | | | | | |
Distributions to Shareholders: | | | | | | | | |
From net investment income | | | | | | | | |
Class IA | | | (59,076,184 | ) | | | (81,109,076 | ) |
Class IB | | | (6,394,079 | ) | | | (8,982,691 | ) |
| | | | | | | | |
Total from net investment income | | | (65,470,263 | ) | | | (90,091,767 | ) |
| | | | | | | | |
From net realized gain on investments | | | | | | | | |
Class IA | | | (8,917,940 | ) | | | (63,383,205 | ) |
Class IB | | | (1,089,963 | ) | | | (7,785,123 | ) |
| | | | | | | | |
Total from net realized gain on investments | | | (10,007,903 | ) | | | (71,168,328 | ) |
| | | | | | | | |
Total distributions | | | (75,478,166 | ) | | | (161,260,095 | ) |
| | | | | | | | |
Capital Share Transactions: | | | | | | | | |
Sold | | | 108,664,980 | | | | 124,109,254 | |
Issued on reinvestment of distributions | | | 75,478,166 | | | | 161,260,095 | |
Redeemed | | | (463,514,702 | ) | | | (605,905,708 | ) |
| | | | | | | | |
Net decrease from capital share transactions | | | (279,371,556 | ) | | | (320,536,359 | ) |
| | | | | | | | |
Net Increase (Decrease) in Net Assets | | | (236,593,919 | ) | | | (496,352,546 | ) |
| | | | | | | | |
Net Assets: | | | | | | | | |
Beginning of period | | | 2,743,286,277 | | | | 3,239,638,823 | |
| | | | | | | | |
End of period | | $ | 2,506,692,358 | | | $ | 2,743,286,277 | |
| | | | | | | | |
Undistributed (distributions in excess of) net investment income | | $ | 69,347,138 | | | $ | 66,990,645 | |
| | | | | | | | |
The accompanying notes are an integral part of these financial statements.
Statements of Changes in Net Assets – (continued)
| | | | | | | | | | | | | | | | | | | | | | |
| Hartford Ultrashort Bond HLS Fund | | | Hartford U.S. Government Securities
HLS Fund | | | Hartford Value HLS Fund | |
For the
Year Ended
December 31,
2016 | | | For the
Year Ended
December 31,
2015 | | | For the
Year Ended
December 31,
2016 | | | For the
Year Ended
December 31,
2015 | | | For the
Year Ended
December 31,
2016 | | | For the
Year Ended
December 31,
2015 | |
| | | | | | | | | | | | | | | | | | | | | | |
| $ | 3,758,059 | | | $ | 2,291,768 | | | $ | 8,073,460 | | | $ | 7,999,122 | | | $ | 9,222,617 | | | $ | 8,732,298 | |
| | 133,001 | | | | 6,610 | | | | 6,902,934 | | | | 6,709,375 | | | | 35,938,666 | | | | 66,859,209 | |
| | 1,981,446 | | | | (1,395,680 | ) | | | (6,553,709 | ) | | | (6,286,185 | ) | | | 20,356,805 | | | | (92,712,676 | ) |
| | | | | | | | | | | | | | | | | | | | | | |
| | 5,872,506 | | | | 902,698 | | | | 8,422,685 | | | | 8,422,312 | | | | 65,518,088 | | | | (17,121,169 | ) |
| | | | | | | | | | | | | | | | | | | | | | |
| | | | | | | | | | | | | | | | | | | | | | |
| | | | | | | | | | | | | | | | | | | | | | |
| | (2,551,645 | ) | | | (2,080,640 | ) | | | (7,582,207 | ) | | | (7,889,540 | ) | | | (7,538,457 | ) | | | (7,270,798 | ) |
| | (120,504 | ) | | | — | | | | (1,447,270 | ) | | | (1,434,327 | ) | | | (1,123,156 | ) | | | (1,103,600 | ) |
| | | | | | | | | | | | | | | | | | | | | | |
| | (2,672,149 | ) | | | (2,080,640 | ) | | | (9,029,477 | ) | | | (9,323,867 | ) | | | (8,661,613 | ) | | | (8,374,398 | ) |
| | | | | | | | | | | | | | | | | | | | | | |
| | | | | | | | | | | | | | | | | | | | | | |
| | — | | | | (63,898 | ) | | | — | | | | — | | | | (55,148,630 | ) | | | (15,308,517 | ) |
| | — | | | | (10,342 | ) | | | — | | | | — | | | | (9,603,547 | ) | | | (2,826,296 | ) |
| | | | | | | | | | | | | | | | | | | | | | |
| | — | | | | (74,240 | ) | | | — | | | | — | | | | (64,752,177 | ) | | | (18,134,813 | ) |
| | | | | | | | | | | | | | | | | | | | | | |
| | (2,672,149 | ) | | | (2,154,880 | ) | | | (9,029,477 | ) | | | (9,323,867 | ) | | | (73,413,790 | ) | | | (26,509,211 | ) |
| | | | | | | | | | | | | | | | | | | | | | |
| | | | | | | | | | | | | | | | | | | | | | |
| | 50,997,507 | | | | 56,291,513 | | | | 51,813,891 | | | | 42,133,789 | | | | 14,794,864 | | | | 42,392,764 | |
| | 2,672,149 | | | | 2,154,880 | | | | 9,029,477 | | | | 9,323,867 | | | | 73,413,790 | | | | 26,509,211 | |
| | (153,178,306 | ) | | | (215,901,855 | ) | | | (114,156,260 | ) | | | (119,610,042 | ) | | | (91,871,378 | ) | | | (111,574,821 | ) |
| | | | | | | | | | | | | | | | | | | | | | |
| | (99,508,650 | ) | | | (157,455,462 | ) | | | (53,312,892 | ) | | | (68,152,386 | ) | | | (3,662,724 | ) | | | (42,672,846 | ) |
| | | | | | | | | | | | | | | | | | | | | | |
| | (96,308,293 | ) | | | (158,707,644 | ) | | | (53,919,684 | ) | | | (69,053,941 | ) | | | (11,558,426 | ) | | | (86,303,226 | ) |
| | | | | | | | | | | | | | | | | | | | | | |
| | | | | | | | | | | | | | | | | | | | | | |
| | 708,057,590 | | | | 866,765,234 | | | | 502,147,811 | | | | 571,201,752 | | | | 535,765,099 | | | | 622,068,325 | |
| | | | | | | | | | | | | | | | | | | | | | |
| $ | 611,749,297 | | | $ | 708,057,590 | | | $ | 448,228,127 | | | $ | 502,147,811 | | | $ | 524,206,673 | | | $ | 535,765,099 | |
| | | | | | | | | | | | | | | | | | | | | | |
| $ | 4,216,358 | | | $ | 2,672,136 | | | $ | 8,912,051 | | | $ | 9,029,448 | | | $ | 879,487 | | | $ | 781,816 | |
| | | | | | | | | | | | | | | | | | | | | | |
The accompanying notes are an integral part of these financial statements.
Financial Highlights
| | | | | | | | | | | | | | | | | | | | | | | | | | | | | | | | | | | | | | | | | | | | | | | | | | | | | | | | |
| | | — Selected Per-Share Data(1) — | | | — Ratios and Supplemental Data — | |
Class | | Net Asset
Value at
Beginning
of Period | | | Net
Investment
Income
(Loss) | | | Net
Realized
and
Unrealized
Gain (Loss)
on
Investments | | | Total from
Investment
Operations | | | Dividends
from Net
Investment
Income | | | Distributions
from
Capital
Gains | | | Total
Dividends
and
Distributions | | | Net
Asset
Value
at
End of
Period | | | Total
Return(2) | | | Net
Assets at
End of
Period
(000s) | | | Ratio of
Expenses
to
Average
Net
Assets
Before
Adjust-
ments(3) | | | Ratio of
Expenses
to
Average
Net
Assets
After
Adjust-
ments(3) | | | Ratio of
Net
Investment
Income
(Loss) to
Average
Net Assets | | | Portfolio
Turnover | |
| Hartford Balanced HLS Fund | | | | | | | | | | | | | | | | | | | | | | | | | | | | | |
For the Year Ended December 31, 2016 | | | | | | | | | | | | | | | | | | | | | | | | | |
IA | | $ | 26.62 | | | $ | 0.56 | | | $ | 1.05 | | | $ | 1.61 | | | $ | (0.77 | ) | | $ | — | | | $ | (0.77 | ) | | $ | 27.46 | | | | 6.04 | % | | $ | 2,043,556 | | | | 0.66 | % | | | 0.64 | % | | | 2.05 | % | | | 25 | % |
IB | | | 26.99 | | | | 0.50 | | | | 1.07 | | | | 1.57 | | | | (0.70 | ) | | | — | | | | (0.70 | ) | | | 27.86 | | | | 5.79 | | | | 275,925 | | | | 0.91 | | | | 0.89 | | | | 1.80 | | | | 25 | |
| | | | | | |
For the Year Ended December 31, 2015 | | | | | | | | | | | | | | | | | | | | | | | | | |
IA | | $ | 27.09 | | | $ | 0.51 | | | $ | (0.46 | ) | | $ | 0.05 | | | $ | (0.52 | ) | | $ | — | | | $ | (0.52 | ) | | $ | 26.62 | | | | 0.18 | % | | $ | 2,210,938 | | | | 0.65 | % | | | 0.63 | % | | | 1.87 | % | | | 18 | % |
IB | | | 27.45 | | | | 0.45 | | | | (0.47 | ) | | | (0.02 | ) | | | (0.44 | ) | | | — | | | | (0.44 | ) | | | 26.99 | | | | (0.07 | ) | | | 300,945 | | | | 0.90 | | | | 0.88 | | | | 1.62 | | | | 18 | |
| | | | | | |
For the Year Ended December 31, 2014 | | | | | | | | | | | | | | | | | | | | | | | | | |
IA | | $ | 25.11 | | | $ | 0.45 | | | $ | 2.01 | | | $ | 2.46 | | | $ | (0.48 | ) | | $ | — | | | $ | (0.48 | ) | | $ | 27.09 | | | | 9.79 | % | | $ | 2,561,814 | | | | 0.65 | % | | | 0.65 | % | | | 1.73 | % | | | 29 | % |
IB | | | 25.44 | | | | 0.39 | | | | 2.03 | | | | 2.42 | | | | (0.41 | ) | | | — | | | | (0.41 | ) | | | 27.45 | | | | 9.51 | | | | 362,210 | | | | 0.90 | | | | 0.90 | | | | 1.49 | | | | 29 | |
| | | | | | |
For the Year Ended December 31, 2013 | | | | | | | | | | | | | | | | | | | | | | | | | |
IA | | $ | 21.03 | | | $ | 0.41 | | | $ | 4.04 | | | $ | 4.45 | | | $ | (0.37 | ) | | $ | — | | | $ | (0.37 | ) | | $ | 25.11 | | | | 21.19 | % | | $ | 2,782,698 | | | | 0.65 | % | | | 0.65 | % | | | 1.75 | % | | | 31 | % |
IB | | | 21.30 | | | | 0.35 | | | | 4.10 | | | | 4.45 | | | | (0.31 | ) | | | — | | | | (0.31 | ) | | | 25.44 | | | | 20.88 | | | | 399,681 | | | | 0.90 | | | | 0.90 | | | | 1.50 | | | | 31 | |
| | | | | | |
For the Year Ended December 31, 2012(4) | | | | | | | | | | | | | | | | | | | | | | | | | |
IA | | $ | 19.34 | | | $ | 0.47 | | | $ | 1.85 | | | $ | 2.32 | | | $ | (0.63 | ) | | $ | — | | | $ | (0.63 | ) | | $ | 21.03 | | | | 12.02 | % | | $ | 2,754,114 | | | | 0.65 | % | | | 0.65 | % | | | 1.98 | % | | | 28 | % |
IB | | | 19.58 | | | | 0.43 | | | | 1.86 | | | | 2.29 | | | | (0.57 | ) | | | — | | | | (0.57 | ) | | | 21.30 | | | | 11.74 | | | | 406,156 | | | | 0.90 | | | | 0.90 | | | | 1.73 | | | | 28 | |
| | | | | | | |
| Hartford Capital Appreciation HLS Fund | | | | | | | | | | | | | | | | | | | | | | | | | | | | | |
For the Year Ended December 31, 2016 | | | | | | | | | | | | | | | | | | | | | | | | | |
IA | | $ | 44.44 | | | $ | 0.41 | | | $ | 1.94 | | | $ | 2.35 | | | $ | (0.47 | ) | | $ | (4.27 | ) | | $ | (4.74 | ) | | $ | 42.05 | | | | 5.52 | % | | $ | 4,555,454 | | | | 0.68 | % | | | 0.68 | % | | | 0.97 | % | | | 103 | % |
IB | | | 43.93 | | | | 0.30 | | | | 1.90 | | | | 2.20 | | | | (0.36 | ) | | | (4.27 | ) | | | (4.63 | ) | | | 41.50 | | | | 5.24 | | | | 558,022 | | | | 0.93 | | | | 0.93 | | | | 0.72 | | | | 103 | |
IC | | | 44.21 | | | | 0.19 | | | | 1.92 | | | | 2.11 | | | | (0.29 | ) | | | (4.27 | ) | | | (4.56 | ) | | | 41.76 | | | | 4.99 | | | | 21,579 | | | | 1.18 | | | | 1.18 | | | | 0.46 | | | | 103 | |
| | | | | | |
For the Year Ended December 31, 2015 | | | | | | | | | | | | | | | | | | | | | | | | | |
IA | | $ | 54.71 | | | $ | 0.43 | | | $ | 0.38 | | | $ | 0.81 | | | $ | (0.43 | ) | | $ | (10.65 | ) | | $ | (11.08 | ) | | $ | 44.44 | | | | 1.02 | % | | $ | 5,701,269 | | | | 0.67 | % | | | 0.67 | % | | | 0.84 | % | | | 75 | % |
IB | | | 54.20 | | | | 0.30 | | | | 0.39 | | | | 0.69 | | | | (0.31 | ) | | | (10.65 | ) | | | (10.96 | ) | | | 43.93 | | | | 0.79 | | | | 641,548 | | | | 0.92 | | | | 0.92 | | | | 0.59 | | | | 75 | |
IC | | | 54.59 | | | | 0.17 | | | | 0.39 | | | | 0.56 | | | | (0.29 | ) | | | (10.65 | ) | | | (10.94 | ) | | | 44.21 | | | | 0.53 | | | | 16,215 | | | | 1.17 | | | | 1.17 | | | | 0.34 | | | | 75 | |
| | | | | | |
For the Year Ended December 31, 2014 | | | | | | | | | | | | | | | | | | | | | | | | | |
IA | | $ | 59.65 | | | $ | 0.56 | | | $ | 3.81 | | | $ | 4.37 | | | $ | (0.50 | ) | | $ | (8.81 | ) | | $ | (9.31 | ) | | $ | 54.71 | | | | 7.31 | % | | $ | 6,470,599 | | | | 0.66 | % | | | 0.66 | % | | | 0.96 | % | | | 89 | % |
IB | | | 59.18 | | | | 0.42 | | | | 3.77 | | | | 4.19 | | | | (0.36 | ) | | | (8.81 | ) | | | (9.17 | ) | | | 54.20 | | | | 7.04 | | | | 764,541 | | | | 0.91 | | | | 0.91 | | | | 0.72 | | | | 89 | |
IC(5) | | | 60.21 | | | | 0.09 | | | | 3.53 | | | | 3.62 | | | | (0.43 | ) | | | (8.81 | ) | | | (9.24 | ) | | | 54.59 | | | | 5.97 | (6) | | | 3,453 | | | | 1.16 | (7) | | | 1.16 | (7) | | | 0.23 | (7) | | | 89 | |
| | | | | | |
For the Year Ended December 31, 2013 | | | | | | | | | | | | | | | | | | | | | | | | | |
IA | | $ | 43.37 | | | $ | 0.45 | | | $ | 16.49 | | | $ | 16.94 | | | $ | (0.51 | ) | | $ | (0.15 | ) | | $ | (0.66 | ) | | $ | 59.65 | | | | 39.08 | % | | $ | 7,029,201 | | | | 0.67 | % | | | 0.67 | % | | | 0.88 | % | | | 86 | % |
IB | | | 43.05 | | | | 0.32 | | | | 16.33 | | | | 16.65 | | | | (0.37 | ) | | | (0.15 | ) | | | (0.52 | ) | | | 59.18 | | | | 38.72 | | | | 969,611 | | | | 0.92 | | | | 0.92 | | | | 0.63 | | | | 86 | |
| | | | | | |
For the Year Ended December 31, 2012 | | | | | | | | | | | | | | | | | | | | | | | | | |
IA | | $ | 37.20 | | | $ | 0.57 | | | $ | 6.24 | | | $ | 6.81 | | | $ | (0.64 | ) | | $ | — | | | $ | (0.64 | ) | | $ | 43.37 | | | | 18.34 | % | | $ | 7,750,924 | | | | 0.67 | % | | | 0.67 | % | | | 1.24 | % | | | 142 | % |
IB | | | 36.90 | | | | 0.52 | | | | 6.14 | | | | 6.66 | | | | (0.51 | ) | | | — | | | | (0.51 | ) | | | 43.05 | | | | 18.04 | | | | 874,386 | | | | 0.92 | | | | 0.92 | | | | 0.99 | | | | 142 | |
The accompanying notes are an integral part of these financial statements.
Financial Highlights – (continued)
| | | | | | | | | | | | | | | | | | | | | | | | | | | | | | | | | | | | | | | | | | | | | | | | | | | | | | | | |
| | | — Selected Per-Share Data(1) — | | | — Ratios and Supplemental Data — | |
Class | | Net Asset
Value at
Beginning
of Period | | | Net
Investment
Income
(Loss) | | | Net
Realized
and
Unrealized
Gain (Loss)
on
Investments | | | Total from
Investment
Operations | | | Dividends
from Net
Investment
Income | | | Distributions
from
Capital
Gains | | | Total
Dividends
and
Distributions | | | Net
Asset
Value
at
End of
Period | | | Total
Return(2) | | | Net
Assets at
End of
Period
(000s) | | | Ratio of
Expenses
to
Average
Net
Assets
Before
Adjust-
ments(3) | | | Ratio of
Expenses
to
Average
Net
Assets
After
Adjust-
ments(3) | | | Ratio of
Net
Investment
Income
(Loss) to
Average
Net Assets | | | Portfolio
Turnover | |
| Hartford Disciplined Equity HLS Fund | | | | | | | | | | | | | | | | | | | | | | | | | | | | | |
For the Year Ended December 31, 2016 | | | | | | | | | | | | | | | | | | | | | | | | | |
IA | | $ | 15.58 | | | $ | 0.11 | | | $ | 0.77 | | | $ | 0.88 | | | $ | (0.13 | ) | | $ | (2.03 | ) | | $ | (2.16 | ) | | $ | 14.30 | | | | 5.76 | % | | $ | 587,089 | | | | 0.79 | % | | | 0.79 | % | | | 0.76 | % | | | 33 | % |
IB | | | 15.46 | | | | 0.08 | | | | 0.75 | | | | 0.83 | | | | (0.09 | ) | | | (2.03 | ) | | | (2.12 | ) | | | 14.17 | | | | 5.49 | | | | 81,304 | | | | 1.04 | | | | 1.04 | | | | 0.51 | | | | 33 | |
| | | | | | |
For the Year Ended December 31, 2015 | | | | | | | | | | | | | | | | | | | | | | | | | |
IA | | $ | 20.99 | | | $ | 0.14 | | | $ | 1.41 | | | $ | 1.55 | | | $ | (0.13 | ) | | $ | (6.83 | ) | | $ | (6.96 | ) | | $ | 15.58 | | | | 6.83 | % | | $ | 648,747 | | | | 0.76 | % | | | 0.76 | % | | | 0.76 | % | | | 29 | % |
IB | | | 20.88 | | | | 0.10 | | | | 1.40 | | | | 1.50 | | | | (0.09 | ) | | | (6.83 | ) | | | (6.92 | ) | | | 15.46 | | | | 6.59 | | | | 91,844 | | | | 1.01 | | | | 1.01 | | | | 0.51 | | | | 29 | |
| | | | | | |
For the Year Ended December 31, 2014 | | | | | | | | | | | | | | | | | | | | | | | | | |
IA | | $ | 18.36 | | | $ | 0.14 | | | $ | 2.83 | | | $ | 2.97 | | | $ | (0.14 | ) | | $ | (0.20 | ) | | $ | (0.34 | ) | | $ | 20.99 | | | | 16.18 | % | | $ | 734,110 | | | | 0.75 | % | | | 0.75 | % | | | 0.73 | % | | | 63 | % |
IB | | | 18.27 | | | | 0.09 | | | | 2.81 | | | | 2.90 | | | | (0.09 | ) | | | (0.20 | ) | | | (0.29 | ) | | | 20.88 | | | | 15.87 | | | | 107,577 | | | | 1.00 | | | | 1.00 | | | | 0.47 | | | | 63 | |
| | | | | | |
For the Year Ended December 31, 2013 | | | | | | | | | | | | | | | | | | | | | | | | | |
IA | | $ | 13.64 | | | $ | 0.17 | | | $ | 4.72 | | | $ | 4.89 | | | $ | (0.17 | ) | | $ | — | | | $ | (0.17 | ) | | $ | 18.36 | | | | 35.82 | % | | $ | 811,099 | | | | 0.76 | % | | | 0.76 | % | | | 1.07 | % | | | 23 | % |
IB | | | 13.58 | | | | 0.13 | | | | 4.68 | | | | 4.81 | | | | (0.12 | ) | | | — | | | | (0.12 | ) | | | 18.27 | | | | 35.47 | | | | 118,598 | | | | 1.01 | | | | 1.01 | | | | 0.82 | | | | 23 | |
| | | | | | |
For the Year Ended December 31, 2012(4) | | | | | | | | | | | | | | | | | | | | | | | | | |
IA | | $ | 11.78 | | | $ | 0.22 | | | $ | 1.86 | | | $ | 2.08 | | | $ | (0.22 | ) | | $ | — | | | $ | (0.22 | ) | | $ | 13.64 | | | | 17.62 | % | | $ | 798,148 | | | | 0.75 | % | | | 0.75 | % | | | 1.45 | % | | | 34 | % |
IB | | | 11.73 | | | | 0.18 | | | | 1.85 | | | | 2.03 | | | | (0.18 | ) | | | — | | | | (0.18 | ) | | | 13.58 | | | | 17.33 | | | | 116,113 | | | | 1.00 | | | | 1.00 | | | | 1.20 | | | | 34 | |
| | | | | | | |
| Hartford Dividend and Growth HLS Fund | | | | | | | | | | | | | | | | | | | | | | | | | | | | | |
For the Year Ended December 31, 2016 | | | | | | | | | | | | | | | | | | | | | | | | | |
IA | | $ | 22.09 | | | $ | 0.43 | | | $ | 2.67 | | | $ | 3.10 | | | $ | (0.44 | ) | | $ | (2.65 | ) | | $ | (3.09 | ) | | $ | 22.10 | | | | 14.89 | % | | $ | 3,013,788 | | | | 0.69 | % | | | 0.69 | % | | | 1.98 | % | | | 20 | % |
IB | | | 22.02 | | | | 0.38 | | | | 2.65 | | | | 3.03 | | | | (0.39 | ) | | | (2.65 | ) | | | (3.04 | ) | | | 22.01 | | | | 14.58 | | | | 438,200 | | | | 0.94 | | | | 0.94 | | | | 1.73 | | | | 20 | |
| | | | | | |
For the Year Ended December 31, 2015 | | | | | | | | | | | | | | | | | | | | | | | | | |
IA | | $ | 26.45 | | | $ | 0.46 | | | $ | (0.70 | ) | | $ | (0.24 | ) | | $ | (0.43 | ) | | $ | (3.69 | ) | | $ | (4.12 | ) | | $ | 22.09 | | | | (1.16 | )% | | $ | 2,991,811 | | | | 0.67 | % | | | 0.67 | % | | | 1.84 | % | | | 20 | % |
IB | | | 26.38 | | | | 0.40 | | | | (0.70 | ) | | | (0.30 | ) | | | (0.37 | ) | | | (3.69 | ) | | | (4.06 | ) | | | 22.02 | | | | (1.41 | ) | | | 449,693 | | | | 0.92 | | | | 0.92 | | | | 1.59 | | | | 20 | |
| | | | | | |
For the Year Ended December 31, 2014 | | | | | | | | | | | | | | | | | | | | | | | | | |
IA | | $ | 27.05 | | | $ | 0.49 | | | $ | 2.92 | | | $ | 3.41 | | | $ | (0.49 | ) | | $ | (3.52 | ) | | $ | (4.01 | ) | | $ | 26.45 | | | | 12.96 | % | | $ | 3,502,492 | | | | 0.67 | % | | | 0.67 | % | | | 1.78 | % | | | 19 | % |
IB | | | 26.99 | | | | 0.42 | | | | 2.91 | | | | 3.33 | | | | (0.42 | ) | | | (3.52 | ) | | | (3.94 | ) | | | 26.38 | | | | 12.68 | | | | 546,006 | | | | 0.92 | | | | 0.92 | | | | 1.53 | | | | 19 | |
| | | | | | |
For the Year Ended December 31, 2013 | | | | | | | | | | | | | | | | | | | | | | | | | |
IA | | $ | 21.46 | | | $ | 0.46 | | | $ | 6.33 | | | $ | 6.79 | | | $ | (0.51 | ) | | $ | (0.69 | ) | | $ | (1.20 | ) | | $ | 27.05 | | | | 31.92 | % | | $ | 3,760,183 | | | | 0.67 | % | | | 0.67 | % | | | 1.88 | % | | | 25 | % |
IB | | | 21.42 | | | | 0.40 | | | | 6.31 | | | | 6.71 | | | | (0.45 | ) | | | (0.69 | ) | | | (1.14 | ) | | | 26.99 | | | | 31.58 | | | | 621,751 | | | | 0.92 | | | | 0.92 | | | | 1.62 | | | | 25 | |
| | | | | | |
For the Year Ended December 31, 2012(4) | | | | | | | | | | | | | | | | | | | | | | | | | |
IA | | $ | 19.34 | | | $ | 0.49 | | | $ | 2.13 | | | $ | 2.62 | | | $ | (0.50 | ) | | $ | — | | | $ | (0.50 | ) | | $ | 21.46 | | | | 13.59 | % | | $ | 3,658,076 | | | | 0.67 | % | | | 0.67 | % | | | 2.13 | % | | | 20 | % |
IB | | | 19.30 | | | | 0.45 | | | | 2.11 | | | | 2.56 | | | | (0.44 | ) | | | — | | | | (0.44 | ) | | | 21.42 | | | | 13.31 | | | | 589,194 | | | | 0.92 | | | | 0.92 | | | | 1.88 | | | | 20 | |
The accompanying notes are an integral part of these financial statements.
Financial Highlights – (continued)
| | | | | | | | | | | | | | | | | | | | | | | | | | | | | | | | | | | | | | | | | | | | | | | | | | | | | | | | |
| | | — Selected Per-Share Data(1) — | | | — Ratios and Supplemental Data — | |
Class | | Net Asset
Value at
Beginning
of Period | | | Net
Investment
Income
(Loss) | | | Net
Realized
and
Unrealized
Gain (Loss)
on
Investments | | | Total from
Investment
Operations | | | Dividends
from Net
Investment
Income | | | Distributions
from
Capital
Gains | | | Total
Dividends
and
Distributions | | | Net
Asset
Value
at
End of
Period | | | Total
Return(2) | | | Net
Assets at
End of
Period
(000s) | | | Ratio of
Expenses
to
Average
Net
Assets
Before
Adjust-
ments(3) | | | Ratio of
Expenses
to
Average
Net
Assets
After
Adjust-
ments(3) | | | Ratio of
Net
Investment
Income
(Loss) to
Average
Net Assets | | | Portfolio
Turnover | |
| Hartford Global Growth HLS Fund | | | | | | | | | | | | | | | | | | | | | | | | | |
For the Year Ended December 31, 2016 | | | | | | | | | | | | | | | | | | | | | | | | | |
IA | | $ | 24.39 | | | $ | 0.13 | | | $ | 0.40 | | | $ | 0.53 | | | $ | (0.17 | ) | | $ | (2.61 | ) | | $ | (2.78 | ) | | $ | 22.14 | | | | 1.95 | % | | $ | 347,375 | | | | 0.82 | % | | | 0.82 | % | | | 0.55 | % | | | 65 | % |
IB | | | 24.19 | | | | 0.07 | | | | 0.39 | | | | 0.46 | | | | (0.09 | ) | | | (2.61 | ) | | | (2.70 | ) | | | 21.95 | | | | 1.71 | | | | 72,531 | | | | 1.07 | | | | 1.07 | | | | 0.30 | | | | 65 | |
| | | | | | |
For the Year Ended December 31, 2015 | | | | | | | | | | | | | | | | | | | | | | | | | |
IA | | $ | 23.74 | | | $ | 0.15 | | | $ | 1.77 | | | $ | 1.92 | | | $ | (0.13 | ) | | $ | (1.14 | ) | | $ | (1.27 | ) | | $ | 24.39 | | | | 8.04 | % | | $ | 392,302 | | | | 0.81 | % | | | 0.81 | % | | | 0.62 | % | | | 67 | % |
IB | | | 23.56 | | | | 0.09 | | | | 1.75 | | | | 1.84 | | | | (0.07 | ) | | | (1.14 | ) | | | (1.21 | ) | | | 24.19 | | | | 7.76 | | | | 86,759 | | | | 1.06 | | | | 1.06 | | | | 0.38 | | | | 67 | |
| | | | | | |
For the Year Ended December 31, 2014 | | | | | | | | | | | | | | | | | | | | | | | | | |
IA | | $ | 22.33 | | | $ | 0.13 | | | $ | 1.39 | | | $ | 1.52 | | | $ | (0.11 | ) | | $ | — | | | $ | (0.11 | ) | | $ | 23.74 | | | | 6.79 | % | | $ | 388,542 | | | | 0.81 | % | | | 0.81 | % | | | 0.57 | % | | | 82 | %(8) |
IB | | | 22.16 | | | | 0.07 | | | | 1.39 | | | | 1.46 | | | | (0.06 | ) | | | — | | | | (0.06 | ) | | | 23.56 | | | | 6.58 | | | | 92,979 | | | | 1.06 | | | | 1.06 | | | | 0.30 | | | | 82 | (8) |
| | | | | | |
For the Year Ended December 31, 2013 | | | | | | | | | | | | | | | | | | | | | | | | | |
IA | | $ | 16.50 | | | $ | 0.11 | | | $ | 5.86 | | | $ | 5.97 | | | $ | (0.14 | ) | | $ | — | | | $ | (0.14 | ) | | $ | 22.33 | | | | 36.30 | % | | $ | 360,086 | | | | 0.82 | % | | | 0.82 | % | | | 0.56 | % | | | 71 | % |
IB | | | 16.38 | | | | 0.06 | | | | 5.81 | | | | 5.87 | | | | (0.09 | ) | | | — | | | | (0.09 | ) | | | 22.16 | | | | 35.90 | | | | 79,823 | | | | 1.07 | | | | 1.07 | | | | 0.32 | | | | 71 | |
| | | | | | |
For the Year Ended December 31, 2012(4) | | | | | | | | | | | | | | | | | | | | | | | | | |
IA | | $ | 13.45 | | | $ | 0.14 | | | $ | 3.00 | | | $ | 3.14 | | | $ | (0.09 | ) | | $ | — | | | $ | (0.09 | ) | | $ | 16.50 | | | | 23.41 | % | | $ | 321,371 | | | | 0.82 | % | | | 0.82 | % | | | 0.73 | % | | | 108 | % |
IB | | | 13.34 | | | | 0.09 | | | | 2.99 | | | | 3.08 | | | | (0.04 | ) | | | — | | | | (0.04 | ) | | | 16.38 | | | | 23.10 | | | | 77,224 | | | | 1.07 | | | | 1.07 | | | | 0.47 | | | | 108 | |
| | | | | | | |
| Hartford Growth Opportunities HLS Fund | | | | | | | | | | | | | | | | | | | | | | | | | | | | | |
For the Year Ended December 31, 2016 | | | | | | | | | | | | | | | | | | | | | | | | | |
IA | | $ | 34.86 | | | $ | (0.04 | ) | | $ | 0.06 | (9) | | $ | 0.02 | | | $ | (0.15 | ) | | $ | (4.90 | ) | | $ | (5.05 | ) | | $ | 29.83 | | | | (0.49 | )% | | $ | 1,145,176 | | | | 0.65 | % | | | 0.65 | % | | | (0.11 | )% | | | 138 | % |
IB | | | 33.76 | | | | (0.11 | ) | | | 0.04 | (9) | | | (0.07 | ) | | | (0.05 | ) | | | (4.90 | ) | | | (4.95 | ) | | | 28.74 | | | | (0.77 | ) | | | 132,149 | | | | 0.90 | | | | 0.90 | | | | (0.35 | ) | | | 138 | |
IC | | | 34.57 | | | | (0.19 | ) | | | 0.04 | (9) | | | (0.15 | ) | | | (0.09 | ) | | | (4.90 | ) | | | (4.99 | ) | | | 29.43 | | | | (1.01 | ) | | | 25,550 | | | | 1.15 | | | | 1.15 | | | | (0.61 | ) | | | 138 | |
| | | | | | |
For the Year Ended December 31, 2015 | | | | | | | | | | | | | | | | | | | | | | | | | |
IA | | $ | 38.88 | | | $ | 0.02 | | | $ | 4.66 | | | $ | 4.68 | | | $ | (0.05 | ) | | $ | (8.65 | ) | | $ | (8.70 | ) | | $ | 34.86 | | | | 11.74 | % | | $ | 1,197,187 | | | | 0.65 | % | | | 0.65 | % | | | 0.05 | % | | | 109 | % |
IB | | | 37.93 | | | | (0.08 | ) | | | 4.56 | | | | 4.48 | | | | — | | | | (8.65 | ) | | | (8.65 | ) | | | 33.76 | | | | 11.47 | | | | 158,304 | | | | 0.90 | | | | 0.90 | | | | (0.20 | ) | | | 109 | |
IC | | | 38.75 | | | | (0.18 | ) | | | 4.65 | | | | 4.47 | | | | — | | | | (8.65 | ) | | | (8.65 | ) | | | 34.57 | | | | 11.18 | | | | 20,495 | | | | 1.16 | | | | 1.16 | | | | (0.48 | ) | | | 109 | |
| | | | | | |
For the Year Ended December 31, 2014 | | | | | | | | | | | | | | | | | | | | | | | | | |
IA | | $ | 40.58 | | | $ | 0.06 | | | $ | 5.31 | | | $ | 5.37 | | | $ | (0.07 | ) | | $ | (7.00 | ) | | $ | (7.07 | ) | | $ | 38.88 | | | | 14.14 | % | | $ | 1,203,366 | | | | 0.64 | % | | | 0.64 | % | | | 0.16 | % | | | 145 | %(10) |
IB | | | 39.79 | | | | (0.04 | ) | | | 5.18 | | | | 5.14 | | | | — | | | | (7.00 | ) | | | (7.00 | ) | | | 37.93 | | | | 13.82 | | | | 160,040 | | | | 0.89 | | | | 0.89 | | | | (0.11 | ) | | | 145 | (10) |
IC(5) | | | 40.23 | | | | (0.10 | ) | | | 5.69 | | | | 5.59 | | | | (0.07 | ) | | | (7.00 | ) | | | (7.07 | ) | | | 38.75 | | | | 14.79 | (6) | | | 1,717 | | | | 1.14 | (7) | | | 1.14 | (7) | | | (0.37 | )(7) | | | 145 | (10) |
| | | | | | |
For the Year Ended December 31, 2013 | | | | | | | | | | | | | | | | | | | | | | | | | |
IA | | $ | 29.90 | | | $ | 0.07 | | | $ | 10.61 | | | $ | 10.68 | | | $ | — | | | $ | — | | | $ | — | | | $ | 40.58 | | | | 35.74 | % | | $ | 1,097,380 | | | | 0.65 | % | | | 0.65 | % | | | 0.21 | % | | | 119 | % |
IB | | | 29.38 | | | | (0.01 | ) | | | 10.42 | | | | 10.41 | | | | — | | | | — | | | | — | | | | 39.79 | | | | 35.42 | | | | 111,230 | | | | 0.90 | | | | 0.90 | | | | (0.04 | ) | | | 119 | |
| | | | | | |
For the Year Ended December 31, 2012 | | | | | | | | | | | | | | | | | | | | | | | | | |
IA | | $ | 23.57 | | | $ | 0.03 | | | $ | 6.30 | | | $ | 6.33 | | | $ | — | | | $ | — | | | $ | — | | | $ | 29.90 | | | | 26.86 | % | | $ | 951,372 | | | | 0.65 | % | | | 0.65 | % | | | 0.11 | % | | | 105 | % |
IB | | | 23.22 | | | | (0.05 | ) | | | 6.21 | | | | 6.16 | | | | — | | | | — | | | | — | | | | 29.38 | | | | 26.54 | | | | 108,506 | | | | 0.90 | | | | 0.90 | | | | (0.15 | ) | | | 105 | |
The accompanying notes are an integral part of these financial statements.
Financial Highlights – (continued)
| | | | | | | | | | | | | | | | | | | | | | | | | | | | | | | | | | | | | | | | | | | | | | | | | | | | | | | | |
| | | — Selected Per-Share Data(1) — | | | — Ratios and Supplemental Data — | |
Class | | Net Asset
Value at
Beginning
of Period | | | Net
Investment
Income
(Loss) | | | Net
Realized
and
Unrealized
Gain (Loss)
on
Investments | | | Total from
Investment
Operations | | | Dividends
from Net
Investment
Income | | | Distributions
from
Capital
Gains | | | Total
Dividends
and
Distributions | | | Net
Asset
Value
at
End of
Period | | | Total
Return(2) | | | Net
Assets at
End of
Period
(000s) | | | Ratio of
Expenses
to
Average
Net
Assets
Before
Adjust-
ments(3) | | | Ratio of
Expenses
to
Average
Net
Assets
After
Adjust-
ments(3) | | | Ratio of
Net
Investment
Income
(Loss) to
Average
Net Assets | | | Portfolio
Turnover | |
| Hartford Healthcare HLS Fund | | | | | | | | | | | | | | | | | | | | | | | | | | | | | |
For the Year Ended December 31, 2016 | | | | | | | | | | | | | | | | | | | | | | | | | |
IA | | $ | 30.32 | | | $ | 0.01 | | | $ | (2.37 | ) | | $ | (2.36 | ) | | $ | (0.99 | ) | | $ | (5.51 | ) | | $ | (6.50 | ) | | $ | 21.46 | | | | (8.39 | )% | | $ | 246,494 | | | | 0.89 | % | | | 0.89 | % | | | 0.05 | % | | | 36 | % |
IB | | | 29.36 | | | | (0.05 | ) | | | (2.30 | ) | | | (2.35 | ) | | | (0.90 | ) | | | (5.51 | ) | | | (6.41 | ) | | | 20.60 | | | | (8.64 | ) | | | 44,149 | | | | 1.14 | | | | 1.14 | | | | (0.20 | ) | | | 36 | |
| | | | | | |
For the Year Ended December 31, 2015 | | | | | | | | | | | | | | | | | | | | | | | | | |
IA | | $ | 30.02 | | | $ | — | | | $ | 4.08 | | | $ | 4.08 | | | $ | — | | | $ | (3.78 | ) | | $ | (3.78 | ) | | $ | 30.32 | | | | 13.21 | % | | $ | 360,783 | | | | 0.86 | % | | | 0.86 | % | | | (0.01 | )% | | | 38 | % |
IB | | | 29.23 | | | | (0.08 | ) | | | 3.99 | | | | 3.91 | | | | — | | | | (3.78 | ) | | | (3.78 | ) | | | 29.36 | | | | 12.98 | | | | 62,644 | | | | 1.11 | | | | 1.11 | | | | (0.26 | ) | | | 38 | |
| | | | | | |
For the Year Ended December 31, 2014 | | | | | | | | | | | | | | | | | | | | | | | | | |
IA | | $ | 25.67 | | | $ | 0.01 | | | $ | 6.75 | | | $ | 6.76 | | | $ | (0.07 | ) | | $ | (2.34 | ) | | $ | (2.41 | ) | | $ | 30.02 | | | | 27.39 | % | | $ | 301,580 | | | | 0.88 | % | | | 0.88 | % | | | 0.03 | % | | | 33 | % |
IB | | | 25.07 | | | | (0.06 | ) | | | 6.57 | | | | 6.51 | | | | (0.01 | ) | | | (2.34 | ) | | | (2.35 | ) | | | 29.23 | | | | 27.00 | | | | 60,413 | | | | 1.13 | | | | 1.13 | | | | (0.22 | ) | | | 33 | |
| | | | | | |
For the Year Ended December 31, 2013 | | | | | | | | | | | | | | | | | | | | | | | | | |
IA | | $ | 18.11 | | | $ | 0.04 | | | $ | 9.12 | | | $ | 9.16 | | | $ | (0.12 | ) | | $ | (1.48 | ) | | $ | (1.60 | ) | | $ | 25.67 | | | | 51.84 | % | | $ | 243,719 | | | | 0.89 | % | | | 0.89 | % | | | 0.19 | % | | | 33 | % |
IB | | | 17.71 | | | | (0.01 | ) | | | 8.92 | | | | 8.91 | | | | (0.07 | ) | | | (1.48 | ) | | | (1.55 | ) | | | 25.07 | | | | 51.50 | | | | 57,187 | | | | 1.14 | | | | 1.14 | | | | (0.06 | ) | | | 33 | |
| | | | | | |
For the Year Ended December 31, 2012(4) | | | | | | | | | | | | | | | | | | | | | | | | | |
IA | | $ | 15.07 | | | $ | 0.13 | | | $ | 2.98 | | | $ | 3.11 | | | $ | (0.07 | ) | | $ | — | | | $ | (0.07 | ) | | $ | 18.11 | | | | 20.62 | % | | $ | 149,801 | | | | 0.91 | % | | | 0.91 | % | | | 0.69 | % | | | 46 | % |
IB | | | 14.74 | | | | 0.09 | | | | 2.90 | | | | 2.99 | | | | (0.02 | ) | | | — | | | | (0.02 | ) | | | 17.71 | | | | 20.32 | | | | 45,306 | | | | 1.16 | | | | 1.16 | | | | 0.43 | | | | 46 | |
| | | | | | | |
| Hartford High Yield HLS Fund | | | | | | | | | | | | | | | | | | | | | | | | | | | | | |
For the Year Ended December 31, 2016 | | | | | | | | | | | | | | | | | | | | | | | | | | | | | |
IA | | $ | 7.55 | | | $ | 0.44 | | | $ | 0.62 | | | $ | 1.06 | | | $ | (0.50 | ) | | $ | — | | | $ | (0.50 | ) | | $ | 8.11 | | | | 14.25 | % | | $ | 244,212 | | | | 0.79 | % | | | 0.79 | % | | | 5.52 | % | | | 41 | % |
IB | | | 7.43 | | | | 0.41 | | | | 0.62 | | | | 1.03 | | | | (0.48 | ) | | | — | | | | (0.48 | ) | | | 7.98 | | | | 13.99 | | | | 77,573 | | | | 1.04 | | | | 1.04 | | | | 5.27 | | | | 41 | |
| | | | | | |
For the Year Ended December 31, 2015 | | | | | | | | | | | | | | | | | | | | | | | | | |
IA | | $ | 8.45 | | | $ | 0.45 | | | $ | (0.79 | ) | | $ | (0.34 | ) | | $ | (0.56 | ) | | $ | — | | | $ | (0.56 | ) | | $ | 7.55 | | | | (4.30 | )% | | $ | 251,313 | | | | 0.76 | % | | | 0.76 | % | | | 5.40 | % | | | 34 | % |
IB | | | 8.32 | | | | 0.42 | | | | (0.77 | ) | | | (0.35 | ) | | | (0.54 | ) | | | — | | | | (0.54 | ) | | | 7.43 | | | | (4.56 | ) | | | 77,013 | | | | 1.01 | | | | 1.01 | | | | 5.15 | | | | 34 | |
| | | | | | |
For the Year Ended December 31, 2014 | | | | | | | | | | | | | | | | | | | | | | | | | |
IA | | $ | 8.90 | | | $ | 0.47 | | | $ | (0.22 | ) | | $ | 0.25 | | | $ | (0.70 | ) | | $ | — | | | $ | (0.70 | ) | | $ | 8.45 | | | | 2.58 | % | | $ | 321,650 | | | | 0.75 | % | | | 0.75 | % | | | 5.28 | % | | | 39 | % |
IB | | | 8.77 | | | | 0.44 | | | | (0.22 | ) | | | 0.22 | | | | (0.67 | ) | | | — | | | | (0.67 | ) | | | 8.32 | | | | 2.31 | | | | 105,579 | | | | 1.00 | | | | 1.00 | | | | 5.02 | | | | 39 | |
| | | | | | |
For the Year Ended December 31, 2013 | | | | | | | | | | | | | | | | | | | | | | | | | |
IA | | $ | 9.09 | | | $ | 0.54 | | | $ | 0.01 | | | $ | 0.55 | | | $ | (0.74 | ) | | $ | — | | | $ | (0.74 | ) | | $ | 8.90 | | | | 6.43 | % | | $ | 389,340 | | | | 0.75 | % | | | 0.75 | % | | | 5.90 | % | | | 46 | % |
IB | | | 8.96 | | | | 0.50 | | | | 0.03 | | | | 0.53 | | | | (0.72 | ) | | | — | | | | (0.72 | ) | | | 8.77 | | | | 6.17 | | | | 125,701 | | | | 1.00 | | | | 1.00 | | | | 5.64 | | | | 46 | |
| | | | | | |
For the Year Ended December 31, 2012 | | | | | | | | | | | | | | | | | | | | | | | | | |
IA | | $ | 8.70 | | | $ | 0.58 | | | $ | 0.63 | | | $ | 1.21 | | | $ | (0.82 | ) | | $ | — | | | $ | (0.82 | ) | | $ | 9.09 | | | | 14.31 | % | | $ | 504,042 | | | | 0.75 | % | | | 0.75 | % | | | 6.37 | % | | | 94 | % |
IB | | | 8.59 | | | | 0.55 | | | | 0.62 | | | | 1.17 | | | | (0.80 | ) | | | — | | | | (0.80 | ) | | | 8.96 | | | | 14.03 | | | | 149,050 | | | | 1.00 | | | | 1.00 | | | | 6.12 | | | | 94 | |
The accompanying notes are an integral part of these financial statements.
Financial Highlights – (continued)
| | | | | | | | | | | | | | | | | | | | | | | | | | | | | | | | | | | | | | | | | | | | | | | | | | | | | | | | |
| | | — Selected Per-Share Data(1) — | | | — Ratios and Supplemental Data — | |
Class | | Net Asset
Value at
Beginning
of Period | | | Net
Investment
Income
(Loss) | | | Net
Realized
and
Unrealized
Gain (Loss)
on
Investments | | | Total from
Investment
Operations | | | Dividends
from Net
Investment
Income | | | Distributions
from
Capital
Gains | | | Total
Dividends
and
Distributions | | | Net
Asset
Value
at
End of
Period | | | Total
Return(2) | | | Net
Assets at
End of
Period
(000s) | | | Ratio of
Expenses
to
Average
Net
Assets
Before
Adjust-
ments(3) | | | Ratio of
Expenses
to
Average
Net
Assets
After
Adjust-
ments(3) | | | Ratio of
Net
Investment
Income
(Loss) to
Average
Net Assets | | | Portfolio
Turnover | |
| Hartford International Opportunities HLS Fund | | | | | | | | | | | | | | | | | | | | | | | | | | | | | |
For the Year Ended December 31, 2016 | | | | | | | | | | | | | | | | | | | | | | | | | | | | | |
IA | | $ | 14.19 | | | $ | 0.24 | | | $ | (0.06 | ) | | $ | 0.18 | | | $ | (0.23 | ) | | $ | — | | | $ | (0.23 | ) | | $ | 14.14 | | | | 1.26 | % | | $ | 1,086,762 | | | | 0.76 | % | | | 0.76 | % | | | 1.74 | % | | | 95 | % |
IB | | | 14.36 | | | | 0.21 | | | | (0.07 | ) | | | 0.14 | | | | (0.19 | ) | | | — | | | | (0.19 | ) | | | 14.31 | | | | 0.94 | | | | 147,343 | | | | 1.01 | | | | 1.01 | | | | 1.50 | | | | 95 | |
| | | | | | |
For the Year Ended December 31, 2015 | | | | | | | | | | | | | | | | | | | | | | | | | |
IA | | $ | 14.13 | | | $ | 0.22 | | | $ | 0.06 | | | $ | 0.28 | | | $ | (0.22 | ) | | $ | — | | | $ | (0.22 | ) | | $ | 14.19 | | | | 1.88 | % | | $ | 1,146,250 | | | | 0.74 | % | | | 0.74 | % | | | 1.47 | % | | | 68 | % |
IB | | | 14.29 | | | | 0.18 | | | | 0.06 | | | | 0.24 | | | | (0.17 | ) | | | — | | | | (0.17 | ) | | | 14.36 | | | | 1.65 | | | | 171,538 | | | | 0.99 | | | | 0.99 | | | | 1.21 | | | | 68 | |
| | | | | | |
For the Year Ended December 31, 2014 | | | | | | | | | | | | | | | | | | | | | | | | | |
IA | | $ | 15.03 | | | $ | 0.19 | | | $ | (0.75 | ) | | $ | (0.56 | ) | | $ | (0.34 | ) | | $ | — | | | $ | (0.34 | ) | | $ | 14.13 | | | | (3.87 | )% | | $ | 1,239,946 | | | | 0.73 | % | | | 0.73 | % | | | 1.30 | % | | | 90 | % |
IB | | | 15.20 | | | | 0.15 | | | | (0.76 | ) | | | (0.61 | ) | | | (0.30 | ) | | | — | | | | (0.30 | ) | | | 14.29 | | | | (4.14 | ) | | | 189,053 | | | | 0.98 | | | | 0.98 | | | | 1.02 | | | | 90 | |
| | | | | | |
For the Year Ended December 31, 2013 | | | | | | | | | | | | | | | | | | | | | | | | | |
IA | | $ | 12.63 | | | $ | 0.24 | | | $ | 2.45 | | | $ | 2.69 | | | $ | (0.29 | ) | | $ | — | | | $ | (0.29 | ) | | $ | 15.03 | | | | 21.55 | % | | $ | 1,454,018 | | | | 0.74 | % | | | 0.74 | % | | | 1.76 | % | | | 100 | % |
IB | | | 12.76 | | | | 0.21 | | | | 2.49 | | | | 2.70 | | | | (0.26 | ) | | | — | | | | (0.26 | ) | | | 15.20 | | | | 21.28 | | | | 215,447 | | | | 0.99 | | | | 0.99 | | | | 1.55 | | | | 100 | |
| | | | | | |
For the Year Ended December 31, 2012(4) | | | | | | | | | | | | | | | | | | | | | | | | | |
IA | | $ | 10.72 | | | $ | 0.26 | | | $ | 1.88 | | | $ | 2.14 | | | $ | (0.23 | ) | | $ | — | | | $ | (0.23 | ) | | $ | 12.63 | | | | 20.20 | % | | $ | 1,303,209 | | | | 0.74 | % | | | 0.74 | % | | | 1.88 | % | | | 95 | % |
IB | | | 10.82 | | | | 0.25 | | | | 1.88 | | | | 2.13 | | | | (0.19 | ) | | | — | | | | (0.19 | ) | | | 12.76 | | | | 19.89 | | | | 220,699 | | | | 0.99 | | | | 0.99 | | | | 1.64 | | | | 95 | |
| | | | | | |
| Hartford MidCap HLS Fund | | | | | | | | | | | | | | | | | | | | | | | | | |
For the Year Ended December 31, 2016 | | | | | | | | | | | | | | | | | | | | | | | | | |
IA | | $ | 33.66 | | | $ | 0.05 | | | $ | 3.80 | | | $ | 3.85 | | | $ | (0.06 | ) | | $ | (3.62 | ) | | $ | (3.68 | ) | | $ | 33.83 | | | | 11.98 | % | | $ | 1,721,029 | | | | 0.71 | % | | | 0.71 | % | | | 0.16 | % | | | 32 | % |
IB | | | 33.11 | | | | (0.03 | ) | | | 3.72 | | | | 3.69 | | | | (0.01 | ) | | | (3.62 | ) | | | (3.63 | ) | | | 33.17 | | | | 11.69 | | | | 93,567 | | | | 0.96 | | | | 0.96 | | | | (0.09 | ) | | | 32 | |
| | | | | | |
For the Year Ended December 31, 2015 | | | | | | | | | | | | | | | | | | | | | | | | | |
IA | | $ | 37.28 | | | $ | 0.03 | | | $ | 0.83 | | | $ | 0.86 | | | $ | (0.03 | ) | | $ | (4.45 | ) | | $ | (4.48 | ) | | $ | 33.66 | | | | 1.60 | % | | $ | 1,647,715 | | | | 0.70 | % | | | 0.70 | % | | | 0.08 | % | | | 38 | % |
IB | | | 36.83 | | | | (0.06 | ) | | | 0.82 | | | | 0.76 | | | | (0.03 | ) | | | (4.45 | ) | | | (4.48 | ) | | | 33.11 | | | | 1.34 | | | | 104,395 | | | | 0.95 | | | | 0.95 | | | | (0.16 | ) | | | 38 | |
| | | | | | |
For the Year Ended December 31, 2014 | | | | | | | | | | | | | | | | | | | | | | | | | |
IA | | $ | 37.87 | | | $ | 0.04 | | | $ | 4.22 | | | $ | 4.26 | | | $ | (0.04 | ) | | $ | (4.81 | ) | | $ | (4.85 | ) | | $ | 37.28 | | | | 11.37 | % | | $ | 1,669,393 | | | | 0.70 | % | | | 0.70 | % | | | 0.10 | % | | | 42 | % |
IB | | | 37.52 | | | | (0.06 | ) | | | 4.18 | | | | 4.12 | | | | — | | | | (4.81 | ) | | | (4.81 | ) | | | 36.83 | | | | 11.09 | | | | 83,562 | | | | 0.95 | | | | 0.95 | | | | (0.15 | ) | | | 42 | |
| | | | | | |
For the Year Ended December 31, 2013 | | | | | | | | | | | | | | | | | | | | | | | | | |
IA | | $ | 28.16 | | | $ | 0.07 | | | $ | 11.02 | | | $ | 11.09 | | | $ | (0.04 | ) | | $ | (1.34 | ) | | $ | (1.38 | ) | | $ | 37.87 | | | | 39.82 | % | | $ | 1,483,626 | | | | 0.71 | % | | | 0.71 | % | | | 0.21 | % | | | 34 | % |
IB | | | 27.95 | | | | (0.02 | ) | | | 10.94 | | | | 10.92 | | | | (0.01 | ) | | | (1.34 | ) | | | (1.35 | ) | | | 37.52 | | | | 39.46 | | | | 82,483 | | | | 0.96 | | | | 0.96 | | | | (0.05 | ) | | | 34 | |
| | | | | | |
For the Year Ended December 31, 2012(4) | | | | | | | | | | | | | | | | | | | | | | | | | |
IA | | $ | 23.77 | | | $ | 0.24 | | | $ | 4.38 | | | $ | 4.62 | | | $ | (0.23 | ) | | $ | — | | | $ | (0.23 | ) | | $ | 28.16 | | | | 19.44 | % | | $ | 1,325,221 | | | | 0.71 | % | | | 0.71 | % | | | 0.84 | % | | | 51 | % |
IB | | | 23.59 | | | | 0.17 | | | | 4.35 | | | | 4.52 | | | | (0.16 | ) | | | — | | | | (0.16 | ) | | | 27.95 | | | | 19.14 | | | | 70,997 | | | | 0.96 | | | | 0.96 | | | | 0.59 | | | | 51 | |
The accompanying notes are an integral part of these financial statements.
Financial Highlights – (continued)
| | | | | | | | | | | | | | | | | | | | | | | | | | | | | | | | | | | | | | | | | | | | | | | | | | | | | | | | |
| | | — Selected Per-Share Data(1) — | | | — Ratios and Supplemental Data — | |
Class | | Net Asset
Value at
Beginning
of Period | | | Net
Investment
Income
(Loss) | | | Net
Realized
and
Unrealized
Gain (Loss)
on
Investments | | | Total from
Investment
Operations | | | Dividends
from Net
Investment
Income | | | Distributions
from
Capital
Gains | | | Total
Dividends
and
Distributions | | | Net
Asset
Value
at
End of
Period | | | Total
Return(2) | | | Net
Assets at
End of
Period
(000s) | | | Ratio of
Expenses
to
Average
Net
Assets
Before
Adjust-
ments(3) | | | Ratio of
Expenses
to
Average
Net
Assets
After
Adjust-
ments(3) | | | Ratio of
Net
Investment
Income
(Loss) to
Average
Net Assets | | | Portfolio
Turnover | |
| Hartford MidCap Value HLS Fund | | | | | | | | | | | | | | | | | | | | | | | | | |
For the Year Ended December 31, 2016 | | | | | | | | | | | | | | | | | | | | | | | | | |
IA | | $ | 12.33 | | | $ | 0.07 | | | $ | 1.40 | | | $ | 1.47 | | | $ | (0.07 | ) | | $ | (1.73 | ) | | $ | (1.80 | ) | | $ | 12.00 | | | | 12.82 | % | | $ | 289,872 | | | | 0.86 | % | | | 0.86 | % | | | 0.61 | % | | | 38 | % |
IB | | | 12.24 | | | | 0.04 | | | | 1.39 | | | | 1.43 | | | | (0.03 | ) | | | (1.73 | ) | | | (1.76 | ) | | | 11.91 | | | | 12.56 | | | | 89,704 | | | | 1.11 | | | | 1.11 | | | | 0.36 | | | | 38 | |
| | | | | | |
For the Year Ended December 31, 2015 | | | | | | | | | | | | | | | | | | | | | | | | | |
IA | | $ | 14.60 | | | $ | 0.07 | | | $ | (0.15 | ) | | $ | (0.08 | ) | | $ | (0.09 | ) | | $ | (2.10 | ) | | $ | (2.19 | ) | | $ | 12.33 | | | | (1.21 | )% | | $ | 291,174 | | | | 0.84 | % | | | 0.84 | % | | | 0.49 | % | | | 29 | % |
IB | | | 14.50 | | | | 0.03 | | | | (0.15 | ) | | | (0.12 | ) | | | (0.04 | ) | | | (2.10 | ) | | | (2.14 | ) | | | 12.24 | | | | (1.45 | ) | | | 91,720 | | | | 1.09 | | | | 1.09 | | | | 0.24 | | | | 29 | |
| | | | | | |
For the Year Ended December 31, 2014 | | | | | | | | | | | | | | | | | | | | | | | | | |
IA | | $ | 15.51 | | | $ | 0.09 | | | $ | 1.19 | | | $ | 1.28 | | | $ | (0.11 | ) | | $ | (2.08 | ) | | $ | (2.19 | ) | | $ | 14.60 | | | | 8.22 | % | | $ | 345,084 | | | | 0.84 | % | | | 0.84 | % | | | 0.60 | % | | | 31 | % |
IB | | | 15.42 | | | | 0.05 | | | | 1.18 | | | | 1.23 | | | | (0.07 | ) | | | (2.08 | ) | | | (2.15 | ) | | | 14.50 | | | | 7.91 | | | | 110,819 | | | | 1.09 | | | | 1.09 | | | | 0.35 | | | | 31 | |
| | | | | | |
For the Year Ended December 31, 2013 | | | | | | | | | | | | | | | | | | | | | | | | | |
IA | | $ | 11.65 | | | $ | 0.08 | | | $ | 3.95 | | | $ | 4.03 | | | $ | (0.17 | ) | | $ | — | | | $ | (0.17 | ) | | $ | 15.51 | | | | 34.71 | % | | $ | 377,272 | | | | 0.84 | % | | | 0.84 | % | | | 0.56 | % | | | 49 | % |
IB | | | 11.59 | | | | 0.04 | | | | 3.93 | | | | 3.97 | | | | (0.14 | ) | | | — | | | | (0.14 | ) | | | 15.42 | | | | 34.37 | | | | 123,884 | | | | 1.09 | | | | 1.09 | | | | 0.31 | | | | 49 | |
| | | | | | |
For the Year Ended December 31, 2012(4) | | | | | | | | | | | | | | | | | | | | | | | | | |
IA | | $ | 9.44 | | | $ | 0.14 | | | $ | 2.20 | | | $ | 2.34 | | | $ | (0.13 | ) | | $ | — | | | $ | (0.13 | ) | | $ | 11.65 | | | | 24.95 | % | | $ | 323,934 | | | | 0.85 | % | | | 0.85 | % | | | 1.03 | % | | | 45 | % |
IB | | | 9.38 | | | | 0.10 | | | | 2.21 | | | | 2.31 | | | | (0.10 | ) | | | — | | | | (0.10 | ) | | | 11.59 | | | | 24.64 | | | | 112,996 | | | | 1.10 | | | | 1.10 | | | | 0.79 | | | | 45 | |
| | | | | | |
| Hartford Small Cap Growth HLS Fund | | | | | | | | | | | | | | | | | | | | | | | | | |
For the Year Ended December 31, 2016 | | | | | | | | | | | | | | | | | | | | | | | | | |
IA | | $ | 24.93 | | | $ | 0.04 | | | $ | 2.98 | | | $ | 3.02 | | | $ | (0.04 | ) | | $ | (1.14 | ) | | $ | (1.18 | ) | | $ | 26.77 | | | | 12.37 | % | | $ | 972,576 | | | | 0.65 | % | | | 0.65 | % | | | 0.17 | % | | | 51 | % |
IB | | | 24.38 | | | | (0.02 | ) | | | 2.90 | | | | 2.88 | | | | — | | | | (1.14 | ) | | | (1.14 | ) | | | 26.12 | | | | 12.08 | | | | 226,557 | | | | 0.90 | | | | 0.90 | | | | (0.08 | ) | | | 51 | |
| | | | | | |
For the Year Ended December 31, 2015 | | | | | | | | | | | | | | | | | | | | | | | | | |
IA | | $ | 27.95 | | | $ | 0.07 | | | $ | (0.02 | ) | | $ | 0.05 | | | $ | (0.02 | ) | | $ | (3.05 | ) | | $ | (3.07 | ) | | $ | 24.93 | | | | (0.55 | )% | | $ | 913,414 | | | | 0.65 | % | | | 0.65 | % | | | 0.25 | % | | | 59 | % |
IB | | | 27.44 | | | | (0.01 | ) | | | — | | | | (0.01 | ) | | | — | | | | (3.05 | ) | | | (3.05 | ) | | | 24.38 | | | | (0.79 | ) | | | 209,948 | | | | 0.90 | | | | 0.90 | | | | (0.03 | ) | | | 59 | |
| | | | | | |
For the Year Ended December 31, 2014 | | | | | | | | | | | | | | | | | | | | | | | | | |
IA | | $ | 32.60 | | | $ | 0.06 | | | $ | 1.48 | | | $ | 1.54 | | | $ | (0.02 | ) | | $ | (6.17 | ) | | $ | (6.19 | ) | | $ | 27.95 | | | | 5.83 | % | | $ | 557,200 | | | | 0.65 | % | | | 0.65 | % | | | 0.19 | % | | | 117 | % |
IB | | | 32.17 | | | | (0.02 | ) | | | 1.46 | | | | 1.44 | | | | — | | | | (6.17 | ) | | | (6.17 | ) | | | 27.44 | | | | 5.57 | | | | 115,230 | | | | 0.90 | | | | 0.90 | | | | (0.06 | ) | | | 117 | |
| | | | | | |
For the Year Ended December 31, 2013 | | | | | | | | | | | | | | | | | | | | | | | | | |
IA | | $ | 25.44 | | | $ | 0.05 | | | $ | 10.92 | | | $ | 10.97 | | | $ | (0.12 | ) | | $ | (3.69 | ) | | $ | (3.81 | ) | | $ | 32.60 | | | | 44.87 | % | | $ | 466,173 | | | | 0.67 | % | | | 0.67 | % | | | 0.16 | % | | | 81 | % |
IB | | | 25.14 | | | | (0.02 | ) | | | 10.77 | | | | 10.75 | | | | (0.03 | ) | | | (3.69 | ) | | | (3.72 | ) | | | 32.17 | | | | 44.50 | | | | 123,966 | | | | 0.92 | | | | 0.92 | | | | (0.08 | ) | | | 81 | |
| | | | | | |
For the Year Ended December 31, 2012(4) | | | | | | | | | | | | | | | | | | | | | | | | | |
IA | | $ | 21.67 | | | $ | 0.11 | | | $ | 3.66 | | | $ | 3.77 | | | $ | — | | | $ | — | | | $ | — | | | $ | 25.44 | | | | 17.40 | % | | $ | 378,318 | | | | 0.67 | % | | | 0.67 | % | | | 0.41 | % | | | 85 | % |
IB | | | 21.47 | | | | 0.04 | | | | 3.63 | | | | 3.67 | | | | — | | | | — | | | | — | | | | 25.14 | | | | 17.10 | | | | 134,404 | | | | 0.92 | | | | 0.92 | | | | 0.16 | | | | 85 | |
The accompanying notes are an integral part of these financial statements.
Financial Highlights – (continued)
| | | | | | | | | | | | | | | | | | | | | | | | | | | | | | | | | | | | | | | | | | | | | | | | | | | | | | | | |
| | | — Selected Per-Share Data(1) — | | | — Ratios and Supplemental Data — | |
Class | | Net Asset
Value at
Beginning
of Period | | | Net
Investment
Income
(Loss) | | | Net
Realized
and
Unrealized
Gain (Loss)
on
Investments | | | Total from
Investment
Operations | | | Dividends
from Net
Investment
Income | | | Distributions
from
Capital
Gains | | | Total
Dividends
and
Distributions | | | Net
Asset
Value
at
End of
Period | | | Total
Return(2) | | | Net
Assets at
End of
Period
(000s) | | | Ratio of
Expenses
to
Average
Net
Assets
Before
Adjust-
ments(3) | | | Ratio of
Expenses
to
Average
Net
Assets
After
Adjust-
ments(3) | | | Ratio of
Net
Investment
Income
(Loss) to
Average
Net Assets | | | Portfolio
Turnover | |
| Hartford Small Company HLS Fund | | | | | | | | | | | | | | | | | | | | | | | | | |
For the Year Ended December 31, 2016 | | | | | | | | | | | | | | | | | | | | | | | | | |
IA | | $ | 17.52 | | | $ | (0.01 | ) | | $ | 0.33 | (9) | | $ | 0.32 | | | $ | — | | | $ | (1.68 | ) | | $ | (1.68 | ) | | $ | 16.16 | | | | 2.04 | % | | $ | 834,044 | | | | 0.76 | % | | | 0.76 | % | | | (0.08 | )% | | | 94 | % |
IB | | | 16.47 | | | | (0.05 | ) | | | 0.31 | (9) | | | 0.26 | | | | — | | | | (1.68 | ) | | | (1.68 | ) | | | 15.05 | | | | 1.81 | | | | 73,108 | | | | 1.01 | | | | 1.01 | | | | (0.34 | ) | | | 94 | |
| | | | | | |
For the Year Ended December 31, 2015 | | | | | | | | | | | | | | | | | | | | | | | | | |
IA | | $ | 23.33 | | | $ | (0.02 | ) | | $ | (1.43 | ) | | $ | (1.45 | ) | | $ | — | | | $ | (4.36 | ) | | $ | (4.36 | ) | | $ | 17.52 | | | | (8.21 | )% | | $ | 1,117,778 | | | | 0.71 | % | | | 0.71 | % | | | (0.11 | )% | | | 88 | % |
IB | | | 22.24 | | | | (0.07 | ) | | | (1.34 | ) | | | (1.41 | ) | | | — | | | | (4.36 | ) | | | (4.36 | ) | | | 16.47 | | | | (8.45 | ) | | | 98,501 | | | | 0.96 | | | | 0.96 | | | | (0.36 | ) | | | 88 | |
| | | | | | |
For the Year Ended December 31, 2014 | | | | | | | | | | | | | | | | | | | | | | | | | |
IA | | $ | 26.43 | | | $ | (0.09 | ) | | $ | 1.78 | | | $ | 1.69 | | | $ | — | | | $ | (4.79 | ) | | $ | (4.79 | ) | | $ | 23.33 | | | | 7.07 | % | | $ | 1,279,533 | | | | 0.71 | % | | | 0.71 | % | | | (0.35 | )% | | | 90 | % |
IB | | | 25.46 | | | | (0.15 | ) | | | 1.72 | | | | 1.57 | | | | — | | | | (4.79 | ) | | | (4.79 | ) | | | 22.24 | | | | 6.85 | | | | 123,799 | | | | 0.96 | | | | 0.96 | | | | (0.60 | ) | | | 90 | |
| | | | | | |
For the Year Ended December 31, 2013 | | | | | | | | | | | | | | | | | | | | | | | | | |
IA | | $ | 19.74 | | | $ | (0.07 | ) | | $ | 8.60 | | | $ | 8.53 | | | $ | (0.02 | ) | | $ | (1.82 | ) | | $ | (1.84 | ) | | $ | 26.43 | | | | 44.38 | % | | $ | 1,354,821 | | | | 0.71 | % | | | 0.71 | % | | | (0.29 | )% | | | 96 | % |
IB | | | 19.06 | | | | (0.12 | ) | | | 8.34 | | | | 8.22 | | | | — | | | | (1.82 | ) | | | (1.82 | ) | | | 25.46 | | | | 44.28 | | | | 141,791 | | | | 0.96 | | | | 0.96 | | | | (0.54 | ) | | | 96 | |
| | | | | | |
For the Year Ended December 31, 2012(4) | | | | | | | | | | | | | | | | | | | | | | | | | |
IA | | $ | 17.07 | | | $ | 0.03 | | | $ | 2.64 | | | $ | 2.67 | | | $ | — | | | $ | — | | | $ | — | | | $ | 19.74 | | | | 15.64 | % | | $ | 1,126,350 | | | | 0.72 | % | | | 0.72 | % | | | 0.16 | % | | | 110 | % |
IB | | | 16.56 | | | | (0.03 | ) | | | 2.53 | | | | 2.50 | | | | — | | | | — | | | | — | | | | 19.06 | | | | 15.10 | | | | 117,133 | | | | 0.97 | | | | 0.97 | | | | (0.13 | ) | | | 110 | |
| | | | | | |
| Hartford Small/Mid Cap Equity HLS Fund | | | | | | | | | | | | | | | | | | | | | | | | | |
For the Year Ended December 31, 2016 | | | | | | | | | | | | | | | | | | | | | | | | | |
IA | | $ | 7.45 | | | $ | 0.09 | | | $ | 1.09 | | | $ | 1.18 | | | $ | (0.11 | ) | | $ | (0.49 | ) | | $ | (0.60 | ) | | $ | 8.03 | | | | 16.48 | % | | $ | 87,752 | | | | 0.92 | % | | | 0.92 | % | | | 1.25 | % | | | 96 | % |
IB | | | 7.40 | | | | 0.07 | | | | 1.09 | | | | 1.16 | | | | (0.08 | ) | | | (0.49 | ) | | | (0.57 | ) | | | 7.99 | | | | 16.33 | | | | 17,125 | | | | 1.17 | | | | 1.17 | | | | 1.01 | | | | 96 | |
| | | | | | |
For the Year Ended December 31, 2015 | | | | | | | | | | | | | | | | | | | | | | | | | |
IA | | $ | 9.47 | | | $ | 0.12 | | | $ | (0.46 | ) | | $ | (0.34 | ) | | $ | (0.12 | ) | | $ | (1.56 | ) | | $ | (1.68 | ) | | $ | 7.45 | | | | (4.73 | )% | | $ | 79,379 | | | | 0.88 | % | | | 0.88 | % | | | 1.39 | % | | | 80 | % |
IB | | | 9.41 | | | | 0.10 | | | | (0.46 | ) | | | (0.36 | ) | | | (0.09 | ) | | | (1.56 | ) | | | (1.65 | ) | | | 7.40 | | | | (4.97 | ) | | | 16,501 | | | | 1.13 | | | | 1.13 | | | | 1.12 | | | | 80 | |
| | | | | | |
For the Year Ended December 31, 2014 | | | | | | | | | | | | | | | | | | | | | | | | | |
IA | | $ | 11.29 | | | $ | 0.13 | | | $ | 0.43 | | | $ | 0.56 | | | $ | (0.18 | ) | | $ | (2.20 | ) | | $ | (2.38 | ) | | $ | 9.47 | | | | 5.22 | % | | $ | 98,069 | | | | 0.85 | % | | | 0.85 | % | | | 1.20 | % | | | 108 | % |
IB | | | 11.22 | | | | 0.10 | | | | 0.44 | | | | 0.54 | | | | (0.15 | ) | | | (2.20 | ) | | | (2.35 | ) | | | 9.41 | | | | 5.00 | | | | 23,239 | | | | 1.10 | | | | 1.10 | | | | 0.96 | | | | 108 | |
| | | | | | |
For the Year Ended December 31, 2013 | | | | | | | | | | | | | | | | | | | | | | | | | |
IA | | $ | 8.90 | | | $ | 0.16 | | | $ | 3.08 | | | $ | 3.24 | | | $ | (0.14 | ) | | $ | (0.71 | ) | | $ | (0.85 | ) | | $ | 11.29 | | | | 37.51 | % | | $ | 117,395 | | | | 0.85 | % | | | 0.85 | % | | | 1.58 | % | | | 128 | % |
IB | | | 8.85 | | | | 0.13 | | | | 3.07 | | | | 3.20 | | | | (0.12 | ) | | | (0.71 | ) | | | (0.83 | ) | | | 11.22 | | | | 37.08 | | | | 26,362 | | | | 1.10 | | | | 1.10 | | | | 1.32 | | | | 128 | |
| | | | | | |
For the Year Ended December 31, 2012(4) | | | | | | | | | | | | | | | | | | | | | | | | | |
IA | | $ | 8.93 | | | $ | 0.15 | | | $ | 1.21 | | | $ | 1.36 | | | $ | (0.06 | ) | | $ | (1.33 | ) | | $ | (1.39 | ) | | $ | 8.90 | | | | 15.87 | % | | $ | 106,339 | | | | 0.88 | % | | | 0.88 | % | | | 1.57 | % | | | 150 | % |
IB | | | 8.88 | | | | 0.13 | | | | 1.20 | | | | 1.33 | | | | (0.03 | ) | | | (1.33 | ) | | | (1.36 | ) | | | 8.85 | | | | 15.58 | | | | 24,774 | | | | 1.13 | | | | 1.13 | | | | 1.26 | | | | 150 | |
The accompanying notes are an integral part of these financial statements.
Financial Highlights – (continued)
| | | | | | | | | | | | | | | | | | | | | | | | | | | | | | | | | | | | | | | | | | | | | | | | | | | | | | | | |
| | | — Selected Per-Share Data(1) — | | | — Ratios and Supplemental Data — | |
Class | | Net Asset
Value at
Beginning
of Period | | | Net
Investment
Income
(Loss) | | | Net
Realized
and
Unrealized
Gain (Loss)
on
Investments | | | Total from
Investment
Operations | | | Dividends
from Net
Investment
Income | | | Distributions
from
Capital
Gains | | | Total
Dividends
and
Distributions | | | Net
Asset
Value
at
End of
Period | | | Total
Return(2) | | | Net
Assets at
End of
Period
(000s) | | | Ratio of
Expenses
to
Average
Net
Assets
Before
Adjust-
ments(3) | | | Ratio of
Expenses
to
Average
Net
Assets
After
Adjust-
ments(3) | | | Ratio of
Net
Investment
Income
(Loss) to
Average
Net Assets | | | Portfolio
Turnover | |
| Hartford Stock HLS Fund | | | | | | | | | | | | | | | | | | | | | | | | | |
For the Year Ended December 31, 2016 | | | | | | | | | | | | | | | | | | | | | | | | | |
IA | | $ | 64.06 | | | $ | 1.14 | | | $ | 3.61 | | | $ | 4.75 | | | $ | (1.26 | ) | | $ | — | | | $ | (1.26 | ) | | $ | 67.55 | | | | 7.41 | % | | $ | 1,312,626 | | | | 0.52 | % | | | 0.52 | % | | | 1.72 | % | | | 29 | % |
IB | | | 64.03 | | | | 0.97 | | | | 3.61 | | | | 4.58 | | | | (1.08 | ) | | | — | | | | (1.08 | ) | | | 67.53 | | | | 7.14 | | | | 140,317 | | | | 0.77 | | | | 0.77 | | | | 1.47 | | | | 29 | |
| | | | | | |
For the Year Ended December 31, 2015 | | | | | | | | | | | | | | | | | | | | | | | | | |
IA | | $ | 63.49 | | | $ | 1.19 | | | $ | 0.56 | | | $ | 1.75 | | | $ | (1.18 | ) | | $ | — | | | $ | (1.18 | ) | | $ | 64.06 | | | | 2.74 | % | | $ | 1,388,110 | | | | 0.51 | % | | | 0.51 | % | | | 1.86 | % | | | 23 | % |
IB | | | 63.46 | | | | 1.03 | | | | 0.54 | | | | 1.57 | | | | (1.00 | ) | | | — | | | | (1.00 | ) | | | 64.03 | | | | 2.48 | | | | 155,722 | | | | 0.76 | | | | 0.76 | | | | 1.61 | | | | 23 | |
| | | | | | |
For the Year Ended December 31, 2014 | | | | | | | | | | | | | | | | | | | | | | | | | |
IA | | $ | 58.07 | | | $ | 1.07 | | | $ | 5.51 | | | $ | 6.58 | | | $ | (1.16 | ) | | $ | — | | | $ | (1.16 | ) | | $ | 63.49 | | | | 11.31 | % | | $ | 1,552,777 | | | | 0.50 | % | | | 0.50 | % | | | 1.79 | % | | | 20 | % |
IB | | | 58.04 | | | | 0.92 | | | | 5.50 | | | | 6.42 | | | | (1.00 | ) | | | — | | | | (1.00 | ) | | | 63.46 | | | | 11.04 | | | | 182,112 | | | | 0.75 | | | | 0.75 | | | | 1.54 | | | | 20 | |
| | | | | | |
For the Year Ended December 31, 2013 | | | | | | | | | | | | | | | | | | | | | | | | | |
IA | | $ | 44.73 | | | $ | 0.99 | | | $ | 13.41 | | | $ | 14.40 | | | $ | (1.06 | ) | | $ | — | | | $ | (1.06 | ) | | $ | 58.07 | | | | 32.25 | % | | $ | 1,667,278 | | | | 0.51 | % | | | 0.51 | % | | | 1.89 | % | | | 27 | % |
IB | | | 44.71 | | | | 0.85 | | | | 13.40 | | | | 14.25 | | | | (0.92 | ) | | | — | | | | (0.92 | ) | | | 58.04 | | | | 31.92 | | | | 204,437 | | | | 0.76 | | | | 0.76 | | | | 1.64 | | | | 27 | |
| | | | | | |
For the Year Ended December 31, 2012(4) | | | | | | | | | | | | | | | | | | | | | | | | | |
IA | | $ | 39.95 | | | $ | 0.91 | | | $ | 4.83 | | | $ | 5.74 | | | $ | (0.96 | ) | | $ | — | | | $ | (0.96 | ) | | $ | 44.73 | | | | 14.38 | % | | $ | 1,532,116 | | | | 0.51 | % | | | 0.51 | % | | | 1.86 | % | | | 82 | % |
IB | | | 39.92 | | | | 0.82 | | | | 4.81 | | | | 5.63 | | | | (0.84 | ) | | | — | | | | (0.84 | ) | | | 44.71 | | | | 14.10 | | | | 200,153 | | | | 0.76 | | | | 0.76 | | | | 1.61 | | | | 82 | |
| | | | | | | |
| Hartford Total Return Bond HLS Fund | | | | | | | | | | | | | | | | | | | | | | | | | | | | | |
For the Year Ended December 31, 2016 | | | | | | | | | | | | | | | | | | | | | | | | | |
IA | | $ | 10.93 | | | $ | 0.36 | | | $ | 0.13 | | | $ | 0.49 | | | $ | (0.29 | ) | | $ | (0.04 | ) | | $ | (0.33 | ) | | $ | 11.09 | | | | 4.49 | % | | $ | 2,244,505 | | | | 0.52 | % | | | 0.52 | % | | | 3.16 | % | | | 36 | % |
IB | | | 10.87 | | | | 0.33 | | | | 0.13 | | | | 0.46 | | | | (0.26 | ) | | | (0.04 | ) | | | (0.30 | ) | | | 11.03 | | | | 4.22 | | | | 262,187 | | | | 0.77 | | | | 0.77 | | | | 2.91 | | | | 36 | |
| | | | | | |
For the Year Ended December 31, 2015 | | | | | | | | | | | | | | | | | | | | | | | | | |
IA | | $ | 11.63 | | | $ | 0.33 | | | $ | (0.39 | ) | | $ | (0.06 | ) | | $ | (0.36 | ) | | $ | (0.28 | ) | | $ | (0.64 | ) | | $ | 10.93 | | | | (0.59 | )% | | $ | 2,448,280 | | | | 0.51 | % | | | 0.51 | % | | | 2.88 | % | | | 66 | % |
IB | | | 11.56 | | | | 0.30 | | | | (0.39 | ) | | | (0.09 | ) | | | (0.32 | ) | | | (0.28 | ) | | | (0.60 | ) | | | 10.87 | | | | (0.81 | ) | | | 295,006 | | | | 0.76 | | | | 0.76 | | | | 2.63 | | | | 66 | |
| | | | | | |
For the Year Ended December 31, 2014 | | | | | | | | | | | | | | | | | | | | | | | | | |
IA | | $ | 11.35 | | | $ | 0.33 | | | $ | 0.34 | | | $ | 0.67 | | | $ | (0.39 | ) | | $ | — | | | $ | (0.39 | ) | | $ | 11.63 | | | | 5.89 | % | | $ | 2,879,633 | | | | 0.50 | % | | | 0.50 | % | | | 2.85 | % | | | 84 | % |
IB | | | 11.27 | | | | 0.30 | | | | 0.34 | | | | 0.64 | | | | (0.35 | ) | | | — | | | | (0.35 | ) | | | 11.56 | | | | 5.68 | | | | 360,006 | | | | 0.75 | | | | 0.75 | | | | 2.60 | | | | 84 | |
| | | | | | |
For the Year Ended December 31, 2013 | | | | | | | | | | | | | | | | | | | | | | | | | |
IA | | $ | 11.99 | | | $ | 0.32 | | | $ | (0.49 | ) | | $ | (0.17 | ) | | $ | (0.47 | ) | | $ | — | | | $ | (0.47 | ) | | $ | 11.35 | | | | (1.36 | )% | | $ | 3,290,622 | | | | 0.50 | % | | | 0.50 | % | | | 2.76 | % | | | 81 | % |
IB | | | 11.91 | | | | 0.29 | | | | (0.50 | ) | | | (0.21 | ) | | | (0.43 | ) | | | — | | | | (0.43 | ) | | | 11.27 | | | | (1.66 | ) | | | 414,910 | | | | 0.75 | | | | 0.75 | | | | 2.51 | | | | 81 | |
| | | | | | |
For the Year Ended December 31, 2012(4) | | | | | | | | | | | | | | | | | | | | | | | | | |
IA | | $ | 11.63 | | | $ | 0.41 | | | $ | 0.45 | | | $ | 0.86 | | | $ | (0.50 | ) | | $ | — | | | $ | (0.50 | ) | | $ | 11.99 | | | | 7.54 | % | | $ | 3,572,511 | | | | 0.50 | % | | | 0.50 | % | | | 3.01 | % | | | 88 | % |
IB | | | 11.55 | | | | 0.40 | | | | 0.43 | | | | 0.83 | | | | (0.47 | ) | | | — | | | | (0.47 | ) | | | 11.91 | | | | 7.27 | | | | 566,274 | | | | 0.75 | | | | 0.75 | | | | 2.76 | | | | 88 | |
The accompanying notes are an integral part of these financial statements.
Financial Highlights – (continued)
| | | | | | | | | | | | | | | | | | | | | | | | | | | | | | | | | | | | | | | | | | | | | | | | | | | | | | | | |
| | | — Selected Per-Share Data(1) — | | | — Ratios and Supplemental Data — | |
Class | | Net Asset
Value at
Beginning
of Period | | | Net
Investment
Income
(Loss) | | | Net
Realized
and
Unrealized
Gain (Loss)
on
Investments | | | Total from
Investment
Operations | | | Dividends
from Net
Investment
Income | | | Distributions
from
Capital
Gains | | | Total
Dividends
and
Distributions | | | Net
Asset
Value
at
End of
Period | | | Total
Return(2) | | | Net
Assets at
End of
Period
(000s) | | | Ratio of
Expenses
to
Average
Net
Assets
Before
Adjust-
ments(3) | | | Ratio of
Expenses
to
Average
Net
Assets
After
Adjust-
ments(3) | | | Ratio of
Net
Investment
Income
(Loss) to
Average
Net Assets | | | Portfolio
Turnover | |
| Hartford Ultrashort Bond HLS Fund | | | | | | | | | | | | | | | | | | | | | | | | | | | | | |
For the Year Ended December 31, 2016 | | | | | | | | | | | | | | | | | | | | | | | | | |
IA | | $ | 9.99 | | | $ | 0.06 | | | $ | 0.04 | | | $ | 0.10 | | | $ | (0.05 | ) | | $ | — | | | $ | (0.05 | ) | | $ | 10.04 | | | | 0.97 | % | | $ | 533,091 | | | | 0.45 | % | | | 0.45 | % | | | 0.61 | % | | | 51 | % |
IB | | | 9.97 | | | | 0.04 | | | | 0.02 | | | | 0.06 | | | | (0.01 | ) | | | — | | | | (0.01 | ) | | | 10.02 | | | | 0.64 | | | | 78,658 | | | | 0.70 | | | | 0.70 | | | | 0.35 | | | | 51 | |
| | | | | | |
For the Year Ended December 31, 2015 | | | | | | | | | | | | | | | | | | | | | | | | | |
IA | | $ | 10.01 | | | $ | 0.03 | | | $ | (0.02 | ) | | $ | 0.01 | | | $ | (0.03 | ) | | $ | — | | | $ | (0.03 | ) | | $ | 9.99 | | | | 0.13 | % | | $ | 611,087 | | | | 0.43 | % | | | 0.43 | % | | | 0.33 | % | | | 35 | % |
IB | | | 9.98 | | | | 0.01 | | | | (0.02 | ) | | | (0.01 | ) | | | — | | | | — | | | | — | | | | 9.97 | | | | (0.09 | ) | | | 96,970 | | | | 0.68 | | | | 0.68 | | | | 0.08 | | | | 35 | |
| | | | | | |
For the Year Ended December 31, 2014 | | | | | | | | | | | | | | | | | | | | | | | | | |
IA | | $ | 10.00 | | | $ | 0.02 | | | $ | (0.01 | ) | | $ | 0.01 | | | $ | — | | | $ | — | | | $ | — | | | $ | 10.01 | | | | 0.10 | % | | $ | 745,597 | | | | 0.43 | % | | | 0.43 | % | | | 0.23 | % | | | 40 | % |
IB | | | 9.99 | | | | — | | | | (0.01 | ) | | | (0.01 | ) | | | — | | | | — | | | | — | | | | 9.98 | | | | (0.10 | ) | | | 121,168 | | | | 0.68 | | | | 0.68 | | | | (0.02 | ) | | | 40 | |
| | | | | | |
For the Year Ended December 31, 2013(4)(11) | | | | | | | | | | | | | | | | | | | | | | | | | |
IA | | $ | 10.00 | | | $ | — | | | $ | — | | | $ | — | | | $ | — | | | $ | — | | | $ | — | | | $ | 10.00 | | | | — | % | | $ | 1,013,110 | | | | 0.45 | % | | | 0.21 | % | | | (0.02 | )% | | | 6 | %(12) |
IB | | | 10.00 | | | | (0.01 | ) | | | — | | | | (0.01 | ) | | | — | | | | — | | | | — | | | | 9.99 | | | | (0.10 | ) | | | 163,058 | | | | 0.49 | | | | 0.25 | | | | (0.06 | ) | | | 6 | (12) |
| | | | | | |
For the Year Ended December 31, 2012(4)(11) | | | | | | | | | | | | | | | | | | | | | | | | | |
IA | | $ | 10.00 | | | $ | — | | | $ | — | | | $ | — | | | $ | — | | | $ | — | | | $ | — | | | $ | 10.00 | | | | — | % | | $ | 1,603,657 | | | | 0.42 | % | | | 0.18 | % | | | — | % | | | — | %(13) |
IB | | | 10.00 | | | | — | | | | — | | | | — | | | | — | | | | — | | | | — | | | | 10.00 | | | | — | | | | 272,464 | | | | 0.42 | | | | 0.18 | | | | — | | | | — | (13) |
| | | | | | | |
| Hartford U.S. Government Securities HLS Fund | | | | | | | | | | | | | | | | | | | | | | | | | | | | | |
For the Year Ended December 31, 2016 | | | | | | | | | | | | | | | | | | | | | | | | | |
IA | | $ | 10.34 | | | $ | 0.18 | | | $ | (0.02 | )(9) | | $ | 0.16 | | | $ | (0.20 | ) | | $ | — | | | $ | (0.20 | ) | | $ | 10.30 | | | | 1.54 | % | | $ | 368,740 | | | | 0.51 | % | | | 0.51 | % | | | 1.67 | % | | | 81 | % |
IB | | | 10.32 | | | | 0.15 | | | | (0.02 | )(9) | | | 0.13 | | | | (0.17 | ) | | | — | | | | (0.17 | ) | | | 10.28 | | | | 1.27 | | | | 79,489 | | | | 0.76 | | | | 0.76 | | | | 1.42 | | | | 81 | |
| | | | | | |
For the Year Ended December 31, 2015 | | | | | | | | | | | | | | | | | | | | | | | | | |
IA | | $ | 10.37 | | | $ | 0.16 | | | $ | — | | | $ | 0.16 | | | $ | (0.19 | ) | | $ | — | | | $ | (0.19 | ) | | $ | 10.34 | | | | 1.56 | % | | $ | 412,060 | | | | 0.49 | % | | | 0.49 | % | | | 1.53 | % | | | 42 | % |
IB | | | 10.34 | | | | 0.13 | | | | 0.01 | | | | 0.14 | | | | (0.16 | ) | | | — | | | | (0.16 | ) | | | 10.32 | | | | 1.35 | | | | 90,088 | | | | 0.74 | | | | 0.74 | | | | 1.28 | | | | 42 | |
| | | | | | |
For the Year Ended December 31, 2014 | | | | | | | | | | | | | | | | | | | | | | | | | |
IA | | $ | 10.32 | | | $ | 0.15 | | | $ | 0.14 | | | $ | 0.29 | | | $ | (0.24 | ) | | $ | — | | | $ | (0.24 | ) | | $ | 10.37 | | | | 2.81 | % | | $ | 468,967 | | | | 0.48 | % | | | 0.48 | % | | | 1.40 | % | | | 37 | % |
IB | | | 10.28 | | | | 0.12 | | | | 0.15 | | | | 0.27 | | | | (0.21 | ) | | | — | | | | (0.21 | ) | | | 10.34 | | | | 2.59 | | | | 102,235 | | | | 0.73 | | | | 0.73 | | | | 1.15 | | | | 37 | |
| | | | | | |
For the Year Ended December 31, 2013 | | | | | | | | | | | | | | | | | | | | | | | | | |
IA | | $ | 10.75 | | | $ | 0.12 | | | $ | (0.30 | ) | | $ | (0.18 | ) | | $ | (0.25 | ) | | $ | — | | | $ | (0.25 | ) | | $ | 10.32 | | | | (1.68 | )% | | $ | 556,169 | | | | 0.49 | % | | | 0.49 | % | | | 1.14 | % | | | 39 | % |
IB | | | 10.71 | | | | 0.09 | | | | (0.30 | ) | | | (0.21 | ) | | | (0.22 | ) | | | — | | | | (0.22 | ) | | | 10.28 | | | | (1.97 | ) | | | 123,908 | | | | 0.74 | | | | 0.74 | | | | 0.89 | | | | 39 | |
| | | | | | |
For the Year Ended December 31, 2012(4) | | | | | | | | | | | | | | | | | | | | | | | | | |
IA | | $ | 10.68 | | | $ | 0.16 | | | $ | 0.22 | | | $ | 0.38 | | | $ | (0.31 | ) | | $ | — | | | $ | (0.31 | ) | | $ | 10.75 | | | | 3.70 | % | | $ | 833,735 | | | | 0.48 | % | | | 0.48 | % | | | 1.20 | % | | | 86 | % |
IB | | | 10.63 | | | | 0.13 | | | | 0.23 | | | | 0.36 | | | | (0.28 | ) | | | — | | | | (0.28 | ) | | | 10.71 | | | | 3.44 | | | | 173,937 | | | | 0.73 | | | | 0.73 | | | | 0.95 | | | | 86 | |
The accompanying notes are an integral part of these financial statements.
Financial Highlights – (continued)
| | | | | | | | | | | | | | | | | | | | | | | | | | | | | | | | | | | | | | | | | | | | | | | | | | | | | | | | |
| | | — Selected Per-Share Data(1) — | | | — Ratios and Supplemental Data — | |
Class | | Net Asset
Value at
Beginning
of Period | | | Net
Investment
Income
(Loss) | | | Net
Realized
and
Unrealized
Gain (Loss)
on
Investments | | | Total from
Investment
Operations | | | Dividends
from Net
Investment
Income | | | Distributions
from
Capital
Gains | | | Total
Dividends
and
Distributions | | | Net
Asset
Value
at
End of
Period | | | Total
Return(2) | | | Net
Assets at
End of
Period
(000s) | | | Ratio of
Expenses
to
Average
Net
Assets
Before
Adjust-
ments(3) | | | Ratio of
Expenses
to
Average
Net
Assets
After
Adjust-
ments(3) | | | Ratio of
Net
Investment
Income
(Loss) to
Average
Net Assets | | | Portfolio
Turnover | |
| Hartford Value HLS Fund | | | | | | | | | | | | | | | | | | | | | | | | | | | | | |
For the Year Ended December 31, 2016 | | | | | | | | | | | | | | | | | | | | | | | | | |
IA | | $ | 15.58 | | | $ | 0.28 | | | $ | 1.75 | | | $ | 2.03 | | | $ | (0.26 | ) | | $ | (2.08 | ) | | $ | (2.34 | ) | | $ | 15.27 | | | | 13.69 | % | | $ | 446,411 | | | | 0.80 | % | | | 0.80 | % | | | 1.83 | % | | | 15 | % |
IB | | | 15.57 | | | | 0.24 | | | | 1.75 | | | | 1.99 | | | | (0.22 | ) | | | (2.08 | ) | | | (2.30 | ) | | | 15.26 | | | | 13.46 | | | | 77,796 | | | | 1.05 | | | | 1.05 | | | | 1.58 | | | | 15 | |
| | | | | | |
For the Year Ended December 31, 2015 | | | | | | | | | | | | | | | | | | | | | | | | | |
IA | | $ | 16.89 | | | $ | 0.26 | | | $ | (0.77 | ) | | $ | (0.51 | ) | | $ | (0.26 | ) | | $ | (0.54 | ) | | $ | (0.80 | ) | | $ | 15.58 | | | | (3.08 | )% | | $ | 455,713 | | | | 0.78 | % | | | 0.78 | % | | | 1.56 | % | | | 19 | % |
IB | | | 16.88 | | | | 0.22 | | | | (0.77 | ) | | | (0.55 | ) | | | (0.22 | ) | | | (0.54 | ) | | | (0.76 | ) | | | 15.57 | | | | (3.35 | ) | | | 80,052 | | | | 1.03 | | | | 1.03 | | | | 1.30 | | | | 19 | |
| | | | | | |
For the Year Ended December 31, 2014 | | | | | | | | | | | | | | | | | | | | | | | | | |
IA | | $ | 15.39 | | | $ | 0.24 | | | $ | 1.51 | | | $ | 1.75 | | | $ | (0.25 | ) | | $ | — | | | $ | (0.25 | ) | | $ | 16.89 | | | | 11.37 | % | | $ | 523,661 | | | | 0.77 | % | | | 0.77 | % | | | 1.51 | % | | | 14 | % |
IB | | | 15.38 | | | | 0.20 | | | | 1.51 | | | | 1.71 | | | | (0.21 | ) | | | — | | | | (0.21 | ) | | | 16.88 | | | | 11.10 | | | | 98,407 | | | | 1.02 | | | | 1.02 | | | | 1.26 | | | | 14 | |
| | | | | | |
For the Year Ended December 31, 2013 | | | | | | | | | | | | | | | | | | | | | | | | | |
IA | | $ | 11.86 | | | $ | 0.23 | | | $ | 3.55 | | | $ | 3.78 | | | $ | (0.25 | ) | | $ | — | | | $ | (0.25 | ) | | $ | 15.39 | | | | 31.94 | % | | $ | 551,350 | | | | 0.76 | % | | | 0.76 | % | | | 1.66 | % | | | 19 | % |
IB | | | 11.85 | | | | 0.20 | | | | 3.54 | | | | 3.74 | | | | (0.21 | ) | | | — | | | | (0.21 | ) | | | 15.38 | | | | 31.65 | | | | 109,081 | | | | 1.01 | | | | 1.01 | | | | 1.41 | | | | 19 | |
| | | | | | |
For the Year Ended December 31, 2012(4) | | | | | | | | | | | | | | | | | | | | | | | | | |
IA | | $ | 10.37 | | | $ | 0.26 | | | $ | 1.50 | | | $ | 1.76 | | | $ | (0.27 | ) | | $ | — | | | $ | (0.27 | ) | | $ | 11.86 | | | | 16.99 | % | | $ | 549,228 | | | | 0.76 | % | | | 0.76 | % | | | 2.02 | % | | | 22 | % |
IB | | | 10.36 | | | | 0.23 | | | | 1.50 | | | | 1.73 | | | | (0.24 | ) | | | — | | | | (0.24 | ) | | | 11.85 | | | | 16.69 | | | | 103,438 | | | | 1.01 | | | | 1.01 | | | | 1.77 | | | | 22 | |
| (1) | Information presented relates to a share outstanding throughout the indicated period. Net investment income (loss) per share amounts are calculated based on average shares outstanding unless otherwise noted. |
| (2) | The figures do not include sales charges or other fees which may be applied at the variable life insurance, variable annuity or qualified retirement plan product level. Any such additional sales charges or other fees would lower the Fund’s performance. |
| (3) | Adjustments include waivers and reimbursements, if applicable. Ratios do not include fees paid indirectly (see Expenses in the accompanying Notes to Financial Statements). |
| (4) | Net investment income (loss) per share amounts have been calculated using the Securities and Exchange Commission method. |
| (5) | Commenced operations on April 30, 2014. |
| (8) | During the year ended December 31, 2014, the Fund incurred $61.8 million in sales associated with the transition of assets from Hartford Global Research HLS Fund, which merged into the Fund on June 23, 2014. These sales were excluded from the portfolio turnover rate calculation. |
| (9) | Per share amount was not in accord with the net realized and unrealized gain (loss) for the period because of the timing of transactions in shares of the Fund and the amount and timing of per-share net realized and unrealized gain (loss) on such shares. |
| (10) | During the year ended December 31, 2014, the Fund incurred $137.9 million in sales associated with the transition of assets from Hartford Growth HLS Fund, which merged into the Fund on June 23, 2014. These sales were excluded from the portfolio turnover rate calculation. |
| (11) | Per share amounts have been restated to reflect a reverse stock split effective October 21, 2013. Please see Notes to Financial Statements. |
| (12) | Portfolio turnover shown is from October 21, 2013 (conversion date) through December 31, 2013. |
| (13) | The Fund was managed as a money market fund and portfolio turnover was not calculated. |
The accompanying notes are an integral part of these financial statements.
Notes to Financial Statements
December 31, 2016
Hartford Series Fund, Inc. and Hartford HLS Series Fund II, Inc. (each, a “Company” and collectively, the “Companies”) are each an open-end registered management investment company comprised of fifteen and four series, respectively, as of December 31, 2016. Financial statements for the series of each Company listed below (each, a “Fund” and collectively, the “Funds”) are included in this report.
Hartford Series Fund, Inc.:
Hartford Balanced HLS Fund (the “Balanced HLS Fund”)
Hartford Capital Appreciation HLS Fund (the “Capital Appreciation HLS Fund”)
Hartford Disciplined Equity HLS Fund (the “Disciplined Equity HLS Fund”)
Hartford Dividend and Growth HLS Fund (the “Dividend and Growth HLS Fund”)
Hartford Global Growth HLS Fund (the “Global Growth HLS Fund”)
Hartford Healthcare HLS Fund (the “Healthcare HLS Fund”)
Hartford High Yield HLS Fund (the “High Yield HLS Fund”)
Hartford International Opportunities HLS Fund (the “International Opportunities HLS Fund”)
Hartford MidCap HLS Fund (the “MidCap HLS Fund”)
Hartford MidCap Value HLS Fund (the “MidCap Value HLS Fund”)
Hartford Small Company HLS Fund (the “Small Company HLS Fund”)
Hartford Stock HLS Fund (the “Stock HLS Fund”)
Hartford Total Return Bond HLS Fund (the “Total Return Bond HLS Fund”)
Hartford Ultrashort Bond HLS Fund (the “Ultrashort Bond HLS Fund”)
Hartford Value HLS Fund (the “Value HLS Fund”)
Hartford HLS Series Fund II, Inc.:
Hartford Growth Opportunities HLS Fund (the “Growth Opportunities HLS Fund”)
Hartford Small Cap Growth HLS Fund (formerly, Hartford SmallCap Growth HLS Fund) (the “Small Cap Growth HLS Fund”)
Hartford Small/Mid Cap Equity HLS Fund (the “Small/Mid Cap Equity HLS Fund”)
Hartford U.S. Government Securities HLS Fund (the “U.S. Government Securities HLS Fund”)
The assets of each Fund are separate, and a shareholder’s interest is limited to the Fund in which shares are held. Each Company is organized under the laws of the State of Maryland and is registered with the Securities and Exchange Commission (the “SEC”) under the Investment Company Act of 1940, as amended (the “1940 Act”). Each Fund serves as an underlying investment option for certain variable annuity and variable life insurance separate accounts of Hartford Life Insurance Company (“HLIC”) and its affiliates and certain qualified retirement plans. Each Fund may also serve as an underlying investment option for certain variable annuity and variable life separate accounts of other insurance companies. Owners of variable annuity contracts and policyholders of variable life insurance contracts may choose the Funds if permitted in the variable insurance contract prospectus. In addition, participants in certain qualified retirement plans may choose the Funds if permitted by their plans.
The Small Cap Growth HLS Fund’s portfolio managers are Mammen Chally (81%) and David J. Elliot (19%) as of December 31, 2016. The Small Company HLS Fund’s portfolio managers are Steven C. Angeli (98%) and Mammen Chally (2%) as of December 31, 2016.
Each Fund is a diversified open-end management investment company. Each Fund applies specialized accounting and reporting under Accounting Standards Codification Topic 946, “Financial Services – Investment Companies”.
Each Fund, except Balanced HLS Fund, Capital Appreciation HLS Fund, Dividend and Growth HLS Fund, Global Growth HLS Fund, Growth Opportunities HLS Fund, International Opportunities HLS Fund, MidCap HLS Fund, Small/Mid Cap Equity HLS Fund and Stock HLS, is divided into Class IA and Class IB shares. Balanced HLS Fund, Capital Appreciation HLS Fund, Dividend and Growth HLS Fund, Global Growth HLS Fund, Growth Opportunities HLS Fund, International Opportunities HLS Fund, MidCap HLS Fund, Small/Mid Cap Equity HLS Fund and Stock HLS Fund are divided into Class IA, Class IB and Class IC shares. Class IC shares have not commenced operations for Balanced HLS Fund, Dividend and Growth HLS Fund, Global Growth HLS Fund, International Opportunities HLS Fund, MidCap HLS Fund, Small/Mid Cap Equity HLS Fund and Stock HLS Fund as of the date of this report. Small Cap Growth HLS Fund and Small Company HLS Fund are closed to new investors until further notice. For more information please see the Fund’s prospectus. Each class is offered at the per share net asset value (“NAV”) without a sales charge and is subject to the same expenses, except certain class specific expenses. Class IB shares are subject to distribution and service fees charged pursuant to a Distribution Plan adopted in accordance with Rule 12b-1 under the 1940 Act. Class IC shares are subject to distribution fees charged pursuant to a Distribution Plan adopted in accordance with Rule 12b-1 under the 1940 Act and Class IC shares are also subject to an administrative service fee.
Notes to Financial Statements – (continued)
December 31, 2016
| 2. | Significant Accounting Policies: |
The following is a summary of significant accounting policies of each Fund used in the preparation of its financial statements, which are in accordance with United States Generally Accepted Accounting Principles (“U.S. GAAP”). The preparation of financial statements in accordance with U.S. GAAP may require management to make estimates and assumptions that affect the reported amounts of assets and liabilities and disclosure of contingent assets and liabilities at the date of the financial statements and the reported amounts of increases and decreases in net assets from operations during the reporting period. Actual results could differ from those estimates.
| | a) | Determination of Net Asset Value – The NAV of each class of each Fund’s shares is determined as of the close of regular trading (normally 4:00 p.m. Eastern Time) (the “NYSE Close”) on each day that the New York Stock Exchange (the “Exchange”) is open (“Valuation Date”). Information that becomes known to the Funds after the NAV has been calculated on a particular day will not generally be used to retroactively adjust the NAV determined earlier that day. |
| | b) | Investment Valuation and Fair Value Measurements – For purposes of calculating the NAV of each Fund, portfolio securities and other assets held in the Fund’s portfolio for which market prices are readily available are valued at market value. Market value is generally determined on the basis of last reported trade prices or official close price. If no trades were reported, market value is based on prices obtained from a quotation reporting system, established market makers, or independent pricing services. If market prices are not readily available or are deemed unreliable, a Fund will use the fair value of the security or other instrument as determined in good faith under policies and procedures established by and under the supervision of the respective Company’s Board of Directors. Market prices are considered not readily available where there is an absence of current or reliable market-based data (e.g., trade information or broker quotes), including where events occur after the close of the relevant market, but prior to the NYSE Close, that materially affect the values of a Fund’s portfolio holdings or assets. In addition, market prices are considered not readily available when, due to extraordinary circumstances, the exchanges or markets on which the securities or other instruments trade do not open for trading for the entire day and no other market prices are available. In addition, prices of foreign equities that are principally traded on certain foreign markets will generally be adjusted daily pursuant to a fair value pricing service approved by the respective Company’s Board of Directors in order to reflect an adjustment for the factors occurring after the close of certain foreign markets but before the NYSE Close. Securities and other instruments that are primarily traded on foreign markets may trade on days that are not business days of the Funds. The value of the foreign securities or other instruments in which a Fund invests may change on days when a shareholder will not be able to purchase or redeem shares of the Fund. Fair value pricing is subjective in nature and the use of fair value pricing by a Fund may cause the NAV of its shares to differ significantly from the NAV that would have been calculated using market prices at the close of the exchange on which a portfolio holding is primarily traded. There can be no assurance that a Fund could obtain the fair value assigned to an investment if the Fund were to sell the investment at approximately the time at which the Fund determines its NAV. |
Fixed income investments (other than short-term obligations and senior floating rate interests), non-exchange traded derivatives and centrally cleared swaps held by a Fund are normally valued on the basis of quotes obtained from brokers and dealers or independent pricing services in accordance with procedures established by the respective Company’s Board of Directors. Prices obtained from independent pricing services use information provided by market makers or estimates of market values obtained from yield data relating to investments or securities with similar characteristics. Senior floating rate interests generally trade in over-the-counter (“OTC”) markets and are priced through an independent pricing service utilizing independent market quotations from loan dealers or financial institutions. Generally, a Fund may use fair valuation in regard to fixed income positions when the Fund holds defaulted or distressed investments or investments in a company in which a reorganization is pending. Short-term investments maturing in 60 days or less are generally valued at amortized cost if their original term to maturity was 60 days or less, or by amortizing their value on the 61st day prior to maturity, if the original term exceeded 60 days.
Exchange traded options, futures and options on futures are valued at the settlement price or last trade price determined by the relevant exchange as of the NYSE Close. If a last trade price is not available, the value will be the mean of the bid and ask prices as of the NYSE Close. If a mean of the bid and ask prices cannot be calculated for the day, the value will be the bid price as of the NYSE Close. In the case of options privately negotiated in the OTC market (“OTC options”) and such instruments that do not trade on an exchange, values may be supplied by a pricing service using a formula or other objective method that may take into consideration the style, direction, expiration, strike price, notional value and volatility or other special adjustments.
Investments valued in currencies other than U.S. dollars are converted to U.S. dollars using exchange rates obtained from independent pricing services for calculation of the NAV. As a result, the NAV of a Fund’s shares may be affected by changes in the value of currencies in relation to the U.S. dollar. The value of securities or other instruments traded in markets outside the United States or denominated in currencies other than the U.S. dollar may be affected significantly on a day that the NYSE is closed and the market value may change on days when an investor is not able to purchase, redeem or exchange shares of a Fund.
Notes to Financial Statements – (continued)
December 31, 2016
Foreign currency contracts represent agreements to exchange currencies on specific future dates at predetermined rates. Foreign currency contracts are valued using foreign currency exchange rates and forward rates as provided by an independent pricing service on the Valuation Date.
Investments in open-end mutual funds are valued at the respective NAV of each open-end mutual fund as determined as of the NYSE Close on the Valuation Date. Such open-end mutual funds may use fair value pricing as disclosed in their prospectuses.
Financial instruments for which prices are not available from an independent pricing service may be valued using market quotations obtained from one or more dealers that make markets in the respective financial instrument in accordance with procedures established by the respective Company’s Board of Directors.
U.S. GAAP defines fair value as the price that a Fund would receive to sell an asset or pay to transfer a liability in an orderly transaction between market participants. The U.S. GAAP fair value measurement standards require disclosure of a fair value hierarchy for each major category of assets and liabilities. Various inputs are used in determining the fair value of each Fund’s investments. These inputs are summarized into three broad hierarchy levels. This hierarchy is based on whether the valuation inputs are observable or unobservable. These levels are:
| | • | | Level 1 – Quoted prices in active markets for identical investments. Level 1 may include exchange traded instruments, such as domestic equities, some foreign equities, options, futures, mutual funds, exchange traded funds, rights and warrants. |
| | • | | Level 2 – Observable inputs other than Level 1 prices, such as quoted prices for similar investments; quoted prices in markets that are not active; or other inputs that are observable or can be corroborated by observable market data. Level 2 may include debt investments that are traded less frequently than exchange traded instruments and which are valued using independent pricing services; foreign equities, which are principally traded on certain foreign markets and are adjusted daily pursuant to a fair value pricing service in order to reflect an adjustment for the factors occurring after the close of certain foreign markets but before the NYSE Close; senior floating rate interests, which are valued using an aggregate of dealer bids; short-term investments, which are valued at amortized cost; and swaps, which are valued based upon the terms of each swap contract. |
| | • | | Level 3 – Significant unobservable inputs that are supported by limited or no market activity. Level 3 may include financial instruments whose values are determined using indicative market quotes or require significant management judgment or estimation. These unobservable valuation inputs may include estimates for current yields, maturity/duration, prepayment speed, and indicative market quotes for comparable investments along with other assumptions relating to credit quality, collateral value, complexity of the investment structure, general market conditions and liquidity. This category may include investments where trading has been halted or there are certain restrictions on trading. While these investments are priced using unobservable inputs, the valuation of these investments reflects the best available data and management believes the prices are a reasonable representation of exit price. |
The Board of Directors of each Company generally reviews and approves the “Procedures for Valuation of Portfolio Investments” at least once a year. These procedures define how investments are to be valued, including the formation and activities of a Valuation Committee. The Valuation Committee, which is chaired by each Company’s Treasurer, is responsible for determining in good faith the fair value of investments when the value cannot be obtained from primary pricing services or alternative sources or if the valuation of an investment as provided by the primary pricing service or alternative source is believed not to reflect the investment’s fair value as of the Valuation Date. The Valuation Committee will consider all relevant factors in determining an investment’s fair value, and may seek the advice of such Fund’s sub-adviser, as applicable, knowledgeable brokers, and legal counsel in making such determination. The Valuation Committee reports to the Audit Committee of each Company’s Board of Directors. The Audit Committee receives quarterly written reports which include details of all fair-valued investments, including the reason for the fair valuation, and an indication, when possible, of the accuracy of the valuation by disclosing the next available reliable public price quotation or the disposition price of such investments (the “lookback” test). The Board of Directors of each Company then must consider for ratification all of the fair value determinations made during the previous quarter.
Valuation levels are not necessarily indicative of the risk associated with investing in such investments. Individual investments within any of the above mentioned asset classes may be assigned a different hierarchical level than those presented above, as individual circumstances dictate.
For additional information, refer to the Fair Valuation Summary and the Level 3 roll-forward reconciliation, if applicable, which follows each Fund’s Schedule of Investments.
Notes to Financial Statements – (continued)
December 31, 2016
Following is quantitative information about Level 3 fair value measurements:
Growth Opportunities HLS Fund
Quantitative Information about Level 3 Fair Value Measurements:
| | | | | | | | | | |
Security Type / Valuation Technique* | | Unobservable Input | | Input Value(s)
Range | | | Fair Value at
December 31, 2016 | |
Common Stock | | | | | | | | | | |
Model | | EV/EBITDA | | | 6.3x to 13.0x | | | $ | 4,466,868 | |
Model | | EV/Estimated Revenue | | | 2.76x to 4.69x | | | | 1,901,709 | |
Cost | | Trade Price | | | $17.81 to $105.69 | | | | 4,406,397 | |
| | | |
Convertible Bonds | | | | | | | | | | |
Cost | | Trade Price | | | $100 | | | | 705,896 | |
| | | |
Preferred Stock | | | | | | | | | | |
Model | | EV/Estimated Revenue | | | 1.0x to 8.69x | | | | 39,955,472 | |
Cost | | Trade Price | | | $1.92 to $50.19 | | | | 67,079,880 | |
| | | |
Convertible Preferred Stock | | | | | | | | | | |
Model | | EV/Estimated Revenue | | | 2.95x to 4.69x | | | | 3,522,420 | |
| | | | | | | | | | |
Total | | | | | | | | $ | 122,038,642 | |
| | | | | | | | | | |
| | * | The Valuation Committee may consider applying appropriate valuation methodologies, which may include, but are not limited to: valuation through use of a “proxy” investment or index, discount from market value of a similar freely traded investment, a discount or premium which may consider market or regulatory sentiment (or other subjective determinations, inputs or factors not otherwise quantifiable), and any other appropriate method. |
Small Company HLS Fund
Quantitative Information about Level 3 Fair Value Measurements:
| | | | | | | | | | |
Security Type / Valuation Technique* | | Unobservable Input | | Input Value(s)
Range | | | Fair Value at
December 31, 2016 | |
Common Stock | | | | | | | | | | |
Model | | EV/EBITDA | | | 6.3x to 13.0x | | | $ | 10,177,632 | |
Cost | | Trade Price | | | $3.18 to $17.81 | | | | 4,193,222 | |
| | | |
Preferred Stock | | | | | | | | | | |
Model | | EV/Estimated Revenue | | | 2.2x to 8.69x | | | | 18,870,445 | |
Cost | | Trade Price | | | $3.97 to $25.25 | | | | 14,054,205 | |
| | | | | | | | | | |
Total | | | | | | | | $ | 47,295,504 | |
| | | | | | | | | | |
| | * | The Valuation Committee may consider applying appropriate valuation methodologies, which may include, but are not limited to: valuation through use of a “proxy” investment or index, discount from market value of a similar freely traded investment, a discount or premium which may consider market or regulatory sentiment (or other subjective determinations, inputs or factors not otherwise quantifiable), and any other appropriate method. |
| | c) | Investment Transactions and Investment Income – Investment transactions are recorded as of the trade date (the date the order to buy or sell is executed) for financial reporting purposes. Investments purchased or sold on a when-issued or delayed-delivery basis may be settled a month or more after the trade date. Realized gains and losses are determined on the basis of identified cost. |
Trade date for senior floating rate interests purchased in the primary loan market is considered the date on which the loan allocations are determined. Trade date for senior floating rate interests purchased in the secondary loan market is the date on which the transaction is entered into.
Dividend income from domestic securities is accrued on the ex-dividend date. In general, dividend income from foreign securities is recorded on the ex-date; however, dividend notifications in certain foreign jurisdictions may not be available in a timely manner and as a result, a Fund will record the dividend as soon as the relevant details (i.e., rate per share, payment date, shareholders of record, etc.) are publicly available. Interest income, including amortization of premium, accretion of discounts, inflation adjustments and additional principal received in-kind in lieu of cash, is accrued on a daily basis. Paydown gains and losses on mortgage related and other asset backed securities are included in interest income in the Statements of Operations, as applicable.
| | d) | Taxes – A Fund may be subject to taxes imposed on realized gains on securities of certain foreign countries in which such Fund invests. The amount of foreign tax expense is included on the accompanying Statements of Operations as a reduction to net realized gain on investments in these securities, if applicable. |
Notes to Financial Statements – (continued)
December 31, 2016
| | e) | Foreign Currency Transactions – Assets and liabilities denominated in currencies other than U.S. dollars are translated into U.S. dollars at the exchange rates in effect on the Valuation Date. Purchases and sales of investments, income and expenses are translated into U.S. dollars at the exchange rates on the dates of such transactions. |
A Fund does not isolate that portion of portfolio investment valuation resulting from fluctuations in the foreign currency exchange rates from the fluctuations arising from changes in the market prices of investments held. Exchange rate fluctuations are included with the net realized and unrealized gain or loss on investments in the accompanying financial statements.
Net realized foreign exchange gains or losses arise from sales of foreign currencies and the difference between asset and liability amounts initially stated in foreign currencies and the U.S. dollar value of the amounts actually received or paid. Net unrealized foreign exchange gains or losses arise from changes in the value of other assets and liabilities at the end of the reporting period, resulting from changes in the exchange rates.
| | f) | Joint Trading Account – A Fund may invest cash balances into a joint trading account that may be invested in one or more repurchase agreements. |
| | g) | Fund Share Valuation and Dividend Distributions to Shareholders – Orders for each Fund’s shares are executed in accordance with the investment instructions of the contract holders and plan participants. The NAV of each Fund’s shares is determined as of the close of business on each business day of the Exchange (see Note 2(a)). The NAV is determined separately for each class of shares of a Fund by dividing the Fund’s net assets attributable to that class by the number of shares of the class outstanding. Each class of shares offered by a Fund has equal rights as to assets and voting privileges (except that shareholders of a class have exclusive voting rights regarding any matter relating solely to that class of shares). Income and non-class specific expenses are allocated daily to each class on the basis of the relative net assets of the class. Realized and unrealized gains and losses are allocated daily based on the relative net assets of each class of shares of each Fund. |
Orders for the purchase of a Fund’s shares received prior to the close of the Exchange on any day the Exchange is open for business are priced at the NAV determined as of the close of the Exchange. Orders received after the close of the Exchange, or on a day on which the Exchange and/or the Funds are not open for business, are priced at the next determined NAV.
Dividends are declared pursuant to a policy adopted by the respective Company’s Board of Directors. Dividends and/or distributions to shareholders are recorded on ex-date. The policy of each Fund is to pay dividends from net investment income and realized gains, if any, at least once a year.
Income dividends and capital gains distributions are determined in accordance with federal income tax regulations, which may differ from U.S. GAAP with respect to character and timing (see Federal Income Taxes: Distributions and Components of Distributable Earnings and Reclassification of Capital Accounts notes).
| 3. | Securities and Other Investments: |
| | a) | Illiquid and Restricted Investments – Each Fund is permitted to invest up to 15% of its net assets in illiquid investments. Illiquid investments are those that may not be sold or disposed of in the ordinary course of business within seven days, at approximately the price used to determine a Fund’s NAV. A Fund may not be able to sell illiquid investments when its sub-adviser considers it desirable to do so or may have to sell such investments at a price that is lower than the price that could be obtained if the investments were more liquid. A sale of illiquid investments may require more time and may result in higher dealer discounts and other selling expenses than does the sale of those that are liquid. Illiquid investments also may be more difficult to value due to the unavailability of reliable market quotations for such investments, and an investment in them may have an adverse impact on a Fund’s NAV. Each Fund may also purchase certain restricted investments that can only be resold to certain qualified investors and may be determined to be liquid pursuant to policies and guidelines established by the respective Company’s Board of Directors. See each Fund’s Schedule of Investments, if applicable, for illiquid or restricted investments as of December 31, 2016. |
| | b) | Investments Purchased on a When-Issued or Delayed-Delivery Basis – Delivery and payment for investments that have been purchased by a Fund on a forward commitment, or when-issued or delayed-delivery basis, take place beyond the customary settlement period. A Fund may dispose of or renegotiate a delayed-delivery transaction after it is entered into, and may sell delayed-delivery investments before they are delivered, which may result in a realized gain or loss. During this period, such investments are subject to market fluctuations, and a Fund identifies investments segregated in its records with a value at least equal to the amount of the commitment. See each Fund’s Schedule of Investments, if applicable, for when-issued or delayed-delivery investments as of December 31, 2016. |
Notes to Financial Statements – (continued)
December 31, 2016
In connection with a Fund’s ability to purchase investments on a when-issued or forward commitment basis, the Fund may enter into to-be announced (“TBA”) commitments. TBA commitments are forward agreements for the purchase or sale of mortgage backed securities for a fixed price, with payment and delivery on an agreed-upon future settlement date. The specific securities to be delivered are not identified at the trade date; however, delivered securities must meet specified terms, including issuer, rate and mortgage terms. Although a Fund may enter into TBA commitments with the intention of acquiring or delivering securities for its portfolio, the Fund can extend the settlement date, roll the transaction, or dispose of a commitment prior to settlement if deemed appropriate to do so. If the TBA commitment is closed through the acquisition of an offsetting TBA commitment, a Fund realizes a gain or loss. In a TBA roll transaction, a Fund generally purchases or sells the initial TBA commitment prior to the agreed upon settlement date and enters into a new TBA commitment for future delivery or receipt of the mortgage backed securities. TBA commitments involve a risk of loss if the value of the security to be purchased or sold declines or increases, respectively, prior to settlement date. See each Fund’s Schedule of Investments, if applicable, for TBA commitments as of December 31, 2016.
| | c) | Senior Floating Rate Interests – Certain Funds may invest in senior floating rate interests. Senior floating rate interests hold the most senior position in the capital structure of a business entity (the “Borrower”), are typically secured by specific collateral and have a claim on the assets and/or stock of the Borrower that is senior to that held by subordinated debtholders and stockholders of the Borrower. Senior floating rate interests are typically structured and administered by a financial institution that acts as the agent of the lenders participating in the senior floating rate interest. A Fund may invest in multiple series or tranches of a senior floating rate interest, which may have varying terms and carry different associated risks. A Fund may also enter into unfunded loan commitments, which are contractual obligations for future funding. Unfunded loan commitments may include revolving credit facilities, which may obligate the Fund to supply additional cash to the borrower on demand. Unfunded loan commitments represent a future obligation in full. A Fund may receive a commitment fee based on the undrawn portion of the underlying line of credit portion of a senior floating rate interest. In certain circumstances, a Fund may receive various fees upon the restructure of a senior floating rate interest by a borrower. Fees earned/paid may be recorded as a component of income or realized gain/loss in the Statements of Operations. |
Senior floating rate interests are typically rated below-investment-grade, which suggests they are more likely to default and generally pay higher interest rates than investment-grade loans. A default could lead to non-payment of income, which would result in a reduction of income to a Fund, and there can be no assurance that the liquidation of any collateral would satisfy the Borrower’s obligation in the event of non-payment of scheduled interest or principal payments, or that such collateral could be readily liquidated. See each Fund’s Schedule of Investments, if applicable, for outstanding senior floating rate interests as of December 31, 2016.
| | d) | Mortgage Related and Other Asset Backed Securities – A Fund may invest in mortgage related and other asset backed securities. These securities include mortgage pass-through securities, collateralized mortgage obligations, commercial mortgage backed securities, stripped mortgage backed securities, asset backed securities, collateralized debt obligations and other securities that directly or indirectly represent a participation in, or are secured by and payable from, mortgage loans on real property. Mortgage related securities are created from pools of residential or commercial mortgage loans, including mortgage loans made by savings and loan institutions, mortgage bankers, commercial banks and others. Asset backed securities are created from many types of assets, including auto loans, credit card receivables, home equity loans, and student loans. These securities provide a monthly payment that consists of both interest and principal payments. Interest payments may be determined by fixed or adjustable rates. The rate of prepayments on underlying mortgages will affect the price and volatility of a mortgage related security, and may have the effect of shortening or extending the effective duration of the security relative to what was anticipated at the time of purchase. The timely payment of principal and interest of certain mortgage related securities is guaranteed by the full faith and credit of the United States Government. Mortgage related and other asset backed securities created and guaranteed by non-governmental issuers, including government-sponsored corporations, may be supported by various forms of insurance or guarantees, but there can be no assurance that the private insurers or guarantors can meet their obligations under the insurance policies or guarantee arrangements. See each Fund’s Schedule of Investments, if applicable, for mortgage related and other asset backed securities as of December 31, 2016. |
| | e) | Inflation Indexed Bonds – A Fund may invest in inflation indexed bonds. Inflation indexed bonds are fixed income investments whose principal value is periodically adjusted to the rate of inflation. The interest rate on these bonds is generally fixed at issuance at a rate lower than typical bonds. Over the life of an inflation indexed bond, however, interest will be paid based on a principal value, which is adjusted for inflation. Any increase or decrease in the principal amount of an inflation indexed bond will be included as interest income on the Statements of Operations, even though investors do not receive the principal amount until maturity. See each Fund’s Schedule of Investments, if applicable, for inflation indexed bonds as of December 31, 2016. |
Notes to Financial Statements – (continued)
December 31, 2016
| 4. | Financial Derivative Instruments: |
The following disclosures contain information on how and why a Fund uses derivative instruments, the credit-risk-related contingent features in certain derivative instruments, and how derivative instruments affect a Fund’s financial position and results of operations. The location and fair value amounts of these instruments on the Statements of Assets and Liabilities and the realized gains and losses and changes in unrealized gains and losses on the Statements of Operations, each categorized by type of derivative contract, are included in the following Additional Derivative Instrument Information footnote. The derivative instruments outstanding as of period-end are disclosed in the notes to the Schedules of Investments, if applicable. The amounts of realized gains and losses and changes in unrealized gains and losses on derivative instruments during the period are disclosed in the Statements of Operations.
| | a) | Foreign Currency Contracts – A Fund may enter into foreign currency contracts that obligate the Fund to purchase or sell currencies at specified future dates. Foreign currency contracts may be used in connection with settling purchases or sales of securities to hedge the currency exposure associated with some or all of a Fund’s investments and/or as part of an investment strategy. Foreign currency contracts are marked to market daily and the change in value is recorded by a Fund as an unrealized gain or loss. A Fund will record a realized gain or loss when the foreign currency contract is settled. |
Foreign currency contracts involve elements of market risk in excess of the amounts reflected in the Statements of Assets and Liabilities. In addition, risks may arise upon entering into these contracts from the potential inability of the counterparties to meet the terms of the contracts and from unanticipated movements in the value of the foreign currencies relative to the U.S. dollar. Upon entering into a foreign currency contract, a Fund may be required to post margin equal to its outstanding exposure thereunder.
During the fiscal year ended December 31, 2016, Capital Appreciation HLS Fund, High Yield HLS Fund and Total Return Bond HLS Fund had engaged in Foreign Currency Contracts.
| | b) | Futures Contracts – A Fund may enter into futures contracts. A futures contract is an agreement between two parties to buy or sell an asset at a set price on a future date. A Fund uses futures contracts to manage risk or obtain exposure to the investment markets, commodities, or movements in interest rates and currency values. The primary risks associated with the use of futures contracts are the imperfect correlation between the change in market value of the investments held by a Fund and the prices of futures contracts and the possibility of an illiquid market. Upon entering into a futures contract, a Fund is required to deposit with a futures commission merchant (“FCM”) an amount of cash or U.S. Government or Agency Obligations in accordance with the initial margin requirements of the broker or exchange. Futures contracts are marked to market daily and an appropriate amount equal to the change in value (“variation margin”) is paid or received by a Fund. Gains or losses are recognized but not considered realized until the contracts expire or are closed. Futures contracts involve, to varying degrees, risk of loss in excess of the variation margin disclosed on the Statements of Assets and Liabilities. |
During the fiscal year ended December 31, 2016, Balanced HLS Fund, Disciplined Equity HLS Fund, Total Return Bond HLS Fund and U.S. Government Securities HLS Fund had engaged in Futures Contracts.
| | c) | Options Contracts – An option contract is a contract sold by one party to another party that offers the buyer the right, but not the obligation, to buy (call) or sell (put) an investment or other financial asset at an agreed-upon price during a specific period of time or on a specific date. Option contracts are either OTC options or executed in a registered exchange (“exchange traded options”). A Fund may write (sell) covered call and put options on futures, swaps (“swaptions”), securities, commodities or currencies. “Covered” means that so long as a Fund is obligated as the writer of an option, it will own either the underlying investments or currency or an option to purchase the same underlying investments or currency having an expiration date of the covered option and an exercise price equal to or less than the exercise price of the covered option, or will segregate or earmark cash or other liquid investments having, for written call options, a value equal to the greater of the exercise price or the market value of the underlying instrument and, for written put options, a value equal to the exercise price. Writing put options may increase a Fund’s exposure to the underlying instrument. Writing call options may decrease a Fund’s exposure to the underlying instrument. Premiums received from writing options that expire are treated as realized gains. Premiums received from writing options that are exercised or closed are added to the proceeds or offset amounts paid on the underlying futures, swap, investment or currency transaction to determine the realized gain or loss. A Fund, as a writer of an option, has no control over whether the underlying instrument may be sold (call) or purchased (put) and as a result bears the market risk of an unfavorable change in the price of the instrument underlying the written option. There is the risk a Fund may not be able to enter into a closing transaction because of an illiquid market. A Fund may also purchase put and call options. Purchasing call options may increase a Fund’s exposure to the underlying instrument. Purchasing put options may decrease a Fund’s exposure to the underlying instrument. A Fund pays a premium, which is included on the Fund’s Statements of Assets and Liabilities as an |
Notes to Financial Statements – (continued)
December 31, 2016
| | investment and is subsequently marked to market to reflect the current value of the option. Premiums paid for purchasing options that expire are treated as realized losses. Certain options may be purchased with premiums to be determined on a future date. The premiums for these options are based upon implied volatility parameters at specified terms. The risk associated with purchasing put and call options is generally limited to the premium paid. Premiums paid for purchasing options that are exercised or closed are added to the amounts paid or offset against the proceeds on the underlying investment transaction to determine the realized gain or loss. Entering into OTC options also exposes a Fund to counterparty risk. Counterparty risk is the possibility that the counterparty to the agreements may default on its obligation to perform or disagree as to the meaning of the contractual terms in the agreements. |
During the fiscal year ended December 31, 2016, Capital Appreciation HLS Fund and Total Return Bond HLS Fund had engaged in Options Contracts.
Transactions involving written option contracts during the year ended December 31, 2016, are summarized below:
Capital Appreciation HLS Fund
Options Activity During the Year Ended December 31, 2016
| | | | | | | | |
Put Options Written During the Year | | Number of
Contracts | | | Premium
Amounts | |
Beginning of period | | | — | | | $ | — | |
Written | | | 4,421 | | | | 780,877 | |
Expired | | | — | | | | — | |
Closed | | | (4,421 | ) | | | (780,877) | |
Exercised | | | — | | | | — | |
| | | | | | | | |
End of Period | | | — | | | $ | — | |
| | | | | | | | |
| | |
| Total Return Bond HLS Fund | | | | | | | | |
| Options Activity During the Year Ended December 31, 2016 | | | | | | | | |
| | |
Call Options Written During the Year | | Number of
Contracts | | | Premium
Amounts | |
Beginning of period | | | 69,695,000 | | | $ | 207,343 | |
Written | | | 1,211,458,000 | | | | 3,752,514 | |
Expired | | | (478,249,000 | ) | | | (1,402,710 | ) |
Closed | | | — | | | | — | |
Exercised | | | (802,904,000 | ) | | | (2,557,147 | ) |
| | | | | | | | |
End of Period | | | — | | | $ | — | |
| | | | | | | | |
| | |
Put Options Written During the Year | | Number of
Contracts | | | Premium
Amounts | |
Beginning of period | | | 69,690,000 | | | $ | 137,638 | |
Written | | | 1,363,778,000 | | | | 3,942,262 | |
Expired | | | (895,282,000 | ) | | | (2,323,957 | ) |
Closed | | | (14,012,000 | ) | | | (388,553) | |
Exercised | | | (524,174,000 | ) | | | (1,367,390 | ) |
| | | | | | | | |
End of Period | | | — | | | $ | — | |
| | | | | | | | |
| | d) | Swap Contracts – A Fund may invest in swap contracts. Swap contracts are agreements to exchange or swap investment cash flows, assets, foreign currencies or market-linked returns at specified, future intervals. Swap contracts are either privately negotiated in the over-the-counter market (“OTC swaps”) or through a central counterparty or derivatives clearing organization (“centrally cleared |
Notes to Financial Statements – (continued)
December 31, 2016
| | swaps”). A Fund may enter into credit default, total return, cross-currency, interest rate, inflation and other forms of swap contracts to manage its exposure to credit, currency, interest rate, commodity and inflation risk. Swap contracts are also used to gain exposure to certain markets. In connection with these contracts, investments or cash may be identified as collateral or margin in accordance with the terms of the respective swap contracts and/or master netting arrangement to provide assets of value and recourse in the event of default or bankruptcy/insolvency. |
Swaps are valued based on custom valuations furnished by an independent pricing service. Swaps for which prices are not available from an independent pricing service are valued in accordance with procedures established by the respective Company’s Board of Directors. Changes in market value, if any, are reflected as a component of net changes in unrealized appreciation or depreciation on the Statements of Operations. Daily changes in valuation of centrally cleared swaps, if any, are recorded as a receivable or payable for the change in value (“variation margin”) on the Statements of Assets and Liabilities. Realized gains or losses on centrally cleared swaps are recorded upon the termination of the swap. OTC swap payments received or paid at the beginning of the measurement period are reflected as such on the Statements of Assets and Liabilities and represent premiums paid or received upon entering into the swap contract to compensate for differences between the stated terms of the swap contract and prevailing market conditions (credit spreads, currency exchange rates, interest rates and other relevant factors). These upfront premiums are recorded as realized gains or losses on the Statements of Operations upon termination or maturity of the swap. A liquidation payment received or made at the termination or maturity of the swap is recorded as a realized gain or loss on the Statements of Operations. Net periodic payments received or paid by a Fund are included as part of realized gains or losses on the Statements of Operations.
Entering into these contracts involves, to varying degrees, elements of liquidation, counterparty, credit and market risk in excess of the amounts recognized on the Statements of Assets and Liabilities. Such risks involve the possibility that there will be no liquid market for these contracts, that the counterparty to the contracts may default on its obligation to perform or disagree as to the meaning of contractual terms in the contracts, and that there may be unfavorable changes in market conditions (credit spreads, currency exchange rates, interest rates and other relevant factors).
A Fund’s maximum risk of loss from counterparty risk for OTC swaps is the net value of the discounted cash flows to be received from the counterparty over the contract’s remaining life, and current market value, to the extent that amount is positive. The risk is mitigated by having a master netting arrangement between a Fund and the counterparty, which allows for the netting of payments made or received (although such amounts are presented on a gross basis within the Statements of Assets and Liabilities, as applicable) as well as the posting of collateral to a Fund to cover the Fund’s exposure to the counterparty. In a centrally cleared swap, while a Fund enters into an agreement with a clearing broker to execute contracts with a counterparty, the performance of the swap is guaranteed by the central clearinghouse, which reduces the Fund’s exposure to counterparty risk. However, the Fund is still exposed to a certain amount of counterparty risk through the clearing broker and clearinghouse. The clearinghouse attempts to minimize this risk to its participants through the use of mandatory margin requirements, daily cash settlements and other procedures. Likewise, the clearing broker reduces its risk through margin requirements and required segregation of customer balances.
Credit Default Swap Contracts – The credit default swap market allows a Fund to manage credit risk through buying and selling credit protection on a specific issuer, asset or basket of assets. Certain credit default swaps involve the exchange of a fixed rate premium for protection against the loss in value of an underlying investment or index in the event of a credit event, such as payment default or bankruptcy.
Under a credit default swap contract, one party acts as guarantor by receiving the fixed periodic payment in exchange for the commitment to purchase the underlying investment at par if the defined credit event occurs. Upon the occurrence of a defined credit event, the difference between the value of the reference obligation and the swap’s notional amount is recorded as realized gain or loss on swap transactions in the Statements of Operations. A “buyer” of credit protection agrees to pay a counterparty to assume the credit risk of an issuer upon the occurrence of certain events. The “seller” of the protection receives periodic payments and agrees to assume the credit risk of an issuer upon the occurrence of certain events. Although specified events are contract specific, credit events are generally defined as bankruptcy, failure to pay, restructuring, obligation acceleration, obligation default or repudiation/moratorium. A “seller’s” exposure is limited to the total notional amount of the credit default swap contract. These potential amounts would be partially offset by any recovery values of the respective referenced obligations or upfront payments received upon entering into the contract.
Implied credit spreads, represented in absolute terms, utilized in determining the market value of credit default swap contracts on corporate issues, sovereign government issues or U.S. municipal issues as of year-end are disclosed in the notes to the Schedules of Investments, as applicable, and serve as an indicator of the current status of the payment/performance risk and represent the
Notes to Financial Statements – (continued)
December 31, 2016
likelihood or risk of default for the credit derivative. The implied credit spread of a particular referenced entity reflects the cost of buying/selling protection and there may also be upfront payments required to be made to enter into the contract. Wider credit spreads represent a deterioration of the referenced entity’s credit soundness and a greater likelihood or risk of default or other credit event occurring as defined under the terms of the contract. For credit default swap contracts on credit indices, the quoted market prices and resulting values serve as the indicator of the current status of the payment/performance risk. Increasing market values, in absolute terms when compared to the notional amount of the swap, represent a deterioration of the referenced equity’s credit soundness and a greater likelihood or risk of default or other credit event occurring as defined under the terms of the contract.
During the fiscal year ended December 31, 2016, High Yield HLS Fund and Total Return Bond HLS Fund had engaged in Credit Default Swap Contracts.
Interest Rate Swap Contracts – Certain Funds are subject to interest rate risk exposure in the normal course of pursuing its investment objectives. A Fund may use interest rate swaps to hedge interest rate and duration risk across a portfolio at particular duration points and to maintain its ability to generate income at prevailing market rates. In a typical interest rate swap, one party agrees to make regular payments equal to a floating interest rate, based on a specified interest rate or benchmark (e.g. London Interbank Offered Rate (“LIBOR”)), multiplied by a notional amount, in return for payments equal to a fixed rate multiplied by the same amount, for a specific period of time. The net interest received or paid on interest rate swap contracts is recorded as a realized gain or loss. Interest rate swaps are marked to market daily and the change, if any, is recorded as an unrealized gain or loss in the Statements of Operations. When the interest rate swap contract is terminated early, a Fund records a realized gain or loss equal to the difference between the current market value and the upfront premium or cost.
If an interest rate swap contract provides for payments in different currencies, the parties might agree to exchange the notional amount as well. Interest rate swaps may also depend on other prices or rates, such as the value of an index. The risks of interest rate swaps include changes in market conditions which will affect the value of the contract or the cash flows and the possible inability of the counterparty to fulfill its obligations under the contract. A Fund’s maximum risk of loss from counterparty credit risk is the discounted net value of the cash flows to be received from the counterparty over the contract’s remaining life, to the extent that amount is positive.
During the fiscal year ended December 31, 2016, Total Return Bond HLS Fund and U.S. Government Securities HLS Fund had engaged in Interest Rate Swap Contracts.
| | e) | Additional Derivative Instrument Information: |
Balanced HLS Fund
Fair Value of Derivative Instruments on the Statement of Assets and Liabilities as of December 31, 2016:
| | | | | | | | | | | | | | | | | | | | | | | | | | | | |
| | | Risk Exposure Category | |
| | | Interest Rate
Contracts | | | Foreign
Exchange
Contracts | | | Credit
Contracts | | | Equity
Contracts | | | Commodity
Contracts | | | Other
Contracts | | | Total | |
| | | | | | | | | | | | | | | | | | | | | | | | | | | | |
Liabilities: | | | | | | | | | | | | | | | | | | | | | | | | | | | | |
Unrealized depreciation on futures contracts(1) | | $ | 161,124 | | | $ | — | | | $ | — | | | $ | — | | | $ | — | | | $ | — | | | $ | 161,124 | |
| | | | | | | | | | | | | | | | | | | | | | | | | | | | |
Total | | $ | 161,124 | | | $ | — | | | $ | — | | | $ | — | | | $ | — | | | $ | — | | | $ | 161,124 | |
| | | | | | | | | | | | | | | | | | | | | | | | | | | | |
The Effect of Derivative Instruments on the Statement of Operations for the year ended December 31, 2016
| | | | | | | | | | | | | | | | | | | | | | | | | | | | |
| | | Risk Exposure Category | |
| | | Interest Rate
Contracts | | | Foreign
Exchange
Contracts | | | Credit
Contracts | | | Equity
Contracts | | | Commodity
Contracts | | | Other
Contracts | | | Total | |
Realized Gain (Loss) on Derivatives Recognized as a Result of Operations: | |
Net realized gain (loss) on futures contracts | | $ | (329,910 | ) | | $ | — | | | $ | — | | | $ | — | | | $ | — | | | $ | — | | | $ | (329,910 | ) |
| | | | | | | | | | | | | | | | | | | | | | | | | | | | |
Total | | $ | (329,910 | ) | | $ | — | | | $ | — | | | $ | — | | | $ | — | | | $ | — | | | $ | (329,910 | ) |
| | | | | | | | | | | | | | | | | | | | | | | | | | | | |
|
Net Change in Unrealized Appreciation (Depreciation) on Derivatives Recognized as a Result of Operations: | |
Net change in unrealized appreciation (depreciation) of futures contracts | | $ | (100,278 | ) | | $ | — | | | $ | — | | | $ | — | | | $ | — | | | $ | — | | | $ | (100,278 | ) |
| | | | | | | | | | | | | | | | | | | | | | | | | | | | |
Total | | $ | (100,278 | ) | | $ | — | | | $ | — | | | $ | — | | | $ | — | | | $ | — | | | $ | (100,278 | ) |
| | | | | | | | | | | | | | | | | | | | | | | | | | | | |
Notes to Financial Statements – (continued)
December 31, 2016
For the year ended December 31, 2016, the average amount or number per contract outstanding for each derivative type was as follows:
| | | | |
Derivative Description | | Average Notional
Par, Contracts or
Face Amount | |
Futures Contracts Long | | | 117 | |
Futures Contracts Short | | | (129 | ) |
Capital Appreciation HLS Fund
Fair Value of Derivative Instruments on the Statement of Assets and Liabilities as of December 31, 2016:
| | | | | | | | | | | | | | | | | | | | | | | | | | | | |
| | | Risk Exposure Category | |
| | | Interest Rate
Contracts | | | Foreign
Exchange
Contracts | | | Credit
Contracts | | | Equity
Contracts | | | Commodity
Contracts | | | Other
Contracts | | | Total | |
Assets: | | | | | | | | | | | | | | | | | | | | | | | | | | | | |
Unrealized appreciation on foreign currency contracts | | $ | — | | | $ | 1,062,399 | | | $ | — | | | $ | — | | | $ | — | | | $ | — | | | $ | 1,062,399 | |
| | | | | | | | | | | | | | | | | | | | | | | | | | | | |
Total | | $ | — | | | $ | 1,062,399 | | | $ | — | | | $ | — | | | $ | — | | | $ | — | | | $ | 1,062,399 | |
| | | | | | | | | | | | | | | | | | | | | | | | | | | | |
| | | | | | | |
Liabilities: | | | | | | | | | | | | | | | | | | | | | | | | | | | | |
Unrealized depreciation on foreign currency contracts | | $ | — | | | $ | 71,825 | | | $ | — | | | $ | — | | | $ | — | | | $ | — | | | $ | 71,825 | |
| | | | | | | | | | | | | | | | | | | | | | | | | | | | |
Total | | $ | — | | | $ | 71,825 | | | $ | — | | | $ | — | | | $ | — | | | $ | — | | | $ | 71,825 | |
| | | | | | | | | | | | | | | | | | | | | | | | | | | | |
The Effect of Derivative Instruments on the Statement of Operations for the year ended December 31, 2016
| | | | | | | | | | | | | | | | | | | | | | | | | | | | |
| | | Risk Exposure Category | |
| | | Interest Rate
Contracts | | | Foreign
Exchange
Contracts | | | Credit
Contracts | | | Equity
Contracts | | | Commodity
Contracts | | | Other
Contracts | | | Total | |
Realized Gain (Loss) on Derivatives Recognized as a Result of Operations: | |
Net realized gain (loss) on written options contracts | | $ | — | | | $ | — | | | $ | — | | | $ | 538,384 | | | $ | — | | | $ | — | | | $ | 538,384 | |
Net realized gain (loss) on foreign currency contracts | | | — | | | | 2,299,913 | | | | — | | | | — | | | | — | | | | — | | | | 2,299,913 | |
| | | | | | | | | | | | | | | | | | | | | | | | | | | | |
Total | | $ | — | | | $ | 2,299,913 | | | $ | — | | | $ | 538,384 | | | $ | — | | | $ | — | | | $ | 2,838,297 | |
| | | | | | | | | | | | | | | | | | | | | | | | | | | | |
| |
Net Change in Unrealized Appreciation (Depreciation) on Derivatives Recognized as a Result of Operations: | | | | | |
Net change in unrealized appreciation (depreciation) of foreign currency contracts | | $ | — | | | $ | 207,549 | | | $ | — | | | $ | — | | | $ | — | | | $ | — | | | $ | 207,549 | |
| | | | | | | | | | | | | | | | | | | | | | | | | | | | |
Total | | $ | — | | | $ | 207,549 | | | $ | — | | | $ | — | | | $ | — | | | $ | — | | | $ | 207,549 | |
| | | | | | | | | | | | | | | | | | | | | | | | | | | | |
For the year ended December 31, 2016, the average amount or number per contract outstanding for each derivative type was as follows:
| | | | |
Derivative Description | | Average Notional
Par, Contracts or
Face Amount | |
Written Options Contracts | | | (4,421 | ) |
Foreign Currency Contracts Purchased | | $ | 13,872,203 | |
Foreign Currency Contracts Sold | | $ | 68,432,876 | |
Notes to Financial Statements – (continued)
December 31, 2016
Disciplined Equity HLS Fund
The Effect of Derivative Instruments on the Statement of Operations for the year ended December 31, 2016
| | | | | | | | | | | | | | | | | | | | | | | | | | | | |
| | | Risk Exposure Category | |
| | | Interest Rate
Contracts | | | Foreign
Exchange
Contracts | | | Credit
Contracts | | | Equity
Contracts | | | Commodity
Contracts | | | Other
Contracts | | | Total | |
Realized Gain (Loss) on Derivatives Recognized as a Result of Operations: | |
Net realized gain (loss) on futures contracts | | $ | — | | | $ | — | | | $ | — | | | $ | 15,267 | | | $ | — | | | $ | — | | | $ | 15,267 | |
| | | | | | | | | | | | | | | | | | | | | | | | | | | | |
Total | | $ | — | | | $ | — | | | $ | — | | | $ | 15,267 | | | $ | — | | | $ | — | | | $ | 15,267 | |
| | | | | | | | | | | | | | | | | | | | | | | | | | | | |
|
Net Change in Unrealized Appreciation (Depreciation) on Derivatives Recognized as a Result of Operations: | |
Net change in unrealized appreciation (depreciation) of futures contracts | | $ | — | | | $ | — | | | $ | — | | | $ | (281,759 | ) | | $ | — | | | $ | — | | | $ | (281,759 | ) |
| | | | | | | | | | | | | | | | | | | | | | | | | | | | |
Total | | $ | — | | | $ | — | | | $ | — | | | $ | (281,759 | ) | | $ | — | | | $ | — | | | $ | (281,759 | ) |
| | | | | | | | | | | | | | | | | | | | | | | | | | | | |
For the year ended December 31, 2016, the average amount or number per contract outstanding for each derivative type was as follows:
| | | | |
Derivative Description | | Average Notional
Par, Contracts or
Face Amount | |
Futures Contracts Long | | | 77 | |
High Yield HLS Fund
Fair Value of Derivative Instruments on the Statement of Assets and Liabilities as of December 31, 2016:
| | | | | | | | | | | | | | | | | | | | | | | | | | | | |
| | | Risk Exposure Category | |
| | | Interest Rate
Contracts | | | Foreign
Exchange
Contracts | | | Credit
Contracts | | | Equity
Contracts | | | Commodity
Contracts | | | Other
Contracts | | | Total | |
Assets: | | | | | | | | | | | | | | | | | | | | | | | | | | | | |
Unrealized appreciation on swap contracts(2) | | $ | — | | | $ | — | | | $ | 302,502 | | | $ | — | | | $ | — | | | $ | — | | | $ | 302,502 | |
| | | | | | | | | | | | | | | | | | | | | | | | | | | | |
Total | | $ | — | | | $ | — | | | $ | 302,502 | | | $ | — | | | $ | — | | | $ | — | | | $ | 302,502 | |
| | | | | | | | | | | | | | | | | | | | | | | | | | | | |
| | | | | | | |
Liabilities: | | | | | | | | | | | | | | | | | | | | | | | | | | | | |
Unrealized depreciation on foreign currency contracts | | $ | — | | | $ | 41,438 | | | $ | — | | | $ | — | | | $ | — | | | $ | — | | | $ | 41,438 | |
| | | | | | | | | | | | | | | | | | | | | | | | | | | | |
Total | | $ | — | | | $ | 41,438 | | | $ | — | | | $ | — | | | $ | — | | | $ | — | | | $ | 41,438 | |
| | | | | | | | | | | | | | | | | | | | | | | | | | | | |
The Effect of Derivative Instruments on the Statement of Operations for the year ended December 31, 2016
| | | | | | | | | | | | | | | | | | | | | | | | | | | | |
| | | Risk Exposure Category | |
| | | Interest Rate
Contracts | | | Foreign
Exchange
Contracts | | | Credit
Contracts | | | Equity
Contracts | | | Commodity
Contracts | | | Other
Contracts | | | Total | |
Realized Gain (Loss) on Derivatives Recognized as a Result of Operations: | | �� | | | | | | | | | | | | | | | |
Net realized gain (loss) on swap contracts | | $ | — | | | $ | — | | | $ | 589,795 | | | $ | — | | | $ | — | | | $ | — | | | $ | 589,795 | |
Net realized gain (loss) on foreign currency contracts | | | — | | | | 72,216 | | | | — | | | | — | | | | — | | | | — | | | | 72,216 | |
| | | | | | | | | | | | | | | | | | | | | | | | | | | | |
Total | | $ | — | | | $ | 72,216 | | | $ | 589,795 | | | $ | — | | | $ | — | | | $ | — | | | $ | 662,011 | |
| | | | | | | | | | | | | | | | | | | | | | | | | | | | |
| | |
Net Change in Unrealized Appreciation (Depreciation) on Derivatives Recognized as a Result of Operations: | | | | | | | | | |
Net change in unrealized appreciation (depreciation) of swap contracts | | $ | — | | | $ | — | | | $ | 370,758 | | | $ | — | | | $ | — | | | $ | — | | | $ | 370,758 | |
Net change in unrealized appreciation (depreciation) of foreign currency contracts | | | — | | | | (105,268 | ) | | | — | | | | — | | | | — | | | | — | | | | (105,268 | ) |
| | | | | | | | | | | | | | | | | | | | | | | | | | | | |
Total | | $ | — | | | $ | (105,268 | ) | | $ | 370,758 | | | $ | — | | | $ | — | | | $ | — | | | $ | 265,490 | |
| | | | | | | | | | | | | | | | | | | | | | | | | | | | |
Notes to Financial Statements – (continued)
December 31, 2016
For the year ended December 31, 2016, the average amount or number per contract outstanding for each derivative type was as follows:
| | | | |
Derivative Description | | Average Notional
Par, Contracts or
Face Amount | |
Swap Contracts | | $ | 8,581,667 | |
Foreign Currency Contracts Purchased | | $ | 537,080 | |
Foreign Currency Contracts Sold | | $ | 6,177,756 | |
Total Return Bond HLS Fund
Fair Value of Derivative Instruments on the Statement of Assets and Liabilities as of December 31, 2016:
| | | | | | | | | | | | | | | | | | | | | | | | | | | | |
| | | Risk Exposure Category | |
| | | Interest Rate
Contracts | | | Foreign
Exchange
Contracts | | | Credit
Contracts | | | Equity
Contracts | | | Commodity
Contracts | | | Other
Contracts | | | Total | |
Assets: | | | | | | | | | | | | | | | | | | | | | | | | | | | | |
Investments in securities, at value (purchased options), market value | | $ | — | | | $ | 13,338 | | | $ | — | | | $ | — | | | $ | — | | | $ | — | | | $ | 13,338 | |
Unrealized appreciation on futures contracts(1) | | | 1,053,726 | | | | — | | | | — | | | | — | | | | — | | | | — | | | | 1,053,726 | |
Unrealized appreciation on foreign currency contracts | | | — | | | | 5,008,810 | | | | — | | | | — | | | | — | | | | — | | | | 5,008,810 | |
Unrealized appreciation on swap contracts(2) | | | 3,643,834 | | | | — | | | | 6,707,797 | | | | — | | | | — | | | | — | | | | 10,351,631 | |
| | | | | | | | | | | | | | | | | | | | | | | | | | | | |
Total | | $ | 4,697,560 | | | $ | 5,022,148 | | | $ | 6,707,797 | | | $ | — | | | $ | — | | | $ | — | | | $ | 16,427,505 | |
| | | | | | | | | | | | | | | | | | | | | | | | | | | | |
| | | | | | | |
Liabilities: | | | | | | | | | | | | | | | | | | | | | | | | | | | | |
Unrealized depreciation on futures contracts(1) | | $ | 1,049,961 | | | $ | — | | | $ | — | | | $ | — | | | $ | — | | | $ | — | | | $ | 1,049,961 | |
Unrealized depreciation on foreign currency contracts | | | — | | | | 1,514,097 | | | | — | | | | — | | | | — | | | | — | | | | 1,514,097 | |
Unrealized depreciation on swap contracts(2) | | | — | | | | — | | | | 5,140,160 | | | | — | | | | — | | | | — | | | | 5,140,160 | |
| | | | | | | | | | | | | | | | | | | | | | | | | | | | |
Total | | $ | 1,049,961 | | | $ | 1,514,097 | | | $ | 5,140,160 | | | $ | — | | | $ | — | | | $ | — | | | $ | 7,704,218 | |
| | | | | | | | | | | | | | | | | | | | | | | | | | | | |
The Effect of Derivative Instruments on the Statement of Operations for the year ended December 31, 2016
| | | | | | | | | | | | | | | | | | | | | | | | | | | | |
| | | Risk Exposure Category | |
| | | Interest Rate
Contracts | | | Foreign
Exchange
Contracts | | | Credit
Contracts | | | Equity
Contracts | | | Commodity
Contracts | | | Other
Contracts | | | Total | |
Realized Gain (Loss) on Derivatives Recognized as a Result of Operations: | |
Net realized gain (loss) on purchased options contracts | | $ | (4,142 | ) | | $ | (104,760 | ) | | $ | — | | | $ | — | | | $ | — | | | $ | — | | | $ | (108,902 | ) |
Net realized gain (loss) on futures contracts | | | 2,768,682 | | | | — | | | | — | | | | — | | | | — | | | | — | | | | 2,768,682 | |
Net realized gain (loss) on written options contracts | | | 3,406,372 | | | | 355,688 | | | | — | | | | — | | | | — | | | | — | | | | 3,762,060 | |
Net realized gain (loss) on swap contracts | | | 2,410,831 | | | | 21,201 | | | | (30,405,008 | ) | | | — | | | | — | | | | — | | | | (27,972,976 | ) |
Net realized gain (loss) on foreign currency contracts | | | — | | | | (4,597,065 | ) | | | — | | | | — | | | | — | | | | — | | | | (4,597,065 | ) |
| | | | | | | | | | | | | | | | | | | | | | | | | | | | |
Total | | $ | 8,581,743 | | | $ | (4,324,936 | ) | | $ | (30,405,008 | ) | | $ | — | | | $ | — | | | $ | — | | | $ | (26,148,201 | ) |
| | | | | | | | | | | | | | | | | | | | | | | | | | | | |
|
Net Change in Unrealized Appreciation (Depreciation) on Derivatives Recognized as a Result of Operations: | |
Net change in unrealized appreciation (depreciation) of investments in purchased options contracts | | $ | — | | | $ | (109,680 | ) | | $ | — | | | $ | — | | | $ | — | | | $ | — | | | $ | (109,680 | ) |
Net change in unrealized appreciation (depreciation) of futures contracts | | | 205,230 | | | | — | | | | — | | | | — | | | | — | | | | — | | | | 205,230 | |
Net change in unrealized appreciation (depreciation) of written options contracts | | | 6,972 | | | | — | | | | — | | | | — | | | | — | | | | — | | | | 6,972 | |
Net change in unrealized appreciation (depreciation) of swap contracts | | | 3,484,932 | | | | 85,865 | | | | 6,271,471 | | | | — | | | | — | | | | — | | | | 9,842,268 | |
Net change in unrealized appreciation (depreciation) of foreign currency contracts | | | — | | | | 3,047,281 | | | | — | | | | — | | | | — | | | | — | | | | 3,047,281 | |
| | | | | | | | | | | | | | | | | | | | | | | | | | | | |
Total | | $ | 3,697,134 | | | $ | 3,023,466 | | | $ | 6,271,471 | | | $ | — | | | $ | — | | | $ | — | | | $ | 12,992,071 | |
| | | | | | | | | | | | | | | | | | | | | | | | | | | | |
Notes to Financial Statements – (continued)
December 31, 2016
For the year ended December 31, 2016, the average amount or number per contract outstanding for each derivative type was as follows:
| | | | |
Derivative Description | | Average Notional
Par, Contracts or
Face Amount | |
Purchased Options Contracts | | | 59,958,113 | |
Futures Contracts Long | | | 5,561 | |
Futures Contracts Short | | | (3,209 | ) |
Written Options Contracts | | | (411,979,833 | ) |
Swap Contracts | | $ | 881,399,290 | |
Foreign Currency Contracts Purchased | | $ | 44,268,496 | |
Foreign Currency Contracts Sold | | $ | 136,086,526 | |
U.S. Government Securities HLS Fund
Fair Value of Derivative Instruments on the Statement of Assets and Liabilities as of December 31, 2016:
| | | | | | | | | | | | | | | | | | | | | | | | | | | | |
| | | Risk Exposure Category | |
| | | Interest Rate
Contracts | | | Foreign
Exchange
Contracts | | | Credit
Contracts | | | Equity
Contracts | | | Commodity
Contracts | | | Other
Contracts | | | Total | |
Assets: | | | | | | | | | | | | | | | | | | | | | | | | | | | | |
Unrealized appreciation on swap contracts(2) | | $ | 426,294 | | | $ | — | | | $ | — | | | $ | — | | | $ | — | | | $ | — | | | $ | 426,294 | |
| | | | | | | | | | | | | | | | | | | | | | | | | | | | |
Total | | $ | 426,294 | | | $ | — | | | $ | — | | | $ | — | | | $ | — | | | $ | — | | | $ | 426,294 | |
| | | | | | | | | | | | | | | | | | | | | | | | | | | | |
| | | | | | | |
Liabilities: | | | | | | | | | | | | | | | | | | | | | | | | | | | | |
Unrealized depreciation on futures contracts(1) | | $ | 376,508 | | | $ | — | | | $ | — | | | $ | — | | | $ | — | | | $ | — | | | $ | 376,508 | |
| | | | | | | | | | | | | | | | | | | | | | | | | | | | |
Total | | $ | 376,508 | | | $ | — | | | $ | — | | | $ | — | | | $ | — | | | $ | — | | | $ | 376,508 | |
| | | | | | | | | | | | | | | | | | | | | | | | | | | | |
The Effect of Derivative Instruments on the Statement of Operations for the year ended December 31, 2016
| | | | | | | | | | | | | | | | | | | | | | | | | | | | |
| | | Risk Exposure Category | |
| | | Interest Rate
Contracts | | | Foreign
Exchange
Contracts | | | Credit
Contracts | | | Equity
Contracts | | | Commodity
Contracts | | | Other
Contracts | | | Total | |
Realized Gain (Loss) on Derivatives Recognized as a Result of Operations: | |
Net realized gain (loss) on futures contracts | | $ | (38,912 | ) | | $ | — | | | $ | — | | | $ | — | | | $ | — | | | $ | — | | | $ | (38,912 | ) |
Net realized gain (loss) on swap contracts | | | (280 | ) | | | — | | | | — | | | | — | | | | — | | | | — | | | | (280 | ) |
| | | | | | | | | | | | | | | | | | | | | | | | | | | | |
Total | | $ | (39,192 | ) | | $ | — | | | $ | — | | | $ | — | | | $ | — | | | $ | — | | | $ | (39,192 | ) |
| | | | | | | | | | | | | | | | | | | | | | | | | | | | |
| |
Net Change in Unrealized Appreciation (Depreciation) on Derivatives Recognized as a Result of Operations: | | | | | |
Net change in unrealized appreciation (depreciation) of futures contracts | | $ | (254,974 | ) | | $ | — | | | $ | — | | | $ | — | | | $ | — | | | $ | — | | | | $ (254,974 | ) |
Net change in unrealized appreciation (depreciation) of swap contracts | | | 426,294 | | | | — | | | | — | | | | — | | | | — | | | | — | | | | 426,294 | |
| | | | | | | | | | | | | | | | | | | | | | | | | | | | |
Total | | $ | 171,320 | | | $ | — | | | $ | — | | | $ | — | | | $ | — | | | $ | — | | | $ | 171,320 | |
| | | | | | | | | | | | | | | | | | | | | | | | | | | | |
Notes to Financial Statements – (continued)
December 31, 2016
For the year ended December 31, 2016, the average amount or number per contract outstanding for each derivative type was as follows:
| | | | |
Derivative Description | | Average Notional
Par, Contracts or
Face Amount | |
Futures Contracts Long | | | 582 | |
Futures Contracts Short | | | (201 | ) |
Swap Contracts | | $ | 5,050,000 | |
| | (1) | Amount represents the cumulative appreciation (depreciation) on futures contracts as disclosed within the Schedule of Investments under the open “Futures Contracts” section. Only current day’s variation margin, if any, is reported within the Statements of Assets and Liabilities. |
| | (2) | Amount represents the cumulative appreciation (depreciation) on centrally cleared swaps, if applicable, as disclosed within the Schedule of Investments. Only the current day’s variation margin, if any, is reported within the Statements of Assets and Liabilities. OTC swaps are reported within the Statement of Assets and Liabilities within Unrealized appreciation (depreciation) on OTC swap contracts, if applicable. |
| | f) | Balance Sheet Offsetting Information – Set forth below are tables which disclose both gross information and net information about instruments and transactions eligible for offset in the financial statements, and instruments and transactions that are subject to a master netting arrangement, as well as amounts related to margin, reflected as financial collateral (including cash collateral), held at clearing brokers, counterparties and a Fund’s custodian. The master netting arrangements allow the clearing brokers to net any collateral held in or on behalf of a Fund, or liabilities or payment obligations of the clearing brokers to the Fund, against any liabilities or payment obligations of the Fund to the clearing brokers. A Fund is required to deposit financial collateral (including cash collateral) at the Fund’s custodian on behalf of clearing brokers and counterparties to continually meet the original and maintenance requirements established by the clearing brokers and counterparties. Such requirements are specific to the respective clearing broker or counterparty. Certain master netting arrangements may not be enforceable in a bankruptcy. |
The following tables present the Funds’ derivative assets and liabilities, presented on a gross basis as no amounts are netted within the Statements of Assets and Liabilities, by counterparty net of amounts available for offset under a master netting agreement or similar agreement (“MNA”) and net of the related collateral received/pledged by the Funds as of December 31, 2016:
| | | | | | | | |
| Balanced HLS Fund | |
Derivative Financial Instruments: | | Assets | | | Liabilities | |
Futures contracts | | $ | — | | | $ | (161,124 | ) |
| | | | | | | | |
Total gross amount of derivative assets and liabilities in the Statement of Assets and Liabilities | | | — | | | | (161,124 | ) |
| | | | | | | | |
Derivatives not subject to a MNA | | | — | | | | 161,124 | |
| | | | | | | | |
Total gross amount of assets and liabilities subject to MNA or similar agreements | | $ | — | | | $ | — | |
| | | | | | | | |
| | | | | | | | |
| Capital Appreciation HLS Fund | |
Derivative Financial Instruments: | | Assets | | | Liabilities | |
Foreign currency contracts | | $ | 1,062,399 | | | $ | (71,825 | ) |
| | | | | | | | |
Total gross amount of derivative assets and liabilities in the Statement of Assets and Liabilities | | | 1,062,399 | | | | (71,825 | ) |
| | | | | | | | |
Derivatives not subject to a MNA | | | — | | | | — | |
| | | | | | | | |
Total gross amount of assets and liabilities subject to MNA or similar agreements | | $ | 1,062,399 | | | $ | (71,825 | ) |
| | | | | | | | |
Notes to Financial Statements – (continued)
December 31, 2016
| | | | | | | | | | | | | | | | | | | | |
| Capital Appreciation HLS Fund | |
Counterparty | | Gross Amount of
Assets | | | Financial
Instruments
and
Derivatives
Available for
Offset | | | Non-cash
Collateral
Received* | | | Cash
Collateral
Received* | | | Net Amount
of
Assets | |
Barclays | | $ | 139,815 | | | $ | (71,825 | ) | | $ | — | | | $ | — | | | $ | 67,990 | |
Citibank NA | | | 614,914 | | | | — | | | | — | | | | — | | | | 614,914 | |
Morgan Stanley | | | 307,670 | | | | — | | | | — | | | | — | | | | 307,670 | |
| | | | | | | | | | | | | | | | | | | | |
Total | | $ | 1,062,399 | | | $ | (71,825 | ) | | $ | — | | | $ | — | | | $ | 990,574 | |
| | | | | | | | | | | | | | | | | | | | |
| | | | | | | | | | | | | | | | | | | | |
Counterparty | | Gross Amount of
Liabilities | | | Financial
Instruments
and
Derivatives
Available for
Offset | | | Non-cash
Collateral
Pledged* | | | Cash
Collateral
Pledged* | | | Net Amount
of
Liabilities | |
Barclays | | $ | (71,825 | ) | | $ | 71,825 | | | $ | — | | | $ | — | | | $ | — | |
| | | | | | | | | | | | | | | | | | | | |
| | * | In some instances, the actual collateral received and/or pledged may be more than the amount shown. |
| | | | | | | | |
High Yield HLS Fund | |
Derivative Financial Instruments: | | Assets | | | Liabilities | |
Foreign currency contracts | | $ | — | | | $ | (41,438 | ) |
Swap contracts | | | 302,502 | | | | — | |
| | | | | | | | |
Total gross amount of derivative assets and liabilities in the Statement of Assets and Liabilities | | | 302,502 | | | | (41,438 | ) |
| | | | | | | | |
Derivatives not subject to a MNA | | | (302,502 | ) | | | — | |
| | | | | | | | |
Total gross amount of assets and liabilities subject to MNA or similar agreements | | $ | — | | | $ | (41,438 | ) |
| | | | | | | | |
| | | | | | | | | | | | | | | | | | | | |
Counterparty | | Gross Amount of
Liabilities | | | Financial
Instruments
and
Derivatives
Available for
Offset | | | Non-cash
Collateral
Pledged* | | | Cash
Collateral
Pledged* | | | Net Amount
of
Liabilities | |
Barclays | | $ | (41,438 | ) | | $ | — | | | $ | — | | | $ | — | | | $ | (41,438 | ) |
| | | | | | | | | | | | | | | | | | | | |
| | * | In some instances, the actual collateral received and/or pledged may be more than the amount shown. |
| | | | | | | | |
Total Return Bond HLS Fund | |
Derivative Financial Instruments: | | Assets | | | Liabilities | |
Foreign currency contracts | | $ | 5,008,810 | | | $ | (1,514,097 | ) |
Futures contracts | | | 1,053,726 | | | | (1,049,961 | ) |
Purchased options | | | 13,338 | | | | — | |
Swap contracts | | | 10,351,631 | | | | (5,140,160 | ) |
| | | | | | | | |
Total gross amount of derivative assets and liabilities in the Statement of Assets and Liabilities | | | 16,427,505 | | | | (7,704,218 | ) |
| | | | | | | | |
Derivatives not subject to a MNA | | | (3,152,789 | ) | | | 2,401,524 | |
| | | | | | | | |
Total gross amount of assets and liabilities subject to MNA or similar agreements | | $ | 13,274,716 | | | $ | (5,302,694 | ) |
| | | | | | | | |
Notes to Financial Statements – (continued)
December 31, 2016
| | | | | | | | | | | | | | | | | | | | |
Total Return Bond HLS Fund | |
Counterparty | | Gross Amount of
Assets | | | Financial
Instruments
and
Derivatives
Available for
Offset | | | Non-cash
Collateral
Received* | | | Cash
Collateral
Received* | | | Net Amount
of
Assets | |
Banc of America Securities LLC | | $ | 2,256,316 | | | $ | (697,505 | ) | | $ | (1,558,811 | ) | | $ | — | | | $ | — | |
Barclays | | | 402,337 | | | | (402,337 | ) | | | — | | | | — | | | | — | |
BNP Paribas Securities Services | | | 261,633 | | | | — | | | | — | | | | — | | | | 261,633 | |
Citibank NA | | | 3,865,336 | | | | (178,114 | ) | | | — | | | | (634,000 | ) | | | 3,053,222 | |
Credit Suisse International | | | 979,044 | | | | (796,559 | ) | | | — | | | | — | | | | 182,485 | |
Deutsche Bank Securities, Inc. | | | 293,848 | | | | (191,697 | ) | | | — | | | | (102,151 | ) | | | — | |
Goldman Sachs & Co. | | | 644,493 | | | | (644,493 | ) | | | — | | | | — | | | | — | |
HSBC Bank USA | | | 165,680 | | | | — | | | | — | | | | — | | | | 165,680 | |
JP Morgan Chase & Co. | | | 2,099,931 | | | | (92,334 | ) | | | — | | | | — | | | | 2,007,597 | |
Merrill Lynch International | | | 901,558 | | | | (165,275 | ) | | | — | | | | — | | | | 736,283 | |
Morgan Stanley | | | 779,755 | | | | (747,337 | ) | | | — | | | | (32,418 | ) | | | — | |
National Australia Bank Limited | | | 1,206 | | | | — | | | | — | | | | — | | | | 1,206 | |
UBS AG | | | 623,579 | | | | (323,898 | ) | | | — | | | | — | | | | 299,681 | |
| | | | | | | | | | | | | | | | | | | | |
Total | | $ | 13,274,716 | | | $ | (4,239,549 | ) | | $ | (1,558,811 | ) | | $ | (768,569 | ) | | $ | 6,707,787 | |
| | | | | | | | | | | | | | | | | | | | |
| | | | | | | | | | | | | | | | | | | | |
Counterparty | | Gross Amount of
Liabilities | | | Financial
Instruments
and
Derivatives
Available for
Offset | | | Non-cash
Collateral
Pledged* | | | Cash
Collateral
Pledged* | | | Net Amount
of Liabilities | |
Banc of America Securities LLC | | $ | (697,505 | ) | | $ | 697,505 | | | $ | — | | | $ | — | | | $ | — | |
Barclays | | | (488,382 | ) | | | 402,337 | | | | 86,045 | | | | — | | | | — | |
Citibank NA | | | (178,114 | ) | | | 178,114 | | | | — | | | | — | | | | — | |
Credit Suisse International | | | (796,559 | ) | | | 796,559 | | | | — | | | | — | | | | — | |
Deutsche Bank Securities, Inc. | | | (191,697 | ) | | | 191,697 | | | | — | | | | — | | | | — | |
Goldman Sachs & Co. | | | (1,081,581 | ) | | | 644,493 | | | | 437,088 | | | | — | | | | — | |
JP Morgan Chase & Co. | | | (92,334 | ) | | | 92,334 | | | | — | | | | — | | | | — | |
Merrill Lynch International | | | (165,275 | ) | | | 165,275 | | | | — | | | | — | | | | — | |
Morgan Stanley | | | (747,337 | ) | | | 747,337 | | | | — | | | | — | | | | — | |
State Street Global Markets LLC | | | (540,012 | ) | | | — | | | | — | | | | — | | | | (540,012 | ) |
UBS AG | | | (323,898 | ) | | | 323,898 | | | | — | | | | — | | | | — | |
| | | | | | | | | | | | | | | | | | | | |
Total | | $ | (5,302,694 | ) | | $ | 4,239,549 | | | $ | 523,133 | | | $ | — | | | $ | (540,012 | ) |
| | | | | | | | | | | | | | | | | | | | |
| | * | In some instances, the actual collateral received and/or pledged may be more than the amount shown. |
| | | | | | | | |
| U.S. Government Securities HLS Fund | | | | |
Derivative Financial Instruments: | | Assets | | | Liabilities | |
Futures contracts | | $ | — | | | $ | (376,508 | ) |
Swap contracts | | | 426,294 | | | | — | |
| | | | | | | | |
Total gross amount of derivative assets and liabilities in the Statement of Assets and Liabilities | | | 426,294 | | | | (376,508 | ) |
| | | | | | | | |
Derivatives not subject to a MNA | | | (426,294 | ) | | | 376,508 | |
| | | | | | | | |
Total gross amount of assets and liabilities subject to MNA or similar agreements | | $ | — | | | $ | — | |
| | | | | | | | |
Notes to Financial Statements – (continued)
December 31, 2016
The market values of equity securities, such as common stocks and preferred stocks, or equity related investments, such as futures and options, may decline due to general market conditions which are not specifically related to a particular company, such as real or perceived adverse economic conditions, changes in the general outlook for corporate earnings, changes in interest or currency rates or adverse investor sentiment generally. The market value of equity securities may also decline due to factors which affect a particular industry or industries, such as labor shortages or increased production costs and competitive conditions within an industry. Equity securities and equity related investments generally have greater market price volatility than fixed income securities.
Credit risk depends largely on the perceived financial health of bond issuers. In general, the credit rating is inversely related to the credit risk of the issuer. Higher rated bonds generally are deemed to have less credit risk, while lower or unrated bonds are deemed to have higher risk of default. The share price, yield and total return of a fund that holds securities with higher credit risk may be more volatile than those of a fund that holds bonds with lower credit risk. Similar to credit risk, a Fund may be exposed to counterparty risk, or the risk that an institution or other entity with which a Fund has unsettled or open transactions will default.
Certain investments held by a Fund expose the Fund to various risks which may include, but are not limited to, interest rate, prepayment, extension and foreign currency risks. Interest rate risk is the risk that fixed income securities will decline in value because of changes in interest rates. As nominal interest rates rise, the values of certain fixed income securities held by a Fund are likely to decrease. A nominal interest rate can be described as the sum of a real interest rate and an expected inflation rate. Fixed income securities with longer durations tend to be more sensitive to changes in interest rates, usually making them more volatile than securities with shorter durations. Duration is useful primarily as a measure of the sensitivity of a fixed income security’s market price to interest rate (i.e., yield) movements. Senior floating rate interests and securities subject to prepayment and extension risk generally offer less potential for gains when interest rates decline. Rising interest rates may cause prepayments to occur at a slower than expected rate, thereby effectively lengthening the maturity of the security and making the security more sensitive to interest rate changes. Prepayment and extension risk are major risks of mortgage backed securities, senior floating rate interests and certain asset backed securities. For certain asset backed securities, the actual maturity may be less than the stated maturity shown in the Schedule of Investments, if applicable. As a result, the timing of income recognition relating to these securities may vary based upon the actual maturity.
If a Fund invests directly in foreign currencies or in securities that trade in, and receive revenues in, foreign currencies, or in derivatives that provide exposure to foreign currencies, it will be subject to the risk that those currencies will decline in value relative to the base currency (U.S. dollars) of the Fund, or, in the case of hedging positions, that the Fund’s base currency will decline in value relative to the currency being hedged. Currency rates in foreign countries may fluctuate significantly over short periods of time for a number of reasons, including changes in interest rates, intervention (or the failure to intervene) by U.S. or foreign governments, central banks or supranational entities, such as the International Monetary Fund, or by the imposition of currency controls or other political developments in the United States or abroad. As a result, a Fund’s investments in foreign currency denominated securities may reduce the returns, if applicable, of the Fund.
| | a) | Each Fund intends to continue to qualify as a Regulated Investment Company (“RIC”) under Subchapter M of the Internal Revenue Code (“IRC”) by distributing substantially all of its taxable net investment income and net realized capital gains to its shareholders. Each Fund has distributed substantially all of its income and capital gains in prior years, if applicable, and intends to distribute substantially all of its income and capital gains during the calendar year ending December 31, 2016. Accordingly, no provision for federal income or excise taxes has been made in the accompanying financial statements. Distributions from short-term capital gains are treated as ordinary income distributions for federal income tax purposes. |
| | b) | Net Investment Income (Loss), Net Realized Gains (Losses) and Distributions – Net investment income (loss) and net realized gains (losses) may differ for financial statement and tax purposes primarily because of losses deferred due to wash sale adjustments, foreign currency gains and losses, adjustments related to Passive Foreign Investment Companies (“PFICs”), Real Estate Investment Trusts (“REITs”), RICs, certain derivatives and partnerships. The character of distributions made during the year from net investment income or net realized gains may differ from their ultimate characterization for federal income tax purposes. Also, due to the timing of dividend distributions, the fiscal year in which amounts are distributed may differ from the year that the income or realized gains (losses) were recorded by each Fund. |
Notes to Financial Statements – (continued)
December 31, 2016
| | c) | Distributions and Components of Distributable Earnings – The tax character of distributions paid by each Fund for the years ended December 31, 2016 and December 31, 2015 are as follows (as adjusted for dividends payable, if applicable): |
| | | | | | | | | | | | | | | | |
| | | For the Year Ended
December 31, 2016 | | | For the Year Ended
December 31, 2015 | |
Fund | | Ordinary
Income | | | Long-Term
Capital Gains(1) | | | Ordinary
Income | | | Long-Term
Capital Gains(1) | |
Balanced HLS Fund | | $ | 64,341,864 | | | $ | — | | | $ | 48,113,111 | | | $ | — | |
Capital Appreciation HLS Fund | | | 109,413,745 | | | | 483,020,980 | | | | 395,608,528 | | | | 941,479,163 | |
Disciplined Equity HLS Fund | | | 5,779,778 | | | | 86,580,393 | | | | 17,696,259 | | | | 226,565,250 | |
Dividend and Growth HLS Fund | | | 67,340,704 | | | | 368,805,693 | | | | 81,615,645 | | | | 497,141,842 | |
Global Growth HLS Fund | | | 2,719,592 | | | | 46,632,592 | | | | 2,330,348 | | | | 21,960,413 | |
Growth Opportunities HLS Fund | | | 63,046,538 | | | | 135,646,185 | | | | 75,794,685 | | | | 207,664,278 | |
Healthcare HLS Fund | | | 16,501,827 | | | | 59,648,396 | | | | 3,015,270 | | | | 46,392,436 | |
High Yield HLS Fund | | | 20,173,151 | | | | — | | | | 24,914,498 | | | | — | |
International Opportunities HLS Fund | | | 19,934,946 | | | | — | | | | 20,056,070 | | | | — | |
MidCap HLS Fund | | | 3,018,544 | | | | 179,809,066 | | | | 13,749,279 | | | | 197,614,796 | |
MidCap Value HLS Fund | | | 3,944,532 | | | | 46,923,488 | | | | 5,717,645 | | | | 55,282,288 | |
Small Cap Growth HLS Fund | | | 3,674,250 | | | | 47,394,376 | | | | 17,138,693 | | | | 81,861,568 | |
Small Company HLS Fund | | | — | | | | 96,202,028 | | | | 48,556,100 | | | | 208,942,541 | |
Small/Mid Cap Equity HLS Fund | | | 1,209,387 | | | | 5,663,682 | | | | 3,215,842 | | | | 15,912,525 | |
Stock HLS Fund | | | 26,635,480 | | | | — | | | | 27,684,514 | | | | — | |
Total Return Bond HLS Fund | | | 65,470,345 | | | | 10,007,821 | | | | 137,524,741 | | | | 23,735,354 | |
Ultrashort Bond HLS Fund | | | 2,672,149 | | | | — | | | | 2,122,089 | | | | 32,791 | |
U.S. Government Securities HLS Fund | | | 9,029,477 | | | | — | | | | 9,323,867 | | | | — | |
Value HLS Fund | | | 10,899,057 | | | | 62,514,733 | | | | 10,774,724 | | | | 15,734,487 | |
| | (1) | The Funds designate these distributions as long-term capital gain dividends pursuant to IRC Sec. 852(b)(3)(c). |
As of December 31, 2016, the components of distributable earnings (deficit) for each Fund on a tax basis are as follows:
| | | | | | | | | | | | | | | | | | | | |
Fund | | Undistributed
Ordinary
Income | | | Undistributed
Long-Term
Capital Gain | | | Accumulated
Capital and
Other Losses(1) | | | Unrealized
Appreciation
(Depreciation)
on Investments(2) | | | Total
Accumulated
Earnings
(Deficit) | |
Balanced HLS Fund | | $ | 11,750,519 | | | $ | — | | | $ | (81,507,953 | ) | | $ | 387,267,803 | | | $ | 317,510,369 | |
Capital Appreciation HLS Fund | | | 9,755,936 | | | | 49,402,766 | | | | — | | | | 250,095,066 | | | | 309,253,768 | |
Disciplined Equity HLS Fund | | | 181,803 | | | | 65,715,031 | | | | — | | | | 123,413,429 | | | | 189,310,263 | |
Dividend and Growth HLS Fund | | | 406,191 | | | | 222,161,590 | | | | — | | | | 997,736,549 | | | | 1,220,304,330 | |
Global Growth HLS Fund | | | 2,331,234 | | | | 22,480,542 | | | | — | | | | 52,868,409 | | | | 77,680,185 | |
Growth Opportunities HLS Fund | | | — | | | | 18,391,824 | | | | — | | | | 91,778,449 | | | | 110,170,273 | |
Healthcare HLS Fund | | | 3,189 | | | | 49,738,559 | | | | — | | | | 11,153,421 | | | | 60,895,169 | |
High Yield HLS Fund | | | 18,453,351 | | | | — | | | | (30,397,808 | ) | | | 1,954,857 | | | | (9,989,600 | ) |
International Opportunities HLS Fund | | | 20,907,509 | | | | — | | | | (300,038,070 | ) | | | 26,731,796 | | | | (252,398,765 | ) |
MidCap HLS Fund | | | 20,852 | | | | 67,862,668 | | | | — | | | | 380,800,413 | | | | 448,683,933 | |
MidCap Value HLS Fund | | | 1,962,506 | | | | 24,377,824 | | | | — | | | | 62,490,565 | | | | 88,830,895 | |
Small Cap Growth HLS Fund | | | 1,097,782 | | | | — | | | | (14,173,818 | ) | | | 146,439,905 | | | | 133,363,869 | |
Small Company HLS Fund | | | — | | | | — | | | | (91,853,413 | ) | | | 71,704,812 | | | | (20,148,601 | ) |
Small/Mid Cap Equity HLS Fund | | | 1,102,708 | | | | 2,803,669 | | | | — | | | | 14,333,783 | | | | 18,240,160 | |
Stock HLS Fund | | | 724,929 | | | | — | | | | (133,818,999 | ) | | | 243,786,561 | | | | 110,692,491 | |
Total Return Bond HLS Fund | | | 70,944,133 | | | | — | | | | (14,650,246 | ) | | | 5,062,642 | | | | 61,356,529 | |
Ultrashort Bond HLS Fund | | | 4,216,358 | | | | — | | | | (667,792 | ) | | | (80,839 | ) | | | 3,467,727 | |
U.S. Government Securities HLS Fund | | | 8,912,051 | | | | — | | | | (107,940,492 | ) | | | (1,849,076 | ) | | | (100,877,517 | ) |
Value HLS Fund | | | 939,208 | | | | 34,865,686 | | | | — | | | | 122,213,385 | | | | 158,018,279 | |
| | (1) | The Funds have capital loss carryforwards that are identified in the Capital Loss Carryforward note that follows. |
| | (2) | Differences between book-basis and tax-basis unrealized appreciation (depreciation) may be attributable to the losses deferred due to wash sale adjustments, foreign currency gains and losses, adjustments related to PFICs, REITs, RICs, certain derivatives and partnerships. |
Notes to Financial Statements – (continued)
December 31, 2016
| | d) | Reclassification of Capital Accounts – The Funds may record reclassifications in their capital accounts. These reclassifications have no impact on the total net assets of the Funds. The reclassifications are a result of permanent differences between U.S. GAAP and tax accounting for such items as foreign currency gain/loss, expiration of capital loss carryforwards, write-off or utilization of net operating losses and tax adjustments related to PFIC, swap and partnership investments. Adjustments are made to reflect the impact these items have on current and future distributions to shareholders. Therefore, the source of the Funds’ distributions may be shown in the accompanying Statements of Changes in Net Assets as from undistributed net investment income, from accumulated net realized gains on investments or from capital depending on the type of book and tax differences that exist. For the year ended December 31, 2016, the Funds recorded reclassifications to increase (decrease) the accounts listed below: |
| | | | | | | | | | | | |
Fund | | Capital Stock and
Paid-in-Capital | | | Undistributed Net
Investment
Income (Loss) | | | Accumulated Net
Realized Gain
(Loss) | |
Balanced HLS Fund | | $ | (15,494 | ) | | $ | (1,192,329 | ) | | $ | 1,207,823 | |
Capital Appreciation HLS Fund | | | (2,173,622 | ) | | | 5,675,544 | | | | (3,501,922 | ) |
Disciplined Equity HLS Fund | | | — | | | | (70,591 | ) | | | 70,591 | |
Dividend and Growth HLS Fund | | | (1 | ) | | | (2,293,544 | ) | | | 2,293,545 | |
Global Growth HLS Fund | | | — | | | | 76,783 | | | | (76,783 | ) |
Growth Opportunities HLS Fund | | | (1,731,481 | ) | | | 1,782,043 | | | | (50,562 | ) |
Healthcare HLS Fund | | | — | | | | (528,215 | ) | | | 528,215 | |
High Yield HLS Fund | | | — | | | | 213,198 | | | | (213,198 | ) |
International Opportunities HLS Fund | | | (94,110,554 | ) | | | 465,602 | | | | 93,644,952 | |
MidCap HLS Fund | | | — | | | | (283,095 | ) | | | 283,095 | |
MidCap Value HLS Fund | | | — | | | | 744,190 | | | | (744,190 | ) |
Small Cap Growth HLS Fund | | | — | | | | (234,630 | ) | | | 234,630 | |
Small Company HLS Fund | | | (1,502,213 | ) | | | 1,080,338 | | | | 421,875 | |
Small/Mid Cap Equity HLS Fund | | | — | | | | (45,192 | ) | | | 45,192 | |
Stock HLS Fund | | | 1 | | | | (623,181 | ) | | | 623,180 | |
Total Return Bond HLS Fund | | | (1 | ) | | | (14,644,799 | ) | | | 14,644,800 | |
Ultrashort Bond HLS Fund | | | (1 | ) | | | 458,312 | | | | (458,311 | ) |
U.S. Government Securities HLS Fund | | | 1 | | | | 838,620 | | | | (838,621 | ) |
Value HLS Fund | | | 1 | | | | (463,333 | ) | | | 463,332 | |
| | e) | Capital Loss Carryforward – On December 22, 2010, the Regulated Investment Company Modernization Act of 2010 (the “Act”) was enacted, which made changes to the capital loss carryforward rules. The changes are effective for taxable years beginning after the date of enactment. Under the Act, funds are permitted to carry forward capital losses for an unlimited period. However, any losses incurred during those future taxable years will be required to be utilized prior to the losses incurred in pre-enactment taxable years, which carry an expiration date. As a result of this ordering rule, pre-enactment capital loss carryforwards may be more likely to expire unused. Additionally, post-enactment capital loss carryforwards retain their character as either short-term or long-term capital losses rather than being considered all short-term as permitted under prior regulation. |
Notes to Financial Statements – (continued)
December 31, 2016
At December 31, 2016 (tax year end), the capital loss carryforwards for U.S. federal income tax purposes were as follows:
| | | | | | | | | | | | | | | | |
| | | Year of Expiration | | | Unlimited
Short-Term
Capital Loss
Carryforward | | | Unlimited
Long-Term
Capital Loss
Carryforward | |
Fund | | 2017 | | | 2018 | | | |
Balanced HLS Fund | | $ | 81,507,953 | | | $ | — | | | $ | — | | | $ | — | |
High Yield HLS Fund | | | 9,709,378 | | | | — | | | | 4,253,411 | | | | 16,435,019 | |
International Opportunities HLS Fund | | | 287,600,120 | | | | — | | | | 12,437,950 | | | | — | |
Small Cap Growth HLS Fund | | | — | | | | — | | | | 14,173,818 | | | | — | |
Small Company HLS Fund | | | — | | | | — | | | | 89,790,983 | | | | 2,062,430 | |
Stock HLS Fund | | | 133,818,999 | | | | — | | | | — | | | | — | |
Total Return Bond HLS Fund | | | — | | | | — | | | | 11,966,088 | | | | 2,684,158 | |
Ultrashort Bond HLS Fund | | | — | | | | — | | | | 260,576 | | | | 407,216 | |
U.S. Government Securities HLS Fund | | | 25,163,377 | | | | 58,149,395 | | | | — | | | | 24,627,720 | |
Capital Appreciation HLS Fund, Disciplined Equity HLS Fund, Dividend and Growth HLS Fund, Global Growth HLS, Growth Opportunities HLS Fund, Healthcare HLS Fund, MidCap HLS Fund, MidCap Value HLS Fund, Small/Mid Cap Equity HLS Fund and Value HLS Fund had no capital loss carryforwards for U.S. federal income tax purposes as of December 31, 2016.
During the year ended December 31, 2016, Balanced HLS Fund, Stock HLS Fund and U.S. Government Securities HLS Fund utilized $117,542,438, $126,576,029 and $5,844,416 of prior year capital loss carryforwards, respectively.
During the year ended December 31, 2016, International Opportunities HLS Fund had expired $94,110,554 of prior year capital loss carryforwards.
| | f) | Accounting for Uncertainty in Income Taxes – Pursuant to provisions set forth by U.S. GAAP, Hartford Funds Management Company, LLC (“HFMC”) reviews each Fund’s tax positions for all open tax years. As of December 31, 2016, HFMC had reviewed the open tax years and concluded that there was no reason to record a liability for net unrecognized tax obligations relating to uncertain income tax positions. Each Fund files U.S. tax returns. Although the statute of limitations for examining a Fund’s U.S. tax returns remains open for 3 years, no examination is currently in progress. HFMC is not aware of any tax positions for which it is reasonably possible that the total amounts of unrecognized tax obligations will significantly change in the next twelve months. |
| | a) | Investment Management Agreement – HFMC serves as each Fund’s investment manager. Each Company, on behalf of its respective Funds, has entered into an Investment Management Agreement with HFMC. HFMC is an indirect subsidiary of The Hartford Financial Services Group, Inc. (“The Hartford”). HFMC has overall investment supervisory responsibility for each Fund. In addition, HFMC provides administrative personnel, services, equipment, facilities and office space for proper operation of each Fund. HFMC has contracted with Wellington Management Company LLP (“Wellington Management”) under a sub-advisory agreement and Wellington Management performs the daily investment of the assets of each Fund in accordance with the Fund’s investment objective and policies. Each Fund pays a fee to HFMC, a portion of which may be used to compensate Wellington Management. |
Notes to Financial Statements – (continued)
December 31, 2016
The schedule below reflects the rates of compensation paid to HFMC for investment management services rendered as of December 31, 2016; the rates are accrued daily and paid monthly based on each Fund’s average daily net assets, at the following annual rates:
| | |
Fund | | Management Fee Rates |
Balanced HLS Fund | | 0.6800% on first $250 million and; |
| | 0.6550% on next $250 million and; |
| | 0.6450% on next $500 million and; |
| | 0.5950% on next $4 billion and; |
| | 0.5925% on next $5 billion and; |
| | 0.5900% over $10 billion |
| |
Capital Appreciation HLS Fund | | 0.7750% on first $250 million and; |
| | 0.7250% on next $250 million and; |
| | 0.6750% on next $500 million and; |
| | 0.6250% on next $1.5 billion and; |
| | 0.6200% on next $2.5 billion and; |
| | 0.6150% on next $5 billion and; |
| | 0.6100% over $10 billion |
| |
Disciplined Equity HLS Fund | | 0.7750% on first $250 million and; |
| | 0.7250% on next $250 million and; |
| | 0.6750% on next $500 million and; |
| | 0.6250% on next $4 billion and; |
| | 0.6225% on next $5 billion and; |
| | 0.6200% over $10 billion |
| |
Dividend and Growth HLS Fund | | 0.7750% on first $250 million and; |
| | 0.7250% on next $250 million and; |
| | 0.6750% on next $500 million and; |
| | 0.6250% on next $1.5 billion and; |
| | 0.6200% on next $2.5 billion and; |
| | 0.6150% on next $5 billion and; |
| | 0.6100% over $10 billion |
| |
Global Growth HLS Fund | | 0.7750% on first $250 million and; |
| | 0.7250% on next $250 million and; |
| | 0.6750% on next $500 million and; |
| | 0.6250% on next $4 billion and; |
| | 0.6225% on next $5 billion and; |
| | 0.6200% over $10 billion |
| |
Growth Opportunities HLS Fund | | 0.7000% on first $100 million and; |
| | 0.6000% on next $4.9 billion and; |
| | 0.5975% on next $5 billion and; |
| | 0.5950% over $10 billion |
| |
Healthcare HLS Fund | | 0.8500% on first $250 million and; |
| | 0.8000% on next $250 million and; |
| | 0.7500% on next $4.5 billion and; |
| | 0.7475% on next $5 billion and; |
| | 0.7450% over $10 billion |
Notes to Financial Statements – (continued)
December 31, 2016
| | |
Fund | | Management Fee Rates |
High Yield HLS Fund | | 0.7000% on first $500 million and; |
| | 0.6750% on next $500 million and; |
| | 0.6250% on next $1.5 billion and; |
| | 0.6150% on next $2.5 billion and; |
| | 0.6050% on next $5 billion and; |
| | 0.5950% over $10 billion |
| |
International Opportunities HLS Fund | | 0.7750% on first $250 million and; |
| | 0.7250% on next $250 million and; |
| | 0.6750% on next $500 million and; |
| | 0.6250% on next $1.5 billion and; |
| | 0.6200% on next $2.5 billion and; |
| | 0.6150% on next $5 billion and; |
| | 0.6100% over $10 billion |
| |
MidCap HLS Fund | | 0.7750% on first $250 million and; |
| | 0.7250% on next $250 million and; |
| | 0.6750% on next $500 million and; |
| | 0.6250% on next $4 billion and; |
| | 0.6225% on next $5 billion and; |
| | 0.6200% over $10 billion |
| |
MidCap Value HLS Fund | | 0.8000% on first $500 million and; |
| | 0.7250% on next $500 million and; |
| | 0.6750% on next $1.5 billion and; |
| | 0.6700% on next $2.5 billion and; |
| | 0.6650% on next $5 billion and; |
| | 0.6600% over $10 billion |
| |
Small Cap Growth HLS Fund | | 0.7000% on first $100 million and; |
| | 0.6000% on next $4.9 billion and; |
| | 0.5800% on next $5 billion and; |
| | 0.5700% over $10 billion |
| |
Small Company HLS Fund | | 0.7750% on first $250 million and; |
| | 0.7250% on next $250 million and; |
| | 0.6750% on next $500 million and; |
| | 0.6000% on next $500 million and; |
| | 0.5500% on next $3.5 billion and; |
| | 0.5300% on next $5 billion and; |
| | 0.5200% over $10 billion |
| |
Small/Mid Cap Equity HLS Fund | | 0.8000% on first $500 million and; |
| | 0.7500% on next $500 million and; |
| | 0.7000% on next $2 billion and; |
| | 0.6900% on next $2 billion and; |
| | 0.6800% on next $5 billion and; |
| | 0.6700% over $10 billion |
| |
Stock HLS Fund | | 0.5250% on first $250 million and; |
| | 0.5000% on next $250 million and; |
| | 0.4750% on next $500 million and; |
| | 0.4500% on next $4 billion and; |
| | 0.4475% on next $5 billion and; |
| | 0.4450% over $10 billion |
Notes to Financial Statements – (continued)
December 31, 2016
| | |
Fund | | Management Fee Rates |
Total Return Bond HLS Fund | | 0.5250% on first $250 million and; |
| | 0.5000% on next $250 million and; |
| | 0.4750% on next $500 million and; |
| | 0.4500% on next $1.5 billion and; |
| | 0.4450% on next $2.5 billion and; |
| | 0.4300% on next $5 billion and; |
| | 0.4200% over $10 billion |
| |
Ultrashort Bond HLS Fund | | 0.4000% on first $5 billion and; |
| | 0.3800% on next $5 billion and; |
| | 0.3700% over $10 billion |
| |
U.S. Government Securities HLS Fund | | 0.4500% on first $500 million and; |
| | 0.4450% on next $500 million and; |
| | 0.4400% on next $1.5 billion and; |
| | 0.4350% on next $2.5 billion and; |
| | 0.4300% on next $5 billion and; |
| | 0.4200% over $10 billion |
| |
Value HLS Fund | | 0.7750% on first $250 million and; |
| | 0.7250% on next $250 million and; |
| | 0.6750% on next $500 million and; |
| | 0.6250% on next $1.5 billion and; |
| | 0.6200% on next $2.5 billion and; |
| | 0.6150% on next $5 billion and; |
| | 0.6100% over $10 billion |
HFMC contractually agreed to waive investment management fees of 0.02% of average daily net assets until December 31, 2016, for the Balanced HLS Fund.
| | b) | Accounting Services Agreement – Pursuant to the Fund Accounting Agreement between HFMC and each Company, on behalf of its respective Funds, HFMC provides accounting services to each Fund and receives monthly compensation based on each Fund’s average daily net assets at the rates set forth below. Each Fund’s accounting services fees are accrued daily and paid monthly. |
| | |
Fund | | Accounting Services Fee Rates |
Balanced HLS Fund | | 0.016% on first $5 billion and; |
| | 0.013% on next $5 billion and; |
| | 0.010% over $10 billion |
| |
Capital Appreciation HLS Fund | | 0.018% on first $5 billion and; |
| | 0.014% on next $5 billion and; |
| | 0.010% over $10 billion |
| |
Disciplined Equity HLS Fund | | 0.012% on first $5 billion and; |
| | 0.010% over $5 billion |
| |
Dividend and Growth HLS Fund | | 0.012% on first $5 billion and; |
| | 0.010% over $5 billion |
| |
Global Growth HLS Fund | | 0.014% on first $5 billion and; |
| | 0.012% on next $5 billion and; |
| | 0.010% over $10 billion |
| |
Growth Opportunities HLS Fund | | 0.010% on all assets |
| |
Healthcare HLS Fund | | 0.010% on all assets |
Notes to Financial Statements – (continued)
December 31, 2016
| | |
Fund | | Accounting Services Fee Rates |
High Yield HLS Fund | | 0.020% on first $5 billion and; |
| | 0.015% on next $5 billion and; |
| | 0.010% over $10 billion |
| |
International Opportunities HLS Fund | | 0.016% on first $5 billion and; |
| | 0.013% on next $5 billion and; |
| | 0.010% over $10 billion |
| |
MidCap HLS Fund | | 0.010% on all assets |
| |
MidCap Value HLS Fund | | 0.010% on all assets |
| |
Small Cap Growth HLS Fund | | 0.012% on first $5 billion and; |
| | 0.010% over $5 billion |
| |
Small Company HLS Fund | | 0.012% on first $5 billion and; |
| | 0.010% over $5 billion |
| |
Small/Mid Cap Equity HLS Fund | | 0.014% on first $5 billion and; |
| | 0.012% on next $5 billion and; |
| | 0.010% over $10 billion |
| |
Stock HLS Fund | | 0.010% on all assets |
| |
Total Return Bond HLS Fund | | 0.020% on first $5 billion and; |
| | 0.015% on next $5 billion and; |
| | 0.010% over $10 billion |
| |
Ultrashort Bond HLS Fund | | 0.010% on all assets |
| |
U.S. Government Securities HLS Fund | | 0.012% on first $5 billion and; |
| | 0.010% over $5 billion |
| |
Value HLS Fund | | 0.010% on all assets |
Effective January 1, 2015, HFMC has delegated certain accounting and administrative services functions to State Street Bank and Trust Company (“State Street”). The costs and expenses of such delegation are borne by HFMC, not by the Funds, and HFMC compensates State Street for its services out of its own resources.
| | c) | Operating Expenses – Allocable expenses incurred by each Company are allocated to each Fund, as applicable, and allocated to classes within each Fund in proportion to the average daily net assets of each Fund and each class, except where allocation of certain expenses is more fairly made directly to each Fund or to specific classes within a Fund. |
| | d) | Fees Paid Indirectly – Hartford HLS Series Fund II, Inc., on behalf of its series except U.S. Government Securities HLS Fund, and Hartford Series Fund, Inc., on behalf of its series except High Yield HLS Fund, Total Return Bond HLS Fund and Ultrashort Bond HLS Fund, have entered into agreements with State Street Global Markets, LLC and Russell Implementation Services, Inc. to partially recapture non-discounted trade commissions. Such rebates are used to pay a portion of the Funds’ expenses. In addition, the Funds’ custodian bank has agreed to reduce its fees when a Fund maintains cash on deposit in a non-interest-bearing custody account. For the year ended December 31, 2016, these amounts, if any, are included in the Statements of Operations. |
Notes to Financial Statements – (continued)
December 31, 2016
The ratio of expenses to average net assets in the accompanying financial highlights excludes the reduction in expenses related to fees paid indirectly. The annualized expense ratio after waivers reflecting the reduction for fees paid indirectly for the period is as follows:
| | | | | | | | | | | | |
Fund | | Class IA | | | Class IB | | | Class IC | |
Balanced HLS Fund | | | 0.64 | % | | | 0.89 | % | | | — | |
Capital Appreciation HLS Fund | | | 0.68 | % | | | 0.93 | % | | | 1.18 | % |
Disciplined Equity HLS Fund | | | 0.79 | % | | | 1.04 | % | | | — | |
Dividend and Growth HLS Fund | | | 0.69 | % | | | 0.94 | % | | | — | |
Global Growth HLS Fund | | | 0.82 | % | | | 1.07 | % | | | — | |
Growth Opportunities HLS Fund | | | 0.65 | % | | | 0.90 | % | | | 1.14 | % |
Healthcare HLS Fund | | | 0.89 | % | | | 1.14 | % | | | — | |
High Yield HLS Fund | | | 0.79 | % | | | 1.04 | % | | | — | |
International Opportunities HLS Fund | | | 0.76 | % | | | 1.01 | % | | | — | |
MidCap HLS Fund | | | 0.71 | % | | | 0.96 | % | | | — | |
MidCap Value HLS Fund | | | 0.86 | % | | | 1.11 | % | | | — | |
Small Cap Growth HLS Fund | | | 0.65 | % | | | 0.90 | % | | | — | |
Small Company HLS Fund | | | 0.76 | % | | | 1.00 | % | | | — | |
Small/Mid Cap Equity HLS Fund | | | 0.92 | % | | | 1.17 | % | | | — | |
Stock HLS Fund | | | 0.52 | % | | | 0.77 | % | | | — | |
Total Return Bond HLS Fund | | | 0.52 | % | | | 0.77 | % | | | — | |
Ultrashort Bond HLS Fund | | | 0.45 | % | | | 0.70 | % | | | — | |
U.S. Government Securities HLS Fund | | | 0.51 | % | | | 0.76 | % | | | — | |
Value HLS Fund | | | 0.80 | % | | | 1.05 | % | | | — | |
| | e) | Distribution Plans for Class IB and Class IC Shares – Hartford Funds Distributors, LLC (“HFD”), an indirect subsidiary of The Hartford, is the principal underwriter and distributor of each Fund. Each Company, on behalf of its respective Funds, has adopted a Distribution Plan pursuant to Rule 12b-1 of the 1940 Act for Class IB shares and each Company, on behalf of certain Funds, has adopted a Distribution Plan pursuant to Rule 12b-1 of the 1940 Act for Class IC shares. |
Pursuant to the Class IB Distribution Plans, a Fund may pay HFD a fee of up to 0.25% of the average daily net assets of the Fund attributable to its Class IB shares for distribution financing activities and shareholder account servicing activities. The entire amount of the fee may be used for shareholder servicing expenses and/or distribution expenses. Pursuant to the Class IC Distribution Plans, a Fund may pay HFD a fee of up to 0.25% of the average daily net assets of the Fund attributable to its Class IC shares for distribution financing activities.
Each Board has the authority to suspend or reduce these payments at any point in time. The distribution fees paid during the period can be found on the Statements of Operations. Each Fund’s 12b-1 fees are accrued daily and paid monthly or at such other intervals as the respective Company’s Board of Directors may determine.
| | f) | Administrative Services Fee for Class IC Shares – Certain Funds may pay an administrative services fee to third party insurance companies annually up to 0.25% of the average daily net assets of the Fund attributable to its Class IC shares for recordkeeping and/or other administrative services provided to such Class IC shares. The total administrative services fees paid during the period are shown on the Statements of Operations. These fees are accrued daily and paid monthly. |
| | g) | Other Related Party Transactions – Certain officers of each Company are directors and/or officers of HFMC and/or The Hartford or its subsidiaries. For the year ended December 31, 2016, a portion of each Company’s Chief Compliance Officer’s (“CCO”) compensation |
Notes to Financial Statements – (continued)
December 31, 2016
| | was paid by all of the investment companies in the Hartford fund complex. The portion allocated to each Fund, as represented in other expenses on the Statement of Operations, is outlined in the table below. |
| | | | |
Fund | | CCO Compensation
Paid by Fund | |
Hartford Balanced HLS Fund | | $ | 5,844 | |
Hartford Capital Appreciation HLS Fund | | | 13,845 | |
Hartford Disciplined Equity HLS Fund | | | 1,674 | |
Hartford Dividend & Growth HLS Fund | | | 7,986 | |
Hartford Global Growth HLS Fund | | | 1,071 | |
Hartford Growth Opportunities HLS Fund | | | 3,191 | |
Hartford Healthcare HLS Fund | | | 827 | |
Hartford High Yield HLS Fund | | | 798 | |
Hartford International Opportunities HLS Fund | | | 3,035 | |
Hartford MidCap HLS Fund | | | 4,190 | |
Hartford MidCap Value HLS Fund | | | 883 | |
Hartford Small Cap Growth HLS Fund | | | 2,677 | |
Hartford Small Company HLS Fund | | | 2,478 | |
Hartford Small/Mid Cap Equity HLS Fund | | | 221 | |
Hartford Stock HLS Fund | | | 3,645 | |
Hartford Total Return Bond HLS Fund | | | 6,401 | |
Hartford Ultrashort Bond HLS Fund | | | 1,596 | |
Hartford US Government Securities HLS Fund | | | 1,205 | |
Hartford Value HLS Fund | | | 1,248 | |
Hartford Administrative Services Company (“HASCO”), an indirect subsidiary of The Hartford, provides transfer agent services to each Fund. Pursuant to a sub-transfer agency agreement between HASCO and Boston Financial Data Services, Inc. (“BFDS”), HASCO has delegated certain transfer agent, dividend disbursing agent and shareholder servicing agent functions to BFDS. The costs and expenses of such delegation are borne by HASCO, not by the Funds. Each Fund pays HASCO a fixed fee annually, plus out of pocket expenses for providing such services. The amount paid to HASCO can be found in the Statements of Operations. These fees are accrued daily and paid monthly.
For the year ended December 31, 2016, the rate of compensation paid to HASCO for transfer agency services as a percentage of each Fund’s average daily net assets is as follows:
| | | | |
Fund | | Percent of
Average Daily
Net Assets | |
Balanced HLS Fund | | | 0.00 | % |
Capital Appreciation HLS Fund | | | 0.00 | % |
Disciplined Equity HLS Fund | | | 0.00 | % |
Dividend and Growth HLS Fund | | | 0.00 | % |
Global Growth HLS Fund | | | 0.00 | % |
Growth Opportunities HLS Fund | | | 0.00 | % |
Healthcare HLS Fund | | | 0.00 | % |
High Yield HLS Fund | | | 0.00 | % |
International Opportunities HLS Fund | | | 0.00 | % |
MidCap HLS Fund | | | 0.00 | % |
MidCap Value HLS Fund | | | 0.00 | % |
Small Cap Growth HLS Fund | | | 0.00 | % |
Small Company HLS Fund | | | 0.00 | % |
Small/Mid Cap Equity HLS Fund | | | 0.01 | % |
Stock HLS Fund | | | 0.00 | % |
Total Return Bond HLS Fund | | | 0.00 | % |
Ultrashort Bond HLS Fund | | | 0.00 | % |
U.S. Government Securities HLS Fund | | | 0.00 | % |
Value HLS Fund | | | 0.00 | % |
Notes to Financial Statements – (continued)
December 31, 2016
As of December 31, 2016, affiliates of The Hartford had ownership of shares in each Fund as follows:
Percentage of a Class:
| | | | | | | | | | | | |
Fund | | Class IA | | | Class IB | | | Class IC | |
Balanced HLS Fund | | | — | | | | — | | | | — | |
Capital Appreciation HLS Fund | | | — | | | | — | | | | — | %* |
Disciplined Equity HLS Fund | | | — | | | | — | | | | — | |
Dividend and Growth HLS Fund | | | — | | | | — | | | | — | |
Global Growth HLS Fund | | | — | | | | — | | | | — | |
Growth Opportunities HLS Fund | | | — | | | | — | | | | — | %* |
Healthcare HLS Fund | | | — | | | | — | | | | — | |
High Yield HLS Fund | | | — | | | | — | | | | — | |
International Opportunities HLS Fund | | | — | | | | — | | | | — | |
MidCap HLS Fund | | | — | | | | — | | | | — | |
MidCap Value HLS Fund | | | — | | | | — | | | | — | |
Small Cap Growth HLS Fund | | | — | | | | — | | | | — | |
Small Company HLS Fund | | | — | | | | — | | | | — | |
Small/Mid Cap Equity HLS Fund | | | — | | | | — | | | | — | |
Stock HLS Fund | | | — | | | | — | | | | — | |
Total Return Bond HLS Fund | | | — | | | | — | | | | — | |
Ultrashort Bond HLS Fund | | | — | | | | — | | | | — | |
U.S. Government Securities HLS Fund | | | — | | | | — | | | | — | |
Value HLS Fund | | | — | | | | — | | | | — | |
Percentage of Fund by Class:
| | | | | | | | | | | | |
Fund | | Class IA | | | Class IB | | | Class IC | |
Balanced HLS Fund | | | — | | | | — | | | | — | |
Capital Appreciation HLS Fund | | | — | | | | — | | | | — | %* |
Disciplined Equity HLS Fund | | | — | | | | — | | | | — | |
Dividend and Growth HLS Fund | | | — | | | | — | | | | — | |
Global Growth HLS Fund | | | — | | | | — | | | | — | |
Growth Opportunities HLS Fund | | | — | | | | — | | | | — | %* |
Healthcare HLS Fund | | | — | | | | — | | | | — | |
High Yield HLS Fund | | | — | | | | — | | | | — | |
International Opportunities HLS Fund | | | — | | | | — | | | | — | |
MidCap HLS Fund | | | — | | | | — | | | | — | |
MidCap Value HLS Fund | | | — | | | | — | | | | — | |
Small Cap Growth HLS Fund | | | — | | | | — | | | | — | |
Small Company HLS Fund | | | — | | | | — | | | | — | |
Small/Mid Cap Equity HLS Fund | | | — | | | | — | | | | — | |
Stock HLS Fund | | | — | | | | — | | | | — | |
Total Return Bond HLS Fund | | | — | | | | — | | | | — | |
Ultrashort Bond HLS Fund | | | — | | | | — | | | | — | |
U.S. Government Securities HLS Fund | | | — | | | | — | | | | — | |
Value HLS Fund | | | — | | | | — | | | | — | |
| | * | Percentage rounds to zero. |
Notes to Financial Statements – (continued)
December 31, 2016
| 9. | Investment Transactions: |
For the year ended December 31, 2016, the cost of purchases and proceeds from sales of investment securities (excluding short-term investments) were as follows:
| | | | | | | | |
Fund | | Cost of Purchases
Excluding U.S.
Government
Obligations | | | Sales Proceeds
Excluding U.S.
Government
Obligations | |
Balanced HLS Fund | | $ | 456,628,069 | | | $ | 628,465,208 | |
Capital Appreciation HLS Fund | | | 5,761,897,146 | | | | 7,137,942,333 | |
Disciplined Equity HLS Fund | | | 224,623,983 | | | | 310,801,193 | |
Dividend and Growth HLS Fund | | | 649,099,861 | | | | 1,071,883,525 | |
Global Growth HLS Fund | | | 284,840,885 | | | | 346,778,904 | |
Growth Opportunities HLS Fund | | | 1,829,379,769 | | | | 1,893,771,147 | |
Healthcare HLS Fund | | | 121,090,004 | | | | 210,718,874 | |
High Yield HLS Fund | | | 128,164,298 | | | | 153,598,627 | |
International Opportunities HLS Fund | | | 1,159,749,574 | | | | 1,209,370,601 | |
MidCap HLS Fund | | | 562,387,367 | | | | 695,815,869 | |
MidCap Value HLS Fund | | | 138,071,430 | | | | 182,427,264 | |
Small Cap Growth HLS Fund | | | 558,834,109 | | | | 609,903,204 | |
Small Company HLS Fund | | | 939,074,799 | | | | 1,204,148,993 | |
Small/Mid Cap Equity HLS Fund | | | 87,154,461 | | | | 91,220,063 | |
Stock HLS Fund | | | 427,187,588 | | | | 576,415,244 | |
Total Return Bond HLS Fund | | | 907,395,742 | | | | 1,324,535,410 | |
Ultrashort Bond HLS Fund | | | 149,673,458 | | | | 226,183,391 | |
U.S. Government Securities HLS Fund | | | 56,150,012 | | | | 79,488,713 | |
Value HLS Fund | | | 77,395,166 | | | | 130,447,178 | |
| | |
Fund | | Cost of Purchases
For U.S.
Government
Obligations | | | Sales Proceeds
For U.S.
Government
Obligations | |
Balanced HLS Fund | | $ | 139,937,897 | | | $ | 240,650,960 | |
Capital Appreciation HLS Fund | | | — | | | | — | |
Disciplined Equity HLS Fund | | | — | | | | — | |
Dividend and Growth HLS Fund | | | — | | | | — | |
Global Growth HLS Fund | | | — | | | | — | |
Growth Opportunities HLS Fund | | | — | | | | — | |
Healthcare HLS Fund | | | — | | | | — | |
High Yield HLS Fund | | | — | | | | — | |
International Opportunities HLS Fund | | | — | | | | — | |
MidCap HLS Fund | | | — | | | | — | |
MidCap Value HLS Fund | | | — | | | | — | |
Small Cap Growth HLS Fund | | | — | | | | — | |
Small Company HLS Fund | | | — | | | | — | |
Small/Mid Cap Equity HLS Fund | | | — | | | | — | |
Stock HLS Fund | | | — | | | | — | |
Total Return Bond HLS Fund | | | 342,635,373 | | | | 312,584,993 | |
Ultrashort Bond HLS Fund | | | 158,029,839 | | | | 200,565,589 | |
U.S. Government Securities HLS Fund | | | 407,799,276 | | | | 440,277,572 | |
Value HLS Fund | | | — | | | | — | |
Notes to Financial Statements – (continued)
December 31, 2016
| | | | | | | | |
Fund | | Total Cost of
Purchases | | | Total Sales
Proceeds | |
Balanced HLS Fund | | $ | 596,565,966 | | | $ | 869,116,168 | |
Capital Appreciation HLS Fund | | | 5,761,897,146 | | | | 7,137,942,333 | |
Disciplined Equity HLS Fund | | | 224,623,983 | | | | 310,801,193 | |
Dividend and Growth HLS Fund | | | 649,099,861 | | | | 1,071,883,525 | |
Global Growth HLS Fund | | | 284,840,885 | | | | 346,778,904 | |
Growth Opportunities HLS Fund | | | 1,829,379,769 | | | | 1,893,771,147 | |
Healthcare HLS Fund | | | 121,090,004 | | | | 210,718,874 | |
High Yield HLS Fund | | | 128,164,298 | | | | 153,598,627 | |
International Opportunities HLS Fund | | | 1,159,749,574 | | | | 1,209,370,601 | |
MidCap HLS Fund | | | 562,387,367 | | | | 695,815,869 | |
MidCap Value HLS Fund | | | 138,071,430 | | | | 182,427,264 | |
Small Cap Growth HLS Fund | | | 558,834,109 | | | | 609,903,204 | |
Small Company HLS Fund | | | 939,074,799 | | | | 1,204,148,993 | |
Small/Mid Cap Equity HLS Fund | | | 87,154,461 | | | | 91,220,063 | |
Stock HLS Fund | | | 427,187,588 | | | | 576,415,244 | |
Total Return Bond HLS Fund | | | 1,250,031,115 | | | | 1,637,120,403 | |
Ultrashort Bond HLS Fund | | | 307,703,297 | | | | 426,748,980 | |
U.S. Government Securities HLS Fund | | | 463,949,288 | | | | 519,766,285 | |
Value HLS Fund | | | 77,395,166 | | | | 130,447,178 | |
| 10. | Capital Share Transactions: |
The following information is for the year ended December 31, 2016, and the year ended December 31, 2015:
| | | | | | | | | | | | | | | | |
|
Balanced HLS Fund | |
| | | For the Year Ended
December 31, 2016 | | | For the Year Ended
December 31, 2015 | |
| | | Shares | | | Amount | | | Shares | | | Amount | |
Class IA | | | | | | | | | | | | | | | | |
Shares Sold | | | 432,134 | | | $ | 11,762,594 | | | | 469,371 | | | $ | 12,840,849 | |
Shares Issued for Reinvested Dividends | | | 2,066,809 | | | | 57,374,388 | | | | 1,613,469 | | | | 43,115,909 | |
Shares Redeemed | | | (11,127,409 | ) | | | (301,710,149 | ) | | | (13,603,501 | ) | | | (371,124,721 | ) |
| | | | | | | | | | | | | | | | |
Net Increase (Decrease) | | | (8,628,466 | ) | | | (232,573,167 | ) | | | (11,520,661 | ) | | | (315,167,963 | ) |
| | | | | | | | | | | | | | | | |
Class IB | | | | | | | | | | | | | | | | |
Shares Sold | | | 183,197 | | | $ | 4,893,695 | | | | 139,993 | | | $ | 3,867,458 | |
Shares Issued for Reinvested Dividends | | | 247,482 | | | | 6,967,476 | | | | 184,225 | | | | 4,997,202 | |
Shares Redeemed | | | (1,673,760 | ) | | | (46,010,455 | ) | | | (2,369,687 | ) | | | (65,344,297 | ) |
| | | | | | | | | | | | | | | | |
Net Increase (Decrease) | | | (1,243,081 | ) | | | (34,149,284 | ) | | | (2,045,469 | ) | | | (56,479,637 | ) |
| | | | | | | | | | | | | | | | |
Total Net Increase (Decrease) | | | (9,871,547 | ) | | $ | (266,722,451 | ) | | | (13,566,130 | ) | | $ | (371,647,600 | ) |
| | | | | | | | | | | | | | | | |
Notes to Financial Statements – (continued)
December 31, 2016
| | | | | | | | | | | | | | | | |
| | | | |
Capital Appreciation HLS Fund | | | | | | | | | | | | | | | | |
| | | For the Year Ended
December 31, 2016 | | | For the Year Ended
December 31, 2015 | |
| | | Shares | | | Amount | | | Shares | | | Amount | |
Class IA | | | | | | | | | | | | | | | | |
Shares Sold | | | 1,890,996 | | | $ | 80,924,245 | | | | 3,266,797 | | | $ | 165,572,633 | |
Shares Issued for Reinvested Dividends | | | 12,769,224 | | | | 530,174,730 | | | | 26,063,902 | | | | 1,196,703,908 | |
Shares Redeemed | | | (34,600,429 | ) | | | (1,476,715,307 | ) | | | (19,316,788 | ) | | | (1,015,737,819 | ) |
| | | | | | | | | | | | | | | | |
Net Increase (Decrease) | | | (19,940,209 | ) | | | (865,616,332 | ) | | | 10,013,911 | | | | 346,538,722 | |
| | | | | | | | | | | | | | | | |
Class IB | | | | | | | | | | | | | | | | |
Shares Sold | | | 115,545 | | | $ | 4,798,062 | | | | 172,518 | | | $ | 8,688,942 | |
Shares Issued for Reinvested Dividends | | | 1,471,280 | | | | 60,184,340 | | | | 3,043,632 | | | | 137,948,750 | |
Shares Redeemed | | | (2,744,732 | ) | | | (115,383,323 | ) | | | (2,715,739 | ) | | | (139,784,790 | ) |
| | | | | | | | | | | | | | | | |
Net Increase (Decrease) | | | (1,157,907 | ) | | | (50,400,921 | ) | | | 500,411 | | | | 6,852,902 | |
| | | | | | | | | | | | | | | | |
Class IC | | | | | | | | | | | | | | | | |
Shares Sold | | | 155,349 | | | $ | 6,572,808 | | | | 284,973 | | | $ | 14,624,663 | |
Shares Issued for Reinvested Dividends | | | 50,492 | | | | 2,075,655 | | | | 53,375 | | | | 2,435,033 | |
Shares Redeemed | | | (55,844 | ) | | | (2,347,703 | ) | | | (34,820 | ) | | | (1,661,177 | ) |
| | | | | | | | | | | | | | | | |
Net Increase (Decrease) | | | 149,997 | | | | 6,300,760 | | | | 303,528 | | | | 15,398,519 | |
| | | | | | | | | | | | | | | | |
Total Net Increase (Decrease) | | | (20,948,119 | ) | | $ | (909,716,493 | ) | | | 10,817,850 | | | $ | 368,790,143 | |
| | | | | | | | | | | | | | | | |
| | | | |
Disciplined Equity HLS Fund | | | | | | | | | | | | | | | | |
| | | For the Year Ended
December 31, 2016 | | | For the Year Ended
December 31, 2015 | |
| | | Shares | | | Amount | | | Shares | | | Amount | |
Class IA | | | | | | | | | | | | | | | | |
Shares Sold | | | 1,162,708 | | | $ | 17,069,443 | | | | 589,196 | | | $ | 10,439,373 | |
Shares Issued for Reinvested Dividends | | | 5,685,375 | | | | 81,089,435 | | | | 13,406,784 | | | | 213,986,540 | |
Shares Redeemed | | | (7,445,491 | ) | | | (111,694,506 | ) | | | (7,325,609 | ) | | | (141,925,976 | ) |
| | | | | | | | | | | | | | | | |
Net Increase (Decrease) | | | (597,408 | ) | | | (13,535,628 | ) | | | 6,670,371 | | | | 82,499,937 | |
| | | | | | | | | | | | | | | | |
Class IB | | | | | | | | | | | | | | | | |
Shares Sold | | | 244,068 | | | $ | 3,630,073 | | | | 168,976 | | | $ | 2,946,000 | |
Shares Issued for Reinvested Dividends | | | 798,826 | | | | 11,270,736 | | | | 1,914,322 | | | | 30,274,969 | |
Shares Redeemed | | | (1,248,004 | ) | | | (18,586,945 | ) | | | (1,292,932 | ) | | | (25,084,582 | ) |
| | | | | | | | | | | | | | | | |
Net Increase (Decrease) | | | (205,110 | ) | | | (3,686,136 | ) | | | 790,366 | | | | 8,136,387 | |
| | | | | | | | | | | | | | | | |
Total Net Increase (Decrease) | | | (802,518 | ) | | $ | (17,221,764 | ) | | | 7,460,737 | | | $ | 90,636,324 | |
| | | | | | | | | | | | | | | | |
Notes to Financial Statements – (continued)
December 31, 2016
| | | | | | | | | | | | | | | | |
| | | | |
Dividend and Growth HLS Fund | | | | | | | | | | | | | | | | |
| | | For the Year Ended
December 31, 2016 | | | For the Year Ended
December 31, 2015 | |
| | | Shares | | | Amount | | | Shares | | | Amount | |
Class IA | | | | | | | | | | | | | | | | |
Shares Sold | | | 5,495,742 | | | $ | 123,287,564 | | | | 2,257,878 | | | $ | 56,525,716 | |
Shares Issued for Reinvested Dividends | | | 17,932,886 | | | | 380,223,306 | | | | 21,995,067 | | | | 503,458,112 | |
Shares Redeemed | | | (22,492,815 | ) | | | (495,062,146 | ) | | | (21,218,821 | ) | | | (531,488,308 | ) |
| | | | | | | | | | | | | | | | |
Net Increase (Decrease) | | | 935,813 | | | | 8,448,724 | | | | 3,034,124 | | | | 28,495,520 | |
| | | | | | | | | | | | | | | | |
Class IB | | | | | | | | | | | | | | | | |
Shares Sold | | | 499,749 | | | $ | 10,925,264 | | | | 395,051 | | | $ | 9,477,984 | |
Shares Issued for Reinvested Dividends | | | 2,654,218 | | | | 55,923,091 | | | | 3,302,608 | | | | 75,299,375 | |
Shares Redeemed | | | (3,669,262 | ) | | | (80,212,091 | ) | | | (3,972,074 | ) | | | (99,357,475 | ) |
| | | | | | | | | | | | | | | | |
Net Increase (Decrease) | | | (515,295 | ) | | | (13,363,736 | ) | | | (274,415 | ) | | | (14,580,116 | ) |
| | | | | | | | | | | | | | | | |
Total Net Increase (Decrease) | | | 420,518 | | | $ | (4,915,012 | ) | | | 2,759,709 | | | $ | 13,915,404 | |
| | | | | | | | | | | | | | | | |
| | | | |
Global Growth HLS Fund | | | | | | | | | | | | | | | | |
| | | For the Year Ended
December 31, 2016 | | | For the Year Ended
December 31, 2015 | |
| | | Shares | | | Amount | | | Shares | | | Amount | |
Class IA | | | | | | | | | | | | | | | | |
Shares Sold | | | 543,460 | | | $ | 12,675,555 | | | | 935,076 | | | $ | 23,257,954 | |
Shares Issued for Reinvested Dividends | | | 1,805,742 | | | | 40,737,536 | | | | 802,612 | | | | 19,872,670 | |
Shares Redeemed | | | (2,745,818 | ) | | | (63,750,555 | ) | | | (2,017,988 | ) | | | (49,833,729 | ) |
| | | | | | | | | | | | | | | | |
Net Increase (Decrease) | | | (396,616 | ) | | | (10,337,464 | ) | | | (280,300 | ) | | | (6,703,105 | ) |
| | | | | | | | | | | | | | | | |
Class IB | | | | | | | | | | | | | | | | |
Shares Sold | | | 181,152 | | | $ | 4,134,958 | | | | 272,638 | | | $ | 6,866,485 | |
Shares Issued for Reinvested Dividends | | | 384,926 | | | | 8,614,648 | | | | 179,743 | | | | 4,418,091 | |
Shares Redeemed | | | (848,234 | ) | | | (19,479,718 | ) | | | (812,324 | ) | | | (19,908,755 | ) |
| | | | | | | | | | | | | | | | |
Net Increase (Decrease) | | | (282,156 | ) | | | (6,730,112 | ) | | | (359,943 | ) | | | (8,624,179 | ) |
| | | | | | | | | | | | | | | | |
Total Net Increase (Decrease) | | | (678,772 | ) | | $ | (17,067,576 | ) | | | (640,243 | ) | | $ | (15,327,284 | ) |
| | | | | | | | | | | | | | | | |
Notes to Financial Statements – (continued)
December 31, 2016
| | | | | | | | | | | | | | | | |
| | | | |
Growth Opportunities HLS Fund | | | | | | | | | | | | | | | | |
| | | For the Year Ended
December 31, 2016 | | | For the Year Ended
December 31, 2015 | |
| | | Shares | | | Amount | | | Shares | | | Amount | |
Class IA | | | | | | | | | | | | | | | | |
Shares Sold | | | 4,317,826 | | | $ | 143,218,022 | | | | 1,044,247 | | | $ | 39,449,289 | |
Shares Issued for Reinvested Dividends | | | 5,633,211 | | | | 174,516,879 | | | | 7,007,351 | | | | 247,639,819 | |
Shares Redeemed | | | (5,899,305 | ) | | | (190,123,880 | ) | | | (4,659,838 | ) | | | (181,701,168 | ) |
| | | | | | | | | | | | | | | | |
Net Increase (Decrease) | | | 4,051,732 | | | | 127,611,021 | | | | 3,391,760 | | | | 105,387,940 | |
| | | | | | | | | | | | | | | | |
Class IB | | | | | | | | | | | | | | | | |
Shares Sold | | | 288,529 | | | $ | 9,169,198 | | | | 405,871 | | | $ | 15,372,728 | |
Shares Issued for Reinvested Dividends | | | 686,184 | | | | 20,503,187 | | | | 979,058 | | | | 33,542,514 | |
Shares Redeemed | | | (1,066,677 | ) | | | (33,338,544 | ) | | | (914,513 | ) | | | (34,771,551 | ) |
| | | | | | | | | | | | | | | | |
Net Increase (Decrease) | | | (91,964 | ) | | | (3,666,159 | ) | | | 470,416 | | | | 14,143,691 | |
| | | | | | | | | | | | | | | | |
Class IC | | | | | | | | | | | | | | | | |
Shares Sold | | | 254,301 | | | $ | 8,077,525 | | | | 499,835 | | | $ | 18,859,811 | |
Shares Issued for Reinvested Dividends | | | 119,944 | | | | 3,672,657 | | | | 64,843 | | | | 2,276,630 | |
Shares Redeemed | | | (99,012 | ) | | | (3,177,329 | ) | | | (16,081 | ) | | | (608,691 | ) |
| | | | | | | | | | | | | | | | |
Net Increase (Decrease) | | | 275,233 | | | | 8,572,853 | | | | 548,597 | | | | 20,527,750 | |
| | | | | | | | | | | | | | | | |
Total Net Increase (Decrease) | | | 4,235,001 | | | $ | 132,517,715 | | | | 4,410,773 | | | $ | 140,059,381 | |
| | | | | | | | | | | | | | | | |
| | | | |
Healthcare HLS Fund | | | | | | | | | | | | | | | | |
| | | For the Year Ended
December 31, 2016 | | | For the Year Ended
December 31, 2015 | |
| | | Shares | | | Amount | | | Shares | | | Amount | |
Class IA | | | | | | | | | | | | | | | | |
Shares Sold | | | 1,315,220 | | | $ | 34,964,722 | | | | 3,399,145 | | | $ | 109,589,966 | |
Shares Issued for Reinvested Dividends | | | 2,918,070 | | | | 64,430,977 | | | | 1,330,488 | | | | 41,644,271 | |
Shares Redeemed | | | (4,642,420 | ) | | | (118,901,866 | ) | | | (2,879,751 | ) | | | (89,869,052 | ) |
| | | | | | | | | | | | | | | | |
Net Increase (Decrease) | | | (409,130 | ) | | | (19,506,167 | ) | | | 1,849,882 | | | | 61,365,185 | |
| | | | | | | | | | | | | | | | |
Class IB | | | | | | | | | | | | | | | | |
Shares Sold | | | 177,850 | | | $ | 4,516,085 | | | | 256,484 | | | $ | 7,997,496 | |
Shares Issued for Reinvested Dividends | | | 552,534 | | | | 11,719,246 | | | | 255,965 | | | | 7,763,435 | |
Shares Redeemed | | | (720,634 | ) | | | (17,478,196 | ) | | | (445,685 | ) | | | (13,476,919 | ) |
| | | | | | | | | | | | | | | | |
Net Increase (Decrease) | | | 9,750 | | | | (1,242,865 | ) | | | 66,764 | | | | 2,284,012 | |
| | | | | | | | | | | | | | | | |
Total Net Increase (Decrease) | | | (399,380 | ) | | $ | (20,749,032 | ) | | | 1,916,646 | | | $ | 63,649,197 | |
| | | | | | | | | | | | | | | | |
Notes to Financial Statements – (continued)
December 31, 2016
| | | | | | | | | | | | | | | | |
| | | | |
High Yield HLS Fund | | | | | | | | | | | | | | | | |
| | | For the Year Ended
December 31, 2016 | | | For the Year Ended
December 31, 2015 | |
| | | Shares | | | Amount | | | Shares | | | Amount | |
Class IA | | | | | | | | | | | | | | | | |
Shares Sold | | | 2,932,807 | | | $ | 23,188,946 | | | | 2,617,181 | | | $ | 21,697,811 | |
Shares Issued for Reinvested Dividends | | | 1,967,008 | | | | 15,598,376 | | | | 2,396,567 | | | | 18,980,813 | |
Shares Redeemed | | | (8,071,995 | ) | | | (63,756,161 | ) | | | (9,818,209 | ) | | | (81,320,965 | ) |
| | | | | | | | | | | | | | | | |
Net Increase (Decrease) | | | (3,172,180 | ) | | | (24,968,839 | ) | | | (4,804,461 | ) | | | (40,642,341 | ) |
| | | | | | | | | | | | | | | | |
Class IB | | | | | | | | | | | | | | | | |
Shares Sold | | | 922,611 | | | $ | 7,179,450 | | | | 607,578 | | | $ | 4,903,841 | |
Shares Issued for Reinvested Dividends | | | 585,759 | | | | 4,574,775 | | | | 760,729 | | | | 5,933,685 | |
Shares Redeemed | | | (2,149,503 | ) | | | (16,659,640 | ) | | | (3,703,573 | ) | | | (29,754,673 | ) |
| | | | | | | | | | | | | | | | |
Net Increase (Decrease) | | | (641,133 | ) | | | (4,905,415 | ) | | | (2,335,266 | ) | | | (18,917,147 | ) |
| | | | | | | | | | | | | | | | |
Total Net Increase (Decrease) | | | (3,813,313 | ) | | $ | (29,874,254 | ) | | | (7,139,727 | ) | | $ | (59,559,488 | ) |
| | | | | | | | | | | | | | | | |
| | | | |
International Opportunities HLS Fund | | | | | | | | | | | | | | | | |
| | | For the Year Ended
December 31, 2016 | | | For the Year Ended
December 31, 2015 | |
| | | Shares | | | Amount | | | Shares | | | Amount | |
Class IA | | | | | | | | | | | | | | | | |
Shares Sold | | | 7,789,062 | | | $ | 108,119,671 | | | | 4,351,758 | | | $ | 63,756,544 | |
Shares Issued for Reinvested Dividends | | | 1,261,253 | | | | 17,922,412 | | | | 1,200,778 | | | | 17,879,578 | |
Shares Redeemed | | | (12,946,295 | ) | | | (179,842,398 | ) | | | (12,532,632 | ) | | | (184,629,876 | ) |
| | | | | | | | | | | | | | | | |
Net Increase (Decrease) | | | (3,895,980 | ) | | | (53,800,315 | ) | | | (6,980,096 | ) | | | (102,993,754 | ) |
| | | | | | | | | | | | | | | | |
Class IB | | | | | | | | | | | | | | | | |
Shares Sold | | | 744,796 | | | $ | 10,264,574 | | | | 1,065,275 | | | $ | 16,100,444 | |
Shares Issued for Reinvested Dividends | | | 139,856 | | | | 2,012,534 | | | | 144,330 | | | | 2,176,492 | |
Shares Redeemed | | | (2,536,882 | ) | | | (35,348,893 | ) | | | (2,491,080 | ) | | | (37,270,704 | ) |
| | | | | | | | | | | | | | | | |
Net Increase (Decrease) | | | (1,652,230 | ) | | | (23,071,785 | ) | | �� | (1,281,475 | ) | | | (18,993,768 | ) |
| | | | | | | | | | | | | | | | |
Total Net Increase (Decrease) | | | (5,548,210 | ) | | $ | (76,872,100 | ) | | | (8,261,571 | ) | | $ | (121,987,522 | ) |
| | | | | | | | | | | | | | | | |
| | | | |
MidCap HLS Fund | | | | | | | | | | | | | | | | |
| | | For the Year Ended
December 31, 2016 | | | For the Year Ended
December 31, 2015 | |
| | | Shares | | | Amount | | | Shares | | | Amount | |
Class IA | | | | | | | | | | | | | | | | |
Shares Sold | | | 4,162,036 | | | $ | 140,508,393 | | | | 6,120,970 | | | $ | 232,038,567 | |
Shares Issued for Reinvested Dividends | | | 5,366,836 | | | | 173,178,978 | | | | 5,541,888 | | | | 198,571,970 | |
Shares Redeemed | | | (7,604,846 | ) | | | (252,673,800 | ) | | | (7,486,621 | ) | | | (279,695,610 | ) |
| | | | | | | | | | | | | | | | |
Net Increase (Decrease) | | | 1,924,026 | | | | 61,013,571 | | | | 4,176,237 | | | | 150,914,927 | |
| | | | | | | | | | | | | | | | |
Class IB | | | | | | | | | | | | | | | | |
Shares Sold | | | 208,879 | | | $ | 6,848,448 | | | | 1,472,929 | | | $ | 55,008,904 | |
Shares Issued for Reinvested Dividends | | | 305,433 | | | | 9,648,632 | | | | 362,679 | | | | 12,792,105 | |
Shares Redeemed | | | (846,524 | ) | | | (27,738,828 | ) | | | (951,307 | ) | | | (36,505,511 | ) |
| | | | | | | | | | | | | | | | |
Net Increase (Decrease) | | | (332,212 | ) | | | (11,241,748 | ) | | | 884,301 | | | | 31,295,498 | |
| | | | | | | | | | | | | | | | |
Total Net Increase (Decrease) | | | 1,591,814 | | | $ | 49,771,823 | | | | 5,060,538 | | | $ | 182,210,425 | |
| | | | | | | | | | | | | | | | |
Notes to Financial Statements – (continued)
December 31, 2016
| | | | | | | | | | | | | | | | |
| | | | |
MidCap Value HLS Fund | | | | | | | | | | | | | | | | |
| | | For the Year Ended
December 31, 2016 | | | For the Year Ended
December 31, 2015 | |
| | | Shares | | | Amount | | | Shares | | | Amount | |
Class IA | | | | | | | | | | | | | | | | |
Shares Sold | | | 389,348 | | | $ | 4,658,326 | | | | 449,172 | | | $ | 6,170,492 | |
Shares Issued for Reinvested Dividends | | | 3,439,721 | | | | 38,903,246 | | | | 3,572,628 | | | | 46,086,897 | |
Shares Redeemed | | | (3,280,710 | ) | | | (39,074,053 | ) | | | (4,047,882 | ) | | | (58,318,837) | |
| | | | | | | | | | | | | | | | |
Net Increase (Decrease) | | | 548,359 | | | | 4,487,519 | | | | (26,082 | ) | | | (6,061,448 | ) |
| | | | | | | | | | | | | | | | |
Class IB | | | | | | | | | | | | | | | | |
Shares Sold | | | 185,352 | | | $ | 2,186,176 | | | | 153,855 | | | $ | 2,252,753 | |
Shares Issued for Reinvested Dividends | | | 1,064,482 | | | | 11,964,774 | | | | 1,163,263 | | | | 14,913,036 | |
Shares Redeemed | | | (1,207,760 | ) | | | (14,245,410 | ) | | | (1,467,107 | ) | | | (20,389,208 | ) |
| | | | | | | | | | | | | | | | |
Net Increase (Decrease) | | | 42,074 | | | | (94,460 | ) | | | (149,989 | ) | | | (3,223,419 | ) |
| | | | | | | | | | | | | | | | |
Total Net Increase (Decrease) | | | 590,433 | | | $ | 4,393,059 | | | | (176,071 | ) | | $ | (9,284,867 | ) |
| | | | | | | | | | | | | | | | |
| | | | |
Small Cap Growth HLS Fund | | | | | | | | | | | | | | | | |
| | | For the Year Ended
December 31, 2016 | | | For the Year Ended
December 31, 2015 | |
| | | Shares | | | Amount | | | Shares | | | Amount | |
Class IA | | | | | | | | | | | | | | | | |
Shares Sold | | | 6,146,285 | | | $ | 150,379,245 | | | | 19,697,951 | | | $ | 535,691,497 | |
Shares Issued for Reinvested Dividends | | | 1,433,174 | | | | 36,230,638 | | | | 2,817,860 | | | | 75,293,233 | |
Shares Redeemed | | | (7,881,231 | ) | | | (192,825,988 | ) | | | (5,815,577 | ) | | | (162,067,889 | ) |
| | | | | | | | | | | | | | | | |
Net Increase (Decrease) | | | (301,772 | ) | | | (6,216,105 | ) | | | 16,700,234 | | | | 448,916,841 | |
| | | | | | | | | | | | | | | | |
Class IB | | | | | | | | | | | | | | | | |
Shares Sold | | | 1,573,648 | | | $ | 37,425,555 | | | | 4,994,251 | | | $ | 145,842,507 | |
Shares Issued for Reinvested Dividends | | | 388,274 | | | | 9,586,481 | | | | 906,232 | | | | 23,707,028 | |
Shares Redeemed | | | (1,899,579 | ) | | | (45,456,649 | ) | | | (1,488,312 | ) | | | (39,637,029 | ) |
| | | | | | | | | | | | | | | | |
Net Increase (Decrease) | | | 62,343 | | | | 1,555,387 | | | | 4,412,171 | | | | 129,912,506 | |
| | | | | | | | | | | | | | | | |
Total Net Increase (Decrease) | | | (239,429 | ) | | $ | (4,660,718 | ) | | | 21,112,405 | | | $ | 578,829,347 | |
| | | | | | | | | | | | | | | | |
| | | | |
Small Company HLS Fund | | | | | | | | | | | | | | | | |
| | | For the Year Ended
December 31, 2016 | | | For the Year Ended
December 31, 2015 | |
| | | Shares | | | Amount | | | Shares | | | Amount | |
Class IA | | | | | | | | | | | | | | | | |
Shares Sold | | | 4,320,930 | | | $ | 69,407,503 | | | | 6,717,473 | | | $ | 150,841,613 | |
Shares Issued for Reinvested Dividends | | | 5,503,709 | | | | 87,123,722 | | | | 11,998,775 | | | | 235,415,969 | |
Shares Redeemed | | | (22,041,377 | ) | | | (349,251,002 | ) | | | (9,745,990 | ) | | | (209,512,224 | ) |
| | | | | | | | | | | | | | | | |
Net Increase (Decrease) | | | (12,216,738 | ) | | | (192,719,777 | ) | | | 8,970,258 | | | | 176,745,358 | |
| | | | | | | | | | | | | | | | |
Class IB | | | | | | | | | | | | | | | | |
Shares Sold | | | 955,330 | | | $ | 14,441,775 | | | | 737,248 | | | $ | 15,492,511 | |
Shares Issued for Reinvested Dividends | | | 615,478 | | | | 9,078,306 | | | | 1,196,244 | | | | 22,082,672 | |
Shares Redeemed | | | (2,695,510 | ) | | | (40,659,316 | ) | | | (1,518,245 | ) | | | (32,011,866 | ) |
| | | | | | | | | | | | | | | | |
Net Increase (Decrease) | | | (1,124,702 | ) | | | (17,139,235 | ) | | | 415,247 | | | | 5,563,317 | |
| | | | | | | | | | | | | | | | |
Total Net Increase (Decrease) | | | (13,341,440 | ) | | $ | (209,859,012 | ) | | | 9,385,505 | | | $ | 182,308,675 | |
| | | | | | | | | | | | | | | | |
Notes to Financial Statements – (continued)
December 31, 2016
| | | | | | | | | | | | | | | | |
| | | | |
Small/Mid Cap Equity HLS Fund | | | | | | | | | | | | | | | | |
| | | For the Year Ended
December 31, 2016 | | | For the Year Ended
December 31, 2015 | |
| | | Shares | | | Amount | | | Shares | | | Amount | |
Class IA | | | | | | | | | | | | | | | | |
Shares Sold | | | 1,366,914 | | | $ | 10,705,912 | | | | 398,575 | | | $ | 3,507,708 | |
Shares Issued for Reinvested Dividends | | | 781,330 | | | | 5,789,652 | | | | 1,968,095 | | | | 15,705,402 | |
Shares Redeemed | | | (1,886,188 | ) | | | (13,863,228 | ) | | | (2,061,224 | ) | | | (18,373,275 | ) |
| | | | | | | | | | | | | | | | |
Net Increase (Decrease) | | | 262,056 | | | | 2,632,336 | | | | 305,446 | | | | 839,835 | |
| | | | | | | | | | | | | | | | |
Class IB | | | | | | | | | | | | | | | | |
Shares Sold | | | 424,789 | | | $ | 3,209,670 | | | | 149,538 | | | $ | 1,423,572 | |
Shares Issued for Reinvested Dividends | | | 147,003 | | | | 1,083,417 | | | | 431,104 | | | | 3,422,965 | |
Shares Redeemed | | | (658,111 | ) | | | (4,818,908 | ) | | | (818,827 | ) | | | (7,315,334 | ) |
| | | | | | | | | | | | | | | | |
Net Increase (Decrease) | | | (86,319 | ) | | | (525,821 | ) | | | (238,185 | ) | | | (2,468,797 | ) |
| | | | | | | | | | | | | | | | |
Total Net Increase (Decrease) | | | 175,737 | | | $ | 2,106,515 | | | | 67,261 | | | $ | (1,628,962 | ) |
| | | | | | | | | | | | | | | | |
| | | | |
Stock HLS Fund | | | | | | | | | | | | | | | | |
| | | For the Year Ended
December 31, 2016 | | | For the Year Ended
December 31, 2015 | |
| | | Shares | | | Amount | | | Shares | | | Amount | |
Class IA | | | | | | | | | | | | | | | | |
Shares Sold | | | 199,184 | | | $ | 13,343,315 | | | | 107,875 | | | $ | 6,926,566 | |
Shares Issued for Reinvested Dividends | | | 356,943 | | | | 24,394,377 | | | | 395,269 | | | | 25,254,549 | |
Shares Redeemed | | | (2,794,292 | ) | | | (184,659,241 | ) | | | (3,288,501 | ) | | | (210,453,182 | ) |
| | | | | | | | | | | | | | | | |
Net Increase (Decrease) | | | (2,238,165 | ) | | | (146,921,549 | ) | | | (2,785,357 | ) | | | (178,272,067 | ) |
| | | | | | | | | | | | | | | | |
Class IB | | | | | | | | | | | | | | | | |
Shares Sold | | | 59,518 | | | $ | 3,936,449 | | | | 38,756 | | | $ | 2,475,585 | |
Shares Issued for Reinvested Dividends | | | 32,802 | | | | 2,241,103 | | | | 38,043 | | | | 2,429,965 | |
Shares Redeemed | | | (446,429 | ) | | | (29,469,033 | ) | | | (514,770 | ) | | | (32,875,813 | ) |
| | | | | | | | | | | | | | | | |
Net Increase (Decrease) | | | (354,109 | ) | | | (23,291,481 | ) | | | (437,971 | ) | | | (27,970,263 | ) |
| | | | | | | | | | | | | | | | |
Total Net Increase (Decrease) | | | (2,592,274 | ) | | $ | (170,213,030 | ) | | | (3,223,328 | ) | | $ | (206,242,330 | ) |
| | | | | | | | | | | | | | | | |
| | | | |
Total Return Bond HLS Fund | | | | | | | | | | | | | | | | |
| | | For the Year Ended
December 31, 2016 | | | For the Year Ended
December 31, 2015 | |
| | | Shares | | | Amount | | | Shares | | | Amount | |
Class IA | | | | | | | | | | | | | | | | |
Shares Sold | | | 8,946,264 | | | $ | 100,688,213 | | | | 10,155,250 | | | $ | 116,189,984 | |
Shares Issued for Reinvested Dividends | | | 5,995,954 | | | | 67,994,124 | | | | 13,123,731 | | | | 144,492,281 | |
Shares Redeemed | | | (36,538,628 | ) | | | (410,475,319 | ) | | | (46,945,401 | ) | | | (535,205,814 | ) |
| | | | | | | | | | | | | | | | |
Net Increase (Decrease) | | | (21,596,410 | ) | | | (241,792,982 | ) | | | (23,666,420 | ) | | | (274,523,549 | ) |
| | | | | | | | | | | | | | | | |
Class IB | | | | | | | | | | | | | | | | |
Shares Sold | | | 711,513 | | | $ | 7,976,767 | | | | 691,074 | | | $ | 7,919,270 | |
Shares Issued for Reinvested Dividends | | | 663,479 | | | | 7,484,042 | | | | 1,529,910 | | | | 16,767,814 | |
Shares Redeemed | | | (4,748,050 | ) | | | (53,039,383 | ) | | | (6,225,863 | ) | | | (70,699,894 | ) |
| | | | | | | | | | | | | | | | |
Net Increase (Decrease) | | | (3,373,058 | ) | | | (37,578,574 | ) | | | (4,004,879 | ) | | | (46,012,810 | ) |
| | | | | | | | | | | | | | | | |
Total Net Increase (Decrease) | | | (24,969,468 | ) | | $ | (279,371,556 | ) | | | (27,671,299 | ) | | $ | (320,536,359 | ) |
| | | | | | | | | | | | | | | | |
Notes to Financial Statements – (continued)
December 31, 2016
| | | | | | | | | | | | | | | | |
| | | | |
Ultrashort Bond HLS Fund | | | | | | | | | | | | | | | | |
| | | For the Year Ended
December 31, 2016 | | | For the Year Ended
December 31, 2015 | |
| | | Shares | | | Amount | | | Shares | | | Amount | |
Class IA | | | | | | | | | | | | | | | | |
Shares Sold | | | 3,997,140 | | | $ | 40,076,556 | | | | 4,401,670 | | | $ | 44,094,704 | |
Shares Issued for Reinvested Dividends | | | 254,655 | | | | 2,551,645 | | | | 214,454 | | | | 2,144,538 | |
Shares Redeemed | | | (12,302,990 | ) | | | (123,344,159 | ) | | | (17,928,559 | ) | | | (179,615,432 | ) |
| | | | | | | | | | | | | | | | |
Net Increase (Decrease) | | | (8,051,195 | ) | | | (80,715,958 | ) | | | (13,312,435 | ) | | | (133,376,190 | ) |
| | | | | | | | | | | | | | | | |
Class IB | | | | | | | | | | | | | | | | |
Shares Sold | | | 1,092,356 | | | $ | 10,920,951 | | | | 1,221,274 | | | $ | 12,196,809 | |
Shares Issued for Reinvested Dividends | | | 12,039 | | | | 120,504 | | | | 1,036 | | | | 10,342 | |
Shares Redeemed | | | (2,982,859 | ) | | | (29,834,147 | ) | | | (3,633,565 | ) | | | (36,286,423 | ) |
| | | | | | | | | | | | | | | | |
Net Increase (Decrease) | | | (1,878,464 | ) | | | (18,792,692 | ) | | | (2,411,255 | ) | | | (24,079,272 | ) |
| | | | | | | | | | | | | | | | |
Total Net Increase (Decrease) | | | (9,929,659 | ) | | $ | (99,508,650 | ) | | | (15,723,690 | ) | | $ | (157,455,462 | ) |
| | | | | | | | | | | | | | | | |
| | | | |
U.S. Government Securities HLS Fund | | | | | | | | | | | | | | | | |
| | | For the Year Ended
December 31, 2016 | | | For the Year Ended
December 31, 2015 | |
| | | Shares | | | Amount | | | Shares | | | Amount | |
Class IA | | | | | | | | | | | | | | | | |
Shares Sold | | | 4,083,858 | | | $ | 42,855,959 | | | | 3,407,701 | | | $ | 35,624,811 | |
Shares Issued for Reinvested Dividends | | | 722,114 | | | | 7,582,207 | | | | 761,539 | | | | 7,889,540 | |
Shares Redeemed | | | (8,875,818 | ) | | | (93,215,231 | ) | | | (9,528,094 | ) | | | (99,648,491 | ) |
| | | | | | | | | | | | | | | | |
Net Increase (Decrease) | | | (4,069,846 | ) | | | (42,777,065 | ) | | | (5,358,854 | ) | | | (56,134,140 | ) |
| | | | | | | | | | | | | | | | |
Class IB | | | | | | | | | | | | | | | | |
Shares Sold | | | 855,371 | | | $ | 8,957,932 | | | | 624,520 | | | $ | 6,508,978 | |
Shares Issued for Reinvested Dividends | | | 137,967 | | | | 1,447,270 | | | | 138,582 | | | | 1,434,327 | |
Shares Redeemed | | | (1,996,389 | ) | | | (20,941,029 | ) | | | (1,914,362 | ) | | | (19,961,551 | ) |
| | | | | | | | | | | | | | | | |
Net Increase (Decrease) | | | (1,003,051 | ) | | | (10,535,827 | ) | | | (1,151,260 | ) | | | (12,018,246 | ) |
| | | | | | | | | | | | | | | | |
Total Net Increase (Decrease) | | | (5,072,897 | ) | | $ | (53,312,892 | ) | | | (6,510,114 | ) | | $ | (68,152,386 | ) |
| | | | | | | | | | | | | | | | |
| | | | |
Value HLS Fund | | | | | | | | | | | | | | | | |
| | | For the Year Ended
December 31, 2016 | | | For the Year Ended
December 31, 2015 | |
| | | Shares | | | Amount | | | Shares | | | Amount | |
Class IA | | | | | | | | | | | | | | | | |
Shares Sold | | | 776,955 | | | $ | 11,933,096 | | | | 2,523,744 | | | $ | 40,916,505 | |
Shares Issued for Reinvested Dividends | | | 4,222,098 | | | | 62,687,087 | | | | 1,406,416 | | | | 22,579,315 | |
Shares Redeemed | | | (5,017,607 | ) | | | (77,099,704 | ) | | | (5,677,276 | ) | | | (94,566,512 | ) |
| | | | | | | | | | | | | | | | |
Net Increase (Decrease) | | | (18,554 | ) | | | (2,479,521 | ) | | | (1,747,116 | ) | | | (31,070,692 | ) |
| | | | | | | | | | | | | | | | |
Class IB | | | | | | | | | | | | | | | | |
Shares Sold | | | 189,127 | | | $ | 2,861,768 | | | | 90,344 | | | $ | 1,476,259 | |
Shares Issued for Reinvested Dividends | | | 724,814 | | | | 10,726,703 | | | | 244,646 | | | | 3,929,896 | |
Shares Redeemed | | | (955,721 | ) | | | (14,771,674 | ) | | | (1,023,557 | ) | | | (17,008,309 | ) |
| | | | | | | | | | | | | | | | |
Net Increase (Decrease) | | | (41,780 | ) | | | (1,183,203 | ) | | | (688,567 | ) | | | (11,602,154 | ) |
| | | | | | | | | | | | | | | | |
Total Net Increase (Decrease) | | | (60,334 | ) | | $ | (3,662,724 | ) | | | (2,435,683 | ) | | $ | (42,672,846 | ) |
| | | | | | | | | | | | | | | | |
Notes to Financial Statements – (continued)
December 31, 2016
Each Fund participates in a committed line of credit pursuant to a credit agreement. Each Fund may borrow under the line of credit for temporary or emergency purposes. The Funds (together with certain other Hartford Funds) may borrow up to $330 million in the aggregate, subject to asset coverage and other limitations specified in the credit agreement. The interest rate on borrowings varies depending on the nature of the loan. The facility also charges a commitment fee, which is allocated to each of the funds participating in the line of credit based on average net assets of the funds. During the year ended December 31, 2016, none of the Funds had borrowings under this facility.
| 12. | Pending Legal Proceedings: |
On February 25, 2011, Jennifer L. Kasilag, Louis Mellinger, Judith M. Menendez, Jacqueline M. Robinson, and Linda A. Russell filed a derivative lawsuit against Hartford Investment Financial Services, LLC (“HIFSCO”) (now known as Hartford Funds Distributors, LLC) on behalf of six Hartford retail mutual funds in the United States District Court for the District of New Jersey, alleging that HIFSCO received excessive advisory and distribution fees in violation of its statutory fiduciary duty under Section 36(b) of the 1940 Act when serving as investment manager and principal underwriter, respectively, to the Hartford retail mutual funds. Although this action was purportedly filed on behalf of certain of the Hartford Funds, none of the Hartford Funds is itself a defendant to the suit. HIFSCO moved to dismiss and, in September 2011, the motion was granted in part and denied in part, with leave to amend the complaint. In November 2011, plaintiffs filed an amended complaint on behalf of certain Hartford retail mutual funds, The Hartford Global Health Fund (now known as The Hartford Healthcare Fund), The Hartford Conservative Allocation Fund, The Hartford Growth Opportunities Fund, The Hartford Inflation Plus Fund, The Hartford Advisers Fund (now known as The Hartford Balanced Fund), and The Hartford Capital Appreciation Fund. Plaintiffs seek to rescind the investment management agreements and distribution plans between HIFSCO and these funds and to recover the total fees charged thereunder or, in the alternative, to recover any improper compensation HIFSCO received, in addition to lost earnings. HIFSCO filed a partial motion to dismiss the amended complaint and, in December 2012, the court dismissed without prejudice the claims regarding distribution fees and denied the motion with respect to the advisory fees claims. In March 2014, the plaintiffs filed a new complaint that, among other things, added as new plaintiffs The Hartford Floating Rate Fund and The Hartford Small Company Fund and named as a defendant Hartford Funds Management Company, LLC (“HFMC”), which assumed the role as investment manager to the funds as of January 2013. In June 2015, HFMC and HIFSCO moved for summary judgment, and plaintiffs cross-moved for partial summary judgment with respect to The Hartford Capital Appreciation Fund. In March 2016, the court, in large part, denied summary judgment for all parties. The court granted judgment for HFMC and HIFSCO with respect to all claims made by The Hartford Small Company Fund and certain claims made by The Hartford Floating Rate Fund. The court further ruled that the appropriate measure of damages on the surviving claims is the difference, if any, between the actual advisory fees paid through trial and those that could have been paid under the applicable legal standard. A bench trial on the issue of liability was held in November 2016 and a decision is expected in 2017. HFMC and HIFSCO dispute the allegations and intend to defend vigorously.
No accrual for litigation relating to this matter has been recorded in the financial statements of the Funds because the Funds are not party to the suit.
On October 21, 2013 for the Ultrashort Bond HLS Fund, a reverse stock split was declared for the Class IA and Class IB shares at a ten to one ratio. The effect of the reverse stock split was to divide the number of outstanding shares by the reverse split factor, with a corresponding increase in the net asset value per share. The split was executed at the closing rounded NAV as of the prior business day. This transaction did not change the net assets of the Fund and the total value of a shareholder’s investment in the Fund did not change as a result of the reverse stock split. Data presented in the Financial Highlights has been adjusted retroactively to account for the reverse stock split.
Under each Company’s organizational documents, the Company shall indemnify its officers and directors to the full extent required or permitted under Maryland General Corporation Law and federal securities laws. In addition, each Company, on behalf of its respective Funds, may enter into contracts that contain a variety of indemnifications. Each Company’s maximum exposure under these arrangements is unknown. However, as of the date of these financial statements, each Company has not had prior claims or losses pursuant to these contracts and expects the risk of loss to be remote.
Notes to Financial Statements – (continued)
December 31, 2016
In connection with the preparation of the financial statements of the Funds as of and for the year ended December 31, 2016, events and transactions subsequent to December 31, 2016, through the date the financial statements were issued have been evaluated by the Funds’ management for possible adjustment and/or disclosure.
Effective January 1, 2017, the fund accounting fees paid by each Fund are changing. For more information, please see the Funds Statement of Additional Information.
Effective January 1, 2017, HFMC has agreed to waive 0.03% of the Balanced HLS Fund’s contractual management fee through December 31, 2017.
|
| Report of Independent Registered Public Accounting Firm |
The Board of Directors and Shareholders of
Hartford Series Fund, Inc. and Hartford HLS Series Fund II, Inc.
We have audited the accompanying statements of assets and liabilities, including the schedules of investments, of Hartford Series Fund, Inc. (comprising, respectively, Hartford Balanced HLS Fund, Hartford Capital Appreciation HLS Fund, Hartford Disciplined Equity HLS Fund, Hartford Dividend and Growth HLS Fund, Hartford Global Growth HLS Fund, Hartford Healthcare HLS Fund, Hartford High Yield HLS Fund, Hartford International Opportunities HLS Fund, Hartford MidCap HLS Fund, Hartford MidCap Value HLS Fund, Hartford Small Company HLS Fund, Hartford Stock HLS Fund, Hartford Total Return Bond HLS Fund, Hartford Ultrashort Bond HLS Fund and Hartford Value HLS Fund) and Hartford HLS Series Fund II, Inc. (comprising, respectively, Hartford Growth Opportunities HLS Fund, Hartford Small/Mid Cap Equity HLS Fund, Hartford Small Cap Growth HLS Fund (formerly Hartford SmallCap Growth HLS Fund) and Hartford U.S. Government Securities HLS Fund) (collectively, the “Companies”) as of December 31, 2016, and the related statements of operations for the year then ended, the statements of changes in net assets for each of the two years in the period then ended, and the financial highlights for each of the periods indicated therein. These financial statements and financial highlights are the responsibility of the Companies’ management. Our responsibility is to express an opinion on these financial statements and financial highlights based on our audits.
We conducted our audits in accordance with the standards of the Public Company Accounting Oversight Board (United States). Those standards require that we plan and perform the audits to obtain reasonable assurance about whether the financial statements and financial highlights are free of material misstatement. We were not engaged to perform an audit of the Companies’ internal control over financial reporting. Our audits included consideration of internal control over financial reporting as a basis for designing audit procedures that are appropriate in the circumstances, but not for the purpose of expressing an opinion on the effectiveness of the Companies’ internal control over financial reporting. Accordingly, we express no such opinion. An audit also includes examining, on a test basis, evidence supporting the amounts and disclosures in the financial statements and financial highlights, assessing the accounting principles used and significant estimates made by management, and evaluating the overall financial statement presentation. Our procedures included confirmation of securities owned as of December 31, 2016, by correspondence with the custodian and others or by other appropriate auditing procedures where replies from others were not received. We believe that our audits provide a reasonable basis for our opinion.
In our opinion, the financial statements and financial highlights referred to above present fairly, in all material respects, the financial position of each of the respective series constituting Hartford Series Fund, Inc. and Hartford HLS Series Fund II, Inc. at December 31, 2016, the results of their operations for the year then ended, the changes in their net assets for each of the two years in the period then ended, and the financial highlights for each of the indicated periods, in conformity with U.S. generally accepted accounting principles.

New York, New York
February 17, 2017
Shareholder Meeting Results (Unaudited)
A Joint Annual Meeting of Shareholders (“Meeting”) was held on March 14, 2016 and shareholders were asked to consider the proposals listed below. The Meeting was adjourned for certain funds until April 19, 2016 with respect to proposals 2 through 6 listed below.
| | |
Proposal
No. | | Description of Proposal |
| |
| 1. | | The election of nominees to the Boards of Directors of Hartford Series Fund, Inc. and Hartford HLS Series Fund II, Inc. (each, a “Company” and collectively, the “Companies”) |
| |
| 2. | | The approval of a new Investment Management Agreement between Hartford Funds Management Company, LLC (“HFMC”) and the Companies, on behalf of the Funds. |
| |
| 3. | | The approval of a change to each Fund’s fundamental investment restriction on the purchase or sale of commodities. |
| |
| 4. | | The approval of a change to each Fund’s fundamental investment restriction on the purchase or sale of real estate. |
| |
| 5. | | The approval of a change to each Fund’s fundamental investment restriction on concentration of investments in a particular industry or group of industries. |
| |
| 6. | | The approval, prospectively, of a modification to the current “manager of managers” policy to permit HFMC, subject to prior approval by the relevant Board and under certain circumstances, to enter into and materially amend agreements with affiliated and unaffiliated sub-advisers without the necessity of obtaining shareholder approval. |
All shareholders of record at the close of business on December 23, 2015 (“Record Date”) were entitled to attend or submit proxies. As of the Record Date, each Fund had the following number of shares outstanding:
| | | | |
Fund | | Outstanding Shares | |
Hartford Balanced HLS Fund | | | 94,446,436.9570 | |
Hartford Capital Appreciation HLS Fund | | | 143,648,815.3550 | |
Hartford Disciplined Equity HLS Fund | | | 47,773,847.9850 | |
Hartford Dividend and Growth HLS Fund | | | 156,449,235.6120 | |
Hartford Global Growth HLS Fund | | | 19,721,225.9010 | |
Hartford Growth Opportunities HLS Fund | | | 39,766,847.0550 | |
Hartford Healthcare HLS Fund | | | 14,027,669.4520 | |
Hartford High Yield HLS Fund | | | 44,107,497.6430 | |
Hartford International Opportunities HLS Fund | | | 92,990,191.3310 | |
Hartford MidCap HLS Fund | | | 52,171,397.0650 | |
Hartford MidCap Value HLS Fund | | | 31,188,226.0310 | |
Hartford Small Cap Growth HLS Fund | | | 45,262,486.1530 | |
Hartford Small Company HLS Fund | | | 69,913,112.1470 | |
Hartford Small/Mid Cap Equity HLS Fund | | | 12,903,066.9700 | |
Hartford Stock HLS Fund | | | 24,179,712.9250 | |
Hartford Total Return Bond HLS Fund | | | 249,868,620.8300 | |
Hartford U.S. Government Securities HLS Fund | | | 48,616,941.6520 | |
Hartford Ultrashort Bond HLS Fund | | | 70,982,715.8490 | |
Hartford Value HLS Fund | | | 33,471,884.5890 | |
Shareholder Meeting Results (Unaudited) – (continued)
Proposal One: The election of nominees to the Boards of Directors of the Companies.
| | | | | | | | |
| Approval of Board of Directors for Hartford Series Fund, Inc. | |
| | |
Name(1) | | For | | | Withheld | |
Hilary E. Ackermann | | | 926,055,036.2136 | | | | 37,881,891.4718 | |
Lynn S. Birdsong | | | 928,236,087.7893 | | | | 35,700,839.8961 | |
James E. Davey | | | 928,312,674.2269 | | | | 35,624,253.4585 | |
Christine Detrick | | | 927,906,136.7720 | | | | 36,030,790.9134 | |
Duane E. Hill | | | 926,911,838.7595 | | | | 37,025,088.9259 | |
Sandra S. Jaffee | | | 925,743,052.2438 | | | | 38,193,875.4416 | |
William P. Johnston | | | 926,627,699.6718 | | | | 37,309,228.0136 | |
Phillip O. Peterson | | | 926,430,382.8904 | | | | 37,506,544.7950 | |
Lemma W. Senbet | | | 927,235,048.4436 | | | | 36,701,879.2418 | |
| (1) | Shareholders approved the election of each nominee at the Meeting. |
| | | | | | | | |
| Approval of Board of Directors for Hartford HLS Series Fund II, Inc. | |
| | |
Name(1) | | For | | | Withheld | |
Hilary E. Ackermann | | | 111,973,151.5668 | | | | 3,455,709.8714 | |
Lynn S. Birdsong | | | 112,222,202.7494 | | | | 3,206,658.6888 | |
James E. Davey | | | 112,183,175.8470 | | | | 3,245,685.5912 | |
Christine Detrick | | | 112,197,609.5991 | | | | 3,231,251.8391 | |
Duane E. Hill | | | 112,096,337.6564 | | | | 3,332,523.7818 | |
Sandra S. Jaffee | | | 112,229,912.3493 | | | | 3,198,949.0889 | |
William P. Johnston | | | 112,149,625.0617 | | | | 3,279,236.3765 | |
Phillip O. Peterson | | | 112,162,997.9970 | | | | 3,265,863.4412 | |
Lemma W. Senbet | | | 112,226,951.1307 | | | | 3,201,910.3075 | |
| (1) | Shareholders approved the election of each nominee at the Meeting. |
Shareholder Meeting Results (Unaudited) – (continued)
Proposal Two: The approval of a new Investment Management Agreement between HFMC and the Companies, on behalf of the Funds.
| | | | | | | | | | | | | | | | |
Fund | | For | | | Against | | | Abstain | | | Broker
Non-Votes | |
Hartford Balanced HLS Fund(1) | | | 84,325,889.3904 | | | | 3,082,698.2808 | | | | 3,055,126.7288 | | | | 0.0000 | |
Hartford Capital Appreciation HLS Fund(1) | | | 94,466,954.0315 | | | | 3,149,954.7430 | | | | 5,726,712.6307 | | | | 103,951.0000 | |
Hartford Disciplined Equity HLS Fund(1) | | | 44,312,363.6449 | | | | 1,809,730.3575 | | | | 1,393,097.8926 | | | | 0.0000 | |
Hartford Dividend and Growth HLS Fund(1) | | | 124,988,275.0039 | | | | 3,763,499.6028 | | | | 9,172,581.5603 | | | | 0.0000 | |
Hartford Global Growth HLS Fund(1) | | | 15,858,197.1705 | | | | 832,028.9355 | | | | 514,690.6920 | | | | 0.0000 | |
Hartford Growth Opportunities HLS Fund(1) | | | 35,088,834.0484 | | | | 1,639,115.9614 | | | | 1,086,176.1282 | | | | 0.0000 | |
Hartford Healthcare HLS Fund(1) | | | 7,560,269.1340 | | | | 132,483.0000 | | | | 216,007.0000 | | | | 0.0000 | |
Hartford High Yield HLS Fund(1) | | | 39,757,140.5652 | | | | 1,630,259.5317 | | | | 1,582,896.0961 | | | | 0.0000 | |
Hartford International Opportunities HLS Fund(1) | | | 67,464,946.3659 | | | | 2,796,169.5736 | | | | 2,279,984.8521 | | | | 119,548.0000 | |
Hartford MidCap HLS Fund(2) | | | 22,649,116.9774 | | | | 528,405.6938 | | | | 3,308,277.5287 | | | | 0.0000 | |
Hartford MidCap Value HLS Fund(1) | | | 29,591,370.5384 | | | | 706,968.1062 | | | | 612,518.8074 | | | | 0.0000 | |
Hartford Small Cap Growth HLS Fund(2) | | | 23,229,031.7737 | | | | 396,290.9920 | | | | 780,643.1054 | | | | 1,453,102.0000 | |
Hartford Small Company HLS Fund(1) | | | 33,226,026.0797 | | | | 970,890.5258 | | | | 1,013,186.0215 | | | | 20,314.0000 | |
Hartford Small/Mid Cap Equity HLS Fund(1) | | | 11,667,590.8594 | | | | 298,449.4983 | | | | 753,951.9533 | | | | 0.0000 | |
Hartford Stock HLS Fund(1) | | | 20,740,796.0800 | | | | 788,774.1754 | | | | 961,794.7386 | | | | 0.0000 | |
Hartford Total Return Bond HLS Fund(1) | | | 218,054,022.2714 | | | | 7,061,616.6450 | | | | 10,762,322.9046 | | | | 0.0000 | |
Hartford U.S. Government Securities HLS Fund(1) | | | 44,253,997.1321 | | | | 1,445,777.8891 | | | | 1,819,577.3858 | | | | 0.0000 | |
Hartford Ultrashort Bond HLS Fund(1) | | | 58,406,990.3858 | | | | 2,770,270.3849 | | | | 3,644,479.3663 | | | | 0.0000 | |
Hartford Value HLS Fund(1) | | | 29,266,957.4890 | | | | 702,207.5122 | | | | 615,049.2288 | | | | 0.0000 | |
| (1) | Meeting Held on March 14, 2016 |
| (2) | Meeting Held on April 19, 2016 |
Proposal Three: The approval of a change to each Fund’s fundamental investment restriction on the purchase or sale of commodities.
| | | | | | | | | | | | | | | | |
Fund | | For | | | Against | | | Abstain | | | Broker
Non-Votes | |
Hartford Balanced HLS Fund(1) | | | 81,288,968.9488 | | | | 5,635,762.1557 | | | | 3,538,983.2955 | | | | 0.0000 | |
Hartford Capital Appreciation HLS Fund(1) | | | 90,357,661.3779 | | | | 7,017,376.6818 | | | | 5,968,583.3455 | | | | 103,951.0000 | |
Hartford Disciplined Equity HLS Fund(1) | | | 42,740,567.2203 | | | | 3,159,268.9653 | | | | 1,615,355.7094 | | | | 0.0000 | |
Hartford Dividend and Growth HLS Fund(1) | | | 120,935,131.1770 | | | | 7,055,101.5694 | | | | 9,934,123.4206 | | | | 0.0000 | |
Hartford Global Growth HLS Fund(1) | | | 15,495,357.3020 | | | | 1,115,138.5477 | | | | 594,420.9483 | | | | 0.0000 | |
Hartford Growth Opportunities HLS Fund(1) | | | 33,475,868.2213 | | | | 3,044,570.2604 | | | | 1,293,687.6563 | | | | 0.0000 | |
Hartford Healthcare HLS Fund(1) | | | 7,389,062.4079 | | | | 237,430.7261 | | | | 282,266.0000 | | | | 0.0000 | |
Hartford High Yield HLS Fund(1) | | | 38,619,974.0367 | | | | 2,953,248.4360 | | | | 1,397,073.7203 | | | | 0.0000 | |
Hartford International Opportunities HLS Fund(1) | | | 65,713,476.3829 | | | | 4,653,207.1841 | | | | 2,174,417.2246 | | | | 119,548.0000 | |
Hartford MidCap HLS Fund(2) | | | 21,735,895.5978 | | | | 1,310,017.8354 | | | | 3,439,886.7667 | | | | 0.0000 | |
Hartford MidCap Value HLS Fund(1) | | | 27,441,826.5228 | | | | 2,812,031.2698 | | | | 656,999.6594 | | | | 0.0000 | |
Hartford Small Cap Growth HLS Fund(2) | | | 22,854,308.9933 | | | | 737,316.4196 | | | | 814,340.4582 | | | | 1,453,102.0000 | |
Hartford Small Company HLS Fund(1) | | | 32,400,067.9806 | | | | 1,692,016.0679 | | | | 1,118,018.5785 | | | | 20,314.0000 | |
Hartford Small/Mid Cap Equity HLS Fund(1) | | | 11,080,805.5805 | | | | 932,618.7772 | | | | 706,567.9533 | | | | 0.0000 | |
Hartford Stock HLS Fund(1) | | | 19,921,462.3284 | | | | 1,434,071.9932 | | | | 1,135,830.6724 | | | | 0.0000 | |
Hartford Total Return Bond HLS Fund(1) | | | 214,185,770.1674 | | | | 10,464,606.7312 | | | | 11,227,584.9224 | | | | 0.0000 | |
Hartford U.S. Government Securities HLS Fund(1) | | | 43,716,651.6845 | | | | 1,930,954.9792 | | | | 1,871,745.7433 | | | | 0.0000 | |
Hartford Ultrashort Bond HLS Fund(1) | | | 53,536,980.4415 | | | | 6,806,755.7905 | | | | 4,478,003.9050 | | | | 0.0000 | |
Hartford Value HLS Fund(1) | | | 27,912,646.2080 | | | | 2,004,484.6138 | | | | 667,083.4082 | | | | 0.0000 | |
| (1) | Meeting Held on March 14, 2016 |
| (2) | Meeting Held on April 19, 2016 |
Shareholder Meeting Results (Unaudited) – (continued)
Proposal Four: The approval of a change to each Fund’s fundamental investment restriction on the purchase or sale of real estate.
| | | | | | | | | | | | | | | | |
Fund | | For | | | Against | | | Abstain | | | Broker
Non-Votes | |
Hartford Balanced HLS Fund(1) | | | 81,470,822.4042 | | | | 5,574,504.6504 | | | | 3,418,387.3454 | | | | 0.0000 | |
Hartford Capital Appreciation HLS Fund(1) | | | 90,474,484.6178 | | | | 6,710,536.4107 | | | | 6,158,600.3767 | | | | 103,951.0000 | |
Hartford Disciplined Equity HLS Fund(1) | | | 42,874,762.6053 | | | | 3,212,309.5904 | | | | 1,428,119.6993 | | | | 0.0000 | |
Hartford Dividend and Growth HLS Fund(1) | | | 120,952,568.0386 | | | | 6,932,760.8916 | | | | 10,039,027.2368 | | | | 0.0000 | |
Hartford Global Growth HLS Fund(1) | | | 15,520,883.8161 | | | | 1,098,876.6036 | | | | 585,156.3783 | | | | 0.0000 | |
Hartford Growth Opportunities HLS Fund(1) | | | 33,749,470.9784 | | | | 2,868,379.3895 | | | | 1,196,275.7701 | | | | 0.0000 | |
Hartford Healthcare HLS Fund(1) | | | 7,432,802.6736 | | | | 196,556.4604 | | | | 279,400.0000 | | | | 0.0000 | |
Hartford High Yield HLS Fund(1) | | | 39,436,209.7147 | | | | 2,262,975.8436 | | | | 1,271,110.6347 | | | | 0.0000 | |
Hartford International Opportunities HLS Fund(1) | | | 65,420,486.7348 | | | | 4,759,155.8674 | | | | 2,361,458.1894 | | | | 119,548.0000 | |
Hartford MidCap HLS Fund(2) | | | 21,881,634.0440 | | | | 1,172,332.0028 | | | | 3,431,834.1531 | | | | 0.0000 | |
Hartford MidCap Value HLS Fund(1) | | | 27,558,354.3914 | | | | 2,735,474.2153 | | | | 617,028.8453 | | | | 0.0000 | |
Hartford Small Cap Growth HLS Fund(2) | | | 22,797,615.7646 | | | | 771,914.4318 | | | | 836,435.6747 | | | | 1,453,102.0000 | |
Hartford Small Company HLS Fund(1) | | | 32,410,684.5013 | | | | 1,718,420.3543 | | | | 1,080,997.7714 | | | | 20,314.0000 | |
Hartford Small/Mid Cap Equity HLS Fund(1) | | | 11,091,596.4195 | | | | 921,828.9382 | | | | 706,566.9533 | | | | 0.0000 | |
Hartford Stock HLS Fund(1) | | | 19,971,227.0680 | | | | 1,403,083.2773 | | | | 1,117,054.6487 | | | | 0.0000 | |
Hartford Total Return Bond HLS Fund(1) | | | 213,171,787.8004 | | | | 10,258,694.4802 | | | | 12,447,479.5404 | | | | 0.0000 | |
Hartford U.S. Government Securities HLS Fund(1) | | | 43,589,879.0144 | | | | 2,063,759.2769 | | | | 1,865,714.1157 | | | | 0.0000 | |
Hartford Ultrashort Bond HLS Fund(1) | | | 56,258,776.1717 | | | | 4,480,935.3284 | | | | 4,082,028.6369 | | | | 0.0000 | |
Hartford Value HLS Fund(1) | | | 27,865,523.8861 | | | | 2,025,587.4178 | | | | 693,102.9261 | | | | 0.0000 | |
| (1) | Meeting Held on March 14, 2016 |
| (2) | Meeting Held on April 19, 2016 |
Proposal Five: The approval of a change to each Fund’s fundamental investment restriction on concentration of investments in a particular industry or group of industries.
| | | | | | | | | | | | | | | | |
Fund | | For | | | Against | | | Abstain | | | Broker
Non-Votes | |
Hartford Balanced HLS Fund(1) | | | 81,674,660.5982 | | | | 5,302,528.6361 | | | | 3,486,525.1657 | | | | 0.0000 | |
Hartford Capital Appreciation HLS Fund(1) | | | 90,510,990.8164 | | | | 6,729,239.4261 | | | | 6,103,391.1627 | | | | 103,951.0000 | |
Hartford Disciplined Equity HLS Fund(1) | | | 42,682,748.9657 | | | | 3,381,859.9812 | | | | 1,450,582.9481 | | | | 0.0000 | |
Hartford Dividend and Growth HLS Fund(1) | | | 120,970,647.5337 | | | | 6,807,830.8540 | | | | 10,145,877.7793 | | | | 0.0000 | |
Hartford Global Growth HLS Fund(1) | | | 15,460,933.5211 | | | | 1,100,386.1630 | | | | 643,597.1139 | | | | 0.0000 | |
Hartford Growth Opportunities HLS Fund(1) | | | 34,057,767.4776 | | | | 2,502,222.8695 | | | | 1,254,135.7909 | | | | 0.0000 | |
Hartford Healthcare HLS Fund(1) | | | 7,356,059.4079 | | | | 215,903.7261 | | | | 336,796.0000 | | | | 0.0000 | |
Hartford High Yield HLS Fund(1) | | | 38,997,464.6663 | | | | 2,443,739.0068 | | | | 1,529,092.5199 | | | | 0.0000 | |
Hartford International Opportunities HLS Fund(1) | | | 65,919,691.1593 | | | | 4,371,867.1265 | | | | 2,249,542.5058 | | | | 119,548.0000 | |
Hartford MidCap HLS Fund(2) | | | 21,990,046.4563 | | | | 1,060,849.8385 | | | | 3,434,903.9051 | | | | 0.0000 | |
Hartford MidCap Value HLS Fund(1) | | | 28,431,101.4981 | | | | 1,785,406.7346 | | | | 694,349.2193 | | | | 0.0000 | |
Hartford Small Cap Growth HLS Fund(2) | | | 22,897,970.5236 | | | | 656,892.1882 | | | | 851,103.1593 | | | | 1,453,102.0000 | |
Hartford Small Company HLS Fund(1) | | | 32,497,197.3982 | | | | 1,598,477.7819 | | | | 1,114,427.4469 | | | | 20,314.0000 | |
Hartford Small/Mid Cap Equity HLS Fund(1) | | | 11,405,530.9601 | | | | 474,369.3976 | | | | 840,091.9533 | | | | 0.0000 | |
Hartford Stock HLS Fund(1) | | | 20,121,181.8641 | | | | 1,320,102.8157 | | | | 1,050,080.3142 | | | | 0.0000 | |
Hartford Total Return Bond HLS Fund(1) | | | 213,521,822.1041 | | | | 11,032,057.3723 | | | | 11,324,082.3446 | | | | 0.0000 | |
Hartford U.S. Government Securities HLS Fund(1) | | | 43,906,357.5931 | | | | 1,961,362.7968 | | | | 1,651,632.0171 | | | | 0.0000 | |
Hartford Ultrashort Bond HLS Fund(1) | | | 55,013,417.4849 | | | | 5,615,232.3905 | | | | 4,193,090.2616 | | | | 0.0000 | |
Hartford Value HLS Fund(1) | | | 28,792,332.5490 | | | | 1,114,401.2784 | | | | 677,480.4026 | | | | 0.0000 | |
| (1) | Meeting Held on March 14, 2016 |
| (2) | Meeting Held on April 19, 2016 |
Shareholder Meeting Results (Unaudited) – (continued)
Proposal Six: The approval, prospectively, of a modification to the current “manager of managers” policy to permit HFMC, subject to prior approval by the relevant Board and under certain circumstances, to enter into and materially amend agreements with affiliated and unaffiliated sub-advisers without the necessity of obtaining shareholder approval.
| | | | | | | | | | | | | | | | |
Fund | | For | | | Against | | | Abstain | | | Broker
Non-Votes | |
Hartford Balanced HLS Fund(1) | | | 80,053,492.1791 | | | | 7,067,883.7455 | | | | 3,342,338.4754 | | | | 0.0000 | |
Hartford Capital Appreciation HLS Fund(1) | | | 84,780,758.0102 | | | | 12,218,442.5529 | | | | 6,344,420.8421 | | | | 103,951.0000 | |
Hartford Disciplined Equity HLS Fund(1) | | | 41,917,306.0963 | | | | 3,841,237.2822 | | | | 1,756,648.5165 | | | | 0.0000 | |
Hartford Dividend and Growth HLS Fund(1) | | | 110,612,227.3062 | | | | 16,778,345.9366 | | | | 10,533,782.9242 | | | | 0.0000 | |
Hartford Global Growth HLS Fund(1) | | | 15,251,157.4278 | | | | 1,444,026.8433 | | | | 509,732.5269 | | | | 0.0000 | |
Hartford Growth Opportunities HLS Fund(1) | | | 33,483,114.9755 | | | | 3,018,508.6244 | | | | 1,312,502.5381 | | | | 0.0000 | |
Hartford Healthcare HLS Fund(1) | | | 7,289,820.6736 | | | | 341,135.4604 | | | | 277,803.0000 | | | | 0.0000 | |
Hartford High Yield HLS Fund(1) | | | 38,234,809.2887 | | | | 2,848,622.4277 | | | | 1,886,864.4766 | | | | 0.0000 | |
Hartford International Opportunities HLS Fund(1) | | | 56,963,607.7782 | | | | 13,005,523.3902 | | | | 2,571,969.6232 | | | | 119,548.0000 | |
Hartford MidCap HLS Fund(2) | | | 18,188,763.7838 | | | | 4,866,913.8209 | | | | 3,430,122.5952 | | | | 0.0000 | |
Hartford MidCap Value HLS Fund(1) | | | 27,442,511.9566 | | | | 2,643,386.7647 | | | | 824,958.7307 | | | | 0.0000 | |
Hartford Small Cap Growth HLS Fund(2) | | | 22,281,047.0136 | | | | 1,262,701.9146 | | | | 862,216.9429 | | | | 1,453,102.0000 | |
Hartford Small Company HLS Fund(1) | | | 19,677,614.9058 | | | | 14,401,224.8121 | | | | 1,131,262.9091 | | | | 20,314.0000 | |
Hartford Small/Mid Cap Equity HLS Fund(1) | | | 10,297,136.3208 | | | | 1,618,761.2347 | | | | 804,094.7555 | | | | 0.0000 | |
Hartford Stock HLS Fund(1) | | | 19,687,075.2727 | | | | 1,673,510.6656 | | | | 1,130,779.0557 | | | | 0.0000 | |
Hartford Total Return Bond HLS Fund(1) | | | 196,881,270.6523 | | | | 25,686,079.6481 | | | | 13,310,611.5206 | | | | 0.0000 | |
Hartford U.S. Government Securities HLS Fund(1) | | | 42,227,852.5322 | | | | 3,541,602.1734 | | | | 1,749,897.7014 | | | | 0.0000 | |
Hartford Ultrashort Bond HLS Fund(1) | | | 53,531,876.5343 | | | | 7,193,163.8629 | | | | 4,096,699.7398 | | | | 0.0000 | |
Hartford Value HLS Fund(1) | | | 27,968,832.9977 | | | | 1,946,478.4232 | | | | 668,902.8091 | | | | 0.0000 | |
| (1) | Meeting Held on March 14, 2016 |
| (2) | Meeting Held on April 19, 2016 |
Directors and Officers of the Companies
| | | | | | | | | | |
Name, Year of Birth
and Address(1) | | Position
Held with
the Companies | | Term of
Office(2) and
Length
of Time
Served | | Principal Occupation(s)
During Past 5 Years | | Number of
Portfolios
in Fund
Complex(3)
Overseen by
Director | | Other Directorships
for Public Companies
and Other Registered
Investment Companies
Held by Director |
NON-INTERESTED DIRECTORS |
HILARY E. ACKERMANN (1956) | | Director | | Since 2014 | | Ms. Ackermann served as Chief Risk Officer at Goldman Sachs Bank USA from October 2008 to November 2011 and has served as a Director of Dynegy, Inc. (an independent power company) from October 2012 to present. | | 76 | | Ms. Ackermann serves as a Director of Dynegy, Inc. (a power company) (October 2012 to present). |
LYNN S. BIRDSONG (1946) | | Director | | Since 2003 | | Mr. Birdsong currently serves as a Director of Aberdeen Global and Aberdeen Global II (investment funds) (September 2014 to present) and Aberdeen Islamic SICAV and Aberdeen Liquidity Fund (investment funds) (2016 to present). Mr. Birdsong served as an Independent Director of Nomura Partners Funds, Inc. (formerly, The Japan Fund) (April 2003 to February 2015) and as a Director of the Sovereign High Yield Investment Company (April 2010 to June 2014). From 2003 to March 2005, Mr. Birdsong was an Independent Director of the Atlantic Whitehall Funds. From 1979 to 2002, Mr. Birdsong was a Managing Director of Zurich Scudder Investments, an investment management firm. During his employment with Scudder, Mr. Birdsong was an Interested Director of The Japan Fund. From January 1981 through December 2013, Mr. Birdsong was a partner in Birdsong Company, an advertising specialty firm. | | 76 | | None |
Directors and Officers of the Companies – (continued)
| | | | | | | | | | |
Name, Year of Birth
and Address(1) | | Position
Held with
the Companies | | Term of
Office(2) and
Length
of Time
Served | | Principal Occupation(s)
During Past 5 Years | | Number of
Portfolios
in Fund
Complex(3)
Overseen by
Director | | Other Directorships
for Public Companies
and Other Registered
Investment Companies
Held by Director |
CHRISTINE DETRICK (1958) | | Director | | Since 2016 | | Ms. Detrick has served as a Director of Reinsurance Group of America since January 2014 and Forest City Realty Trust (a real estate company) since November 2014. Previously, she was a Director of Forethought Financial Group, Inc. (a financial services company) from January 2012 to January 2014 and a Senior Partner/Advisor at Bain & Company (a management consulting firm) from September 2002 to December 2012. | | 76 | | Ms. Detrick serves as a Director of Reinsurance Group of America (January 2014 to present) and Forest City Realty Trust (a real estate company) (November 2014 to present). |
DUANE E. HILL (1945) | | Director | | Since 2001(4) Since 2002(5) | | Mr. Hill is a Partner of TSG Ventures L.P., a private equity investment company. Mr. Hill is a former partner of TSG Capital Group, a private equity investment firm that served as sponsor and lead investor in leveraged buyouts of middle market companies. | | 76 | | None |
WILLIAM P. JOHNSTON (1944) | | Director and Chairman of the Board | | Director since 2005 and Chairman of the Board since 2015 | | In June 2006, Mr. Johnston was appointed as Senior Advisor to The Carlyle Group, a global private equity and other alternative asset investment firm and currently serves as an Operating Executive. In July 2006, Mr. Johnston was elected to the Board of Directors of MultiPlan, Inc. and served as a Director (July 2006 to August 2010). In August 2007, Mr. Johnston was elected to the Board of Directors of LifeCare Holdings, Inc. and served as a Director (August 2007 to June 2013). In February 2008, | | 76 | | None |
Directors and Officers of the Companies – (continued)
| | | | | | | | | | |
Name, Year of Birth
and Address(1) | | Position
Held with
the Companies | | Term of
Office(2) and
Length
of Time
Served | | Principal Occupation(s)
During Past 5 Years | | Number of
Portfolios
in Fund
Complex(3)
Overseen by
Director | | Other Directorships
for Public Companies
and Other Registered
Investment Companies
Held by Director |
| | | | | | Mr. Johnston was elected to the Board of Directors of HCR-ManorCare, Inc. In May 2006, Mr. Johnston was elected to the Supervisory Board of Fresenius Medical Care AG & Co. KGaA, after its acquisition of Renal Care Group, Inc. in March 2006. Mr. Johnston joined Renal Care Group in November 2002 as a member of the Board of Directors and served as Chairman of the Board from March 2003 through March 2006. From 2002 through 2013, Mr. Johnston served as a Board member of the Georgia O’Keefe Museum. From September 1987 to December 2002, Mr. Johnston was with Equitable Securities Corporation (and its successors, SunTrust Equitable Securities and SunTrust Robinson Humphrey) serving in various investment banking and managerial positions, including Managing Director and Head of Investment Banking, Chief Executive Officer and Vice Chairman. | | | | |
PHILLIP O. PETERSON (1944) | | Director | | Since 2002(4) Since 2000(5) | | Mr. Peterson is a mutual fund industry consultant. He was a partner of KPMG LLP (an accounting firm) until July 1999. Mr. Peterson joined William Blair Funds in February 2007 as a member of the Board of Trustees. From February 2012 to February 2014, Mr. Peterson served as a Trustee of Symetra Variable Mutual Funds. From January 2004 to April 2005, Mr. Peterson served as Independent President of the Strong Mutual Funds. | | 76 | | Mr. Peterson is a Trustee of the William Blair Funds (February 2007 to current) (22 funds overseen). |
Directors and Officers of the Companies – (continued)
| | | | | | | | | | |
Name, Year of Birth
and Address(1) | | Position
Held with
the Companies | | Term of
Office(2) and
Length
of Time
Served | | Principal Occupation(s)
During Past 5 Years | | Number of
Portfolios
in Fund
Complex(3)
Overseen by
Director | | Other Directorships
for Public Companies
and Other Registered
Investment Companies
Held by Director |
LEMMA W. SENBET (1946) | | Director | | Since 2005 | | Dr. Senbet is the William E. Mayer Chair Professor of Finance and Founding Director, Center for Financial Policy, at the University of Maryland, Robert H. Smith School of Business. He was chair of the Finance Department of the University of Maryland, Robert H. Smith School of Business from 1998 to 2006. Since June 2013, he has been on leave from the University to serve as Executive Director of the African Economic Research Consortium which focuses on economic policy research and training. Previously, he was a chaired professor of finance at the University of Wisconsin-Madison. Also, he was a Director of the Fortis Funds from March 2000 to July 2002. Dr. Senbet served as Director of the American Finance Association and President of the Western Finance Association. In 2006, Dr. Senbet was inducted Fellow of Financial Management Association International for his career-long distinguished scholarship and professional service. | | 76 | | None |
Directors and Officers of the Companies – (continued)
| | | | | | | | | | |
Name, Year of Birth
and Address(1) | | Position
Held with
the Companies | | Term of
Office(2) and
Length
of Time
Served | | Principal Occupation(s)
During Past 5 Years | | Number of
Portfolios
in Fund
Complex(3)
Overseen
by Director | | Other Directorships
Held by Director |
OFFICERS AND INTERESTED DIRECTORS |
JAMES E. DAVEY(6) (1964) | | Director, President and Chief Executive Officer | | President and Chief Executive Officer since 2010; Director since 2012 | | Mr. Davey serves as Executive Vice President of The Hartford Financial Services Group, Inc. Additionally, Mr. Davey serves as Chairman of the Board, Manager and Senior Managing Director of Hartford Funds Distributors, LLC (“HFD”). He also currently serves as Director, Chairman of the Board, President and Senior Managing Director of Hartford Administrative Services Company (“HASCO”). Mr. Davey also serves as President, Manager, Chairman of the Board and Senior Managing Director for Hartford Funds Management Company, LLC (“HFMC”) and Director, Chairman of the Board, President and Senior Managing Director for Hartford Funds Management Group, Inc. (“HFMG”). Mr. Davey also serves as Chairman of the Board, President and Manager of Lattice Strategies LLC effective July 30, 2016. Mr. Davey has served in various positions within The Hartford and its subsidiaries in connection with the operation of the Hartford Funds. Mr. Davey joined The Hartford in 2002. | | 76 | | N/A |
ANDREW S. DECKER (1963) | | AML Compliance Officer | | Since 2015 | | Mr. Decker currently serves as Chief Compliance Officer and AML Compliance Officer of HASCO and as AML Officer of HFD. Prior to joining The Hartford, Mr. Decker served as Vice President and AML Officer at Janney Montgomery Scott (a broker dealer) from April 2011 to January 2015. Mr. Decker served as AML Compliance and Sanctions Enforcement Officer at SEI Investments from December 2007 to April 2011. | | N/A | | N/A |
Directors and Officers of the Companies – (continued)
| | | | | | | | | | |
Name, Year of Birth
and Address(1) | | Position
Held with
the Companies | | Term of
Office(2) and
Length
of Time
Served | | Principal Occupation(s)
During Past 5 Years | | Number of
Portfolios
in Fund
Complex(3)
Overseen
by Director | | Other Directorships
Held by Director |
MICHAEL FLOOK (1965) | | Vice President, Treasurer and Controller | | Since 2015 | | Mr. Flook served as Assistant Treasurer for each Company, The Hartford Alternative Strategies Fund, The Hartford Mutual Funds, Inc. and The Hartford Mutual Funds II, Inc. from February 2015 to March 2015. Mr. Flook joined The Hartford in 2014. Prior to joining The Hartford, Mr. Flook served as Director, Vice President and Assistant Treasurer at UBS Global Asset Management from May 2006 to November 2014. Mr. Flook currently serves as an employee of HFMC. | �� | N/A | | N/A |
WALTER F. GARGER (1965) | | Vice President and Chief Legal Officer | | Since 2016 | | Mr. Garger currently serves as Secretary, Managing Director and General Counsel of HFD, HASCO, HFMC and HFMG. Mr. Garger also serves as Secretary and General Counsel of Lattice Strategies LLC effective July 30, 2016. Mr. Garger has served in various positions within The Hartford and its subsidiaries in connection with the operation of the Hartford Funds. Mr. Garger joined The Hartford in 1995. | | N/A | | N/A |
JOSEPH G. MELCHER (1973) | | Vice President and Chief Compliance Officer | | Since 2013 | | Mr. Melcher currently serves as Executive Vice President of HFD, HFMG and HASCO. Mr. Melcher also currently serves as Executive Vice President and Chief Compliance Officer of HFMC. He also serves as Chief Compliance Officer and Executive Vice President of Lattice Strategies LLC effective July 30, 2016. Mr. Melcher has served in various positions within The Hartford and its subsidiaries in connection with the operation of the Hartford Funds since joining The Hartford in 2012. Prior to joining The Hartford, Mr. Melcher worked at Touchstone Investments, a member of the Western & Southern Financial Group, where he held the position of Vice President and Chief Compliance Officer from 2010 through 2012 and Assistant Vice President, Compliance from 2005 to 2010. | | N/A | | N/A |
Directors and Officers of the Companies – (continued)
| | | | | | | | | | |
Name, Year of Birth
and Address(1) | | Position
Held with
the Companies | | Term of
Office(2) and
Length
of Time
Served | | Principal Occupation(s)
During Past 5 Years | | Number of
Portfolios
in Fund
Complex(3)
Overseen
by Director | | Other Directorships
Held by Director |
VERNON J. MEYER (1964) | | Vice President | | Since 2006 | | Mr. Meyer currently serves as Senior Vice President of Hartford Life Insurance Company (“HLIC”). He also currently serves as Managing Director and Chief Investment Officer of HFMC and Managing Director of HFMG. Mr. Meyer has served in various positions within The Hartford and its subsidiaries in connection with the operation of the Hartford Funds. Mr. Meyer joined The Hartford in 2004. | | N/A | | N/A |
LAURA S. QUADE (1969) | | Vice President | | Since 2012 | | Ms. Quade currently serves as Senior Vice President of HLIC and Vice President of HASCO, HFD and HFMG. She is the Head of Operations of HASCO and formerly served as Director, Enterprise Operations of HLIC. Ms. Quade has served in various positions within The Hartford and its subsidiaries in connection with the operation of the Hartford Funds. Ms. Quade joined The Hartford in 2001. | | N/A | | N/A |
ALICE A. PELLEGRINO (1960) | | Vice President and Secretary | | Since 2016 | | Ms. Pellegrino currently serves as Vice President of HLIC and HFMG. Ms. Pellegrino is a Senior Counsel and has served in various positions within The Hartford and its subsidiaries in connection with the operation of the Hartford Funds. Ms. Pellegrino joined The Hartford in 2007. | | N/A | | N/A |
| (1) | The address for each officer and Director is c/o Hartford Funds 5 Radnor Corporate Center, 100 Matsonford Road, Suite 300, Radnor, Pennsylvania 19087. On or about April 24, 2017, the address of each officer and Director will be c/o Hartford Funds 690 Lee Road, Wayne, PA 19087. |
| (2) | Each Director holds an indefinite term until the earlier of (i) the election and qualification of his or her successor or (ii) when the Director turns 75 years of age. Each officer shall serve until his or her successor is elected and qualifies. |
| (3) | The portfolios are series of The Hartford Mutual Funds, Inc., The Hartford Mutual Funds II, Inc., Hartford Series Fund, Inc. and Hartford HLS Series Fund II, Inc. |
| (4) | For Hartford Series Fund, Inc. |
| (5) | For Hartford HLS Series Fund II, Inc. |
| (6) | “Interested person,” as defined in the 1940 Act, of each Company because of the person’s affiliation with, or equity ownership of, HFMC, HFD or affiliated companies. |
For more information regarding the Directors and Officers, please refer to the Statement of Additional Information, as supplemented, which is available, without charge, upon request by calling 1-888-843-7824.
General Information (Unaudited)
HOW TO OBTAIN A COPY OF EACH FUND’S PROXY VOTING POLICIES AND VOTING RECORDS (UNAUDITED)
A description of the policies and procedures that each Fund uses to determine how to vote proxies relating to portfolio securities and information about how each Fund voted proxies relating to portfolio securities during the most recent twelve-month period ended June 30 are available (1) without charge, upon request, by calling 888-843-7824 and (2) on the SEC’s website at http://www.sec.gov.
QUARTERLY PORTFOLIO HOLDINGS INFORMATION (UNAUDITED)
Each Fund files a complete schedule of portfolio holdings with the SEC for the first and third quarters of each fiscal year on Form N-Q. The Fund’s Forms N-Q are available (1) without charge, upon request, by calling 888-843-7824 and (2) on the SEC’s website at http://www.sec.gov. The Form N-Q may be reviewed and copied at the SEC’s Public Reference Room in Washington, DC. Information on the operation of the Public Reference Room may be obtained by calling 1-800-SEC-0330.
Approval of Investment Management and Investment Sub-Advisory Agreements (Unaudited)
Hartford Series Fund, Inc. and Hartford HLS Series Fund II, Inc.
Hartford Balanced HLS Fund
Hartford Capital Appreciation HLS Fund
Hartford Disciplined Equity HLS Fund
Hartford Dividend and Growth HLS Fund
Hartford Global Growth HLS Fund
Hartford Growth Opportunities HLS Fund
Hartford Healthcare HLS Fund
Hartford High Yield HLS Fund
Hartford International Opportunities HLS Fund
Hartford MidCap HLS Fund
Hartford MidCap Value HLS Fund
Hartford Small Cap Growth HLS Fund
Hartford Small Company HLS Fund
Hartford Small/Mid Cap Equity HLS Fund
Hartford Stock HLS Fund
Hartford Total Return Bond HLS Fund
Hartford Ultrashort Bond HLS Fund
Hartford U.S. Government Securities HLS Fund
Hartford Value HLS Fund
Section 15(c) of the Investment Company Act of 1940, as amended (the “1940 Act”), requires that each mutual fund’s board of directors, including a majority of those directors who are not “interested persons” of the mutual fund, as defined in the 1940 Act (the “Independent Directors”), annually review and consider the continuation of the mutual fund’s investment advisory and sub-advisory agreements. At a Joint Annual Meeting of Shareholders held on March 14, 2016 and adjourned to April 19, 2016 with respect to certain funds, shareholders of each of the funds listed above (each a “Fund” and collectively, the “Funds”) voted to approve a new investment management agreement (the “Management Agreement”) by and between Hartford Series Fund, Inc. (“HLS”) and Hartford HLS Series Fund II, Inc. (“HLS II”), on behalf of each of their respective Funds, and Hartford Funds Management Company, LLC (“HFMC”).
At their meeting held on August 2-3, 2016, the Boards of Directors (collectively, the “Board”) of HLS and HLS II, including each of the Independent Directors, unanimously voted to approve (i) the continuation of the Management Agreement; and (ii) the continuation of the investment sub-advisory agreement between HFMC and each Fund’s sub-adviser, Wellington Management Company LLP (the “Sub-adviser,” and together with HFMC, the “Advisers”) (collectively, the “Agreements”).
In the months preceding the August 2-3, 2016 meeting, the Board requested and reviewed written responses from the Advisers to questions posed to the Advisers on behalf of the Independent Directors and supporting materials relating to those questions and responses. In addition, the Board considered such additional information as it deemed reasonably necessary to evaluate the Agreements with respect to each Fund, which included information furnished to the Board at its meetings throughout the year, as well as information specifically prepared in connection with the annual approval of the Agreements at the Board’s meetings held on June 21-22, 2016 and August 2-3, 2016. Information provided to the Board at its meetings throughout the year included, among other things, reports on Fund performance, legal and compliance matters, sales and marketing activity, shareholder services, and the other services provided to each Fund by the Advisers and their affiliates. The Board also considered the materials and in-person presentations by Fund officers and representatives of HFMC received at the Board’s meetings on June 21-22, 2016 and August 2-3, 2016 concerning the Agreements.
The Independent Directors, advised by independent legal counsel, engaged service providers to assist them with evaluating the Agreements with respect to each Fund. Broadridge Financial Solutions, Inc. (“Broadridge”), an independent provider of investment company data, was retained to provide the Board with reports on how each Fund’s contractual management fees, actual management fees, other non-management fees, overall expense ratios and investment performance compared to those of comparable mutual funds with similar investment objectives. The Independent Directors also engaged an independent financial services consultant (the “Consultant”) to assist them in evaluating the Funds’ respective management fees, sub-advisory fees, other non-management fees, overall expense ratios and investment performance. In addition, the Consultant reviewed the profitability calculations utilized by HFMC in connection with the continuation of the Management Agreement.
Approval of Investment Management and Investment Sub-Advisory Agreements (Unaudited) – (continued)
In determining whether to continue the Agreements for a Fund, the members of the Board reviewed and evaluated information and factors they believed to be relevant and appropriate in light of the information that the Board deemed necessary and appropriate through the exercise of its reasonable business judgment. While individual members of the Board may have weighed certain factors differently, the Board’s determination to continue the Agreements was based on a comprehensive consideration of all information provided to the Board throughout the year and specifically with respect to the continuation of the Agreements. The Board was also furnished with an analysis of its fiduciary obligations in connection with its evaluation of the Agreements and, throughout the evaluation process, the Board was assisted by counsel for the Funds. The Independent Directors were also separately assisted by independent legal counsel. A more detailed summary of the important, but not necessarily all, factors the Board considered with respect to its approval of the Agreements is provided below.
Nature, Extent and Quality of Services Provided by the Advisers
The Board requested and considered information concerning the nature, extent and quality of the services provided to each Fund by the Advisers. The Board considered, among other things, the terms of the Agreements and the range of services provided by the Advisers. The Board considered the Advisers’ professional personnel who provide services to the Funds, including each Adviser’s ability and experience in attracting and retaining qualified personnel to service the Funds. The Board considered each Adviser’s reputation and overall financial strength, as well as its willingness to consider and implement organizational and operational changes designed to enhance services to the Hartford Funds. In addition, the Board considered the quality of each Adviser’s communications with the Board and responsiveness to Board inquiries and requests made from time to time with respect to the Funds and other Hartford Funds.
The Board also requested and evaluated information concerning each Adviser’s regulatory and compliance environment. In this regard, the Board requested and reviewed information about each Adviser’s compliance policies and procedures, compliance history, and a report from the Funds’ Chief Compliance Officer about each Adviser’s compliance with applicable laws and regulations, including responses to regulatory developments and compliance issues raised by regulators. The Board also noted the Advisers’ support of the Funds’ compliance control structure, as applicable, and, in particular, the resources devoted by the Advisers in support of the Funds’ obligations pursuant to Rule 38a-1 under the 1940 Act, as well as the efforts of HFMC and its affiliates to combat cybersecurity risks and invest in business continuity planning.
With respect to HFMC, the Board noted that, under the Management Agreement, HFMC is responsible for the management of the Funds, including oversight of fund operations and service providers, and the provision of administrative and investment advisory services in connection with selecting, monitoring and supervising the Sub-adviser. The Board considered HFMC’s ongoing monitoring of people, process and performance, including its quarterly reviews of each of the Hartford Funds, semi-annual meetings with the leaders of each Fund’s portfolio management team, and oversight of the Funds’ approximately 35 portfolio managers. The Board recognized that HFMC has demonstrated a record of making changes to the management and/or strategies of the Hartford Funds when warranted. The Board considered HFMC’s periodic due diligence reviews of the Sub-adviser and ongoing oversight of the Sub-adviser’s investment approach and results, process for monitoring best execution of portfolio trades and other trading operations by the Sub-adviser, and approach to risk management with respect to the Funds and the service providers to the Funds. The Board also considered HFMC’s day-to-day oversight of compliance with each Fund’s objective and policies as well as with applicable laws and regulations, noting that regulatory and other developments had over time led to an increase in the scope of HFMC’s services in this regard. Moreover, the Board considered HFMC’s oversight of potential conflicts of interest between the Funds’ investments and those of other funds or accounts managed by the Funds’ portfolio management personnel.
In addition, the Board considered HFMC’s ongoing commitment to review and rationalize the Hartford Funds product line-up. The Board considered that HFMC is responsible for providing the Funds’ officers. The Board also noted that Hartford Life Insurance Company (“HLIC”), an affiliate of HFMC, provides administrative services to the Funds. The Board considered its experiences with HFMC and HLIC with respect to each of these services.
With respect to the Sub-adviser, which provides certain day-to-day portfolio management services for the Funds, subject to oversight by HFMC, the Board considered, among other things, the quality of each Fund’s portfolio manager(s), the Sub-adviser’s other investment personnel, its investment philosophy and process, its investment research capabilities and resources, its performance record, its trade execution capabilities and its experience. The Board considered the experience of each Fund’s portfolio manager(s), the number of accounts managed by the portfolio manager(s), and the Sub-adviser’s method for compensating the portfolio manager(s).
Based on these considerations, the Board concluded that it was satisfied with the nature, extent and quality of the services provided to each Fund by HFMC and the Sub-adviser.
Approval of Investment Management and Investment Sub-Advisory Agreements (Unaudited) – (continued)
Performance of each Fund and the Advisers
The Board considered the investment performance of each Fund. In this regard, the Board reviewed the performance of each Fund over different time periods presented in the materials and evaluated HFMC’s analysis of the Fund’s performance for these time periods. The Board considered information and materials provided to the Board by the Advisers concerning Fund performance, as well as information from Broadridge comparing the investment performance of each Fund to an appropriate universe of peer funds. For details regarding each Fund’s performance, see the Fund-by-Fund synopsis below.
The Board considered the detailed investment analytics reports provided by Hartford Funds’ Investment Advisory Group throughout the year, including in connection with the annual approval of the Agreements. These reports include, among other things, information on each Fund’s gross returns and, with respect to certain reports, net returns, the Fund’s investment performance relative to an appropriate benchmark and peer group, various statistics concerning the Fund’s portfolio, and a narrative summary of various factors affecting Fund performance. The Board considered the Advisers’ cooperation with the Investment Committee, which assists the Board in evaluating the performance of each Fund at periodic meetings throughout the year. The Board also considered the analysis provided by the Consultant relating to each Fund’s performance track record.
In light of all the considerations noted above, the Board concluded that it had continued confidence in HFMC’s and the Sub-adviser’s overall capabilities to manage the Funds.
Costs of the Services and Profitability of the Advisers
The Board reviewed information regarding HFMC’s cost to provide investment management and related services to each Fund and HFMC’s profitability, both overall and for each Fund, on a pre-tax basis without regard to distribution expenses. The Board also requested and reviewed information about the profitability to HFMC and its affiliates from all services provided to each Fund and all aspects of their relationship with the Fund, including information regarding profitability trends over time. The Board also requested and received information relating to the operations and profitability of the Sub-adviser.
The Board considered the Consultant’s review of the profitability calculations used by HFMC in connection with the continuation of the Management Agreement, noting the Consultant’s view that Hartford Funds’ process for calculating and reporting Fund profitability is reasonable and consistent with the process previously reviewed by the Consultant. In this regard, the Board noted that the Consultant had previously performed a full review of this process and reported that such process is sound and well within common industry practice.
Based on these considerations, the Board concluded that the profits anticipated to be realized by the Advisers and their affiliates from their relationships with the Funds would not be excessive.
Comparison of Fees and Services Provided by the Advisers
The Board considered the comparative information that had been provided at meetings on June 21-22, 2016 and August 2-3, 2016 with respect to the services rendered to and the management fees to be paid by each Fund to HFMC and the total expense ratios of the Fund. The Board also considered comparative information with respect to the sub-advisory fees to be paid by HFMC to the Sub-adviser with respect to each Fund, taking into account that HFMC compensates the Sub-adviser out of the management fee paid by the Fund to HFMC. In this regard, the Board requested and reviewed information from HFMC and the Sub-adviser relating to the management and sub-advisory fees, including the sub-advisory fee schedule for each Fund, and total operating expenses for each Fund. The Board considered that the management fee for each Fund covers the fee paid by HFMC to HLIC for providing certain administrative services to the Fund. With respect to each Fund’s sub-advisory fee schedule, the Board considered representations from HFMC and the Sub-adviser that the Sub-adviser’s fees were negotiated at arm’s length on a Fund-by-Fund basis. The Board also reviewed information from Broadridge comparing each Fund’s contractual management fees, actual management fees and overall expense ratios relative to a group of funds selected by Broadridge, in consultation with the Consultant, and a broader universe of funds selected by Broadridge. For details regarding each Fund’s expenses, see the Fund-by-Fund synopsis below.
While the Board recognized that comparisons between a Fund and its peer funds may be imprecise, given the different service levels and characteristics of mutual funds and the different business models and cost structures of the Advisers, the comparative information provided by Broadridge assisted the Board in evaluating the reasonableness of each Fund’s management and sub-advisory fees and total operating expenses. In addition, the Board considered the analysis and recommendations of the Consultant relating to each Fund’s management and sub-advisory fees and total operating expenses.
Approval of Investment Management and Investment Sub-Advisory Agreements (Unaudited) – (continued)
Based on these considerations, the Board concluded that each Fund’s fees and total operating expenses, in conjunction with the information about quality of services, profitability, economies of scale, and other matters discussed, were reasonable in light of the services provided.
Economies of Scale
The Board considered information regarding the extent to which economies of scale may be realized as a Fund grows and whether fee levels reflect these economies of scale for the benefit of shareholders of the Fund. The Board reviewed the breakpoints in the management fee schedule for each Fund, if any, which reduce fee rates as the Fund’s assets grow over time. The Board recognized that a fund with assets beyond the highest breakpoint level will continue to benefit from economies of scale because additional assets are charged the lowest breakpoint fee resulting in lower overall effective management fee rates. The Board also recognized that a fee schedule that reaches a lower breakpoint quickly provides shareholders with the benefit of anticipated or potential economies of scale. In addition, the Board considered that initially setting competitive fee rates and pricing the Funds to scale at inception are other means of sharing potential economies of scale with shareholders. The Board also considered that HFMC has been active in managing expenses, which has resulted in benefits being realized by shareholders as assets within the Hartford Funds family of funds have grown over time, including through lower operating expenses. The Board noted the effect of the run-off of the variable annuity business on the HLS Funds and also noted that, for Hartford Small/Mid Cap Equity HLS Fund, the Fund’s current low asset levels have kept the Fund from fully realizing the benefits of anticipated or potential economies of scale.
The Board reviewed and evaluated materials from Broadridge and the Consultant showing how management fee schedules of peer funds reflect economies of scale for the benefit of shareholders as a peer fund’s assets hypothetically increase over time. Based on information provided by HFMC, Broadridge, and the Consultant, the Board recognized that there is no uniform methodology for establishing breakpoints or uniform pattern in asset levels that trigger breakpoints or the amounts of breakpoints triggered.
After considering all of the information available to it, the Board concluded that it was satisfied with the extent to which economies of scale would be shared for the benefit of each Fund’s shareholders based on currently available information and the effective advisory fees and expense ratios for the Fund at its current and reasonably anticipated asset levels. The Board noted, however, that it would continue to monitor future growth in each Fund’s assets and the appropriateness of additional breakpoints.
Other Benefits
The Board considered other benefits to the Advisers and their affiliates from their relationships with the Funds, including the role of each Fund in supporting the variable life insurance and variable annuity products offered by The Hartford.
The Board noted that HLIC, an affiliate of HFMC, receives fees for providing certain administrative services to the Funds and that HFMC receives fees for fund accounting and related services from the Funds. The Board considered information on profits to HLIC and HFMC for such services. The Board considered that it had approved an increase in the Funds’ fund accounting fee rate. The Board reviewed information from Broadridge comparing the new accounting fee rate with relevant industry data and considered that the new fund accounting fee schedule more properly aligned with HFMC’s actual costs for those services. The Board considered that, while the new fee schedule is projected to result in a reasonable increase in overall profitability to HFMC, HFMC expected that it would continue to operate at a net loss with respect to fund accounting services. The Board also considered that Hartford Administrative Services Company (“HASCO”), the Funds’ transfer agent and an affiliate of HFMC, receives transfer agency compensation from the Funds, and the Board reviewed information about the profitability to HASCO of the Funds’ transfer agency function. The Board considered information regarding the transfer agency services provided by HASCO to the Funds and the transfer agency fees received therefor. The Board also noted that HFMC and HASCO had delegated certain fund accounting services and transfer agency services, respectively, to external service providers.
The Board also considered that Hartford Funds Distributors, LLC (“HFD”), an affiliate of HFMC, serves as principal underwriter of the Funds. As principal underwriter, HFD receives distribution and service fees from the Funds. The Board also noted that certain affiliates of HFD receive compensation from HFD, including affiliated insurance companies that offer the Funds as investment options under their contracts.
The Board considered the benefits, if any, to the Sub-adviser from any use of a Fund’s brokerage commissions to obtain soft dollar research, and representations from HFMC and the Sub-adviser that the Sub-adviser does not make any revenue-sharing payments or any other type of distribution payments to HFMC or its affiliates.
The Board considered the benefits to shareholders of being part of the Hartford Funds family of funds. The Board considered HFMC’s efforts to provide investors in the fund family with a broad range of investment styles and asset classes.
Approval of Investment Management and Investment Sub-Advisory Agreements (Unaudited) – (continued)
Fund-by-Fund factors
Hartford Balanced HLS Fund
| • | | The Board noted that the Fund’s performance was in the 1st quintile of its performance universe for the 1-, 3- and 5-year periods. The Board also noted that the Fund’s performance was below its blended custom benchmark for the 1-year period, above its blended custom benchmark for the 3-year period and in line with its blended custom benchmark for the 5-year period. |
| • | | The Board noted that the Fund’s contractual management fee was in the 4th quintile of its expense group, while its actual management fee and total expenses (less 12b-1 and shareholder service fees) were in the 3rd quintile. The Board also noted that the Fund has a temporary management fee waiver through December 31, 2016. |
Hartford Capital Appreciation HLS Fund
| • | | The Board noted that the Fund’s performance was in the 4th quintile of its performance universe for the 1-year period and the 3rd quintile for the 3- and 5-year periods. The Board also noted that the Fund’s performance was below its benchmark for the 1-, 3- and 5-year periods. The Board considered that, in response to questions concerning the Fund’s performance, HFMC stated it has confidence in the Fund’s portfolio management team and investment strategy. The Board noted recent changes to the Fund’s portfolio management team. |
| • | | The Board noted that the Fund’s contractual management fee, actual management fee and total expenses (less 12b-1 and shareholder service fees) were in the 3rd quintile of its expense group. |
Hartford Disciplined Equity HLS Fund
| • | | The Board noted that the Fund’s performance was in the 1st quintile of its performance universe for the 1-, 3- and 5-year periods. The Board also noted that the Fund’s performance was above its benchmark for the 1-, 3- and 5-year periods. |
| • | | The Board noted that the Fund’s contractual management fee, actual management fee and total expenses (less 12b-1 and shareholder service fees) were in the 3rd quintile of its expense group. |
Hartford Dividend and Growth HLS Fund
| • | | The Board noted that the Fund’s performance was in the 2nd quintile of its performance universe for the 1- and 5-year periods and the 1st quintile for the 3-year period. The Board also noted that the Fund’s performance was below its benchmark for the 1-, 3- and 5-year periods. |
| • | | The Board noted that the Fund’s contractual management fee and actual management fee were in the 3rd quintile of its expense group, while its total expenses (less 12b-1 and shareholder service fees) were in the 2nd quintile. |
Hartford Global Growth HLS Fund
| • | | The Board noted that the Fund’s performance was in the 1st quintile of its performance universe for the 1-, 3- and 5-year periods. The Board also noted that the Fund’s performance was above its benchmark for the 1-, 3- and 5-year periods. |
| • | | The Board noted that the Fund’s contractual management fee was in the 5th quintile of its expense group, while its actual management fee was in the 4th quintile and its total expenses (less 12b-1 and shareholder service fees) were in the 2nd quintile. |
Hartford Growth Opportunities HLS Fund
| • | | The Board noted that the Fund’s performance was in the 1st quintile of its performance universe for the 1-, 3- and 5-year periods. The Board also noted that the Fund’s performance was below its benchmark for the 1-year period and above its benchmark for the 3- and 5-year periods. |
| • | | The Board noted that the Fund’s contractual management fee, actual management fee and total expenses (less 12b-1 and shareholder service fees) were in the 1st quintile of its expense group. |
Approval of Investment Management and Investment Sub-Advisory Agreements (Unaudited) – (continued)
Hartford Healthcare HLS Fund
| • | | The Board noted that the Fund’s performance was in the 2nd quintile of its performance universe for the 1-, 3- and 5-year periods. The Board also noted that the Fund’s performance was below its benchmark for the 1-year period and above its benchmark for the 3- and 5-year periods. |
| • | | The Board noted that the Fund’s contractual management fee and actual management fee were in the 3rd quintile of its expense group, while its total expenses (less 12b-1 and shareholder service fees) were in the 2nd quintile. |
Hartford High Yield HLS Fund
| • | | The Board noted that the Fund’s performance was in the 4th quintile of its performance universe for the 1-year period and the 3rd quintile for the 3- and 5-year periods. The Board also noted that the Fund’s performance was above its benchmark for the 1- and 3-year periods and in line with its benchmark for the 5-year period. |
| • | | The Board noted that the Fund’s contractual management fee was in the 3rd quintile of its expense group, while its actual management fee and total expenses (less 12b-1 and shareholder service fees) were in the 4th quintile. |
Hartford International Opportunities HLS Fund
| • | | The Board noted that the Fund’s performance was in the 2nd quintile of its performance universe for the 1-year period and the 1st quintile for the 3- and 5-year periods. The Board also noted that the Fund’s performance was above its benchmark for the 1-, 3- and 5-year periods. |
| • | | The Board noted that the Fund’s contractual management fee and total expenses (less 12b-1 and shareholder service fees) were in the 1st quintile of its expense group, while its actual management fee was in the 2nd quintile. |
Hartford MidCap HLS Fund
| • | | The Board noted that the Fund’s performance was in the 1st quintile of its performance universe for the 1-, 3- and 5-year periods. The Board also noted that the Fund’s performance was above its benchmark for the 1-, 3- and 5-year periods. |
| • | | The Board noted that the Fund’s contractual management fee was in the 2nd quintile of its expense group, while its actual management fee and total expenses (less 12b-1 and shareholder service fees) were in the 1st quintile. |
Hartford MidCap Value HLS Fund
| • | | The Board noted that the Fund’s performance was in the 4th quintile of its performance universe for the 1-year period, the 3rd quintile for the 3-year period and the 2nd quintile for the 5-year period. The Board also noted that the Fund’s performance was below its benchmark for the 1-year period and above its benchmark for the 3- and 5-year periods. |
| • | | The Board noted that the Fund’s contractual management fee, actual management fee and total expenses (less 12b-1 and shareholder service fees) were in the 3rd quintile of its expense group. |
Hartford Small Cap Growth HLS Fund
| • | | The Board noted that the Fund’s performance was in the 3rd quintile of its performance universe for the 1-year period, the 2nd quintile for the 3-year period and the 1st quintile for the 5-year period. The Board also noted that the Fund’s performance was above its benchmark for the 1-, 3- and 5-year periods. |
| • | | The Board noted that the Fund’s contractual management fee, actual management fee and total expenses (less 12b-1 and shareholder service fees) were in the 1st quintile of its expense group. |
Approval of Investment Management and Investment Sub-Advisory Agreements (Unaudited) – (continued)
Hartford Small Company HLS Fund
| • | | The Board noted that the Fund’s performance was in the 5th quintile of its performance universe for the 1-year period and the 4th quintile for the 3- and 5-year periods. The Board also noted that the Fund’s performance was below its benchmark for the 1-, 3- and 5-year periods. The Board considered that, in response to questions concerning the Fund’s performance, HFMC stated it has confidence in the Fund’s portfolio management team and investment strategy. |
| • | | The Board noted that the Fund’s contractual management fee was in the 2nd quintile of its expense group, while its actual management fee and total expenses (less 12b-1 and shareholder service fees) were in the 1st quintile. |
Hartford Small/Mid Cap Equity HLS Fund
| • | | The Board noted that the Fund’s performance was in the 3rd quintile of its performance universe for the 1-, 3- and 5-year periods. The Board also noted that the Fund’s performance was below its benchmark for the 1-year period and in line with its benchmark for the 3- and 5-year periods. |
| • | | The Board noted that the Fund’s contractual management fee and total expenses (less 12b-1 and shareholder service fees) were in the 2nd quintile of its expense group, while its actual management fee was in the 3rd quintile. |
Hartford Stock HLS Fund
| • | | The Board noted that the Fund’s performance was in the 1st quintile of its performance universe for the 1-year period and the 2nd quintile for the 3- and 5-year periods. The Board also noted that the Fund’s performance was above its benchmark for the 1- and 3-year periods and in line with its benchmark for the 5-year period. |
| • | | The Board noted that the Fund’s contractual management fee, actual management fee and total expenses (less 12b-1 and shareholder service fees) were in the 1st quintile of its expense group. |
Hartford Total Return Bond HLS Fund
| • | | The Board noted that the Fund’s performance was in the 5th quintile of its performance universe for the 1-year period and the 2nd quintile for the 3- and 5-year periods. The Board also noted that the Fund’s performance was below its benchmark for the 1-year period, in line with its benchmark for the 3-year period and above its benchmark for the 5-year period. |
| • | | The Board noted that the Fund’s contractual management fee and actual management fee were in the 3rd quintile of its expense group, while its total expenses (less 12b-1 and shareholder service fees) were in the 2nd quintile. |
Hartford Ultrashort Bond HLS Fund
| • | | The Board noted that the Fund’s performance was in the 4th quintile of its performance universe for the 1-year period. The Board also noted that the Fund’s performance was in line with its benchmark for the 1-year period. |
| • | | The Board noted that the Fund’s contractual management fee, actual management fee and total expenses (less 12b-1 and shareholder service fees) were in the 1st quintile of its expense group. |
Hartford U.S. Government Securities HLS Fund
| • | | The Board noted that the Fund’s performance was in the 2nd quintile of its performance universe for the 1-year period and the 3rd quintile for the 3- and 5-year periods. The Board also noted that the Fund’s performance was in line with its benchmark for the 1- and 3-year periods and above its benchmark for the 5-year period. |
| • | | The Board noted that the Fund’s contractual management fee, actual management fee and total expenses (less 12b-1 and shareholder service fees) were in the 1st quintile of its expense group. |
Approval of Investment Management and Investment Sub-Advisory Agreements (Unaudited) – (continued)
Hartford Value HLS Fund
| • | | The Board noted that the Fund’s performance was in the 3rd quintile of its performance universe for the 1-year period and the 2nd quintile for the 3- and 5-year periods. The Board also noted that the Fund’s performance was below its benchmark for the 1-year period and in line with its benchmark for the 3- and 5-year periods. |
| • | | The Board noted that the Fund’s contractual management fee and total expenses (less 12b-1 and shareholder service fees) were in the 3rd quintile of its expense group, while its actual management fee was in the 4th quintile. |
* * * *
Based upon its review of these various factors, among others, the Board concluded that it is in the best interests of each Fund and its shareholders for the Board to approve the Agreements for an additional year. In reaching this decision, the Board did not assign relative weights to the factors discussed above or deem any one or group of them to be controlling in and of themselves. In connection with their deliberations, the Independent Directors met separately in executive session on several occasions, with independent legal counsel and the Consultant, to review the relevant materials and consider their responsibilities under relevant laws and regulations.
THIS PRIVACY POLICY IS NOT PART OF THIS REPORT
Privacy Policy and Practices of The Hartford Financial Services Group, Inc. and its Affiliates
(herein called “we, our, and us”)
This Privacy Policy applies to our United States Operations
We value your trust. We are committed to the responsible:
a) management;
b) use; and
c) protection;
of Personal Information.
This notice describes how we collect, disclose, and protect Personal Information.
We collect Personal Information to:
a) service your Transactions with us; and
b) support our business functions.
We may obtain Personal Information from:
a) You;
b) your Transactions with us; and
c) third parties such as a consumer-reporting agency.
Based on the type of product or service You apply for or get from us, Personal Information such as:
a) your name;
b) your address;
c) your income;
d) your payment; or
e) your credit history;
may be gathered from sources such as applications, Transactions, and consumer reports.
To serve You and service our business, we may share certain Personal Information. We will share Personal Information, only as allowed by law, with affiliates such as:
a) our insurance companies;
b) our employee agents;
c) our brokerage firms; and
d) our administrators.
As allowed by law, we may share Personal Financial Information with our affiliates to:
a) market our products; or
b) market our services;
to You without providing You with an option to prevent these disclosures.
We may also share Personal Information, only as allowed by law, with unaffiliated third parties including:
a) independent agents;
b) brokerage firms;
c) insurance companies;
d) administrators; and
e) service providers;
who help us serve You and service our business.
When allowed by law, we may share certain Personal Financial Information with other unaffiliated third parties who assist us by performing services or functions such as:
a) taking surveys;
b) marketing our products or services; or
c) offering financial products or services under a joint
agreement between us and one or more financial institutions.
We, and third parties we partner with, may track some of the pages You visit through the use of:
a) cookies;
b) pixel tagging; or
c) other technologies;
and currently do not process or comply with any web browser’s “do not track” signal or other similar mechanism that indicates a request to disable online tracking of individual users who visit our websites or use our services.
For more information, please see our Online Privacy Policy, which governs information we collect on our website and our affiliate websites, which is available at Online Privacy Policy.
We will not sell or share your Personal Financial Information with anyone for purposes unrelated to our business functions without offering You the opportunity to:
a) “opt-out;” or
b) “opt-in;”
as required by law.
We only disclose Personal Health Information with:
a) your proper written authorization; or
b) as otherwise allowed or required by law.
Our employees have access to Personal Information in the course of doing their jobs, such as:
a) underwriting policies;
b) paying claims;
c) developing new products; or
d) advising customers of our products and services.
We use manual and electronic security procedures to maintain:
a) the confidentiality; and
b) the integrity of;
Personal Information that we have. We use these procedures to guard against unauthorized access.
Some techniques we use to protect Personal Information include:
a) secured files;
b) user authentication;
c) encryption;
d) firewall technology; and
e) the use of detection software.
We are responsible for and must:
a) identify information to be protected;
b) provide an adequate level of protection for that data;
c) grant access to protected data only to those people
who must use it in the performance of their job-related duties.
Employees who violate our Privacy Policy will be subject to discipline, which may include ending their employment with us.
At the start of our business relationship, we will give You a copy of our current Privacy Policy.
We will also give You a copy of our current Privacy Policy once a year if you maintain a continuing business relationship with us.
We will continue to follow our Privacy Policy regarding Personal Information even when a business relationship no longer exists between us.
As used in this Privacy Notice:
Application means your request for our product or service.
Personal Financial Information means financial information such as:
a) credit history;
b) income;
c) financial benefits; or
d) policy or claim information.
Personal Financial Information may include Social Security Numbers, Driver’s license numbers, or other government-issued identification numbers, or credit, debit card, or bank account numbers.
Personal Health Information means health information such as:
a) your medical records; or
b) information about your illness, disability or injury.
Personal Information means information that identifies You personally and is not otherwise available to the public. It includes:
a) Personal Financial Information; and
b) Personal Health Information.
Transaction means your business dealings with us, such as:
a) your Application;
b) your request for us to pay a claim; and
c) your request for us to take an action on your account.
You means an individual who has given us Personal Information in conjunction with:
a) asking about;
b) applying for; or
c) obtaining;
a financial product or service from us if the product or service is used mainly for personal, family, or household purposes.
This Privacy Policy is being provided on behalf of the following affiliates of The Hartford Financial Services Group, Inc.:
1stAGChoice, Inc.; Access CoverageCorp, Inc.; Access CoverageCorp Technologies, Inc.; American Maturity Life Insurance Company; Archway 60 R, LLC; Business Management Group, Inc.; DMS R, LLC; First State Insurance Company; Fountain Investors I LLC; Fountain Investors II LLC; Fountain Investors III LLC; Fountain Investors IV LLC; FP R, LLC (Delaware); FTC Resolution Company LLC; Hart Re Group L.L.C.; Hartford Accident and Indemnity Company; Hartford Administrative Services Company; Hartford Casualty General Agency, Inc.; Hartford Casualty Insurance Company; Hartford Financial Services, LLC; Hartford Fire General Agency, Inc.; Hartford Fire Insurance Company; Hartford Funds Distributors, LLC; Hartford Funds Management Company, LLC; Hartford Funds Management Group, Inc.; Hartford Holdings, Inc.; Hartford HLS Series Fund II, Inc.; Hartford Insurance Company of Illinois; Hartford Insurance Company of the Midwest; Hartford Insurance Company of the Southeast; Hartford Integrated Technologies, Inc.; Hartford International Life Reassurance Corporation; Hartford Investment Management Company; Hartford Life and Accident Insurance Company; Hartford Life and Annuity Insurance Company; Hartford Life Insurance Company; Hartford Life, Inc.; Hartford Life International Holding Company; Hartford Life Private Placement, LLC; Hartford Lloyd’s Corporation; Hartford Lloyd’s Insurance Company; Hartford of Texas General Agency, Inc.; Hartford Residual Market, L.C.C.; Hartford Securities Distribution Company, Inc.; Hartford Series Fund, Inc.; Hartford Specialty Insurance Services of Texas, LLC; Hartford Strategic Investments, LLC; Hartford Underwriters General Agency, Inc.; Hartford Underwriters Insurance Company; Hartford-Comprehensive Employee Benefit Service Company; HDC R, LLC .; Heritage Holdings, Inc.; HIMCO Distribution Services Company; HIMCO Variable Insurance Trust; HLA LLC; HL Investment Advisors, LLC; Horizon Management Group, LLC; HRA Brokerage Services, Inc.; Lanidex Class B, LLC; ; Lanidex R, LLC (Delaware); MPC Resolution Company LLC; New England Insurance Company; New England Reinsurance Corporation; Nutmeg Insurance Agency, Inc.; Nutmeg Insurance Company; Pacific Insurance Company, Limited; Property and Casualty Insurance Company of Hartford; Revere R, LLC; RVR R, LLC; Sentinel Insurance Company, Ltd.; Sunstone R, LLC; Symphony R, LLC; The Evergreen Group Incorporated; The Hartford Alternative Strategies Fund; The Hartford Mutual Funds, Inc.; The Hartford Mutual Funds II, Inc.; Trumbull Flood Management, L.L.C.; Trumbull Insurance Company; Twin City Fire Insurance Company.
Revised March 2016
Item 2. Code of Ethics.
| | (a) | The registrant, as of the end of the period covered by this report, has adopted a code of ethics that applies to the registrant’s principal executive officer, principal financial officer, principal accounting officer or controller, or persons performing similar functions, regardless of whether these individuals are employed by the registrant or a third party. A copy of the code of ethics is filed herewith. |
| | (c) | The registrant amended the code of ethics on May 3, 2016. The key changes to the code of ethics are as follows: (1) simplify the code provisions, (2) simplify the waiver process, and (3) require that the specified officers in the code of ethics complete an initial and annual certification. |
| | (d) | The registrant has not granted any waivers, including an implicit waiver, from a provision of the code of ethics that applies to the registrant’s principal executive officer, principal financial officer, principal accounting officer or controller, or persons performing similar functions, regardless of whether these individuals are employed by the registrant or a third party, that relates to one or more of the items set forth in paragraph (b) of this item’s instructions. |
Item 3. Audit Committee Financial Expert.
The Board of Directors of the Registrant (the “Board”) has designated Phillip O. Peterson as an Audit Committee Financial Expert. Mr. Peterson is considered by the Board to be an independent director.
Item 4. Principal Accountant Fees and Services.
| | (a) | Audit Fees: The aggregate fees billed for each of the last two fiscal years for professional services rendered by the principal accountant for the audit of the registrant’s annual financial statements or services that are normally provided by the accountant in connection with statutory and regulatory filings or engagements for those fiscal years were: |
| | | $367,360 for the fiscal year ended December 31, 2015; $382,000 for the fiscal year ended December 31, 2016. |
| | (b) | Audit Related Fees: The aggregate fees billed in each of the last two fiscal years for assurance and related services by the principal accountant that are reasonably related to the performance of the audit of the registrant’s financial statements and are not reported under paragraph (a) of this Item were: |
| | | $25,634 for the fiscal year ended December 31, 2015; $7,895 for the fiscal year ended December 31, 2016. Audit-related services are principally in connection with Rule 17Ad-13 under the Securities Exchange Act of 1934. |
| | (c) | Tax Fees: The aggregate fees billed in each of the last two fiscal years for professional services rendered by the principal accountant for tax compliance, tax advice, and tax planning were: |
$88,114 for the fiscal year ended December 31, 2015; $85,204 for the fiscal year ended December 31, 2016. Tax-related services are principally in connection with, but not limited to, general tax services and Passive Foreign Investment Company (PFIC) analysis.
| | (d) | All Other Fees: The aggregate fees billed in each of the last two fiscal years for products and services provided by the principal accountant, other than the services reported in paragraphs (a) through (c) of this Item were: |
$0 for the fiscal year ended December 31, 2015; $0 for the fiscal year ended December 31, 2016.
| | (e) | (1) The Pre-Approval Policies and Procedures (the “Policy”) adopted by the Audit Committee of the Registrant (also, the “Fund”) sets forth the procedures pursuant to which services performed by the independent registered public accounting firm for the Registrant may be pre-approved. The following are some main provisions from the Policy. |
| | 1. | The Audit Committee must pre-approve all audit services and non-audit services that the independent registered public accounting firm provides to the Fund. |
| | 2. | The Audit Committee must pre-approve any engagement of the independent registered public accounting firm to provide non-audit services to any Service Affiliate (which is defined to include any entity controlling, controlled by, or under common control with the investment adviser that provides ongoing services to the Fund) during the period of the independent registered public accounting firm’s engagement to provide audit services to the Fund, if the non-audit services to the Service Affiliate directly impact the Fund’s operations and financial reporting. |
| | 3. | The Audit Committee shall pre-approve certain non-audit services to the Fund and its Service Affiliates pursuant to procedures set forth in the Policy. |
| | 4. | The Audit Committee, from time to time, may designate one or more of its members who are Independent Directors (each a “Designated Member”) to consider, on the Audit Committee’s behalf, any non-audit services, whether to the Fund or to any Service Affiliate, that have not been pre-approved by the Audit Committee. The Designated Member also shall review, on the Audit Committee’s behalf, any proposed material change in the nature or extent of any non-audit services previously approved. In considering any requested non-audit services or proposed material change in such services, the Designated Member shall not authorize services which would exceed $50,000 in fees for such services. |
| | 5. | The independent registered public accounting firm may not provide specified prohibited non-audit services set forth in the Policy to the Fund, the Fund’s investment adviser, the Service Affiliates or any other member of the investment company complex. |
| | (e) | (2) One hundred percent of the services described in items 4(b) through 4(d) were approved in accordance with the Audit Committee’s Pre-Approval Policy. As a result, none of such services was approved pursuant to paragraph (c)(7)(i)(c) of Rule 2-01 of Regulation S-X. |
| | (f) | None of the hours expended on the principal accountant’s engagement to audit the registrant’s financial statements for the year ended December 31, 2016, were attributed to work performed by persons other than the principal accountant’s full-time, permanent employees. |
| | (g) | The aggregate non-audit fees billed by the registrant’s accountant for services rendered to the registrant, and rendered to the registrant’s investment adviser (not including any sub-adviser whose role is primarily portfolio management and is subcontracted with or overseen by another investment adviser), and any entity controlling, controlled by, or under common control with the adviser that provides ongoing services to the registrant for each of the last two fiscal years of the registrant were: |
$1,862,111 for the fiscal year ended December 31, 2015; $1,294,322 for the fiscal year ended December 31, 2016.
| | (h) | The registrant’s audit committee of the board of directors has considered whether the provision of non-audit services that were rendered to the registrant’s investment adviser (not including any sub-adviser whose role is primarily portfolio management and is subcontracted with or overseen by another investment adviser), and any entity controlling, controlled by, or under common control with the investment adviser that provides ongoing services to the registrant that were not pre-approved pursuant to paragraph (c)(7)(ii) of Rule 2-01 of Regulation S-X is compatible with maintaining the principal accountant’s independence. |
Item 5. Audit Committee of Listed Registrants.
Not applicable.
Item 6. Investments.
| | (a) | The Schedule of Investments in securities of unaffiliated issuers as of the close of the reporting period is included as part of the annual report filed under Item 1 of this form. |
Item 7. Disclosure of Proxy Voting Policies and Procedures for Closed-End Management Investment Companies.
Not applicable.
Item 8. Portfolio Managers of Closed-End Management Investment Companies.
Not applicable.
Item 9. Purchases of Equity Securities by Closed-End Management Investment Company and Affiliated Purchasers.
Not applicable.
Item 10. Submission of Matters to a Vote of Security Holders.
There have been no material changes to the procedures by which shareholders may recommend nominees to the registrant’s board of directors since registrant last provided disclosure in response to this requirement.
Item 11. Controls and Procedures.
| | (a) | The registrant’s principal executive and principal financial officers, or persons performing similar functions, have concluded that the registrant’s disclosure controls and procedures (as defined in Rule 30a-3(c) under the Investment Company Act of 1940, as amended (the “1940 Act”) (17 CFR 270.30a-3(c))) are generally effective to provide reasonable assurance, as of a date within 90 days of the filing date of the report that includes the disclosure required by this paragraph, based on their evaluation of these controls and procedures required by Rule 30a-3(b) under the 1940 Act (17 CFR 270.30a-3(b)) and Rules 13a-15(b) or 15d-15(b) under the Securities Exchange Act of 1934, as amended (17 CFR 240.13a-15(b) or 240.15d-15(b)). |
| | (b) | There were no changes in the registrant’s internal control over financial reporting (as defined in Rule 30a-3(d) under the 1940 Act (17 CFR 270.30a-3(d)) that occurred during the registrant’s second fiscal quarter of the period covered by this report that have materially affected, or is reasonably likely to materially affect, the registrant’s internal control over financial reporting. |
Item 12. Exhibits.
(a)(1) Code of Ethics.
(a)(2) Separate certifications for each principal executive officer and principal financial officer of the registrant as required by Rule 30a-2(a) under the 1940 Act (17 CFR 270.30a-2(a)) and Section 302 of the Sarbanes-Oxley Act of 2002 are attached hereto.
(a)(3) Not applicable.
(b) Certifications pursuant to Rule 30a-2(b) under the 1940 Act and Section 906 of the Sarbanes-Oxley Act of 2002 are attached hereto.
SIGNATURES
Pursuant to the requirements of the Securities Exchange Act of 1934 and the Investment Company Act of 1940, the registrant has duly caused this report to be signed on its behalf by the undersigned, thereunto duly authorized.
| | | | | | |
| | | | HARTFORD SERIES FUND, INC. |
| | | |
Date: February 27, 2017 | | | | By: | | /s/ James E. Davey |
| | | | | | James E. Davey, President and |
| | | | | | Chief Executive Officer |
Pursuant to the requirements of the Securities Exchange Act of 1934 and the Investment Company Act of 1940, this report has been signed below by the following persons on behalf of the registrant and in the capacities and on the dates indicated.
| | | | | | |
Date: February 27, 2017 | | | | By: | | /s/ James E. Davey |
| | | | | | James E. Davey, President and |
| | | | | | Chief Executive Officer |
| | | |
Date: February 27, 2017 | | | | By: | | /s/ Michael Flook |
| | | | | | Michael Flook, Vice President, |
| | | | | | Treasurer and Controller |