UNITED STATES
SECURITIES AND EXCHANGE COMMISSION
Washington, D.C. 20549
FORMN-CSR
CERTIFIED SHAREHOLDER REPORT OF REGISTERED MANAGEMENT
INVESTMENT COMPANIES
Investment Company Act file number:811-08629
HARTFORD SERIES FUND, INC.
(Exact name of registrant as specified in charter)
690 Lee Road, Wayne, Pennsylvania 19087
(Address of Principal Executive Offices) (Zip Code)
Thomas R. Phillips, Esquire
Hartford Funds Management Company, LLC
690 Lee Road
Wayne, Pennsylvania 19087
(Name and Address of Agent for Service)
Registrant’s telephone number, including area code: (610)386-4068
Date of fiscal year end: December 31
Date of reporting period: December 31, 2018
FormN-CSR is to be used by management investment companies to file reports with the Commission not later than 10 days after the transmission to stockholders of any report that is required to be transmitted to stockholders under Rule30e-1 under the Investment Company Act of 1940 (17 CFR270.30e-1). The Commission may use the information provided on FormN-CSR in its regulatory, disclosure review, inspection, and policymaking roles.
A registrant is required to disclose the information specified by FormN-CSR, and the Commission will make this information public. A registrant is not required to respond to the collection of information contained in FormN-CSR unless the Form displays a currently valid Office of Management and Budget (“OMB”) control number. Please direct comments concerning the accuracy of the information collection burden estimate and any suggestions for reducing the burden to Secretary, Securities and Exchange Commission, 100 F Street, NE, Washington, DC 20549. The OMB has reviewed this collection of information under the clearance requirements of 44 U.S.C. § 3507.
Item 1. Reports to Stockholders.
A MESSAGE FROM THE PRESIDENT
Dear Shareholders:
Thank you for investing in Hartford HLS Funds. The following is the Funds’ Annual Report covering the period from January 1, 2018 through December 31, 2018.
Market Review
The market was volatile in 2018, particularly at the end of the year. For the first time since 2008, the S&P 500 Index1 closed the year with a negative return,-4.38%.
Rising interest rates, inflation anxiety, slowing global growth, and concerns surrounding U.S. tariffs and foreign policy have all contributed to increased volatility.
Throughout 2018, the U.S. Federal Reserve (Fed) continued its cycle of interest-rate increases. At the end of December 2018, short-term rates had risen to 2.5%. At the time of this writing, expectations were for two additional raises in 2019. Central banks overseas also began to unwind their accommodative policies by raising interest rates.
Domestic and foreign politics are likely to play a key role in market movements in 2019. For example, potential gridlock due to divided government and ongoing trade tensions with China could impact U.S. markets significantly. Abroad, uncertainties surrounding the future of the “Brexit” undertaking for the United Kingdom to leave the European Union may impact global markets.
Despite increased volatility, unemployment is low in the U.S. and the U.S. economy is supported by a strong job market, higher wages, and healthy consumer confidence.
We encourage you to maintain a strong relationship with your financial advisor, who can help guide you through shifting markets confidently. He or she can help you proactively build a portfolio that takes market uncertainty into account, along with your unique investment goals and risk tolerances. Your financial advisor can help you find a fit within our family of funds as you work toward those goals.
Thank you again for investing in Hartford HLS Funds. For the mostup-to-date information on our funds, please take advantage of all the resources available at hartfordfunds.com.

James Davey
President
Hartford HLS Funds
| 1 | S&P 500 Index is a market capitalization-weighted price index composed of 500 widely held common stocks. The index is unmanaged and not available for direct investment. Past performance is not indicative of future results. |
Hartford HLS Funds
Table of Contents
The views expressed in each Fund’s Manager Discussion contained in the Fund Overview section are views of that Fund’s sub-adviser and portfolio management team through the end of the period and are subject to change based on market and other conditions. Each Fund’s Manager Discussion is for informational purposes only and does not represent an offer, recommendation or solicitation to buy, hold or sell any security. The specific securities identified and described, if any, do not represent all of the securities purchased or sold and you should not assume that investments in the securities identified and discussed will be profitable.
|
| Hartford Balanced HLS Fund |
Fund Overview
December 31, 2018 (Unaudited)
| | |
Inception 3/31/1983 Sub-advised by Wellington Management Company LLP | | Investment objective – The Fund seeks long-term total return. |
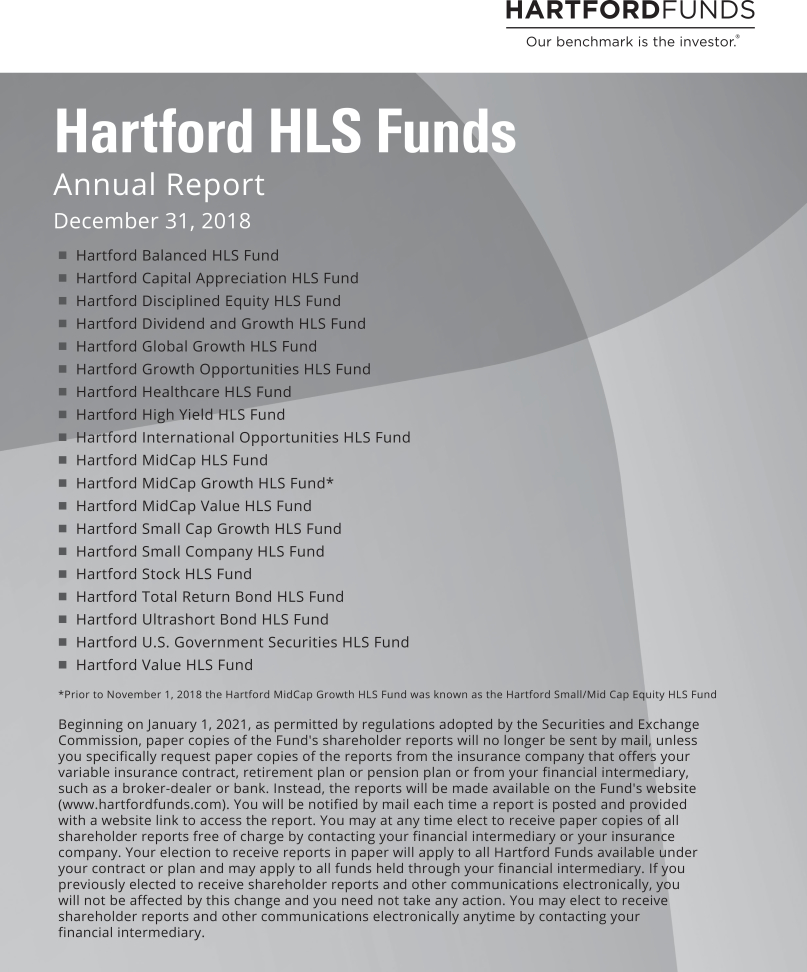
The chart above represents the hypothetical growth of a $10,000 investment in Class IA. Growth results in classes other than Class IA will vary from what is seen above due to differences in the expenses charged to those share classes.
Average Annual Total Returns
for the Periods Ending 12/31/18
| | | | | | | | | | | | |
| | | 1 Year | | | 5 Years | | | 10 Years | |
Class IA | | | -5.24% | | | | 5.02% | | | | 9.94% | |
Class IB | | | -5.50% | | | | 4.75% | | | | 9.67% | |
60% S&P 500 Index/ 35% Bloomberg Barclays Government/Credit Bond Index/ 5% ICE BofAML US 3-Month Treasury Bill Index | | | -2.41% | | | | 6.14% | | | | 9.25% | |
S&P 500 Index | | | -4.38% | | | | 8.49% | | | | 13.12% | |
Bloomberg Barclays Government/Credit Bond Index | | | -0.42% | | | | 2.53% | | | | 3.46% | |
ICE BofAML US 3-Month Treasury Bill Index | | | 1.88% | | | | 0.63% | | | | 0.37% | |
PERFORMANCE DATA QUOTED REPRESENTS PAST PERFORMANCE AND DOES NOT GUARANTEE FUTURE RESULTS. The investment return and principal value of the investment will fluctuate so that investors’ shares, when redeemed, may be worth more or less than their original cost. Current performance may be lower or higher than the performance data quoted. To obtain performance data current to the most recent month-end, please visit our website www.hartfordfunds.com.
Total returns presented above were calculated using the Fund’s net asset value available to shareholders for sale or redemption of Fund shares on December 31, 2018, which may exclude investment transactions as of this date. All share class returns assume the reinvestment of all distributions at net asset value and the deduction of all fund expenses.
60% S&P 500 Index/ 35% Bloomberg Barclays Government/Credit Bond Index/ 5% ICE BofAML US 3-Month Treasury Bill Index is calculated by Hartford Funds Management Company, LLC.
S&P 500 Index(reflects no deduction for fees, expenses or taxes) is a float-adjusted market capitalization-weighted price index composed of 500 widely held common stocks.
Bloomberg Barclays Government/Credit Bond Index(reflects no deduction for fees, expenses or taxes) is designed to measure the non-securitized component of the U.S. Aggregate Index. It includes investment grade, U.S. dollar-denominated, fixed-rate Treasuries, government-related and corporate securities.
ICE BofAML US 3-Month Treasury Bill Index (reflects no deduction for fees, expenses or taxes) is comprised of a single issue purchased at the beginning of the month and held for a full month. At the end of the month that issue is sold and rolled into a newly selected issue. The issue selected at each month-end rebalancing is the outstanding Treasury Bill that matures closest to, but not beyond, three months from the rebalancing date. To qualify for selection, an issue must have settled on or before the month-end rebalancing date.
You cannot invest directly in an index.
Performance information may reflect historical or current waivers/reimbursements without which performance would have been lower. For information on current expense waivers/reimbursements, please see the prospectus.
As shown in the Fund’s prospectus dated May 1, 2018, the total annual fund operating expense ratios for Class IA and Class IB were 0.66% and 0.91%, respectively. The Fund filed a supplement to its prospectus, dated November 19, 2018, with the U.S. Securities and Exchange Commission that updated the Fund’s total annual fund operating expense table effective January 1, 2019. However, the information in this annual report is as of December 31, 2018 and does not reflect any changes made to the total annual fund operating expense table in the prospectus, as supplemented. The net expense ratios shown in the supplement are as follows: 0.63% (Class IA) and 0.88% (Class IB). The gross expense ratios shown in the supplement are as follows: 0.66% (Class IA) and 0.91% (Class IB). This contractual waiver will remain in effect through April 30, 2020 unless the Board of Directors of the Fund approves its earlier termination. Actual expenses may be higher or lower. Please see the accompanying Financial Highlights for expense ratios for the year ended December 31, 2018.
The chart and table do not reflect the deductions of taxes, sales charges or other fees which may be applied at the variable contract level or by a qualified pension or retirement plan. Any such additional sales charges or other fees or expenses would lower the contract’s or plan’s performance.
The Fund is closed to certain qualified pension and retirement plans. For more information, please see the Fund’s statutory prospectus.
|
| Hartford Balanced HLS Fund |
Fund Overview – (continued)
December 31, 2018 (Unaudited)
Portfolio Managers
Adam H. Illfelder, CFA
Managing Director and Equity Portfolio Manager
Wellington Management Company LLP
Michael E. Stack, CFA
Senior Managing Director and Fixed Income Portfolio Manager
Wellington Management Company LLP
Loren L. Moran, CFA
Senior Managing Director and Fixed Income Portfolio Manager
Wellington Management Company LLP
Manager Discussion
How did the Fund perform during the period?
The Class IA shares of Hartford Balanced HLS Fund returned-5.24% for the twelve-month period ended December 31, 2018, underperforming the Fund’s custom benchmark (60% S&P 500 Index, 35% Bloomberg Barclays Government/Credit Bond Index, and 5% ICE BofAML US3-Month Treasury Bill Index), which returned-2.41% for the same period. The S&P 500, Bloomberg Barclays Government/Credit Bond, and ICE BofAML US3-Month Treasury Bill Indices returned-4.38%,-0.42% and 1.88%, respectively for the same period. During the same period, the Class IA shares of the Fund outperformed the-6.64% average return of the Lipper Mixed-Asset Target Allocation Growth Funds peer group, a group of funds that hold between60%-80% in equity securities, with the remainder invested in bonds, cash, and cash equivalents.
Why did the Fund perform this way?
U.S. equities, as measured by the S&P 500 Index, posted negative results over the trailing twelve month period ending December 31, 2018. Bullish sentiment was exceptionally strong to start the year, as better-than-expected corporate profits helped drive U.S. equities higher. Returns in October and December were sharply negative, with the latter representing the largest U.S. equity market monthly decline seen this decade, culminating the first year of negative U.S. equity returns since 2008.
During the twelve-month period, three of the eleven sectors within the S&P 500 Index posted positive returns, led by Healthcare (+6%), Utilities (+4%), and Consumer Discretionary (+1%), while Energy(-18%) and Communication Services(-15%) fell the most.
U.S. fixed income markets largely generated negative total returns during the year, driven by corporate spread widening and higher yields as measured by the Bloomberg Barclays Global Aggregate Index. Geopolitical uncertainty remained elevated despite some seemingly positive developments, including a temporary U.S. and China trade truce, survived confidence vote by U.K. Prime Minister May, and compromised budget plan between Italy and the European Union (EU).
Global monetary policy continued along a less accommodative path during the period. The Federal Reserve (Fed) increased rates four times and projected additional increases, but set expectations that the pace of tightening may slow. The European Central Bank (ECB) concluded its asset purchase program but announced it would continue reinvestments for an extended period after the first rate increase, slated for the second half of 2019.
Early in the period, U.S. yields generally moved higher, driven by continued global growth momentum and rising inflation expectations. However, late in the year, yields declined amid a spike in equity market volatility and increasing concerns about slowing global growth. The prospect of fewer Fed rate increases in 2019 amid a deteriorating global economic outlook contributed to a decline in U.S. yields late in the period but they still finished higher for the year. The yield curve flattened substantially during the year as Fed rate increases propelledfront-end rates higher.
During the period, asset allocation decisions detracted from the custom benchmark-relative performance during the period. The Fund was generally overweight equities and underweight fixed income and cash relative to the custom benchmark. The equity portion of the Fund underperformed the S&P 500 Index while the fixed income portion of the Fund outperformed the Bloomberg Barclays Government/Credit Bond Index.
Equity underperformance versus the S&P 500 Index was driven primarily by security selection. In particular, weak security selection in the Consumer Discretionary, Consumer Staples, and Finance sectors detracted from performance relative to the S&P 500 Index, which was partially offset by stronger selection in the Information Technology and Communication Services sector. Sector allocation, which is a residual of ourbottom-up security selection process, contributed positively to relative performance during the period primarily due to the Fund’s overweight to the Healthcare sector and underweight to the Consumer Staples sector, which was slightly offset by an overweight to Energy and Materials sectors.
Stocks that detracted the most from returns relative to the S&P 500 Index and absolute returns in the equity portion of the Fund during the period were Invesco (Financials), British-American Tobacco (Consumer Staples), and Fortune Brands Home (Consumer Discretionary). Shares of the Invesco, a U.S.-based investment management company, fell over 52% as a result of broad market weakness, weak fund flows, and uncertainty about the impact of their recent acquisition of Oppenheimer. We maintained a position in the stock as of the end of the period. British-American Tobacco, aUK-based tobacco company, shares were impacted by concerns about the long-term trajectory of the U.S. cigarette business, due to increased Federal Drug Administration (FDA) regulation and the significant growth of the JUULe-vapor product. The FDA is seeking to ban menthol in U.S. tobacco products, which would have a meaningful impact on the company’s U.S. business and their important Newport brand. We exited the position during the fourth quarter on concerns about greater FDA regulation and added risk from their
|
| Hartford Balanced HLS Fund |
Fund Overview – (continued)
December 31, 2018 (Unaudited)
balance sheet leverage. Shares of Fortune Brands Home, a U.S.-based manufacturer of home fixtures and hardware, declined due to softer-than-expected demand during the fourth quarter of 2018. In addition, underwhelming new construction end market shipments in the fourth quarter of 2018 and lower starts expectations in 2019 may limit organic growth for the company. We maintain a position in the stock at the end of the period. Invesco (Financials), Citigroup (Financials), and Philip Morris International (Consumer Staples) were the top detractors from absolute returns during the period.
Top contributors to performance relative to the S&P 500 Index in the equity portion of the Fund during the period included Eli Lilly (Healthcare), XL Group (Financials), and NextEra Energy (Energy). Eli Lilly, a U.S.-based global pharmaceutical company, returned more than 50% during the period, as the company reported strong third quarter results and released positive data on their diabetes franchise. Shares of XL Group, a global insurance and reinsurance company, rose sharply after the company agreed to be acquired by France-based insurer AXA. We eliminated the Fund’s position during the period. Shares of NextEra Energy, a U.S.-based clean energy company, rose during the period as the company reported strong second quarter earnings. The year-over-year earnings growth was led by solid contribution from both Florida Power & Light Company and NextEra Energy Resources segments. The enhanced growth was primarily due to new investments made at both the segments. Microsoft (Information Technology), Eli Lilly (Healthcare), and XL Group (Financials) were the top contributors to absolute returns during the period.
The fixed income portion of the Fund outperformed the Bloomberg Barclays Government/Credit Bond Index during the period. Short duration/yield curve positioning was the primary contributor to relative performance. Investment grade credit positioning contributed positively overall, as positive impacts from an overweight to and security selection within the Industrials, Sovereigns and Taxable Municipals sectors more than offset a negative impact from an overweight to Financials and Utilities sectors.Out-of-benchmark allocation to Treasury Inflation-Protected Securities (TIPS) detracted from performance relative to the Bloomberg Barclays Government/Credit Bond Index, particularly in the last quarter of 2018 as TIPS underperformed duration-equivalent nominal U.S. Treasuries. An out of benchmark allocation to agency Mortgage-Backed Securities (MBS) pass-throughs and Collateralized Loan Obligations (CLOs) detracted modestly from relative performance.
Derivatives were not used in a significant manner in the Fund during the period and did not have a material impact on performance during the period.
What is the outlook as of the end of the period?
Economic updates remained solid during the period, but rising uncertainty on a range of issues contributed to a deterioration in investor sentiment. Job growth remained steady through the period and the unemployment rate remained below 4%. Consumer confidence and retail sales have remained strong throughout the year, and initial reports from the holiday season have been solid. Inflation remains benign, partly thanks to lower oil prices, which we believe may benefit the consumer in 2019. The Fed highlighted in December that wages have started to increase which we believe may also help the U.S. consumer, but may also serve as a source of margin pressure in several domestic industries.
On the fixed income side, we have a cautious view of risk assets and as a result, the Fund has reduced exposure to corporate bonds. With better interest rate valuations, and as we expect the Fed to be more data dependent as we approach the terminal policy rate, and with much of the
rise in short- term rates behind us, we have chosen to seek to limit the Fund’s interest rate risk relative to the benchmark and have reduced the Fund’s short duration positioning. Credit remains a main investment focus of the portfolio. While the Fund is positioned with an overweight to corporate credit, we favor higher quality and less cyclical sectors. We believe that the market should benefit from continued tailwinds of tax reform, deregulation, and fiscal stimulus. Despite the prolonged economic cycle and persistently strong earnings from the corporate sector, we are viewing the credit cycle as mature with most of the narrowing of spreads (corporate compared to Treasury) behind us.
Within equities, the Fund ended the period most overweight to the Healthcare sector and most underweight to the Consumer Discretionary sector. Within fixed income, the Fund ended the period with a moderatelypro-cyclical risk posture, continuing to favor investment grade credit, particularly in the U.S. Financials sector. As of the end of the period, the Fund is positioned with an overweight to taxable municipal bonds for the diversification benefit we believe they provide and maintained long inflation break evens via an allocation to TIPS. The Fund ownsout-of-benchmark allocations to securitized sectors MBS, Commercial Mortgage Backed Securities (CMBS), and Asset Backed Securities (ABS) as of the end of the period.
At the end of the period, the Fund’s equity exposure was at 67% compared to 60% in its custom benchmark.
Important Risks
Investing involves risk, including the possible loss of principal. The Fund seeks to achieve its investment objective by allocating assets among different asset classes. There is no guarantee the Fund will achieve its stated objective. Security prices fluctuate in value depending on general market and economic conditions and the prospects of individual companies.• Foreign investments may be more volatile and less liquid than U.S. investments and are subject to the risk of currency fluctuations and adverse political and economic developments.• Fixed income security risks include credit, liquidity, call, duration, and interest-rate risk. As interest rates rise, bond prices generally fall.• Mortgage related- and asset-backed securities’ risks include credit, interest-rate, prepayment, and extension risk.• Obligations of U.S. Government agencies are supported by varying degrees of credit but are generally not backed by the full faith and credit of the U.S. Government.
Composition by Security Type(1)
as of December 31, 2018
| | | | |
| Category | | Percentage of
Net Assets | |
Equity Securities | | | | |
Common Stocks | | | 65.1 | % |
| | | | |
Total | | | 65.1 | % |
| | | | |
Fixed Income Securities | | | | |
Asset & Commercial Mortgage Backed Securities | | | 3.7 | % |
Corporate Bonds | | | 18.4 | |
Foreign Government Obligations | | | 0.6 | |
Municipal Bonds | | | 1.1 | |
U.S. Government Agencies | | | 0.9 | |
U.S. Government Securities | | | 8.4 | |
| | | | |
Total | | | 33.1 | % |
| | | | |
Short-Term Investments | | | 1.6 | |
Other Assets & Liabilities | | | 0.2 | |
| | | | |
Total | | | 100.0 | % |
| | | | |
| (1) | For Fund compliance purposes, the Fund may not use the same classification system. These classifications are used for financial reporting purposes. |
|
| Hartford Capital Appreciation HLS Fund |
Fund Overview
December 31, 2018 (Unaudited)
| | |
Inception 4/02/1984 Sub-advised by Wellington Management Company LLP | | Investment objective – The Fund seeks growth of capital. |
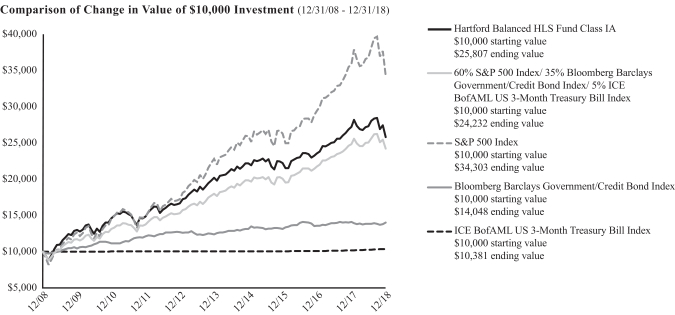
The chart above represents the hypothetical growth of a $10,000 investment in Class IA. Growth results in classes other than Class IA will vary from what is seen above due to differences in the expenses charged to those share classes.
Average Annual Total Returns
for the Periods Ending 12/31/18
| | | | | | | | | | | | |
| | | 1 Year | | | 5 Years | | | 10 Years | |
Class IA | | | -6.96% | | | | 5.39% | | | | 12.39% | |
Class IB | | | -7.18% | | | | 5.12% | | | | 12.11% | |
Class IC | | | -7.41% | | | | 4.86% | | | | 11.83% | |
Russell 3000 Index | | | -5.24% | | | | 7.91% | | | | 13.18% | |
S&P 500 Index | | | -4.38% | | | | 8.49% | | | | 13.12% | |
PERFORMANCE DATA QUOTED REPRESENTS PAST PERFORMANCE AND DOES NOT GUARANTEE FUTURE RESULTS. The investment return and principal value of the investment will fluctuate so that investors’ shares, when redeemed, may be worth more or less than their original cost. Current performance may be lower or higher than the performance data quoted. To obtain performance data current to the most recent month-end, please visit our website www.hartfordfunds.com.
Total returns presented above were calculated using the Fund’s net asset value available to shareholders for sale or redemption of Fund shares on December 31, 2018, which may exclude investment transactions as of this date. All share class returns assume the reinvestment of all distributions at net asset value and the deduction of all fund expenses.
Class IC shares commenced operations on April 30, 2014. Class IC shares performance prior to that date reflects Class IA shares performance adjusted to reflect the 12b-1 fee of 0.25% and the administrative services fee of 0.25% applicable to Class IC shares. The performance after such date reflects actual Class IC shares performance.
Russell 3000 Index(reflects no deduction for fees, expenses or taxes) is designed to measure the performance of the 3,000 largest U.S. companies based on total market capitalization.
S&P 500 Index(reflects no deduction for fees, expenses or taxes) is a float-adjusted market capitalization-weighted price index composed of 500 widely held common stocks.
You cannot invest directly in an index.
Performance information may reflect historical waivers/reimbursements without which performance would have been lower.
As shown in the Fund’s current prospectus, the total annual fund operating expense ratios for Class IA, Class IB and Class IC were 0.68%, 0.93% and 1.18%, respectively. Actual expenses may be higher or lower. Please see the accompanying Financial Highlights for expense ratios for the year ended December 31, 2018.
The chart and table do not reflect the deductions of taxes, sales charges or other fees which may be applied at the variable contract level or by a qualified pension or retirement plan. Any such additional sales charges or other fees or expenses would lower the contract’s or plan’s performance.
The Fund is closed to certain qualified pension and retirement plans. For more information, please see the Fund’s statutory prospectus.
|
| Hartford Capital Appreciation HLS Fund |
Fund Overview – (continued)
December 31, 2018 (Unaudited)
Portfolio Managers
Gregg R. Thomas, CFA
Senior Managing Director and Director of Investment Strategy
Wellington Management Company LLP
Manager Discussion
How did the Fund perform during the period?
The Class IA shares of Hartford Capital Appreciation HLS Fund returned-6.96% for the twelve-month period ended December 31, 2018, underperforming the Fund’s benchmarks, the Russell 3000 Index and the S&P 500 Index, which returned-5.24% and-4.38%, respectively, for the same period. For the same period, Class IA shares of the Fund outperformed the-7.87% average return of the LipperMulti-Cap Core Funds peer group, a group of funds with investment strategies similar to those of the Fund.
Why did the Fund perform this way?
U.S. equities, as measured by the S&P 500 Index, posted negative results over the trailing twelve-month period ending December 31, 2018. The Federal Reserve (Fed) raised its benchmark interest rate by 0.25% four times during the year, in line with expectations, although they signaled a more dovish path heading into 2019. (“Dovish” describes a monetary policy that favors lower interest rates to encourage economic growth.) Bullish sentiment was exceptionally strong to start the year, as better-than-expected corporate profits helped drive U.S. equities higher. Signs of inflation entered the market in February of 2018 which led to heightened levels of volatility, a theme that continued for the remainder of the year. By the summer of 2018, talk of tariffs and trade wars had progressed to implementation, raising concerns in an otherwise strong economy. Nonetheless, positive sentiment persisted, fueled by robust earnings growth, fiscal stimulus, the announcement of a preliminary trade deal between the U.S. and Mexico, and expectations for stronger U.S. economic growth relative to other regions of the world. This changed in the final months of 2018, when concerns surrounding slowing global growth, rich valuations, rising central bank benchmark interest rates, and capricious U.S. and China trade tensions were at the forefront of investors’ minds. Returns in October and December were sharply negative, with the latter representing the largest U.S. equity market monthly decline seen this decade, culminating the first year of negative U.S. equity returns since 2008.
Returns varied bymarket-cap during the period, aslarge-cap equities, as measured by the S&P 500 Index, outperformed both small- andmid-cap equities, as measured by the Russell 2000 Index and S&P MidCap 400 Index, respectively. During the twelve-month period, eight of the eleven sectors in the Russell 3000 Index had negative returns. Energy(-20.0%), Materials(-16.4%), and Industrials(-14.1%) were the worst performers, while Healthcare (+5.3), Utilities (+4.6%), and Information Technology (+0.5%) performed best.
Security selection was the primary detractor from performance relative to the Russell 3000 Index during the period. Weak stock selection in the Healthcare, Consumer Discretionary, and Information Technology sectors was only partially offset by positive selection in the Industrials and Real Estate sectors. Sector allocation, a result of the Fund’sbottom-up security selection process, contributed positively to
performance relative to the Russell 3000 Index during the period. An overweight to the Consumer Staples sector and an underweight to the Financials and Energy sectors contributed positively to returns relative to the Russell 3000 Index. This was only partially offset by an overweight to the Materials and Industrials sectors, which detracted from benchmark-relative performance. Factor impact on the Fund was neutral. Exposure to volatility factors was positive but was offset by exposure to dividend yield. International exposure (country and currency) also detracted from relative performance, in particular due to the Fund’s exposure within Europe (Switzerland, France, and the United Kingdom) and Emerging Markets (China and South Korea).
The largest detractors to performance relative to the Russell 3000 Index over the period were Amazon (Consumer Discretionary), Microsoft (Information Technology), and Halliburton (Energy). Underweight exposure to U.S.-based globale-commerce retailer Amazon detracted from performance relative to the Russell 3000 Index. The stock price rose after the company posted strong earnings during the period as investors continued to be bullish on the prospects of continued strong growth. We believe the fundamentals across Amazon’s three key business units remain robust and the company continues to expand its categories, many of which have a high likelihood of success. While we have added to the position over the period, we remained underweight relative to the Russell 3000 Index. Underweight exposure to Microsoft, a U.S.-based developer of software products and services, detracted from performance relative to the Russell 3000 Index. Microsoft’s stock price rose during the period as the company released strong quarterly and fiscal 2018 financial results driven by robust performance across all business segments (productivity and business processes, intelligent cloud, and personal computing). Halliburton is a U.S.-based oil service company. The stock price declined during the period with falling oil prices. Bank OZK (Financials) and Citigroup (Financials) were among the top absolute detractors during the period.
The largest contributors to performance relative to the Russell 3000 Index over the period were ServiceNow (Information Technology), Facebook (Communications Services), and General Electric (Industrials). ServiceNow is a U.S.-based provider of cloud-based services that automate enterprise IT operations. The stock price rose as underlying results and guidance were better than the market expected during each quarterly earnings report. The market continued to have confidence in the company’s strong fundamentals momentum, as it has been successful at selling their products more broadly. The Fund continued to have an overweight to ServiceNow at the end of the period. Facebook is a U.S.-based company that engages in the development of social media applications. Shares declined sharply after lower than expected second quarter results as Facebook’s privacy data issues have had more of an impact on users, usage, and advertising revenue than anticipated. The company provided a softer outlook for the second half of 2018 and given the increased near-term uncertainty on revenue growth, slowing user growth, and lower margin forecast we have eliminated the Fund’s position. Our decision not to own General Electric
|
| Hartford Capital Appreciation HLS Fund |
Fund Overview – (continued)
December 31, 2018 (Unaudited)
contributed positively to performance relative to the Russell 3000 Index during the period. GE is a U.S.-based multi-segment company that develops and manufactures products for the generation, transmission, distribution, control and utilization of electricity. The company is facing a number of controversies, including those relating to the company’s accounting practices. The stock price fell significantly in 2018 in the face of high leverage, poor power and gas business, and continued restructuring efforts. We continued to avoid the stock at the end of the period and remained unconvinced that the company’s turnaround plan will work. Atlassian (Information Technology) and Nike (Consumer Discretionary) were among the top contributors to absolute returns over the period.
The Fund, at times, uses derivative instruments such as currency forwards to hedge currency risk and equity index futures to hedge the market risk. During the period, the use of currency forwards did not have a significant impact on performance while the use of equity index futures slightly detracted from relative performance.
What is the outlook as of the end of the period?
Economic growth in the U.S. was tracking above the long-term average in the fourth quarter of 2018; however, we see signs of slowing growth ahead as durable goods orders remain sluggish and input costs are increasing on the back of higher tariffs. With inflationin-line with Fed’s forecasts and the Fed’s reiteration of a data-dependent monetary policy agenda, we could see further tightening in 2019. However, we expect to see a pause in this policy approach if macro fundamentals deteriorate.
In addition to the considerable uncertainty regarding the pace of tightening, we believe continued uncertainty stemming from ongoing trade tensions persists. Furthermore, the risk of an abrupt economic slowdown in China and political risk in Europe could have ramifications for the U.S. We expect the net impact of these uncertainties to lead to continued market volatility in 2019.
From a factor perspective, while we maintained the Fund’s exposure to value and growth factors for capital appreciation potential, we are increasingly looking to quality and low volatility to mitigate downside risk.
At the end of the period, the Fund’s largest overweights were to Consumer Discretionary and Consumer Staples sectors, while the Fund’s largest underweights were to Information Technology and Communications Services sectors, relative to the Russell 3000 Index.
Important Risks
Investing involves risk, including the possible loss of principal. The Fund seeks to achieve its investment objective by allocating assets among different asset classes and/or portfolio management teams. There is no guarantee the Fund will achieve its stated objective. Security prices fluctuate in value depending on general market and economic conditions and the prospects of individual companies.• Small- and mid-cap securities can have greater risk and volatility than large-cap securities.• Foreign investments may be more volatile and less liquid than U.S. investments and are subject to the risk of currency fluctuations and adverse political and economic developments. These risks are generally greater for investments in emerging markets.• The Fund’s focus on investments in particular sectors may increase its volatility and risk of loss if adverse developments occur.
Composition by Sector(1)
as of December 31, 2018
| | | | |
| Sector | | Percentage of
Net Assets | |
Equity Securities | | | | |
Communication Services | | | 6.0 | % |
Consumer Discretionary | | | 12.7 | |
Consumer Staples | | | 8.6 | |
Energy | | | 3.9 | |
Financials | | | 11.9 | |
Health Care | | | 16.7 | |
Industrials | | | 11.9 | |
Information Technology | | | 15.2 | |
Materials | | | 3.6 | |
Real Estate | | | 5.6 | |
Utilities | | | 2.2 | |
| | | | |
Total | | | 98.3 | % |
| | | | |
Short-Term Investments | | | 1.8 | |
Other Assets & Liabilities | | | (0.1 | ) |
| | | | |
Total | | | 100.0 | % |
| | | | |
| (1) | A sector may be comprised of several industries. For Fund compliance purposes, the Fund may not use the same classification system. These sector classifications are used for financial reporting purposes. |
|
| Hartford Disciplined Equity HLS Fund |
Fund Overview
December 31, 2018 (Unaudited)
| | |
Inception 5/29/1998 Sub-advised by Wellington Management Company LLP | | Investment objective – The Fund seeks growth of capital. |
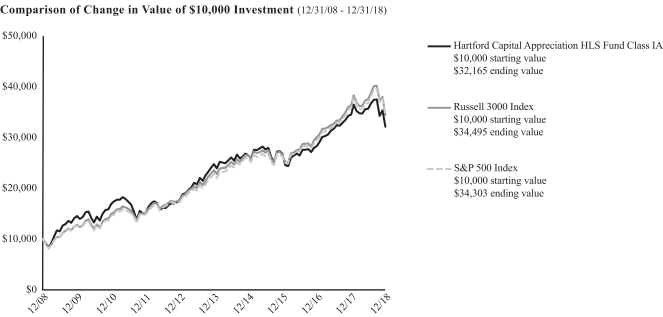
The chart above represents the hypothetical growth of a $10,000 investment in Class IA. Growth results in classes other than Class IA will vary from what is seen above due to differences in the expenses charged to those share classes.
Average Annual Total Returns
for the Periods Ending 12/31/18
| | | | | | | | | | | | |
| | | 1 Year | | | 5 Years | | | 10 Years | |
Class IA | | | -1.99% | | | | 9.42% | | | | 13.77% | |
Class IB | | | -2.23% | | | | 9.15% | | | | 13.48% | |
S&P 500 Index | | | -4.38% | | | | 8.49% | | | | 13.12% | |
PERFORMANCE DATA QUOTED REPRESENTS PAST PERFORMANCE AND DOES NOT GUARANTEE FUTURE RESULTS. The investment return and principal value of the investment will fluctuate so that investors’ shares, when redeemed, may be worth more or less than their original cost. Current performance may be lower or higher than the performance data quoted. To obtain performance data current to the most recent month-end, please visit our website www.hartfordfunds.com.
Total returns presented above were calculated using the Fund’s net asset value available to shareholders for sale or redemption of Fund shares on December 31, 2018, which may exclude investment transactions as of this date. All share class returns assume the reinvestment of all distributions at net asset value and the deduction of all fund expenses.
S&P 500 Index(reflects no deduction for fees, expenses or taxes) is a float-adjusted market capitalization-weighted price index composed of 500 widely held common stocks.
You cannot invest directly in an index.
Performance information may reflect historical waivers/reimbursements without which performance would have been lower.
As shown in the Fund’s current prospectus, the total annual fund operating expense ratios for Class IA and Class IB were 0.78% and 1.03%, respectively. Actual expenses may be higher or lower. Please see the accompanying Financial Highlights for expense ratios for the year ended December 31, 2018.
The chart and table do not reflect the deductions of taxes, sales charges or other fees which may be applied at the variable contract level or by a qualified pension or retirement plan. Any such additional sales charges or other fees or expenses would lower the contract’s or plan’s performance.
The Fund is closed to certain qualified pension and retirement plans. For more information, please see the Fund’s statutory prospectus.
|
| Hartford Disciplined Equity HLS Fund |
Fund Overview – (continued)
December 31, 2018 (Unaudited)
Portfolio Managers
Mammen Chally, CFA
Senior Managing Director and Equity Portfolio Manager
Wellington Management Company LLP
David A. Siegle, CFA
Managing Director and Equity Research Analyst
Wellington Management Company LLP
Douglas W. McLane, CFA
Managing Director and Equity Research Analyst
Wellington Management Company LLP
Manager Discussion
How did the Fund perform during the period?
The Class IA shares of the Hartford Disciplined Equity HLS Fund returned-1.99% for the twelve-month period ended December 31, 2018, outperforming the Fund’s benchmark, the S&P 500 Index, which returned-4.38% for the same period. During the same period, the Class IA shares of the Fund also outperformed the-5.43% average return of the LipperLarge-Cap Core Funds peer group, a group of funds with investment strategies similar to those of the Fund.
Why did the Fund perform this way?
U.S. equities, as measured by the S&P 500 Index, posted negative results over the trailing twelve-month period ending December 31, 2018. The Federal Reserve (Fed) raised its benchmark interest rate by 0.25% four times during the twelve-month period ending December 31, 2018, in line with expectations, although they signaled a more dovish path heading into 2019. (“Dovish” describes a monetary policy that favors lower interest rates to encourage economic growth.) Bullish sentiment was exceptionally strong to start the year, as better-than-expected corporate profits helped drive U.S. equities higher. Signs of inflation entered the market in February which led to heightened levels of volatility, a theme that continued for the remainder of the year. By the summer of 2018, talk of tariffs and trade wars had progressed to implementation, raising concerns in an otherwise strong economy. Nonetheless, positive sentiment persisted, fueled by robust earnings growth, fiscal stimulus, the announcement of a preliminary trade deal between the U.S. and Mexico, and expectations for stronger U.S. economic growth relative to other regions of the world. This changed in the final months of 2018, when concerns surrounding slowing global growth, rich valuations, rising central bank benchmark interest rates, and capricious U.S. and China trade tensions were at the forefront of investors’ minds. Returns in October and December were sharply negative, with the latter representing the largest U.S. equity market monthly decline seen this decade, culminating the first year of negative U.S. equity returns since 2008.
Returns varied bymarket-cap during the period, aslarge-cap equities, as measured by the S&P 500 Index, outperformed both small- andmid-cap equities, as measured by the Russell 2000 Index and S&P MidCap 400 Index, respectively. During the twelve-month period, three of the eleven sectors within the S&P 500 Index rose, led by Healthcare (+6%), Utilities (+4%), and Consumer Discretionary (+1%). Energy(-18%), Communication Services(-15%) and Materials(-15%) lagged on a relative basis.
Security selection was the primary contributor to returns relative to the S&P 500 Index during the period, primarily within Healthcare, Information Technology, and Communication Services sectors, which more than offset weaker selection within the Consumer Discretionary and Energy sectors, which detracted from performance relative to the S&P 500 Index. Sector allocation, which is a residual of ourbottom-up security selection process, contributed positively to results relative to the S&P 500 Index driven by the Fund’s underweight to the Energy sector and overweight to Healthcare and Utilities sectors. This more than offset the negative impact from an overweight to the Industrials sector and an underweight to the Consumer Discretionary sector.
The top contributors to performance relative to the S&P 500 Index and absolute performance over the period were Mastercard (Information Technology), XL Group (Financials), and Eli Lilly (Healthcare). The top contributor to performance relative to the S&P 500 Index during the period was Mastercard, a U.S.-based electronic transactions company. The stock price of the company rose as the company continued to benefit from the ongoing secular shift away from cash and checks and towards electronic payments. XL Group, a U.S.-based global commercial Property & Casualty insurer was among the top contributors during the period. The company’s share price rose after the company agreed to be acquired by France-based insurer AXA. Eli Lilly, a global pharmaceutical company, contributed positively to performance relative to the S&P 500 Index during the period. Its shares traded higher on positive news from the company, including the U.S. Food and Drug Administration granting Breakthrough Therapy Designation to the company’s headache drug candidate Emgality.
The largest detractors from performance relative to the S&P 500 Index over the period were Amazon (Consumer Discretionary), Micron (Information Technology), and Fortune Brands (Industrials). An underweight position in Amazon, a U.S.-based globale-commerce retailer, detracted from performance relative to the S&P 500 Index as the company saw its share price rise; the company continued to expand its categories, such as its purchase of Whole Foods, to which the market reacted positively. Micron, a U.S.-based semiconductor company was among the top detractors from performance relative to the S&P 500 Index during the period. Share prices of the company came under pressure amid market concerns over global trade tensions and price weakness in the DRAM memory chip market. Fortune Brands, a U.S.-based home and security company, saw its share price decline during the period over concerns around rising interest rates and slowing housing starts. FedEx (Industrials) was a top absolute detractor from performance during the period.
|
| Hartford Disciplined Equity HLS Fund |
Fund Overview – (continued)
December 31, 2018 (Unaudited)
Derivatives were not used in a significant manner in the Fund during the period and did not have a material impact on performance during the period.
What is the outlook as of the end of the period?
We believe the U.S. economy remains healthy, although leading indicators are suggesting some moderation in growth into next year. With unemployment levels low and trending lower, we see risks of higher U.S. inflation. Many companies are facing higher labor and material costs, creating some uncertainty around profitability. While we were concerned about the possibility of higher oil prices during the period given the prospect of Iran sanctions, the waivers granted by the U.S. government actually resulted in oversupply and declining crude prices. However, we believe the subsequent cuts should restore supply demand balance and allow oil prices to find a firmer footing in 2019.
Trade continues to dominate the narrative. We are hopeful that a satisfactory agreement with China will be arrived at, however some supply chain disruption and temporary pauses in capital investment cannot be ruled out. The U.K.’s exit from the E.U. hasre-emerged as another near term uncertainty that we have to monitor. On the flip side, we believe the strong employment situation bodes well for the consumer and so far the government shutdown has had little economic impact. Also credit remains benign and does not appear to be a near term headwind to profitability.
We will be watching profitability trends in 2019, particularly in areas seeing inflationary pressures, to evaluate the ability for companies to pass on prices and still grow. Given the uncertainty of some of the aforementioned macroeconomic issues, we do expect volatility to remain somewhat elevated despite recent declines in the market.
At the end of the period, the Fund’s largest overweights were to the Healthcare, Consumer Staples, and Utilities sectors, while the Fund’s largest underweights were to the Communication Services, Energy, and Information Technology sectors, relative to the S&P 500 Index.
Important Risks
Investing involves risk, including the possible loss of principal. There is no guarantee the Fund will achieve its stated objective. Security prices fluctuate in value depending on general market and economic conditions and the prospects of individual companies.
Composition by Sector(1)
as of December 31, 2018
| | | | |
| Sector | | Percentage of
Net Assets | |
Equity Securities | | | | |
Communication Services | | | 6.6 | % |
Consumer Discretionary | | | 10.5 | |
Consumer Staples | | | 9.2 | |
Energy | | | 2.1 | |
Financials | | | 14.0 | |
Health Care | | | 19.3 | |
Industrials | | | 10.4 | |
Information Technology | | | 18.0 | |
Materials | | | 2.3 | |
Real Estate | | | 1.1 | |
Utilities | | | 5.2 | |
| | | | |
Total | | | 98.7 | % |
| | | | |
Short-Term Investments | | | 1.2 | |
Other Assets & Liabilities | | | 0.1 | |
| | | | |
Total | | | 100.0 | % |
| | | | |
| (1) | A sector may be comprised of several industries. For Fund compliance purposes, the Fund may not use the same classification system. These sector classifications are used for financial reporting purposes. |
|
| Hartford Dividend and Growth HLS Fund |
Fund Overview
December 31, 2018 (Unaudited)
| | |
Inception 3/09/1994 Sub-advised by Wellington Management Company LLP | | Investment objective – The Fund seeks a high level of current income consistent with growth of capital. |
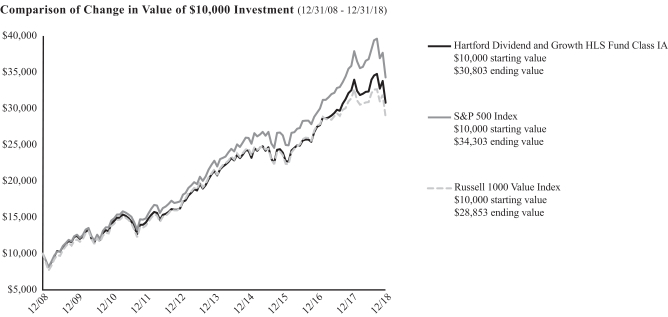
The chart above represents the hypothetical growth of a $10,000 investment in Class IA. Growth results in classes other than Class IA will vary from what is seen above due to differences in the expenses charged to those share classes.
Average Annual Total Returns
for the Periods Ending 12/31/18
| | | | | | | | | | | | |
| | | 1 Year | | | 5 Years | | | 10 Years | |
Class IA | | | -5.32% | | | | 7.53% | | | | 11.91% | |
Class IB | | | -5.56% | | | | 7.26% | | | | 11.63% | |
S&P 500 Index | | | -4.38% | | | | 8.49% | | | | 13.12% | |
Russell 1000 Value Index | | | -8.27% | | | | 5.95% | | | | 11.18% | |
PERFORMANCE DATA QUOTED REPRESENTS PAST PERFORMANCE AND DOES NOT GUARANTEE FUTURE RESULTS. The investment return and principal value of the investment will fluctuate so that investors’ shares, when redeemed, may be worth more or less than their original cost. Current performance may be lower or higher than the performance data quoted. To obtain performance data current to the most recent month-end, please visit our website www.hartfordfunds.com.
Total returns presented above were calculated using the Fund’s net asset value available to shareholders for sale or redemption of Fund shares on December 31, 2018, which may exclude investment transactions as of this date. All share class returns assume the reinvestment of all distributions at net asset value and the deduction of all fund expenses.
S&P 500 Index(reflects no deduction for fees, expenses or taxes) is a float-adjusted market capitalization-weighted price index composed of 500 widely held common stocks.
Russell 1000 Value Index(reflects no deduction for fees, expenses or taxes) is designed to measure the performance of those Russell 1000 Index companies with lower price-to-book ratios and lower forecasted growth values. The Russell 1000 Index is designed to measure the performance of the 1,000 largest companies in the Russell 3000 Index based on their market capitalization and current index membership.
You cannot invest directly in an index.
Performance information may reflect historical waivers/reimbursements without which performance would have been lower.
As shown in the Fund’s current prospectus, the total annual fund operating expense ratios for Class IA and Class IB were 0.68% and 0.93%, respectively. Actual expenses may be higher or lower. Please see the accompanying Financial Highlights for expense ratios for the year ended December 31, 2018.
The chart and table do not reflect the deductions of taxes, sales charges or other fees which may be applied at the variable contract level or by a qualified pension or retirement plan. Any such additional sales charges or other fees or expenses would lower the contract’s or plan’s performance.
The Fund is closed to certain qualified pension and retirement plans. For more information, please see the Fund’s statutory prospectus.
|
| Hartford Dividend and Growth HLS Fund |
Fund Overview – (continued)
December 31, 2018 (Unaudited)
Portfolio Managers
Edward P. Bousa, CFA
Senior Managing Director and Equity Portfolio Manager
Wellington Management Company LLP
Matthew G. Baker
Senior Managing Director and Equity Portfolio Manager
Wellington Management Company LLP
Mark E. Vincent
Managing Director and Equity Research Analyst
Wellington Management Company LLP
Manager Discussion
How did the Fund perform during the period?
The Class IA shares of Hartford Dividend and Growth HLS Fund returned-5.32% for the twelve-month period ended December 31, 2018, underperforming one of the Fund’s benchmarks, the S&P 500 Index, which returned-4.38% for the same period. Class IA shares of the Fund outperformed the Russell 1000 Value Index, its other benchmark, which returned-8.27% for the same period. During the same period, the Class IA shares of the Fund outperformed the-7.08% average return of the Lipper Equity Income Funds peer group, a group of funds with investment strategies similar to those of the Fund.
Why did the Fund perform this way?
U.S. equities, as measured by the S&P 500 Index, posted negative results over the trailing twelve-month period ending December 31, 2018. The Federal Reserve (Fed) raised its benchmark interest rate by 0.25% four times during the twelve-month period, in line with expectations, although they signaled a more dovish path heading into 2019. (“Dovish” describes a monetary policy that favors lower interest rates to encourage economic growth.) Bullish sentiment was exceptionally strong to start the year, as better-than-expected corporate profits helped drive U.S. equities higher. Signs of inflation entered the market in February which led to heightened levels of volatility, a theme that continued for the remainder of the period. By the summer of 2018, talk of tariffs and trade wars had progressed to implementation, raising concerns in an otherwise strong economy. Nonetheless, positive sentiment persisted, fueled by robust earnings growth, fiscal stimulus, the announcement of a preliminary trade deal between the U.S. and Mexico, and expectations for stronger U.S. economic growth relative to other regions of the world. This changed in the final months of 2018, when concerns surrounding slowing global growth, rich valuations, rising central bank benchmark interest rates, and capricious U.S. and China trade tensions were at the forefront of investors’ minds. Returns in October and December were sharply negative, with the latter representing the largest U.S. equity market monthly decline seen this decade, culminating the first year of negative U.S. equity returns since 2008.
Returns varied bymarket-cap during the period, aslarge-cap equities, as measured by the S&P 500 Index, outperformed both small- andmid-cap equities, as measured by the Russell 2000 Index and S&P MidCap 400 Index, respectively. During the twelve-month period, three of the eleven sectors within the S&P 500 Index posted positive returns, led by Healthcare (+6%), Utilities (+4%), and Consumer Discretionary
(+1%). Energy(-18%), Communication Services(-15%) and Materials(-15%) lagged on a relative basis.
Sector allocation, a result of our bottom up stock selection process, was the primary detractor from performance relative to the S&P 500 Index during the period. An overweight to the Financials and Energy sectors more than offset the positive impact of an overweight to the Utilities sector and an underweight to Consumer Staples sector. Security selection contributed positively to performance relative to the S&P 500 Index during the period. Strong selection within Communication Services, Healthcare, and Energy sectors was only partially offset by weaker selection within Consumer Discretionary and Financials sectors.
The Fund’s top detractors from performance relative to the S&P 500 Index were Amazon (Consumer Discretionary), Prudential Financial (Financials), and Principal Financial Group (Financials). Not owning Amazon, a constituent in the S&P 500 Index, a U.S.-based globale-commerce retailer, detracted from performance relative to the S&P 500 Index as the company reported strong organic growth and rising profit, along with increasing net sales year over year. Shares of U.S.-based life insurance and Financial Services company, Prudential, detracted from performance relative to the S&P 500 Index despite rising earnings expectations during the year. The stock fell along with those of many other insurers on concerns over potential charges associated with long-term care insurance and the fear of economic recession. Principal Financial Group, faltered during the period amid widespread weakness in the sector and earnings results that slightly lagged street estimates. Top absolute detractors during the period included Bank of America (Financials) and DXC Technology (Information Technology).
The Fund’s top contributors to performance relative to the S&P 500 Index during the period were Facebook (Communication Services), Verizon (Communication Services), and General Electric (Industrials). Not holding Facebook, a constituent in the S&P 500 Index, U.S.-based social media provider, contributed positively to benchmark-relative performance as the company faced ongoing concerns surrounding slowing growth and the potential for increased regulatory attention. Verizon, a U.S.-based communications technology company, saw its share price rise as the company reported strong quarterly results above street estimates and reduced its capital expenditure guidance. General Electric, a U.S.-based multinational conglomerate operating in the technology infrastructure, capital finance, and consumer and industrial products industries, underperformed as the company reported earnings results that were weaker than consensus estimates primarily driven by
|
| Hartford Dividend and Growth HLS Fund |
Fund Overview – (continued)
December 31, 2018 (Unaudited)
another miss in the GE Power division. The Fund’s modest position in GE was eliminated at the beginning of the period. Top absolute performers during the period included Microsoft (Information Technology) and Merck (Healthcare).
Derivatives were not used in a significant manner in the Fund during the period and did not have a material impact on performance during the period.
What is the outlook as of the end of the period?
The economic outlook has weakened in the last six months, and we are now seeing the slowdown in China reverberating across Europe and the U.S. While we generally see the U.S. on the tail end of the slowdown, we believe that the wealth effect of weak equity market performance should impact consumer confidence. As of the end of the period, we remained optimistic about the Fund’s overweight to the Financials sector given the moderate valuations. We are cautious on more cyclical sectors of the economy and would not want to overexpose the portfolio to highly leveraged businesses at this stage of the cycle. However, as equities in the Industrials sector underperformed the broad market by the end of the period, we became interested in select opportunities. Many of the traditionally safe equities in the Consumers Staples sector appeared overly expensive in our valuation framework as of the end of the period.
We continue to rely on our process and philosophy as we construct the Fund.
At the end of the period, the Fund’s largest overweights relative to the to the S&P 500 Index were to the Financials, Energy, and Utilities sectors, while the Fund’s largest underweights were to Information Technology and Consumer Discretionary sectors.
Important Risks
Investing involves risk, including the possible loss of principal. There is no guarantee the Fund will achieve its stated objective. Security prices fluctuate in value depending on general market and economic conditions and the prospects of individual companies.• For dividend-paying stocks, dividends are not guaranteed and may decrease without notice.• Foreign investments may be more volatile and less liquid than U.S. investments and are subject to the risk of currency fluctuations and adverse political and economic developments.
Composition by Sector(1)
as of December 31, 2018
| | | | |
| Sector | | Percentage of
Net Assets | |
Equity Securities | | | | |
Communication Services | | | 9.2 | % |
Consumer Discretionary | | | 4.8 | |
Consumer Staples | | | 5.4 | |
Energy | | | 8.6 | |
Financials | | | 20.4 | |
Health Care | | | 16.2 | |
Industrials | | | 8.4 | |
Information Technology | | | 13.1 | |
Materials | | | 4.3 | |
Real Estate | | | 2.6 | |
Utilities | | | 5.1 | |
| | | | |
Total | | | 98.1 | % |
| | | | |
Short-Term Investments | | | 1.9 | |
Other Assets & Liabilities | | | 0.0 | * |
| | | | |
Total | | | 100.0 | % |
| | | | |
| * | Percentage rounds to zero. |
| (1) | A sector may be comprised of several industries. For Fund compliance purposes, the Fund may not use the same classification system. These sector classifications are used for financial reporting purposes. |
|
| Hartford Global Growth HLS Fund |
Fund Overview
December 31, 2018 (Unaudited)
| | |
Inception 9/30/1998 Sub-advised by Wellington Management Company LLP | | Investment objective – The Fund seeks growth of capital. |
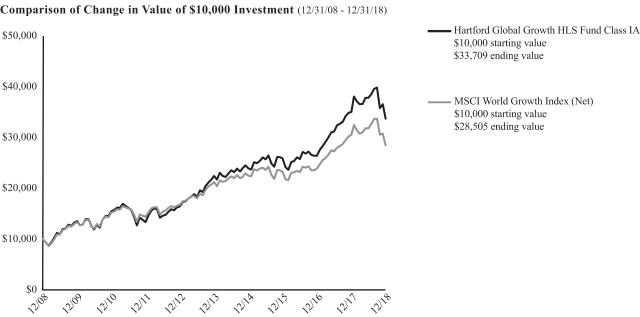
The chart above represents the hypothetical growth of a $10,000 investment in Class IA. Growth results in classes other than Class IA will vary from what is seen above due to differences in the expenses charged to those share classes.
Average Annual Total Returns
for the Periods Ending 12/31/18
| | | | | | | | | | | | |
| | | 1 Year | | | 5 Years | | | 10 Years | |
Class IA | | | -3.81% | | | | 8.47% | | | | 12.92% | |
Class IB | | | -4.07% | | | | 8.21% | | | | 12.64% | |
MSCI World Growth Index (Net) | | | -6.74% | | | | 6.08% | | | | 11.04% | |
PERFORMANCE DATA QUOTED REPRESENTS PAST PERFORMANCE AND DOES NOT GUARANTEE FUTURE RESULTS. The investment return and principal value of the investment will fluctuate so that investors’ shares, when redeemed, may be worth more or less than their original cost. Current performance may be lower or higher than the performance data quoted. To obtain performance data current to the most recent month-end, please visit our website www.hartfordfunds.com.
Total returns presented above were calculated using the Fund’s net asset value available to shareholders for sale or redemption of Fund shares on December 31, 2018, which may exclude investment transactions as of this date. All share class returns assume the reinvestment of all distributions at net asset value and the deduction of all fund expenses.
MSCI World Growth Index (Net)(reflects reinvested dividends net of withholding taxes but reflects no deduction for fees, expenses or other taxes) is designed to capture large and mid cap securities exhibiting overall growth style characteristics across developed markets.
You cannot invest directly in an index.
Performance information may reflect historical waivers/reimbursements without which performance would have been lower.
As shown in the Fund’s current prospectus, the total annual fund operating expense ratios for Class IA and Class IB were 0.81% and 1.06%, respectively. Actual expenses may be higher or lower. Please see the accompanying Financial Highlights for expense ratios for the year ended December 31, 2018.
The chart and table do not reflect the deductions of taxes, sales charges or other fees which may be applied at the variable contract level or by a qualified pension or retirement plan. Any such additional sales charges or other fees or expenses would lower the contract’s or plan’s performance.
The Fund is closed to certain qualified pension and retirement plans. For more information, please see the Fund’s statutory prospectus.
|
| Hartford Global Growth HLS Fund |
Fund Overview – (continued)
December 31, 2018 (Unaudited)
Portfolio Managers
Matthew D. Hudson, CFA
Senior Managing Director and Equity Portfolio Manager
Wellington Management Company LLP
John A. Boselli, CFA
Senior Managing Director and Equity Portfolio Manager
Wellington Management Company LLP
Manager Discussion
How did the Fund perform during the period?
The Class IA shares of Hartford Global Growth HLS Fund returned-3.81% for the twelve-month period ended December 31, 2018, outperforming the Fund’s benchmark, the MSCI World Growth Index (Net), which returned-6.74% for the same period. For the same period, Class IA shares of the Fund also outperformed the-7.94% average return of the Lipper GlobalMulti-Cap Growth Funds peer group, a group of funds with investment strategies similar to those of the Fund.
Why did the Fund perform this way?
Global equity markets lost ground over the twelve-month period ended December 31, 2018, as measured by the MSCI All Country World Index (Net), finishing the year in negative territory. Escalating inflation risks knocked the rallying market off course, leading to a sharp correction and a large spike in volatility at the onset of February of 2018. Through the late spring and summer of 2018, an intensification of trade war rhetoric, strong U.S. economic data, and a strengthening dollar formed a divergence between markets as the U.S. broadly outperformed international markets, most notably China and other developing economies. Global equities, U.S.-included, finished the year in a turbulent downtrend, weighed down by the cumulating stress of higher rates, tariff uncertainty, and shifts in political power.
The U.S. government saw a shift in power when Democrats gained control of the U.S. House of Representatives following November’smid-term elections. U.S.-China trade relations remained especially volatile. By early July, talk of tariffs and trade wars had progressed to implementation, raising concerns in an otherwise strong economy. In Europe, the U.K.’s exit from the E.U. (“Brexit”) negotiations progressed after the European Union (EU) and the U.K. reached a deal that set the terms of the U.K.’s exit from the bloc. In Latin America, Brazil was a notable bright spot in the fourth quarter of 2018, as markets rallied on the news that Jair Bolsonaro was elected president.
On the monetary front, the U.S. Federal Reserve (Fed), the Bank of England, and the Bank of Canada raised interest rates. In the U.S., Fed Chairman Jerome Powell raised interest rates four times, bringing the Fed Funds rate to a range of2.25-2.5%. The European Central Bank (ECB) announced that quantitative easing will not continue into 2019, but offered a dovish undertone pledging to keep policy rates unchanged at least through the summer of 2019. (“Dovish” describes a monetary policy that favors lower interest rates to encourage economic growth.) Central banks globally are concluding multifaceted economic support programs. However, on several occasions through the year the People’s Bank of China lowered the reserve-requirement ratio (RRR), the amount of cash banks must keep on reserve, in an effort to boost growth.
Global Manufacturing Purchasing Managers’ Index (PMI) fell through the course of the year, signaling moderated growth rates. In the U.S., unemployment continued to trend downward over the period, ending the year at a historically low 3.7%. Oil approached a four-year high amidst global supply uncertainties and strong global growth before plummeting over 25% through the end of the year as increased production was paired with tepid demand. China’s Gross Domestic Product (GDP) growth slowed; in the third quarter economic growth fell to its lowest level since the first quarter of 2009.
During the period, U.S. equities outperformednon-U.S. equities, as measured by the S&P 500 Index and MSCI EAFE Index (Net), respectively, and emerging market equities underperformed their developed market counterparts, as measured by the MSCI Emerging Markets Index (Net) and MSCI World Index (Net), respectively. Within the MSCI World Growth Index (Net), all sectors posted negative returns. Energy(-24%), Materials(-17%), and Industrials(-14%) fell by the most during the period.
The Fund’s outperformance versus the Fund’s benchmark, was driven by security selection and sector allocation. In particular, selection in the Healthcare, Information Technology, and Consumer Discretionary sectors contributed positively to relative performance, which was partially offset by weaker selection in the Energy and Financials sectors, which detracted from performance. Sector allocation, a result of the Fund’sbottom-up security selection process, also contributed positively to relative performance. The Fund’s overweight to the Information Technology sector and underweights to the Materials and Energy sectors contributed positively to performance relative to the MSCI World Growth Index (Net). This was partially offset by an overweight to the Financials sector, which detracted from performance relative to the MSCI World Growth Index (Net).
Top contributors to performance relative to the MSCI World Growth Index (Net) were Adobe (Information Technology), ServiceNow (Information Technology), and salesforce.com (Information Technology). Shares of Adobe, a U.S. based multinational computer software company, outperformed driven by strong earnings, as the company has been able to transition to a subscription based model with sticky, recurring revenues, while raising prices. The Fund’s position in ServiceNow, a U.S. based provider of cloud-based services that automate enterprise IT operations, rose during the period as the market gained confidence in the company’s strong fundamental momentum, which continues to show impressive success with new products and market penetration. The stock price of salesforce.com, a U.S.-based developer ofon-demand customer relationship management (CRM) software, posted positive results after the company reported strong revenue growth and provided next year’s guidance ahead of expectations. Amazon (Consumer Discretionary) was a top absolute contributor during the period.
|
| Hartford Global Growth HLS Fund |
Fund Overview – (continued)
December 31, 2018 (Unaudited)
The top detractors from the Fund’s performance relative to the MSCI World Growth Index (Net) were EnCana (Energy), Flex (Information Technology), and Julius Baer Group (Financials). Shares of EnCana, a Canada based energy company, underperformed amid broader energy weakness. Additionally, at the beginning of November, EnCana announced it would acquire Newfield Exploration in anall-stock transaction further hindering EnCana’s performance. Given the Fund held both companies and the share price of Newfield Exploration increased following news of the acquisition, the Fund eliminated its Newfield Exploration holdings. Flex, a U.S.-based company that designs, manufactures, and services consumer electronics for original equipment manufacturers, announced the retirement of its CEO at the end of 2018, the cancellation of a strategic partnership with Nike, and lowered guidance for the quarter and 2019 during their third period’s earnings release. The Fund sold its position in order to seek to fund more attractive opportunities. The shares of Julius Baer Group, a Switzerland-based multinational private bank, underperformed primarily due to negative market sentiment in Europe and European financials, poor performance in Asia where transaction volumes were lower than expected, and a minor money laundering scandal in Panama. Top absolute detractors included Electronic Arts (Communication Services) and Schlumberger (Energy).
Derivatives were not used in a significant manner in this Fund during the period and did not have a material impact on performance during the period.
What is the outlook as of the end of the period?
Looking ahead, our focus remains on stock selection driven bybottom-up, fundamental research, regular meetings with the managements of leading companies globally, and leveraging the deep research capabilities of our firm. As of the end of the period, we believe risks remain on the horizon, including political risk in Europe, trade negotiations between the U.S. and China, and the potential ramifications of a sharp slowdown in economic growth in China. We remain focused on selecting companies with improving fundamentals and catalysts that we think should lead to accelerating earnings growth above consensus expectations.
At the end of the period, the Fund’s largest sector overweights were to the Healthcare, Consumer Discretionary, and Financials sectors, while the Fund’s largest underweights were to the Consumer Staples, Materials, and Industrials sectors, relative to the MSCI World Growth Index (Net).
Important Risks
Investing involves risk, including the possible loss of principal. The Fund seeks to achieve its investment objective by allocating assets among different asset classes and/or portfolio management teams. There is no guarantee the Fund will achieve its stated objective. Security prices fluctuate in value depending on general market and economic conditions and the prospects of individual companies.• Foreign investments may be more volatile and less liquid than U.S. investments and are subject to the risk of currency fluctuations and adverse political and economic developments. These risks may be greater for investments in emerging markets.• Mid-cap securities can have greater risk and volatility than large-cap securities.• Different investment styles may go in and out of favor, which may cause the Fund to underperform the broader stock market.• The Fund’s focus on investments in particular sectors may increase its volatility and risk of loss if adverse developments occur.
Composition by Country(1)
as of December 31, 2018
| | | | |
| Country | | Percentage of
Net Assets | |
Canada | | | 1.6 | % |
China | | | 2.9 | |
France | | | 2.5 | |
Germany | | | 1.3 | |
Hong Kong | | | 1.5 | |
India | | | 0.6 | |
Ireland | | | 1.3 | |
Italy | | | 1.2 | |
Japan | | | 4.3 | |
Luxembourg | | | 0.6 | |
Portugal | | | 0.5 | |
Russia | | | 0.6 | |
Sweden | | | 1.0 | |
Switzerland | | | 3.6 | |
Taiwan | | | 0.5 | |
United Kingdom | | | 6.9 | |
United States | | | 68.2 | |
Short-Term Investments | | | 1.1 | |
Other Assets & Liabilities | | | (0.2 | ) |
| | | | |
Total | | | 100.0 | % |
| | | | |
| (1) | The table above is based on Bloomberg’s country of risk classifications. For Fund compliance purposes, the Fund may not use the same classification system. These classifications are used for financial reporting purposes. |
|
| Hartford Growth Opportunities HLS Fund |
Fund Overview
December 31, 2018 (Unaudited)
| | |
Inception 3/24/1987 Sub-advised by Wellington Management Company LLP | | Investment objective – The Fund seeks capital appreciation. |

The chart above represents the hypothetical growth of a $10,000 investment in Class IA. Growth results in classes other than Class IA will vary from what is seen above due to differences in the expenses charged to those share classes.
Average Annual Total Returns
for the Periods Ending 12/31/18
| | | | | | | | | | | | |
| | | 1 Year | | | 5 Years | | | 10 Years | |
Class IA | | | 0.53% | | | | 10.72% | | | | 14.81% | |
Class IB | | | 0.29% | | | | 10.44% | | | | 14.52% | |
Class IC | | | 0.04% | | | | 10.18% | | | | 14.24% | |
Russell 3000 Growth Index | | | -2.12% | | | | 9.99% | | | | 15.15% | |
Russell 1000 Growth Index | | | -1.51% | | | | 10.40% | | | | 15.29% | |
PERFORMANCE DATA QUOTED REPRESENTS PAST PERFORMANCE AND DOES NOT GUARANTEE FUTURE RESULTS. The investment return and principal value of the investment will fluctuate so that investors’ shares, when redeemed, may be worth more or less than their original cost. Current performance may be lower or higher than the performance data quoted. To obtain performance data current to the most recent month-end, please visit our website www.hartfordfunds.com.
Total returns presented above were calculated using the Fund’s net asset value available to shareholders for sale or redemption of Fund shares on December 31, 2018, which may exclude investment transactions as of this date. All share class returns assume the reinvestment of all distributions at net asset value and the deduction of all fund expenses.
Class IC shares commenced operations on April 30, 2014. Class IC shares performance prior to that date reflects Class IA shares performance adjusted to reflect the 12b-1 fee of 0.25% and the administrative services fee of 0.25% applicable to Class IC shares. The performance after such date reflects actual Class IC shares performance.
Russell 3000 Growth Index(reflects no deduction for fees, expenses or taxes) is designed to measure the performance of those Russell 3000 Index companies with higher price-to-book ratios and higher forecasted growth values. The Russell 3000 Index is designed to measure the performance of the 3,000 largest U.S. companies based on total market capitalization.
Russell 1000 Growth Index(reflects no deduction for fees, expenses or taxes) is designed to measure the performance of those Russell 1000 Index companies with higher price-to-book ratios and higher forecasted growth values. The Russell 1000 Index is
designed to measure the performance of the 1,000 largest companies in the Russell 3000 Index based on their market capitalization and current index membership.
You cannot invest directly in an index.
Performance information may reflect historical waivers/reimbursements without which performance would have been lower.
As shown in the Fund’s current prospectus, the total annual fund operating expense ratios for Class IA, Class IB and Class IC were 0.66%, 0.91% and 1.16%, respectively. Actual expenses may be higher or lower. Please see the accompanying Financial Highlights for expense ratios for the year ended December 31, 2018.
The chart and table do not reflect the deductions of taxes, sales charges or other fees which may be applied at the variable contract level or by a qualified pension or retirement plan. Any such additional sales charges or other fees or expenses would lower the contract’s or plan’s performance.
The Fund is closed to certain qualified pension and retirement plans. For more information, please see the Fund’s statutory prospectus.
|
| Hartford Growth Opportunities HLS Fund |
Fund Overview – (continued)
December 31, 2018 (Unaudited)
Portfolio Managers
Michael T. Carmen, CFA
Senior Managing Director and Equity Portfolio Manager
Wellington Management Company LLP
Mario E. Abularach, CFA, CMT
Senior Managing Director and Equity Research Analyst
Wellington Management Company LLP
Stephen Mortimer
Senior Managing Director and Equity Portfolio Manager
Wellington Management Company LLP
Manager Discussion
How did the Fund perform during the period?
The Class IA shares of Hartford Growth Opportunities HLS Fund returned 0.53% for the twelve-month period ended December 31, 2018, outperforming the Fund’s benchmarks, the Russell 3000 Growth Index and the Russell 1000 Growth Index, which returned-2.12% and-1.51%, respectively, for the same period. For the same period, Class IA shares of the Fund also outperformed the-2.92% average return of the LipperMulti-Cap Growth Funds peer group, a group of funds with investment strategies similar to those of the Fund.
Why did the Fund perform this way?
U.S. equities, as measured by the S&P 500 Index, posted negative results over the trailing twelve-month period ending December 31, 2018. The Federal Reserve (Fed) raised its benchmark interest rate by 0.25% four times during the year, in line with expectations, although they signaled a more dovish path heading into 2019. (“Dovish” describes a monetary policy that favors lower interest rates to encourage economic growth.) Bullish sentiment was exceptionally strong to start the year, as better-than-expected corporate profits helped drive U.S. equities higher. Signs of inflation entered the market in February of 2018 which led to heightened levels of volatility, a theme that continued for the remainder of the year. By the summer of 2018, talk of tariffs and trade wars had progressed to implementation, raising concerns in an otherwise strong economy. Nonetheless, positive sentiment persisted, fueled by robust earnings growth, fiscal stimulus, the announcement of a preliminary trade deal between the U.S. and Mexico, and expectations for stronger U.S. economic growth relative to other regions of the world. This changed in the final months of 2018, when concerns surrounding slowing global growth, rich valuations, rising central bank benchmark interest rates, and capricious U.S. and China trade tensions were at the forefront of investors’ minds. Returns in October and December of 2018 were sharply negative, with the latter representing the largest U.S. equity market monthly decline seen this decade, culminating the first year of negative U.S. equity returns since 2008.
Returns varied bymarket-cap during the period, aslarge-cap equities, as measured by the S&P 500 Index, outperformed both small- andmid-cap equities, as measured by the Russell 2000 Index and S&P MidCap 400 Index, respectively. During the twelve-month period, five of the eleven sectors within the Russell 3000 Growth Index rose, led by Utilities (+3%) and Healthcare (3%). Energy(-33%), Materials(-15%), and Communication Services(-12%) lagged on a relative basis.
The Fund’s outperformance versus the Russell 3000 Growth Index was primarily driven by strong security selection within the Information Technology, Healthcare, and Consumer Staples sectors. Weaker selection in Consumer Discretionary partially offset positive results relative to the Russell 3000 Growth Index. Sector allocation, a residual of thebottom-up stock selection process, also contributed positively to returns relative to the Russell 3000 Growth Index, due primarily to an overweight allocation to the Information Technology sector and an underweight allocation to the Consumer Staples sector.
Top contributors to performance relative to the Russell 3000 Growth Index during the period included The Trade Desk (Information Technology), Workday (Information Technology), and Facebook (Information Technology). Shares of The Trade Desk, a U.S.-based technology company providing ad buyers a platform to manage and display social, mobile, and video advertising, advanced during the period on strong earnings as revenues and guidance came in above consensus estimates. Results were strong across the board as sales, gross profit, and operating profit all increased year over year. The Fund’s position in The Trade Desk was eliminated during the period. Workday, a U.S.-basedsoftware-as-a-service (SaaS) provider for finance and human resources, reported strong earnings results during the period. The company displayed accelerated new business signings across their product platform, strong growth in their international and financials segments, and a significant increase in subscription revenue. Facebook, a U.S.-based social media provider, contributed positively to performance relative to the Russell 3000 Growth Index as the company faced ongoing concerns over data privacy issues. The Fund’s position in Facebook was eliminated during the period. Salesforce.com (Information Technology) was a top absolute contributor to performance during the period.
Stocks that detracted the most from performance relative to the Russell 3000 Growth Index during the period were Microsoft (Information Technology), Alphabet (Information Technology), and Floor & Decor (Consumer Discretionary). Shares of Microsoft, a U.S.-based developer of software products and services, rose due to strong revenue growth mainly attributable to the commercial cloud and the successful launch of newer hybrid server products. Not owning a position in the benchmark constituent detracted from performance relative to the Russell 3000 Growth Index. Shares of Alphabet, a U.S.-based internet search provider, fell during the period after announcing both revenue and margins were below consensus estimates, along with modest growth deceleration. We began selling the Fund’s shares of Alphabet and the Fund was
|
| Hartford Growth Opportunities HLS Fund |
Fund Overview – (continued)
December 31, 2018 (Unaudited)
underweight at the end of the period. Shares of U.S.-based flooring and related accessory retailer, Floor & Decor, fell during the period after announcing softer than expected sales growth including lower same-store-sales and guidance below consensus estimates. ADT (Industrials) was a top absolute detractor from performance.
Derivatives were not used in a significant manner in the Fund during the period and did not have a material impact on performance during the period.
What is the outlook as of the end of the period?
In our view, the recent trade rhetoric between the U.S. and China has caused a further deceleration in global growth and started to have a material impact on U.S. companies. Near term we believe the current market volatility will continue, but do not view a recession as inevitable. However, we do acknowledge it as a possibility. We are using the periods of uncertainty and market depreciation to seek to upgrade the quality of the portfolio and have been adding to high conviction names that we think are overly discounting a negative scenario. We are particularly focused on companies that we believe can succeed in an environment of slower economic growth.
At the end of the period, ourbottom-up investment approach resulted in overweight exposures to the Consumer Discretionary, Healthcare, and Communication Services sectors, relative to the Russell 3000 Growth Index. The Fund’s largest underweights relative to the Russell 3000 Growth Index were to Industrials, Consumer Staples, and Real Estate sectors, at the end of the period.
Important Risks
Investing involves risk, including the possible loss of principal. There is no guarantee the Fund will achieve its stated objective. Security prices fluctuate in value depending on general market and economic conditions and the prospects of individual companies.• Foreign investments may be more volatile and less liquid than U.S. investments and are subject to the risk of currency fluctuations and adverse political and economic developments.• Mid-cap securities can have greater risk and volatility than large-cap securities.• The Fund’s focus on investments in particular sectors may increase its volatility and risk of loss if adverse developments occur.• Different investment styles may go in and out of favor, which may cause the Fund to underperform the broader stock market.
Composition by Sector(1)
as of December 31, 2018
| | | | |
| Sector | | Percentage of
Net Assets | |
Equity Securities | | | | |
Communication Services | | | 11.0 | % |
Consumer Discretionary | | | 17.5 | |
Consumer Staples | | | 3.9 | |
Energy | | | 1.5 | |
Financials | | | 4.9 | |
Health Care | | | 17.3 | |
Industrials | | | 8.8 | |
Information Technology | | | 32.7 | |
Materials | | | 1.0 | |
Real Estate | | | 1.0 | |
| | | | |
Total | | | 99.6 | % |
| | | | |
Short-Term Investments | | | 1.2 | |
Other Assets & Liabilities | | | (0.8 | ) |
| | | | |
Total | | | 100.0 | % |
| | | | |
| (1) | A sector may be comprised of several industries. For Fund compliance purposes, the Fund may not use the same classification system. These sector classifications are used for financial reporting purposes. |
|
| Hartford Healthcare HLS Fund |
Fund Overview
December 31, 2018 (Unaudited)
| | |
Inception 5/01/2000 Sub-advised by Wellington Management Company LLP | | Investment objective – The Fund seeks long-term capital appreciation. |

The chart above represents the hypothetical growth of a $10,000 investment in Class IA. Growth results in classes other than Class IA will vary from what is seen above due to differences in the expenses charged to those share classes.
Average Annual Total Returns
for the Periods Ending 12/31/18
| | | | | | | | | | | | |
| | | 1 Year | | | 5 Years | | | 10 Years | |
Class IA | | | -2.67% | | | | 9.47% | | | | 15.18% | |
Class IB | | | -2.96% | | | | 9.18% | | | | 14.88% | |
S&P Composite 1500 Health Care Index | | | 6.71% | | | | 11.40% | | | | 15.16% | |
S&P 500 Index | | | -4.38% | | | | 8.49% | | | | 13.12% | |
PERFORMANCE DATA QUOTED REPRESENTS PAST PERFORMANCE AND DOES NOT GUARANTEE FUTURE RESULTS. The investment return and principal value of the investment will fluctuate so that investors’ shares, when redeemed, may be worth more or less than their original cost. Current performance may be lower or higher than the performance data quoted. To obtain performance data current to the most recent month-end, please visit our website www.hartfordfunds.com.
Total returns presented above were calculated using the Fund’s net asset value available to shareholders for sale or redemption of Fund shares on December 31, 2018, which may exclude investment transactions as of this date. All share class returns assume the reinvestment of all distributions at net asset value and the deduction of all fund expenses.
S&P Composite 1500 Health Care Index(reflects no deduction for fees, expenses or taxes) is a float-adjusted market capitalization-weighted index comprised of those companies included in the S&P Composite 1500 that are classified as members of the Global Industry Classification Standard (GICS®) health care sector.
S&P 500 Index(reflects no deduction for fees, expenses or taxes) is a float-adjusted market capitalization-weighted price index composed of 500 widely held common stocks.
You cannot invest directly in an index.
Performance information may reflect historical waivers/reimbursements without which performance would have been lower.
As shown in the Fund’s current prospectus, the total annual fund operating expense ratios for Class IA and Class IB were 0.90% and 1.15%, respectively. Expenses shown include acquired fund fees and expenses. Actual expenses may be higher or lower. Please see the accompanying Financial Highlights for expense ratios for the year ended December 31, 2018.
The chart and table do not reflect the deductions of taxes, sales charges or other fees which may be applied at the variable contract level or by a qualified pension or retirement plan. Any such additional sales charges or other fees or expenses would lower the contract’s or plan’s performance.
The Fund is closed to certain qualified pension and retirement plans. For more information, please see the Fund’s statutory prospectus.
|
| Hartford Healthcare HLS Fund |
Fund Overview – (continued)
December 31, 2018 (Unaudited)
Portfolio Managers
Jean M. Hynes, CFA
Senior Managing Director and Global Industry Analyst
Wellington Management Company LLP
Ann C. Gallo
Senior Managing Director and Global Industry Analyst
Wellington Management Company LLP
Robert L. Deresiewicz
Senior Managing Director and Global Industry Analyst
Wellington Management Company LLP
Manager Discussion
How did the Fund perform during the period?
The Class IA shares of the Hartford Healthcare HLS Fund returned-2.67% for the twelve-month period ended December 31, 2018, underperforming the Fund’s benchmark, the S&P Composite 1500 Health Care Index, which returned 6.71% for the same period. The Class IA shares of the Fund outperformed the S&P 500 Index, the Fund’s other benchmark, which returned-4.38% during the period. During the same period, Class IA shares of the Fund underperformed the-0.57% average return of the Lipper Global Health and Biotechnology peer group, a group of funds with investment strategies similar to those of the Fund.
Why did the Fund perform this way?
Healthcare equities (+7%) drastically outperformed the broader U.S. equity market(-4%) and global equity market(-9%) during the period, as measured by the S&P Composite 1500 Healthcare, S&P 500, and the MSCI All Country World (ACWI) Indices (Net), respectively. Within the S&P Composite 1500 Health Care Index, medical technology returned 15%, health care services returned 6%,large-cap biopharma returned 5%,small-cap biopharma returned-6%, andmid-cap biopharmareturned -31%.
The Fund underperformed the S&P Composite 1500 Health Care Index, over the period due primarily to unfavorable sector allocation decisions. An overweight tomid- andsmall-cap biopharma detracted from results relative to the S&P Composite 1500 Health Care Index during the period, more than offsetting a positive contribution from an underweight tolarge-cap biopharma. Security selection also detracted modestly from performance relative to the S&P Composite 1500 Health Care Index. Security selection was weakest in small- andlarge-cap biopharma. This was partially offset by stronger selection inmid-cap biopharma and medical technology over the period.
Merck(large-cap biopharma), Portola Pharmaceuticals(mid-cap biopharma), and Pfizer(large-cap biopharma) were the top detractors from performance relative to the S&P Composite 1500 Health Care Index. Not holding benchmark constituent Merck, a U.S.-based pharmaceutical company, detracted from returns relative to the S&P Composite 1500 Health Care Index, as the stock moved higher on U.S. Food and Drug Administration (FDA) approval of both Lenvima for first-line liver cancer, and an expanded label for Keytruda. Shares of Portola Pharmaceuticals, a commercial-stage biotechnology company focused
mainly on cardiovascular disease, underperformed after sales of Bevyxxa, one of the company’s two marketed products, posted disappointing sales and management indicated that the launch would remain slow. Not holding benchmark constituent Pfizer, a U.S.-based pharmaceutical company, detracted from returns relative to the S&P Composite 1500 Health Care Index during the period as the stock moved higher on a solid earnings report and European approval of Trazimera, Pfizer’s biosimilar to Herceptin. This marks Pfizer’s fourth biosimilar, and the first oncology biosimilar, to receive European Commission approval. Alkermes (biopharma) was a top detractor from absolute performance during the period.
Johnson & Johnson(large-cap biopharma), Loxo Oncology(mid-cap biopharma), and Boston Scientific (medical technology) contributed positively to results relative to the S&P Composite 1500 Health Care Index over the period. Shares of Johnson & Johnson, a U.S.-based pharmaceutical company, ended the period lower as a result of the FDA’s commitment to targeting high drug pricing on less innovative products and legal battles over the safety of the company’s baby powder. An underweight position during the period contributed positively to performance relative to the S&P Composite 1500 Health Care Index; we later eliminated the name from the Fund. Shares of Loxo Oncology, a U.S.-based biopharmaceutical company specializing in medicines that target genetically-defined cancers, rose after the company announced that its lead drug Larotrectinib was accepted for priority review by the FDA for treating certain cancers. In addition, the company presented compelling clinical data for its second molecule,LOXO-292, in treating tumors driven by theRET gene at the American Society of Clinical Oncology annual meeting. Shares of Boston Scientific, a U.S.-based developer and manufacturer of medical devices, rose on strong earnings reports, and FDA approval for its innovative vascular stent, Eluvia. Eli Lilly (biopharma) was a top contributor to absolute performance during the period.
Derivatives were not used in a significant manner in the Fund during the period and did not have a material impact on performance during the period.
What is the outlook as of the end of the period?
Looking back, we believe that the significant market valuation correction of this past quarter – while painful – has expanded our range of opportunities going forward. The recent stock market gyrations should almost certainly continue, but with valuations broadly lower, we look to 2019 with cautious optimism. We believe innovation in the
|
| Hartford Healthcare HLS Fund |
Fund Overview – (continued)
December 31, 2018 (Unaudited)
biopharmaceutical and medical technology sectors is alive and well – indeed, the FDA approved a record number of new drugs in 2018 – and that fundamental innovation plus renewed interest in merger and acquisition (M&A) activity among larger drug companies may ultimately lead the sector higher.
Pressure on pricing and payment models will be ongoing in these sectors, but we continue to believe that fundamental structural reform is unlikely in the foreseeable future. The Trump Administration Healthcare blueprint seeks to address high drug prices by increasing competition, fostering pricing transparency, and wringing out inefficiencies in the pharmaceutical market. Importantly, it appears supportive of biomedical innovation and of the economic model thereof.
In selecting equities for the Fund, we favor companies that develop innovative products designed to address important unmet medical needs. Over the long term, the tailwinds of innovation, an aging population, and the globalization of demand for cutting-edge Western-style medicines may continue to drive growth of the sector.
Important Risks
Investing involves risk, including the possible loss of principal. There is no guarantee the Fund will achieve its stated objective. Security prices fluctuate in value depending on general market and economic conditions and the prospects of individual companies.• Risks of focusing investments on the healthcare related sector include regulatory and legal developments, patent considerations, intense competitive pressures, rapid technological changes, potential product obsolescence, and liquidity risk.• Foreign investments may be more volatile and less liquid than U.S. investments and are subject to the risk of currency fluctuations and adverse political and economic developments. These risks may be greater for investments in emerging markets.• Small- and mid-cap securities can have greater risk and volatility than large-cap securities.
Composition by Subsector(1)
as of December 31, 2018
| | | | |
| Subsector | | Percentage of
Net Assets | |
Equity Securities | | | | |
Biotechnology | | | 24.5 | % |
Health Care Equipment & Supplies | | | 22.9 | |
Health Care Providers & Services | | | 19.9 | |
Health Care Technology | | | 3.0 | |
Life Sciences Tools & Services | | | 4.7 | |
Pharmaceuticals | | | 23.9 | |
| | | | |
Total | | | 98.9 | % |
| | | | |
Short-Term Investments | | | 2.2 | |
Other Assets & Liabilities | | | (1.1 | ) |
| | | | |
Total | | | 100.0 | % |
| | | | |
| (1) | A subsector may be comprised of several industries. For Fund compliance purposes, the Fund may not use the same classification system. These subsector classifications are used for financial reporting purposes. |
|
| Hartford High Yield HLS Fund |
Fund Overview
December 31, 2018 (Unaudited)
| | |
Inception 9/30/1998 Sub-advised by Wellington Management Company LLP | | Investment objective – The Fund seeks to provide high current income, and long-term total return. |
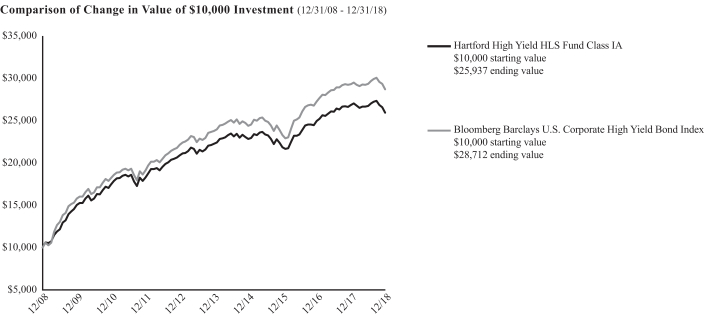
The chart above represents the hypothetical growth of a $10,000 investment in Class IA. Growth results in classes other than Class IA will vary from what is seen above due to differences in the expenses charged to those share classes.
Average Annual Total Returns
for the Periods Ending 12/31/18
| | | | | | | | | | | | |
| | | 1 Year | | | 5 Years | | | 10 Years | |
Class IA | | | -3.44% | | | | 3.11% | | | | 10.00% | |
Class IB | | | -3.66% | | | | 2.85% | | | | 9.73% | |
Bloomberg Barclays U.S. Corporate High Yield Bond Index | | | -2.08% | | | | 3.83% | | | | 11.12% | |
PERFORMANCE DATA QUOTED REPRESENTS PAST PERFORMANCE AND DOES NOT GUARANTEE FUTURE RESULTS. The investment return and principal value of the investment will fluctuate so that investors’ shares, when redeemed, may be worth more or less than their original cost. Current performance may be lower or higher than the performance data quoted. To obtain performance data current to the most recent month-end, please visit our website www.hartfordfunds.com.
Total returns presented above were calculated using the Fund’s net asset value available to shareholders for sale or redemption of Fund shares on December 31, 2018, which may exclude investment transactions as of this date. All share class returns assume the reinvestment of all distributions at net asset value and the deduction of all fund expenses.
Performance information through March 5, 2012 represents performance of the Fund’s previous sub-adviser, Hartford Investment Management Company (“HIMCO”). As of March 5, 2012 HIMCO no longer served as the sub-adviser to the Fund.
Bloomberg Barclays U.S. Corporate High Yield Bond Index(reflects no deduction for fees, expenses or taxes) is a market-value-weighted index that tracks the total return performance of non-investment grade, fixed-rate, publicly placed, dollar denominated and nonconvertible debt registered with the SEC.
You cannot invest directly in an index.
Performance information may reflect historical waivers/reimbursements without which performance would have been lower.
As shown in the Fund’s current prospectus, the total annual fund operating expense ratios for Class IA and Class IB were 0.78% and 1.03%, respectively. Expenses shown include
acquired fund fees and expenses. Actual expenses may be higher or lower. Please see the accompanying Financial Highlights for expense ratios for the year ended December 31, 2018.
The chart and table do not reflect the deductions of taxes, sales charges or other fees which may be applied at the variable contract level or by a qualified pension or retirement plan. Any such additional sales charges or other fees or expenses would lower the contract’s or plan’s performance.
The Fund is closed to certain qualified pension and retirement plans. For more information, please see the Fund’s statutory prospectus.
|
| Hartford High Yield HLS Fund |
Fund Overview – (continued)
December 31, 2018 (Unaudited)
Portfolio Managers
Christopher A. Jones, CFA
Senior Managing Director and Fixed Income Portfolio Manager
Wellington Management Company LLP
David B. Marshak
Managing Director and Fixed Income Portfolio Manager
Wellington Management Company LLP
Manager Discussion
How did the Fund perform during the period?
The Class IA shares of Hartford High Yield HLS Fund returned-3.44% for the twelve-month period ended December 31, 2018, underperforming the Fund’s benchmark, the Bloomberg Barclays U.S. Corporate High Yield Bond Index, which returned-2.08% for the same period. During the same period, the Class IA shares of the Fund underperformed the-2.53% average return of the Lipper High Yield Funds peer group, a group of funds with investment strategies similar to those of the Fund.
Why did the Fund perform this way?
During the period, global fixed income markets largely generated negative total returns as measured by the Bloomberg Barclays Global Aggregate Index, driven by corporate spread widening and higher yields in the U.S. and select emerging markets government bond markets. Geopolitical uncertainty remained elevated despite some seemingly positive developments, including the U.S. and China temporary trade truce, survived confidence vote by United Kingdom (UK) Prime Minister May, and compromised budget plan between Italy and the European Union (EU).
Global monetary policy continued along a less accommodative path during the period. The Federal Reserve (Fed) increased rates four times and projected additional increases, but set expectations that the pace of tightening may slow. The European Central Bank (ECB) concluded its asset purchase program but announced it would continue reinvestments for an extended period after the first rate increase, slated for the second half of 2019. The Bank of England increased rates once, but later kept them on hold as the U.K. continued to negotiate terms of its exit from the EU (“Brexit”).
Early in the period, sovereign debt yields generally moved higher, driven by continued global growth momentum and rising inflation expectations. However, late in the year, sovereign debt yields declined across most markets amid a spike in equity market volatility and increasing concerns about slowing global growth. The prospect of fewer Fed rate increases in 2019 amid a deteriorating global economic outlook contributed to a decline in U.S. yields late in the period but they still finished higher for the year. Brexit worries and weakening European growth indicators contributed to lower core European sovereign debt yields while U.K. yields rose. Italian bond yields rose sharply on debt sustainability concerns but declined after the government announced a budget agreement that will allow the country to dodge a painful EU sanctions process.
Absolute returns were positive for most securitized sectors but negative for corporate sectors during the year. On an excess return basis relative to duration-equivalent treasuries, most major credit risk sectors posted negative returns over the period, with greater underperformance across lower-rated sectors.
High-yield markets were adversely impacted by both increasing interest rates and widening credit spreads during the year amid a backdrop of ongoing geopolitical uncertainty in Europe and elevated tensions between the U.S. and its trading partners, namely China. High yield held up well during the first three quarters of the year, but spreads widened sharply during the fourth quarter of 2018 amid a spike in equity market volatility, lack of progress on key political issues in Europe, and a sharp selloff in energy prices.
The Bloomberg Barclays U.S. Corporate High Yield Bond Index returned-2.08% for the twelve months ended December 31, 2018 and outperformed duration-equivalent Treasuries by-3.58%. The Option-Adjusted Spread (OAS) of the Bloomberg Barclays U.S. Corporate High Yield Bond Index was 5.26% on December 31, 2018, wider than twelve months ago (3.43% as of December 31, 2017).
During the period, sector allocation contributed positively to returns relative to the Bloomberg Barclays U.S. Corporate High Yield Bond Index, mainly driven by the Fund’s underweight allocations to the Energy and Automotive sectors. This was partially offset by underweights to Healthcare and Utilities sectors, which detracted from returns relative to the Bloomberg Barclays U.S. Corporate High Yield Bond Index.
Overall, security selection decisions detracted from returns relative to the Bloomberg Barclays U.S. Corporate High Yield Bond Index, primarily driven by selection within the Metals and Mining and financial institutions sectors. This was partially offset by stronger selection in the Energy and home constructions sectors, which contributed positively to returns relative to the Bloomberg Barclays U.S. Corporate High Yield Bond Index.
Quality positioning contributed positively to performance relative to the Bloomberg Barclays U.S. Corporate High Yield Bond Index during the period, primarily due to an underweight toBB-rated securities along with an overweight to CCC and below-rated securities.
Over the period, the Fund had a small position in the High Yield Credit Default Swap Index (CDX). During the period, the Fund’s CDX position was used for liquidity purposes and for tactically adjusting the risk posture of the Fund. This position contributed positively to relative performance.
What is the outlook as of the end of the period?
We remain constructive on high yield given what we view as the backdrop of stable corporate fundamentals, a supportive macroeconomic landscape, and continued demand for yield-producing assets. We believe valuations appear attractive following recent spread widening given the strong economy and solid company fundamentals. Whilegeo-political events and tighter-than-expected central bank monetary policy are risks, we believe spreads offer ample cushion given our expectation for a benign default environment over the next year.
|
| Hartford High Yield HLS Fund |
Fund Overview – (continued)
December 31, 2018 (Unaudited)
We are particularly positive on conditions in the U.S., and favor issuers expected to benefit from a stable or growing U.S. domestic economy. However, we also acknowledge that high yield spreads in Europe and emerging markets have widened significantly and we are finding select investment opportunities in these regions. We continue to monitor the possible impact on global growth from increased political uncertainty and potentially more protectionist policies.
We believe high yield continues to be an attractive asset class and the ongoing “search for yield,” caused in part by low absolute levels of interest rates around much of the globe, may continue to provide a tailwind for the asset class going forward.
The Fund ended the year most overweight in the Gaming and Packaging sectors, and was most underweight to the Energy and Automotive sectors relative to Bloomberg Barclay U.S Corporate High Yield Bond Index.
Important Risks
Investing involves risk, including the possible loss of principal. There is no guarantee the Fund will achieve its stated objective. Security prices fluctuate in value depending on general market and economic conditions and the prospects of individual companies.• Fixed income security risks include credit, liquidity, call, duration, and interest-rate risk. As interest rates rise, bond prices generally fall.• Investments in high-yield (“junk”) bonds involve greater risk of price volatility, illiquidity, and default than higher-rated debt securities.• Derivatives are generally more volatile and sensitive to changes in market or economic conditions than other securities; their risks include currency, leverage, liquidity, index, pricing, and counterparty risk.• Foreign investments may be more volatile and less liquid than U.S. investments and are subject to the risk of currency fluctuations and adverse political and economic developments. These risks may be greater for investments in emerging markets.• Privately placed, restricted (Rule 144A) securities may be more difficult to sell and price than other securities.
Composition by Security Type(1)
as of December 31, 2018
| | | | |
| Category | | Percentage of
Net Assets | |
Equity Securities | | | | |
Common Stocks | | | 0.9 | % |
Escrows | | | 0.0 | * |
| | | | |
Total | | | 0.9 | % |
| | | | |
Fixed Income Securities | | | | |
Asset & Commercial Mortgage Backed Securities | | | 0.0 | %* |
Convertible Bonds | | | 1.1 | |
Corporate Bonds | | | 88.6 | |
Senior Floating Rate Interests | | | 5.8 | |
| | | | |
Total | | | 95.5 | % |
| | | | |
Short-Term Investments | | | 2.1 | |
Other Assets & Liabilities | | | 1.5 | |
| | | | �� |
Total | | | 100.0 | % |
| | | | |
| * | Percentage rounds to zero. |
| (1) | For Fund compliance purposes, the Fund may not use the same classification system. These classifications are used for financial reporting purposes. |
|
| Hartford International Opportunities HLS Fund |
Fund Overview
December 31, 2018 (Unaudited)
| | |
Inception 7/02/1990 Sub-advised by Wellington Management Company LLP | | Investment objective – The Fund seeks long-term growth of capital. |
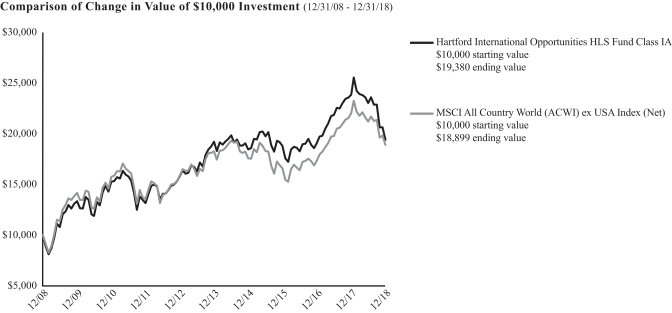
The chart above represents the hypothetical growth of a $10,000 investment in Class IA. Growth results in classes other than Class IA will vary from what is seen above due to differences in the expenses charged to those share classes.
Average Annual Total Returns
for the Periods Ending 12/31/18
| | | | | | | | | | | | |
| | | 1 Year | | | 5 Years | | | 10 Years | |
Class IA | | | -18.74% | | | | 0.18% | | | | 6.84% | |
Class IB | | | -18.96% | | | | -0.07% | | | | 6.57% | |
MSCI ACWI ex USA Index (Net) | | | -14.20% | | | | 0.68% | | | | 6.57% | |
PERFORMANCE DATA QUOTED REPRESENTS PAST PERFORMANCE AND DOES NOT GUARANTEE FUTURE RESULTS. The investment return and principal value of the investment will fluctuate so that investors’ shares, when redeemed, may be worth more or less than their original cost. Current performance may be lower or higher than the performance data quoted. To obtain performance data current to the most recent month-end, please visit our website www.hartfordfunds.com.
Total returns presented above were calculated using the Fund’s net asset value available to shareholders for sale or redemption of Fund shares on December 31, 2018, which may exclude investment transactions as of this date. All share class returns assume the reinvestment of all distributions at net asset value and the deduction of all fund expenses.
MSCI ACWI ex USA Index (Net)(reflects reinvested dividends net of withholding taxes but reflects no deduction for fees, expenses or other taxes) is designed to capture large and mid cap representation across developed markets (excluding the United States) and emerging market countries.
You cannot invest directly in an index.
Performance information may reflect historical waivers/reimbursements without which performance would have been lower.
As shown in the Fund’s current prospectus, the total annual fund operating expense ratios for Class IA and Class IB were 0.73% and 0.98%, respectively. Actual expenses may be higher or lower. Please see the accompanying Financial Highlights for expense ratios for the year ended December 31, 2018.
The chart and table do not reflect the deductions of taxes, sales charges or other fees which may be applied at the variable contract level or by a qualified pension or retirement plan. Any such additional sales charges or other fees or expenses would lower the contract’s or plan’s performance.
The Fund is closed to certain qualified pension and retirement plans. For more information, please see the Fund’s statutory prospectus.
|
| Hartford International Opportunities HLS Fund |
Fund Overview – (continued)
December 31, 2018 (Unaudited)
Portfolio Managers
Nicolas M. Choumenkovitch
Senior Managing Director and Equity Portfolio Manager
Wellington Management Company LLP
Tara C. Stilwell, CFA
Senior Managing Director and Equity Portfolio Manager
Wellington Management Company LLP
Manager Discussion
How did the Fund perform during the period?
The Class IA shares of the Hartford International Opportunities HLS Fund returned-18.74% for the twelve-month period ended December 31, 2018, underperforming the Fund’s benchmark, the MSCI All Country World (ACWI) ex USA Index (Net) which returned-14.20% for the same period. During the same period, the Class IA shares of the Fund also underperformed the-13.70% average return of the Lipper InternationalLarge-Cap Growth Fund peer group, a group of funds with investment strategies similar to those of the Fund.
Why did the Fund perform this way?
International equity markets lost ground over the period, finishing the year in negative territory, as measured by the MSCI ACWI ex USA Index (Net). Escalating inflation risks knocked the rallying market off course, leading to a sharp correction and a large spike in volatility at the onset of February 2018. Through the late spring and summer, an intensification of trade war rhetoric, strong U.S. economic data, and a strengthening U.S. dollar formed a divergence between markets as the U.S. broadly outperformed international markets, most notably China and other developing economies. Global equities, U.S. included, finished the year in a turbulent downtrend, weighed down by the cumulating stress of higher rates, tariff uncertainty, and shifts in political power, as measured by the MSCI ACWI Index (Net).
The U.S. government saw a shift in power when Democrats gained control of the U.S. House of Representatives following November’smid-term elections. U.S.-China trade relations remained especially volatile. By early July of 2018, talk of tariffs and trade wars had progressed to implementation, raising concerns in an otherwise strong economy. In Latin America, Brazil was a notable bright spot in the fourth quarter, as markets rallied on the news that Jair Bolsonaro was elected president.
On the monetary front, the U.S. Federal Reserve (Fed), the Bank of England, and the Bank of Canada raised interest rates. In the U.S., Fed Chairman Jerome Powell raised benchmark interest rates four times, bringing the Fed Funds rate to a range of2.25-2.5%. The European Central Bank announced that quantitative easing will not continue into 2019, but offered a dovish undertone pledging to keep policy rates unchanged at least through the summer of 2019. (“Dovish” describes a monetary policy that favors lower interest rates to encourage economic growth.) Central banks globally are concluding multifaceted economic support programs. However, on several occasions through the year the People’s Bank of China lowered the reserve-requirement ratio (RRR), the amount of cash banks must keep on reserve, in an effort to boost growth.
Global Manufacturing Purchasing Managers’ Index (PMI) declined over the course of the year, signaling moderated growth rates. In the U.S., unemployment continued to trend downward, ending the year at a historically low 3.7%. Oil approached a four-year high amidst global supply uncertainties and strong global growth before plummeting over 25% through the end of the year as increased production was paired with tepid demand. China’s GDP growth slowed; in the third quarter economic growth fell to its lowest level since the first quarter of 2009.
During the period, U.S. equities outperformednon-U.S. equities, as measured by the S&P 500 Index and MSCI EAFE Index (Net), respectively, and developed market equities outperformed their emerging market counterparts, as measured by the MSCI World Index (Net) and MSCI Emerging Markets Index (Net), respectively. Within the MSCI ACWI ex USA Index (Net), all eleven sectors posted negative returns during the period; Consumer Discretionary(-20%), Information Technology(-19%), and Financials(-16%) fell the most.
Security selection effects drove underperformance relative to the MSCI ACWI ex USA Index (Net) during the period. Selection was weakest within the Information Technology, Energy, and Financials sectors. This was partially offset by stronger selection within the Communication Services, Industrials, and Utilities sectors. Sector allocation, a result of ourbottom-up security selection process, was a slight contributor to performance relative to the MSCI ACWI ex USA Index (Net) during the period. A relative underweight to the Financials sector benefited results while an overweight to the Consumer Discretionary sector partially detracted from relative performance. On a regional basis, security selection within Europe and emerging markets detracted markedly from relative performance.
Top detractors from performance relative to the MSCI ACWI ex USA Index (Net) during the period included AMS AG (Information Technology), British-American Tobacco (Consumer Staples), and Valeo (Consumer Discretionary). Although they are in different sectors, Valeo and AMS share similarities. They are suppliers of competitive, technology-driven solutions to their end markets – automotive in Valeo’s case and smartphones in AMS’ case – and have been benefiting from secular trends for higher technology content per unit. Both companies have been gaining market share due to their intellectual property, and, in our view, are managed by CEOs that are investing with a long-term mindset. While we believe the secular trend to higher content will drive the long-term outcomes of these businesses, the cyclical impact of slowing unit demand proved to be more important in the fourth quarter, and the degree of slowdown priced into these companies’ valuations surprised us. We added to the Fund’s holding in Valeo, where we believe the depth of downturn in the company’s valuation is factoring in a sufficiently dire scenario, and we sold out of AMS, where we believe a
|
| Hartford International Opportunities HLS Fund |
Fund Overview – (continued)
December 31, 2018 (Unaudited)
prolonged weakness in smartphone demand could further decrease its valuation. Shares of British-American Tobacco, theUK-based tobacco company, fell during the fourth quarter 2018 as investors expressed concerns about regulations, specifically the U.S. Federal Drug Administration’s (FDA) announcement of restrictions on the sale of flavorede-vapor products and a proposed ban on the sale of menthol cigarettes. We continue to hold the stock and believe the market underappreciates the company’s ability to sustain its return on invested capital (ROIC) driven by its strong pricing, expanding margins, and the potential of its next-generation products business. EnCana (Energy) and UBS Group (Financials) were top absolute detractors during the period.
Top contributors to returns relative to the MSCI ACWI ex USA Index (Net) included Safran (Industrials), China Tower (Communication Services), and Tokio Marine (Financials). Safran, a France-based technology company producing aircraft and rocket engines, propulsion systems, and aerospace equipment, was the top contributor relative to the MSCI ACWI ex USA Index (Net) during the period. The stock performed well after the company reported better-than-expected first quarter sales driven by strong organic growth mainly in the civil aftermarket. The stock price of China Tower, a China-based telecom tower operator, rose following the company’s site tour in which management maintained a positive outlook on demand for 5G and improving cash flow. It was a strong year for Japanese insurer Tokio Marine as the company demonstrated a clear commitment to better capital allocation. ENN Energy Holdings (Utilities) and Mocler (Consumer Discretionary) were top absolute contributors during the period.
Derivatives were not used in a significant manner in the Fund during the period and did not have a material impact on performance during the period.
What is the outlook as of the end of the period?
In general, we remain constructive on the global economy, but are mindful that the global economic cycle faces challenges from rising interest rates and ongoing trade disputes. At the same time, we continue to watch for potential stimulus measures in China and Europe.
In the latter part of the year, financial markets were focused on cyclical issues such as the Apple supply chain, ongoing trade frictions and the slowdown in China. But taking a longer term perspective, we still see many investment opportunities where companies’ return on capital appears to be mispriced due to the nature of their businesses or because their valuations provide greater insulation from cyclical change.
Across sectors, we continue to favor companies that are able to exploit technologies to bring significant positive change for the market they are addressing. This could be in terms of a company’s unique business model, differentiated process, or a new product or service. In our view, the long term winners will be those companies that can most effectively optimize their technology to increase productivity.
We remain excited about the long-term prospects for China and continue to maintain the Fund’s exposure to Chinese companies and companies with significant exposure to the Chinese market where we believe the market is mispricing the future returns on capital. We continue to think that despite the government’s efforts to slow the trajectory of growth, we may see stable growth from this market. Although we do believe this is where we want to have exposure in the Fund, we’re also mindful that we have limited transparency around the path of certain policy issues that
are weighing on the market and that the uncertainty around the future state of issues like trade may lead to continued bouts of volatility that may impact the portfolio in the near-term.
Important Risks
Investing involves risk, including the possible loss of principal. There is no guarantee the Fund will achieve its stated objective. Security prices fluctuate in value depending on general market and economic conditions and the prospects of individual companies.• Foreign investments may be more volatile and less liquid than U.S. investments and are subject to the risk of currency fluctuations and adverse political and economic developments. These risks may be greater for investments in emerging markets.• Mid-cap securities can have greater risks and volatility than large-cap securities.• The Fund’s focus on investments in particular sectors, geographic regions or countries may increase its volatility and risk of loss if adverse developments occur.
Composition by Currency
as of December 31, 2018
| | | | |
| Description | | Percentage of
Net Assets | |
Australian Dollar | | | 0.9 | % |
British Pound | | | 13.2 | |
Canadian Dollar | | | 4.3 | |
Danish Krone | | | 0.5 | |
Euro | | | 29.4 | |
Hong Kong Dollar | | | 8.7 | |
Indian Rupee | | | 2.0 | |
Japanese Yen | | | 14.6 | |
Norwegian Krone | | | 0.5 | |
South Korean Won | | | 2.1 | |
Swiss Franc | | | 11.3 | |
Taiwanese Dollar | | | 2.6 | |
United States Dollar | | | 9.9 | |
Other Assets & Liabilities | | | 0.0 | * |
| | | | |
Total | | | 100.0 | % |
| | | | |
| * | Percentage rounds to zero. |
Composition by Sector(1)
as of December 31, 2018
| | | | |
| Sector | | Percentage of
Net Assets | |
Equity Securities | | | | |
Communication Services | | | 7.1 | % |
Consumer Discretionary | | | 12.2 | |
Consumer Staples | | | 9.7 | |
Energy | | | 7.8 | |
Financials | | | 16.4 | |
Health Care | | | 11.5 | |
Industrials | | | 11.4 | |
Information Technology | | | 6.3 | |
Materials | | | 3.9 | |
Real Estate | | | 6.6 | |
Utilities | | | 4.1 | |
| | | | |
Total | | | 97.0 | % |
| | | | |
Short-Term Investments | | | 3.0 | |
Other Assets & Liabilities | | | 0.0 | * |
| | | | |
Total | | | 100.0 | % |
| | | | |
| * | Percentage rounds to zero. |
| (1) | A sector may be comprised of several industries. For Fund compliance purposes, the Fund may not use the same classification system. These sector classifications are used for financial reporting purposes. |
Fund Overview
December 31, 2018 (Unaudited)
| | |
Inception 7/14/1997 Sub-advised by Wellington Management Company LLP | | Investment objective – The Fund seeks long-term growth of capital. |
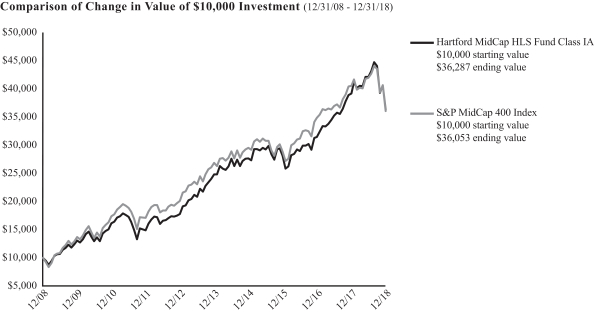
The chart above represents the hypothetical growth of a $10,000 investment in Class IA. Growth results in classes other than Class IA will vary from what is seen above due to differences in the expenses charged to those share classes.
Average Annual Total Returns
for the Periods Ending 12/31/18
| | | | | | | | | | | | |
| | | 1 Year | | | 5 Years | | | 10 Years | |
Class IA | | | -7.44% | | | | 7.86% | | | | 13.76% | |
Class IB | | | -7.65% | | | | 7.59% | | | | 13.47% | |
S&P MidCap 400 Index | | | -11.08% | | | | 6.03% | | | | 13.68% | |
PERFORMANCE DATA QUOTED REPRESENTS PAST PERFORMANCE AND DOES NOT GUARANTEE FUTURE RESULTS. The investment return and principal value of the investment will fluctuate so that investors’ shares, when redeemed, may be worth more or less than their original cost. Current performance may be lower or higher than the performance data quoted. To obtain performance data current to the most recent month-end, please visit our website www.hartfordfunds.com.
Total returns presented above were calculated using the Fund’s net asset value available to shareholders for sale or redemption of Fund shares on December 31, 2018, which may exclude investment transactions as of this date. All share class returns assume the reinvestment of all distributions at net asset value and the deduction of all fund expenses.
S&P MidCap 400 Index(reflects no deduction for fees, expenses or taxes) is a float-adjusted market capitalization-weighted index designed to measure the performance of the mid-cap segment of the market. The index is composed of 400 constituent companies.
You cannot invest directly in an index.
Performance information may reflect historical waivers/reimbursements without which performance would have been lower.
As shown in the Fund’s current prospectus, the total annual fund operating expense ratios for Class IA and Class IB were 0.70% and 0.95%, respectively. Actual expenses may be higher or lower. Please see the accompanying Financial Highlights for expense ratios for the year ended December 31, 2018.
The chart and table do not reflect the deductions of taxes, sales charges or other fees which may be applied at the variable contract level or by a qualified pension or retirement plan. Any such additional sales charges or other fees or expenses would lower the contract’s or plan’s performance.
The Fund is closed to certain qualified pension and retirement plans. For more information, please see the Fund’s statutory prospectus.
Fund Overview – (continued)
December 31, 2018 (Unaudited)
Portfolio Managers
Philip W. Ruedi, CFA
Senior Managing Director and Equity Portfolio Manager
Wellington Management Company LLP
Mark A. Whitaker, CFA
Senior Managing Director and Equity Portfolio Manager
Wellington Management Company LLP
Manager Discussion
How did the Fund perform during the period?
The Class IA shares of the Hartford MidCap HLS Fund returned-7.44% for the twelve-month period ended December 31, 2018, outperforming the Fund’s benchmark, the S&P MidCap 400 Index, which returned-11.08% for the same period. For the same period, the Class IA shares of the Fund underperformed the-5.42% average return of the LipperMid-Cap Growth Funds peer group, a group of funds with investment strategies similar to those of the Fund.
Why did the Fund perform this way?
U.S. equities, as measured by the S&P 500 Index, posted negative results over the trailing twelve month period ending December 31, 2018. The U.S. Federal Reserve (Fed) raised its benchmark interest rate by 0.25% four times during the year, in line with expectations, although they signaled a more dovish path heading into 2019. (“Dovish” describes a monetary policy that favors lower interest rates to encourage economic growth.) Bullish sentiment was exceptionally strong to start the year, as better-than-expected corporate profits helped drive U.S. equities higher. Signs of inflation entered the market in February of 2018, which led to heightened levels of volatility, a theme that continued for the remainder of the year. By the summer of 2018, talk of tariffs and trade wars had progressed to implementation, raising concerns in an otherwise strong economy. Nonetheless, positive sentiment persisted, fueled by robust U.S. earnings growth, fiscal stimulus, the announcement of a preliminary trade deal between the U.S. and Mexico, and expectations for stronger U.S. economic growth relative to other regions of the world. This changed in the final months of 2018, when concerns surrounding slowing global growth, rich valuations, rising central bank benchmark interest rates, and capricious U.S. and China trade tensions were at the forefront of investors’ minds. Returns in October and December were sharply negative, with the latter representing the largest U.S. equity market monthly decline seen this decade, culminating the first year of negative U.S. equity returns since 2008.
Returns varied bymarket-cap during the period, aslarge-cap equities, as measured by the S&P 500 Index, outperformed both small- andmid-cap equities, as measured by the Russell 2000 Index and S&P MidCap 400 Index, respectively. Within the S&P MidCap 400 Index, nine of eleven sectors posted negative returns during the period. The Energy(-30%), Materials(-20%), and Consumer Discretionary(-17%) sectors posted the lowest returns while Utilities (8%) posted positive returns and Communication Services was roughly neutral for the period.
The Fund’s outperformance relative to the S&P MidCap 400 Index during the period was driven primarily by security selection in the Industrials, Financials, and Information Technology sectors. This more
than offset weaker selection in Healthcare and Energy. Sector allocation, a result of thebottom-up security selection process, also contributed positively to returns relative to the S&P MidCap 400 Index over the period. An overweight to the Healthcare sector and Information Technology sectors contributed positively to relative returns, which more than offset negative relative performance from underweights to the Utilities and Real Estate sectors.
The top contributors to performance relative to the S&P MidCap 400 Index during the period were VeriSign (Information Technology), Veeva Systems (Healthcare), and CDW (Information Technology). Shares of Veeva Systems, a cloud-computing company focused on the life sciences industries, rose after the company reported very strong second quarter financial results primarily due to its Vault system, which manages regulated documents and data for clients. VeriSign, an internet domain name registry, was a strong performer in 2018. Shares rose after the company filed a request with their price regulator which will allow them to raise prices in the future, thus potentially increasing their organic growth rate. The stock price of CDW rose as the IT services provider for education, business, and government, continued to steadily grow profits. GrubHub (Consumer Discretionary) and Keysight Technologies (Information Technology) were among the top absolute contributors to performance during the period.
The top detractors from performance relative to the S&P MidCap 400 Index and absolute performance during the period were CommScope Holding Company (Information Technology), Newfield Exploration (Energy), and Alkermes (Healthcare). CommScope, a communications network infrastructure provider, reported earnings below market expectations. The company announced during the period that it was acquiring Arris, a telecomm equipment manufacturer; we thought that the deal would be beneficial so we added modestly to its position. Newfield Exploration, a petroleum and natural gas exploration and production company, saw its share price drop during the period as oil prices fell dramatically during the fourth quarter 2018 amidst ongoing concerns about excess supply and lower demand growth. The Fund continued to hold its position at the end of the period based on what we considered to be the company’s attractive oil and gas reserves and favorable production costs. Shares of Alkermes, a biopharmaceutical company that focuses on diseases of the central nervous system, declined as the Food and Drug Administration (FDA) initially refused to consider trial data for a new medication that aims to treat major depressive disorder. The FDA subsequently reversed this decision and the company expects the drug to be very successful at treating depression. Our view is that Alkermes has a broad pipeline with a number of attractive opportunities so the Fund continued to hold the stock although we trimmed its position slightly near the end of the period.
Fund Overview – (continued)
December 31, 2018 (Unaudited)
Derivatives were not used in a significant manner in the Fund during the period and did not have a material impact on performance during the period.
What is the outlook as of the end of the period?
Despite the recent market selloff, we believe the fundamentals of the U.S. economy are solid and we continue to find what we consider to be attractive company-specific opportunities to add to the portfolio. Higher levels of volatility may persist as the market absorbs the effects of higher interest rates, trade policy, slower growth, and political uncertainty.
Based on ourbottom-up, company specific research and stock selection, at the end of the period, the Fund was most overweight the Information Technology, Healthcare, and Industrials sectors, and most underweight the Real Estate, Consumer Discretionary, and Materials sectors, relative to the S&P MidCap 400 Index.
Important Risks
Investing involves risk, including the possible loss of principal. There is no guarantee the Fund will achieve its stated objective. Security prices fluctuate in value depending on general market and economic conditions and the prospects of individual companies.• Mid-cap securities can have greater risk and volatility than large-cap securities.• The Fund’s focus on investments in particular sectors may increase its volatility and risk of loss if adverse developments occur.
Composition by Sector(1)
as of December 31, 2018
| | | | |
| Sector | | Percentage of
Net Assets | |
Equity Securities | | | | |
Communication Services | | | 2.5 | % |
Consumer Discretionary | | | 6.9 | |
Energy | | | 3.1 | |
Financials | | | 14.5 | |
Health Care | | | 19.1 | |
Industrials | | | 18.9 | |
Information Technology | | | 27.4 | |
Materials | | | 2.8 | |
Real Estate | | | 1.4 | |
Utilities | | | 2.6 | |
| | | | |
Total | | | 99.2 | % |
| | | | |
Short-Term Investments | | | 1.1 | |
Other Assets & Liabilities | | | (0.3 | ) |
| | | | |
Total | | | 100.0 | % |
| | | | |
| (1) | A sector may be comprised of several industries. For Fund compliance purposes, the Fund may not use the same classification system. These sector classifications are used for financial reporting purposes. |
|
| Hartford MidCap Growth HLS Fund(formerly, Hartford Small/Mid Cap Equity HLS Fund) |
Fund Overview
December 31, 2018 (Unaudited)
| | |
Inception 5/01/1998 Sub-advised by Wellington Management Company LLP | | Investment objective – The Fund seeks long-term growth of capital. |
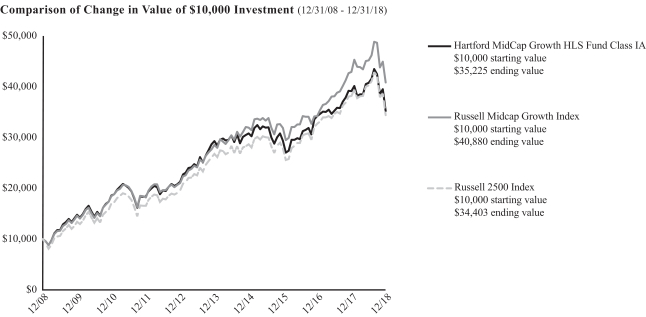
The chart above represents the hypothetical growth of a $10,000 investment in Class IA. Growth results in classes other than Class IA will vary from what is seen above due to differences in the expenses charged to those share classes.
Average Annual Total Returns
for the Periods Ending 12/31/18
| | | | | | | | | | | | |
| | | 1 Year | | | 5 Years | | | 10 Years | |
Class IA | | | -10.05% | | | | 3.74% | | | | 13.42% | |
Class IB | | | -10.25% | | | | 3.49% | | | | 13.13% | |
Russell Midcap Growth Index | | | -4.75% | | | | 7.42% | | | | 15.12% | |
Russell 2500 Index | | | -10.00% | | | | 5.15% | | | | 13.15% | |
PERFORMANCE DATA QUOTED REPRESENTS PAST PERFORMANCE AND DOES NOT GUARANTEE FUTURE RESULTS. The investment return and principal value of the investment will fluctuate so that investors’ shares, when redeemed, may be worth more or less than their original cost. Current performance may be lower or higher than the performance data quoted. To obtain performance data current to the most recent month-end, please visit our website www.hartfordfunds.com.
Total returns presented above were calculated using the Fund’s net asset value available to shareholders for sale or redemption of Fund shares on December 31, 2018, which may exclude investment transactions as of this date. All share class returns assume the reinvestment of all distributions at net asset value and the deduction of all fund expenses.
Performance information prior to June 4, 2012 represents performance of the Fund’s previous sub-adviser, Hartford Investment Management Company (“HIMCO”). As of June 4, 2012, HIMCO no longer served as the sub-adviser to the Fund.
Performance information prior to November 1, 2018 includes the Fund’s performance when it pursued different strategies. For more information, please see the Fund’s statutory prospectus.
Russell Midcap Growth Index(reflects no deduction for fees, expenses or taxes) is designed to measure the performance of the mid-cap growth segment of the US equity universe. It includes those Russell Midcap Index companies with higher price-to-book ratios and higher forecasted growth values.
Effective November 1, 2018, the Fund changed its benchmark to the Russell Midcap Growth Index from the Russell 2500 Index because Hartford Funds Management Company, LLC believes it better reflects the Fund’s revised investment strategy.
Russell 2500 Index(reflects no deduction for fees, expenses or taxes) is designed to measure the performance of the small to mid-cap segment of the U.S. equity universe, commonly referred to as “smid” cap. The Russell 2500 Index is a subset of the Russell 3000 Index and includes approximately 2,500 of the smallest securities based on a combination of their market capitalization and current index membership.
You cannot invest directly in an index.
Performance information may reflect historical waivers/reimbursements without which performance would have been lower.
As shown in the Fund’s current prospectus, the total annual fund operating expense ratios for Class IA and Class IB were 0.92% and 1.17%, respectively. Actual expenses may be higher or lower. Please see the accompanying Financial Highlights for expense ratios for the year ended December 31, 2018.
The chart and table do not reflect the deductions of taxes, sales charges or other fees which may be applied at the variable contract level or by a qualified pension or retirement plan. Any such additional sales charges or other fees or expenses would lower the contract’s or plan’s performance.
The Fund is closed to certain qualified pension and retirement plans. For more information, please see the Fund’s statutory prospectus.
|
| Hartford MidCap Growth HLS Fund(formerly, Hartford Small/Mid Cap Equity HLS Fund) |
Fund Overview – (continued)
December 31, 2018 (Unaudited)
Portfolio Managers
Timothy N. Manning
Managing Director and Equity Portfolio Manager
Wellington Management Company LLP
Manager Discussion
How did the Fund perform during the period?
The Class IA shares of Hartford MidCap Growth HLS Fund* returned-10.05% for the twelve-month period ended December 31, 2018, underperforming its new benchmark**, the Russell Midcap Growth Index, which returned-4.75%. The Fund also underperformed its former benchmark, the Russell 2500 Index, which returned-10.00% for the same period. For the same period, Class IA shares of the Fund underperformed the-5.43% average return of the LipperMid-Cap Growth Funds*** peer group, a group of funds with investment strategies similar to those of the Fund.
Why did the Fund perform this way?
U.S. equities, as measured by the S&P 500 Index, posted negative results over the trailing twelve-month period ending December 31, 2018. The Federal Reserve (Fed) raised its benchmark interest rate by 0.25% four times during the year, in line with expectations, albeit signaling a more dovish path heading into 2019. (“Dovish” describes a monetary policy that favors lower interest rates to encourage economic growth.) Bullish sentiment was exceptionally strong to start the year, as better-than-expected corporate profits helped drive U.S. equities higher. Signs of inflation entered the market in February of 2018 and led to heightened levels of volatility, a theme that continued for the remainder of the period. By the summer of 2018, talk of tariffs and trade wars had progressed to implementation, raising concerns in an otherwise strong economy. Nonetheless, positive sentiment persisted, fueled by robust earnings growth, fiscal stimulus, the announcement of a preliminary trade deal between the U.S. and Mexico, and expectations for stronger U.S. economic growth relative to other regions of the world. This changed in the final months of 2018, when concerns surrounding slowing global growth, rich valuations, rising central bank benchmark interest rates, and capricious U.S. and China trade tensions were at the forefront of investors’ minds. Returns in October and December were sharply negative, with the latter representing the largest U.S. equity market monthly decline seen this decade, culminating the first year of negative U.S. equity returns since 2008.
Returns varied bymarket-cap, aslarge-cap equities, as measured by the S&P 500 Index, outperformed both small- andmid-cap equities, as measured by the Russell 2000 Index and S&P MidCap 400 Index, respectively. Four of the eleven sectors in the custom benchmark**** posted positive absolute returns during the period. Utilities (+6%), Information Technology (+4%), and Healthcare (+2%) rose the most while Energy(-24%) and Materials(-19%) posted negative returns.
The Fund’s underperformance relative to the custom benchmark**** was driven by weak stock selection, particularly in the Industrials, Information Technology, and Healthcare sectors. This was partially offset by stronger selection in the Energy and Consumer Staples sectors. Sector allocation, a product of our bottom up stock-selection process, slightly aided returns relative to the custom benchmark**** during the period. An underweight to the Materials sector and an overweight to Utilities sector contributed positively to performance relative to the custom
benchmark****, partially offset by the negative impact from the Fund’s overweight allocations to the Consumer Staples and Consumer Discretionary sectors.
The largest detractors from performance relative to the custom benchmark**** during the period were Aramark (Consumer Discretionary), BWX Technologies (Industrials), and Acadia Healthcare (Healthcare). Aramark, a U.S.-based food service, facilities, and uniform services provider, detracted from relative performance after indicating modestly lower organic revenue guidance, which caused the stock to decline below what we believe to be its intrinsic value. The Fund used this as an opportunity to add to the position. BWX Technologies, a leading supplier of nuclear components and fuel to the U.S. government, was down after reporting a large one time charge and the delay of a new product launch. These issues are isolated from its core business and the Fund continued to hold the position at the end of the reporting period. Acadia Healthcare, a U.S.-based Healthcare services company, declined due to management lowering the company’s guidance and political pressures surrounding a new opioid bill being reviewed by the U.S. House of Representatives and the Senate. Gartner (Information Technology) was among the top absolute detractors during the period.
The largest contributors to performance relative to the custom benchmark**** and absolute performance during the period were Medifast (Consumer Staples), Fortinet (Information Technology), and Popular (Financials). Shares of Medifast, a U.S.-based healthy-living product and program specialist, rose on strong earnings announcements during the first part of the period. This small cap security was sold as part of the Fund’s transition. Fortinet, a network security company, rose in price as revenue growth accelerated and the company increased guidance during their second quarter earnings release. Shares of Popular, the holding company of Puerto Rico’s largest bank, Banco Popular de Puerto Rico, rallied as the company returned topre-hurricane levels of profitability.
Derivatives were not used in a significant manner in the Fund during the period and did not have a material impact on performance during the period.
What is the outlook as of the end of the period?
Despite recent volatility and the ensuing sell off in U.S. equities, we continue to believe the U.S. economy is on solid footing. We do recognize there are some pockets of heightened macro risk in the near term. We will continue to gauge signs that the economy is decelerating from where it stands at the end of the reporting period and will position accordingly.
| * | Effective November 1, 2018, the Fund changed its name from the Hartford Small/Mid Cap Equity HLS Fund to Hartford MidCap Growth HLS Fund and changed its principal investment strategy. |
| ** | Effective November 1, 2018, the benchmark changed from Russell 2500 Index to Russell Midcap Growth Index. |
| *** | During the period, the peer group changed from Lipper Mid-Cap Core Funds to Lipper Mid-Cap Growth Funds |
| **** | Custom benchmark returns and attribution results represent the Russell 2500 Index from January 1, 2018 through October 31, 2018 and the Russell Midcap Growth Index from November 1, 2018 through December 31, 2018. |
|
| Hartford MidCap Growth HLS Fund(formerly, Hartford Small/Mid Cap Equity HLS Fund) |
Fund Overview – (continued)
December 31, 2018 (Unaudited)
Important Risks
Investing involves risk, including the possible loss of principal. There is no guarantee the Fund will achieve its stated objective. Security prices fluctuate in value depending on general market and economic conditions and the prospects of individual companies.• Mid-cap securities can have greater risk and volatility than large-cap securities.• Foreign investments may be more volatile and less liquid than U.S. investments and are subject to the risk of currency fluctuations and adverse political and economic developments.• The Fund’s focus on investments in particular sectors may increase its volatility and risk of loss if adverse developments occur.• Different investment styles may go in and out of favor, which may cause the Fund to underperform the broader stock market.
Composition by Sector(1)
as of December 31, 2018
| | | | |
| Sector | | Percentage of
Net Assets | |
Equity Securities | | | | |
Communication Services | | | 3.2 | % |
Consumer Discretionary | | | 22.4 | |
Financials | | | 4.5 | |
Health Care | | | 17.9 | |
Industrials | | | 15.7 | |
Information Technology | | | 31.0 | |
Real Estate | | | 3.4 | |
| | | | |
Total | | | 98.1 | % |
| | | | |
Short-Term Investments | | | 1.6 | |
Other Assets & Liabilities | | | 0.3 | |
| | | | |
Total | | | 100.0 | % |
| | | | |
| (1) | A sector may be comprised of several industries. For Fund compliance purposes, the Fund may not use the same classification system. These sector classifications are used for financial reporting purposes. |
|
| Hartford MidCap Value HLS Fund |
Fund Overview
December 31, 2018 (Unaudited)
| | |
Inception 4/30/2001 Sub-advised by Wellington Management Company LLP | | Investment objective – The Fund seeks long-term capital appreciation. |
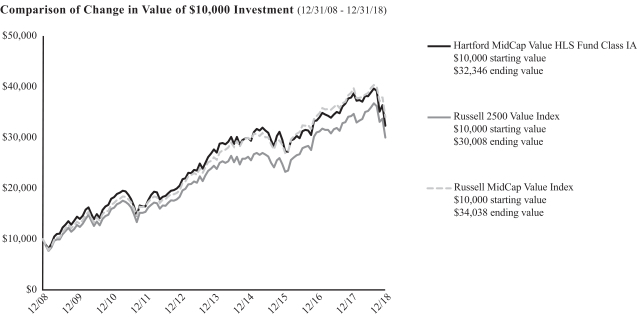
The chart above represents the hypothetical growth of a $10,000 investment in Class IA. Growth results in classes other than Class IA will vary from what is seen above due to differences in the expenses charged to those share classes.
Average Annual Total Returns
for the Periods Ending 12/31/18
| | | | | | | | | | | | |
| | | 1 Year | | | 5 Years | | | 10 Years | |
Class IA | | | -14.57% | | | | 3.17% | | | | 12.46% | |
Class IB | | | -14.77% | | | | 2.92% | | | | 12.18% | |
Russell 2500 Value Index | | | -12.36% | | | | 4.16% | | | | 11.62% | |
Russell MidCap Value Index | | | -12.29% | | | | 5.44% | | | | 13.03% | |
PERFORMANCE DATA QUOTED REPRESENTS PAST PERFORMANCE AND DOES NOT GUARANTEE FUTURE RESULTS. The investment return and principal value of the investment will fluctuate so that investors’ shares, when redeemed, may be worth more or less than their original cost. Current performance may be lower or higher than the performance data quoted. To obtain performance data current to the most recent month-end, please visit our website www.hartfordfunds.com.
Total returns presented above were calculated using the Fund’s net asset value available to shareholders for sale or redemption of Fund shares on December 31, 2018, which may exclude investment transactions as of this date. All share class returns assume the reinvestment of all distributions at net asset value and the deduction of all fund expenses.
Russell 2500 Value Index(reflects no deduction for fees, expenses or taxes) is designed to measure the performance of those Russell 2500 Index companies with lower price-to-book ratios and lower forecasted growth values. The Russell 2500 Index is designed to measure the performance of the 2,500 smallest U.S. companies based on their market capitalization and current index membership.
Russell MidCap Value Index (reflects no deduction for fees, expenses or taxes) is designed to measure the performance of the mid-cap value segment of the U.S. equity universe. It includes those Russell MidCap Index companies with lower price-to-book ratios and lower forecasted growth values.
You cannot invest directly in an index.
Performance information may reflect historical waivers/reimbursements without which performance would have been lower.
As shown in the Fund’s prospectus dated May 1, 2018, the total annual fund operating expense ratios for Class IA and Class IB were 0.86% and 1.11%, respectively. The Fund filed a supplement to its prospectus, dated November 19, 2018, with the U.S. Securities and Exchange Commission that updated the Fund’s total annual fund operating expense table effective January 1, 2019. However, the information in this annual report is as of December 31, 2018 and does not reflect any changes made to the total annual fund operating expense table in the prospectus, as supplemented. The net expense ratios shown in the supplement are as follows: 0.82% (Class IA) and 1.07% (Class IB). The gross expense ratios shown in the supplement are as follows: 0.86% (Class IA) and 1.11% (Class IB). This contractual waiver, which became effective January 1, 2019, will remain in effect through April 30, 2020 unless the Board of Directors of the Fund approves its earlier termination. Actual expenses may be higher or lower. Please see the accompanying Financial Highlights for expense ratios for the year ended December 31, 2018.
The chart and table do not reflect the deductions of taxes, sales charges or other fees which may be applied at the variable contract level or by a qualified pension or retirement plan. Any such additional sales charges or other fees or expenses would lower the contract’s or plan’s performance.
The Fund is closed to certain qualified pension and retirement plans. For more information, please see the Fund’s statutory prospectus.
|
| Hartford MidCap Value HLS Fund |
Fund Overview – (continued)
December 31, 2018 (Unaudited)
Portfolio Managers
Gregory J. Garabedian
Managing Director and Equity Portfolio Manager
Wellington Management Company LLP
Manager Discussion
How did the Fund perform during the period?
The Class IA shares of Hartford MidCap Value HLS Fund returned-14.57% for the twelve-month period ended December 31, 2018, underperforming the Fund’s benchmarks, the Russell 2500 Value Index and the Russell MidCap Value Index, which returned-12.36%and-12.29%, respectively, for the same period. For the same period, Class IA shares of the Fund also underperformed the-11.06% average return of the LipperMid-Cap Core Fund peer group, a group of funds with investment strategies similar to those of the Fund.
Why did the Fund perform this way?
U.S. equities, as measured by the S&P 500 Index, posted negative results over the trailing twelve-month period ending December 31, 2018. The Federal Reserve (Fed) raised its benchmark interest rate by 0.25% four times during the year, in line with expectations, albeit signaling a more dovish path heading into 2019. (“Dovish” describes a monetary policy that favors lower interest rates to encourage economic growth.) Bullish sentiment was exceptionally strong to start the year, as better-than-expected corporate profits helped drive U.S. equities higher. Signs of inflation entered the market in February of 2018 and led to heightened levels of volatility, a theme that continued for the remainder of the period. By the summer of 2018, talk of tariffs and trade wars had progressed to implementation, raising concerns in an otherwise strong economy. Nonetheless, positive sentiment persisted, fueled by robust earnings growth, fiscal stimulus, the announcement of a preliminary trade deal between the U.S. and Mexico, and expectations for stronger U.S. economic growth relative to other regions of the world. This changed in the final months of 2018, when concerns surrounding slowing global growth, rich valuations, rising central bank benchmark interest rates, and capricious U.S. and China trade tensions were at the forefront of investors’ minds. Returns in October and December were sharply negative, with the latter representing the largest U.S. equity market monthly decline seen this decade, culminating the first year of negative U.S. equity returns since 2008.
The Fund’s underperformance relative to the Russell 2500 Value Index was largely driven by weak security selection. Negative stock selection within the Financials, Consumer Discretionary, and Industrials sectors more than offset positive stock selection within Real Estate, Information Technology, and Healthcare. Sector allocation, a result of thebottom-up security selection process, also detracted from results relative to the Russell 2500 Value Index over the period, primarily due to an overweight position in the Materials and Energy sectors. An overweight to the Information Technology sector and an underweight to the Consumer Discretionary sector, which contributed positively, partially offset weak relative performance over the period.
The largest detractors from returns relative to the Russell 2500 Value Index included Unum Group (Financials), Newfield Exploration (Energy), andJELD-WEN (Industrials). Shares of Unum Group, an insurance
company, fell over the period due to weak earnings reports. Shares of Newfield Exploration, an oil and gas exploration company, struggled due to a sharp decline in oil prices.JELD-WEN, a leading manufacturer of residential windows and doors, preannounced a weak third quarter. Diamondback Energy (Energy) was a top absolute detractor from performance during the period.
The largest contributors to performance relative to the Russell 2500 Value Index included XL Group (Financials), UGI (Utilities), and Microsemi (Information Technology). XL Group, a global insurance and reinsurance company, rose sharply after the company agreed to be acquired by France-based insurer AXA. Shares of UGI, a natural gas and electric operator, rose during the period as the company reported strong earnings. Microsemi, a semiconductor manufacturing company, rose on news that it agreed to be acquired by Microchip Technology. Keysight (Information Technology) was a top absolute contributor to performance during the period.
Derivatives were not used in a significant manner in the Fund during the period and did not have a material impact on performance during the period.
What is the outlook as of the end of the period?
Although U.S. fundamentals remain solid, the combination of the Fed’s balance sheet runoff and higher policy rates proved too much for the financial markets to bear as concerns over slowing global growth continued to emerge. We maintain our belief that supply-side impacts of the tax cut and regulatory easing have yet to be fully realized, and combined with lower oil prices, the backdrop appears strong for the biggest part of the U.S. economy, the consumer. While we expect continued volatility in the near term, we have begun to evaluate new opportunities where moves in stock prices appear overdone and offer attractive valuations in multiple economic scenarios in our view. In fact, at the end of the period, the equity risk premium (the earnings yield over Treasury yields) was over 3%, signaling valuations are becoming increasingly attractive, especially amongst cyclicals where the Fund remained overweight relative to the benchmark.
The Fund ended the year most overweight in the Information Technology, Materials, and Energy sectors, and most underweight the Consumer Discretionary, Real Estate, and Financials sectors, relative to the Russell 2500 Value Index.
Important Risks
Investing involves risk, including the possible loss of principal. There is no guarantee the Fund will achieve its stated objective. Security prices fluctuate in value depending on general market and economic conditions and the prospects of individual companies.• Mid-cap securities can have greater risk and volatility than large-cap securities.• Foreign investments may be more volatile and less liquid than U.S. investments and are subject to the risk of currency fluctuations and adverse political and economic developments.• The Fund’s focus on investments in
|
| Hartford MidCap Value HLS Fund |
Fund Overview – (continued)
December 31, 2018 (Unaudited)
particular sectors may increase its volatility and risk of loss if adverse developments occur.• Different investment styles may go in and out of favor, which may cause the Fund to underperform the broader stock market.
Composition by Sector(1)
as of December 31, 2018
| | | | |
| Sector | | Percentage of
Net Assets | |
Equity Securities | | | | |
Communication Services | | | 2.3 | % |
Consumer Discretionary | | | 4.4 | |
Consumer Staples | | | 3.5 | |
Energy | | | 6.6 | |
Financials | | | 20.3 | |
Health Care | | | 3.7 | |
Industrials | | | 14.9 | |
Information Technology | | | 15.5 | |
Materials | | | 9.5 | |
Real Estate | | | 12.1 | |
Utilities | | | 5.8 | |
| | | | |
Total | | | 98.6 | % |
| | | | |
Short-Term Investments | | | 2.1 | |
Other Assets & Liabilities | | | (0.7 | ) |
| | | | |
Total | | | 100.0 | % |
| | | | |
| (1) | A sector may be comprised of several industries. For Fund compliance purposes, the Fund may not use the same classification system. These sector classifications are used for financial reporting purposes. |
|
| Hartford Small Cap Growth HLS Fund |
Fund Overview
December 31, 2018 (Unaudited)
| | |
Inception 5/02/1994 Sub-advised by Wellington Management Company LLP | | Investment objective – The Fund seeks long-term capital appreciation. |

The chart above represents the hypothetical growth of a $10,000 investment in Class IA. Growth results in classes other than Class IA will vary from what is seen above due to differences in the expenses charged to those share classes.
Average Annual Total Returns
for the Periods Ending 12/31/18
| | | | | | | | | | | | |
| | | 1 Year | | | 5 Years | | | 10 Years | |
Class IA | | | -11.70% | | | | 4.63% | | | | 14.87% | |
Class IB | | | -11.89% | | | | 4.37% | | | | 14.58% | |
Russell 2000 Growth Index | | | -9.31% | | | | 5.13% | | | | 13.52% | |
PERFORMANCE DATA QUOTED REPRESENTS PAST PERFORMANCE AND DOES NOT GUARANTEE FUTURE RESULTS. The investment return and principal value of the investment will fluctuate so that investors’ shares, when redeemed, may be worth more or less than their original cost. Current performance may be lower or higher than the performance data quoted. To obtain performance data current to the most recent month-end, please visit our website www.hartfordfunds.com.
Total returns presented above were calculated using the Fund’s net asset value available to shareholders for sale or redemption of Fund shares on December 31, 2018, which may exclude investment transactions as of this date. All share class returns assume the reinvestment of all distributions at net asset value and the deduction of all fund expenses.
Russell 2000 Growth Index(reflects no deduction for fees, expenses or taxes) is an index of those Russell 2000 Index growth companies with higher price-to-book ratios and higher forecasted growth values. The Russell 2000 Index is an index comprised of 2,000 of the smallest U.S.-domiciled company common stocks based on a combination of their market capitalization and current index membership.
You cannot invest directly in an index.
Performance information may reflect historical waivers/reimbursements without which performance would have been lower.
As shown in the Fund’s current prospectus, the total annual fund operating expense ratios for Class IA and Class IB were 0.66% and 0.91%, respectively. Expenses shown include acquired fund fees and expenses. Actual expenses may be higher or lower. Please see the accompanying Financial Highlights for expense ratios for the year ended December 31, 2018.
Performance information through July 21, 2010 represents performance of the Fund’s previous additional sub-adviser, Hartford Investment Management Company (“HIMCO”). As of July 21, 2010, HIMCO no longer serves as an additional sub-adviser to the Fund.
The chart and table do not reflect the deductions of taxes, sales charges or other fees which may be applied at the variable contract level or by a qualified pension or retirement plan. Any such additional sales charges or other fees or expenses would lower the contract’s or plan’s performance.
The Fund is closed to new investors, subject to certain exceptions. For more information, please see the Fund’s statutory prospectus.
|
| Hartford Small Cap Growth HLS Fund |
Fund Overview – (continued)
December 31, 2018 (Unaudited)
Portfolio Managers
Mammen Chally, CFA
Senior Managing Director and Equity Portfolio Manager
Wellington Management Company LLP
David A. Siegle, CFA
Managing Director and Equity Research Analyst
Wellington Management Company LLP
Douglas W. McLane, CFA
Managing Director and Equity Research Analyst
Wellington Management Company LLP
Manager Discussion
How did the Fund perform during the period?
The Class IA shares of Hartford Small Cap Growth HLS Fund returned-11.70% for the twelve-month period ended December 31, 2018, underperforming the Fund’s benchmark, the Russell 2000 Growth Index, which returned-9.31%. For the same period, the Class IA shares of the Fund also underperformed the average return of the LipperSmall-Cap Growth Funds peer group-4.57%, a group of funds with investment strategies similar to those of the Fund.
Why did the Fund perform this way?
U.S. equities, as measured by the S&P 500 Index, posted negative results over the trailing twelve-month period ending December 31, 2018. The U.S. Federal Reserve (Fed) raised its benchmark interest rate by 0.25% four times during the year, in line with expectations, although they signaled a more dovish path heading into 2019. (“Dovish” describes a monetary policy that favors lower interest rates to encourage economic growth.) Bullish sentiment was exceptionally strong to start the year, as better-than-expected corporate profits helped drive U.S. equities higher. Signs of inflation entered the market in February of 2018 which led to heightened levels of volatility, a theme that continued for the remainder of the year. By the summer of 2018, talk of tariffs and trade wars had progressed to implementation, raising concerns in an otherwise strong economy. Nonetheless, positive sentiment persisted, fueled by robust earnings growth, fiscal stimulus, the announcement of a preliminary trade deal between the U.S. and Mexico, and expectations for stronger U.S. economic growth relative to other regions of the world. This changed in the final months of 2018, when concerns surrounding slowing global growth, rich valuations, rising central bank benchmark interest rates, and capricious U.S. and China trade tensions were at the forefront of investors’ minds. Returns in October and December were sharply negative, with the latter representing the largest U.S. equity market monthly decline seen this decade, culminating the first year of negative U.S. equity returns since 2008.
Returns varied bymarket-cap, aslarge-cap equities, as measured by the S&P 500 Index, outperformed both small- andmid-cap equities, as measured by the Russell 2000 Index and S&P MidCap 400 Index, respectively. Three of the eleven sectors in the Russell 2000 Growth Index had positive returns during the period. Energy(-48%), Materials(-25%), and Industrials(-21%) lagged the broader index, while Information Technology (6%) rose during the period.
Security selection was the primary detractor from the Fund’s performance relative to the Russell 2000 Growth Index. Selection was weakest within the Healthcare, Consumer Discretionary, and Materials sectors, which was partially offset by stronger selection within the Information Technology and Energy sectors. Sector allocation, which is a result of ourbottom-up security selection process, contributed positively to performance relative to the Russell 2000 Growth Index driven by underweights to Industrials and Materials and an overweight to Information Technology. An underweight to Utilities detracted from performance relative to the Russell 2000 Growth Index during the period.
Among the top detractors from performance relative to the Russell 2000 Growth Index during the period wereJELD-WEN (Industrials), Floor & Decor (Consumer Discretionary) and Altra (Industrials).JELD-WEN is a designer, manufacturer and distributor of doors and aluminum windows. Shares fell after the company’s earnings came in lower than estimates due to difficult conditions in the housing market. Floor & Decor, a surface and flooring company declined during the period over concerns around rising interest rates and slowing housing starts. Shares of Altra, a manufacturer of motion control and transmission products, fell during the period on concerns that tariffs on aluminum and steel could diminish margins.JELD-WEN (Industrials) and Altra (Industrials) were among the top absolute detractors during the period.
Top contributors to performance relative to the Russell 2000 Growth Index during the period included Wingstop (Consumer Discretionary), Etsy (Consumer Discretionary), and MongoDB (Information Technology). Shares of Wingstop, an owner and operator of restaurants and franchises, rose on the back of high same-store sales growth and optimism about the company’s roll out of delivery services in 2019. Shares of Etsy, ane-commerce company, rose during the period on the back of strong sales and revenue growth. The company also raised its revenue guidance and remained active with their share repurchase program. Shares of MongoDB, a database platform company, rose because of strong subscription growth and continued traction in their cloud-hosted database offering. Etsy (Consumer Discretionary) was the top absolute contributor during the period.
Derivatives were not used in a significant manner in the Fund during the period and did not have a material impact on performance during the period.
|
| Hartford Small Cap Growth HLS Fund |
Fund Overview – (continued)
December 31, 2018 (Unaudited)
What is the outlook as of the end of the period?
We believe the U.S. economy remains healthy, although leading indicators are suggesting some moderation in growth later in 2019. With unemployment levels low and trending lower, we still believe risks to U.S. inflation are to the upside. Many companies are facing higher labor and material costs creating some uncertainty around profitability. While we were concerned about the possibility of higher oil prices in the last quarter of 2018 given the prospect of Iran sanctions, the waivers granted by the U.S. government actually resulted in oversupply and declining crude prices. However, we believe the subsequent cuts should restore supply demand balance and allow oil prices to find a firmer footing in 2019.
Trade continues to dominate the narrative. In the first quarter of 2019, trade representatives will be starting conversations in China. We are hopeful that a satisfactory agreement will be arrived at, however some supply chain disruption and temporary pauses in capital investment cannot be ruled out. The U.K.’s exit from the E.U. (Brexit) hasre-emerged as another near term uncertainty that we have to monitor. On the flip side, the strong employment situation bodes well for the consumer and so far the government shutdown has had little economic impact. Also credit remains benign and does not appear to be a near term headwind to profitability.
We will be watching profitability trends during the first quarter of 2019, particularly in areas seeing inflationary pressures to evaluate the ability for companies to pass on prices and still grow. Given the uncertainty of some of the aforementioned macroeconomic issues, we do expect volatility to remain somewhat elevated despite recent declines in the market.
At the end of the period, the Fund’s largest overweights were to the Information Technology, Consumer Staples, and Financials sectors, while the Fund’s largest underweights were to the communication services, industrial, and Consumer Discretionary sectors, relative to the Russell 2000 Growth Index.
Important Risks
Investing involves risk, including the possible loss of principal. There is no guarantee the Fund will achieve its stated objective. Security prices fluctuate in value depending on general market and economic conditions and the prospects of individual companies.• Small-cap securities can have greater risk and volatility than large-cap securities.• The Fund’s focus on investments in particular sectors may increase its volatility and risk of loss if adverse developments occur.• Different investment styles may go in and out of favor, which may cause the Fund to underperform the broader stock market.
Composition by Sector(1)
as of December 31, 2018
| | | | |
| Sector | | Percentage of
Net Assets | |
Equity Securities | | | | |
Communication Services | | | 1.2 | % |
Consumer Discretionary | | | 12.9 | |
Consumer Staples | | | 4.1 | |
Energy | | | 1.5 | |
Financials | | | 12.2 | |
Health Care | | | 25.5 | |
Industrials | | | 15.5 | |
Information Technology | | | 19.5 | |
Materials | | | 2.9 | |
Real Estate | | | 2.8 | |
| | | | |
Total | | | 98.1 | % |
| | | | |
Short-Term Investments | | | 5.3 | |
Other Assets & Liabilities | | | (3.4 | ) |
| | | | |
Total | | | 100.0 | % |
| | | | |
| (1) | A sector may be comprised of several industries. For Fund compliance purposes, the Fund may not use the same classification system. These sector classifications are used for financial reporting purposes. |
|
| Hartford Small Company HLS Fund |
Fund Overview
December 31, 2018 (Unaudited)
| | |
Inception 8/09/1996 Sub-advised by Wellington Management Company LLP | | Investment objective – The Fund seeks growth of capital. |
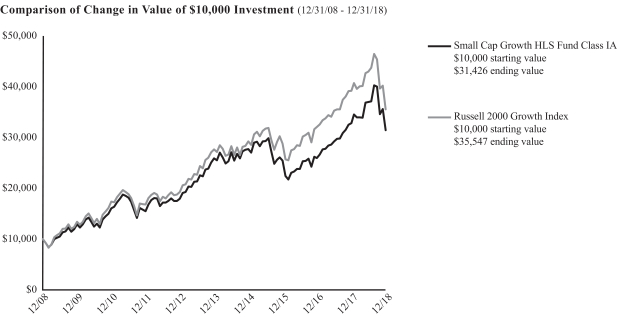
The chart above represents the hypothetical growth of a $10,000 investment in Class IA. Growth results in classes other than Class IA will vary from what is seen above due to differences in the expenses charged to those share classes.
Average Annual Total Returns
for the Periods Ending 12/31/18
| | | | | | | | | | | | |
| | | 1 Year | | | 5 Years | | | 10 Years | |
Class IA | | | -4.23% | | | | 3.95% | | | | 12.13% | |
Class IB | | | -4.51% | | | | 3.69% | | | | 11.85% | |
Russell 2000 Growth Index | | | -9.31% | | | | 5.13% | | | | 13.52% | |
PERFORMANCE DATA QUOTED REPRESENTS PAST PERFORMANCE AND DOES NOT GUARANTEE FUTURE RESULTS. The investment return and principal value of the investment will fluctuate so that investors’ shares, when redeemed, may be worth more or less than their original cost. Current performance may be lower or higher than the performance data quoted. To obtain performance data current to the most recent month-end, please visit our website www.hartfordfunds.com.
Total returns presented above were calculated using the Fund’s net asset value available to shareholders for sale or redemption of Fund shares on December 31, 2018, which may exclude investment transactions as of this date. All share class returns assume the reinvestment of all distributions at net asset value and the deduction of all fund expenses.
Russell 2000 Growth Index(reflects no deduction for fees, expenses or taxes) is an index of those Russell 2000 Index growth companies with higher price-to-book ratios and higher forecasted growth values. The Russell 2000 Index is an index comprised of 2,000 of the smallest U.S.-domiciled company common stocks based on a combination of their market capitalization and current index membership.
You cannot invest directly in an index.
Performance information may reflect historical waivers/reimbursements without which performance would have been lower.
As shown in the Fund’s current prospectus, the total annual fund operating expense ratios for Class IA and Class IB were 0.78% and 1.03%, respectively. Actual expenses may be higher or lower. Please see the accompanying Financial Highlights for expense ratios for the year ended December 31, 2018.
Performance information through July 21, 2010 represents performance of the Fund’s previous additional sub-adviser, Hartford Investment Management Company (“HIMCO”). As of July 21, 2010, HIMCO no longer serves as an additional sub-adviser to the Fund.
The chart and table do not reflect the deductions of taxes, sales charges or other fees which may be applied at the variable contract level or by a qualified pension or retirement plan. Any such additional sales charges or other fees or expenses would lower the contract’s or plan’s performance.
The Fund is closed to new investors, subject to certain exceptions. For more information, please see the Fund’s prospectus.
|
| Hartford Small Company HLS Fund |
Fund Overview – (continued)
December 31, 2018 (Unaudited)
Portfolio Managers
Steven C. Angeli, CFA
Senior Managing Director and Equity Portfolio Manager
Wellington Management Company LLP
John V. Schneider, CFA
Vice President and Equity Research Analyst
Wellington Management Company LLP
Manager Discussion
How did the Fund perform during the period?
The Class IA shares of Hartford Small Company HLS Fund returned-4.23% for the twelve-month period ended December 31, 2018, outperforming the Fund’s benchmark, the Russell 2000 Growth Index which returned-9.31% for the same period. For the same period, Class IA shares of the Fund also outperformed the-4.58% average return of the LipperSmall-Cap Growth Funds peer group, a group of funds with investment strategies similar to those of the Fund.
Why did the Fund perform this way?
U.S. equities, as measured by the S&P 500 Index, posted negative results over the trailing twelve-month period ending December 31, 2018. The U.S. Federal Reserve (Fed) raised its benchmark interest rate by 0.25% four times during the year, in line with expectations, although they signaled a more dovish path heading into 2019. (“Dovish” describes a monetary policy that favors lower interest rates to encourage economic growth.) Bullish sentiment was exceptionally strong to start the year, as better-than-expected corporate profits helped drive U.S. equities higher. Signs of inflation entered the market in February of 2018, which led to heightened levels of volatility, a theme that continued for the remainder of the year. By the summer of 2018, talk of tariffs and trade wars had progressed to implementation, raising concerns in an otherwise strong economy. Nonetheless, positive sentiment persisted, fueled by robust earnings growth, fiscal stimulus, the announcement of a preliminary trade deal between the U.S. and Mexico, and expectations for stronger U.S. economic growth relative to other regions of the world. This changed in the final months of 2018, when concerns surrounding slowing global growth, rich valuations, rising central bank benchmark interest rates, and capricious U.S. and China trade tensions were at the forefront of investors’ minds. Returns in October and December were sharply negative, with returns in December representing the largest U.S. equity market monthly decline seen this decade, culminating in the first year of negative U.S. equity returns since 2008.
Returns varied bymarket-cap, aslarge-cap equities, as measured by the S&P 500 Index, outperformed both small- andmid-cap equities, as measured by the Russell 2000 Index and S&P MidCap 400 Index, respectively. Three of the eleven sectors in the Russell 2000 Growth Index had positive returns during the period. Energy(-48%), Materials(-25%), and Industrials(-21%) lagged the broader index, while Information Technology (+6%) rose the most during the period.
Stock selection was the main driver of outperformance versus the Russell 2000 Growth Index, primarily due to selection within the Information Technology, Healthcare, and Energy sectors. This was partially offset by weaker selection in the Financials, Consumer
Discretionary and Communication Services sectors, which detracted from performance relative to the Russell 2000 Growth Index. Sector allocation, which is the result ofbottom-up stock selection, contributed positively to relative returns, primarily due to an overweight to the Information Technology sector and an underweight to the Industrial sector. This more than offset negative relative performance from an underweight allocation to the Healthcare sector, and an overweight allocation to the Materials sector.
Top contributors to performance relative the Russell 2000 Growth Index during the period included The Trade Desk (Information Technology), Planet Fitness (Consumer Discretionary), and Zebra Technologies (Information Technology). The Trade Desk, a digital advertising platform for media buyers, announced results which exceeded market expectations as more ad dollars continue to shift to digital. We trimmed the Fund’s position through the period but remained overweight to conclude the year. Planet Fitness is a national fitness center operator whose financial results exceeded consensus earnings expectations. The company raised its forward guidance as it grew its footprint and experienced strong growth in its franchise segment; as a result, the stock price of the company rose. We maintained the Fund’s position in the security as ofyear-end, though we trimmed it throughout the year as it has outperformed. Zebra Technologies, a barcode scanning and radio frequency identification company, was a top contributor in the Information Technology sector. Management is focused on growth and expanding margins with Motorola Solution’s enterprise acquisition now fully integrated, and the company continues to benefit from secular demand as the market increasingly moves from 2 day delivery to 2 hour delivery. Okta (Information Technology) was a top absolute contributor during the period.
Top detractors from performance relative to the Russell 2000 Growth Index during the period included Floor & Decor (Consumer Discretionary), Marriott Vacations Worldwide (Consumer Discretionary), and Tower Semiconductor (Information Technology). Floor & Decor, a surface and flooring company, saw its stock price decline during the period over concerns around rising interest rates and slowing housing starts. The share price of Marriott Vacations Worldwide, a global timeshare operator, fell as rising interest rates and a slowdown in the residential housing market caused sentiment to weigh negatively on the stock. We continued to hold an overweight position in the company as we believe the industry is less cyclical than other areas of consumer discretionary spending, and that the company has attractive growth opportunities with a strong balance sheet and attractive free cash flow yield as ofyear-end. The stock price of Tower Semiconductor, an Israeli-based manufacturer of analog chips, fell during the period following multiple estimate cuts related to Apple/smartphone supply chain weakness and broader concerns over a cyclical downturn in the industry.
|
| Hartford Small Company HLS Fund |
Fund Overview – (continued)
December 31, 2018 (Unaudited)
We tactically eliminated the position earlier in the year, and then reinitiated the position following further weakness given strong management and an underappreciated secular demand driver as more end markets require the company’s technology. Skyline Champion (Consumer Discretionary) was a top absolute detractor during the period.
Derivatives were not used in a significant manner in the Fund during the period and did not have a material impact on performance during the period.
What is the outlook as of the end of the period?
The Russell 2000 Index has corrected-27%peak-to-troughs since late August 2018, with overtwo-thirds of the index constituents down more than-20%. In our view, this broad based correction seems to be pricing in a late cycle slowdown and is not discriminating between long term, secular growers and companies that will be facing more challenges from this type of environment. While this rapid and steep downturn is disappointing in the near term, we believe it has presented us with an opportunity to both add to high conviction positions as well as to initiate positions in the aforementioned strong, secular growers that may be able to outperform in a challenging, late cycle macro environment. With valuations trading in line with large caps as ofyear-end, despite better growth prospects, and with consensus earnings growth for small caps expected to accelerate in the second quarter of 2019, we are cautiously optimistic heading into the new year.
At the end of the period, the Fund’s largest overweights were to the Consumer Discretionary, Healthcare, and Information Technology sectors, while the Fund’s largest underweights were to the Industrial, Communication Services, and Utilities sectors, relative to the Russell 2000 Growth Index.
Important Risks
Investing involves risk, including the possible loss of principal. There is no guarantee the Fund will achieve its stated objective. Security prices fluctuate in value depending on general market and economic conditions and the prospects of individual companies.• Small-cap securities can have greater risk and volatility than large-cap securities.• Foreign investments may be more volatile and less liquid than U.S. investments and are subject to the risk of currency fluctuations and adverse political and economic developments.• The Fund’s focus on investments in particular sectors may increase its volatility and risk of loss if adverse developments occur.• Different investment styles may go in and out of favor, which may cause the Fund to underperform the broader stock market.
Composition by Sector(1)
as of December 31, 2018
| | | | |
| Sector | | Percentage of
Net Assets | |
Equity Securities | | | | |
Communication Services | | | 0.8 | % |
Consumer Discretionary | | | 18.9 | |
Consumer Staples | | | 2.7 | |
Energy | | | 1.5 | |
Financials | | | 7.1 | |
Health Care | | | 27.5 | |
Industrials | | | 12.1 | |
Information Technology | | | 19.6 | |
Materials | | | 3.6 | |
Real Estate | | | 3.4 | |
| | | | |
Total | | | 97.2 | % |
| | | | |
Short-Term Investments | | | 6.3 | |
Other Assets & Liabilities | | | (3.5 | ) |
| | | | |
Total | | | 100.0 | % |
| | | | |
| (1) | A sector may be comprised of several industries. For Fund compliance purposes, the Fund may not use the same classification system. These sector classifications are used for financial reporting purposes. |
Fund Overview
December 31, 2018 (Unaudited)
| | |
Inception 8/31/1977 Sub-advised by Wellington Management Company LLP | | Investment objective – The Fund seeks long-term growth of capital. |
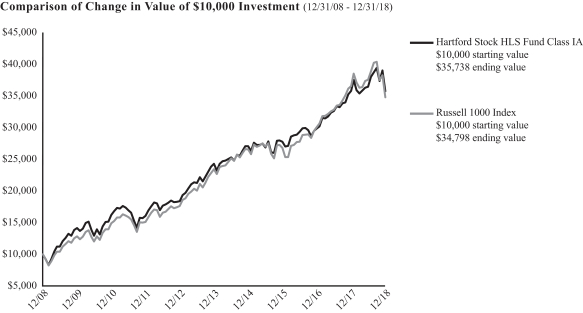
The chart above represents the hypothetical growth of a $10,000 investment in Class IA. Growth results in classes other than Class IA will vary from what is seen above due to differences in the expenses charged to those share classes.
Average Annual Total Returns
for the Periods Ending 12/31/18
| | | | | | | | | | | | |
| | | 1 Year | | | 5 Years | | | 10 Years | |
Class IA | | | -0.14% | | | | 8.01% | | | | 13.58% | |
Class IB | | | -0.38% | | | | 7.74% | | | | 13.30% | |
Russell 1000 Index | | | -4.78% | | | | 8.21% | | | | 13.28% | |
PERFORMANCE DATA QUOTED REPRESENTS PAST PERFORMANCE AND DOES NOT GUARANTEE FUTURE RESULTS. The investment return and principal value of the investment will fluctuate so that investors’ shares, when redeemed, may be worth more or less than their original cost. Current performance may be lower or higher than the performance data quoted. To obtain performance data current to the most recent month-end, please visit our website www.hartfordfunds.com.
Total returns presented above were calculated using the Fund’s net asset value available to shareholders for sale or redemption of Fund shares on December 31, 2018, which may exclude investment transactions as of this date. All share class returns assume the reinvestment of all distributions at net asset value and the deduction of all fund expenses.
Russell 1000 Index(reflects no deduction for fees, expenses or taxes) is designed to measure the performance of the 1,000 largest companies in the Russell 3000 Index, which is designed to measure the performance of the 3,000 largest U.S. companies, based on total market capitalization.
You cannot invest directly in an index.
Performance information may reflect historical waivers/reimbursements without which performance would have been lower.
As shown in the Fund’s current prospectus, the total annual fund operating expense ratios for Class IA and Class IB were 0.52% and 0.77%, respectively. Actual expenses may be higher or lower. Please see the accompanying Financial Highlights for expense ratios for the year ended December 31, 2018.
The chart and table do not reflect the deductions of taxes, sales charges or other fees which may be applied at the variable contract level or by a qualified pension or retirement plan. Any such additional sales charges or other fees or expenses would lower the contract’s or plan’s performance.
The Fund is closed to certain qualified pension and retirement plans. For more information, please see the Fund’s statutory prospectus.
Fund Overview – (continued)
December 31, 2018 (Unaudited)
Portfolio Managers
Donald J. Kilbride
Senior Managing Director and Equity Portfolio Manager
Wellington Management Company LLP
Manager Discussion
How did the Fund perform during the period?
The Class IA shares of Hartford Stock HLS Fund returned-0.14% for the twelve-month period ended December 31, 2018, outperforming the Fund’s benchmark, the Russell 1000 Index, which returned-4.78% for the same period. For the same period, Class IA shares of the Fund also outperformed the-5.43% average return of the LipperLarge-Cap Core Funds peer group, a group of funds with investment strategies similar to those of the Fund.
Why did the Fund perform this way?
U.S. equities, measured by the S&P 500 Index, posted negative results over the trailing twelve-month period ending December 31, 2018. The Federal Reserve (Fed) raised its benchmark interest rate by 0.25% four times during the year, in line with expectations, although they signaled a more dovish path heading into 2019. (“Dovish” describes a monetary policy that favors lower interest rates to encourage economic growth.) Bullish sentiment was exceptionally strong to start the year, as better-than-expected corporate profits helped drive U.S. equities higher. Signs of inflation entered the market in February of 2018, which led to heightened levels of volatility, a theme that continued for the remainder of the year. By the summer of 2018, talk of tariffs and trade wars had progressed to implementation, raising concerns in an otherwise strong economy. Nonetheless, positive sentiment persisted, fueled by robust earnings growth, fiscal stimulus, the announcement of a preliminary trade deal between the U.S. and Mexico, and expectations for stronger U.S. economic growth relative to other regions of the world. This changed in the final months of 2018, when concerns surrounding slowing global growth, rich valuations, rising central bank benchmark interest rates, and capricious U.S. and China trade tensions were at the forefront of investors’ minds. Returns in October and December were sharply negative, with the latter representing the largest U.S. equity market monthly decline seen this decade, culminating the first year of negative U.S. equity returns since 2008.
Returns varied bymarket-cap during the period, aslarge-cap equities, as measured by the S&P 500 Index, outperformed both small- andmid-cap equities, as measured by the Russell 2000 Index and S&P MidCap 400 Index, respectively. During the twelve-month period, only three of the eleven sectors within the Russell 1000 Index rose, led by Healthcare (+6%) and Utilities (+5%). Energy(-19%), Materials(-16%), Industrials(-14%) and Communication Services(-14%) lagged on a relative basis.
The Fund’s outperformance versus the Russell 1000 Index was primarily driven by strong security selection within Consumer Discretionary, Consumer Staples, Materials, and Information Technology sectors. Weaker selection in the Energy sector partially offset positive results. Sector allocation, a residual of thebottom-up stock selection process, detracted from returns relative to the Russell 1000 Index, due primarily
to an underweight allocation to the Information Technology sector and an overweight to the Industrials sector.
Top contributors to performance relative to the Russell 1000 Index during the period included TJX Companies (Consumer Discretionary), Nike (Consumer Discretionary), and American Tower (Real Estate). Shares of TJX Companies, a U.S.-basedglobal-off price apparel and home goods retailer, advanced during the period on strong adjusted earnings per share. Results were strong across the board as sales, gross profit, and operating profit all increased year over year. Nike, a U.S.-based provider of athletic footwear, apparel and accessories, reported strong earnings during the period. The company announced that its new innovation platforms are all working, sales are accelerating across all regions and channels (including the US), gross margins exceeded expectations, and inventory issues are in the rearview mirror. The stock price of American Tower, a U.S.-based owner and operator of wireless communications real estate, rose during the period after management reported another strong period with adjusted earnings per share above consensus estimates. Microsoft (Information Technology) was a top absolute contributor to relative performance during the period.
Stocks that detracted the most from performance relative to the Russell 1000 Index during the period were Amazon (Consumer Discretionary), Schlumberger (Energy), and General Dynamics (Industrials). Not owning benchmark constituent Amazon, a U.S.-based globale-commerce retailer, detracted from performance relative to the Russell 1000 Index as the company reported strong organic growth and rising profit, along with increasing net sales year over year. Shares of Schlumberger, a U.S.-based provider of services and equipment used in drilling, evaluation, completion, production, and maintenance of oil and natural gas wells, fell during the period along with other Energy companies as the price of oil plunged. We trimmed the Fund’s position in Schlumberger in the fourth quarter of 2018. Shares of U.S.-based aerospace and defense company, General Dynamics, fell during the period, along with the Russell 1000 Index, as ongoing trade tensions and China related growth concerns hampered the sector. Colgate-Palmolive (Consumer Staples) was a top absolute detractor from performance.
Derivatives were not used in a significant manner in the Fund during the period and did not have a material impact on performance during the period.
What is the outlook as of the end of the period?
During the fourth quarter, equity markets in Europe, Japan and the U.S. finally succumbed to the ebbing tide of global liquidity. The effects of the liquidity drought have been rolling through various risk assets around the world throughout the year, so we view the recent equity market turmoil as part of this broader theme rather than aone-off event.
The drop in share prices has presented some opportunities in our view, but on the whole our concerns remain: a levered global economy late in an economic cycle, with intrinsic valuations that are difficult to ascertain,
Fund Overview – (continued)
December 31, 2018 (Unaudited)
suffering through a gradual tightening of liquidity, and buffeted by all sorts of risks such as trade wars and volatile geopolitics. We remain cautious.
Late in the year, we rebalanced the portfolio a bit by taking profits from some strong performers in order to add to existing holdings where we believe that there is higher earnings potential. We will be looking for further opportunities to add new companies to the portfolio if market volatility continues, as we think likely.
We continue to look for companies that can sustainably grow their dividends over time.
At the end of the period, ourbottom-up investment approach resulted in overweight exposures to the Consumer Staples, Industrials, and Healthcare sectors, relative to the Russell 1000 Index. The Fund’s largest underweights relative to the Russell 1000 Index were to the Information Technology, Communication Services, and Utilities sectors, at the end of the period.
Important Risks
Investing involves risk, including the possible loss of principal. There is no guarantee the Fund will achieve its stated objective. Security prices fluctuate in value depending on general market and economic conditions and the prospects of individual companies.• Foreign investments may be more volatile and less liquid than U.S. investments and are subject to the risk of currency fluctuations and adverse political and economic developments.
Composition by Sector(1)
as of December 31, 2018
| | | | |
| Sector | | Percentage of
Net Assets | |
Equity Securities | | | | |
Consumer Discretionary | | | 11.7 | % |
Consumer Staples | | | 16.9 | |
Energy | | | 1.8 | |
Financials | | | 12.2 | |
Health Care | | | 17.0 | |
Industrials | | | 19.2 | |
Information Technology | | | 9.2 | |
Materials | | | 4.8 | |
Real Estate | | | 6.4 | |
| | | | |
Total | | | 99.2 | % |
| | | | |
Short-Term Investments | | | 0.9 | |
Other Assets & Liabilities | | | (0.1 | ) |
| | | | |
Total | | | 100.0 | % |
| | | | |
| (1) | A sector may be comprised of several industries. For Fund compliance purposes, the Fund may not use the same classification system. These sector classifications are used for financial reporting purposes. |
|
| Hartford Total Return Bond HLS Fund |
Fund Overview
December 31, 2018 (Unaudited)
| | |
Inception 8/31/1977 Sub-advised by Wellington Management Company LLP | | Investment objective – The Fund seeks a competitive total return, with income as a secondary objective. |
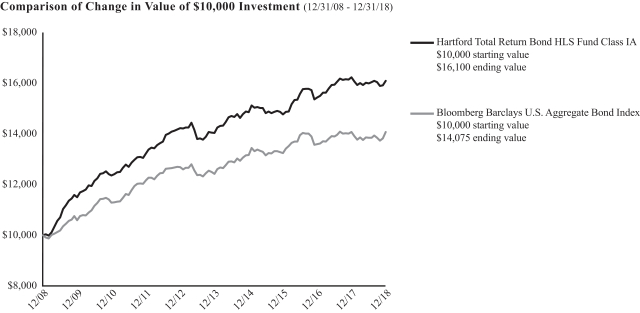
The chart above represents the hypothetical growth of a $10,000 investment in Class IA. Growth results in classes other than Class IA will vary from what is seen above due to differences in the expenses charged to those share classes.
Average Annual Total Returns
for the Periods Ending 12/31/18
| | | | | | | | | | | | |
| | | 1 Year | | | 5 Years | | | 10 Years | |
Class IA | | | -0.81% | | | | 2.79% | | | | 4.88% | |
Class IB | | | -0.91% | | | | 2.55% | | | | 4.62% | |
Bloomberg Barclays U.S. Aggregate Bond Index | | | 0.01% | | | | 2.52% | | | | 3.48% | |
PERFORMANCE DATA QUOTED REPRESENTS PAST PERFORMANCE AND DOES NOT GUARANTEE FUTURE RESULTS. The investment return and principal value of the investment will fluctuate so that investors’ shares, when redeemed, may be worth more or less than their original cost. Current performance may be lower or higher than the performance data quoted. To obtain performance data current to the most recent month-end, please visit our website www.hartfordfunds.com.
Total returns presented above were calculated using the Fund’s net asset value available to shareholders for sale or redemption of Fund shares on December 31, 2018, which may exclude investment transactions as of this date. All share class returns assume the reinvestment of all distributions at net asset value and the deduction of all fund expenses.
Performance information through March 5, 2012 represents performance of the Fund’s previous sub-adviser, Hartford Investment Management Company (“HIMCO”). As of March 5, 2012, HIMCO no longer served as the sub-adviser to the Fund.
Bloomberg Barclays U.S. Aggregate Bond Index (reflects no deduction for fees, expenses or taxes) is composed of securities that are Securities and Exchange Commission registered, taxable, and dollar denominated. The index covers the U.S. investment grade fixed rate bond market, with index components for government and corporate securities, mortgage pass-through securities, and asset-backed securities. These major sectors are subdivided into more specific indices that are calculated and reported on a regular basis.
You cannot invest directly in an index.
Performance information may reflect historical waivers/reimbursements without which performance would have been lower.
As shown in the Fund’s current prospectus dated May 1, 2018, the total annual fund operating expense ratios for Class IA and Class IB were 0.51% and 0.76%, respectively. Actual expenses may be higher or lower. Please see the accompanying Financial Highlights for expense ratios for the year ended December 31, 2018.
The chart and table do not reflect the deductions of taxes, sales charges or other fees which may be applied at the variable contract level or by a qualified pension or retirement plan. Any such additional sales charges or other fees or expenses would lower the contract’s or plan’s performance.
The Fund is closed to certain qualified pension and retirement plans. For more information, please see the Fund’s statutory prospectus.
|
| Hartford Total Return Bond HLS Fund |
Fund Overview – (continued)
December 31, 2018 (Unaudited)
Portfolio Managers
Joseph F. Marvan, CFA
Senior Managing Director and Fixed Income Portfolio Manager
Wellington Management Company LLP
Campe Goodman, CFA
Senior Managing Director and Fixed Income Portfolio Manager
Wellington Management Company LLP
Robert D. Burn, CFA
Managing Director and Fixed Income Portfolio Manager
Wellington Management Company LLP
Manager Discussion
How did the Fund perform during the period?
The Class IA shares of Hartford Total Return Bond HLS Fund returned-0.81% for the twelve-month period ended December 31, 2018, underperforming the Fund’s benchmark, the Bloomberg Barclays U.S. Aggregate Bond Index, which returned 0.01% for the same period. For the same period, Class IA shares of the Fund also underperformed the-0.53% average return of the Lipper Core Bond Funds peer group, a group of funds with investment strategies similar to those of the Fund.
Why did the Fund perform this way?
Over the period, global fixed income markets generated negative total returns, driven by higher United States (U.S.) and select emerging markets government bond yields and corporate spread widening. Geopolitical uncertainty remained elevated despite some seemingly positive developments, including the U.S. and China temporary trade truce, survived confidence vote by United Kingdom (U.K.) Prime Minister May, and compromised budget plan between Italy and the European Union (EU).
Global monetary policy continued along a less accommodative path during the period. The U.S. Federal Reserve (Fed) increased rates four times and projected additional increases, but set expectations that the pace of tightening may slow. The European Central Bank (ECB) concluded its asset purchase program but announced it would continue reinvestments for an extended period after the first rate increase, slated for the second half of 2019. The Bank of England increased rates once, but later kept them on hold as the U.K. continued to negotiate terms of its exit from the EU (“Brexit”). The Riksbank (Sweden) embarked on a tightening cycle for the first time since 2011, however policy rates still remain below zero. The Bank of Japan amended its yield curve targeting policy to allow longer-term bond yields to fluctuate more freely around its 0% target.
Early in the period, sovereign debt yields generally moved higher, driven by continued global growth momentum and rising inflation expectations. However, late in the year, sovereign debt yields declined across most markets amid a spike in equity market volatility and increasing concerns about slowing global growth. The prospect of fewer Fed rate increases in 2019 amid a deteriorating global economic outlook contributed to a decline in U.S. yields late in the period but they still finished higher for the year. Brexit worries and weakening European growth indicators contributed to lower core European sovereign debt yields while U.K. yields rose. Italian
bond yields rose sharply on debt sustainability concerns but declined after the government announced a budget agreement that will allow the country to dodge a painful EU sanctions process.
Over the period, the Japanese yen (JPY) and U.S. dollar (USD) rallied relative to most other currencies. The JPY was the top performer among major currencies as elevated U.S.-China trade uncertainty and global equity market weakness led to safe-haven flows. Sharp currency declines in Turkey and Argentina over the summer sparked emerging markets (EM) contagion fears before policymakers intervened with various stabilization measures. The Chinese renminbi declined as the People’s Bank of China eased monetary policy as part of a moderate step back on the policy-driven deleveraging campaign, especially given the increased downside growth risks due to the prospect of deeper tensions in the U.S.-China bilateral relationship.
The agency mortgage-backed securities (MBS) market returned 0.99% as measured by the Barclays MBS Fixed Rate Index, while underperforming duration equivalent Treasuries by 0.66% (as measured by Wellington Management Company LLP). Bouts of heightened market volatility across global financial markets – particularly in the first and fourth quarters of 2018 – drove credit spreads wider, dragging agency MBS spreads along with them. Still, Agency MBS fared much better than investment-grade corporates in thisflight-to-quality environment. Higher coupon conventionals (Fannie Mae (FNMA), Freddie Mac (FHLMC)) lagged the most, especially toward the end of the year when the rally in interest rates sparked prepayment concerns. However, higher coupon Ginnie Mae MBS (GNMA) suffered less, aided by slowing prepayment expectations due to GNMA’s efforts to reign in the aggressive refinancing of mortgage loans guaranteed by the Department of Veterans Affairs. Given their shorter spread durations in a weak environment,15-year MBS outperformed their30-year counterparts.
High-yield markets were adversely impacted by both increasing interest rates and widening credit spreads during the year amid a backdrop of ongoing geopolitical uncertainty in Europe and elevated tensions between the U.S. and its trading partners, namely China. High yield held up well during the first three quarters of 2018, but spreads widened sharply during the fourth quarter amid a spike in equity market volatility, lack of progress on key political issues in Europe, and a sharp selloff in energy prices.
The Bloomberg Barclays U.S. Corporate High Yield Index returned-2.08% for the twelve months ended December 31, 2018 and
|
| Hartford Total Return Bond HLS Fund |
Fund Overview – (continued)
December 31, 2018 (Unaudited)
outperformed duration-equivalent Treasuries by-3.58%. The Option-Adjusted Spread (OAS) of the High Yield index was 5.26% on December 31, 2018, wider than twelve months ago (3.43%).
Similar to high yield, bank loans struggled during the fourth quarter, but still managed to generate positive returns for the year. The Credit Suisse Leveraged Loan index returned 1.14% for 2018. Demand for bank loans weakened as a result of expectations for a slower pace of Fed rate increases in 2019. Bank loans had benefited from rate increases due to their floating rate nature.
The primary driver of the Fund’s underperformance versus the Bloomberg Barclays U.S. Aggregate Bond Index was the Fund’s duration positioning, particularly during the fourth quarter; the Fund was primarily positioned for short duration, which overall had a negative impact on performance as rates fell amid a globalflight-to-quality. The Fund’s allocation to commercial mortgage-backed securities (CMBS),non-agency Mortgage-Backed Securities (MBS), and positioning within agency MBS had a positive impact on relative returns. An allocation to collateralized loan obligations (CLOs) had a modest positive contribution to performance relative to Bloomberg Barclays U.S. Aggregate Bond Index.
Investment grade (IG) credit positioning, particularly security selection within the Industrials sector, also generated positive returns relative to Bloomberg Barclays U.S. Aggregate Bond Index. The Fund maintained exposure to Treasury Inflation-Protected Securities (TIPS) which detracted from performance relative to Bloomberg Barclays U.S. Aggregate Bond Index during the period as TIPS underperformed duration-equivalent nominal U.S. Treasuries.
The Fund held an underweight to IG credit in favor of bank loans and high yield credit. Allocations to high yield credit and bank loans had a negative impact on results, as those higher-yielding sectors underperformed investment grade credit in the fourth quarter, reversing the outperformance from earlier in the period.
During the period, the Fund used Treasury futures, swaps, and options to manage duration and yield curve positioning. The Fund also used currency forwards, futures, and options to implementnon-U.S. rate and currency positions. The Fund’s currency hedges had an overall positive effect on performance, offsetting the negative effect fromnon-USD currency exposure in the underlying positions being hedged. The use of interest rate derivatives had an overall negative effect on performance. Credit Default Swaps (CDS) were used to manage credit exposure and Investment Grade and High Yield CDS index positions were used to seek liquidity and to manage overall portfolio risk, and these instruments overall had a positive contribution to performance. The High Yield hedges were additive to relative performance while the Investment Grade CDS positions also had a small positive impact on relative performance.
What is the outlook as of the end of the period?
As of the end of the period, we continued to position the Fund with a moderatelypro-cyclical risk posture in credit markets, based on what we considered to be positive U.S. economic fundamentals. Inflation expectations declined meaningfully towards the end of the period based on TIPS breakevens (a market-based measure of expected inflation). The Fund’s inflation breakeven positioning is near neutral, but we would consider adding to the position if the interest rate environment stabilizes. The Fund ended the period with an underweight positioning in investment grade credit. The Fund held an overweight to agency MBS and maintained
anout-of-benchmark allocation to selectnon-agency residential MBS. The Fund also held CMBS and CLOs as of the end of the period based on what we consider to be attractive valuations. Within corporate credit we continued to favor bank loans. The Fund also held high yield and contingent convertibles (CoCos) of large European banks, as well as select exposure to EM debt where valuations appear to be attractive.
Important Risks
Investing involves risk, including the possible loss of principal. There is no guarantee the Fund will achieve its stated objective. The Fund may allocate a portion of its assets to specialist portfolio managers, which may not work as intended. Security prices fluctuate in value depending on general market and economic conditions and the prospects of individual companies.• Fixed income security risks include credit, liquidity, call, duration, and interest-rate risk. As interest rates rise, bond prices generally fall.• Investments in high-yield (“junk”) bonds involve greater risk of price volatility, illiquidity, and default than higher-rated debt securities.• Obligations of U.S. Government agencies are supported by varying degrees of credit but are generally not backed by the full faith and credit of the U.S. Government.• The risks associated with mortgage related- and asset-backed securities as well as collateralized loan obligations (CLOs) include credit, interest-rate, prepayment, liquidity, default and extension risk.• The purchase of securities in the To-Be-Announced (TBA) market can result in additional price and counterparty risk.• Derivatives are generally more volatile and sensitive to changes in market or economic conditions than other securities; their risks include currency, leverage, liquidity, index, pricing, and counterparty risk.• Foreign investments may be more volatile and less liquid than U.S. investments and are subject to the risk of currency fluctuations and adverse political and economic developments. These risks may be greater for investments in emerging markets.• Privately placed, restricted (Rule 144A) securities may be more difficult to sell and price than other securities.
Composition by Security Type(1)
as of December 31, 2018
| | | | |
| Category | | Percentage of
Net Assets | |
Equity Securities | | | | |
Common Stocks | | | 0.0 | %* |
Escrows | | | 0.0 | * |
Preferred Stocks | | | 0.1 | |
Warrants | | | 0.0 | * |
| | | | |
Total | | | 0.1 | % |
| | | | |
Fixed Income Securities | | | | |
Asset & Commercial Mortgage Backed Securities | | | 34.9 | % |
Corporate Bonds | | | 28.6 | |
Foreign Government Obligations | | | 1.0 | |
Municipal Bonds | | | 0.9 | |
Senior Floating Rate Interests | | | 2.3 | |
U.S. Government Agencies | | | 59.8 | |
U.S. Government Securities | | | 8.4 | |
| | | | |
Total | | | 135.9 | % |
| | | | |
Short-Term Investments | | | 0.7 | |
Purchased Options | | | 0.3 | |
Other Assets & Liabilities | | | (37.0 | ) |
| | | | |
Total | | | 100.0 | % |
| | | | |
| * | Percentage rounds to zero. |
| (1) | For Fund compliance purposes, the Fund may not use the same classification system. These classifications are used for financial reporting purposes. |
|
| Hartford Ultrashort Bond HLS Fund |
Fund Overview
December 31, 2018 (Unaudited)
| | |
Inception 8/31/1977 Sub-advised by Wellington Management Company LLP | | Investment objective – The Fund seeks total return and income consistent with preserving capital and maintaining liquidity. |
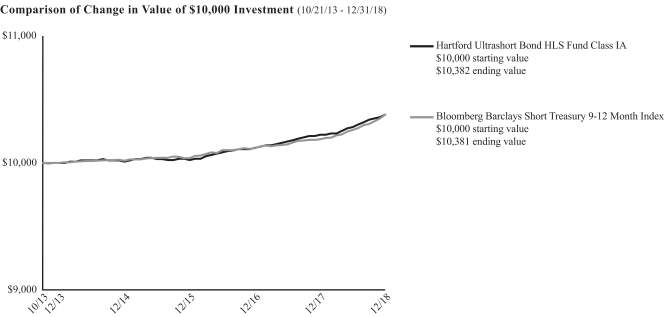
The chart above represents the hypothetical growth of a $10,000 investment in Class IA. Growth results in classes other than Class IA will vary from what is seen above due to differences in the expenses charged to those share classes.
Average Annual Total Returns
for the Periods Ending 12/31/18
| | | | | | | | | | | | |
| | | 1 Year | | | 5 Years | | | Since
Inception1 | |
Class IA | | | 1.57% | | | | 0.75% | | | | 0.72% | |
Class IB | | | 1.27% | | | | 0.50% | | | | 0.47% | |
Bloomberg Barclays Short Treasury9-12 Month Index | | | 1.91% | | | | 0.75% | | | | 0.72% | |
| 1 | On October 21, 2013, the Fund converted from a money market fund to an ultrashort bond fund. Total returns shown are from conversion date (October 21, 2013) to December 31, 2018. |
PERFORMANCE DATA QUOTED REPRESENTS PAST PERFORMANCE AND DOES NOT GUARANTEE FUTURE RESULTS. The investment return and principal value of the investment will fluctuate so that investors’ shares, when redeemed, may be worth more or less than their original cost. Current performance may be lower or higher than the performance data quoted. To obtain performance data current to the most recent month-end, please visit our website www.hartfordfunds.com.
Total returns presented above were calculated using the Fund’s net asset value available to shareholders for sale or redemption of Fund shares on December 31, 2018, which may exclude investment transactions as of this date. All share class returns assume the reinvestment of all distributions at net asset value and the deduction of all fund expenses.
Prior to October 21, 2013, the Fund was managed as a money market fund. Accordingly, performance of the Fund prior to October 21, 2013 is not shown. Past performance information for when the Fund was managed as a money market fund is available upon request by calling 1-888-843-7824.
Bloomberg Barclays Short Treasury 9-12 Month Index (reflects no deduction for fees, expenses or taxes) includes aged U.S. Treasury bills, notes and bonds with a remaining maturity from 1 up to (but not including) 12 months. It excludes zero coupon strips.
You cannot invest directly in an index.
Performance information may reflect historical waivers/reimbursements without which performance would have been lower. For information on current expense waivers/reimbursements, please see the prospectus.
As shown in the Fund’s current prospectus, the total annual fund operating expense ratios for Class IA and Class IB were 0.45% and 0.70%, respectively. Actual expenses may be higher or lower. Please see the accompanying Financial Highlights for expense ratios for the year ended December 31, 2018.
The chart and table do not reflect the deductions of taxes, sales charges or other fees which may be applied at the variable contract level or by a qualified pension or retirement plan. Any such additional sales charges or other fees or expenses would lower the contract’s or plan’s performance.
The Fund is closed to certain qualified pension and retirement plans. For more information, please see the Fund’s statutory prospectus.
|
| Hartford Ultrashort Bond HLS Fund |
Fund Overview – (continued)
December 31, 2018 (Unaudited)
Portfolio Managers
Timothy E. Smith
Senior Managing Director and Fixed Income Portfolio Manager
Wellington Management Company LLP
Manager Discussion
How did the Fund perform during the period?
The Class IA shares of Hartford Ultrashort Bond HLS Fund returned 1.57% for the twelve-month period ended December 31, 2018, underperforming the Fund’s benchmark, the Bloomberg Barclays Short Treasury9-12 Month Index, which returned 1.91% for the same period. During the same period, the Class IA shares of the Fund outperformed the 0.52% average return of the Lipper Short Investment Grade Debt Funds peer group, a group of funds that invest primarily in investment grade issues with dollar-weighted average maturities of one to five years.
Why did the Fund perform this way?
U.S. fixed income markets largely generated negative total returns during the year, driven by corporate spread widening and higher yields as measured by the Bloomberg Barclays Global Aggregate Index. Geopolitical uncertainty remained elevated despite some seemingly positive developments, including a temporary U.S. and China trade truce, survived confidence vote by U.K. Prime Minister May, and compromised budget plan between Italy and the European Union (EU).
Global monetary policy continued along a less accommodative path during the period ended December 31, 2018. The Federal Reserve (Fed) increased rates four times and projected additional increases, but set expectations that the pace of tightening may slow. The European Central Bank (ECB) concluded its asset purchase program but announced it would continue reinvestments for an extended period after the first rate increase, slated for the second half of 2019.
Early in the period, U.S. yields generally moved higher, driven by continued global growth momentum and rising inflation expectations. However, late in the year, yields declined amid a spike in equity market volatility and increasing concerns about slowing global growth. The prospect of fewer Fed rate increases in 2019 amid a deteriorating global economic outlook contributed to a decline in U.S. yields late in the period but they still finished higher for the year. The yield curve flattened substantially during the year as Fed rate increases propelledfront-end rates higher.
Absolute returns were positive for most securitized sectors but negative for corporate sectors during the year. On an excess return basis (returns over U.S. Treasuries), most major credit risk sectors posted negative returns over the period, with greater underperformance across lower-rated sectors.
Front-end markets (i.e. credit with shorter-dated maturities) largely generated positive total returns, aided by coupon income and more modest spread widening compared to their longer-dated peers.
The Fund underperformed the Bloomberg Barclays Short Treasury9-12 Month Index, primarily due to an out of benchmark allocation to investment grade corporate credit in the Financials sector. Conversely,
the Fund’s shorter duration versus the Bloomberg Barclays Short Treasury9-12 Month Index and its yield curve positioning contributed positively to relative performance.
Derivatives were not used in a significant manner in the Fund during the period and did not have a material impact on performance during the period.
What is the outlook as of the end of the period?
At the end of the period, the Fund was positioned with a moderatelypro-cyclical risk posture, favoring the credit and securitized sectors. We expect U.S. economic growth to decelerate in 2019, but the risk of recession is low in our view. We believe that growth will be underpinned by the consumer, the labor market, and fiscal policy – the strongest parts of the economy. We believe U.S. inflation may trend higher. Global central bank policy normalization and trade tensions could continue to be a source of market volatility.
We expect the Fed to be increasingly data dependent. The Fed’s median forecast at their December meeting was for two rate increases in 2019 and one in 2020; however, recent Federal Open Market Committee (FOMC) rhetoric indicates the pace of tightening could slow. It appears that tightening financial conditions and signs of spillover to the real economy have caught the Fed’s attention. As a result, we believe the Fed is effectively on hold. The bond market now appears to be pricing in a small probability of a rate cut over the next twelve months, though we believe this is less likely. As a result, the portfolio is positioned with a short duration bias.
As of the end of the period, the Fund continued to be positioned without-of-benchmark allocations to investment grade corporates, asset-backed securities (ABS), and mortgage-backed securities. Within investment grade corporates, we favor U.S. banks, as balance sheets are less risky on improved capital ratios and regulation in our view. Within ABS, we favor auto, credit card and equipment deals. As of the end of the period, the Fund also continued to hold government agency debt because we believe it is attractively valued relative to U.S. Treasuries.
Important Risks
Investing involves risk, including the possible loss of principal. There is no guarantee the Fund will achieve its stated objective. Security prices fluctuate in value depending on general market and economic conditions and the prospects of individual companies.• Fixed income security risks include credit, liquidity, call, duration, and interest-rate risk. As interest rates rise, bond prices generally fall.• Obligations of U.S. Government agencies are supported by varying degrees of credit but are generally not backed by the full faith and credit of the U.S. Government.• The risks associated with mortgage related- and asset-backed securities include credit, interest-rate, prepayment, liquidity, default and extension risk.• Derivatives are generally more volatile and sensitive to changes in market or economic conditions than other securities; their risks include currency, leverage, liquidity, index, pricing, and counterparty risk.
|
| Hartford Ultrashort Bond HLS Fund |
Fund Overview – (continued)
December 31, 2018 (Unaudited)
• Privately placed, restricted (Rule 144A) securities may be more difficult to sell and price than other securities.• Repurchase agreements may increase the Fund’s risk and volatility.
Composition by Security Type(1)
as of December 31, 2018
| | | | |
| Category | | Percentage of
Net Assets | |
Fixed Income Securities | | | | |
Asset & Commercial Mortgage Backed Securities | | | 31.6 | % |
Corporate Bonds | | | 38.5 | |
Municipal Bonds | | | 0.3 | |
U.S. Government Agencies | | | 4.6 | |
U.S. Government Securities | | | 18.9 | |
| | | | |
Total | | | 93.9 | % |
| | | | |
Short-Term Investments | | | 7.4 | |
Other Assets & Liabilities | | | (1.3 | ) |
| | | | |
Total | | | 100.0 | % |
| | | | |
| (1) | For Fund compliance purposes, the Fund may not use the same classification system. These classifications are used for financial reporting purposes. |
|
| Hartford U.S. Government Securities HLS Fund |
Fund Overview
December 31, 2018 (Unaudited)
| | |
Inception 3/24/1987 Sub-advised by Wellington Management Company LLP | | Investment objective – The Fund seeks to maximize total return while providing shareholders with a high level of current income consistent with prudent investment risk. |
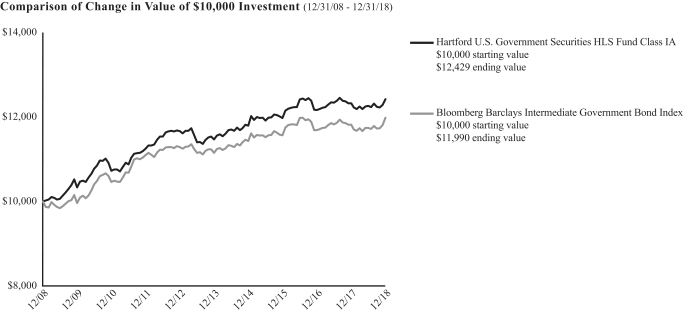
The chart above represents the hypothetical growth of a $10,000 investment in Class IA. Growth results in classes other than Class IA will vary from what is seen above due to differences in the expenses charged to those share classes.
Average Annual Total Returns
for the Periods Ending 12/31/18
| | | | | | | | | | | | |
| | | 1 Year | | | 5 Years | | | 10 Years | |
Class IA | | | 0.85% | | | | 1.61% | | | | 2.20% | |
Class IB | | | 0.55% | | | | 1.37% | | | | 1.94% | |
Bloomberg Barclays Intermediate Government Bond Index | | | 1.43% | | | | 1.46% | | | | 1.83% | |
PERFORMANCE DATA QUOTED REPRESENTS PAST PERFORMANCE AND DOES NOT GUARANTEE FUTURE RESULTS. The investment return and principal value of the investment will fluctuate so that investors’ shares, when redeemed, may be worth more or less than their original cost. Current performance may be lower or higher than the performance data quoted. To obtain performance data current to the most recent month-end, please visit our website www.hartfordfunds.com.
Total returns presented above were calculated using the Fund’s net asset value available to shareholders for sale or redemption of Fund shares on December 31, 2018, which may exclude investment transactions as of this date. All share class returns assume the reinvestment of all distributions at net asset value and the deduction of all fund expenses.
Performance information through March 5, 2012 represents performance of the Fund’s previous sub-adviser, Hartford Investment Management Company (“HIMCO”). As of March 5, 2012, HIMCO no longer served as the sub-adviser to the Fund.
Bloomberg Barclays Intermediate Government Bond Index(reflects no deduction for fees, expenses or taxes) is an unmanaged index of government bonds with maturities of between one and ten years.
You cannot invest directly in an index.
Performance information may reflect historical waivers/reimbursements without which performance would have been lower. For information on current expense waivers/reimbursements, please see the prospectus.
As shown in the Fund’s current prospectus, the total annual fund operating expense ratios for Class IA and Class IB were 0.51% and 0.76%, respectively. Actual expenses may be higher or lower. Please see the accompanying Financial Highlights for expense ratios for the year ended December 31, 2018.
The chart and table do not reflect the deductions of taxes, sales charges or other fees which may be applied at the variable contract level or by a qualified pension or retirement plan. Any such additional sales charges or other fees or expenses would lower the contract’s or plan’s performance.
The Fund is closed to certain qualified pension and retirement plans. For more information, please see the Fund’s statutory prospectus.
|
| Hartford U.S. Government Securities HLS Fund |
Fund Overview – (continued)
December 31, 2018 (Unaudited)
Portfolio Managers
Michael F. Garrett
Senior Managing Director and Fixed Income Portfolio Manager
Wellington Management Company LLP.
Brian Conroy, CFA
Managing Director and Fixed Income Portfolio Manager
Wellington Management Company LLP.
Manager Discussion
How did the Fund perform during the period?
The Class IA shares of Hartford U.S. Government Securities HLS Fund returned 0.85% for the twelve-month period ended December 31, 2018, underperforming the Fund’s benchmark, the Bloomberg Barclays Intermediate Government Bond Index, which returned 1.43% for the same period. During the same period, Class IA shares of the Fund outperformed the 0.73% average return of the Lipper Intermediate U.S. Government Funds peer group, a group of funds that invest primarily in U.S. government and agency issues.
Why did the Fund perform this way?
U.S. fixed income markets largely generated negative total returns during the period, driven by corporate spread widening and higher yields as measured by the Bloomberg Barclays Global Aggregate Index. Geopolitical uncertainty remained elevated despite some seemingly positive developments, including U.S. and China temporary trade truce, survived confidence vote by United Kingdom (UK) Prime Minister May, and compromised budget plan between Italy and the European Union (EU).
Global monetary policy continued along a less accommodative path during the period. The U.S. Federal Reserve (Fed) increased rates four times and projected additional increases, but set expectations that the pace of tightening may slow. The European Central Bank (ECB) concluded its asset purchase program but announced it would continue reinvestments for an extended period after the first rate increase, slated for the second half of 2019.
Early in the period, U.S. yields generally moved higher, driven by continued global growth momentum and rising inflation expectations. However, late in the year, yields declined amid a spike in equity market volatility and increasing concerns about slowing global growth. The prospect of fewer Fed rate increases in 2019 amid a deteriorating global economic outlook contributed to a decline in U.S. yields late in the period but they still finished higher for the year.
Absolute returns were positive for most securitized sectors but negative for corporate sectors during the year. On an excess return basis, relative to duration-equivalent Treasuries, most major credit risk sectors posted negative returns over the period, with greater underperformance across lower-rated sectors.
The agency Mortgage-Backed Securities (MBS) market returned 0.99% as measured by the Barclays MBS Fixed Rate Index, while underperforming duration equivalent Treasuries by 0.66% (as measured by Wellington Management Company LLP). Bouts of heightened market
volatility across global financial markets – particularly in the first and fourth quarters of 2018 – drove credit spreads wider, dragging agency MBS spreads along with them. Still, Agency MBS fared much better than investment-grade corporates in this flight to quality environment. Higher coupon conventionals (Fannie Mae (FNMA), Freddie Mac (FHLMC)) lagged the most, especially toward the end of the year when the rally in interest rates sparked prepayment concerns. However, higher coupon Ginnie Mae (GNMA) MBS suffered less, aided by slowing prepayment expectations due to GNMA’s efforts to reign in the aggressive refinancing of mortgage loans guaranteed by the Department of Veterans Affairs. Given their shorter spread durations in a weak environment, 15-year MBS outperformed their 30-year counterparts.
Out-of-benchmark allocations to U.S. Treasury Inflation-Protected Securities (TIPS) and agency MBS) pass-throughs were the primary drivers of underperformance relative to the Bloomberg Barclays U.S. Intermediate Government Bond Index over the period. This was partially offset by positive effects from out-of-benchmark allocations to multi-family Fannie Mae Delegated Underwriting and Servicing Bonds (FNMA DUS), Collateralized Mortgage Obligations (CMOs) and asset-backed securities (ABS). An allocation to non-agency residential mortgage-backed securities (RMBS) also contributed modestly, while an allocation to commercial mortgage-backed securities (CMBS) had a neutral impact. During the period, we used Treasury futures and interest rate swaps to manage the Fund’s duration and yield curve exposures; overall, these components had a positive impact on absolute performance over the period.
What is the outlook as of the end of the period?
As of the end of the period, the Fund was overweight agency MBS relative to the Fund’s benchmark. We have a bias toward assets that generate income and provide more stable cash flows in our view, such as FNMA DUS, agency CMOs and high quality securitized credit such as CMBS, non-agency RMBS, and ABS.
Valuations in MBS are fair to slightly cheap in our view. We believe mortgages have become more attractive as spreads relative to Treasuries are well off their narrowest point in 2017.
From a technical perspective, the Fed’s balance sheet normalization process is expected to bring predictable, extra supply to the market. Given the out of the money status of the majority of the MBS market, paydowns may remain below the monthly $20 billion cap. We believe agency MBS spreads are likely to be supported by growth in the Federal budget deficit as the supply of Treasuries is set to rise relative to agency MBS. Additionally, we believe MBS may continue to benefit from lower leverage in the system and a more stable buyer-base of long-term investors who do not hedge.
|
| Hartford U.S. Government Securities HLS Fund |
Fund Overview – (continued)
December 31, 2018 (Unaudited)
We have a constructive outlook on most non-agency RMBS, given the healthy U.S. housing market and positive technical tailwinds. We believe valuations have cheapened amid the broader macro volatility, though decelerating U.S. growth in 2019 could affect spreads. Securitizations in non-traditional sectors, such as re-securitizations and non-qualified mortgages, are attractive opportunities in our view.
Our longer-term CMBS outlook is constructive due to favorable commercial Real Estate and economic fundamentals. We believe areas of structural weakness exist, such as retail and oil-patch regions, requiring judicious credit analysis and security selection. We favor FHLMC multi-family and single-asset single-borrower deals, as well as interest-only tranches from conduit deals.
We are constructive on the ABS sector based on what we consider to be the strength of the U.S. consumer, but we are being selective as the credit cycle matures. Lenders are passing on higher borrowing costs to consumers, which could slow activity; however, positive fundamentals (low unemployment, increasing wages, benign inflation) may be supportive of collateral performance. We maintained the Fund’s allocations to the traditional ABS sectors given our favorable view of the U.S. consumer. We believe there are also attractive opportunities in niche subsectors, including unsecured consumer loans, fleet lease deals, and other select esoteric debt sectors.
Important Risks
Investing involves risk, including the possible loss of principal. There is no guarantee the Fund will achieve its stated objective. Security prices fluctuate in value depending on general market and economic conditions and the prospects of individual companies.• Fixed income security risks include credit, liquidity, call, duration, and interest-rate risk. As interest rates rise, bond prices generally fall.• The purchase of securities in the To-Be-Announced (TBA) market can result in additional price and counterparty risk.• Derivatives are generally more volatile and sensitive to changes in market or economic conditions than other securities; their risks include currency, leverage, liquidity, index, pricing, and counterparty risk.• The risks associated with mortgage related- and asset-backed securities include credit, interest-rate, prepayment, liquidity, default and extension risk• Obligations of U.S. Government agencies are supported by varying degrees of credit but are generally not backed by the full faith and credit of the U.S. Government.• Privately placed, restricted (Rule 144A) securities may be more difficult to sell and price than other securities.
Composition by Security Type(1)
as of December 31, 2018
| | | | |
| Category | | Percentage of
Net Assets | |
Fixed Income Securities | | | | |
Asset & Commercial Mortgage Backed Securities | | | 15.2 | % |
U.S. Government Agencies | | | 64.1 | |
U.S. Government Securities | | | 22.7 | |
| | | | |
Total | | | 102.0 | % |
| | | | |
Short-Term Investments | | | 3.0 | |
Other Assets & Liabilities | | | (5.0 | ) |
| | | | |
Total | | | 100.0 | % |
| | | | |
| (1) | For Fund compliance purposes, the Fund may not use the same classification system. These classifications are used for financial reporting purposes. |
Fund Overview
December 31, 2018 (Unaudited)
| | |
Inception 4/30/2001 Sub-advised by Wellington Management Company LLP | | Investment objective – The Fund seeks long-term total return. |
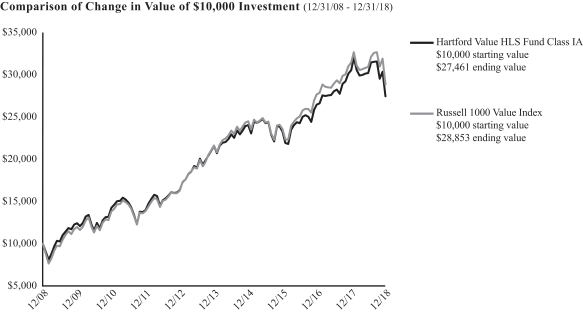
The chart above represents the hypothetical growth of a $10,000 investment in Class IA. Growth results in classes other than Class IA will vary from what is seen above due to differences in the expenses charged to those share classes.
Average Annual Total Returns
for the Periods Ending 12/31/18
| | | | | | | | | | | | |
| | | 1 Year | | | 5 Years | | | 10 Years | |
Class IA | | | -10.18% | | | | 4.94% | | | | 10.63% | |
Class IB | | | -10.40% | | | | 4.66% | | | | 10.35% | |
Russell 1000 Value Index | | | -8.27% | | | | 5.95% | | | | 11.18% | |
PERFORMANCE DATA QUOTED REPRESENTS PAST PERFORMANCE AND DOES NOT GUARANTEE FUTURE RESULTS. The investment return and principal value of the investment will fluctuate so that investors’ shares, when redeemed, may be worth more or less than their original cost. Current performance may be lower or higher than the performance data quoted. To obtain performance data current to the most recent month-end, please visit our website www.hartfordfunds.com.
Total returns presented above were calculated using the Fund’s net asset value available to shareholders for sale or redemption of Fund shares on December 31, 2018, which may exclude investment transactions as of this date. All share class returns assume the reinvestment of all distributions at net asset value and the deduction of all fund expenses.
Russell 1000 Value Index(reflects no deduction for fees, expenses or taxes) is designed to measure the performance of those Russell 1000 Index companies with lower price-to-book ratios and lower forecasted growth values. The Russell 1000 Index is designed to measure the performance of the 1,000 largest companies in the Russell 3000 Index based on their market capitalization and current index membership.
You cannot invest directly in an index.
Performance information may reflect historical waivers/reimbursements without which performance would have been lower. For information on current expense waivers/reimbursements, please see the prospectus.
As shown in the Fund’s current prospectus, the total annual fund operating expense ratios for Class IA and Class IB were 0.71% and 0.96%, respectively. Actual expenses may be higher or lower. Please see the accompanying Financial Highlights for expense ratios for the year ended December 31, 2018.
The chart and table do not reflect the deductions of taxes, sales charges or other fees which may be applied at the variable contract level or by a qualified pension or retirement plan. Any such additional sales charges or other fees or expenses would lower the contract’s or plan’s performance.
The Fund is closed to certain qualified pension and retirement plans. For more information, please see the Fund’s statutory prospectus.
Fund Overview – (continued)
December 31, 2018 (Unaudited)
Portfolio Managers
Adam H. Illfelder, CFA
Managing Director and Equity Portfolio Manager
Wellington Management Company LLP
W. Michael Reckmeyer, III, CFA
Senior Managing Director and Equity Portfolio Manager
Wellington Management Company LLP
Manager Discussion
How did the Fund perform during the period?
The Class IA shares of Hartford Value HLS Fund returned-10.18% for the twelve-month period ended December 31, 2018, underperforming the Fund’s benchmark, the Russell 1000 Value Index, which returned-8.27% for the same period. For the same period, Class IA shares of the Fund underperformed the-8.19% average return of the Lipper Large Cap Value Funds peer group, a group of funds with investment strategies similar to those of the Fund.
Why did the Fund perform this way?
U.S. equities, as measured by the S&P 500 Index, posted negative results over the trailing twelve-month period ending December 31, 2018. The Federal Reserve (Fed) raised its benchmark interest rate by 0.25% four times during the twelve-month period, in line with expectations, although they signaled a more dovish path heading into 2019. (“Dovish” describes a monetary policy that favors lower interest rates to encourage economic growth.) Bullish sentiment was exceptionally strong to start the year, as better-than-expected corporate profits helped drive U.S. equities higher. Signs of inflation entered the market in February which led to heightened levels of volatility, a theme that continued for the remainder of the year. By the summer of 2018, talk of tariffs and trade wars had progressed to implementation, raising concerns in an otherwise strong economy. Nonetheless, positive sentiment persisted, fueled by robust earnings growth, fiscal stimulus, the announcement of a preliminary trade deal between the U.S. and Mexico, and expectations for stronger U.S. economic growth relative to other regions of the world. This changed in the final months of 2018, when concerns surrounding slowing global growth, rich valuations, rising central bank benchmark interest rates, and capricious U.S. and China trade tensions were at the forefront of investors’ minds. Returns in October and December were sharply negative, with the latter representing the largest U.S. equity market monthly decline seen this decade, culminating the first year of negative U.S. equity returns since 2008.
During the period, returns varied bymarket-cap, aslarge-cap equities, as measured by the S&P 500 Index, outperformed both small- andmid-cap equities, as measured by the Russell 2000 Index and S&P MidCap 400 Index, respectively. During the twelve-month period, two of the eleven sectors within the Russell 1000 Value Index rose, led by Healthcare (+8%) and Utilities (+5%). Industrials(-19%), Energy(-18%), and Materials(-17%) lagged on a relative basis.
The Fund’s underperformance versus the Russell 1000 Value Index during the period was primarily driven by weak security selection, most notably within the Consumer Staples, Financials, and Consumer
Discretionary sectors. Negative performance was partially offset by strong security selection within the Information Technology, Communication Services, and Healthcare sectors. Sector allocation, a residual of the bottom up stock selection process, was a modest contributor to relative performance mainly driven by the overweight position in the Information Technology sector and the underweight position in the Consumer Staples sector.
The Fund’s top detractors from returns relative to the Russell 1000 Value Index over the period were Invesco (Financials), Pfizer (Healthcare), and Halliburton (Energy). Shares of Invesco, a U.S.-based investment manager, struggled during the period. This was due to broad market weakness, weak fund flows, and uncertainty about the impact of their recent acquisition of Oppenheimer. Pfizer is a multinational pharmaceutical company that is not held in the portfolio. The stock remained flat due to strong earnings and its more defensive orientation during a bout of market weakness. Not owning this benchmark constituent during the period weighed on relative performance. Shares of Halliburton, a U.S.-based oilfield services company, declined in line with the Energy sector as it experienced weakness from OPEC oversupply and a related drop in the oil price. We continued to hold this stock at the end of the period. Top absolute detractors during the period included Citigroup (Financials) and Philip Morris (Consumer Staples).
The largest contributors to returns relative to the Russell 1000 Value Index were Eli Lilly (Healthcare), XL Group (Financials), and General Electric (Industrials). Shares of Eli Lilly, a U.S.-based pharmaceutical company, rose during the period on strong earnings that beat consensus expectations. The firm’s new diabetes drug, Trulicity, was approved this year and will provide a new source of incremental revenue growth for the firm. We continue to hold the Fund’s position in this stock at the end of the period. Shares of XL Group, a global insurance and reinsurance company, rose sharply after the company agreed to be acquired by France-based insurer AXA. We sold the stock once it reached our valuation target. Not owning shares of benchmark constituent General Electric, a U.S.-based global Industrials conglomerate, for most of the period contributed positively to returns relative to the Russell 1000 Value Index, as the stock struggled on a host of execution and legacy issues that ultimately saw the dividend cut and the CEO terminated. We eliminated this stock in a position of strength early in the period. Top absolute contributors during the period included Merck (Healthcare) and Eli Lilly (Healthcare).
Derivatives were not used in a significant manner in the Fund during the period and did not have a material impact on performance during the period.
Fund Overview – (continued)
December 31, 2018 (Unaudited)
What is the outlook as of the end of the period?
Economic updates remained solid during the fourth quarter, but rising uncertainty on a range of issues contributed to a deterioration in investor sentiment. Job growth remained steady through the end of the year and the unemployment rate remained below 4% as of December 31, 2018. Consumer confidence and retail sales have remained strong throughout the year, and initial reports from the holiday season have been solid. Inflation remained benign as ofyear-end, partly thanks to lower oil prices, which we believe may benefit the consumer in 2019. The Fed highlighted in December that wages have started to increase which we believe may also help the U.S. consumer, but may also serve as a source of margin pressure in several domestic industries.
Company results for the third quarter were solid. However, the market traded lower due to the potential negative implications of a trade war between the U.S. and China, additional Fed Funds rate increases, the U.K.’s exit from the E.U. (“Brexit”), and the U.S. government shut-down at the end of December.
Given the increase in economic uncertainty, we are tightly monitoring business confidence and the potential negative impact on 2019 corporate spending plans. We expect continued volatility in the near term, and we’re evaluating new opportunities in companies where stock price moves appear overdone, offering attractive valuations in multiple economic scenarios in our view.
Based on individual stock decisions, the Fund ended the period most overweight the Information Technology, Energy, and Financials sectors, and most underweight the Real Estate, Utilities, and Consumer Staples sectors, relative to the Russell 1000 Value Index.
Important Risks
Investing involves risk, including the possible loss of principal. There is no guarantee the Fund will achieve its stated objective. Security prices fluctuate in value depending on general market and economic conditions and the prospects of individual companies.• Foreign investments may be more volatile and less liquid than U.S. investments and are subject to the risk of currency fluctuations and adverse political and economic developments.• The Fund’s focus on investments in particular sectors may increase its volatility and risk of loss if adverse developments occur.• Different investment styles may go in and out of favor, which may cause the Fund to underperform the broader stock market.
Composition by Sector(1)
as of December 31, 2018
| | | | |
| Sector | | Percentage of
Net Assets | |
Equity Securities | | | | |
Communication Services | | | 6.2 | % |
Consumer Discretionary | | | 4.2 | |
Consumer Staples | | | 6.2 | |
Energy | | | 10.6 | |
Financials | | | 23.3 | |
Health Care | | | 16.3 | |
Industrials | | | 8.3 | |
Information Technology | | | 11.9 | |
Materials | | | 3.7 | |
Real Estate | | | 3.1 | |
Utilities | | | 4.7 | |
| | | | |
Total | | | 98.5 | % |
| | | | |
Short-Term Investments | | | 1.4 | |
Other Assets & Liabilities | | | 0.1 | |
| | | | |
Total | | | 100.0 | % |
| | | | |
| (1) | A sector may be comprised of several industries. For Fund compliance purposes, the Fund may not use the same classification system. These sector classifications are used for financial reporting purposes. |
Expense Examples (Unaudited)
Your Fund’s Expenses
As a shareholder of a Fund, you incur two types of costs: (1) transaction costs and (2) ongoing costs, including investment management fees, distribution and/or service (12b-1) fees, if any, and other fund expenses. This example is intended to help you understand your ongoing costs (in dollars) of investing in a Fund and to compare these costs with the ongoing costs of investing in other mutual funds. The example is based on an investment of $1,000 invested at the beginning of the period and held for the entire period of July 1, 2018 through December 31, 2018. To the extent a Fund was subject to acquired fund fees and expenses during the period, acquired fund fees and expenses are not included in the annualized expense ratios below.
Actual Expenses
The first set of columns of the table below provides information about actual account values and actual expenses. You may use this information, together with the amount you invested, to estimate the expenses that you paid over the period. Simply divide your account value by $1,000 (for example, an $8,600 account value divided by $1,000 = 8.6), then multiply the result by the number in the line under the heading entitled “Expenses Paid During The Period” to estimate the expenses you paid on your account during this period.
Hypothetical Example for Comparison Purposes
The second set of columns of the table below provides information about hypothetical account values and hypothetical expenses based on a Fund’s actual expense ratio and an assumed rate of return of 5% per year before expenses, which is not the Fund’s actual return. The hypothetical account values and expenses may not be used to estimate the actual ending account balance or expenses you paid for the period. You may use this information to compare the ongoing costs of investing in a Fund and other funds. To do so, compare this 5% hypothetical example with the 5% hypothetical examples that appear in the shareholder reports of the other funds.
Please note that the expenses shown in the table are meant to highlight your ongoing costs only and do not reflect any transactional costs, such as sales charges (loads) or fees which may be applied at the variable life insurance, variable annuity, or qualified retirement plan product level. Therefore, the second set of columns of the table is useful in comparing ongoing costs only, and will not help you determine the relative total costs of owning different funds. In addition, if these transactional costs were included, your costs would be higher. Expenses for a class of a Fund are equal to the class’ annualized expense ratio multiplied by average account value over the period, multiplied by 184/365 (to reflect the one-half year period).
| | | | | | | | | | | | | | | | | | | | | | | | | | | | |
| | | Actual Return | | | Hypothetical (5% return before expenses) | |
| | | Beginning
Account Value
July 1, 2018 | | | Ending
Account Value
December 31, 2018 | | | Expenses paid
during the period
July 1, 2018
through
December 31, 2018 | | | Beginning
Account Value
July 1, 2018 | | | Ending
Account Value
December 31, 2018 | | | Expenses paid
during the period
July 1, 2018
through
December 31, 2018 | | | Annualized
expense
ratio | |
Hartford Balanced HLS Fund | |
| | | | | | | |
Class IA | | $ | 1,000.00 | | | $ | 945.50 | | | $ | 3.09 | | | $ | 1,000.00 | | | $ | 1,022.03 | | | $ | 3.21 | | | | 0.63 | % |
Class IB | | $ | 1,000.00 | | | $ | 944.10 | | | $ | 4.31 | | | $ | 1,000.00 | | | $ | 1,020.77 | | | $ | 4.48 | | | | 0.88 | % |
|
Hartford Capital Appreciation HLS Fund | |
| | | | | | | |
Class IA | | $ | 1,000.00 | | | $ | 901.10 | | | $ | 3.21 | | | $ | 1,000.00 | | | $ | 1,021.83 | | | $ | 3.41 | | | | 0.67 | % |
Class IB | | $ | 1,000.00 | | | $ | 900.00 | | | $ | 4.41 | | | $ | 1,000.00 | | | $ | 1,020.57 | | | $ | 4.69 | | | | 0.92 | % |
Class IC | | $ | 1,000.00 | | | $ | 898.80 | | | $ | 5.60 | | | $ | 1,000.00 | | | $ | 1,019.31 | | | $ | 5.96 | | | | 1.17 | % |
|
Hartford Disciplined Equity HLS Fund | |
| | | | | | | |
Class IA | | $ | 1,000.00 | | | $ | 945.20 | | | $ | 3.78 | | | $ | 1,000.00 | | | $ | 1,021.32 | | | $ | 3.92 | | | | 0.77 | % |
Class IB | | $ | 1,000.00 | | | $ | 943.70 | | | $ | 5.00 | | | $ | 1,000.00 | | | $ | 1,020.06 | | | $ | 5.19 | | | | 1.02 | % |
|
Hartford Dividend and Growth HLS Fund | |
| | | | | | | |
Class IA | | $ | 1,000.00 | | | $ | 952.40 | | | $ | 3.35 | | | $ | 1,000.00 | | | $ | 1,021.78 | | | $ | 3.47 | | | | 0.68 | % |
Class IB | | $ | 1,000.00 | | | $ | 951.60 | | | $ | 4.57 | | | $ | 1,000.00 | | | $ | 1,020.52 | | | $ | 4.74 | | | | 0.93 | % |
|
Hartford Global Growth HLS Fund | |
| | | | | | | |
Class IA | | $ | 1,000.00 | | | $ | 891.60 | | | $ | 3.81 | | | $ | 1,000.00 | | | $ | 1,021.17 | | | $ | 4.08 | | | | 0.80 | % |
Class IB | | $ | 1,000.00 | | | $ | 890.30 | | | $ | 5.00 | | | $ | 1,000.00 | | | $ | 1,019.91 | | | $ | 5.35 | | | | 1.05 | % |
|
Hartford Growth Opportunities HLS Fund | |
| | | | | | | |
Class IA | | $ | 1,000.00 | | | $ | 876.00 | | | $ | 3.07 | | | $ | 1,000.00 | | | $ | 1,021.93 | | | $ | 3.31 | | | | 0.65 | % |
Class IB | | $ | 1,000.00 | | | $ | 874.90 | | | $ | 4.25 | | | $ | 1,000.00 | | | $ | 1,020.67 | | | $ | 4.58 | | | | 0.90 | % |
Class IC | | $ | 1,000.00 | | | $ | 873.90 | | | $ | 5.43 | | | $ | 1,000.00 | | | $ | 1,019.41 | | | $ | 5.85 | | | | 1.15 | % |
|
Hartford Healthcare HLS Fund | |
| | | | | | | |
Class IA | | $ | 1,000.00 | | | $ | 921.20 | | | $ | 4.31 | | | $ | 1,000.00 | | | $ | 1,020.72 | | | $ | 4.53 | | | | 0.89 | % |
Class IB | | $ | 1,000.00 | | | $ | 919.60 | | | $ | 5.52 | | | $ | 1,000.00 | | | $ | 1,019.46 | | | $ | 5.80 | | | | 1.14 | % |
Expense Examples (Unaudited) – (continued)
| | | | | | | | | | | | | | | | | | | | | | | | | | | | |
| | | Actual Return | | | Hypothetical (5% return before expenses) | |
| | | Beginning
Account Value
July 1, 2018 | | | Ending
Account Value
December 31, 2018 | | | Expenses paid
during the period
July 1, 2018
through
December 31, 2018 | | | Beginning
Account Value
July 1, 2018 | | | Ending
Account Value
December 31, 2018 | | | Expenses paid
during the period
July 1, 2018
through
December 31, 2018 | | | Annualized
expense
ratio | |
|
Hartford High Yield HLS Fund | |
| | | | | | | |
Class IA | | $ | 1,000.00 | | | $ | 970.30 | | | $ | 3.77 | | | $ | 1,000.00 | | | $ | 1,021.37 | | | $ | 3.87 | | | | 0.76 | % |
Class IB | | $ | 1,000.00 | | | $ | 969.40 | | | $ | 5.01 | | | $ | 1,000.00 | | | $ | 1,020.11 | | | $ | 5.14 | | | | 1.01 | % |
|
Hartford International Opportunities HLS Fund | |
| | | | | | | |
Class IA | | $ | 1,000.00 | | | $ | 842.00 | | | $ | 3.44 | | | $ | 1,000.00 | | | $ | 1,021.48 | | | $ | 3.77 | | | | 0.74 | % |
Class IB | | $ | 1,000.00 | | | $ | 840.80 | | | $ | 4.59 | | | $ | 1,000.00 | | | $ | 1,020.22 | | | $ | 5.04 | | | | 0.99 | % |
|
Hartford MidCap HLS Fund | |
| | | | | | | |
Class IA | | $ | 1,000.00 | | | $ | 860.90 | | | $ | 3.24 | | | $ | 1,000.00 | | | $ | 1,021.73 | | | $ | 3.52 | | | | 0.69 | % |
Class IB | | $ | 1,000.00 | | | $ | 860.10 | | | $ | 4.41 | | | $ | 1,000.00 | | | $ | 1,020.47 | | | $ | 4.79 | | | | 0.94 | % |
|
Hartford MidCap Growth HLS Fund | |
| | | | | | | |
Class IA | | $ | 1,000.00 | | | $ | 864.20 | | | $ | 4.28 | | | $ | 1,000.00 | | | $ | 1,020.62 | | | $ | 4.63 | | | | 0.91 | % |
Class IB | | $ | 1,000.00 | | | $ | 863.00 | | | $ | 5.45 | | | $ | 1,000.00 | | | $ | 1,019.36 | | | $ | 5.90 | | | | 1.16 | % |
|
Hartford MidCap Value HLS Fund | |
| | | | | | | |
Class IA | | $ | 1,000.00 | | | $ | 847.60 | | | $ | 3.96 | | | $ | 1,000.00 | | | $ | 1,020.92 | | | $ | 4.33 | | | | 0.85 | % |
Class IB | | $ | 1,000.00 | | | $ | 846.20 | | | $ | 5.12 | | | $ | 1,000.00 | | | $ | 1,019.66 | | | $ | 5.60 | | | | 1.10 | % |
|
Hartford Small Cap Growth HLS Fund | |
| | | | | | | |
Class IA | | $ | 1,000.00 | | | $ | 812.20 | | | $ | 2.92 | | | $ | 1,000.00 | | | $ | 1,021.98 | | | $ | 3.26 | | | | 0.64 | % |
Class IB | | $ | 1,000.00 | | | $ | 811.30 | | | $ | 4.06 | | | $ | 1,000.00 | | | $ | 1,020.72 | | | $ | 4.53 | | | | 0.89 | % |
|
Hartford Small Company HLS Fund | |
| | | | | | | |
Class IA | | $ | 1,000.00 | | | $ | 848.80 | | | $ | 3.68 | | | $ | 1,000.00 | | | $ | 1,021.22 | | | $ | 4.02 | | | | 0.79 | % |
Class IB | | $ | 1,000.00 | | | $ | 847.30 | | | $ | 4.84 | | | $ | 1,000.00 | | | $ | 1,019.96 | | | $ | 5.30 | | | | 1.04 | % |
|
Hartford Stock HLS Fund | |
| | | | | | | |
Class IA | | $ | 1,000.00 | | | $ | 979.60 | | | $ | 2.54 | | | $ | 1,000.00 | | | $ | 1,022.64 | | | $ | 2.60 | | | | 0.51 | % |
Class IB | | $ | 1,000.00 | | | $ | 978.50 | | | $ | 3.79 | | | $ | 1,000.00 | | | $ | 1,021.37 | | | $ | 3.87 | | | | 0.76 | % |
|
Hartford Total Return Bond HLS Fund | |
| | | | | | | |
Class IA | | $ | 1,000.00 | | | $ | 1,007.10 | | | $ | 2.58 | | | $ | 1,000.00 | | | $ | 1,022.64 | | | $ | 2.60 | | | | 0.51 | % |
Class IB | | $ | 1,000.00 | | | $ | 1,006.10 | | | $ | 3.84 | | | $ | 1,000.00 | | | $ | 1,021.37 | | | $ | 3.87 | | | | 0.76 | % |
|
Hartford Ultrashort Bond HLS Fund | |
| | | | | | | |
Class IA | | $ | 1,000.00 | | | $ | 1,009.60 | | | $ | 2.23 | | | $ | 1,000.00 | | | $ | 1,022.99 | | | $ | 2.24 | | | | 0.44 | % |
Class IB | | $ | 1,000.00 | | | $ | 1,007.70 | | | $ | 3.49 | | | $ | 1,000.00 | | | $ | 1,021.73 | | | $ | 3.52 | | | | 0.69 | % |
|
Hartford U.S. Government Securities HLS Fund | |
| | | | | | | |
Class IA | | $ | 1,000.00 | | | $ | 1,013.40 | | | $ | 2.69 | | | $ | 1,000.00 | | | $ | 1,022.53 | | | $ | 2.70 | | | | 0.53 | % |
Class IB | | $ | 1,000.00 | | | $ | 1,012.40 | | | $ | 3.96 | | | $ | 1,000.00 | | | $ | 1,021.27 | | | $ | 3.97 | | | | 0.78 | % |
|
Hartford Value HLS Fund | |
| | | | | | | |
Class IA | | $ | 1,000.00 | | | $ | 909.00 | | | $ | 3.42 | | | $ | 1,000.00 | | | $ | 1,021.63 | | | $ | 3.62 | | | | 0.71 | % |
Class IB | | $ | 1,000.00 | | | $ | 907.30 | | | $ | 4.62 | | | $ | 1,000.00 | | | $ | 1,020.37 | | | $ | 4.89 | | | | 0.96 | % |
|
| Hartford Balanced HLS Fund |
Schedule of Investments
December 31, 2018
| | | | | | | | | | |
| Shares or Principal Amount | | Market Value† | |
| COMMON STOCKS - 65.1% | | | |
| | | | | | Banks - 6.2% | |
| | | 1,094,340 | | | Bank of America Corp. | | $ | 26,964,538 | |
| | | 443,280 | | | Citigroup, Inc. | | | 23,077,157 | |
| | | 349,610 | | | JP Morgan Chase & Co. | | | 34,128,928 | |
| | | 133,650 | | | PNC Financial Services Group, Inc. | | | 15,625,021 | |
| | | 443,120 | | | Wells Fargo & Co. | | | 20,418,970 | |
| | | | | | | | | | |
| | | | | | 120,214,614 | |
| | | | | | | | | | |
| | | | | | Capital Goods - 4.9% | |
| | | 149,520 | | | Caterpillar, Inc. | | | 18,999,506 | |
| | | 232,150 | | | Eaton Corp. plc | | | 15,939,419 | |
| | | 339,910 | | | Fortune Brands Home & Security, Inc. | | | 12,913,181 | |
| | | 148,290 | | | Ingersoll-Rand plc | | | 13,528,497 | |
| | | 68,510 | | | Lockheed Martin Corp. | | | 17,938,658 | |
| | | 160,670 | | | United Technologies Corp. | | | 17,108,142 | |
| | | | | | | | | | |
| | | | | | 96,427,403 | |
| | | | | | | | | | |
| | | | | | Consumer Durables & Apparel - 0.5% | |
| | | 267,050 | | | Newell Brands, Inc. | | | 4,964,459 | |
| | | 242,600 | | | Skechers USA, Inc. Class A* | | | 5,553,114 | |
| | | | | | | | | | |
| | | | | | 10,517,573 | |
| | | | | | | | | | |
| | | | | | Consumer Services - 0.8% | |
| | | 203,816 | | | Hilton Worldwide Holdings, Inc. | | | 14,633,989 | |
| | | | | | | | | | |
| | | | | | Diversified Financials - 0.5% | |
| | | 580,530 | | | Invesco Ltd. | | | 9,718,072 | |
| | | | | | | | | | |
| | | | | | Energy - 4.0% | |
| | | 101,640 | | | Concho Resources, Inc.* | | | 10,447,576 | |
| | | 150,610 | | | EOG Resources, Inc. | | | 13,134,698 | |
| | | 313,690 | | | Exxon Mobil Corp. | | | 21,390,521 | |
| | | 393,430 | | | Halliburton Co. | | | 10,457,369 | |
| | | 86,710 | | | Pioneer Natural Resources Co. | | | 11,404,099 | |
| | | 393,440 | | | Suncor Energy, Inc. | | | 11,004,517 | |
| | | | | | | | | | |
| | | | | | 77,838,780 | |
| | | | | | | | | | |
| | | | | | Food & Staples Retailing - 0.8% | |
| | | 516,760 | | | US Foods Holding Corp.* | | | 16,350,286 | |
| | | | | | | | | | |
| | | | | | Food, Beverage & Tobacco - 2.2% | |
| | | 283,186 | | | Kraft Heinz Co. | | | 12,188,325 | |
| | | 334,320 | | | Mondelez International, Inc. Class A | | | 13,382,830 | |
| | | 268,170 | | | Philip Morris International, Inc. | | | 17,903,029 | |
| | | | | | | | | | |
| | | | | | 43,474,184 | |
| | | | | | | | | | |
| | | | | | Health Care Equipment & Services - 5.5% | |
| | | 65,500 | | | Anthem, Inc. | | | 17,202,265 | |
| | | 383,270 | | | Boston Scientific Corp.* | | | 13,544,762 | |
| | | 373,230 | | | Koninklijke Philips N.V. | | | 13,085,253 | |
| | | 249,815 | | | Medtronic plc | | | 22,723,172 | |
| | | 110,260 | | | UnitedHealth Group, Inc. | | | 27,467,971 | |
| | | 107,330 | | | Universal Health Services, Inc. Class B | | | 12,510,385 | |
| | | | | | | | | | |
| | | | | | 106,533,808 | |
| | | | | | | | | | |
| | | | | | Household & Personal Products - 0.7% | |
| | | 269,680 | | | Unilever N.V. ADR | | | 14,508,784 | |
| | | | | | | | | | |
| | | | | | Insurance - 2.4% | |
| | | 412,020 | | | American International Group, Inc. | | | 16,237,708 | |
| | | 184,240 | | | Intact Financial Corp. | | | 13,386,146 | |
| | | 216,040 | | | Marsh & McLennan Cos., Inc. | | | 17,229,190 | |
| | | | | | | | | | |
| | | | | | 46,853,044 | |
| | | | | | | | | | |
| | | | | | Materials - 2.5% | |
| | | 435,700 | | | DowDuPont, Inc. | | | 23,301,236 | |
| | | 190,720 | | | FMC Corp. | | | 14,105,651 | |
| | | 299,910 | | | Sealed Air Corp. | | | 10,448,865 | |
| | | | | | | | | | |
| | | | | | 47,855,752 | |
| | | | | | | | | | |
| | | | | | | | | | |
| Shares or Principal Amount | | Market Value† | |
| COMMON STOCKS - 65.1% - (continued) | | | |
| | | | | | Media & Entertainment - 5.3% | |
| | | 58,845 | | | Alphabet, Inc. Class C* | | $ | 60,940,470 | |
| | | 924,030 | | | Comcast Corp. Class A | | | 31,463,222 | |
| | | 458,180 | | | Viacom, Inc. Class B | | | 11,775,226 | |
| | | | | | | | | | |
| | | | | | 104,178,918 | |
| | | | | | | | | | |
| | | | | | Pharmaceuticals, Biotechnology & Life Sciences - 7.1% | |
| | | 117,080 | | | Allergan plc | | | 15,648,913 | |
| | | 450,710 | | | AstraZeneca plc ADR | | | 17,117,966 | |
| | | 398,020 | | | Bristol-Myers Squibb Co. | | | 20,689,079 | |
| | | 126,130 | | | Eisai Co., Ltd. | | | 9,764,962 | |
| | | 239,520 | | | Eli Lilly & Co. | | | 27,717,254 | |
| | | 90,100 | | | Nektar Therapeutics* | | | 2,961,587 | |
| | | 188,520 | | | Novartis AG | | | 16,145,643 | |
| | | 66,825 | | | Roche Holding AG | | | 16,589,897 | |
| | | 74,070 | | | Vertex Pharmaceuticals, Inc.* | | | 12,274,140 | |
| | | | | | | | | | |
| | | | | | 138,909,441 | |
| | | | | | | | | | |
| | | | | | Real Estate - 1.0% | |
| | | 178,010 | | | Crown Castle International Corp. REIT | | | 19,337,226 | |
| | | | | | | | | | |
| | | | | | Retailing - 4.1% | |
| | | 11,702,200 | | | Allstar Co.*(1)(2)(3) | | | 2,457,462 | |
| | | 10,500 | | | Booking Holdings, Inc.* | | | 18,085,410 | |
| | | 153,060 | | | Home Depot, Inc. | | | 26,298,769 | |
| | | 691,040 | | | Qurate Retail, Inc.* | | | 13,489,101 | |
| | | 340,860 | | | TJX Cos., Inc. | | | 15,250,076 | |
| | | 67,006 | | | Tory Burch LLC*(1)(2)(3) | | | 3,731,574 | |
| | | | | | | | | | |
| | | | | | 79,312,392 | |
| | | | | | | | | | |
| | | | | | Semiconductors & Semiconductor Equipment - 5.4% | |
| | | 212,220 | | | Analog Devices, Inc. | | | 18,214,842 | |
| | | 60,010 | | | Broadcom, Inc. | | | 15,259,343 | |
| | | 495,870 | | | Intel Corp. | | | 23,271,179 | |
| | | 90,240 | | | KLA-Tencor Corp. | | | 8,075,578 | |
| | | 249,700 | | | Maxim Integrated Products, Inc. | | | 12,697,245 | |
| | | 476,470 | | | QUALCOMM, Inc. | | | 27,115,908 | |
| | | | | | | | | | |
| | | | | | 104,634,095 | |
| | | | | | | | | | |
| | | | | | Software & Services - 3.1% | |
| | | 601,450 | | | Microsoft Corp. | | | 61,089,276 | |
| | | | | | | | | | |
| | | | | | Technology Hardware & Equipment - 3.8% | |
| | | 86,640 | | | Apple, Inc. | | | 13,666,594 | |
| | | 631,790 | | | Cisco Systems, Inc. | | | 27,375,461 | |
| | | 229,160 | | | NetApp, Inc. | | | 13,673,977 | |
| | | 3,167,170 | | | Nokia Oyj | | | 18,385,789 | |
| | | | | | | | | | |
| | | | | | 73,101,821 | |
| | | | | | | | | | |
| | | | | | Telecommunication Services - 1.6% | |
| | | 548,420 | | | Verizon Communications, Inc. | | | 30,832,172 | |
| | | | | | | | | | |
| | | | | | Transportation - 1.1% | |
| | | 152,800 | | | Union Pacific Corp. | | | 21,121,544 | |
| | | | | | | | | | |
| | | | | | Utilities - 1.6% | |
| | | 179,920 | | | Dominion Energy, Inc. | | | 12,857,083 | |
| | | 104,920 | | | NextEra Energy, Inc. | | | 18,237,195 | |
| | | | | | | | | | |
| | | | | | 31,094,278 | |
| | | | | | | | | | |
| | | |
| | | | | | Total Common Stocks
(cost $1,074,465,760) | | $ | 1,268,537,452 | |
| | | | | | | | | | |
|
| ASSET & COMMERCIAL MORTGAGE BACKED SECURITIES - 3.7% | |
| | | | | | Asset-Backed - Automobile - 0.4% | |
| $ | | | 206,607 | | | ARI Fleet Lease Trust 1.91%, 04/15/2026 | | $ | 205,115 | |
| | | 655,000 | | | Canadian Pacer Auto Receivables Trust 2.05%, 03/19/2021 | | | 650,382 | |
| | | | | | Chesapeake Funding LLC | |
| | | 925,019 | | | 1.91%, 08/15/2029 | | | 913,090 | |
The accompanying notes are an integral part of these financial statements.
|
| Hartford Balanced HLS Fund |
Schedule of Investments – (continued)
December 31, 2018
| | | | | | | | | | |
| Shares or Principal Amount | | Market Value† | |
|
| ASSET & COMMERCIAL MORTGAGE BACKED SECURITIES - 3.7% - (continued) | |
| | | | | | Asset-Backed - Automobile - 0.4% - (continued) | |
| $ | | | 671,288 | | | 1 mo. USD LIBOR + 0.450%, 2.91%, 05/15/2029(4) | | $ | 672,462 | |
| | | 803,726 | | | 1 mo. USD LIBOR + 1.000%, 3.46%, 06/15/2028(4) | | | 805,744 | |
| | | | | | Enterprise Fleet Financing LLC | |
| | | 591,879 | | | 1.97%, 01/20/2023 | | | 587,300 | |
| | | 265,487 | | | 2.13%, 07/20/2022 | | | 263,917 | |
| | | 775,023 | | | 2.13%, 05/22/2023 | | | 768,167 | |
| | | | | | First Investors Auto Owner Trust | |
| | | 125,354 | | | 1.86%, 10/15/2021 | | | 124,754 | |
| | | 501,000 | | | 2.00%, 03/15/2022 | | | 498,628 | |
| | | 645,000 | | | OneMain Direct Auto Receivables Trust 2.31%, 12/14/2021 | | | 641,021 | |
| | | | | | Securitized Term Auto Receivables Trust | |
| | | 445,860 | | | 1.52%, 03/25/2020 | | | 444,414 | |
| | | 550,000 | | | 2.04%, 04/26/2021 | | | 544,038 | |
| | | | | | Wheels SPV LLC | |
| | | 55,420 | | | 1.59%, 05/20/2025 | | | 55,270 | |
| | | 505,264 | | | 1.88%, 04/20/2026 | | | 501,303 | |
| | | | | | | |
| | | | | | 7,675,605 | |
| | | | | | | |
| | | | | | Asset-Backed - Finance & Insurance - 2.1% | |
| | | 2,374,748 | | | Ajax Mortgage Loan Trust 3.16%, 09/25/2056(5) | | | 2,343,998 | |
| | | 1,780,000 | | | ALM VI Ltd. 3 mo. USD LIBOR + 1.400%, 3.84%, 07/15/2026(4) | | | 1,739,836 | |
| | | 3,480,000 | | | Atlas Senior Loan Fund Ltd. 3 mo. USD LIBOR + 1.300%, 3.74%, 01/16/2030(4) | | | 3,462,109 | |
| | | 1,148,522 | | | Bayview Koitere Fund Trust 3.50%, 07/28/2057(5) | | | 1,138,430 | |
| | | | | | Bayview Opportunity Master Fund Trust | |
| | | 600,707 | | | 3.50%, 01/28/2055(5) | | | 595,384 | |
| | | 630,009 | | | 3.50%, 06/28/2057(5) | | | 624,339 | |
| | | 594,228 | | | 4.00%, 11/28/2053(5) | | | 596,249 | |
| | | 818,072 | | | 4.00%, 10/28/2064(5) | | | 820,719 | |
| | | 3,500,000 | | | CIFC Funding Ltd. 3 mo. USD LIBOR + 1.050%, 3.54%, 04/24/2030(4) | | | 3,445,085 | |
| | | | | | Ford Credit Floorplan Master Owner Trust | |
| | | 2,575,000 | | | 1.75%, 07/15/2021 | | | 2,556,174 | |
| | | 430,000 | | | 2.09%, 03/15/2022 | | | 425,090 | |
| | | | | | GreatAmerica Leasing Receivables Funding LLC | |
| | | 1,040,000 | | | 2.36%, 01/20/2023 | | | 1,031,786 | |
| | | 470,000 | | | 2.60%, 06/15/2021 | | | 467,479 | |
| | | 332,000 | | | 2.83%, 06/17/2024 | | | 331,083 | |
| | | 1,465,000 | | | KKR Clo 17 Ltd. 3 mo. USD LIBOR + 1.340%, 3.78%, 04/15/2029(4) | | | 1,458,454 | |
| | | 2,635,000 | | | Madison Park Funding Ltd. 3 mo. USD LIBOR + 0.750%, 3.19%, 04/15/2029(4) | | | 2,569,786 | |
| | | 2,690,000 | | | Magnetite VII Ltd. 3 mo. USD LIBOR + 0.800%, 3.24%, 01/15/2028(4) | | | 2,639,697 | |
| | | | | | Magnetite XVIII Ltd. | |
| | | 1,443,000 | | | 3 mo. USD LIBOR + 1.080%, 3.70%, 11/15/2028(4) | | | 1,436,609 | |
| | | 1,615,000 | | | 3 mo. USD LIBOR + 1.500%, 4.07%, 11/15/2028(4) | | | 1,583,659 | |
| | | | | | MMAF Equipment Finance LLC | |
| | | 75,281 | | | 1.73%, 05/18/2020 | | | 75,157 | |
| | | 665,000 | | | 2.21%, 10/17/2022 | | | 654,711 | |
| | | 1,000,000 | | | 2.21%, 12/15/2032 | | | 973,751 | |
| | | 182,092 | | | Nationstar HECM Loan Trust 2.04%, 09/25/2027(5) | | | 181,393 | |
| | | | | | OneMain Financial Issuance Trust | |
| | | 440,000 | | | 3.66%, 02/20/2029 | | | 440,799 | |
| | | 224,164 | | | 4.10%, 03/20/2028 | | | 224,691 | |
| | | 1,565,000 | | | SBA Tower Trust 2.90%, 10/15/2044(6) | | | 1,555,775 | |
| | | | | | Springleaf Funding Trust | |
| | | 429,758 | | | 2.90%, 11/15/2029 | | | 427,260 | |
| | | 443,458 | | | 3.16%, 11/15/2024 | | | 442,846 | |
| | | | | | | | | | |
| Shares or Principal Amount | | Market Value† | |
|
| ASSET & COMMERCIAL MORTGAGE BACKED SECURITIES - 3.7% - (continued) | |
| | | | | | Asset-Backed - Finance & Insurance - 2.1% - (continued) | |
| $ | | | 755,000 | | | 3.48%, 05/15/2028 | | $ | 752,562 | |
| | | 615,000 | | | SPS Servicer Advance Receivables Trust 3.62%, 10/17/2050 | | | 617,528 | |
| | | | | | Towd Point Mortgage Trust | |
| | | 1,080,003 | | | 2.75%, 10/25/2056(5) | | | 1,056,463 | |
| | | 276,194 | | | 2.75%, 04/25/2057(5) | | | 270,107 | |
| | | 790,287 | | | 2.75%, 06/25/2057(5) | | | 768,936 | |
| | | 384,127 | | | 3.00%, 01/25/2058(5) | | | 377,110 | |
| | | 2,635,000 | | | Treman Park CLO Ltd. 3 mo. USD LIBOR + 1.070%, 3.54%, 10/20/2028(4) | | | 2,625,440 | |
| | | 808,208 | | | Vantage Data Centers Issuer LLC 4.07%, 02/16/2043 | | | 809,825 | |
| | | | | | | |
| | | | | | 41,520,320 | |
| | | | | | | |
| | | | | | Commercial Mortgage - Backed Securities - 0.6% | |
| | | 840,000 | | | BAMLL Commercial Mortgage Securities Trust 4.09%, 08/10/2038(5) | | | 872,552 | |
| | | | | | CSAIL Commercial Mortgage Trust | |
| | | 2,000,000 | | | 3.50%, 06/15/2057 | | | 1,998,940 | |
| | | 3,400,000 | | | 3.51%, 04/15/2050 | | | 3,408,626 | |
| | | 2,220,000 | | | CSMC Trust 2.76%, 04/05/2033 | | | 2,200,426 | |
| | | | | | FREMF Mortgage Trust | |
| | | 230,000 | | | 3.15%, 04/25/2046(5) | | | 229,506 | |
| | | 385,000 | | | 3.36%, 05/25/2045(5) | | | 384,615 | |
| | | 1,015,000 | | | 4.08%, 09/25/2025(5) | | | 1,012,857 | |
| | | 525,000 | | | 5.50%, 04/25/2020(5) | | | 538,551 | |
| | | 710,000 | | | JP Morgan Chase Commercial Mortgage Securities Trust 3.91%, 01/15/2049 | | | 725,734 | |
| | | 1,000,000 | | | SFAVE Commercial Mortgage Securities Trust 4.14%, 01/05/2043(5) | | | 939,792 | |
| | | | | | | |
| | | | | | 12,311,599 | |
| | | | | | | |
| | | | | | Other ABS - 0.2% | |
| | | 1,226,479 | | | AASET US Ltd. 4.45%, 11/16/2038 | | | 1,238,951 | |
| | | 1,225,000 | | | BlueMountain CLO Ltd. 3 mo. USD LIBOR + 1.450%, 4.10%, 11/20/2028(4) | | | 1,190,596 | |
| | | 1,797,395 | | | SoFi Consumer Loan Program Trust 3.54%, 11/26/2027 | | | 1,799,316 | |
| | | | | | | |
| | | | | | 4,228,863 | |
| | | | | | | |
| | | | | | Whole Loan Collateral CMO - 0.4% | |
| | | 349,605 | | | Angel Oak Mortgage Trust LLC 2.71%, 11/25/2047(5) | | | 346,792 | |
| | | | | | COLT Mortgage Loan Trust | |
| | | 625,940 | | | 2.93%, 02/25/2048(5) | | | 618,771 | |
| | | 521,024 | | | 3.69%, 10/26/2048(5) | | | 520,467 | |
| | | | | | Deephaven Residential Mortgage Trust | |
| | | 446,928 | | | 2.45%, 06/25/2047(5) | | | 439,564 | |
| | | 370,653 | | | 2.58%, 10/25/2047(5) | | | 365,929 | |
| | | 169,828 | | | 2.73%, 12/26/2046(5) | | | 168,149 | |
| | | 605,181 | | | 2.98%, 12/25/2057(5) | | | 599,388 | |
| | | 258,964 | | | Finance of America Structured Securities Trust 2.32%, 11/25/2027(5) | | | 258,806 | |
| | | 750,341 | | | MetLife Securitization Trust 3.00%, 04/25/2055(5) | | | 738,475 | |
| | | | | | Mill City Mortgage Loan Trust | |
| | | 331,603 | | | 2.50%, 04/25/2057(5) | | | 324,470 | |
| | | 855,653 | | | 2.75%, 01/25/2061(5) | | | 835,985 | |
| | | 1,025,665 | | | New Residential Mortgage Loan Trust 4.00%, 04/25/2057(5) | | | 1,031,852 | |
| | | 743,918 | | | Towd Point Mortgage Trust 2.25%, 04/25/2056(5) | | | 726,839 | |
| | | | | | | |
| | | | | | 6,975,487 | |
| | | | | | | |
| | | |
| | | | | | Total Asset & Commercial Mortgage Backed Securities
(cost $73,973,899) | | $ | 72,711,874 | |
| | | | | | | | | | |
The accompanying notes are an integral part of these financial statements.
|
| Hartford Balanced HLS Fund |
Schedule of Investments – (continued)
December 31, 2018
| | | | | | | | | | |
| Shares or Principal Amount | | Market Value† | |
| CORPORATE BONDS - 18.4% | | | |
| | | | | | Aerospace/Defense - 0.2% | |
| $ | | | 850,000 | | | BAE Systems Holdings, Inc. 3.85%, 12/15/2025 | | $ | 842,713 | |
| | | | | | Lockheed Martin Corp. | |
| | | 500,000 | | | 4.07%, 12/15/2042 | | | 477,093 | |
| | | 256,000 | | | 4.50%, 05/15/2036 | | | 264,148 | |
| | | 560,000 | | | 4.85%, 09/15/2041 | | | 595,601 | |
| | | 685,000 | | | United Technologies Corp. 3.95%, 08/16/2025 | | | 679,695 | |
| | | | | | | | | | |
| | | | | | 2,859,250 | |
| | | | | | | |
| | | | | | Agriculture - 0.5% | |
| | | | | | Altria Group, Inc. | |
| | | 560,000 | | | 4.50%, 05/02/2043 | | | 466,068 | |
| | | 1,995,000 | | | 4.75%, 05/05/2021 | | | 2,038,977 | |
| | | 3,160,000 | | | BAT Capital Corp. 3.56%, 08/15/2027 | | | 2,805,279 | |
| | | | | | BAT International Finance plc | |
| | | 685,000 | | | 2.75%, 06/15/2020 | | | 673,058 | |
| | | 2,775,000 | | | 3.25%, 06/07/2022 | | | 2,668,204 | |
| | | 290,000 | | | 3.50%, 06/15/2022 | | | 283,732 | |
| | | 1,065,000 | | | Imperial Brands Finance plc 3.75%, 07/21/2022 | | | 1,056,424 | |
| | | 325,000 | | | Philip Morris International, Inc. 4.88%, 11/15/2043 | | | 322,223 | |
| | | | | | | | | | |
| | | | | | 10,313,965 | |
| | | | | | | |
| | | | | | Airlines - 0.3% | |
| | | 2,831,229 | | | Continental Airlines, Inc. 5.98%, 10/19/2023 | | | 2,956,369 | |
| | | 1,790,441 | | | Southwest Airlines Co. 6.15%, 02/01/2024 | | | 1,881,396 | |
| | | 170,000 | | | United Airlines Class B Pass Through Trust 4.60%, 09/01/2027 | | | 170,071 | |
| | | | | | | | | | |
| | | | | | 5,007,836 | |
| | | | | | | |
| | | | | | Auto Manufacturers - 0.5% | |
| | | | | | Daimler Finance North America LLC | |
| | | 150,000 | | | 2.25%, 07/31/2019 | | | 148,898 | |
| | | 1,440,000 | | | 2.30%, 02/12/2021 | | | 1,405,037 | |
| | | 4,200,000 | | | Ford Motor Credit Co. LLC 3.10%, 05/04/2023 | | | 3,796,716 | |
| | | | | | General Motors Financial Co., Inc. | |
| | | 3,185,000 | | | 3.70%, 05/09/2023 | | | 3,030,302 | |
| | | 1,245,000 | | | 3.95%, 04/13/2024 | | | 1,182,389 | |
| | | 580,000 | | | Volkswagen Group of America Finance LLC 2.45%, 11/20/2019 | | | 574,470 | |
| | | | | | | | | | |
| | | | | | 10,137,812 | |
| | | | | | | |
| | | | | | Beverages - 0.3% | |
| | | | | | Anheuser-Busch Cos. LLC / Anheuser-Busch InBev Worldwide, Inc. | | | | |
| | | 1,750,000 | | | 3.65%, 02/01/2026 | | | 1,654,709 | |
| | | 310,000 | | | 4.70%, 02/01/2036 | | | 287,493 | |
| | | 280,000 | | | 4.90%, 02/01/2046 | | | 259,668 | |
| | | | | | Anheuser-Busch InBev Worldwide, Inc. | |
| | | 1,125,000 | | | 3.50%, 01/12/2024 | | | 1,100,414 | |
| | | 220,000 | | | 4.38%, 04/15/2038 | | | 196,284 | |
| | | 1,300,000 | | | Coca-Cola Femsa S.A.B. de C.V. 3.88%, 11/26/2023 | | | 1,310,397 | |
| | | 765,000 | | | Molson Coors Brewing Co. 3.50%, 05/01/2022 | | | 760,421 | |
| | | | | | | | | | |
| | | | | | 5,569,386 | |
| | | | | | | |
| | | | | | Biotechnology - 0.1% | |
| | | 1,340,000 | | | Biogen, Inc. 2.90%, 09/15/2020 | | | 1,330,021 | |
| | | 770,000 | | | Celgene Corp. 3.55%, 08/15/2022 | | | 761,542 | |
| | | 335,000 | | | Gilead Sciences, Inc. 2.55%, 09/01/2020 | | | 332,291 | |
| | | | | | | | | | |
| | | | | | 2,423,854 | |
| | | | | | | |
| | | | | | Chemicals - 0.1% | |
| | | 2,740,000 | | | CNAC HK Synbridge Co., Ltd. 5.00%, 05/05/2020 | | | 2,748,412 | |
| | | | | | | | | | |
| | | | | | Commercial Banks - 4.6% | |
| | | | | | Banco Santander S.A. | |
| | | 1,200,000 | | | 3.13%, 02/23/2023 | | | 1,134,535 | |
| | | 600,000 | | | 3.85%, 04/12/2023 | | | 582,998 | |
| | | | | | | | | | |
| Shares or Principal Amount | | Market Value† | |
| CORPORATE BONDS - 18.4% - (continued) | | | |
| | | | | | Commercial Banks - 4.6% - (continued) | |
| | | | | | Bank of America Corp. | |
| $ | | | 1,220,000 | | | 2.63%, 10/19/2020 | | $ | 1,207,213 | |
| | | 1,799,000 | | | 3 mo. USD LIBOR + 1.040%, 3.42%, 12/20/2028(4) | | | 1,680,535 | |
| | | 1,610,000 | | | 3 mo. USD LIBOR + 1.370%, 3.59%, 07/21/2028(4) | | | 1,526,794 | |
| | | 2,950,000 | | | 4.20%, 08/26/2024 | | | 2,925,810 | |
| | | 2,740,000 | | | Barclays plc 3.20%, 08/10/2021 | | | 2,662,858 | |
| | | 1,660,000 | | | BB&T Corp. 3.20%, 09/03/2021 | | | 1,658,370 | |
| | | | | | BNP Paribas S.A. | |
| | | 1,000,000 | | | 3.38%, 01/09/2025 | | | 941,077 | |
| | | 2,410,000 | | | 3.50%, 11/16/2027 | | | 2,219,904 | |
| | | | | | BPCE S.A. | |
| | | 2,025,000 | | | 3.50%, 10/23/2027 | | | 1,839,868 | |
| | | 2,225,000 | | | 5.15%, 07/21/2024 | | | 2,234,221 | |
| | | 3,625,000 | | | 5.70%, 10/22/2023 | | | 3,753,412 | |
| | | 1,875,000 | | | Capital One Financial Corp. 3.75%, 04/24/2024 | | | 1,828,703 | |
| | | | | | Citigroup, Inc. | |
| | | 1,220,000 | | | 2.50%, 07/29/2019 | | | 1,215,833 | |
| | | 2,355,000 | | | 3 mo. USD LIBOR + 1.151%, 3.52%, 10/27/2028(4) | | | 2,196,251 | |
| | | 533,000 | | | 5.30%, 05/06/2044 | | | 531,180 | |
| | | 290,000 | | | 8.13%, 07/15/2039 | | | 402,332 | |
| | | 1,695,000 | | | Citizens Bank NA 2.55%, 05/13/2021 | | | 1,657,844 | |
| | | | | | Credit Agricole S.A. | |
| | | 950,000 | | | 2.50%, 04/15/2019 | | | 948,526 | |
| | | 1,025,000 | | | 3.25%, 10/04/2024 | | | 958,358 | |
| | | 535,000 | | | 3.75%, 04/24/2023 | | | 523,519 | |
| | | 790,000 | | | 4.38%, 03/17/2025 | | | 764,808 | |
| | | | | | Credit Suisse AG | |
| | | 855,000 | | | 3.00%, 10/29/2021 | | | 844,158 | |
| | | 250,000 | | | 3.63%, 09/09/2024 | | | 245,297 | |
| | | | | | Credit Suisse Group AG | |
| | | 530,000 | | | 3.57%, 01/09/2023 | | | 517,032 | |
| | | 260,000 | | | 3 mo. USD LIBOR + 1.410%, 3.87%, 01/12/2029(4) | | | 241,881 | |
| | | 345,000 | | | 3 mo. USD LIBOR + 1.240%, 4.02%, 06/12/2024(4) | | | 339,799 | |
| | | | | | Credit Suisse Group Funding Guernsey Ltd. | |
| | | 1,425,000 | | | 3.75%, 03/26/2025 | | | 1,358,819 | |
| | | 1,885,000 | | | 3.80%, 09/15/2022 | | | 1,871,248 | |
| | | 775,000 | | | Danske Bank A/S 3.88%, 09/12/2023 | | | 746,072 | |
| | | | | | Deutsche Bank AG | |
| | | 1,925,000 | | | 3.15%, 01/22/2021 | | | 1,860,280 | |
| | | 2,210,000 | | | 4.25%, 10/14/2021 | | | 2,160,833 | |
| | | | | | Goldman Sachs Group, Inc. | |
| | | 250,000 | | | 3 mo. USD LIBOR + 1.158%, 3.81%, 04/23/2029(4) | | | 233,406 | |
| | | 2,590,000 | | | 6.25%, 02/01/2041 | | | 2,954,042 | |
| | | | | | HSBC Holdings plc | |
| | | 1,030,000 | | | 3.40%, 03/08/2021 | | | 1,027,327 | |
| | | 3,625,000 | | | 3.60%, 05/25/2023 | | | 3,604,301 | |
| | | 590,000 | | | 3 mo. USD LIBOR + 1.535%, 4.58%, 06/19/2029(4) | | | 584,831 | |
| | | 1,490,000 | | | Huntington National Bank 2.40%, 04/01/2020 | | | 1,474,155 | |
| | | | | | ING Groep N.V. | |
| | | 345,000 | | | 3.15%, 03/29/2022 | | | 339,218 | |
| | | 1,100,000 | | | 3.95%, 03/29/2027 | | | 1,055,497 | |
| | | | | | JP Morgan Chase & Co. | |
| | | 2,240,000 | | | 3.25%, 09/23/2022 | | | 2,222,213 | |
| | | 2,000,000 | | | 4.95%, 03/25/2020 | | | 2,042,325 | |
| | | 470,000 | | | Macquarie Bank Ltd. 2.40%, 01/21/2020 | | | 465,835 | |
| | | 2,215,000 | | | Macquarie Group Ltd. 3 mo. USD LIBOR + 1.330%, 4.15%, 03/27/2024(4) | | | 2,215,253 | |
The accompanying notes are an integral part of these financial statements.
|
| Hartford Balanced HLS Fund |
Schedule of Investments – (continued)
December 31, 2018
| | | | | | | | | | |
| Shares or Principal Amount | | Market Value† | |
| CORPORATE BONDS - 18.4% - (continued) | | | |
| | | | | | Commercial Banks - 4.6% - (continued) | |
| | | | | | Morgan Stanley | |
| $ | | | 4,875,000 | | | 2.50%, 01/24/2019 | | $ | 4,873,011 | |
| | | 1,450,000 | | | 3.13%, 07/27/2026 | | | 1,340,719 | |
| | | 1,800,000 | | | 3.63%, 01/20/2027 | | | 1,710,716 | |
| | | 1,000,000 | | | 3.70%, 10/23/2024 | | | 983,390 | |
| | | 250,000 | | | 5.63%, 09/23/2019 | | | 253,700 | |
| | | 4,905,000 | | | NBK SPC Ltd. 2.75%, 05/30/2022 | | | 4,718,120 | |
| | | 1,755,000 | | | Santander Holdings USA, Inc. 3.40%, 01/18/2023 | | | 1,684,185 | |
| | | 1,775,000 | | | Societe Generale S.A. 3.25%, 01/12/2022 | | | 1,737,782 | |
| | | 640,000 | | | SunTrust Bank 3.30%, 05/15/2026 | | | 606,448 | |
| | | | | | UBS Group Funding Switzerland AG | |
| | | 1,665,000 | | | 2.95%, 09/24/2020 | | | 1,647,396 | |
| | | 1,900,000 | | | 3.00%, 04/15/2021 | | | 1,885,306 | |
| | | | | | Wells Fargo & Co. | |
| | | 4,344,000 | | | 4.48%, 01/16/2024 | | | 4,396,109 | |
| | | 850,000 | | | 4.75%, 12/07/2046 | | | 818,422 | |
| | | | | | | | | | |
| | | | | | 90,454,075 | |
| | | | | | | |
| | | | | | Commercial Services - 0.5% | |
| | | | | | Catholic Health Initiatives | |
| | | 1,854,000 | | | 2.95%, 11/01/2022 | | | 1,813,388 | |
| | | 245,000 | | | 4.35%, 11/01/2042 | | | 221,617 | |
| | | | | | ERAC USA Finance LLC | |
| | | 655,000 | | | 2.35%, 10/15/2019 | | | 650,571 | |
| | | 1,800,000 | | | 4.50%, 08/16/2021 | | | 1,836,481 | |
| | | 1,500,000 | | | 5.63%, 03/15/2042 | | | 1,639,936 | |
| | | 2,545,000 | | | Total System Services, Inc. 3.80%, 04/01/2021 | | | 2,544,494 | |
| | | | | | | | | | |
| | | | | | 8,706,487 | |
| | | | | | | |
| | | | | | Diversified Financial Services - 0.5% | |
| | | 265,000 | | | GE Capital International Funding Co. 4.42%, 11/15/2035 | | | 221,955 | |
| | | 1,910,000 | | | LeasePlan Corp. N.V. 2.88%, 01/22/2019 | | | 1,909,288 | |
| | | 6,190,369 | | | Postal Square L.P. 8.95%, 06/15/2022 | | | 6,918,981 | |
| | | | | | | | | | |
| | | | | | 9,050,224 | |
| | | | | | | |
| | | | | | Electric - 1.9% | |
| | | 1,960,000 | | | Cleveland Electric Illuminating Co. 3.50%, 04/01/2028 | | | 1,867,181 | |
| | | | | | Dominion Energy, Inc. | |
| | | 725,000 | | | 2.96%, 07/01/2019(6) | | | 722,422 | |
| | | 1,750,000 | | | 4.10%, 04/01/2021(6) | | | 1,760,107 | |
| | | 1,200,000 | | | Duke Energy Carolinas LLC 6.10%, 06/01/2037 | | | 1,439,544 | |
| | | 1,375,000 | | | Electricite de France S.A. 10 year USD Swap + 3.041%, 5.63%, 01/22/2024(4)(7)(8) | | | 1,265,000 | |
| | | 365,000 | | | Emera U.S. Finance L.P. 2.70%, 06/15/2021 | | | 355,582 | |
| | | 1,000,000 | | | FirstEnergy Corp. 3.90%, 07/15/2027 | | | 969,209 | |
| | | 1,705,000 | | | Fortis, Inc. 3.06%, 10/04/2026 | | | 1,556,478 | |
| | | | | | Georgia Power Co. | | | | |
| | | 170,000 | | | 4.30%, 03/15/2042 | | | 156,600 | |
| | | 245,000 | | | 4.75%, 09/01/2040 | | | 242,244 | |
| | | 1,275,000 | | | Indianapolis Power and Light Co. 6.60%, 06/01/2037 | | | 1,605,723 | |
| | | 515,000 | | | Infraestructura Energetica Nova S.A.B. de C.V. 4.88%, 01/14/2048 | | | 403,703 | |
| | | 645,000 | | | Niagara Mohawk Power Corp. 4.28%, 12/15/2028 | | | 667,051 | |
| | | 750,000 | | | Oglethorpe Power Corp. 5.25%, 09/01/2050 | | | 777,480 | |
| | | | | | Oncor Electric Delivery Co. LLC | | | | |
| | | 385,000 | | | 2.95%, 04/01/2025 | | | 374,914 | |
| | | 1,185,000 | | | 4.10%, 06/01/2022 | | | 1,213,868 | |
| | | | | | Pacific Gas & Electric Co. | | | | |
| | | 695,000 | | | 3.85%, 11/15/2023 | | | 622,000 | |
| | | 20,000 | | | 4.00%, 12/01/2046 | | | 15,084 | |
| | | 45,000 | | | 4.30%, 03/15/2045 | | | 35,639 | |
| | | | | | | | | | |
| Shares or Principal Amount | | Market Value† | |
| CORPORATE BONDS - 18.4% - (continued) | | | |
| | | | | | Electric - 1.9% - (continued) | |
| $ | | | 310,000 | | | 4.75%, 02/15/2044 | | $ | 254,530 | |
| | | 725,000 | | | 5.13%, 11/15/2043 | | | 624,932 | |
| | | 1,390,000 | | | 5.40%, 01/15/2040 | | | 1,232,719 | |
| | | 996,000 | | | 5.80%, 03/01/2037 | | | 923,052 | |
| | | 155,000 | | | 6.05%, 03/01/2034 | | | 143,616 | |
| | | 320,000 | | | 6.25%, 03/01/2039 | | | 300,583 | |
| | | 55,000 | | | 6.35%, 02/15/2038 | | | 51,935 | |
| | | | | | SCANA Corp. | | | | |
| | | 2,031,000 | | | 4.13%, 02/01/2022(7) | | | 2,031,653 | |
| | | 2,780,000 | | | 4.75%, 05/15/2021(7) | | | 2,814,192 | |
| | | 1,100,000 | | | 6.25%, 04/01/2020 | | | 1,127,065 | |
| | | | | | South Carolina Electric & Gas Co. | | | | |
| | | 395,000 | | | 3.50%, 08/15/2021 | | | 396,109 | |
| | | 465,000 | | | 4.25%, 08/15/2028 | | | 482,075 | |
| | | 215,000 | | | 4.35%, 02/01/2042 | | | 211,944 | |
| | | 205,000 | | | 4.60%, 06/15/2043 | | | 210,006 | |
| | | 1,180,000 | | | 6.05%, 01/15/2038 | | | 1,391,505 | |
| | | 360,000 | | | 6.63%, 02/01/2032 | | | 436,478 | |
| | | 2,000,000 | | | Southern California Edison Co. 5.55%, 01/15/2037 | | | 2,170,349 | |
| | | | | | Southern Co. | | | | |
| | | 1,450,000 | | | 2.75%, 06/15/2020 | | | 1,433,934 | |
| | | 2,050,000 | | | 2.95%, 07/01/2023 | | | 1,979,675 | |
| | | | | | State Grid Overseas Investment Ltd. | | | | |
| | | 1,485,000 | | | 2.75%, 05/04/2022 | | | 1,448,271 | |
| | | 1,490,000 | | | 3.50%, 05/04/2027 | | | 1,435,297 | |
| | | | | | | | | | |
| | | | | | 37,149,749 | |
| | | | | | | |
| | | | | | Engineering & Construction - 0.1% | |
| | | | | | SBA Tower Trust | | | | |
| | | 1,235,000 | | | 2.88%, 07/15/2046 | | | 1,212,349 | |
| | | 225,000 | | | 3.45%, 03/15/2048 | | | 223,617 | |
| | | | | | | | | | |
| | | | | | 1,435,966 | |
| | | | | | | |
| | | | | | Food - 0.3% | |
| | | | | | Conagra Brands, Inc. | | | | |
| | | 455,000 | | | 4.60%, 11/01/2025 | | | 456,441 | |
| | | 330,000 | | | 5.30%, 11/01/2038 | | | 311,830 | |
| | | | | | Kraft Heinz Foods Co. | | | | |
| | | 530,000 | | | 3.00%, 06/01/2026 | | | 472,804 | |
| | | 2,030,000 | | | 4.00%, 06/15/2023 | | | 2,024,680 | |
| | | 1,890,000 | | | 4.38%, 06/01/2046 | | | 1,557,032 | |
| | | 1,065,000 | | | Kroger Co. 4.00%, 02/01/2024 | | | 1,074,011 | |
| | | 680,000 | | | Sigma Alimentos S.A. de C.V. 4.13%, 05/02/2026 | | | 634,957 | |
| | | | | | | | | | |
| | | | | | 6,531,755 | |
| | | | | | | |
| | | | | | Gas - 0.1% | |
| | | 330,000 | | | Boston Gas Co. 3.15%, 08/01/2027 | | | 314,804 | |
| | | 1,870,000 | | | KeySpan Gas East Corp. 2.74%, 08/15/2026 | | | 1,741,091 | |
| | | | | | | | | | |
| | | | | | 2,055,895 | |
| | | | | | | |
| | | | | | Healthcare-Products - 0.1% | |
| | | | | | Medtronic, Inc. | | | | |
| | | 775,000 | | | 3.15%, 03/15/2022 | | | 772,861 | |
| | | 1,230,000 | | | 3.50%, 03/15/2025 | | | 1,225,140 | |
| | | 310,000 | | | 3.63%, 03/15/2024 | | | 312,972 | |
| | | | | | | | | | |
| | | | | | 2,310,973 | |
| | | | | | | |
| | | | | | Healthcare-Services - 0.7% | |
| | | | | | Anthem, Inc. | |
| | | 421,000 | | | 3.30%, 01/15/2023 | | | 414,252 | |
| | | 1,360,000 | | | 4.10%, 03/01/2028 | | | 1,332,985 | |
| | | 675,000 | | | 4.65%, 08/15/2044 | | | 649,142 | |
| | | 590,000 | | | Catholic Health Initiatives 4.20%, 08/01/2023 | | | 598,322 | |
| | | 955,000 | | | Cigna Corp. 4.38%, 10/15/2028 | | | 960,330 | |
The accompanying notes are an integral part of these financial statements.
|
| Hartford Balanced HLS Fund |
Schedule of Investments – (continued)
December 31, 2018
| | | | | | | | | | |
| Shares or Principal Amount | | Market Value† | |
| CORPORATE BONDS - 18.4% - (continued) | | | |
| | | | | | Healthcare-Services - 0.7% - (continued) | |
| | | | | | Dignity Health | | | | |
| $ | | | 180,000 | | | 2.64%, 11/01/2019 | | $ | 178,949 | |
| | | 714,000 | | | 3.81%, 11/01/2024 | | | 718,880 | |
| | | 1,353,000 | | | 4.50%, 11/01/2042 | | | 1,269,397 | |
| | | 1,770,000 | | | Humana, Inc. 2.90%, 12/15/2022 | | | 1,720,725 | |
| | | 1,400,000 | | | Mercy Health 3.56%, 08/01/2027 | | | 1,354,910 | |
| | | 1,155,000 | | | PeaceHealth Obligated Group 4.79%, 11/15/2048 | | | 1,221,017 | |
| | | | | | UnitedHealth Group, Inc. | | | | |
| | | 920,000 | | | 3.35%, 07/15/2022 | | | 924,216 | |
| | | 1,440,000 | | | 3.75%, 07/15/2025 | | | 1,457,664 | |
| | | 910,000 | | | 3.85%, 06/15/2028 | | | 919,917 | |
| | | | | | | | | | |
| | | | | | 13,720,706 | |
| | | | | | | |
| | | | | | Household Products - 0.2% | |
| | | 3,566,208 | | | Procter & Gamble - Esop 9.36%, 01/01/2021 | | | 3,781,400 | |
| | | | | | | | | | |
| | | | | | Insurance - 0.4% | |
| | | 1,000,000 | | | Berkshire Hathaway, Inc. 2.75%, 03/15/2023 | | | 981,675 | |
| | | | | | Chubb INA Holdings, Inc. | | | | |
| | | 495,000 | | | 2.30%, 11/03/2020 | | | 487,921 | |
| | | 840,000 | | | 3.35%, 05/15/2024 | | | 834,613 | |
| | | 200,000 | | | Five Corners Funding Trust 4.42%, 11/15/2023 | | | 205,756 | |
| | | 550,000 | | | Liberty Mutual Group, Inc. 4.25%, 06/15/2023 | | | 554,519 | |
| | | | | | MetLife, Inc. | | | | |
| | | 2,205,000 | | | 3.60%, 04/10/2024 | | | 2,220,186 | |
| | | 795,000 | | | 4.88%, 11/13/2043 | | | 829,533 | |
| | | 2,220,000 | | | Trinity Acquisition plc 4.40%, 03/15/2026 | | | 2,206,049 | |
| | | | | | | | | | |
| | | | | | 8,320,252 | |
| | | | | | | |
| | | | | | Internet - 0.4% | |
| | | | | | Alibaba Group Holding Ltd. | |
| | | 200,000 | | | 2.50%, 11/28/2019 | | | 198,909 | |
| | | 1,775,000 | | | 3.40%, 12/06/2027 | | | 1,641,269 | |
| | | 1,045,000 | | | 3.60%, 11/28/2024 | | | 1,022,213 | |
| | | | | | Amazon.com, Inc. | |
| | | 1,250,000 | | | 2.50%, 11/29/2022 | | | 1,222,576 | |
| | | 1,020,000 | | | 4.80%, 12/05/2034 | | | 1,092,563 | |
| | | 480,000 | | | 4.95%, 12/05/2044 | | | 532,141 | |
| | | 1,095,000 | | | Tencent Holdings Ltd. 3.60%, 01/19/2028 | | | 1,028,821 | |
| | | | | | | | | | |
| | | | | | 6,738,492 | |
| | | | | | | |
| | | | | | IT Services - 0.1% | |
| | | | | | Apple, Inc. | |
| | | 546,000 | | | 3.25%, 02/23/2026 | | | 532,965 | |
| | | 1,360,000 | | | 3.45%, 05/06/2024 | | | 1,366,447 | |
| | | | | | | | | | |
| | | | | | 1,899,412 | |
| | | | | | | |
| | | | | | Machinery - Construction & Mining - 0.1% | |
| | | 1,500,000 | | | Caterpillar Financial Services Corp. 3.30%, 06/09/2024 | | | 1,491,015 | |
| | | | | | | | | | |
| | | | | | Media - 0.9% | |
| | | | | | 21st Century Fox America, Inc. | |
| | | 385,000 | | | 4.00%, 10/01/2023 | | | 394,971 | |
| | | 1,275,000 | | | 4.50%, 02/15/2021 | | | 1,309,033 | |
| | | 485,000 | | | Charter Communications Operating LLC / Charter Communications Operating Capital 5.38%, 05/01/2047 | | | 439,492 | |
| | | | | | Comcast Corp. | |
| | | 1,140,000 | | | 3.95%, 10/15/2025 | | | 1,153,495 | |
| | | 2,050,000 | | | 4.40%, 08/15/2035 | | | 1,983,161 | |
| | | 585,000 | | | 4.60%, 10/15/2038 | | | 590,720 | |
| | | | | | Cox Communications, Inc. | |
| | | 80,000 | | | 4.60%, 08/15/2047 | | | 71,966 | |
| | | 2,320,000 | | | 4.80%, 02/01/2035 | | | 2,115,190 | |
| | | | | | | | | | |
| Shares or Principal Amount | | Market Value† | |
| CORPORATE BONDS - 18.4% - (continued) | | | |
| | | | | | Media - 0.9% - (continued) | |
| | | | | | Sky Ltd. | |
| $ | | | 1,265,000 | | | 2.63%, 09/16/2019 | | $ | 1,255,450 | |
| | | 2,386,000 | | | 3.75%, 09/16/2024 | | | 2,377,252 | |
| | | | | | Time Warner Cable LLC | |
| | | 395,000 | | | 6.55%, 05/01/2037 | | | 405,365 | |
| | | 250,000 | | | 7.30%, 07/01/2038 | | | 271,014 | |
| | | 480,000 | | | 8.25%, 04/01/2019 | | | 485,387 | |
| | | 40,000 | | | 8.75%, 02/14/2019 | | | 40,223 | |
| | | 130,000 | | | Time Warner Entertainment Co., L.P. 8.38%, 03/15/2023 | | | 148,307 | |
| | | | | | Viacom, Inc. | |
| | | 835,000 | | | 3.88%, 12/15/2021 | | | 839,999 | |
| | | 2,175,000 | | | 4.25%, 09/01/2023 | | | 2,166,512 | |
| | | 2,325,000 | | | Warner Media LLC 3.60%, 07/15/2025 | | | 2,202,059 | |
| | | | | | | | | | |
| | | | | | 18,249,596 | |
| | | | | | | |
| | | | | | Mining - 0.1% | |
| | | 1,575,000 | | | Glencore Finance Canada Ltd. 4.25%, 10/25/2022 | | | 1,570,016 | |
| | | | | | | | | | |
| | | | | | Miscellaneous Manufacturing - 0.0% | |
| | | 370,000 | | | General Electric Co. 4.13%, 10/09/2042 | | | 289,096 | |
| | | | | | | | | | |
| | | | | | Oil & Gas - 1.2% | |
| | | 1,326,000 | | | Anadarko Petroleum Corp. 4.85%, 03/15/2021 | | | 1,357,665 | |
| | | 1,200,000 | | | BG Energy Capital plc 4.00%, 10/15/2021 | | | 1,216,814 | |
| | | 655,000 | | | BP Capital Markets America, Inc. 3.25%, 05/06/2022 | | | 649,321 | |
| | | | | | BP Capital Markets plc | |
| | | 140,000 | | | 3.99%, 09/26/2023 | | | 142,907 | |
| | | 2,850,000 | | | 4.75%, 03/10/2019 | | | 2,858,667 | |
| | | 130,000 | | | ConocoPhillips Co. 4.95%, 03/15/2026 | | | 139,119 | |
| | | | | | Equinor ASA | |
| | | 340,000 | | | 2.25%, 11/08/2019 | | | 337,390 | |
| | | 160,000 | | | 2.45%, 01/17/2023 | | | 155,459 | |
| | | 1,850,000 | | | 2.90%, 11/08/2020 | | | 1,843,167 | |
| | | 210,000 | | | 3.25%, 11/10/2024 | | | 209,121 | |
| | | 45,000 | | | 3.70%, 03/01/2024 | | | 45,839 | |
| | | 920,000 | | | Marathon Oil Corp. 2.70%, 06/01/2020 | | | 906,406 | |
| | | | | | Petroleos Mexicanos | |
| | | 40,000 | | | 5.38%, 03/13/2022 | | | 39,180 | |
| | | 2,900,000 | | | 5.50%, 01/21/2021 | | | 2,888,313 | |
| | | 670,000 | | | 6.35%, 02/12/2048 | | | 536,000 | |
| | | 2,425,000 | | | 6.75%, 09/21/2047 | | | 2,005,208 | |
| | | 3,540,000 | | | Pioneer Natural Resources Co. 7.50%, 01/15/2020 | | | 3,678,552 | |
| | | 3,950,000 | | | Sinopec Group Overseas Development Ltd. 2.50%, 04/28/2020 | | | 3,901,462 | |
| | | 1,375,000 | | | Total Capital International S.A. 2.70%, 01/25/2023 | | | 1,343,199 | |
| | | | | | | | | | |
| | | | | | 24,253,789 | |
| | | | | | | |
| | | | | | Oil & Gas Services - 0.1% | |
| | | 940,000 | | | Schlumberger Holdings Corp. 3.00%, 12/21/2020 | | | 931,853 | |
| | | | | | | | | | |
| | | | | | Pharmaceuticals - 1.3% | |
| | | | | | Allergan Funding SCS | |
| | | 645,000 | | | 3.45%, 03/15/2022 | | | 634,708 | |
| | | 975,000 | | | 3.80%, 03/15/2025 | | | 951,818 | |
| | | 600,000 | | | 4.85%, 06/15/2044 | | | 566,509 | |
| | | | | | Allergan Sales LLC | |
| | | 142,000 | | | 4.88%, 02/15/2021 | | | 145,447 | |
| | | 800,000 | | | 5.00%, 12/15/2021 | | | 823,119 | |
| | | | | | Bayer U.S. Finance LLC | |
| | | 260,000 | | | 2.38%, 10/08/2019 | | | 257,922 | |
| | | 1,230,000 | | | 4.25%, 12/15/2025 | | | 1,197,111 | |
The accompanying notes are an integral part of these financial statements.
|
| Hartford Balanced HLS Fund |
Schedule of Investments – (continued)
December 31, 2018
| | | | | | | | | | |
| Shares or Principal Amount | | Market Value† | |
| CORPORATE BONDS - 18.4% - (continued) | | | |
| | | | | | Pharmaceuticals - 1.3% - (continued) | |
| | | | | | Cardinal Health, Inc. | |
| $ | | | 990,000 | | | 2.40%, 11/15/2019 | | $ | 983,005 | |
| | | 445,000 | | | 3.08%, 06/15/2024 | | | 417,881 | |
| | | 880,000 | | | 3.50%, 11/15/2024 | | | 847,087 | |
| | | 785,000 | | | 4.50%, 11/15/2044 | | | 665,296 | |
| | | | | | CVS Health Corp. | |
| | | 3,130,000 | | | 4.10%, 03/25/2025 | | | 3,098,770 | |
| | | 600,000 | | | 5.13%, 07/20/2045 | | | 584,045 | |
| | | 2,015,000 | | | EMD Finance LLC 2.95%, 03/19/2022 | | | 1,985,256 | |
| | | 1,525,000 | | | Express Scripts Holding Co. 2.25%, 06/15/2019 | | | 1,518,509 | |
| | | | | | McKesson Corp. | |
| | | 100,000 | | | 2.85%, 03/15/2023 | | | 96,594 | |
| | | 650,000 | | | 3.80%, 03/15/2024 | | | 643,101 | |
| | | | | | Merck & Co., Inc. | |
| | | 1,960,000 | | | 2.75%, 02/10/2025 | | | 1,896,080 | |
| | | 1,640,000 | | | 2.80%, 05/18/2023 | | | 1,617,917 | |
| | | 2,325,000 | | | Mylan N.V. 3.95%, 06/15/2026 | | | 2,119,035 | |
| | | | | | Mylan, Inc. | |
| | | 1,025,000 | | | 4.55%, 04/15/2028 | | | 955,327 | |
| | | 455,000 | | | 5.20%, 04/15/2048 | | | 375,168 | |
| | | 755,000 | | | Teva Pharmaceutical Finance Co. B.V. 3.65%, 11/10/2021 | | | 715,334 | |
| | | 1,725,000 | | | Teva Pharmaceutical Finance Netherlands B.V. 2.80%, 07/21/2023 | | | 1,485,649 | |
| | | | | | | | | | |
| | | | | | 24,580,688 | |
| | | | | | | |
| | | | | | Pipelines - 0.6% | |
| | | 872,000 | | | Energy Transfer Operating LP 7.60%, 02/01/2024 | | | 963,386 | |
| | | 375,000 | | | Energy Transfer Partners LP 4.50%, 11/01/2023 | | | 375,122 | |
| | | 2,395,000 | | | EQT Midstream Partners L.P. 4.75%, 07/15/2023 | | | 2,389,850 | |
| | | 2,425,000 | | | Phillips 66 Partners L.P. 3.61%, 02/15/2025 | | | 2,329,783 | |
| | | | | | Sunoco Logistics Partners Operations L.P. | |
| | | 1,200,000 | | | 3.90%, 07/15/2026 | | | 1,108,219 | |
| | | 509,000 | | | 4.40%, 04/01/2021 | | | 514,700 | |
| | | 800,000 | | | 5.35%, 05/15/2045 | | | 708,108 | |
| | | 2,470,000 | | | Western Gas Partners L.P. 4.00%, 07/01/2022 | | | 2,448,848 | |
| | | | | | | | | | |
| | | | | | 10,838,016 | |
| | | | | | | |
| | | | | | Real Estate - 0.2% | |
| | | 1,920,000 | | | WEA Finance LLC 4.13%, 09/20/2028 | | | 1,921,503 | |
| | | | | | WEA Finance LLC / Westfield UK & Europe Finance plc | | | | |
| | | 730,000 | | | 2.70%, 09/17/2019 | | | 726,768 | |
| | | 1,400,000 | | | 3.25%, 10/05/2020 | | | 1,398,056 | |
| | | | | | | | | | |
| | | | | | 4,046,327 | |
| | | | | | | |
| | | | | | Real Estate Investment Trusts - 0.6% | |
| | | | | | American Tower Corp. | |
| | | 975,000 | | | 3.45%, 09/15/2021 | | | 974,817 | |
| | | 375,000 | | | 4.40%, 02/15/2026 | | | 374,707 | |
| | | 1,110,000 | | | 5.00%, 02/15/2024 | | | 1,148,226 | |
| | | 760,000 | | | AvalonBay Communities, Inc. 3.63%, 10/01/2020 | | | 764,362 | |
| | | 1,950,000 | | | Brandywine Operating Partnership L.P. 3.95%, 11/15/2027 | | | 1,852,714 | |
| | | | | | Crown Castle International Corp. | |
| | | 635,000 | | | 3.65%, 09/01/2027 | | | 588,671 | |
| | | 525,000 | | | 3.80%, 02/15/2028 | | | 496,803 | |
| | | 2,960,000 | | | HCP, Inc. 4.00%, 06/01/2025 | | | 2,897,591 | |
| | | 1,735,000 | | | Scentre Group Trust 2.38%, 11/05/2019 | | | 1,718,294 | |
| | | | | | | | | | |
| | | | | | 10,816,185 | |
| | | | | | | |
| | | | | | | | | | |
| Shares or Principal Amount | | Market Value† | |
| CORPORATE BONDS - 18.4% - (continued) | | | |
| | | | | | Retail - 0.1% | |
| | | | | | CVS Health Corp. | |
| $ | | | 2,100,000 | | | 4.00%, 12/05/2023 | | $ | 2,106,001 | |
| | | 685,000 | | | 4.88%, 07/20/2035 | | | 662,020 | |
| | | | | | | | | | |
| | | | | | 2,768,021 | |
| | | | | | | |
| | | | | | Semiconductors - 0.1% | |
| | | 1,855,000 | | | Broadcom Corp. / Broadcom Cayman Finance Ltd. 3.63%, 01/15/2024 | | | 1,755,017 | |
| | | 810,000 | | | Microchip Technology, Inc. 3.92%, 06/01/2021 | | | 803,510 | |
| | | | | | | | | | |
| | | | | | 2,558,527 | |
| | | | | | | |
| | | | | | Software - 0.2% | |
| | | | | | Microsoft Corp. | |
| | | 1,605,000 | | | 2.40%, 08/08/2026 | | | 1,496,417 | |
| | | 1,000,000 | | | 3.70%, 08/08/2046 | | | 957,983 | |
| | | 2,300,000 | | | Oracle Corp.
3.25%, 11/15/2027 | | | 2,218,313 | |
| | | | | | | | | | |
| | | | | | 4,672,713 | |
| | | | | | | |
| | | | | | Telecommunications - 0.7% | |
| | | 635,000 | | | America Movil S.A.B. de C.V. 3.13%, 07/16/2022 | | | 622,267 | |
| | | | | | AT&T, Inc. | |
| | | 355,000 | | | 3.95%, 01/15/2025 | | | 347,139 | |
| | | 800,000 | | | 4.13%, 02/17/2026 | | | 781,762 | |
| | | 2,185,000 | | | 4.45%, 04/01/2024 | | | 2,221,256 | |
| | | 715,000 | | | GTP Acquisition Partners I LLC 2.35%, 06/15/2045 | | | 703,486 | |
| | | 576,000 | | | Orange S.A. 9.00%, 03/01/2031 | | | 795,846 | |
| | | 2,440,000 | | | Sprint Spectrum Co. LLC / Sprint Spectrum Co. II LLC / Sprint Spectrum Co. III LLC 4.74%, 09/20/2029 | | | 2,394,250 | |
| | | | | | Verizon Communications, Inc. | |
| | | 2,300,000 | | | 2.95%, 03/15/2022 | | | 2,275,768 | |
| | | 2,486,000 | | | 4.52%, 09/15/2048 | | | 2,330,015 | |
| | | 425,000 | | | 4.67%, 03/15/2055 | | | 390,277 | |
| | | 715,000 | | | 4.75%, 11/01/2041 | | | 693,227 | |
| | | 283,000 | | | 4.81%, 03/15/2039 | | | 277,138 | |
| | | | | | | | | | |
| | | | | | 13,832,431 | |
| | | | | | | |
| | | | | | Transportation - 0.3% | |
| | | 1,285,000 | | | FedEx Corp. 5.10%, 01/15/2044 | | | 1,265,032 | |
| | | | | | Penske Truck Leasing Co. L.P. / PTL Finance Corp. | | | | |
| | | 1,685,000 | | | 3.20%, 07/15/2020 | | | 1,676,597 | |
| | | 1,100,000 | | | 3.38%, 02/01/2022 | | | 1,087,720 | |
| | | 1,525,000 | | | 3.95%, 03/10/2025 | | | 1,493,926 | |
| | | | | | | | | | |
| | | | | | 5,523,275 | |
| | | | | | | |
| | | | | | Water - 0.0% | |
| | | 625,000 | | | American Water Capital Corp.
2.95%, 09/01/2027 | | | 590,532 | |
| | | | | | | | | | |
| | | |
| | | | | | Total Corporate Bonds
(cost $365,067,910) | | $ | 358,227,981 | |
| | | | | | | | | | |
|
| FOREIGN GOVERNMENT OBLIGATIONS - 0.6% | |
| | | | | | Qatar - 0.4% | |
| | | | | | Qatar Government International Bond | |
| | | 4,990,000 | | | 2.38%, 06/02/2021 | | $ | 4,872,186 | |
| | | 1,680,000 | | | 3.88%, 04/23/2023 | | | 1,699,035 | |
| | | 645,000 | | | 5.10%, 04/23/2048 | | | 677,411 | |
| | | | | | | | | | |
| | | | | | 7,248,632 | |
| | | | | | | |
| | | | | | Saudi Arabia - 0.2% | |
| | | | | | Saudi Government International Bond | |
| | | 935,000 | | | 2.38%, 10/26/2021 | | | 899,988 | |
| | | 1,680,000 | | | 2.88%, 03/04/2023 | | | 1,614,893 | |
The accompanying notes are an integral part of these financial statements.
|
| Hartford Balanced HLS Fund |
Schedule of Investments – (continued)
December 31, 2018
| | | | | | | | | | |
| Shares or Principal Amount | | Market Value† | |
|
| FOREIGN GOVERNMENT OBLIGATIONS - 0.6% - (continued) | |
| | | | | | Saudi Arabia - 0.2% - (continued) | |
| $ | | | 760,000 | | | 4.00%, 04/17/2025 | | $ | 753,292 | |
| | | | | | | | | | |
| | | | | | 3,268,173 | |
| | | | | | | |
| | | | | | Total Foreign Government Obligations
(cost $10,581,350) | | $ | 10,516,805 | |
| | | | | | | | | | |
|
| MUNICIPAL BONDS - 1.1% | |
| | | | | | General - 0.4% | |
| | | | | | Chicago, IL, Transit Auth Rev | |
| | | 205,000 | | | 6.30%, 12/01/2021 | | $ | 216,706 | |
| | | 900,000 | | | 6.90%, 12/01/2040 | | | 1,149,741 | |
| | | 365,000 | | | City of Sacramento, CA 6.42%, 08/01/2023 | | | 412,851 | |
| | | 1,345,000 | | | Kansas, Development FA 4.93%, 04/15/2045 | | | 1,477,267 | |
| | | 2,895,000 | | | New York State Urban Development Corp. 2.10%, 03/15/2022 | | | 2,855,078 | |
| | | 600,000 | | | San Jose Redev. Agcy. Successor Agcy. 3.38%, 08/01/2034 | | | 564,762 | |
| | | | | | | | | | |
| | | | | | 6,676,405 | |
| | | | | | | |
| | | | | | General Obligation - 0.5% | |
| | | | | | California State, GO Taxable | |
| | | 420,000 | | | 7.35%, 11/01/2039 | | | 579,806 | |
| | | 540,000 | | | 7.55%, 04/01/2039 | | | 773,577 | |
| | | 685,000 | | | Chicago, IL, Metropolitan Water Reclamation, GO 5.72%, 12/01/2038 | | | 823,445 | |
| | | 785,000 | | | Illinois Municipal Electric Agency 6.83%, 02/01/2035 | | | 966,673 | |
| | | 3,780,000 | | | Illinois State, GO 5.10%, 06/01/2033 | | | 3,603,965 | |
| | | 700,000 | | | South Carolina Public Service Auth 6.45%, 01/01/2050 | | | 887,215 | |
| | | 2,065,000 | | | State of Connecticut, GO 2.99%, 01/15/2023 | | | 2,045,961 | |
| | | | | | | | | | |
| | | | | | 9,680,642 | |
| | | | | | | |
| | | | | | Power - 0.0% | |
| | | 485,000 | | | New York, Utility Debt Securitization Auth 3.44%, 12/15/2025 | | | 486,140 | |
| | | | | | | | | | |
| | | | | | Transportation - 0.1% | |
| | | 875,000 | | | Illinois State Toll Highway Auth 6.18%, 01/01/2034 | | | 1,098,090 | |
| | | 570,000 | | | New York and New Jersey PA, Taxable Rev 6.04%, 12/01/2029 | | | 692,077 | |
| | | 645,000 | | | North Texas Tollway Auth, Rev 6.72%, 01/01/2049 | | | 887,558 | |
| | | | | | | | | | |
| | | | | | 2,677,725 | |
| | | | | | | |
| | | | | | Utility - Electric - 0.1% | |
| | | | | | Municipal Electric Auth Georgia | |
| | | 1,363,000 | | | 6.64%, 04/01/2057 | | | 1,441,018 | |
| | | 410,000 | | | 6.66%, 04/01/2057 | | | 450,000 | |
| | | | | | | | | | |
| | | | | | 1,891,018 | |
| | | | | | | |
| | | |
| | | | | | Total Municipal Bonds
(cost $20,403,158) | | $ | 21,411,930 | |
| | | | | | | | | | |
|
| U.S. GOVERNMENT AGENCIES - 0.9% | |
| | | | | | Mortgage-Backed Agencies - 0.9% | |
| | | | | | FHLMC - 0.6% | |
| | | 11,011,331 | | | 3.50%, 08/01/2048 | | $ | 11,008,415 | |
| | | 29,600 | | | 4.00%, 03/01/2041 | | | 30,457 | |
| | | 23,000 | | | 1 year CMT + 2.249%, 4.26%, 04/01/2029(4) | | | 23,895 | |
| | | | | | | | | | |
| | | | | | 11,062,767 | |
| | | | | | | |
| | | | | | FNMA - 0.1% | |
| | | 926,655 | | | 1 mo. USD LIBOR + 0.400%, 2.70%, 10/25/2024(4) | | | 925,428 | |
| | | 55,436 | | | 4.50%, 11/01/2023 | | | 57,394 | |
| | | 131,543 | | | 4.50%, 03/01/2038 | | | 137,749 | |
| | | | | | | | | | |
| Shares or Principal Amount | | Market Value† | |
|
| U.S. GOVERNMENT AGENCIES - 0.9% - (continued) | |
| | | | | | FNMA - 0.1% - (continued) | |
| $ | | | 73,243 | | | 4.50%, 11/01/2039 | | $ | 76,692 | |
| | | 46,090 | | | 4.50%, 04/01/2040 | | | 48,276 | |
| | | 114,272 | | | 4.50%, 08/01/2040 | | | 119,693 | |
| | | 41,533 | | | 4.50%, 02/01/2041 | | | 43,504 | |
| | | 562,818 | | | 4.50%, 04/01/2041 | | | 589,517 | |
| | | 349,277 | | | 4.50%, 06/01/2041 | | | 365,846 | |
| | | 486,165 | | | 4.50%, 07/01/2041 | | | 509,005 | |
| | | 178,892 | | | 4.50%, 09/01/2041 | | | 187,048 | |
| | | 71,974 | | | 4.50%, 07/01/2044 | | | 74,578 | |
| | | 38 | | | 5.00%, 02/01/2019 | | | 39 | |
| | | 2,281 | | | 5.00%, 04/01/2019 | | | 2,321 | |
| | | | | | | | | | |
| | | | | | 3,137,090 | |
| | | | | | | |
| | | | | | GNMA - 0.2% | |
| | | 88,703 | | | 5.00%, 07/15/2037 | | | 93,999 | |
| | | 11,612 | | | 6.00%, 06/15/2024 | | | 12,458 | |
| | | 5,282 | | | 6.00%, 07/15/2026 | | | 5,667 | |
| | | 5,473 | | | 6.00%, 01/15/2028 | | | 5,871 | |
| | | 1,883 | | | 6.00%, 03/15/2028 | | | 2,020 | |
| | | 47,246 | | | 6.00%, 04/15/2028 | | | 50,744 | |
| | | 71,810 | | | 6.00%, 05/15/2028 | | | 77,041 | |
| | | 19,071 | | | 6.00%, 06/15/2028 | | | 20,461 | |
| | | 45,244 | | | 6.00%, 07/15/2028 | | | 48,540 | |
| | | 17,147 | | | 6.00%, 08/15/2028 | | | 18,395 | |
| | | 45,088 | | | 6.00%, 09/15/2028 | | | 48,373 | |
| | | 99,083 | | | 6.00%, 10/15/2028 | | | 106,301 | |
| | | 99,303 | | | 6.00%, 11/15/2028 | | | 106,537 | |
| | | 104,562 | | | 6.00%, 12/15/2028 | | | 112,180 | |
| | | 2,605 | | | 6.00%, 12/15/2031 | | | 2,854 | |
| | | 24,536 | | | 6.00%, 09/15/2032 | | | 26,991 | |
| | | 9,038 | | | 6.00%, 11/15/2032 | | | 9,944 | |
| | | 1,970 | | | 6.00%, 04/15/2033 | | | 2,113 | |
| | | 87,127 | | | 6.00%, 06/15/2033 | | | 94,420 | |
| | | 33,837 | | | 6.00%, 10/15/2033 | | | 36,801 | |
| | | 4,528 | | | 6.00%, 11/15/2033 | | | 4,924 | |
| | | 61,267 | | | 6.00%, 10/15/2034 | | | 65,856 | |
| | | 58,114 | | | 6.00%, 01/15/2035 | | | 62,348 | |
| | | 7,301 | | | 6.00%, 05/15/2035 | | | 7,832 | |
| | | 11,444 | | | 6.00%, 06/15/2035 | | | 12,279 | |
| | | 531 | | | 6.50%, 03/15/2026 | | | 571 | |
| | | 4,584 | | | 6.50%, 01/15/2028 | | | 4,937 | |
| | | 45,222 | | | 6.50%, 03/15/2028 | | | 48,701 | |
| | | 108,725 | | | 6.50%, 04/15/2028 | | | 117,089 | |
| | | 31,052 | | | 6.50%, 05/15/2028 | | | 33,442 | |
| | | 168,874 | | | 6.50%, 06/15/2028 | | | 181,864 | |
| | | 6,685 | | | 6.50%, 10/15/2028 | | | 7,199 | |
| | | 2,883 | | | 6.50%, 02/15/2035 | | | 3,222 | |
| | | 17,177 | | | 7.00%, 11/15/2031 | | | 18,860 | |
| | | 8,621 | | | 7.00%, 03/15/2032 | | | 9,486 | |
| | | 1,149,606 | | | 7.00%, 11/15/2032 | | | 1,333,383 | |
| | | 156,704 | | | 7.00%, 01/15/2033 | | | 178,564 | |
| | | 166,537 | | | 7.00%, 05/15/2033 | | | 188,945 | |
| | | 30,421 | | | 7.00%, 07/15/2033 | | | 34,218 | |
| | | 198,573 | | | 7.00%, 11/15/2033 | | | 225,462 | |
| | | 79,426 | | | 7.50%, 09/16/2035 | | | 88,429 | |
| | | 164 | | | 8.00%, 09/15/2026 | | | 176 | |
| | | 100 | | | 8.00%, 11/15/2026 | | | 104 | |
| | | 8,987 | | | 8.00%, 12/15/2026 | | | 10,098 | |
| | | 134 | | | 8.00%, 09/15/2027 | | | 137 | |
| | | 5,977 | | | 8.00%, 07/15/2029 | | | 6,846 | |
| | | 2,584 | | | 8.00%, 11/15/2029 | | | 2,588 | |
| | | 13,149 | | | 8.00%, 12/15/2029 | | | 13,612 | |
| | | 4,095 | | | 8.00%, 01/15/2030 | | | 4,181 | |
| | | 5,743 | | | 8.00%, 02/15/2030 | | | 5,853 | |
| | | 879 | | | 8.00%, 03/15/2030 | | | 888 | |
| | | 22,126 | | | 8.00%, 04/15/2030 | | | 22,297 | |
The accompanying notes are an integral part of these financial statements.
|
| Hartford Balanced HLS Fund |
Schedule of Investments – (continued)
December 31, 2018
| | | | | | | | | | |
| Shares or Principal Amount | | Market Value† | |
|
| U.S. GOVERNMENT AGENCIES - 0.9% - (continued) | |
| | | | | | GNMA - 0.2% - (continued) | |
| $ | | | 5,215 | | | 8.00%, 05/15/2030 | | $ | 5,364 | |
| | | 38,125 | | | 8.00%, 06/15/2030 | | | 40,023 | |
| | | 2,209 | | | 8.00%, 07/15/2030 | | | 2,289 | |
| | | 68,079 | | | 8.00%, 08/15/2030 | | | 69,481 | |
| | | 15,600 | | | 8.00%, 09/15/2030 | | | 15,922 | |
| | | 7,953 | | | 8.00%, 11/15/2030 | | | 8,046 | |
| | | 127,977 | | | 8.00%, 12/15/2030 | | | 140,433 | |
| | | 251 | | | 8.00%, 02/15/2031 | | | 260 | |
| | | 3,171 | | | 9.00%, 06/15/2022 | | | 3,195 | |
| | | | | | | | | | |
| | | | | | 3,861,114 | |
| | | | | | | |
| | | | | | 18,060,971 | |
| | | | | | | |
| | | |
| | | | | | Total U.S. Government Agencies
(cost $17,686,323) | | $ | 18,060,971 | |
| | | | | | | | | | |
|
| U.S. GOVERNMENT SECURITIES - 8.4% | |
| | | | | | U.S. Treasury Securities - 8.4% | |
| | | | | | U.S. Treasury Bonds - 4.2% | |
| | | 19,450,000 | | | 2.50%, 02/15/2045(9) | | $ | 17,626,562 | |
| | | 2,280,000 | | | 2.50%, 05/15/2046 | | | 2,056,186 | |
| | | 1,905,000 | | | 2.75%, 08/15/2047 | | | 1,804,169 | |
| | | 6,964,000 | | | 2.75%, 11/15/2047 | | | 6,589,413 | |
| | | 10,450,800 | | | 2.88%, 05/15/2043 | | | 10,202,185 | |
| | | 925,000 | | | 3.00%, 02/15/2048 | | | 920,050 | |
| | | 1,265,000 | | | 3.00%, 08/15/2048 | | | 1,259,021 | |
| | | 8,195,000 | | | 3.13%, 08/15/2044 | | | 8,365,622 | |
| | | 2,260,000 | | | 3.13%, 05/15/2048 | | | 2,302,905 | |
| | | 4,630,000 | | | 3.38%, 05/15/2044 | | | 4,931,312 | |
| | | 21,300,000 | | | 4.38%, 02/15/2038 | | | 26,091,668 | |
| | | | | | | | | | |
| | | | | | 82,149,093 | |
| | | | | | | |
| | | | | | U.S. Treasury Notes - 4.2% | |
| | | 23,370,480 | | | 0.38%, 01/15/2027(10) | | | 22,198,000 | |
| | | 7,960,367 | | | 0.50%, 01/15/2028(10) | | | 7,596,761 | |
| | | 18,125,000 | | | 1.50%, 03/31/2023 | | | 17,398,584 | |
| | | 405,000 | | | 2.13%, 12/31/2022 | | | 399,289 | |
| | | 8,730,000 | | | 2.63%, 06/30/2023 | | | 8,775,355 | |
| | | 20,550,000 | | | 2.75%, 09/30/2020 | | | 20,627,062 | |
| | | 1,900,000 | | | 2.75%, 05/31/2023 | | | 1,920,707 | |
| | | 870,000 | | | 2.88%, 10/31/2020 | | | 875,438 | |
| | | 185,000 | | | 2.88%, 09/30/2023 | | | 188,006 | |
| | | 525,000 | | | 2.88%, 05/15/2028 | | | 533,060 | |
| | | | | | | | | | |
| | | | | | 80,512,262 | |
| | | | | | | |
| | | | | | 162,661,355 | |
| | | | | | | |
| | | |
| | | | | | Total U.S. Government Securities
(cost $159,112,298) | | $ | 162,661,355 | |
| | | | | | | | | | |
| | | |
| | | | | | Total Long-Term Investments
(cost $1,721,290,698) | | $ | 1,912,128,368 | |
| | | | | | | | | | |
|
| SHORT-TERM INVESTMENTS - 1.6% | |
| | | | | | Other Investment Pools & Funds - 0.6% | |
| | | 11,514,884 | | | Morgan Stanley Institutional Liquidity Funds, Government Portfolio, Institutional Class, 2.50%(11) | | $ | 11,514,884 | |
| | | | | | | | | | |
| | | | | | Securities Lending Collateral - 0.2% | |
| | | 225,285 | | | Citibank NA DDCA, 2.39%, 1/2/2019(11) | | | 225,285 | |
| | | 2,977,066 | | | Fidelity Investments Money Market Funds, Government Portfolio, Institutional Class, 2.35%(11) | | | 2,977,066 | |
| | | 213,539 | | | Goldman Sachs Financial Square Funds, Government Fund, Institutional Class, 2.30%(11) | | | 213,539 | |
| | | | | | | | | | |
| Shares or Principal Amount | | Market Value† | |
|
| SHORT-TERM INVESTMENTS - 1.6% - (continued) | |
| | | | | | Securities Lending Collateral - 0.2% - (continued) | |
| | | 155,714 | | | Invesco Government & Agency Portfolio, Institutional Class, 2.30%(11) | | $ | 155,714 | |
| | | 866,805 | | | Morgan Stanley Institutional Liquidity Funds, Government Portfolio, Institutional Class, 2.50%(11) | | | 866,805 | |
| | | 67,288 | | | Western Asset Institutional Government Reserves Fund, Institutional Class, 2.28%(11) | | | 67,288 | |
| | | | | | | | | | |
| | | | | | 4,505,697 | |
| | | | | | | |
| | | | | | U.S. Treasury Bills - 0.8% | |
| | | 9,400,000 | | | 2.35%, 02/19/2019(12) | | | 9,369,933 | |
| | | 7,000,000 | | | 2.36%, 02/19/2019(12) | | | 6,977,486 | |
| | | | | | | | | | |
| | | | | | | | | 16,347,419 | |
| | | | | | | | | | |
| | | |
| | | | | | Total Short-Term Investments
(cost $32,368,000) | | $ | 32,368,000 | |
| | | | | | | | | | |
| | | | | | | | | | | | | | |
| | | | |
| | | | | | Total Investments
(cost $1,753,658,698) | | | 99.8 | % | | $ | 1,944,496,368 | |
| | | | | | Other Assets and Liabilities | | | 0.2 | % | | | 3,053,010 | |
| | | | | | | | | | | | | | |
| | | | | | Total Net Assets | | | 100.0 | % | | $ | 1,947,549,378 | |
| | | | | | | | | | | | | | |
| Note: | Percentage of investments as shown is the ratio of the total market value to total net assets. |
| | Prices of foreign equities that are principally traded on certain foreign markets will generally be adjusted daily pursuant to a fair value pricing service approved by the Board of Directors in order to reflect an adjustment for factors occurring after the close of certain foreign markets but before the close of the New York Stock Exchange. |
| | The Fund may refer to any one or more of the industry classifications used by one or more widely recognized market indices, ratings group and/or as defined by Fund management. Industry classifications may not be identical across all security types. |
| | Equity industry classifications used in this report are the Global Industry Classification Standard, which was developed by and is the exclusive property and service mark of MSCI, Inc. and Standard & Poor’s. |
| | For Fund compliance purposes, the Fund may not use the same classification system. These classifications are used for financial reporting purposes. |
| (1) | Investment valued using significant unobservable inputs. |
| (2) | These securities are valued in good faith at fair value as determined under policies and procedures established by and under the supervision of the Board of Directors. At December 31, 2018, the aggregate fair value of these securities was $6,189,036, which represented 0.3% of total net assets. This amount excludes securities that are principally traded in certain foreign markets and whose prices are adjusted pursuant to a third party pricing service methodology approved by the Board of Directors. |
| (3) | Investment in securities not registered under the Securities Act of 1933 (excluding securities acquired pursuant to Rule 144A and Regulation S). At the end of the period, the value of such restricted securities amounted to $6,189,036 or 0.3% of net assets. |
| | | | | | | | | | | | | | | | |
Period
Acquired | | | Security Name | | Shares/
Par Value | | | Base
Total Cost | | | Base
Market Value | |
| | 08/2011 | | | Allstar Co. | | | 11,702,200 | | | $ | 5,090,681 | | | $ | 2,457,462 | |
| | 11/2013 | | | Tory Burch LLC | | | 67,006 | | | | 5,251,707 | | | | 3,731,574 | |
| | | | | | | | | | | | | | | | |
| | | | | | | | | | $ | 10,342,388 | | | $ | 6,189,036 | |
| | | | | | | | | | | | | | | | |
The accompanying notes are an integral part of these financial statements.
|
| Hartford Balanced HLS Fund |
Schedule of Investments – (continued)
December 31, 2018
| (4) | Variable rate securities; the rate reported is the coupon rate in effect at December 31, 2018. |
| (5) | Variable or floating rate security, for which interest rate adjusts periodically based on changes in current interest rates and prepayments on the underlying pool of assets. Rate shown is the rate in effect as of period end. |
| (6) | Security is a“step-up” bond where coupon increases or steps up at a predetermined date. Rate shown is current coupon rate. |
| (7) | Represents entire or partial securities on loan. See Note 8 in the accompanying Notes to Financial Statements for securities lending information. |
| (8) | Perpetual maturity security. Maturity date shown is the next call date or final legal maturity date, whichever comes first. |
| (9) | This security, or a portion of this security, has been pledged as collateral in connection with futures contracts. |
| (10) | The principal amount for these securities are adjusted for inflation and the interest payments equal a fixed percentage of the inflation-adjusted principal amount. |
| (11) | Current yield as of period end. |
| (12) | The rate shown represents current yield to maturity. |
| | | | | | | | | | | | | | | | |
| Futures Contracts Outstanding at December 31, 2018 | |
Description | | Number of
Contracts | | | Expiration
Date | | | Current
Notional
Amount | | | Value and
Unrealized
Appreciation/
(Depreciation) | |
| Long position contracts: | |
U.S. Treasury2-Year Note Future | | | 60 | | | | 03/29/2019 | | | $ | 12,738,750 | | | $ | 82,235 | |
U.S. Treasury5-Year Note Future | | | 97 | | | | 03/29/2019 | | | | 11,124,688 | | | | 181,231 | |
| | | | | | | | | | | | | | | | |
Total | | | $ | 263,466 | |
| | | | | | | | | | | | | | | | |
| Short position contracts: | |
U.S. Treasury10-Year Ultra Future | | | 21 | | | | 03/20/2019 | | | $ | 2,731,641 | | | $ | (85,351 | ) |
| | | | | | | | | | | | | | | | |
Total futures contracts | | | $ | 178,115 | |
| | | | | | | | | | | | | | | | |
| † | See Significant Accounting Policies of accompanying Notes to Financial Statements regarding valuation of investments. |
| | |
| GLOSSARY: (abbreviations used in preceding Schedule of Investments) |
|
| Index Abbreviations: |
CMT | | Constant Maturity Treasury Index |
|
| Other Abbreviations: |
ADR | | American Depositary Receipt |
CLO | | Collateralized Loan Obligation |
CMO | | Collateralized Mortgage Obligation |
DDCA | | Dollars on Deposit in Custody Account |
FHLMC | | Federal Home Loan Mortgage Corp. |
| | |
|
| Other Abbreviations: – (continued) |
FNMA | | Federal National Mortgage Association |
GNMA | | Government National Mortgage Association |
LIBOR | | London Interbank Offered Rate |
REIT | | Real Estate Investment Trust |
|
| Municipal Abbreviations: |
Auth | | Authority |
FA | | Finance Authority |
GO | | General Obligation |
PA | | Port Authority |
Rev | | Revenue |
The accompanying notes are an integral part of these financial statements.
|
| Hartford Balanced HLS Fund |
Schedule of Investments – (continued)
December 31, 2018
Fair Valuation Summary
The following is a summary of the fair valuations according to the inputs used as of December 31, 2018 in valuing the Fund’s investments.
| | | | | | | | | | | | | | | | |
Description | | Total | | | Level 1 | | | Level 2 | | | Level 3(1) | |
Assets | |
Common Stocks | |
Banks | | $ | 120,214,614 | | | $ | 120,214,614 | | | $ | — | | | $ | — | |
Capital Goods | | | 96,427,403 | | | | 96,427,403 | | | | — | | | | — | |
Consumer Durables & Apparel | | | 10,517,573 | | | | 10,517,573 | | | | — | | | | — | |
Consumer Services | | | 14,633,989 | | | | 14,633,989 | | | | — | | | | — | |
Diversified Financials | | | 9,718,072 | | | | 9,718,072 | | | | — | | | | — | |
Energy | | | 77,838,780 | | | | 77,838,780 | | | | — | | | | — | |
Food & Staples Retailing | | | 16,350,286 | | | | 16,350,286 | | | | — | | | | — | |
Food, Beverage & Tobacco | | | 43,474,184 | | | | 43,474,184 | | | | — | | | | — | |
Health Care Equipment & Services | | | 106,533,808 | | | | 93,448,555 | | | | 13,085,253 | | | | — | |
Household & Personal Products | | | 14,508,784 | | | | 14,508,784 | | | | — | | | | — | |
Insurance | | | 46,853,044 | | | | 46,853,044 | | | | — | | | | — | |
Materials | | | 47,855,752 | | | | 47,855,752 | | | | — | | | | — | |
Media & Entertainment | | | 104,178,918 | | | | 104,178,918 | | | | — | | | | — | |
Pharmaceuticals, Biotechnology & Life Sciences | | | 138,909,441 | | | | 96,408,939 | | | | 42,500,502 | | | | — | |
Real Estate | | | 19,337,226 | | | | 19,337,226 | | | | — | | | | — | |
Retailing | | | 79,312,392 | | | | 73,123,356 | | | | — | | | | 6,189,036 | |
Semiconductors & Semiconductor Equipment | | | 104,634,095 | | | | 104,634,095 | | | | — | | | | — | |
Software & Services | | | 61,089,276 | | | | 61,089,276 | | | | — | | | | — | |
Technology Hardware & Equipment | | | 73,101,821 | | | | 54,716,032 | | | | 18,385,789 | | | | — | |
Telecommunication Services | | | 30,832,172 | | | | 30,832,172 | | | | — | | | | — | |
Transportation | | | 21,121,544 | | | | 21,121,544 | | | | — | | | | — | |
Utilities | | | 31,094,278 | | | | 31,094,278 | | | | — | | | | — | |
Asset & Commercial Mortgage Backed Securities | | | 72,711,874 | | | | — | | | | 72,711,874 | | | | — | |
Corporate Bonds | | | 358,227,981 | | | | — | | | | 358,227,981 | | | | — | |
Foreign Government Obligations | | | 10,516,805 | | | | — | | | | 10,516,805 | | | | — | |
Municipal Bonds | | | 21,411,930 | | | | — | | | | 21,411,930 | | | | — | |
U.S. Government Agencies | | | 18,060,971 | | | | — | | | | 18,060,971 | | | | — | |
U.S. Government Securities | | | 162,661,355 | | | | — | | | | 162,661,355 | | | | — | |
Short-Term Investments | | | 32,368,000 | | | | 16,020,581 | | | | 16,347,419 | | | | — | |
Futures Contracts(2) | | | 263,466 | | | | 263,466 | | | | — | | | | — | |
| | | | | | | | | | | | | | | | |
Total | | $ | 1,944,759,834 | | | $ | 1,204,660,919 | | | $ | 733,909,879 | | | $ | 6,189,036 | |
| | | | | | | | | | | | | | | | |
Liabilities | |
Futures Contracts(2) | | $ | (85,351 | ) | | $ | (85,351 | ) | | $ | — | | | $ | — | |
| | | | | | | | | | | | | | | | |
Total | | $ | (85,351 | ) | | $ | (85,351 | ) | | $ | — | | | $ | — | |
| | | | | | | | | | | | | | | | |
| (1) | For the year ended December 31, 2018, there were no transfers in and out of Level 3. |
| (2) | Derivative instruments (excluding purchased and written options, if applicable) are valued at the unrealized appreciation/(depreciation) on the investments. |
Level 3 investments at the beginning and/or end of the period in relation to net assets were not significant and accordingly, a reconciliation of Level 3 assets for the period ended December 31, 2018 is not presented.
The accompanying notes are an integral part of these financial statements.
|
| Hartford Capital Appreciation HLS Fund |
Schedule of Investments
December 31, 2018
| | | | | | | | |
| Shares or Principal Amount | | Market Value† | |
| COMMON STOCKS - 97.2% | |
| | | | Automobiles & Components - 0.9% | |
| | 85,395 | | | Ferrari N.V. | | $ | 8,497,146 | |
| | 392,459 | | | General Motors Co. | | | 13,127,753 | |
| | 17,857 | | | Tesla, Inc.* | | | 5,942,810 | |
| | 263,112 | | | Valeo S.A. | | | 7,673,815 | |
| | | | | | | | |
| | | | 35,241,524 | |
| | | | | |
| | | | Banks - 3.3% | |
| | 516,126 | | | Bank OZK | | | 11,783,157 | |
| | 517,691 | | | Citigroup, Inc. | | | 26,950,993 | |
| | 97,304 | | | First Republic Bank | | | 8,455,718 | |
| | 94,967 | | | HDFC Bank Ltd. ADR | | | 9,837,631 | |
| | 17,247 | | | HDFC Bank Ltd. | | | 524,142 | |
| | 587,789 | | | KeyCorp. | | | 8,687,521 | |
| | 517,853 | | | People’s United Financial, Inc. | | | 7,472,619 | |
| | 434,427 | | | PNC Financial Services Group, Inc. | | | 50,788,860 | |
| | 284,011 | | | Sumitomo Mitsui Financial Group, Inc. | | | 9,362,440 | |
| | | | | | | | |
| | | | 133,863,081 | |
| | | | | |
| | | | Capital Goods - 5.2% | |
| | 110,578 | | | 3M Co. | | | 21,069,532 | |
| | 220,107 | | | AerCap Holdings N.V.* | | | 8,716,237 | |
| | 81,197 | | | Airbus SE | | | 7,741,301 | |
| | 274,700 | | | Fortune Brands Home & Security, Inc. | | | 10,435,853 | |
| | 206,325 | | | General Dynamics Corp. | | | 32,436,353 | |
| | 60,113 | | | Harris Corp. | | | 8,094,216 | |
| | 350,600 | | | Harry’s, Inc.(1)(2)(3) | | | 4,641,944 | |
| | 35,081 | | | IDEX Corp. | | | 4,429,327 | |
| | 158,587 | | | Ingersoll-Rand plc | | | 14,467,892 | |
| | 341,900 | | | Johnson Controls International plc | | | 10,137,335 | |
| | 64,102 | | | L3 Technologies, Inc. | | | 11,131,953 | |
| | 103,978 | | | Lockheed Martin Corp. | | | 27,225,600 | |
| | 47,600 | | | Middleby Corp.* | | | 4,889,948 | |
| | 23,936 | | | Roper Technologies, Inc. | | | 6,379,423 | |
| | 103,705 | | | Safran S.A. | | | 12,437,850 | |
| | 1,031,730 | | | Sanwa Holdings Corp. | | | 11,714,166 | |
| | 175,467 | | | Xylem, Inc. | | | 11,707,158 | |
| | | | | | | | |
| | | | 207,656,088 | |
| | | | | |
| | | | Commercial & Professional Services - 3.2% | |
| | 81,087 | | | CoStar Group, Inc.* | | | 27,353,888 | |
| | 71,209 | | | Equifax, Inc. | | | 6,631,694 | |
| | 360,459 | | | Herman Miller, Inc. | | | 10,903,885 | |
| | 230,363 | | | IHS Markit Ltd.* | | | 11,050,513 | |
| | 106,668 | | | Intertek Group plc | | | 6,528,382 | |
| | 290,229 | | | Republic Services, Inc. | | | 20,922,609 | |
| | 963,441 | | | Steelcase, Inc. Class A | | | 14,287,830 | |
| | 257,897 | | | TransUnion | | | 14,648,549 | |
| | 5,700 | | | Upwork, Inc.*(4) | | | 103,227 | |
| | 197,015 | | | Waste Connections, Inc. | | | 14,628,364 | |
| | | | | | | | |
| | | | 127,058,941 | |
| | | | | |
| | | | Consumer Durables & Apparel - 2.3% | |
| | 559,868 | | | Newell Brands, Inc. | | | 10,407,946 | |
| | 620,758 | | | NIKE, Inc. Class B | | | 46,022,998 | |
| | 61,932 | | | Polaris Industries, Inc. | | | 4,748,946 | |
| | 506,259 | | | Skechers USA, Inc. Class A* | | | 11,588,269 | |
| | 143,727 | | | Sony Corp. | | | 6,929,024 | |
| | 216,647 | | | Tapestry, Inc. | | | 7,311,836 | |
| | 69,234 | | | Under Armour, Inc. Class A* | | | 1,223,365 | |
| | 205,654 | | | Under Armour, Inc. Class C*(4) | | | 3,325,425 | |
| | | | | | | | |
| | | | 91,557,809 | |
| | | | | |
| | | | Consumer Services - 2.9% | |
| | 42,274 | | | Domino’s Pizza, Inc. | | | 10,483,529 | |
| | 514,432 | | | DraftKings, Inc.*(1)(2)(3) | | | 1,311,575 | |
| | 62,426 | | | Grand Canyon Education, Inc.* | | | 6,001,636 | |
| | 140,368 | | | Hilton Grand Vacations, Inc.* | | | 3,704,311 | |
| | | | | | | | |
| Shares or Principal Amount | | Market Value† | |
| COMMON STOCKS - 97.2% - (continued) | |
| | | | Consumer Services - 2.9% - (continued) | |
| | 78,688 | | | Marriott Vacations Worldwide Corp. | | $ | 5,548,291 | |
| | 272,791 | | | McDonald’s Corp. | | | 48,439,498 | |
| | 324,881 | | | Melco Resorts & Entertainment Ltd. ADR | | | 5,724,403 | |
| | 123,860 | | | New Oriental Education & Technology Group, Inc. ADR* | | | 6,788,767 | |
| | 128,410 | | | Norwegian Cruise Line Holdings Ltd.* | | | 5,443,300 | |
| | 131,921 | | | Planet Fitness, Inc. Class A* | | | 7,073,604 | |
| | 84,354 | | | Royal Caribbean Cruises Ltd. | | | 8,248,978 | |
| | 44,131 | | | Vail Resorts, Inc. | | | 9,303,697 | |
| | | | | | | | |
| | | | 118,071,589 | |
| | | | | |
| | | | Diversified Financials - 3.1% | |
| | 496,581 | | | American Express Co. | | | 47,334,101 | |
| | 191,885 | | | Intercontinental Exchange, Inc. | | | 14,454,697 | |
| | 1,502,670 | | | SLM Corp.* | | | 12,487,188 | |
| | 719,540 | | | TD Ameritrade Holding Corp. | | | 35,228,678 | |
| | 334,443 | | | UBS Group AG* | | | 4,171,588 | |
| | 228,000 | | | Voya Financial, Inc. | | | 9,151,920 | |
| | | | | | | | |
| | | | 122,828,172 | |
| | | | | |
| | | | Energy - 3.9% | |
| | 125,303 | | | Anadarko Petroleum Corp. | | | 5,493,284 | |
| | 733,717 | | | Canadian Natural Resources Ltd. | | | 17,704,591 | |
| | 199,300 | | | Chevron Corp. | | | 21,681,847 | |
| | 202,315 | | | Cimarex Energy Co. | | | 12,472,720 | |
| | 101,865 | | | Concho Resources, Inc.* | | | 10,470,703 | |
| | 143,481 | | | Diamondback Energy, Inc. | | | 13,300,689 | |
| | 490,900 | | | Enbridge, Inc. | | | 15,257,172 | |
| | 694,090 | | | Encana Corp. | | | 4,006,321 | |
| | 146,329 | | | EOG Resources, Inc. | | | 12,761,352 | |
| | 382,406 | | | Halliburton Co. | | | 10,164,352 | |
| | 942,062 | | | Laredo Petroleum, Inc.* | | | 3,410,264 | |
| | 534,763 | | | Marathon Oil Corp. | | | 7,668,501 | |
| | 364,540 | | | Tenaris S.A. ADR | | | 7,771,993 | |
| | 241,801 | | | TOTAL S.A. | | | 12,753,820 | |
| | | | | | | | |
| | | | 154,917,609 | |
| | | | | |
| | | | Food & Staples Retailing - 1.6% | |
| | 97,920 | | | Costco Wholesale Corp. | | | 19,947,283 | |
| | 298,535 | | | Kroger Co. | | | 8,209,713 | |
| | 313,701 | | | Walgreens Boots Alliance, Inc. | | | 21,435,189 | |
| | 179,729 | | | Walmart, Inc. | | | 16,741,756 | |
| | | | | | | | |
| | | | 66,333,941 | |
| | | | | |
| | | | Food, Beverage & Tobacco - 6.0% | |
| | 352,529 | | | Altria Group, Inc. | | | 17,411,407 | |
| | 212,871 | | | Archer-Daniels-Midland Co. | | | 8,721,325 | |
| | 336,841 | | | British American Tobacco plc | | | 10,717,948 | |
| | 981,842 | | | Coca-Cola Co. | | | 46,490,219 | |
| | 1,168,756 | | | Diageo plc | | | 41,764,790 | |
| | 83,626 | | | Hershey Co. | | | 8,963,035 | |
| | 158,486 | | | Lamb Weston Holdings, Inc. | | | 11,658,230 | |
| | 566,029 | | | Monster Beverage Corp.* | | | 27,859,947 | |
| | 393,049 | | | PepsiCo., Inc. | | | 43,424,054 | |
| | 233,001 | | | Philip Morris International, Inc. | | | 15,555,147 | |
| | 706,938 | | | Treasury Wine Estates Ltd. | | | 7,371,798 | |
| | | | | | | | |
| | | | 239,937,900 | |
| | | | | |
| | | | Health Care Equipment & Services - 8.2% | |
| | 66,938 | | | Align Technology, Inc.* | | | 14,018,825 | |
| | 227,470 | | | Baxter International, Inc. | | | 14,972,075 | |
| | 96,221 | | | Becton Dickinson and Co. | | | 21,680,516 | |
| | 329,300 | | | CVS Health Corp. | | | 21,575,736 | |
| | 381,210 | | | Danaher Corp. | | | 39,310,375 | |
| | 73,422 | | | DexCom, Inc.* | | | 8,795,956 | |
| | 64,109 | | | Edwards Lifesciences Corp.* | | | 9,819,575 | |
| | 109,541 | | | Haemonetics Corp.* | | | 10,959,577 | |
The accompanying notes are an integral part of these financial statements.
|
| Hartford Capital Appreciation HLS Fund |
Schedule of Investments – (continued)
December 31, 2018
| | | | | | | | |
| Shares or Principal Amount | | Market Value† | |
| COMMON STOCKS - 97.2% - (continued) | |
| | | | Health Care Equipment & Services - 8.2% - (continued) | |
| | 91,639 | | | Insulet Corp.* | | $ | 7,268,805 | |
| | 434,278 | | | Koninklijke Philips N.V. ADR | | | 15,247,501 | |
| | 235,879 | | | Koninklijke Philips N.V. | | | 8,269,797 | |
| | 126,802 | | | McKesson Corp. | | | 14,007,817 | |
| | 618,134 | | | Medtronic plc | | | 56,225,469 | |
| | 47,915 | | | Penumbra, Inc.* | | | 5,855,213 | |
| | 126,821 | | | Stryker Corp. | | | 19,879,192 | |
| | 62,883 | | | Teleflex, Inc. | | | 16,253,998 | |
| | 127,477 | | | UnitedHealth Group, Inc. | | | 31,757,070 | |
| | 50,607 | | | WellCare Health Plans, Inc.* | | | 11,947,807 | |
| | | | | | | | |
| | | | 327,845,304 | |
| | | | | |
| | | | Household & Personal Products - 1.0% | |
| | 593,818 | | | Colgate-Palmolive Co. | | | 35,344,047 | |
| | 736,971 | | | Coty, Inc. Class A | | | 4,834,530 | |
| | | | | | | | |
| | | | 40,178,577 | |
| | | | | |
| | | | Insurance - 5.5% | |
| | 379,750 | | | Aflac, Inc. | | | 17,301,410 | |
| | 457,250 | | | American International Group, Inc. | | | 18,020,223 | |
| | 317,873 | | | Chubb Ltd. | | | 41,062,834 | |
| | 585,800 | | | CNO Financial Group, Inc. | | | 8,716,704 | |
| | 228,649 | | | Fidelity National Financial, Inc. | | | 7,188,725 | |
| | 905,877 | | | Lancashire Holdings Ltd. | | | 6,990,628 | |
| | 144,030 | | | Lincoln National Corp. | | | 7,390,179 | |
| | 340,187 | | | Marsh & McLennan Cos., Inc. | | | 27,129,913 | |
| | 840,763 | | | MetLife, Inc. | | | 34,521,729 | |
| | 959,111 | | | Ping An Insurance Group Co. of China Ltd. Class H(4) | | | 8,461,291 | |
| | 90,996 | | | RenaissanceRe Holdings Ltd. | | | 12,166,165 | |
| | 226,313 | | | Tokio Marine Holdings, Inc. | | | 10,751,837 | |
| | 744,401 | | | Unum Group | | | 21,870,501 | |
| | | | | | | | |
| | | | 221,572,139 | |
| | | | | |
| | | | Materials - 3.6% | |
| | 286,900 | | | Alcoa Corp.* | | | 7,625,802 | |
| | 252,204 | | | Anglo American plc | | | 5,639,448 | |
| | 177,091 | | | Cabot Corp. | | | 7,604,288 | |
| | 222,299 | | | Celanese Corp. | | | 20,000,241 | |
| | 391,429 | | | CRH plc | | | 10,361,859 | |
| | 129,043 | | | Eastman Chemical Co. | | | 9,434,334 | |
| | 90,470 | | | FMC Corp. | | | 6,691,161 | |
| | 170,211 | | | Linde plc | | | 26,559,724 | |
| | 153,333 | | | Nucor Corp. | | | 7,944,183 | |
| | 146,062 | | | Nutrien Ltd. | | | 6,860,164 | |
| | 112,806 | | | Packaging Corp. of America | | | 9,414,789 | |
| | 282,270 | | | Reliance Steel & Aluminum Co. | | | 20,089,156 | |
| | 54,374 | | | Vulcan Materials Co. | | | 5,372,151 | |
| | | | | | | | |
| | | | 143,597,300 | |
| | | | | |
| | | | Media & Entertainment - 4.0% | |
| | 7,833 | | | Alphabet, Inc. Class C* | | | 8,111,933 | |
| | 10,949 | | | Alphabet, Inc. Class A* | | | 11,441,267 | |
| | 28,778 | | | Charter Communications, Inc. Class A* | | | 8,200,867 | |
| | 874,400 | | | Comcast Corp. Class A | | | 29,773,320 | |
| | 80,678 | | | Netflix, Inc.* | | | 21,594,274 | |
| | 203,714 | | | Spotify Technology S.A.* | | | 23,121,539 | |
| | 55,634 | | | Take-Two Interactive Software, Inc.* | | | 5,726,964 | |
| | 229,703 | | | Tencent Holdings Ltd. | | | 9,206,570 | |
| | 58,846 | | | TripAdvisor, Inc.* | | | 3,174,153 | |
| | 126,498 | | | Walt Disney Co. | | | 13,870,506 | |
| | 521,558 | | | Yandex N.V. Class A* | | | 14,264,611 | |
| | 187,664 | | | Zillow Group, Inc. Class C* | | | 5,926,429 | |
| | 156,621 | | | Zillow Group, Inc. Class A* | | | 4,922,598 | |
| | | | | | | | |
| | | | 159,335,031 | |
| | | | | |
| | | | Pharmaceuticals, Biotechnology & Life Sciences - 8.5% | |
| | 246,737 | | | Agilent Technologies, Inc. | | | 16,644,878 | |
| | 301,967 | | | Alkermes plc* | | | 8,911,046 | |
| | | | | | | | |
| Shares or Principal Amount | | Market Value† | |
| COMMON STOCKS - 97.2% - (continued) | |
| | | | Pharmaceuticals, Biotechnology &
Life Sciences - 8.5% - (continued) | |
| | 83,393 | | | Allergan plc | | $ | 11,146,308 | |
| | 194,023 | | | Alnylam Pharmaceuticals, Inc.* | | | 14,146,217 | |
| | 312,879 | | | Bausch Health Cos., Inc.* | | | 5,778,875 | |
| | 66,103 | | | BeiGene Ltd. ADR* | | | 9,271,607 | |
| | 39,445 | | | Biogen, Inc.* | | | 11,869,789 | |
| | 11,579 | | | Bluebird Bio, Inc.*(4) | | | 1,148,637 | |
| | 1,005,069 | | | Bristol-Myers Squibb Co. | | | 52,243,487 | |
| | 12,700 | | | Elanco Animal Health, Inc.* | | | 400,431 | |
| | 270,998 | | | Exact Sciences Corp.* | | | 17,099,974 | |
| | 125,641 | | | Five Prime Therapeutics, Inc.* | | | 1,168,461 | |
| | 7,400 | | | Galapagos N.V. ADR* | | | 678,876 | |
| | 52,057 | | | Galapagos N.V.* | | | 4,771,598 | |
| | 83,795 | | | Gilead Sciences, Inc. | | | 5,241,377 | |
| | 136,206 | | | Incyte Corp.* | | | 8,661,340 | |
| | 370,797 | | | Ionis Pharmaceuticals, Inc.* | | | 20,045,286 | |
| | 324,186 | | | Johnson & Johnson | | | 41,836,203 | |
| | 330,000 | | | Merck & Co., Inc. | | | 25,215,300 | |
| | 26,400 | | | Mettler-Toledo International, Inc.* | | | 14,931,312 | |
| | 518,307 | | | Mylan N.V.* | | | 14,201,612 | |
| | 629,144 | | | Pfizer, Inc. | | | 27,462,136 | |
| | 31,412 | | | Sage Therapeutics, Inc.* | | | 3,008,956 | |
| | 157,329 | | | Seattle Genetics, Inc.* | | | 8,914,261 | |
| | 209,655 | | | Teva Pharmaceutical Industries Ltd. ADR | | | 3,232,880 | |
| | 50,955 | | | Thermo Fisher Scientific, Inc. | | | 11,403,219 | |
| | | | | | | | |
| | | | 339,434,066 | |
| | | | | |
| | | | Real Estate - 5.6% | |
| | 350,200 | | | Acadia Realty Trust REIT | | | 8,320,752 | |
| | 347,337 | | | American Tower Corp. REIT | | | 54,945,240 | |
| | 90,809 | | | AvalonBay Communities, Inc. REIT | | | 15,805,306 | |
| | 668,664 | | | Brixmor Property Group, Inc. REIT | | | 9,822,674 | |
| | 517,800 | | | Columbia Property Trust, Inc. REIT | | | 10,019,430 | |
| | 61,049 | | | Crown Castle International Corp. REIT | | | 6,631,753 | |
| | 74,608 | | | Equinix, Inc. REIT | | | 26,303,796 | |
| | 1,062,847 | | | Host Hotels & Resorts, Inc. REIT | | | 17,717,660 | |
| | 417,600 | | | Mitsui Fudosan Co., Ltd. REIT | | | 9,275,690 | |
| | 186,529 | | | Public Storage REIT | | | 37,755,335 | |
| | 73,034 | | | Simon Property Group, Inc. REIT | | | 12,268,982 | |
| | 202,147 | | | Welltower, Inc. REIT | | | 14,031,023 | |
| | | | | | | | |
| | | | 222,897,641 | |
| | | | | |
| | | | Retailing - 6.6% | |
| | 165,334 | | | Alibaba Group Holding Ltd. ADR* | | | 22,662,331 | |
| | 8,451,700 | | | Allstar Co.*(1)(2)(3) | | | 1,774,857 | |
| | 30,429 | | | Amazon.com, Inc.* | | | 45,703,445 | |
| | 11,694 | | | Booking Holdings, Inc.* | | | 20,141,980 | |
| | 194,448 | | | CarMax, Inc.* | | | 12,197,723 | |
| | 295,706 | | | Delivery Hero SE*(5) | | | 11,039,881 | |
| | 208,362 | | | Expedia Group, Inc. | | | 23,471,979 | |
| | 198,686 | | | Floor & Decor Holdings, Inc. Class A* | | | 5,145,967 | |
| | 108,998 | | | Genuine Parts Co. | | | 10,465,988 | |
| | 136,486 | | | Home Depot, Inc. | | | 23,451,025 | |
| | 162,546 | | | Industria de Diseno Textil S.A. | | | 4,148,932 | |
| | 1,742,340 | | | Just Eat plc* | | | 13,029,708 | |
| | 85,700 | | | Lowe’s Cos., Inc. | | | 7,915,252 | |
| | 209,054 | | | Ross Stores, Inc. | | | 17,393,293 | |
| | 706,674 | | | TJX Cos., Inc. | | | 31,616,595 | |
| | 115,140 | | | Tory Burch LLC*(1)(2)(3) | | | 6,412,129 | |
| | 95,539 | | | Wayfair, Inc. Class A*(4) | | | 8,606,153 | |
| | | | | | | | |
| | | | 265,177,238 | |
| | | | | |
| | | | Semiconductors & Semiconductor Equipment - 2.1% | |
| | 363,491 | | | Advanced Micro Devices, Inc.* | | | 6,710,044 | |
| | 101,077 | | | Broadcom, Inc. | | | 25,701,859 | |
| | 153,172 | | | KLA-Tencor Corp. | | | 13,707,362 | |
| | 512,147 | | | Marvell Technology Group Ltd. | | | 8,291,660 | |
The accompanying notes are an integral part of these financial statements.
|
| Hartford Capital Appreciation HLS Fund |
Schedule of Investments – (continued)
December 31, 2018
| | | | | | | | |
| Shares or Principal Amount | | Market Value† | |
| COMMON STOCKS - 97.2% - (continued) | |
| | | | Semiconductors & Semiconductor Equipment - 2.1% - (continued) | |
| | 222,524 | | | QUALCOMM, Inc. | | $ | 12,663,841 | |
| | 1,532,190 | | | Taiwan Semiconductor Manufacturing Co., Ltd. | | | 11,125,583 | |
| | 82,853 | | | Teradyne, Inc. | | | 2,599,927 | |
| | 39,388 | | | Universal Display Corp.(4) | | | 3,685,535 | |
| | | | | | | | |
| | | | 84,485,811 | |
| | | | | |
| | | | Software & Services - 10.1% | |
| | 259,114 | | | 2U, Inc.* | | | 12,883,148 | |
| | 199,499 | | | Accenture plc Class A | | | 28,131,354 | |
| | 86,602 | | | Adobe, Inc.* | | | 19,592,836 | |
| | 222,822 | | | Amdocs Ltd. | | | 13,052,913 | |
| | 45,298 | | | Autodesk, Inc.* | | | 5,825,776 | |
| | 81,410 | | | FleetCor Technologies, Inc.* | | | 15,119,465 | |
| | 1,184,494 | | | Genpact Ltd. | | | 31,969,493 | |
| | 230,445 | | | Global Payments, Inc. | | | 23,765,793 | |
| | 89,430 | | | GoDaddy, Inc. Class A* | | | 5,868,397 | |
| | 247,692 | | | Guidewire Software, Inc.* | | | 19,872,329 | |
| | 420,550 | | | Microsoft Corp. | | | 42,715,263 | |
| | 277,259 | | | PayPal Holdings, Inc.* | | | 23,314,709 | |
| | 222,657 | | | salesforce.com, Inc.* | | | 30,497,329 | |
| | 185,553 | | | ServiceNow, Inc.* | | | 33,037,712 | |
| | 46,969 | | | Shopify, Inc. Class A* | | | 6,502,858 | |
| | 55,509 | | | Splunk, Inc.* | | | 5,820,119 | |
| | 122,256 | | | VeriSign, Inc.* | | | 18,129,342 | |
| | 209,556 | | | Visa, Inc. Class A | | | 27,648,819 | |
| | 56,665 | | | WEX, Inc.* | | | 7,936,500 | |
| | 183,284 | | | Workday, Inc. Class A* | | | 29,266,789 | |
| | 110,121 | | | Zuora, Inc. Class A* | | | 1,997,595 | |
| | | | | | | | |
| | | | 402,948,539 | |
| | | | | |
| | | | Technology Hardware & Equipment - 1.9% | |
| | 191,975 | | | CDW Corp. | | | 15,559,574 | |
| | 69,000 | | | Coherent, Inc.* | | | 7,293,990 | |
| | 476,316 | | | Flex Ltd.* | | | 3,624,765 | |
| | 144,765 | | | Logitech International S.A. | | | 4,570,850 | |
| | 236,486 | | | Samsung Electronics Co., Ltd. | | | 8,232,477 | |
| | 221,175 | | | TE Connectivity Ltd. | | | 16,727,465 | |
| | 363,580 | | | Western Digital Corp. | | | 13,441,552 | |
| | 43,007 | | | Zebra Technologies Corp. Class A* | | | 6,848,005 | |
| | | | | | | | |
| | | | 76,298,678 | |
| | | | | |
| | | | Telecommunication Services - 2.0% | |
| | 677,416 | | | AT&T, Inc. | | | 19,333,453 | |
| | 174,049 | | | T-Mobile US, Inc.* | | | 11,071,257 | |
| | 908,632 | | | Verizon Communications, Inc. | | | 51,083,291 | |
| | | | | | | | |
| | | | 81,488,001 | |
| | | | | |
| | | | Transportation - 3.5% | |
| | 588,576 | | | Canadian National Railway Co. | | | 43,591,356 | |
| | 99,919 | | | CSX Corp. | | | 6,207,967 | |
| | 198,581 | | | Delta Air Lines, Inc. | | | 9,909,192 | |
| | 174,430 | | | Expeditors International of Washington, Inc. | | | 11,876,939 | |
| | 363,972 | | | Southwest Airlines Co. | | | 16,917,419 | |
| | 242,978 | | | Union Pacific Corp. | | | 33,586,849 | |
| | 169,063 | | | United Parcel Service, Inc. Class B | | | 16,488,714 | |
| | | | | | | | |
| | | | 138,578,436 | |
| | | | | |
| | | | Utilities - 2.2% | |
| | 144,536 | | | Dominion Energy, Inc. | | | 10,328,543 | |
| | 130,818 | | | Edison International | | | 7,426,538 | |
| | 1,338,121 | | | Iberdrola S.A. | | | 10,744,949 | |
| | 462,977 | | | NRG Energy, Inc. | | | 18,333,889 | |
| | 303,741 | | | OGE Energy Corp. | | | 11,903,610 | |
| | 101,142 | | | Sempra Energy | | | 10,942,553 | |
| | 401,719 | | | Southern Co. | | | 17,643,498 | |
| | | | | | | | |
| | | | 87,323,580 | |
| | | | | |
| | |
| | | | Total Common Stocks
(cost $4,083,621,319) | | $ | 3,888,626,995 | |
| | | | | | | | |
| | | | | | | | |
| Shares or Principal Amount | | Market Value† | |
| PREFERRED STOCKS - 1.1% | |
| | | | Consumer Services - 0.0% | |
| | 16,619 | | | Airbnb, Inc. Series E*(1)(2)(3) | | $ | 1,821,110 | |
| | | | | | | | |
| | | | Diversified Financials - 0.0% | |
| | 85,350 | | | Social Finance, Inc. Series F*(1)(2)(3) | | | 1,387,791 | |
| | | | | | | | |
| | | | Software & Services - 1.1% | |
| | 29,504 | | | Magic Leap, Inc. Series C*(1)(2)(3) | | | 796,608 | |
| | 50,200 | | | Nanigans, Inc. Series D*(1)(2)(3) | | | 207,326 | |
| | 793,410 | | | Pinterest, Inc. Series G*(1)(2)(3) | | | 3,863,907 | |
| | 20,891 | | | Sharecare Series B2*(1)(2)(3) | | | 4,668,303 | |
| | 749,645 | | | Uber Technologies, Inc. Series D*(1)(2)(3) | | | 32,572,075 | |
| | | | | | | | |
| | | | 42,108,219 | |
| | | | | | | | |
| | |
| | | | Total Preferred Stocks
(cost $26,666,595) | | $ | 45,317,120 | |
| | | | | | | | |
|
| CONVERTIBLE PREFERRED STOCKS - 0.0% | |
| | | | Retailing - 0.0% | |
| | 40,566 | | | Honest Co. Series C*(1)(2)(3) | | $ | 1,259,169 | |
| | | | | | | | |
| | |
| | | | Total Convertible Preferred Stocks
(cost $1,097,607) | | $ | 1,259,169 | |
| | | | | | | | |
|
| ESCROWS - 0.0%(6) | |
| | | | Consumer Durables & Apparel - 0.0% | |
| | 127,917 | | | One Kings Lane, Inc.*(1)(2)(3) | | $ | 23,025 | |
| | | | | | | | |
| | | | Telecommunication Services - 0.0% | |
| | 22,145 | | | Docusign, Inc. Earnout*(1)(2)(3) | | | 49,826 | |
| | | | | | | | |
| | |
| | | | Total Escrows
(cost $—) | | $ | 72,851 | |
| | | | | | | | |
| | |
| | | | Total Long-Term Investments
(cost $4,111,385,521) | | $ | 3,935,276,135 | |
| | | | | | | | |
|
| SHORT-TERM INVESTMENTS - 1.8% | |
| | | | Other Investment Pools & Funds - 1.6% | |
| | 65,454,986 | | | BlackRock Liquidity Funds FedFund Portfolio, Institutional Class, 2.40%(7) | | $ | 65,454,986 | |
| | | | | | | | |
| | | | Securities Lending Collateral - 0.2% | |
| | 352,256 | | | Citibank NA DDCA, 2.39%, 1/2/2019(7) | | | 352,256 | |
| | 4,654,948 | | | Fidelity Investments Money Market Funds, Government Portfolio, Institutional Class, 2.35%(7) | | | 4,654,948 | |
| | 333,890 | | | Goldman Sachs Financial Square Funds, Government Fund, Institutional Class, 2.30%(7) | | | 333,890 | |
| | 243,475 | | | Invesco Governmesnt & Agency Portfolio, Institutional Class, 2.30%(7) | | | 243,475 | |
| | 1,355,338 | | | Morgan Stanley Institutional Liquidity Funds, Government Portfolio, Institutional Class, 2.50%(7) | | | 1,355,338 | |
| | 105,211 | | | Western Asset Institutional Government Reserves Fund, Institutional Class, 2.28%(7) | | | 105,211 | |
| | | | | | | | |
| | | | 7,045,118 | |
| | | | | | | | |
| | |
| | | | Total Short-Term Investments
(cost $72,500,104) | | $ | 72,500,104 | |
| | | | | | | | |
| | | | | | | | | | | | |
| | | |
| | | | Total Investments
(cost $4,183,885,625) | | | 100.1 | % | | $ | 4,007,776,239 | |
| | | | Other Assets and Liabilities | | | (0.1 | )% | | | (4,576,256 | ) |
| | | | | | | | | | | | |
| | | | Total Net Assets | | | 100 | % | | $ | 4,003,199,983 | |
| | | | | | | | | | | | |
The accompanying notes are an integral part of these financial statements.
|
| Hartford Capital Appreciation HLS Fund |
Schedule of Investments – (continued)
December 31, 2018
| Note: | Percentage of investments as shown is the ratio of the total market value to total net assets. |
| | Prices of foreign equities that are principally traded on certain foreign markets will generally be adjusted daily pursuant to a fair value pricing service approved by the Board of Directors in order to reflect an adjustment for factors occurring after the close of certain foreign markets but before the close of the New York Stock Exchange. |
| | Equity industry classifications used in this report are the Global Industry Classification Standard, which was developed by and is the exclusive property and service mark of MSCI, Inc. and Standard & Poor’s. |
| | For Fund compliance purposes, the Fund may not use the same classification system. These classifications are used for financial reporting purposes. |
*Non-income producing.
| (1) | Investment valued using significant unobservable inputs. |
| (2) | These securities are valued in good faith at fair value as determined under policies and procedures established by and under the supervision of the Board of Directors. At December 31, 2018, the aggregate fair value of these securities was $60,789,645, which represented 1.5% of total net assets. This amount excludes securities that are principally traded in certain foreign markets and whose prices are adjusted pursuant to a third party pricing service methodology approved by the Board of Directors. |
| (3) | Investment in securities not registered under the Securities Act of 1933 (excluding securities acquired pursuant to Rule 144A and Regulation S). At the end of the period, the value of such restricted securities amounted to $60,789,645 or 1.5% of net assets. |
| | | | | | | | | | | | | | | | |
Period
Acquired | | | Security Name | | Shares/
Par Value | | | Base
Total Cost | | | Base
Market Value | |
| | 06/2015 | | | Airbnb, Inc. Series E | | | 16,619 | | | $ | 1,547,136 | | | $ | 1,821,110 | |
| | 08/2011 | | | Allstar Co. | | | 8,451,700 | | | | 3,676,649 | | | | 1,774,857 | |
| | 05/2018 | | | Docusign, Inc. Earnout | | | 22,145 | | | | — | | | | 49,826 | |
| | 07/2015 | | | DraftKings, Inc. | | | 514,432 | | | | 1,938,196 | | | | 1,311,575 | |
| | 06/2015 | | | Harry’s, Inc. | | | 350,600 | | | | 4,713,607 | | | | 4,641,944 | |
| | 08/2014 | | | Honest Co. Series C | | | 40,566 | | | | 1,097,607 | | | | 1,259,169 | |
| | 12/2015 | | | Magic Leap, Inc. Series C | | | 29,504 | | | | 679,566 | | | | 796,608 | |
| | 03/2015 | | | Nanigans, Inc. Series D | | | 50,200 | | | | 548,109 | | | | 207,326 | |
| | 01/2014 | | | One Kings Lane, Inc. | | | 127,917 | | | | — | | | | 23,025 | |
| | 03/2015 | | | Pinterest, Inc. Series G | | | 793,410 | | | | 5,695,963 | | | | 3,863,907 | |
| | 03/2015 | | | Sharecare Series B2 | | | 20,891 | | | | 5,220,034 | | | | 4,668,303 | |
| | 09/2015 | | | Social Finance, Inc. Series F | | | 85,350 | | | | 1,346,507 | | | | 1,387,791 | |
| | 11/2013 | | | Tory Burch LLC | | | 115,140 | | | | 9,024,247 | | | | 6,412,129 | |
| | 06/2014 | | | Uber Technologies, Inc. Series D | | | 749,645 | | | | 11,629,280 | | | | 32,572,075 | |
| | | | | | | | | | | | | | | | |
| | | | | | | | | | $ | 47,116,901 | | | $ | 60,789,645 | |
| | | | | | | | | | | | | | | | |
| (4) | Represents entire or partial securities on loan. See Note 8 in the accompanying Notes to Financial Statements for securities lending information. |
| (5) | Security was purchased pursuant to Rule 144A under the Securities Act of 1933 and may be sold in transactions that are exempt from registration (typically only to qualified institutional buyers) or in a public offering registered under the Securities Act of 1933. At December 31, 2018, the aggregate value of this security was $11,039,881, representing 0.3% of net assets. |
| (6) | Share amount represents shares of the issuer previously held that resulted in receipt of the escrow. |
| (7) | Current yield as of period end. |
| | | | | | | | | | | | | | | | |
| Futures Contracts Outstanding at December 31, 2018 | |
Description | | Number of
Contracts | | | Expiration
Date | | | Current
Notional
Amount | | | Value and
Unrealized
Appreciation/
(Depreciation) | |
| Long position contracts: | |
S&P 500(E-Mini) Future | | | 351 | | | | 03/15/2019 | | | $ | 43,966,260 | | | $ | (2,656,926 | ) |
| | | | | | | | | | | | | | | | |
Total futures contracts | | | $ | (2,656,926 | ) |
| | | | | | | | | | | | | | | | |
| | | | | | | | | | | | | | | | | | | | | | | | |
| Foreign Currency Contracts Outstanding at December 31, 2018 | |
Amount and Description of
Currency to be Purchased | | Amount and Description of
Currency to be Sold | | Counterparty | | Settlement
Date | | | Appreciation | | | Depreciation | |
| | 6,621,630 | | | USD | | | 5,793,000 | | | EUR | | BOA | | | 03/20/19 | | | $ | — | | | $ | (60,930 | ) |
| | 9,229,120 | | | USD | | | 1,035,944,000 | | | JPY | | BCLY | | | 03/20/19 | | | | — | | | | (284,652 | ) |
| | | | | | | | | | | | | | | | | | | | | | | | |
| | Total | | | $ | — | | | $ | (345,582 | ) |
| | | | | | | | | | |
| † | See Significant Accounting Policies of accompanying Notes to Financial Statements regarding valuation of investments. |
The accompanying notes are an integral part of these financial statements.
|
| Hartford Capital Appreciation HLS Fund |
Schedule of Investments – (continued)
December 31, 2018
| | |
| GLOSSARY: (abbreviations used in preceding Schedule of Investments) |
|
| Counterparty Abbreviations: |
BCLY | | Barclays |
BOA | | Banc of America Securities LLC |
|
| Currency Abbreviations: |
EUR | | Euro |
JPY | | Japanese Yen |
USD | | United States Dollar |
| | |
|
| Index Abbreviations: |
S&P | | Standard & Poors |
|
| Other Abbreviations: |
ADR | | American Depositary Receipt |
DDCA | | Dollars on Deposit in Custody Account |
REIT | | Real Estate Investment Trust |
Fair Valuation Summary
The following is a summary of the fair valuations according to the inputs used as of December 31, 2018 in valuing the Fund’s investments.
| | | | | | | | | | | | | | | | |
Description | | Total | | | Level 1 | | | Level 2 | | | Level 3(1) | |
Assets | |
Common Stocks | |
Automobiles & Components | | $ | 35,241,524 | | | $ | 19,070,563 | | | $ | 16,170,961 | | | $ | — | |
Banks | | | 133,863,081 | | | | 123,976,499 | | | | 9,886,582 | | | | — | |
Capital Goods | | | 207,656,088 | | | | 171,120,827 | | | | 31,893,317 | | | | 4,641,944 | |
Commercial & Professional Services | | | 127,058,941 | | | | 120,530,559 | | | | 6,528,382 | | | | — | |
Consumer Durables & Apparel | | | 91,557,809 | | | | 84,628,785 | | | | 6,929,024 | | | | — | |
Consumer Services | | | 118,071,589 | | | | 116,760,014 | | | | — | | | | 1,311,575 | |
Diversified Financials | | | 122,828,172 | | | | 118,656,584 | | | | 4,171,588 | | | | — | |
Energy | | | 154,917,609 | | | | 142,163,789 | | | | 12,753,820 | | | | — | |
Food & Staples Retailing | | | 66,333,941 | | | | 66,333,941 | | | | — | | | | — | |
Food, Beverage & Tobacco | | | 239,937,900 | | | | 180,083,364 | | | | 59,854,536 | | | | — | |
Health Care Equipment & Services | | | 327,845,304 | | | | 319,575,507 | | | | 8,269,797 | | | | — | |
Household & Personal Products | | | 40,178,577 | | | | 40,178,577 | | | | — | | | | — | |
Insurance | | | 221,572,139 | | | | 195,368,383 | | | | 26,203,756 | | | | — | |
Materials | | | 143,597,300 | | | | 127,595,993 | | | | 16,001,307 | | | | — | |
Media & Entertainment | | | 159,335,031 | | | | 150,128,461 | | | | 9,206,570 | | | | — | |
Pharmaceuticals, Biotechnology & Life Sciences | | | 339,434,066 | | | | 334,662,468 | | | | 4,771,598 | | | | — | |
Real Estate | | | 222,897,641 | | | | 213,621,951 | | | | 9,275,690 | | | | — | |
Retailing | | | 265,177,238 | | | | 228,771,731 | | | | 28,218,521 | | | | 8,186,986 | |
Semiconductors & Semiconductor Equipment | | | 84,485,811 | | | | 73,360,228 | | | | 11,125,583 | | | | — | |
Software & Services | | | 402,948,539 | | | | 402,948,539 | | | | — | | | | — | |
Technology Hardware & Equipment | | | 76,298,678 | | | | 63,705,177 | | | | 12,593,501 | | | | — | |
Telecommunication Services | | | 81,488,001 | | | | 81,488,001 | | | | — | | | | — | |
Transportation | | | 138,578,436 | | | | 138,578,436 | | | | — | | | | — | |
Utilities | | | 87,323,580 | | | | 76,578,631 | | | | 10,744,949 | | | | — | |
Preferred Stocks | | | 45,317,120 | | | | — | | | | — | | | | 45,317,120 | |
Convertible Preferred Stocks | | | 1,259,169 | | | | — | | | | — | | | | 1,259,169 | |
Escrows | | | 72,851 | | | | — | | | | — | | | | 72,851 | |
Short-Term Investments | | | 72,500,104 | | | | 72,500,104 | | | | — | | | | — | |
| | | | | | | | | | | | | | | | |
Total | | $ | 4,007,776,239 | | | $ | 3,662,387,112 | | | $ | 284,599,482 | | | $ | 60,789,645 | |
| | | | | | | | | | | | | | | | |
Liabilities | |
Foreign Currency Contracts(2) | | $ | (345,582 | ) | | $ | — | | | $ | (345,582 | ) | | $ | — | |
Futures Contracts(2) | | | (2,656,926 | ) | | | (2,656,926 | ) | | | — | | | | — | |
| | | | | | | | | | | | | | | | |
Total | | $ | (3,002,508 | ) | | $ | (2,656,926 | ) | | $ | (345,582 | ) | | $ | — | |
| | | | | | | | | | | | | | | | |
| (1) | For the year ended December 31, 2018, investments valued at $2,347,051 were transferred out of Level 3 due to the expiration of trading restrictions. There were no transfers into level 3. |
| (2) | Derivative instruments (excluding purchased and written options, if applicable) are valued at the unrealized appreciation/(depreciation) on the investments. |
The accompanying notes are an integral part of these financial statements.
|
| Hartford Capital Appreciation HLS Fund |
Schedule of Investments – (continued)
December 31, 2018
The following is a rollforward of the Fund’s investments that were valued using unobservable inputs (Level 3) for the year ended December 31, 2018:
| | | | | | | | | | | | | | | | | | | | |
| | | Common
Stocks | | | Preferred
Stocks | | | Convertible
Preferred
Stocks | | | Escrows | | | Total | |
Beginning balance | | $ | 14,720,609 | | | $ | 46,021,366 | | | $ | 1,238,075 | | | $ | — | | | $ | 61,980,050 | |
Conversions* | | | (31,979 | ) | | | — | | | | — | | | | 31,979 | | | | — | |
Purchases | | | — | | | | — | | | | — | | | | — | | | | — | |
Sales | | | (193,230 | ) | | | (2,385,595 | ) | | | — | | | | — | | | | (2,578,825 | ) |
Total realized gain/(loss) | | | (28,067,350 | ) | | | 1,369,258 | | | | — | | | | — | | | | (26,698,092 | ) |
Net change in unrealized appreciation/depreciation | | | 28,943,823 | | | | 1,427,774 | | | | 21,094 | | | | 40,872 | | | | 30,433,563 | |
Transfers into Level 3 | | | — | | | | — | | | | — | | | | — | | | | — | |
Transfers out of Level 3 | | | (1,231,368 | ) | | | (1,115,683 | ) | | | — | | | | — | | | | (2,347,051 | ) |
| | | | | | | | | | | | | | | | | | | | |
Ending balance | | $ | 14,140,505 | | | $ | 45,317,120 | | | $ | 1,259,169 | | | $ | 72,851 | | | $ | 60,789,645 | |
| | | | | | | | | | | | | | | | | | | | |
The change in net unrealized appreciation/(depreciation) relating to the Level 3 investments held at December 31, 2018 was $3,262,089.
| * | Private Equity securities that were common stocks are now escrows. |
The accompanying notes are an integral part of these financial statements.
|
| Hartford Disciplined Equity HLS Fund |
Schedule of Investments
December 31, 2018
| | | | | | | | |
| Shares or Principal Amount | | Market Value† | |
| COMMON STOCKS - 98.7% | |
| | | | Banks - 8.1% | |
| | 587,456 | | | Bank of America Corp. | | $ | 14,474,916 | |
| | 192,942 | | | Fifth Third Bancorp | | | 4,539,925 | |
| | 159,836 | | | JP Morgan Chase & Co. | | | 15,603,191 | |
| | 99,586 | | | PNC Financial Services Group, Inc. | | | 11,642,599 | |
| | | | | | | | |
| | | | 46,260,631 | |
| | | | | |
| | | | Capital Goods - 6.9% | |
| | 90,923 | | | AMETEK, Inc. | | | 6,155,487 | |
| | 36,659 | | | Boeing Co. | | | 11,822,528 | |
| | 123,774 | | | Fortune Brands Home & Security, Inc. | | | 4,702,174 | |
| | 31,278 | | | General Dynamics Corp. | | | 4,917,214 | |
| | 49,571 | | | Illinois Tool Works, Inc. | | | 6,280,150 | |
| | 36,955 | | | Snap-on, Inc. | | | 5,369,192 | |
| | | | | | | | |
| | | | 39,246,745 | |
| | | | | |
| | | | Commercial & Professional Services - 2.5% | |
| | 34,380 | | | Equifax, Inc. | | | 3,201,809 | |
| | 92,944 | | | IHS Markit Ltd.* | | | 4,458,524 | |
| | 92,140 | | | Republic Services, Inc. | | | 6,642,373 | |
| | | | | | | | |
| | | | 14,302,706 | |
| | | | | |
| | | | Consumer Durables & Apparel - 3.1% | |
| | 138,767 | | | NIKE, Inc. Class B | | | 10,288,185 | |
| | 99,810 | | | VF Corp. | | | 7,120,446 | |
| | | | | | | | |
| | | | 17,408,631 | |
| | | | | |
| | | | Consumer Services - 3.6% | |
| | 178,860 | | | Aramark | | | 5,181,574 | |
| | 69,453 | | | Hilton Worldwide Holdings, Inc. | | | 4,986,725 | |
| | 57,031 | | | McDonald’s Corp. | | | 10,126,995 | |
| | | | | | | | |
| | | | 20,295,294 | |
| | | | | |
| | | | Diversified Financials - 2.1% | |
| | 63,570 | | | American Express Co. | | | 6,059,492 | |
| | 79,762 | | | Capital One Financial Corp. | | | 6,029,210 | |
| | | | | | | | |
| | | | 12,088,702 | |
| | | | | |
| | | | Energy - 2.1% | |
| | 107,321 | | | Continental Resources, Inc.* | | | 4,313,231 | |
| | 87,277 | | | EOG Resources, Inc. | | | 7,611,427 | |
| | | | | | | | |
| | | | 11,924,658 | |
| | | | | |
| | | | Food & Staples Retailing - 3.5% | |
| | 44,709 | | | Costco Wholesale Corp. | | | 9,107,670 | |
| | 119,663 | | | Walmart, Inc. | | | 11,146,609 | |
| | | | | | | | |
| | | | 20,254,279 | |
| | | | | |
| | | | Food, Beverage & Tobacco - 1.3% | |
| | 15,338 | | | Constellation Brands, Inc. Class A | | | 2,466,657 | |
| | 99,256 | | | Monster Beverage Corp.* | | | 4,885,381 | |
| | | | | | | | |
| | | | 7,352,038 | |
| | | | | |
| | | | Health Care Equipment & Services - 12.2% | |
| | 119,400 | | | Abbott Laboratories | | | 8,636,202 | |
| | 37,126 | | | Anthem, Inc. | | | 9,750,401 | |
| | 150,547 | | | Baxter International, Inc. | | | 9,909,004 | |
| | 57,250 | | | Danaher Corp. | | | 5,903,620 | |
| | 131,314 | | | Hologic, Inc.* | | | 5,397,005 | |
| | 45,093 | | | Laboratory Corp. of America Holdings* | | | 5,697,951 | |
| | 106,075 | | | Medtronic plc | | | 9,648,582 | |
| | 59,547 | | | UnitedHealth Group, Inc. | | | 14,834,349 | |
| | | | | | | | |
| | | | 69,777,114 | |
| | | | | |
| | | | Household & Personal Products - 4.4% | |
| | 142,188 | | | Colgate-Palmolive Co. | | | 8,463,030 | |
| | 31,024 | | | Estee Lauder Cos., Inc. Class A | | | 4,036,222 | |
| | 135,531 | | | Procter & Gamble Co. | | | 12,458,010 | |
| | | | | | | | |
| | | | 24,957,262 | |
| | | | | |
| | | | | | | | |
| Shares or Principal Amount | | Market Value† | |
| COMMON STOCKS - 98.7% - (continued) | |
| | | | Insurance - 3.8% | |
| | 88,839 | | | Allstate Corp. | | $ | 7,340,767 | |
| | 93,966 | | | Athene Holding Ltd. Class A* | | | 3,742,666 | |
| | 81,392 | | | Chubb Ltd. | | | 10,514,218 | |
| | | | | | | | |
| | | | 21,597,651 | |
| | | | | |
| | | | Materials - 2.3% | |
| | 92,510 | | | DowDuPont, Inc. | | | 4,947,435 | |
| | 54,900 | | | Ecolab, Inc. | | | 8,089,515 | |
| | | | | | | | |
| | | | 13,036,950 | |
| | | | | |
| | | | Media & Entertainment - 4.4% | |
| | 3,854 | | | Alphabet, Inc. Class C* | | | 3,991,241 | |
| | 15,322 | | | Alphabet, Inc. Class A* | | | 16,010,877 | |
| | 40,013 | | | Facebook, Inc. Class A* | | | 5,245,304 | |
| | | | | | | | |
| | | | 25,247,422 | |
| | | | | |
| | | | Pharmaceuticals, Biotechnology & Life Sciences - 7.1% | |
| | 34,664 | | | Allergan plc | | | 4,633,190 | |
| | 110,153 | | | Bristol-Myers Squibb Co. | | | 5,725,753 | |
| | 101,484 | | | Eli Lilly & Co. | | | 11,743,728 | |
| | 133,531 | | | Merck & Co., Inc. | | | 10,203,104 | |
| | 37,452 | | | Thermo Fisher Scientific, Inc. | | | 8,381,383 | |
| | | | | | | | |
| | | | 40,687,158 | |
| | | | | |
| | | | Real Estate - 1.1% | |
| | 40,478 | | | American Tower Corp. REIT | | | 6,403,215 | |
| | | | | | | | |
| | | | Retailing - 3.8% | |
| | 3,745 | | | Amazon.com, Inc.* | | | 5,624,878 | |
| | 4,284 | | | Booking Holdings, Inc.* | | | 7,378,847 | |
| | 197,272 | | | TJX Cos., Inc. | | | 8,825,949 | |
| | | | | | | | |
| | | | 21,829,674 | |
| | | | | |
| | | | Semiconductors & Semiconductor Equipment - 1.8% | |
| | 115,472 | | | Micron Technology, Inc.* | | | 3,663,927 | |
| | 183,303 | | | ON Semiconductor Corp.* | | | 3,026,332 | |
| | 119,183 | | | Teradyne, Inc. | | | 3,739,963 | |
| | | | | | | | |
| | | | 10,430,222 | |
| | | | | |
| | | | Software & Services - 11.4% | |
| | 126,204 | | | GoDaddy, Inc. Class A* | | | 8,281,506 | |
| | 114,825 | | | Leidos Holdings, Inc. | | | 6,053,574 | |
| | 57,890 | | | Mastercard, Inc. Class A | | | 10,920,949 | |
| | 161,571 | | | Microsoft Corp. | | | 16,410,766 | |
| | 53,994 | | | salesforce.com, Inc.* | | | 7,395,558 | |
| | 111,760 | | | SS&C Technologies Holdings, Inc. | | | 5,041,494 | |
| | 63,662 | | | Total System Services, Inc. | | | 5,175,084 | |
| | 36,837 | | | Workday, Inc. Class A* | | | 5,882,132 | |
| | | | | | | | |
| | | | 65,161,063 | |
| | | | | |
| | | | Technology Hardware & Equipment - 4.8% | |
| | 68,440 | | | Apple, Inc. | | | 10,795,726 | |
| | 54,882 | | | CDW Corp. | | | 4,448,186 | |
| | 62,836 | | | Motorola Solutions, Inc. | | | 7,228,653 | |
| | 79,967 | | | NetApp, Inc. | | | 4,771,631 | |
| | | | | | | | |
| | | | 27,244,196 | |
| | | | | |
| | | | Telecommunication Services - 2.2% | |
| | 219,524 | | | Verizon Communications, Inc. | | | 12,341,639 | |
| | | | | | | | |
| | | | Transportation - 1.0% | |
| | 36,936 | | | Norfolk Southern Corp. | | | 5,523,409 | |
| | | | | | | | |
| | | | Utilities - 5.2% | |
| | 135,707 | | | American Electric Power Co., Inc. | | | 10,142,741 | |
| | 68,561 | | | NextEra Energy, Inc. | | | 11,917,273 | |
The accompanying notes are an integral part of these financial statements.
|
| Hartford Disciplined Equity HLS Fund |
Schedule of Investments – (continued)
December 31, 2018
| | | | | | | | |
| Shares or Principal Amount | | Market Value† | |
| COMMON STOCKS - 98.7% - (continued) | |
| | | | Utilities - 5.2% - (continued) | |
| | 88,913 | | | Pinnacle West Capital Corp. | | $ | 7,575,388 | |
| | | | | | | | |
| | | | 29,635,402 | |
| | | | | | | | |
| | |
| | | | Total Common Stocks
(cost $460,398,770) | | $ | 563,006,061 | |
| | | | | | | | |
| | |
| | | | Total Long-Term Investments
(cost $460,398,770) | | $ | 563,006,061 | |
| | | | | | | | |
|
| SHORT-TERM INVESTMENTS - 1.2% | |
| | | | Other Investment Pools & Funds - 1.2% | |
| | 6,643,831 | | | BlackRock Liquidity Funds Fed Fund Portfolio, Institutional Class, 2.40%(1) | | $ | 6,643,831 | |
| | | | | | | | |
| | |
| | | | Total Short-Term Investments
(cost $6,643,831) | | $ | 6,643,831 | |
| | | | | | | | |
| | | | | | | | | | | | |
| | | |
| | | | Total Investments
(cost $467,042,601) | | | 99.9 | % | | $ | 569,649,892 | |
| | | | Other Assets and Liabilities | | | 0.1 | % | | | 530,354 | |
| | | | | | | | | | | | |
| | | | Total Net Assets | | | 100.0 | % | | $ | 570,180,246 | |
| | | | | | | | | | | | |
| Note: | Percentage of investments as shown is the ratio of the total market value to total net assets. |
| | Equity industry classifications used in this report are the Global Industry Classification Standard, which was developed by and is the exclusive property and service mark of MSCI, Inc. and Standard & Poor’s. |
| | For Fund compliance purposes, the Fund may not use the same classification system. These classifications are used for financial reporting purposes. |
| (1) | Current yield as of period end. |
| † | See Significant Accounting Policies of accompanying Notes to Financial Statements regarding valuation of investments. |
| | |
| GLOSSARY: (abbreviations used in preceding Schedule of Investments) |
|
| Other Abbreviations: |
REIT | | Real Estate Investment Trust |
Fair Valuation Summary
The following is a summary of the fair valuations according to the inputs used as of December 31, 2018 in valuing the Fund’s investments.
| | | | | | | | | | | | | | | | |
Description | | Total | | | Level 1 | | | Level 2 | | | Level 3(1) | |
Assets | |
Common Stocks | |
Banks | | $ | 46,260,631 | | | $ | 46,260,631 | | | $ | — | | | $ | — | |
Capital Goods | | | 39,246,745 | | | | 39,246,745 | | | | — | | | | — | |
Commercial & Professional Services | | | 14,302,706 | | | | 14,302,706 | | | | — | | | | — | |
Consumer Durables & Apparel | | | 17,408,631 | | | | 17,408,631 | | | | — | | | | — | |
Consumer Services | | | 20,295,294 | | | | 20,295,294 | | | | — | | | | — | |
Diversified Financials | | | 12,088,702 | | | | 12,088,702 | | | | — | | | | — | |
Energy | | | 11,924,658 | | | | 11,924,658 | | | | — | | | | — | |
Food & Staples Retailing | | | 20,254,279 | | | | 20,254,279 | | | | — | | | | — | |
Food, Beverage & Tobacco | | | 7,352,038 | | | | 7,352,038 | | | | — | | | | — | |
Health Care Equipment & Services | | | 69,777,114 | | | | 69,777,114 | | | | — | | | | — | |
Household & Personal Products | | | 24,957,262 | | | | 24,957,262 | | | | — | | | | — | |
Insurance | | | 21,597,651 | | | | 21,597,651 | | | | — | | | | — | |
Materials | | | 13,036,950 | | | | 13,036,950 | | | | — | | | | — | |
Media & Entertainment | | | 25,247,422 | | | | 25,247,422 | | | | — | | | | — | |
Pharmaceuticals, Biotechnology & Life Sciences | | | 40,687,158 | | | | 40,687,158 | | | | — | | | | — | |
Real Estate | | | 6,403,215 | | | | 6,403,215 | | | | — | | | | — | |
Retailing | | | 21,829,674 | | | | 21,829,674 | | | | — | | | | — | |
Semiconductors & Semiconductor Equipment | | | 10,430,222 | | | | 10,430,222 | | | | — | | | | — | |
Software & Services | | | 65,161,063 | | | | 65,161,063 | | | | — | | | | — | |
Technology Hardware & Equipment | | | 27,244,196 | | | | 27,244,196 | | | | — | | | | — | |
Telecommunication Services | | | 12,341,639 | | | | 12,341,639 | | | | — | | | | — | |
Transportation | | | 5,523,409 | | | | 5,523,409 | | | | — | | | | — | |
Utilities | | | 29,635,402 | | | | 29,635,402 | | | | — | | | | — | |
Short-Term Investments | | | 6,643,831 | | | | 6,643,831 | | | | — | | | | — | |
| | | | | | | | | | | | | | | | |
Total | | $ | 569,649,892 | | | $ | 569,649,892 | | | $ | — | | | $ | — | |
| | | | | | | | | | | | | | | | |
| (1) | For the year ended December 31, 2018, there were no transfers in and out of Level 3. |
The accompanying notes are an integral part of these financial statements.
|
| Hartford Dividend and Growth HLS Fund |
Schedule of Investments
December 31, 2018
| | | | | | | | |
| Shares or Principal Amount | | Market Value† | |
| COMMON STOCKS - 98.1% | |
| | | | Automobiles & Components - 0.3% | |
| | 116,615 | | | Autoliv, Inc. | | $ | 8,189,871 | |
| | | | | | | | |
| | | | Banks - 10.0% | |
| | 3,961,713 | | | Bank of America Corp. | | | 97,616,608 | |
| | 394,537 | | | Bank of Nova Scotia | | | 19,675,560 | |
| | 550,993 | | | Citigroup, Inc. | | | 28,684,696 | |
| | 1,027,271 | | | JP Morgan Chase & Co. | | | 100,282,195 | |
| | 429,375 | | | PNC Financial Services Group, Inc. | | | 50,198,231 | |
| | | | | | | | |
| | | | 296,457,290 | |
| | | | | |
| | | | Capital Goods - 5.6% | |
| | 239,848 | | | Deere & Co. | | | 35,778,126 | |
| | 240,606 | | | Eaton Corp. plc | | | 16,520,008 | |
| | 209,553 | | | General Dynamics Corp. | | | 32,943,827 | |
| | 874,398 | | | Johnson Controls International plc | | | 25,925,901 | |
| | 77,450 | | | Lockheed Martin Corp. | | | 20,279,508 | |
| | 313,689 | | | United Technologies Corp. | | | 33,401,605 | |
| | | | | | | | |
| | | | 164,848,975 | |
| | | | | |
| | | | Consumer Services - 1.0% | |
| | 404,117 | | | Hilton Worldwide Holdings, Inc. | | | 29,015,601 | |
| | | | | | | | |
| | | | Diversified Financials - 3.1% | |
| | 69,804 | | | BlackRock, Inc. | | | 27,420,407 | |
| | 472,969 | | | Intercontinental Exchange, Inc. | | | 35,628,755 | |
| | 351,407 | | | Northern Trust Corp. | | | 29,374,111 | |
| | | | | | | | |
| | | | 92,423,273 | |
| | | | | |
| | | | Energy - 8.6% | |
| | 337,319 | | | BP plc ADR | | | 12,791,136 | |
| | 705,822 | | | Chevron Corp. | | | 76,786,375 | |
| | 427,509 | | | ConocoPhillips | | | 26,655,186 | |
| | 1,468,196 | | | Encana Corp. | | | 8,486,173 | |
| | 662,193 | | | Exxon Mobil Corp. | | | 45,154,941 | |
| | 815,123 | | | Halliburton Co. | | | 21,665,969 | |
| | 771,701 | | | Hess Corp. | | | 31,253,891 | |
| | 1,156,712 | | | Suncor Energy, Inc. | | | 32,353,235 | |
| | | | | | | | |
| | | | 255,146,906 | |
| | | | | |
| | | | Food & Staples Retailing - 1.7% | |
| | 418,362 | | | Sysco Corp. | | | 26,214,563 | |
| | 249,970 | | | Walmart, Inc. | | | 23,284,705 | |
| | | | | | | | |
| | | | 49,499,268 | |
| | | | | |
| | | | Food, Beverage & Tobacco - 3.0% | |
| | 599,322 | | | Coca-Cola Co. | | | 28,377,897 | |
| | 382,759 | | | PepsiCo., Inc. | | | 42,287,214 | |
| | 258,527 | | | Philip Morris International, Inc. | | | 17,259,262 | |
| | | | | | | | |
| | | | 87,924,373 | |
| | | | | |
| | | | Health Care Equipment & Services - 5.6% | |
| | 323,523 | | | Abbott Laboratories | | | 23,400,419 | |
| | 500,977 | | | CVS Health Corp. | | | 32,824,013 | |
| | 552,546 | | | Medtronic plc | | | 50,259,584 | |
| | 169,437 | | | UnitedHealth Group, Inc. | | | 42,210,145 | |
| | 137,716 | | | Universal Health Services, Inc. Class B | | | 16,052,177 | |
| | | | | | | | |
| | | | 164,746,338 | |
| | | | | |
| | | | Household & Personal Products - 0.7% | |
| | 384,346 | | | Unilever N.V. ADR | | | 20,677,815 | |
| | | | | | | | |
| | | | Insurance - 7.3% | |
| | 648,704 | | | American International Group, Inc. | | | 25,565,425 | |
| | 48,361 | | | Brighthouse Financial, Inc.* | | | 1,474,043 | |
| | 502,720 | | | Chubb Ltd. | | | 64,941,370 | |
| | 309,651 | | | Marsh & McLennan Cos., Inc. | | | 24,694,667 | |
| | 379,336 | | | MetLife, Inc. | | | 15,575,536 | |
| | 608,746 | | | Principal Financial Group, Inc. | | | 26,888,311 | |
| | 688,666 | | | Prudential Financial, Inc. | | | 56,160,712 | |
| | | | | | | | |
| | | | 215,300,064 | |
| | | | | |
| | | | | | | | |
| Shares or Principal Amount | | Market Value† | |
| COMMON STOCKS - 98.1% - (continued) | |
| | | | Materials - 4.3% | |
| | 212,983 | | | Ball Corp. | | $ | 9,792,958 | |
| | 636,641 | | | DowDuPont, Inc. | | | 34,047,561 | |
| | 285,082 | | | FMC Corp. | | | 21,084,665 | |
| | 767,091 | | | International Paper Co. | | | 30,959,793 | |
| | 312,363 | | | PPG Industries, Inc. | | | 31,932,869 | |
| | | | | | | | |
| | | | 127,817,846 | |
| | | | | |
| | | | Media & Entertainment - 5.0% | |
| | 77,079 | | | Alphabet, Inc. Class A* | | | 80,544,472 | |
| | 2,010,902 | | | Comcast Corp. Class A | | | 68,471,213 | |
| | | | | | | | |
| | | | 149,015,685 | |
| | | | | |
| | | | Pharmaceuticals, Biotechnology & Life Sciences - 10.6% | |
| | 358,334 | | | Agilent Technologies, Inc. | | | 24,173,211 | |
| | 1,384,533 | | | AstraZeneca plc ADR | | | 52,584,563 | |
| | 1,159,164 | | | Bristol-Myers Squibb Co. | | | 60,253,345 | |
| | 301,565 | | | Eli Lilly & Co. | | | 34,897,102 | |
| | 651,624 | | | Merck & Co., Inc. | | | 49,790,590 | |
| | 396,133 | | | Novartis AG ADR | | | 33,992,173 | |
| | 1,366,438 | | | Pfizer, Inc. | | | 59,645,019 | |
| | | | | | | | |
| | | | 315,336,003 | |
| | | | | |
| | | | Real Estate - 2.6% | |
| | 210,026 | | | American Tower Corp. REIT | | | 33,224,013 | |
| | 35,985 | | | Essex Property Trust, Inc. REIT | | | 8,823,882 | |
| | 213,198 | | | Simon Property Group, Inc. REIT | | | 35,815,132 | |
| | | | | | | | |
| | | | 77,863,027 | |
| | | | | |
| | | | Retailing - 3.5% | |
| | 60,755 | | | Alibaba Group Holding Ltd. ADR* | | | 8,327,688 | |
| | 171,110 | | | Expedia Group, Inc. | | | 19,275,542 | |
| | 161,412 | | | Home Depot, Inc. | | | 27,733,810 | |
| | 271,075 | | | Lowe’s Cos., Inc. | | | 25,036,487 | |
| | 556,102 | | | TJX Cos., Inc. | | | 24,880,003 | |
| | | | | | | | |
| | | | 105,253,530 | |
| | | | | |
| | | | Semiconductors & Semiconductor Equipment - 2.8% | |
| | 1,003,676 | | | Intel Corp. | | | 47,102,515 | |
| | 223,241 | | | KLA-Tencor Corp. | | | 19,977,837 | |
| | 106,662 | | | QUALCOMM, Inc. | | | 6,070,134 | |
| | 93,847 | | | Texas Instruments, Inc. | | | 8,868,542 | |
| | | | | | | | |
| | | | 82,019,028 | |
| | | | | |
| | | | Software & Services - 6.0% | |
| | 126,956 | | | Accenture plc Class A | | | 17,902,066 | |
| | 375,190 | | | DXC Technology Co. | | | 19,948,852 | |
| | 129,139 | | | International Business Machines Corp. | | | 14,679,230 | |
| | 1,221,149 | | | Microsoft Corp. | | | 124,032,104 | |
| | | | | | | | |
| | | | 176,562,252 | |
| | | | | |
| | | | Technology Hardware & Equipment - 4.3% | |
| | 187,596 | | | Apple, Inc. | | | 29,591,393 | |
| | 887,976 | | | Cisco Systems, Inc. | | | 38,476,000 | |
| | 1,409,714 | | | HP, Inc. | | | 28,842,749 | |
| | 269,332 | | | Motorola Solutions, Inc. | | | 30,983,953 | |
| | | | | | | | |
| | | | 127,894,095 | |
| | | | | |
| | | | Telecommunication Services - 4.2% | |
| | 706,266 | | | AT&T, Inc. | | | 20,156,832 | |
| | 1,841,593 | | | Verizon Communications, Inc. | | | 103,534,358 | |
| | | | | | | | |
| | | | 123,691,190 | |
| | | | | |
| | | | Transportation - 2.8% | |
| | 401,761 | | | Delta Air Lines, Inc. | | | 20,047,874 | |
| | 262,699 | | | Union Pacific Corp. | | | 36,312,883 | |
| | 282,454 | | | United Parcel Service, Inc. Class B | | | 27,547,738 | |
| | | | | | | | |
| | | | 83,908,495 | |
| | | | | |
The accompanying notes are an integral part of these financial statements.
|
| Hartford Dividend and Growth HLS Fund |
Schedule of Investments – (continued)
December 31, 2018
| | | | | | | | |
| Shares or Principal Amount | | Market Value† | |
| COMMON STOCKS - 98.1% - (continued) | |
| | | | Utilities - 5.1% | | | |
| | 620,580 | | | Dominion Energy, Inc. | | $ | 44,346,647 | |
| | 442,387 | | | Edison International | | | 25,114,310 | |
| | 725,790 | | | Exelon Corp. | | | 32,733,129 | |
| | 280,704 | | | NextEra Energy, Inc. | | | 48,791,969 | |
| | | | | | | | |
| | | | 150,986,055 | |
| | | | | | | | |
| | |
| | | | Total Common Stocks
(cost $2,340,147,541) | | $ | 2,904,576,980 | |
| | | | | | | | |
| | |
| | | | Total Long-Term Investments
(cost $2,340,147,541) | | $ | 2,904,576,980 | |
| | | | | | | | |
|
| SHORT-TERM INVESTMENTS - 1.9% | |
| | | | Other Investment Pools & Funds - 1.9% | | | |
| | 56,455,893 | | | Fidelity Investments Money Market Funds, Government Portfolio, Institutional Class, 2.35%(1) | | $ | 56,455,893 | |
| | | | | | | | |
| | |
| | | | Total Short-Term Investments
(cost $56,455,893) | | $ | 56,455,893 | |
| | | | | | | | |
| | | | | | | | | | | | |
| | | |
| | | | Total Investments
(cost $2,396,603,434) | | | 100.0 | % | | $ | 2,961,032,873 | |
| | | | Other Assets and Liabilities | | | 0.0 | % | | | (7,056 | ) |
| | | | | | | | | | | | |
| | | | Total Net Assets | | | 100.0 | % | | $ | 2,961,025,817 | |
| | | | | | | | | | | | |
| Note: | Percentage of investments as shown is the ratio of the total market value to total net assets. |
| | Equity industry classifications used in this report are the Global Industry Classification Standard, which was developed by and is the exclusive property and service mark of MSCI, Inc. and Standard & Poor’s. |
| | For Fund compliance purposes, the Fund may not use the same classification system. These classifications are used for financial reporting purposes. |
| (1) | Current yield as of period end. |
| † | See Significant Accounting Policies of accompanying Notes to Financial Statements regarding valuation of investments. |
| | |
| GLOSSARY: (abbreviations used in preceding Schedule of Investments) |
|
| Other Abbreviations: |
ADR | | American Depositary Receipt |
REIT | | Real Estate Investment Trust |
Fair Valuation Summary
The following is a summary of the fair valuations according to the inputs used as of December 31, 2018 in valuing the Fund’s investments.
| | | | | | | | | | | | | | | | |
Description | | Total | | | Level 1 | | | Level 2 | | | Level 3(1) | |
Assets | |
Common Stocks | |
Automobiles & Components | | $ | 8,189,871 | | | $ | 8,189,871 | | | $ | — | | | $ | — | |
Banks | | | 296,457,290 | | | | 296,457,290 | | | | — | | | | — | |
Capital Goods | | | 164,848,975 | | | | 164,848,975 | | | | — | | | | — | |
Consumer Services | | | 29,015,601 | | | | 29,015,601 | | | | — | | | | — | |
Diversified Financials | | | 92,423,273 | | | | 92,423,273 | | | | — | | | | — | |
Energy | | | 255,146,906 | | | | 255,146,906 | | | | — | | | | — | |
Food & Staples Retailing | | | 49,499,268 | | | | 49,499,268 | | | | — | | | | — | |
Food, Beverage & Tobacco | | | 87,924,373 | | | | 87,924,373 | | | | — | | | | — | |
Health Care Equipment & Services | | | 164,746,338 | | | | 164,746,338 | | | | — | | | | — | |
Household & Personal Products | | | 20,677,815 | | | | 20,677,815 | | | | — | | | | — | |
Insurance | | | 215,300,064 | | | | 215,300,064 | | | | — | | | | — | |
Materials | | | 127,817,846 | | | | 127,817,846 | | | | — | | | | — | |
Media & Entertainment | | | 149,015,685 | | | | 149,015,685 | | | | — | | | | — | |
Pharmaceuticals, Biotechnology & Life Sciences | | | 315,336,003 | | | | 315,336,003 | | | | — | | | | — | |
Real Estate | | | 77,863,027 | | | | 77,863,027 | | | | — | | | | — | |
Retailing | | | 105,253,530 | | | | 105,253,530 | | | | — | | | | — | |
Semiconductors & Semiconductor Equipment | | | 82,019,028 | | | | 82,019,028 | | | | — | | | | — | |
Software & Services | | | 176,562,252 | | | | 176,562,252 | | | | — | | | | — | |
Technology Hardware & Equipment | | | 127,894,095 | | | | 127,894,095 | | | | — | | | | — | |
Telecommunication Services | | | 123,691,190 | | | | 123,691,190 | | | | — | | | | — | |
Transportation | | | 83,908,495 | | | | 83,908,495 | | | | — | | | | — | |
Utilities | | | 150,986,055 | | | | 150,986,055 | | | | — | | | | — | |
Short-Term Investments | | | 56,455,893 | | | | 56,455,893 | | | | — | | | | — | |
| | | | | | | | | | | | | | | | |
Total | | $ | 2,961,032,873 | | | $ | 2,961,032,873 | | | $ | — | | | $ | — | |
| | | | | | | | | | | | | | | | |
| (1) | For the year ended December 31, 2018, there were no transfers in and out of Level 3. |
The accompanying notes are an integral part of these financial statements.
|
| Hartford Global Growth HLS Fund |
Schedule of Investments
December 31, 2018
| | | | | | | | |
| Shares or Principal Amount | | Market Value† | |
| COMMON STOCKS - 99.1% | |
| | | | Automobiles & Components - 0.6% | |
| | 25,480 | | | Ferrari N.V. | | $ | 2,535,362 | |
| | | | | | | | |
| | | | Banks - 1.4% | |
| | 143,297 | | | Bank of America Corp. | | | 3,530,838 | |
| | 24,320 | | | HDFC Bank Ltd. ADR | | | 2,519,309 | |
| | | | | | | | |
| | | | 6,050,147 | |
| | | | | | | | |
| | | | Capital Goods - 8.0% | |
| | 64,047 | | | ABB Ltd. | | | 1,223,048 | |
| | 58,960 | | | Airbus SE | | | 5,621,231 | |
| | 122,640 | | | Assa Abloy AB Class B | | | 2,196,089 | |
| | 97,049 | | | Atlas Copco AB Class A* | | | 2,315,398 | |
| | 13,902 | | | Boeing Co. | | | 4,483,395 | |
| | 17,354 | | | General Dynamics Corp. | | | 2,728,222 | |
| | 18,059 | | | Harris Corp. | | | 2,431,644 | |
| | 100,880 | | | Komatsu Ltd. | | | 2,167,904 | |
| | 26,352 | | | Lockheed Martin Corp. | | | 6,900,008 | |
| | 23,070 | | | Nidec Corp. | | | 2,610,300 | |
| | 24,111 | | | Safran S.A. | | | 2,891,751 | |
| | | | | | | | |
| | | | 35,568,990 | |
| | | | | | | | |
| | | | Commercial & Professional Services - 2.3% | |
| | 65,684 | | | Edenred | | | 2,419,072 | |
| | 140,971 | | | Experian plc | | | 3,417,407 | |
| | 48,620 | | | IHS Markit Ltd.* | | | 2,332,301 | |
| | 40,337 | | | TransUnion | | | 2,291,142 | |
| | | | | | | | |
| | | | 10,459,922 | |
| | | | | | | | |
| | | | Consumer Durables & Apparel - 4.2% | |
| | 14,160 | | | adidas AG | | | 2,959,283 | |
| | 27,021 | | | Cie Financiere Richemont S.A. | | | 1,742,519 | |
| | 102,984 | | | NIKE, Inc. Class B | | | 7,635,234 | |
| | 73,900 | | | Sony Corp. | | | 3,562,691 | |
| | 151,280 | | | Under Armour, Inc. Class A* | | | 2,673,118 | |
| | | | | | | | |
| | | | 18,572,845 | |
| | | | | | | | |
| | | | Consumer Services - 2.7% | |
| | 185,456 | | | Compass Group plc | | | 3,902,888 | |
| | 9,649 | | | Domino’s Pizza, Inc. | | | 2,392,856 | |
| | 43,610 | | | Hilton Worldwide Holdings, Inc. | | | 3,131,198 | |
| | 558,012 | | | Sands China Ltd. | | | 2,433,497 | |
| | | | | | | | |
| | | | 11,860,439 | |
| | | | | | | | |
| | | | Diversified Financials - 5.4% | |
| | 68,050 | | | American Express Co. | | | 6,486,526 | |
| | 42,494 | | | Intercontinental Exchange, Inc. | | | 3,201,073 | |
| | 55,472 | | | Julius Baer Group Ltd.* | | | 1,976,828 | |
| | 4,459 | | | Partners Group Holding AG | | | 2,712,616 | |
| | 17,260 | | | S&P Global, Inc. | | | 2,933,164 | |
| | 137,980 | | | TD Ameritrade Holding Corp. | | | 6,755,501 | |
| | | | | | | | |
| | | | 24,065,708 | |
| | | | | | | | |
| | | | Energy - 1.5% | |
| | 417,759 | | | Encana Corp. | | | 2,411,325 | |
| | 154,148 | | | Galp Energia SGPS S.A. | | | 2,427,187 | |
| | 57,990 | | | Schlumberger Ltd. | | | 2,092,279 | |
| | | | | | | | |
| | | | 6,930,791 | |
| | | | | | | | |
| | | | Food & Staples Retailing - 0.6% | |
| | 43,165 | | | Sysco Corp. | | | 2,704,719 | |
| | | | | | | | |
| | | | Food, Beverage & Tobacco - 3.5% | |
| | 17,150 | | | Constellation Brands, Inc. Class A | | | 2,758,063 | |
| | 328,352 | | | Davide Campari-Milano S.p.A. | | | 2,780,614 | |
| | 204,530 | | | Diageo plc | | | 7,308,756 | |
| | 60,565 | | | Monster Beverage Corp.* | | | 2,981,009 | |
| | | | | | | | |
| | | | 15,828,442 | |
| | | | | | | | |
| | | | | | | | |
| Shares or Principal Amount | | Market Value† | |
| COMMON STOCKS - 99.1% - (continued) | |
| | | | Health Care Equipment & Services - 8.8% | |
| | 41,942 | | | Abbott Laboratories | | $ | 3,033,665 | |
| | 14,718 | | | Anthem, Inc. | | | 3,865,388 | |
| | 42,570 | | | Baxter International, Inc. | | | 2,801,957 | |
| | 152,335 | | | Boston Scientific Corp.* | | | 5,383,519 | |
| | 45,970 | | | Edwards Lifesciences Corp.* | | | 7,041,225 | |
| | 45,000 | | | Hoya Corp. | | | 2,713,502 | |
| | 9,274 | | | Humana, Inc. | | | 2,656,816 | |
| | 25,098 | | | Medtronic plc | | | 2,282,914 | |
| | 11,600 | | | Penumbra, Inc.* | | | 1,417,520 | |
| | 18,059 | | | Stryker Corp. | | | 2,830,748 | |
| | 21,094 | | | UnitedHealth Group, Inc. | | | 5,254,937 | |
| | | | | | | | |
| | | | 39,282,191 | |
| | | | | | | | |
| | | | Household & Personal Products - 1.0% | |
| | 80,534 | | | Unilever N.V. ADR | | | 4,362,709 | |
| | | | | | | | |
| | | | Insurance - 2.6% | |
| | 490,600 | | | AIA Group Ltd. | | | 4,075,321 | |
| | 545,038 | | | Ping An Insurance Group Co. of China Ltd. Class H | | | 4,808,333 | |
| | 43,715 | | | Progressive Corp. | | | 2,637,326 | |
| | | | | | | | |
| | | | 11,520,980 | |
| | | | | | | | |
| | | | Materials - 1.7% | |
| | 155,493 | | | BHP Group plc | | | 3,285,724 | |
| | 275,644 | | | First Quantum Minerals Ltd. | | | 2,229,058 | |
| | 28,180 | | | Shin-Etsu Chemical Co., Ltd. | | | 2,165,148 | |
| | | | | | | | |
| | | | 7,679,930 | |
| | | | | | | | |
| | | | Media & Entertainment - 8.1% | |
| | 18,371 | | | Alphabet, Inc. Class C* | | | 19,025,191 | |
| | 36,990 | | | Electronic Arts, Inc.* | | | 2,918,881 | |
| | 8,877 | | | Netflix, Inc.* | | | 2,376,018 | |
| | 10,560 | | | Nintendo Co., Ltd. | | | 2,804,092 | |
| | 25,130 | | | Spotify Technology S.A.* | | | 2,852,255 | |
| | 85,020 | | | Tencent Holdings Ltd. | | | 3,407,629 | |
| | 96,989 | | | Yandex N.V. Class A* | | | 2,652,649 | |
| | | | | | | | |
| | | | 36,036,715 | |
| | | | | | | | |
| | | | Pharmaceuticals, Biotechnology & Life Sciences - 8.7% | |
| | 83,343 | | | Agilent Technologies, Inc. | | | 5,622,319 | |
| | 104,354 | | | AstraZeneca plc | | | 7,789,601 | |
| | 17,870 | | | Bluebird Bio, Inc.*(1) | | | 1,772,704 | |
| | 38,320 | | | Eisai Co., Ltd. | | | 2,966,728 | |
| | 31,208 | | | Eli Lilly & Co. | | | 3,611,390 | |
| | 44,580 | | | Gilead Sciences, Inc. | | | 2,788,479 | |
| | 17,111 | | | ICON plc* | | | 2,210,912 | |
| | 81,835 | | | Novartis AG | | | 7,008,692 | |
| | 34,840 | | | Seattle Genetics, Inc.* | | | 1,974,034 | |
| | 14,965 | | | Thermo Fisher Scientific, Inc. | | | 3,349,017 | |
| | | | | | | | |
| | | | 39,093,876 | |
| | | | | | | | |
| | | | Real Estate - 1.8% | |
| | 51,424 | | | American Tower Corp. REIT | | | 8,134,763 | |
| | | | | | | | |
| | | | Retailing - 11.4% | |
| | 21,032 | | | Alibaba Group Holding Ltd. ADR* | | | 2,882,856 | |
| | 12,824 | | | Amazon.com, Inc.* | | | 19,261,263 | |
| | 3,692 | | | Booking Holdings, Inc.* | | | 6,359,175 | |
| | 54,287 | | | Home Depot, Inc. | | | 9,327,592 | |
| | 279,151 | | | Just Eat plc* | | | 2,087,570 | |
| | 34,059 | | | Ross Stores, Inc. | | | 2,833,709 | |
| | 135,325 | | | TJX Cos., Inc. | | | 6,054,441 | |
| | 23,990 | | | Wayfair, Inc. Class A* | | | 2,161,019 | |
| | | | | | | | |
| | | | 50,967,625 | |
| | | | | | | | |
| | | | Semiconductors & Semiconductor Equipment - 2.4% | |
| | 164,898 | | | Advanced Micro Devices, Inc.* | | | 3,044,017 | |
| | 136,169 | | | Infineon Technologies AG | | | 2,726,330 | |
| | 50,657 | | | Micron Technology, Inc.* | | | 1,607,347 | |
The accompanying notes are an integral part of these financial statements.
|
| Hartford Global Growth HLS Fund |
Schedule of Investments – (continued)
December 31, 2018
| | | | | | | | |
| Shares or Principal Amount | | Market Value† | |
| COMMON STOCKS - 99.1% - (continued) | |
| | | | Semiconductors & Semiconductor Equipment - 2.4% - (continued) | |
| | 8,920 | | | NVIDIA Corp. | | $ | 1,190,820 | |
| | 321,000 | | | Taiwan Semiconductor Manufacturing Co., Ltd. | | | 2,330,854 | |
| | | | | | | | |
| | | | 10,899,368 | |
| | | | | | | | |
| | | | Software & Services - 18.5% | |
| | 23,054 | | | Accenture plc Class A | | | 3,250,845 | |
| | 37,804 | | | Adobe Systems Inc.* | | | 8,552,777 | |
| | 26,683 | | | Autodesk, Inc.* | | | 3,431,701 | |
| | 24,921 | | | Automatic Data Processing, Inc. | | | 3,267,642 | |
| | 13,384 | | | FleetCor Technologies, Inc.* | | | 2,485,676 | |
| | 27,257 | | | Global Payments, Inc. | | | 2,811,014 | |
| | 16,522 | | | Intuit, Inc. | | | 3,252,356 | |
| | 44,033 | | | Mastercard, Inc. Class A | | | 8,306,825 | |
| | 181,842 | | | Microsoft Corp. | | | 18,469,692 | |
| | 96,686 | | | PayPal Holdings, Inc.* | | | 8,130,326 | |
| | 34,011 | | | salesforce.com, Inc.* | | | 4,658,487 | |
| | 24,543 | | | ServiceNow, Inc.* | | | 4,369,881 | |
| | 21,140 | | | Splunk, Inc.* | | | 2,216,529 | |
| | 9,127 | | | Temenos AG* | | | 1,096,725 | |
| | 29,697 | | | Total System Services, Inc. | | | 2,414,069 | |
| | 46,526 | | | Visa, Inc. Class A | | | 6,138,640 | |
| | | | | | | | |
| | | | 82,853,185 | |
| | | | | | | | |
| | | | Technology Hardware & Equipment - 1.1% | |
| | 39,315 | | | CDW Corp. | | | 3,186,481 | |
| | 183,483 | | | Sunny Optical Technology Group Co., Ltd. | | | 1,631,904 | |
| | | | | | | | |
| | | | 4,818,385 | |
| | | | | | | | |
| | | | Telecommunication Services - 0.8% | |
| | 57,496 | | | T-Mobile US, Inc.* | | | 3,657,321 | |
| | | | | | | | |
| | | | Transportation - 2.0% | |
| | 38,384 | | | Canadian National Railway Co. | | | 2,842,811 | |
| | 47,839 | | | CSX Corp. | | | 2,972,237 | |
| | 23,964 | | | Union Pacific Corp. | | | 3,312,544 | |
| | | | | | | | |
| | | | 9,127,592 | |
| | | | | | | | |
| | |
| | | | Total Common Stocks
(cost $388,520,806) | | $ | 443,012,005 | |
| | | | | | | | |
| | |
| | | | Total Long-Term Investments
(cost $388,520,806) | | $ | 443,012,005 | |
| | | | | | | | |
|
| SHORT-TERM INVESTMENTS - 1.1% | |
| | | | Other Investment Pools & Funds - 0.9% | |
| | 4,158,107 | | | Fidelity Investments Money Market Funds, Government Portfolio, Institutional Class, 2.35%(2) | | $ | 4,158,107 | |
| | | | | | | | |
| | | | Securities Lending Collateral - 0.2% | |
| | 47,750 | | | Citibank NA DDCA, 2.39%, 1/2/2019(2) | | | 47,750 | |
| | 631,003 | | | Fidelity Investments Money Market Funds, Government Portfolio, Institutional Class, 2.35%(2) | | | 631,003 | |
| | 45,261 | | | Goldman Sachs Financial Square Funds, Government Fund, Institutional Class, 2.30%(2) | | | 45,261 | |
| | 33,004 | | | Invesco Government & Agency Portfolio, Institutional Class, 2.30%(2) | | | 33,004 | |
| | 183,723 | | | Morgan Stanley Institutional Liquidity Funds, Government Portfolio, Institutional Class, 2.50%(2) | | | 183,724 | |
| | 14,262 | | | Western Asset Institutional Government Reserves Fund, Institutional Class, 2.28%(2) | | | 14,262 | |
| | | | | | | | |
| | | | 955,004 | |
| | | | | | | | |
| | |
| | | | Total Short-Term Investments
(cost $5,113,111) | | $ | 5,113,111 | |
| | | | | | | | |
| | | | | | | | | | | | |
| | | |
| | | | Total Investments
(cost $393,633,917) | | | 100.2 | % | | $ | 448,125,116 | |
| | | | Other Assets and Liabilities | | | (0.2 | )% | | | (930,146 | ) |
| | | | | | | | | | | | |
| | | | Total Net Assets | | | 100.0 | % | | $ | 447,194,970 | |
| | | | | | | | | | | | |
| Note: | Percentage of investments as shown is the ratio of the total market value to total net assets. |
| | Prices of foreign equities that are principally traded on certain foreign markets will generally be adjusted daily pursuant to a fair value pricing service approved by the Board of Directors in order to reflect an adjustment for factors occurring after the close of certain foreign markets but before the close of the New York Stock Exchange. |
| | Equity industry classifications used in this report are the Global Industry Classification Standard, which was developed by and is the exclusive property and service mark of MSCI, Inc. and Standard & Poor’s. |
| | For Fund compliance purposes, the Fund may not use the same classification system. These classifications are used for financial reporting purposes. |
| (1) | Represents entire or partial securities on loan. See Note 8 in the accompanying Notes to Financial Statements for securities lending information. |
| (2) | Current yield as of period end. |
| † | See Significant Accounting Policies of accompanying Notes to Financial Statements regarding valuation of investments. |
| | |
| GLOSSARY: (abbreviations used in preceding Schedule of Investments) |
|
| Other Abbreviations: |
ADR | | American Depositary Receipt |
DDCA | | Dollars on Deposit in Custody Account |
REIT | | Real Estate Investment Trust |
The accompanying notes are an integral part of these financial statements.
|
| Hartford Global Growth HLS Fund |
Schedule of Investments – (continued)
December 31, 2018
Fair Valuation Summary
The following is a summary of the fair valuations according to the inputs used as of December 31, 2018 in valuing the Fund’s investments.
| | | | | | | | | | | | | | | | |
Description | | Total | | | Level 1 | | | Level 2 | | | Level 3(1) | |
Assets | |
Common Stocks | |
Automobiles & Components | | $ | 2,535,362 | | | $ | — | | | $ | 2,535,362 | | | $ | — | |
Banks | | | 6,050,147 | | | | 6,050,147 | | | | — | | | | — | |
Capital Goods | | | 35,568,990 | | | | 16,543,269 | | | | 19,025,721 | | | | — | |
Commercial & Professional Services | | | 10,459,922 | | | | 4,623,443 | | | | 5,836,479 | | | | — | |
Consumer Durables & Apparel | | | 18,572,845 | | | | 10,308,352 | | | | 8,264,493 | | | | — | |
Consumer Services | | | 11,860,439 | | | | 5,524,054 | | | | 6,336,385 | | | | — | |
Diversified Financials | | | 24,065,708 | | | | 19,376,264 | | | | 4,689,444 | | | | — | |
Energy | | | 6,930,791 | | | | 4,503,604 | | | | 2,427,187 | | | | — | |
Food & Staples Retailing | | | 2,704,719 | | | | 2,704,719 | | | | — | | | | — | |
Food, Beverage & Tobacco | | | 15,828,442 | | | | 5,739,072 | | | | 10,089,370 | | | | — | |
Health Care Equipment & Services | | | 39,282,191 | | | | 36,568,689 | | | | 2,713,502 | | | | — | |
Household & Personal Products | | | 4,362,709 | | | | — | | | | 4,362,709 | | | | — | |
Insurance | | | 11,520,980 | | | | 2,637,326 | | | | 8,883,654 | | | | — | |
Materials | | | 7,679,930 | | | | 2,229,058 | | | | 5,450,872 | | | | — | |
Media & Entertainment | | | 36,036,715 | | | | 29,824,994 | | | | 6,211,721 | | | | — | |
Pharmaceuticals, Biotechnology & Life Sciences | | | 39,093,876 | | | | 21,328,855 | | | | 17,765,021 | | | | — | |
Real Estate | | | 8,134,763 | | | | 8,134,763 | | | | — | | | | — | |
Retailing | | | 50,967,625 | | | | 48,880,055 | | | | 2,087,570 | | | | — | |
Semiconductors & Semiconductor Equipment | | | 10,899,368 | | | | 5,842,184 | | | | 5,057,184 | | | | — | |
Software & Services | | | 82,853,185 | | | | 81,756,460 | | | | 1,096,725 | | | | — | |
Technology Hardware & Equipment | | | 4,818,385 | | | | 3,186,481 | | | | 1,631,904 | | | | — | |
Telecommunication Services | | | 3,657,321 | | | | 3,657,321 | | | | — | | | | — | |
Transportation | | | 9,127,592 | | | | 9,127,592 | | | | — | | | | — | |
Short-Term Investments | | | 5,113,111 | | | | 5,113,111 | | | | — | | | | — | |
| | | | | | | | | | | | | | | | |
Total | | $ | 448,125,116 | | | $ | 333,659,813 | | | $ | 114,465,303 | | | $ | — | |
| | | | | | | | | | | | | | | | |
| (1) | For the year ended December 31, 2018, there were no transfers in and out of Level 3. |
The accompanying notes are an integral part of these financial statements.
|
| Hartford Growth Opportunities HLS Fund |
Schedule of Investments
December 31, 2018
| | | | | | | | |
| Shares or Principal Amount | | Market Value† | |
| COMMON STOCKS - 94.5% | |
| | | | Automobiles & Components - 1.0% | |
| | 41,783 | | | Tesla, Inc.* | | $ | 13,905,382 | |
| | | | | | | | |
| | | | Capital Goods - 3.7% | |
| | 114,614 | | | Harris Corp. | | | 15,432,775 | |
| | 102,599 | | | IDEX Corp. | | | 12,954,150 | |
| | 51,518 | | | Roper Technologies, Inc. | | | 13,730,577 | |
| | 917,240 | | | Willscot Corp.* | | | 8,640,401 | |
| | | | | | | | |
| | | | 50,757,903 | |
| | | | | | | | |
| | | | Commercial & Professional Services - 2.7% | |
| | 1,941,647 | | | ADT, Inc.(1) | | | 11,669,298 | |
| | 60,811 | | | CoStar Group, Inc.* | | | 20,513,983 | |
| | 18,785 | | | Klarna Holding AB(2)(3)(4) | | | 2,390,793 | |
| | 182,167 | | | Landscape Acquisition Holdings Ltd.* | | | 1,634,547 | |
| | | | | | | | |
| | | | 36,208,621 | |
| | | | | | | | |
| | | | Consumer Durables & Apparel - 2.2% | |
| | 149,747 | | | Polaris Industries, Inc. | | | 11,482,600 | |
| | 478,740 | | | Under Armour, Inc. Class A* | | | 8,459,336 | |
| | 628,945 | | | Under Armour, Inc. Class C* | | | 10,170,040 | |
| | | | | | | | |
| | | | 30,111,976 | |
| | | | | | | | |
| | | | Consumer Services - 3.9% | |
| | 1,556,596 | | | DraftKings, Inc.*(2)(3)(4) | | | 3,968,635 | |
| | 184,202 | | | Grand Canyon Education, Inc.* | | | 17,709,180 | |
| | 223,854 | | | Marriott Vacations Worldwide Corp. | | | 15,783,946 | |
| | 72,178 | | | Vail Resorts, Inc. | | | 15,216,566 | |
| | | | | | | | |
| | | | 52,678,327 | |
| | | | | | | | |
| | | | Diversified Financials - 4.8% | |
| | 319,045 | | | American Express Co. | | | 30,411,370 | |
| | 1,080,873 | | | J2 Acquisition Ltd.*(5) | | | 9,934,097 | |
| | 577,000 | | | Platinum Eagle Acquisition Corp.* | | | 6,023,880 | |
| | 381,981 | | | TD Ameritrade Holding Corp. | | | 18,701,790 | |
| | | | | | | | |
| | | | 65,071,137 | |
| | | | | | | | |
| | | | Energy - 1.5% | |
| | 82,102 | | | Concho Resources, Inc.* | | | 8,439,264 | |
| | 94,011 | | | Diamondback Energy, Inc. | | | 8,714,820 | |
| | 302,460 | | | WPX Energy, Inc.* | | | 3,432,921 | |
| | | | | | | | |
| | | | 20,587,005 | |
| | | | | | | | |
| | | | Food, Beverage & Tobacco - 3.9% | |
| | 322,160 | | | Lamb Weston Holdings, Inc. | | | 23,698,090 | |
| | 580,510 | | | Monster Beverage Corp.* | | | 28,572,702 | |
| | | | | | | | |
| | | | 52,270,792 | |
| | | | | | | | |
| | | | Health Care Equipment & Services - 11.3% | |
| | 136,093 | | | Align Technology, Inc.* | | | 28,501,957 | |
| | 209,512 | | | Baxter International, Inc. | | | 13,790,080 | |
| | 88,172 | | | DexCom, Inc.* | | | 10,563,006 | |
| | 87,337 | | | Edwards Lifesciences Corp.* | | | 13,377,408 | |
| | 193,414 | | | Haemonetics Corp.* | | | 19,351,071 | |
| | 348,783 | | | Insulet Corp.* | | | 27,665,467 | |
| | 171,546 | | | Penumbra, Inc.* | | | 20,962,921 | |
| | 206,134 | | | Veeva Systems, Inc. Class A* | | | 18,411,889 | |
| | | | | | | | |
| | | | 152,623,799 | |
| | | | | | | | |
| | | | Materials - 1.0% | |
| | 139,571 | | | Vulcan Materials Co. | | | 13,789,615 | |
| | | | | | | | |
| | | | Media & Entertainment - 11.0% | |
| | 6,587 | | | Alphabet, Inc. Class C* | | | 6,821,563 | |
| | 151,215 | | | Netflix, Inc.* | | | 40,474,207 | |
| | 680,569 | | | Ocean Outdoor Ltd.*(2)(3)(5) | | | 6,516,448 | |
| | 202,279 | | | Spotify Technology S.A.* | | | 22,958,667 | |
| | 129,965 | | | Take-Two Interactive Software, Inc.* | | | 13,378,597 | |
| | 220,760 | | | TripAdvisor, Inc.* | | | 11,907,794 | |
| | 292,579 | | | Walt Disney Co. | | | 32,081,287 | |
| | | | | | | | |
| Shares or Principal Amount | | Market Value† | |
| COMMON STOCKS - 94.5% - (continued) | |
| | | | Media & Entertainment - 11.0% - (continued) | |
| | 482,608 | | | Zillow Group, Inc. Class C*(1) | | $ | 15,240,761 | |
| | | | | | | | |
| | | | 149,379,324 | |
| | | | | | | | |
| | | | Pharmaceuticals, Biotechnology & Life Sciences - 6.0% | |
| | 542,568 | | | AstraZeneca plc ADR | | | 20,606,733 | |
| | 43,317 | | | Bluebird Bio, Inc.*(1) | | | 4,297,046 | |
| | 30,500 | | | Elanco Animal Health, Inc.* | | | 961,665 | |
| | 359,629 | | | Exact Sciences Corp.* | | | 22,692,590 | |
| | 12,354 | | | Galapagos N.V. ADR* | | | 1,133,356 | |
| | 88,983 | | | Galapagos N.V.* | | | 8,156,272 | |
| | 174,732 | | | Novartis AG | | | 14,964,781 | |
| | 99,682 | | | Seattle Genetics, Inc.* | | | 5,647,982 | |
| | 372,500 | | | WuXi AppTec Co., Ltd. Class H*(5) | | | 3,234,787 | |
| | | | | | | | |
| | | | 81,695,212 | |
| | | | | | | | |
| | | | Real Estate - 1.0% | |
| | 124,066 | | | Crown Castle International Corp. REIT | | | 13,477,290 | |
| | 10,657 | | | WeWork Companies, Inc. Class A(2)(3)(4) | | | 660,840 | |
| | | | | | | | |
| | | | 14,138,130 | |
| | | | | | | | |
| | | | Retailing - 9.4% | |
| | 63,647 | | | Amazon.com, Inc.* | | | 95,595,885 | |
| | 493,548 | | | Floor & Decor Holdings, Inc. Class A* | | | 12,782,893 | |
| | 41,578 | | | JAND, Inc. Class A(2)(3)(4) | | | 548,414 | |
| | 38,805 | | | Tory Burch LLC*(2)(3)(4) | | | 2,161,052 | |
| | 176,756 | | | Wayfair, Inc. Class A* | | | 15,922,180 | |
| | | | | | | | |
| | | | 127,010,424 | |
| | | | | | | | |
| | | | Semiconductors & Semiconductor Equipment - 2.6% | |
| | 1,065,489 | | | Advanced Micro Devices, Inc.* | | | 19,668,927 | |
| | 250,570 | | | Teradyne, Inc. | | | 7,862,887 | |
| | 86,528 | | | Universal Display Corp.(1) | | | 8,096,425 | |
| | | | | | | | |
| | | | 35,628,239 | |
| | | | | | | | |
| | | | Software & Services - 25.1% | |
| | 267,686 | | | 2U, Inc.* | | | 13,309,348 | |
| | 82,779 | | | Adobe, Inc.* | | | 18,727,921 | |
| | 182,873 | | | Autodesk, Inc.* | | | 23,519,296 | |
| | 70,240 | | | Fair Isaac Corp.* | | | 13,134,880 | |
| | 86,227 | | | FleetCor Technologies, Inc.* | | | 16,014,078 | |
| | 410,251 | | | GoDaddy, Inc. Class A* | | | 26,920,671 | |
| | 324,123 | | | Guidewire Software, Inc.* | | | 26,004,388 | |
| | 313,532 | | | PayPal Holdings, Inc.* | | | 26,364,906 | |
| | 261,280 | | | salesforce.com, Inc.* | | | 35,787,522 | |
| | 159,491 | | | ServiceNow, Inc.* | | | 28,397,373 | |
| | 186,518 | | | Shopify, Inc. Class A* | | | 25,823,417 | |
| | 129,903 | | | Splunk, Inc.* | | | 13,620,330 | |
| | 471,063 | | | SS&C Technologies Holdings, Inc. | | | 21,249,652 | |
| | 173,286 | | | Wix.com Ltd.* | | | 15,654,657 | |
| | 175,872 | | | Workday, Inc. Class A* | | | 28,083,241 | |
| | 437,381 | | | Zuora, Inc. Class A* | | | 7,934,091 | |
| | | | | | | | |
| | | | 340,545,771 | |
| | | | | | | | |
| | | | Technology Hardware & Equipment - 1.9% | |
| | 299,877 | | | Logitech International S.A. | | | 9,472,687 | |
| | 103,232 | | | Zebra Technologies Corp. Class A* | | | 16,437,631 | |
| | | | | | | | |
| | | | 25,910,318 | |
| | | | | | | | |
| | | | Transportation - 1.5% | |
| | 328,896 | | | CSX Corp. | | | 20,434,309 | |
| | | | | | | | |
| | |
| | | | Total Common Stocks
(cost $1,334,123,476) | | $ | 1,282,746,284 | |
| | | | | | | | |
|
| PREFERRED STOCKS - 4.8% | |
| | | | Real Estate - 1.2% | |
| | 145,709 | | | WeWork Companies, Inc.Class D-1*(2)(3)(4) | | $ | 9,035,415 | |
| | 114,486 | | | WeWork Companies, Inc.Class D-2*(2)(3)(4) | | | 7,099,277 | |
| | | | | | | | |
| | | | 16,134,692 | |
| | | | | | | | |
The accompanying notes are an integral part of these financial statements.
|
| Hartford Growth Opportunities HLS Fund |
Schedule of Investments – (continued)
December 31, 2018
| | | | | | | | |
| Shares or Principal Amount | | Market Value† | |
|
| PREFERRED STOCKS - 4.8% - (continued) | |
| | | | Retailing - 0.8% | |
| | 1,605,750 | | | Coupang LLC*(2)(3)(4) | | $ | 9,154,060 | |
| | 92,843 | | | JAND, Inc. Series D*(2)(3)(4) | | | 1,263,593 | |
| | | | | | | | |
| | | | 10,417,653 | |
| | | | | | | | |
| | | | Software & Services - 2.8% | |
| | 1,871,878 | | | Essence Group Holdings Corp. Series 3*(2)(3)(4) | | | 4,193,007 | |
| | 287,204 | | | Lookout, Inc. Series F*(2)(3)(4) | | | 2,122,437 | |
| | 366,944 | | | MarkLogic Corp. Series F*(2)(3)(4) | | | 3,669,440 | |
| | 488,790 | | | Pinterest, Inc. Series G*(2)(3)(4) | | | 2,380,407 | |
| | 589,628 | | | Uber Technologies, Inc. Series D*(2)(3)(4) | | | 25,619,337 | |
| | | | | | | | |
| | | | 37,984,628 | |
| | | | | | | | |
| | |
| | | | Total Preferred Stocks
(cost $33,556,291) | | $ | 64,536,973 | |
| | | | | | | | |
|
| CONVERTIBLE PREFERRED STOCKS - 0.2% | |
| | | | Retailing - 0.2% | |
| | 102,040 | | | Honest Co. Series C*(2)(3)(4) | | $ | 3,167,321 | |
| | | | | | | | |
| | |
| | | | Total Convertible Preferred Stocks
(cost $2,760,927) | | $ | 3,167,321 | |
| | | | | | | | |
|
| ESCROWS - 0.0%(6) | |
| | | | Capital Goods - 0.0% | |
| | 1,458,400 | | | Lithium Technology Corp.*(2)(3)(4) | | $ | 14,584 | |
| | | | | | | | |
| | | | Software & Services - 0.0% | |
| | 535,139 | | | Birst, Inc.*(2)(3)(4) | | | 27,827 | |
| | 535,139 | | | Birst, Inc. Earnout*(2)(3)(4) | | | 1 | |
| | 210,735 | | | Veracode, Inc.*(2)(3)(4) | | | 114,640 | |
| | | | | | | | |
| | | | 142,468 | |
| | | | | | | | |
| | | | Telecommunication Services - 0.0% | |
| | 49,126 | | | Docusign, Inc. Earnout*(2)(3)(4) | | | 110,533 | |
| | | | | | | | |
| | |
| | | | Total Escrows
(cost $—) | | $ | 267,585 | |
| | | | | | | | |
|
| WARRANTS - 0.1% | |
| | | | Commercial & Professional Services - 0.0% | |
| | 516,400 | | | Landscape Acquisition Holdings Ltd. Expires 11/23/22* | | $ | 129,100 | |
| | | | | | | | |
| | | | Diversified Financials - 0.1% | |
| | 1,195,579 | | | J2 Acquisition Ltd. Expires 9/7/27* | | | 508,121 | |
| | | | | | | | |
| | |
| | | | Total Warrants
(cost $17,120) | | $ | 637,221 | |
| | | | | | | | |
| | |
| | | | Total Long-Term Investments
(cost $1,370,457,814) | | $ | 1,351,355,384 | |
| | | | | | | | |
|
| SHORT-TERM INVESTMENTS - 1.2% | |
| | | | Other Investment Pools & Funds - 0.6% | |
| | 8,889,986 | | | Morgan Stanley Institutional Liquidity Funds, Government Portfolio, Institutional Class, 2.50%(7) | | $ | 8,889,986 | |
| | | | | | | | |
| | | | Securities Lending Collateral - 0.6% | |
| | 394,476 | | | Citibank NA DDCA, 2.39%, 1/2/2019(7) | | | 394,476 | |
| | 5,212,870 | | | Fidelity Investments Money Market Funds, Government Portfolio, Institutional Class, 2.35%(7) | | | 5,212,870 | |
| | 373,909 | | | Goldman Sachs Financial Square Funds, Government Fund, Institutional Class, 2.30%(7) | | | 373,909 | |
| | 272,656 | | | Invesco Government & Agency Portfolio, Institutional Class, 2.30%(7) | | | 272,656 | |
| | | | | | | | |
| Shares or Principal Amount | | Market Value† | |
|
| SHORT-TERM INVESTMENTS - 1.2% - (continued) | |
| | | | Securities Lending Collateral - 0.6% - (continued) | |
| | 1,517,783 | | | Morgan Stanley Institutional Liquidity Funds, Government Portfolio, Institutional Class, 2.50%(7) | | $ | 1,517,783 | |
| | 117,822 | | | Western Asset Institutional Government Reserves Fund, Institutional Class, 2.28%(7) | | | 117,822 | |
| | | | | | | | |
| | | | 7,889,516 | |
| | | | | | | | |
| | |
| | | | Total Short-Term Investments
(cost $16,779,502) | | $ | 16,779,502 | |
| | | | | | | | |
| | | | | | | | | | | | |
| | | |
| | | | Total Investments
(cost $1,387,237,316) | | | 100.8 | % | | $ | 1,368,134,886 | |
| | | | Other Assets and Liabilities | | | (0.8 | )% | | | (10,670,492 | ) |
| | | | | | | | | | | | |
| | | | Total Net Assets | | | 100.0 | % | | $ | 1,357,464,394 | |
| | | | | | | | | | | | |
| Note: | Percentage of investments as shown is the ratio of the total market value to total net assets. |
| | Prices of foreign equities that are principally traded on certain foreign markets will generally be adjusted daily pursuant to a fair value pricing service approved by the Board of Directors in order to reflect an adjustment for factors occurring after the close of certain foreign markets but before the close of the New York Stock Exchange. |
| | Equity industry classifications used in this report are the Global Industry Classification Standard, which was developed by and is the exclusive property and service mark of MSCI, Inc. and Standard & Poor’s. |
| | For Fund compliance purposes, the Fund may not use the same classification system. These classifications are used for financial reporting purposes. |
| (1) | Represents entire or partial securities on loan. See Note 9 in the accompanying Notes to Financial Statements for securities lending information. |
| (2) | Investment valued using significant unobservable inputs. |
| (3) | These securities are valued in good faith at fair value as determined under policies and procedures established by and under the supervision of the Board of Directors. At December 31, 2018, the aggregate fair value of these securities was $84,218,061, which represented 6.2% of total net assets. This amount excludes securities that are principally traded in certain foreign markets and whose prices are adjusted pursuant to a third party pricing service methodology approved by the Board of Directors. |
| (4) | Investment in securities not registered under the Securities Act of 1933 (excluding securities acquired pursuant to Rule 144A and Regulation S). At the end of the period, the value of such restricted securities amounted to $77,701,613 or 5.7% of net assets. |
| | | | | | | | | | | | | | | | |
Period
Acquired | | | Security Name | | Shares/
Par Value | | | Base
Total Cost | | | Base
Market Value | |
| | 03/2015 | | | Birst, Inc. | | | 535,139 | | | $ | — | | | $ | 27,827 | |
| | 03/2015 | | | Birst, Inc. Earnout | | | 535,139 | | | | — | | | | 1 | |
| | 11/2014 | | | Coupang LLC Preferred | | | 1,605,750 | | | | 4,998,894 | | | | 9,154,060 | |
| | 05/2018 | | | Docusign, Inc. Earnout | | | 49,126 | | | | — | | | | 110,533 | |
| | 12/2014 | | | DraftKings, Inc. | | | 1,556,596 | | | | 2,280,348 | | | | 3,968,635 | |
| | 05/2014 | | | Essence Group Holdings Corp. Series 3 Preferred | | | 1,871,878 | | | | 2,960,001 | | | | 4,193,007 | |
| | 08/2014 | | | Honest Co.
Series C Convertible Preferred | | | 102,040 | | | | 2,760,927 | | | | 3,167,321 | |
| | 04/2015 | | | JAND, Inc. Class A | | | 41,578 | | | | 477,536 | | | | 548,414 | |
| | 04/2015 | | | JAND, Inc. Series D Preferred | | | 92,843 | | | | 1,066,330 | | | | 1,263,593 | |
| | 08/2015 | | | Klarna Holding AB | | | 18,785 | | | | 2,060,349 | | | | 2,390,793 | |
| | 08/2013 | | | Lithium Technology Corp. | | | 1,458,400 | | | | — | | | | 14,584 | |
| | 07/2014 | | | Lookout, Inc. Series F Preferred | | | 287,204 | | | | 3,280,760 | | | | 2,122,437 | |
The accompanying notes are an integral part of these financial statements.
|
| Hartford Growth Opportunities HLS Fund |
Schedule of Investments – (continued)
December 31, 2018
| | | | | | | | | | | | | | | | |
Period
Acquired | | | Security Name | | Shares/
Par Value | | | Base
Total Cost | | | Base
Market Value | |
| | 04/2015 | | | MarkLogic Corp.
Series F Preferred | | | 366,944 | | | $ | 4,261,761 | | | $ | 3,669,440 | |
| | 03/2015 | | | Pinterest, Inc.
Series G Preferred | | | 488,790 | | | | 3,509,068 | | | | 2,380,407 | |
| | 11/2013 | | | Tory Burch LLC | | | 38,805 | | | | 3,041,403 | | | | 2,161,052 | |
| | 06/2014 | | | Uber Technologies, Inc. Series D Preferred | | | 589,628 | | | | 9,146,929 | | | | 25,619,337 | |
| | 04/2017 | | | Veracode, Inc. | | | 210,735 | | | | — | | | | 114,640 | |
| | 12/2014 | | | WeWork Companies, Inc. Class A | | | 10,657 | | | | 177,451 | | | | 660,840 | |
| | 12/2014 | | | WeWork Companies, Inc.Class D-1 Preferred | | | 145,709 | | | | 2,426,224 | | | | 9,035,415 | |
| | 12/2014 | | | WeWork Companies, Inc.Class D-2 Preferred | | | 114,486 | | | | 1,906,324 | | | | 7,099,277 | |
| | | | | | | | | | | | | | | | |
| | | | | | | | | | $ | 44,354,305 | | | $ | 77,701,613 | |
| | | | | | | | | | | | | | | | |
| (5) | Security was purchased pursuant to Rule 144A under the Securities Act of 1933 and may be sold in transactions that are exempt from registration (typically only to qualified institutional buyers) or in a public offering registered under the Securities Act of 1933. At December 31, 2018, the aggregate value of these securities was $19,685,332, representing 1.5% of net assets. |
| (6) | Share amount represents shares of the issuer previously held that resulted in receipt of the escrow. |
| (7) | Current yield as of period end. |
| † | See Significant Accounting Policies of accompanying Notes to Financial Statements regarding valuation of investments. |
| | |
| GLOSSARY: (abbreviations used in preceding Schedule of Investments) |
|
| Other Abbreviations: |
ADR | | American Depositary Receipt |
DDCA | | Dollars on Deposit in Custody Account |
REIT | | Real Estate Investment Trust |
Fair Valuation Summary
The following is a summary of the fair valuations according to the inputs used as of December 31, 2018 in valuing the Fund’s investments.
| | | | | | | | | | | | | | | | |
Description | | Total | | | Level 1 | | | Level 2 | | | Level 3(1) | |
Assets | |
Common Stocks | |
Automobiles & Components | | $ | 13,905,382 | | | $ | 13,905,382 | | | $ | — | | | $ | — | |
Capital Goods | | | 50,757,903 | | | | 50,757,903 | | | | — | | | | — | |
Commercial & Professional Services | | | 36,208,621 | | | | 32,183,281 | | | | 1,634,547 | | | | 2,390,793 | |
Consumer Durables & Apparel | | | 30,111,976 | | | | 30,111,976 | | | | — | | | | — | |
Consumer Services | | | 52,678,327 | | | | 48,709,692 | | | | — | | | | 3,968,635 | |
Diversified Financials | | | 65,071,137 | | | | 55,137,040 | | | | 9,934,097 | | | | — | |
Energy | | | 20,587,005 | | | | 20,587,005 | | | | — | | | | — | |
Food, Beverage & Tobacco | | | 52,270,792 | | | | 52,270,792 | | | | — | | | | — | |
Health Care Equipment & Services | | | 152,623,799 | | | | 152,623,799 | | | | — | | | | — | |
Materials | | | 13,789,615 | | | | 13,789,615 | | | | — | | | | — | |
Media & Entertainment | | | 149,379,324 | | | | 142,862,876 | | | | — | | | | 6,516,448 | |
Pharmaceuticals, Biotechnology & Life Sciences | | | 81,695,212 | | | | 58,574,159 | | | | 23,121,053 | | | | — | |
Real Estate | | | 14,138,130 | | | | 13,477,290 | | | | — | | | | 660,840 | |
Retailing | | | 127,010,424 | | | | 124,300,958 | | | | — | | | | 2,709,466 | |
Semiconductors & Semiconductor Equipment | | | 35,628,239 | | | | 35,628,239 | | | | — | | | | — | |
Software & Services | | | 340,545,771 | | | | 340,545,771 | | | | — | | | | — | |
Technology Hardware & Equipment | | | 25,910,318 | | | | 16,437,631 | | | | 9,472,687 | | | | — | |
Transportation | | | 20,434,309 | | | | 20,434,309 | | | | — | | | | — | |
Preferred Stocks | | | 64,536,973 | | | | — | | | | — | | | | 64,536,973 | |
Convertible Preferred Stocks | | | 3,167,321 | | | | — | | | | — | | | | 3,167,321 | |
Escrows | | | 267,585 | | | | — | | | | — | | | | 267,585 | |
Warrants | | | 637,221 | | | | 637,221 | | | | — | | | | — | |
Short-Term Investments | | | 16,779,502 | | | | 16,779,502 | | | | — | | | | — | |
| | | | | | | | | | | | | | | | |
Total | | $ | 1,368,134,886 | | | $ | 1,239,754,441 | | | $ | 44,162,384 | | | $ | 84,218,061 | |
| | | | | | | | | | | | | | | | |
| (1) | For the year ended December 31, 2018, investments valued at $4,900,099 were transferred into Level 3 due to the unavailability of active market pricing and investments valued at $7,211,753 were transferred out of Level 3 due to the expiration of trading restrictions. |
The accompanying notes are an integral part of these financial statements.
|
| Hartford Growth Opportunities HLS Fund |
Schedule of Investments – (continued)
December 31, 2018
The following is a rollforward of the Fund’s investments that were valued using unobservable inputs (Level 3) for the year ended December 31, 2018:
| | | | | | | | | | | | | | | | | | | | |
| | | Common
Stocks | | | Preferred
Stocks | | | Convertible
Preferred
Stocks | | | Escrows | | | Total | |
Beginning balance | | $ | 22,670,128 | | | $ | 70,602,059 | | | $ | 3,114,261 | | | $ | — | | | $ | 96,386,448 | |
Conversions* | | | (1,430,104 | ) | | | — | | | | — | | | | 1,430,104 | | | | — | |
Purchases | | | 1,706,524 | | | | — | | | | — | | | | — | | | | 1,706,524 | |
Sales | | | (3,386,625 | ) | | | (9,033,437 | ) | | | | | | | — | | | | (12,420,062 | ) |
Accrued discounts/(premiums) | | | — | | | | — | | | | — | | | | — | | | | — | |
Total realized gain/(loss) | | | (697,200 | ) | | | 3,901,816 | | | | — | | | | — | | | | 3,204,616 | |
Net change in unrealized appreciation/depreciation | | | (4,712,349 | ) | | | 3,473,997 | | | | 53,060 | | | | (1,162,519 | ) | | | (2,347,811 | ) |
Transfers into Level 3 | | | 4,900,099 | | | | — | | | | — | | | | — | | | | 4,900,099 | |
Transfers out of Level 3 | | | (2,804,291 | ) | | | (4,407,462 | ) | | | — | | | | — | | | | (7,211,753 | ) |
| | | | | | | | | | | | | | | | | | | | |
Ending balance | | $ | 16,246,182 | | | $ | 64,536,973 | | | $ | 3,167,321 | | | $ | 267,585 | | | $ | 84,218,061 | |
| | | | | | | | | | | | | | | | | | | | |
The change in net unrealized appreciation/(depreciation) relating to the Level 3 investments held at December 31, 2018 was $6,499,374.
| * | Private Equity securities that were common stocks are now escrows. |
The accompanying notes are an integral part of these financial statements.
|
| Hartford Healthcare HLS Fund |
Schedule of Investments
December 31, 2018
| | | | | | | | |
| Shares or Principal Amount | | Market Value† | |
| COMMON STOCKS - 98.9% | |
| | | | Biotechnology - 24.5% | |
| | 116,887 | | | Aduro Biotech, Inc.* | | $ | 308,582 | |
| | 27,154 | | | Aimmune Therapeutics, Inc.* | | | 649,524 | |
| | 64,943 | | | Alder Biopharmaceuticals, Inc.* | | | 665,666 | |
| | 119,016 | | | Alkermes plc* | | | 3,512,162 | |
| | 31,472 | | | Alnylam Pharmaceuticals, Inc.* | | | 2,294,624 | |
| | 41,045 | | | Arena Pharmaceuticals, Inc.* | | | 1,598,703 | |
| | 50,062 | | | Audentes Therapeutics, Inc.* | | | 1,067,322 | |
| | 13,470 | | | Biogen, Inc.* | | | 4,053,392 | |
| | 31,541 | | | Bluebird Bio, Inc.*(1) | | | 3,128,867 | |
| | 57,334 | | | Calithera Biosciences, Inc.* | | | 229,909 | |
| | 8,612 | | | Celgene Corp.* | | | 551,943 | |
| | 84,935 | | | Clementia Pharmaceuticals, Inc.* | | | 998,836 | |
| | 198,658 | | | Coherus Biosciences, Inc.* | | | 1,797,855 | |
| | 99,814 | | | Cytokinetics, Inc.* | | | 630,824 | |
| | 72,584 | | | CytomX Therapeutics, Inc.* | | | 1,096,018 | |
| | 72,955 | | | Forty Seven, Inc.* | | | 1,146,853 | |
| | 60,513 | | | G1 Therapeutics, Inc.* | | | 1,158,824 | |
| | 17,152 | | | Galapagos N.V.* | | | 1,572,170 | |
| | 14,954 | | | Genmab A/S* | | | 2,458,743 | |
| | 42,963 | | | Genus plc | | | 1,175,163 | |
| | 54,649 | | | Global Blood Therapeutics, Inc.* | | | 2,243,341 | |
| | 112,391 | | | GlycoMimetics, Inc.* | | | 1,064,343 | |
| | 50,610 | | | Heron Therapeutics, Inc.*(1) | | | 1,312,823 | |
| | 26,816 | | | Incyte Corp.* | | | 1,705,229 | |
| | 17,743 | | | Innate Pharma S.A.*(1) | | | 151,236 | |
| | 138,403 | | | Ironwood Pharmaceuticals, Inc.* | | | 1,433,855 | |
| | 100,473 | | | Karyopharm Therapeutics, Inc.* | | | 941,432 | |
| | 37,898 | | | Loxo Oncology, Inc.* | | | 5,308,373 | |
| | 195,092 | | | Momenta Pharmaceuticals, Inc.* | | | 2,153,816 | |
| | 44,210 | | | Neon Therapeutics, Inc.*(1) | | | 222,376 | |
| | 73,430 | | | Nightstar Therapeutics plc ADR* | | | 845,914 | |
| | 87,231 | | | PhaseBio Pharmaceuticals, Inc.* | | | 269,544 | |
| | 113,658 | | | Portola Pharmaceuticals, Inc.*(1) | | | 2,218,604 | |
| | 65,500 | | | Ra Pharmaceuticals, Inc.* | | | 1,192,100 | |
| | 37,750 | | | Radius Health, Inc.* | | | 622,497 | |
| | 1,942 | | | Regeneron Pharmaceuticals, Inc.* | | | 725,337 | |
| | 359,459 | | | Rigel Pharmaceuticals, Inc.* | | | 826,756 | |
| | 116,954 | | | Seattle Genetics, Inc.* | | | 6,626,614 | |
| | 24,610 | | | Spark Therapeutics, Inc.* | | | 963,235 | |
| | 129,420 | | | Syndax Pharmaceuticals, Inc.* | | | 575,919 | |
| | 12,357 | | | TESARO, Inc.* | | | 917,507 | |
| | 139,918 | | | Trevena, Inc.* | | | 60,165 | |
| | 21,776 | | | Ultragenyx Pharmaceutical, Inc.* | | | 946,820 | |
| | 32,836 | | | UroGen Pharma Ltd.* | | | 1,413,918 | |
| | 29,609 | | | Vertex Pharmaceuticals, Inc.* | | | 4,906,507 | |
| | 21,442 | | | Zealand Pharma A/S ADR* | | | 248,942 | |
| | | | | | | | |
| | | | 69,993,183 | |
| | | | | | | | |
| | | | Health Care Distributors - 1.5% | |
| | 32,692 | | | Cardinal Health, Inc. | | | 1,458,063 | |
| | 25,812 | | | McKesson Corp. | | | 2,851,452 | |
| | | | | | | | |
| | | | 4,309,515 | |
| | | | | | | | |
| | | | Health Care Equipment - 22.9% | |
| | 181,523 | | | Abbott Laboratories | | | 13,129,559 | |
| | 49,435 | | | AtriCure, Inc.* | | | 1,512,711 | |
| | 34,499 | | | Baxter International, Inc. | | | 2,270,724 | |
| | 306,519 | | | Boston Scientific Corp.* | | | 10,832,381 | |
| | 50,956 | | | Danaher Corp. | | | 5,254,583 | |
| | 32,774 | | | Edwards Lifesciences Corp.* | | | 5,019,993 | |
| | 25,032 | | | Globus Medical, Inc. Class A* | | | 1,083,385 | |
| | 37,246 | | | Koninklijke Philips N.V. | | | 1,305,826 | |
| | 136,656 | | | Medtronic plc | | | 12,430,230 | |
| | 20,479 | | | NuVasive, Inc.* | | | 1,014,939 | |
| | 97,244 | | | Smith & Nephew plc | | | 1,820,277 | |
| | 18,962 | | | Stryker Corp. | | | 2,972,293 | |
| | | | | | | | |
| Shares or Principal Amount | | Market Value† | |
| COMMON STOCKS - 98.9% - (continued) | |
| | | | Health Care Equipment - 22.9% - (continued) | |
| | 9,820 | | | Teleflex, Inc. | | $ | 2,538,274 | |
| | 42,026 | | | Zimmer Biomet Holdings, Inc. | | | 4,358,937 | |
| | | | | | | | |
| | | | 65,544,112 | |
| | | | | | | | |
| | | | Health Care Facilities - 5.0% | |
| | 82,280 | | | Acadia Healthcare Co., Inc.* | | | 2,115,419 | |
| | 774,417 | | | China Resources Medical Holdings Co., Ltd. | | | 505,297 | |
| | 60,949 | | | HCA Healthcare, Inc. | | | 7,585,103 | |
| | 38,639 | | | NMC Health plc | | | 1,348,548 | |
| | 22,334 | | | Universal Health Services, Inc. Class B | | | 2,603,251 | |
| | | | | | | | |
| | | | 14,157,618 | |
| | | | | | | | |
| | | | Health Care Services - 0.8% | |
| | 9,062 | | | Cigna Corp.* | | | 1,721,055 | |
| | 6,130 | | | CVS Health Corp. | | | 401,638 | |
| | 2,150 | | | Guardant Health, Inc.*(1) | | | 80,818 | |
| | | | | | | | |
| | | | 2,203,511 | |
| | | | | | | | |
| | | | Health Care Supplies - 0.0% | |
| | 64,227 | | | Endologix, Inc.* | | | 45,987 | |
| | | | | | | | |
| | | | Health Care Technology - 3.0% | |
| | 118,544 | | | Allscripts Healthcare Solutions, Inc.* | | | 1,142,764 | |
| | 25,902 | | | athenahealth, Inc.* | | | 3,417,251 | |
| | 25,746 | | | Cerner Corp.* | | | 1,350,120 | |
| | 53,765 | | | HMS Holdings Corp.* | | | 1,512,409 | |
| | 25,031 | | | Teladoc Health, Inc.* | | | 1,240,787 | |
| | | | | | | | |
| | | | 8,663,331 | |
| | | | | | | | |
| | | | Life Sciences Tools & Services - 4.7% | |
| | 11,622 | | | ICON plc* | | | 1,501,678 | |
| | 33,440 | | | Syneos Health, Inc.* | | | 1,315,864 | |
| | 830 | | | Tecan Group AG | | | 161,548 | |
| | 39,356 | | | Thermo Fisher Scientific, Inc. | | | 8,807,479 | |
| | 178,623 | | | WuXi AppTec Co., Ltd. Class H*(2) | | | 1,551,161 | |
| | | | | | | | |
| | | | 13,337,730 | |
| | | | | | | | |
| | | | Managed Health Care - 12.6% | |
| | 31,941 | | | Anthem, Inc. | | | 8,388,665 | |
| | 16,861 | | | Centene Corp.* | | | 1,944,073 | |
| | 5,545 | | | Humana, Inc. | | | 1,588,532 | |
| | 13,042 | | | Molina Healthcare, Inc.* | | | 1,515,741 | |
| | 78,321 | | | UnitedHealth Group, Inc. | | | 19,511,327 | |
| | 12,666 | | | WellCare Health Plans, Inc.* | | | 2,990,316 | |
| | | | | | | | |
| | | | 35,938,654 | |
| | | | | | | | |
| | | | Pharmaceuticals - 23.9% | |
| | 58,485 | | | Allergan plc | | | 7,817,105 | |
| | 88,219 | | | Amneal Pharmaceuticals, Inc.* | | | 1,193,603 | |
| | 47,116 | | | Assembly Biosciences, Inc.* | | | 1,065,764 | |
| | 196,330 | | | AstraZeneca plc ADR | | | 7,456,613 | |
| | 210,903 | | | Bristol-Myers Squibb Co. | | | 10,962,738 | |
| | 24,665 | | | Chugai Pharmaceutical Co., Ltd. | | | 1,430,550 | |
| | 91,833 | | | Clearside Biomedical, Inc.* | | | 98,261 | |
| | 40,900 | | | Daiichi Sankyo Co., Ltd. | | | 1,308,215 | |
| | 46,802 | | | Dermira, Inc.* | | | 336,506 | |
| | 56,054 | | | Eisai Co., Ltd. | | | 4,339,691 | |
| | 8,555 | | | Elanco Animal Health, Inc.* | | | 269,739 | |
| | 87,712 | | | Eli Lilly & Co. | | | 10,150,033 | |
| | 45,100 | | | Evolus, Inc.* | | | 536,690 | |
| | 13,496 | | | Hikma Pharmaceuticals plc | | | 295,131 | |
| | 35,077 | | | Intersect ENT, Inc.* | | | 988,470 | |
| | 18,691 | | | Kala Pharmaceuticals, Inc.* | | | 91,399 | |
| | 39,811 | | | Laboratorios Farmaceuticos Rovi S.A. | | | 795,955 | |
| | 104,897 | | | Medicines Co.*(1) | | | 2,007,729 | |
| | 231,041 | | | MediWound Ltd.* | | | 938,026 | |
| | 100,297 | | | Mylan N.V.* | | | 2,748,138 | |
| | 55,960 | | | MyoKardia, Inc.* | | | 2,734,206 | |
The accompanying notes are an integral part of these financial statements.
|
| Hartford Healthcare HLS Fund |
Schedule of Investments – (continued)
December 31, 2018
| | | | | | | | |
| Shares or Principal Amount | | Market Value† | |
| COMMON STOCKS - 98.9% - (continued) | |
| | | | Pharmaceuticals - 23.9% - (continued) | |
| | 318,477 | | | Nabriva Therapeutics plc* | | $ | 464,976 | |
| | 24,763 | | | Novartis AG | | | 2,120,807 | |
| | 24,985 | | | ObsEva S.A.* | | | 316,310 | |
| | 77,461 | | | Ono Pharmaceutical Co., Ltd. | | | 1,581,808 | |
| | 63,496 | | | Revance Therapeutics, Inc.* | | | 1,278,174 | |
| | 767,736 | | | Sino Biopharmaceutical Ltd. | | | 505,392 | |
| | 24,024 | | | Takeda Pharmaceutical Co., Ltd. | | | 814,281 | |
| | 45,871 | | | Teva Pharmaceutical Industries Ltd. ADR | | | 707,330 | |
| | 20,215 | | | Tricida, Inc.* | | | 476,670 | |
| | 30,550 | | | UCB S.A. | | | 2,495,221 | |
| | | | | | | | |
| | | | 68,325,531 | |
| | | | | | | | |
| | |
| | | | Total Common Stocks
(cost $260,087,225) | | $ | 282,519,172 | |
| | | | | | | | |
| | |
| | | | Total Long-Term Investments
(cost $260,087,225) | | $ | 282,519,172 | |
| | | | | | | | |
|
| SHORT-TERM INVESTMENTS - 2.2% | |
| | | | Other Investment Pools & Funds - 1.2% | |
| | 3,278,285 | | | Fidelity Investments Money Market Funds, Government Portfolio, Institutional Class, 2.35%(3) | | $ | 3,278,285 | |
| | | | | | | | |
| | | | Securities Lending Collateral - 1.0% | |
| | 148,513 | | | Citibank NA DDCA, 2.39%, 1/2/2019(3) | | | 148,513 | |
| | 1,962,552 | | | Fidelity Investments Money Market Funds, Government Portfolio, Institutional Class, 2.35%(3) | | | 1,962,552 | |
| | 140,770 | | | Goldman Sachs Financial Square Funds, Government Fund, Institutional Class, 2.30%(3) | | | 140,770 | |
| | 102,650 | | | Invesco Government & Agency Portfolio, Institutional Class, 2.30%(3) | | | 102,650 | |
| | 571,418 | | | Morgan Stanley Institutional Liquidity Funds, Government Portfolio, Institutional Class, 2.50%(3) | | | 571,418 | |
| | 44,358 | | | Western Asset Institutional Government Reserves Fund, Institutional Class, 2.28%(3) | | | 44,358 | |
| | | | | | | | |
| | | | 2,970,261 | |
| | | | | | | | |
| | |
| | | | Total Short-Term Investments
(cost $6,248,546) | | $ | 6,248,546 | |
| | | | | | | | |
| | | | | | | | | | | | |
| | | |
| | | | Total Investments
(cost $266,335,771) | | | 101.1 | % | | $ | 288,767,718 | |
| | | | Other Assets and Liabilities | | | (1.1 | )% | | | (3,047,666 | ) |
| | | | | | | | | | | | |
| | | | Total Net Assets | | | 100.0 | % | | $ | 285,720,052 | |
| | | | | | | | | | | | |
| Note: | Percentage of investments as shown is the ratio of the total market value to total net assets. |
| | Prices of foreign equities that are principally traded on certain foreign markets will generally be adjusted daily pursuant to a fair value pricing service approved by the Board of Directors in order to reflect an adjustment for factors occurring after the close of certain foreign markets but before the close of the New York Stock Exchange. |
| | Equity industry classifications used in this report are the Global Industry Classification Standard, which was developed by and is the exclusive property and service mark of MSCI, Inc. and Standard & Poor’s. |
| | For Fund compliance purposes, the Fund may not use the same classification system. These classifications are used for financial reporting purposes. |
| (1) | Represents entire or partial securities on loan. See Note 8 in the accompanying Notes to Financial Statements for securities lending information. |
| (2) | Security was purchased pursuant to Rule 144A under the Securities Act of 1933 and may be sold in transactions that are exempt from registration (typically only to qualified institutional buyers) or in a public offering registered under the Securities Act of 1933. At December 31, 2018, the aggregate value of this security was $1,551,161, representing 0.5% of net assets. |
| (3) | Current yield as of period end. |
| † | See Significant Accounting Policies of accompanying Notes to Financial Statements regarding valuation of investments. |
| | |
| GLOSSARY: (abbreviations used in preceding Schedule of Investments) |
|
| Other Abbreviations: |
ADR | | American Depositary Receipt |
DDCA | | Dollars on Deposit in Custody Account |
Fair Valuation Summary
The following is a summary of the fair valuations according to the inputs used as of December 31, 2018 in valuing the Fund’s investments.
| | | | | | | | | | | | | | | | |
Description | | Total | | | Level 1 | | | Level 2 | | | Level 3(1) | |
Assets | |
Common Stocks | |
Biotechnology | | $ | 69,993,183 | | | $ | 65,811,034 | | | $ | 4,182,149 | | | $ | — | |
Health Care Distributors | | | 4,309,515 | | | | 4,309,515 | | | | — | | | | — | |
Health Care Equipment | | | 65,544,112 | | | | 62,418,009 | | | | 3,126,103 | | | | — | |
Health Care Facilities | | | 14,157,618 | | | | 12,303,773 | | | | 1,853,845 | | | | — | |
Health Care Services | | | 2,203,511 | | | | 2,203,511 | | | | — | | | | — | |
Health Care Supplies | | | 45,987 | | | | 45,987 | | | | — | | | | — | |
Health Care Technology | | | 8,663,331 | | | | 8,663,331 | | | | — | | | | — | |
Life Sciences Tools & Services | | | 13,337,730 | | | | 13,176,182 | | | | 161,548 | | | | — | |
Managed Health Care | | | 35,938,654 | | | | 35,938,654 | | | | — | | | | — | |
Pharmaceuticals | | | 68,325,531 | | | | 53,434,435 | | | | 14,891,096 | | | | — | |
Short-Term Investments | | | 6,248,546 | | | | 6,248,546 | | | | — | | | | — | |
| | | | | | | | | | | | | | | | |
Total | | $ | 288,767,718 | | | $ | 264,552,977 | | | $ | 24,214,741 | | | $ | — | |
| | | | | | | | | | | | | | | | |
| (1) | For the year ended December 31, 2018, there were no transfers in and out of Level 3. |
The accompanying notes are an integral part of these financial statements.
|
| Hartford High Yield HLS Fund |
Schedule of Investments
December 31, 2018
| | | | | | | | | | |
| Shares or Principal Amount | | Market Value† | |
| COMMON STOCKS - 0.9% | |
| | | | Consumer Services - 0.2% | |
| | | 58,800 | | | Caesars Entertainment Corp.* | | $ | 399,252 | |
| | | | | | | | | | |
| | | | Diversified Financials - 0.2% | |
| | | 21,000 | | | OneMain Holdings, Inc.* | | | 510,090 | |
| | | | | | | | | | |
| | | | Energy - 0.3% | |
| | | 206,275,142 | | | KCA Deutag*(1)(2)(13) | | | 849,235 | |
| | | | | | | | | | |
| | | | Materials - 0.2% | |
| | | 57,600 | | | Constellium N.V. Class A* | | | 402,624 | |
| | | | | | | | | | |
| | |
| | | Total Common Stocks
(cost $5,082,488) | | $ | 2,161,201 | |
| | | | | | | | | | |
|
| ASSET & COMMERCIAL MORTGAGE BACKED SECURITIES - 0.0% | |
| | | | Asset-Backed - Finance & Insurance - 0.0% | |
| $ | | | 2,490,000 | | | Soundview NIM Trust 8.25%, 12/25/2036(1)(2)(3)(4) | | $ | — | |
| | | | | | | | | | |
| | |
| | | Total Asset & Commercial Mortgage Backed Securities
(cost $2,478,958) | | $ | — | |
| | | | | | | | | | |
|
| CORPORATE BONDS - 88.6% | |
| | | | Aerospace/Defense - 0.4% | |
| | | DAE Funding LLC | |
| | | 370,000 | | | 4.50%, 08/01/2022(3) | | | 355,200 | |
| | | 760,000 | | | 5.00%, 08/01/2024(3) | | | 735,300 | |
| | | | | | | | | | |
| | | 1,090,500 | |
| | | | | | | | | | |
| | | | Auto Parts & Equipment - 0.2% | |
| | | 685,000 | | | Goodyear Tire & Rubber Co. 5.00%, 05/31/2026 | | | 616,500 | |
| | | | | | | | | | |
| | | | Biotechnology - 0.1% | |
| | | 370,000 | | | Sotera Health Topco, Inc. (8.13% Cash, 8.88% PIK) 8.13%, 11/01/2021(3)(5) | | | 347,800 | |
| | | | | | | | | | |
| | | | Chemicals - 1.1% | |
| | | CF Industries, Inc. | |
| | | 140,000 | | | 4.95%, 06/01/2043 | | | 108,500 | |
| | | 767,000 | | | 5.15%, 03/15/2034 | | | 644,280 | |
| | | 220,000 | | | 5.38%, 03/15/2044 | | | 178,200 | |
| | | Chemours Co. | |
| | | 970,000 | | | 6.63%, 05/15/2023 | | | 979,700 | |
| | | 305,000 | | | 7.00%, 05/15/2025 | | | 307,288 | |
| | | 545,000 | | | Starfruit Finco B.V. / Starfruit US Holdco LLC 8.00%, 10/01/2026(3) | | | 504,125 | |
| | | | | | | | | | |
| | | 2,722,093 | |
| | | | | | | | | | |
| | | | Coal - 2.6% | |
| | | 1,365,000 | | | Cloud Peak Energy Resources LLC / Cloud Peak Energy Finance Corp. 12.00%, 11/01/2021 | | | 778,050 | |
| | | 2,515,000 | | | Foresight Energy LLC / Foresight Energy Finance Corp. 11.50%, 04/01/2023(3) | | | 2,137,750 | |
| | | 2,390,000 | | | Peabody Energy Corp. 6.38%, 03/31/2025(3) | | | 2,222,700 | |
| | | 1,435,000 | | | Warrior Met Coal, Inc. 8.00%, 11/01/2024(3) | | | 1,424,237 | |
| | | | | | | | | | |
| | | 6,562,737 | |
| | | | | | | | | | |
| | | | Commercial Banks - 4.7% | |
| | | Banco Bilbao Vizcaya Argentaria S.A. | |
| | | 2,000,000 | | | 5 year USD Swap + 3.870%, 6.13%, 11/16/2027(6)(7) | | | 1,675,000 | |
| EUR | | | 800,000 | | | 5 year EUR Swap + 6.155%, 7.00%, 02/19/2019(6)(7)(8) | | | 914,121 | |
| | | 400,000 | | | 5 year EUR Swap + 9.177%, 8.88%, 04/14/2021(6)(7)(8) | | | 496,384 | |
| | | 1,400,000 | | | Banco de Sabadell S.A. 5 year EUR Swap + 6.414%, 6.50%, 05/18/2022(6)(7)(8) | | | 1,481,776 | |
| | | BNP Paribas S.A. | |
| $ | | | 260,000 | | | 5 year USD Swap + 2.838%,
5.13%, 11/15/2027(3)(6)(7) | | | 224,900 | |
| | | | | | | | | | |
| Shares or Principal Amount | | Market Value† | |
|
| CORPORATE BONDS - 88.6% - (continued) | |
| | | | Commercial Banks - 4.7% - (continued) | |
| $ | | | 1,080,000 | | | 5 year USD Swap + 6.314%, 7.63%, 03/30/2021(3)(6)(7) | | $ | 1,100,250 | |
| | | 690,000 | | | Credit Agricole S.A. 5 year USD Swap + 4.898%, 7.88%, 01/23/2024(3)(6)(7) | | | 689,099 | |
| | | 2,135,000 | | | Credit Suisse Group AG 5 year USD Swap + 3.455%, 6.25%, 12/18/2024(6)(7)(8) | | | 2,016,636 | |
| | | 1,580,000 | | | Freedom Mortgage Corp. 8.13%, 11/15/2024(3) | | | 1,354,850 | |
| | | 730,000 | | | Intesa Sanpaolo S.p.A. 5 year USD Swap + 5.462%, 7.70%, 09/17/2025(3)(6)(7) | | | 653,350 | |
| | | 1,200,000 | | | UniCredit S.p.A. 5 year USD Swap + 5.180%, 8.00%, 06/03/2024(6)(7)(8) | | | 1,065,000 | |
| | | | | | | | | | |
| | | 11,671,366 | |
| | | | | | | | | | |
| | | | Commercial Services - 4.5% | |
| | | 324,000 | | | ACE Cash Express, Inc. 12.00%, 12/15/2022(3) | | | 282,690 | |
| | | APX Group, Inc. | |
| | | 1,180,000 | | | 7.63%, 09/01/2023 | | | 952,850 | |
| | | 2,050,000 | | | 7.88%, 12/01/2022 | | | 1,937,250 | |
| | | Avis Budget Car Rental LLC / Avis Budget Finance, Inc. | |
| | | 1,195,000 | | | 5.25%, 03/15/2025(3) | | | 1,033,675 | |
| | | 985,000 | | | 5.50%, 04/01/2023 | | | 950,525 | |
| | | 1,344,000 | | | Brand Industrial Services, Inc. 8.50%, 07/15/2025(3) | | | 1,145,760 | |
| | | 1,450,000 | | | Garda World Security Corp. 8.75%, 05/15/2025(3) | | | 1,319,500 | |
| | | Herc Rentals, Inc. | |
| | | 665,000 | | | 7.50%, 06/01/2022(3) | | | 689,938 | |
| | | 1,184,000 | | | 7.75%, 06/01/2024(3) | | | 1,234,320 | |
| | | 385,000 | | | Service Corp. International 4.63%, 12/15/2027 | | | 361,900 | |
| | | United Rentals North America, Inc. | |
| | | 440,000 | | | 4.63%, 10/15/2025 | | | 392,700 | |
| | | 875,000 | | | 5.88%, 09/15/2026 | | | 824,687 | |
| | | | | | | | | | |
| | | 11,125,795 | |
| | | | | | | | | | |
| | | | Construction Materials - 0.6% | |
| | | 1,605,000 | | | Standard Industries, Inc. 5.38%, 11/15/2024(3) | | | 1,506,694 | |
| | | | | | | | | | |
| | | | Diversified Financial Services - 4.3% | |
| | | 620,000 | | | Fly Leasing Ltd. 5.25%, 10/15/2024 | | | 559,550 | |
| | | 1,370,000 | | | goeasy Ltd. 7.88%, 11/01/2022(3) | | | 1,387,125 | |
| | | Navient Corp. | |
| | | 417,000 | | | 5.50%, 01/25/2023 | | | 364,875 | |
| | | 365,000 | | | 5.63%, 08/01/2033 | | | 240,900 | |
| | | 1,641,000 | | | 5.88%, 10/25/2024 | | | 1,370,235 | |
| | | 1,240,000 | | | 6.13%, 03/25/2024 | | | 1,063,300 | |
| | | 815,000 | | | 6.50%, 06/15/2022 | | | 759,987 | |
| | | 527,000 | | | 7.25%, 09/25/2023 | | | 483,523 | |
| | | Springleaf Finance Corp. | |
| | | 490,000 | | | 5.25%, 12/15/2019 | | | 491,166 | |
| | | 410,000 | | | 6.88%, 03/15/2025 | | | 366,950 | |
| | | 140,000 | | | 7.13%, 03/15/2026 | | | 124,950 | |
| | | 675,000 | | | 7.75%, 10/01/2021 | | | 677,531 | |
| | | 1,730,000 | | | 8.25%, 12/15/2020 | | | 1,790,550 | |
| | | 720,000 | | | Tempo Acquisition LLC / Tempo Acquisition Finance Corp. 6.75%, 06/01/2025(3) | | | 666,000 | |
| | | 285,000 | | | Vantiv LLC / Vantiv Issuer Corp. 4.38%, 11/15/2025(3) | | | 260,775 | |
| | | | | | | | | | |
| | | 10,607,417 | |
| | | | | | | | | | |
| | | | Electric - 0.9% | |
| | | 2,220,000 | | | AES Corp. 5.13%, 09/01/2027 | | | 2,131,200 | |
| | | | | | | | | | |
| | | | Electrical Components & Equipment - 0.5% | |
| EUR | | | 1,085,000 | | | Energizer Gamma Acquisition B.V. 4.63%, 07/15/2026(3) | | | 1,162,334 | |
| | | | | | | | | | |
| | | | Entertainment - 2.6% | |
| $ | | | 1,150,000 | | | Caesars Resort Collection LLC / CRC Finco, Inc. 5.25%, 10/15/2025(3) | | | 989,000 | |
The accompanying notes are an integral part of these financial statements.
|
| Hartford High Yield HLS Fund |
Schedule of Investments – (continued)
December 31, 2018
| | | | | | | | | | |
| Shares or Principal Amount | | Market Value† | |
|
| CORPORATE BONDS - 88.6% - (continued) | |
| | | | Entertainment - 2.6% - (continued) | |
| | | Eldorado Resorts, Inc. | |
| $ | | | 1,350,000 | | | 6.00%, 04/01/2025 | | $ | 1,302,264 | |
| | | 195,000 | | | 6.00%, 09/15/2026(3) | | | 184,275 | |
| | | 1,655,000 | | | Jacobs Entertainment, Inc. 7.88%, 02/01/2024(3) | | | 1,704,650 | |
| | | 1,880,000 | | | Penn National Gaming, Inc. 5.63%, 01/15/2027(3) | | | 1,682,600 | |
| | | 195,000 | | | Scientific Games International, Inc. 5.00%, 10/15/2025(3) | | | 174,038 | |
| | | 325,000 | | | WMG Acquisition Corp. 5.00%, 08/01/2023(3) | | | 316,062 | |
| | | | | | | | | | |
| | | 6,352,889 | |
| | | | | | | | | | |
| | | | | | Environmental Control - 0.8% | |
| | | 2,107,000 | | | Tervita Escrow Corp. 7.63%, 12/01/2021(3) | | | 2,006,918 | |
| | | | | | | | | | |
| | | | | | Food - 2.2% | |
| | | | | | Post Holdings, Inc. | |
| | | 2,510,000 | | | 5.00%, 08/15/2026(3) | | | 2,284,100 | |
| | | 1,151,000 | | | 5.63%, 01/15/2028(3) | | | 1,058,920 | |
| | | 660,000 | | | 5.75%, 03/01/2027(3) | | | 618,750 | |
| | | 1,665,000 | | | TreeHouse Foods, Inc. 4.88%, 03/15/2022 | | | 1,635,862 | |
| | | | | | | | | | |
| | | 5,597,632 | |
| | | | | | | | | | |
| | | | | | Healthcare - Products - 1.7% | |
| | | 1,420,000 | | | Avantor, Inc. 6.00%, 10/01/2024(3) | | | 1,395,150 | |
| | | 2,895,000 | | | Sotera Health Holdings LLC 6.50%, 05/15/2023(3) | | | 2,771,962 | |
| | | | | | | | | | |
| | | 4,167,112 | |
| | | | | | | | | | |
| | | | | | Healthcare - Services - 3.5% | |
| | | 1,835,000 | | | HCA Healthcare, Inc. 6.25%, 02/15/2021 | | | 1,876,287 | |
| | | | | | HCA, Inc. | |
| | | 670,000 | | | 5.25%, 06/15/2026 | | | 664,975 | |
| | | 1,085,000 | | | 5.38%, 02/01/2025 | | | 1,057,875 | |
| | | 1,430,000 | | | 5.38%, 09/01/2026 | | | 1,390,675 | |
| | | 1,599,000 | | | 7.50%, 11/15/2095 | | | 1,551,030 | |
| | | 2,340,000 | | | West Street Merger Sub, Inc. 6.38%, 09/01/2025(3) | | | 2,070,900 | |
| | | | | | | | | | |
| | | 8,611,742 | |
| | | | | | | | | | |
| | | | | | Home Builders - 3.1% | |
| | | | | | Beazer Homes USA, Inc. | |
| | | 370,000 | | | 5.88%, 10/15/2027 | | | 292,300 | |
| | | 525,000 | | | 6.75%, 03/15/2025 | | | 451,500 | |
| | | 1,120,000 | | | 8.75%, 03/15/2022 | | | 1,120,000 | |
| | | 1,310,000 | | | KB Home 8.00%, 03/15/2020 | | | 1,352,575 | |
| | | | | | M/I Homes, Inc. | |
| | | 150,000 | | | 5.63%, 08/01/2025 | | | 137,250 | |
| | | 2,115,000 | | | 6.75%, 01/15/2021 | | | 2,104,425 | |
| | | 1,690,000 | | | Taylor Morrison Communities, Inc. 6.63%, 05/15/2022 | | | 1,692,112 | |
| | | 700,000 | | | TRI Pointe Group, Inc. / TRI Pointe Homes, Inc. 5.88%, 06/15/2024 | | | 624,750 | |
| | | | | | | | | | |
| | | 7,774,912 | |
| | | | | | | | | | |
| | | | | | Household Products - 0.5% | |
| $ | | | 2,400,000 | | | Revlon Consumer Products Corp. 6.25%, 08/01/2024 | | | 1,272,000 | |
| | | | | | | | | | |
| | | | Household Products/Wares - 0.5% | |
| EUR | | | 1,320,000 | | | Diamond (BC) B.V. 5.63%, 08/15/2025(3) | | | 1,285,531 | |
| | | | | | | | | | |
| | | | Insurance - 1.3% | |
| | | Genworth Holdings, Inc. | |
| $ | | | 110,000 | | | 4.80%, 02/15/2024 | | | 90,750 | |
| | | 770,000 | | | 4.90%, 08/15/2023 | | | 637,175 | |
| | | 440,000 | | | 7.20%, 02/15/2021 | | | 433,400 | |
| | | 245,000 | | | 7.63%, 09/24/2021 | | | 241,938 | |
| | | 35,000 | | | 7.70%, 06/15/2020 | | | 35,350 | |
| | | 1,910,000 | | | USIS Merger Sub, Inc. 6.88%, 05/01/2025(3) | | | 1,753,571 | |
| | | | | | | | | | |
| | | 3,192,184 | |
| | | | | | | | | | |
| | | | | | | | | | |
| Shares or Principal Amount | | Market Value† | |
|
| CORPORATE BONDS - 88.6% - (continued) | |
| | | | Iron/Steel - 1.1% | |
| | | AK Steel Corp. | |
| $ | | | 760,000 | | | 7.00%, 03/15/2027 | | $ | 592,800 | |
| | | 1,015,000 | | | 7.63%, 10/01/2021 | | | 916,037 | |
| | | Steel Dynamics, Inc. | |
| | | 230,000 | | | 4.13%, 09/15/2025 | | | 211,313 | |
| | | 1,130,000 | | | 5.50%, 10/01/2024 | | | 1,118,700 | |
| | | | | | | | | | |
| | | 2,838,850 | |
| | | | | | | | | | |
| | | | Lodging - 3.1% | |
| | | Boyd Gaming Corp. | |
| | | 790,000 | | | 6.00%, 08/15/2026 | | | 738,650 | |
| | | 920,000 | | | 6.38%, 04/01/2026 | | | 890,100 | |
| | | 1,935,000 | | | FelCor Lodging L.P. 6.00%, 06/01/2025 | | | 1,978,537 | |
| | | 1,630,000 | | | Jack Ohio Finance LLC / Jack Ohio Finance Corp. 6.75%, 11/15/2021(3) | | | 1,646,300 | |
| | | 1,170,000 | | | Station Casinos LLC 5.00%, 10/01/2025(3) | | | 1,058,850 | |
| | | 1,585,000 | | | Sugarhouse HSP Gaming Prop Mezz L.P. / Sugarhouse HSP Gaming Finance Corp.
5.88%, 05/15/2025(3) | | | 1,481,975 | |
| | | | | | | | | | |
| | | 7,794,412 | |
| | | | | | | | | | |
| | | | Machinery - Diversified - 1.1% | |
| | | 1,935,000 | | | Cloud Crane LLC 10.13%, 08/01/2024(3) | | | 1,988,213 | |
| | | 795,000 | | | Stevens Holding Co., Inc. 6.13%, 10/01/2026(3) | | | 783,075 | |
| | | | | | | | | | |
| | | 2,771,288 | |
| | | | | | | | | | |
| | | | | | Media - 9.8% | |
| | | | | | Altice France S.A. | |
| | | 2,370,000 | | | 7.38%, 05/01/2026(3) | | | 2,174,475 | |
| | | 1,375,000 | | | 8.13%, 02/01/2027(3) | | | 1,295,937 | |
| | | 1,610,000 | | | Altice Luxembourg S.A. 7.75%, 05/15/2022(3) | | | 1,465,100 | |
| | | | | | CCO Holdings LLC / CCO Holdings Capital Corp. | |
| | | 120,000 | | | 5.13%, 02/15/2023 | | | 117,000 | |
| | | 245,000 | | | 5.13%, 05/01/2023(3) | | | 238,263 | |
| | | 95,000 | | | 5.25%, 09/30/2022 | | | 94,169 | |
| | | 545,000 | | | 5.75%, 09/01/2023 | | | 542,275 | |
| | | 105,000 | | | 5.75%, 01/15/2024 | | | 103,950 | |
| | | 3,000,000 | | | 5.75%, 02/15/2026(3) | | | 2,940,000 | |
| | | | | | CSC Holdings LLC | |
| | | 1,775,000 | | | 5.13%, 12/15/2021(3) | | | 1,739,500 | |
| | | 1,195,000 | | | 5.25%, 06/01/2024 | | | 1,094,919 | |
| | | 585,000 | | | 5.50%, 04/15/2027(3) | | | 544,050 | |
| | | | | | DISH DBS Corp. | |
| | | 830,000 | | | 5.00%, 03/15/2023 | | | 690,975 | |
| | | 595,000 | | | 5.88%, 07/15/2022 | | | 547,400 | |
| | | 945,000 | | | 6.75%, 06/01/2021 | | | 935,267 | |
| | | 556,000 | | | 7.88%, 09/01/2019 | | | 567,287 | |
| | | | | | Gray Television, Inc. | |
| | | 1,255,000 | | | 5.13%, 10/15/2024(3) | | | 1,157,110 | |
| | | 380,000 | | | 5.88%, 07/15/2026(3) | | | 354,274 | |
| | | 1,089,000 | | | Liberty Interactive LLC 8.25%, 02/01/2030 | | | 1,061,775 | |
| | | | | | Sinclair Television Group, Inc. | |
| | | 520,000 | | | 5.13%, 02/15/2027(3) | | | 458,900 | |
| | | 1,055,000 | | | 5.88%, 03/15/2026(3) | | | 983,787 | |
| | | | | | TEGNA, Inc. | |
| | | 1,515,000 | | | 4.88%, 09/15/2021(3) | | | 1,480,912 | |
| | | 1,528,000 | | | 5.13%, 10/15/2019 | | | 1,527,282 | |
| | | 1,565,000 | | | Tribune Media Co. 5.88%, 07/15/2022 | | | 1,572,825 | |
| | | 817,000 | | | WMG Acquisition Corp. 5.50%, 04/15/2026(3) | | | 780,235 | |
| | | | | | | | | | |
| | | | | | | | | 24,467,667 | |
| | | | | | | | | | |
| | | | | | Metal Fabricate/Hardware - 0.8% | |
| | | | | | Novelis Corp. | |
| | | 605,000 | | | 5.88%, 09/30/2026(3) | | | 535,425 | |
| | | 1,115,000 | | | 6.25%, 08/15/2024(3) | | | 1,048,100 | |
The accompanying notes are an integral part of these financial statements.
|
| Hartford High Yield HLS Fund |
Schedule of Investments – (continued)
December 31, 2018
| | | | | | | | | | |
| Shares or Principal Amount | | Market Value† | |
|
| CORPORATE BONDS - 88.6% - (continued) | |
| | | | | | Metal Fabricate/Hardware - 0.8% - (continued) | |
| $ | | | 340,000 | | | TriMas Corp. 4.88%, 10/15/2025(3) | | $ | 313,650 | |
| | | | | | | | | | |
| | | | | | | | | 1,897,175 | |
| | | | | | | | | | |
| | | | | | Mining - 1.6% | |
| | | 1,075,000 | | | Alcoa Nederland Holding B.V. 6.13%, 05/15/2028(3) | | | 1,029,313 | |
| | | 520,000 | | | Constellium N.V. 5.88%, 02/15/2026(3) | | | 462,800 | |
| | | | | | First Quantum Minerals Ltd. | |
| | | 760,000 | | | 7.00%, 02/15/2021(3) | | | 729,600 | |
| | | 615,000 | | | 7.50%, 04/01/2025(3) | | | 507,375 | |
| | | | | | New Gold, Inc. | |
| | | 105,000 | | | 6.25%, 11/15/2022(3) | | | 88,200 | |
| | | 1,510,000 | | | 6.38%, 05/15/2025(3) | | | 1,147,600 | |
| | | | | | | | | | |
| | | | | | | | | 3,964,888 | |
| | | | | | | | | | |
| | | | | | Miscellaneous Manufacturing - 0.7% | |
| | | 1,785,000 | | | Bombardier, Inc. 6.13%, 01/15/2023(3) | | | 1,673,438 | |
| | | | | | | | | | |
| | | | | | Office/Business Equipment - 0.4% | |
| | | | | | Pitney Bowes, Inc. | |
| | | 280,000 | | | 4.63%, 03/15/2024 | | | 236,423 | |
| | | 270,000 | | | 4.70%, 04/01/2023 | | | 238,275 | |
| | | 460,000 | | | Xerox Corp. 3.63%, 03/15/2023 | | | 413,840 | |
| | | | | | | | | | |
| | | | | | | | | 888,538 | |
| | | | | | | | | | |
| | | | | | Oil & Gas - 7.5% | |
| | | 2,260,000 | | | Blue Racer Midstream LLC / Blue Racer Finance Corp. 6.13%, 11/15/2022(3) | | | 2,180,900 | |
| | | 875,000 | | | California Resources Corp. 8.00%, 12/15/2022(3) | | | 592,813 | |
| | | | | | Chesapeake Energy Corp. | |
| | | 1,410,000 | | | 7.00%, 10/01/2024 | | | 1,219,650 | |
| | | 915,000 | | | 7.50%, 10/01/2026 | | | 782,325 | |
| | | 1,430,000 | | | Energen Corp. 4.63%, 09/01/2021 | | | 1,415,700 | |
| | | 1,355,000 | | | Jagged Peak Energy LLC 5.88%, 05/01/2026(3) | | | 1,260,150 | |
| | | 885,000 | | | Matador Resources Co. 5.88%, 09/15/2026 | | | 814,200 | |
| | | | | | MEG Energy Corp. | |
| | | 220,000 | | | 6.38%, 01/30/2023(3) | | | 207,900 | |
| | | 1,090,000 | | | 6.50%, 01/15/2025(3) | | | 1,106,350 | |
| | | 910,000 | | | 7.00%, 03/31/2024(3) | | | 869,050 | |
| | | | | | QEP Resources, Inc. | |
| | | 1,895,000 | | | 5.25%, 05/01/2023 | | | 1,677,075 | |
| | | 205,000 | | | 5.38%, 10/01/2022 | | | 186,550 | |
| | | 150,000 | | | 5.63%, 03/01/2026 | | | 124,500 | |
| | | 245,000 | | | 6.80%, 03/01/2020 | | | 246,531 | |
| | | | | | SM Energy Co. | |
| | | 1,680,000 | | | 5.00%, 01/15/2024 | | | 1,461,600 | |
| | | 240,000 | | | 6.13%, 11/15/2022 | | | 226,800 | |
| | | 420,000 | | | 6.63%, 01/15/2027 | | | 371,700 | |
| | | 530,000 | | | Tullow Oil plc 6.25%, 04/15/2022(3) | | | 510,125 | |
| | | 1,875,000 | | | Vine Oil & Gas L.P. / Vine Oil & Gas Finance Corp. 8.75%, 04/15/2023(3) | | | 1,481,250 | |
| | | | | | WPX Energy, Inc. | |
| | | 1,170,000 | | | 5.25%, 09/15/2024 | | | 1,058,850 | |
| | | 270,000 | | | 5.75%, 06/01/2026 | | | 244,350 | |
| | | 384,000 | | | 6.00%, 01/15/2022 | | | 373,440 | |
| | | 295,000 | | | 8.25%, 08/01/2023 | | | 308,275 | |
| | | | | | | | | | �� |
| | | | | | | | | 18,720,084 | |
| | | | | | | | | | |
| | | | | | Oil & Gas Services - 0.2% | |
| | | | | | Weatherford International Ltd. | |
| | | 250,000 | | | 5.95%, 04/15/2042 | | | 127,188 | |
| | | 660,000 | | | 6.50%, 08/01/2036 | | | 343,200 | |
| | | 250,000 | | | 7.00%, 03/15/2038 | | | 129,375 | |
| | | | | | | | | | |
| | | | | | | | | 599,763 | |
| | | | | | | | | | |
| | | | | | Packaging & Containers - 5.3% | |
| | | 1,700,000 | | | ARD Finance S.A. (PIK 7.88%) 7.13%, 09/15/2023(5) | | | 1,525,750 | |
| | | | | | | | | | |
| Shares or Principal Amount | | Market Value† | |
|
| CORPORATE BONDS - 88.6% - (continued) | |
| | | | | | Packaging & Containers - 5.3% - (continued) | |
| | | | | | Ardagh Packaging Finance plc / Ardagh Holdings USA, Inc. | | | | |
| $ | | | 340,000 | | | 6.00%, 02/15/2025(3) | | $ | 313,861 | |
| | | 305,000 | | | 7.25%, 05/15/2024(3) | | | 304,238 | |
| | | 2,060,000 | | | Berry Global, Inc. 6.00%, 10/15/2022 | | | 2,080,600 | |
| | | 1,015,000 | | | Crown Americas LLC / Crown Americas Capital Corp. 4.75%, 02/01/2026(3) | | | 956,637 | |
| | | | | | Flex Acquisition Co., Inc. | |
| | | 1,875,000 | | | 6.88%, 01/15/2025(3) | | | 1,668,750 | |
| | | 575,000 | | | 7.88%, 07/15/2026(3) | | | 517,500 | |
| | | 1,410,000 | | | Multi-Color Corp. 4.88%, 11/01/2025(3) | | | 1,212,600 | |
| | | 535,000 | | | OI European Group B.V. 4.00%, 03/15/2023(3) | | | 500,225 | |
| | | 1,470,000 | | | Plastipak Holdings, Inc. 6.25%, 10/15/2025(3) | | | 1,300,950 | |
| | | | | | Reynolds Group Issuer, Inc. / Reynolds Group Issuer LLC / Reynolds Group Issuer Lu | |
| | | 2,070,000 | | | 5.13%, 07/15/2023(3) | | | 1,971,675 | |
| | | 805,000 | | | 7.00%, 07/15/2024(3) | | | 766,762 | |
| | | | | | | | | | |
| | | | | | | | | 13,119,548 | |
| | | | | | | | | | |
| | | | | | Pharmaceuticals - 4.1% | |
| | | | | | Bausch Health Cos., Inc. | |
| | | 1,720,000 | | | 5.50%, 03/01/2023(3) | | | 1,573,800 | |
| | | 4,360,000 | | | 5.88%, 05/15/2023(3) | | | 4,033,000 | |
| | | 700,000 | | | 6.13%, 04/15/2025(3) | | | 610,750 | |
| | | 240,000 | | | 7.00%, 03/15/2024(3) | | | 242,400 | |
| | | 280,000 | | | Catalent Pharma Solutions, Inc. 4.88%, 01/15/2026(3) | | | 265,300 | |
| | | | | | Endo Dac / Endo Finance LLC / Endo Finco, Inc. | |
| | | 736,000 | | | 6.00%, 07/15/2023(3) | | | 561,200 | |
| | | 1,495,000 | | | 6.00%, 02/01/2025(3) | | | 1,072,663 | |
| | | 910,000 | | | Teva Pharmaceutical Finance LLC 2.25%, 03/18/2020 | | | 885,559 | |
| | | | | | Teva Pharmaceutical Finance Netherlands B.V. | |
| | | 620,000 | | | 3.15%, 10/01/2026 | | | 473,193 | |
| | | 640,000 | | | 6.75%, 03/01/2028 | | | 620,122 | |
| | | | | | | | | | |
| | | | | | | | | 10,337,987 | |
| | | | | | | | | | |
| | | | | | Pipelines - 1.5% | |
| | | 905,000 | | | Cheniere Corpus Christi Holdings LLC 5.13%, 06/30/2027 | | | 854,365 | |
| | | | | | Energy Transfer L.P. | |
| | | 230,000 | | | 4.25%, 03/15/2023 | | | 221,375 | |
| | | 1,773,000 | | | 7.50%, 10/15/2020 | | | 1,843,920 | |
| | | 950,000 | | | Tallgrass Energy Partners L.P. / Tallgrass Energy Finance Corp. 4.75%, 10/01/2023(3) | | | 916,750 | |
| | | | | | | | | | |
| | | | | | | | | 3,836,410 | |
| | | | | | | | | | |
| | | | | | Retail - 3.8% | |
| | | 3,670,000 | | | 1011778 BC ULC / New Red Finance, Inc. 5.00%, 10/15/2025(3) | | | 3,376,400 | |
| | | 895,000 | | | Beacon Roofing Supply, Inc. 4.88%, 11/01/2025(3) | | | 786,481 | |
| | | | | | L Brands, Inc. | |
| | | 925,000 | | | 5.25%, 02/01/2028 | | | 790,875 | |
| | | 185,000 | | | 6.75%, 07/01/2036 | | | 150,775 | |
| | | 85,000 | | | 6.88%, 11/01/2035 | | | 70,992 | |
| | | 965,000 | | | PetSmart, Inc. 5.88%, 06/01/2025(3) | | | 697,213 | |
| | | 1,200,000 | | | Staples, Inc. 8.50%, 09/15/2025(3) | | | 1,082,640 | |
| | | 2,890,000 | | | United Rentals North America, Inc. 4.88%, 01/15/2028 | | | 2,535,975 | |
| | | | | | | | | | |
| | | | | | | | | 9,491,351 | |
| | | | | | | | | | |
| | | | | | Semiconductors - 1.8% | |
| | | 765,000 | | | Entegris, Inc. 4.63%, 02/10/2026(3) | | | 703,800 | |
| | | 1,865,000 | | | Micron Technology, Inc. 5.50%, 02/01/2025 | | | 1,825,369 | |
| | | | | | Sensata Technologies B.V. | |
| | | 1,221,000 | | | 5.00%, 10/01/2025(3) | | | 1,147,740 | |
| | | 900,000 | | | 5.63%, 11/01/2024(3) | | | 886,500 | |
| | | | | | | | | | |
| | | | | | | | | 4,563,409 | |
| | | | | | | | | | |
The accompanying notes are an integral part of these financial statements.
|
| Hartford High Yield HLS Fund |
Schedule of Investments – (continued)
December 31, 2018
| | | | | | | | | | |
| Shares or Principal Amount | | Market Value† | |
|
| CORPORATE BONDS - 88.6% - (continued) | |
| | | | | | Software - 2.5% | |
| $ | | | 980,000 | | | Change Healthcare Holdings LLC / Change Healthcare Finance, Inc. 5.75%, 03/01/2025(3) | | $ | 913,850 | |
| | | | | | First Data Corp. | |
| | | 1,425,000 | | | 5.38%, 08/15/2023(3) | | | 1,400,063 | |
| | | 1,361,000 | | | 5.75%, 01/15/2024(3) | | | 1,326,975 | |
| | | 684,000 | | | Infor Software Parent LLC (7.13% Cash, 7.88% PIK) 7.13%, 05/01/2021(3)(5) | | | 665,190 | |
| | | 2,075,000 | | | Infor U.S., Inc. 6.50%, 05/15/2022 | | | 2,006,836 | |
| | | | | | | | | | |
| | | | | | | | | 6,312,914 | |
| | | | | | | | | | |
| | | | | | Telecommunications - 6.7% | |
| | | | | | Altice Financing S.A. | |
| | | 380,000 | | | 6.63%, 02/15/2023(3) | | | 364,800 | |
| | | 2,270,000 | | | 7.50%, 05/15/2026(3) | | | 2,071,375 | |
| | | | | | CenturyLink, Inc. | |
| | | 2,144,000 | | | 5.63%, 04/01/2025 | | | 1,886,720 | |
| | | 466,000 | | | 7.50%, 04/01/2024 | | | 449,690 | |
| | | 1,010,000 | | | Embarq Corp. 8.00%, 06/01/2036 | | | 914,050 | |
| | | 1,395,000 | | | Frontier Communications Corp. 8.50%, 04/01/2026(3) | | | 1,220,625 | |
| | | 1,390,000 | | | Intelsat Jackson Holdings S.A. 8.50%, 10/15/2024(3) | | | 1,348,300 | |
| | | 800,000 | | | Sprint Capital Corp. 6.88%, 11/15/2028 | | | 756,000 | |
| | | | | | Sprint Corp. | |
| | | 416,000 | | | 7.13%, 06/15/2024 | | | 411,981 | |
| | | 2,495,000 | | | 7.25%, 09/15/2021 | | | 2,553,633 | |
| | | 710,000 | | | 7.63%, 02/15/2025 | | | 710,000 | |
| | | 2,694,000 | | | 7.88%, 09/15/2023 | | | 2,764,717 | |
| | | 480,000 | | | Telecom Italia Capital S.A. 7.20%, 07/18/2036 | | | 458,400 | |
| | | 725,000 | | | Telecom Italia S.p.A. 5.30%, 05/30/2024(3) | | | 688,750 | |
| | | | | | | | | | |
| | | | | | | | | 16,599,041 | |
| | | | | | | | | | |
| | | | | | Textiles - 0.5% | |
| | | 1,395,000 | | | Eagle Intermediate Global Holding B.V./Ruyi US Finance LLC 7.50%, 05/01/2025(3) | | | 1,305,023 | |
| | | | | | | | | | |
| | | |
| | | | | | Total Corporate Bonds
(cost $236,513,751) | | $ | 220,987,142 | |
| | | | | | | | | | |
| |
| | | SENIOR FLOATING RATE INTERESTS - 5.8%(9) | |
| | | | | | Chemicals - 0.1% | |
| | | 245,000 | | | Starfruit Finco B.V1 mo. USD LIBOR + 3.250%, 5.60%, 10/01/2025 | | $ | 233,975 | |
| | | | | | | | | | |
| | | | | | Commercial Services - 0.5% | |
| | | 766,150 | | | Blackhawk Network Holdings, Inc.1 mo. USD LIBOR + 3.000%, 5.52%, 06/15/2025 | | | 727,367 | |
| | | 646,750 | | | Trans Union LLC 1 mo. USD LIBOR + 2.000%, 4.52%, 06/19/2025 | | | 622,497 | |
| | | | | | | | | | |
| | | | | | | | | 1,349,864 | |
| | | | | | | | | | |
| | | | | | Diversified Financial Services - 0.4% | |
| | | 858,513 | | | Crown Finance U.S., Inc. 1 mo. USD LIBOR + 2.500%, 5.02%, 02/28/2025 | | | 809,860 | |
| | | 236,766 | | | SS&C Technologies Holdings Europe S.a.r.l. 1 mo. USD LIBOR + 2.250%, 4.77%, 04/16/2025 | | | 222,899 | |
| | | | | | | | | | |
| | | | | | | | | 1,032,759 | |
| | | | | | | | | | |
| | | | | | Food - 0.1% | |
| | | 248,750 | | | CHG PPC Parent LLC 1 mo. USD LIBOR + 2.750%, 5.27%, 03/31/2025 | | | 238,178 | |
| | | | | | | | | | |
| | | | | | Gas - 0.1% | |
| | | 275,000 | | | Messer Industries LLC 0.00%, 10/01/2025(10) | | | 260,334 | |
| | | | | | | | | | |
| | | | | | Healthcare-Services - 0.4% | |
| | | 908,119 | | | Syneos Health, Inc. 1 mo. USD LIBOR + 2.000%, 4.52%, 08/01/2024 | | | 874,636 | |
| | | | | | | | | | |
| | | | | | | | | | |
| Shares or Principal Amount | | Market Value† | |
|
| SENIOR FLOATING RATE INTERESTS - 5.8%(9) - (continued) | |
| | | | | | Household Products - 0.2% | |
| $ | | | 475,200 | | | Diamond (BC) B.V. 2 mo. USD LIBOR + 3.000%, 5.53%, 09/06/2024 | | $ | 437,184 | |
| | | | | | | | | | |
| | | | | | Insurance - 1.0% | |
| | | 1,776,075 | | | Asurion LLC 1 mo. USD LIBOR + 3.000%, 5.52%, 11/03/2024 | | | 1,695,601 | |
| | | 178,650 | | | Genworth Holdings, Inc. 1 mo. USD LIBOR + 4.500%, 6.96%, 03/07/2023 | | | 175,077 | |
| | | 786,050 | | | Hub International Ltd. 2 mo. USD LIBOR + 2.750%, 5.24%, 04/25/2025 | | | 740,609 | |
| | | | | | | | | | |
| | | | | | | | | 2,611,287 | |
| | | | | | | | | | |
| | | | | | Internet - 0.5% | |
| | | 1,246,909 | | | Lands’ End, Inc. 1 mo. USD LIBOR + 3.250%, 5.77%, 04/04/2021 | | | 1,170,536 | |
| | | | | | | | | | |
| | | | | | Leisure Time - 0.7% | |
| | | 1,950,300 | | | Golden Entertainment, Inc. 1 mo. USD LIBOR + 3.000%, 5.53%, 10/21/2024 | | | 1,862,537 | |
| | | | | | | | | | |
| | | | | | Machinery - Diversified - 0.2% | |
| | | 505,552 | | | Gardner Denver, Inc. 3 mo. USD LIBOR + 2.750%, 5.27%, 07/30/2024 | | | 487,069 | |
| | | | | | | | | | |
| | | | | | Media - 1.1% | |
| | | 1,419,275 | | | PSAV Holdings LLC 3 mo. USD LIBOR + 3.250%, 5.89%, 03/01/2025 | | | 1,341,215 | |
| | | 1,353,209 | | | Shutterfly, Inc. 1 mo. USD LIBOR + 2.750%, 5.28%, 08/17/2024 | | | 1,306,699 | |
| | | | | | | | | | |
| | | | | | | | | 2,647,914 | |
| | | | | | | | | | |
| | | | | | Semiconductors - 0.2% | |
| | | 574,252 | | | Microchip Technology, Inc. 1 mo. USD LIBOR + 2.000%, 4.53%, 05/29/2025 | | | 543,145 | |
| | | | | | | | | | |
| | | | | | Software - 0.3% | |
| | | 788,781 | | | SS&C Technologies, Inc. 1 mo. USD LIBOR + 2.250%, 4.77%, 04/16/2025 | | | 742,656 | |
| | | | | | | | | | |
| | | |
| | | | | | Total Senior Floating Rate Interests
(cost $15,207,845) | | $ | 14,492,074 | |
| | | | | | | | | | |
|
| CONVERTIBLE BONDS - 1.1% | |
| | | | | | Commercial Services - 0.3% | |
| | | 690,000 | | | Cardtronics, Inc. 1.00%, 12/01/2020 | | $ | 639,057 | |
| | | | | | | | | | |
| | | | | | Media - 0.2% | |
| | | 750,000 | | | DISH Network Corp. 3.38%, 08/15/2026 | | | 605,637 | |
| | | | | | | | | | |
| | | | | | Oil & Gas - 0.0% | |
| | | 1,790,000 | | | Cobalt International Energy, Inc. 2.63%, 12/01/2019(4) | | | 2,327 | |
| | | | | | | | | | |
| | | | | | Semiconductors - 0.3% | |
| | | | | | Microchip Technology, Inc. | |
| | | 315,000 | | | 1.63%, 02/15/2027 | | | 307,690 | |
| | | 309,000 | | | 2.25%, 02/15/2037 | | | 302,995 | |
| | | | | | | | | | |
| | | | | | | | | 610,685 | |
| | | | | | | | | | |
| | | | | | Software - 0.3% | |
| | | 1,052,000 | | | Western Digital Corp. 1.50%, 02/01/2024(3) | | | 852,542 | |
| | | | | | | | | | |
| | | |
| | | | | | Total Convertible Bonds
(cost $5,091,453) | | $ | 2,710,248 | |
| | | | | | | | | | |
|
| ESCROWS - 0.0%(11) | |
| | | | | | Electric - 0.0% | |
| | | 415,000 | | | Texas Competitive Electric Holdings Co. LLC 11.50%, 10/01/2020(1)(2)(4) | | $ | — | |
| | | | | | | | | | |
The accompanying notes are an integral part of these financial statements.
|
| Hartford High Yield HLS Fund |
Schedule of Investments – (continued)
December 31, 2018
| | | | | | | | | | |
| Shares or Principal Amount | | Market Value† | |
|
| ESCROWS - 0.0%(11) - (continued) | |
| | | | | | Energy - Alternate Sources - 0.0% | |
| $ | | | 4,525,000 | | | TCEH Corp.*(1)(2) | | $ | 4 | |
| | | 82,554 | | | Vistra Energy Corp.* | | | 61,503 | |
| | | | | | | | | | |
| | | | | | | | | 61,507 | |
| | | | | | | | | | |
| | | |
| | | | | | Total Escrows
(cost $— ) | | $ | 61,507 | |
| | | | | | | | | | |
| | | |
| | | | | | Total Long-Term Investments
(cost $264,374,495) | | $ | 240,412,172 | |
| | | | | | | | | | |
|
| SHORT-TERM INVESTMENTS - 2.1% | |
| | | | | | Other Investment Pools & Funds - 2.1% | |
| | | 5,356,712 | | | Fidelity Investments Money Market Funds, Government Portfolio, Institutional Class, 2.35%(12) | | $ | 5,356,712 | |
| | | | | | | | | | |
| | | |
| | | | | | Total Short-Term Investments
(cost $5,356,712) | | $ | 5,356,712 | |
| | | | | | | | | | |
| | | | | | | | | | | | |
| | | |
| | | | Total Investments
(cost $269,731,207) | | | 98.5 | % | | $ | 245,768,884 | |
| | | | Other Assets and Liabilities | | | 1.5 | % | | | 3,638,323 | |
| | | | | | | | | | | | |
| | | | Total Net Assets | | | 100.0 | % | | $ | 249,407,207 | |
| | | | | | | | | | | | |
| Note: | Percentage of investments as shown is the ratio of the total market value to total net assets. |
| | The Fund may refer to any one or more of the industry classifications used by one or more widely recognized market indices, ratings group and/or as defined by Fund management. Industry classifications may not be identical across all security types. |
| | Equity Industry classifications used in this report are the Global Industry Classification Standard, which was developed by and is the exclusive property and service mark of MSCI, Inc. and Standard & Poor’s. |
| | For Fund compliance purposes, the Fund may not use the same classification system. These classifications are used for financial reporting purposes. |
| (1) | Investment valued using significant unobservable inputs. |
| (2) | These securities are valued in good faith at fair value as determined under policies and procedures established by and under the supervision of the Board of Directors. At December 31, 2018, the aggregate fair value of these securities was $849,239, which represented 0.3% of total net assets. This amount excludes securities that are principally traded in certain foreign markets and whose prices are adjusted pursuant to a third party pricing service methodology approved by the Board of Directors. |
| (3) | Security was purchased pursuant to Rule 144A under the Securities Act of 1933 and may be sold in transactions that are exempt from registration (typically only to qualified institutional buyers) or in a public offering registered under the Securities Act of 1933. At December 31, 2018, the aggregate value of these securities was $120,677,122, representing 48.4% of net assets. |
| (4) | Non-income producing. For long-term debt securities, items identified are in default as to payment of interest and/or principal. |
| (5) | Security has the ability to pay in kind (“PIK”) or pay income in cash. When applicable, separate rates of such payments are disclosed. |
| (6) | Perpetual maturity security. Maturity date shown is the next call date or final legal maturity date, whichever comes first. |
| (7) | Variable rate securities; the rate reported is the coupon rate in effect at December 31, 2018. |
| (8) | Security is exempt from registration under Regulation S under the Securities Act of 1933, which exempts from registration securities offered and sold outside of the United States. Security may not be offered or sold in the United States except pursuant to an exemption from, or in a transaction not subject to, the registration requirements of the Securities Act of 1933. At December 31, 2018, the aggregate value of these securities was $5,973,917, representing 2.4% of net assets. |
| (9) | Senior floating rate interests generally pay interest rates which are periodically adjusted by reference to a base short-term, floating lending rate plus a premium. The base lending rates are primarily the LIBOR, and secondarily the prime rate offered by one or more major United States banks (the “Prime Rate”) and the certificate of deposit rate or other base lending rates used by commercial lenders. Senior floating rate interests often require prepayments from excess cash flows or permit the borrower to repay at its election. The rate at which the borrower repays cannot be predicted with accuracy. As a result, the actual remaining maturity may be substantially less than the stated maturities shown. Unless otherwise noted, the interest rate disclosed for these securities represents the rate in effect as of December 31, 2018. |
| (10) | Represents an unsettled loan commitment. The coupon rate will be determined at time of settlement. |
| (11) | Share amount represents shares of the issuer previously held that resulted in receipt of the escrow. |
| (12) | Current yield as of period end. |
| (13) | Investment in securities not registered under the Securities Act of 1933 (excluding securities acquired pursuant to Rule 144A and Regulation S). At the end of the period, the value of such restricted securities amounted to $849,235 or 0.3% of net assets. |
| | | | | | | | | | | | | | | | |
Period
Acquired | | | Security Name | | Shares/
Par Value | | | Base
Total Cost | | | Base
Market Value | |
| | 03/2011 | | | KCA Deutag | | | 206,275,142 | | | $ | 2,795,441 | | | $ | 849,235 | |
| | | | | | | | | | | | | | | | | | | | | | | | |
| Foreign Currency Contracts Outstanding at December 31, 2018 | |
Amount and Description of
Currency to be Purchased | | Amount and Description of
Currency to be Sold | | Counterparty | | Settlement
Date | | | Appreciation | | | Depreciation | |
| | 5,732,327 | | | USD | | | 4,976,000 | | | EUR | | BOA | | | 01/31/19 | | | $ | 15,850 | | | $ | — | |
| | | | | | | | | | | | | | | | | | | | | | | | |
| † | See Significant Accounting Policies of accompanying Notes to Financial Statements regarding valuation of investments. |
The accompanying notes are an integral part of these financial statements.
|
| Hartford High Yield HLS Fund |
Schedule of Investments – (continued)
December 31, 2018
| | |
| GLOSSARY: (abbreviations used in preceding Schedule of Investments) |
|
| Counterparty Abbreviations: |
BOA | | Banc of America Securities LLC |
|
| Currency Abbreviations: |
EUR | | Euro |
USD | | United States Dollar |
| | |
| Other Abbreviations: |
LIBOR | | London Interbank Offered Rate |
PIK | | Payment-in-kind |
Fair Valuation Summary
The following is a summary of the fair valuations according to the inputs used as of December 31, 2018 in valuing the Fund’s investments.
| | | | | | | | | | | | | | | | |
Description | | Total | | | Level 1 | | | Level 2 | | | Level 3(1) | |
Assets | |
Common Stocks | |
Consumer Services | | $ | 399,252 | | | $ | 399,252 | | | $ | — | | | $ | — | |
Diversified Financials | | | 510,090 | | | | 510,090 | | | | — | | | | — | |
Energy | | | 849,235 | | | | — | | | | — | | | | 849,235 | |
Materials | | | 402,624 | | | | 402,624 | | | | — | | | | — | |
Asset & Commercial Mortgage Backed Securities | | | — | | | | — | | | | — | | | | — | |
Corporate Bonds | | | 220,987,142 | | | | — | | | | 220,987,142 | | | | — | |
Senior Floating Rate Interests | | | 14,492,074 | | | | — | | | | 14,492,074 | | | | — | |
Convertible Bonds | | | 2,710,248 | | | | — | | | | 2,710,248 | | | | — | |
Escrows | | | 61,507 | | | | — | | | | 61,503 | | | | 4 | |
Short-Term Investments | | | 5,356,712 | | | | 5,356,712 | | | | — | | | | — | |
Foreign Currency Contracts(2) | | | 15,850 | | | | — | | | | 15,850 | | | | — | |
| | | | | | | | | | | | | | | | |
Total | | $ | 245,784,734 | | | $ | 6,668,678 | | | $ | 238,266,817 | | | $ | 849,239 | |
| | | | | | | | | | | | | | | | |
| (1) | For the year ended December 31, 2018, there were no transfers in and out of Level 3. |
| (2) | Derivative instruments (excluding purchased and written options, if applicable) are valued at the unrealized appreciation/(depreciation) on the investments. |
Level 3 investments at the beginning and/or end of the period in relation to net assets were not significant and accordingly, a reconciliation of Level 3 assets for the year ended December 31, 2018 is not presented.
The accompanying notes are an integral part of these financial statements.
|
| Hartford International Opportunities HLS Fund |
Schedule of Investments
December 31, 2018
| | | | | | | | |
| Shares or Principal Amount | | Market Value† | |
| COMMON STOCKS - 97.0% | |
| | | | Australia - 0.9% | |
| | 978,948 | | | Treasury Wine Estates Ltd. | | $ | 10,208,260 | |
| | | | | | | | |
| | | | Canada - 4.3% | |
| | 289,638 | | | Canadian National Railway Co. | | | 21,451,288 | |
| | 1,668,171 | | | Encana Corp. | | | 9,628,763 | |
| | 76,113 | | | Magna International, Inc. | | | 3,454,968 | |
| | 387,619 | | | TransCanada Corp. | | | 13,841,508 | |
| | | | | | | | |
| | | | | | | 48,376,527 | |
| | | | | | | | |
| | | | China - 12.3% | |
| | 40,999 | | | 58.com, Inc. ADR* | | | 2,222,556 | |
| | 177,473 | | | Alibaba Group Holding Ltd. ADR* | | | 24,326,224 | |
| | 20,690 | | | BeiGene Ltd. ADR* | | | 2,901,979 | |
| | 1,802,821 | | | China Merchants Bank Co., Ltd. Class H | | | 6,583,528 | |
| | 127,062,651 | | | China Tower Corp. Ltd. Class H*(1) | | | 24,027,700 | |
| | 1,174,776 | | | ENN Energy Holdings Ltd. | | | 10,441,132 | |
| | 2,436,000 | | | Kingdee International Software Group Co., Ltd. | | | 2,153,647 | |
| | 238,543 | | | New Oriental Education & Technology Group, Inc. ADR* | | | 13,074,542 | |
| | 125,100 | | | NIO, Inc. ADR*(2) | | | 796,887 | |
| | 2,094,501 | | | Ping An Insurance Group Co. of China Ltd. Class H(2) | | | 18,477,717 | |
| | 208,980 | | | Sunny Optical Technology Group Co., Ltd. | | | 1,858,676 | |
| | 697,752 | | | Tencent Holdings Ltd. | | | 27,966,125 | |
| | 297,800 | | | WuXi AppTec Co., Ltd. Class H*(1) | | | 2,586,093 | |
| | | | | | | | |
| | | | | | | 137,416,806 | |
| | | | | | | | |
| | | | Denmark - 0.5% | |
| | 81,760 | | | DSV A/S | | | 5,399,626 | |
| | | | | | | | |
| | | | Finland - 0.3% | |
| | 47,673 | | | Neste Oyj | | | 3,690,967 | |
| | | | | | | | |
| | | | France - 12.7% | |
| | 171,307 | | | Airbus SE | | | 16,332,364 | |
| | 86,417 | | | Capgemini SE | | | 8,595,466 | |
| | 170,014 | | | Cie Generale des Etablissements Michelin SCA | | | 16,733,963 | |
| | 68,819 | | | EssilorLuxottica S.A. | | | 8,723,350 | |
| | 2,720,495 | | | Natixis S.A. | | | 12,831,166 | |
| | 209,518 | | | Safran S.A. | | | 25,128,524 | |
| | 618,312 | | | TOTAL S.A. | | | 32,612,933 | |
| | 69,486 | | | Unibail-Rodamco-Westfield | | | 10,752,576 | |
| | 348,765 | | | Valeo S.A. | | | 10,171,935 | |
| | | | | | | | |
| | | | | | | 141,882,277 | |
| | | | | | | | |
| | | | Germany - 5.9% | |
| | 95,246 | | | Allianz SE | | | 19,140,175 | |
| | 38,795 | | | Beiersdorf AG | | | 4,046,412 | |
| | 1,120,052 | | | E.ON SE | | | 11,056,386 | |
| | 59,319 | | | Siemens AG | | | 6,620,093 | |
| | 571,279 | | | Vonovia SE | | | 25,752,631 | |
| | | | | | | | |
| | | | | | | 66,615,697 | |
| | | | | | | | |
| | | | Hong Kong - 0.4% | |
| | 487,800 | | | AIA Group Ltd. | | | 4,052,062 | |
| | | | | | | | |
| | | | India - 2.0% | |
| | 581,417 | | | HDFC Bank Ltd. | | | 17,669,447 | |
| | 1,596,812 | | | Power Grid Corp. of India Ltd. | | | 4,541,738 | |
| | | | | | | | |
| | | | | | | 22,211,185 | |
| | | | | | | | |
| | | | Israel - 0.6% | |
| | 463,904 | | | Teva Pharmaceutical Industries Ltd. ADR | | | 7,153,400 | |
| | | | | | | | |
| | | | Italy - 1.9% | |
| | 120,856 | | | Banca Generali S.p.A. | | | 2,512,503 | |
| | 132,100 | | | Ferrari N.V. | | | 13,144,481 | |
| | 436,298 | | | FinecoBank Banca Fineco S.p.A. | | | 4,389,778 | |
| | 239,698 | | | Pirelli & C. S.p.A.*(1) | | | 1,540,340 | |
| | | | | | | | |
| | | | | | | 21,587,102 | |
| | | | | | | | |
| | | | | | | | |
| Shares or Principal Amount | | Market Value† | |
| COMMON STOCKS - 97.0% - (continued) | |
| | | | Japan - 14.6% | |
| | 35,300 | | | Daikin Industries Ltd. | | $ | 3,750,817 | |
| | 363,515 | | | Daiwa House Industry Co., Ltd. | | | 11,595,555 | |
| | 72,800 | | | Eisai Co., Ltd. | | | 5,636,163 | |
| | 30,630 | | | FANUC Corp. | | | 4,648,396 | |
| | 15,396 | | | Keyence Corp. | | | 7,781,841 | |
| | 209,200 | | | Komatsu Ltd. | | | 4,495,694 | |
| | 702,678 | | | Mitsui Fudosan Co., Ltd. | | | 15,607,814 | |
| | 387,900 | | | Nexon Co., Ltd.* | | | 5,007,605 | |
| | 589,000 | | | NTT DOCOMO, Inc. | | | 13,234,369 | |
| | 201,513 | | | Ono Pharmaceutical Co., Ltd. | | | 4,115,037 | |
| | 125,600 | | | Recruit Holdings Co., Ltd. | | | 3,034,336 | |
| | 295,941 | | | Sony Corp. | | | 14,267,202 | |
| | 409,887 | | | Sony Financial Holdings, Inc. | | | 7,638,890 | |
| | 690,530 | | | Sumitomo Mitsui Financial Group, Inc. | | | 22,763,363 | |
| | 161,787 | | | Sysmex Corp. | | | 7,683,439 | |
| | 90,700 | | | Terumo Corp. | | | 5,115,942 | |
| | 474,301 | | | Tokio Marine Holdings, Inc. | | | 22,533,426 | |
| | 167,400 | | | Yamato Holdings Co., Ltd. | | | 4,589,545 | |
| | | | | | | | |
| | | | | | | 163,499,434 | |
| | | | | | | | |
| | | | Luxembourg - 0.5% | |
| | 45,383 | | | Spotify Technology S.A.* | | | 5,150,971 | |
| | | | | | | | |
| | | | Netherlands - 7.0% | |
| | 366,787 | | | AerCap Holdings N.V.* | | | 14,524,765 | |
| | 720,960 | | | DP Eurasia N.V.*(1) | | | 963,044 | |
| | 1,425,631 | | | ING Groep N.V. | | | 15,334,925 | |
| | 583,622 | | | Koninklijke Philips N.V. | | | 20,461,488 | |
| | 941,669 | | | Royal Dutch Shell plc Class A | | | 27,715,984 | |
| | | | | | | | |
| | | | | | | 79,000,206 | |
| | | | | | | | |
| | | | Norway - 0.5% | |
| | 1,276,938 | | | Norsk Hydro ASA | | | 5,785,882 | |
| | | | | | | | |
| | | | South Korea - 2.1% | |
| | 3,344 | | | Hugel, Inc.* | | | 1,146,993 | |
| | 5,193 | | | NCSoft Corp. | | | 2,176,751 | |
| | 571,541 | | | Samsung Electronics Co., Ltd. | | | 19,896,306 | |
| | | | | | | | |
| | | | | | | 23,220,050 | |
| | | | | | | | |
| | | | Spain - 2.7% | |
| | 2,548,470 | | | Iberdrola S.A. | | | 20,463,905 | |
| | 390,185 | | | Industria de Diseno Textil S.A. | | | 9,959,341 | |
| | | | | | | | |
| | | | | | | 30,423,246 | |
| | | | | | | | |
| | | | Switzerland - 11.3% | |
| | 181,511 | | | Julius Baer Group Ltd.* | | | 6,468,417 | |
| | 22,709 | | | Lonza Group AG* | | | 5,903,310 | |
| | 560,543 | | | Nestle S.A. | | | 45,495,209 | |
| | 437,967 | | | Novartis AG | | | 37,509,329 | |
| | 70,898 | | | PSP Swiss Property AG | | | 6,991,890 | |
| | 155,720 | | | Swiss Re AG | | | 14,326,292 | |
| | 775,576 | | | UBS Group AG* | | | 9,673,945 | |
| | | | | | | | |
| | | | | | | 126,368,392 | |
| | | | | | | | |
| | | | Taiwan - 2.6% | |
| | 4,034,995 | | | Taiwan Semiconductor Manufacturing Co., Ltd. | | | 29,299,023 | |
| | | | | | | | |
| | | | United Kingdom - 13.4% | |
| | 696,000 | | | Anglo American plc | | | 15,563,020 | |
| | 243,177 | | | AstraZeneca plc | | | 18,152,172 | |
| | 1,121,573 | | | BAE Systems plc | | | 6,559,916 | |
| | 579,560 | | | British American Tobacco plc | | | 18,441,027 | |
| | 834,861 | | | Compass Group plc | | | 17,569,498 | |
| | 95,874 | | | Derwent London plc REIT | | | 3,486,108 | |
| | 181,113 | | | Intertek Group plc | | | 11,084,625 | |
| | 476,762 | | | Rio Tinto plc | | | 22,833,271 | |
| | 273,669 | | | Smith & Nephew plc | | | 5,122,717 | |
The accompanying notes are an integral part of these financial statements.
|
| Hartford International Opportunities HLS Fund |
Schedule of Investments – (continued)
December 31, 2018
| | | | | | | | |
| Shares or Principal Amount | | Market Value† | |
| COMMON STOCKS - 97.0% - (continued) | |
| | | | United Kingdom - 13.4% - (continued) | |
| | 574,953 | | | Unilever N.V. ADR | | $ | 31,146,502 | |
| | | | | | | | |
| | | | | | | 149,958,856 | |
| | | | | | | | |
| | | | United States - 0.5% | |
| | 285,027 | | | Bausch Health Cos., Inc.* | | | 5,264,449 | |
| | | | | | | | |
| | |
| | | | Total Common Stocks
(cost $1,206,635,860) | | $ | 1,086,564,418 | |
| | | | | | | | |
| | |
| | | | Total Long-Term Investments
(cost $1,206,635,860) | | $ | 1,086,564,418 | |
| | | | | | | | |
|
| SHORT-TERM INVESTMENTS - 3.0% | |
| | | | Other Investment Pools & Funds - 3.0% | |
| | 33,850,201 | | | BlackRock Liquidity Funds FedFund Portfolio, Institutional Class, 2.40%(3) | | $ | 33,850,201 | |
| | | | | | | | |
| | | | Securities Lending Collateral - 0.0% | |
| | 2,660 | | | Citibank NA DDCA, 2.39%, 1/2/2019(3) | | | 2,660 | |
| | 35,151 | | | Fidelity Investments Money Market Funds, Government Portfolio, Institutional Class, 2.35%(3) | | | 35,151 | |
| | 2,521 | | | Goldman Sachs Financial Square Funds, Government Fund, Institutional Class, 2.30%(3) | | | 2,521 | |
| | 1,839 | | | Invesco Government & Agency Portfolio, Institutional Class, 2.30%(3) | | | 1,839 | |
| | 10,235 | | | Morgan Stanley Institutional Liquidity Funds, Government Portfolio, Institutional Class, 2.50%(3) | | | 10,235 | |
| | 794 | | | Western Asset Institutional Government Reserves Fund, Institutional Class, 2.28%(3) | | | 794 | |
| | | | | | | | |
| | | | | | | 53,200 | |
| | | | | | | | |
| | |
| | | | Total Short-Term Investments
(cost $33,903,401) | | $ | 33,903,401 | |
| | | | | | | | |
| | | | | | | | | | | | |
| | | |
| | | | Total Investments
(cost $1,240,539,261) | | | 100.0 | % | | $ | 1,120,467,819 | |
| | | | Other Assets and Liabilities | | | 0.0 | % | | | 462,345 | |
| | | | | | | | | | | | |
| | | | Total Net Assets | | | 100.0 | % | | $ | 1,120,930,164 | |
| | | | | | | | | | | | |
| Note: | Percentage of investments as shown is the ratio of the total market value to total net assets. |
| | Prices of foreign equities that are principally traded on certain foreign markets will generally be adjusted daily pursuant to a fair value pricing service approved by the Board of Directors in order to reflect an adjustment for factors occurring after the close of certain foreign markets but before the close of the New York Stock Exchange. |
| | Equity industry classifications used in this report are the Global Industry Classification Standard, which was developed by and is the exclusive property and service mark of MSCI, Inc. and Standard & Poor’s. |
| | For Fund compliance purposes, the Fund may not use the same classification system. These classifications are used for financial reporting purposes. |
| (1) | Security was purchased pursuant to Rule 144A under the Securities Act of 1933 and may be sold in transactions that are exempt from registration (typically only to qualified institutional buyers) or in a public offering registered under the Securities Act of 1933. At December 31, 2018, the aggregate value of these securities was $29,117,177, representing 2.6% of net assets. |
| (2) | Represents entire or partial securities on loan. See Note 8 in the accompanying Notes to Financial Statements for securities lending information. |
| (3) | Current yield as of period end. |
| † | See Significant Accounting Policies of accompanying Notes to Financial Statements regarding valuation of investments. |
| | |
| GLOSSARY: (abbreviations used in preceding Schedule of Investments) |
|
| Other Abbreviations: |
ADR | | American Depositary Receipt |
DDCA | | Dollars on Deposit in Custody Account |
REIT | | Real Estate Investment Trust |
Fair Valuation Summary
The following is a summary of the fair valuations according to the inputs used as of December 31, 2018 in valuing the Fund’s investments.
| | | | | | | | | | | | | | | | |
Description | | Total | | | Level 1 | | | Level 2 | | | Level 3(1) | |
Assets | |
Common Stocks | |
Australia | | $ | 10,208,260 | | | $ | — | | | $ | 10,208,260 | | | $ | — | |
Canada | | | 48,376,527 | | | | 48,376,527 | | | | — | | | | — | |
China | | | 137,416,806 | | | | 45,908,281 | | | | 91,508,525 | | | | — | |
Denmark | | | 5,399,626 | | | | — | | | | 5,399,626 | | | | — | |
Finland | | | 3,690,967 | | | | — | | | | 3,690,967 | | | | — | |
France | | | 141,882,277 | | | | — | | | | 141,882,277 | | | | — | |
Germany | | | 66,615,697 | | | | — | | | | 66,615,697 | | | | — | |
Hong Kong | | | 4,052,062 | | | | — | | | | 4,052,062 | | | | — | |
India | | | 22,211,185 | | | | — | | | | 22,211,185 | | | | — | |
Israel | | | 7,153,400 | | | | 7,153,400 | | | | — | | | | — | |
Italy | | | 21,587,102 | | | | — | | | | 21,587,102 | | | | — | |
Japan | | | 163,499,434 | | | | — | | | | 163,499,434 | | | | — | |
Luxembourg | | | 5,150,971 | | | | 5,150,971 | | | | — | | | | — | |
Netherlands | | | 79,000,206 | | | | 15,487,809 | | | | 63,512,397 | | | | — | |
Norway | | | 5,785,882 | | | | — | | | | 5,785,882 | | | | — | |
South Korea | | | 23,220,050 | | | | — | | | | 23,220,050 | | | | — | |
Spain | | | 30,423,246 | | | | — | | | | 30,423,246 | | | | — | |
The accompanying notes are an integral part of these financial statements.
|
| Hartford International Opportunities HLS Fund |
Schedule of Investments – (continued)
December 31, 2018
| | | | | | | | | | | | | | | | |
Description | | Total | | | Level 1 | | | Level 2 | | | Level 3(1) | |
Switzerland | | $ | 126,368,392 | | | $ | — | | | $ | 126,368,392 | | | $ | — | |
Taiwan | | | 29,299,023 | | | | — | | | | 29,299,023 | | | | — | |
United Kingdom | | | 149,958,856 | | | | — | | | | 149,958,856 | | | | — | |
United States | | | 5,264,449 | | | | 5,264,449 | | | | — | | | | — | |
Short-Term Investments | | | 33,903,401 | | | | 33,903,401 | | | | — | | | | — | |
| | | | | | | | | | | | | | | | |
Total | | $ | 1,120,467,819 | | | $ | 161,244,838 | | | $ | 959,222,981 | | | $ | — | |
| | | | | | | | | | | | | | | | |
| (1) | For the year ended December 31, 2018, there were no transfers in and out of Level 3. |
The accompanying notes are an integral part of these financial statements.
Schedule of Investments
December 31, 2018
| | | | | | | | |
| Shares or Principal Amount | | Market Value† | |
| COMMON STOCKS - 99.2% | |
| | | | Banks - 5.8% | |
| | 188,180 | | | Cullen/Frost Bankers, Inc. | | $ | 16,548,549 | |
| | 35,974 | | | First Citizens BancShares, Inc. Class A | | | 13,563,997 | |
| | 255,999 | | | First Republic Bank | | | 22,246,313 | |
| | 144,274 | | | M&T Bank Corp. | | | 20,649,938 | |
| | 150,523 | | | Pinnacle Financial Partners, Inc. | | | 6,939,110 | |
| | 236,377 | | | Prosperity Bancshares, Inc. | | | 14,726,287 | |
| | 171,959 | | | South State Corp. | | | 10,308,942 | |
| | | | | | | | |
| | | | | | | 104,983,136 | |
| | | | | | | | |
| | | | Capital Goods - 8.0% | |
| | 347,898 | | | Fastenal Co. | | | 18,191,586 | |
| | 230,941 | | | HEICO Corp. Class A | | | 14,549,283 | |
| | 237,835 | | | IDEX Corp. | | | 30,029,047 | |
| | 170,642 | | | Lennox International, Inc. | | | 37,346,708 | |
| | 232,591 | | | Lincoln Electric Holdings, Inc. | | | 18,339,800 | |
| | 115,904 | | | Middleby Corp.* | | | 11,906,818 | |
| | 243,775 | | | PACCAR, Inc. | | | 13,929,304 | |
| | | | | | | | |
| | | | | | | 144,292,546 | |
| | | | | | | | |
| | | | Commercial & Professional Services - 6.9% | |
| | 119,353 | | | Cimpress N.V.* | | | 12,343,487 | |
| | 102,091 | | | Cintas Corp. | | | 17,150,267 | |
| | 54,821 | | | CoStar Group, Inc.* | | | 18,493,316 | |
| | 416,502 | | | KAR Auction Services, Inc. | | | 19,875,475 | |
| | 517,282 | | | TransUnion | | | 29,381,618 | |
| | 58,042 | | | UniFirst Corp. | | | 8,304,069 | |
| | 265,314 | | | Waste Connections, Inc. | | | 19,699,565 | |
| | | | | | | | |
| | | | | | | 125,247,797 | |
| | | | | | | | |
| | | | Consumer Durables & Apparel - 3.0% | |
| | 195,996 | | | Carter’s, Inc. | | | 15,997,194 | |
| | 10,855 | | | NVR, Inc.* | | | 26,453,526 | |
| | 739,632 | | | Under Armour, Inc. Class C* | | | 11,959,849 | |
| | | | | | | | |
| | | | | | | 54,410,569 | |
| | | | | | | | |
| | | | Consumer Services - 2.1% | |
| | 566,561 | | | Aramark | | | 16,413,272 | |
| | 283,388 | | | Choice Hotels International, Inc. | | | 20,284,913 | |
| | 52,497 | | | Service Corp. International/US | | | 2,113,529 | |
| | | | | | | | |
| | | | | | | 38,811,714 | |
| | | | | | | | |
| | | | Diversified Financials - 3.1% | |
| | 54,026 | | | Credit Acceptance Corp.* | | | 20,624,966 | |
| | 97,233 | | | FactSet Research Systems, Inc. | | | 19,459,240 | |
| | 183,644 | | | Northern Trust Corp. | | | 15,350,802 | |
| | | | | | | | |
| | | | | | | 55,435,008 | |
| | | | | | | | |
| | | | Energy - 3.1% | |
| | 176,185 | | | Diamondback Energy, Inc. | | | 16,332,350 | |
| | 897,830 | | | Newfield Exploration Co.* | | | 13,162,188 | |
| | 2,394,558 | | | WPX Energy, Inc.* | | | 27,178,233 | |
| | | | | | | | |
| | | | | | | 56,672,771 | |
| | | | | | | | |
| | | | Health Care Equipment & Services - 7.6% | |
| | 219,358 | | | Hill-Rom Holdings, Inc. | | | 19,424,151 | |
| | 371,056 | | | Integra LifeSciences Holdings Corp.* | | | 16,734,626 | |
| | 252,198 | | | NuVasive, Inc.* | | | 12,498,933 | |
| | 188,322 | | | STERIS plc | | | 20,122,206 | |
| | 107,193 | | | Teleflex, Inc. | | | 27,707,247 | |
| | 192,479 | | | Varian Medical Systems, Inc.* | | | 21,809,795 | |
| | 224,108 | | | Veeva Systems, Inc. Class A* | | | 20,017,326 | |
| | | | | | | | |
| | | | | | | 138,314,284 | |
| | | | | | | | |
| | | | Insurance - 5.6% | |
| | 25,048 | | | Alleghany Corp. | | | 15,612,919 | |
| | 27,251 | | | Fairfax Financial Holdings Ltd. | | | 11,996,269 | |
| | 323,440 | | | Fidelity National Financial, Inc. | | | 10,168,954 | |
| | 34,005 | | | Markel Corp.* | | | 35,298,890 | |
| | | | | | | | |
| Shares or Principal Amount | | Market Value† | |
| COMMON STOCKS - 99.2% - (continued) | |
| | | | Insurance - 5.6% - (continued) | |
| | 17,770 | | | White Mountains Insurance Group Ltd. | | $ | 15,241,151 | |
| | 183,066 | | | WR Berkley Corp. | | | 13,530,408 | |
| | | | | | | | |
| | | | | | | 101,848,591 | |
| | | | | | | | |
| | | | Materials - 2.8% | |
| | 618,385 | | | Ball Corp. | | | 28,433,342 | |
| | 160,077 | | | Packaging Corp. of America | | | 13,360,027 | |
| | 371,424 | | | Silgan Holdings, Inc. | | | 8,773,035 | |
| | | | | | | | |
| | | | | | | 50,566,404 | |
| | | | | | | | |
| | | | Media & Entertainment - 2.5% | |
| | 217,216 | | | Cargurus, Inc.* | | | 7,326,696 | |
| | 434,344 | | | TripAdvisor, Inc.* | | | 23,428,515 | |
| | 122,098 | | | Zillow Group, Inc. Class A* | | | 3,837,540 | |
| | 334,691 | | | Zillow Group, Inc. Class C*(1) | | | 10,569,542 | |
| | | | | | | | |
| | | | | | | 45,162,293 | |
| | | | | | | | |
| | | | Pharmaceuticals, Biotechnology & Life Sciences - 11.5% | |
| | 376,114 | | | Aerie Pharmaceuticals, Inc.* | | | 13,577,715 | |
| | 265,618 | | | Agios Pharmaceuticals, Inc.* | | | 12,247,646 | |
| | 507,210 | | | Alkermes plc* | | | 14,967,767 | |
| | 199,336 | | | Alnylam Pharmaceuticals, Inc.* | | | 14,533,588 | |
| | 113,491 | | | Bio-Techne Corp. | | | 16,424,418 | |
| | 143,101 | | | Bluebird Bio, Inc.*(1) | | | 14,195,619 | |
| | 343,025 | | | Ionis Pharmaceuticals, Inc.* | | | 18,543,932 | |
| | 836,772 | | | Ironwood Pharmaceuticals, Inc.* | | | 8,668,958 | |
| | 31,717 | | | Mettler-Toledo International, Inc.* | | | 17,938,501 | |
| | 195,617 | | | PRA Health Sciences, Inc.* | | | 17,988,939 | |
| | 186,208 | | | Repligen Corp.* | | | 9,820,610 | |
| | 160,781 | | | Sage Therapeutics, Inc.* | | | 15,401,212 | |
| | 384,884 | | | Seattle Genetics, Inc.* | | | 21,807,527 | |
| | 307,150 | | | Ultragenyx Pharmaceutical, Inc.* | | | 13,354,882 | |
| | | | | | | | |
| | | | | | | 209,471,314 | |
| | | | | | | | |
| | | | Real Estate - 1.4% | |
| | 534,694 | | | Equity Commonwealth REIT | | | 16,046,167 | |
| | 684,605 | | | Redfin Corp.*(1) | | | 9,858,312 | |
| | | | | | | | |
| | | | | | | 25,904,479 | |
| | | | | | | | |
| | | | Retailing - 1.8% | |
| | 303,272 | | | CarMax, Inc.* | | | 19,024,253 | |
| | 287,899 | | | Etsy, Inc.* | | | 13,695,355 | |
| | | | | | | | |
| | | | | | | 32,719,608 | |
| | | | | | | | |
| | | | Semiconductors & Semiconductor Equipment - 2.6% | |
| | 241,596 | | | MKS Instruments, Inc. | | | 15,609,518 | |
| | 132,067 | | | Monolithic Power Systems, Inc. | | | 15,352,789 | |
| | 205,008 | | | Silicon Laboratories, Inc.* | | | 16,156,680 | |
| | | | | | | | |
| | | | | | | 47,118,987 | |
| | | | | | | | |
| | | | Software & Services - 17.8% | |
| | 217,794 | | | 2U, Inc.* | | | 10,828,718 | |
| | 282,666 | | | Akamai Technologies, Inc.* | | | 17,265,239 | |
| | 295,322 | | | Black Knight, Inc.* | | | 13,307,209 | |
| | 319,071 | | | Blackbaud, Inc. | | | 20,069,566 | |
| | 120,387 | | | EPAM Systems, Inc.* | | | 13,966,096 | |
| | 104,255 | | | Fair Isaac Corp.* | | | 19,495,685 | |
| | 1,583,552 | | | Genpact Ltd. | | | 42,740,069 | |
| | 246,379 | | | Global Payments, Inc. | | | 25,409,066 | |
| | 260,648 | | | Guidewire Software, Inc.* | | | 20,911,789 | |
| | 246,397 | | | PTC, Inc.* | | | 20,426,311 | |
| | 765,004 | | | Teradata Corp.* | | | 29,345,553 | |
| | 208,264 | | | Total System Services, Inc. | | | 16,929,781 | |
| | 239,393 | | | VeriSign, Inc.* | | | 35,499,588 | |
| | 269,064 | | | WEX, Inc.* | | | 37,685,104 | |
| | | | | | | | |
| | | | | | | 323,879,774 | |
| | | | | | | | |
The accompanying notes are an integral part of these financial statements.
Schedule of Investments – (continued)
December 31, 2018
| | | | | | | | |
| Shares or Principal Amount | | Market Value† | |
| COMMON STOCKS - 99.2% - (continued) | |
| | | | Technology Hardware & Equipment - 7.0% | |
| | 379,564 | | | CDW Corp. | | $ | 30,763,662 | |
| | 892,827 | | | CommScope Holding Co., Inc.* | | | 14,633,435 | |
| | 115,720 | | | F5 Networks, Inc.* | | | 18,750,112 | |
| | 653,652 | | | II-VI, Inc.* | | | 21,217,544 | |
| | 313,574 | | | Keysight Technologies, Inc.* | | | 19,466,674 | |
| | 474,577 | | | National Instruments Corp. | | | 21,536,304 | |
| | | | | | | | |
| | | | | | | 126,367,731 | |
| | | | | | | | |
| | | | Transportation - 4.0% | |
| | 56,098 | | | AMERCO | | | 18,406,315 | |
| | 334,710 | | | Genesee & Wyoming, Inc. Class A* | | | 24,775,234 | |
| | 902,327 | | | JetBlue Airways Corp.* | | | 14,491,371 | |
| | 268,829 | | | Spirit Airlines, Inc.* | | | 15,570,576 | |
| | | | | | | | |
| | | | | | | 73,243,496 | |
| | | | | | | | |
| | | | Utilities - 2.6% | |
| | 169,521 | | | Black Hills Corp. | | | 10,642,528 | |
| | 335,449 | | | NiSource, Inc. | | | 8,503,632 | |
| | 515,419 | | | UGI Corp. | | | 27,497,604 | |
| | | | | | | | |
| | | | | | | 46,643,764 | |
| | | | | | | | |
| | |
| | | | Total Common Stocks
(cost $1,660,595,161) | | $ | 1,801,094,266 | |
| | | | | | | | |
| | |
| | | | Total Long-Term Investments
(cost $1,660,595,161) | | $ | 1,801,094,266 | |
| | | | | | | | |
|
| SHORT-TERM INVESTMENTS - 1.1% | |
| | | | Other Investment Pools & Funds - 0.1% | |
| | 2,099,522 | | | Fidelity Investments Money Market Funds, Government Portfolio, Institutional Class, 2.35%(2) | | $ | 2,099,522 | |
| | | | | | | | |
| | | | Securities Lending Collateral - 1.0% | |
| | 864,529 | | | Citibank NA DDCA, 2.39%, 1/2/2019(2) | | | 864,529 | |
| | 11,424,475 | | | Fidelity Investments Money Market Funds, Government Portfolio, Institutional Class, 2.35%(2) | | | 11,424,475 | |
| | 819,455 | | | Goldman Sachs Financial Square Funds, Government Fund, Institutional Class, 2.30%(2) | | | 819,455 | |
| | 597,551 | | | Invesco Government & Agency Portfolio, Institutional Class, 2.30%(2) | | | 597,551 | |
| | 3,326,360 | | | Morgan Stanley Institutional Liquidity Funds, Government Portfolio, Institutional Class, 2.50%(2) | | | 3,326,360 | |
| | | | | | | | |
| Shares or Principal Amount | | Market Value† | |
| SHORT-TERM INVESTMENTS - 1.1% - (continued) | |
| | | | Securities Lending Collateral - 1.0% - (continued) | |
| | 258,217 | | | Western Asset Institutional Government Reserves Fund, Institutional Class, 2.28%(2) | | $ | 258,217 | |
| | | | | | | | |
| | | | | | | 17,290,587 | |
| | | | | | | | |
| | |
| | | | Total Short-Term Investments
(cost $19,390,109) | | $ | 19,390,109 | |
| | | | | | | | |
| | | | | | | | | | | | |
| | | |
| | | | Total Investments
(cost $1,679,985,270) | | | 100.3 | % | | $ | 1,820,484,375 | |
| | | | Other Assets and Liabilities | | | (0.3 | )% | | | (5,586,367 | ) |
| | | | | | | | | | | | |
| | | | Total Net Assets | | | 100.0 | % | | $ | 1,814,898,008 | |
| | | | | | | | | | | | |
| Note: | Percentage of investments as shown is the ratio of the total market value to total net assets. |
| | Prices of foreign equities that are principally traded on certain foreign markets will generally be adjusted daily pursuant to a fair value pricing service approved by the Board of Directors in order to reflect an adjustment for factors occurring after the close of certain foreign markets but before the close of the New York Stock Exchange. |
| | Equity industry classifications used in this report are the Global Industry Classification Standard, which was developed by and is the exclusive property and service mark of MSCI, Inc. and Standard & Poor’s. |
| | For Fund compliance purposes, the Fund may not use the same classification system. These classifications are used for financial reporting purposes. |
| (1) | Represents entire or partial securities on loan. See Note 8 in the accompanying Notes to Financial Statements for securities lending information. |
| (2) | Current yield as of period end. |
| † | See Significant Accounting Policies of accompanying Notes to Financial Statements regarding valuation of investments. |
| | |
| GLOSSARY: (abbreviations used in preceding Schedule of Investments) |
|
| Other Abbreviations: |
DDCA | | Dollars on Deposit in Custody Account |
REIT | | Real Estate Investment Trust |
Fair Valuation Summary
The following is a summary of the fair valuations according to the inputs used as of December 31, 2018 in valuing the Fund’s investments.
| | | | | | | | | | | | | | | | |
Description | | Total | | | Level 1 | | | Level 2 | | | Level 3(1) | |
Assets | |
Common Stocks | |
Banks | | $ | 104,983,136 | | | $ | 104,983,136 | | | $ | — | | | $ | — | |
Capital Goods | | | 144,292,546 | | | | 144,292,546 | | | | — | | | | — | |
Commercial & Professional Services | | | 125,247,797 | | | | 125,247,797 | | | | — | | | | — | |
Consumer Durables & Apparel | | | 54,410,569 | | | | 54,410,569 | | | | — | | | | — | |
Consumer Services | | | 38,811,714 | | | | 38,811,714 | | | | — | | | | — | |
Diversified Financials | | | 55,435,008 | | | | 55,435,008 | | | | — | | | | — | |
Energy | | | 56,672,771 | | | | 56,672,771 | | | | — | | | | — | |
Health Care Equipment & Services | | | 138,314,284 | | | | 138,314,284 | | | | — | | | | — | |
Insurance | | | 101,848,591 | | | | 101,848,591 | | | | — | | | | — | |
Materials | | | 50,566,404 | | | | 50,566,404 | | | | — | | | | — | |
Media & Entertainment | | | 45,162,293 | | | | 45,162,293 | | | | — | | | | — | |
The accompanying notes are an integral part of these financial statements.
Schedule of Investments – (continued)
December 31, 2018
| | | | | | | | | | | | | | | | |
Description | | Total | | | Level 1 | | | Level 2 | | | Level 3(1) | |
Pharmaceuticals, Biotechnology & Life Sciences | | $ | 209,471,314 | | | $ | 209,471,314 | | | $ | — | | | $ | — | |
Real Estate | | | 25,904,479 | | | | 25,904,479 | | | | — | | | | — | |
Retailing | | | 32,719,608 | | | | 32,719,608 | | | | — | | | | — | |
Semiconductors & Semiconductor Equipment | | | 47,118,987 | | | | 47,118,987 | | | | — | | | | — | |
Software & Services | | | 323,879,774 | | | | 323,879,774 | | | | — | | | | — | |
Technology Hardware & Equipment | | | 126,367,731 | | | | 126,367,731 | | | | — | | | | — | |
Transportation | | | 73,243,496 | | | | 73,243,496 | | | | — | | | | — | |
Utilities | | | 46,643,764 | | | | 46,643,764 | | | | — | | | | — | |
Short-Term Investments | | | 19,390,109 | | | | 19,390,109 | | | | — | | | | — | |
| | | | | | | | | | | | | | | | |
Total | | $ | 1,820,484,375 | | | $ | 1,820,484,375 | | | $ | — | | | $ | — | |
| | | | | | | | | | | | | | | | |
| (1) | For the year ended December 31, 2018, there were no transfers in and out of Level 3. |
The accompanying notes are an integral part of these financial statements.
|
| Hartford MidCap Growth HLS Fund |
Schedule of Investments
December 31, 2018
| | | | | | | | |
| Shares or Principal Amount | | Market Value† | |
| COMMON STOCKS - 98.1% | |
| | | | Banks - 1.9% | |
| | 16,346 | | | First Republic Bank | | $ | 1,420,467 | |
| | | | | | | | |
| | | | Capital Goods - 8.6% | |
| | 38,738 | | | BWX Technologies, Inc. | | | 1,480,954 | |
| | 22,459 | | | Graco, Inc. | | | 939,909 | |
| | 29,412 | | | Hexcel Corp. | | | 1,686,484 | |
| | 14,562 | | | Lincoln Electric Holdings, Inc. | | | 1,148,214 | |
| | 12,913 | | | Middleby Corp.* | | | 1,326,552 | |
| | | | | | | | |
| | | | | | | 6,582,113 | |
| | | | | | | | |
| | | | Commercial & Professional Services - 7.1% | |
| | 8,652 | | | Equifax, Inc. | | | 805,761 | |
| | 45,347 | | | IHS Markit Ltd.* | | | 2,175,296 | |
| | 28,555 | | | TransUnion | | | 1,621,924 | |
| | 10,891 | | | TriNet Group, Inc.* | | | 456,877 | |
| | 11,814 | | | WageWorks, Inc.* | | | 320,868 | |
| | | | | | | | |
| | | | | | | 5,380,726 | |
| | | | | | | | |
| | | | Consumer Durables & Apparel - 1.1% | |
| | 49,348 | | | Under Armour, Inc. Class A* | | | 871,979 | |
| | | | | | | | |
| | | | Consumer Services - 13.7% | |
| | 96,070 | | | Aramark | | | 2,783,148 | |
| | 16,782 | | | Bright Horizons Family Solutions, Inc.* | | | 1,870,354 | |
| | 6,912 | | | Domino’s Pizza, Inc. | | | 1,714,107 | |
| | 72,547 | | | Extended Stay America, Inc. | | | 1,124,478 | |
| | 7,035 | | | Grand Canyon Education, Inc.* | | | 676,345 | |
| | 11,143 | | | Hilton Worldwide Holdings, Inc. | | | 800,067 | |
| | 6,873 | | | Vail Resorts, Inc. | | | 1,448,966 | |
| | | | | | | | |
| | | | | | | 10,417,465 | |
| | | | | | | | |
| | | | Diversified Financials - 2.6% | |
| | 4,122 | | | MarketAxess Holdings, Inc. | | | 871,020 | |
| | 7,414 | | | MSCI, Inc. | | | 1,093,046 | |
| | | | | | | | |
| | | | | | | 1,964,066 | |
| | | | | | | | |
| | | | Health Care Equipment & Services - 9.2% | |
| | 21,802 | | | Acadia Healthcare Co., Inc.* | | | 560,530 | |
| | 15,382 | | | Cardinal Health, Inc. | | | 686,037 | |
| | 9,876 | | | Centene Corp.* | | | 1,138,703 | |
| | 7,273 | | | DexCom, Inc.* | | | 871,305 | |
| | 10,931 | | | Edwards Lifesciences Corp.* | | | 1,674,301 | |
| | 2,420 | | | Penumbra, Inc.* | | | 295,724 | |
| | 10,822 | | | Universal Health Services, Inc. Class B | | | 1,261,412 | |
| | 2,277 | | | WellCare Health Plans, Inc.* | | | 537,577 | |
| | | | | | | | |
| | | | | | | 7,025,589 | |
| | | | | | | | |
| | | | Media & Entertainment - 3.2% | |
| | 2,400 | | | Electronic Arts, Inc.* | | | 189,384 | |
| | 35,475 | | | Liberty Media Corp-Liberty Formula One | | | 1,089,082 | |
| | 10,973 | | | Take-Two Interactive Software, Inc.* | | | 1,129,561 | |
| | | | | | | | |
| | | | | | | 2,408,027 | |
| | | | | | | | |
| | | | Pharmaceuticals, Biotechnology & Life Sciences - 8.7% | |
| | 8,761 | | | Bluebird Bio, Inc.*(1) | | | 869,091 | |
| | 31,126 | | | Elanco Animal Health, Inc.* | | | 981,403 | |
| | 5,886 | | | ICON plc* | | | 760,530 | |
| | 24,290 | | | Incyte Corp.* | | | 1,544,601 | |
| | 1,859 | | | Mettler-Toledo International, Inc.* | | | 1,051,413 | |
| | 25,293 | | | Seattle Genetics, Inc.* | | | 1,433,102 | |
| | | | | | | | |
| | | | | | | 6,640,140 | |
| | | | | | | | |
| | | | Real Estate - 3.4% | |
| | 15,930 | | | SBA Communications Corp. REIT* | | | 2,578,908 | |
| | | | | | | | |
| | | | Retailing - 7.6% | | | |
| | 8,671 | | | Burlington Stores, Inc.* | | | 1,410,512 | |
| | 7,184 | | | Etsy, Inc.* | | | 341,743 | |
| | 18,340 | | | Expedia Group, Inc. | | | 2,066,001 | |
| | 2,112 | | | O’Reilly Automotive, Inc.* | | | 727,225 | |
| | | | | | | | |
| Shares or Principal Amount | | Market Value† | |
| COMMON STOCKS - 98.1% - (continued) | |
| | | | Retailing - 7.6% - (continued) | | | |
| | 2,609 | | | Stamps.com, Inc.* | | $ | 406,065 | |
| | 9,168 | | | Wayfair, Inc. Class A* | | | 825,853 | |
| | | | | | | | |
| | | | | | | 5,777,399 | |
| | | | | | | | |
| | | | Semiconductors & Semiconductor Equipment - 4.5% | |
| | 61,244 | | | Advanced Micro Devices, Inc.* | | | 1,130,564 | |
| | 10,691 | | | KLA-Tencor Corp. | | | 956,737 | |
| | 5,804 | | | Monolithic Power Systems, Inc. | | | 674,715 | |
| | 21,186 | | | Teradyne, Inc. | | | 664,817 | |
| | | | | | | | |
| | | | | | | 3,426,833 | |
| | | | | | | | |
| | | | Software & Services - 21.9% | |
| | 7,917 | | | 2U, Inc.* | | | 393,633 | |
| | 6,623 | | | Autodesk, Inc.* | | | 851,784 | |
| | 26,098 | | | Black Knight, Inc.* | | | 1,175,976 | |
| | 19,587 | | | Blackbaud, Inc. | | | 1,232,022 | |
| | 20,202 | | | Ceridian HCM Holding, Inc.* | | | 696,767 | |
| | 5,921 | | | DocuSign, Inc.* | | | 237,314 | |
| | 24,328 | | | Gartner, Inc.* | | | 3,110,092 | |
| | 19,898 | | | Global Payments, Inc. | | | 2,052,081 | |
| | 12,640 | | | Guidewire Software, Inc.* | | | 1,014,107 | |
| | 7,958 | | | ServiceNow, Inc.* | | | 1,416,922 | |
| | 9,839 | | | Splunk, Inc.* | | | 1,031,619 | |
| | 53,031 | | | SS&C Technologies Holdings, Inc. | | | 2,392,228 | |
| | 6,539 | | | Workday, Inc. Class A* | | | 1,044,148 | |
| | | | | | | | |
| | | | | | | 16,648,693 | |
| | | | | | | | |
| | | | Technology Hardware & Equipment - 4.6% | |
| | 23,486 | | | CDW Corp. | | | 1,903,541 | |
| | 168,507 | | | Flex Ltd.* | | | 1,282,338 | |
| | 7,445 | | | Itron, Inc.* | | | 352,074 | |
| | | | | | | | |
| | | | | | | 3,537,953 | |
| | | | | | | | |
| | |
| | | | Total Common Stocks
(cost $81,931,784) | | $ | 74,680,358 | |
| | | | | | | | |
| | |
| | | | Total Long-Term Investments
(cost $81,931,784) | | $ | 74,680,358 | |
| | | | | | | | |
|
| SHORT-TERM INVESTMENTS - 1.6% | |
| | | | Other Investment Pools & Funds - 1.1% | |
| | 822,470 | | | Morgan Stanley Institutional Liquidity Funds, Government Portfolio, Institutional Class, 2.50%(2) | | $ | 822,470 | |
| | | | | | | | |
| | | | Securities Lending Collateral - 0.5% | |
| | 20,398 | | | Citibank NA DDCA, 2.39%, 1/2/2019(2) | | | 20,398 | |
| | 269,547 | | | Fidelity Investments Money Market Funds, Government Portfolio, Institutional Class, 2.35%(2) | | | 269,547 | |
| | 19,334 | | | Goldman Sachs Financial Square Funds, Government Fund, Institutional Class, 2.30%(2) | | | 19,334 | |
| | 14,099 | | | Invesco Government & Agency Portfolio, Institutional Class, 2.30%(2) | | | 14,098 | |
| | 78,482 | | | Morgan Stanley Institutional Liquidity Funds, Government Portfolio, Institutional Class, 2.50%(2) | | | 78,482 | |
| | 6,092 | | | Western Asset Institutional Government Reserves Fund, Institutional Class, 2.28%(2) | | | 6,092 | |
| | | | | | | | |
| | | | | | | 407,951 | |
| | | | | | | | |
| | |
| | | | Total Short-Term Investments
(cost $1,230,421) | | $ | 1,230,421 | |
| | | | | | | | |
| | | | | | | | | | | | |
| | | |
| | | | Total Investments
(cost $83,162,205) | | | 99.7 | % | | $ | 75,910,779 | |
| | | | Other Assets and Liabilities | | | 0.3 | % | | | 196,656 | |
| | | | | | | | | | | | |
| | | | Total Net Assets | | | 100.0 | % | | $ | 76,107,435 | |
| | | | | | | | | | | | |
The accompanying notes are an integral part of these financial statements.
|
| Hartford MidCap Growth HLS Fund |
Schedule of Investments – (continued)
December 31, 2018
| Note: | Percentage of investments as shown is the ratio of the total market value to total net assets. |
| | Equity industry classifications used in this report are the Global Industry Classification Standard, which was developed by and is the exclusive property and service mark of MSCI, Inc. and Standard & Poor’s. |
| | For Fund compliance purposes, the Fund may not use the same classification system. These classifications are used for financial reporting purposes. |
| (1) | Represents entire or partial securities on loan. See Note 8 in the accompanying Notes to Financial Statements for securities lending information. |
| (2) | Current yield as of period end. |
| † | See Significant Accounting Policies of accompanying Notes to Financial Statements regarding valuation of investments. |
| | |
| GLOSSARY: (abbreviations used in preceding Schedule of Investments) |
|
| Other Abbreviations: |
DDCA | | Dollars on Deposit in Custody Account |
MSCI | | Morgan Stanley Capital International |
REIT | | Real Estate Investment Trust |
Fair Valuation Summary
The following is a summary of the fair valuations according to the inputs used as of December 31, 2018 in valuing the Fund’s investments.
| | | | | | | | | | | | | | | | |
Description | | Total | | | Level 1 | | | Level 2 | | | Level 3(1) | |
Assets | |
Common Stocks | |
Banks | | $ | 1,420,467 | | | $ | 1,420,467 | | | $ | — | | | $ | — | |
Capital Goods | | | 6,582,113 | | | | 6,582,113 | | | | — | | | | — | |
Commercial & Professional Services | | | 5,380,726 | | | | 5,380,726 | | | | — | | | | — | |
Consumer Durables & Apparel | | | 871,979 | | | | 871,979 | | | | — | | | | — | |
Consumer Services | | | 10,417,465 | | | | 10,417,465 | | | | — | | | | — | |
Diversified Financials | | | 1,964,066 | | | | 1,964,066 | | | | — | | | | — | |
Health Care Equipment & Services | | | 7,025,589 | | | | 7,025,589 | | | | — | | | | — | |
Media & Entertainment | | | 2,408,027 | | | | 2,408,027 | | | | — | | | | — | |
Pharmaceuticals, Biotechnology & Life Sciences | | | 6,640,140 | | | | 6,640,140 | | | | — | | | | — | |
Real Estate | | | 2,578,908 | | | | 2,578,908 | | | | — | | | | — | |
Retailing | | | 5,777,399 | | | | 5,777,399 | | | | — | | | | — | |
Semiconductors & Semiconductor Equipment | | | 3,426,833 | | | | 3,426,833 | | | | — | | | | — | |
Software & Services | | | 16,648,693 | | | | 16,648,693 | | | | — | | | | — | |
Technology Hardware & Equipment | | | 3,537,953 | | | | 3,537,953 | | | | — | | | | — | |
Short-Term Investments | | | 1,230,421 | | | | 1,230,421 | | | | — | | | | — | |
| | | | | | | | | | | | | | | | |
Total | | $ | 75,910,779 | | | $ | 75,910,779 | | | $ | — | | | $ | — | |
| | | | | | | | | | | | | | | | |
| (1) | For the year ended December 31, 2018, there were no transfers in and out of Level 3. |
The accompanying notes are an integral part of these financial statements.
|
| Hartford MidCap Value HLS Fund |
Schedule of Investments
December 31, 2018
| | | | | | | | |
| Shares or Principal Amount | | Market Value† | |
| COMMON STOCKS - 98.6% | |
| | | | Automobiles & Components - 0.7% | |
| | 101,758 | | | Goodyear Tire & Rubber Co. | | $ | 2,076,881 | |
| | | | | | | | |
| | | | Banks - 10.3% | |
| | 87,003 | | | BancorpSouth Bank | | | 2,274,258 | |
| | 78,614 | | | Bank OZK | | | 1,794,758 | |
| | 66,113 | | | Comerica, Inc. | | | 4,541,302 | |
| | 128,983 | | | First Midwest Bancorp, Inc. | | | 2,555,153 | |
| | 58,718 | | | IBERIABANK Corp. | | | 3,774,393 | |
| | 27,428 | | | Pinnacle Financial Partners, Inc. | | | 1,264,431 | |
| | 38,650 | | | South State Corp. | | | 2,317,068 | |
| | 206,518 | | | Sterling Bancorp | | | 3,409,612 | |
| | 73,949 | | | Western Alliance Bancorp* | | | 2,920,246 | |
| | 101,775 | | | Zions Bancorporation | | | 4,146,313 | |
| | | | | | | | |
| | | | | | | 28,997,534 | |
| | | | | | | | |
| | | | Capital Goods - 9.7% | |
| | 44,505 | | | Granite Construction, Inc. | | | 1,792,661 | |
| | 37,949 | | | Harris Corp. | | | 5,109,833 | |
| | 42,367 | | | Hubbell, Inc. | | | 4,208,738 | |
| | 125,443 | | | JELD-WEN Holding, Inc.* | | | 1,782,545 | |
| | 268,456 | | | Milacron Holdings Corp.* | | | 3,191,942 | |
| | 55,535 | | | Moog, Inc. Class A | | | 4,302,852 | |
| | 344,294 | | | Sanwa Holdings Corp. | | | 3,909,082 | |
| | 70,291 | | | Sensata Technologies Holding plc* | | | 3,151,848 | |
| | | | | | | | |
| | | | | | | 27,449,501 | |
| | | | | | | | |
| | | | Commercial & Professional Services - 1.8% | |
| | 193,688 | | | Atento S.A. | | | 776,689 | |
| | 85,033 | | | Clean Harbors, Inc.* | | | 4,196,378 | |
| | | | | | | | |
| | | | | | | 4,973,067 | |
| | | | | | | | |
| | | | Consumer Durables & Apparel - 1.8% | |
| | 51,285 | | | Lennar Corp. Class A | | | 2,007,808 | |
| | 159,935 | | | Newell Brands, Inc. | | | 2,973,191 | |
| | | | | | | | |
| | | | | | | 4,980,999 | |
| | | | | | | | |
| | | | Consumer Services - 0.9% | |
| | 59,992 | | | Norwegian Cruise Line Holdings Ltd.* | | | 2,543,061 | |
| | | | | | | | |
| | | | Diversified Financials - 0.9% | |
| | 319,934 | | | SLM Corp.* | | | 2,658,652 | |
| | | | | | | | |
| | | | Energy - 6.6% | |
| | 42,064 | | | Delek U.S. Holdings, Inc. | | | 1,367,501 | |
| | 94,355 | | | Diamondback Energy, Inc. | | | 8,746,708 | |
| | 611,907 | | | Encana Corp. | | | 3,536,822 | |
| | 280,474 | | | Laredo Petroleum, Inc.* | | | 1,015,316 | |
| | 61,421 | | | Viper Energy Partners L.P. | | | 1,599,403 | |
| | 195,410 | | | WPX Energy, Inc.* | | | 2,217,904 | |
| | | | | | | | |
| | | | | | | 18,483,654 | |
| | | | | | | | |
| | | | Food & Staples Retailing - 1.8% | |
| | 163,903 | | | US Foods Holding Corp.* | | | 5,185,891 | |
| | | | | | | | |
| | | | Food, Beverage & Tobacco - 1.7% | |
| | 18,447 | | | Ingredion, Inc. | | | 1,686,056 | |
| | 35,518 | | | Post Holdings, Inc.* | | | 3,165,719 | |
| | | | | | | | |
| | | | | | | 4,851,775 | |
| | | | | | | | |
| | | | Health Care Equipment & Services - 3.7% | |
| | 70,692 | | | Acadia Healthcare Co., Inc.* | | | 1,817,491 | |
| | 56,505 | | | Hill-Rom Holdings, Inc. | | | 5,003,518 | |
| | 33,946 | | | STERIS plc | | | 3,627,130 | |
| | | | | | | | |
| | | | | | | 10,448,139 | |
| | | | | | | | |
| | | | Insurance - 9.1% | |
| | 44,560 | | | Assurant, Inc. | | | 3,985,446 | |
| | 241,946 | | | CNO Financial Group, Inc. | | | 3,600,157 | |
| | 41,752 | | | Hanover Insurance Group, Inc. | | | 4,875,381 | |
| | 492,669 | | | Lancashire Holdings Ltd. | | | 3,801,913 | |
| | | | | | | | |
| Shares or Principal Amount | | Market Value† | |
| COMMON STOCKS - 98.6% - (continued) | |
| | | | Insurance - 9.1% - (continued) | |
| | 42,466 | | | Reinsurance Group of America, Inc. | | $ | 5,955,007 | |
| | 111,942 | | | Unum Group | | | 3,288,856 | |
| | | | | | | | |
| | | | | | | 25,506,760 | |
| | | | | | | | |
| | | | Materials - 9.5% | |
| | 93,803 | | | Alcoa Corp.* | | | 2,493,284 | |
| | 122,585 | | | Buzzi Unicem S.p.A. | | | 2,114,374 | |
| | 85,219 | | | Cabot Corp. | | | 3,659,304 | |
| | 55,218 | | | Carpenter Technology Corp. | | | 1,966,313 | |
| | 54,591 | | | Celanese Corp.(1) | | | 4,911,552 | |
| | 123,959 | | | Commercial Metals Co. | | | 1,985,823 | |
| | 68,479 | | | FMC Corp. | | | 5,064,707 | |
| | 62,899 | | | Reliance Steel & Aluminum Co. | | | 4,476,522 | |
| | | | | | | | |
| | | | | | | 26,671,879 | |
| | | | | | | | |
| | | | Media & Entertainment - 0.7% | |
| | 171,824 | | | TEGNA, Inc. | | | 1,867,727 | |
| | | | | | | | |
| | | | Real Estate - 12.1% | |
| | 44,891 | | | American Assets Trust, Inc. REIT | | | 1,803,271 | |
| | 282,157 | | | Brixmor Property Group, Inc. REIT | | | 4,144,886 | |
| | 157,333 | | | Corporate Office Properties Trust REIT | | | 3,308,713 | |
| | 28,318 | | | Equity LifeStyle Properties, Inc. REIT | | | 2,750,527 | |
| | 5,714 | | | Extra Space Storage, Inc. REIT | | | 517,003 | |
| | 30,834 | | | Life Storage, Inc. REIT | | | 2,867,254 | |
| | 152,007 | | | Park Hotels & Resorts, Inc. REIT | | | 3,949,142 | |
| | 240,426 | | | Physicians Realty Trust REIT | | | 3,854,029 | |
| | 34,406 | | | PS Business Parks, Inc. REIT | | | 4,507,186 | |
| | 228,815 | | | STORE Capital Corp. REIT | | | 6,477,753 | |
| | | | | | | | |
| | | | | | | 34,179,764 | |
| | | | | | | | |
| | | | Retailing - 1.0% | |
| | 98,040 | | | Caleres, Inc. | | | 2,728,453 | |
| | | | | | | | |
| | | | Semiconductors & Semiconductor Equipment - 2.7% | |
| | 105,277 | | | Axcelis Technologies, Inc.* | | | 1,873,931 | |
| | 153,227 | | | Ichor Holdings Ltd.*(1) | | | 2,497,600 | |
| | 93,008 | | | Silicon Motion Technology Corp. ADR | | | 3,208,776 | |
| | | | | | | | |
| | | | | | | 7,580,307 | |
| | | | | | | | |
| | | | Software & Services - 6.1% | |
| | 70,327 | | | Amdocs Ltd. | | | 4,119,756 | |
| | 58,300 | | | Booz Allen Hamilton Holding Corp. | | | 2,627,581 | |
| | 74,860 | | | Leidos Holdings, Inc. | | | 3,946,619 | |
| | 95,241 | | | SS&C Technologies Holdings, Inc. | | | 4,296,321 | |
| | 15,399 | | | VeriSign, Inc.* | | | 2,283,518 | |
| | | | | | | | |
| | | | | | | 17,273,795 | |
| | | | | | | | |
| | | | Technology Hardware & Equipment - 6.7% | |
| | 37,359 | | | Acacia Communications, Inc.* | | | 1,419,642 | |
| | 111,056 | | | Arrow Electronics, Inc.* | | | 7,657,311 | |
| | 16,066 | | | Coherent, Inc.* | | | 1,698,337 | |
| | 71,774 | | | Itron, Inc.* | | | 3,394,192 | |
| | 91,798 | | | KEMET Corp. | | | 1,610,137 | |
| | 47,984 | | | Keysight Technologies, Inc.* | | | 2,978,847 | |
| | | | | | | | |
| | | | | | | 18,758,466 | |
| | | | | | | | |
| | | | Telecommunication Services - 1.6% | |
| | 72,415 | | | Millicom International Cellular S.A. ADR | | | 4,582,110 | |
| | | | | | | | |
| | | | Transportation - 3.4% | |
| | 63,677 | | | Genesee & Wyoming, Inc. Class A* | | | 4,713,372 | |
| | 200,584 | | | JetBlue Airways Corp.* | | | 3,221,379 | |
| | 66,084 | | | Knight-Swift Transportation Holdings, Inc. | | | 1,656,726 | |
| | | | | | | | |
| | | | | | | 9,591,477 | |
| | | | | | | | |
| | | | Utilities - 5.8% | |
| | 128,693 | | | Alliant Energy Corp. | | | 5,437,279 | |
| | 47,329 | | | Evergy, Inc. | | | 2,686,867 | |
The accompanying notes are an integral part of these financial statements.
|
| Hartford MidCap Value HLS Fund |
Schedule of Investments – (continued)
December 31, 2018
| | | | | | | | |
| Shares or Principal Amount | | Market Value† | |
| COMMON STOCKS - 98.6% - (continued) | |
| | | | Utilities - 5.8% - (continued) | |
| | 153,584 | | | UGI Corp. | | $ | 8,193,707 | |
| | | | | | | | |
| | | | | | | 16,317,853 | |
| | | | | | | | |
| | | | Total Common Stocks
(cost $281,728,041) | | $ | 277,707,745 | |
| | | | | | | | |
| | |
| | | | Total Long-Term Investments
(cost $281,728,041) | | $ | 277,707,745 | |
| | | | | | | | |
|
| SHORT-TERM INVESTMENTS - 2.1% | |
| | | | Other Investment Pools & Funds - 1.4% | |
| | 3,395,095 | | | Morgan Stanley Institutional Liquidity Funds, Government Portfolio, Institutional Class, 2.50%(2) | | $ | 3,950,952 | |
| | | | | | | | |
| | | | Securities Lending Collateral - 0.7% | |
| | 103,208 | | | Citibank NA DDCA, 2.39%, 1/2/2019(2) | | | 103,208 | |
| | 1,363,857 | | | Fidelity Investments Money Market Funds, Government Portfolio, Institutional Class, 2.35%(2) | | | 1,363,857 | |
| | 97,827 | | | Goldman Sachs Financial Square Funds, Government Fund, Institutional Class, 2.30%(2) | | | 97,827 | |
| | 71,336 | | | Invesco Government & Agency Portfolio, Institutional Class, 2.30%(2) | | | 71,336 | |
| | 397,102 | | | Morgan Stanley Institutional Liquidity Funds, Government Portfolio, Institutional Class, 2.50%(2) | | | 397,102 | |
| | 30,826 | | | Western Asset Institutional Government Reserves Fund, Institutional Class, 2.28%(2) | | | 30,826 | |
| | | | | | | | |
| | | | | | | 2,064,156 | |
| | | | | | | | |
| | |
| | | | Total Short-Term Investments
(cost $6,015,108) | | $ | 6,015,108 | |
| | | | | | | | |
| | | | | | | | | | | | |
| | | |
| | | | Total Investments
(cost $287,743,149) | | | 100.7 | % | | $ | 283,722,853 | |
| | | | Other Assets and Liabilities | | | (0.7 | )% | | | (2,054,854 | ) |
| | | | | | | | | | | | |
| | | | Total Net Assets | | | 100.0 | % | | $ | 281,667,999 | |
| | | | | | | | | | | | |
| Note: | Percentage of investments as shown is the ratio of the total market value to total net assets. |
| | Prices of foreign equities that are principally traded on certain foreign markets will generally be adjusted daily pursuant to a fair value pricing service approved by the Board of Directors in order to reflect an adjustment for factors occurring after the close of certain foreign markets but before the close of the New York Stock Exchange. |
| | Equity industry classifications used in this report are the Global Industry Classification Standard, which was developed by and is the exclusive property and service mark of MSCI, Inc. and Standard & Poor’s. |
| | For Fund compliance purposes, the Fund may not use the same classification system. These classifications are used for financial reporting purposes. |
| (1) | Represents entire or partial securities on loan. See Note 8 in the accompanying Notes to Financial Statements for securities lending information. |
| (2) | Current yield as of period end. |
| † | See Significant Accounting Policies of accompanying Notes to Financial Statements regarding valuation of investments. |
| | |
| GLOSSARY: (abbreviations used in preceding Schedule of Investments) |
|
| Other Abbreviations: |
ADR | | American Depositary Receipt |
DDCA | | Dollars on Deposit in Custody Account |
REIT | | Real Estate Investment Trust |
Fair Valuation Summary
The following is a summary of the fair valuations according to the inputs used as of December 31, 2018 in valuing the Fund’s investments.
| | | | | | | | | | | | | | | | |
Description | | Total | | | Level 1 | | | Level 2 | | | Level 3(1) | |
Assets | |
Common Stocks | |
Automobiles & Components | | $ | 2,076,881 | | | $ | 2,076,881 | | | $ | — | | | $ | — | |
Banks | | | 28,997,534 | | | | 28,997,534 | | | | — | | | | — | |
Capital Goods | | | 27,449,501 | | | | 23,540,419 | | | | 3,909,082 | | | | — | |
Commercial & Professional Services | | | 4,973,067 | | | | 4,973,067 | | | | — | | | | — | |
Consumer Durables & Apparel | | | 4,980,999 | | | | 4,980,999 | | | | — | | | | — | |
Consumer Services | | | 2,543,061 | | | | 2,543,061 | | | | — | | | | — | |
Diversified Financials | | | 2,658,652 | | | | 2,658,652 | | | | — | | | | — | |
Energy | | | 18,483,654 | | | | 18,483,654 | | | | — | | | | — | |
Food & Staples Retailing | | | 5,185,891 | | | | 5,185,891 | | | | — | | | | — | |
Food, Beverage & Tobacco | | | 4,851,775 | | | | 4,851,775 | | | | — | | | | — | |
Health Care Equipment & Services | | | 10,448,139 | | | | 10,448,139 | | | | — | | | | — | |
Insurance | | | 25,506,760 | | | | 21,704,847 | | | | 3,801,913 | | | | — | |
Materials | | | 26,671,879 | | | | 24,557,505 | | | | 2,114,374 | | | | — | |
Media & Entertainment | | | 1,867,727 | | | | 1,867,727 | | | | — | | | | — | |
Real Estate | | | 34,179,764 | | | | 34,179,764 | | | | — | | | | — | |
Retailing | | | 2,728,453 | | | | 2,728,453 | | | | — | | | | — | |
Semiconductors & Semiconductor Equipment | | | 7,580,307 | | | | 7,580,307 | | | | — | | | | — | |
Software & Services | | | 17,273,795 | | | | 17,273,795 | | | | — | | | | — | |
Technology Hardware & Equipment | | | 18,758,466 | | | | 18,758,466 | | | | — | | | | — | |
Telecommunication Services | | | 4,582,110 | | | | — | | | | 4,582,110 | | | | — | |
Transportation | | | 9,591,477 | | | | 9,591,477 | | | | — | | | | — | |
Utilities | | | 16,317,853 | | | | 16,317,853 | | | | — | | | | — | |
Short-Term Investments | | | 6,015,108 | | | | 6,015,108 | | | | — | | | | — | |
| | | | | | | | | | | | | | | | |
Total | | $ | 283,722,853 | | | $ | 269,315,374 | | | $ | 14,407,479 | | | $ | — | |
| | | | | | | | | | | | | | | | |
| (1) | For the year ended December 31, 2018, there were no transfers in and out of Level 3. |
The accompanying notes are an integral part of these financial statements.
|
| Hartford Small Cap Growth HLS Fund |
Schedule of Investments
December 31, 2018
| | | | | | | | |
| Shares or Principal Amount | | Market Value† | |
| COMMON STOCKS - 93.7% | |
| | | | Automobiles & Components - 1.5% | |
| | 158,221 | | | Cooper Tire & Rubber Co. | | $ | 5,115,285 | |
| | 244,764 | | | Tenneco, Inc. | | | 6,704,086 | |
| | 84,238 | | | Visteon Corp.* | | | 5,077,867 | |
| | | | | | | | |
| | | | | | | 16,897,238 | |
| | | | | | | | |
| | | | Banks - 4.6% | |
| | 224,328 | | | First Busey Corp. | | | 5,505,009 | |
| | 269,394 | | | First Hawaiian, Inc. | | | 6,064,059 | |
| | 155,993 | | | Great Western Bancorp, Inc. | | | 4,874,781 | |
| | 118,034 | | | IBERIABANK Corp. | | | 7,587,225 | |
| | 873,579 | | | MGIC Investment Corp.* | | | 9,137,636 | |
| | 235,637 | | | Seacoast Banking Corp. of Florida* | | | 6,131,275 | |
| | 448,503 | | | Sterling Bancorp | | | 7,404,785 | |
| | 142,148 | | | Triumph Bancorp, Inc.* | | | 4,221,796 | |
| | | | | | | | |
| | | | | | | 50,926,566 | |
| | | | | | | | |
| | | | Capital Goods - 9.6% | |
| | 259,204 | | | Aerojet Rocketdyne Holdings, Inc.* | | | 9,131,757 | |
| | 266,804 | | | Altra Industrial Motion Corp. | | | 6,710,121 | |
| | 65,479 | | | American Woodmark Corp.* | | | 3,645,871 | |
| | 147,792 | | | Applied Industrial Technologies, Inc. | | | 7,971,901 | |
| | 88,725 | | | Armstrong World Industries, Inc. | | | 5,164,682 | |
| | 105,078 | | | Astec Industries, Inc. | | | 3,172,305 | |
| | 151,155 | | | Axon Enterprise, Inc.* | | | 6,613,031 | |
| | 133,290 | | | AZZ, Inc. | | | 5,379,584 | |
| | 181,063 | | | Generac Holdings, Inc.* | | | 8,998,831 | |
| | 213,536 | | | ITT, Inc. | | | 10,307,383 | |
| | 251,685 | | | JELD-WEN Holding, Inc.* | | | 3,576,444 | |
| | 153,463 | | | John Bean Technologies Corp. | | | 11,020,178 | |
| | 132,212 | | | Mercury Systems, Inc.* | | | 6,252,305 | |
| | 414,771 | | | Milacron Holdings Corp.* | | | 4,931,627 | |
| | 330,317 | | | Rexnord Corp.* | | | 7,580,775 | |
| | 74,151 | | | SiteOne Landscape Supply, Inc.* | | | 4,098,326 | |
| | 224,045 | | | Welbilt, Inc.* | | | 2,489,140 | |
| | | | | | | | |
| | | | | | | 107,044,261 | |
| | | | | | | | |
| | | | Commercial & Professional Services - 4.4% | |
| | 361,080 | | | Advanced Disposal Services, Inc.* | | | 8,644,255 | |
| | 172,373 | | | ASGN, Inc.* | | | 9,394,328 | |
| | 155,606 | | | Clean Harbors, Inc.* | | | 7,679,156 | |
| | 204,181 | | | Exponent, Inc. | | | 10,354,019 | |
| | 90,273 | | | Huron Consulting Group, Inc.* | | | 4,631,908 | |
| | 93,457 | | | MSA Safety, Inc. | | | 8,810,191 | |
| | | | | | | | |
| | | | | | | 49,513,857 | |
| | | | | | | | |
| | | | Consumer Durables & Apparel - 5.4% | |
| | 130,289 | | | Carter’s, Inc. | | | 10,634,188 | |
| | 144,720 | | | Oxford Industries, Inc. | | | 10,280,909 | |
| | 94,400 | | | Skyline Champion Corp. | | | 1,386,736 | |
| | 458,736 | | | Steven Madden Ltd. | | | 13,881,351 | |
| | 195,022 | | | TopBuild Corp.* | | | 8,775,990 | |
| | 464,850 | | | Wolverine World Wide, Inc. | | | 14,824,067 | |
| | | | | | | | |
| | | | | | | 59,783,241 | |
| | | | | | | | |
| | | | Consumer Services - 2.5% | |
| | 150,718 | | | Dunkin’ Brands Group, Inc. | | | 9,664,038 | |
| | 120,330 | | | Marriott Vacations Worldwide Corp. | | | 8,484,468 | |
| | 158,498 | | | Wingstop, Inc. | | | 10,173,987 | |
| | | | | | | | |
| | | | | | | 28,322,493 | |
| | | | | | | | |
| | | | Diversified Financials - 2.3% | |
| | 258,472 | | | Blucora, Inc.* | | | 6,885,694 | |
| | 115,291 | | | Evercore, Inc. Class A | | | 8,250,224 | |
| | 156,233 | | | OneMain Holdings, Inc.* | | | 3,794,900 | |
| | 856,694 | | | SLM Corp.* | | | 7,119,127 | |
| | | | | | | | |
| | | | | | | 26,049,945 | |
| | | | | | | | |
| | | | | | | | |
| Shares or Principal Amount | | Market Value† | |
| COMMON STOCKS - 93.7% - (continued) | |
| | | | Energy - 1.5% | |
| | 190,236 | | | Newfield Exploration Co.* | | $ | 2,788,860 | |
| | 133,450 | | | PDC Energy, Inc.* | | | 3,971,472 | |
| | 345,673 | | | ProPetro Holding Corp.* | | | 4,258,691 | |
| | 400,020 | | | WildHorse Resource Development Corp.* | | | 5,644,282 | |
| | | | | | | | |
| | | | | | | 16,663,305 | |
| | | | | | | | |
| | | | Food & Staples Retailing - 2.2% | |
| | 48,686 | | | Casey’s General Stores, Inc. | | | 6,238,624 | |
| | 339,464 | | | Performance Food Group Co.* | | | 10,954,504 | |
| | 119,332 | | | PriceSmart, Inc. | | | 7,052,521 | |
| | | | | | | | |
| | | | | | | 24,245,649 | |
| | | | | | | | |
| | | | Food, Beverage & Tobacco - 1.2% | |
| | 597,585 | | | Hostess Brands, Inc.* | | | 6,537,580 | |
| | 81,860 | | | Post Holdings, Inc.* | | | 7,296,182 | |
| | | | | | | | |
| | | | | | | 13,833,762 | |
| | | | | | | | |
| | | | Health Care Equipment & Services - 13.1% | |
| | 240,697 | | | AtriCure, Inc.* | | | 7,365,328 | |
| | 234,918 | | | Cardiovascular Systems, Inc.* | | | 6,692,814 | |
| | 291,078 | | | Globus Medical, Inc. Class A* | | | 12,597,856 | |
| | 85,462 | | | Haemonetics Corp.* | | | 8,550,473 | |
| | 345,189 | | | HMS Holdings Corp.* | | | 9,710,167 | |
| | 38,873 | | | ICU Medical, Inc.* | | | 8,926,407 | |
| | 143,679 | | | Insulet Corp.* | | | 11,396,618 | |
| | 156,205 | | | Integra LifeSciences Holdings Corp.* | | | 7,044,846 | |
| | 81,046 | | | LHC Group, Inc.* | | | 7,608,598 | |
| | 56,138 | | | LivaNova plc* | | | 5,134,943 | |
| | 90,863 | | | Medidata Solutions, Inc.* | | | 6,125,983 | |
| | 225,564 | | | Merit Medical Systems, Inc.* | | | 12,588,727 | |
| | 206,377 | | | Omnicell, Inc.* | | | 12,638,527 | |
| | 368,695 | | | OraSure Technologies, Inc.* | | | 4,306,358 | |
| | 75,321 | | | Orthofix Medical, Inc.* | | | 3,953,599 | |
| | 89,313 | | | Providence Service Corp.* | | | 5,360,566 | |
| | 699,442 | | | R1 RCM, Inc.* | | | 5,560,564 | |
| | 95,280 | | | Teladoc Health, Inc.*(1) | | | 4,723,030 | |
| | 57,219 | | | U.S. Physical Therapy, Inc. | | | 5,856,365 | |
| | | | | | | | |
| | | | | | | 146,141,769 | |
| | | | | | | | |
| | | | Household & Personal Products - 0.7% | |
| | 212,070 | | | Edgewell Personal Care Co.* | | | 7,920,815 | |
| | | | | | | | |
| | | | Insurance - 0.9% | |
| | 269,979 | | | James River Group Holdings Ltd. | | | 9,865,033 | |
| | | | | | | | |
| | | | Materials - 2.9% | |
| | 141,699 | | | Boise Cascade Co. | | | 3,379,521 | |
| | 607,651 | | | Graphic Packaging Holding Co. | | | 6,465,407 | |
| | 232,276 | | | Louisiana-Pacific Corp. | | | 5,161,173 | |
| | 497,560 | | | OMNOVA Solutions, Inc.* | | | 3,647,115 | |
| | 312,594 | | | PolyOne Corp. | | | 8,940,188 | |
| | 364,965 | | | Summit Materials, Inc. Class A* | | | 4,525,566 | |
| | | | | | | | |
| | | | | | | 32,118,970 | |
| | | | | | | | |
| | | | Media & Entertainment - 0.4% | |
| | 558,107 | | | TrueCar, Inc.* | | | 5,056,449 | |
| | | | | | | | |
| | | | Pharmaceuticals, Biotechnology & Life Sciences - 12.4% | |
| | 227,314 | | | Abeona Therapeutics, Inc.*(1) | | | 1,623,022 | |
| | 145,720 | | | Aerie Pharmaceuticals, Inc.* | | | 5,260,492 | |
| | 54,568 | | | Agios Pharmaceuticals, Inc.* | | | 2,516,130 | |
| | 629,556 | | | Amicus Therapeutics, Inc.* | | | 6,031,146 | |
| | 442,737 | | | Amneal Pharmaceuticals, Inc.* | | | 5,990,232 | |
| | 53,025 | | | Aptinyx, Inc.* | | | 877,033 | |
| | 180,359 | | | Arena Pharmaceuticals, Inc.* | | | 7,024,983 | |
| | 103,151 | | | Assembly Biosciences, Inc.* | | | 2,333,276 | |
| | 151,423 | | | Audentes Therapeutics, Inc.* | | | 3,228,338 | |
| | 47,145 | | | Avrobio, Inc.* | | | 784,964 | |
| | 120,621 | | | Biohaven Pharmaceutical Holding Co., Ltd.* | | | 4,460,565 | |
| | 134,120 | | | Blueprint Medicines Corp.* | | | 7,230,409 | |
The accompanying notes are an integral part of these financial statements.
|
| Hartford Small Cap Growth HLS Fund |
Schedule of Investments – (continued)
December 31, 2018
| | | | | | | | |
| Shares or Principal Amount | | Market Value† | |
| COMMON STOCKS - 93.7% - (continued) | |
| | | | Pharmaceuticals, Biotechnology & Life Sciences - 12.4% - (continued) | |
| | 202,517 | | | Catalent, Inc.* | | $ | 6,314,480 | |
| | 217,746 | | | Dermira, Inc.* | | | 1,565,594 | |
| | 247,435 | | | Five Prime Therapeutics, Inc.* | | | 2,301,145 | |
| | 159,036 | | | Flexion Therapeutics, Inc.* | | | 1,800,288 | |
| | 132,463 | | | G1 Therapeutics, Inc.* | | | 2,536,666 | |
| | 182,017 | | | GlycoMimetics, Inc.* | | | 1,723,701 | |
| | 271,960 | | | Heron Therapeutics, Inc.* | | | 7,054,642 | |
| | 356,498 | | | Intersect ENT, Inc.* | | | 10,046,114 | |
| | 112,700 | | | Karyopharm Therapeutics, Inc.* | | | 1,055,999 | |
| | 72,837 | | | Loxo Oncology, Inc.* | | | 10,202,279 | |
| | 16,830 | | | Madrigal Pharmaceuticals, Inc.*(1) | | | 1,897,078 | |
| | 125,826 | | | Minerva Neurosciences, Inc.* | | | 848,067 | |
| | 149,805 | | | MyoKardia, Inc.* | | | 7,319,472 | |
| | 369,654 | | | NanoString Technologies, Inc.* | | | 5,481,969 | |
| | 158,430 | | | Portola Pharmaceuticals, Inc.*(1) | | | 3,092,554 | |
| | 97,714 | | | REGENXBIO, Inc.* | | | 4,099,102 | |
| | 203,216 | | | Revance Therapeutics, Inc.* | | | 4,090,738 | |
| | 860,583 | | | Rigel Pharmaceuticals, Inc.* | | | 1,979,341 | |
| | 102,858 | | | Spark Therapeutics, Inc.* | | | 4,025,862 | |
| | 185,085 | | | Syneos Health, Inc.* | | | 7,283,095 | |
| | 146,664 | | | Ultragenyx Pharmaceutical, Inc.* | | | 6,376,951 | |
| | | | | | | | |
| | | | | | | 138,455,727 | |
| | | | | | | | |
| | | | Real Estate - 2.8% | |
| | 298,772 | | | Columbia Property Trust, Inc. REIT | | | 5,781,238 | |
| | 61,454 | | | Coresite Realty Corp. REIT | | | 5,360,632 | |
| | 227,697 | | | Corporate Office Properties Trust REIT | | | 4,788,468 | |
| | 240,215 | | | Pebblebrook Hotel Trust REIT | | | 6,800,487 | |
| | 61,974 | | | PS Business Parks, Inc. REIT | | | 8,118,594 | |
| | | | | | | | |
| | | | | | | 30,849,419 | |
| | | | | | | | |
| | | | Retailing - 3.5% | |
| | 275,103 | | | Caleres, Inc. | | | 7,656,116 | |
| | 212,872 | | | Core-Mark Holding Co., Inc. | | | 4,949,274 | |
| | 182,553 | | | Etsy, Inc.* | | | 8,684,046 | |
| | 92,600 | | | Five Below, Inc.* | | | 9,474,832 | |
| | 164,459 | | | Floor & Decor Holdings, Inc. Class A* | | | 4,259,488 | |
| | 332,588 | | | Michaels Cos., Inc.*(1) | | | 4,503,242 | |
| | | | | | | | |
| | | | | | | 39,526,998 | |
| | | | | | | | |
| | | | Semiconductors & Semiconductor Equipment - 3.0% | |
| | 131,960 | | | Cirrus Logic, Inc.* | | | 4,378,433 | |
| | 398,583 | | | Cohu, Inc. | | | 6,405,229 | |
| | 160,893 | | | Diodes, Inc.* | | | 5,190,408 | |
| | 360,994 | | | Entegris, Inc. | | | 10,069,928 | |
| | 501,037 | | | FormFactor, Inc.* | | | 7,059,611 | |
| | | | | | | | |
| | | | | | | 33,103,609 | |
| | | | | | | | |
| | | | Software & Services - 14.3% | |
| | 111,638 | | | 2U, Inc.* | | | 5,550,641 | |
| | 316,819 | | | 8x8, Inc.* | | | 5,715,415 | |
| | 83,541 | | | Alteryx, Inc. Class A* | | | 4,968,183 | |
| | 89,711 | | | Blackbaud, Inc. | | | 5,642,822 | |
| | 54,169 | | | CACI International, Inc. Class A* | | | 7,801,961 | |
| | 232,904 | | | Carbonite, Inc.* | | | 5,883,155 | |
| | 477,853 | | | Cloudera, Inc.* | | | 5,285,054 | |
| | 49,079 | | | EPAM Systems, Inc.* | | | 5,693,655 | |
| | 153,259 | | | Everbridge, Inc.* | | | 8,698,981 | |
| | 51,243 | | | Fair Isaac Corp.* | | | 9,582,441 | |
| | 249,545 | | | Five9, Inc.* | | | 10,910,107 | |
| | 270,308 | | | ForeScout Technologies, Inc.* | | | 7,025,305 | |
| | 68,695 | | | HubSpot, Inc.* | | | 8,637,022 | |
| | 118,513 | | | Instructure, Inc.* | | | 4,445,423 | |
| | 133,145 | | | LiveRamp Holdings, Inc.* | | | 5,143,391 | |
| | 233,371 | | | MINDBODY, Inc. Class A* | | | 8,494,704 | |
| | 59,095 | | | MongoDB, Inc.*(1) | | | 4,948,615 | |
| | 106,537 | | | New Relic, Inc.* | | | 8,626,301 | |
| | | | | | | | |
| Shares or Principal Amount | | Market Value† | |
| COMMON STOCKS - 93.7% - (continued) | |
| | | | Software & Services - 14.3% - (continued) | |
| | 134,245 | | | Paylocity Holding Corp.* | | $ | 8,082,892 | |
| | 158,469 | | | Pegasystems, Inc. | | | 7,579,572 | |
| | 304,187 | | | Pivotal Software, Inc. Class A* | | | 4,973,458 | |
| | 90,546 | | | Q2 Holdings, Inc.* | | | 4,486,554 | |
| | 69,638 | | | Science Applications International Corp. | | | 4,435,941 | |
| | 61,433 | | | Trade Desk, Inc. Class A* | | | 7,129,914 | |
| | | | | | | | |
| | | | | | | 159,741,507 | |
| | | | | | | | |
| | | | Technology Hardware & Equipment - 2.2% | |
| | 251,294 | | | CTS Corp. | | | 6,506,002 | |
| | 117,610 | | | ePlus, Inc.* | | | 8,370,304 | |
| | 77,420 | | | Lumentum Holdings, Inc.* | | | 3,252,414 | |
| | 63,977 | | | Rogers Corp.* | | | 6,337,561 | |
| | | | | | | | |
| | | | | | | 24,466,281 | |
| | | | | | | | |
| | | | Telecommunication Services - 0.8% | |
| | 405,609 | | | ORBCOMM, Inc.* | | | 3,350,330 | |
| | 634,867 | | | Vonage Holdings Corp.* | | | 5,542,389 | |
| | | | | | | | |
| | | | | | | 8,892,719 | |
| | | | | | | | |
| | | | Transportation - 1.5% | |
| | 118,562 | | | Genesee & Wyoming, Inc. Class A* | | | 8,775,959 | |
| | 100,437 | | | Knight-Swift Transportation Holdings, Inc. | | | 2,517,955 | |
| | 312,393 | | | Marten Transport Ltd. | | | 5,057,643 | |
| | | | | | | | |
| | | | | | | 16,351,557 | |
| | | | | | | | |
| | |
| | | | Total Common Stocks
(cost $1,116,091,672) | | $ | 1,045,771,170 | |
| | | | | | | | |
|
| EXCHANGE-TRADED FUNDS - 4.4% | |
| | | | Other Investment Pools & Funds - 4.4% | |
| | 290,806 | | | iShares Russell 2000 Growth ETF(1) | | $ | 48,855,408 | |
| | | | | | | | |
| | |
| | | | Total Exchange-Traded Funds
(cost $53,656,288) | | $ | 48,855,408 | |
| | | | | | | | |
| | |
| | | | Total Long-Term Investments
(cost $1,169,747,960) | | $ | 1,094,626,578 | |
| | | | | | | | |
|
| SHORT-TERM INVESTMENTS - 5.3% | |
| | | | Other Investment Pools & Funds - 1.4% | |
| | 16,044,341 | | | Morgan Stanley Institutional Liquidity Funds, Government Portfolio, Institutional Class, 2.50%(2) | | $ | 16,044,341 | |
| | | | | | | | |
| | | | Securities Lending Collateral - 3.9% | |
| | 2,176,416 | | | Citibank NA DDCA, 2.39%, 1/2/2019(2) | | | 2,176,416 | |
| | 28,760,636 | | | Fidelity Investments Money Market Funds, Government Portfolio, Institutional Class, 2.35%(2) | | | 28,760,636 | |
| | 2,062,943 | | | Goldman Sachs Financial Square Funds, Government Fund, Institutional Class, 2.30%(2) | | | 2,062,943 | |
| | 1,504,310 | | | Invesco Government & Agency Portfolio, Institutional Class, 2.30%(2) | | | 1,504,310 | |
| | 8,373,971 | | | Morgan Stanley Institutional Liquidity Funds, Government Portfolio, Institutional Class, 2.50%(2) | | | 8,373,971 | |
| | 650,050 | | | Western Asset Institutional Government Reserves Fund, Institutional Class, 2.28%(2) | | | 650,050 | |
| | | | | | | | |
| | | | | | | 43,528,326 | |
| | | | | | | | |
| | |
| | | | Total Short-Term Investments
(cost $59,572,667) | | $ | 59,572,667 | |
| | | | | | | | |
| | | | | | | | | | | | |
| | | |
| | | | Total Investments
(cost $1,229,320,627) | | | 103.4 | % | | $ | 1,154,199,245 | |
| | | | Other Assets and Liabilities | | | (3.4 | )% | | | (37,817,877 | ) |
| | | | | | | | | | | | |
| | | | Total Net Assets | | | 100.0 | % | | $ | 1,116,381,368 | |
| | | | | | | | | | | | |
The accompanying notes are an integral part of these financial statements.
|
| Hartford Small Cap Growth HLS Fund |
Schedule of Investments – (continued)
December 31, 2018
| Note: | Percentage of investments as shown is the ratio of the total market value to total net assets. |
| | Other than the industry classifications “Other Investment Pools & Funds,” equity industry classifications used in this report are the Global Industry Classification Standard, which was developed by and is the exclusive property and service mark of MSCI, Inc. and Standard & Poor’s. |
| | For Fund compliance purposes, the Fund may not use the same classification system. These classifications are used for financial reporting purposes. |
| (1) | Represents entire or partial securities on loan. See Note 8 in the accompanying Notes to Financial Statements for securities lending information. |
| (2) | Current yield as of period end. |
| † | See Significant Accounting Policies of accompanying Notes to Financial Statements regarding valuation of investments. |
| | |
| GLOSSARY: (abbreviations used in preceding Schedule of Investments) |
|
| Other Abbreviations: |
DDCA | | Dollars on Deposit in Custody Account |
ETF | | Exchange-Traded Fund |
REIT | | Real Estate Investment Trust |
Fair Valuation Summary
The following is a summary of the fair valuations according to the inputs used as of December 31, 2018 in valuing the Fund’s investments.
| | | | | | | | | | | | | | | | |
Description | | Total | | | Level 1 | | | Level 2 | | | Level 3(1) | |
Assets | |
Common Stocks | |
Automobiles & Components | | $ | 16,897,238 | | | $ | 16,897,238 | | | $ | — | | | $ | — | |
Banks | | | 50,926,566 | | | | 50,926,566 | | | | — | | | | — | |
Capital Goods | | | 107,044,261 | | | | 107,044,261 | | | | — | | | | — | |
Commercial & Professional Services | | | 49,513,857 | | | | 49,513,857 | | | | — | | | | — | |
Consumer Durables & Apparel | | | 59,783,241 | | | | 59,783,241 | | | | — | | | | — | |
Consumer Services | | | 28,322,493 | | | | 28,322,493 | | | | — | | | | — | |
Diversified Financials | | | 26,049,945 | | | | 26,049,945 | | | | — | | | | — | |
Energy | | | 16,663,305 | | | | 16,663,305 | | | | — | | | | — | |
Food & Staples Retailing | | | 24,245,649 | | | | 24,245,649 | | | | — | | | | — | |
Food, Beverage & Tobacco | | | 13,833,762 | | | | 13,833,762 | | | | — | | | | — | |
Health Care Equipment & Services | | | 146,141,769 | | | | 146,141,769 | | | | — | | | | — | |
Household & Personal Products | | | 7,920,815 | | | | 7,920,815 | | | | — | | | | — | |
Insurance | | | 9,865,033 | | | | 9,865,033 | | | | — | | | | — | |
Materials | | | 32,118,970 | | | | 32,118,970 | | | | — | | | | — | |
Media & Entertainment | | | 5,056,449 | | | | 5,056,449 | | | | — | | | | — | |
Pharmaceuticals, Biotechnology & Life Sciences | | | 138,455,727 | | | | 138,455,727 | | | | — | | | | — | |
Real Estate | | | 30,849,419 | | | | 30,849,419 | | | | — | | | | — | |
Retailing | | | 39,526,998 | | | | 39,526,998 | | | | — | | | | — | |
Semiconductors & Semiconductor Equipment | | | 33,103,609 | | | | 33,103,609 | | | | — | | | | — | |
Software & Services | | | 159,741,507 | | | | 159,741,507 | | | | — | | | | — | |
Technology Hardware & Equipment | | | 24,466,281 | | | | 24,466,281 | | | | — | | | | — | |
Telecommunication Services | | | 8,892,719 | | | | 8,892,719 | | | | — | | | | — | |
Transportation | | | 16,351,557 | | | | 16,351,557 | | | | — | | | | — | |
Exchange-Traded Funds | | | 48,855,408 | | | | 48,855,408 | | | | — | | | | — | |
Short-Term Investments | | | 59,572,667 | | | | 59,572,667 | | | | — | | | | — | |
| | | | | | | | | | | | | | | | |
Total | | $ | 1,154,199,245 | | | $ | 1,154,199,245 | | | $ | — | | | $ | — | |
| | | | | | | | | | | | | | | | |
| (1) | For the year ended December 31, 2018, there were no transfers in and out of Level 3. |
The accompanying notes are an integral part of these financial statements.
|
| Hartford Small Company HLS Fund |
Schedule of Investments
December 31, 2018
| | | | | | | | |
| Shares or Principal Amount | | Market Value† | |
| COMMON STOCKS - 95.9% | |
| | | | Banks - 5.1% | |
| | 158,420 | | | BancorpSouth Bank | | $ | 4,141,099 | |
| | 155,718 | | | CenterState Bank Corp. | | | 3,276,307 | |
| | 521,876 | | | MGIC Investment Corp.* | | | 5,458,823 | |
| | 337,475 | | | Sterling Bancorp | | | 5,571,712 | |
| | 55,171 | | | Texas Capital Bancshares, Inc.* | | | 2,818,686 | |
| | 180,290 | | | Union Bankshares Corp. | | | 5,089,587 | |
| | | | | | | | |
| | | | | | | 26,356,214 | |
| | | | | | | | |
| | | | Capital Goods - 7.8% | |
| | 398,375 | | | Actuant Corp. Class A | | | 8,361,891 | |
| | 62,801 | | | Axon Enterprise, Inc.* | | | 2,747,544 | |
| | 157,117 | | | EnerSys | | | 12,193,850 | |
| | 220,026 | | | ITT, Inc. | | | 10,620,655 | |
| | 296,739 | | | Rexnord Corp.* | | | 6,810,160 | |
| | | | | | | | |
| | | | | | | 40,734,100 | |
| | | | | | | | |
| | | | Commercial & Professional Services - 3.9% | |
| | 140,797 | | | Brink’s Co. | | | 9,102,526 | |
| | 13,519 | | | CoStar Group, Inc.* | | | 4,560,500 | |
| | 163,016 | | | TriNet Group, Inc.* | | | 6,838,521 | |
| | | | | | | | |
| | | | | | | 20,501,547 | |
| | | | | | | | |
| | | | Consumer Durables & Apparel - 4.9% | |
| | 107,904 | | | Carter’s, Inc. | | | 8,807,125 | |
| | 66,782 | | | iRobot Corp.*(1) | | | 5,592,325 | |
| | 311,463 | | | Skyline Champion Corp. | | | 4,575,391 | |
| | 29,260 | | | Under Armour, Inc. Class A* | | | 517,024 | |
| | 365,232 | | | Under Armour, Inc. Class C*(1) | | | 5,905,801 | |
| | | | | | | | |
| | | | | | | 25,397,666 | |
| | | | | | | | |
| | | | Consumer Services - 7.0% | |
| | 219,125 | | | Boyd Gaming Corp. | | | 4,553,418 | |
| | 909,759 | | | DraftKings, Inc.*(2)(3)(4) | | | 2,319,485 | |
| | 58,010 | | | Grand Canyon Education, Inc.* | | | 5,577,081 | |
| | 124,721 | | | Marriott Vacations Worldwide Corp. | | | 8,794,078 | |
| | 236,716 | | | Planet Fitness, Inc. Class A* | | | 12,692,712 | |
| | 39,754 | | | Wingstop, Inc. | | | 2,551,809 | |
| | | | | | | | |
| | | | | | | 36,488,583 | |
| | | | | | | | |
| | | | Diversified Financials - 1.1% | |
| | 69,705 | | | Green Dot Corp. Class A* | | | 5,542,942 | |
| | | | | | | | |
| | | | Energy - 1.5% | |
| | 376,754 | | | Centennial Resource Development, Inc. Class A* | | | 4,151,829 | |
| | 139,698 | | | Viper Energy Partners L.P. | | | 3,637,736 | |
| | | | | | | | |
| | | | | | | 7,789,565 | |
| | | | | | | | |
| | | | Food & Staples Retailing - 1.5% | |
| | 236,276 | | | Performance Food Group Co.* | | | 7,624,627 | |
| | | | | | | | |
| | | | Food, Beverage & Tobacco - 1.2% | |
| | 104,607 | | | MGP Ingredients, Inc.(1) | | | 5,967,829 | |
| | | | | | | | |
| | | | Health Care Equipment & Services - 15.9% | |
| | 53,902 | | | Amedisys, Inc.* | | | 6,312,463 | |
| | 23,248 | | | DexCom, Inc.* | | | 2,785,110 | |
| | 142,087 | | | Globus Medical, Inc. Class A* | | | 6,149,525 | |
| | 73,933 | | | Haemonetics Corp.* | | | 7,396,997 | |
| | 103,257 | | | Hill-Rom Holdings, Inc. | | | 9,143,407 | |
| | 313,974 | | | HMS Holdings Corp.* | | | 8,832,089 | |
| | 178,140 | | | Insulet Corp.* | | | 14,130,065 | |
| | 168,575 | | | Merit Medical Systems, Inc.* | | | 9,408,171 | |
| | 162,600 | | | Omnicell, Inc.* | | | 9,957,624 | |
| | 53,530 | | | Penumbra, Inc.* | | | 6,541,366 | |
| | 44,275 | | | Teladoc Health, Inc.* | | | 2,194,712 | |
| | | | | | | | |
| | | | | | | 82,851,529 | |
| | | | | | | | |
| | | | Insurance - 0.9% | |
| | 120,752 | | | James River Group Holdings Ltd. | | | 4,412,278 | |
| | | | | | | | |
| | | | | | | | |
| Shares or Principal Amount | | Market Value† | |
| COMMON STOCKS - 95.9% - (continued) | |
| | | | Materials - 3.6% | |
| | 190,732 | | | Cabot Corp. | | $ | 8,190,032 | |
| | 189,174 | | | Carpenter Technology Corp. | | | 6,736,486 | |
| | 44,055 | | | Ingevity Corp.* | | | 3,686,963 | |
| | | | | | | | |
| | | | | | | 18,613,481 | |
| | | | | | | | |
| | | | Pharmaceuticals, Biotechnology & Life Sciences - 11.6% | |
| | 207,386 | | | Abeona Therapeutics, Inc.* | | | 1,480,736 | |
| | 119,134 | | | Aerie Pharmaceuticals, Inc.* | | | 4,300,737 | |
| | 267,988 | | | Amicus Therapeutics, Inc.* | | | 2,567,325 | |
| | 96,053 | | | Arena Pharmaceuticals, Inc.* | | | 3,741,264 | |
| | 67,927 | | | CytomX Therapeutics, Inc.* | | | 1,025,698 | |
| | 101,220 | | | Exact Sciences Corp.* | | | 6,386,982 | |
| | 95,175 | | | G1 Therapeutics, Inc.* | | | 1,822,601 | |
| | 41,034 | | | Galapagos N.V. ADR* | | | 3,764,459 | |
| | 111,040 | | | Heron Therapeutics, Inc.* | | | 2,880,378 | |
| | 181,083 | | | Karyopharm Therapeutics, Inc.* | | | 1,696,748 | |
| | 32,503 | | | Loxo Oncology, Inc.* | | | 4,552,695 | |
| | 63,935 | | | MyoKardia, Inc.* | | | 3,123,864 | |
| | 181,845 | | | Nightstar Therapeutics plc ADR* | | | 2,094,854 | |
| | 62,729 | | | PRA Health Sciences, Inc.* | | | 5,768,559 | |
| | 145,570 | | | Ra Pharmaceuticals, Inc.* | | | 2,649,374 | |
| | 50,661 | | | REGENXBIO, Inc.* | | | 2,125,229 | |
| | 111,612 | | | Rhythm Pharmaceuticals, Inc.* | | | 3,000,131 | |
| | 188,646 | | | Sangamo Therapeutics, Inc.* | | | 2,165,656 | |
| | 126,757 | | | Syneos Health, Inc.* | | | 4,987,888 | |
| | | | | | | | |
| | | | | | | 60,135,178 | |
| | | | | | | | |
| | | | Real Estate - 3.4% | |
| | 142,087 | | | Agree Realty Corp. REIT | | | 8,400,183 | |
| | 138,395 | | | NexPoint Residential Trust, Inc. REIT | | | 4,850,745 | |
| | 270,845 | | | Xenia Hotels & Resorts, Inc. REIT | | | 4,658,534 | |
| | | | | | | | |
| | | | | | | 17,909,462 | |
| | | | | | | | |
| | | | Retailing - 6.9% | |
| | 5,016,400 | | | Allstar Co.*(2)(3)(4) | | | 1,053,444 | |
| | 130,356 | | | Etsy, Inc.* | | | 6,201,035 | |
| | 68,336 | | | Five Below, Inc.* | | | 6,992,140 | |
| | 124,770 | | | Floor & Decor Holdings, Inc. Class A* | | | 3,231,543 | |
| | 42,928 | | | RH*(1) | | | 5,143,633 | |
| | 122,947 | | | Sleep Number Corp.* | | | 3,901,108 | |
| | 43,094 | | | Tory Burch LLC*(2)(3)(4) | | | 2,399,907 | |
| | 78,079 | | | Wayfair, Inc. Class A* | | | 7,033,356 | |
| | | | | | | | |
| | | | | | | 35,956,166 | |
| | | | | | | | |
| | | | Semiconductors & Semiconductor Equipment - 1.7% | |
| | 206,163 | | | Entegris, Inc. | | | 5,750,917 | |
| | 203,162 | | | Tower Semiconductor Ltd.* | | | 2,994,608 | |
| | | | | | | | |
| | | | | | | 8,745,525 | |
| | | | | | | | |
| | | | Software & Services - 14.7% | |
| | 70,910 | | | 2U, Inc.* | | | 3,525,645 | |
| | 31,354 | | | EPAM Systems, Inc.* | | | 3,637,377 | |
| | 93,479 | | | Everbridge, Inc.* | | | 5,305,868 | |
| | 42,310 | | | Fair Isaac Corp.* | | | 7,911,970 | |
| | 208,662 | | | Five9, Inc.* | | | 9,122,703 | |
| | 158,865 | | | Globant S.A.* | | | 8,947,277 | |
| | 57,248 | | | Guidewire Software, Inc.* | | | 4,593,007 | |
| | 40,200 | | | HubSpot, Inc.* | | | 5,054,346 | |
| | 91,028 | | | LiveRamp Holdings, Inc.* | | | 3,516,412 | |
| | 269,883 | | | Mimecast Ltd.* | | | 9,076,165 | |
| | 222,074 | | | Pivotal Software, Inc. Class A* | | | 3,630,910 | |
| | 37,910 | | | Trade Desk, Inc. Class A* | | | 4,399,835 | |
| | 52,117 | | | Wix.com Ltd.* | | | 4,708,250 | |
| | 51,327 | | | Zendesk, Inc.* | | | 2,995,957 | |
| | | | | | | | |
| | | | | | | 76,425,722 | |
| | | | | | | | |
The accompanying notes are an integral part of these financial statements.
|
| Hartford Small Company HLS Fund |
Schedule of Investments – (continued)
December 31, 2018
| | | | | | | | |
| Shares or Principal Amount | | Market Value† | |
| COMMON STOCKS - 95.9% - (continued) | |
| | | | Technology Hardware & Equipment - 2.0% | |
| | 64,006 | | | Zebra Technologies Corp. Class A* | | $ | 10,191,675 | |
| | | | | | | | |
| | | | Telecommunication Services - 0.8% | |
| | 199,391 | | | Boingo Wireless, Inc.* | | | 4,101,473 | |
| | 24,732 | | | Vonage Holdings Corp.* | | | 215,910 | |
| | | | | | | | |
| | | | | | | 4,317,383 | |
| | | | | | | | |
| | | | Transportation - 0.4% | |
| | 127,814 | | | JetBlue Airways Corp.* | | | 2,052,693 | |
| | | | | | | | |
| | |
| | | | Total Common Stocks
(cost $509,910,775) | | $ | 498,014,165 | |
| | | | | | | | |
|
| PREFERRED STOCKS - 1.3% | |
| | | | Retailing - 0.5% | |
| | 74,004 | | | Honest Co.*(2)(3)(4) | | $ | 2,718,907 | |
| | | | | | | | |
| | | | Software & Services - 0.8% | |
| | 410,300 | | | MarkLogic Corp. Series F*(2)(3)(4) | | | 4,103,000 | |
| | | | | | | | |
| | |
| | | | Total Preferred Stocks
(cost $8,151,359) | | $ | 6,821,907 | |
| | | | | | | | |
|
| ESCROWS - 0.0%(5) | |
| | | | Software & Services - 0.0% | |
| | 157,023 | | | Veracode, Inc.*(2)(3)(4) | | $ | 85,421 | |
| | | | | | | | |
| | | | Telecommunication Services - 0.0% | |
| | 41,522 | | | Docusign, Inc. Earnout*(2)(3)(4) | | | 93,424 | |
| | | | | | | | |
| | |
| | | | Total Escrows
(cost $—) | | $ | 178,845 | |
| | | | | | | | |
| | |
| | | | Total Long-Term Investments
(cost $518,062,134) | | $ | 505,014,917 | |
| | | | | | | | |
|
| SHORT-TERM INVESTMENTS - 6.3% | |
| | | | Other Investment Pools & Funds - 4.6% | |
| | 23,660,741 | | | BlackRock Liquidity Funds FedFund Portfolio, Institutional Class, 2.40%(6) | | $ | 23,660,741 | |
| | | | | | | | |
| | | | Securities Lending Collateral - 1.7% | |
| | 451,725 | | | Citibank NA DDCA, 2.39%, 1/2/2019(6) | | | 451,725 | |
| | 5,969,396 | | | Fidelity Investments Money Market Funds, Government Portfolio, Institutional Class, 2.35%(6) | | | 5,969,396 | |
| | 428,173 | | | Goldman Sachs Financial Square Funds, Government Fund, Institutional Class, 2.30%(6) | | | 428,173 | |
| | 312,226 | | | Invesco Government & Agency Portfolio, Institutional Class, 2.30%(6) | | | 312,226 | |
| | 1,738,054 | | | Morgan Stanley Institutional Liquidity Funds, Government Portfolio, Institutional Class, 2.50%(6) | | | 1,738,054 | |
| | 134,921 | | | Western Asset Institutional Government Reserves Fund, Institutional Class, 2.28%(6) | | | 134,921 | |
| | | | | | | | |
| | | | | | | 9,034,495 | |
| | | | | | | | |
| | |
| | | | Total Short-Term Investments
(cost $32,695,236) | | $ | 32,695,236 | |
| | | | | | | | |
| | | | | | | | | | | | |
| | | |
| | | | Total Investments
(cost $550,757,370) | | | 103.5 | % | | $ | 537,710,153 | |
| | | | Other Assets and Liabilities | | | (3.5 | )% | | | (18,210,475 | ) |
| | | | | | | | | | | | |
| | | | Total Net Assets | | | 100.0 | % | | $ | 519,499,678 | |
| | | | | | | | | | | | |
| Note: | Percentage of investments as shown is the ratio of the total market value to total net assets. |
| | Equity industry classifications used in this report are the Global Industry Classification Standard, which was developed by and is the exclusive property and service mark of MSCI, Inc. and Standard & Poor’s. |
| | For Fund compliance purposes, the Fund may not use the same classification system. These classifications are used for financial reporting purposes. |
| (1) | Represents entire or partial securities on loan. See Note 8 in the accompanying Notes to Financial Statements for securities lending information. |
| (2) | Investment valued using significant unobservable inputs. |
| (3) | These securities are valued in good faith at fair value as determined under policies and procedures established by and under the supervision of the Board of Directors. At December 31, 2018, the aggregate fair value of these securities was $12,773,588, which represented 2.5% of total net assets. This amount excludes securities that are principally traded in certain foreign markets and whose prices are adjusted pursuant to a third party pricing service methodology approved by the Board of Directors. |
| (4) | Investment in securities not registered under the Securities Act of 1933 (excluding securities acquired pursuant to Rule 144A and Regulation S). At the end of the period, the value of such restricted securities amounted to $12,773,588 or 2.5% of net assets. |
| | | | | | | | | | | | | | | | |
Period
Acquired | | | Security Name | | Shares/
Par Value | | | Base
Total Cost | | | Base
Market Value | |
| | 08/2011 | | | Allstar Co. | | | 5,016,400 | | | $ | 2,182,228 | | | $ | 1,053,444 | |
| | 05/2018 | | | Docusign, Inc. Earnout | | | 41,522 | | | | — | | | | 93,424 | |
| | 07/2015 | | | DraftKings, Inc. | | | 909,759 | | | | 3,430,143 | | | | 2,319,485 | |
| | 08/2015 | | | Honest Co. Preferred | | | 74,004 | | | | 3,386,053 | | | | 2,718,907 | |
| | 04/2015 | | | MarkLogic Corp. Series F Preferred | | | 410,300 | | | | 4,765,306 | | | | 4,103,000 | |
| | 11/2013 | | | Tory Burch LLC | | | 43,094 | | | | 3,377,560 | | | | 2,399,907 | |
| | 04/2017 | | | Veracode, Inc. | | | 157,023 | | | | — | | | | 85,421 | |
| | | | | | | | | | | | | | | | |
| | | | | | | | | | $ | 17,141,290 | | | $ | 12,773,588 | |
| | | | | | | | | | | | | | | | |
| (5) | Share amount represents shares of the issuer previously held that resulted in receipt of the escrow. |
| (6) | Current yield as of period end. |
| † | See Significant Accounting Policies of accompanying Notes to Financial Statements regarding valuation of investments. |
| | |
| GLOSSARY: (abbreviations used in preceding Schedule of Investments) |
|
| Other Abbreviations: |
ADR | | American Depositary Receipt |
DDCA | | Dollars on Deposit in Custody Account |
REIT | | Real Estate Investment Trust |
The accompanying notes are an integral part of these financial statements.
|
| Hartford Small Company HLS Fund |
Schedule of Investments – (continued)
December 31, 2018
Fair Valuation Summary
The following is a summary of the fair valuations according to the inputs used as of December 31, 2018 in valuing the Fund’s investments.
| | | | | | | | | | | | | | | | |
Description | | Total | | | Level 1 | | | Level 2 | | | Level 3(1) | |
Assets | |
Common Stocks | |
Banks | | $ | 26,356,214 | | | $ | 26,356,214 | | | $ | — | | | $ | — | |
Capital Goods | | | 40,734,100 | | | | 40,734,100 | | | | — | | | | — | |
Commercial & Professional Services | | | 20,501,547 | | | | 20,501,547 | | | | — | | | | — | |
Consumer Durables & Apparel | | | 25,397,666 | | | | 25,397,666 | | | | — | | | | — | |
Consumer Services | | | 36,488,583 | | | | 34,169,098 | | | | — | | | | 2,319,485 | |
Diversified Financials | | | 5,542,942 | | | | 5,542,942 | | | | — | | | | — | |
Energy | | | 7,789,565 | | | | 7,789,565 | | | | — | | | | — | |
Food & Staples Retailing | | | 7,624,627 | | | | 7,624,627 | | | | — | | | | — | |
Food, Beverage & Tobacco | | | 5,967,829 | | | | 5,967,829 | | | | — | | | | — | |
Health Care Equipment & Services | | | 82,851,529 | | | | 82,851,529 | | | | — | | | | — | |
Insurance | | | 4,412,278 | | | | 4,412,278 | | | | — | | | | — | |
Materials | | | 18,613,481 | | | | 18,613,481 | | | | — | | | | — | |
Pharmaceuticals, Biotechnology & Life Sciences | | | 60,135,178 | | | | 60,135,178 | | | | — | | | | — | |
Real Estate | | | 17,909,462 | | | | 17,909,462 | | | | — | | | | — | |
Retailing | | | 35,956,166 | | | | 32,502,815 | | | | — | | | | 3,453,351 | |
Semiconductors & Semiconductor Equipment | | | 8,745,525 | | | | 8,745,525 | | | | — | | | | — | |
Software & Services | | | 76,425,722 | | | | 76,425,722 | | | | — | | | | — | |
Technology Hardware & Equipment | | | 10,191,675 | | | | 10,191,675 | | | | — | | | | — | |
Telecommunication Services | | | 4,317,383 | | | | 4,317,383 | | | | — | | | | — | |
Transportation | | | 2,052,693 | | | | 2,052,693 | | | | — | | | | — | |
Preferred Stocks | | | 6,821,907 | | | | — | | | | — | | | | 6,821,907 | |
Escrows | | | 178,845 | | | | — | | | | — | | | | 178,845 | |
Short-Term Investments | | | 32,695,236 | | | | 32,695,236 | | | | — | | | | — | |
| | | | | | | | | | | | | | | | |
Total | | $ | 537,710,153 | | | $ | 524,936,565 | | | $ | — | | | $ | 12,773,588 | |
| | | | | | | | | | | | | | | | |
| (1) | For the year ended December 31, 2018, there were no transfers in and out of Level 3. |
The following is a rollforward of the Fund’s investments that were valued using unobservable inputs (Level 3) for the year ended December 31, 2018:
| | | | | | | | | | | | | | | | |
| | | Common
Stocks | | | Preferred
Stocks | | | Escrows | | | Total | |
Beginning balance | | $ | 5,046,165 | | | $ | 12,389,626 | | | $ | — | | | $ | 17,435,791 | |
Conversion* | | | (631,232 | ) | | | | | | | 631,232 | | | | — | |
Purchases | | | — | | | | — | | | | — | | | | — | |
Sales | | | — | | | | (3,898,583 | ) | | | — | | | | (3,898,583 | ) |
Accrued discounts/(premiums) | | | — | | | | — | | | | — | | | | — | |
Total realized gain/(loss) | | | | | | | (290,199 | ) | | | — | | | | (290,199 | ) |
Net change in unrealized appreciation/depreciation | | | 1,357,903 | | | | (1,378,937 | ) | | | (452,387 | ) | | | (473,421 | ) |
Transfers into Level 3 | | | — | | | | — | | | | — | | | | — | |
Transfers out of Level 3 | | | — | | | | — | | | | — | | | | — | |
| | | | | | | | | | | | | | | | |
Ending balance | | $ | 5,772,836 | | | $ | 6,821,907 | | | $ | 178,845 | | | $ | 12,773,588 | |
| | | | | | | | | | | | | | | | |
The change in net unrealized appreciation/(depreciation) relating to the Level 3 investments held at December 31, 2018 was $1,088,961.
| * | Private Equity securities that were common stocks are now escrows. |
The accompanying notes are an integral part of these financial statements.
Schedule of Investments
December 31, 2018
| | | | | | | | |
| Shares or Principal Amount | | Market Value† | |
| COMMON STOCKS - 99.2% | |
| | | | Banks - 2.3% | |
| | 260,852 | | | PNC Financial Services Group, Inc. | | $ | 30,496,207 | |
| | | | | | | | |
| | | | Capital Goods - 12.1% | |
| | 143,222 | | | 3M Co. | | | 27,289,520 | |
| | 204,638 | | | General Dynamics Corp. | | | 32,171,140 | |
| | 204,314 | | | Honeywell International, Inc. | | | 26,993,965 | |
| | 107,445 | | | Lockheed Martin Corp. | | | 28,133,399 | |
| | 104,459 | | | Northrop Grumman Corp. | | | 25,582,009 | |
| | 191,350 | | | United Technologies Corp. | | | 20,374,948 | |
| | | | | | | | |
| | | | | | | 160,544,981 | |
| | | | | | | | |
| | | | Consumer Durables & Apparel - 4.2% | |
| | 514,261 | | | NIKE, Inc. Class B | | | 38,127,311 | |
| | 242,427 | | | VF Corp. | | | 17,294,742 | |
| | | | | | | | |
| | | | | | | 55,422,053 | |
| | | | | | | | |
| | | | Consumer Services - 4.9% | |
| | 287,008 | | | McDonald’s Corp. | | | 50,964,010 | |
| | 222,357 | | | Starbucks Corp. | | | 14,319,791 | |
| | | | | | | | |
| | | | | | | 65,283,801 | |
| | | | | | | | |
| | | | Diversified Financials - 4.3% | |
| | 347,393 | | | American Express Co. | | | 33,113,501 | |
| | 62,146 | | | BlackRock, Inc. | | | 24,412,192 | |
| | | | | | | | |
| | | | | | | 57,525,693 | |
| | | | | | | | |
| | | | Energy - 1.8% | |
| | 267,009 | | | Exxon Mobil Corp. | | | 18,207,344 | |
| | 161,768 | | | Schlumberger Ltd. | | | 5,836,589 | |
| | | | | | | | |
| | | | | | | 24,043,933 | |
| | | | | | | | |
| | | | Food & Staples Retailing - 2.5% | |
| | 159,095 | | | Costco Wholesale Corp. | | | 32,409,242 | |
| | | | | | | | |
| | | | Food, Beverage & Tobacco - 9.7% | |
| | 1,035,163 | | | Coca-Cola Co. | | | 49,014,968 | |
| | 962,845 | | | Diageo plc | | | 34,406,685 | |
| | 404,760 | | | PepsiCo., Inc. | | | 44,717,885 | |
| | | | | | | | |
| | | | | | | 128,139,538 | |
| | | | | | | | |
| | | | Health Care Equipment & Services - 10.5% | |
| | 493,321 | | | Baxter International, Inc. | | | 32,470,388 | |
| | 344,813 | | | Danaher Corp. | | | 35,557,117 | |
| | 412,687 | | | Medtronic plc | | | 37,538,009 | |
| | 132,893 | | | UnitedHealth Group, Inc. | | | 33,106,304 | |
| | | | | | | | |
| | | | | | | 138,671,818 | |
| | | | | | | | |
| | | | Household & Personal Products - 4.7% | |
| | 636,400 | | | Colgate-Palmolive Co. | | | 37,878,528 | |
| | 268,283 | | | Procter & Gamble Co. | | | 24,660,573 | |
| | | | | | | | |
| | | | | | | 62,539,101 | |
| | | | | | | | |
| | | | Insurance - 5.6% | |
| | 319,042 | | | Chubb Ltd. | | | 41,213,846 | |
| | 405,832 | | | Marsh & McLennan Cos., Inc. | | | 32,365,102 | |
| | | | | | | | |
| | | | | | | 73,578,948 | |
| | | | | | | | |
| | | | Materials - 4.8% | |
| | 243,973 | | | Ecolab, Inc. | | | 35,949,422 | |
| | 180,358 | | | Linde plc | | | 28,143,062 | |
| | | | | | | | |
| | | | | | | 64,092,484 | |
| | | | | | | | |
| | | | Pharmaceuticals, Biotechnology & Life Sciences - 6.5% | |
| | 107,412 | | | Amgen, Inc. | | | 20,909,894 | |
| | 318,301 | | | Johnson & Johnson | | | 41,076,744 | |
| | 305,162 | | | Merck & Co., Inc. | | | 23,317,429 | |
| | | | | | | | |
| | | | | | | 85,304,067 | |
| | | | | | | | |
| | | | | | | | |
| Shares or Principal Amount | | Market Value† | |
| COMMON STOCKS - 99.2% - (continued) | |
| | | | Real Estate - 6.4% | |
| | 298,354 | | | American Tower Corp. REIT | | $ | 47,196,619 | |
| | 181,924 | | | Public Storage REIT | | | 36,823,237 | |
| | | | | | | | |
| | | | | | | 84,019,856 | |
| | | | | | | | |
| | | | Retailing - 2.6% | |
| | 9,440,100 | | | Allstar Co.*(1)(2)(3) | | | 1,982,421 | |
| | 709,932 | | | TJX Cos., Inc. | | | 31,762,358 | |
| | | | | | | | |
| | | | | | | 33,744,779 | |
| | | | | | | | |
| | | | Software & Services - 9.2% | |
| | 224,706 | | | Accenture plc Class A | | | 31,685,793 | |
| | 126,405 | | | Automatic Data Processing, Inc. | | | 16,574,224 | |
| | 391,596 | | | Microsoft Corp. | | | 39,774,406 | |
| | 255,459 | | | Visa, Inc. Class A | | | 33,705,260 | |
| | | | | | | | |
| | | | | | | 121,739,683 | |
| | | | | | | | |
| | | | Transportation - 7.1% | |
| | 418,475 | | | Canadian National Railway Co. | | | 30,993,266 | |
| | 260,170 | | | Union Pacific Corp. | | | 35,963,299 | |
| | 277,499 | | | United Parcel Service, Inc. Class B | | | 27,064,478 | |
| | | | | | | | |
| | | | | | | 94,021,043 | |
| | | | | | | | |
| | |
| | | | Total Common Stocks
(cost $1,086,075,222) | | $ | 1,311,577,227 | |
| | | | | | | | |
| | |
| | | | Total Long-Term Investments
(cost $1,086,075,222) | | $ | 1,311,577,227 | |
| | | | | | | | |
|
| SHORT-TERM INVESTMENTS - 0.9% | |
| | | | Other Investment Pools & Funds - 0.9% | |
| | 11,699,371 | | | Fidelity Investments Money Market Funds, Government Portfolio, Institutional Class, 2.35%(4) | | $ | 11,699,371 | |
| | | | | | | | |
| | |
| | | | Total Short-Term Investments
(cost $11,699,371) | | $ | 11,699,371 | |
| | | | | | | | |
| | | | | | | | | | | | |
| | | | | | | | | |
| | | |
| | | | Total Investments
(cost $1,097,774,593) | | | 100.1 | % | | $ | 1,323,276,598 | |
| | | | Other Assets and Liabilities | | | (0.1 | )% | | | (1,228,019 | ) |
| | | | | | | | | | | | |
| | | | Total Net Assets | | | 100.0 | % | | $ | 1,322,048,579 | |
| | | | | | | | | | | | |
| Note: | Percentage of investments as shown is the ratio of the total market value to total net assets. |
| | Prices of foreign equities that are principally traded on certain foreign markets will generally be adjusted daily pursuant to a fair value pricing service approved by the Board of Directors in order to reflect an adjustment for factors occurring after the close of certain foreign markets but before the close of the New York Stock Exchange. |
| | Equity industry classifications used in this report are the Global Industry Classification Standard, which was developed by and is the exclusive property and service mark of MSCI, Inc. and Standard & Poor’s. |
| | For Fund compliance purposes, the Fund may not use the same classification system. These classifications are used for financial reporting purposes. |
| (1) | Investment valued using significant unobservable inputs. |
| (2) | This security is valued in good faith at fair value as determined under policies and procedures established by and under the supervision of the Board of Directors. At December 31, 2018, the aggregate fair value of this security was $1,982,421, which |
The accompanying notes are an integral part of these financial statements.
Schedule of Investments – (continued)
December 31, 2018
| | represented 0.1% of total net assets. This amount excludes securities that are principally traded in certain foreign markets and whose prices are adjusted pursuant to a third party pricing service methodology approved by the Board of Directors. |
| (3) | Investment in securities not registered under the Securities Act of 1933 (excluding securities acquired pursuant to Rule 144A and Regulation S). At the end of the period, the value of such restricted securities amounted to $1,982,421 or 0.1% of net assets. |
| | | | | | | | | | | | | | | | |
Period
Acquired | | | Security Name | | Shares/
Par Value | | | Base
Total Cost | | | Base
Market Value | |
| | 08/2011 | | | Allstar Co. | | | 9,440,100 | | | $ | 4,106,619 | | | $ | 1,982,421 | |
| (4) | Current yield as of period end. |
| † | See Significant Accounting Policies of accompanying Notes to Financial Statements regarding valuation of investments. |
| | |
| GLOSSARY: (abbreviations used in preceding Schedule of Investments) |
|
| Other Abbreviations: |
REIT | | Real Estate Investment Trust |
Fair Valuation Summary
The following is a summary of the fair valuations according to the inputs used as of December 31, 2018 in valuing the Fund’s investments.
| | | | | | | | | | | | | | | | |
Description | | Total | | | Level 1 | | | Level 2 | | | Level 3(1) | |
Assets | |
Common Stocks | |
Banks | | $ | 30,496,207 | | | $ | 30,496,207 | | | $ | — | | | $ | — | |
Capital Goods | | | 160,544,981 | | | | 160,544,981 | | | | — | | | | — | |
Consumer Durables & Apparel | | | 55,422,053 | | | | 55,422,053 | | | | — | | | | — | |
Consumer Services | | | 65,283,801 | | | | 65,283,801 | | | | — | | | | — | |
Diversified Financials | | | 57,525,693 | | | | 57,525,693 | | | | — | | | | — | |
Energy | | | 24,043,933 | | | | 24,043,933 | | | | — | | | | — | |
Food & Staples Retailing | | | 32,409,242 | | | | 32,409,242 | | | | — | | | | — | |
Food, Beverage & Tobacco | | | 128,139,538 | | | | 93,732,853 | | | | 34,406,685 | | | | — | |
Health Care Equipment & Services | | | 138,671,818 | | | | 138,671,818 | | | | — | | | | — | |
Household & Personal Products | | | 62,539,101 | | | | 62,539,101 | | | | — | | | | — | |
Insurance | | | 73,578,948 | | | | 73,578,948 | | | | — | | | | — | |
Materials | | | 64,092,484 | | | | 64,092,484 | | | | — | | | | — | |
Pharmaceuticals, Biotechnology & Life Sciences | | | 85,304,067 | | | | 85,304,067 | | | | — | | | | — | |
Real Estate | | | 84,019,856 | | | | 84,019,856 | | | | — | | | | — | |
Retailing | | | 33,744,779 | | | | 31,762,358 | | | | — | | | | 1,982,421 | |
Software & Services | | | 121,739,683 | | | | 121,739,683 | | | | — | | | | — | |
Transportation | | | 94,021,043 | | | | 94,021,043 | | | | — | | | | — | |
Short-Term Investments | | | 11,699,371 | | | | 11,699,371 | | | | — | | | | — | |
| | | | | | | | | | | | | | | | |
Total | | $ | 1,323,276,598 | | | $ | 1,286,887,492 | | | $ | 34,406,685 | | | $ | 1,982,421 | |
| | | | | | | | | | | | | | | | |
| (1) | For the year ended December 31, 2018, there were no transfers in and out of Level 3. |
Level 3 investments at the beginning and/or end of the period in relation to net assets were not significant and accordingly, a reconciliation of Level 3 assets for the period ended December 31, 2018 is not presented.
The accompanying notes are an integral part of these financial statements.
|
| Hartford Total Return Bond HLS Fund |
Schedule of Investments
December 31, 2018
| | | | | | | | | | |
| Shares or Principal Amount | | Market Value† | |
| ASSET & COMMERCIAL MORTGAGE BACKED SECURITIES - 34.9% | |
| | | | | | Asset-Backed - Automobile - 0.5% | |
| $ | | | 749,984 | | | CIG Automobile Receivables Trust 2.71%, 05/15/2023(1) | | $ | 745,424 | |
| | | 2,625,000 | | | Credit Acceptance Auto Loan Trust 2.65%, 06/15/2026(1) | | | 2,599,863 | |
| | | 2,421,180 | | | Skopos Auto Receivables Trust 3.19%, 09/15/2021(1) | | | 2,419,165 | |
| | | 4,810,000 | | | Westlake Automobile Receivables Trust 3.28%, 12/15/2022(1) | | | 4,749,127 | |
| | | | | | | | | | |
| | | | | | | | | 10,513,579 | |
| | | | | | | | | | |
| | | | | | Asset-Backed - Finance & Insurance - 18.0% | |
| | | 9,180,000 | | | AMMC CLO Ltd. 3 mo. USD LIBOR + 1.250%, 3.74%, 07/25/2029(1)(2) | | | 9,153,295 | |
| | | 6,890,000 | | | Anchorage Capital CLO Ltd. 3 mo. USD LIBOR + 1.000%, 3.51%, 07/28/2028(1)(2) | | | 6,817,200 | |
| | | 9,215,000 | | | Apex Credit CLO Ltd. 3 mo. USD LIBOR + 1.470%, 3.96%, 04/24/2029(1)(2) | | | 9,211,756 | |
| | | 2,248,292 | | | Apidos CLO 3 mo. USD LIBOR + 0.980%, 3.43%, 01/19/2025(1)(2) | | | 2,247,139 | |
| | | 4,560,000 | | | Atlas Senior Loan Fund Ltd. 3 mo. USD LIBOR + 1.090%, 3.53%, 01/15/2031(1)(2) | | | 4,488,627 | |
| | | 6,700,000 | | | Atrium 3 mo. USD LIBOR + 0.830%, 3.30%, 04/22/2027(1)(2) | | | 6,616,953 | |
| | | | | | Avery Point CLO Ltd. | |
| | | 2,985,421 | | | 3 mo. USD LIBOR + 1.120%, 3.57%, 01/18/2025(1)(2) | | | 2,981,472 | |
| | | 6,972,092 | | | 3 mo. USD LIBOR + 1.100%, 3.59%, 04/25/2026(1)(2) | | | 6,960,498 | |
| | | 1,746,481 | | | Babson CLO Ltd. 3 mo. USD LIBOR + 1.150%, 3.62%, 07/20/2025(1)(2) | | | 1,742,623 | |
| | | 6,467,471 | | | Bayview Koitere Fund Trust 3.50%, 07/28/2057(1)(3) | | | 6,410,642 | |
| | | | | | Bayview Opportunity Master Fund Trust | |
| | | 1,050,054 | | | 3.35%, 11/28/2032(1)(4) | | | 1,045,511 | |
| | | 2,867,327 | | | 3.50%, 01/28/2055(1)(3) | | | 2,841,919 | |
| | | 3,361,243 | | | 3.50%, 06/28/2057(1)(3) | | | 3,330,990 | |
| | | 4,382,406 | | | 3.50%, 01/28/2058(1)(3) | | | 4,338,482 | |
| | | 1,272,764 | | | 3.60%, 02/25/2033(1)(4) | | | 1,269,733 | |
| | | 2,566,635 | | | 4.00%, 11/28/2053(1)(3) | | | 2,575,365 | |
| | | 5,083,479 | | | 4.00%, 10/28/2064(1)(3) | | | 5,099,927 | |
| | | 5,759,000 | | | Bellemeade Re Ltd. 1 mo. USD LIBOR + 1.200%, 3.71%, 10/25/2027(1)(2) | | | 5,757,379 | |
| | | 560,000 | | | Benefit Street Partners CLO Ltd. 3 mo. USD LIBOR + 0.800%, 3.25%, 10/18/2029(1)(2) | | | 559,720 | |
| | | 783,917 | | | Cal Funding Ltd. 3.47%, 10/25/2027(1) | | | 779,159 | |
| | | 7,890,000 | | | Carlyle Global Market Strategies CLO Ltd. 1 mo. USD LIBOR + 0.780%, 3.29%, 04/27/2027(1)(2) | | | 7,846,045 | |
| | | | | | CBAM Ltd. | |
| | | 3,330,000 | | | 3 mo. USD LIBOR + 1.120%, 3.56%, 10/20/2029(1)(2) | | | 3,308,661 | |
| | | 7,305,000 | | | 3 mo. USD LIBOR + 1.230%, 3.68%, 10/17/2029(1)(2) | | | 7,250,680 | |
| | | | | | CIFC Funding Ltd. | |
| | | 517,018 | | | 3 mo. USD LIBOR + 0.850%, 3.29%, 07/16/2030(1)(2) | | | 516,992 | |
| | | 8,960,000 | | | 3 mo. USD LIBOR + 1.050%, 3.54%, 04/24/2030(1)(2) | | | 8,819,418 | |
| | | 4,175,000 | | | Cirrus Funding Ltd. 4.80%, 01/25/2037(1) | | | 4,245,052 | |
| | | 1,305,522 | | | Civic Mortgage LLC 3.89%, 06/25/2022(1)(4) | | | 1,303,784 | |
| | | 2,130,000 | | | Covenant Credit Partners CLO Ltd. 3 mo. USD LIBOR + 1.850%, 4.29%, 10/15/2029(1)(2) | | | 2,101,518 | |
| | | 3,258,625 | | | Domino’s Pizza Master Issuer LLC 4.12%, 07/25/2048(1) | | | 3,214,862 | |
| | | | | | Dryden Senior Loan Fund | |
| | | 7,264,000 | | | 3 mo. USD LIBOR + 0.820%, 3.43%, 11/15/2028(1)(2) | | | 7,154,532 | |
| | | | | | | | | | |
| Shares or Principal Amount | | Market Value† | |
| ASSET & COMMERCIAL MORTGAGE BACKED SECURITIES - 34.9% - (continued) | |
| | | | | | Asset-Backed - Finance & Insurance - 18.0% - (continued) | |
| $ | | | 7,852,000 | | | 3 mo. USD LIBOR + 1.430%, 3.87%, 10/15/2028(1)(2) | | $ | 7,849,158 | |
| | | 2,950,000 | | | Eagle Re Ltd. 1 mo. USD LIBOR + 1.700%, 3.98%, 11/25/2028(1)(2) | | | 2,945,911 | |
| | | 1,272,788 | | | Fieldstone Mortgage Investment Corp. 1 mo. USD LIBOR + 0.270%, 2.78%, 05/25/2036(2) | | | 965,397 | |
| | | 3,267,261 | | | First Franklin Mortgage Loan Trust 1 mo. USD LIBOR + 0.240%, 2.75%, 04/25/2036(2) | | | 2,981,778 | |
| | | 3,496,681 | | | GSAMP Trust 1 mo. USD LIBOR + 0.090%, 2.60%, 01/25/2037(2) | | | 2,296,694 | |
| | | 2,295,000 | | | Highbridge Loan Management Ltd. 3 mo. USD LIBOR + 1.000%, 3.58%, 02/05/2031(1)(2) | | | 2,249,529 | |
| | | 4,578,000 | | | LCM Ltd. 3 mo. USD LIBOR + 1.210%, 3.68%, 07/20/2030(1)(2) | | | 4,575,148 | |
| | | 3,235,000 | | | Lendmark Funding Trust 2.83%, 12/22/2025(1) | | | 3,191,806 | |
| | | | | | Madison Park Funding Ltd. | |
| | | 7,200,000 | | | 3 mo. USD LIBOR + 1.160%, 3.64%, 07/23/2029(1)(2) | | | 7,166,110 | |
| | | 3,582,000 | | | 3 mo. USD LIBOR + 1.190%, 3.66%, 10/21/2030(1)(2) | | | 3,563,345 | |
| | | 8,416,217 | | | 3 mo. USD LIBOR + 1.260%, 3.73%, 07/20/2026(1)(2) | | | 8,410,956 | |
| | | | | | Magnetite Ltd. | |
| | | 7,657,180 | | | 3 mo. USD LIBOR + 1.000%, 3.49%, 07/25/2026(1)(2) | | | 7,649,845 | |
| | | 6,595,000 | | | 3 mo. USD LIBOR + 1.500%, 3.99%, 07/25/2026(1)(2) | | | 6,554,362 | |
| | | 928,889 | | | Marlette Funding Trust 2.36%, 12/15/2024(1) | | | 926,088 | |
| | | 4,978,140 | | | MFA Trust 3.35%, 11/25/2047(1)(4) | | | 4,960,104 | |
| | | 804,548 | | | Nationstar HECM Loan Trust 2.04%, 09/25/2027(1)(3) | | | 801,460 | |
| | | 4,450,000 | | | Neuberger Berman CLO Ltd. 3 mo. USD LIBOR + 0.800%, 3.24%, 01/15/2028(1)(2) | | | 4,396,062 | |
| | | | | | NRZ Advance Receivables Trust | |
| | | 3,265,500 | | | 2.58%, 10/15/2049(1) | | | 3,245,134 | |
| | | 6,250,000 | | | 3.11%, 12/15/2050(1) | | | 6,239,430 | |
| | | 5,421,000 | | | 3.21%, 02/15/2051(1) | | | 5,410,011 | |
| | | | | | NRZ Excess Spread-Collateralized Notes | |
| | | 4,556,869 | | | 3.19%, 01/25/2023(1) | | | 4,527,232 | |
| | | 2,819,415 | | | 3.27%, 02/25/2023(1) | | | 2,814,630 | |
| | | 2,014,432 | | | Oak Hill Advisors Residential Loan Trust 3.00%, 06/25/2057(1)(4) | | | 1,973,736 | |
| | | 2,495,000 | | | Oaktree EIF Ltd. 3 mo. USD LIBOR + 1.450%, 3.90%, 07/17/2029(1)(2) | | | 2,493,723 | |
| | | 6,780,000 | | | OCP CLO Ltd. 3 mo. USD LIBOR + 0.850%, 3.30%, 04/17/2027(1)(2) | | | 6,711,942 | |
| | | 3,715,000 | | | Octagon Investment Partners Ltd. 3 mo. USD LIBOR + 1.320%, 3.79%, 03/17/2030(1)(2) | | | 3,716,363 | |
| | | | | | OneMain Financial Issuance Trust | |
| | | 7,814,000 | | | 2.37%, 09/14/2032(1) | | | 7,692,881 | |
| | | 2,388,506 | | | 4.10%, 03/20/2028(1) | | | 2,394,125 | |
| | | | | | Pretium Mortgage Credit Partners LLC | |
| | | 891,480 | | | 3.33%, 12/30/2032(1)(3) | | | 880,778 | |
| | | 1,128,533 | | | 3.38%, 01/27/2033(1)(4) | | | 1,118,152 | |
| | | 717,876 | | | Prosper Marketplace Issuance Trust 2.36%, 11/15/2023(1) | | | 715,870 | |
| | | 5,250,000 | | | SBA Tower Trust 2.90%, 10/15/2044(1)(4) | | | 5,219,053 | |
| | | 450,081 | | | Securitized Asset Backed Receivables LLC Trust 1 mo. USD LIBOR + 0.090%, 2.60%, 07/25/2036(2) | | | 209,487 | |
| | | 7,305,000 | | | Shackleton CLO Ltd. 3 mo. USD LIBOR + 1.020%, 3.36%, 07/17/2028(1)(2) | | | 7,218,911 | |
| | | | | | SoFi Consumer Loan Program LLC | |
| | | 1,374,040 | | | 2.50%, 05/26/2026(1) | | | 1,358,130 | |
| | | 705,757 | | | 2.77%, 05/25/2026(1) | | | 699,477 | |
The accompanying notes are an integral part of these financial statements.
|
| Hartford Total Return Bond HLS Fund |
Schedule of Investments – (continued)
December 31, 2018
| | | | | | | | | | |
| Shares or Principal Amount | | Market Value† | |
| ASSET & COMMERCIAL MORTGAGE BACKED SECURITIES - 34.9% - (continued) | |
| | | | | | Asset-Backed - Finance & Insurance - 18.0% - (continued) | |
| $ | | | 1,565,269 | | | 3.05%, 12/26/2025(1) | | $ | 1,561,875 | |
| | | 1,336,715 | | | 3.09%, 10/27/2025(1) | | | 1,333,902 | |
| | | 1,221,540 | | | 3.28%, 01/26/2026(1) | | | 1,220,909 | |
| | | | | | Sound Point CLO Ltd. | |
| | | 5,015,000 | | | 1 mo. USD LIBOR + 1.150%, 3.60%, 04/18/2031(1)(2) | | | 4,937,513 | |
| | | 2,575,000 | | | 3 mo. USD LIBOR + 1.390%, 3.87%, 01/23/2029(1)(2) | | | 2,572,724 | |
| | | | | | Springleaf Funding Trust | |
| | | 8,130,000 | | | 2.68%, 07/15/2030(1) | | | 7,990,524 | |
| | | 4,868,963 | | | 2.90%, 11/15/2029(1) | | | 4,840,660 | |
| | | 5,340,000 | | | SPS Servicer Advance Receivables Trust 2.75%, 11/15/2049(1) | | | 5,330,062 | |
| | | 8,413,695 | | | Symphony CLO Ltd. 3 mo. USD LIBOR + 1.280%, 3.72%, 07/14/2026(1)(2) | | | 8,418,693 | |
| | | | | | Towd Point Mortgage Trust | |
| | | 8,078,939 | | | 2.75%, 10/25/2056(1)(3) | | | 7,902,852 | |
| | | 2,121,521 | | | 2.75%, 04/25/2057(1)(3) | | | 2,074,765 | |
| | | 5,633,305 | | | 2.75%, 06/25/2057(1)(3) | | | 5,481,112 | |
| | | 3,939,877 | | | 2.75%, 07/25/2057(1)(3) | | | 3,835,878 | |
| | | 7,660,000 | | | Treman Park CLO Ltd. 3 mo. USD LIBOR + 1.070%, 3.54%, 10/20/2028(1)(2) | | | 7,632,209 | |
| | | 5,390,203 | | | VOLT LLC 3.38%, 10/25/2047(1)(4) | | | 5,335,288 | |
| | | 1,225,073 | | | VOLT LX LLC 3.25%, 06/25/2047(1)(4) | | | 1,219,131 | |
| | | 1,275,469 | | | VOLT LXII LLC 3.13%, 09/25/2047(1)(4) | | | 1,265,357 | |
| | | 3,201,560 | | | VOLT LXVI 4.34%, 05/25/2048(1)(4) | | | 3,198,087 | |
| | | | | | Voya CLO Ltd. | |
| | | 7,550,000 | | | 3 mo. USD LIBOR + 0.900%, 3.35%, 01/18/2029(1)(2) | | | 7,452,416 | |
| | | 4,835,000 | | | 1 mo. USD LIBOR + 0.990%, 3.44%, 04/18/2031(1)(2) | | | 4,757,872 | |
| | | 2,670,000 | | | 3 mo. USD LIBOR + 1.250%, 3.70%, 01/18/2029(1)(2) | | | 2,558,212 | |
| | | 2,915,000 | | | 3 mo. USD LIBOR + 1.250%, 3.70%, 04/17/2030(1)(2) | | | 2,907,089 | |
| | | 2,059,200 | | | Wendy’s Funding LLC 3.88%, 03/15/2048(1) | | | 1,940,281 | |
| | | 1,810,000 | | | Wingstop Funding LLC 4.97%, 12/05/2048(1) | | | 1,850,996 | |
| | | 10,785,000 | | | York CLO Ltd. 3 mo. USD LIBOR + 1.630%, 2.73%, 01/20/2030(1)(2) | | | 10,846,474 | |
| | | | | | | | | | |
| | | | | | | | | 374,577,633 | |
| | | | | | | | | | |
| | | | | | Asset-Backed - Home Equity - 1.5% | |
| | | | | | GSAA Home Equity Trust | |
| | | 6,024,981 | | | 1 mo. USD LIBOR + 0.080%, 2.59%, 02/25/2037(2) | | | 2,913,899 | |
| | | 3,530,985 | | | 1 mo. USD LIBOR + 0.100%, 2.61%, 03/25/2037(2) | | | 1,684,730 | |
| | | 2,611,197 | | | 1 mo. USD LIBOR + 0.180%, 2.69%, 11/25/2036(2) | | | 1,171,125 | |
| | | 114,291 | | | 1 mo. USD LIBOR + 0.240%, 2.75%, 11/25/2036(2) | | | 64,143 | |
| | | 636,597 | | | 5.99%, 06/25/2036(3) | | | 292,051 | |
| | | 7,541,264 | | | Legacy Mortgage Asset Trust 4.00%, 03/25/2058(1)(4) | | | 7,515,841 | |
| | | 103,323 | | | Morgan Stanley Asset-Backed Securities Capital, Inc. Trust 1 mo. USD LIBOR + 0.150%, 2.66%, 06/25/2036(2) | | | 86,003 | |
| | | 1,494,544 | | | Morgan Stanley Mortgage Loan Trust 1 mo. USD LIBOR + 0.170%, 2.68%, 11/25/2036(2) | | | 626,623 | |
| | | | | | New Residential Mortgage Loan Trust | |
| | | 6,483,715 | | | 4.00%, 08/27/2057(1)(3) | | | 6,517,251 | |
| | | 2,762,942 | | | 4.00%, 12/25/2057(1)(3) | | | 2,776,969 | |
| | | 5,569,307 | | | 1 mo. USD LIBOR + 1.500%, 4.01%, 06/25/2057(1)(2) | | | 5,668,813 | |
| | | | | | | | | | |
| Shares or Principal Amount | | Market Value† | |
| ASSET & COMMERCIAL MORTGAGE BACKED SECURITIES - 34.9% - (continued) | |
| | | | | | Asset-Backed - Home Equity - 1.5% - (continued) | |
| | | | | | Soundview Home Loan Trust | |
| $ | | | 2,873,938 | | | 1 mo. USD LIBOR + 0.180%, 2.69%, 07/25/2037(2) | | $ | 2,568,887 | |
| | | 435,000 | | | 1 mo. USD LIBOR + 0.250%, 2.76%, 11/25/2036(2) | | | 396,781 | |
| | | | | | | | | | |
| | | | | | | | | 32,283,116 | |
| | | | | | | | | | |
| | | | | | Collateralized - Mortgage Obligations - 0.2% | |
| | | 1,414,508 | | | COLT Mortgage Loan Trust 2.61%, 05/27/2047(1)(3) | | | 1,405,652 | |
| | | 2,181,531 | | | Consumer Loan Underlying Bond Credit Trust 2.61%, 01/15/2024(1) | | | 2,168,613 | |
| | | | | | | | | | |
| | | | | | | | | 3,574,265 | |
| | | | | | | | | | |
| | | | | | Commercial Mortgage - Backed Securities - 5.5% | |
| | | | | | Banc of America Commercial Mortgage Trust | | | | |
| | | 39,931,203 | | | 0.75%, 11/15/2050(3)(5) | | | 2,098,564 | |
| | | 4,709,071 | | | 0.82%, 11/15/2054(3)(5) | | | 263,121 | |
| | | | | | BBCMS Mortgage Trust | |
| | | 28,862,361 | | | 1.51%, 02/15/2050(3)(5) | | | 2,602,692 | |
| | | 8,553,000 | | | 1 mo. USD LIBOR + 0.850%, 3.31%, 08/15/2036(1)(2) | | | 8,540,268 | |
| | | | | | Benchmark Mortgage Trust | |
| | | 12,000,262 | | | 0.53%, 01/15/2051(3)(5) | | | 442,346 | |
| | | 20,325,512 | | | 0.54%, 07/15/2051(3)(5) | | | 754,702 | |
| | | | | | Citigroup Commercial Mortgage Trust | |
| | | 22,414,407 | | | 1.02%, 07/10/2047(3)(5) | | | 962,883 | |
| | | 26,314,625 | | | 1.11%, 04/10/2048(3)(5) | | | 1,289,301 | |
| | | | | | Commercial Mortgage Pass-Through Certificates | | | | |
| | | 7,436,115 | | | 0.65%, 02/10/2047(3)(5) | | | 195,124 | |
| | | 535,000 | | | 4.24%, 02/10/2047(3) | | | 556,851 | |
| | | | | | Commercial Mortgage Trust | | | | |
| | | 4,121,104 | | | 0.68%, 08/10/2046(3)(5) | | | 112,571 | |
| | | 6,762,951 | | | 1.92%, 07/10/2046(1)(3)(5) | | | 153,056 | |
| | | 1,035,000 | | | 2.54%, 12/10/2045 | | | 1,011,086 | |
| | | 950,805 | | | 2.82%, 10/15/2045 | | | 935,902 | |
| | | 1,670,000 | | | 2.85%, 10/15/2045 | | | 1,641,129 | |
| | | 1,145,000 | | | 3.10%, 03/10/2046 | | | 1,138,574 | |
| | | 876,221 | | | 3.21%, 03/10/2046 | | | 875,270 | |
| | | 6,780,000 | | | 3.42%, 03/10/2031(1) | | | 6,890,219 | |
| | | 1,260,000 | | | 3.61%, 06/10/2046(3) | | | 1,276,206 | |
| | | 705,000 | | | 3.62%, 07/10/2050 | | | 708,924 | |
| | | 2,120,000 | | | 3.69%, 08/10/2047 | | | 2,149,763 | |
| | | 1,150,133 | | | 3.80%, 08/10/2047 | | | 1,172,938 | |
| | | 1,485,000 | | | 3.83%, 07/15/2047 | | | 1,514,673 | |
| | | 575,125 | | | 3.96%, 03/10/2047 | | | 589,606 | |
| | | 1,199,384 | | | 4.02%, 07/10/2045 | | | 1,237,616 | |
| | | 630,000 | | | 4.07%, 02/10/2047(3) | | | 650,524 | |
| | | 1,045,000 | | | 4.21%, 08/10/2046(3) | | | 1,085,583 | |
| | | 615,085 | | | 4.23%, 07/10/2045(3) | | | 641,182 | |
| | | 720,000 | | | 4.57%, 10/15/2045(1)(3) | | | 163,238 | |
| | | 1,920,000 | | | 4.75%, 10/15/2045(1)(3) | | | 978,240 | |
| | | 436,716 | | | Credit Suisse First Boston Mortgage Securities Corp. 4.88%, 04/15/2037 | | | 429,226 | |
| | | | | | CSAIL Commercial Mortgage Trust | |
| | | 62,588,014 | | | 0.80%, 06/15/2057(3)(5) | | | 2,411,616 | |
| | | 3,833,675 | | | 1.02%, 11/15/2048(3)(5) | | | 175,534 | |
| | | 11,373,718 | | | 1.80%, 01/15/2049(3)(5) | | | 1,010,967 | |
| | | 470,000 | | | 3.45%, 08/15/2048 | | | 468,008 | |
| | | 545,000 | | | 3.54%, 11/15/2048 | | | 544,418 | |
| | | 550,000 | | | 3.72%, 08/15/2048 | | | 555,343 | |
| | | 83,000 | | | 3.76%, 11/15/2048 | | | 83,896 | |
| | | 7,397,420 | | | DBUBS Mortgage Trust
0.71%, 11/10/2046(1)(3)(5) | | | 66,802 | |
The accompanying notes are an integral part of these financial statements.
|
| Hartford Total Return Bond HLS Fund |
Schedule of Investments – (continued)
December 31, 2018
| | | | | | | | | | |
| Shares or Principal Amount | | Market Value† | |
| ASSET & COMMERCIAL MORTGAGE BACKED SECURITIES - 34.9% - (continued) | |
| | | | | | Commercial Mortgage - Backed Securities - 5.5% - (continued) | |
| $ | | | 3,024,029 | | | Four Times Square Trust Commercial Mortgage Pass-Through Certificates 5.40%, 12/13/2028(1) | | $ | 3,132,069 | |
| | | | | | FREMF Mortgage Trust | | | | |
| | | 4,680,000 | | | 3.05%, 10/25/2047(1)(3) | | | 4,660,364 | |
| | | 868,000 | | | 4.29%, 11/25/2051(1)(3) | | | 781,018 | |
| | | 5,485,000 | | | 5.28%, 09/25/2043(1)(3) | | | 5,632,176 | |
| | | 1,086,895 | | | GE Business Loan Trust 1 mo. USD LIBOR + 1.000%, 3.46%, 05/15/2034(1)(2) | | | 1,020,271 | |
| | | | | | GS Mortgage Securities Trust | | | | |
| | | 45,732,241 | | | 0.09%, 07/10/2046(3)(5) | | | 175,077 | |
| | | 6,508,531 | | | 1.34%, 08/10/2044(1)(3)(5) | | | 176,229 | |
| | | 4,340,000 | | | 2.95%, 11/05/2034(1) | | | 4,300,996 | |
| | | 1,580,166 | | | 3.67%, 04/10/2047(1) | | | 654,995 | |
| | | 785,121 | | | 4.07%, 01/10/2047 | | | 808,597 | |
| | | 2,215,000 | | | 4.97%, 04/10/2047(1)(3) | | | 1,842,378 | |
| | | | | | JP Morgan Chase Commercial Mortgage Securities Trust | | | | |
| | | 2,185,000 | | | 2.73%, 10/15/2045(1)(3) | | | 1,110,810 | |
| | | 765,128 | | | 2.84%, 12/15/2047 | | | 751,811 | |
| | | 1,290,924 | | | 4.37%, 12/15/2047(1)(3) | | | 1,060,286 | |
| | | | | | JPMBB Commercial Mortgage Securities Trust | | | | |
| | | 24,491,642 | | | 0.75%, 09/15/2047(3)(5) | | | 673,158 | |
| | | 7,539,456 | | | 0.81%, 05/15/2048(3)(5) | | | 224,865 | |
| | | 825,000 | | | 2.91%, 10/15/2048 | | | 802,002 | |
| | | 1,119,872 | | | 3.36%, 07/15/2045 | | | 1,121,057 | |
| | | 11,349 | | | Lehman Brothers Small Balance Commercial Mortgage Trust 5.52%, 09/25/2030(1)(3) | | | 11,389 | |
| | | | | | Morgan Stanley Bank of America Merrill Lynch Trust | | | | |
| | | 1,532,918 | | | 1.04%, 10/15/2048(3)(5) | | | 82,606 | |
| | | 15,758,482 | | | 1.10%, 12/15/2047(3)(5) | | | 582,905 | |
| | | 1,530,000 | | | 3.13%, 12/15/2048 | | | 1,520,437 | |
| | | 1,320,000 | | | 3.18%, 08/15/2045 | | | 1,314,192 | |
| | | 795,172 | | | 4.26%, 10/15/2046(3) | | | 825,922 | |
| | | | | | Morgan Stanley Capital Trust | |
| | | 32,201,068 | | | 0.34%, 09/15/2047(1)(3)(5) | | | 212,839 | |
| | | 8,232,076 | | | 1.45%, 06/15/2050(3)(5) | | | 671,327 | |
| | | 4,920,000 | | | 3.47%, 08/11/2033(1) | | | 4,978,326 | |
| | | 1,460,000 | | | 5.15%, 07/15/2049(1)(3) | | | 1,315,407 | |
| | | 920,000 | | | 5.24%, 10/12/2052(1)(3) | | | 100,954 | |
| | | 3,830,000 | | | Oaktown Re II Ltd. 3 mo. USD LIBOR + 1.550%, 4.06%, 07/25/2028(1)(2) | | | 3,834,641 | |
| | | 790,000 | | | SFAVE Commercial Mortgage Securities Trust 3.87%, 01/05/2043(1)(3) | | | 730,754 | |
| | | | | | UBS Commercial Mortgage Trust | |
| | | 4,928,569 | | | 1.15%, 08/15/2050(3)(5) | | | 348,950 | |
| | | 850,000 | | | 3.43%, 08/15/2050 | | | 833,268 | |
| | | | | | UBS-Barclays Commercial Mortgage Trust | |
| | | 790,000 | | | 2.85%, 12/10/2045 | | | 781,063 | |
| | | 2,295,000 | | | 3.09%, 08/10/2049 | | | 2,289,926 | |
| | | 2,065,000 | | | 3.19%, 03/10/2046 | | | 2,064,492 | |
| | | 775,000 | | | 3.24%, 04/10/2046 | | | 776,577 | |
| | | | | | Wells Fargo Commercial Mortgage Trust | |
| | | 21,135,621 | | | 1.16%, 05/15/2048(3)(5) | | | 1,000,129 | |
| | | 1,166,029 | | | 2.92%, 10/15/2045 | | | 1,153,601 | |
| | | 419,000 | | | 2.92%, 11/15/2049 | | | 398,851 | |
| | | 345,000 | | | 2.94%, 10/15/2049 | | | 328,981 | |
| | | 805,000 | | | 3.29%, 05/15/2048 | | | 795,588 | |
| | | 440,000 | | | 3.41%, 12/15/2047 | | | 440,394 | |
| | | 445,000 | | | 3.79%, 09/15/2048 | | | 450,361 | |
| | | 430,000 | | | 4.10%, 05/15/2048(3) | | | 378,059 | |
| | | | | | WF-RBS Commercial Mortgage Trust | |
| | | 255,115 | | | 2.88%, 12/15/2045 | | | 251,172 | |
| | | 1,215,000 | | | 3.00%, 08/15/2045 | | | 1,207,093 | |
| | | | | | | | | | |
| Shares or Principal Amount | | Market Value† | |
| ASSET & COMMERCIAL MORTGAGE BACKED SECURITIES - 34.9% - (continued) | |
| | | | | | Commercial Mortgage - Backed Securities - 5.5% - (continued) | |
| $ | | | 1,150,000 | | | 3.07%, 03/15/2045 | | $ | 1,141,408 | |
| | | 450,000 | | | 3.35%, 05/15/2045 | | | 446,148 | |
| | | 1,015,000 | | | 3.61%, 11/15/2047 | | | 1,022,992 | |
| | | 990,000 | | | 3.72%, 05/15/2047 | | | 1,005,550 | |
| | | 925,000 | | | 4.00%, 05/15/2047 | | | 951,923 | |
| | | 230,000 | | | 4.05%, 03/15/2047 | | | 237,243 | |
| | | 755,286 | | | 4.10%, 03/15/2047 | | | 780,850 | |
| | | 1,095,000 | | | 4.15%, 08/15/2046(3) | | | 1,134,277 | |
| | | 710,000 | | | 5.00%, 06/15/2044(1)(3) | | | 524,997 | |
| | | 790,000 | | | 5.58%, 04/15/2045(1)(3) | | | 791,357 | |
| | | | | | | | | | |
| | | | | | | | | 115,023,070 | |
| | | | | | | | | | |
| | | | | | Diversified Financial Services - 0.1% | |
| | | 1,716,000 | | | Barings CLO Ltd. 1 mo. USD LIBOR + 0.950%, 3.42%, 07/20/2029(1)(2) | | | 1,692,762 | |
| | | | | | | | | | |
| | | | | | Other ABS - 1.4% | |
| | | 3,967,224 | | | Atlas Senior Loan Fund IV Ltd. 3 mo. USD LIBOR + 0.680%, 3.30%, 02/17/2026(1)(2) | | | 3,939,279 | |
| | | 7,420,000 | | | Galaxy XXIX CLO Ltd. 3 mo. USD LIBOR + 0.790%, 3.41%, 11/15/2026(1)(2) | | | 7,379,049 | |
| | | 6,116,737 | | | Seasoned Credit Risk Transfer Trust 3.50%, 11/25/2057 | | | 6,045,055 | |
| | | 7,465,000 | | | TICP CLO XII Ltd. 3 mo. USD LIBOR + 1.110%, 3.70%, 01/15/2031(1)(2) | | | 7,444,859 | |
| | | 4,695,000 | | | VOLT LXXIII LLC 4.46%, 10/25/2048(1)(4) | | | 4,696,194 | |
| | | | | | | | | | |
| | | | | | | | | 29,504,436 | |
| | | | | | | | | | |
| | | | | | Whole Loan Collateral CMO - 7.7% | |
| | | | | | Alternative Loan Trust | |
| | | 1,150,163 | | | 1 mo. USD LIBOR + 0.320%, 2.64%, 11/25/2035(2) | | | 1,053,769 | |
| | | 234,609 | | | 1 mo. USD LIBOR + 0.540%, 3.05%, 01/25/2036(2) | | | 222,482 | |
| | | 1,103,215 | | | 5.75%, 05/25/2036 | | | 797,000 | |
| | | | | | Angel Oak Mortgage Trust LLC | |
| | | 1,878,841 | | | 2.48%, 07/25/2047(1)(3) | | | 1,850,410 | |
| | | 1,520,374 | | | 2.71%, 11/25/2047(1)(3) | | | 1,508,141 | |
| | | 385,025 | | | 2.81%, 01/25/2047(1)(3) | | | 382,715 | |
| | | | | | Banc of America Funding Trust | |
| | | 1,405,723 | | | 1 mo. USD LIBOR + 0.300%, 2.77%, 05/20/2047(2) | | | 1,280,867 | |
| | | 4,368,907 | | | 5.77%, 05/25/2037(3) | | | 4,178,623 | |
| | | 162,642 | | | 5.85%, 01/25/2037(4) | | | 151,849 | |
| | | 994,698 | | | BCAP LLC Trust 1 mo. USD LIBOR + 0.180%, 2.69%, 03/25/2037(2) | | | 962,339 | |
| | | 415,230 | | | Bear Stearns Adjustable Rate Mortgage Trust 1 year USD CMT + 2.300%, 4.73%, 10/25/2035(2) | | | 418,365 | |
| | | 1,313,997 | | | Bear StearnsAlt-A Trust 1 mo. USD LIBOR + 0.500%, 3.01%, 01/25/2036(2) | | | 1,334,480 | |
| | | 467,736 | | | Bear Stearns Mortgage Funding Trust
1 mo. USD LIBOR + 0.180%, 2.69%, 10/25/2036(2) | | | 428,270 | |
| | | 6,240,000 | | | Cent CLO Ltd. 3 mo. USD LIBOR + 1.150%, 3.66%, 07/27/2030(1)(2) | | | 6,166,231 | |
| | | | | | CHL Mortgage Pass-Through Trust | |
| | | 544,235 | | | 3.85%, 11/20/2035(3) | | | 499,046 | |
| | | 2,418,832 | | | 4.06%, 09/25/2047(3) | | | 2,243,582 | |
| | | 6,152,906 | | | CIM Trust 3.00%, 04/25/2057(1)(3) | | | 6,104,559 | |
| | | 4,485,000 | | | Colombia Cent CLO Ltd. 3 mo. USD LIBOR + 1.150%, 3.64%, 10/25/2028(1)(2) | | | 4,448,192 | |
| | | 1,919,182 | | | COLT Mortgage Loan Trust 2.93%, 02/25/2048(1)(3) | | | 1,897,201 | |
| | | 2,046,371 | | | Credit Suisse First Boston Mortgage Securities Corp. 5.50%, 06/25/2035 | | | 1,956,036 | |
| | | 2,575,403 | | | CSMC Trust 3.25%, 04/25/2047(1)(3) | | | 2,513,437 | |
The accompanying notes are an integral part of these financial statements.
|
| Hartford Total Return Bond HLS Fund |
Schedule of Investments – (continued)
December 31, 2018
| | | | | | | | | | |
| Shares or Principal Amount | | Market Value† | |
| ASSET & COMMERCIAL MORTGAGE BACKED SECURITIES - 34.9% - (continued) | |
| | | | | | Whole Loan Collateral CMO - 7.7% - (continued) | |
| | | | | | Deephaven Residential Mortgage Trust | |
| $ | | | 1,393,623 | | | 2.45%, 06/25/2047(1)(3) | | $ | 1,370,660 | |
| | | 1,614,134 | | | 2.58%, 10/25/2047(1)(3) | | | 1,593,563 | |
| | | 714,447 | | | 2.73%, 12/26/2046(1)(3) | | | 707,386 | |
| | | | | | Fannie Mae Connecticut Avenue Securities | | | | |
| | | 2,025,000 | | | 1 mo. USD LIBOR + 3.550%, 6.06%, 07/25/2029(2) | | | 2,146,087 | |
| | | 4,065,143 | | | 1 mo. USD LIBOR + 4.350%, 6.86%, 05/25/2029(2) | | | 4,402,334 | |
| | | 1,313,979 | | | 1 mo. USD LIBOR + 4.900%, 7.41%, 11/25/2024(2) | | | 1,466,584 | |
| | | 725,147 | | | 1 mo. USD LIBOR + 5.700%, 8.21%, 04/25/2028(2) | | | 818,639 | |
| | | 616,000 | | | 1 mo. USD LIBOR + 6.000%, 8.51%, 09/25/2028(2) | | | 707,078 | |
| | | 1,952,739 | | | Galton Funding Mortgage Trust 3.50%, 11/25/2057(1)(3) | | | 1,946,521 | |
| | | 34,846 | | | GMACM Mortgage Loan Trust 3.83%, 04/19/2036(3) | | | 30,780 | |
| | | | | | GSR Mortgage Loan Trust | |
| | | 1,341,254 | | | 1 mo. USD LIBOR + 0.300%, 2.81%, 01/25/2037(2) | | | 744,390 | |
| | | 2,224,068 | | | 4.35%, 01/25/2036(3) | | | 2,205,125 | |
| | | | | | HarborView Mortgage Loan Trust | |
| | | 1,141,376 | | | 1 mo. USD LIBOR + 0.190%, 2.66%, 01/19/2038(2) | | | 1,096,293 | |
| | | 4,134,214 | | | 1 mo. USD LIBOR + 0.240%, 2.71%, 12/19/2036(2) | | | 3,773,491 | |
| | | 3,060,000 | | | Home Re Ltd. 1 mo. USD LIBOR + 1.600%, 4.11%, 10/25/2028(1)(2) | | | 3,063,728 | |
| | | 1,256,908 | | | IndyMac Index Mortgage Loan Trust 3.74%, 03/25/2036(3) | | | 1,122,906 | |
| | | 315,769 | | | JP Morgan Mortgage Trust 4.13%, 04/25/2037(3) | | | 296,786 | |
| | | 2,735,000 | | | LCM L.P. 3 mo. USD LIBOR + 1.040%, 3.38%, 10/20/2027(1)(2) | | | 2,712,269 | |
| | | 1,363,265 | | | Lehman XS Trust 1 mo. USD LIBOR + 0.210%, 2.72%, 07/25/2046(2) | | | 1,311,170 | |
| | | | | | LSTAR Securities Investment Ltd. | |
| | | 994,314 | | | 1 mo. USD LIBOR + 1.550%, 3.85%, 04/01/2021(1)(2) | | | 973,262 | |
| | | 1,583,128 | | | 1 mo. USD LIBOR + 1.650%, 4.00%, 11/01/2022(1)(2) | | | 1,594,362 | |
| | | 1,365,009 | | | 1 mo. USD LIBOR + 1.750%, 4.10%, 09/01/2022(1)(2) | | | 1,368,867 | |
| | | 2,191,538 | | | 1 mo. USD LIBOR + 1.750%, 4.10%, 10/01/2022(1)(2) | | | 2,183,582 | |
| | | 516,853 | | | MASTR Adjustable Rate Mortgages Trust 4.44%, 11/21/2034(3) | | | 529,057 | |
| | | 1,490,115 | | | MFA Trust 2.59%, 02/25/2057(1)(3) | | | 1,465,544 | |
| | | | | | New Residential Mortgage Loan Trust | |
| | | 6,988,093 | | | 1 mo. USD LIBOR + 0.750%, 3.26%, 01/25/2048(1)(2) | | | 6,951,318 | |
| | | 4,698,349 | | | 3.75%, 11/26/2035(1)(3) | | | 4,702,160 | |
| | | 4,172,004 | | | 3.75%, 11/25/2056(1)(3) | | | 4,166,189 | |
| | | 7,867,644 | | | 4.00%, 02/25/2057(1)(3) | | | 7,916,533 | |
| | | 7,715,782 | | | 4.00%, 03/25/2057(1)(3) | | | 7,786,990 | |
| | | 6,239,110 | | | 4.00%, 04/25/2057(1)(3) | | | 6,276,746 | |
| | | 4,997,502 | | | 4.00%, 05/25/2057(1)(3) | | | 5,042,036 | |
| | | 7,485,000 | | | OZLM Ltd. 3 mo. USD LIBOR + 1.050%, 3.57%, 04/30/2027(1)(2) | | | 7,423,825 | |
| | | 1,410,320 | | | RBSGC Mortgage Loan Trust 6.25%, 01/25/2037 | | | 1,367,121 | �� |
| | | | | | Residential Accredit Loans, Inc. | |
| | | 3,385,949 | | | 3.41%, 11/25/2037(3) | | | 3,004,521 | |
| | | 866,093 | | | 6.00%, 12/25/2035 | | | 826,046 | |
| | | | | | | | | | |
| Shares or Principal Amount | | Market Value† | |
| ASSET & COMMERCIAL MORTGAGE BACKED SECURITIES - 34.9% - (continued) | |
| | | | | | Whole Loan Collateral CMO - 7.7% - (continued) | |
| $ | | | 1,651,678 | | | Structured Agency Credit Risk Trust 1 mo. USD LIBOR + 1.650%, 4.16%, 04/25/2043(1)(2) | | $ | 1,652,138 | |
| | | | | | Towd Point Mortgage Trust | |
| | | 3,596,854 | | | 2.25%, 04/25/2056(1)(3) | | | 3,514,279 | |
| | | 857,295 | | | 2.75%, 02/25/2055(1)(3) | | | 845,484 | |
| | | 3,150,301 | | | 2.75%, 08/25/2055(1)(3) | | | 3,087,220 | |
| | | 7,254,084 | | | 1 mo. USD LIBOR + 0.600%, 2.92%, 02/25/2057(1)(2) | | | 7,228,956 | |
| | | 670,138 | | | 3.00%, 03/25/2054(1)(3) | | | 662,990 | |
| | | | | | WaMu Mortgage Pass-Through Certificates Trust | |
| | | 3,559,216 | | | 12 mo. USD MTA + 0.820%, 2.87%, 12/25/2046(2) | | | 3,273,349 | |
| | | 757,114 | | | 1 mo. USD LIBOR + 0.420%, 2.93%, 06/25/2044(2) | | | 734,532 | |
| | | 1,372,355 | | | 3.59%, 06/25/2037(3) | | | 1,272,520 | |
| | | | | | Wells Fargo Commercial Mortgage Trust | |
| | | 45,676,048 | | | 1.15%, 09/15/2057(3)(5) | | | 2,078,402 | |
| | | 1,015,000 | | | 3.84%, 09/15/2058 | | | 1,033,822 | |
| | | | | | | | | | |
| | | | | | | | | 160,875,235 | |
| | | | | | | | | | |
| | | |
| | | | | | Total Asset & Commercial Mortgage Backed Securities
(cost $736,570,826) | | $ | 728,044,096 | |
| | | | | | | | | | |
| CORPORATE BONDS - 28.6% | |
| | | | | | Aerospace/Defense - 0.5% | |
| | | | | | DAE Funding LLC | |
| | | 75,000 | | | 4.50%, 08/01/2022(1) | | $ | 72,000 | |
| | | 80,000 | | | 5.00%, 08/01/2024(1) | | | 77,400 | |
| | | 4,127,000 | | | Lockheed Martin Corp. 4.09%, 09/15/2052 | | | 3,852,188 | |
| | | | | | United Technologies Corp. | |
| | | 140,000 | | | 2.80%, 05/04/2024 | | | 131,964 | |
| | | 5,255,000 | | | 3.65%, 08/16/2023 | | | 5,234,409 | |
| | | 1,565,000 | | | 3.95%, 08/16/2025 | | | 1,552,880 | |
| | | 400,000 | | | 4.63%, 11/16/2048 | | | 386,275 | |
| | | | | | | | | | |
| | | | | | | | | 11,307,116 | |
| | | | | | | | | | |
| | | | | | Agriculture - 0.9% | |
| | | | | | Altria Group, Inc. | |
| | | 4,550,000 | | | 2.85%, 08/09/2022 | | | 4,367,893 | |
| | | 2,345,000 | | | 3.88%, 09/16/2046 | | | 1,786,223 | |
| | | | | | BAT Capital Corp. | |
| | | 1,635,000 | | | 3.22%, 08/15/2024 | | | 1,505,989 | |
| | | 3,025,000 | | | 4.39%, 08/15/2037 | | | 2,475,867 | |
| | | 6,195,000 | | | Hidden Hills DUS 3.90%, 01/01/2029(19)(20) | | | 6,372,380 | |
| | | 1,300,000 | | | Imperial Brands Finance plc 3.75%, 07/21/2022(1) | | | 1,289,532 | |
| | | | | | | | | | |
| | | | | | | | | 17,797,884 | |
| | | | | | | | | | |
| | | | | | Airlines - 0.1% | |
| | | | | | Delta Air Lines, Inc. | |
| | | 765,000 | | | 3.63%, 03/15/2022 | | | 748,622 | |
| | | 1,310,000 | | | 3.80%, 04/19/2023 | | | 1,289,044 | |
| | | | | | | | | | |
| | | | | | | | | 2,037,666 | |
| | | | | | | | | | |
| | | | | | Auto Manufacturers - 0.5% | |
| | | | | | Ford Motor Co. | |
| | | 585,000 | | | 4.75%, 01/15/2043 | | | 451,143 | |
| | | 635,000 | | | 5.29%, 12/08/2046 | | | 521,323 | |
| | | 540,000 | | | Ford Motor Credit Co. LLC 3.82%, 11/02/2027 | | | 455,603 | |
| | | | | | General Motors Co. | |
| | | 2,220,000 | | | 5.40%, 04/01/2048 | | | 1,890,659 | |
| | | 915,000 | | | 5.95%, 04/01/2049 | | | 825,068 | |
| | | 1,000,000 | | | 6.25%, 10/02/2043 | | | 937,343 | |
| | | 1,035,000 | | | 6.75%, 04/01/2046 | | | 1,001,988 | |
The accompanying notes are an integral part of these financial statements.
|
| Hartford Total Return Bond HLS Fund |
Schedule of Investments – (continued)
December 31, 2018
| | | | | | | | | | |
| Shares or Principal Amount | | Market Value† | |
| CORPORATE BONDS - 28.6% - (continued) | |
| | | | | | Auto Manufacturers - 0.5% - (continued) | |
| | | | | | General Motors Financial Co., Inc. | |
| $ | | | 500,000 | | | 3.70%, 05/09/2023 | | $ | 475,715 | |
| | | 1,760,000 | | | 3.95%, 04/13/2024 | | | 1,671,490 | |
| | | 3,135,000 | | | Volkswagen Group of America Finance LLC 3.88%, 11/13/2020(1) | | | 3,150,295 | |
| | | | | | | | | | |
| | | | | | | | | 11,380,627 | |
| | | | | | | | | | |
| | | | | | Auto Parts & Equipment - 0.0% | |
| | | 450,000 | | | Adient Global Holdings Ltd.
4.88%, 08/15/2026(1) | | | 344,250 | |
| | | 290,000 | | | Goodyear Tire & Rubber Co. 5.00%, 05/31/2026 | | | 261,000 | |
| | | | | | | | | | |
| | | | | | | | | 605,250 | |
| | | | | | | | | | |
| | | | | | Beverages - 1.0% | |
| | | | | | Anheuser-Busch Cos. LLC / Anheuser-Busch InBev Worldwide, Inc. | |
| | | 3,895,000 | | | 3.65%, 02/01/2026(1) | | | 3,682,910 | |
| | | 70,000 | | | 4.70%, 02/01/2036(1) | | | 64,918 | |
| | | 3,470,000 | | | Anheuser-Busch InBev Finance, Inc. 3.30%, 02/01/2023 | | | 3,374,050 | |
| | | | | | Anheuser-Busch InBev Worldwide, Inc. | |
| | | 2,190,000 | | | 3.50%, 01/12/2024 | | | 2,142,139 | |
| | | 2,213,000 | | | 3.75%, 07/15/2042 | | | 1,734,783 | |
| | | 1,145,000 | | | 4.60%, 04/15/2048 | | | 1,026,217 | |
| | | 2,035,000 | | | 4.75%, 04/15/2058 | | | 1,770,915 | |
| | | | | | Constellation Brands, Inc. | |
| | | 1,795,000 | | | 2.65%, 11/07/2022 | | | 1,718,771 | |
| | | 380,000 | | | 2.70%, 05/09/2022 | | | 367,035 | |
| | | 1,490,000 | | | 3.60%, 02/15/2028 | | | 1,372,196 | |
| | | 1,170,000 | | | 4.40%, 11/15/2025 | | | 1,172,315 | |
| | | 245,000 | | | 4.50%, 05/09/2047 | | | 223,617 | |
| | | 2,003,000 | | | 4.75%, 12/01/2025 | | | 2,045,623 | |
| | | | | | | | | | |
| | | | | | | | | 20,695,489 | |
| | | | | | | | | | |
| | | | | | Biotechnology - 0.3% | |
| | | 1,315,000 | | | Amgen, Inc. 2.65%, 05/11/2022 | | | 1,285,470 | |
| | | 85,000 | | | Celgene Corp. 4.63%, 05/15/2044 | | | 74,668 | |
| | | | | | Gilead Sciences, Inc. | |
| | | 590,000 | | | 3.25%, 09/01/2022 | | | 588,613 | |
| | | 4,490,000 | | | 4.15%, 03/01/2047 | | | 4,135,923 | |
| | | | | | | | | | |
| | | | | | | | | 6,084,674 | |
| | | | | | | | | | |
| | | | | | Chemicals - 1.0% | |
| | | 440,000 | | | CF Industries, Inc. 4.95%, 06/01/2043 | | | 341,000 | |
| | | 290,000 | | | Chemours Co. 5.38%, 05/15/2027 | | | 261,000 | |
| | | DowDuPont, Inc. | |
| | | 3,495,000 | | | 4.21%, 11/15/2023 | | | 3,572,413 | |
| | | 3,495,000 | | | 4.73%, 11/15/2028 | | | 3,608,244 | |
| | | 1,080,000 | | | LyondellBasell Industries N.V. 4.63%, 02/26/2055 | | | 909,595 | |
| | | Methanex Corp. | |
| | | 1,590,000 | | | 4.25%, 12/01/2024 | | | 1,543,216 | |
| | | 531,000 | | | 5.65%, 12/01/2044 | | | 476,338 | |
| | | 290,000 | | | Olin Corp. 5.13%, 09/15/2027(6) | | | 266,800 | |
| | | 2,485,000 | | | SABIC Capital II B.V. 4.00%, 10/10/2023(1) | | | 2,472,575 | |
| | | 1,830,000 | | | Sherwin-Williams Co. 3.45%, 06/01/2027 | | | 1,705,865 | |
| | | Syngenta Finance N.V. | |
| | | 1,810,000 | | | 4.89%, 04/24/2025(1) | | | 1,711,444 | |
| | | 3,190,000 | | | 5.18%, 04/24/2028(1) | | | 2,958,245 | |
| | | 265,000 | | | Versum Materials, Inc. 5.50%, 09/30/2024(1) | | | 262,350 | |
| | | | | | | | | | |
| | | | | | | | | 20,089,085 | |
| | | | | | | | | | |
| | | | | | Commercial Banks - 8.1% | | | |
| | | Banco Bilbao Vizcaya Argentaria S.A. | |
| | | 5,200,000 | | | 5 year USD Swap + 3.870%, 6.13%, 11/16/2027(2)(6)(7) | | | 4,355,000 | |
| EUR | | | 400,000 | | | 5 year EUR Swap + 9.177%, 8.88%, 04/14/2021(2)(7)(8) | | | 496,385 | |
| | | | | | | | | | |
| Shares or Principal Amount | | Market Value† | |
| CORPORATE BONDS - 28.6% - (continued) | |
| | | | | | Commercial Banks - 8.1% - (continued) | | | |
| | | Banco de Sabadell S.A. | |
| EUR | | | 1,400,000 | | | 5 year EUR Swap + 6.051%, 6.13%, 11/23/2022(2)(7)(8) | | $ | 1,445,650 | |
| | | 2,400,000 | | | 5 year EUR Swap + 6.414%, 6.50%, 05/18/2022(2)(7)(8) | | | 2,540,188 | |
| $ | | | 2,800,000 | | | Banco Santander S.A. 3.80%, 02/23/2028 | | | 2,490,523 | |
| | | Bank of America Corp. | |
| | | 3,275,000 | | | 3 mo. USD LIBOR + 1.160%, 3.12%, 01/20/2023(2) | | | 3,219,883 | |
| | | 6,005,000 | | | 3 mo. USD LIBOR + 0.810%, 3.37%, 01/23/2026(2) | | | 5,741,329 | |
| | | 4,620,000 | | | 3 mo. USD LIBOR + 1.512%, 3.71%, 04/24/2028(2) | | | 4,431,820 | |
| | | 1,205,000 | | | 3 mo. USD LIBOR + 0.940%, 3.86%, 07/23/2024(2) | | | 1,202,130 | |
| | | 1,020,000 | | | 4.00%, 01/22/2025 | | | 993,629 | |
| | | 40,000 | | | 4.18%, 11/25/2027 | | | 38,447 | |
| | | 2,285,000 | | | 4.20%, 08/26/2024 | | | 2,266,263 | |
| | | 2,925,000 | | | 7.75%, 05/14/2038 | | | 3,782,846 | |
| | | 780,000 | | | Barclays Bank plc 2.65%, 01/11/2021 | | | 763,720 | |
| | | 1,450,000 | | | Barclays plc 5 year USD Swap + 6.772%, 7.88%, 03/15/2022(2)(7)(8) | | | 1,450,000 | |
| | | BNP Paribas S.A. | |
| | | 585,000 | | | 2.95%, 05/23/2022(1) | | | 563,778 | |
| | | 2,890,000 | | | 3.38%, 01/09/2025(1) | | | 2,719,713 | |
| | | 1,645,000 | | | 4.40%, 08/14/2028(1) | | | 1,605,587 | |
| | | 1,505,000 | | | 5 year USD Swap + 2.838%, 5.13%, 11/15/2027(1)(2)(7) | | | 1,301,825 | |
| | | 1,940,000 | | | 5 year USD Swap + 6.314%, 7.63%, 03/30/2021(1)(2)(7) | | | 1,976,375 | |
| | | BPCE S.A. | |
| | | 635,000 | | | 2.75%, 01/11/2023(1) | | | 609,133 | |
| | | 1,245,000 | | | 3.00%, 05/22/2022(1) | | | 1,202,595 | |
| EUR | | | 400,000 | | | Caixa Geral de Depositos S.A. 5 year EUR Swap + 10.925%, 10.75%, 03/30/2022(2)(7)(8) | | | 499,547 | |
| | | 1,200,000 | | | CaixaBank S.A. 5 year EUR Swap + 6.498%, 6.75%, 06/13/2024(2)(7)(8) | | | 1,387,502 | |
| | | Citigroup, Inc. | |
| $ | | | 300,000 | | | 2.70%, 10/27/2022 | | | 289,185 | |
| | | 2,360,000 | | | 3.20%, 10/21/2026 | | | 2,178,725 | |
| | | 1,085,000 | | | 3 mo. USD LIBOR + 1.151%, 3.52%, 10/27/2028(2) | | | 1,011,861 | |
| | | 2,960,000 | | | 3 mo. USD LIBOR + 1.100%, 3.74%, 05/17/2024(2) | | | 2,887,805 | |
| | | 1,025,000 | | | 3 mo. USD LIBOR + 1.192%, 4.08%, 04/23/2029(2) | | | 997,274 | |
| | | 2,275,000 | | | 4.45%, 09/29/2027 | | | 2,192,683 | |
| | | 111,000 | | | 4.65%, 07/30/2045 | | | 108,118 | |
| | | 1,069,000 | | | 4.75%, 05/18/2046 | | | 988,247 | |
| | | | | | Credit Agricole S.A. | |
| | | 1,750,000 | | | 5 year USD Swap +1.644%, 4.00%, 01/10/2033(1)(2) | | | 1,602,553 | |
| | | 4,000,000 | | | 5 year USD Swap + 6.185%, 8.13%, 12/23/2025(1)(2)(7) | | | 4,110,000 | |
| | | | | | Credit Suisse Group AG | |
| | | 5,685,000 | | | 5 year USD Swap + 3.455%, 6.25%, 12/18/2024(1)(2)(7) | | | 5,369,824 | |
| | | 275,000 | | | 5 year USD Swap + 4.600%, 7.50%, 07/17/2023(1)(2)(7) | | | 268,125 | |
| EUR | | | 650,000 | | | Danske Bank A/S 5 year EUR Swap + 5.471%, 5.88%, 04/06/2022(2)(7)(8) | | | 745,345 | |
| $ | | | 1,400,000 | | | DNB Bank ASA 5 year USD Swap + 5.080%, 6.50%, 03/26/2022(2)(7)(8) | | | 1,374,450 | |
| | | | | | Goldman Sachs Group, Inc. | |
| | | 2,235,000 | | | 3 mo. USD LIBOR + 0.821%, 2.88%, 10/31/2022(2) | | | 2,170,651 | |
The accompanying notes are an integral part of these financial statements.
|
| Hartford Total Return Bond HLS Fund |
Schedule of Investments – (continued)
December 31, 2018
| | | | | | | | | | |
| Shares or Principal Amount | | Market Value† | |
| CORPORATE BONDS - 28.6% - (continued) | |
| | | | | | Commercial Banks - 8.1% - (continued) | | | |
| $ | | | 3,040,000 | | | 3 mo. USD LIBOR + 0.990%, 2.91%, 07/24/2023(2) | | $ | 2,895,832 | |
| | | 4,430,000 | | | 3 mo. USD LIBOR + 1.510%, 3.69%, 06/05/2028(2) | | | 4,117,111 | |
| | | 3,860,000 | | | 3 mo. USD LIBOR + 1.158%, 3.81%, 04/23/2029(2) | | | 3,603,793 | |
| | | 2,285,000 | | | 3 mo. USD LIBOR + 1.373%, 4.02%, 10/31/2038(2) | | | 2,010,815 | |
| | | 1,250,000 | | | 3 mo. USD LIBOR + 1.301%, 4.22%, 05/01/2029(2) | | | 1,202,985 | |
| | | 1,005,000 | | | 6.25%, 02/01/2041 | | | 1,146,260 | |
| | | 1,890,000 | | | 6.75%, 10/01/2037 | | | 2,134,346 | |
| | | | | | HSBC Holdings plc | |
| | | 1,305,000 | | | 2.95%, 05/25/2021 | | | 1,288,183 | |
| | | 2,370,000 | | | 3.40%, 03/08/2021 | | | 2,363,849 | |
| | | 1,200,000 | | | 3 mo. USD LIBOR + 1.535%, 4.58%, 06/19/2029(2) | | | 1,189,486 | |
| | | 2,925,000 | | | 5 year USD ICE Swap + 3.746%, 6.00%, 05/22/2027(2)(7) | | | 2,633,904 | |
| | | 1,075,000 | | | 5 year USD ICE Swap + 3.453%, 6.25%, 03/23/2023(2)(7) | | | 1,007,812 | |
| | | | | | Intesa Sanpaolo S.p.A. | |
| | | 1,015,000 | | | 3.38%, 01/12/2023(1) | | | 940,247 | |
| | | 895,000 | | | 3.88%, 01/12/2028(1) | | | 764,364 | |
| | | 300,000 | | | 4.38%, 01/12/2048(1) | | | 225,891 | |
| | | 1,675,000 | | | 5 year USD Swap + 5.462%, 7.70%, 09/17/2025(1)(2)(6)(7) | | | 1,499,125 | |
| EUR | | | 1,375,000 | | | 5 year EUR Swap + 7.192%, 7.75%, 01/11/2027(2)(7)(8) | | | 1,647,786 | |
| | | | | | JP Morgan Chase & Co. | |
| $ | | | 2,750,000 | | | 2.40%, 06/07/2021 | | | 2,689,789 | |
| | | 2,665,000 | | | 3 mo. USD LIBOR + 1.155%, 3.22%, 03/01/2025(2) | | | 2,574,342 | |
| | | 2,500,000 | | | 3 mo. USD LIBOR + 0.945%, 3.51%, 01/23/2029(2) | | | 2,367,260 | |
| | | 955,000 | | | 3 mo. USD LIBOR + 1.230%, 3.72%, 10/24/2023(2) | | | 954,759 | |
| | | 1,990,000 | | | 3 mo. USD LIBOR + 0.890%, 3.80%, 07/23/2024(2) | | | 1,993,593 | |
| | | 2,230,000 | | | 3 mo. USD LIBOR + 1.120%, 4.01%, 04/23/2029(2) | | | 2,186,208 | |
| | | | | | Morgan Stanley | |
| | | 2,725,000 | | | 2.50%, 04/21/2021 | | | 2,667,218 | |
| | | 3,240,000 | | | 2.75%, 05/19/2022 | | | 3,152,133 | |
| | | 5,935,000 | | | 3 mo. USD LIBOR + 1.340%, 3.59%, 07/22/2028(2) | | | 5,611,565 | |
| | | 2,120,000 | | | 3.63%, 01/20/2027 | | | 2,014,843 | |
| | | 1,090,000 | | | 3.95%, 04/23/2027 | | | 1,027,646 | |
| | | 3,275,000 | | | 4.00%, 07/23/2025 | | | 3,230,952 | |
| | | 685,000 | | | Royal Bank of Scotland Group plc 5 year USD Swap + 7.598%, 8.63%, 08/15/2021(2)(7) | | | 708,975 | |
| | | 1,825,000 | | | Santander Holdings USA, Inc. 3.70%, 03/28/2022 | | | 1,792,327 | |
| | | Societe Generale S.A. | |
| | | 3,275,000 | | | 5 year USD Swap + 6.238%, 7.38%, 09/13/2021(1)(2)(7) | | | 3,189,031 | |
| | | 625,000 | | | 5 year USD ICE Swap + 5.873%, 8.00%, 09/29/2025(1)(2)(7) | | | 627,344 | |
| | | 1,950,000 | | | Standard Chartered plc 5 year USD Swap + 6.301%, 7.50%, 04/02/2022(2)(7)(8) | | | 1,954,875 | |
| | | 2,325,000 | | | UBS AG 2.45%, 12/01/2020(1) | | | 2,281,553 | |
| | | | | | UBS Group Funding Switzerland AG | |
| | | 1,273,000 | | | 2.65%, 02/01/2022(1) | | | 1,232,106 | |
| | | 3,050,000 | | | 5 year USD ICE Swap + 5.497%, 6.88%, 03/22/2021(2)(7)(8) | | | 3,050,000 | |
| | | 1,620,000 | | | 5 year USD Swap + 5.464%, 7.13%, 02/19/2020(2)(7)(8) | | | 1,624,050 | |
| | | | | | | | | | |
| Shares or Principal Amount | | Market Value† | |
| CORPORATE BONDS - 28.6% - (continued) | |
| | | | | | Commercial Banks - 8.1% - (continued) | | | |
| | | | | | UniCredit S.p.A. | |
| EUR | | | 1,215,000 | | | 5 year EUR Swap + 4.925%, 5.38%, 06/03/2025(2)(7)(8) | | $ | 1,167,495 | |
| | | 2,225,000 | | | 5 year EUR Swap + 6.387%, 6.63%, 06/03/2023(2)(7)(8) | | | 2,394,281 | |
| $ | | | 625,000 | | | 5 year USD Swap + 5.180%, 8.00%, 06/03/2024(2)(7)(8) | | | 554,687 | |
| | | | | | Wells Fargo & Co. | |
| | | 1,795,000 | | | 2.63%, 07/22/2022 | | | 1,730,848 | |
| | | 1,655,000 | | | 3.00%, 04/22/2026 | | | 1,542,193 | |
| | | 665,000 | | | 3.00%, 10/23/2026 | | | 615,607 | |
| | | 4,800,000 | | | 3.07%, 01/24/2023 | | | 4,674,835 | |
| | | 3,375,000 | | | 3 mo. USD LIBOR + 1.310%, 3.58%, 05/22/2028(2) | | | 3,240,257 | |
| | | 1,370,000 | | | 4.40%, 06/14/2046 | | | 1,256,717 | |
| | | 295,000 | | | 4.90%, 11/17/2045 | | | 287,647 | |
| | | 890,000 | | | 5.61%, 01/15/2044 | | | 965,216 | |
| | | | | | | | | | |
| | | | | | | | | 169,410,855 | |
| | | | | | | | | | |
| | | | | | Commercial Services - 0.3% | |
| | | 6,128,000 | | | Acwa Power Management And Investments One Ltd. 5.95%, 12/15/2039(1) | | | 5,756,153 | |
| | | | | | Ashtead Capital, Inc. | |
| | | 200,000 | | | 4.13%, 08/15/2025(1) | | | 183,000 | |
| | | 200,000 | | | 4.38%, 08/15/2027(1) | | | 180,000 | |
| | | 400,000 | | | United Rentals North America, Inc. 5.50%, 07/15/2025 | | | 377,000 | |
| | | | | | | | | | |
| | | | | | | | | 6,496,153 | |
| | | | | | | | | | |
| | | | | | Construction Materials - 0.0% | |
| | | | | | Standard Industries, Inc. | |
| | | 60,000 | | | 5.38%, 11/15/2024(1) | | | 56,325 | |
| | | 930,000 | | | 6.00%, 10/15/2025(1) | | | 891,963 | |
| | | | | | | | | | |
| | | | | | | | | 948,288 | |
| | | | | | | | | | |
| | | | | | Diversified Financial Services - 0.4% | |
| | | 2,425,000 | | | American Express Co. 3.40%, 02/27/2023 | | | 2,402,433 | |
| | | 5,580,000 | | | IHS Markit Ltd. 4.13%, 08/01/2023 | | | 5,523,084 | |
| | | | | | Navient Corp. | |
| | | 660,000 | | | 5.88%, 03/25/2021 | | | 631,950 | |
| | | 390,000 | | | 7.25%, 01/25/2022 | | | 376,350 | |
| | | | | | | | | | |
| | | | | | | | | 8,933,817 | |
| | | | | | | | | | |
| | | | | | Electric - 1.4% | |
| | | | | | AES Corp. | |
| | | 330,000 | | | 4.00%, 03/15/2021 | | | 324,225 | |
| | | 220,000 | | | 4.50%, 03/15/2023 | | | 214,500 | |
| | | 330,000 | | | 4.88%, 05/15/2023 | | | 322,575 | |
| | | 50,000 | | | 5.13%, 09/01/2027 | | | 48,000 | |
| | | 1,180,000 | | | Berkshire Hathaway Energy Co. 3.25%, 04/15/2028 | | | 1,122,503 | |
| | | 1,605,000 | | | DTE Energy Co. 1.50%, 10/01/2019 | | | 1,581,207 | |
| | | 1,525,000 | | | Duke Energy Carolinas LLC 4.25%, 12/15/2041 | | | 1,528,919 | |
| | | 970,000 | | | Duke Energy Florida LLC 3.40%, 10/01/2046 | | | 835,770 | |
| | | 1,495,000 | | | Duke Energy Progress LLC 4.38%, 03/30/2044 | | | 1,522,441 | |
| | | 2,275,000 | | | Exelon Corp. 2.85%, 06/15/2020 | | | 2,256,973 | |
| | | 645,000 | | | Fortis, Inc. 2.10%, 10/04/2021 | | | 620,081 | |
| | | 1,590,000 | | | IPALCO Enterprises, Inc. 3.70%, 09/01/2024 | | | 1,547,863 | |
| | | 565,000 | | | Oncor Electric Delivery Co. LLC 5.75%, 03/15/2029(1) | | | 659,429 | |
| | | | | | Pacific Gas & Electric Co. | |
| | | 785,000 | | | 2.95%, 03/01/2026 | | | 645,416 | |
| | | 4,390,000 | | | 3.30%, 12/01/2027 | | | 3,582,454 | |
| | | 1,833,000 | | | 3.40%, 08/15/2024 | | | 1,589,628 | |
| | | 550,000 | | | 3.50%, 06/15/2025 | | | 471,375 | |
| | | 544,000 | | | 3.75%, 02/15/2024 | | | 482,571 | |
| | | 135,000 | | | 5.13%, 11/15/2043 | | | 116,367 | |
The accompanying notes are an integral part of these financial statements.
|
| Hartford Total Return Bond HLS Fund |
Schedule of Investments – (continued)
December 31, 2018
| | | | | | | | | | |
| Shares or Principal Amount | | Market Value† | |
| CORPORATE BONDS - 28.6% - (continued) | |
| | | | | | Electric - 1.4% - (continued) | |
| $ | | | 20,000 | | | 5.40%, 01/15/2040 | | $ | 17,737 | |
| | | 2,625,000 | | | 6.05%, 03/01/2034 | | | 2,432,212 | |
| | | | | | South Carolina Electric & Gas Co. | |
| | | 525,000 | | | 3.50%, 08/15/2021 | | | 526,474 | |
| | | 580,000 | | | 4.25%, 08/15/2028 | | | 601,298 | |
| | | 2,275,000 | | | 4.50%, 06/01/2064 | | | 2,100,831 | |
| | | | | | Southern California Edison Co. | |
| | | 425,000 | | | 3.70%, 08/01/2025 | | | 423,938 | |
| | | 245,000 | | | 4.13%, 03/01/2048 | | | 231,952 | |
| | | | | | Southern Co. | |
| | | 625,000 | | | 2.95%, 07/01/2023 | | | 603,560 | |
| | | 1,495,000 | | | 3.25%, 07/01/2026 | | | 1,400,447 | |
| | | 2,125,000 | | | Vistra Operations Co. LLC 5.50%, 09/01/2026(1) | | | 2,045,312 | |
| | | | | | | | | | |
| | | | | | | | | 29,856,058 | |
| | | | | | | | | | |
| | | | | | Electronics - 0.1% | |
| | | 1,125,000 | | | Fortive Corp. 2.35%, 06/15/2021 | | | 1,096,948 | |
| | | | | | | | | | |
| | | | | | Engineering & Construction - 0.6% | |
| | | 2,350,000 | | | Fluor Corp. 4.25%, 09/15/2028 | | | 2,289,291 | |
| | | | | | Mexico City Airport Trust | |
| | | 474,000 | | | 3.88%, 04/30/2028(1) | | | 416,409 | |
| | | 200,000 | | | 5.50%, 07/31/2047(1) | | | 175,752 | |
| | | | | | SBA Tower Trust | |
| | | 4,815,000 | | | 3.17%, 04/09/2047(1) | | | 4,734,096 | |
| | | 4,540,000 | | | 3.45%, 03/15/2048(1) | | | 4,512,081 | |
| | | | | | | | | | |
| | | | | | | | | 12,127,629 | |
| | | | | | | | | | |
| | | | | | Entertainment - 0.1% | |
| | | | | | GLP Capital L.P. / GLP Financing II, Inc. | |
| | | 1,260,000 | | | 5.30%, 01/15/2029 | | | 1,232,318 | |
| | | 275,000 | | | 5.38%, 04/15/2026 | | | 271,978 | |
| | | | | | WMG Acquisition Corp. | |
| | | 445,000 | | | 4.88%, 11/01/2024(1) | | | 421,637 | |
| | | 260,000 | | | 5.00%, 08/01/2023(1) | | | 252,850 | |
| | | | | | | | | | |
| | | | | | | | | 2,178,783 | |
| | | | | | | | | | |
| | | | | | Food - 0.4% | |
| | | | | | Conagra Brands, Inc. | |
| | | 450,000 | | | 3.80%, 10/22/2021 | | | 450,159 | |
| | | 240,000 | | | 4.60%, 11/01/2025 | | | 240,760 | |
| | | 370,000 | | | 5.30%, 11/01/2038 | | | 349,628 | |
| | | | | | Kraft Heinz Foods Co. | |
| | | 1,485,000 | | | 4.38%, 06/01/2046 | | | 1,223,382 | |
| | | 4,075,000 | | | 4.63%, 01/30/2029 | | | 4,029,029 | |
| | | 1,730,000 | | | Sysco Corp. 2.50%, 07/15/2021 | | | 1,695,020 | |
| | | 285,000 | | | TreeHouse Foods, Inc. 6.00%, 02/15/2024(1) | | | 282,150 | |
| | | | | | | | | | |
| | | | | | | | | 8,270,128 | |
| | | | | | | | | | |
| | | | | | Food Service - 0.0% | |
| | | | | | Aramark Services, Inc. | |
| | | 75,000 | | | 4.75%, 06/01/2026 | | | 70,500 | |
| | | 585,000 | | | 5.00%, 02/01/2028(1) | | | 545,512 | |
| | | | | | | | | | |
| | | | | | | | | 616,012 | |
| | | | | | | | | | |
| | | | | | Forest Products & Paper - 0.1% | |
| | | 1,365,000 | | | Suzano Austria GmbH 6.00%, 01/15/2029(1) | | | 1,392,982 | |
| | | | | | | | | | |
| | | | | | Gas - 0.1% | |
| | | | | | AmeriGas Partners L.P. / AmeriGas Finance Corp. | |
| | | 70,000 | | | 5.63%, 05/20/2024 | | | 66,150 | |
| | | 375,000 | | | 5.88%, 08/20/2026 | | | 342,188 | |
| | | 1,640,000 | | | Sempra Energy 2.40%, 02/01/2020 | | | 1,617,947 | |
| | | | | | | | | | |
| | | | | | | | | 2,026,285 | |
| | | | | | | | | | |
| | | | | | Healthcare - Products - 0.5% | |
| | | | | | Becton Dickinson and Co. | |
| | | 4,140,000 | | | 3.36%, 06/06/2024 | | | 3,976,375 | |
| | | 2,610,000 | | | 3.70%, 06/06/2027 | | | 2,468,637 | |
| | | | | | | | | | |
| Shares or Principal Amount | | Market Value† | |
| CORPORATE BONDS - 28.6% - (continued) | |
| | | | | | Healthcare - Products - 0.5% - (continued) | |
| $ | | | 2,385,000 | | | Boston Scientific Corp. 4.00%, 03/01/2028 | | $ | 2,314,957 | |
| | | 855,000 | | | Thermo Fisher Scientific, Inc. 3.00%, 04/15/2023 | | | 831,819 | |
| | | | | | | | | | |
| | | | | | | | | 9,591,788 | |
| | | | | | | | | | |
| | | | | | Healthcare - Services - 1.1% | |
| | | 855,000 | | | Aetna, Inc. 2.80%, 06/15/2023 | | | 813,112 | |
| | | | | | Anthem, Inc. | |
| | | 2,875,000 | | | 3.50%, 08/15/2024 | | | 2,820,009 | |
| | | 2,305,000 | | | 3.65%, 12/01/2027 | | | 2,202,258 | |
| | | 410,000 | | | 4.63%, 05/15/2042 | | | 395,200 | |
| | | 8,155,000 | | | Cigna Corp. 4.38%, 10/15/2028(1) | | | 8,200,512 | |
| | | | | | Community Health Systems, Inc. | |
| | | 535,000 | | | 5.13%, 08/01/2021(6) | | | 496,213 | |
| | | 90,000 | | | 6.25%, 03/31/2023 | | | 81,792 | |
| | | 1,530,000 | | | Halfmoon Parent, Inc. 4.13%, 11/15/2025(1) | | | 1,527,845 | |
| | | 75,000 | | | HCA, Inc. 4.75%, 05/01/2023 | | | 73,875 | |
| | | 140,000 | | | Tenet Healthcare Corp. 6.00%, 10/01/2020 | | | 141,750 | |
| | | | | | UnitedHealth Group, Inc. | |
| | | 1,230,000 | | | 3.50%, 06/15/2023 | | | 1,240,605 | |
| | | 860,000 | | | 3.70%, 12/15/2025 | | | 868,581 | |
| | | 1,260,000 | | | 3.75%, 07/15/2025 | | | 1,275,456 | |
| | | 370,000 | | | 4.25%, 04/15/2047 | | | 366,779 | |
| | | 705,000 | | | 4.25%, 06/15/2048 | | | 704,607 | |
| | | 670,000 | | | 4.75%, 07/15/2045 | | | 708,860 | |
| | | | | | | | | | |
| | | | | | | | | 21,917,454 | |
| | | | | | | | | | |
| | | | | | Home Builders - 0.1% | |
| | | 595,000 | | | Lennar Corp. 4.75%, 11/29/2027 | | | 536,987 | |
| | | 285,000 | | | PulteGroup, Inc. 5.50%, 03/01/2026 | | | 274,313 | |
| | | 575,000 | | | Toll Brothers Finance Corp. 4.88%, 11/15/2025 | | | 537,625 | |
| | | | | | | | | | |
| | | | | | | | | 1,348,925 | |
| | | | | | | | | | |
| | | | | | Insurance - 0.1% | |
| | | 835,000 | | | CNO Financial Group, Inc. 5.25%, 05/30/2025 | | | 795,337 | |
| | | | | | Genworth Holdings, Inc. | |
| | | 20,000 | | | 4.80%, 02/15/2024 | | | 16,500 | |
| | | 380,000 | | | 4.90%, 08/15/2023 | | | 314,450 | |
| | | 15,000 | | | 7.63%, 09/24/2021 | | | 14,813 | |
| | | 258,000 | | | Massachusetts Mutual Life Insurance Co. 8.88%, 06/01/2039(1) | | | 386,725 | |
| | | 345,000 | | | MGIC Investment Corp. 5.75%, 08/15/2023 | | | 343,275 | |
| | | 1,035,000 | | | Willis North America, Inc. 3.60%, 05/15/2024 | | | 1,010,533 | |
| | | | | | | | | | |
| | | | | | | | | 2,881,633 | |
| | | | | | | | | | |
| | | | | | Internet - 0.5% | |
| | | | | | Alibaba Group Holding Ltd. | |
| | | 2,975,000 | | | 3.40%, 12/06/2027 | | | 2,750,860 | |
| | | 630,000 | | | 4.00%, 12/06/2037 | | | 565,164 | |
| | | 1,050,000 | | | 4.20%, 12/06/2047 | | | 930,987 | |
| | | | | | Amazon.com, Inc. | |
| | | 550,000 | | | 2.80%, 08/22/2024 | | | 534,576 | |
| | | 2,640,000 | | | 3.88%, 08/22/2037 | | | 2,549,594 | |
| | | 150,000 | | | Symantec Corp. 5.00%, 04/15/2025(1) | | | 139,902 | |
| | | | | | Tencent Holdings Ltd. | |
| | | 2,090,000 | | | 2.99%, 01/19/2023(1) | | | 2,031,148 | |
| | | 1,210,000 | | | 3.60%, 01/19/2028(1) | | | 1,136,870 | |
| | | | | | | | | | |
| | | | | | | | | 10,639,101 | |
| | | | | | | | | | |
| | | | | | Iron/Steel - 0.3% | |
| | | 275,000 | | | ArcelorMittal 6.13%, 06/01/2025 | | | 286,690 | |
| | | 285,000 | | | Commercial Metals Co. 5.38%, 07/15/2027 | | | 255,075 | |
| | | | | | Steel Dynamics, Inc. | |
| | | 785,000 | | | 4.13%, 09/15/2025 | | | 721,219 | |
| | | 275,000 | | | 5.50%, 10/01/2024 | | | 272,250 | |
| | | | | | Vale Overseas Ltd. | |
| | | 3,910,000 | | | 6.25%, 08/10/2026 | | | 4,222,800 | |
| | | 405,000 | | | 6.88%, 11/10/2039 | | | 467,775 | |
| | | | | | | | | | |
| | | | | | | | | 6,225,809 | |
| | | | | | | | | | |
The accompanying notes are an integral part of these financial statements.
|
| Hartford Total Return Bond HLS Fund |
Schedule of Investments – (continued)
December 31, 2018
| | | | | | | | | | |
| Shares or Principal Amount | | Market Value† | |
| CORPORATE BONDS - 28.6% - (continued) | |
| | | | | | IT Services - 0.1% | |
| $ | | | 1,050,000 | | | Apple, Inc. 3.45%, 02/09/2045 | | $ | 929,747 | |
| | | 1,035,000 | | | Hewlett Packard Enterprise Co. 6.35%, 10/15/2045 | | | 966,105 | |
| | | | | | | | | | |
| | | | | | | | | 1,895,852 | |
| | | | | | | | | | |
| | | | | | Leisure Time - 0.0% | |
| | | 150,000 | | | VOC Escrow Ltd. 5.00%, 02/15/2028(1) | | | 138,375 | |
| | | | | | | | | | |
| | | | | | Lodging - 0.0% | |
| | | 290,000 | | | Hilton Domestic Operating Co., Inc. 5.13%, 05/01/2026(1) | | | 278,400 | |
| | | | | | Wynn Las Vegas LLC / Wynn Las Vegas Capital Corp. | |
| | | 15,000 | | | 5.25%, 05/15/2027(1) | | | 13,200 | |
| | | 20,000 | | | 5.50%, 03/01/2025(1) | | | 18,650 | |
| | | | | | | | | | |
| | | | | | | | | 310,250 | |
| | | | | | | | | | |
| | | | | | Machinery - Construction & Mining - 0.0% | |
| | | 365,000 | | | Oshkosh Corp. 5.38%, 03/01/2025 | | | 364,088 | |
| | | | | | | | | | |
| | | | | | Media - 1.9% | |
| | | | | | CCO Holdings LLC / CCO Holdings Capital Corp. | |
| | | 40,000 | | | 5.13%, 02/15/2023 | | | 39,000 | |
| | | 150,000 | | | 5.13%, 05/01/2027(1) | | | 139,710 | |
| | | 145,000 | | | 5.75%, 02/15/2026(1) | | | 142,100 | |
| | | | | | Charter Communications Operating LLC / Charter Communications Operating Capital | |
| | | 4,450,000 | | | 4.20%, 03/15/2028 | | | 4,191,905 | |
| | | 3,420,000 | | | 6.48%, 10/23/2045 | | | 3,515,550 | |
| | | | | | Comcast Corp. | |
| | | 150,000 | | | 2.35%, 01/15/2027 | | | 134,084 | |
| | | 490,000 | | | 3.20%, 07/15/2036 | | | 421,501 | |
| | | 940,000 | | | 3.95%, 10/15/2025 | | | 951,127 | |
| | | 1,815,000 | | | 4.05%, 11/01/2052 | | | 1,628,940 | |
| | | 845,000 | | | 4.15%, 10/15/2028 | | | 858,040 | |
| | | 935,000 | | | 4.25%, 10/15/2030 | | | 945,573 | |
| | | 645,000 | | | 4.60%, 10/15/2038 | | | 651,307 | |
| | | 440,000 | | | 4.95%, 10/15/2058 | | | 447,326 | |
| | | | | | Cox Communications, Inc. | |
| | | 510,000 | | | 2.95%, 06/30/2023(1) | | | 490,739 | |
| | | 2,601,000 | | | 3.15%, 08/15/2024(1) | | | 2,502,171 | |
| | | 600,000 | | | 4.80%, 02/01/2035(1) | | | 547,032 | |
| | | 430,000 | | | CSC Holdings LLC 5.50%, 04/15/2027(1) | | | 399,900 | |
| | | | | | Discovery Communications LLC | |
| | | 1,590,000 | | | 3.80%, 03/13/2024 | | | 1,551,097 | |
| | | 1,057,000 | | | 3.95%, 06/15/2025(1) | | | 1,015,324 | |
| | | 890,000 | | | 4.90%, 03/11/2026 | | | 896,559 | |
| | | 555,000 | | | DISH DBS Corp. 5.88%, 11/15/2024 | | | 446,775 | |
| | | 545,000 | | | Liberty Interactive LLC 8.25%, 02/01/2030 | | | 531,375 | |
| | | 1,500,000 | | | NBCUniversal Media LLC 5.95%, 04/01/2041 | | | 1,721,645 | |
| | | 505,000 | | | TEGNA, Inc. 5.50%, 09/15/2024(1)(6) | | | 489,219 | |
| | | 5,060,000 | | | Time Warner Entertainment Co. L.P. 8.38%, 07/15/2033 | | | 6,168,748 | |
| | | | | | Viacom, Inc. | |
| | | 5,595,000 | | | 4.25%, 09/01/2023 | | | 5,573,165 | |
| | | 845,000 | | | 4.38%, 03/15/2043 | | | 667,181 | |
| | | 55,000 | | | 3 mo. USD LIBOR + 3.895%, 5.88%, 02/28/2057(2) | | | 49,912 | |
| | | 79,000 | | | 3 mo. USD LIBOR + 3.899%, 6.25%, 02/28/2057(2) | | | 73,640 | |
| | | 550,000 | | | Videotron Ltd. 5.38%, 06/15/2024(1) | | | 544,500 | |
| | | | | | Warner Media LLC | |
| | | 165,000 | | | 2.95%, 07/15/2026 | | | 147,516 | |
| | | 2,725,000 | | | 3.80%, 02/15/2027 | | | 2,556,876 | |
| | | 165,000 | | | 3.88%, 01/15/2026 | | | 157,591 | |
| | | | | | | | | | |
| | | | | | | | | 40,597,128 | |
| | | | | | | | | | |
| | | | | | | | | | |
| Shares or Principal Amount | | Market Value† | |
| CORPORATE BONDS - 28.6% - (continued) | |
| | | | | | Mining - 0.2% | |
| | | | | | Anglo American Capital plc | |
| $ | | | 850,000 | | | 4.75%, 04/10/2027(1) | | $ | 814,069 | |
| | | 1,945,000 | | | 4.88%, 05/14/2025(1) | | | 1,910,406 | |
| | | 285,000 | | | FMG Resources August 2006 Pty Ltd. 5.13%, 05/15/2024(1) | | | 262,200 | |
| | | 560,000 | | | Kaiser Aluminum Corp. 5.88%, 05/15/2024 | | | 547,400 | |
| | | | | | | | | | |
| | | | | | | | | 3,534,075 | |
| | | | | | | | | | |
| | | | | | Miscellaneous Manufacturing - 0.1% | |
| | | 1,000,000 | | | Ingersoll-Rand Global Holding Co., Ltd. 2.90%, 02/21/2021 | | | 990,560 | |
| | | | | | | | | | |
| | | | | | Office/Business Equipment - 0.0% | |
| | | 870,000 | | | Pitney Bowes, Inc. 4.70%, 04/01/2023 | | | 767,775 | |
| | | | | | | | | | |
| | | | | | Oil & Gas - 1.2% | |
| | | 150,000 | | | Aker BP ASA 5.88%, 03/31/2025(1) | | | 149,625 | |
| | | 485,000 | | | Anadarko Petroleum Corp. 4.50%, 07/15/2044 | | | 410,989 | |
| | | 280,000 | | | Antero Resources Corp. 5.63%, 06/01/2023 | | | 266,000 | |
| | | 3,035,000 | | | Canadian Natural Resources Ltd. 3.85%, 06/01/2027 | | | 2,862,977 | |
| | | 88,000 | | | Continental Resources, Inc. 5.00%, 09/15/2022 | | | 87,376 | |
| | | 1,335,000 | | | EnCana Corp. 3.90%, 11/15/2021 | | | 1,336,129 | |
| | | | | | Hess Corp. | |
| | | 3,415,000 | | | 4.30%, 04/01/2027 | | | 3,129,280 | |
| | | 105,000 | | | 6.00%, 01/15/2040 | | | 96,244 | |
| | | 2,210,000 | | | Kerr-McGee Corp. 6.95%, 07/01/2024 | | | 2,463,842 | |
| | | 585,000 | | | Marathon Oil Corp. 3.85%, 06/01/2025 | | | 548,796 | |
| | | 945,000 | | | Marathon Petroleum Corp. 3.80%, 04/01/2028(1) | | | 886,822 | |
| | | 295,000 | | | MEG Energy Corp. 6.50%, 01/15/2025(1) | | | 299,425 | |
| | | 150,000 | | | Nabors Industries, Inc. 4.63%, 09/15/2021 | | | 134,503 | |
| | | Petroleos Mexicanos | |
| | | 240,000 | | | 6.50%, 01/23/2029 | | | 223,800 | |
| | | 1,650,000 | | | 6.63%, 06/15/2035 | | | 1,440,450 | |
| | | 1,015,000 | | | Phillips 66 3.90%, 03/15/2028 | | | 980,477 | |
| | | 2,090,000 | | | Pioneer Natural Resources Co. 7.50%, 01/15/2020 | | | 2,171,800 | |
| | | | | | QEP Resources, Inc. | | | | |
| | | 385,000 | | | 5.25%, 05/01/2023 | | | 340,725 | |
| | | 10,000 | | | 5.38%, 10/01/2022 | | | 9,100 | |
| | | SM Energy Co. | |
| | | 255,000 | | | 6.13%, 11/15/2022 | | | 240,975 | |
| | | 70,000 | | | 6.75%, 09/15/2026(6) | | | 62,650 | |
| | | 295,000 | | | Sunoco L.P. / Sunoco Finance Corp. 5.50%, 02/15/2026 | | | 279,513 | |
| | | 2,320,000 | | | Tullow Oil plc 7.00%, 03/01/2025(1) | | | 2,151,800 | |
| | | 1,650,000 | | | Valero Energy Corp. 3.40%, 09/15/2026 | | | 1,513,606 | |
| | | WPX Energy, Inc. | |
| | | 190,000 | | | 5.25%, 09/15/2024 | | | 171,950 | |
| | | 72,000 | | | 6.00%, 01/15/2022 | | | 70,020 | |
| ARS | | | 93,580,252 | | | YPF S.A. 16.50%, 05/09/2022(1) | | | 1,608,944 | |
| | | | | | | | | | |
| | | 23,937,818 | |
| | | | | | | | | | |
| | | | | | Packaging & Containers - 0.2% | |
| $ | | | 695,000 | | | Owens-Brockway Glass Container, Inc. 5.88%, 08/15/2023(1) | | | 696,737 | |
| | | 295,000 | | | Reynolds Group Issuer, Inc. / Reynolds Group Issuer LLC / Reynolds Group Issuer Lu 5.13%, 07/15/2023(1) | | | 280,988 | |
| | | 2,415,000 | | | Westrock Co. 4.65%, 03/15/2026(1) | | | 2,451,904 | |
| | | | | | | | | | |
| | | 3,429,629 | |
| | | | | | | | | | |
| | | | | | Pharmaceuticals - 1.4% | |
| | | 1,135,000 | | | Allergan Funding SCS 3.45%, 03/15/2022 | | | 1,116,888 | |
| | | | | | Bausch Health Cos., Inc. | |
| | | 315,000 | | | 6.50%, 03/15/2022(1) | | | 316,575 | |
| | | 140,000 | | | 7.00%, 03/15/2024(1) | | | 141,400 | |
| | | 95,000 | | | Baxalta, Inc. 3.60%, 06/23/2022 | | | 94,280 | |
The accompanying notes are an integral part of these financial statements.
|
| Hartford Total Return Bond HLS Fund |
Schedule of Investments – (continued)
December 31, 2018
| | | | | | | | | | |
| Shares or Principal Amount | | Market Value† | |
| CORPORATE BONDS - 28.6% - (continued) | |
| | | | | | Pharmaceuticals - 1.4% - (continued) | |
| $ | | | 3,915,000 | | | Bayer U.S. Finance LLC 4.25%, 12/15/2025(1) | | $ | 3,810,316 | |
| | | 2,120,000 | | | Cardinal Health, Inc. 2.62%, 06/15/2022 | | | 2,042,271 | |
| | | | | | CVS Health Corp. | |
| | | 1,530,000 | | | 3.13%, 03/09/2020 | | | 1,526,969 | |
| | | 883,000 | | | 3.88%, 07/20/2025 | | | 860,484 | |
| | | 3,855,000 | | | 4.10%, 03/25/2025 | | | 3,816,536 | |
| | | 1,640,000 | | | 5.05%, 03/25/2048 | | | 1,595,080 | |
| | | 1,690,000 | | | 5.13%, 07/20/2045 | | | 1,645,061 | |
| | | | | | Elanco Animal Health, Inc. | |
| | | 1,406,000 | | | 3.91%, 08/27/2021(1) | | | 1,414,748 | |
| | | 1,395,000 | | | 4.27%, 08/28/2023(1) | | | 1,393,820 | |
| | | 2,875,000 | | | GlaxoSmithKline Capital, Inc. 3.63%, 05/15/2025 | | | 2,893,337 | |
| | | 280,000 | | | IQVIA, Inc. 4.88%, 05/15/2023(1) | | | 274,400 | |
| | | | | | Mylan N.V. | |
| | | 865,000 | | | 3.15%, 06/15/2021 | | | 845,939 | |
| | | 1,705,000 | | | 3.75%, 12/15/2020 | | | 1,704,206 | |
| | | 988,000 | | | 3.95%, 06/15/2026 | | | 900,476 | |
| | | | | | Mylan, Inc. | |
| | | 1,080,000 | | | 4.55%, 04/15/2028(1) | | | 1,006,588 | |
| | | 590,000 | | | 5.20%, 04/15/2048(1) | | | 486,482 | |
| | | 1,525,000 | | | Shire Acquisitions Investments Ireland DAC 2.40%, 09/23/2021 | | | 1,474,650 | |
| | | | | | Teva Pharmaceutical Finance Netherlands B.V. | |
| | | 805,000 | | | 2.80%, 07/21/2023 | | | 693,303 | |
| | | 100,000 | | | 3.15%, 10/01/2026 | | | 76,322 | |
| | | | | | | | | | |
| | | | | | | | | 30,130,131 | |
| | | | | | | | | | |
| | | | | | Pipelines - 0.9% | |
| | | | | | Andeavor Logistics L.P. / Tesoro Logistics Finance Corp. | |
| | | 1,970,000 | | | 4.25%, 12/01/2027 | | | 1,859,690 | |
| | | 211,000 | | | 6.25%, 10/15/2022 | | | 215,220 | |
| | | 280,000 | | | Cheniere Corpus Christi Holdings LLC 5.88%, 03/31/2025 | | | 278,600 | |
| | | | | | DCP Midstream Operating L.P. | |
| | | 241,000 | | | 4.95%, 04/01/2022 | | | 238,590 | |
| | | 215,000 | | | 5.60%, 04/01/2044 | | | 185,975 | |
| | | 555,000 | | | Energy Transfer Equity L.P. 5.50%, 06/01/2027 | | | 541,125 | |
| | | 360,000 | | | Energy Transfer Partners L.P. 4.20%, 09/15/2023 | | | 354,794 | |
| | | | | | EQT Midstream Partners L.P. | |
| | | 1,000,000 | | | 4.75%, 07/15/2023 | | | 997,850 | |
| | | 1,250,000 | | | 5.50%, 07/15/2028 | | | 1,224,249 | |
| | | | | | MPLX L.P. | |
| | | 875,000 | | | 4.00%, 03/15/2028 | | | 820,094 | |
| | | 1,355,000 | | | 4.13%, 03/01/2027 | | | 1,290,114 | |
| | | 510,000 | | | 4.70%, 04/15/2048 | | | 442,938 | |
| | | 325,000 | | | 5.20%, 03/01/2047 | | | 299,162 | |
| | | 245,000 | | | Sabine Pass Liquefaction LLC 4.20%, 03/15/2028 | | | 234,347 | |
| | | | | | Sunoco Logistics Partners Operations L.P. | |
| | | 175,000 | | | 5.30%, 04/01/2044 | | | 154,528 | |
| | | 180,000 | | | 5.35%, 05/15/2045 | | | 159,324 | |
| | | | | | Texas Eastern Transmission L.P. | |
| | | 2,080,000 | | | 2.80%, 10/15/2022(1) | | | 2,000,224 | |
| | | 165,000 | | | 3.50%, 01/15/2028(1) | | | 155,781 | |
| | | | | | TransCanada PipeLines Ltd. | |
| | | 645,000 | | | 4.75%, 05/15/2038 | | | 621,682 | |
| | | 155,000 | | | 6.10%, 06/01/2040 | | | 172,998 | |
| | | 475,000 | | | Transcontinental Gas Pipe Line Co. LLC 4.00%, 03/15/2028 | | | 464,474 | |
| | | 2,045,000 | | | Valero Energy Partners L.P. 4.50%, 03/15/2028 | | | 2,002,384 | |
| | | | | | Western Gas Partners L.P. | |
| | | 2,155,000 | | | 4.50%, 03/01/2028 | | | 2,014,331 | |
| | | 1,300,000 | | | 4.75%, 08/15/2028 | | | 1,237,489 | |
| | | 110,000 | | | 5.50%, 08/15/2048 | | | 97,927 | |
| | | 570,000 | | | Williams Cos., Inc. 4.30%, 03/04/2024 | | | 568,013 | |
| | | | | | | | | | |
| | | | | | | | | 18,631,903 | |
| | | | | | | | | | |
| | | | | | | | | | |
| Shares or Principal Amount | | Market Value† | |
| CORPORATE BONDS - 28.6% - (continued) | |
| | | | | | Real Estate Investment Trusts - 0.1% | |
| | | | | | Crown Castle International Corp. | |
| $ | | | 500,000 | | | 3.15%, 07/15/2023 | | $ | 480,642 | |
| | | 600,000 | | | 3.20%, 09/01/2024 | | | 569,223 | |
| | | 265,000 | | | 3.80%, 02/15/2028 | | | 250,767 | |
| | | 570,000 | | | Equinix, Inc. 5.88%, 01/15/2026 | | | 574,275 | |
| | | | | | | | | | |
| | | | | | | | | 1,874,907 | |
| | | | | | | | | | |
| | | | | | Retail - 0.5% | |
| | | 150,000 | | | 1011778 BC ULC / New Red Finance, Inc. 4.25%, 05/15/2024(1) | | | 138,000 | |
| | | 1,060,000 | | | Home Depot, Inc. 3.50%, 09/15/2056 | | | 891,281 | |
| | | 270,000 | | | Lowe’s Cos., Inc. 3.70%, 04/15/2046 | | | 220,195 | |
| | | 1,780,000 | | | McDonald’s Corp. 3.35%, 04/01/2023 | | | 1,770,999 | |
| | | | | | Starbucks Corp. | |
| | | 1,195,000 | | | 3.80%, 08/15/2025 | | | 1,181,758 | |
| | | 720,000 | | | 4.00%, 11/15/2028 | | | 714,170 | |
| | | 315,000 | | | Suburban Propane Partners L.P. / Suburban Energy Finance Corp. 5.88%, 03/01/2027 | | | 278,775 | |
| | | 445,000 | | | United Rentals North America, Inc. 4.88%, 01/15/2028 | | | 390,488 | |
| | | 4,210,000 | | | Walmart, Inc. 3.40%, 06/26/2023 | | | 4,253,382 | |
| | | | | | | | | | |
| | | | | | | | | 9,839,048 | |
| | | | | | | | | | |
| | | | | | Semiconductors - 0.8% | |
| | | | | | Broadcom Corp. / Broadcom Cayman Finance Ltd. | |
| | | 745,000 | | | 3.13%, 01/15/2025 | | | 672,556 | |
| | | 5,750,000 | | | 3.63%, 01/15/2024 | | | 5,440,080 | |
| | | 2,610,000 | | | 3.88%, 01/15/2027 | | | 2,341,443 | |
| | | 85,000 | | | Entegris, Inc. 4.63%, 02/10/2026(1) | | | 78,200 | |
| | | 870,000 | | | Intel Corp. 4.10%, 05/19/2046 | | | 845,378 | |
| | | 1,645,000 | | | Microchip Technology, Inc. 4.33%, 06/01/2023(1) | | | 1,604,558 | |
| | | 5,220,000 | | | NXP B.V. / NXP Funding LLC 4.88%, 03/01/2024(1) | | | 5,242,916 | |
| | | 355,000 | | | Sensata Technologies B.V. 5.00%, 10/01/2025(1) | | | 333,700 | |
| | | 310,000 | | | Sensata Technologies UK Financing Co. plc 6.25%, 02/15/2026(1) | | | 311,550 | |
| | | | | | | | | | |
| | | | | | | | | 16,870,381 | |
| | | | | | | | | | |
| | | | | | Software - 0.5% | |
| | | | | | CDK Global, Inc. | |
| | | 150,000 | | | 4.88%, 06/01/2027 | | | 139,125 | |
| | | 30,000 | | | 5.88%, 06/15/2026 | | | 30,122 | |
| | | 810,000 | | | Fidelity National Information Services, Inc. 4.25%, 05/15/2028 | | | 804,668 | |
| | | | | | First Data Corp. | |
| | | 100,000 | | | 5.00%, 01/15/2024(1) | | | 96,250 | |
| | | 480,000 | | | 5.38%, 08/15/2023(1) | | | 471,600 | |
| | | | | | Microsoft Corp. | |
| | | 180,000 | | | 3.30%, 02/06/2027 | | | 178,290 | |
| | | 1,525,000 | | | 3.70%, 08/08/2046 | | | 1,460,925 | |
| | | 1,470,000 | | | 3.95%, 08/08/2056 | | | 1,434,242 | |
| | | 465,000 | | | MSCI, Inc. 5.75%, 08/15/2025(1) | | | 468,487 | |
| | | 260,000 | | | Open Text Corp. 5.88%, 06/01/2026(1) | | | 254,800 | |
| | | 795,000 | | | Oracle Corp. 4.00%, 11/15/2047 | | | 740,701 | |
| | | | | | salesforce.com, Inc. | |
| | | 1,165,000 | | | 3.25%, 04/11/2023 | | | 1,170,985 | |
| | | 780,000 | | | 3.70%, 04/11/2028 | | | 784,122 | |
| | | 3,810,000 | | | Western Digital Corp. 4.75%, 02/15/2026 | | | 3,305,175 | |
| | | | | | | | | | |
| | | | | | | | | 11,339,492 | |
| | | | | | | | | | |
| | | | | | Telecommunications - 1.9% | |
| | | AT&T, Inc. | |
| | | 620,000 | | | 4.10%, 02/15/2028 | | | 596,177 | |
| | | 120,000 | | | 4.13%, 02/17/2026 | | | 117,264 | |
| | | 715,000 | | | 4.25%, 03/01/2027 | | | 699,527 | |
| | | 4,604,000 | | | 4.30%, 02/15/2030 | | | 4,350,714 | |
| | | 1,615,000 | | | 4.75%, 05/15/2046 | | | 1,433,949 | |
The accompanying notes are an integral part of these financial statements.
|
| Hartford Total Return Bond HLS Fund |
Schedule of Investments – (continued)
December 31, 2018
| | | | | | | | | | |
| Shares or Principal Amount | | Market Value† | |
| CORPORATE BONDS - 28.6% - (continued) | |
| | | | | | Telecommunications - 1.9% - (continued) | |
| $ | | | 7,400,000 | | | GTP Acquisition Partners LLC 3.48%, 06/15/2050(1) | | $ | 7,303,981 | |
| | | Nokia Oyj | |
| | | 1,190,000 | | | 4.38%, 06/12/2027 | | | 1,106,700 | |
| | | 575,000 | | | 6.63%, 05/15/2039 | | | 583,625 | |
| | | 270,000 | | | Sprint Communications, Inc. 7.00%, 03/01/2020(1) | | | 276,750 | |
| | | 425,000 | | | Sprint Corp. 7.13%, 06/15/2024 | | | 420,895 | |
| | | 2,365,000 | | | Sprint Spectrum Co. LLC / Sprint Spectrum Co. II LLC / Sprint Spectrum Co. III LLC 5.15%, 09/20/2029(1) | | | 2,323,612 | |
| | | Telecom Italia Capital S.A. | |
| | | 265,000 | | | 6.00%, 09/30/2034 | | | 229,225 | |
| | | 160,000 | | | 7.72%, 06/04/2038 | | | 158,901 | |
| | | 4,430,000 | | | Telecom Italia S.p.A. 5.30%, 05/30/2024(1) | | | 4,208,500 | |
| | | Telefonica Emisiones SAU | |
| | | 555,000 | | | 4.67%, 03/06/2038 | | | 502,048 | |
| | | 925,000 | | | 4.90%, 03/06/2048 | | | 816,422 | |
| | | 825,000 | | | 5.21%, 03/08/2047 | | | 755,203 | |
| | | Verizon Communications, Inc. | |
| | | 2,603,000 | | | 4.27%, 01/15/2036 | | | 2,430,872 | |
| | | 3,185,000 | | | 4.40%, 11/01/2034 | | | 3,069,676 | |
| | | 1,735,000 | | | 4.50%, 08/10/2033 | | | 1,712,594 | |
| | | 1,535,000 | | | 4.52%, 09/15/2048 | | | 1,438,686 | |
| | | 100,000 | | | 4.81%, 03/15/2039 | | | 97,929 | |
| | | 115,000 | | | 5.01%, 08/21/2054 | | | 111,122 | |
| | | 1,345,000 | | | 5.25%, 03/16/2037 | | | 1,401,041 | |
| | | 3,785,000 | | | Vodafone Group plc 4.38%, 05/30/2028 | | | 3,671,710 | |
| | | | | | | | | | |
| | | 39,817,123 | |
| | | | | | | | | | |
| | | | | | Transportation - 0.3% | |
| | | 620,000 | | | Canadian Pacific Railway Co. 9.45%, 08/01/2021 | | | 710,666 | |
| | | 2,725,000 | | | CSX Corp. 3.25%, 06/01/2027 | | | 2,563,848 | |
| | | FedEx Corp. | |
| | | 300,000 | | | 4.55%, 04/01/2046 | | | 272,661 | |
| | | 395,000 | | | 4.75%, 11/15/2045 | | | 372,420 | |
| | | 2,975,000 | | | Union Pacific Corp. 4.38%, 09/10/2038 | | | 2,917,543 | |
| | | | | | | | | | |
| | | 6,837,138 | |
| | | | | | | | | | |
| | |
| | | Total Corporate Bonds
(cost $625,735,068) | | $ | 597,262,112 | |
| | | | | | | | | | |
| | | |
| | | | | | | | | | |
FOREIGN GOVERNMENT OBLIGATIONS - 1.0% | |
| | | | | | Argentina - 0.1% | |
| EUR | | | 1,780,000 | | | Argentine Republic Government International Bond 5.25%, 01/15/2028 | | $ | 1,455,544 | |
| | | | | | | | | | |
| | | | | | Egypt - 0.0% | |
| $ | | | 720,000 | | | Egypt Government International Bond 8.50%, 01/31/2047(8) | | | 648,939 | |
| | | | | | | | | | |
| | | | | | Ghana - 0.1% | |
| | | 1,140,000 | | | Ghana Government International Bond 8.63%, 06/16/2049(1) | | | 992,438 | |
| | | | | | | | | | |
| | | | | | Hungary - 0.0% | |
| | | 710,000 | | | Hungary Government International Bond 6.38%, 03/29/2021 | | | 749,291 | |
| | | | | | | | | | |
| | | | | | Panama - 0.2% | |
| | | Panama Government International Bond | |
| | | 2,464,000 | | | 4.30%, 04/29/2053 | | | 2,287,849 | |
| | | 1,460,000 | | | 4.50%, 04/16/2050 | | | 1,397,950 | |
| | | | | | | | | | |
| | | 3,685,799 | |
| | | | | | | | | | |
| | | | | | Romania - 0.2% | |
| | | 3,902,000 | | | Romanian Government International Bond 6.13%, 01/22/2044(8) | | | 4,323,869 | |
| | | | | | | | | | |
| | | | | | | | | | |
| Shares or Principal Amount | | Market Value† | |
| FOREIGN GOVERNMENT OBLIGATIONS - 1.0% - (continued) | |
| | | | | | Tunisia - 0.1% | |
| EUR | | | 2,365,000 | | | Banque Centrale de Tunisie International Bond 6.75%, 10/31/2023(1) | | $ | 2,587,534 | |
| | | | | | | | | | |
| | | | | | United Arab Emirates - 0.3% | |
| $ | | | 5,970,000 | | | Abu Dhabi Government International Bond 4.13%, 10/11/2047(1) | | | 5,716,275 | |
| | | | | | | | | | |
| | |
| | | Total Foreign Government Obligations
(cost $21,530,776) | | $ | 20,159,689 | |
| | | | | | | | | | |
| | | |
| | | | | | | | | | |
MUNICIPAL BONDS - 0.9% | |
| | | | | | Education - 0.1% | |
| | | | | | Chicago, IL, Board of Education, GO | |
| | | 740,000 | | | 6.14%, 12/01/2039 | | $ | 703,148 | |
| | | 1,750,000 | | | 6.32%, 11/01/2029 | | | 1,724,117 | |
| | | | | | | | | | |
| | | 2,427,265 | |
| | | | | | | | | | |
| | | | | | General - 0.2% | |
| | | 2,810,000 | | | Chicago, IL, Transit Auth Rev 6.90%, 12/01/2040 | | | 3,589,747 | |
| | | | | | | | | | |
| | | | | | General Obligation - 0.6% | |
| | | 1,620,000 | | | California State, GO Taxable 7.55%, 04/01/2039 | | | 2,320,731 | |
| | | City of Chicago, IL, GO | |
| | | 1,015,000 | | | 7.05%, 01/01/2029 | | | 1,092,312 | |
| | | 3,945,000 | | | 7.38%, 01/01/2033 | | | 4,337,725 | |
| | | | | | Illinois State, GO | | | | |
| | | 1,690,000 | | | 4.95%, 06/01/2023 | | | 1,715,925 | |
| | | 75,000 | | | 5.36%, 02/01/2019 | | | 75,127 | |
| | | 3,160,000 | | | 5.88%, 03/01/2019 | | | 3,173,967 | |
| | | | | | | | | | |
| | | 12,715,787 | |
| | | | | | | | | | |
| | |
| | | Total Municipal Bonds
(cost $18,754,166) | | $ | 18,732,799 | |
| | | | | | | | | | |
| | | |
| | | | | | | | | | |
SENIOR FLOATING RATE INTERESTS - 2.3%(9) | |
| | | | | | Advertising - 0.0% | |
| | | 451,566 | | | Acosta Holdco, Inc. 1 mo. USD LIBOR + 3.250%, 5.77%, 09/26/2021 | | $ | 271,965 | |
| | | | | | | | | | |
| | | | | | Aerospace/Defense - 0.1% | |
| | | 356,400 | | | Circor International, Inc. 1 mo. USD LIBOR + 3.500%, 5.92%, 12/11/2024 | | | 337,393 | |
| | | 573,726 | | | TransDigm, Inc. 1 mo. USD LIBOR + 2.500%, 5.02%, 06/09/2023 | | | 540,020 | |
| | | | | | | | | | |
| | | 877,413 | |
| | | | | | | | | | |
| | | | | | Agriculture - 0.0% | |
| | | 737,525 | | | Pinnacle Operating Corp. 1 mo. USD LIBOR + 7.250%, 9.77%, 11/15/2021 | | | 593,708 | |
| | | | | | | | | | |
| | | | | | Auto Manufacturers - 0.0% | |
| | | 153,838 | | | Navistar International Corp. 1 mo. USD LIBOR + 3.500%, 5.89%, 11/06/2024 | | | 148,069 | |
| | | | | | | | | | |
| | | | | | Auto Parts & Equipment - 0.0% | |
| | | 221,642 | | | Altra Industrial Motion Corp. 1 mo. USD LIBOR + 2.000%, 4.52%, 10/01/2025 | | | 210,006 | |
| | | | | | | | | | |
| | | | | | Biotechnology - 0.0% | |
| | | 615,232 | | | Sotera Health Holdings LLC 1 mo. USD LIBOR + 3.000%, 5.52%, 05/15/2022 | | | 588,058 | |
| | | | | | | | | | |
| | | | | | Chemicals - 0.1% | |
| | | 100,000 | | | Cabot Microelectronics Corp. 1 mo. ICE LIBOR + 2.250%, 4.81%, 11/14/2025 | | | 96,000 | |
| | | 271,551 | | | Chemours Co. 1 mo. USD LIBOR + 1.750%, 4.28%, 04/03/2025 | | | 260,010 | |
| | | 124,688 | | | LTI Holdings, Inc. 1 mo. USD LIBOR + 3.500%, 6.02%, 09/06/2025 | | | 117,103 | |
| | | 100,000 | | | Starfruit Finco B.V 1 mo. USD LIBOR + 3.250%, 5.60%, 10/01/2025 | | | 95,500 | |
The accompanying notes are an integral part of these financial statements.
|
| Hartford Total Return Bond HLS Fund |
Schedule of Investments – (continued)
December 31, 2018
| | | | | | | | | | |
| Shares or Principal Amount | | Market Value† | |
| SENIOR FLOATING RATE INTERESTS - 2.3%(9) - (continued) | |
| | | | | | Chemicals - 0.1% - (continued) | |
| EUR | | | 100,000 | | | Starfruit Finco B.V EURIBOR + 3.750%, 3.75%, 10/01/2025 | | $ | 112,599 | |
| $ | | | 425,419 | | | Univar, Inc. 1 mo. USD LIBOR + 2.250%, 4.77%, 07/01/2024 | | | 406,062 | |
| | | | | | | | | | |
| | | 1,087,274 | |
| | | | | | | | | | |
| | | | | | Coal - 0.0% | |
| | | 704,813 | | | Foresight Energy LLC 3 mo. USD LIBOR + 5.750%, 8.28%, 03/28/2022 | | | 688,658 | |
| | | 174,735 | | | Peabody Energy Corp. 1 mo. USD LIBOR + 2.750%, 5.27%, 03/31/2025 | | | 169,056 | |
| | | | | | | | | | |
| | | 857,714 | |
| | | | | | | | | | |
| | | | | | Commercial Services - 0.2% | |
| | | 130,000 | | | Allied Universal Holdco LLC 2 mo. USD LIBOR + 4.250%, 6.77%, 07/28/2022 | | | 123,825 | |
| | | 279,300 | | | APX Group, Inc. 2 mo. USD LIBOR + 5.000%, 7.50%, 04/01/2024 | | | 271,153 | |
| | | 123,438 | | | Ascend Learning LLC 1 mo. USD LIBOR + 3.000%, 5.52%, 07/12/2024 | | | 116,340 | |
| | | 203,975 | | | Blackhawk Network Holdings, Inc. 1 mo. USD LIBOR + 3.000%, 5.52%, 06/15/2025 | | | 193,650 | |
| | | 160,158 | | | Capital Automotive L.P. 1 mo. USD LIBOR + 6.000%, 8.53%, 03/24/2025 | | | 157,657 | |
| | | 100,000 | | | Energizer Holdings, Inc. 1 mo. USD LIBOR + 2.250%, 0.00%, 06/20/2025(10) | | | 96,375 | |
| | | 170,000 | | | Quad/Graphics, Inc. 1 mo. USD LIBOR + 5.000%, 0.00%, 12/18/2025(10) | | | 165,325 | |
| | | 605,769 | | | Quikrete Holdings, Inc. 1 mo. USD LIBOR + 2.750%, 5.27%, 11/15/2023 | | | 575,862 | |
| EUR | | | 395,000 | | | Techem GmbH EURIBOR + 3.750%, 3.75%, 07/31/2025 | | | 449,516 | |
| $ | | | 1,014,550 | | | Tempo Acquisition LLC 1 mo. USD LIBOR + 3.000%, 5.52%, 05/01/2024 | | | 968,895 | |
| EUR | | | 135,000 | | | Verisure Holding AB EURIBOR + 3.500%, 0.00%, 10/21/2022(10) | | | 152,622 | |
| $ | | | 137,750 | | | Weight Watchers International, Inc. 3 mo. USD LIBOR + 4.750%, 7.56%, 11/29/2024 | | | 135,798 | |
| | | 519,400 | | | Xerox Business Services LLC 1 mo. USD LIBOR + 2.500%, 5.02%, 12/07/2023 | | | 492,459 | |
| | | | | | | | | | |
| | | 3,899,477 | |
| | | | | | | | | | |
| | | | | | Construction Materials - 0.0% | |
| | | 268,650 | | | NCI Building Systems, Inc. 3 mo. USD LIBOR + 3.750%, 6.18%, 04/12/2025 | | | 244,471 | |
| | | | | | | | | | |
| | | | | | Diversified Financial Services - 0.1% | |
| | | 461,775 | | | AlixPartners LLP 3 mo. USD LIBOR + 2.750%, 5.27%, 04/04/2024 | | | 442,644 | |
| | | Crown Finance U.S., Inc. | |
| EUR | | | 104,213 | | | EURIBOR + 2.625%, 2.63%, 02/28/2025 | | | 116,566 | |
| $ | | | 223,313 | | | 1 mo. USD LIBOR + 2.500%, 5.02%, 02/28/2025 | | | 210,657 | |
| | | 230,000 | | | Financial & Risk US Holdings, Inc. 1 mo. USD LIBOR + 3.750%, 6.27%, 10/01/2025 | | | 218,500 | |
| EUR | | | 185,208 | | | Nets Holding A/S EURIBOR + 3.000%, 3.00%, 02/06/2025 | | | 209,119 | |
| $ | | | 279,300 | | | RP Crown Parent LLC 1 mo. USD LIBOR + 2.750%, 5.27%, 10/12/2023 | | | 268,491 | |
| | | 68,453 | | | SS&C Technologies Holdings Europe S.a.r.l. 1 mo. USD LIBOR + 2.250%, 4.77%, 04/16/2025 | | | 64,443 | |
| | | | | | | | | | |
| | | 1,530,420 | |
| | | | | | | | | | |
| | | | | | Electric - 0.0% | |
| | | 323,713 | | | Seadrill Partners Finco LLC 3 mo. USD LIBOR + 6.000%, 8.80%, 02/21/2021 | | | 252,700 | |
| | | | | | | | | | |
| | | | | | | | | | |
| Shares or Principal Amount | | Market Value† | |
| SENIOR FLOATING RATE INTERESTS - 2.3%(9) - (continued) | |
| | | | | | Energy - Alternate Sources - 0.0% | |
| $ | | | 263,675 | | | BCP Renaissance Parent LLC 3 mo. USD LIBOR + 3.500%, 6.03%, 10/31/2024 | | $ | 256,094 | |
| | | 99,000 | | | Medallion Midland Acquisition LLC 1 mo. USD LIBOR + 3.250%, 5.77%, 10/30/2024 | | | 93,184 | |
| | | | | | | | | | |
| | | 349,278 | |
| | | | | | | | | | |
| | | | | | Engineering & Construction - 0.0% | |
| | | 738,750 | | | Brand Energy & Infrastructure Services, Inc. 3 mo. USD LIBOR + 4.250%, 6.73%, 06/21/2024 | | | 699,862 | |
| | | 99,250 | | | Verra Mobility Corp. 1 mo. USD LIBOR + 3.750%, 6.27%, 02/28/2025 | | | 96,397 | |
| | | | | | | | | | |
| | | 796,259 | |
| | | | | | | | | | |
| | | | | | Entertainment - 0.0% | |
| | | 430,658 | | | Scientific Games International, Inc. 2 mo. USD LIBOR + 2.750%, 5.25%, 08/14/2024 | | | 403,126 | |
| | | 119,700 | | | Wyndham Hotels & Resorts, Inc. 1 mo. USD LIBOR + 1.750%, 4.27%, 05/30/2025 | | | 114,912 | |
| | | | | | | | | | |
| | | 518,038 | |
| | | | | | | | | | |
| | | | | | Food - 0.1% | |
| | | 495,921 | | | Hostess Brands LLC 1 mo. USD LIBOR + 2.250%, 4.78%, 08/03/2022 | | | 471,125 | |
| | | 470,230 | | | Post Holdings, Inc. 1 mo. USD LIBOR + 2.000%, 4.51%, 05/24/2024 | | | 452,205 | |
| | | | | | | | | | |
| | | 923,330 | |
| | | | | | | | | | |
| | | | | | Food Service - 0.0% | |
| | | 100,000 | | | 8th Avenue Food & Provisions, Inc. 3 mo. USD LIBOR + 3.750%, 6.10%, 10/01/2025 | | | 97,750 | |
| | | 111,920 | | | Aramark Services, Inc. 3 mo. USD LIBOR + 1.750%, 4.27%, 03/11/2025 | | | 108,469 | |
| | | | | | | | | | |
| | | 206,219 | |
| | | | | | | | | | |
| | | | | | Gas - 0.0% | |
| | | 105,000 | | | Messer Industries LLC 1 mo. USD LIBOR + 2.500%, 0.00%, 10/01/2025(10) | | | 99,400 | |
| | | | | | | | | | |
| | | | | | Healthcare - Products - 0.1% | |
| | | 349,675 | | | Kinetic Concepts, Inc. 3 mo. USD LIBOR + 3.250%, 6.05%, 02/02/2024 | | | 335,251 | |
| | | 225,000 | | | Lifescan Global Corp. 3 mo. USD LIBOR + 6.000%, 8.40%, 09/27/2024 | | | 212,063 | |
| | | 232,063 | | | Parexel International Corp. 1 mo. USD LIBOR + 2.750%, 5.27%, 09/27/2024 | | | 209,146 | |
| | | 293,250 | | | Revlon Consumer Products Corp. 1 mo. USD LIBOR + 3.500%, 6.21%, 09/07/2023 | | | 207,055 | |
| | | | | | | | | | |
| | | 963,515 | |
| | | | | | | | | | |
| | | | | | Healthcare - Services - 0.2% | |
| | | 359,062 | | | CDRH Parent, Inc. 3 mo. USD LIBOR + 4.250%, 7.01%, 07/01/2021 | | | 323,156 | |
| | | DentalCorp Perfect Smile ULC | |
| | | 26,366 | | | 3 mo. ICE LIBOR + 3.750%, 5.17%, 06/06/2025(11) | | | 25,542 | |
| | | 105,150 | | | 1 mo. USD LIBOR + 3.750%, 6.27%, 06/06/2025 | | | 101,864 | |
| | | 275,000 | | | Envision Healthcare Corp. 1 mo. USD LIBOR + 3.750%, 6.27%, 10/10/2025 | | | 255,651 | |
| | | 310,029 | | | Global Medical Response, Inc. 1 mo. USD LIBOR + 3.250%, 5.68%, 04/28/2022 | | | 288,811 | |
| EUR | | | 218,900 | | | IQVIA, Inc. EURIBOR + 2.000%, 2.50%, 06/11/2025 | | | 249,029 | |
| $ | | | 683,098 | | | Jaguar Holding Co. 3 mo. USD LIBOR + 2.500%, 5.02%, 08/18/2022 | | | 647,236 | |
| | | 471,972 | | | MPH Acquisition Holdings LLC 3 mo. USD LIBOR + 2.750%, 5.55%, 06/07/2023 | | | 446,013 | |
| | | 232,235 | | | One Call Corp. 1 mo. USD LIBOR + 5.250%, 7.71%, 11/25/2022 | | | 204,483 | |
The accompanying notes are an integral part of these financial statements.
|
| Hartford Total Return Bond HLS Fund |
Schedule of Investments – (continued)
December 31, 2018
| | | | | | | | | | |
| Shares or Principal Amount | | Market Value† | |
| SENIOR FLOATING RATE INTERESTS - 2.3%(9) - (continued) | |
| | | | | | Healthcare - Services - 0.2% - (continued) | |
| $ | | | 309,066 | | | Syneos Health, Inc. 1 mo. USD LIBOR + 2.000%, 4.52%, 08/01/2024 | | $ | 297,670 | |
| | | 388,106 | | | U.S. Renal Care, Inc. 3 mo. USD LIBOR + 4.250%, 7.05%, 12/30/2022 | | | 368,507 | |
| | | | | | | | | | |
| | | 3,207,962 | |
| | | | | | | | | | |
| | | | | | Household Products - 0.0% | |
| | | 292,050 | | | Diamond (BC) B.V. 2 mo. USD LIBOR + 3.000%, 5.53%, 09/06/2024 | | | 268,686 | |
| | | | | | | | | | |
| | | | | | Insurance - 0.1% | |
| | | Asurion LLC | |
| | | 822,298 | | | 1 mo. USD LIBOR + 3.000%, 5.52%, 08/04/2022 | | | 788,230 | |
| | | 375,000 | | | 1 mo. USD LIBOR + 6.500%, 9.02%, 08/04/2025 | | | 370,080 | |
| | | 223,875 | | | Hub International Ltd. 2 mo. USD LIBOR + 2.750%, 5.24%, 04/25/2025 | | | 210,933 | |
| | | 285,000 | | | Sedgwick Claims Management Services, Inc. 1 mo. USD LIBOR + 3.250%, 0.00%, 11/06/2025(10) | | | 271,582 | |
| | | | | | | | | | |
| | | 1,640,825 | |
| | | | | | | | | | |
| | | | | | Internet - 0.0% | |
| | | 610,682 | | | Lands’ End, Inc. 1 mo. USD LIBOR + 3.250%, 5.77%, 04/04/2021 | | | 573,278 | |
| | | | | | | | | | |
| | | | | | Investment Company Security - 0.0% | |
| | | 155,000 | | | Aretec Group, Inc. 3 mo. USD LIBOR + 4.250%, 6.77%, 10/01/2025 | | | 150,479 | |
| | | | | | | | | | |
| | | | | | Leisure Time - 0.1% | |
| | | 440,710 | | | Caesars Resort Collection LLC 1 mo. USD LIBOR + 2.750%, 5.27%, 12/22/2024 | | | 422,451 | |
| | | 795,546 | | | Delta (LUX) S.a.r.l. 1 mo. USD LIBOR + 2.500%, 5.02%, 02/01/2024 | | | 750,462 | |
| | | 752,400 | | | Golden Entertainment, Inc. 1 mo. USD LIBOR + 3.000%, 5.53%, 10/21/2024 | | | 718,542 | |
| | | 145,000 | | | Penn National Gaming, Inc. 3 mo. USD LIBOR + 2.250%, 4.71%, 10/15/2025 | | | 139,654 | |
| | | | | | | | | | |
| | | 2,031,109 | |
| | | | | | | | | | |
| | | | | | Lodging - 0.1% | |
| | | 250,681 | | | Boyd Gaming Corp. 1 Week USD LIBOR + 2.250%, 4.67%, 09/15/2023 | | | 240,967 | |
| | | 658,350 | | | Caesars Entertainment Operating Co. 1 mo. USD LIBOR + 2.000%, 4.52%, 10/06/2024 | | | 623,787 | |
| | | | | | | | | | |
| | | 864,754 | |
| | | | | | | | | | |
| | | | | | Machinery - Construction & Mining - 0.0% | |
| | | 270,000 | | | Brookfield WEC Holdings, Inc. 1 mo. USD LIBOR + 3.750%, 6.27%, 08/01/2025 | | | 260,985 | |
| | | 89,198 | | | Pike Corp. 1 mo. USD LIBOR + 3.500%, 6.03%, 03/23/2025 | | | 87,153 | |
| | | | | | | | | | |
| | | 348,138 | |
| | | | | | | | | | |
| | | | | | Machinery - Diversified - 0.0% | |
| | | 264,788 | | | Gates Global LLC 3 mo. USD LIBOR + 2.750%, 5.27%, 04/01/2024 | | | 250,968 | |
| | | | | | | | | | |
| | | | | | Media - 0.2% | |
| | | 193,050 | | | Altice Financing S.A. 3 mo. USD LIBOR + 2.750%, 5.22%, 01/31/2026 | | | 177,847 | |
| | | 1,536,069 | | | Charter Communications Operating LLC 1 mo. USD LIBOR + 2.000%, 4.53%, 04/30/2025 | | | 1,469,066 | |
| | | 218,900 | | | CSC Holdings LLC 1 mo. USD LIBOR + 2.500%, 4.96%, 01/25/2026 | | | 209,505 | |
| | | 190,000 | | | Gray Television, Inc. 1 mo. ICE LIBOR + 2.500%, 0.00%, 11/02/2025(10) | | | 183,215 | |
| | | | | | | | | | |
| Shares or Principal Amount | | Market Value† | |
| SENIOR FLOATING RATE INTERESTS - 2.3%(9) - (continued) | |
| | | | | | Media - 0.2% - (continued) | |
| $ | | | 124,677 | | | Houghton Mifflin Harcourt Publishers, Inc. 1 mo. USD LIBOR + 3.000%, 5.52%, 05/31/2021 | | $ | 112,677 | |
| | | 268,157 | | | MTN Infrastructure TopCo, Inc. 1 mo. USD LIBOR + 3.000%, 5.52%, 11/15/2024 | | | 254,883 | |
| | | 697,628 | | | Numericable Group S.A. 3 mo. USD LIBOR + 3.688%, 6.14%, 01/31/2026 | | | 646,004 | |
| | | 492,034 | | | PSAV Holdings LLC 3 mo. USD LIBOR + 3.250%, 5.89%, 03/01/2025 | | | 464,972 | |
| | | 159,201 | | | Shutterfly, Inc. 1 mo. USD LIBOR + 2.750%, 5.28%, 08/17/2024 | | | 153,729 | |
| | | 220,000 | | | Telenet Financing USD LLC 1 mo. USD LIBOR + 2.250%, 4.71%, 08/15/2026 | | | 208,850 | |
| | | 440,000 | | | Unitymedia Finance LLC 1 mo. USD LIBOR + 2.250%, 4.71%, 09/30/2025 | | | 424,160 | |
| | | 437,278 | | | UPC Financing Partnership 1 mo. USD LIBOR + 2.500%, 4.96%, 01/15/2026 | | | 415,087 | |
| | | | | | | | | | |
| | | 4,719,995 | |
| | | | | | | | | | |
| | | | | | Metal Fabricate/Hardware - 0.0% | |
| | | 298,561 | | | Rexnord LLC 1 mo. USD LIBOR + 2.000%, 4.52%, 08/21/2024 | | | 288,858 | |
| | | | | | | | | | |
| | | | | | Miscellaneous Manufacturing - 0.0% | |
| EUR | | | 195,139 | | | CTC AcquiCo GmbH EURIBOR + 2.750%, 2.75%, 03/07/2025 | | | 218,582 | |
| $ | | | 146,177 | | | H.B. Fuller Co. 1 mo. USD LIBOR + 2.000%, 4.47%, 10/20/2024 | | | 137,187 | |
| | | 528,313 | | | USI, Inc. 3 mo. USD LIBOR + 3.000%, 5.80%, 05/16/2024 | | | 497,274 | |
| | | | | | | | | | |
| | | 853,043 | |
| | | | | | | | | | |
| | | | | | Oil & Gas - 0.1% | |
| | | 90,000 | | | Ascent Resources - Marcellus LLC 1 mo. USD LIBOR + 6.500%, 8.89%, 03/30/2023 | | | 89,888 | |
| | | 115,000 | | | BCP Raptor II LLC 2 mo. USD LIBOR + 4.750%, 7.14%, 11/03/2025 | | | 106,231 | |
| | | 156,353 | | | BCP Raptor LLC 2 mo. USD LIBOR + 4.250%, 6.87%, 06/24/2024 | | | 145,604 | |
| | | 455,000 | | | California Resources Corp. 1 mo. USD LIBOR + 10.375%, 12.90%, 12/31/2021 | | | 444,762 | |
| | | 764,040 | | | Fieldwood Energy LLC 1 mo. USD LIBOR + 5.250%, 7.77%, 04/11/2022 | | | 711,993 | |
| | | 214,463 | | | Grizzly Acquisitions, Inc. 1 mo. USD LIBOR + 3.250%, 5.65%, 10/01/2025 | | | 209,101 | |
| | | 636,969 | | | PES Holdings LLC 3 mo. USD LIBOR + 3.500%, 6.30%, 12/31/2022 | | | 538,239 | |
| | | 120,000 | | | Traverse Midstream Partners LLC 3 mo. USD LIBOR + 4.000%, 6.60%, 09/27/2024 | | | 114,900 | |
| | | | | | | | | | |
| | | 2,360,718 | |
| | | | | | | | | | |
| | | | | | Packaging & Containers - 0.1% | |
| | | 1,032,489 | | | Berry Global, Inc. 3 mo. USD LIBOR + 1.750%, 4.14%, 02/08/2020 | | | 1,013,027 | |
| | | 88,713 | | | Crown Americas LLC 1 Week USD LIBOR + 2.000%, 4.48%, 04/03/2025 | | | 88,131 | |
| | | 403,850 | | | Flex Acquisition Co., Inc. 3 mo. USD LIBOR + 3.000%, 5.35%, 12/29/2023 | | | 379,954 | |
| | | 200,900 | | | Proampac PG Borrower LLC 1 mo. USD LIBOR + 2.50%, 6.05%, 11/18/2023 | | | 191,357 | |
| | | 543,689 | | | Reynolds Group Holdings, Inc. 1 mo. USD LIBOR + 2.750%, 5.27%, 02/05/2023 | | | 516,505 | |
| | | | | | | | | | |
| | | 2,188,974 | |
| | | | | | | | | | |
| | | | | | Pharmaceuticals - 0.1% | |
| | | 807,700 | | | Endo Luxembourg Finance Co. S.a r.l. 1 mo. USD LIBOR + 4.250%, 6.81%, 04/29/2024 | | | 763,277 | |
The accompanying notes are an integral part of these financial statements.
|
| Hartford Total Return Bond HLS Fund |
Schedule of Investments – (continued)
December 31, 2018
| | | | | | | | | | |
| Shares or Principal Amount | | Market Value† | |
| SENIOR FLOATING RATE INTERESTS - 2.3%(9) - (continued) | |
| | | | | | Pharmaceuticals - 0.1% - (continued) | |
| $ | | | 498,670 | | | Valeant Pharmaceuticals International, Inc. 1 mo. USD LIBOR + 3.000%, 5.38%, 06/02/2025 | | $ | 475,262 | |
| | | | | | | | | | |
| | | | | | | | | 1,238,539 | |
| | | | | | | | | | |
| | | | | | Real Estate - 0.0% | |
| | | 286,364 | | | VICI Properties LLC 1 mo. USD LIBOR + 2.000%, 4.50%, 12/20/2024 | | | 272,807 | |
| | | | | | | | | | |
| | | | | | Retail - 0.2% | |
| | | 303,066 | | | Albertsons LLC 3 mo. USD LIBOR + 3.000%, 5.82%, 12/21/2022 | | | 290,394 | |
| | | 981,960 | | | American Builders & Contractors Supply Co., Inc. 1 mo. USD LIBOR + 2.000%, 4.52%, 10/31/2023 | | | 932,165 | |
| | | 661,625 | | | Bass Pro Group LLC 1 mo. USD LIBOR + 5.000%, 7.52%, 09/25/2024 | | | 631,521 | |
| | | 392,352 | | | Coty, Inc. 1 mo. USD LIBOR + 2.250%, 4.63%, 04/07/2025 | | | 361,454 | |
| | | 491,406 | | | Harbor Freight Tools USA, Inc. 1 mo. USD LIBOR + 2.500%, 5.02%, 08/18/2023 | | | 462,384 | |
| | | 395,795 | | | Neiman Marcus Group Ltd. LLC 1 mo. USD LIBOR + 3.250%, 5.63%, 10/25/2020 | | | 333,335 | |
| | | 134,325 | | | Rodan & Fields LLC 1 mo. USD LIBOR + 4.000%, 6.46%, 06/06/2025 | | | 123,075 | |
| | | 387,090 | | | Staples, Inc. 3 mo. USD LIBOR + 4.000%, 6.54%, 09/12/2024 | | | 370,317 | |
| | | 500,830 | | | U.S. Foods, Inc. 1 mo. USD LIBOR + 2.000%, 4.52%, 06/27/2023 | | | 479,545 | |
| | | | | | | | | | |
| | | | | | | | | 3,984,190 | |
| | | | | | | | | | |
| | | | | | Semiconductors - 0.0% | |
| | | 189,910 | | | Microchip Technology, Inc. 1 mo. USD LIBOR + 2.000%, 4.53%, 05/29/2025 | | | 179,623 | |
| | | | | | | | | | |
| | | | | | Software - 0.3% | |
| | | 516,201 | | | Almonde, Inc. 3 mo. USD LIBOR + 3.500%, 6.30%, 06/13/2024 | | | 479,700 | |
| | | 721,875 | | | Change Healthcare Holdings LLC 1 mo. USD LIBOR + 2.750%, 5.27%, 03/01/2024 | | | 683,074 | |
| | | 343,960 | | | Epicor Software Corp. 1 mo. USD LIBOR + 3.250%, 5.78%, 06/01/2022 | | | 328,052 | |
| | | 1,604,646 | | | First Data Corp. 1 mo. USD LIBOR + 2.000%, 4.50%, 04/26/2024 | | | 1,529,227 | |
| | | 812,653 | | | Hyland Software, Inc. 1 mo. USD LIBOR + 3.500%, 6.02%, 07/01/2024 | | | 785,835 | |
| | | 724,056 | | | Infor U.S., Inc. 1 mo. USD LIBOR + 2.750%, 5.27%, 02/01/2022 | | | 692,719 | |
| | | 140,000 | | | Quest Software U.S. Holdings, Inc. 3 mo. USD LIBOR + 4.250%, 6.78%, 05/16/2025 | | | 135,100 | |
| | | 149,609 | | | SkillSoft Corp. 3 mo. USD LIBOR + 4.750%, 7.27%, 04/28/2021 | | | 120,560 | |
| | | | | | SS&C Technologies, Inc. | |
| | | 329,170 | | | 1 mo. USD LIBOR + 2.250%, 0.00%, 04/16/2025(10) | | | 310,039 | |
| | | 180,465 | | | 1 mo. USD LIBOR + 2.250%, 4.77%, 04/16/2025 | | | 169,895 | |
| | | 100,000 | | | Web.com Group, Inc. 3 mo. USD LIBOR + 3.750%, 6.17%, 10/10/2025 | | | 96,000 | |
| | | 1,343,642 | | | WEX, Inc. 1 mo. USD LIBOR + 2.250%, 4.77%, 06/30/2023 | | | 1,289,413 | |
| | | | | | | | | | |
| | | | | | | | | 6,619,614 | |
| | | | | | | | | | |
| | | | | | Telecommunications - 0.1% | |
| | | 300,000 | | | Level 3 Financing, Inc. 1 mo. USD LIBOR + 2.250%, 4.75%, 02/22/2024 | | | 284,250 | |
| | | 1,002,150 | | | Sprint Communications, Inc. 1 mo. USD LIBOR + 2.500%, 5.06%, 02/02/2024 | | | 951,211 | |
| | | | | | | | | | |
| Shares or Principal Amount | | Market Value† | |
| SENIOR FLOATING RATE INTERESTS - 2.3%(9) - (continued) | |
| | | | | | Telecommunications - 0.1% - (continued) | |
| $ | | | 660,518 | | | Univision Communications, Inc. 1 mo. USD LIBOR + 2.750%, 5.27%, 03/15/2024 | | $ | 596,395 | |
| | | 159,600 | | | Zacapa LLC 1 mo. USD LIBOR + 5.000%, 7.80%, 07/02/2025 | | | 157,074 | |
| | | 361,056 | | | Zayo Group LLC 1 mo. USD LIBOR + 2.250%, 4.77%, 01/19/2024 | | | 344,938 | |
| | | | | | | | | | |
| | | | | | | | | 2,333,868 | |
| | | | | | | | | | |
| | | | | | Transportation - 0.0% | |
| | | 264,063 | | | Savage Enterprises LLC 1 mo. USD LIBOR + 4.500%, 6.88%, 08/01/2025 | | | 259,771 | |
| | | | | | | | | | |
| | | |
| | | | | | Total Senior Floating Rate Interests
(cost $51,857,774) | | $ | 49,053,513 | |
| �� | | | | | | | | | |
| | | |
| | | | | | | | | | |
| U.S. GOVERNMENT AGENCIES - 59.8% | |
| | | | | | Mortgage-Backed Agencies - 46.3% | |
| | | | | | FHLMC | |
| $ | | | 136,431 | | | 0.00%, 11/15/2036(12) | | $ | 124,811 | |
| | | 54,063,824 | | | 0.15%, 10/25/2020(3)(5) | | | 145,383 | |
| | | 21,079,152 | | | 0.61%, 03/25/2027(3)(5) | | | 886,334 | |
| | | 2,351,643 | | | 1.75%, 10/15/2042 | | | 2,228,508 | |
| | | 902,214 | | | 2.50%, 05/15/2028(5) | | | 68,950 | |
| | | 2,803,262 | | | 3.00%, 03/15/2028(5) | | | 210,923 | |
| | | 2,579,136 | | | 3.00%, 08/01/2029 | | | 2,582,164 | |
| | | 1,251,622 | | | 3.00%, 05/15/2032(5) | | | 86,129 | |
| | | 926,135 | | | 3.00%, 03/15/2033(5) | | | 111,004 | |
| | | 16,879,311 | | | 3.00%, 04/01/2033 | | | 16,822,787 | |
| | | 6,094,614 | | | 3.00%, 11/01/2036 | | | 6,010,674 | |
| | | 3,873,553 | | | 3.00%, 01/01/2037 | | | 3,820,207 | |
| | | 4,225,000 | | | 3.00%, 08/15/2043 | | | 4,094,073 | |
| | | 1,329,037 | | | 3.00%, 05/15/2046 | | | 1,314,243 | |
| | | 9,496,840 | | | 3.00%, 11/01/2046 | | | 9,271,656 | |
| | | 1,738,245 | | | 3.00%, 12/01/2046 | | | 1,698,595 | |
| | | 4,859,894 | | | 3.00%, 02/15/2048 | | | 4,873,171 | |
| | | 1,274,756 | | | 3.25%, 11/15/2041 | | | 1,271,913 | |
| | | 1,439,015 | | | 3.50%, 06/15/2026(5) | | | 87,398 | |
| | | 503,193 | | | 3.50%, 09/15/2026(5) | | | 43,760 | |
| | | 869,952 | | | 3.50%, 03/15/2027(5) | | | 72,914 | |
| | | 5,166,824 | | | 3.50%, 08/01/2034 | | | 5,258,378 | |
| | | 3,278,446 | | | 3.50%, 03/15/2041(5) | | | 390,035 | |
| | | 1,427,209 | | | 3.50%, 06/01/2046 | | | 1,431,168 | |
| | | 6,250,723 | | | 3.50%, 10/01/2047 | | | 6,249,670 | |
| | | 62,328,009 | | | 3.50%, 03/01/2048 | | | 62,321,260 | |
| | | 445,375 | | | 3.50%, 08/01/2048 | | | 445,270 | |
| | | 4,227,772 | | | 4.00%, 08/01/2025 | | | 4,336,449 | |
| | | 1,921,872 | | | 4.00%, 12/15/2026(5) | | | 156,915 | |
| | | 3,294,448 | | | 4.00%, 07/15/2027(5) | | | 292,207 | |
| | | 1,438,241 | | | 4.00%, 03/15/2028(5) | | | 127,226 | |
| | | 777,810 | | | 4.00%, 06/15/2028(5) | | | 70,745 | |
| | | 1,960,743 | | | 4.00%, 07/15/2030(5) | | | 207,040 | |
| | | 4,108,478 | | | 4.00%, 05/01/2042 | | | 4,227,296 | |
| | | 1,211,621 | | | 4.00%, 08/01/2042 | | | 1,246,684 | |
| | | 1,695,847 | | | 4.00%, 09/01/2042 | | | 1,741,867 | |
| | | 469,138 | | | 4.00%, 07/01/2044 | | | 482,135 | |
| | | 306,532 | | | 4.00%, 06/01/2045 | | | 313,349 | |
| | | 1,671,217 | | | 4.00%, 02/01/2046 | | | 1,706,134 | |
| | | 680,509 | | | 4.00%, 09/01/2048 | | | 693,922 | |
| | | 23,330,000 | | | 4.00%, 01/01/2049(13) | | | 23,783,386 | |
| | | 2,194,000 | | | 4.05%, 09/25/2028(3) | | | 2,313,926 | |
| | | 830,672 | | | 4.50%, 09/01/2044 | | | 860,950 | |
| | | 2,574,304 | | | 4.75%, 07/15/2039 | | | 2,759,984 | |
| | | 98,745 | | | 5.00%, 03/01/2028 | | | 103,394 | |
| | | 391,040 | | | 5.00%, 03/01/2031 | | | 410,512 | |
| | | 631,834 | | | 5.00%, 05/01/2031 | | | 665,202 | |
The accompanying notes are an integral part of these financial statements.
|
| Hartford Total Return Bond HLS Fund |
Schedule of Investments – (continued)
December 31, 2018
| | | | | | | | | | |
| Shares or Principal Amount | | Market Value† | |
| U.S. GOVERNMENT AGENCIES - 59.8% - (continued) | |
| | | | | | Mortgage-Backed Agencies - 46.3% - (continued) | |
| $ | | | 799,025 | | | 5.00%, 09/01/2031 | | $ | 836,910 | |
| | | 764,696 | | | 5.00%, 11/01/2031 | | | 802,174 | |
| | | 232,305 | | | 5.00%, 07/01/2032 | | | 243,434 | |
| | | 1,206,963 | | | 5.00%, 09/15/2033(5) | | | 228,239 | |
| | | 17,198 | | | 5.00%, 12/01/2034 | | | 18,008 | |
| | | 18,184 | | | 5.00%, 11/01/2035 | | | 19,302 | |
| | | 35,798 | | | 5.00%, 03/01/2039 | | | 37,877 | |
| | | 399,154 | | | 5.00%, 08/01/2039 | | | 422,761 | |
| | | 15,665 | | | 5.00%, 09/01/2039 | | | 16,589 | |
| | | 15,702 | | | 5.00%, 12/01/2039 | | | 16,706 | |
| | | 17,983 | | | 5.00%, 04/01/2041 | | | 19,048 | |
| | | 40,606 | | | 5.00%, 04/01/2044 | | | 42,970 | |
| | | 23,371 | | | 5.00%, 05/01/2044 | | | 24,535 | |
| | | 48,813 | | | 5.50%, 03/01/2028 | | | 51,544 | |
| | | 91,040 | | | 5.50%, 04/01/2033 | | | 98,114 | |
| | | 988,221 | | | 5.50%, 05/01/2034 | | | 1,065,973 | |
| | | 1,410 | | | 5.50%, 11/01/2035 | | | 1,520 | |
| | | 20,437 | | | 5.50%, 05/01/2037 | | | 22,040 | |
| | | 51,240 | | | 5.50%, 11/01/2037 | | | 55,263 | |
| | | 91,468 | | | 5.50%, 02/01/2038 | | | 97,975 | |
| | | 38,759 | | | 5.50%, 04/01/2038 | | | 41,488 | |
| | | 46,733 | | | 5.50%, 06/01/2038 | | | 49,925 | |
| | | 5,231,955 | | | 5.50%, 08/01/2038 | | | 5,642,980 | |
| | | 523,634 | | | 5.50%, 09/01/2038 | | | 559,107 | |
| | | 10,380 | | | 5.50%, 12/01/2039 | | | 11,099 | |
| | | 134,742 | | | 5.50%, 02/01/2040 | | | 144,084 | |
| | | 440,848 | | | 5.50%, 05/01/2040 | | | 472,236 | |
| | | 442,116 | | | 5.50%, 08/01/2040 | | | 472,795 | |
| | | 1,891,081 | | | 5.50%, 06/01/2041 | | | 2,027,357 | |
| | | 1,472 | | | 6.00%, 07/01/2029 | | | 1,584 | |
| | | 236,135 | | | 6.00%, 10/01/2032 | | | 257,923 | |
| | | 255,225 | | | 6.00%, 11/01/2032 | | | 275,107 | |
| | | 293,109 | | | 6.00%, 12/01/2032 | | | 320,001 | |
| | | 20,634 | | | 6.00%, 11/01/2033 | | | 22,539 | |
| | | 34,172 | | | 6.00%, 01/01/2034 | | | 37,320 | |
| | | 22,264 | | | 6.00%, 02/01/2034 | | | 24,319 | |
| | | 248,091 | | | 6.00%, 08/01/2034 | | | 270,998 | |
| | | 259,065 | | | 6.00%, 09/01/2034 | | | 282,935 | |
| | | 266,439 | | | 6.00%, 01/01/2035 | | | 286,727 | |
| | | 1,908,745 | | | 6.00%, 11/01/2037 | | | 2,084,315 | |
| | | 106 | | | 6.50%, 07/01/2031 | | | 115 | |
| | | 334 | | | 6.50%, 08/01/2032 | | | 363 | |
| | | 926,865 | | | 6.50%, 07/15/2036 | | | 1,025,161 | |
| | | 176,706 | | | 6.50%, 12/01/2037 | | | 194,586 | |
| | | 109 | | | 7.50%, 09/01/2029 | | | 115 | |
| | | 1,102 | | | 7.50%, 11/01/2031 | | | 1,200 | |
| | | | | | | | | | |
| | | | | | | | | 197,048,062 | |
| | | | | | | | | | |
| | | | | | FNMA | |
| $ | | | 147,589 | | | 0.00%, 03/25/2036(12) | | $ | 121,761 | |
| | | 1,222,116 | | | 0.00%, 06/25/2036(12) | | | 1,041,372 | |
| | | 3,690,960 | | | 1.34%, 08/25/2044(3)(5) | | | 185,923 | |
| | | 3,962,340 | | | 1.54%, 05/25/2046(3)(5) | | | 185,658 | |
| | | 3,795,545 | | | 1.56%, 04/25/2055(3)(5) | | | 186,827 | |
| | | 2,826,046 | | | 1.65%, 06/25/2055(3)(5) | | | 151,332 | |
| | | 2,575,418 | | | 1.75%, 12/25/2042 | | | 2,453,972 | |
| | | 2,005,374 | | | 2.00%, 09/25/2039 | | | 1,880,865 | |
| | | 1,263,314 | | | 2.00%, 08/25/2043 | | | 1,181,211 | |
| | | 938,920 | | | 2.50%, 06/25/2028(5) | | | 69,270 | |
| | | 241,502 | | | 2.50%, 01/01/2043 | | | 228,665 | |
| | | 4,789,076 | | | 2.50%, 02/01/2043 | | | 4,542,521 | |
| | | 1,894,234 | | | 2.50%, 03/01/2043 | | | 1,796,714 | |
| | | 3,865,871 | | | 2.50%, 05/01/2043 | | | 3,666,832 | |
| | | 2,666,068 | | | 2.50%, 06/01/2043 | | | 2,527,010 | |
| | | 1,793,645 | | | 2.50%, 04/01/2045 | | | 1,694,036 | |
| | | 6,600,000 | | | 2.98%, 12/01/2029 | | | 6,307,194 | |
| | | | | | | | | | |
| Shares or Principal Amount | | Market Value† | |
| U.S. GOVERNMENT AGENCIES - 59.8% - (continued) | |
| | | | | | FNMA - (continued) | |
| $ | | | 2,196,485 | | | 3.00%, 02/25/2027(5) | | $ | 156,331 | |
| | | 852,384 | | | 3.00%, 09/25/2027(5) | | | 72,108 | |
| | | 5,865,198 | | | 3.00%, 01/25/2028(5) | | | 473,731 | |
| | | 3,860,577 | | | 3.00%, 03/01/2037 | | | 3,819,035 | |
| | | 1,973,940 | | | 3.00%, 05/25/2047 | | | 1,956,712 | |
| | | 6,886,437 | | | 3.00%, 09/25/2047 | | | 6,866,961 | |
| | | 6,117,682 | | | 3.00%, 06/25/2048 | | | 5,998,556 | |
| | | 4,752,885 | | | 3.00%, 10/25/2048 | | | 4,664,532 | |
| | | 4,000,000 | | | 3.02%, 12/01/2029 | | | 3,836,141 | |
| | | 2,975,000 | | | 3.09%, 02/25/2030(3) | | | 2,854,289 | |
| | | 4,349,000 | | | 3.13%, 01/01/2030 | | | 4,215,046 | |
| | | 4,000,000 | | | 3.18%, 12/01/2029 | | | 3,875,300 | |
| | | 3,790,000 | | | 3.22%, 01/01/2030 | | | 3,700,829 | |
| | | 481,028 | | | 3.24%, 12/01/2026 | | | 486,945 | |
| | | 290,000 | | | 3.29%, 06/01/2029 | | | 286,598 | |
| | | 955,609 | | | 3.50%, 05/25/2027(5) | | | 92,320 | |
| | | 1,464,419 | | | 3.50%, 10/25/2027(5) | | | 136,113 | |
| | | 1,624,702 | | | 3.50%, 05/25/2030(5) | | | 188,683 | |
| | | 489,656 | | | 3.50%, 08/25/2030(5) | | | 48,189 | |
| | | 1,075,642 | | | 3.50%, 02/25/2031(5) | | | 91,443 | |
| | | 956,859 | | | 3.50%, 09/25/2035(5) | | | 142,191 | |
| | | 2,019,399 | | | 3.50%, 10/01/2044 | | | 2,028,906 | |
| | | 2,354,388 | | | 3.50%, 02/01/2045 | | | 2,363,291 | |
| | | 4,444,365 | | | 3.50%, 09/01/2046 | | | 4,455,891 | |
| | | 2,144,823 | | | 3.50%, 10/01/2046 | | | 2,150,386 | |
| | | 848,974 | | | 3.50%, 10/25/2046(5) | | | 195,360 | |
| | | 1,528,373 | | | 3.50%, 11/01/2046 | | | 1,533,521 | |
| | | 1,473,296 | | | 3.50%, 09/01/2047 | | | 1,474,126 | |
| | | 5,748,172 | | | 3.50%, 11/25/2047 | | | 5,847,673 | |
| | | 1,087,081 | | | 3.50%, 12/01/2047 | | | 1,087,795 | |
| | | 6,408,040 | | | 3.50%, 01/01/2048 | | | 6,407,836 | |
| | | 1,218,103 | | | 3.50%, 02/01/2048 | | | 1,220,343 | |
| | | 1,589,576 | | | 3.50%, 02/25/2048 | | | 1,608,337 | |
| | | 3,711,529 | | | 3.50%, 04/25/2048 | | | 3,835,441 | |
| | | 231,659,000 | | | 3.50%, 01/01/2049(13) | | | 231,618,279 | |
| | | 9,636,856 | | | 3.50%, 09/01/2057 | | | 9,592,669 | |
| | | 6,197,389 | | | 3.50%, 12/25/2058 | | | 6,207,494 | |
| | | 2,900,000 | | | 3.66%, 07/01/2030 | | | 2,933,093 | |
| | | 2,895,795 | | | 3.71%, 09/01/2028 | | | 2,973,089 | |
| | | 1,951,030 | | | 3.74%, 06/01/2026 | | | 2,024,332 | |
| | | 670,970 | | | 3.89%, 05/01/2030 | | | 694,762 | |
| | | 289,380 | | | 3.96%, 05/01/2034 | | | 299,339 | |
| | | 2,045,264 | | | 4.00%, 06/01/2025 | | | 2,095,631 | |
| | | 615,042 | | | 4.00%, 10/01/2025 | | | 629,840 | |
| | | 425,029 | | | 4.00%, 04/25/2032(5) | | | 60,006 | |
| | | 4,291,542 | | | 4.00%, 10/01/2040 | | | 4,412,648 | |
| | | 1,975,414 | | | 4.00%, 11/01/2040 | | | 2,031,224 | |
| | | 1,437,623 | | | 4.00%, 12/01/2040 | | | 1,478,239 | |
| | | 693,883 | | | 4.00%, 02/01/2041 | | | 713,921 | |
| | | 1,628,996 | | | 4.00%, 03/01/2041 | | | 1,675,027 | |
| | | 699,336 | | | 4.00%, 03/25/2042(5) | | | 105,280 | |
| | | 730,797 | | | 4.00%, 08/01/2042 | | | 751,445 | |
| | | 1,403,847 | | | 4.00%, 09/01/2042 | | | 1,443,508 | |
| | | 399,367 | | | 4.00%, 11/25/2042(5) | | | 60,454 | |
| | | 311,252 | | | 4.00%, 03/01/2045 | | | 317,815 | |
| | | 1,299,886 | | | 4.00%, 07/01/2045 | | | 1,335,108 | |
| | | 686,091 | | | 4.00%, 05/01/2046 | | | 699,884 | |
| | | 1,648,285 | | | 4.00%, 06/01/2046 | | | 1,681,687 | |
| | | 1,508,761 | | | 4.00%, 04/01/2047 | | | 1,547,149 | |
| | | 4,399,629 | | | 4.00%, 09/01/2048 | | | 4,485,823 | |
| | | 198,445,000 | | | 4.00%, 01/01/2049(13) | | | 202,289,872 | |
| | | 539,227 | | | 4.50%, 04/01/2025 | | | 555,103 | |
| | | 747,191 | | | 4.50%, 07/25/2027(5) | | | 73,554 | |
| | | 1,135,121 | | | 4.50%, 09/01/2035 | | | 1,181,392 | |
| | | 4,248,987 | | | 4.50%, 08/01/2040 | | | 4,450,529 | |
The accompanying notes are an integral part of these financial statements.
|
| Hartford Total Return Bond HLS Fund |
Schedule of Investments – (continued)
December 31, 2018
| | | | | | | | | | |
| Shares or Principal Amount | | Market Value† | |
| U.S. GOVERNMENT AGENCIES - 59.8% - (continued) | |
| | | | | | FNMA - (continued) | |
| $ | | | 3,892,703 | | | 4.50%, 10/01/2040 | | $ | 4,077,341 | |
| | | 1,683,431 | | | 4.50%, 10/01/2041 | | | 1,763,193 | |
| | | 1,573,551 | | | 4.50%, 09/01/2043 | | | 1,648,100 | |
| | | 5,898,025 | | | 4.50%, 01/01/2051 | | | 6,128,021 | |
| | | 50,215 | | | 5.00%, 01/01/2020 | | | 51,090 | |
| | | 621,300 | | | 5.00%, 06/01/2022 | | | 635,484 | |
| | | 250,741 | | | 5.00%, 06/01/2025 | | | 256,532 | |
| | | 572,851 | | | 5.00%, 04/25/2038 | | | 602,537 | |
| | | 3,128,984 | | | 5.00%, 06/01/2047 | | | 3,279,389 | |
| | | 20,500,000 | | | 5.00%, 01/01/2049(13) | | | 21,472,149 | |
| | | 394,235 | | | 5.47%, 05/25/2042(3)(5) | | | 43,259 | |
| | | 7,775 | | | 5.50%, 08/01/2019 | | | 7,779 | |
| | | 18,110 | | | 5.50%, 09/01/2019 | | | 18,137 | |
| | | 3,588 | | | 5.50%, 10/01/2019 | | | 3,589 | |
| | | 2,279 | | | 5.50%, 01/01/2020 | | | 2,286 | |
| | | 340 | | | 5.50%, 03/01/2020 | | | 342 | |
| | | 136,172 | | | 5.50%, 05/01/2020 | | | 136,920 | |
| | | 138,724 | | | 5.50%, 06/01/2022 | | | 142,144 | |
| | | 238,599 | | | 5.50%, 06/01/2033 | | | 257,117 | |
| | | 184,559 | | | 5.50%, 08/01/2033 | | | 197,021 | |
| | | 1,161,165 | | | 5.50%, 09/01/2033 | | | 1,250,527 | |
| | | 1,098,462 | | | 5.50%, 12/01/2033 | | | 1,184,866 | |
| | | 844,945 | | | 5.50%, 01/01/2034 | | | 910,013 | |
| | | 4,123,146 | | | 5.50%, 11/01/2035 | | | 4,438,857 | |
| | | 1,218,373 | | | 5.50%, 04/01/2036 | | | 1,311,776 | |
| | | 955,464 | | | 5.50%, 09/01/2036 | | | 1,028,100 | |
| | | 88,094 | | | 5.50%, 01/01/2037 | | | 94,239 | |
| | | 660,676 | | | 5.50%, 04/25/2037 | | | 723,795 | |
| | | 2,625,249 | | | 5.50%, 06/25/2042(5) | | | 580,220 | |
| | | 2,062 | | | 6.00%, 03/01/2022 | | | 2,070 | |
| | | 419,204 | | | 6.00%, 12/01/2032 | | | 453,833 | |
| | | 363,880 | | | 6.00%, 01/01/2033 | | | 395,921 | |
| | | 74,913 | | | 6.00%, 02/01/2033 | | | 80,383 | |
| | | 541,768 | | | 6.00%, 03/01/2033 | | | 588,341 | |
| | | 1,129,246 | | | 6.00%, 02/01/2037 | | | 1,230,991 | |
| | | 2,693,442 | | | 6.00%, 01/25/2042(5) | | | 485,928 | |
| | | 1,808,880 | | | 6.00%, 09/25/2047(5) | | | 428,479 | |
| | | 1,286 | | | 6.50%, 05/01/2031 | | | 1,408 | |
| | | 1,078 | | | 6.50%, 09/01/2031 | | | 1,192 | |
| | | 1,596 | | | 6.50%, 07/01/2032 | | | 1,809 | |
| | | 1,371 | | | 7.00%, 07/01/2029 | | | 1,552 | |
| | | 91 | | | 7.00%, 12/01/2030 | | | 93 | |
| | | 665 | | | 7.00%, 02/01/2032 | | | 689 | |
| | | 237 | | | 7.00%, 03/01/2032 | | | 273 | |
| | | 1,889 | | | 7.00%, 09/01/2032 | | | 1,977 | |
| | | 1,741 | | | 7.50%, 10/01/2022 | | | 1,842 | |
| | | 1,661 | | | 7.50%, 06/01/2027 | | | 1,857 | |
| | | 2,136 | | | 7.50%, 10/01/2029 | | | 2,167 | |
| | | 14,016 | | | 7.50%, 03/01/2030 | | | 15,370 | |
| | | 8,257 | | | 7.50%, 04/01/2030 | | | 8,654 | |
| | | 1,081 | | | 7.50%, 06/01/2030 | | | 1,216 | |
| | | 1,957 | | | 7.50%, 07/01/2030 | | | 2,187 | |
| | | 465 | | | 7.50%, 08/01/2030 | | | 518 | |
| | | 5,538 | | | 7.50%, 10/01/2030 | | | 5,575 | |
| | | 7,586 | | | 7.50%, 01/01/2031 | | | 7,697 | |
| | | 25,083 | | | 7.50%, 05/01/2031 | | | 28,520 | |
| | | 7,231 | | | 7.50%, 06/01/2031 | | | 7,395 | |
| | | 1,685 | | | 7.50%, 08/01/2031 | | | 1,863 | |
| | | 38,390 | | | 7.50%, 09/01/2031 | | | 39,611 | |
| | | 273 | | | 7.50%, 05/01/2032 | | | 315 | |
| | | | | | | | | | |
| | | | | | | | | 652,854,867 | |
| | | | | | | | | | |
| | | | | | GNMA | |
| $ | | | 459,990 | | | 1.75%, 09/20/2043 | | $ | 441,786 | |
| | | 2,005,001 | | | 2.00%, 01/20/2042 | | | 1,914,122 | |
| | | 1,964,992 | | | 2.50%, 12/16/2039 | | | 1,929,647 | |
| | | | | | | | | | |
| Shares or Principal Amount | | Market Value† | |
| U.S. GOVERNMENT AGENCIES - 59.8% - (continued) | |
| | | | | | GNMA - (continued) | |
| $ | | | 2,907,409 | | | 2.50%, 07/20/2041 | | $ | 2,837,273 | |
| | | 1,061,165 | | | 3.00%, 09/20/2028(5) | | | 88,826 | |
| | | 631,821 | | | 3.00%, 02/16/2043(5) | | | 98,657 | |
| | | 6,673,520 | | | 3.00%, 03/15/2045 | | | 6,583,671 | |
| | | 369,486 | | | 3.00%, 04/15/2045 | | | 364,207 | |
| | | 4,568,733 | | | 3.00%, 07/15/2045 | | | 4,503,460 | |
| | | 109,562 | | | 3.00%, 08/15/2045 | | | 107,997 | |
| | | 465,244 | | | 3.00%, 03/20/2047(14) | | | 414,414 | |
| | | 1,290,013 | | | 3.00%, 07/16/2047 | | | 1,223,608 | |
| | | 451,584 | | | 3.50%, 02/16/2027(5) | | | 39,418 | |
| | | 1,111,526 | | | 3.50%, 03/20/2027(5) | | | 105,988 | |
| | | 999,572 | | | 3.50%, 07/20/2040(5) | | | 104,502 | |
| | | 1,462,522 | | | 3.50%, 02/20/2041(5) | | | 164,373 | |
| | | 2,515,658 | | | 3.50%, 04/20/2042(5) | | | 294,196 | |
| | | 3,744,924 | | | 3.50%, 10/20/2042(5) | | | 676,154 | |
| | | 393,430 | | | 3.50%, 11/15/2042 | | | 398,834 | |
| | | 12,200 | | | 3.50%, 12/15/2042 | | | 12,345 | |
| | | 281,724 | | | 3.50%, 02/15/2043 | | | 285,073 | |
| | | 14,436 | | | 3.50%, 03/15/2043 | | | 14,608 | |
| | | 1,895,617 | | | 3.50%, 04/15/2043 | | | 1,918,166 | |
| | | 4,783,772 | | | 3.50%, 05/15/2043 | | | 4,837,380 | |
| | | 275,091 | | | 3.50%, 05/20/2043(5) | | | 46,456 | |
| | | 2,182,326 | | | 3.50%, 07/20/2043(5) | | | 324,794 | |
| | | 2,358,000 | | | 3.50%, 01/20/2046 | | | 2,339,949 | |
| | | 2,422,885 | | | 3.50%, 08/20/2047 | | | 2,438,976 | |
| | | 334,222 | | | 4.00%, 12/16/2026(5) | | | 30,046 | |
| | | 4,582,777 | | | 4.00%, 05/20/2029(5) | | | 449,832 | |
| | | 5,308,488 | | | 4.00%, 07/20/2040 | | | 5,482,660 | |
| | | 6,270,858 | | | 4.00%, 09/20/2040 | | | 6,485,417 | |
| | | 9,440,412 | | | 4.00%, 10/20/2040 | | | 9,749,626 | |
| | | 1,487,117 | | | 4.00%, 12/20/2040 | | | 1,532,990 | |
| | | 485,183 | | | 4.00%, 05/16/2042(5) | | | 72,769 | |
| | | 707,247 | | | 4.00%, 03/20/2043(5) | | | 149,802 | |
| | | 319,336 | | | 4.00%, 01/20/2044(5) | | | 72,113 | |
| | | 3,050,063 | | | 4.00%, 01/16/2046(5) | | | 565,113 | |
| | | 2,517,017 | | | 4.00%, 03/20/2047(5) | | | 444,177 | |
| | | 3,887,174 | | | 4.00%, 07/20/2047(5) | | | 680,604 | |
| | | 1,173,862 | | | 4.00%, 11/20/2047 | | | 1,208,277 | |
| | | 5,221,302 | | | 4.00%, 03/20/2048 | | | 5,360,972 | |
| | | 274,793 | | | 4.50%, 11/15/2039 | | | 287,048 | |
| | | 2,039,856 | | | 4.50%, 05/15/2040 | | | 2,132,200 | |
| | | 6,245,654 | | | 4.50%, 05/20/2040 | | | 6,553,623 | |
| | | 400,550 | | | 4.50%, 07/15/2041 | | | 418,257 | |
| | | 1,200,064 | | | 4.50%, 04/20/2045(5) | | | 289,031 | |
| | | 579,124 | | | 4.50%, 01/20/2046 | | | 607,279 | |
| | | 9,195,943 | | | 4.50%, 08/20/2048 | | | 9,522,358 | |
| | | 8,595,696 | | | 4.50%, 09/20/2048 | | | 8,900,743 | |
| | | 3,007,067 | | | 5.00%, 02/16/2040(5) | | | 707,044 | |
| | | 673,896 | | | 5.00%, 05/20/2040 | | | 717,247 | |
| | | 1,641,619 | | | 5.00%, 06/15/2041 | | | 1,739,908 | |
| | | 2,042,661 | | | 5.00%, 10/16/2041(5) | | | 312,188 | |
| | | 2,536,790 | | | 5.00%, 03/15/2044 | | | 2,688,359 | |
| | | 724,490 | | | 5.00%, 01/16/2047(5) | | | 159,482 | |
| | | 545,157 | | | 5.50%, 03/15/2033 | | | 597,375 | |
| | | 730,223 | | | 5.50%, 04/15/2033 | | | 803,352 | |
| | | 880,574 | | | 5.50%, 05/15/2033 | | | 969,876 | |
| | | 1,183,885 | | | 5.50%, 10/20/2034 | | | 1,264,607 | |
| | | 2,520,392 | | | 5.50%, 03/20/2039(5) | | | 563,347 | |
| | | 2,218,359 | | | 5.50%, 02/16/2047(5) | | | 498,493 | |
| | | 1,323,179 | | | 5.50%, 02/20/2047(5) | | | 289,056 | |
| | | 1,580 | | | 6.00%, 12/15/2023 | | | 1,695 | |
| | | 1,072 | | | 6.00%, 01/15/2029 | | | 1,150 | |
| | | 1,302 | | | 6.00%, 04/15/2029 | | | 1,415 | |
| | | 45,805 | | | 6.00%, 12/15/2031 | | | 49,151 | |
| | | 946 | | | 6.00%, 10/15/2032 | | | 1,035 | |
The accompanying notes are an integral part of these financial statements.
|
| Hartford Total Return Bond HLS Fund |
Schedule of Investments – (continued)
December 31, 2018
| | | | | | | | | | |
| Shares or Principal Amount | | Market Value† | |
| U.S. GOVERNMENT AGENCIES - 59.8% - (continued) | |
| | | | | | GNMA - (continued) | |
| $ | | | 24,691 | | | 6.00%, 06/15/2033 | | $ | 26,865 | |
| | | 2,052 | | | 6.00%, 03/15/2034 | | | 2,202 | |
| | | 57,753 | | | 6.00%, 08/15/2034 | | | 62,858 | |
| | | 78,928 | | | 6.00%, 09/15/2034 | | | 85,345 | |
| | | 43,805 | | | 6.00%, 02/15/2035 | | | 47,669 | |
| | | 289,204 | | | 6.00%, 12/15/2035 | | | 311,633 | |
| | | 25,709 | | | 6.00%, 02/15/2036 | | | 27,582 | |
| | | 188,439 | | | 6.00%, 03/15/2036 | | | 204,465 | |
| | | 31,747 | | | 6.00%, 04/15/2036 | | | 34,060 | |
| | | 120,862 | | | 6.00%, 05/15/2036 | | | 131,537 | |
| | | 256,791 | | | 6.00%, 06/15/2036 | | | 279,028 | |
| | | 66,726 | | | 6.00%, 07/15/2036 | | | 71,647 | |
| | | 19,589 | | | 6.00%, 08/15/2036 | | | 21,018 | |
| | | 175,518 | | | 6.00%, 02/15/2037 | | | 190,686 | |
| | | 631 | | | 6.00%, 05/15/2037 | | | 686 | |
| | | 393,799 | | | 6.00%, 06/15/2037 | | | 427,850 | |
| | | 283,962 | | | 6.00%, 07/15/2037 | | | 304,647 | |
| | | 83,527 | | | 6.00%, 08/15/2037 | | | 90,844 | |
| | | 97,830 | | | 6.00%, 10/15/2037 | | | 104,956 | |
| | | 70,414 | | | 6.00%, 11/15/2037 | | | 75,543 | |
| | | 99,010 | | | 6.00%, 12/15/2037 | | | 109,273 | |
| | | 173,606 | | | 6.00%, 01/15/2038 | | | 187,993 | |
| | | 13,448 | | | 6.00%, 02/15/2038 | | | 14,428 | |
| | | 29,581 | | | 6.00%, 05/15/2038 | | | 31,735 | |
| | | 9,247 | | | 6.00%, 06/15/2038 | | | 9,924 | |
| | | 37,687 | | | 6.00%, 08/15/2038 | | | 40,494 | |
| | | 96,489 | | | 6.00%, 09/15/2038 | | | 103,551 | |
| | | 131,053 | | | 6.00%, 10/15/2038 | | | 140,785 | |
| | | 262,840 | | | 6.00%, 11/15/2038 | | | 281,986 | |
| | | 100,547 | | | 6.00%, 12/15/2038 | | | 107,871 | |
| | | 1,656 | | | 6.00%, 01/15/2039 | | | 1,777 | |
| | | 36,162 | | | 6.00%, 08/15/2039 | | | 38,796 | |
| | | 73,241 | | | 6.00%, 11/15/2039 | | | 78,589 | |
| | | 13,945 | | | 6.00%, 02/15/2040 | | | 14,961 | |
| | | 877,111 | | | 6.00%, 06/15/2040 | | | 941,003 | |
| | | 166,937 | | | 6.00%, 07/15/2040 | | | 179,097 | |
| | | 1,967,523 | | | 6.00%, 09/20/2040(5) | | | 469,104 | |
| | | 922,281 | | | 6.00%, 06/15/2041 | | | 992,181 | |
| | | 1,936,055 | | | 6.00%, 02/20/2046(5) | | | 445,581 | |
| | | 23,138 | | | 6.50%, 06/15/2028 | | | 24,918 | |
| | | 493 | | | 6.50%, 07/15/2028 | | | 531 | |
| | | 2,032 | | | 6.50%, 08/15/2028 | | | 2,189 | |
| | | 15,831 | | | 6.50%, 09/15/2028 | | | 17,049 | |
| | | 1,446 | | | 6.50%, 10/15/2028 | | | 1,558 | |
| | | 3,042 | | | 6.50%, 11/15/2028 | | | 3,276 | |
| | | 4,925 | | | 6.50%, 12/15/2028 | | | 5,304 | |
| | | 6,730 | | | 6.50%, 01/15/2029 | | | 7,248 | |
| | | 23,289 | | | 6.50%, 02/15/2029 | | | 25,079 | |
| | | 191,992 | | | 6.50%, 03/15/2029 | | | 206,762 | |
| | | 33,788 | | | 6.50%, 04/15/2029 | | | 36,387 | |
| | | 22,642 | | | 6.50%, 05/15/2029 | | | 24,384 | |
| | | 168,670 | | | 6.50%, 06/15/2029 | | | 181,646 | |
| | | 7,385 | | | 6.50%, 07/15/2029 | | | 7,953 | |
| | | 222 | | | 6.50%, 03/15/2031 | | | 239 | |
| | | 210,544 | | | 6.50%, 04/15/2031 | | | 226,740 | |
| | | 48,875 | | | 6.50%, 05/15/2031 | | | 54,437 | |
| | | 8,280 | | | 6.50%, 06/15/2031 | | | 9,176 | |
| | | 183,291 | | | 6.50%, 07/15/2031 | | | 198,149 | |
| | | 98,284 | | | 6.50%, 08/15/2031 | | | 105,845 | |
| | | 130,969 | | | 6.50%, 09/15/2031 | | | 141,254 | |
| | | 150,989 | | | 6.50%, 10/15/2031 | | | 162,605 | |
| | | 296,970 | | | 6.50%, 11/15/2031 | | | 320,424 | |
| | | 66,727 | | | 6.50%, 12/15/2031 | | | 71,861 | |
| | | 278,679 | | | 6.50%, 01/15/2032 | | | 301,946 | |
| | | 58,487 | | | 6.50%, 02/15/2032 | | | 66,076 | |
| | | | | | | | | | |
| Shares or Principal Amount | | Market Value† | |
| U.S. GOVERNMENT AGENCIES - 59.8% - (continued) | |
| | | | | | GNMA - (continued) | |
| $ | | | 43,829 | | | 6.50%, 03/15/2032 | | $ | 47,201 | |
| | | 222,035 | | | 6.50%, 04/15/2032 | | | 245,137 | |
| | | 716 | | | 6.50%, 05/15/2032 | | | 771 | |
| | | 36,432 | | | 6.50%, 06/15/2032 | | | 39,235 | |
| | | 5,651 | | | 7.00%, 06/20/2030 | | | 6,107 | |
| | | 667 | | | 7.00%, 02/15/2031 | | | 721 | |
| | | 190 | | | 7.00%, 06/15/2031 | | | 199 | |
| | | 179 | | | 7.00%, 08/15/2031 | | | 199 | |
| | | 645 | | | 8.50%, 11/15/2024 | | | 646 | |
| | | | | | | | | | |
| | | | | | | | | 116,102,099 | |
| | | | | | | | | | |
| | | | | | | | | 966,005,028 | |
| | | | | | | | | | |
| | | | | | U.S. Government Agencies - 13.5% | |
| | | | | | FHLMC | |
| $ | | | 7,730,000 | | | 3.00%, 01/01/2034(13) | | $ | 7,702,645 | |
| | | 21,977,000 | | | 3.00%, 01/01/2049(13) | | | 21,415,732 | |
| | | 3,200,000 | | | 3.50%, 01/01/2034(13) | | | 3,240,438 | |
| | | 11,020,000 | | | 4.50%, 01/01/2049(13) | | | 11,406,715 | |
| | | 6,250,000 | | | 5.00%, 01/01/2049(13) | | | 6,545,272 | |
| | | | | | | | | | |
| | | | | | | | | 50,310,802 | |
| | | | | | | | | | |
| | | | | | FNMA | |
| $ | | | 17,800,000 | | | 3.00%, 01/01/2034(13) | | $ | 17,755,848 | |
| | | 26,696,000 | | | 3.00%, 01/01/2049(13) | | | 26,020,704 | |
| | | 41,550,000 | | | 3.50%, 01/01/2034(13) | | | 42,049,087 | |
| | | 22,185,000 | | | 4.50%, 01/01/2049(13) | | | 22,972,307 | |
| | | | | | | | | | |
| | | | | | | | | 108,797,946 | |
| | | | | | | | | | |
| | | | | | GNMA | |
| $ | | | 31,140,000 | | | 3.00%, 01/01/2049(13) | | $ | 30,664,993 | |
| | | 52,331,000 | | | 3.50%, 01/01/2049(13) | | | 52,653,980 | |
| | | 7,741,000 | | | 4.00%, 01/01/2049(13) | | | 7,926,058 | |
| | | 25,165,000 | | | 4.50%, 01/01/2049(13) | | | 26,039,386 | |
| | | 4,400,000 | | | 5.00%, 01/01/2049(13) | | | 4,570,672 | |
| | | | | | | | | | |
| | | | | | | | | 121,855,089 | |
| | | | | | | | | | |
| | | | | | | | | 280,963,837 | |
| | | | | | | | | | |
| | | |
| | | | | | Total U.S. Government Agencies
(cost $1,241,093,334) | | $ | 1,246,968,865 | |
| | | | | | | | | | |
| | | |
| | | | | | | | | | |
| U.S. GOVERNMENT SECURITIES - 8.4% | |
| | | | | | U.S. Treasury Securities - 8.4% | |
| | | | | | U.S. Treasury Bonds - 1.7% | |
| $ | | | 5,119,000 | | | 2.50%, 02/15/2046(15) | | $ | 4,621,497 | |
| | | 13,709,000 | | | 2.88%, 11/15/2046(15)(16) | | | 13,329,325 | |
| | | 1,095,000 | | | 3.00%, 05/15/2045(15) | | | 1,092,904 | |
| | | 6,430,000 | | | 3.00%, 02/15/2048(15)(17) | | | 6,395,589 | |
| | | 8,990,000 | | | 3.13%, 08/15/2044(15)(17) | | | 9,177,175 | |
| | | | | | | | | | |
| | | | | | | | | 34,616,490 | |
| | | | | | | | | | |
| | | | | | U.S. Treasury Notes - 6.7% | |
| | | 66,784,773 | | | 0.38%, 07/15/2027(16)(18) | | | 63,355,966 | |
| | | 13,662,223 | | | 0.75%, 07/15/2028(18) | | | 13,372,435 | |
| | | 4,420,000 | | | 1.88%, 11/30/2021(15) | | | 4,347,484 | |
| | | 58,815,000 | | | 2.88%, 05/31/2025(15) | | | 59,828,180 | |
| | | | | | | | | | |
| | | | | | | | | 140,904,065 | |
| | | | | | | | | | |
| | | | | | | | | 175,520,555 | |
| | | | | | | | | | |
| | | |
| | | | | | Total U.S. Government Securities
(cost $178,599,222) | | $ | 175,520,555 | |
| | | | | | | | | | |
| | | |
| | | | | | | | | | |
| COMMON STOCKS - 0.0% | |
| | | | | | Energy - 0.0% | |
| | | 64,657 | | | Ascent Resources - Marcellus LLC Class A(19)(20) | | | 203,670 | |
| | | 30,559 | | | Philadelphia Energy Solutions Class A | | | 168,074 | |
The accompanying notes are an integral part of these financial statements.
|
| Hartford Total Return Bond HLS Fund |
Schedule of Investments – (continued)
December 31, 2018
| | | | | | | | | | |
| Shares or Principal Amount | | Market Value† | |
| COMMON STOCKS - 0.0% - (continued) | |
| | | | | | Energy - 0.0% - (continued) | |
| | | 14,557 | | | Templar Energy LLC Class A* | | $ | 3,639 | |
| | | | | | | | | | |
| | | | | | | | | 375,383 | |
| | | | | | | | | | |
| | | |
| | | | | | Total Common Stocks
(cost $593,434) | | $ | 375,383 | |
| | | | | | | | | | |
| | | |
| | | | | | | | | | |
| PREFERRED STOCKS - 0.1% | |
| | | | | | Banks - 0.1% | |
| | | 2,242 | | | U.S. Bancorp Series A, 3.50%, 01/31/2019 (2)(7) | | $ | 1,670,290 | |
| | | | | | | | | | |
| | | |
| | | | | | Total Preferred Stocks
(cost $1,591,820) | | $ | 1,670,290 | |
| | | | | | | | | | |
| | | |
| | | | | | | | | | |
| WARRANTS - 0.0% | |
| | | | | | Energy - 0.0% | |
| | | 16,740 | | | Ascent Resources - Marcellus LLC Expires 3/30/2023*(19)(20) | | | 1,339 | |
| | | | | | | | | | |
| | | |
| | | | | | Total Warrants
(cost $1,339) | | $ | 1,339 | |
| | | | | | | | | | |
| | | |
| | | | | | | | | | |
| ESCROWS - 0.0%(21) | |
| | | | | | Energy-Alternate Sources - 0.0% | |
| | | 800,000 | | | TCEH Corp.*(19)(20) | | | 1 | |
| | | | | | | | | | |
| | | |
| | | | | | Total Escrows
(cost $ - ) | | $ | 1 | |
| | | | | | | | | | |
| | | |
| | | | | | Total Long-Term Investments
(cost $2,876,327,759) | | $ | 2,837,788,642 | |
| | | | | | | | | | |
| | | |
| | | | | | | | | | |
| SHORT-TERM INVESTMENTS - 0.7% | |
| | | | | | Other Investment Pools & Funds - 0.4% | |
| | | 9,656,892 | | | Morgan Stanley Institutional Liquidity Funds, Government Portfolio, Institutional Class, 2.50%(22) | | $ | 9,656,892 | |
| | | | | | | | | | |
| | | | | | Securities Lending Collateral - 0.3% | |
| | | 277,266 | | | Citibank NA DDCA, 2.39%, 1/2/2019(22) | | | 277,266 | |
| | | 3,663,980 | | | Fidelity Investments Money Market Funds, Government Portfolio, Institutional Class, 2.35%(22) | | | 3,663,980 | |
| | | 262,810 | | | Goldman Sachs Financial Square Funds, Government Fund, Institutional Class, 2.30%(22) | | | 262,810 | |
| | | 191,643 | | | Invesco Government & Agency Portfolio, Institutional Class, 2.30%(22) | | | 191,643 | |
| | | 1,066,808 | | | Morgan Stanley Institutional Liquidity Funds, Government Portfolio, Institutional Class, 2.50%(22) | | | 1,066,808 | |
| | | 82,813 | | | Western Asset Institutional Government Reserves Fund, Institutional Class, 2.28%(22) | | | 82,813 | |
| | | | | | | | | | |
| | | | | | | | | 5,545,320 | |
| | | | | | | | | | |
| | | |
| | | | | | Total Short-Term Investments
(cost $15,202,212) | | $ | 15,202,212 | |
| | | | | | | | | | |
| | | | | | | | | | | | | | |
| | | | |
| | | | | | Total Investments Excluding Purchased Options
(cost $2,891,529,971) | | | 136.7 | % | | $ | 2,852,990,854 | |
| | | | | | | | | | | | | | |
| | | | |
| | | | | | Total Purchased Options
(cost $6,640,962) | | | 0.3 | % | | $ | 5,142,116 | |
| | | | | | | | | | | | | | |
| | | | |
| | | | | | Total Investments
(cost $2,898,170,933) | | | 137.0 | % | | $ | 2,858,132,970 | |
| | | | | | Other Assets and Liabilities | | | (37.0 | )% | | | (771,711,409 | ) |
| | | | | | | | | | | | | | |
| | | | | | Total Net Assets | | | 100.0 | % | | $ | 2,086,421,561 | |
| | | | | | | | | | | | | | |
| Note: | Percentage of investments as shown is the ratio of the total market value to total net assets. |
| | The Fund may refer to any one or more of the industry classifications used by one or more widely recognized market indices, ratings group and/or as defined by Fund management. Industry classifications may not be identical across all security types. |
| | Equity Industry classifications used in this report are the Global Industry Classification Standard, which was developed by and is the exclusive property and service mark of MSCI, Inc. and Standard & Poor’s. |
| | For Fund compliance purposes, the Fund may not use the same classification system. These classifications are used for financial reporting purposes. |
| (1) | Security was purchased pursuant to Rule 144A under the Securities Act of 1933 and may be sold in transactions that are exempt from registration (typically only to qualified institutional buyers) or in a public offering registered under the Securities Act of 1933. At December 31, 2018, the aggregate value of these securities was $740,360,177, representing 35.5% of net assets. |
| (2) | Variable rate securities; the rate reported is the coupon rate in effect at December 31, 2018. |
| (3) | Variable or floating rate security, which interest rate adjusts periodically based on changes in current interest rates and prepayments on the underlying pool of assets. Rate shown is the rate in effect as of period end. |
| (4) | Security is a“step-up” bond where coupon increases or steps up at a predetermined date. Rate shown is current coupon rate. |
| (5) | Securities disclosed are interest-only strips. |
| (6) | Represents entire or partial securities on loan. See Note 8 in the accompanying Notes to Financial Statements for securities lending information. |
| (7) | Perpetual maturity security. Maturity date shown is the next call date or final legal maturity date, whichever comes first. |
| (8) | Security is exempt from registration under Regulation S under the Securities Act of 1933, which exempts from registration securities offered and sold outside of the United States. Security may not be offered or sold in the United States except pursuant to an exemption from, or in a transaction not subject to, the registration requirements of the Securities Act of 1933. At December 31, 2018, the aggregate value of these securities was $27,305,049, representing 1.3% of net assets. |
| (9) | Senior floating rate interests generally pay interest rates which are periodically adjusted by reference to a base short-term, floating lending rate plus a premium. The base lending rates are primarily the LIBOR, and secondarily the prime rate offered by one or more major United States banks (the “Prime Rate”) and the certificate of deposit rate or other base lending rates used by commercial lenders. Senior floating rate interests often require prepayments from excess cash flows or permit the borrower to repay at its election. The rate at which the borrower repays cannot be predicted with accuracy. As a result, the actual remaining maturity may be substantially less than the stated maturities shown. Unless otherwise noted, the interest rate disclosed for these securities represents the rate in effect as of December 31, 2018. |
| (10) | Represents an unsettled loan commitment. The coupon rate will be determined at time of settlement. |
| (11) | This security, or a portion of this security, has unfunded loan commitments. As of December 31, 2018, the aggregate value of the unfunded commitment was $25,542, which rounds to zero percent of total net assets. |
| (12) | Securities disclosed are principal-only strips. |
| (13) | Represents or includes a TBA transaction. |
The accompanying notes are an integral part of these financial statements.
|
| Hartford Total Return Bond HLS Fund |
Schedule of Investments – (continued)
December 31, 2018
| (14) | These securities pay no principal or interest during their initial accrual period, but accrue additional principal at a specified coupon rate. |
| (15) | This security, or a portion of this security, has been pledged as collateral in connection with OTC swap contracts. |
| (16) | This security, or a portion of this security, has been pledged as collateral in connection with centrally cleared swap contracts. |
| (17) | This security, or a portion of this security, has been pledged as collateral in connection with futures contracts. |
| (18) | The principal amount for these securities are adjusted for inflation and the interest payments equal a fixed percentage of the inflation-adjusted principal amount. |
| (19) | Investment valued using significant unobservable inputs. |
| (20) | These securities are valued in good faith at fair value as determined under policies and procedures established by and under the supervision of the Board of Directors. At December 31, 2018, the aggregate fair value of these securities was $6,577,390, which represented 0.3% of total net assets. This amount excludes securities that are principally traded in certain foreign markets and whose prices are adjusted pursuant to a third party pricing service methodology approved by the Board of Directors. |
| (21) | Share amount represents shares of the issuer previously held that resulted in receipt of the escrow. |
| (22) | Current yield as of period end. |
| | | | | | | | | | | | | | | | | | | | | | | | | | | | | | | | | | | | |
| OTC Swaption Contracts Outstanding at December 31, 2018 | |
Description | | Counter-
party | | Exercise
Price/FX
Rate/
Rate | | Pay/
Receive
Floating
Rate | | | Expiration
Date | | | Notional
Amount | | | Number of
Contracts | | | Market
Value† | | | Premiums
Paid
(Received)
by Fund | | | Unrealized
Appreciation/
(Depreciation) | |
Purchased swaption contracts: | |
| |
Calls | |
3 MonthUSD-LIBOR-BBA-Interest Rate Swap Expiring 05/06/57* | | BOA | | 2.45% | | | Pay | | | | 08/02/27 | | | | USD | | | | 5,070,000 | | | | 5,070,000 | | | $ | 540,462 | | | $ | 436,020 | | | $ | 104,442 | |
3 MonthUSD-LIBOR-BBA-Interest Rate Swap Expiring 07/20/48* | | CITI | | 2.91% | | | Pay | | | | 07/18/28 | | | | USD | | | | 3,200,000 | | | | 3,200,000 | | | | 361,600 | | | | 374,080 | | | | (12,480 | ) |
3 MonthUSD-LIBOR-BBA-Interest Rate Swap Expiring 08/04/57* | | BCLY | | 2.45% | | | Receive | | | | 08/02/27 | | | | USD | | | | 7,000,000 | | | | 7,000,000 | | | | 746,200 | | | | 1,009,321 | | | | (263,121 | ) |
| | | | | | | | | | | | | | | | | | | | | | | | | | | | | | | | | | | | |
Total Calls | | | | 15,270,000 | | | $ | 1,648,262 | | | $ | 1,819,421 | | | $ | (171,159 | ) |
| | | | | | | | | | | | | | | | | | | | | | | | | | | | | | | | | | | | |
Puts | |
3 MonthUSD-LIBOR-BBA-Interest Rate Swap Expiring 02/28/19* | | BCLY | | 2.45% | | | Pay | | | | 08/02/27 | | | | USD | | | | 7,000,000 | | | | 7,000,000 | | | $ | 1,350,300 | | | $ | 1,378,379 | | | $ | (28,079 | ) |
3 MonthUSD-LIBOR-BBA-Interest Rate Swap Expiring 05/06/57* | | BOA | | 2.45% | | | Receive | | | | 08/02/27 | | | | USD | | | | 5,070,000 | | | | 5,070,000 | | | | 978,003 | | | | 1,161,030 | | | | (183,027 | ) |
3 MonthUSD-LIBOR-BBA-Interest Rate Swap Expiring 06/03/29* | | BOA | | 3.20% | | | Receive | | | | 05/30/19 | | | | USD | | | | 37,670,000 | | | | 37,670,000 | | | $ | 108,565 | | | $ | 245,690 | | | $ | (137,125 | ) |
3 MonthUSD-LIBOR-BBA-Interest Rate Swap Expiring 06/03/29* | | DEUT | | 3.20% | | | Receive | | | | 05/30/19 | | | | USD | | | | 58,000,000 | | | | 58,000,000 | | | | 167,156 | | | | 864,200 | | | | (697,044 | ) |
3 MonthUSD-LIBOR-BBA-Interest Rate Swap Expiring 07/20/48* | | CITI | | 2.91% | | | Receive | | | | 07/18/28 | | | | USD | | | | 3,200,000 | | | | 3,200,000 | | | | 371,200 | | | | 374,080 | | | | (2,880 | ) |
3 Month USD-LIBOR-BBA-Interest Rate Swap Expiring 12/11/29* | | BOA | | 3.20% | | | Receive | | | | 12/09/19 | | | | USD | | | | 58,260,000 | | | | 58,260,000 | | | | 518,630 | | | | 798,162 | | | | (279,532 | ) |
| | | | | | | | | | | | | | | | | | | | | | | | | | | | | | | | | | | | |
Total Puts | | | | 169,200,000 | | | $ | 3,493,854 | | | $ | 4,821,541 | | | $ | (1,327,687 | ) |
| | | | | | | | | | | | | | | | | | | | | | | | | | | | | | | | | | | | |
Total purchased swaption contracts | | | | | | | | | | | | | | | | | | | 184,470,000 | | | $ | 5,142,116 | | | $ | 6,640,962 | | | $ | (1,498,846 | ) |
| | | | | | | | | | | | | | | | | | | | | | | | | | | | | | | | | | | | |
| * | Swaptions with forward premiums. |
| | | | | | | | | | | | | | | | | | | | | | | | | | | | | | | | |
| OTC Swaption Contracts Outstanding at December 31, 2018 | |
Description | | Counter-
party | | Exercise
Price/FX
Rate/
Rate | | Pay/
Receive
Floating
Rate | | | Expiration
Date | | Notional
Amount | | | Number of
Contracts | | | Market
Value† | | | Premiums
Paid
(Received)
by Fund | | | Unrealized
Appreciation/
(Depreciation) | |
Written swaption contracts: | |
Calls | |
CDX.NA.IG.31 | | GSC | | 77.50 | | | Receive | | | 01/16/19 | | | USD (159,348,000 | ) | | | (159,348,000 | ) | | $ | (36,347 | ) | | $ | (195,201 | ) | | $ | 158,854 | |
Written swaption contracts: | |
Puts | |
CDX.NA.IG.31 | | GSC | | 77.50 | | | Receive | | | 01/16/19 | | | USD (159,348,000 | ) | | | (159,348,000 | ) | | $ | (840,570 | ) | | $ | (470,077 | ) | | $ | (370,493 | ) |
| | | | | | | | | | | | | | | | | | | | | | | | | | | | | | | | |
Total written swaption contracts | | | | (318,696,000 | ) | | $ | (876,917 | ) | | $ | (665,278 | ) | | $ | (211,639 | ) |
| | | | | | | | | | | | | | | | | | | | | | | | | | | | | | | | |
The accompanying notes are an integral part of these financial statements.
|
| Hartford Total Return Bond HLS Fund |
Schedule of Investments – (continued)
December 31, 2018
| | | | | | | | | | | | | | | | | | | | | | | | | | | | | | | | | | | | |
| Exchange-Traded Options Contracts Outstanding at December 31, 2018 | |
Description | | Exercise
Price/
FX Rate/
Rate | | | Expiration
Date | | Number
of Contracts | | | Notional
Amount | | | Market
Value† | | | Premiums
Paid
(Received)
by Fund | | | Unrealized
Appreciation/
(Depreciation) | |
Written option contracts: | |
Calls | |
U.S. Treasury10-Year Future Option | | | 119.50 USD | | | 01/25/19 | | | | | (10 | ) | | | USD | | | | (10,000 | ) | | $ | (25,469 | ) | | $ | (8,273 | ) | | $ | (17,196 | ) |
Puts | |
U.S. Treasury10-Year Future Option | | | 119.50 USD | | | 01/25/19 | | | | | (10 | ) | | | USD | | | | (10,000 | ) | | $ | (313 | ) | | $ | (4,211 | ) | | $ | 3,898 | |
| | | | | | | | | | | | | | | | | | | | | | | | | | | | | | | | | | | | |
Total written option contracts | | | | | | | | (20,000 | ) | | $ | (25,782 | ) | | $ | (12,484 | ) | | $ | (13,298 | ) |
| | | | | | | | | | | | | | | | | | | | | | | | | | | | | | | | | | | | |
| | | | | | | | | | | | | | | | |
| Futures Contracts Outstanding at December 31, 2018 | |
Description | | Number of
Contracts | | | Expiration
Date | | | Current
Notional
Amount | | | Value and
Unrealized
Appreciation/
(Depreciation) | |
Long position contracts: | |
90-Day Euro Future | | | 850 | | | | 12/16/2019 | | | $ | 206,868,750 | | | $ | 542,270 | |
U.S. Treasury5-Year Note Future | | | 1,362 | | | | 03/29/2019 | | | | 156,204,375 | | | | 2,125,938 | |
U.S. Treasury Long Bond Future | | | 14 | | | | 03/20/2019 | | | | 2,044,000 | | | | 95,409 | |
U.S. Treasury Ultra Bond Future | | | 894 | | | | 03/20/2019 | | | | 143,626,687 | | | | 7,653,454 | |
| | | | | | | | | | | | | | | | |
Total | | | $ | 10,417,071 | |
| | | | | | | | | | | | | | | | |
Short position contracts: | |
90-Day Euro Future | | | 850 | | | | 12/14/2020 | | | $ | 207,251,250 | | | $ | (691,830 | ) |
U.S. Treasury2-Year Note Future | | | 666 | | | | 03/29/2019 | | | | 141,400,125 | | | | (936,536 | ) |
U.S. Treasury10-Year Note Future | | | 265 | | | | 03/20/2019 | | | | 32,334,140 | | | | (414,578 | ) |
U.S. Treasury10-Year Ultra Future | | | 557 | | | | 03/20/2019 | | | | 72,453,516 | | | $ | (2,263,832 | ) |
| | | | | | | | | | | | | | | | |
Total | | | $ | (4,306,776 | ) |
| | | | | | | | | | | | | | | | |
Total futures contracts | | | $ | 6,110,295 | |
| | | | | | | | | | | | | | | | |
| | | | | | | | | | | | | | | | |
| TBA Sale Commitments Outstanding at December 31, 2018 | |
Description | | Principal
Amount | | | Maturity
Date | | | Market Value† | | | Unrealized
Appreciation/
(Depreciation) | |
FHLMC, 3.00% | | $ | 17,800,000 | | | | 01/01/2034 | | | $ | (17,737,010 | ) | | $ | (135,869 | ) |
FHLMC, 3.50% | | | 25,196,000 | | | | 01/01/2049 | | | | (25,181,500 | ) | | | (266,750 | ) |
FHLMC, 5.50% | | | 5,100,000 | | | | 01/01/2049 | | | | (5,385,874 | ) | | | 3,391 | |
FNMA, 2.50% | | | 33,300,000 | | | | 01/01/2034 | | | | (32,520,182 | ) | | | (257,408 | ) |
FNMA, 3.00% | | | 28,198,000 | | | | 01/01/2034 | | | | (28,128,056 | ) | | | (172,382 | ) |
FNMA, 3.00% | | | 55,128,000 | | | | 01/01/2049 | | | | (53,733,494 | ) | | | (662,240 | ) |
FNMA, 4.00% | | | 3,200,000 | | | | 01/01/2034 | | | | (3,275,500 | ) | | | (18,000 | ) |
FNMA, 4.50% | | | 18,555,000 | | | | 01/01/2049 | | | | (19,213,485 | ) | | | (104,734 | ) |
FNMA, 5.50% | | | 13,400,000 | | | | 01/01/2049 | | | | (14,178,875 | ) | | | 27,219 | |
FNMA, 6.00% | | | 3,300,000 | | | | 01/01/2049 | | | | (3,543,932 | ) | | | 4,083 | |
GNMA, 4.50% | | | 21,500,000 | | | | 01/01/2049 | | | | (22,247,041 | ) | | | (51,651 | ) |
| | | | | | | | | | | | | | | | |
Total (proceeds receivable $223,510,608) | | | $ | (225,144,949 | ) | | $ | (1,634,341 | ) |
| | | | | | | | | | | | | | | | |
At December 31, 2018, the aggregate market value of TBA Sale Commitments represents (10.8)% of total net assets.
| | | | | | | | | | | | | | | | | | | | | | | | | | | | | | | | | | | | |
| OTC Credit Default Swap Contracts Outstanding at December 31, 2018 | |
Reference Entity | | Counterparty | | | Notional
Amount(a) | | | (Pay)/
Receive
Fixed
Rate | | Expiration
Date | | | Periodic
Payment
Frequency | | | Upfront
Premiums
Paid | | | Upfront
Premiums
Received | | | Market
Value† | | | Unrealized
Appreciation/
(Depreciation) | |
Credit default swaps on indices: | |
Buy protection: | |
ABX.HE.AAA.07 | | GSC | | | USD | | | | 1,445,193 | | | (0.09%) | | | 08/25/37 | | | | Monthly | | | $ | 304,605 | | | $ | — | | | $ | 35,999 | | | $ | (268,606 | ) |
ABX.HE.AAA.07 | | CSI | | | USD | | | | 3,512,980 | | | (0.09%) | | | 08/25/37 | | | | Monthly | | | | 851,367 | | | | — | | | | 71,492 | | | | (779,875 | ) |
The accompanying notes are an integral part of these financial statements.
|
| Hartford Total Return Bond HLS Fund |
Schedule of Investments – (continued)
December 31, 2018
| | | | | | | | | | | | | | | | | | | | | | | | | | | | | | | | | | | | | | | | |
| OTC Credit Default Swap Contracts Outstanding at December 31, 2018 – (continued) | |
Reference Entity | | Counterparty | | | Notional
Amount(a) | | | (Pay)/
Receive
Fixed
Rate | | | Expiration
Date | | | Periodic
Payment
Frequency | | | Upfront
Premiums
Paid | | | Upfront
Premiums
Received | | | Market
Value† | | | Unrealized
Appreciation/
(Depreciation) | |
ABX.HE.PENAAA.06 | | | MSC | | | | USD | | | | 718,509 | | | | (0.11%) | | | | 05/25/46 | | | | Monthly | | | $ | 77,650 | | | $ | — | | | $ | 38,539 | | | $ | (39,111 | ) |
ABX.HE.PENAAA.06 | | | JPM | | | | USD | | | | 1,640,298 | | | | (0.11%) | | | | 05/25/46 | | | | Monthly | | | | 176,848 | | | | — | | | | 88,855 | | | | (87,993 | ) |
ABX.HE.PENAAA.06 | | | GSC | | | | USD | | | | 673,288 | | | | (0.11%) | | | | 05/25/46 | | | | Monthly | | | | 166,237 | | | | — | | | | 36,114 | | | | (130,123 | ) |
| | | | | | | | | | | | | | | | | | | | | | | | | | | | | | | | | | | | | | | | |
Total | | | | | | | | | | | | | | | | | | | | | | | $ | 1,576,707 | | | $ | — | | | $ | 270,999 | | | $ | (1,305,708 | ) |
| | | | | | | | | | | | | | | | | | | | | | | | | | | | | | | | | | | | | | | | |
Sell protection: | | | | | | | | | | | | | | | | | | | | | | | | | | | | | | | | | | | | | | | | |
ABX.HE.AAA.07 | | | MSC | | | | USD | | | | 1,445,192 | | | | 0.09% | | | | 08/25/37 | | | | Monthly | | | $ | 13,663 | | | $ | — | | | $ | (38,005 | ) | | $ | (51,668 | ) |
ABX.HE.AAA.07 | | | MSC | | | | USD | | | | 3,512,978 | | | | 0.09% | | | | 08/25/37 | | | | Monthly | | | | 33,412 | | | | — | | | | (92,383 | ) | | | (125,795 | ) |
ABX.HE.PENAAA.06 | | | BCLY | | | | USD | | | | 3,032,099 | | | | 0.11% | | | | 05/25/46 | | | | Monthly | | | | — | | | | (79,203 | ) | | | (163,975 | ) | | | (84,772 | ) |
CMBX.NA.BB.6 | | | MSC | | | | USD | | | | 1,065,000 | | | | 5.00% | | | | 05/11/63 | | | | Monthly | | | | — | | | | (188,601 | ) | | | (298,363 | ) | | | (109,762 | ) |
CMBX.NA.BB.6 | | | CSI | | | | USD | | | | 965,000 | | | | 5.00% | | | | 05/11/63 | | | | Monthly | | | | — | | | | (137,967 | ) | | | (270,616 | ) | | | (132,649 | ) |
CMBX.NA.BB.6 | | | CSI | | | | USD | | | | 1,825,000 | | | | 5.00% | | | | 05/11/63 | | | | Monthly | | | | — | | | | (356,591 | ) | | | (511,785 | ) | | | (155,194 | ) |
CMBX.NA.BB.6 | | | CSI | | | | USD | | | | 3,270,000 | | | | 5.00% | | | | 05/11/63 | | | | Monthly | | | | — | | | | (662,014 | ) | | | (917,008 | ) | | | (254,994 | ) |
CMBX.NA.BB.6 | | | CSI | | | | USD | | | | 2,671,000 | | | | 5.00% | | | | 05/11/63 | | | | Monthly | | | | — | | | | (472,979 | ) | | | (748,288 | ) | | | (275,309 | ) |
CMBX.NA.BB.6 | | | CSI | | | | USD | | | | 2,795,000 | | | | 5.00% | | | | 05/11/63 | | | | Monthly | | | | — | | | | (494,937 | ) | | | (783,027 | ) | | | (288,090 | ) |
CMBX.NA.BB.6 | | | CSI | | | | USD | | | | 2,795,000 | | | | 5.00% | | | | 05/11/63 | | | | Monthly | | | | — | | | | (494,937 | ) | | | (783,027 | ) | | | (288,090 | ) |
CMBX.NA.BB.6 | | | CSI | | | | USD | | | | 2,800,000 | | | | 5.00% | | | | 05/11/63 | | | | Monthly | | | | — | | | | (495,822 | ) | | | (784,427 | ) | | | (288,605 | ) |
CMBX.NA.BB.6 | | | GSC | | | | USD | | | | 2,855,000 | | | | 5.00% | | | | 05/11/63 | | | | Monthly | | | | — | | | | (300,599 | ) | | | (799,837 | ) | | | (499,238 | ) |
CMBX.NA.BB.8 | | | MSC | | | | USD | | | | 5,083,000 | | | | 5.00% | | | | 10/17/57 | | | | Monthly | | | | — | | | | (1,362,760 | ) | | | (1,089,245 | ) | | | 273,515 | |
CMBX.NA.BB.8 | | | CSI | | | | USD | | | | 2,507,000 | | | | 5.00% | | | | 10/17/57 | | | | Monthly | | | | — | | | | (672,086 | ) | | | (537,230 | ) | | | 134,856 | |
CMBX.NA.BB.8 | | | GSC | | | | USD | | | | 3,445,000 | | | | 5.00% | | | | 10/17/57 | | | | Monthly | | | | — | | | | (826,935 | ) | | | (739,192 | ) | | | 87,743 | |
CMBX.NA.BB.8 | | | DEUT | | | | USD | | | | 1,455,000 | | | | 5.00% | | | | 10/17/57 | | | | Monthly | | | | — | | | | (350,807 | ) | | | (312,198 | ) | | | 38,609 | |
CMBX.NA.BB.8 | | | GSC | | | | USD | | | | 240,000 | | | | 5.00% | | | | 10/17/57 | | | | Monthly | | | | — | | | | (26,682 | ) | | | (51,430 | ) | | | (24,748 | ) |
CMBX.NA.BBB-.6 | | | MSC | | | | USD | | | | 465,000 | | | | 3.00% | | | | 05/11/63 | | | | Monthly | | | | — | | | | (39,432 | ) | | | (74,714 | ) | | | (35,282 | ) |
CMBX.NA.BBB-.6 | | | DEUT | | | | USD | | | | 485,000 | | | | 3.00% | | | | 05/11/63 | | | | Monthly | | | | — | | | | (71,578 | ) | | | (77,927 | ) | | | (6,349 | ) |
CMBX.NA.BBB-.6 | | | CSI | | | | USD | | | | 920,000 | | | | 3.00% | | | | 05/11/63 | | | | Monthly | | | | — | | | | (126,742 | ) | | | (147,975 | ) | | | (21,233 | ) |
CMBX.NA.BBB-.6 | | | MSC | | | | USD | | | | 4,245,000 | | | | 3.00% | | | | 05/11/63 | | | | Monthly | | | | — | | | | (619,935 | ) | | | (682,069 | ) | | | (62,134 | ) |
CMBX.NA.BBB-.6 | | | GSC | | | | USD | | | | 2,725,000 | | | | 3.00% | | | | 05/11/63 | | | | Monthly | | | | — | | | | (298,760 | ) | | | (438,069 | ) | | | (139,309 | ) |
Fed Republic of Brazil | | | DEUT | | | | USD | | | | 2,900,000 | | | | 1.00% | | | | 12/20/23 | | | | Quarterly | | �� | | — | | | | (119,878 | ) | | | (135,453 | ) | | | (15,575 | ) |
Republic of Turkey | | | MSC | | | | USD | | | | 1,565,000 | | | | 1.00% | | | | 12/20/23 | | | | Quarterly | | | | — | | | | (191,970 | ) | | | (170,947 | ) | | | 21,023 | |
Republic of Turkey | | | GSC | | | | USD | | | | 1,565,000 | | | | 1.00% | | | | 12/20/23 | | | | Quarterly | | | | — | | | | (190,802 | ) | | | (170,947 | ) | | | 19,855 | |
| | | | | | | | | | | | | | | | | | | | | | | | | | | | | | | | | | | | | | | | |
Total | | | | | | | | | | | $ | 47,075 | | | $ | (8,582,017 | ) | | $ | (10,818,137 | ) | | $ | (2,283,195 | ) |
| | | | | | | | | | | | | | | | | | | | | | | | | | | | | | | | | | | | | | | | |
Total traded indices | | | | | | | | | | | $ | 1,623,782 | | | $ | (8,582,017 | ) | | $ | (10,547,138 | ) | | $ | (3,588,903 | ) |
| | | | | | | | | | | | | | | | | | | | | | | | | | | | | | | | | | | | | | | | |
Total OTC contracts | | | | | | | | | | | $ | 1,623,782 | | | $ | (8,582,017 | ) | | $ | (10,547,138 | ) | | $ | (3,588,903 | ) |
| | | | | | | | | | | | | | | | | | | | | | | | | | | | | | | | | | | | | | | | |
| (a) | The maximum potential amount the Fund could be required to pay as a seller of credit protection or receive as a buyer of credit protection if a credit event occurs as defined under the terms of that particular swap agreement. |
| | | | | | | | | | | | | | | | | | | | | | | | | | | | | | |
| Centrally Cleared Credit Default Swap Contracts Outstanding at December 31, 2018 | |
Reference Entity | | Notional
Amount (a) | | | (Pay)/Receive
Fixed Rate | | | Expiration
Date | | | Periodic
Payment
Frequency | | | Cost
Basis | | | Value† | | | Unrealized
Appreciation/
(Depreciation) | |
Credit default swaps on indices: | |
Buy protection: | |
CDX.EM.30 | | USD | | | 34,520,000 | | | | (1.00 | %) | | | 12/20/23 | | | | Quarterly | | | $ | (1,636,821 | ) | | $ | (1,595,440 | ) | | $ | 41,381 | |
CDX.NA.HY.31 | | USD | | | 19,595,000 | | | | (5.00 | %) | | | 12/20/23 | | | | Quarterly | | | | 721,371 | | | | 406,610 | | | | (314,761 | ) |
ITRAXX.EUR.30 | | EUR | | | 22,730,000 | | | | (1.00 | %) | | | 12/20/23 | | | | Quarterly | | | | 416,649 | | | | 164,268 | | | | (252,381 | ) |
| | | | | | | | | | | | | | | | | | | | | | | | | | | | | | |
Total | | | | | | | | | | | $ | (498,801 | ) | | $ | (1,024,562 | ) | | $ | (525,761 | ) |
| | | | | | | | | | | | | | | | | | | | | | | | | | | | | | |
Credit default swaps on indices: | |
Sell protection: | |
CDX.NA.IG.S.31 | | USD | | | 27,700,000 | | | | 1.00 | % | | | 12/20/23 | | | | Quarterly | | | $ | 288,740 | | | $ | 161,873 | | | $ | (126,867 | ) |
| | | | | | | | | | | | | | | | | | | | | | | | | | | | | | |
Total | | | | | | | | | | | $ | (210,061 | ) | | $ | (862,689 | ) | | $ | (652,628 | ) |
| | | | | | | | | | | | | | | | | | | | | | | | | | | | | | |
| (a) | The maximum potential amount the Fund could be required to pay as a seller of credit protection or receive as a buyer of credit protection if a credit event occurs as defined under the terms of that particular swap agreement. |
The accompanying notes are an integral part of these financial statements.
|
| Hartford Total Return Bond HLS Fund |
Schedule of Investments – (continued)
December 31, 2018
| | | | | | | | | | | | | | | | | | | | | | | | | | | | | | |
| Centrally Cleared Interest Rate Swap Contracts Outstanding at December 31, 2018 | |
Payments made by Fund | | Payments
received by
Fund | | Notional
Amount | | | Expiration
Date | | | Periodic
Payment
Frequency | | Upfront
Premiums
Paid | | | Upfront
Premiums
Received | | | Value† | | | Unrealized
Appreciation/
(Depreciation) | |
12 Mo. Federal Funds Rate | | 1.62% Fixed | | USD | | | 13,700,000 | | | | 11/14/26 | | | Annual | | $ | — | | | $ | — | | | $ | 736,446 | | | $ | 736,446 | |
3 Mo. USD LIBOR | | 2.79% Fixed | | USD | | | 28,405,000 | | | | 09/30/25 | | | Semi-Annual | | | — | | | | — | | | | (312,508 | ) | | | (312,508 | ) |
3 Mo. USD LIBOR | | 2.83% Fixed | | USD | | | 16,422,000 | | | | 12/21/28 | | | Semi-Annual | | | — | | | | — | | | | (184,401 | ) | | | (184,401 | ) |
3 Mo. USD LIBOR | | 2.88% Fixed | | USD | | | 1,350,000 | | | | 12/31/48 | | | Semi-Annual | | | — | | | | — | | | | (13,173 | ) | | | (13,173 | ) |
3 Mo. USD LIBOR | | 2.00% Fixed | | USD | | | 17,550,000 | | | | 03/21/23 | | | Semi-Annual | | | 89,961 | | | | — | | | | 303,118 | | | | 213,157 | |
3 Mo. USD LIBOR | | 3.00% Fixed | | USD | | | 15,511,000 | | | | 04/30/25 | | | Semi-Annual | | | 78,631 | | | | — | | | | (446,644 | ) | | | (525,275 | ) |
3 Mo. USD LIBOR | | 3.00% Fixed | | USD | | | 13,187,000 | | | | 06/18/28 | | | Semi-Annual | | | — | | | | — | | | | (353,670 | ) | | | (353,670 | ) |
3 Mo. USD LIBOR | | 2.25% Fixed | | USD | | | 103,083,000 | | | | 06/20/28 | | | Semi-Annual | | | 5,304,218 | | | | — | | | | 3,897,308 | | | | (1,406,910 | ) |
3 Mo. USD LIBOR | | 2.75% Fixed | | USD | | | 22,395,000 | | | | 12/20/47 | | | Semi-Annual | | | — | | | | (485,534 | ) | | | 411,677 | | | | 897,211 | |
| | | | | | | | | | | | | | | | | | | | | | | | | | | | | | |
Total | | | | | | | | | $ | 5,472,810 | | | $ | (485,534 | ) | | $ | 4,038,153 | | | $ | (949,123 | ) |
| | | | | | | | | | | | | | | | | | | | | | | | | | | | | | |
| | | | | | | | | | | | | | | | | | | | | | | | | | | | |
| Foreign Currency Contracts Outstanding at December 31, 2018 | |
Amount and Description of
Currency to be Purchased | | | Amount and Description of
Currency to be Sold | | | Counterparty | | | Settlement
Date | | | Appreciation | | | Depreciation | |
| 60,490,000 | | | EGP | | | | 3,172,831 | | | | USD | | | | MSC | | | | 04/22/19 | | | $ | 85,898 | | | $ | — | |
| 13,909,188 | | | USD | | | | 12,074,000 | | | | EUR | | | | BOA | | | | 01/31/19 | | | | 38,460 | | | | — | |
| 231,071 | | | USD | | | | 201,000 | | | | EUR | | | | SSG | | | | 01/31/19 | | | | 161 | | | | — | |
| 4,702,467 | | | USD | | | | 4,114,000 | | | | EUR | | | | BOA | | | | 03/20/19 | | | | — | | | | (43,270 | ) |
| | | | | | | | | | | | | | | | | | | | | | | | | | | | |
Total | | | $ | 124,519 | | | $ | (43,270 | ) |
| | | | | | | | | |
† See Significant Accounting Policies of accompanying Notes to Financial Statements regarding valuation of investments.
| | |
| GLOSSARY: (abbreviations used in preceding Schedule of Investments) |
|
| Counterparty Abbreviations: |
BCLY | | Barclays |
BOA | | Banc of America Securities LLC |
CITI | | Citigroup Global Markets, Inc. |
CSI | | Credit Suisse International |
DEUT | | Deutsche Bank Securities, Inc. |
GSC | | Goldman Sachs & Co. |
JPM | | JP Morgan Chase & Co. |
MSC | | Morgan Stanley |
SSG | | State Street Global Markets LLC |
|
| Currency Abbreviations: |
ARS | | Argentine Peso |
EGP | | Egyptian Pound |
EUR | | Euro |
USD | | United States Dollar |
|
| Index Abbreviations: |
ABX.HE | | Markit Asset Backed Security Home Equity |
ABX.HE.PEN | | Markit Asset Backed Security Home Equity Penultimate |
CDX.EM | | Credit Derivatives Emerging Markets |
CDX.NA.HY | | Credit Derivatives North American High Yield |
| | |
| Index Abbreviations: – (continued) |
CDX.NA.IG | | Credit Derivatives North American Investment Grade |
CMBX.NA | | Markit Commercial Mortgage Backed North American |
CMT | | Constant Maturity Treasury Index |
ICE | | Intercontinental Exchange, Inc. |
ITRAXX.EUR | | Markit iTraxx - Europe |
MTA | | Monthly Treasury Average Index |
|
| Other Abbreviations: |
CLO | | Collateralized Loan Obligation |
CMO | | Collateralized Mortgage Obligation |
DDCA | | Dollars on Deposit in Custody Account |
EURIBOR | | Euro Interbank Offered Rate |
FHLMC | | Federal Home Loan Mortgage Corp. |
FNMA | | Federal National Mortgage Association |
GNMA | | Government National Mortgage Association |
LIBOR | | London Interbank Offered Rate |
OTC | | Over-the-Counter |
TBA | | To Be Announced |
|
| Municipal Abbreviations: |
Auth | | Authority |
GO | | General Obligation |
The accompanying notes are an integral part of these financial statements.
|
| Hartford Total Return Bond HLS Fund |
Schedule of Investments – (continued)
December 31, 2018
Fair Valuation Summary
The following is a summary of the fair valuations according to the inputs used as of December 31, 2018 in valuing the Fund’s investments.
| | | | | | | | | | | | | | | | |
Description | | Total | | | Level 1 | | | Level 2 | | | Level 3(1) | |
Assets | | | | | | | | | | | | | | | | |
Asset & Commercial Mortgage Backed Securities | | $ | 728,044,096 | | | $ | — | | | $ | 728,044,096 | | | $ | — | |
Corporate Bonds | | | 597,262,112 | | | | — | | | | 590,889,732 | | | | 6,372,380 | |
Foreign Government Obligations | | | 20,159,689 | | | | — | | | | 20,159,689 | | | | — | |
Municipal Bonds | | | 18,732,799 | | | | — | | | | 18,732,799 | | | | — | |
Senior Floating Rate Interests | | | 49,053,513 | | | | — | | | | 49,053,513 | | | | — | |
U.S. Government Agencies | | | 1,246,968,865 | | | | — | | | | 1,246,968,865 | | | | — | |
U.S. Government Securities | | | 175,520,555 | | | | — | | | | 175,520,555 | | | | — | |
Common Stocks | | | | | | | | | | | | | | | | |
Energy | | | 375,383 | | | | — | | | | 171,713 | | | | 203,670 | |
Preferred Stocks | | | 1,670,290 | | | | 1,670,290 | | | | — | | | | — | |
Warrants | | | 1,339 | | | | — | | | | — | | | | 1,339 | |
Escrows | | | 1 | | | | — | | | | — | | | | 1 | |
Short-Term Investments | | | 15,202,212 | | | | 15,202,212 | | | | — | | | | — | |
Purchased Options | | | 5,142,116 | | | | — | | | | 5,142,116 | | | | — | |
Foreign Currency Contracts(2) | | | 124,519 | | | | — | | | | 124,519 | | | | — | |
Futures Contracts(2) | | | 10,417,071 | | | | 10,417,071 | | | | — | | | | — | |
Swaps - Credit Default(2) | | | 616,982 | | | | — | | | | 616,982 | | | | — | |
Swaps - Interest Rate(2) | | | 1,846,814 | | | | — | | | | 1,846,814 | | | | — | |
| | | | | | | | | | | | | | | | |
Total | | $ | 2,871,138,356 | | | $ | 27,289,573 | | | $ | 2,837,271,393 | | | $ | 6,577,390 | |
| | | | | | | | | | | | | | | | |
Liabilities | | | | | | | | | | | | | | | | |
Foreign Currency Contracts(2) | | $ | (43,270 | ) | | $ | — | | | $ | (43,270 | ) | | $ | — | |
Futures Contracts(2) | | | (4,306,776 | ) | | | (4,306,776 | ) | | | — | | | | — | |
Swaps - Credit Default(2) | | | (4,858,513 | ) | | | — | | | | (4,858,513 | ) | | | — | |
Swaps - Interest Rate(2) | | | (2,795,937 | ) | | | — | | | | (2,795,937 | ) | | | — | |
TBA Sale Commitments | | | (225,144,949 | ) | | | — | | | | (225,144,949 | ) | | | — | |
Written Options | | | (902,699 | ) | | | (25,782 | ) | | | (876,917 | ) | | | — | |
| | | | | | | | | | | | | | | | |
Total | | $ | (238,052,144 | ) | | $ | (4,332,558 | ) | | $ | (233,719,586 | ) | | $ | — | |
| | | | | | | | | | | | | | | | |
| (1) | For the year ended December 31, 2018, there were no transfers in and out of Level 3. |
| (2) | Derivative instruments (excluding purchased and written options, if applicable) are valued at the unrealized appreciation/(depreciation) on the investments. |
Level 3 investments at the beginning and/or end of the period in relation to net assets were not significant and accordingly, a reconciliation of Level 3 assets for the year ended December 31, 2018 is not presented.
The accompanying notes are an integral part of these financial statements.
|
| Hartford Ultrashort Bond HLS Fund |
Schedule of Investments
December 31, 2018
| | | | | | | | | | |
| Shares or Principal Amount | | Market Value† | |
| ASSET & COMMERCIAL MORTGAGE BACKED SECURITIES - 31.6% | |
| | | | | | Asset-Backed - Automobile - 21.2% | |
| | | | | | Ally Auto Receivables Trust | |
| $ | | | 318,571 | | | 1.53%, 03/16/2020 | | $ | 318,294 | |
| | | 1,310,000 | | | 2.72%, 05/17/2021 | | | 1,307,893 | |
| | | | | | American Credit Acceptance Receivables Trust | |
| | | 283,887 | | | 2.72%, 03/10/2021(1) | | | 283,631 | |
| | | 823,578 | | | 2.92%, 08/12/2021(1) | | | 822,209 | |
| | | 1,297,675 | | | 2.94%, 01/10/2022(1) | | | 1,295,174 | |
| | | | | | AmeriCredit Automobile Receivables Trust | |
| | | 204,951 | | | 1.46%, 05/10/2021 | | | 204,097 | |
| | | 100,107 | | | 1.65%, 09/18/2020 | | | 99,998 | |
| | | 225,299 | | | 1.69%, 12/18/2020 | | | 224,524 | |
| | | 941,249 | | | 2.71%, 07/19/2021 | | | 939,608 | |
| | | 1,535,000 | | | 2.86%, 11/18/2021 | | | 1,531,992 | |
| | | 1,600,000 | | | 3.11%, 01/18/2022 | | | 1,601,333 | |
| | | | | | ARI Fleet Lease Trust | |
| | | 808,461 | | | 1.91%, 04/15/2026(1) | | | 802,623 | |
| | | 680,830 | | | 2.54%, 10/15/2019(1) | | | 680,154 | |
| | | 572,000 | | | 2.55%, 10/15/2026(1) | | | 569,287 | |
| | | 565,000 | | | BMW Floorplan Master Owner Trust 1 mo. USD LIBOR + 0.320%, 2.78%, 05/15/2023(1)(2) | | | 564,999 | |
| | | 2,500,000 | | | BMW Vehicle Lease Trust 2.97%, 12/21/2020 | | | 2,497,505 | |
| | | | | | Canadian Pacer Auto Receivables Trust | |
| | | 320,000 | | | 2.05%, 03/19/2021(1) | | | 317,744 | |
| | | 990,248 | | | 2.70%, 08/19/2020(1) | | | 989,038 | |
| | | 1,050,000 | | | 3.00%, 06/21/2021(1) | | | 1,050,568 | |
| | | | | | Capital Auto Receivables Asset Trust | |
| | | 335,000 | | | 2.02%, 08/20/2021(1) | | | 332,062 | |
| | | 1,795,000 | | | 3.02%, 02/22/2021(1) | | | 1,793,986 | |
| | | | | | CarMax Auto Owner Trust | |
| | | 1,545,452 | | | 1.40%, 08/15/2021 | | | 1,527,506 | |
| | | 834,925 | | | 1.56%, 11/16/2020 | | | 831,850 | |
| | | 1,440,211 | | | 2.23%, 05/17/2021 | | | 1,434,999 | |
| | | 2,190,000 | | | 2.88%, 10/15/2021 | | | 2,185,600 | |
| | | 2,345,000 | | | 3.11%, 02/15/2022 | | | 2,347,332 | |
| | | 980,000 | | | Chesapeake Funding II LLC 3.39%, 01/15/2031(1) | | | 979,814 | |
| | | | | | Chesapeake Funding LLC | |
| | | 889,578 | | | 1.91%, 08/15/2029(1) | | | 878,106 | |
| | | 1,235,164 | | | 2.12%, 11/15/2029(1) | | | 1,221,779 | |
| | | 1,500,000 | | | 1 mo. USD LIBOR + 0.370%, 2.83%, 08/15/2030(1)(2) | | | 1,496,040 | |
| | | 469,901 | | | 1 mo. USD LIBOR + 0.450%, 2.91%, 05/15/2029(1)(2) | | | 470,723 | |
| | | 902,362 | | | 3.04%, 04/15/2030(1) | | | 901,735 | |
| | | 381,130 | | | 1 mo. USD LIBOR + 1.150%, 3.61%, 03/15/2028(1)(2) | | | 381,846 | |
| | | | | | CPS Auto Receivables Trust | |
| | | 32,716 | | | 1.78%, 09/15/2020(1) | | | 32,667 | |
| | | 191,593 | | | 1.87%, 03/15/2021(1) | | | 190,964 | |
| | | 271,840 | | | 2.16%, 05/17/2021(1) | | | 270,694 | |
| | | 1,230,765 | | | 3.06%, 01/18/2022(1) | | | 1,229,568 | |
| | | 814,566 | | | CPS Auto Trust 2.87%, 09/15/2021(1) | | | 813,959 | |
| | | | | | Drive Auto Receivables Trust | |
| | | 344,469 | | | 2.75%, 10/15/2020 | | | 344,258 | |
| | | 560,000 | | | 3.01%, 11/15/2021 | | | 559,268 | |
| | | 725,000 | | | 3.04%, 11/15/2021 | | | 723,825 | |
| | | 2,500,000 | | | 3.34%, 10/15/2022 | | | 2,509,252 | |
| | | | | | DT Auto Owner Trust | |
| | | 475,647 | | | 2.84%, 09/15/2021(1) | | | 474,273 | |
| | | 1,919,146 | | | 3.02%, 02/15/2022(1) | | | 1,913,438 | |
| | | | | | Enterprise Fleet Financing LLC | |
| | | 781,256 | | | 1.74%, 02/22/2022(1) | | | 778,348 | |
| | | 574,263 | | | 1.97%, 01/20/2023(1) | | | 569,820 | |
| | | 804,996 | | | 2.13%, 05/22/2023(1) | | | 797,875 | |
| | | 1,465,000 | | | 3.14%, 02/20/2024(1) | | | 1,463,890 | |
| | | 540,000 | | | 3.38%, 05/20/2024(1) | | | 541,652 | |
| | | | | | | | | | |
| Shares or Principal Amount | | Market Value† | |
| ASSET & COMMERCIAL MORTGAGE BACKED SECURITIES - 31.6% - (continued) | |
| | | | | | Asset-Backed - Automobile - 21.2% - (continued) | |
| | | | | | Exeter Automobile Receivables Trust | |
| $ | | | 220,619 | | | 2.21%, 05/17/2021(1) | | $ | 220,260 | |
| | | 1,002,640 | | | 2.90%, 01/18/2022(1) | | | 1,001,299 | |
| | | 1,253,016 | | | 3.05%, 12/15/2021(1) | | | 1,250,650 | |
| | | 17,900 | | | Fifth Third Auto Trust 1.42%, 03/16/2020 | | | 17,889 | |
| | | | | | First Investors Auto Owner Trust | |
| | | 69,881 | | | 1.69%, 04/15/2021(1) | | | 69,759 | |
| | | 138,411 | | | 1.86%, 10/15/2021(1) | | | 137,750 | |
| | | 509,643 | | | 2.84%, 05/16/2022(1) | | | 508,661 | |
| | | 1,096,663 | | | 3.23%, 12/15/2022(1) | | | 1,097,898 | |
| | | | | | Flagship Credit Auto Trust | |
| | | 264,341 | | | 1.85%, 07/15/2021(1) | | | 263,106 | |
| | | 1,199,802 | | | 1.88%, 10/15/2021(1) | | | 1,192,057 | |
| | | 863,364 | | | 3.07%, 02/15/2023(1) | | | 862,973 | |
| | | 2,341,787 | | | 3.41%, 05/15/2023(1) | | | 2,344,512 | |
| | | | | | Ford Credit Auto Lease Trust | |
| | | 1,410,297 | | | 2.71%, 12/15/2020 | | | 1,407,522 | |
| | | 1,850,000 | | | 2.93%, 04/15/2021 | | | 1,847,917 | |
| | | | | | Ford Credit Auto Owner Trust | |
| | | 1,000,000 | | | 2.12%, 07/15/2026(1) | | | 989,769 | |
| | | 1,500,000 | | | 2.26%, 11/15/2025(1) | | | 1,495,386 | |
| | | | | | GM Financial Automobile Leasing Trust | |
| | | 131,495 | | | 1.61%, 12/20/2019 | | | 131,304 | |
| | | 464,771 | | | 2.39%, 04/20/2020 | | | 463,484 | |
| | | 2,392,514 | | | 2.83%, 07/20/2020 | | | 2,389,877 | |
| | | 965,000 | | | 2.89%, 09/21/2020 | | | 964,063 | |
| | | | | | GM Financial Consumer Automobile | |
| | | 14,681 | | | 1.51%, 03/16/2020(1) | | | 14,671 | |
| | | 17,128 | | | 1 mo. USD LIBOR + 0.120%, 2.58%, 03/16/2020(1)(2) | | | 17,128 | |
| | | | | | GM Financial Consumer Automobile Receivables Trust | |
| | | 419,369 | | | 1.71%, 09/16/2020(1) | | | 418,075 | |
| | | 1,780,004 | | | 2.08%, 01/19/2021 | | | 1,773,039 | |
| | | 2,500,000 | | | 2.74%, 07/16/2021 | | | 2,495,680 | |
| | | 1,650,000 | | | 2.93%, 11/16/2021 | | | 1,650,510 | |
| | | | | | Honda Auto Receivables Owner Trust | |
| | | 1,330,000 | | | 2.67%, 12/21/2020 | | | 1,326,710 | |
| | | 985,000 | | | 2.98%, 05/17/2021 | | | 984,177 | |
| | | | | | Hyundai Auto Lease Securitization Trust | |
| | | 2,549,614 | | | 1.88%, 08/17/2020(1) | | | 2,542,508 | |
| | | 2,500,000 | | | 2.81%, 12/15/2020(1) | | | 2,495,588 | |
| | | | | | Hyundai Auto Receivables Trust | |
| | | 83,050 | | | 1.48%, 02/18/2020 | | | 82,993 | |
| | | 472,788 | | | 2.55%, 04/15/2021 | | | 471,797 | |
| | | 1,200,000 | | | 2.55%, 11/15/2021 | | | 1,193,932 | |
| | | 121,621 | | | Mercedes-Benz Auto Lease Trust 1.53%, 08/15/2019 | | | 121,548 | |
| | | | | | Mercedes-Benz Auto Receivables Trust | |
| | | 562,820 | | | 1.26%, 02/16/2021 | | | 558,419 | |
| | | 1,550,000 | | | 2.71%, 04/15/2021 | | | 1,547,051 | |
| | | 2,600,000 | | | Nissan Auto Lease Trust 3.03%, 02/16/2021 | | | 2,598,527 | |
| | | 1,960,000 | | | OneMain Direct Auto Receivables Trust 2.31%, 12/14/2021(1) | | | 1,947,910 | |
| | | | | | Prestige Auto Receivables Trust | |
| | | 278,116 | | | 1.80%, 11/16/2020(1) | | | 277,746 | |
| | | 1,045,000 | | | 2.97%, 12/15/2021(1) | | | 1,042,044 | |
| | | | | | Santander Drive Auto Receivables Trust | |
| | | 257,875 | | | 1.87%, 12/15/2020 | | | 257,731 | |
| | | 2,075,000 | | | 2.97%, 07/15/2021 | | | 2,072,831 | |
| | | 755,000 | | | 3.03%, 02/15/2022 | | | 755,423 | |
| | | | | | Securitized Term Auto Receivables Trust | |
| | | 168,699 | | | 1.78%, 01/27/2020(1) | | | 168,308 | |
| | | 1,500,000 | | | 2.21%, 06/25/2021(1) | | | 1,489,590 | |
| | | 2,500,000 | | | 2.81%, 12/29/2020(1) | | | 2,497,215 | |
| | | 116,522 | | | Toyota Auto Receivables Owner Trust 1.30%, 04/15/2020 | | | 115,894 | |
The accompanying notes are an integral part of these financial statements.
|
| Hartford Ultrashort Bond HLS Fund |
Schedule of Investments – (continued)
December 31, 2018
| | | | | | | | | | |
| Shares or Principal Amount | | Market Value† | |
| ASSET & COMMERCIAL MORTGAGE BACKED SECURITIES - 31.6% - (continued) | |
| | | | | | Asset-Backed - Automobile - 21.2% - (continued) | |
| $ | | | 1,190,000 | | | Volkswagen Auto Loan Enhanced Trust 2.81%, 07/20/2021 | | $ | 1,188,395 | |
| | | | | | Westlake Automobile Receivables Trust | |
| | | 245,656 | | | 1.80%, 07/15/2020(1) | | | 245,111 | |
| | | 908,147 | | | 2.24%, 12/15/2020(1) | | | 905,630 | |
| | | 1,068,203 | | | 2.84%, 09/15/2021(1) | | | 1,066,643 | |
| | | | | | Wheels SPV LLC | |
| | | 59,683 | | | 1.59%, 05/20/2025(1) | | | 59,521 | |
| | | 356,657 | | | 1.88%, 04/20/2026(1) | | | 353,861 | |
| | | 480,000 | | | 3.06%, 04/20/2027(1) | | | 479,983 | |
| | | | | | World Omni Auto Receivables Trust | |
| | | 1,340,000 | | | 2.80%, 01/18/2022 | | | 1,337,388 | |
| | | 1,700,000 | | | 3.01%, 04/15/2022 | | | 1,699,381 | |
| | | | | | World Omni Automobile Lease Securitization Trust | |
| | | 201,401 | | | 1.68%, 12/16/2019 | | | 200,887 | |
| | | 1,575,241 | | | 2.59%, 11/16/2020 | | | 1,570,920 | |
| | | 1,420,000 | | | 2.96%, 06/15/2021 | | | 1,417,382 | |
| | | | | | | | | | |
| | | | | | | | | 106,196,083 | |
| | | | | | | | | | |
| | | | | | Asset-Backed - Credit Card - 3.4% | |
| | | 2,995,000 | | | BA Credit Card Trust 1 mo. USD LIBOR + 0.380%, 2.84%, 06/15/2021(2) | | | 2,995,223 | |
| | | | | | Barclays Dryrock Issuance Trust | |
| | | 1,750,000 | | | 2.41%, 07/15/2022 | | | 1,742,174 | |
| | | 915,000 | | | 1 mo. USD LIBOR + 0.330%, 2.79%, 03/15/2023(2) | | | 915,349 | |
| | | | | | Cabela’s Credit Card Master Note Trust | |
| | | 1,785,000 | | | 1.78%, 06/15/2022 | | | 1,774,644 | |
| | | 3,000,000 | | | 1 mo. USD LIBOR + 0.450%, 2.91%, 07/15/2022(2) | | | 3,001,463 | |
| | | 2,500,000 | | | Capital One Multi-Asset Execution Trust 1 mo. USD LIBOR + 0.450%, 2.91%, 02/15/2022(2) | | | 2,502,262 | |
| | | 1,815,000 | | | CARDS Trust 1 mo. USD LIBOR + 0.370%, 2.83%, 04/18/2022(1)(2) | | | 1,814,823 | |
| | | 2,250,000 | | | Chase Issuance Trust 1.27%, 07/15/2021 | | | 2,230,278 | |
| | | | | | | | | | |
| | | | | | | | | 16,976,216 | |
| | | | | | | | | | |
| | | | | | Asset-Backed - Finance & Insurance - 5.0% | |
| | | | | | CNH Equipment Trust | |
| | | 329,708 | | | 1.64%, 07/15/2020 | | | 329,376 | |
| | | 914,619 | | | 1.84%, 03/15/2021 | | | 910,530 | |
| | | 1,800,000 | | | 2.78%, 08/16/2021 | | | 1,796,455 | |
| | | 1,570,000 | | | 2.93%, 12/15/2021 | | | 1,567,787 | |
| | | 2,495,000 | | | DLL LLC 2.81%, 11/17/2020(1) | | | 2,491,920 | |
| | | 473,517 | | | DLL Securitization Trust 1.89%, 07/15/2020(1) | | | 471,841 | |
| | | 336,819 | | | Engs Commercial Finance Trust 2.97%, 02/22/2021(1) | | | 335,852 | |
| | | | | | GMF Floorplan Owner Revolving Trust | |
| | | 2,675,000 | | | 1 mo. USD LIBOR + 0.430%, 2.89%, 07/15/2022(1)(2) | | | 2,672,071 | |
| | | 1,440,000 | | | 1 mo. USD LIBOR + 0.570%, 3.03%, 01/18/2022(1)(2) | | | 1,444,658 | |
| | | 687,531 | | | GreatAmerica Leasing Receivables Funding LLC 2.35%, 05/15/2020(1) | | | 685,167 | |
| | | 124,544 | | | John Deere Owner Trust 1.59%, 04/15/2020 | | | 124,306 | |
| | | 1,310,000 | | | Kubota Credit Owner Trust 2.80%, 02/16/2021(1) | | | 1,307,041 | |
| | | | | | MMAF Equipment Finance LLC | |
| | | 123,129 | | | 1.73%, 05/18/2020(1) | | | 122,926 | |
| | | 1,016,743 | | | 1.93%, 10/15/2020(1) | | | 1,012,286 | |
| | | 1,354,145 | | | 2.92%, 07/12/2021(1) | | | 1,352,836 | |
| | | 221,750 | | | Nationstar HECM Loan Trust 2.76%, 02/25/2028(1)(3)(4)(5) | | | 221,750 | |
| | | | | | New York City Tax Lien | |
| | | 560,995 | | | 1.87%, 11/10/2030(1) | | | 555,134 | |
| | | 3,404,076 | | | 3.22%, 11/10/2031(1) | | | 3,409,144 | |
| | | | | | Verizon Owner Trust | |
| | | 1,108,994 | | | 1.42%, 01/20/2021(1) | | | 1,103,566 | |
| | | | | | | | | | |
| Shares or Principal Amount | | Market Value† | |
| ASSET & COMMERCIAL MORTGAGE BACKED SECURITIES - 31.6% - (continued) | |
| | | | | | Asset-Backed - Finance & Insurance - (continued) | |
| $ | | | 730,000 | | | 1.92%, 12/20/2021(1) | | $ | 722,527 | |
| | | 905,000 | | | 2.06%, 09/20/2021(1) | | | 898,251 | |
| | | 1,060,000 | | | 3.23%, 04/20/2023 | | | 1,066,500 | |
| | | 40,075 | | | Volvo Financial Equipment LLC 1.55%, 10/15/2019(1) | | | 40,049 | |
| | | 230,000 | | | Volvo Financial Equipment Master Owner Trust 1 mo. USD LIBOR + 0.500%, 2.96%, 11/15/2022(1)(2) | | | 230,487 | |
| | | | | | | | | | |
| | | | | | | | | 24,872,460 | |
| | | | | | | | | | |
| | | | | | Asset-Backed - Home Equity - 0.2% | |
| | | 1,261,423 | | | New Residential Mortgage Loan Trust 4.00%, 08/27/2057(1)(3) | | | 1,267,948 | |
| | | | | | | | | | |
| | | | | | Asset-Backed - Student Loan - 0.7% | |
| | | 28,493 | | | Navient Student Loan Trust 1 mo. USD LIBOR + 0.480%, 2.99%, 03/25/2066(1)(2) | | | 28,499 | |
| | | | | | SLM Student Loan Trust | |
| | | 627,548 | | | 3 mo. USD LIBOR + 0.090%, 2.58%, 10/25/2024(2) | | | 626,958 | |
| | | 701,908 | | | 3 mo. USD LIBOR + 0.120%, 2.61%, 01/25/2027(2) | | | 698,470 | |
| | | 641,815 | | | 1 mo. USD LIBOR + 0.520%, 3.03%, 03/25/2026(2) | | | 643,113 | |
| | | 1,278,406 | | | 1 mo. USD LIBOR + 0.600%, 3.11%, 11/25/2027(2) | | | 1,283,565 | |
| | | 334,945 | | | SoFi Professional Loan Program LLC 1 mo. USD LIBOR + 1.600%, 4.11%, 06/25/2025(1)(2) | | | 336,557 | |
| | | | | | | | | | |
| | | | | | | | | 3,617,162 | |
| | | | | | | | | | |
| | | | | | Commercial Mortgage - Backed Securities - 1.0% | |
| | | 1,365,000 | | | FREMF Mortgage Trust 1 mo. USD LIBOR + 0.320%, 2.82%, 02/25/2020(2) | | | 1,363,312 | |
| | | 800,000 | | | GS Mortgage Securities Corp. Trust 1 mo. USD LIBOR + 0.700%, 3.16%, 07/15/2032(1)(2) | | | 791,923 | |
| | | 500,000 | | | JP Morgan Chase Commercial Mortgage Securities Trust 5.63%, 12/05/2027(1) | | | 511,843 | |
| | | 1,384,613 | | | SG Residential Mortgage Trust 3.43%, 04/27/2048(1)(3) | | | 1,383,023 | |
| | | 980,533 | | | Verus Securitization Trust 3.68%, 06/01/2058(1)(3) | | | 978,901 | |
| | | | | | | | | | |
| | | | | | | | | 5,029,002 | |
| | | | | | | | | | |
| | | | | | Whole Loan Collateral CMO - 0.1% | |
| | | 200,122 | | | OBX Trust 1 mo. USD LIBOR + 0.650%, 3.16%, 06/25/2057(1)(2) | | | 198,392 | |
| | | 525,368 | | | Verus Securitization Trust 2.93%, 02/25/2048(1)(3) | | | 520,100 | |
| | | | | | | | | | |
| | | | | | | | | 718,492 | |
| | | | | | | | | | |
| | | |
| | | | | | Total Asset & Commercial Mortgage Backed Securities
(cost $159,034,375) | | $ | 158,677,363 | |
| | | | | | | | | | |
|
| CORPORATE BONDS - 38.5% | |
| | | | | | Aerospace/Defense - 0.3% | |
| | | 1,500,000 | | | United Technologies Corp. 3 mo. USD LIBOR + 0.650%, 3.28%, 08/16/2021(2) | | $ | 1,494,363 | |
| | | | | | | | | | |
| | | | | | Agriculture - 0.4% | |
| | | 1,750,000 | | | Philip Morris International, Inc. 3 mo. USD LIBOR + 0.420%, 3.07%, 02/21/2020(2) | | | 1,747,572 | |
| | | | | | | | | | |
| | | | | | Auto Manufacturers - 3.6% | |
| | | 2,000,000 | | | American Honda Finance Corp. 2.00%, 11/13/2019 | | | 1,984,339 | |
| | | | | | Daimler Finance North America LLC | |
| | | 1,750,000 | | | 1.50%, 07/05/2019(1) | | | 1,732,764 | |
| | | 715,000 | | | 3 mo. USD LIBOR + 0.390%, 2.97%, 05/04/2020(1)(2) | | | 711,015 | |
The accompanying notes are an integral part of these financial statements.
|
| Hartford Ultrashort Bond HLS Fund |
Schedule of Investments – (continued)
December 31, 2018 (Unaudited)
| | | | | | | | | | |
| Shares or Principal Amount | | Market Value† | |
|
| CORPORATE BONDS - 38.5% - (continued) | |
| | | | | | Auto Manufacturers - 3.6% - (continued) | |
| | | | | | Ford Motor Credit Co. LLC | |
| $ | | | 1,500,000 | | | 2.26%, 03/28/2019 | | $ | 1,495,697 | |
| | | 2,500,000 | | | 3 mo. USD LIBOR + 0.830%, 3.61%, 03/12/2019(2) | | | 2,498,190 | |
| | | 1,000,000 | | | General Motors Financial Co., Inc. 3 mo. USD LIBOR + 0.850%, 3.26%, 04/09/2021(2) | | | 977,240 | |
| | | 1,500,000 | | | Harley-Davidson Financial Services, Inc. 2.25%, 01/15/2019(1) | | | 1,499,404 | |
| | | 1,250,000 | | | Hyundai Capital America 3 mo. USD LIBOR + 0.940%, 3.35%, 07/08/2021(1)(2) | | | 1,246,351 | |
| | | 1,900,000 | | | Nissan Motor Acceptance Corp. 3 mo. USD LIBOR + 0.390%, 3.20%, 09/28/2020(1)(2) | | | 1,878,857 | |
| | | | | | Toyota Motor Credit Corp. | |
| | | 1,000,000 | | | 2.20%, 01/10/2020 | | | 990,938 | |
| | | 2,000,000 | | | 3 mo. USD LIBOR + 0.260%, 2.71%, 04/17/2020(2) | | | 1,993,238 | |
| | | 1,195,000 | | | Volkswagen Group of America Finance LLC 3.88%, 11/13/2020(1) | | | 1,200,830 | |
| | | | | | | | | | |
| | | | | | | | | 18,208,863 | |
| | | | | | | | | | |
| | | | | | Beverages - 1.2% | |
| | | 5,000,000 | | | Anheuser-Busch InBev Finance, Inc. 3 mo. USD LIBOR + 0.400%, 2.94%, 02/01/2019(2) | | | 4,999,256 | |
| | | 1,250,000 | | | PepsiCo, Inc. 3 mo. USD LIBOR + 0.040%, 2.60%, 05/02/2019(2) | | | 1,249,877 | |
| | | | | | | | | | |
| | | | | | | | | 6,249,133 | |
| | | | | | | | | | |
| | | | | | Biotechnology - 0.2% | |
| | | 1,205,000 | | | Gilead Sciences, Inc. 1.85%, 09/20/2019 | | | 1,194,226 | |
| | | | | | | | | | |
| | | | | | Chemicals - 0.7% | |
| | | 1,250,000 | | | Air Liquide Finance S.A. 1.38%, 09/27/2019(1) | | | 1,234,824 | |
| | | 640,000 | | | DowDuPont, Inc. 3.77%, 11/15/2020 | | | 646,136 | |
| | | 1,450,000 | | | EI du Pont de Nemours & Co. 3 mo. USD LIBOR + 0.530%, 3.07%, 05/01/2020(2) | | | 1,450,733 | |
| | | | | | | | | | |
| | | | | | | | | 3,331,693 | |
| | | | | | | | | | |
| | | | | | Commercial Banks - 18.0% | |
| | | | | | ABN Amro Bank N.V. | |
| | | 2,200,000 | | | 3 mo. USD LIBOR + 0.640%, 3.09%, 01/18/2019(1)(2) | | | 2,200,251 | |
| | | 1,000,000 | | | 3 mo. USD LIBOR + 0.570%, 3.26%, 08/27/2021(1)(2) | | | 994,270 | |
| | | | | | Bank of America Corp. | |
| | | 1,500,000 | | | 3 mo. USD LIBOR + 0.650%, 3.45%, 10/01/2021(2) | | | 1,488,976 | |
| | | 2,000,000 | | | 3 mo. USD LIBOR + 1.040%, 3.48%, 01/15/2019(2) | | | 2,000,443 | |
| | | 1,750,000 | | | Bank of Nova Scotia 1.65%, 06/14/2019 | | | 1,740,077 | |
| | | | | | BB&T Corp. | |
| | | 2,500,000 | | | 3 mo. USD LIBOR + 0.660%, 3.20%, 02/01/2019(2) | | | 2,500,000 | |
| | | 1,500,000 | | | 3 mo. USD LIBOR + 0.570%, 3.36%, 06/15/2020(2) | | | 1,501,776 | |
| | | 1,750,000 | | | Canadian Imperial Bank of Commerce 3 mo. USD LIBOR + 0.315%, 2.87%, 02/02/2021(2) | | | 1,732,070 | |
| | | | | | Capital One Financial Corp. | |
| | | 1,250,000 | | | 3 mo. USD LIBOR + 0.760%, 3.38%, 05/12/2020(2) | | | 1,250,000 | |
| | | 1,500,000 | | | 3 mo. USD LIBOR + 0.950%, 3.72%, 03/09/2022(2) | | | 1,475,762 | |
| | | 4,000,000 | | | Citigroup, Inc. 3 mo. USD LIBOR + 0.770%, 3.18%, 04/08/2019(2) | | | 4,003,406 | |
| | | 1,500,000 | | | Citizens Bank NA 3 mo. USD LIBOR + 0.540%, 3.28%, 03/02/2020(2) | | | 1,497,791 | |
| | | 2,070,000 | | | Commonwealth Bank of Australia 3 mo. USD LIBOR + 0.640%, 3.23%, 11/07/2019(1)(2) | | | 2,074,361 | |
| | | | | | | | | | |
| Shares or Principal Amount | | Market Value† | |
|
| CORPORATE BONDS - 38.5% - (continued) | |
| | | | | | Commercial Banks - 18.0% - (continued) | |
| $ | | | 2,500,000 | | | Credit Agricole S.A. 3 mo. USD LIBOR + 0.970%, 3.74%, 06/10/2020(1)(2) | | $ | 2,512,825 | |
| | | | | | Danske Bank A/S | |
| | | 1,500,000 | | | 3 mo. USD LIBOR + 0.510%, 3.25%, 03/02/2020(1)(2) | | | 1,496,956 | |
| | | 2,000,000 | | | 3 mo. USD LIBOR + 0.580%, 3.32%, 09/06/2019(1)(2) | | | 1,998,649 | |
| | | 1,500,000 | | | Deutsche Bank AG 3 mo. USD LIBOR + 0.970%, 3.41%, 07/13/2020(2) | | | 1,460,533 | |
| | | 1,500,000 | | | DNB Bank ASA 3 mo. USD LIBOR + 0.370%, 3.17%, 10/02/2020(1)(2) | | | 1,490,346 | |
| | | | | | Fifth Third Bank | |
| | | 500,000 | | | 2.20%, 10/30/2020 | | | 490,181 | |
| | | 1,000,000 | | | 3 mo. USD LIBOR + 0.250%, 2.77%, 10/30/2020(2) | | | 992,789 | |
| | | 2,350,000 | | | 3 mo. USD LIBOR + 0.590%, 3.41%, 09/27/2019(2) | | | 2,353,181 | |
| | | | | | Goldman Sachs Group, Inc. | |
| | | 2,000,000 | | | 3 mo. USD LIBOR + 1.160%, 3.64%, 04/23/2020(2) | | | 2,006,914 | |
| | | 3,500,000 | | | 3 mo. USD LIBOR + 1.170%, 3.79%, 11/15/2021(2) | | | 3,491,847 | |
| | | | | | HSBC Holdings plc | |
| | | 1,785,000 | | | 3 mo. USD LIBOR + 0.600%, 3.24%, 05/18/2021(2) | | | 1,758,511 | |
| | | 750,000 | | | 3 mo. USD LIBOR + 0.650%, 3.43%, 09/11/2021(2) | | | 740,084 | |
| | | 1,500,000 | | | Huntington National Bank 3 mo. USD LIBOR + 0.510%, 3.28%, 03/10/2020(2) | | | 1,499,671 | |
| | | 1,000,000 | | | ING Bank N.V. 1.65%, 08/15/2019(1) | | | 990,515 | |
| | | | | | JP Morgan Chase & Co. | |
| | | 3,000,000 | | | 3 mo. USD LIBOR + 0.630%, 3.14%, 01/28/2019(2) | | | 3,000,475 | |
| | | 1,500,000 | | | 3 mo. USD LIBOR + 0.680%, 3.42%, 06/01/2021(2) | | | 1,490,880 | |
| | | 1,000,000 | | | KeyBank NA 1.60%, 08/22/2019 | | | 991,100 | |
| | | 1,250,000 | | | Manufacturers & Traders Trust Co. 3 mo. USD LIBOR + 0.270%, 2.76%, 01/25/2021(2) | | | 1,242,449 | |
| | | | | | Morgan Stanley | |
| | | 3,000,000 | | | 3 mo. USD LIBOR + 0.850%, 3.34%, 01/24/2019(2) | | | 3,000,815 | |
| | | 1,500,000 | | | 5.63%, 09/23/2019 | | | 1,522,198 | |
| | | | | | PNC Bank NA | |
| | | 2,000,000 | | | 1.45%, 07/29/2019 | | | 1,982,808 | |
| | | 750,000 | | | 2.50%, 01/22/2021 | | | 740,056 | |
| | | | | | Regions Bank | |
| | | 1,000,000 | | | 3 mo. USD LIBOR + 0.500%, 3.12%, 08/13/2021(2) | | | 982,020 | |
| | | 1,500,000 | | | 3 mo. USD LIBOR + 0.380%, 3.18%, 04/01/2021(2) | | | 1,471,696 | |
| | | 3,000,000 | | | Royal Bank of Canada 3 mo. USD LIBOR + 0.450%, 2.86%, 01/10/2019(2) | | | 3,000,168 | |
| | | | | | Santander UK plc | |
| | | 750,000 | | | 2.13%, 11/03/2020 | | | 732,510 | |
| | | 1,500,000 | | | 3 mo. USD LIBOR + 0.620%, 3.36%, 06/01/2021(2) | | | 1,483,443 | |
| | | | | | Sumitomo Mitsui Banking Corp. | |
| | | 1,000,000 | | | 2.51%, 01/17/2020 | | | 992,642 | |
| | | 1,000,000 | | | 3 mo. USD LIBOR + 0.350%, 2.80%, 01/17/2020(2) | | | 999,121 | |
| | | | | | SunTrust Bank | |
| | | 1,000,000 | | | 3 mo. USD LIBOR + 0.298%, 2.59%, 01/29/2021(2) | | | 990,264 | |
| | | 3,000,000 | | | 3 mo. USD LIBOR + 0.530%, 3.06%, 01/31/2020(2) | | | 2,997,106 | |
The accompanying notes are an integral part of these financial statements.
|
| Hartford Ultrashort Bond HLS Fund |
Schedule of Investments – (continued)
December 31, 2018 (Unaudited)
| | | | | | | | | | |
| Shares or Principal Amount | | Market Value† | |
|
| CORPORATE BONDS - 38.5% - (continued) | |
| | | | | | Commercial Banks - 18.0% - (continued) | |
| | | | | | Svenska Handelsbanken AB | |
| $ | | | 1,250,000 | | | 3 mo. USD LIBOR + 0.360%, 3.13%, 09/08/2020(2) | | $ | 1,249,129 | |
| | | 1,250,000 | | | 3 mo. USD LIBOR + 0.470%, 3.16%, 05/24/2021(2) | | | 1,238,685 | |
| | | 1,665,000 | | | 3 mo. USD LIBOR + 0.490%, 3.23%, 09/06/2019(2) | | | 1,666,122 | |
| | | 2,250,000 | | | Toronto-Dominion Bank 1.45%, 08/13/2019 | | | 2,229,922 | |
| | | | | | U.S. Bank NA | |
| | | 1,000,000 | | | 2.05%, 10/23/2020 | | | 982,661 | |
| | | 1,250,000 | | | 3 mo. USD LIBOR + 0.320%, 2.81%, 01/24/2020(2) | | | 1,249,004 | |
| | | 1,775,000 | | | 3 mo. USD LIBOR + 0.290%, 2.94%, 05/21/2021(2) | | | 1,768,516 | |
| | | | | | UBS AG | |
| | | 715,000 | | | 2.45%, 12/01/2020(1) | | | 701,639 | |
| | | 800,000 | | | 3 mo. USD LIBOR + 0.580%, 3.35%, 06/08/2020(1)(2) | | | 799,562 | |
| | | | | | Wells Fargo Bank NA | |
| | | 1,025,000 | | | 2.60%, 01/15/2021 | | | 1,012,269 | |
| | | 2,000,000 | | | 3 mo. USD LIBOR + 0.650%, 3.39%, 12/06/2019(2) | | | 2,004,874 | |
| | | | | | | | | | |
| | | | | | | | | 90,264,319 | |
| | | | | | | | | | |
| | | | | | Commercial Services - 0.2% | |
| | | 915,000 | | | Equifax, Inc. 3 mo. USD LIBOR + 0.870%, 3.49%, 08/15/2021(2) | | | 904,590 | |
| | | | | | | | | | |
| | | | | | Diversified Financial Services - 2.1% | |
| | | 1,250,000 | | | AIG Global Funding 3 mo. USD LIBOR + 0.460%, 3.28%, 06/25/2021(1)(2) | | | 1,240,500 | |
| | | 1,000,000 | | | American Express Co. 3 mo. USD LIBOR + 0.525%, 3.17%, 05/17/2021(2) | | | 995,499 | |
| | | | | | American Express Credit Corp. | |
| | | 1,000,000 | | | 3 mo. USD LIBOR + 0.330%, 2.91%, 05/03/2019(2) | | | 999,959 | |
| | | 2,500,000 | | | 3 mo. USD LIBOR + 0.550%, 3.35%, 03/18/2019(2) | | | 2,501,407 | |
| | | 1,395,000 | | | Private Export Funding Corp. 2.10%, 12/19/2019(1) | | | 1,385,308 | |
| | | 1,465,000 | | | Protective Life Global Funding 1.72%, 04/15/2019(1) | | | 1,459,133 | |
| | | 1,700,000 | | | Synchrony Financial 3 mo. USD LIBOR + 1.230%, 3.81%, 02/03/2020(2) | | | 1,698,714 | |
| | | | | | | | | | |
| | | | | | | | | 10,280,520 | |
| | | | | | | | | | |
| | | | | | Electric - 0.7% | |
| | | 1,250,000 | | | American Electric Power Co., Inc. 2.15%, 11/13/2020 | | | 1,225,068 | |
| | | 1,000,000 | | | Duke Energy Florida LLC 2.10%, 12/15/2019 | | | 991,909 | |
| | | 1,500,000 | | | NextEra Energy Capital Holdings, Inc. 3.34%, 09/01/2020 | | | 1,502,976 | |
| | | | | | | | | | |
| | | | | | | | | 3,719,953 | |
| | | | | | | | | | |
| | | | | | Electronics - 0.6% | |
| | | | | | Honeywell International, Inc. | |
| | | 1,000,000 | | | 1.80%, 10/30/2019 | | | 990,201 | |
| | | 2,000,000 | | | 3 mo. USD LIBOR + 0.280%, 2.80%, 10/30/2019(2) | | | 1,999,695 | |
| | | | | | | | | | |
| | | | | | | | | 2,989,896 | |
| | | | | | | | | | |
| | | | | | Food - 0.8% | |
| | | 1,250,000 | | | Conagra Brands, Inc. 3 mo. USD LIBOR + 0.750%, 3.22%, 10/22/2020(2) | | | 1,246,488 | |
| | | 1,500,000 | | | JM Smucker Co. 2.20%, 12/06/2019 | | | 1,486,802 | |
| | | 1,500,000 | | | Kraft Heinz Foods Co. 3 mo. USD LIBOR + 0.570%, 3.19%, 02/10/2021(2) | | | 1,487,542 | |
| | | | | | | | | | |
| | | | | | | | | 4,220,832 | |
| | | | | | | | | | |
| | | | | | | | | | |
| Shares or Principal Amount | | Market Value† | |
|
| CORPORATE BONDS - 38.5% - (continued) | |
| | | | | | Healthcare - Services - 1.1% | |
| $ | | | 2,000,000 | | | Cigna Corp. 3.20%, 09/17/2020(1) | | $ | 1,991,780 | |
| | | 2,500,000 | | | Roche Holdings, Inc. 3 mo. USD LIBOR + 0.340%, 3.14%, 09/30/2019(1)(2) | | | 2,501,364 | |
| | | 1,000,000 | | | UnitedHealth Group, Inc. 1.95%, 10/15/2020 | | | 982,547 | |
| | | | | | | | | | |
| | | | | | | | | 5,475,691 | |
| | | | | | | | | | |
| | | | | | Insurance - 1.7% | |
| | | 440,000 | | | Allstate Corp. 3 mo. USD LIBOR + 0.430%, 3.23%, 03/29/2021(2) | | | 435,229 | |
| | | | | | MassMutual Global Funding II | |
| | | 1,500,000 | | | 1.55%, 10/11/2019(1) | | | 1,481,501 | |
| | | 704,000 | | | 1.95%, 09/22/2020(1) | | | 689,949 | |
| | | | | | Metropolitan Life Global Funding I | |
| | | 795,000 | | | 2.40%, 01/08/2021(1) | | | 782,894 | |
| | | 2,000,000 | | | USD SOFR + 0.570%, 3.03%, 09/07/2020(1)(2) | | | 1,986,841 | |
| | | 2,000,000 | | | New York Life Global Funding 3 mo. USD LIBOR + 0.270%, 2.68%, 04/09/2020(1)(2) | | | 1,995,242 | |
| | | 1,000,000 | | | Protective Life Global Funding 3 mo. USD LIBOR + 0.520%, 3.33%, 06/28/2021(1)(2) | | | 992,110 | |
| | | | | | | | | | |
| | | | | | | | | 8,363,766 | |
| | | | | | | | | | |
| | | | | | Iron/Steel - 0.3% | |
| | | 1,500,000 | | | Glencore Funding LLC 2.50%, 01/15/2019(1) | | | 1,499,370 | |
| | | | | | | | | | |
| | | | | | IT Services - 1.2% | |
| | | 1,425,000 | | | Apple, Inc. 3 mo. USD LIBOR + 0.070%, 2.69%, 05/11/2020(2) | | | 1,421,638 | |
| | | | | | Hewlett Packard Enterprise Co. | |
| | | 2,000,000 | | | 2.10%, 10/04/2019(1) | | | 1,977,464 | |
| | | 1,000,000 | | | 3 mo. USD LIBOR + 0.720%, 3.06%, 10/05/2021(2) | | | 991,298 | |
| | | 1,500,000 | | | IBM Credit LLC 3.45%, 11/30/2020 | | | 1,507,755 | |
| | | | | | | | | | |
| | | | | | | | | 5,898,155 | |
| | | | | | | | | | |
| | | | | | Machinery - Construction & Mining - 0.5% | |
| | | | | | Caterpillar Financial Services Corp. | |
| | | 1,000,000 | | | 2.00%, 11/29/2019 | | | 992,804 | |
| | | 1,750,000 | | | 3 mo. USD LIBOR + 0.280%, 3.10%, 03/22/2019(2) | | | 1,750,073 | |
| | | | | | | | | | |
| | | | | | | | | 2,742,877 | |
| | | | | | | | | | |
| | | | | | Machinery - Diversified - 0.6% | |
| | | | | | John Deere Capital Corp. | |
| | | 2,000,000 | | | 3 mo. USD LIBOR + 0.300%, 3.08%, 03/13/2020(2) | | | 1,997,588 | |
| | | 1,125,000 | | | 3 mo. USD LIBOR + 0.290%, 3.11%, 06/22/2020(2) | | | 1,125,345 | |
| | | | | | | | | | |
| | | | | | | | | 3,122,933 | |
| | | | | | | | | | |
| | | | | | Media - 1.0% | |
| | | 2,500,000 | | | Comcast Corp. 3.30%, 10/01/2020 | | | 2,509,562 | |
| | | 1,125,000 | | | NBCUniversal Enterprise, Inc. 3 mo. USD LIBOR + 0.400%, 3.20%, 04/01/2021(1)(2) | | | 1,113,989 | |
| | | 1,315,000 | | | Walt Disney Co. 0.88%, 07/12/2019 | | | 1,300,628 | |
| | | | | | | | | | |
| | | | | | | | | 4,924,179 | |
| | | | | | | | | | |
| | | | | | Miscellaneous Manufacturing - 0.6% | |
| | | | | | Siemens Financieringsmaatschappij N.V. | |
| | | 1,700,000 | | | 3 mo. USD LIBOR + 0.320%, 3.10%, 09/13/2019(1)(2) | | | 1,700,413 | |
| | | 1,500,000 | | | 3 mo. USD LIBOR + 0.340%, 3.13%, 03/16/2020(1)(2) | | | 1,499,628 | |
| | | | | | | | | | |
| | | | | | | | | 3,200,041 | |
| | | | | | | | | | |
| | | | | | Oil & Gas - 0.5% | |
| | | 980,000 | | | BP Capital Markets plc 1.77%, 09/19/2019 | | | 971,262 | |
| | | 1,660,000 | | | Phillips 66 3 mo. USD LIBOR + 0.750%, 3.19%, 04/15/2020(1)(2) | | | 1,660,286 | |
| | | | | | | | | | |
| | | | | | | | | 2,631,548 | |
| | | | | | | | | | |
The accompanying notes are an integral part of these financial statements.
|
| Hartford Ultrashort Bond HLS Fund |
Schedule of Investments – (continued)
December 31, 2018 (Unaudited)
| | | | | | | | | | |
| Shares or Principal Amount | | Market Value† | |
|
| CORPORATE BONDS - 38.5% - (continued) | |
| | | | | | Oil & Gas Services - 0.2% | |
| $ | | | 1,250,000 | | | Schlumberger Finance Canada Ltd. 2.20%, 11/20/2020(1) | | $ | 1,221,541 | |
| | | | | | | | | | |
| | | | | | Pharmaceuticals - 0.8% | |
| | | | | | Bayer U.S. Finance LLC | |
| | | 900,000 | | | 2.13%, 07/15/2019(1) | | | 892,936 | |
| | | 1,500,000 | | | 3 mo. USD LIBOR + 0.630%, 3.45%, 06/25/2021(1)(2) | | | 1,480,019 | |
| | | 700,000 | | | CVS Health Corp. 3 mo. USD LIBOR + 0.720%, 3.49%, 03/09/2021(2) | | | 694,357 | |
| | | 795,000 | | | Takeda Pharmaceutical Co., Ltd. 3.80%, 11/26/2020(1) | | | 799,796 | |
| | | | | | | | | | |
| | | | | | | | | 3,867,108 | |
| | | | | | | | | | |
| | | | | | Retail - 0.9% | |
| | | 2,000,000 | | | Alimentation Couche-Tard, Inc. 2.35%, 12/13/2019(1) | | | 1,981,344 | |
| | | 1,100,000 | | | Dollar Tree, Inc. 3 mo. USD LIBOR + 0.700%, 3.15%, 04/17/2020(2) | | | 1,092,984 | |
| | | 1,500,000 | | | Home Depot, Inc. 3 mo. USD LIBOR + 0.150%, 2.90%, 06/05/2020(2) | | | 1,494,573 | |
| | | | | | | | | | |
| | | | | | | | | 4,568,901 | |
| | | | | | | | | | |
| | | | | | Trucking & Leasing - 0.3% | |
| | | 1,375,000 | | | Aviation Capital Group LLC 3 mo. USD LIBOR + 0.670%, 3.19%,
07/30/2021(1)(2) | | | 1,364,283 | |
| | | | | | | | | | |
| | | |
| | | | | | Total Corporate Bonds
(cost $194,336,087) | | $ | 193,486,353 | |
| | | | | | | | | | |
|
| MUNICIPAL BONDS - 0.3% | |
| | | | | | Transportation - 0.3% | |
| | | 1,490,000 | | | New York & New Jersey PA 2.29%, 09/15/2019 | | $ | 1,485,306 | |
| | | | | | | | | | |
| | | |
| | | | | | Total Municipal Bonds
(cost $1,490,000) | | $ | 1,485,306 | |
| | | | | | | | | | |
|
| U.S. GOVERNMENT AGENCIES - 4.6% | |
| | | | | | Mortgage-Backed Agencies - 4.6% | |
| | | | | | FHLB - 4.0% | |
| | | 5,100,000 | | | 1.25%, 01/16/2019 | | $ | 5,097,440 | |
| | | 15,000,000 | | | 1.38%, 05/28/2019 | | | 14,926,860 | |
| | | | | | | | | | |
| | | | | | | | | 20,024,300 | |
| | | | | | | | | | |
| | | | | | FHLMC - 0.6% | | | |
| | | 3,006,996 | | | 3.00%, 05/15/2037 | | $ | 3,011,423 | |
| | | | | | | | | | |
| | | | | | | | | 3,011,423 | |
| | | | | | | | | | |
| | | | | | | | | 23,035,723 | |
| | | | | | | | | | |
| | | | | | Total U.S. Government Agencies
(cost $23,091,886) | | $ | 23,035,723 | |
| | | | | | | | | | |
|
| U.S. GOVERNMENT SECURITIES - 18.9% | |
| | | | | | U.S. Treasury Securities - 18.9% | |
| | | | | | U.S. Treasury Notes - 18.9% | |
| | | 7,500,000 | | | 0.88%, 04/15/2019(6) | | $ | 7,467,043 | |
| | | 11,250,000 | | | 1.00%, 03/15/2019 | | | 11,218,439 | |
| | | 5,000,000 | | | 1.00%, 11/15/2019 | | | 4,929,688 | |
| | | 15,000,000 | | | 1.13%, 01/31/2019 | | | 14,985,652 | |
| | | 10,000,000 | | | 1.25%, 06/30/2019 | | | 9,937,500 | |
| | | 6,250,000 | | | 1.38%, 04/30/2020 | | | 6,153,809 | |
| | | 6,000,000 | | | 1.50%, 05/31/2019 | | | 5,975,625 | |
| | | 10,000,000 | | | 1.50%, 05/15/2020 | | | 9,857,812 | |
| | | 10,000,000 | | | 1.63%, 06/30/2020 | | | 9,864,844 | |
| | | | | | | | | | |
| Shares or Principal Amount | | Market Value† | |
|
| U.S. GOVERNMENT SECURITIES - 18.9% - (continued) | |
| | | | | | U.S. Treasury Securities - 18.9% - (continued) | |
| | | | | | U.S. Treasury Notes - 18.9% - (continued) | |
| $ | | | 7,500,000 | | | 1.88%, 12/31/2019 | | $ | 7,445,508 | |
| | | 7,000,000 | | | 2.38%, 04/30/2020 | | | 6,981,406 | |
| | | | | | | | | | |
| | | | | | | | | 94,817,326 | |
| | | | | | | | | | |
| | | | | | | | | 94,817,326 | |
| | | | | | | | | | |
| | | |
| | | | | | Total U.S. Government Securities
(cost $94,796,359) | | $ | 94,817,326 | |
| | | | | | | | | | |
| | | |
| | | | | | Total Long-Term Investments
(cost $472,748,707) | | $ | 471,502,071 | |
| | | | | | | | | | |
|
| SHORT-TERM INVESTMENTS - 7.4% | |
| | | | | | Commercial Paper - 0.4% | |
| | | 2,000,000 | | | Bank of Montreal 3 mo. USD LIBOR + 0.260%, 2.84%, 11/04/2019(2)(7) | | $ | 2,000,816 | |
| | | | | | | | | | |
| | | | | | Other Investment Pools & Funds - 0.6% | |
| | | 2,757,978 | | | Fidelity Investments Money Market Funds, Government Portfolio, Institutional Class, 2.35%(8) | | | 2,757,978 | |
| | | | | | | | | | |
| | | | | | Securities Lending Collateral - 1.5% | |
| | | 381,563 | | | Citibank NA DDCA, 2.39%, 1/2/2019(8) | | | 381,563 | |
| | | 5,042,238 | | | Fidelity Investments Money Market Funds, Government Portfolio, Institutional Class, 2.35%(8) | | | 5,042,238 | |
| | | 361,670 | | | Goldman Sachs Financial Square Funds, Government Fund, Institutional Class, 2.30%(8) | | | 361,670 | |
| | | 263,732 | | | Invesco Government & Agency Portfolio, Institutional Class, 2.30%(8) | | | 263,732 | |
| | | 1,468,102 | | | Morgan Stanley Institutional Liquidity Funds, Government Portfolio, Institutional Class, 2.50%(8) | | | 1,468,102 | |
| | | 113,965 | | | Western Asset Institutional Government Reserves Fund, Institutional Class,
2.28%(8) | | | 113,965 | |
| | | | | | | | | | |
| | | | | | | | | 7,631,270 | |
| | | | | | | | | | |
| | | | | | U.S. Treasury Bills - 4.9% | | | |
| | | 15,000,000 | | | 2.43%, 08/15/2019(7) | | $ | 14,764,102 | |
| | | 10,000,000 | | | 2.55%, 09/12/2019(7) | | | 9,823,339 | |
| | | | | | | | | | |
| | | | | | | | | 24,587,441 | |
| | | | | | | | | | |
| | | |
| | | | | | Total Short-Term Investments
(cost $36,990,495) | | $ | 36,977,505 | |
| | | | | | | | | | |
| | | | | | | | | | | | | | |
| | | | |
| | | | | | Total Investments
(cost $509,739,202) | | | 101.3 | % | | $ | 508,479,576 | |
| | | | | | Other Assets and Liabilities | | | (1.3 | )% | | | (6,460,468 | ) |
| | | | | | | | | | | | | | |
| | | | | | Total Net Assets | | | 100.0 | % | | $ | 502,019,108 | |
| | | | | | | | | | | | | | |
| Note: | Percentage of investments as shown is the ratio of the total market value to total net assets. |
| | The Fund may refer to any one or more of the industry classifications used by one or more widely recognized market indices, ratings group and/or as defined by Fund management. Industry classifications may not be identical across all security types. |
| | For Fund compliance purposes, the Fund may not use the same classification system. These classifications are used for financial reporting purposes. |
| (1) | Security was purchased pursuant to Rule 144A under the Securities Act of 1933 and may be sold in transactions that are exempt from registration (typically only to qualified institutional buyers) or in a public offering registered under the Securities Act of 1933. At December 31, 2018, the aggregate value of these securities was $137,734,903, representing 27.4% of net assets. |
The accompanying notes are an integral part of these financial statements.
|
| Hartford Ultrashort Bond HLS Fund |
Schedule of Investments – (continued)
December 31, 2018 (Unaudited)
| (2) | Variable rate securities; the rate reported is the coupon rate in effect at December 31, 2018. |
| (3) | Variable or floating rate security, which interest rate adjusts periodically based on changes in current interest rates and prepayments on the underlying pool of assets. Rate shown is the rate in effect as of period end. |
| (4) | This security is valued in good faith at fair value as determined under policies and procedures established by and under the supervision of the Board of Directors. At December 31, 2018, the aggregate fair value of this security was $221,750, which represented 0.0% of total net assets. This amount excludes securities that are principally traded in certain foreign markets and whose prices are adjusted pursuant to a third party pricing service methodology approved by the Board of Directors. |
| (5) | Investment valued using significant unobservable inputs. |
| (6) | Represents entire or partial securities on loan. See Note 8 in the accompanying Notes to Financial Statements for securities lending information. |
| (7) | The rate shown represents current yield to maturity. |
| (8) | Current yield as of period end. |
| † | See Significant Accounting Policies of accompanying Notes to Financial Statements regarding valuation of investments. |
| | |
| GLOSSARY: (abbreviations used in preceding Schedule of Investments) |
|
| Other Abbreviations: |
CMO | | Collateralized Mortgage Obligation |
DDCA | | Dollars on Deposit in Custody Account |
FHLB | | Federal Home Loan Bank |
FHLMC | | Federal Home Loan Mortgage Corp. |
LIBOR | | London Interbank Offered Rate |
|
| Municipal Abbreviations: |
PA | | Port Authority |
Fair Valuation Summary
The following is a summary of the fair valuations according to the inputs used as of December 31, 2018 in valuing the Fund’s investments.
| | | | | | | | | | | | | | | | |
Description | | Total | | | Level 1 | | | Level 2 | | | Level 3 (1) | |
Assets | |
Asset & Commercial Mortgage Backed Securities | | $ | 158,677,363 | | | $ | — | | | $ | 158,455,613 | | | $ | 221,750 | |
Corporate Bonds | | | 193,486,353 | | | | — | | | | 193,486,353 | | | | — | |
Municipal Bonds | | | 1,485,306 | | | | — | | | | 1,485,306 | | | | — | |
U.S. Government Agencies | | | 23,035,723 | | | | — | | | | 23,035,723 | | | | — | |
U.S. Government Securities | | | 94,817,326 | | | | — | | | | 94,817,326 | | | | — | |
Short-Term Investments | | | 36,977,505 | | | | 10,389,248 | | | | 26,588,257 | | | | — | |
| | | | | | | | | | | | | | | | |
Total | | $ | 508,479,576 | | | $ | 10,389,248 | | | $ | 497,868,578 | | | $ | 221,750 | |
| | | | | | | | | | | | | | | | |
| (1) | For the year ended December 31, 2018, there were no transfers in and out of Level 3. |
Level 3 investments at the beginning and/or end of the period in relation to net assets were not significant and accordingly, a reconciliation of Level 3 assets for the year ended December 31, 2018 is not presented.
The accompanying notes are an integral part of these financial statements.
|
| Hartford U.S. Government Securities HLS Fund |
Schedule of Investments
December 31, 2018
| | | | | | | | | | |
| Shares or Principal Amount | | Market Value† | |
| ASSET & COMMERCIAL MORTGAGE BACKEDSECURITIES -15.2% | |
| | | | | | Asset-Backed - Automobile - 0.9% | |
| $ | | | 350,000 | | | Avis Budget Rental Car Funding AESOP LLC 2.99%, 06/20/2022(1) | | $ | 347,869 | |
| | | 2,907,000 | | | Capital Auto Receivables Asset Trust 3.62%, 05/20/2021 | | | 2,915,010 | |
| | | | | | | | | | |
| | | | | | | | | 3,262,879 | |
| | | | | | | | | | |
| | | | | | Asset-Backed - Finance & Insurance - 2.6% | |
| | | 1,803,000 | | | NRZ Advance Receivables Trust 2.58%, 10/15/2049(1) | | | 1,791,755 | |
| | | 1,515,051 | | | NRZ Excess Spread-Collateralized Notes 3.19%, 01/25/2023(1) | | | 1,505,198 | |
| | | 1,185,904 | | | Springleaf Funding Trust 3.16%, 11/15/2024(1) | | | 1,184,268 | |
| | | 499,307 | | | Structured Asset Securities Corp. 1 mo. USD LIBOR + 1.500%, 4.01%, 02/25/2033(2) | | | 504,267 | |
| | | | | | Towd Point Mortgage Trust | |
| | | 569,188 | | | 2.75%, 04/25/2057(1)(3) | | | 556,644 | |
| | | 2,417,576 | | | 3.75%, 05/25/2058(1)(3) | | | 2,416,058 | |
| | | 1,185,000 | | | Tryon Park CLO, Ltd. 3 mo. USD LIBOR + 0.890%, 3.33%, 04/15/2029(1)(2) | | | 1,170,783 | |
| | | | | | | | | | |
| | | | | | | | | 9,128,973 | |
| | | | | | | | | | |
| | | | | | Asset-Backed - Home Equity - 0.3% | |
| | | 562,006 | | | Morgan Stanley Asset-Backed Securities Capital, Inc. Trust 1 mo. USD LIBOR + 1.500%, 4.01%, 11/25/2032(2) | | | 558,748 | |
| | | 7,624,819 | | | Morgan Stanley Capital Trust 0.84%, 07/15/2051(3)(4) | | | 453,208 | |
| | | | | | | | | | |
| | | | | | | | | 1,011,956 | |
| | | | | | | | | | |
| | | | | | Commercial Mortgage - Backed Securities - 7.4% | |
| | | 22,930,605 | | | Benchmark Mortgage Trust 0.54%, 07/15/2051(3)(4) | | | 851,432 | |
| | | 3,400,000 | | | CSMC Trust 2.76%, 04/05/2033(1) | | | 3,370,022 | |
| | | | | | FREMF Mortgage Trust | |
| | | 5,845,000 | | | 1 mo. USD LIBOR + 0.320%, 2.82%, 02/25/2020(2) | | | 5,837,773 | |
| | | 435,000 | | | 3.36%, 05/25/2045(1)(3) | | | 434,565 | |
| | | 955,000 | | | 3.65%, 11/25/2050(1)(3) | | | 950,088 | |
| | | 1,515,000 | | | 3.70%, 04/25/2048(1)(3) | | | 1,477,116 | |
| | | 1,325,000 | | | 3.73%, 10/25/2049(1)(3) | | | 1,264,229 | |
| | | 1,005,000 | | | 3.80%, 02/25/2050(1)(3) | | | 992,694 | |
| | | 2,645,000 | | | 3.82%, 06/25/2047(1)(3) | | | 2,643,093 | |
| | | 700,000 | | | 3.84%, 10/25/2049(1)(3) | | | 675,140 | |
| | | 660,000 | | | 3.94%, 09/25/2049(1)(3) | | | 644,922 | |
| | | 4,580,000 | | | 3.98%, 04/25/2051(1)(3) | | | 4,389,734 | |
| | | 1,990,000 | | | 5.50%, 04/25/2020(1)(3) | | | 2,041,363 | |
| | | | | | | | | | |
| | | | | | | | | 25,572,171 | |
| | | | | | | | | | |
| | | | | | Whole Loan Collateral CMO - 4.0% | |
| | | 145,786 | | | Angel Oak Mortgage Trust LLC 2.81%, 01/25/2047(1)(3) | | | 144,911 | |
| | | 2,973,407 | | | CIM Trust 3.00%, 04/25/2057(1)(3) | | | 2,950,043 | |
| | | 360,152 | | | Deephaven Residential Mortgage Trust 2.73%, 12/26/2046(1)(3) | | | 356,592 | |
| | | 563,911 | | | LSTAR Securities Investment Ltd. 1 mo. USD LIBOR + 1.750%, 4.10%, 10/01/2022(1)(2) | | | 561,864 | |
| | | | | | Mill City Mortgage Loan Trust | |
| | | 442,138 | | | 2.50%, 04/25/2057(1)(3) | | | 432,626 | |
| | | 1,854,298 | | | 3.25%, 05/25/2062(1)(3) | | | 1,831,081 | |
| | | | | | New Residential Mortgage Loan Trust | |
| | | 1,072,769 | | | 3.25%, 09/25/2056(1)(3) | | | 1,058,090 | |
| | | 1,297,758 | | | 3.75%, 03/25/2056(1)(3) | | | 1,293,946 | |
| | | 1,291,818 | | | Thornburg Mortgage Securities Trust 3.72%, 04/25/2045(3) | | | 1,298,328 | |
| | | | | | | | | | |
| Shares or Principal Amount | | Market Value† | |
| ASSET & COMMERCIAL MORTGAGE BACKEDSECURITIES -15.2% - (continued) | |
| | | | | | Whole Loan Collateral CMO - 4.0% - (continued) | |
| | | | | | Towd Point Mortgage Trust | |
| $ | | | 49,693 | | | 2.75%, 04/25/2055(1)(3) | | $ | 48,812 | |
| | | 56,529 | | | 2.75%, 05/25/2055(1)(3) | | | 55,675 | |
| | | 1,232,801 | | | 3.00%, 03/25/2054(1)(3) | | | 1,219,651 | |
| | | 2,399,000 | | | 3.75%, 04/25/2055(1)(3) | | | 2,409,627 | |
| | | | | | | | | | |
| | | | | | | | | 13,661,246 | |
| | | | | | | | | | |
| | | |
| | | | | | Total Asset & Commercial Mortgage Backed Securities
(cost $53,221,251) | | $ | 52,637,225 | |
| | | | | | | | | | |
|
| U.S. GOVERNMENT AGENCIES - 64.1% | |
| | | | | | Mortgage-Backed Agencies - 61.5% | |
| | | | | | FHLMC | |
| $ | | | 68,450,000 | | | 1.38%, 05/01/2020 | | $ | 67,392,927 | |
| | | 6,144,849 | | | 1.57%, 01/25/2022 | | | 6,023,329 | |
| | | 774,138 | | | 2.50%, 12/15/2026(4) | | | 39,368 | |
| | | 783,535 | | | 2.50%, 03/15/2028(4) | | | 57,294 | |
| | | 554,901 | | | 2.50%, 05/15/2028(4) | | | 42,407 | |
| | | 1,100,952 | | | 1 mo. USD LIBOR + 0.380%, 2.73%, 04/25/2020(2) | | | 1,100,623 | |
| | | 961,660 | | | 3.00%, 04/15/2028(4) | | | 82,911 | |
| | | 769,516 | | | 3.00%, 05/15/2032(4) | | | 52,953 | |
| | | 588,354 | | | 3.00%, 03/15/2033(4) | | | 70,518 | |
| | | 3,977,896 | | | 3.00%, 11/01/2036 | | | 3,923,109 | |
| | | 143,626 | | | 3.00%, 09/01/2045 | | | 141,107 | |
| | | 3,632,702 | | | 3.00%, 05/15/2046 | | | 3,592,265 | |
| | | 888,018 | | | 3.00%, 08/15/2047 | | | 888,106 | |
| | | 6,205,000 | | | 3.50%, 11/15/2025 | | | 6,303,725 | |
| | | 883,513 | | | 3.50%, 06/15/2026(4) | | | 53,660 | |
| | | 313,939 | | | 3.50%, 09/15/2026(4) | | | 27,302 | |
| | | 542,684 | | | 3.50%, 03/15/2027(4) | | | 45,484 | |
| | | 1,716,536 | | | 3.50%, 01/15/2028(4) | | | 154,289 | |
| | | 302,732 | | | 4.00%, 07/15/2027(4) | | | 28,758 | |
| | | 911,838 | | | 4.00%, 03/15/2028(4) | | | 80,661 | |
| | | 489,732 | | | 4.00%, 06/15/2028(4) | | | 44,543 | |
| | | 1,145,313 | | | 4.00%, 07/15/2030(4) | | | 120,937 | |
| | | 246,458 | | | 4.00%, 06/01/2044 | | | 251,913 | |
| | | 600,000 | | | 4.00%, 01/01/2049(5) | | | 611,660 | |
| | | 1,838,887 | | | 4.50%, 02/15/2027(4) | | | 188,793 | |
| | | 2,120,388 | | | 4.50%, 05/15/2034 | | | 2,177,388 | |
| | | 736,883 | | | 5.00%, 09/15/2033(4) | | | 139,346 | |
| | | 3,431 | | | 5.50%, 06/01/2034 | | | 3,668 | |
| | | 30,936 | | | 5.50%, 10/01/2035 | | | 33,363 | |
| | | 50,735 | | | 5.50%, 04/01/2037 | | | 54,669 | |
| | | 728,425 | | | 5.50%, 12/01/2037 | | | 780,333 | |
| | | 239,776 | | | 5.50%, 04/01/2038 | | | 255,983 | |
| | | 15,082 | | | 5.50%, 05/01/2038 | | | 16,172 | |
| | | 1,172,211 | | | 5.50%, 08/01/2038 | | | 1,264,180 | |
| | | 2,368 | | | 5.50%, 12/01/2039 | | | 2,533 | |
| | | 22,571 | | | 6.00%, 10/01/2021 | | | 24,283 | |
| | | 34,559 | | | 6.00%, 10/01/2022 | | | 37,180 | |
| | | 51,444 | | | 6.00%, 01/01/2028 | | | 55,347 | |
| | | 16,944 | | | 6.00%, 04/15/2028 | | | 18,283 | |
| | | 32,500 | | | 6.00%, 05/15/2028(6) | | | 35,148 | |
| | | 40,423 | | | 6.00%, 11/15/2028 | | | 43,595 | |
| | | 74,505 | | | 6.00%, 12/15/2028 | | | 80,903 | |
| | | 159,856 | | | 6.00%, 01/15/2029 | | | 172,740 | |
| | | 36,427 | | | 6.00%, 02/15/2029 | | | 39,327 | |
| | | 38,632 | | | 6.00%, 03/15/2029 | | | 41,825 | |
| | | 26,952 | | | 6.00%, 05/15/2029 | | | 29,045 | |
| | | 6,300 | | | 6.00%, 06/15/2029 | | | 6,832 | |
| | | 1,765 | | | 6.00%, 03/15/2031 | | | 1,932 | |
| | | 76,532 | | | 6.00%, 04/15/2031 | | | 83,070 | |
The accompanying notes are an integral part of these financial statements.
|
| Hartford U.S. Government Securities HLS Fund |
Schedule of Investments – (continued)
December 31, 2018
| | | | | | | | | | |
| Shares or Principal Amount | | Market Value† | |
|
| U.S. GOVERNMENT AGENCIES - 64.1% - (continued) | |
| | | | | | Mortgage-Backed Agencies - 61.5% - (continued) | |
| | | | | | FHLMC - (continued) | |
| $ | | | 32,481 | | | 6.00%, 10/15/2031 | | $ | 35,594 | |
| | | 42,450 | | | 6.00%, 12/01/2031 | | | 46,365 | |
| | | 246,744 | | | 6.00%, 12/15/2031(6) | | | 269,536 | |
| | | 338,714 | | | 6.00%, 12/15/2031 | | | 368,834 | |
| | | 12,348 | | | 6.00%, 05/15/2032 | | | 13,369 | |
| | | 742,154 | | | 6.00%, 06/15/2032 | | | 803,766 | |
| | | 634,946 | | | 6.00%, 09/15/2032 | | | 698,915 | |
| | | 56,824 | | | 6.00%, 10/15/2032 | | | 63,044 | |
| | | 458 | | | 6.00%, 11/01/2032 | | | 500 | |
| | | 42,632 | | | 6.00%, 11/15/2032 | | | 46,875 | |
| | | 14,543 | | | 6.00%, 04/01/2033 | | | 15,646 | |
| | | 14,801 | | | 6.00%, 09/01/2034 | | | 16,189 | |
| | | 4,963 | | | 6.50%, 04/01/2028 | | | 5,422 | |
| | | 240,873 | | | 6.50%, 08/15/2028 | | | 263,055 | |
| | | 533,992 | | | 6.50%, 05/15/2032 | | | 596,540 | |
| | | 85,991 | | | 6.50%, 08/01/2032 | | | 95,886 | |
| | | 205,519 | | | 6.50%, 09/01/2032 | | | 232,566 | |
| | | 22,908 | | | 7.00%, 10/01/2026 | | | 23,352 | |
| | | 2,443 | | | 7.00%, 03/01/2027 | | | 2,581 | |
| | | 1,745 | | | 7.00%, 12/01/2027 | | | 1,746 | |
| | | 798 | | | 7.00%, 02/01/2029 | | | 895 | |
| | | 515 | | | 7.00%, 05/01/2029 | | | 578 | |
| | | 846 | | | 7.00%, 09/01/2029 | | | 886 | |
| | | 467 | | | 7.00%, 02/01/2031 | | | 530 | |
| | | 69,000 | | | 7.00%, 04/01/2032 | | | 78,336 | |
| | | 56,764 | | | 7.00%, 05/01/2032 | | | 57,598 | |
| | | 50,373 | | | 7.00%, 06/01/2032 | | | 57,491 | |
| | | 74,092 | | | 7.00%, 11/01/2032 | | | 82,580 | |
| | | 2,430 | | | 7.50%, 05/01/2024 | | | 2,580 | |
| | | 430 | | | 7.50%, 06/01/2024 | | | 430 | |
| | | 968 | | | 7.50%, 06/01/2025 | | | 1,026 | |
| | | 3,801 | | | 8.00%, 08/01/2024 | | | 3,845 | |
| | | 4,262 | | | 8.00%, 09/01/2024 | | | 4,345 | |
| | | 64 | | | 8.00%, 10/01/2024 | | | 68 | |
| | | | | | | | | | |
| | | | | | | | | 100,606,756 | |
| | | | | | | | | | |
| | | | | | FNMA | |
| $ | | | 2,439,471 | | | 1.34%, 08/25/2044(3)(4) | | $ | 122,882 | |
| | | 1,428,027 | | | 1.56%, 04/25/2055(3)(4) | | | 70,291 | |
| | | 1,831,057 | | | 1.65%, 06/25/2055(3)(4) | | | 98,051 | |
| | | 6,389,625 | | | 1.97%, 11/01/2023 | | | 6,121,122 | |
| | | 1,224,949 | | | 2.00%, 09/25/2039 | | | 1,148,895 | |
| | | 672,794 | | | 2.05%, 11/01/2023 | | | 647,494 | |
| | | 3,329,785 | | | 2.22%, 10/01/2022 | | | 3,264,625 | |
| | | 2,300,000 | | | 2.23%, 11/01/2023 | | | 2,228,685 | |
| | | 200,000 | | | 2.45%, 11/01/2022 | | | 197,901 | |
| | | 23,835 | | | 2.50%, 01/01/2043 | | | 22,608 | |
| | | 268,322 | | | 2.54%, 03/01/2023 | | | 266,345 | |
| | | 2,500,000 | | | 2.68%, 05/01/2025 | | | 2,460,210 | |
| | | 1,470,746 | | | 1 mo. USD LIBOR + 0.400%, 2.70%, 10/25/2024(2) | | | 1,468,798 | |
| | | 87,356 | | | 2.74%, 04/01/2022 | | | 87,285 | |
| | | 1,098,143 | | | 1 mo. USD LIBOR + 0.400%, 2.75%, 08/25/2025(2) | | | 1,096,764 | |
| | | 1,730,299 | | | 1 mo. USD LIBOR + 0.490%, 2.79%, 04/25/2024(2) | | | 1,735,178 | |
| | | 87,117 | | | 2.83%, 06/01/2022 | | | 87,086 | |
| | | 243,447 | | | 2.94%, 06/01/2022 | | | 244,620 | |
| | | 1,371,840 | | | 3.00%, 02/25/2027(4) | | | 97,638 | |
| | | 1,457,329 | | | 3.00%, 07/25/2027(4) | | | 116,244 | |
| | | 554,105 | | | 3.00%, 09/25/2027(4) | | | 46,875 | |
| | | 60,778 | | | 3.00%, 12/01/2030 | | | 60,669 | |
| | | 1,366,329 | | | 3.00%, 06/25/2043 | | | 1,367,968 | |
| | | 177,382 | | | 3.02%, 04/01/2022 | | | 179,132 | |
| | | 515,000 | | | 3.07%, 06/01/2027 | | | 503,465 | |
| | | | | | | | | | |
| Shares or Principal Amount | | Market Value† | |
|
| U.S. GOVERNMENT AGENCIES - 64.1% - (continued) | |
| | | | | | FNMA - (continued) | |
| $ | | | 7,341,518 | | | 3.11%, 10/01/2021 | | $ | 7,406,400 | |
| | | 569,927 | | | 3.25%, 12/01/2021 | | | 576,665 | |
| | | 383,118 | | | 3.26%, 01/01/2022 | | | 389,070 | |
| | | 215,977 | | | 3.50%, 11/01/2020 | | | 218,386 | |
| | | 3,284,326 | | | 3.50%, 04/25/2027(4) | | | 282,433 | |
| | | 593,352 | | | 3.50%, 05/25/2027(4) | | | 57,323 | |
| | | 979,022 | | | 3.50%, 10/25/2027(4) | | | 90,997 | |
| | | 305,854 | | | 3.50%, 08/25/2030(4) | | | 30,100 | |
| | | 670,830 | | | 3.50%, 02/25/2031(4) | | | 57,029 | |
| | | 592,541 | | | 3.50%, 09/25/2035(4) | | | 88,053 | |
| | | 10,732,004 | | | 3.50%, 04/25/2044 | | | 10,867,209 | |
| | | 3,530,014 | | | 3.50%, 03/25/2045 | | | 3,579,195 | |
| | | 517,667 | | | 3.50%, 10/25/2046(4) | | | 119,122 | |
| | | 3,543,579 | | | 3.50%, 01/25/2047 | | | 3,594,841 | |
| | | 4,538,000 | | | 3.50%, 01/01/2049(5) | | | 4,537,202 | |
| | | 2,512,953 | | | 3.50%, 10/25/2056 | | | 2,551,190 | |
| | | 479,227 | | | 3.51%, 11/01/2021 | | | 487,961 | |
| | | 1,035,050 | | | 3.59%, 09/01/2030 | | | 1,044,162 | |
| | | 1,716,446 | | | 3.65%, 11/01/2021 | | | 1,754,168 | |
| | | 83,047 | | | 3.65%, 08/01/2023 | | | 86,102 | |
| | | 1,051,749 | | | 3.73%, 07/01/2022 | | | 1,074,716 | |
| | | 1,005,119 | | | 3.75%, 09/01/2023 | | | 1,046,766 | |
| | | 92,320 | | | 3.81%, 11/01/2023 | | | 95,793 | |
| | | 279,805 | | | 3.85%, 01/01/2024 | | | 291,195 | |
| | | 378,566 | | | 3.89%, 10/01/2023 | | | 392,555 | |
| | | 2,700,000 | | | 3.98%, 07/01/2021 | | | 2,773,381 | |
| | | 146,421 | | | 3.99%, 07/01/2021 | | | 150,122 | |
| | | 932,318 | | | 4.00%, 05/25/2027(4) | | | 83,054 | |
| | | 12,400,000 | | | 4.00%, 01/01/2049(5) | | | 12,640,250 | |
| | | 1,246,683 | | | 4.50%, 10/01/2040 | | | 1,305,815 | |
| | | 539,138 | | | 4.50%, 10/01/2041 | | | 564,683 | |
| | | 2,922,160 | | | 4.50%, 02/25/2042(4) | | | 352,970 | |
| | | 1,627,200 | | | 4.50%, 01/01/2043 | | | 1,704,337 | |
| | | 503,948 | | | 4.50%, 09/01/2043 | | | 527,823 | |
| | | 1,591,443 | | | 4.50%, 08/01/2044 | | | 1,666,841 | |
| | | 102,392 | | | 5.00%, 06/01/2025 | | | 104,757 | |
| | | 249,455 | | | 5.47%, 05/25/2042(3)(4) | | | 27,373 | |
| | | 84,566 | | | 5.50%, 08/01/2019 | | | 84,650 | |
| | | 168,365 | | | 6.00%, 10/01/2023 | | | 180,658 | |
| | | 23,372 | | | 6.00%, 10/25/2028 | | | 25,288 | |
| | | 8,744 | | | 6.00%, 11/25/2028 | | | 9,490 | |
| | | 33,177 | | | 6.00%, 04/25/2029 | | | 35,754 | |
| | | 563 | | | 6.00%, 05/01/2029 | | | 613 | |
| | | 26,653 | | | 6.00%, 05/25/2029 | | | 28,821 | |
| | | 23,183 | | | 6.00%, 06/25/2029(6) | | | 25,346 | |
| | | 54,469 | | | 6.00%, 07/25/2029 | | | 59,045 | |
| | | 276,350 | | | 6.00%, 05/25/2031(6) | | | 298,339 | |
| | | 92,085 | | | 6.00%, 09/25/2031 | | | 100,193 | |
| | | 22,364 | | | 6.00%, 11/25/2031 | | | 24,130 | |
| | | 406,505 | | | 6.00%, 12/25/2031 | | | 442,556 | |
| | | 214,674 | | | 6.00%, 01/01/2032 | | | 233,316 | |
| | | 227 | | | 6.00%, 04/01/2032 | | | 244 | |
| | | 315 | | | 6.00%, 05/01/2032 | | | 344 | |
| | | 1,532 | | | 6.00%, 09/25/2032 | | | 1,689 | |
| | | 82,772 | | | 6.00%, 11/01/2032 | | | 88,834 | |
| | | 38,669 | | | 6.00%, 02/01/2033 | | | 42,159 | |
| | | 204,670 | | | 6.00%, 03/01/2033 | | | 223,154 | |
| | | 659,550 | | | 6.00%, 05/01/2033 | | | 719,438 | |
| | | 7,712 | | | 6.00%, 08/01/2034 | | | 8,279 | |
| | | 162,139 | | | 6.00%, 01/01/2035 | | | 176,366 | |
| | | 2,018,412 | | | 6.00%, 02/01/2037 | | | 2,200,272 | |
| | | 1,590,158 | | | 6.00%, 01/25/2042(4) | | | 286,883 | |
| | | 1,098,413 | | | 6.00%, 09/25/2047(4) | | | 260,187 | |
| | | 20 | | | 6.50%, 04/01/2024 | | | 21 | |
| | | 182 | | | 6.50%, 04/01/2027 | | | 196 | |
The accompanying notes are an integral part of these financial statements.
|
| Hartford U.S. Government Securities HLS Fund |
Schedule of Investments – (continued)
December 31, 2018
| | | | | | | | | | |
| Shares or Principal Amount | | Market Value† | |
|
| U.S. GOVERNMENT AGENCIES - 64.1% - (continued) | |
| | | | | | FNMA - (continued) | |
| $ | | | 13,226 | | | 6.50%, 04/01/2028 | | $ | 14,202 | |
| | | 110 | | | 6.50%, 05/01/2028 | | | 118 | |
| | | 6,597 | | | 6.50%, 10/01/2028 | | | 7,219 | |
| | | 115,549 | | | 6.50%, 11/01/2028 | | | 125,411 | |
| | | 60,245 | | | 6.50%, 12/01/2028 | | | 66,824 | |
| | | 284,222 | | | 6.50%, 06/25/2029 | | | 299,561 | |
| | | 177,738 | | | 6.50%, 08/01/2029 | | | 197,541 | |
| | | 816 | | | 6.50%, 11/01/2030 | | | 877 | |
| | | 3,968 | | | 6.50%, 05/01/2031 | | | 4,439 | |
| | | 143,783 | | | 6.50%, 10/25/2031 | | | 159,239 | |
| | | 947,609 | | | 6.50%, 08/01/2032 | | | 1,060,109 | |
| | | 51,299 | | | 6.50%, 09/01/2032 | | | 55,272 | |
| | | 205 | | | 7.00%, 11/01/2031 | | | 208 | |
| | | 188,509 | | | 7.00%, 02/01/2032 | | | 212,014 | |
| | | 4,231 | | | 7.50%, 06/01/2023 | | | 4,448 | |
| | | 1,587 | | | 8.00%, 10/01/2029 | | | 1,789 | |
| | | 78 | | | 8.00%, 03/01/2030 | | | 79 | |
| | | 5,255 | | | 8.00%, 04/01/2030 | | | 6,152 | |
| | | 16 | | | 8.00%, 06/01/2030 | | | 16 | |
| | | 13,113 | | | 8.00%, 10/01/2030 | | | 15,400 | |
| | | 25,366 | | | 8.00%, 12/01/2030 | | | 28,307 | |
| | | 56 | | | 9.00%, 08/01/2020 | | | 57 | |
| | | 11,826 | | | 9.00%, 09/01/2021 | | | 11,861 | |
| | | | | | | | | | |
| | | | | | | | | 94,188,278 | |
| | | | | | | | | | |
| | | | | | GNMA | |
| $ | | | 269,262 | | | 1.75%, 09/20/2043 | | $ | 258,606 | |
| | | 1,979,335 | | | 2.50%, 12/16/2039 | | | 1,943,732 | |
| | | 668,679 | | | 3.00%, 09/20/2028(4) | | | 55,973 | |
| | | 399,724 | | | 3.00%, 02/16/2043(4) | | | 62,416 | |
| | | 2,887,246 | | | 3.00%, 04/20/2045 | | | 2,865,756 | |
| | | 279,552 | | | 3.50%, 02/16/2027(4) | | | 24,402 | |
| | | 679,586 | | | 3.50%, 03/20/2027(4) | | | 64,801 | |
| | | 613,772 | | | 3.50%, 07/20/2040(4) | | | 64,168 | |
| | | 914,076 | | | 3.50%, 02/20/2041(4) | | | 102,733 | |
| | | 1,572,286 | | | 3.50%, 04/20/2042(4) | | | 183,872 | |
| | | 2,261,312 | | | 3.50%, 10/20/2042(4) | | | 408,284 | |
| | | 178,809 | | | 3.50%, 05/20/2043(4) | | | 30,197 | |
| | | 1,380,983 | | | 3.50%, 07/20/2043(4) | | | 205,530 | |
| | | 3,752,245 | | | 3.50%, 01/20/2048 | | | 3,827,753 | |
| | | 206,432 | | | 4.00%, 12/16/2026(4) | | | 18,558 | |
| | | 2,903,293 | | | 4.00%, 05/20/2029(4) | | | 284,978 | |
| | | 438,981 | | | 4.00%, 03/20/2043(4) | | | 92,981 | |
| | | 212,890 | | | 4.00%, 01/20/2044(4) | | | 48,076 | |
| | | 1,514,657 | | | 4.00%, 03/20/2047(4) | | | 267,291 | |
| | | 2,336,798 | | | 4.00%, 07/20/2047(4) | | | 409,149 | |
| | | 621,956 | | | 4.50%, 04/20/2045(4) | | | 149,796 | |
| | | 680,623 | | | 5.00%, 01/20/2034 | | | 722,106 | |
| | | 1,841,441 | | | 5.00%, 02/16/2040(4) | | | 432,973 | |
| | | 526,864 | | | 5.00%, 05/20/2040(4) | | | 119,174 | |
| | | 1,592,296 | | | 5.00%, 03/16/2044(4) | | | 321,384 | |
| | | 431,244 | | | 5.00%, 01/16/2047(4) | | | 94,929 | |
| | | 869,385 | | | 5.50%, 09/20/2033 | | | 941,602 | |
| | | 1,364,218 | | | 5.50%, 03/20/2039(4) | | | 304,924 | |
| | | 1,366,509 | | | 5.50%, 02/16/2047(4) | | | 307,072 | |
| | | 818,282 | | | 5.50%, 02/20/2047(4) | | | 178,758 | |
| | | 360,784 | | | 6.00%, 01/15/2033 | | | 391,259 | |
| | | 305,075 | | | 6.00%, 02/15/2033 | | | 332,354 | |
| | | 1,444,573 | | | 6.00%, 09/20/2040(4) | | | 344,420 | |
| | | 1,183,918 | | | 6.00%, 02/20/2046(4) | | | 272,477 | |
| | | 31,297 | | | 6.50%, 12/15/2028 | | | 34,907 | |
| | | 25,736 | | | 6.50%, 05/15/2029 | | | 28,745 | |
| | | 20,590 | | | 6.50%, 09/15/2031 | | | 22,174 | |
| | | 188,732 | | | 6.50%, 10/15/2031 | | | 203,251 | |
| | | 193,512 | | | 6.50%, 11/15/2031 | | | 208,522 | |
| | | 212,493 | | | 6.50%, 01/15/2032 | | | 229,646 | |
| | | | | | | | | | |
| Shares or Principal Amount | | Market Value† | |
|
| U.S. GOVERNMENT AGENCIES - 64.1% - (continued) | |
| | | | | | GNMA - (continued) | |
| $ | | | 10,442 | | | 7.00%, 06/20/2030 | | $ | 11,285 | |
| | | 11,843 | | | 7.00%, 05/15/2032 | | | 13,592 | |
| | | 43,630 | | | 7.00%, 07/15/2032 | | | 47,684 | |
| | | 88,610 | | | 7.00%, 09/15/2032 | | | 92,514 | |
| | | 471,534 | | | 7.00%, 10/15/2032(7) | | | 516,525 | |
| | | 653 | | | 7.50%, 04/15/2022 | | | 654 | |
| | | 2,669 | | | 7.50%, 01/15/2023 | | | 2,672 | |
| | | 546 | | | 7.50%, 05/15/2023 | | | 565 | |
| | | 2,646 | | | 7.50%, 06/15/2023 | | | 2,708 | |
| | | 997 | | | 7.50%, 07/15/2023 | | | 998 | |
| | | 11,885 | | | 7.50%, 08/15/2023 | | | 11,951 | |
| | | 5,109 | | | 7.50%, 09/15/2023 | | | 5,116 | |
| | | 3,707 | | | 7.50%, 10/15/2023 | | | 3,877 | |
| | | 9,941 | | | 7.50%, 11/15/2023 | | | 10,239 | |
| | | 1,436 | | | 7.50%, 12/15/2023 | | | 1,438 | |
| | | 6,927 | | | 7.50%, 02/15/2024 | | | 7,039 | |
| | | 136 | | | 7.50%, 05/15/2024 | | | 143 | |
| | | 35,496 | | | 7.50%, 07/15/2027 | | | 37,876 | |
| | | 33,249 | | | 7.50%, 04/20/2030 | | | 38,142 | |
| | | 7,636 | | | 8.50%, 09/15/2024 | | | 8,186 | |
| | | 908 | | | 8.50%, 06/15/2029 | | | 931 | |
| | | 3,499 | | | 8.50%, 10/15/2029 | | | 3,574 | |
| | | 2,218 | | | 8.50%, 01/15/2030 | | | 2,445 | |
| | | 7,829 | | | 8.50%, 02/15/2030 | | | 7,857 | |
| | | 842 | | | 8.50%, 03/15/2030 | | | 878 | |
| | | | | | | | | | |
| | | | | | | | | 17,688,618 | |
| | | | | | | | | | |
| | | | | | | | | 212,483,652 | |
| | | | | | | | | | |
| | | | | | Other Direct Federal Obligations - 2.6% | |
| | | | | | Other - 1.6% | |
| | | | | | United States Small Business Administration | |
| $ | | | 2,419,710 | | | 3.20%, 03/01/2038 | | $ | 2,416,217 | |
| | | 1,790,000 | | | 3.53%, 09/01/2038 | | | 1,822,628 | |
| | | 1,350,000 | | | 3.54%, 12/01/2038 | | | 1,361,376 | |
| | | | | | | | | | |
| | | | | | | | | 5,600,221 | |
| | | | | | | | | | |
| | | | | | SLM Student Loan Trust - 1.0% | |
| | | 3,393,553 | | | Nelnet Student Loan Trust 1 mo. USD LIBOR + 0.770%, 3.28%, 09/25/2065(1)(2) | | | 3,410,615 | |
| | | | | | | | | | |
| | | | | | | | | 3,410,615 | |
| | | | | | | | | | |
| | | | | | | | | 9,010,836 | |
| | | | | | | | | | |
| | | |
| | | | | | Total U.S. Government Agencies
(cost $223,259,989) | | $ | 221,494,488 | |
| | | | | | | | | | |
|
| U.S. GOVERNMENT SECURITIES - 22.7% | |
| | | | | | Other Direct Federal Obligations - 1.4% | |
| | | | | | FHLB - 1.4% | |
| | | 4,825,000 | | | FHLB 1.88%, 08/01/2019 | | | 4,802,467 | |
| | | | | | | | | | |
| | | | | | | | | 4,802,467 | |
| | | | | | | | | | |
| | | | | | U.S. Treasury Securities - 21.3% | |
| | | | | | U.S. Treasury Notes - 21.3% | |
| | | 26,060,172 | | | 0.75%, 07/15/2028(8) | | | 25,507,411 | |
| | | 7,857,000 | | | 1.88%, 07/31/2022 | | | 7,694,029 | |
| | | 4,303,000 | | | 2.25%, 11/15/2024 | | | 4,228,874 | |
| | | 34,550,000 | | | 2.75%, 11/15/2023(7)(9) | | | 34,927,891 | |
| | | 1,148,000 | | | 2.88%, 05/31/2025 | | | 1,167,776 | |
| | | | | | | | | | |
| | | | | | | | | 73,525,981 | |
| | | | | | | | | | |
| | | | | | | | | 73,525,981 | |
| | | | | | | | | | |
| | | |
| | | | | | Total U.S. Government Securities
(cost $78,409,387) | | $ | 78,328,448 | |
| | | | | | | | | | |
| | | |
| | | | | | Total Long-Term Investments
(cost $354,890,627) | | $ | 352,460,161 | |
| | | | | | | | | | |
The accompanying notes are an integral part of these financial statements.
|
| Hartford U.S. Government Securities HLS Fund |
Schedule of Investments – (continued)
December 31, 2018
| | | | | | | | | | |
| Shares or Principal Amount | | Market Value† | |
| SHORT-TERM INVESTMENTS - 3.0% | | | |
| | | | | | Other Investment Pools & Funds - 3.0% | |
| | | 10,290,074 | | | Fidelity Investments Money Market Funds, Government Portfolio, Institutional Class, 2.35%(10) | | $ | 10,290,074 | |
| | | | | | | | | | |
| | | |
| | | | | | Total Short-Term Investments
(cost $10,290,074) | | $ | 10,290,074 | |
| | | | | | | | | | |
| | | | | | | | | | | | | | |
| | | | |
| | | | | | Total Investments
(cost $365,180,701) | | | 105.0 | % | | $ | 362,750,235 | |
| | | | | | Other Assets and Liabilities | | | (5.0 | )% | | | (17,167,327 | ) |
| | | | | | | | | | | | | | |
| | | | | | Total Net Assets | | | 100.0 | % | | $ | 345,582,908 | |
| | | | | | | | | | | | | | |
| Note: | Percentage of investments as shown is the ratio of the total market value to total net assets. |
| | The Fund may refer to any one or more of the industry classifications used by one or more widely recognized market indices, ratings group and/or as defined by Fund management. Industry classifications may not be identical across all security types. |
| | For Fund compliance purposes, the Fund may not use the same classification system. These classifications are used for financial reporting purposes. |
| (1) | Security was purchased pursuant to Rule 144A under the Securities Act of 1933 and may be sold in transactions that are exempt from registration (typically only to |
| | qualified institutional buyers) or in a public offering registered under the Securities Act of 1933. At December 31, 2018, the aggregate value of these securities was $43,629,074, representing 12.6% of net assets. |
| (2) | Variable rate securities; the rate reported is the coupon rate in effect at December 31, 2018. |
| (3) | Variable or floating rate security, which interest rate adjusts periodically based on changes in current interest rates and prepayments on the underlying pool of assets. Rate shown is the rate in effect as of period end. |
| (4) | Securities disclosed are interest-only strips. |
| (5) | Represents or includes a TBA transaction. |
| (6) | These securities pay no principal or interest during their initial accrual period, but accrue additional principal at a specified coupon rate. |
| (7) | This security, or a portion of this security, has been pledged as collateral in connection with futures contracts. |
| (8) | The principal amount for this security is adjusted for inflation and the interest payments equal a fixed percentage of the inflation-adjusted principal amount. |
| (9) | This security, or a portion of this security, has been pledged as collateral in connection with OTC swap contracts. |
| (10) | Current yield as of period end. |
| | | | | | | | | | | | | | | | |
| Futures Contracts Outstanding at December 31, 2018 | |
Description | | Number of
Contracts | | | Expiration
Date | | | Current
Notional
Amount | | | Value and
Unrealized
Appreciation/
(Depreciation) | |
| Long position contracts: | |
U.S. Treasury Ultra Bond Future | | | 29 | | | | 03/20/2019 | | | | 4,659,031 | | | | 250,364 | |
U.S. Treasury5-Year Note Future | | | 676 | | | | 03/29/2019 | | | | 77,528,750 | | | | 1,263,013 | |
U.S. Treasury10-Year Ultra Future | | | 192 | | | | 03/20/2019 | | | $ | 24,975,000 | | | $ | 779,649 | |
| | | | | | | | | | | | | | | | |
Total | | | | | | | | | | | | | | $ | 2,293,026 | |
| | | | | | | | | | | | | | | | |
| Short position contracts: | |
U.S. Treasury Long Bond Future | | | 45 | | | | 03/20/2019 | | | | 6,570,000 | | | | (312,051 | ) |
U.S. Treasury2-Year Note Future | | | 69 | | | | 03/29/2019 | | | | 14,649,563 | | | | (77,750 | ) |
U.S. Treasury10-Year Note Future | | | 95 | | | | 03/20/2019 | | | $ | 11,591,484 | | | $ | (271,183 | ) |
| | | | | | | | | | | | | | | | |
Total | | | | | | | | | | | | | | $ | (660,984 | ) |
| | | | | | | | | | | | | | | | |
Total futures contracts | | | | | | | | | | | | | | $ | 1,632,042 | |
| | | | | | | | | | | | | | | | |
| | | | | | | | | | | | | | | | |
| TBA Sale Commitments Outstanding at December 31, 2018 | |
Description | | Principal
Amount | | | Maturity
Date | | | Market
Value† | | | Unrealized
Appreciation/
(Depreciation) | |
FHLMC, 4.00% | | $ | 800,000 | | | | 01/01/2049 | | | $ | (815,547 | ) | | $ | (6,359 | ) |
FNMA, 4.50% | | | 4,700,000 | | | | 01/01/2049 | | | | (4,866,795 | ) | | | (26,217 | ) |
| | | | | | | | | | | | | | | | |
Total (proceeds receivable $5,649,766) | | | | | | | | | | $ | (5,682,342 | ) | | $ | (32,576 | ) |
| | | | | | | | | | | | | | | | |
The accompanying notes are an integral part of these financial statements.
|
| Hartford U.S. Government Securities HLS Fund |
Schedule of Investments – (continued)
December 31, 2018
At December 31, 2018, the aggregate market value of TBA Sale Commitments represents (1.6) % of total net assets.
| | | | | | | | | | | | | | | | | | | | | | | | | | | | | | |
| Centrally Cleared Interest Rate Swap Contracts Outstanding at December 31, 2018 | |
Payments made
by Fund | | Payments received
by Fund | | Notional
Amount | | | Expiration
Date | | | Periodic
Payment
Frequency | | Upfront
Premiums
Paid | | | Upfront
Premiums
Received | | | Value† | | | Unrealized
Appreciation/
(Depreciation) | |
3 Mo. USD LIBOR | | 2.95% Fixed | | USD | | | 6,201,000 | | | | 06/18/23 | | | Semi-Annual | | $ | — | | | $ | — | | | $ | (99,824 | ) | | $ | (99,824 | ) |
3 Mo. USD LIBOR | | 3.00% Fixed | | USD | | | 4,916,000 | | | | 04/30/25 | | | Semi-Annual | | | — | | | | (50 | ) | | | (141,558 | ) | | | (141,508 | ) |
3 Mo. USD LIBOR | | 2.79% Fixed | | USD | | | 15,286,000 | | | | 09/30/25 | | | Semi-Annual | | | — | | | | — | | | | (168,174 | ) | | | (168,174 | ) |
3 Mo. USD LIBOR | | 2.25% Fixed | | USD | | | 7,750,000 | | | | 03/21/28 | | | Semi-Annual | | | 82,365 | | | | — | | | | 284,695 | | | | 202,330 | |
3 Mo. USD LIBOR | | 2.83% Fixed | | USD | | | 12,366,000 | | | | 12/21/28 | | | Semi-Annual | | | — | | | | — | | | | (138,856 | ) | | | (138,856 | ) |
| | | | | | | | | | | | | | | | | | | | | | | | | | | | | | |
Total | | | | | | | | | | | | | | | | $ | 82,365 | | | $ | (50 | ) | | $ | (263,717 | ) | | $ | (346,032 | ) |
| | | | | | | | | | | | | | | | | | | | | | | | | | | | | | |
| † | See Significant Accounting Policies of accompanying Notes to Financial Statements regarding valuation of investments. |
| | |
| GLOSSARY: (abbreviations used in preceding Schedule of Investments) |
|
| Counterparty Abbreviations: |
GSC | | Goldman Sachs & Co. |
|
| Other Abbreviations: |
CLO | | Collateralized Loan Obligation |
CMO | | Collateralized Mortgage Obligation |
| | |
|
| Other Abbreviations: – (continued) |
FHLB | | Federal Home Loan Bank |
FHLMC | | Federal Home Loan Mortgage Corp. |
FNMA | | Federal National Mortgage Association |
GNMA | | Government National Mortgage Association |
LIBOR | | London Interbank Offered Rate |
PT | | Perseroan Terbatas |
TBA | | To Be Announced |
Fair Valuation Summary
The following is a summary of the fair valuations according to the inputs used as of December 31, 2018 in valuing the Fund’s investments.
| | | | | | | | | | | | | | | | |
Description | | Total | | | Level 1 | | | Level 2 | | | Level 3(1) | |
Assets | |
Asset & Commercial Mortgage Backed Securities | | $ | 52,637,225 | | | $ | — | | | $ | 52,637,225 | | | $ | — | |
U.S. Government Agencies | | | 221,494,488 | | | | — | | | | 221,494,488 | | | | — | |
U.S. Government Securities | | | 78,328,448 | | | | — | | | | 78,328,448 | | | | — | |
Short-Term Investments | | | 10,290,074 | | | | 10,290,074 | | | | — | | | | — | |
Futures Contracts(2) | | | 2,293,026 | | | | 2,293,026 | | | | — | | | | — | |
Swaps - Interest Rate(2) | | | 202,330 | | | | — | | | | 202,330 | | | | — | |
| | | | | | | | | | | | | | | | |
Total | | $ | 365,245,591 | | | $ | 12,583,100 | | | $ | 352,662,491 | | | $ | — | |
| | | | | | | | | | | | | | | | |
Liabilities | |
Futures Contracts(2) | | $ | (660,984 | ) | | $ | (660,984 | ) | | $ | — | | | $ | — | |
Swaps - Interest Rate(2) | | | (548,362 | ) | | | — | | | | (548,362 | ) | | | — | |
TBA Sale Commitments | | | (5,682,342 | ) | | | — | | | | (5,682,342 | ) | | | — | |
| | | | | | | | | | | | | | | | |
Total | | $ | (6,891,688 | ) | | $ | (660,984 | ) | | $ | (6,230,704 | ) | | $ | — | |
| | | | | | | | | | | | | | | | |
| (1) | For the year ended December 31, 2018, there were no transfers in and out of Level 3. |
| (2) | Derivative instruments (excluding purchased and written options, if applicable) are valued at the unrealized appreciation/(depreciation) on the investments. |
The accompanying notes are an integral part of these financial statements.
Schedule of Investments
December 31, 2018
| | | | | | | | |
| Shares or Principal Amount | | Market Value† | |
| COMMON STOCKS - 98.5% | |
| | | | Banks - 15.3% | |
| | 514,470 | | | Bank of America Corp. | | $ | 12,676,541 | |
| | 175,945 | | | Citigroup, Inc. | | | 9,159,697 | |
| | 180,982 | | | JP Morgan Chase & Co. | | | 17,667,463 | |
| | 37,520 | | | M&T Bank Corp. | | | 5,370,237 | |
| | 73,410 | | | PNC Financial Services Group, Inc. | | | 8,582,363 | |
| | 203,905 | | | Wells Fargo & Co. | | | 9,395,942 | |
| | | | | | | | |
| | | | | | | 62,852,243 | |
| | | | | | | | |
| | | | Capital Goods - 7.1% | |
| | 46,110 | | | Caterpillar, Inc. | | | 5,859,198 | |
| | 71,765 | | | Eaton Corp. plc | | | 4,927,385 | |
| | 109,670 | | | Fortune Brands Home & Security, Inc. | | | 4,166,363 | |
| | 47,295 | | | Ingersoll-Rand plc | | | 4,314,723 | |
| | 16,480 | | | Lockheed Martin Corp. | | | 4,315,123 | |
| | 54,580 | | | United Technologies Corp. | | | 5,811,678 | |
| | | | | | | | |
| | | | | | | 29,394,470 | |
| | | | | | | | |
| | | | Consumer Durables & Apparel - 0.9% | |
| | 112,100 | | | Newell Brands, Inc. | | | 2,083,939 | |
| | 74,680 | | | Skechers USA, Inc. Class A* | | | 1,709,425 | |
| | | | | | | | |
| | | | | | | 3,793,364 | |
| | | | | | | | |
| | | | Consumer Services - 1.1% | |
| | 62,773 | | | Hilton Worldwide Holdings, Inc. | | | 4,507,101 | |
| | | | | | | | |
| | | | Diversified Financials - 2.2% | |
| | 13,365 | | | BlackRock, Inc. | | | 5,250,039 | |
| | 232,940 | | | Invesco Ltd. | | | 3,899,416 | |
| | | | | | | | |
| | | | | | | 9,149,455 | |
| | | | | | | | |
| | | | Energy - 10.6% | |
| | 179,540 | | | Canadian Natural Resources Ltd. | | | 4,332,300 | |
| | 111,555 | | | Chevron Corp. | | | 12,136,069 | |
| | 39,800 | | | Concho Resources, Inc.* | | | 4,091,042 | |
| | 71,280 | | | EOG Resources, Inc. | | | 6,216,329 | |
| | 71,575 | | | Exxon Mobil Corp. | | | 4,880,699 | |
| | 126,805 | | | Halliburton Co. | | | 3,370,477 | |
| | 79,670 | | | Occidental Petroleum Corp. | | | 4,890,145 | |
| | 27,120 | | | Pioneer Natural Resources Co. | | | 3,566,822 | |
| | | | | | | | |
| | | | | | | 43,483,883 | |
| | | | | | | | |
| | | | Food & Staples Retailing - 1.1% | |
| | 141,820 | | | US Foods Holding Corp.* | | | 4,487,185 | |
| | | | | | | | |
| | | | Food, Beverage & Tobacco - 4.0% | |
| | 107,773 | | | Kraft Heinz Co. | | | 4,638,550 | |
| | 120,400 | | | Mondelez International, Inc. Class A | | | 4,819,612 | |
| | 105,120 | | | Philip Morris International, Inc. | | | 7,017,811 | |
| | | | | | | | |
| | | | | | | 16,475,973 | |
| | | | | | | | |
| | | | Health Care Equipment & Services - 6.9% | |
| | 25,010 | | | Anthem, Inc. | | | 6,568,376 | |
| | 131,292 | | | Koninklijke Philips N.V. | | | 4,603,030 | |
| | 85,366 | | | Medtronic plc | | | 7,764,892 | |
| | 20,275 | | | UnitedHealth Group, Inc. | | | 5,050,908 | |
| | 42,660 | | | Zimmer Biomet Holdings, Inc. | | | 4,424,695 | |
| | | | | | | | |
| | | | | | | 28,411,901 | |
| | | | | | | | |
| | | | Household & Personal Products - 1.1% | |
| | 82,910 | | | Unilever N.V. ADR | | | 4,460,558 | |
| | | | | | | | |
| | | | Insurance - 5.8% | |
| | 83,805 | | | American International Group, Inc. | | | 3,302,755 | |
| | 52,590 | | | Chubb Ltd. | | | 6,793,576 | |
| | 62,320 | | | Intact Financial Corp. | | | 4,527,924 | |
| | 67,020 | | | Marsh & McLennan Cos., Inc. | | | 5,344,845 | |
| | 95,420 | | | MetLife, Inc. | | | 3,917,945 | |
| | | | | | | | |
| | | | | | | 23,887,045 | |
| | | | | | | | |
| | | | | | | | |
| Shares or Principal Amount | | Market Value† | |
| COMMON STOCKS - 98.5% - (continued) | |
| | | | Materials - 3.7% | |
| | 133,410 | | | DowDuPont, Inc. | | $ | 7,134,767 | |
| | 66,560 | | | FMC Corp. | | | 4,922,778 | |
| | 95,210 | | | Sealed Air Corp. | | | 3,317,116 | |
| | | | | | | | |
| | | | | | | 15,374,661 | |
| | | | | | | | |
| | | | Media & Entertainment - 3.3% | |
| | 326,780 | | | Comcast Corp. Class A | | | 11,126,859 | |
| | 94,530 | | | Viacom, Inc. Class B | | | 2,429,421 | |
| | | | | | | | |
| | | | | | | 13,556,280 | |
| | | | | | | | |
| | | | Pharmaceuticals, Biotechnology & Life Sciences - 9.4% | |
| | 30,940 | | | Allergan plc | | | 4,135,440 | |
| | 137,840 | | | AstraZeneca plc ADR | | | 5,235,163 | |
| | 101,470 | | | Bristol-Myers Squibb Co. | | | 5,274,411 | |
| | 60,920 | | | Eli Lilly & Co. | | | 7,049,663 | |
| | 137,090 | | | Merck & Co., Inc. | | | 10,475,047 | |
| | 25,998 | | | Roche Holding AG | | | 6,454,233 | |
| | | | | | | | |
| | | | | | | 38,623,957 | |
| | | | | | | | |
| | | | Real Estate - 3.1% | |
| | 158,890 | | | Brixmor Property Group, Inc. REIT | | | 2,334,094 | |
| | 61,070 | | | Crown Castle International Corp. REIT | | | 6,634,034 | |
| | 150,100 | | | Park Hotels & Resorts, Inc. REIT | | | 3,899,598 | |
| | | | | | | | |
| | | | | | | 12,867,726 | |
| | | | | | | | |
| | | | Retailing - 2.2% | |
| | 26,660 | | | Home Depot, Inc. | | | 4,580,721 | |
| | 224,930 | | | Qurate Retail, Inc.* | | | 4,390,634 | |
| | | | | | | | |
| | | | | | | 8,971,355 | |
| | | | | | | | |
| | | | Semiconductors & Semiconductor Equipment - 7.0% | |
| | 63,780 | | | Analog Devices, Inc. | | | 5,474,237 | |
| | 204,170 | | | Intel Corp. | | | 9,581,698 | |
| | 35,540 | | | KLA-Tencor Corp. | | | 3,180,475 | |
| | 89,765 | | | Maxim Integrated Products, Inc. | | | 4,564,550 | |
| | 102,650 | | | QUALCOMM, Inc. | | | 5,841,812 | |
| | | | | | | | |
| | | | | | | 28,642,772 | |
| | | | | | | | |
| | | | Technology Hardware & Equipment - 4.9% | |
| | 262,720 | | | Cisco Systems, Inc. | | | 11,383,657 | |
| | 63,770 | | | NetApp, Inc. | | | 3,805,156 | |
| | 846,890 | | | Nokia Oyj ADR | | | 4,928,900 | |
| | | | | | | | |
| | | | | | | 20,117,713 | |
| | | | | | | | |
| | | | Telecommunication Services - 2.9% | |
| | 211,440 | | | Verizon Communications, Inc. | | | 11,887,157 | |
| | | | | | | | |
| | | | Transportation - 1.2% | |
| | 34,610 | | | Union Pacific Corp. | | | 4,784,140 | |
| | | | | | | | |
| | | | Utilities - 4.7% | |
| | 81,120 | | | Dominion Energy, Inc. | | | 5,796,835 | |
| | 67,780 | | | Edison International | | | 3,847,871 | |
| | 88,945 | | | Eversource Energy | | | 5,784,983 | |
| | 36,960 | | | Sempra Energy | | | 3,998,702 | |
| | | | | | | | |
| | | | | | | 19,428,391 | |
| | | | | | | | |
| | |
| | | | Total Common Stocks
(cost $361,184,449) | | $ | 405,157,330 | |
| | | | | | | | |
| | |
| | | | Total Long-Term Investments
(cost $361,184,449) | | $ | 405,157,330 | |
| | | | | | | | |
The accompanying notes are an integral part of these financial statements.
Schedule of Investments – (continued)
December 31, 2018
| | | | | | | | |
| Shares or Principal Amount | | Market Value† | |
| SHORT-TERM INVESTMENTS - 1.4% | |
| | | | Other Investment Pools & Funds - 1.4% | |
| | 5,515,188 | | | BlackRock Liquidity Funds FedFund Portfolio, Institutional Class, 2.40%(1) | | $ | 5,515,188 | |
| | | | | | | | |
| | |
| | | | Total Short-Term Investments
(cost $5,515,188) | | $ | 5,515,188 | |
| | | | | | | | |
| | | | | | | | | | | | |
| | | |
| | | | Total Investments
(cost $366,699,637) | | | 99.9 | % | | $ | 410,672,518 | |
| | | | Other Assets and Liabilities | | | 0.1 | % | | | 571,876 | |
| | | | | | | | | | | | |
| | | | Total Net Assets | | | 100.0 | % | | $ | 411,244,394 | |
| | | | | | | | | | | | |
| Note: | Percentage of investments as shown is the ratio of the total market value to total net assets. |
| | Prices of foreign equities that are principally traded on certain foreign markets will generally be adjusted daily pursuant to a fair value pricing service approved by the Board of Directors in order to reflect an adjustment for factors occurring after the close of certain foreign markets but before the close of the New York Stock Exchange. |
| | Equity industry classifications used in this report are the Global Industry Classification Standard, which was developed by and is the exclusive property and service mark of MSCI, Inc. and Standard & Poor’s. |
| | For Fund compliance purposes, the Fund may not use the same classification system. These classifications are used for financial reporting purposes. |
| (1) | Current yield as of period end. |
| † | See Significant Accounting Policies of accompanying Notes to Financial Statements regarding valuation of investments. |
| | |
| GLOSSARY: (abbreviations used in preceding Schedule of Investments) |
|
| Other Abbreviations: |
ADR | | American Depositary Receipt |
REIT | | Real Estate Investment Trust |
Fair Valuation Summary
The following is a summary of the fair valuations according to the inputs used as of December 31, 2018 in valuing the Fund’s investments.
| | | | | | | | | | | | | | | | |
| Description | | Total | | | Level 1 | | | Level 2 | | | Level 3(1) | |
Assets | |
Common Stocks | |
Banks | | $ | 62,852,243 | | | $ | 62,852,243 | | | $ | — | | | $ | — | |
Capital Goods | | | 29,394,470 | | | | 29,394,470 | | | | — | | | | — | |
Consumer Durables & Apparel | | | 3,793,364 | | | | 3,793,364 | | | | — | | | | — | |
Consumer Services | | | 4,507,101 | | | | 4,507,101 | | | | — | | | | — | |
Diversified Financials | | | 9,149,455 | | | | 9,149,455 | | | | — | | | | — | |
Energy | | | 43,483,883 | | | | 43,483,883 | | | | — | | | | — | |
Food & Staples Retailing | | | 4,487,185 | | | | 4,487,185 | | | | — | | | | — | |
Food, Beverage & Tobacco | | | 16,475,973 | | | | 16,475,973 | | | | — | | | | — | |
Health Care Equipment & Services | | | 28,411,901 | | | | 23,808,871 | | | | 4,603,030 | | | | — | |
Household & Personal Products | | | 4,460,558 | | | | 4,460,558 | | | | — | | | | — | |
Insurance | | | 23,887,045 | | | | 23,887,045 | | | | — | | | | — | |
Materials | | | 15,374,661 | | | | 15,374,661 | | | | — | | | | — | |
Media & Entertainment | | | 13,556,280 | | | | 13,556,280 | | | | — | | | | — | |
Pharmaceuticals, Biotechnology & Life Sciences | | | 38,623,957 | | | | 32,169,724 | | | | 6,454,233 | | | | — | |
Real Estate | | | 12,867,726 | | | | 12,867,726 | | | | — | | | | — | |
Retailing | | | 8,971,355 | | | | 8,971,355 | | | | — | | | | — | |
Semiconductors & Semiconductor Equipment | | | 28,642,772 | | | | 28,642,772 | | | | — | | | | — | |
Technology Hardware & Equipment | | | 20,117,713 | | | | 20,117,713 | | | | — | | | | — | |
Telecommunication Services | | | 11,887,157 | | | | 11,887,157 | | | | — | | | | — | |
Transportation | | | 4,784,140 | | | | 4,784,140 | | | | — | | | | — | |
Utilities | | | 19,428,391 | | | | 19,428,391 | | | | — | | | | — | |
Short-Term Investments | | | 5,515,188 | | | | 5,515,188 | | | | — | | | | — | |
| | | | | | | | | | | | | | | | |
Total | | $ | 410,672,518 | | | $ | 399,615,255 | | | $ | 11,057,263 | | | $ | — | |
| | | | | | | | | | | | | | | | |
| (1) | For the year ended December 31, 2018, there were no transfers in and out of Level 3. |
The accompanying notes are an integral part of these financial statements.
Statements of Assets and Liabilities
December 31, 2018
| | | | | | | | | | | | | | | | | | | | | | | | | | | | |
| | | Hartford
Balanced
HLS Fund | | | Hartford
Capital
Appreciation
HLS Fund | | | Hartford
Disciplined
Equity
HLS Fund | | | Hartford
Dividend
and Growth
HLS Fund | | | Hartford
Global
Growth
HLS Fund | | | Hartford
Growth
Opportunities
HLS Fund | | | Hartford
Healthcare
HLS Fund | |
Assets: | | | | | | | | | | | | | | | | | | | | | | | | | | | | |
Investments in securities, at market value(1) | | $ | 1,944,496,368 | | | $ | 4,007,776,239 | | | $ | 569,649,892 | | | $ | 2,961,032,873 | | | $ | 448,125,116 | | | $ | 1,368,134,886 | | | $ | 288,767,718 | |
Cash | | | 78,594 | | | | 84,051 | | | | — | | | | 18,720 | | | | 134 | | | | — | | | | — | |
Foreign currency | | | 80,298 | | | | 8,987 | | | | — | | | | — | | | | 63,968 | | | | — | | | | — | |
Receivables: | | | | | | | | | | | | | | | | | | | | | | | | | | | | |
Investment securities sold | | | 2,292,149 | | | | 340,621 | | | | 726,521 | | | | — | | | | 1,709,130 | | | | 1,058,187 | | | | 181,376 | |
Fund shares sold | | | 14,800 | | | | 124,447 | | | | 74,205 | | | | 942,293 | | | | 20,020 | | | | 340,095 | | | | 117,550 | |
Dividends and interest | | | 6,544,842 | | | | 5,457,344 | | | | 622,426 | | | | 4,240,773 | | | | 183,190 | | | | 626,788 | | | | 155,258 | |
Securities lending income | | | 6,166 | | | | 14,612 | | | | 44 | | | | 346 | | | | 159 | | | | 7,298 | | | | 1,770 | |
Variation margin on futures contracts | | | 22,833 | | | | 2,442,960 | | | | — | | | | — | | | | — | | | | — | | | | — | |
Tax reclaims | | | 821,320 | | | | 1,142,066 | | | | — | | | | 567,422 | | | | 602,937 | | | | 212,509 | | | | 7,790 | |
Other assets | | | 9,991 | | | | 6,523 | | | | 16,044 | | | | 9,256 | | | | 16,432 | | | | 20,870 | | | | 14,510 | |
| | | | | | | | | | | | | | | | | | | | | | | | | | | | |
Total assets | | | 1,954,367,361 | | | | 4,017,397,850 | | | | 571,089,132 | | | | 2,966,811,683 | | | | 450,721,086 | | | | 1,370,400,633 | | | | 289,245,972 | |
| | | | | | | | | | | | | | | | | | | | | | | | | | | | |
Liabilities: | | | | | | | | | | | | | | | | | | | | | | | | | | | | |
Unrealized depreciation on foreign currency contracts | | | — | | | | 345,582 | | | | — | | | | — | | | | — | | | | — | | | | — | |
Obligation to return securities lending collateral | | | 4,505,697 | | | | 7,045,118 | | | | — | | | | — | | | | 955,004 | | | | 7,889,516 | | | | 2,970,261 | |
Payables: | | | | | | | | | | | | | | | | | | | | | | | | | | | | |
Investment securities purchased | | | — | | | | 1,980,074 | | | | — | | | | 2,670,093 | | | | 790,715 | | | | 3,427,842 | | | | 126,019 | |
Fund shares redeemed | | | 1,068,575 | | | | 2,078,716 | | | | 421,950 | | | | 1,105,284 | | | | 1,372,290 | | | | 660,498 | | | | 176,602 | |
Investment management fees | | | 1,013,810 | | | | 2,274,865 | | | | 370,569 | | | | 1,700,541 | | | | 296,263 | | | | 730,095 | | | | 213,449 | |
Transfer agent fees | | | 965 | | | | 1,390 | | | | 904 | | | | 983 | | | | 921 | | | | 1,348 | | | | 942 | |
Accounting services fees | | | 30,641 | | | | 61,341 | | | | 7,025 | | | | 36,482 | | | | 5,516 | | | | 21,648 | | | | 3,550 | |
Board of Directors’ fees | | | 13,176 | | | | 28,564 | | | | 3,972 | | | | 20,215 | | | | 3,147 | | | | 9,463 | | | | 1,976 | |
Distribution fees | | | 9,347 | | | | 18,608 | | | | 2,766 | | | | 14,425 | | | | 2,884 | | | | 6,773 | | | | 1,467 | |
Accrued expenses | | | 175,772 | | | | 363,609 | | | | 101,700 | | | | 237,843 | | | | 99,376 | | | | 189,056 | | | | 31,654 | |
| | | | | | | | | | | | | | | | | | | | | | | | | | | | |
Total liabilities | | | 6,817,983 | | | | 14,197,867 | | | | 908,886 | | | | 5,785,866 | | | | 3,526,116 | | | | 12,936,239 | | | | 3,525,920 | |
| | | | | | | | | | | | | | | | | | | | | | | | | | | | |
Net assets | | $ | 1,947,549,378 | | | $ | 4,003,199,983 | | | $ | 570,180,246 | | | $ | 2,961,025,817 | | | $ | 447,194,970 | | | $ | 1,357,464,394 | | | $ | 285,720,052 | |
| | | | | | | | | | | | | | | | | | | | | | | | | | | | |
Summary of Net Assets: | | | | | | | | | | | | | | | | | | | | | | | | | | | | |
Capital stock andpaid-in-capital | | $ | 1,590,817,425 | | | $ | 3,774,288,932 | | | $ | 398,676,147 | | | $ | 2,019,916,579 | | | $ | 322,589,754 | | | $ | 1,073,921,400 | | | $ | 237,832,324 | |
Distributable earnings | | | 356,731,953 | | | | 228,911,051 | | | | 171,504,099 | | | | 941,109,238 | | | | 124,605,216 | | | | 283,542,994 | | | | 47,887,728 | |
| | | | | | | | | | | | | | | | | | | | | | | | | | | | |
Net assets | | $ | 1,947,549,378 | | | $ | 4,003,199,983 | | | $ | 570,180,246 | | | $ | 2,961,025,817 | | | $ | 447,194,970 | | | $ | 1,357,464,394 | | | $ | 285,720,052 | |
| | | | | | | | | | | | | | | | | | | | | | | | | | | | |
Shares authorized | | | 9,700,000,000 | | | | 5,450,000,000 | | | | 3,500,000,000 | | | | 4,200,000,000 | | | | 3,600,000,000 | | | | 900,000,000 | | | | 800,000,000 | |
| | | | | | | | | | | | | | | | | | | | | | | | | | | | |
Par value | | $ | 0.0010 | | | $ | 0.0010 | | | $ | 0.0010 | | | $ | 0.0010 | | | $ | 0.0010 | | | $ | 0.0010 | | | $ | 0.0010 | |
| | | | | | | | | | | | | | | | | | | | | | | | | | | | |
Class IA: Net asset value per share | | $ | 27.47 | | | $ | 39.89 | | | $ | 13.59 | | | $ | 19.91 | | | $ | 24.54 | | | $ | 33.79 | | | $ | 20.56 | |
| | | | | | | | | | | | | | | | | | | | | | | | | | | | |
Shares outstanding | | | 62,529,487 | | | | 88,832,501 | | | | 36,915,486 | | | | 130,797,411 | | | | 15,316,585 | | | | 35,174,940 | | | | 12,120,792 | |
| | | | | | | | | | | | | | | | | | | | | | | | | | | | |
Net Assets | | $ | 1,717,759,083 | | | $ | 3,543,187,021 | | | $ | 501,718,298 | | | $ | 2,604,425,066 | | | $ | 375,825,188 | | | $ | 1,188,514,244 | | | $ | 249,144,444 | |
| | | | | | | | | | | | | | | | | | | | | | | | | | | | |
Class IB: Net asset value per share | | $ | 27.91 | | | $ | 39.28 | | | $ | 13.44 | | | $ | 19.82 | | | $ | 24.28 | | | $ | 32.19 | | | $ | 19.44 | |
| | | | | | | | | | | | | | | | | | | | | | | | | | | | |
Shares outstanding | | | 8,232,148 | | | | 11,007,503 | | | | 5,094,175 | | | | 17,992,848 | | | | 2,939,194 | | | | 4,120,588 | | | | 1,881,029 | |
| | | | | | | | | | | | | | | | | | | | | | | | | | | | |
Net Assets | | $ | 229,790,295 | | | $ | 432,334,076 | | | $ | 68,461,948 | | | $ | 356,600,751 | | | $ | 71,369,782 | | | $ | 132,628,866 | | | $ | 36,575,608 | |
| | | | | | | | | | | | | | | | | | | | | | | | | | | | |
Class IC: Net asset value per share | | $ | — | | | $ | 39.54 | | | $ | — | | | $ | — | | | $ | — | | | $ | 32.90 | | | $ | — | |
| | | | | | | | | | | | | | | | | | | | | | | | | | | | |
Shares outstanding | | | — | | | | 700,037 | | | | — | | | | — | | | | — | | | | 1,104,105 | | | | — | |
| | | | | | | | | | | | | | | | | | | | | | | | | | | | |
Net Assets | | $ | — | | | $ | 27,678,886 | | | $ | — | | | $ | — | | | $ | — | | | $ | 36,321,284 | | | $ | — | |
| | | | | | | | | | | | | | | | | | | | | | | | | | | | |
Cost of investments | | $ | 1,753,658,698 | | | $ | 4,183,885,625 | | | $ | 467,042,601 | | | $ | 2,396,603,434 | | | $ | 393,633,917 | | | $ | 1,387,237,316 | | | $ | 266,335,771 | |
Cost of foreign currency | | $ | 80,260 | | | $ | 8,982 | | | $ | — | | | $ | — | | | $ | 63,082 | | | $ | — | | | $ | — | |
| | | | | | | |
(1) Includes Investment in securities on loan, at market value | | $ | 4,357,478 | | | $ | 12,788,151 | | | $ | — | | | $ | — | | | $ | 952,122 | | | $ | 7,766,810 | | | $ | 3,181,546 | |
The accompanying notes are an integral part of these financial statements.
Statements of Assets and Liabilities – (continued)
December 31, 2018
| | | | | | | | | | | | | | | | | | | | | | | | |
| | | Hartford
High Yield
HLS Fund | | | Hartford
International
Opportunities
HLS Fund | | | Hartford
MidCap
HLS Fund | | | Hartford
MidCap
Growth
HLS Fund | | | Hartford
MidCap
Value
HLS Fund | | | Hartford
Small Cap
Growth
HLS Fund | |
Assets: | | | | | | | | | | | | | | | | | | | | | | | | |
Investments in securities, at market value(1) | | $ | 245,768,884 | | | $ | 1,120,467,819 | | | $ | 1,820,484,375 | | | $ | 75,910,779 | | | $ | 283,722,853 | | | $ | 1,154,199,245 | |
Cash | | | — | | | | — | | | | — | | | | — | | | | 7,823 | | | | — | |
Foreign currency | | | — | | | | 100,637 | | | | — | | | | — | | | | — | | | | — | |
Unrealized appreciation on foreign currency contracts | | | 15,850 | | | | — | | | | — | | | | — | | | | — | | | | — | |
Receivables: | | | | | | | | | | | | | | | | | | | | | | | | |
Investment securities sold | | | 73,468 | | | | — | | | | — | | | | 597,600 | | | | 557,080 | | | | 95,641 | |
Fund shares sold | | | 100,010 | | | | 3,660,931 | | | | 12,069,651 | | | | 40,803 | | | | 105,966 | | | | 7,462,516 | |
Dividends and interest | | | 4,119,792 | | | | 1,363,155 | | | | 1,466,505 | | | | 28,000 | | | | 511,422 | | | | 680,908 | |
Securities lending income | | | — | | | | 29,994 | | | | 10,643 | | | | 77 | | | | 1,773 | | | | 13,585 | |
Tax reclaims | | | — | | | | 3,141,955 | | | | — | | | | — | | | | — | | | | — | |
Other assets | | | 16,503 | | | | 15,283 | | | | 12,658 | | | | 21,495 | | | | 17,022 | | | | 17,745 | |
| | | | | | | | | | | | | | | | | | | | | | | | |
Total assets | | | 250,094,507 | | | | 1,128,779,774 | | | | 1,834,043,832 | | | | 76,598,754 | | | | 284,923,939 | | | | 1,162,469,640 | |
| | | | | | | | | | | | | | | | | | | | | | | | |
Liabilities: | | | | | | | | | | | | | | | | | | | | | | | | |
Obligation to return securities lending collateral | | | — | | | | 53,200 | | | | 17,290,587 | | | | 407,951 | | | | 2,064,156 | | | | 43,528,326 | |
Payables: | | | | | | | | | | | | | | | | | | | | | | | | |
Investment securities purchased | | | 274,313 | | | | 6,535,113 | | | | — | | | | — | | | | 819,837 | | | | — | |
Fund shares redeemed | | | 187,695 | | | | 342,378 | | | | 640,801 | | | | 607 | | | | 102,918 | | | | 1,838,066 | |
Investment management fees | | | 151,760 | | | | 682,269 | | | | 1,096,971 | | | | 54,519 | | | | 200,613 | | | | 598,069 | |
Transfer agent fees | | | 873 | | | | 1,291 | | | | 1,423 | | | | 831 | | | | 850 | | | | 1,235 | |
Accounting services fees | | | 3,035 | | | | 13,618 | | | | 22,907 | | | | 954 | | | | 3,511 | | | | 17,687 | |
Board of Directors’ fees | | | 1,653 | | | | 8,541 | | | | 13,552 | | | | 567 | | | | 2,106 | | | | 8,272 | |
Distribution fees | | | 2,409 | | | | 4,912 | | | | 1,857 | | | | 459 | | | | 2,619 | | | | 12,272 | |
Accrued expenses | | | 65,562 | | | | 208,288 | | | | 77,726 | | | | 25,431 | | | | 59,330 | | | | 84,345 | |
| | | | | | | | | | | | | | | | | | | | | | | | |
Total liabilities | | | 687,300 | | | | 7,849,610 | | | | 19,145,824 | | | | 491,319 | | | | 3,255,940 | | | | 46,088,272 | |
| | | | | | | | | | | | | | | | | | | | | | | | |
Net assets | | $ | 249,407,207 | | | $ | 1,120,930,164 | | | $ | 1,814,898,008 | | | $ | 76,107,435 | | | $ | 281,667,999 | | | $ | 1,116,381,368 | |
| | | | | | | | | | | | | | | | | | | | | | | | |
Summary of Net Assets: | | | | | | | | | | | | | | | | | | | | | | | | |
Capital stock andpaid-in-capital | | $ | 270,877,683 | | | $ | 1,179,075,950 | | | $ | 1,374,010,126 | | | $ | 66,262,787 | | | $ | 247,984,087 | | | $ | 974,838,335 | |
Distributable earnings | | | (21,470,476 | ) | | | (58,145,786 | ) | | | 440,887,882 | | | | 9,844,648 | | | | 33,683,912 | | | | 141,543,033 | |
| | | | | | | | | | | | | | | | | | | | | | | | |
Net assets | | $ | 249,407,207 | | | $ | 1,120,930,164 | | | $ | 1,814,898,008 | | | $ | 76,107,435 | | | $ | 281,667,999 | | | $ | 1,116,381,368 | |
| | | | | | | | | | | | | | | | | | | | | | | | |
Shares authorized | | | 2,800,000,000 | | | | 2,825,000,000 | | | | 2,600,000,000 | | | | 900,000,000 | | | | 1,200,000,000 | | | | 700,000,000 | |
| | | | | | | | | | | | | | | | | | | | | | | | |
Par value | | $ | 0.0010 | | | $ | 0.0010 | | | $ | 0.0010 | | | $ | 0.0010 | | | $ | 0.0010 | | | $ | 0.0010 | |
| | | | | | | | | | | | | | | | | | | | | | | | |
Class IA: Net asset value per share | | $ | 7.45 | | | $ | 13.91 | | | $ | 33.77 | | | $ | 7.17 | | | $ | 9.93 | | | $ | 26.76 | |
| | | | | | | | | | | | | | | | | | | | | | | | |
Shares outstanding | | | 25,591,456 | | | | 71,928,197 | | | | 52,367,573 | | | | 9,028,160 | | | | 21,848,917 | | | | 30,035,915 | |
| | | | | | | | | | | | | | | | | | | | | | | | |
Net Assets | | $ | 190,681,212 | | | $ | 1,000,294,744 | | | $ | 1,768,712,228 | | | $ | 64,744,428 | | | $ | 216,867,772 | | | $ | 803,906,613 | |
| | | | | | | | | | | | | | | | | | | | | | | | |
Class IB: Net asset value per share | | $ | 7.32 | | | $ | 14.09 | | | $ | 32.85 | | | $ | 7.12 | | | $ | 9.88 | | | $ | 25.95 | |
| | | | | | | | | | | | | | | | | | | | | | | | |
Shares outstanding | | | 8,022,273 | | | | 8,563,900 | | | | 1,406,107 | | | | 1,595,001 | | | | 6,561,917 | | | | 12,040,807 | |
| | | | | | | | | | | | | | | | | | | | | | | | |
Net Assets | | $ | 58,725,995 | | | $ | 120,635,420 | | | $ | 46,185,780 | | | $ | 11,363,007 | | | $ | 64,800,227 | | | $ | 312,474,755 | |
| | | | | | | | | | | | | | | | | | | | | | | | |
Cost of investments | | $ | 269,731,207 | | | $ | 1,240,539,261 | | | $ | 1,679,985,270 | | | $ | 83,162,205 | | | $ | 287,743,149 | | | $ | 1,229,320,627 | |
Cost of foreign currency | | $ | — | | | $ | 100,736 | | | $ | — | | | $ | — | | | $ | — | | | $ | — | |
| | | | | | |
(1) Includes Investment in securities on loan, at market value | | $ | — | | | $ | 4,459,412 | | | $ | 17,020,702 | | | $ | 406,720 | | | $ | 6,213,738 | | | $ | 43,530,718 | |
The accompanying notes are an integral part of these financial statements.
Statements of Assets and Liabilities – (continued)
December 31, 2018
| | | | | | | | | | | | | | | | | | | | | | | | |
| | | Hartford
Small
Company
HLS Fund | | | Hartford
Stock
HLS Fund | | | Hartford
Total Return
Bond
HLS Fund | | | Hartford
Ultrashort
Bond
HLS Fund | | | Hartford
U.S.
Government
Securities
HLS Fund | | | Hartford
Value
HLS Fund | |
Assets: | | | | | | | | | | | | | | | | | | | | | | | | |
Investments in securities, at market value(1) | | $ | 537,710,153 | | | $ | 1,323,276,598 | | | $ | 2,858,132,970 | | | $ | 508,479,576 | | | $ | 362,750,235 | | | $ | 410,672,518 | |
Cash | | | — | | | | — | | | | — | | | | — | | | | — | | | | 25,411 | |
Foreign currency | | | 5 | | | | — | | | | 248,769 | | | | — | | | | — | | | | 27,161 | |
Unrealized appreciation on OTC swap contracts | | | — | | | | — | | | | 575,601 | | | | — | | | | — | | | | — | |
Unrealized appreciation on foreign currency contracts | | | — | | | | — | | | | 124,519 | | | | — | | | | — | | | | — | |
Receivables: | | | | | | | | | | | | | | | | | | | | | | | | |
Investment securities sold | | | 7,706,502 | | | | 3,858,671 | | | | 431,206,221 | | | | — | | | | 5,649,766 | | | | — | |
Fund shares sold | | | 69,549 | | | | 6,802 | | | | 254,305 | | | | 327,593 | | | | 2,343 | | | | 14,994 | |
Dividends and interest | | | 285,658 | | | | 1,906,373 | | | | 13,015,269 | | | | 1,374,990 | | | | 1,249,980 | | | | 760,919 | |
Securities lending income | | | 6,708 | | | | — | | | | 6,027 | | | | 912 | | | | — | | | | 806 | |
Variation margin on futures contracts | | | — | | | | — | | | | 338,138 | | | | — | | | | 197,130 | | | | — | |
Tax reclaims | | | — | | | | 923,516 | | | | 13,929 | | | | 1,868 | | | | — | | | | 236,253 | |
OTC swap contracts premiums paid | | | — | | | | — | | | | 1,623,782 | | | | — | | | | — | | | | — | |
Other assets | | | 17,777 | | | | 12,442 | | | | 11,035 | | | | 16,801 | | | | 19,300 | | | | 19,221 | |
| | | | | | | | | | | | | | | | | | | | | | | | |
Total assets | | | 545,796,352 | | | | 1,329,984,402 | | | | 3,305,550,565 | | | | 510,201,740 | | | | 369,868,754 | | | | 411,757,283 | |
| | | | | | | | | | | | | | | | | | | | | | | | |
Liabilities: | | | | | | | | | | | | | | | | | | | | | |
Unrealized depreciation on foreign currency contracts | | | — | | | | — | | | | 43,270 | | | | — | | | | — | | | | — | |
Bank overdraft | | | — | | | | — | | | | 92,492 | | | | — | | | | 86,644 | | | | — | |
Obligation to return securities lending collateral | | | 9,034,495 | | | | — | | | | 5,545,320 | | | | 7,631,270 | | | | — | | | | — | |
Unrealized depreciation on OTC swap contracts | | | — | | | | — | | | | 4,164,504 | | | | — | | | | — | | | | — | |
Cash collateral due to broker on swap contracts | | | — | | | | — | | | | 120,000 | | | | — | | | | — | | | | — | |
TBA sale commitments, at market value | | | — | | | | — | | | | 225,144,949 | | | | — | | | | 5,682,342 | | | | — | |
Payables: | | | | | | | | | | | | | | | | | | | | | |
Investment securities purchased | | | 16,121,982 | | | | — | | | | 970,725,581 | | | | — | | | | 17,567,153 | | | | — | |
Fund shares redeemed | | | 704,055 | | | | 7,195,270 | | | | 1,811,998 | | | | 299,565 | | | | 581,610 | | | | 190,488 | |
Investment management fees | | | 343,410 | | | | 564,568 | | | | 846,635 | | | | 169,841 | | | | 131,883 | | | | 243,642 | |
Transfer agent fees | | | 917 | | | | 886 | | | | 945 | | | | 902 | | | | 865 | | | | 937 | |
Accounting services fees | | | 8,310 | | | | 16,408 | | | | 32,379 | | | | 5,944 | | | | 4,103 | | | | 5,089 | |
Board of Directors’ fees | | | 3,836 | | | | 8,645 | | | | 13,099 | | | | 2,917 | | | | 2,170 | | | | 2,906 | |
Variation margin on centrally cleared swap contracts | | | — | | | | — | | | | 860,840 | | | | — | | | | 133,043 | | | | — | |
Distribution fees | | | 1,879 | | | | 4,868 | | | | 8,842 | | | | 2,664 | | | | 2,440 | | | | 2,352 | |
Written options | | | — | | | | — | | | | 902,699 | | | | — | | | | — | | | | — | |
Accrued expenses | | | 77,790 | | | | 145,178 | | | | 233,434 | | | | 69,529 | | | | 93,593 | | | | 67,475 | |
OTC swap contracts premiums received | | | — | | | | — | | | | 8,582,017 | | | | — | | | | — | | | | — | |
| | | | | | | | | | | | | | | | | | | | | | | | |
Total liabilities | | | 26,296,674 | | | | 7,935,823 | | | | 1,219,129,004 | | | | 8,182,632 | | | | 24,285,846 | | | | 512,889 | |
| | | | | | | | | | | | | | | | | | | | | | | | |
Net assets | | $ | 519,499,678 | | | $ | 1,322,048,579 | | | $ | 2,086,421,561 | | | $ | 502,019,108 | | | $ | 345,582,908 | | | $ | 411,244,394 | |
| | | | | | | | | | | | | | | | | | | | | | | | |
Summary of Net Assets: | | | | | | | | | | | | | | | | | | | | | |
Capital stock andpaid-in-capital | | $ | 423,606,945 | | | $ | 979,843,632 | | | $ | 2,087,982,668 | | | $ | 495,215,688 | | | $ | 372,740,506 | | | $ | 324,459,177 | |
Distributable earnings | | | 95,892,733 | | | | 342,204,947 | | | | (1,561,107 | ) | | | 6,803,420 | | | | (27,157,598 | ) | | | 86,785,217 | |
| | | | | | | | | | | | | | | | | | | | | | | | |
Net assets | | $ | 519,499,678 | | | $ | 1,322,048,579 | | | $ | 2,086,421,561 | | | $ | 502,019,108 | | | $ | 345,582,908 | | | $ | 411,244,394 | |
| | | | | | | | | | | | | | | | | | | | | | | | |
Shares authorized | | | 1,500,000,000 | | | | 4,200,000,000 | | | | 5,000,000,000 | | | | 14,000,000,000 | | | | 700,000,000 | | | | 800,000,000 | |
| | | | | | | | | | | | | | | | | | | | | | | | |
Par value | | $ | 0.0010 | | | $ | 0.0010 | | | $ | 0.0010 | | | $ | 0.0010 | | | $ | 0.0010 | | | $ | 0.0010 | |
| | | | | | | | | | | | | | | | | | | | | | | | |
Class IA: Net asset value per share | | $ | 18.38 | | | $ | 78.10 | | | $ | 10.76 | | | $ | 10.10 | | | $ | 10.05 | | | $ | 12.81 | |
| | | | | | | | | | | | | | | | | | | | | | | | |
Shares outstanding | | | 25,745,116 | | | | 15,388,113 | | | | 173,988,565 | | | | 43,291,935 | | | | 28,484,329 | | | | 27,570,093 | |
| | | | | | | | | | | | | | | | | | | | | | | | |
Net Assets | | $ | 473,098,063 | | | $ | 1,201,873,020 | | | $ | 1,871,298,689 | | | $ | 437,159,700 | | | $ | 286,242,615 | | | $ | 353,040,089 | |
| | | | | | | | | | | | | | | | | | | | | | | | |
Class IB: Net asset value per share | | $ | 16.94 | | | $ | 78.11 | | | $ | 10.70 | | | $ | 10.09 | | | $ | 10.04 | | | $ | 12.79 | |
| | | | | | | | | | | | | | | | | | | | | | | | |
Shares outstanding | | | 2,738,519 | | | | 1,538,564 | | | | 20,108,290 | | | | 6,427,109 | | | | 5,911,399 | | | | 4,549,860 | |
| | | | | | | | | | | | | | | | | | | | | | | | |
Net Assets | | $ | 46,401,615 | | | $ | 120,175,559 | | | $ | 215,122,872 | | | $ | 64,859,408 | | | $ | 59,340,293 | | | $ | 58,204,305 | |
| | | | | | | | | | | | | | | | | | | | | | | | |
Cost of investments | | $ | 550,757,370 | | | $ | 1,097,774,593 | | | $ | 2,898,170,933 | | | $ | 509,739,202 | | | $ | 365,180,701 | | | $ | 366,699,637 | |
Cost of foreign currency | | $ | 5 | | | $ | — | | | $ | 250,647 | | | $ | — | | | $ | — | | | $ | 27,148 | |
Proceeds of TBA sale commitments | | $ | — | | | $ | — | | | $ | 223,510,608 | | | $ | — | | | $ | 5,649,766 | | | $ | — | |
Proceeds of written option contracts | | $ | — | | | $ | — | | | $ | 677,762 | | | $ | — | | | $ | — | | | $ | — | |
| | | | | | |
(1) Includes Investment in securities on loan, at market value | | $ | 8,978,711 | | | $ | — | | | $ | 5,298,633 | | | $ | 7,467,045 | | | $ | — | | | $ | — | |
The accompanying notes are an integral part of these financial statements.
Statements of Operations
For the Year Ended December 31, 2018
| | | | | | | | | | | | | | | | | | | | | | | | | | | | |
| | | Hartford
Balanced
HLS Fund | | | Hartford
Capital
Appreciation
HLS Fund | | | Hartford
Disciplined
Equity
HLS Fund | | | Hartford
Dividend
and Growth
HLS Fund | | | Hartford
Global
Growth
HLS Fund | | | Hartford
Growth
Opportunities
HLS Fund | | | Hartford
Healthcare
HLS Fund | |
Investment Income: | | | | | | | | | | | | | | | | | | | | | | | | | | | | |
Dividends | | $ | 32,475,347 | | | $ | 81,007,182 | | | $ | 9,915,122 | | | $ | 85,988,078 | | | $ | 6,410,519 | | | $ | 7,953,214 | | | $ | 2,740,859 | |
Interest | | | 24,788,604 | | | | 1,099,465 | | | | 62,674 | | | | 900,679 | | | | 102,217 | | | | 180,180 | | | | 147,702 | |
Securities lending | | | 74,664 | | | | 299,794 | | | | 44 | | | | 16,660 | | | | 18,098 | | | | 252,366 | | | | 53,634 | |
Less: Foreign tax withheld | | | (532,049 | ) | | | (1,256,115 | ) | | | — | | | | (769,504 | ) | | | (314,289 | ) | | | (44,931 | ) | | | (30,568 | ) |
| | | | | | | | | | | | | | | | | | | | | | | | | | | | |
Total investment income, net | | | 56,806,566 | | | | 81,150,326 | | | | 9,977,840 | | | | 86,135,913 | | | | 6,216,545 | | | | 8,340,829 | | | | 2,911,627 | |
| | | | | | | | | | | | | | | | | | | | | | | | | | | | |
Expenses: | | | | | | | | | | | | | | | | | | | | | | | | | | | | |
Investment management fees | | | 13,883,801 | | | | 30,606,967 | | | | 4,875,888 | | | | 22,168,396 | | | | 3,957,602 | | | | 9,562,267 | | | | 2,772,445 | |
Administrative services fees | | | | | | | | | | | | | | | | | | | | | | | | | | | | |
Class IC | | | — | | | | 76,494 | | | | — | | | | — | | | | — | | | | 95,329 | | | | — | |
Transfer agent fees | | | | | | | | | | | | | | | | | | | | | | | | | | | | |
Class IA | | | 5,023 | | | | 7,392 | | | | 4,787 | | | | 5,252 | | | | 4,668 | | | | 7,133 | | | | 4,934 | |
Class IB | | | 670 | | | | 913 | | | | 659 | | | | 726 | | | | 898 | | | | 801 | | | | 736 | |
Class IC | | | — | | | | 54 | | | | — | | | | — | | | | — | | | | 197 | | | | — | |
Distribution fees | | | | | | | | | | | | | | | | | | | | | | | | | | | | |
Class IB | | | 656,306 | | | | 1,304,058 | | | | 201,853 | | | | 1,036,585 | | | | 214,185 | | | | 388,298 | | | | 107,523 | |
Class IC | | | — | | | | 76,494 | | | | — | | | | — | | | | — | | | | 95,329 | | | | — | |
Custodian fees | | | 19,102 | | | | 63,480 | | | | 5,063 | | | | 9,431 | | | | 21,107 | | | | 40,792 | | | | 6,172 | |
Registration and filing fees | | | 34,545 | | | | 45,625 | | | | 32,867 | | | | 33,631 | | | | 32,862 | | | | 46,342 | | | | 33,163 | |
Accounting services fees | | | 401,485 | | | | 808,571 | | | | 93,352 | | | | 477,499 | | | | 74,352 | | | | 283,868 | | | | 46,330 | |
Board of Directors’ fees | | | 66,655 | | | | 142,730 | | | | 19,986 | | | | 102,437 | | | | 16,024 | | | | 47,243 | | | | 9,786 | |
Audit fees | | | 31,079 | | | | 62,171 | | | | 21,480 | | | | 20,945 | | | | 45,539 | | | | 45,099 | | | | 32,393 | |
Other expenses | | | 245,215 | | | | 492,096 | | | | 127,750 | | | | 361,054 | | | | 87,867 | | | | 217,252 | | | | 29,013 | |
| | | | | | | | | | | | | | | | | | | | | | | | | | | | |
Total expenses (before waivers and fees paid indirectly) | | | 15,343,881 | | | | 33,687,045 | | | | 5,383,685 | | | | 24,215,956 | | | | 4,455,104 | | | | 10,829,950 | | | | 3,042,495 | |
| | | | | | | | | | | | | | | | | | | | | | | | | | | | |
Management fee waivers | | | (669,141 | ) | | | — | | | | — | | | | — | | | | — | | | | — | | | | — | |
Commission recapture | | | (7,184 | ) | | | (38,534 | ) | | | (570 | ) | | | (18,866 | ) | | | (3,321 | ) | | | (19,394 | ) | | | (1,257 | ) |
| | | | | | | | | | | | | | | | | | | | | | | | | | | | |
Total waivers and fees paid indirectly | | | (676,325 | ) | | | (38,534 | ) | | | (570 | ) | | | (18,866 | ) | | | (3,321 | ) | | | (19,394 | ) | | | (1,257 | ) |
| | | | | | | | | | | | | | | | | | | | | | | | | | | | |
Total expenses, net | | | 14,667,556 | | | | 33,648,511 | | | | 5,383,115 | | | | 24,197,090 | | | | 4,451,783 | | | | 10,810,556 | | | | 3,041,238 | |
| | | | | | | | | | | | | | | | | | | | | | | | | | | | |
Net Investment Income (Loss) | | | 42,139,010 | | | | 47,501,815 | | | | 4,594,725 | | | | 61,938,823 | | | | 1,764,762 | | | | (2,469,727 | ) | | | (129,611 | ) |
| | | | | | | | | | | | | �� | | | | | | | | | | | | | | | |
Net Realized Gain (Loss) on Investments, Other Financial Instruments and Foreign Currency Transactions: | | | | | | | | | | | | | | | | | | | | | | | | | | | | |
Net realized gain (loss) on investments | | | 180,416,285 | | | | 506,754,652 | | | | 72,774,676 | | | | 372,863,845 | | | | 68,693,851 | | | | 314,671,672 | | | | 31,458,838 | |
Net realized gain (loss) on futures contracts | | | 2,257,919 | | | | (3,280,817 | ) | | | — | | | | — | | | | — | | | | — | | | | — | |
Net realized gain (loss) on foreign currency contracts | | | — | | | | 627,283 | | | | — | | | | — | | | | — | | | | — | | | | — | |
Net realized gain (loss) on other foreign currency transactions | | | (17,697 | ) | | | (267,672 | ) | | | — | | | | 9,402 | | | | (21,769 | ) | | | (24,689 | ) | | | 1,770 | |
| | | | | | | | | | | | | | | | | | | | | | | | | | | | |
Net Realized Gain (Loss) on Investments, Other Financial Instruments and Foreign Currency Transactions | | | 182,656,507 | | | | 503,833,446 | | | | 72,774,676 | | | | 372,873,247 | | | | 68,672,082 | | | | 314,646,983 | | | | 31,460,608 | |
| | | | | | | | | | | | | | | | | | | | | | | | | | | | |
Net Changes in Unrealized Appreciation (Depreciation) of Investments, Other Financial Instruments and Foreign Currency Transactions: | | | | | | | | | | | | | | | | | | | | | | | | | | | | |
Net unrealized appreciation (depreciation) of investments | | | (330,766,428 | ) | | | (826,839,388 | ) | | | (83,373,336 | ) | | | (593,173,572 | ) | | | (85,373,872 | ) | | | (288,645,717 | ) | | | (37,552,465 | ) |
Net unrealized appreciation (depreciation) of futures contracts | | | (10,187 | ) | | | (2,656,926 | ) | | | — | | | | — | | | | — | | | | — | | | | — | |
Net unrealized appreciation (depreciation) of foreign currency contracts | | | — | | | | (115,379 | ) | | | — | | | | — | | | | — | | | | — | | | | — | |
Net unrealized appreciation (depreciation) of translation of other assets and liabilities in foreign currencies | | | (6,963 | ) | | | (39,731 | ) | | | — | | | | (10,243 | ) | | | (15,663 | ) | | | (2,009 | ) | | | 665 | |
| | | | | | | | | | | | | | | | | | | | | | | | | | | | |
Net Changes in Unrealized Appreciation (Depreciation) of Investments, Other Financial Instruments and Foreign Currency Transactions | | | (330,783,578 | ) | | | (829,651,424 | ) | | | (83,373,336 | ) | | | (593,183,815 | ) | | | (85,389,535 | ) | | | (288,647,726 | ) | | | (37,551,800 | ) |
| | | | | | | | | | | | | | | | | | | | | | | | | | | | |
Net Gain (Loss) on Investments, Other Financial Instruments and Foreign Currency Transactions | | | (148,127,071 | ) | | | (325,817,978 | ) | | | (10,598,660 | ) | | | (220,310,568 | ) | | | (16,717,453 | ) | | | 25,999,257 | | | | (6,091,192 | ) |
| | | | | | | | | | | | | | | | | | | | | | | | | | | | |
Net Increase (Decrease) in Net Assets Resulting from Operations | | $ | (105,988,061 | ) | | $ | (278,316,163 | ) | | $ | (6,003,935 | ) | | $ | (158,371,745 | ) | | $ | (14,952,691 | ) | | $ | 23,529,530 | | | $ | (6,220,803 | ) |
| | | | | | | | | | | | | | | | | | | | | | | | | | | | |
The accompanying notes are an integral part of these financial statements.
Statements of Operations – (continued)
For the Year Ended December 31, 2018
| | | | | | | | | | | | | | | | | | | | | | | | |
| | | Hartford
High Yield
HLS Fund | | | Hartford
International
Opportunities
HLS Fund | | | Hartford
MidCap
HLS Fund | | | Hartford
MidCap
Growth
HLS Fund | | | Hartford
MidCap
Value
HLS Fund | | | Hartford
Small Cap
Growth
HLS Fund | |
Investment Income: | | | | | | | | | | | | | | | | | | | | | | | | |
Dividends | | $ | 33,233 | | | $ | 35,515,686 | | | $ | 16,266,674 | | | $ | 1,014,357 | | | $ | 5,081,008 | | | $ | 7,824,188 | |
Interest | | | 17,229,488 | | | | 579,902 | | | | 43,708 | | | | 15,441 | | | | 94,175 | | | | 309,975 | |
Securities lending | | | — | | | | 171,097 | | | | 137,463 | | | | 6,574 | | | | 50,882 | | | | 203,827 | |
Less: Foreign tax withheld | | | — | | | | (3,408,255 | ) | | | (80,121 | ) | | | (2,935 | ) | | | (45,944 | ) | | | (2,774 | ) |
| | | | | | | | | | | | | | | | | | | | | | | | |
Total investment income, net | | | 17,262,721 | | | | 32,858,430 | | | | 16,367,724 | | | | 1,033,437 | | | | 5,180,121 | | | | 8,335,216 | |
| | | | | | | | | | | | | | | | | | | | | | | | |
Expenses: | | | | | | | | | | | | | | | | | | | | | | | | |
Investment management fees | | | 1,960,785 | | | | 9,878,165 | | | | 14,984,752 | | | | 745,737 | | | | 2,791,354 | | | | 8,248,353 | |
Transfer agent fees | | | | | | | | | | | | | | | | | | | | | | | | |
Class IA | | | 4,002 | | | | 6,728 | | | | 8,438 | | | | 4,252 | | | | 3,935 | | | | 5,397 | |
Class IB | | | 1,239 | | | | 781 | | | | 218 | | | | 752 | | | | 1,186 | | | | 2,065 | |
Distribution fees | | | | | | | | | | | | | | | | | | | | | | | | |
Class IB | | | 165,624 | | | | 372,787 | | | | 142,648 | | | | 35,040 | | | | 202,046 | | | | 939,840 | |
Custodian fees | | | 7,579 | | | | 103,208 | | | | 13,353 | | | | 3,355 | | | | 8,489 | | | | 9,227 | |
Registration and filing fees | | | 32,229 | | | | 37,088 | | | | 45,683 | | | | 31,406 | | | | 33,316 | | | | 37,222 | |
Accounting services fees | | | 39,216 | | | | 201,671 | | | | 316,058 | | | | 13,050 | | | | 48,849 | | | | 244,451 | |
Board of Directors’ fees | | | 8,312 | | | | 44,741 | | | | 68,349 | | | | 2,822 | | | | 10,551 | | | | 41,015 | |
Audit fees | | | 31,544 | | | | 46,900 | | | | 21,422 | | | | 21,945 | | | | 21,745 | | | | 21,623 | |
Other expenses | | | 69,930 | | | | 223,618 | | | | 177,776 | | | | 23,891 | | | | 59,781 | | | | 112,917 | |
| | | | | | | | | | | | | | | | | | | | | | | | |
Total expenses (before waivers and fees paid indirectly) | | | 2,320,460 | | | | 10,915,687 | | | | 15,778,697 | | | | 882,250 | | | | 3,181,252 | | | | 9,662,110 | |
| | | | | | | | | | | | | | | | | | | | | | | | |
Commission recapture | | | — | | | | (28,061 | ) | | | (8,370 | ) | | | — | | | | (4,615 | ) | | | (6,727 | ) |
| | | | | | | | | | | | | | | | | | | | | | | | |
Total waivers and fees paid indirectly | | | — | | | | (28,061 | ) | | | (8,370 | ) | | | — | | | | (4,615 | ) | | | (6,727 | ) |
| | | | | | | | | | | | | | | | | | | | | | | | |
Total expenses, net | | | 2,320,460 | | | | 10,887,626 | | | | 15,770,327 | | | | 882,250 | | | | 3,176,637 | | | | 9,655,383 | |
| | | | | | | | | | | | | | | | | | | | | | | | |
Net Investment Income (Loss) | | | 14,942,261 | | | | 21,970,804 | | | | 597,397 | | | | 151,187 | | | | 2,003,484 | | | | (1,320,167 | ) |
| | | | | | | | | | | | | | | | | | | | | | | | |
Net Realized Gain (Loss) on Investments, Other Financial Instruments and Foreign Currency Transactions: | | | | | | | | | | | | | | | | | | | | | | | | |
Net realized gain (loss) on investments | | | 2,828,754 | | | | 46,526,507 | | | | 313,603,919 | | | | 16,823,323 | | | | 39,205,536 | | | | 219,253,261 | |
Net realized gain (loss) on foreign currency contracts | | | 311,327 | | | | — | | | | — | | | | — | | | | — | | | | — | |
Net realized gain (loss) on other foreign currency transactions | | | (10,982 | ) | | | (669,193 | ) | | | (2,850 | ) | | | — | | | | (111,181 | ) | | | — | |
| | | | | | | | | | | | | | | | | | | | | | | | |
Net Realized Gain (Loss) on Investments, Other Financial Instruments and Foreign Currency Transactions | | | 3,129,099 | | | | 45,857,314 | | | | 313,601,069 | | | | 16,823,323 | | | | 39,094,355 | | | | 219,253,261 | |
| | | | | | | | | | | | | | | | | | | | | | | | |
Net Changes in Unrealized Appreciation (Depreciation) of Investments, Other Financial Instruments and Foreign Currency Transactions: | | | | | | | | | | | | | | | | | | | | | | | | |
Net unrealized appreciation (depreciation) of investments | | | (27,155,534 | ) | | | (332,581,427 | ) | | | (453,906,710 | ) | | | (25,371,110 | ) | | | (89,946,212 | ) | | | (363,380,245 | ) |
Net unrealized appreciation (depreciation) of foreign currency contracts | | | 76,393 | | | | — | | | | — | | | | — | | | | — | | | | — | |
Net unrealized appreciation (depreciation) of translation of other assets and liabilities in foreign currencies | | | (1,040 | ) | | | (67,720 | ) | | | — | | | | — | | | | 1,215 | | | | — | |
| | | | | | | | | | | | | | | | | | | | | | | | |
Net Changes in Unrealized Appreciation (Depreciation) of Investments, Other Financial Instruments and Foreign Currency Transactions | | | (27,080,181 | ) | | | (332,649,147 | ) | | | (453,906,710 | ) | | | (25,371,110 | ) | | | (89,944,997 | ) | | | (363,380,245) | |
| | | | | | | | | | | | | | | | | | | | | | | | |
Net Gain (Loss) on Investments, Other Financial Instruments and Foreign Currency Transactions | | | (23,951,082 | ) | | | (286,791,833 | ) | | | (140,305,641 | ) | | | (8,547,787 | ) | | | (50,850,642 | ) | | | (144,126,984 | ) |
| | | | | | | | | | | | | | | | | | | | | | | | |
Net Increase (Decrease) in Net Assets Resulting from Operations | | $ | (9,008,821 | ) | | $ | (264,821,029 | ) | | $ | (139,708,244 | ) | | $ | (8,396,600 | ) | | $ | (48,847,158 | ) | | $ | (145,447,151 | ) |
| | | | | | | | | | | | | | | | | | | | | | | | |
The accompanying notes are an integral part of these financial statements.
Statements of Operations – (continued)
For the Year Ended December 31, 2018
| | | | | | | | | | | | | | | | | | | | | | | | |
| | | Hartford
Small
Company
HLS Fund | | | Hartford
Stock
HLS Fund | | | Hartford
Total Return
Bond
HLS Fund | | | Hartford
Ultrashort
Bond
HLS Fund | | | Hartford
U.S.
Government
Securities
HLS Fund | | | Hartford
Value
HLS Fund | |
Investment Income: | | | | | | | | | | | | | | | | | | | | | | | | |
Dividends | | $ | 1,661,898 | | | $ | 30,831,798 | | | $ | 89,460 | | | $ | — | | | $ | — | | | $ | 12,341,520 | |
Interest | | | 200,890 | | | | 368,476 | | | | 83,715,797 | | | | 11,183,888 | | | | 9,633,689 | | | | 106,470 | |
Securities lending | | | 69,867 | | | | — | | | | 51,527 | | | | 6,710 | | | | — | | | | 12,704 | |
Less: Foreign tax withheld | | | — | | | | (105,685 | ) | | | — | | | | (2,993 | ) | | | — | | | | (160,034 | ) |
| | | | | | | | | | | | | | | | | | | | | | | | |
Total investment income, net | | | 1,932,655 | | | | 31,094,589 | | | | 83,856,784 | | | | 11,187,605 | | | | 9,633,689 | | | | 12,300,660 | |
| | | | | | | | | | | | | | | | | | | | | | | | |
Expenses: | | | | | | | | | | | | | | | | | | | | | | | | |
Investment management fees | | | 4,596,041 | | | | 7,068,904 | | | | 10,527,975 | | | | 2,019,160 | | | | 1,664,695 | | | | 3,257,727 | |
Transfer agent fees | | | | | | | | | | | | | | | | | | | | | | | | |
Class IA | | | 5,011 | | | | 4,857 | | | | 5,145 | | | | 4,785 | | | | 4,310 | | | | 4,831 | |
Class IB | | | 505 | | | | 493 | | | | 590 | | | | 688 | | | | 913 | | | | 806 | |
Distribution fees | | | | | | | | | | | | | | | | | | | | | | | | |
Class IB | | | 143,051 | | | | 339,892 | | | | 577,002 | | | | 158,665 | | | | 161,711 | | | | 174,810 | |
Custodian fees | | | 12,197 | | | | 5,600 | | | | 49,304 | | | | 4,420 | | | | 6,457 | | | | 3,639 | |
Registration and filing fees | | | 35,245 | | | | 33,859 | | | | 34,521 | | | | 32,833 | | | | 35,002 | | | | 32,519 | |
Accounting services fees | | | 112,563 | | | | 206,310 | | | | 403,619 | | | | 70,671 | | | | 51,791 | | | | 68,409 | |
Board of Directors’ fees | | | 18,382 | | | | 43,663 | | | | 66,328 | | | | 14,699 | | | | 10,909 | | | | 14,691 | |
Audit fees | | | 46,821 | | | | 30,773 | | | | 51,443 | | | | 31,388 | | | | 44,573 | | | | 21,768 | |
Other expenses | | | 93,098 | | | | 192,245 | | | | 317,231 | | | | 83,459 | | | | 106,397 | | | | 84,888 | |
| | | | | | | | | | | | | | | | | | | | | | | | |
Total expenses (before waivers and fees paid indirectly) | | | 5,062,914 | | | | 7,926,596 | | | | 12,033,158 | | | | 2,420,768 | | | | 2,086,758 | | | | 3,664,088 | |
| | | | | | | | | | | | | | | | | | | | | | | | |
Commission recapture | | | (18,084 | ) | | | (996 | ) | | | — | | | | — | | | | — | | | | (2,239 | ) |
| | | | | | | | | | | | | | | | | | | | | | | | |
Total waivers and fees paid indirectly | | | (18,084 | ) | | | (996 | ) | | | — | | | | — | | | | — | | | | (2,239 | ) |
| | | | | | | | | | | | | | | | | | | | | | | | |
Total expenses, net | | | 5,044,830 | | | | 7,925,600 | | | | 12,033,158 | | | | 2,420,768 | | | | 2,086,758 | | | | 3,661,849 | |
| | | | | | | | | | | | | | | | | | | | | | | | |
Net Investment Income (Loss) | | | (3,112,175 | ) | | | 23,168,989 | | | | 71,823,626 | | | | 8,766,837 | | | | 7,546,931 | | | | 8,638,811 | |
| | | | | | | | | | | | | | | | | | | | | | | | |
Net Realized Gain (Loss) on Investments, Other Financial Instruments and Foreign Currency Transactions: | | | | | | | | | | | | | | | | | | | | | | | | |
Net realized gain (loss) on investments | | | 113,780,251 | | | | 120,033,221 | | | | (16,429,142 | ) | | | (18,669 | ) | | | (3,269,319 | ) | | | 48,093,227 | |
Net realized gain (loss) on purchased options contracts | | | — | | | | — | | | | 385,075 | | | | — | | | | — | | | | — | |
Net realized gain (loss) on futures contracts | | | — | | | | — | | | | (23,920,328 | ) | | | — | | | | (3,417,130 | ) | | | — | |
Net realized gain (loss) on written options contracts | | | — | | | | — | | | | 1,094,667 | | | | — | | | | (96,204 | ) | | | — | |
Net realized gain (loss) on swap contracts | | | — | | | | — | | | | 2,155,275 | | | | — | | | | 1,140,952 | | | | — | |
Net realized gain (loss) on foreign currency contracts | | | — | | | | — | | | | (854,578 | ) | | | — | | | | — | | | | — | |
Net realized gain (loss) on other foreign currency transactions | | | 812 | | | | (13,010 | ) | | | (241,362 | ) | | | — | | | | — | | | | (13,541 | ) |
| | | | | | | | | | | | | | | | | | | | | | | | |
Net Realized Gain (Loss) on Investments, Other Financial Instruments and Foreign Currency Transactions | | | 113,781,063 | | | | 120,020,211 | | | | (37,810,393 | ) | | | (18,669 | ) | | | (5,641,701 | ) | | | 48,079,686 | |
| | | | | | | | | | | | | | | | | | | | | | | | |
Net Changes in Unrealized Appreciation (Depreciation) of Investments, Other Financial Instruments and Foreign Currency Transactions: | | | | | | | | | | | | | | | | | | | | | | | | |
Net unrealized appreciation (depreciation) of investments | | | (127,972,764 | ) | | | (138,534,419 | ) | | | (59,167,865 | ) | | | (1,061,293 | ) | | | (1,479,925 | ) | | | (103,389,323 | ) |
Net unrealized appreciation (depreciation) of purchased options contracts | | | — | | | | — | | | | (908,053 | ) | | | — | | | | — | | | | — | |
Net unrealized appreciation (depreciation) of futures contracts | | | — | | | | — | | | | 7,758,743 | | | | — | | | | 1,997,765 | | | | — | |
Net unrealized appreciation (depreciation) of written options contracts | | | — | | | | — | | | | (224,937 | ) | | | — | | | | — | | | | — | |
Net unrealized appreciation (depreciation) of swap contracts | | | — | | | | — | | | | (2,351,579 | ) | | | — | | | | (289,737 | ) | | | — | |
Net unrealized appreciation (depreciation) of foreign currency contracts | | | — | | | | — | | | | 562,943 | | | | — | | | | — | | | | — | |
Net unrealized appreciation (depreciation) of translation of other assets and liabilities in foreign currencies | | | — | | | | (11,348 | ) | | | (20,853 | ) | | | — | | | | — | | | | (5,236 | ) |
| | | | | | | | | | | | | | | | | | | | | | | | |
Net Changes in Unrealized Appreciation (Depreciation) of Investments, Other Financial Instruments and Foreign Currency Transactions | | | (127,972,764) | | | | (138,545,767 | ) | | | (54,351,601 | ) | | | (1,061,293 | ) | | | 228,103 | | | | (103,394,559 | ) |
| | | | | | | | | | | | | | | | | | | | | | | | |
Net Gain (Loss) on Investments, Other Financial Instruments and Foreign Currency Transactions | | | (14,191,701 | ) | | | (18,525,556 | ) | | | (92,161,994 | ) | | | (1,079,962 | ) | | | (5,413,598 | ) | | | (55,314,873 | ) |
| | | | | | | | | | | | | | | | | | | | | | | | |
Net Increase (Decrease) in Net Assets Resulting from Operations | | $ | (17,303,876 | ) | | $ | 4,643,433 | | | $ | (20,338,368 | ) | | $ | 7,686,875 | | | $ | 2,133,333 | | | $ | (46,676,062 | ) |
| | | | | | | | | | | | | | | | | | | | | | | | |
The accompanying notes are an integral part of these financial statements.
Statements of Changes in Net Assets
| | | | | | | | | | | | | | | | | | | | | | | | |
| | | Hartford Balanced
HLS Fund | | | Hartford Capital Appreciation
HLS Fund | | | Hartford Disciplined Equity
HLS Fund | |
| | | For the
Year Ended
December 31,
2018 | | | For the
Year Ended
December 31,
2017 | | | For the
Year Ended
December 31,
2018 | | | For the
Year Ended
December 31,
2017 | | | For the
Year Ended
December 31,
2018 | | | For the
Year Ended
December 31,
2017 | |
Operations: | | | | | | | | | | | | | | | | | |
Net investment income (loss) | | $ | 42,139,010 | | | $ | 42,692,836 | | | $ | 47,501,815 | | | $ | 45,424,632 | | | $ | 4,594,725 | | | $ | 6,623,756 | |
Net realized gain (loss) on investments, other financial instruments and foreign currency transactions | | | 182,656,507 | | | | 173,385,809 | | | | 503,833,446 | | | | 641,921,865 | | | | 72,774,676 | | | | 66,406,606 | |
Net changes in unrealized appreciation (depreciation) of investments, other financial instruments and foreign currency transactions | | | (330,783,578 | ) | | | 122,002,272 | | | | (829,651,424 | ) | | | 340,712,360 | | | | (83,373,336 | ) | | | 61,943,262 | |
| | | | | | | | | | | | | | | | | | | | | | | | |
Net Increase (Decrease) in Net Assets Resulting from Operations | | | (105,988,061 | ) | | | 338,080,917 | | | | (278,316,163 | ) | | | 1,028,058,857 | | | | (6,003,935 | ) | | | 134,973,624 | |
| | | | | | | | | | | | | | | | | | | | | | | | |
Distributions to Shareholders:(1) | | | | | | | | | | | | | | | | | | | | | | | | |
Class IA | | | (123,979,008 | ) | | | (47,464,119 | ) | | | (454,718,791 | ) | | | (280,000,593 | ) | | | (59,926,122 | ) | | | (69,277,938 | ) |
Class IB | | | (15,722,695 | ) | | | (5,534,060 | ) | | | (55,433,183 | ) | | | (35,014,412 | ) | | | (8,120,313 | ) | | | (9,451,480 | ) |
Class IC | | | — | | | | — | | | | (3,306,481 | ) | | | (1,722,982 | ) | | | — | | | | — | |
| | | | | | | | | | | | | | | | | | | | | | | | |
Total distributions | | | (139,701,703 | ) | | | (52,998,179 | ) | | | (513,458,455 | ) | | | (316,737,987 | ) | | | (68,046,435 | ) | | | (78,729,418 | ) |
| | | | | | | | | | | | | | | | | | | | | | | | |
Capital Share Transactions: | | | | | | | | | | | | | | | | | |
Sold | | | 17,623,057 | | | | 27,191,961 | | | | 41,412,513 | | | | 80,762,993 | | | | 8,267,277 | | | | 6,573,433 | |
Issued on reinvestment of distributions | | | 139,701,703 | | | | 52,998,179 | | | | 513,458,455 | | | | 316,737,987 | | | | 68,046,434 | | | | 78,729,418 | |
Redeemed | | | (337,066,656 | ) | | | (311,772,955 | ) | | | (817,092,381 | ) | | | (1,186,680,309 | ) | | | (129,497,572 | ) | | | (112,526,090 | ) |
| | | | | | | | | | | | | | | | | | | | | | | | |
Net (decrease) from capital share transactions | | | (179,741,896 | ) | | | (231,582,815 | ) | | | (262,221,413 | ) | | | (789,179,329 | ) | | | (53,183,861 | ) | | | (27,223,239 | ) |
| | | | | | | | | | | | | | | | | | | | | | | | |
Net Increase (Decrease) in Net Assets | | | (425,431,660 | ) | | | 53,499,923 | | | | (1,053,996,031 | ) | | | (77,858,459 | ) | | | (127,234,231 | ) | | | 29,020,967 | |
| | | | | | | | | | | | | | | | | | | | | | | | |
Net Assets: | | | | | | | | | | | | | | | | | |
Beginning of period | | | 2,372,981,038 | | | | 2,319,481,115 | | | | 5,057,196,014 | | | | 5,135,054,473 | | | | 697,414,477 | | | | 668,393,510 | |
| | | | | | | | | | | | | | | | | | | | | | | | |
End of period | | $ | 1,947,549,378 | | | $ | 2,372,981,038 | | | $ | 4,003,199,983 | | | $ | 5,057,196,014 | | | $ | 570,180,246 | | | $ | 697,414,477 | |
| | | | | | | | | | | | | | | | | | | | | | | | |
| (1) | Per the Securities and Exchange Commission Release #33-10532 “Disclosure Update and Simplification”, it is no longer required to differentiate distributions from earnings as either net investment income or net realized capital gains or disclose the Fund’s undistributed net investment income within the Fund’s Statement of Changes in Net Assets. The presentation within the Fund’s Statement of Changes in Net Assets for the year ended December 31, 2017 has been modified accordingly. See Note 2, Significant Accounting Policies, in Notes to Financial Statements for additional information. |
The accompanying notes are an integral part of these financial statements.
Statements of Changes in Net Assets – (continued)
| | | | | | | | | | | | | | | | | | | | | | | | |
| | | Hartford Dividend and Growth
HLS Fund | | | Hartford Global Growth
HLS Fund | | | Hartford Growth Opportunities
HLS Fund | |
| | | For the
Year Ended
December 31,
2018 | | | For the
Year Ended
December 31,
2017 | | | For the
Year Ended
December 31,
2018 | | | For the
Year Ended
December 31,
2017 | | | For the
Year Ended
December 31,
2018 | | | For the
Year Ended
December 31,
2017 | |
Operations: | | | | | | | | | | | | | | | | | |
Net investment income (loss) | | $ | 61,938,823 | | | $ | 60,240,785 | | | $ | 1,764,762 | | | $ | 2,465,165 | | | $ | (2,469,727 | ) | | $ | (2,643,363 | ) |
Net realized gain (loss) on investments, other financial instruments and foreign currency transactions | | | 372,873,247 | | | | 372,570,368 | | | | 68,672,082 | | | | 43,958,518 | | | | 314,646,983 | | | | 215,967,758 | |
Net changes in unrealized appreciation (depreciation) of investments, other financial instruments and foreign currency transactions | | | (593,183,815 | ) | | | 160,622,809 | | | | (85,389,535 | ) | | | 86,452,802 | | | | (288,647,726 | ) | | | 164,605,261 | |
| | | | | | | | | | | | | | | | | | | | | | | | |
Net Increase (Decrease) in Net Assets Resulting from Operations | | | (158,371,745 | ) | | | 593,433,962 | | | | (14,952,691 | ) | | | 132,876,485 | | | | 23,529,530 | | | | 377,929,656 | |
| | | | | | | | | | | | | | | | | | | | | | | | |
Distributions to Shareholders:(1) | | | | | | | | | | | | | | | | | | | | | | | | |
Class IA | | | (367,065,830 | ) | | | (261,460,717 | ) | | | (38,893,548 | ) | | | (20,798,629 | ) | | | (183,161,141 | ) | | | (16,106,762 | ) |
Class IB | | | (50,078,265 | ) | | | (35,652,496 | ) | | | (7,324,732 | ) | | | (3,981,855 | ) | | | (21,414,890 | ) | | | (1,881,415 | ) |
Class IC | | | — | | | | — | | | | — | | | | — | | | | (5,228,239 | ) | | | (403,653 | ) |
| | | | | | | | | | | | | | | | | | | | | | | | |
Total distributions | | | (417,144,095 | ) | | | (297,113,213 | ) | | | (46,218,280 | ) | | | (24,780,484 | ) | | | (209,804,270 | ) | | | (18,391,830 | ) |
| | | | | | | | | | | | | | | | | | | | | | | | |
Capital Share Transactions: | | | | | | | | | | | | | | | | | |
Sold | | | 61,469,849 | | | | 104,640,250 | | | | 36,885,058 | | | | 35,466,468 | | | | 50,069,414 | | | | 46,904,728 | |
Issued on reinvestment of distributions | | | 417,144,095 | | | | 297,113,212 | | | | 46,218,280 | | | | 24,780,485 | | | | 209,804,270 | | | | 18,391,829 | |
Redeemed | | | (561,723,069 | ) | | | (530,411,682 | ) | | | (91,759,918 | ) | | | (71,226,539 | ) | | | (225,579,813 | ) | | | (218,264,877 | ) |
| | | | | | | | | | | | | | | | | | | | | | | | |
Net (decrease) from capital share transactions | | | (83,109,125 | ) | | | (128,658,220 | ) | | | (8,656,580 | ) | | | (10,979,586 | ) | | | 34,293,871 | | | | (152,968,320 | ) |
| | | | | | | | | | | | | | | | | | | | | | | | |
Net Increase (Decrease) in Net Assets | | | (658,624,965 | ) | | | 167,662,529 | | | | (69,827,551 | ) | | | 97,116,415 | | | | (151,980,869 | ) | | | 206,569,506 | |
| | | | | | | | | | | | | | | | | | | | | | | | |
Net Assets: | | | | | | | | | | | | | | | | | |
Beginning of period | | | 3,619,650,782 | | | | 3,451,988,253 | | | | 517,022,521 | | | | 419,906,106 | | | | 1,509,445,263 | | | | 1,302,875,757 | |
| | | | | | | | | | | | | | | | | | | | | | | | |
End of period | | $ | 2,961,025,817 | | | $ | 3,619,650,782 | | | $ | 447,194,970 | | | $ | 517,022,521 | | | $ | 1,357,464,394 | | | $ | 1,509,445,263 | |
| | | | | | | | | | | | | | | | | | | | | | | | |
| (1) | Per the Securities and Exchange Commission Release #33-10532 “Disclosure Update and Simplification”, it is no longer required to differentiate distributions from earnings as either net investment income or net realized capital gains or disclose the Fund’s undistributed net investment income within the Fund’s Statement of Changes in Net Assets. The presentation within the Fund’s Statement of Changes in Net Assets for the year ended December 31, 2017 has been modified accordingly. See Note 2, Significant Accounting Policies, in Notes to Financial Statements for additional information. |
The accompanying notes are an integral part of these financial statements.
Statements of Changes in Net Assets – (continued)
| | | | | | | | | | | | | | | | | | | | | | | | |
| | | Hartford Healthcare
HLS Fund | | | Hartford High Yield
HLS Fund | | | Hartford International Opportunities
HLS Fund | |
| | | For the
Year Ended
December 31,
2018 | | | For the
Year Ended
December 31,
2017 | | | For the
Year Ended
December 31,
2018 | | | For the
Year Ended
December 31,
2017 | | | For the
Year Ended
December 31,
2018 | | | For the
Year Ended
December 31,
2017 | |
Operations: | | | | | | | | | | | | | | | | | | | | | | | | |
Net investment income (loss) | | $ | (129,611 | ) | | $ | 21,704 | | | $ | 14,942,261 | | | $ | 16,752,837 | | | $ | 21,970,804 | | | $ | 20,447,179 | |
Net realized gain (loss) on investments, other financial instruments and foreign currency transactions | | | 31,460,608 | | | | 20,678,238 | | | | 3,129,099 | | | | 5,132,805 | | | | 45,857,314 | | | | 112,396,083 | |
Net changes in unrealized appreciation (depreciation) of investments, other financial instruments and foreign currency transactions | | | (37,551,800 | ) | | | 42,617,943 | | | | (27,080,181 | ) | | | 769,720 | | | | (332,649,147 | ) | | | 178,814,146 | |
| | | | | | | | | | | | | | | | | | | | | | | | |
Net Increase (Decrease) in Net Assets Resulting from Operations | | | (6,220,803 | ) | | | 63,317,885 | | | | (9,008,821 | ) | | | 22,655,362 | | | | (264,821,029 | ) | | | 311,657,408 | |
| | | | | | | | | | | | | | | | | | | | | | | | |
Distributions to Shareholders:(1) | | | | | | | | | | | | | | | | | | | | | | | | |
Class IA | | | (17,636,397 | ) | | | (42,557,293 | ) | | | (12,607,847 | ) | | | (14,107,895 | ) | | | (24,591,559 | ) | | | (19,083,304 | ) |
Class IB | | | (2,726,361 | ) | | | (7,184,474 | ) | | | (3,775,566 | ) | | | (4,345,488 | ) | | | (2,394,120 | ) | | | (1,824,269 | ) |
| | | | | | | | | | | | | | | | | | | | | | | | |
Total distributions | | | (20,362,758 | ) | | | (49,741,767 | ) | | | (16,383,413 | ) | | | (18,453,383 | ) | | | (26,985,679 | ) | | | (20,907,573 | ) |
| | | | | | | | | | | | | | | | | | | | | | | | |
Capital Share Transactions: | | | | | | | | | | | | | | | | | | | | | | | | |
Sold | | | 31,276,586 | | | | 47,830,448 | | | | 13,407,636 | | | | 16,051,926 | | | | 144,483,508 | | | | 238,539,464 | |
Issued on reinvestment of distributions | | | 20,362,758 | | | | 49,741,767 | | | | 16,383,413 | | | | 18,453,383 | | | | 26,985,679 | | | | 20,907,573 | |
Redeemed | | | (74,733,932 | ) | | | (66,393,210 | ) | | | (56,481,478 | ) | | | (59,002,412 | ) | | | (339,252,535 | ) | | | (203,781,844 | ) |
| | | | | | | | | | | | | | | | | | | | | | | | |
Net increase (decrease) from capital share transactions | | | (23,094,588 | ) | | | 31,179,005 | | | | (26,690,429 | ) | | | (24,497,103 | ) | | | (167,783,348 | ) | | | 55,665,193 | |
| | | | | | | | | | | | | | | | | | | | | | | | |
Net Increase (Decrease) in Net Assets | | | (49,678,149 | ) | | | 44,755,123 | | | | (52,082,663 | ) | | | (20,295,124 | ) | | | (459,590,056 | ) | | | 346,415,028 | |
| | | | | | | | | | | | | | | | | | | | | | | | |
Net Assets: | | | | | | | | | | | | | | | | | | | | | | | | |
Beginning of period | | | 335,398,201 | | | | 290,643,078 | | | | 301,489,870 | | | | 321,784,994 | | | | 1,580,520,220 | | | | 1,234,105,192 | |
| | | | | | | | | | | | | | | | | | | | | | | | |
End of period | | $ | 285,720,052 | | | $ | 335,398,201 | | | $ | 249,407,207 | | | $ | 301,489,870 | | | $ | 1,120,930,164 | | | $ | 1,580,520,220 | |
| | | | | | | | | | | | | | | | | | | | | | | | |
| (1) | Per the Securities and Exchange Commission Release#33-10532 “Disclosure Update and Simplification”, it is no longer required to differentiate distributions from earnings as either net investment income or net realized capital gains or disclose the Fund’s undistributed net investment income within the Fund’s Statement of Changes in Net Assets. The presentation within the Fund’s Statement of Changes in Net Assets for the year ended December 31, 2017 has been modified accordingly. See Note 2, Significant Accounting Policies, in Notes to Financial Statements for additional information. |
The accompanying notes are an integral part of these financial statements.
Statements of Changes in Net Assets – (continued)
| | | | | | | | | | | | | | | | | | | | | | | | |
| | | Hartford MidCap
HLS Fund | | | Hartford MidCap Growth
HLS Fund | | | Hartford MidCap Value
HLS Fund | |
| | | For the
Year Ended
December 31,
2018 | | | For the
Year Ended
December 31,
2017 | | | For the
Year Ended
December 31,
2018 | | | For the
Year Ended
December 31,
2017 | | | For the
Year Ended
December 31,
2018 | | | For the
Year Ended
December 31,
2017 | |
Operations: | | | | | | | | | | | | | | | | | | | | | | | | |
Net investment income (loss) | | $ | 597,397 | | | $ | 161,392 | | | $ | 151,187 | | | $ | 857,365 | | | $ | 2,003,484 | | | $ | 1,239,709 | |
Net realized gain (loss) on investments, other financial instruments and foreign currency transactions | | | 313,601,069 | | | | 232,241,276 | | | | 16,823,323 | | | | 8,513,724 | | | | 39,094,355 | | | | 23,401,263 | |
Net changes in unrealized appreciation (depreciation) of investments, other financial instruments and foreign currency transactions | | | (453,906,710 | ) | | | 210,733,817 | | | | (25,371,110 | ) | | | 3,773,225 | | | | (89,944,997 | ) | | | 22,239,620 | |
| | | | | | | | | | | | | | | | | | | | | | | | |
Net Increase (Decrease) in Net Assets Resulting from Operations | | | (139,708,244 | ) | | | 443,136,485 | | | | (8,396,600 | ) | | | 13,144,314 | | | | (48,847,158 | ) | | | 46,880,592 | |
| | | | | | | | | | | | | | | | | | | | | | | | |
Distributions to Shareholders:(1) | | | | | | | | | | | | | | | | | | | | | | | | |
Class IA | | | (206,009,765 | ) | | | (94,658,887 | ) | | | (7,929,782 | ) | | | (3,287,870 | ) | | | (20,921,640 | ) | | | (20,308,939 | ) |
Class IB | | | (5,470,747 | ) | | | (5,084,893 | ) | | | (1,375,082 | ) | | | (550,492 | ) | | | (5,918,091 | ) | | | (6,031,749 | ) |
| | | | | | | | | | | | | | | | | | | | | | | | |
Total distributions | | | (211,480,512 | ) | | | (99,743,780 | ) | | | (9,304,864 | ) | | | (3,838,362 | ) | | | (26,839,731 | ) | | | (26,340,688 | ) |
| | | | | | | | | | | | | | | | | | | | | | | | |
Capital Share Transactions: | | | | | | | | | | | | | | | | | | | | | | | | |
Sold | | | 268,177,739 | | | | 371,154,622 | | | | 4,772,590 | | | | 6,228,487 | | | | 5,167,853 | | | | 6,974,933 | |
Issued on reinvestment of distributions | | | 211,480,512 | | | | 99,743,781 | | | | 9,304,864 | | | | 3,838,362 | | | | 26,839,731 | | | | 26,340,688 | |
Redeemed | | | (528,465,528 | ) | | | (413,993,325 | ) | | | (19,264,292 | ) | | | (25,253,892 | ) | | | (49,490,166 | ) | | | (58,594,091 | ) |
| | | | | | | | | | | | | | | | | | | | | | | | |
Net increase (decrease) from capital share transactions | | | (48,807,277 | ) | | | 56,905,078 | | | | (5,186,838 | ) | | | (15,187,043 | ) | | | (17,482,582 | ) | | | (25,278,470 | ) |
| | | | | | | | | | | | | | | | | | | | | | | | |
Net Increase (Decrease) in Net Assets | | | (399,996,033 | ) | | | 400,297,783 | | | | (22,888,302 | ) | | | (5,881,091 | ) | | | (93,169,471 | ) | | | (4,738,566 | ) |
| | | | | | | | | | | | | | | | | | | | | | | | |
Net Assets: | | | | | | | | | | | | | | | | | | | | | | | | |
Beginning of period | | | 2,214,894,041 | | | | 1,814,596,258 | | | | 98,995,737 | | | | 104,876,828 | | | | 374,837,470 | | | | 379,576,036 | |
| | | | | | | | | | | | | | | | | | | | | | | | |
End of period | | $ | 1,814,898,008 | | | $ | 2,214,894,041 | | | $ | 76,107,435 | | | $ | 98,995,737 | | | $ | 281,667,999 | | | $ | 374,837,470 | |
| | | | | | | | | | | | | | | | | | | | | | | | |
| (1) | Per the Securities and Exchange Commission Release#33-10532 “Disclosure Update and Simplification”, it is no longer required to differentiate distributions from earnings as either net investment income or net realized capital gains or disclose the Fund’s undistributed net investment income within the Fund’s Statement of Changes in Net Assets. The presentation within the Fund’s Statement of Changes in Net Assets for the year ended December 31, 2017 has been modified accordingly. See Note 2, Significant Accounting Policies, in Notes to Financial Statements for additional information. |
The accompanying notes are an integral part of these financial statements.
Statements of Changes in Net Assets – (continued)
| | | | | | | | | | | | | | | | | | | | | | | | |
| | | Hartford Small Cap Growth
HLS Fund | | | Hartford Small Company
HLS Fund | | | Hartford Stock
HLS Fund | |
| | | For the
Year Ended
December 31,
2018 | | | For the
Year Ended
December 31,
2017 | | | For the
Year Ended
December 31,
2018 | | | For the
Year Ended
December 31,
2017 | | | For the
Year Ended
December 31,
2018 | | | For the
Year Ended
December 31,
2017 | |
Operations: | | | | | | | | | | | | | | | | | | | | | | | | |
Net investment income (loss) | | $ | (1,320,167 | ) | | $ | (1,454,879 | ) | | $ | (3,112,175 | ) | | $ | (2,511,265 | ) | | $ | 23,168,989 | | | $ | 25,878,193 | |
Net realized gain (loss) on investments and foreign currency transactions | | | 219,253,261 | | | | 99,838,478 | | | | 113,781,063 | | | | 136,468,650 | | | | 120,020,211 | | | | 127,954,070 | |
Net changes in unrealized appreciation (depreciation) of investments and foreign currency transactions | | | (363,380,245 | ) | | | 137,585,826 | | | | (127,972,764 | ) | | | 35,311,309 | | | | (138,545,767 | ) | | | 115,361,860 | |
| | | | | | | | | | | | | | | | | | | | | | | | |
Net Increase (Decrease) in Net Assets Resulting from Operations | | | (145,447,151 | ) | | | 235,969,425 | | | | (17,303,876 | ) | | | 169,268,694 | | | | 4,643,433 | | | | 269,194,123 | |
| | | | | | | | | | | | | | | | | | | | | | | | |
Distributions to Shareholders:(1) | | | | | | | | | | | | | | | | | | | | | | | | |
Class IA | | | (60,365,921 | ) | | | (446,628 | ) | | | (37,253,096 | ) | | | — | | | | (20,294,819 | ) | | | (23,707,000 | ) |
Class IB | | | (23,243,803 | ) | | | — | | | | (4,017,068 | ) | | | — | | | | (1,685,834 | ) | | | (2,111,519 | ) |
| | | | | | | | | | | | | | | | | | | | | | | | |
Total distributions | | | (83,609,724 | ) | | | (446,628 | ) | | | (41,270,164 | ) | | | — | | | | (21,980,653 | ) | | | (25,818,519 | ) |
| | | | | | | | | | | | | | | | | | | | | | | | |
Capital Share Transactions: | | | | | | | | | | | | | | | | | | | | | | | | |
Sold | | | 200,210,026 | | | | 341,821,699 | | | | 55,281,428 | | | | 35,844,453 | | | | 8,126,181 | | | | 7,902,822 | |
Issued on reinvestment of distributions | | | 74,744,865 | | | | 391,968 | | | | 41,270,164 | | | | — | | | | 21,980,653 | | | | 25,818,519 | |
Redeemed | | | (264,548,970 | ) | | | (441,836,449 | ) | | | (126,680,602 | ) | | | (504,062,833 | ) | | | (212,336,911 | ) | | | (208,424,356 | ) |
| | | | | | | | | | | | | | | | | | | | | | | | |
Net increase (decrease) from capital share transactions | | | 10,405,921 | | | | (99,622,782) | | | | (30,129,010) | | | | (468,218,380) | | | | (182,230,077) | | | | (174,703,015) | |
| | | | | | | | | | | | | | | | | | | | | | | | |
Net Increase (Decrease) in Net Assets | | | (218,650,954) | | | | 135,900,015 | | | | (88,703,050 | ) | | | (298,949,686 | ) | | | (199,567,297 | ) | | | 68,672,589 | |
| | | | | | | | | | | | | | | | | | | | | | | | |
Net Assets: | | | | | | | | | | | | | | | | | | | | | | | | |
Beginning of period | | | 1,335,032,322 | | | | 1,199,132,307 | | | | 608,202,728 | | | | 907,152,414 | | | | 1,521,615,876 | | | | 1,452,943,287 | |
| | | | | | | | | | | | | | | | | | | | | | | | |
End of period | | $ | 1,116,381,368 | | | $ | 1,335,032,322 | | | $ | 519,499,678 | | | $ | 608,202,728 | | | $ | 1,322,048,579 | | | $ | 1,521,615,876 | |
| | | | | | | | | | | | | | | | | | | | | | | | |
| (1) | Per the Securities and Exchange Commission Release#33-10532 “Disclosure Update and Simplification”, it is no longer required to differentiate distributions from earnings as either net investment income or net realized capital gains or disclose the Fund’s undistributed net investment income within the Fund’s Statement of Changes in Net Assets. The presentation within the Fund’s Statement of Changes in Net Assets for the year ended December 31, 2017 has been modified accordingly. See Note 2, Significant Accounting Policies, in Notes to Financial Statements for additional information. |
The accompanying notes are an integral part of these financial statements.
Statements of Changes in Net Assets – (continued)
| | | | | | | | | | | | | | | | | | | | | | | | |
| | | Hartford Total Return Bond
HLS Fund | | | Hartford Ultrashort Bond
HLS Fund | | | Hartford U.S. Government
Securities HLS Fund | |
| | | For the
Year Ended
December 31,
2018 | | | For the
Year Ended
December 31,
2017 | | | For the
Year Ended
December 31,
2018 | | | For the
Year Ended
December 31,
2017 | | | For the
Year Ended
December 31,
2018 | | | For the
Year Ended
December 31,
2017 | |
Operations: | | | | | | | | | | | | | | | | | |
Net investment income (loss) | | $ | 71,823,626 | | | $ | 72,397,790 | | | $ | 8,766,837 | | | $ | 5,426,975 | | | $ | 7,546,931 | | | $ | 7,433,049 | |
Net realized gain (loss) on investments, other financial instruments and foreign currency transactions | | | (37,810,393 | ) | | | 46,924,738 | | | | (18,669 | ) | | | 110,447 | | | | (5,641,701 | ) | | | (2,529,210 | ) |
Net changes in unrealized appreciation (depreciation) of investments, other financial instruments and foreign currency transactions | | | (54,351,601 | ) | | | 3,063,744 | | | | (1,061,293 | ) | | | (117,494 | ) | | | 228,103 | | | | 749,426 | |
| | | | | | | | | | | | | | | | | | | | | | | | |
Net Increase (Decrease) in Net Assets Resulting from Operations | | | (20,338,368 | ) | | | 122,386,272 | | | | 7,686,875 | | | | 5,419,928 | | | | 2,133,333 | | | | 5,653,265 | |
| | | | | | | | | | | | | | | | | | | | | | | | |
Distributions to Shareholders:(1) | | | | | | | | | | | | | | | | | | | | | | | | |
Class IA | | | (84,804,607 | ) | | | (64,104,099 | ) | | | (5,018,413 | ) | | | (3,863,181 | ) | | | (7,134,442 | ) | | | (7,516,833 | ) |
Class IB | | | (9,181,448 | ) | | | (6,840,084 | ) | | | (536,294 | ) | | | (353,222 | ) | | | (1,332,927 | ) | | | (1,395,249 | ) |
| | | | | | | | | | | | | | | | | | | | | | | | |
Total distributions | | | (93,986,055 | ) | | | (70,944,183 | ) | | | (5,554,707 | ) | | | (4,216,403 | ) | | | (8,467,369 | ) | | | (8,912,082 | ) |
| | | | | | | | | | | | | | | | | | | | | | | | |
Capital Share Transactions: | | | | | | | | | | | | | | | | | |
Sold | | | 106,840,708 | | | | 133,249,068 | | | | 73,505,332 | | | | 40,599,916 | | | | 21,420,796 | | | | 25,399,365 | |
Issued on reinvestment of distributions | | | 93,986,055 | | | | 70,944,183 | | | | 5,554,708 | | | | 4,216,403 | | | | 8,467,369 | | | | 8,912,083 | |
Redeemed | | | (406,372,006 | ) | | | (356,036,471 | ) | | | (105,240,180 | ) | | | (131,702,061 | ) | | | (78,045,222 | ) | | | (79,206,757 | ) |
| | | | | | | | | | | | | | | | | | | | | | | | |
Net (decrease) from capital share transactions | | | (205,545,243 | ) | | | (151,843,220 | ) | | | (26,180,140 | ) | | | (86,885,742 | ) | | | (48,157,057 | ) | | | (44,895,309 | ) |
| | | | | | | | | | | | | | | | | | | | | | | | |
Net Increase (Decrease) in Net Assets | | | (319,869,666 | ) | | | (100,401,131 | ) | | | (24,047,972 | ) | | | (85,682,217 | ) | | | (54,491,093 | ) | | | (48,154,126 | ) |
| | | | | | | | | | | | | | | | | | | | | | | | |
Net Assets: | | | | | | | | | | | | | | | | | |
Beginning of period | | | 2,406,291,227 | | | | 2,506,692,358 | | | | 526,067,080 | | | | 611,749,297 | | | | 400,074,001 | | | | 448,228,127 | |
| | | | | | | | | | | | | | | | | | | | | | | | |
End of period | | $ | 2,086,421,561 | | | $ | 2,406,291,227 | | | $ | 502,019,108 | | | $ | 526,067,080 | | | $ | 345,582,908 | | | $ | 400,074,001 | |
| | | | | | | | | | | | | | | | | | | | | | | | |
| (1) | Per the Securities and Exchange Commission Release#33-10532 “Disclosure Update and Simplification”, it is no longer required to differentiate distributions from earnings as either net investment income or net realized capital gains or disclose the Fund’s undistributed net investment income within the Fund’s Statement of Changes in Net Assets. The presentation within the Fund’s Statement of Changes in Net Assets for the year ended December 31, 2017 has been modified accordingly. See Note 2, Significant Accounting Policies, in Notes to Financial Statements for additional information. |
The accompanying notes are an integral part of these financial statements.
Statements of Changes in Net Assets – (continued)
| | | | | | | | |
| | | Hartford Value
HLS Fund | |
| | | For the
Year Ended
December 31,
2018 | | | For the
Year Ended
December 31,
2017 | |
Operations: | |
Net investment income (loss) | | $ | 8,638,811 | | | $ | 7,919,163 | |
Net realized gain (loss) on investments, other financial instruments and foreign currency transactions | | | 48,079,686 | | | | 43,232,153 | |
Net changes in unrealized appreciation (depreciation) of investments, other financial instruments and foreign currency transactions | | | (103,394,559 | ) | | | 23,121,521 | |
| | | | | | | | |
Net Increase (Decrease) in Net Assets Resulting from Operations | | | (46,676,062 | ) | | | 74,272,837 | |
| | | | | | | | |
Distributions to Shareholders:(1) | | | | | | | | |
Class IA | | | (45,728,961 | ) | | | (39,184,875 | ) |
Class IB | | | (7,417,890 | ) | | | (6,498,111 | ) |
| | | | | | | | |
Total distributions | | | (53,146,851 | ) | | | (45,682,986 | ) |
| | | | | | | | |
Capital Share Transactions: | |
Sold | | | 13,010,218 | | | | 12,186,616 | |
Issued on reinvestment of distributions | | | 53,146,851 | | | | 45,682,987 | |
Redeemed | | | (81,575,571 | ) | | | (84,180,318 | ) |
| | | | | | | | |
Net (decrease) from capital share transactions | | | (15,418,502 | ) | | | (26,310,715 | ) |
| | | | | | | | |
Net Increase (Decrease) in Net Assets | | | (115,241,415 | ) | | | 2,279,136 | |
| | | | | | | | |
Net Assets: | |
Beginning of period | | | 526,485,809 | | | | 524,206,673 | |
| | | | | | | | |
End of period | | $ | 411,244,394 | | | $ | 526,485,809 | |
| | | | | | | | |
| (1) | Per the Securities and Exchange Commission Release #33-10532 “Disclosure Update and Simplification”, it is no longer required to differentiate distributions from earnings as either net investment income or net realized capital gains or disclose the Fund’s undistributed net investment income within the Fund’s Statement of Changes in Net Assets. The presentation within the Fund’s Statement of Changes in Net Assets for the year ended December 31, 2017 has been modified accordingly. See Note 2, Significant Accounting Policies, in Notes to Financial Statements for additional information. |
The accompanying notes are an integral part of these financial statements.
Financial Highlights
| | | | | | | | | | | | | | | | | | | | | | | | | | | | | | | | | | | | | | | | | | | | | | | | | | | | | | | | |
| | | — SelectedPer-Share Data(1) — | | | — Ratios and Supplemental Data — | |
Class | | Net Asset
Value at
Beginning
of Period | | | Net
Investment
Income
(Loss) | | | Net
Realized
and
Unrealized
Gain (Loss)
on
Investments | | | Total from
Investment
Operations | | | Dividends
from Net
Investment
Income | | | Distributions
from
Capital
Gains | | | Total
Dividends
and
Distributions | | | Net
Asset
Value at
End of
Period | | | Total
Return(2) | | | Net
Assets at
End of
Period
(000s) | | | Ratio of
Expenses
to
Average
Net
Assets
Before
Adjust-
ments(3) | | | Ratio of
Expenses
to
Average
Net
Assets
After
Adjust-
ments(3) | | | Ratio of
Net
Investment
Income
(Loss) to
Average
Net Assets | | | Portfolio
Turnover | |
|
| Hartford Balanced HLS Fund | |
|
For the Year Ended December 31, 2018 | |
IA | | $ | 31.02 | | | $ | 0.59 | | | $ | (2.12 | ) | | $ | (1.53 | ) | | $ | (0.61 | ) | | $ | (1.41 | ) | | $ | (2.02 | ) | | $ | 27.47 | | | | (5.24 | )% | | $ | 1,717,759 | | | | 0.66 | % | | | 0.63 | % | | | 1.92 | % | | | 31 | % |
IB | | | 31.48 | | | | 0.52 | | | | (2.15 | ) | | | (1.63 | ) | | | (0.53 | ) | | | (1.41 | ) | | | (1.94 | ) | | | 27.91 | | | | (5.50 | ) | | | 229,790 | | | | 0.91 | | | | 0.88 | | | | 1.67 | | | | 31 | |
|
For the Year Ended December 31, 2017 | |
IA | | $ | 27.46 | | | $ | 0.55 | | | $ | 3.72 | | | $ | 4.27 | | | $ | (0.71 | ) | | $ | — | | | $ | (0.71 | ) | | $ | 31.02 | | | | 15.59 | % | | $ | 2,095,246 | | | | 0.66 | % | | | 0.63 | % | | | 1.86 | % | | | 26 | % |
IB | | | 27.86 | | | | 0.48 | | | | 3.77 | | | | 4.25 | | | | (0.63 | ) | | | — | | | | (0.63 | ) | | | 31.48 | | | | 15.30 | | | | 277,735 | | | | 0.91 | | | | 0.88 | | | | 1.61 | | | | 26 | |
|
For the Year Ended December 31, 2016 | |
IA | | $ | 26.62 | | | $ | 0.56 | | | $ | 1.05 | | | $ | 1.61 | | | $ | (0.77 | ) | | $ | — | | | $ | (0.77 | ) | | $ | 27.46 | | | | 6.04 | % | | $ | 2,043,556 | | | | 0.66 | % | | | 0.64 | % | | | 2.05 | % | | | 25 | % |
IB | | | 26.99 | | | | 0.50 | | | | 1.07 | | | | 1.57 | | | | (0.70 | ) | | | — | | | | (0.70 | ) | | | 27.86 | | | | 5.79 | | | | 275,925 | | | | 0.91 | | | | 0.89 | | | | 1.80 | | | | 25 | |
|
For the Year Ended December 31, 2015 | |
IA | | $ | 27.09 | | | $ | 0.51 | | | $ | (0.46 | ) | | $ | 0.05 | | | $ | (0.52 | ) | | $ | — | | | $ | (0.52 | ) | | $ | 26.62 | | | | 0.18 | % | | $ | 2,210,938 | | | | 0.65 | % | | | 0.63 | % | | | 1.87 | % | | | 18 | % |
IB | | | 27.45 | | | | 0.45 | | | | (0.47 | ) | | | (0.02 | ) | | | (0.44 | ) | | | — | | | | (0.44 | ) | | | 26.99 | | | | (0.07 | ) | | | 300,945 | | | | 0.90 | | | | 0.88 | | | | 1.62 | | | | 18 | |
|
For the Year Ended December 31, 2014 | |
IA | | $ | 25.11 | | | $ | 0.45 | | | $ | 2.01 | | | $ | 2.46 | | | $ | (0.48 | ) | | $ | — | | | $ | (0.48 | ) | | $ | 27.09 | | | | 9.79 | % | | $ | 2,561,814 | | | | 0.65 | % | | | 0.65 | % | | | 1.73 | % | | | 29 | % |
IB | | | 25.44 | | | | 0.39 | | | | 2.03 | | | | 2.42 | | | | (0.41 | ) | | | — | | | | (0.41 | ) | | | 27.45 | | | | 9.51 | | | | 362,210 | | | | 0.90 | | | | 0.90 | | | | 1.49 | | | | 29 | |
|
| Hartford Capital Appreciation HLS Fund | |
|
For the Year Ended December 31, 2018 | |
IA | | $ | 48.16 | | | $ | 0.49 | | | $ | (3.33 | ) | | $ | (2.84 | ) | | $ | (0.43 | ) | | $ | (5.00 | ) | | $ | (5.43 | ) | | $ | 39.89 | | | | (6.96 | )% | | $ | 3,543,187 | | | | 0.67 | % | | | 0.67 | % | | | 1.03 | % | | | 73 | % |
IB | | | 47.48 | | | | 0.37 | | | | (3.26 | ) | | | (2.89 | ) | | | (0.31 | ) | | | (5.00 | ) | | | (5.31 | ) | | | 39.28 | | | | (7.18 | ) | | | 432,334 | | | | 0.92 | | | | 0.92 | | | | 0.77 | | | | 73 | |
IC | | | 47.76 | | | | 0.25 | | | | (3.26 | ) | | | (3.01 | ) | | | (0.21 | ) | | | (5.00 | ) | | | (5.21 | ) | | | 39.54 | | | | (7.41 | ) | | | 27,679 | | | | 1.17 | | | | 1.17 | | | | 0.53 | | | | 73 | |
|
For the Year Ended December 31, 2017 | |
IA | | $ | 42.05 | | | $ | 0.43 | | | $ | 8.83 | | | $ | 9.26 | | | $ | (0.54 | ) | | $ | (2.61 | ) | | $ | (3.15 | ) | | $ | 48.16 | | | | 22.14 | % | | $ | 4,457,603 | | | | 0.68 | % | | | 0.68 | % | | | 0.91 | % | | | 75 | % |
IB | | | 41.50 | | | | 0.30 | | | | 8.70 | | | | 9.00 | | | | (0.41 | ) | | | (2.61 | ) | | | (3.02 | ) | | | 47.48 | | | | 21.82 | | | | 569,615 | | | | 0.93 | | | | 0.93 | | | | 0.66 | | | | 75 | |
IC | | | 41.76 | | | | 0.19 | | | | 8.74 | | | | 8.93 | | | | (0.32 | ) | | | (2.61 | ) | | | (2.93 | ) | | | 47.76 | | | | 21.50 | | | | 29,979 | | | | 1.18 | | | | 1.18 | | | | 0.41 | | | | 75 | |
|
For the Year Ended December 31, 2016 | |
IA | | $ | 44.44 | | | $ | 0.41 | | | $ | 1.94 | | | $ | 2.35 | | | $ | (0.47 | ) | | $ | (4.27 | ) | | $ | (4.74 | ) | | $ | 42.05 | | | | 5.52 | % | | $ | 4,555,454 | | | | 0.68 | % | | | 0.68 | % | | | 0.97 | % | | | 103 | % |
IB | | | 43.93 | | | | 0.30 | | | | 1.90 | | | | 2.20 | | | | (0.36 | ) | | | (4.27 | ) | | | (4.63 | ) | | | 41.50 | | | | 5.24 | | | | 558,022 | | | | 0.93 | | | | 0.93 | | | | 0.72 | | | | 103 | |
IC | | | 44.21 | | | | 0.19 | | | | 1.92 | | | | 2.11 | | | | (0.29 | ) | | | (4.27 | ) | | | (4.56 | ) | | | 41.76 | | | | 4.99 | | | | 21,579 | | | | 1.18 | | | | 1.18 | | | | 0.46 | | | | 103 | |
|
For the Year Ended December 31, 2015 | |
IA | | $ | 54.71 | | | $ | 0.43 | | | $ | 0.38 | | | $ | 0.81 | | | $ | (0.43 | ) | | $ | (10.65 | ) | | $ | (11.08 | ) | | $ | 44.44 | | | | 1.02 | % | | $ | 5,701,269 | | | | 0.67 | % | | | 0.67 | % | | | 0.84 | % | | | 75 | % |
IB | | | 54.20 | | | | 0.30 | | | | 0.39 | | | | 0.69 | | | | (0.31 | ) | | | (10.65 | ) | | | (10.96 | ) | | | 43.93 | | | | 0.79 | | | | 641,548 | | | | 0.92 | | | | 0.92 | | | | 0.59 | | | | 75 | |
IC | | | 54.59 | | | | 0.17 | | | | 0.39 | | | | 0.56 | | | | (0.29 | ) | | | (10.65 | ) | | | (10.94 | ) | | | 44.21 | | | | 0.53 | | | | 16,215 | | | | 1.17 | | | | 1.17 | | | | 0.34 | | | | 75 | |
|
For the Year Ended December 31, 2014 | |
IA | | $ | 59.65 | | | $ | 0.56 | | | $ | 3.81 | | | $ | 4.37 | | | $ | (0.50 | ) | | $ | (8.81 | ) | | $ | (9.31 | ) | | $ | 54.71 | | | | 7.31 | % | | $ | 6,470,599 | | | | 0.66 | % | | | 0.66 | % | | | 0.96 | % | | | 89 | % |
IB | | | 59.18 | | | | 0.42 | | | | 3.77 | | | | 4.19 | | | | (0.36 | ) | | | (8.81 | ) | | | (9.17 | ) | | | 54.20 | | | | 7.04 | | | | 764,541 | | | | 0.91 | | | | 0.91 | | | | 0.72 | | | | 89 | |
IC(4) | | | 60.21 | | | | 0.09 | | | | 3.53 | | | | 3.62 | | | | (0.43 | ) | | | (8.81 | ) | | | (9.24 | ) | | | 54.59 | | | | 5.97 | (5) | | | 3,453 | | | | 1.16 | (6) | | | 1.16 | (6) | | | 0.23 | (6) | | | 89 | |
|
| Hartford Disciplined Equity HLS Fund | |
|
For the Year Ended December 31, 2018 | |
IA | | $ | 15.43 | | | $ | 0.11 | | | $ | (0.27 | ) | | $ | (0.16 | ) | | $ | (0.11 | ) | | $ | (1.57 | ) | | $ | (1.68 | ) | | $ | 13.59 | | | | (1.99 | )% | | $ | 501,718 | | | | 0.78 | % | | | 0.78 | % | | | 0.72 | % | | | 22 | % |
IB | | | 15.27 | | | | 0.07 | | | | (0.26 | ) | | | (0.19 | ) | | | (0.07 | ) | | | (1.57 | ) | | | (1.64 | ) | | | 13.44 | | | | (2.23 | ) | | | 68,462 | | | | 1.03 | | | | 1.03 | | | | 0.47 | | | | 22 | |
|
For the Year Ended December 31, 2017 | |
IA | | $ | 14.30 | | | $ | 0.15 | | | $ | 2.83 | | | $ | 2.98 | | | $ | (0.14 | ) | | $ | (1.71 | ) | | $ | (1.85 | ) | | $ | 15.43 | | | | 21.92 | % | | $ | 613,037 | | | | 0.78 | % | | | 0.78 | % | | | 1.00 | % | | | 30 | % |
IB | | | 14.17 | | | | 0.11 | | | | 2.80 | | | | 2.91 | | | | (0.10 | ) | | | (1.71 | ) | | | (1.81 | ) | | | 15.27 | | | | 21.63 | | | | 84,377 | | | | 1.03 | | | | 1.03 | | | | 0.76 | | | | 30 | |
The accompanying notes are an integral part of these financial statements.
Financial Highlights – (continued)
| | | | | | | | | | | | | | | | | | | | | | | | | | | | | | | | | | | | | | | | | | | | | | | | | | | | | | | | |
| | | — SelectedPer-Share Data(1) — | | | — Ratios and Supplemental Data — | |
Class | | Net Asset
Value at
Beginning
of Period | | | Net
Investment
Income
(Loss) | | | Net
Realized
and
Unrealized
Gain (Loss)
on
Investments | | | Total from
Investment
Operations | | | Dividends
from Net
Investment
Income | | | Distributions
from
Capital
Gains | | | Total
Dividends
and
Distributions | | | Net
Asset
Value at
End of
Period | | | Total
Return(2) | | | Net
Assets at
End of
Period
(000s) | | | Ratio of
Expenses
to
Average
Net
Assets
Before
Adjust-
ments(3) | | | Ratio of
Expenses
to
Average
Net
Assets
After
Adjust-
ments(3) | | | Ratio of
Net
Investment
Income
(Loss) to
Average
Net Assets | | | Portfolio
Turnover | |
|
| Hartford Disciplined Equity HLS Fund – (continued) | |
|
For the Year Ended December 31, 2016 | |
IA | | $ | 15.58 | | | $ | 0.11 | | | $ | 0.77 | | | $ | 0.88 | | | $ | (0.13 | ) | | $ | (2.03 | ) | | $ | (2.16 | ) | | $ | 14.30 | | | | 5.76 | % | | $ | 587,089 | | | | 0.79 | % | | | 0.79 | % | | | 0.76 | % | | | 33 | % |
IB | | | 15.46 | | | | 0.08 | | | | 0.75 | | | | 0.83 | | | | (0.09 | ) | | | (2.03 | ) | | | (2.12 | ) | | | 14.17 | | | | 5.49 | | | | 81,304 | | | | 1.04 | | | | 1.04 | | | | 0.51 | | | | 33 | |
|
For the Year Ended December 31, 2015 | |
IA | | $ | 20.99 | | | $ | 0.14 | | | $ | 1.41 | | | $ | 1.55 | | | $ | (0.13 | ) | | $ | (6.83 | ) | | $ | (6.96 | ) | | $ | 15.58 | | | | 6.83 | % | | $ | 648,747 | | | | 0.76 | % | | | 0.76 | % | | | 0.76 | % | | | 29 | % |
IB | | | 20.88 | | | | 0.10 | | | | 1.40 | | | | 1.50 | | | | (0.09 | ) | | | (6.83 | ) | | | (6.92 | ) | | | 15.46 | | | | 6.59 | | | | 91,844 | | | | 1.01 | | | | 1.01 | | | | 0.51 | | | | 29 | |
|
For the Year Ended December 31, 2014 | |
IA | | $ | 18.36 | | | $ | 0.14 | | | $ | 2.83 | | | $ | 2.97 | | | $ | (0.14 | ) | | $ | (0.20 | ) | | $ | (0.34 | ) | | $ | 20.99 | | | | 16.18 | % | | $ | 734,110 | | | | 0.75 | % | | | 0.75 | % | | | 0.73 | % | | | 63 | % |
IB | | | 18.27 | | | | 0.09 | | | | 2.81 | | | | 2.90 | | | | (0.09 | ) | | | (0.20 | ) | | | (0.29 | ) | | | 20.88 | | | | 15.87 | | �� | | 107,577 | | | | 1.00 | | | | 1.00 | | | | 0.47 | | | | 63 | |
|
| Hartford Dividend and Growth HLS Fund | |
|
For the Year Ended December 31, 2018 | |
IA | | $ | 23.95 | | | $ | 0.43 | | | $ | (1.45 | ) | | $ | (1.02 | ) | | $ | (0.44 | ) | | $ | (2.58 | ) | | $ | (3.02 | ) | | $ | 19.91 | | | | (5.32 | )% | | $ | 2,604,425 | | | | 0.68 | % | | | 0.68 | % | | | 1.84 | % | | | 28 | % |
IB | | | 23.85 | | | | 0.37 | | | | (1.44 | ) | | | (1.07 | ) | | | (0.38 | ) | | | (2.58 | ) | | | (2.96 | ) | | | 19.82 | | | | (5.56 | ) | | | 356,601 | | | | 0.93 | | | | 0.93 | | | | 1.59 | | | | 28 | |
|
For the Year Ended December 31, 2017 | |
IA | | $ | 22.10 | | | $ | 0.41 | | | $ | 3.48 | | | $ | 3.89 | | | $ | (0.38 | ) | | $ | (1.66 | ) | | $ | (2.04 | ) | | $ | 23.95 | | | | 18.36 | % | | $ | 3,179,540 | | | | 0.68 | % | | | 0.68 | % | | | 1.75 | % | | | 25 | % |
IB | | | 22.01 | | | | 0.35 | | | | 3.47 | | | | 3.82 | | | | (0.32 | ) | | | (1.66 | ) | | | (1.98 | ) | | | 23.85 | | | | 18.11 | | | | 440,111 | | | | 0.93 | | | | 0.93 | | | | 1.50 | | | | 25 | |
|
For the Year Ended December 31, 2016 | |
IA | | $ | 22.09 | | | $ | 0.43 | | | $ | 2.67 | | | $ | 3.10 | | | $ | (0.44 | ) | | $ | (2.65 | ) | | $ | (3.09 | ) | | $ | 22.10 | | | | 14.89 | % | | $ | 3,013,788 | | | | 0.69 | % | | | 0.69 | % | | | 1.98 | % | | | 20 | % |
IB | | | 22.02 | | | | 0.38 | | | | 2.65 | | | | 3.03 | | | | (0.39 | ) | | | (2.65 | ) | | | (3.04 | ) | | | 22.01 | | | | 14.58 | | | | 438,200 | | | | 0.94 | | | | 0.94 | | | | 1.73 | | | | 20 | |
|
For the Year Ended December 31, 2015 | |
IA | | $ | 26.45 | | | $ | 0.46 | | | $ | (0.70 | ) | | $ | (0.24 | ) | | $ | (0.43 | ) | | $ | (3.69 | ) | | $ | (4.12 | ) | | $ | 22.09 | | | | (1.16 | )% | | $ | 2,991,811 | | | | 0.67 | % | | | 0.67 | % | | | 1.84 | % | | | 20 | % |
IB | | | 26.38 | | | | 0.40 | | | | (0.70 | ) | | | (0.30 | ) | | | (0.37 | ) | | | (3.69 | ) | | | (4.06 | ) | | | 22.02 | | | | (1.41 | ) | | | 449,693 | | | | 0.92 | | | | 0.92 | | | | 1.59 | | | | 20 | |
|
For the Year Ended December 31, 2014 | |
IA | | $ | 27.05 | | | $ | 0.49 | | | $ | 2.92 | | | $ | 3.41 | | | $ | (0.49 | ) | | $ | (3.52 | ) | | $ | (4.01 | ) | | $ | 26.45 | | | | 12.96 | % | | $ | 3,502,492 | | | | 0.67 | % | | | 0.67 | % | | | 1.78 | % | | | 19 | % |
IB | | | 26.99 | | | | 0.42 | | | | 2.91 | | | | 3.33 | | | | (0.42 | ) | | | (3.52 | ) | | | (3.94 | ) | | | 26.38 | | | | 12.68 | | | | 546,006 | | | | 0.92 | | | | 0.92 | | | | 1.53 | | | | 19 | |
|
| Hartford Global Growth HLS Fund | |
|
For the Year Ended December 31, 2018 | |
IA | | $ | 27.89 | | | $ | 0.11 | | | $ | (0.83 | ) | | $ | (0.72 | ) | | $ | (0.15 | ) | | $ | (2.48 | ) | | $ | (2.63 | ) | | $ | 24.54 | | | | (3.81 | )% | | $ | 375,825 | | | | 0.80 | % | | | 0.80 | % | | | 0.37 | % | | | 55 | % |
IB | | | 27.63 | | | | 0.04 | | | | (0.83 | ) | | | (0.79 | ) | | | (0.08 | ) | | | (2.48 | ) | | | (2.56 | ) | | | 24.28 | | | | (4.07 | ) | | | 71,370 | | | | 1.05 | | | | 1.05 | | | | 0.12 | | | | 55 | |
|
For the Year Ended December 31, 2017 | |
IA | | $ | 22.14 | | | $ | 0.14 | | | $ | 6.99 | | | $ | 7.13 | | | $ | (0.14 | ) | | $ | (1.24 | ) | | $ | (1.38 | ) | | $ | 27.89 | | | | 32.73 | % | | $ | 432,581 | | | | 0.81 | % | | | 0.81 | % | | | 0.56 | % | | | 58 | % |
IB | | | 21.95 | | | | 0.08 | | | | 6.91 | | | | 6.99 | | | | (0.07 | ) | | | (1.24 | ) | | | (1.31 | ) | | | 27.63 | | | | 32.37 | | | | 84,442 | | | | 1.06 | | | | 1.06 | | | | 0.31 | | | | 58 | |
|
For the Year Ended December 31, 2016 | |
IA | | $ | 24.39 | | | $ | 0.13 | | | $ | 0.40 | | | $ | 0.53 | | | $ | (0.17 | ) | | $ | (2.61 | ) | | $ | (2.78 | ) | | $ | 22.14 | | | | 1.95 | % | | $ | 347,375 | | | | 0.82 | % | | | 0.82 | % | | | 0.55 | % | | | 65 | % |
IB | | | 24.19 | | | | 0.07 | | | | 0.39 | | | | 0.46 | | | | (0.09 | ) | | | (2.61 | ) | | | (2.70 | ) | | | 21.95 | | | | 1.71 | | | | 72,531 | | | | 1.07 | | | | 1.07 | | | | 0.30 | | | | 65 | |
|
For the Year Ended December 31, 2015 | |
IA | | $ | 23.74 | | | $ | 0.15 | | | $ | 1.77 | | | $ | 1.92 | | | $ | (0.13 | ) | | $ | (1.14 | ) | | $ | (1.27 | ) | | $ | 24.39 | | | | 8.04 | % | | $ | 392,302 | | | | 0.81 | % | | | 0.81 | % | | | 0.62 | % | | | 67 | % |
IB | | | 23.56 | | | | 0.09 | | | | 1.75 | | | | 1.84 | | | | (0.07 | ) | | | (1.14 | ) | | | (1.21 | ) | | | 24.19 | | | | 7.76 | | | | 86,759 | | | | 1.06 | | | | 1.06 | | | | 0.38 | | | | 67 | |
|
For the Year Ended December 31, 2014 | |
IA | | $ | 22.33 | | | $ | 0.13 | | | $ | 1.39 | | | $ | 1.52 | | | $ | (0.11 | ) | | $ | — | | | $ | (0.11 | ) | | $ | 23.74 | | | | 6.79 | % | | $ | 388,542 | | | | 0.81 | % | | | 0.81 | % | | | 0.57 | % | | | 82 | %(7) |
IB | | | 22.16 | | | | 0.07 | | | | 1.39 | | | | 1.46 | | | | (0.06 | ) | | | — | | | | (0.06 | ) | | | 23.56 | | | | 6.58 | | | | 92,979 | | | | 1.06 | | | | 1.06 | | | | 0.30 | | | | 82 | (7) |
The accompanying notes are an integral part of these financial statements.
Financial Highlights – (continued)
| | | | | | | | | | | | | | | | | | | | | | | | | | | | | | | | | | | | | | | | | | | | | | | | | | | | | | | | |
| | | — SelectedPer-Share Data(1) — | | | — Ratios and Supplemental Data — | |
Class | | Net Asset
Value at
Beginning
of Period | | | Net
Investment
Income
(Loss) | | | Net
Realized
and
Unrealized
Gain (Loss)
on
Investments | | | Total from
Investment
Operations | | | Dividends
from Net
Investment
Income | | | Distributions
from
Capital
Gains | | | Total
Dividends
and
Distributions | | | Net
Asset
Value at
End of
Period | | | Total
Return(2) | | | Net
Assets at
End of
Period
(000s) | | | Ratio of
Expenses
to
Average
Net
Assets
Before
Adjust-
ments(3) | | | Ratio of
Expenses
to
Average
Net
Assets
After
Adjust-
ments(3) | | | Ratio of
Net
Investment
Income
(Loss) to
Average
Net Assets | | | Portfolio
Turnover | |
|
| Hartford Growth Opportunities HLS Fund | |
|
For the Year Ended December 31, 2018 | |
IA | | $ | 38.42 | | | $ | (0.05 | ) | | $ | 1.17 | | | $ | 1.12 | | | $ | — | | | $ | (5.75 | ) | | $ | (5.75 | ) | | $ | 33.79 | | | | 0.53 | % | | $ | 1,188,514 | | | | 0.65 | % | | | 0.65 | % | | | (0.12 | )% | | | 118 | % |
IB | | | 36.91 | | | | (0.14 | ) | | | 1.17 | | | | 1.03 | | | | — | | | | (5.75 | ) | | | (5.75 | ) | | | 32.19 | | | | 0.29 | | | | 132,629 | | | | 0.90 | | | | 0.90 | | | | (0.37 | ) | | | 118 | |
IC | | | 37.71 | | | | (0.25 | ) | | | 1.19 | | | | 0.94 | | | | — | | | | (5.75 | ) | | | (5.75 | ) | | | 32.90 | | | | 0.04 | | | | 36,321 | | | | 1.15 | | | | 1.15 | | | | (0.62 | ) | | | 118 | |
|
For the Year Ended December 31, 2017 | |
IA | | $ | 29.83 | | | $ | (0.05 | ) | | $ | 9.09 | | | $ | 9.04 | | | $ | — | | | $ | (0.45 | ) | | $ | (0.45 | ) | | $ | 38.42 | | | | 30.45 | % | | $ | 1,326,201 | | | | 0.66 | % | | | 0.66 | % | | | (0.15 | )% | | | 99 | % |
IB | | | 28.74 | | | | (0.13 | ) | | | 8.75 | | | | 8.62 | | | | — | | | | (0.45 | ) | | | (0.45 | ) | | | 36.91 | | | | 30.14 | | | | 149,212 | | | | 0.91 | | | | 0.91 | | | | (0.40 | ) | | | 99 | |
IC | | | 29.43 | | | | (0.22 | ) | | | 8.95 | | | | 8.73 | | | | — | | | | (0.45 | ) | | | (0.45 | ) | | | 37.71 | | | | 29.80 | | | | 34,033 | | | | 1.16 | | | | 1.16 | | | | (0.65 | ) | | | 99 | |
|
For the Year Ended December 31, 2016 | |
IA | | $ | 34.86 | | | $ | (0.04 | ) | | $ | 0.06 | (8) | | $ | 0.02 | | | $ | (0.15 | ) | | $ | (4.90 | ) | | $ | (5.05 | ) | | $ | 29.83 | | | | (0.49 | )% | | $ | 1,145,176 | | | | 0.65 | % | | | 0.65 | % | | | (0.11 | )% | | | 138 | % |
IB | | | 33.76 | | | | (0.11 | ) | | | 0.04 | (8) | | | (0.07 | ) | | | (0.05 | ) | | | (4.90 | ) | | | (4.95 | ) | | | 28.74 | | | | (0.77 | ) | | | 132,149 | | | | 0.90 | | | | 0.90 | | | | (0.35 | ) | | | 138 | |
IC | | | 34.57 | | | | (0.19 | ) | | | 0.04 | (8) | | | (0.15 | ) | | | (0.09 | ) | | | (4.90 | ) | | | (4.99 | ) | | | 29.43 | | | | (1.01 | ) | | | 25,550 | | | | 1.15 | | | | 1.15 | | | | (0.61 | ) | | | 138 | |
|
For the Year Ended December 31, 2015 | |
IA | | $ | 38.88 | | | $ | 0.02 | | | $ | 4.66 | | | $ | 4.68 | | | $ | (0.05 | ) | | $ | (8.65 | ) | | $ | (8.70 | ) | | $ | 34.86 | | | | 11.74 | % | | $ | 1,197,187 | | | | 0.65 | % | | | 0.65 | % | | | 0.05 | % | | | 109 | % |
IB | | | 37.93 | | | | (0.08 | ) | | | 4.56 | | | | 4.48 | | | | — | | | | (8.65 | ) | | | (8.65 | ) | | | 33.76 | | | | 11.47 | | | | 158,304 | | | | 0.90 | | | | 0.90 | | | | (0.20 | ) | | | 109 | |
IC | | | 38.75 | | | | (0.18 | ) | | | 4.65 | | | | 4.47 | | | | — | | | | (8.65 | ) | | | (8.65 | ) | | | 34.57 | | | | 11.18 | | | | 20,495 | | | | 1.16 | | | | 1.16 | | | | (0.48 | ) | | | 109 | |
|
For the Year Ended December 31, 2014 | |
IA | | $ | 40.58 | | | $ | 0.06 | | | $ | 5.31 | | | $ | 5.37 | | | $ | (0.07 | ) | | $ | (7.00 | ) | | $ | (7.07 | ) | | $ | 38.88 | | | | 14.14 | % | | $ | 1,203,366 | | | | 0.64 | % | | | 0.64 | % | | | 0.16 | % | | | 145 | %(9) |
IB | | | 39.79 | | | | (0.04 | ) | | | 5.18 | | | | 5.14 | | | | — | | | | (7.00 | ) | | | (7.00 | ) | | | 37.93 | | | | 13.82 | | | | 160,040 | | | | 0.89 | | | | 0.89 | | | | (0.11 | ) | | | 145 | (9) |
IC(4) | | | 40.23 | | | | (0.10 | ) | | | 5.69 | | | | 5.59 | | | | (0.07 | ) | | | (7.00 | ) | | | (7.07 | ) | | | 38.75 | | | | 14.79 | (5) | | | 1,717 | | | | 1.14 | (6) | | | 1.14 | (6) | | | (0.37 | )(6) | | | 145 | (9) |
| |
| Hartford Healthcare HLS Fund | |
|
For the Year Ended December 31, 2018 | |
IA | | $ | 22.46 | | | $ | — | | | $ | (0.41 | ) | | $ | (0.41 | ) | | $ | (0.02 | ) | | $ | (1.47 | ) | | $ | (1.49 | ) | | $ | 20.56 | | | | (2.67 | )% | | $ | 249,144 | | | | 0.89 | % | | | 0.89 | % | | | (0.01 | )% | | | 29 | % |
IB | | | 21.35 | | | | (0.06 | ) | | | (0.38 | ) | | | (0.44 | ) | | | — | | | | (1.47 | ) | | | (1.47 | ) | | | 19.44 | | | | (2.96 | ) | | | 36,576 | | | | 1.14 | | | | 1.14 | | | | (0.26 | ) | | | 29 | |
|
For the Year Ended December 31, 2017 | |
IA | | $ | 21.46 | | | $ | 0.01 | | | $ | 4.69 | | | $ | 4.70 | | | $ | — | | | $ | (3.70 | ) | | $ | (3.70 | ) | | $ | 22.46 | | | | 22.26 | % | | $ | 290,603 | | | | 0.89 | % | | | 0.89 | % | | | 0.04 | % | | | 18 | % |
IB | | | 20.60 | | | | (0.05 | ) | | | 4.50 | | | | 4.45 | | | | — | | | | (3.70 | ) | | | (3.70 | ) | | | 21.35 | | | | 21.96 | | | | 44,796 | | | | 1.14 | | | | 1.14 | | | | (0.21 | ) | | | 18 | |
|
For the Year Ended December 31, 2016 | |
IA | | $ | 30.32 | | | $ | 0.01 | | | $ | (2.37 | ) | | $ | (2.36 | ) | | $ | (0.99 | ) | | $ | (5.51 | ) | | $ | (6.50 | ) | | $ | 21.46 | | | | (8.39 | )% | | $ | 246,494 | | | | 0.89 | % | | | 0.89 | % | | | 0.05 | % | | | 36 | % |
IB | | | 29.36 | | | | (0.05 | ) | | | (2.30 | ) | | | (2.35 | ) | | | (0.90 | ) | | | (5.51 | ) | | | (6.41 | ) | | | 20.60 | | | | (8.64 | ) | | | 44,149 | | | | 1.14 | | | | 1.14 | | | | (0.20 | ) | | | 36 | |
|
For the Year Ended December 31, 2015 | |
IA | | $ | 30.02 | | | $ | — | | | $ | 4.08 | | | $ | 4.08 | | | $ | — | | | $ | (3.78 | ) | | $ | (3.78 | ) | | $ | 30.32 | | | | 13.21 | % | | $ | 360,783 | | | | 0.86 | % | | | 0.86 | % | | | (0.01 | )% | | | 38 | % |
IB | | | 29.23 | | | | (0.08 | ) | | | 3.99 | | | | 3.91 | | | | — | | | | (3.78 | ) | | | (3.78 | ) | | | 29.36 | | | | 12.98 | | | | 62,644 | | | | 1.11 | | | | 1.11 | | | | (0.26 | ) | | | 38 | |
|
For the Year Ended December 31, 2014 | |
IA | | $ | 25.67 | | | $ | 0.01 | | | $ | 6.75 | | | $ | 6.76 | | | $ | (0.07 | ) | | $ | (2.34 | ) | | $ | (2.41 | ) | | $ | 30.02 | | | | 27.39 | % | | $ | 301,580 | | | | 0.88 | % | | | 0.88 | % | | | 0.03 | % | | | 33 | % |
IB | | | 25.07 | | | | (0.06 | ) | | | 6.57 | | | | 6.51 | | | | (0.01 | ) | | | (2.34 | ) | | | (2.35 | ) | | | 29.23 | | | | 27.00 | | | | 60,413 | | | | 1.13 | | | | 1.13 | | | | (0.22 | ) | | | 33 | |
|
| Hartford High Yield HLS Fund | |
|
For the Year Ended December 31, 2018 | |
IA | | $ | 8.20 | | | $ | 0.43 | | | $ | (0.69 | ) | | $ | (0.26 | ) | | $ | (0.49 | ) | | $ | — | | | $ | (0.49 | ) | | $ | 7.45 | | | | (3.44 | )% | | $ | 190,681 | | | | 0.77 | % | | | 0.77 | % | | | 5.39 | % | | | 26 | % |
IB | | | 8.06 | | | | 0.41 | | | | (0.68 | ) | | | (0.27 | ) | | | (0.47 | ) | | | — | | | | (0.47 | ) | | | 7.32 | | | | (3.66 | ) | | | 58,726 | | | | 1.02 | | | | 1.02 | | | | 5.14 | | | | 26 | |
|
For the Year Ended December 31, 2017 | |
IA | | $ | 8.11 | | | $ | 0.45 | | | $ | 0.15 | | | $ | 0.60 | | | $ | (0.51 | ) | | $ | — | | | $ | (0.51 | ) | | $ | 8.20 | | | | 7.60 | % | | $ | 230,101 | | | | 0.77 | % | | | 0.77 | % | | | 5.42 | % | | | 43 | % |
IB | | | 7.98 | | | | 0.42 | | | | 0.15 | | | | 0.57 | | | | (0.49 | ) | | | — | | | | (0.49 | ) | | | 8.06 | | | | 7.31 | | | | 71,389 | | | | 1.02 | | | | 1.02 | | | | 5.17 | | | | 43 | |
The accompanying notes are an integral part of these financial statements.
Financial Highlights – (continued)
| | | | | | | | | | | | | | | | | | | | | | | | | | | | | | | | | | | | | | | | | | | | | | | | | | | | | | | | |
| | | — SelectedPer-Share Data(1) — | | | — Ratios and Supplemental Data — | |
Class | | Net Asset
Value at
Beginning
of Period | | | Net
Investment
Income
(Loss) | | | Net
Realized
and
Unrealized
Gain (Loss)
on
Investments | | | Total from
Investment
Operations | | | Dividends
from Net
Investment
Income | | | Distributions
from
Capital
Gains | | | Total
Dividends
and
Distributions | | | Net
Asset
Value at
End of
Period | | | Total
Return(2) | | | Net
Assets at
End of
Period
(000s) | | | Ratio of
Expenses
to
Average
Net
Assets
Before
Adjust-
ments(3) | | | Ratio of
Expenses
to
Average
Net
Assets
After
Adjust-
ments(3) | | | Ratio of
Net
Investment
Income
(Loss) to
Average
Net Assets | | | Portfolio
Turnover | |
|
| Hartford High Yield HLS Fund – (continued) | |
|
For the Year Ended December 31, 2016 | |
IA | | $ | 7.55 | | | $ | 0.44 | | | $ | 0.62 | | | $ | 1.06 | | | $ | (0.50 | ) | | $ | — | | | $ | (0.50 | ) | | $ | 8.11 | | | | 14.25 | % | | $ | 244,212 | | | | 0.79 | % | | | 0.79 | % | | | 5.52 | % | | | 41 | % |
IB | | | 7.43 | | | | 0.41 | | | | 0.62 | | | | 1.03 | | | | (0.48 | ) | | | — | | | | (0.48 | ) | | | 7.98 | | | | 13.99 | | | | 77,573 | | | | 1.04 | | | | 1.04 | | | | 5.27 | | | | 41 | |
|
For the Year Ended December 31, 2015 | |
IA | | $ | 8.45 | | | $ | 0.45 | | | $ | (0.79 | ) | | $ | (0.34 | ) | | $ | (0.56 | ) | | $ | — | | | $ | (0.56 | ) | | $ | 7.55 | | | | (4.30 | )% | | $ | 251,313 | | | | 0.76 | % | | | 0.76 | % | | | 5.40 | % | | | 34 | % |
IB | | | 8.32 | | | | 0.42 | | | | (0.77 | ) | | | (0.35 | ) | | | (0.54 | ) | | | — | | | | (0.54 | ) | | | 7.43 | | | | (4.56 | ) | | | 77,013 | | | | 1.01 | | | | 1.01 | | | | 5.15 | | | | 34 | |
|
For the Year Ended December 31, 2014 | |
IA | | $ | 8.90 | | | $ | 0.47 | | | $ | (0.22 | ) | | $ | 0.25 | | | $ | (0.70 | ) | | $ | — | | | $ | (0.70 | ) | | $ | 8.45 | | | | 2.58 | % | | $ | 321,650 | | | | 0.75 | % | | | 0.75 | % | | | 5.28 | % | | | 39 | % |
IB | | | 8.77 | | | | 0.44 | | | | (0.22 | ) | | | 0.22 | | | | (0.67 | ) | | | — | | | | (0.67 | ) | | | 8.32 | | | | 2.31 | | | | 105,579 | | | | 1.00 | | | | 1.00 | | | | 5.02 | | | | 39 | |
|
| Hartford International Opportunities HLS Fund | |
|
For the Year Ended December 31, 2018 | |
IA | | $ | 17.46 | | | $ | 0.26 | | | $ | (3.49 | ) | | $ | (3.23 | ) | | $ | (0.32 | ) | | $ | — | | | $ | (0.32 | ) | | $ | 13.91 | | | | (18.74 | )% | | $ | 1,000,295 | | | | 0.73 | % | | | 0.73 | % | | | 1.55 | % | | | 80 | % |
IB | | | 17.68 | | | | 0.22 | | | | (3.53 | ) | | | (3.31 | ) | | | (0.28 | ) | | | — | | | | (0.28 | ) | | | 14.09 | | | | (18.96 | ) | | | 120,635 | | | | 0.98 | | | | 0.98 | | | | 1.28 | | | | 80 | |
|
For the Year Ended December 31, 2017 | |
IA | | $ | 14.14 | | | $ | 0.24 | | | $ | 3.31 | | | $ | 3.55 | | | $ | (0.23 | ) | | $ | — | | | $ | (0.23 | ) | | $ | 17.46 | | | | 25.25 | % | | $ | 1,418,078 | | | | 0.73 | % | | | 0.73 | % | | | 1.46 | % | | | 91 | % |
IB | | | 14.31 | | | | 0.21 | | | | 3.35 | | | | 3.56 | | | | (0.19 | ) | | | — | | | | (0.19 | ) | | | 17.68 | | | | 24.99 | | | | 162,442 | | | | 0.98 | | | | 0.98 | | | | 1.28 | | | | 91 | |
|
For the Year Ended December 31, 2016 | |
IA | | $ | 14.19 | | | $ | 0.24 | | | $ | (0.06 | ) | | $ | 0.18 | | | $ | (0.23 | ) | | $ | — | | | $ | (0.23 | ) | | $ | 14.14 | | | | 1.26 | % | | $ | 1,086,762 | | | | 0.76 | % | | | 0.76 | % | | | 1.74 | % | | | 95 | % |
IB | | | 14.36 | | | | 0.21 | | | | (0.07 | ) | | | 0.14 | | | | (0.19 | ) | | | — | | | | (0.19 | ) | | | 14.31 | | | | 0.94 | | | | 147,343 | | | | 1.01 | | | | 1.01 | | | | 1.50 | | | | 95 | |
|
For the Year Ended December 31, 2015 | |
IA | | $ | 14.13 | | | $ | 0.22 | | | $ | 0.06 | | | $ | 0.28 | | | $ | (0.22 | ) | | $ | — | | | $ | (0.22 | ) | | $ | 14.19 | | | | 1.88 | % | | $ | 1,146,250 | | | | 0.74 | % | | | 0.74 | % | | | 1.47 | % | | | 68 | % |
IB | | | 14.29 | | | | 0.18 | | | | 0.06 | | | | 0.24 | | | | (0.17 | ) | | | — | | | | (0.17 | ) | | | 14.36 | | | | 1.65 | | | | 171,538 | | | | 0.99 | | | | 0.99 | | | | 1.21 | | | | 68 | |
|
For the Year Ended December 31, 2014 | |
IA | | $ | 15.03 | | | $ | 0.19 | | | $ | (0.75 | ) | | $ | (0.56 | ) | | $ | (0.34 | ) | | $ | — | | | $ | (0.34 | ) | | $ | 14.13 | | | | (3.87 | )% | | $ | 1,239,946 | | | | 0.73 | % | | | 0.73 | % | | | 1.30 | % | | | 90 | % |
IB | | | 15.20 | | | | 0.15 | | | | (0.76 | ) | | | (0.61 | ) | | | (0.30 | ) | | | — | | | | (0.30 | ) | | | 14.29 | | | | (4.14 | ) | | | 189,053 | | | | 0.98 | | | | 0.98 | | | | 1.02 | | | | 90 | |
|
| Hartford MidCap HLS Fund | |
|
For the Year Ended December 31, 2018 | |
IA | | $ | 40.10 | | | $ | 0.01 | | | $ | (2.35 | ) | | $ | (2.34 | ) | | $ | (0.01 | ) | | $ | (3.98 | ) | | $ | (3.99 | ) | | $ | 33.77 | | | | (7.44 | )% | | $ | 1,768,712 | | | | 0.69 | % | | | 0.69 | % | | | 0.03 | % | | | 35 | % |
IB | | | 39.18 | | | | (0.09 | ) | | | (2.26 | ) | | | (2.35 | ) | | | — | | | | (3.98 | ) | | | (3.98 | ) | | | 32.85 | | | | (7.65 | ) | | | 46,186 | | | | 0.94 | | | | 0.94 | | | | (0.22 | ) | | | 35 | |
|
For the Year Ended December 31, 2017 | |
IA | | $ | 33.83 | | | $ | 0.01 | | | $ | 8.11 | | | $ | 8.12 | | | $ | — | | | $ | (1.85 | ) | | $ | (1.85 | ) | | $ | 40.10 | | | | 24.47 | % | | $ | 2,156,044 | | | | 0.70 | % | | | 0.70 | % | | | 0.02 | % | | | 36 | % |
IB | | | 33.17 | | | | (0.08 | ) | | | 7.94 | | | | 7.86 | | | | — | | | | (1.85 | ) | | | (1.85 | ) | | | 39.18 | | | | 24.17 | | | | 58,850 | | | | 0.95 | | | | 0.95 | | | | (0.23 | ) | | | 36 | |
|
For the Year Ended December 31, 2016 | |
IA | | $ | 33.66 | | | $ | 0.05 | | | $ | 3.80 | | | $ | 3.85 | | | $ | (0.06 | ) | | $ | (3.62 | ) | | $ | (3.68 | ) | | $ | 33.83 | | | | 11.98 | % | | $ | 1,721,029 | | | | 0.71 | % | | | 0.71 | % | | | 0.16 | % | | | 32 | % |
IB | | | 33.11 | | | | (0.03 | ) | | | 3.72 | | | | 3.69 | | | | (0.01 | ) | | | (3.62 | ) | | | (3.63 | ) | | | 33.17 | | | | 11.69 | | | | 93,567 | | | | 0.96 | | | | 0.96 | | | | (0.09 | ) | | | 32 | |
|
For the Year Ended December 31, 2015 | |
IA | | $ | 37.28 | | | $ | 0.03 | | | $ | 0.83 | | | $ | 0.86 | | | $ | (0.03 | ) | | $ | (4.45 | ) | | $ | (4.48 | ) | | $ | 33.66 | | | | 1.60 | % | | $ | 1,647,715 | | | | 0.70 | % | | | 0.70 | % | | | 0.08 | % | | | 38 | % |
IB | | | 36.83 | | | | (0.06 | ) | | | 0.82 | | | | 0.76 | | | | (0.03 | ) | | | (4.45 | ) | | | (4.48 | ) | | | 33.11 | | | | 1.34 | | | | 104,395 | | | | 0.95 | | | | 0.95 | | | | (0.16 | ) | | | 38 | |
|
For the Year Ended December 31, 2014 | |
IA | | $ | 37.87 | | | $ | 0.04 | | | $ | 4.22 | | | $ | 4.26 | | | $ | (0.04 | ) | | $ | (4.81 | ) | | $ | (4.85 | ) | | $ | 37.28 | | | | 11.37 | % | | $ | 1,669,393 | | | | 0.70 | % | | | 0.70 | % | | | 0.10 | % | | | 42 | % |
IB | | | 37.52 | | | | (0.06 | ) | | | 4.18 | | | | 4.12 | | | | — | | | | (4.81 | ) | | | (4.81 | ) | | | 36.83 | | | | 11.09 | | | | 83,562 | | | | 0.95 | | | | 0.95 | | | | (0.15 | ) | | | 42 | |
The accompanying notes are an integral part of these financial statements.
Financial Highlights – (continued)
| | | | | | | | | | | | | | | | | | | | | | | | | | | | | | | | | | | | | | | | | | | | | | | | | | | | | | | | |
| | | — SelectedPer-Share Data(1) — | | | — Ratios and Supplemental Data — | |
Class | | Net Asset
Value at
Beginning
of Period | | | Net
Investment
Income
(Loss) | | | Net
Realized
and
Unrealized
Gain (Loss)
on
Investments | | | Total from
Investment
Operations | | | Dividends
from Net
Investment
Income | | | Distributions
from
Capital
Gains | | | Total
Dividends
and
Distributions | | | Net
Asset
Value at
End of
Period | | | Total
Return(2) | | | Net
Assets at
End of
Period
(000s) | | | Ratio of
Expenses
to
Average
Net
Assets
Before
Adjust-
ments(3) | | | Ratio of
Expenses
to
Average
Net
Assets
After
Adjust-
ments(3) | | | Ratio of
Net
Investment
Income
(Loss) to
Average
Net Assets | | | Portfolio
Turnover | |
|
| Hartford MidCap Growth HLS Fund | |
|
For the Year Ended December 31, 2018 | |
IA | | $ | 8.81 | | | $ | 0.02 | | | $ | (0.74 | ) | | $ | (0.72 | ) | | $ | (0.06 | ) | | $ | (0.86 | ) | | $ | (0.92 | ) | | $ | 7.17 | | | | (10.05 | )% | | $ | 64,744 | | | | 0.91 | % | | | 0.91 | % | | | 0.20 | % | | | 160 | % |
IB | | | 8.75 | | | | — | | | | (0.73 | ) | | | (0.73 | ) | | | (0.04 | ) | | | (0.86 | ) | | | (0.90 | ) | | | 7.12 | | | | (10.25 | ) | | | 11,363 | | | | 1.16 | | | | 1.16 | | | | (0.05 | ) | | | 160 | |
|
For the Year Ended December 31, 2017 | |
IA | | $ | 8.03 | | | $ | 0.08 | | | $ | 1.04 | | | $ | 1.12 | | | $ | (0.07 | ) | | $ | (0.27 | ) | | $ | (0.34 | ) | | $ | 8.81 | | | | 14.43 | % | | $ | 84,144 | | | | 0.92 | % | | | 0.92 | % | | | 0.91 | % | | | 82 | % |
IB | | | 7.99 | | | | 0.05 | | | | 1.03 | | | | 1.08 | | | | (0.05 | ) | | | (0.27 | ) | | | (0.32 | ) | | | 8.75 | | | | 13.94 | | | | 14,851 | | | | 1.17 | | | | 1.17 | | | | 0.66 | | | | 82 | |
|
For the Year Ended December 31, 2016 | |
IA | | $ | 7.45 | | | $ | 0.09 | | | $ | 1.09 | | | $ | 1.18 | | | $ | (0.11 | ) | | $ | (0.49 | ) | | $ | (0.60 | ) | | $ | 8.03 | | | | 16.48 | % | | $ | 87,752 | | | | 0.92 | % | | | 0.92 | % | | | 1.25 | % | | | 96 | % |
IB | | | 7.40 | | | | 0.07 | | | | 1.09 | | | | 1.16 | | | | (0.08 | ) | | | (0.49 | ) | | | (0.57 | ) | | | 7.99 | | | | 16.33 | | | | 17,125 | | | | 1.17 | | | | 1.17 | | | | 1.01 | | | | 96 | |
|
For the Year Ended December 31, 2015 | |
IA | | $ | 9.47 | | | $ | 0.12 | | | $ | (0.46 | ) | | $ | (0.34 | ) | | $ | (0.12 | ) | | $ | (1.56 | ) | | $ | (1.68 | ) | | $ | 7.45 | | | | (4.73 | )% | | $ | 79,379 | | | | 0.88 | % | | | 0.88 | % | | | 1.39 | % | | | 80 | % |
IB | | | 9.41 | | | | 0.10 | | | | (0.46 | ) | | | (0.36 | ) | | | (0.09 | ) | | | (1.56 | ) | | | (1.65 | ) | | | 7.40 | | | | (4.97 | ) | | | 16,501 | | | | 1.13 | | | | 1.13 | | | | 1.12 | | | | 80 | |
|
For the Year Ended December 31, 2014 | |
IA | | $ | 11.29 | | | $ | 0.13 | | | $ | 0.43 | | | $ | 0.56 | | | $ | (0.18 | ) | | $ | (2.20 | ) | | $ | (2.38 | ) | | $ | 9.47 | | | | 5.22 | % | | $ | 98,069 | | | | 0.85 | % | | | 0.85 | % | | | 1.20 | % | | | 108 | % |
IB | | | 11.22 | | | | 0.10 | | | | 0.44 | | | | 0.54 | | | | (0.15 | ) | | | (2.20 | ) | | | (2.35 | ) | | | 9.41 | | | | 5.00 | | | | 23,239 | | | | 1.10 | | | | 1.10 | | | | 0.96 | | | | 108 | |
|
| Hartford MidCap Value HLS Fund | |
|
For the Year Ended December 31, 2018 | |
IA | | $ | 12.60 | | | $ | 0.08 | | | $ | (1.76 | ) | | $ | (1.68 | ) | | $ | (0.13 | ) | | $ | (0.86 | ) | | $ | (0.99 | ) | | $ | 9.93 | | | | (14.57 | )% | | $ | 216,868 | | | | 0.85 | % | | | 0.85 | % | | | 0.63 | % | | | 42 | % |
IB | | | 12.50 | | | | 0.05 | | | | (1.75 | ) | | | (1.70 | ) | | | (0.06 | ) | | | (0.86 | ) | | | (0.92 | ) | | | 9.88 | | | | (14.77 | ) | | | 64,800 | | | | 1.10 | | | | 1.10 | | | | 0.38 | | | | 42 | |
|
For the Year Ended December 31, 2017 | |
IA | | $ | 12.00 | | | $ | 0.05 | | | $ | 1.47 | | | $ | 1.52 | | | $ | (0.07 | ) | | $ | (0.85 | ) | | $ | (0.92 | ) | | $ | 12.60 | | | | 13.47 | % | | $ | 287,688 | | | | 0.86 | % | | | 0.86 | % | | | 0.39 | % | | | 32 | % |
IB | | | 11.91 | | | | 0.02 | | | | 1.46 | | | | 1.48 | | | | (0.04 | ) | | | (0.85 | ) | | | (0.89 | ) | | | 12.50 | | | | 13.18 | | | | 87,149 | | | | 1.11 | | | | 1.11 | | | | 0.14 | | | | 32 | |
|
For the Year Ended December 31, 2016 | |
IA | | $ | 12.33 | | | $ | 0.07 | | | $ | 1.40 | | | $ | 1.47 | | | $ | (0.07 | ) | | $ | (1.73 | ) | | $ | (1.80 | ) | | $ | 12.00 | | | | 12.82 | % | | $ | 289,872 | | | | 0.86 | % | | | 0.86 | % | | | 0.61 | % | | | 38 | % |
IB | | | 12.24 | | | | 0.04 | | | | 1.39 | | | | 1.43 | | | | (0.03 | ) | | | (1.73 | ) | | | (1.76 | ) | | | 11.91 | | | | 12.56 | | | | 89,704 | | | | 1.11 | | | | 1.11 | | | | 0.36 | | | | 38 | |
|
For the Year Ended December 31, 2015 | |
IA | | $ | 14.60 | | | $ | 0.07 | | | $ | (0.15 | ) | | $ | (0.08 | ) | | $ | (0.09 | ) | | $ | (2.10 | ) | | $ | (2.19 | ) | | $ | 12.33 | | | | (1.21 | )% | | $ | 291,174 | | | | 0.84 | % | | | 0.84 | % | | | 0.49 | % | | | 29 | % |
IB | | | 14.50 | | | | 0.03 | | | | (0.15 | ) | | | (0.12 | ) | | | (0.04 | ) | | | (2.10 | ) | | | (2.14 | ) | | | 12.24 | | | | (1.45 | ) | | | 91,720 | | | | 1.09 | | | | 1.09 | | | | 0.24 | | | | 29 | |
|
For the Year Ended December 31, 2014 | |
IA | | $ | 15.51 | | | $ | 0.09 | | | $ | 1.19 | | | $ | 1.28 | | | $ | (0.11 | ) | | $ | (2.08 | ) | | $ | (2.19 | ) | | $ | 14.60 | | | | 8.22 | % | | $ | 345,084 | | | | 0.84 | % | | | 0.84 | % | | | 0.60 | % | | | 31 | % |
IB | | | 15.42 | | | | 0.05 | | | | 1.18 | | | | 1.23 | | | | (0.07 | ) | | | (2.08 | ) | | | (2.15 | ) | | | 14.50 | | | | 7.91 | | | | 110,819 | | | | 1.09 | | | | 1.09 | | | | 0.35 | | | | 31 | |
|
| Hartford Small Cap Growth HLS Fund | |
|
For the Year Ended December 31, 2018 | |
IA | | $ | 32.13 | | | $ | (0.01 | ) | | $ | (3.27 | ) | | $ | (3.28 | ) | | $ | — | | | $ | (2.09 | ) | | $ | (2.09 | ) | | $ | 26.76 | | | | (11.70 | )% | | $ | 803,907 | | | | 0.64 | % | | | 0.64 | % | | | (0.03 | )% | | | 86 | % |
IB | | | 31.28 | | | | (0.09 | ) | | | (3.15 | ) | | | (3.24 | ) | | | — | | | | (2.09 | ) | | | (2.09 | ) | | | 25.95 | | | | (11.89 | ) | | | 312,475 | | | | 0.89 | | | | 0.89 | | | | (0.28 | ) | | | 86 | |
|
For the Year Ended December 31, 2017 | |
IA | | $ | 26.77 | | | $ | (0.02 | ) | | $ | 5.39 | | | $ | 5.37 | | | $ | (0.01 | ) | | $ | — | | | $ | (0.01 | ) | | $ | 32.13 | | | | 20.07 | % | | $ | 960,690 | | | | 0.65 | % | | | 0.65 | % | | | (0.06 | )% | | | 51 | % |
IB | | | 26.12 | | | | (0.09 | ) | | | 5.25 | | | | 5.16 | | | | — | | | | — | | | | — | | | | 31.28 | | | | 19.75 | | | | 374,342 | | | | 0.90 | | | | 0.90 | | | | (0.31 | ) | | | 51 | |
|
For the Year Ended December 31, 2016 | |
IA | | $ | 24.93 | | | $ | 0.04 | | | $ | 2.98 | | | $ | 3.02 | | | $ | (0.04 | ) | | $ | (1.14 | ) | | $ | (1.18 | ) | | $ | 26.77 | | | | 12.37 | % | | $ | 972,576 | | | | 0.65 | % | | | 0.65 | % | | | 0.17 | % | | | 51 | % |
IB | | | 24.38 | | | | (0.02 | ) | | | 2.90 | | | | 2.88 | | | | — | | | | (1.14 | ) | | | (1.14 | ) | | | 26.12 | | | | 12.08 | | | | 226,557 | | | | 0.90 | | | | 0.90 | | | | (0.08 | ) | | | 51 | |
|
For the Year Ended December 31, 2015 | |
IA | | $ | 27.95 | | | $ | 0.07 | | | $ | (0.02 | ) | | $ | 0.05 | | | $ | (0.02 | ) | | $ | (3.05 | ) | | $ | (3.07 | ) | | $ | 24.93 | | | | (0.55 | )% | | $ | 913,414 | | | | 0.65 | % | | | 0.65 | % | | | 0.25 | % | | | 59 | % |
IB | | | 27.44 | | | | (0.01 | ) | | | — | | | | (0.01 | ) | | | — | | | | (3.05 | ) | | | (3.05 | ) | | | 24.38 | | | | (0.79 | ) | | | 209,948 | | | | 0.90 | | | | 0.90 | | | | (0.03 | ) | | | 59 | |
The accompanying notes are an integral part of these financial statements.
Financial Highlights – (continued)
| | | | | | | | | | | | | | | | | | | | | | | | | | | | | | | | | | | | | | | | | | | | | | | | | | | | | | | | |
| | | — SelectedPer-Share Data(1) — | | | — Ratios and Supplemental Data — | |
Class | | Net Asset
Value at
Beginning
of Period | | | Net
Investment
Income
(Loss) | | | Net
Realized
and
Unrealized
Gain (Loss)
on
Investments | | | Total from
Investment
Operations | | | Dividends
from Net
Investment
Income | | | Distributions
from
Capital
Gains | | | Total
Dividends
and
Distributions | | | Net
Asset
Value at
End of
Period | | | Total
Return(2) | | | Net
Assets at
End of
Period
(000s) | | | Ratio of
Expenses
to
Average
Net
Assets
Before
Adjust-
ments(3) | | | Ratio of
Expenses
to
Average
Net
Assets
After
Adjust-
ments(3) | | | Ratio of
Net
Investment
Income
(Loss) to
Average
Net Assets | | | Portfolio
Turnover | |
|
| Hartford Small Cap Growth HLS Fund – (continued) | |
|
For the Year Ended December 31, 2014 | |
IA | | $ | 32.60 | | | $ | 0.06 | | | $ | 1.48 | | | $ | 1.54 | | | $ | (0.02 | ) | | $ | (6.17 | ) | | $ | (6.19 | ) | | $ | 27.95 | | | | 5.83 | % | | $ | 557,200 | | | | 0.65 | % | | | 0.65 | % | | | 0.19 | % | | | 117 | % |
IB | | | 32.17 | | | | (0.02 | ) | | | 1.46 | | | | 1.44 | | | | — | | | | (6.17 | ) | | | (6.17 | ) | | | 27.44 | | | | 5.57 | | | | 115,230 | | | | 0.90 | | | | 0.90 | | | | (0.06 | ) | | | 117 | |
|
| Hartford Small Company HLS Fund | |
|
For the Year Ended December 31, 2018 | |
IA | | $ | 20.42 | | | $ | (0.10 | ) | | $ | (0.46 | ) | | $ | (0.56 | ) | | $ | — | | | $ | (1.48 | ) | | $ | (1.48 | ) | | $ | 18.38 | | | | (4.23 | )% | | $ | 473,098 | | | | 0.78 | % | | | 0.78 | % | | | (0.47 | )% | | | 100 | % |
IB | | | 18.97 | | | | (0.15 | ) | | | (0.40 | ) | | | (0.55 | ) | | | — | | | | (1.48 | ) | | | (1.48 | ) | | | 16.94 | | | | (4.51 | ) | | | 46,402 | | | | 1.03 | | | | 1.03 | | | | (0.73 | ) | | | 100 | |
|
For the Year Ended December 31, 2017 | |
IA | | $ | 16.16 | | | $ | (0.06 | ) | | $ | 4.32 | | | $ | 4.26 | | | $ | — | | | $ | — | | | $ | — | | | $ | 20.42 | | | | 26.36 | % | | $ | 551,010 | | | | 0.78 | % | | | 0.78 | % | | | (0.33 | )% | | | 107 | % |
IB | | | 15.05 | | | | (0.10 | ) | | | 4.02 | | | | 3.92 | | | | — | | | | — | | | | — | | | | 18.97 | | | | 26.05 | | | | 57,193 | | | | 1.03 | | | | 1.03 | | | | (0.58 | ) | | | 107 | |
|
For the Year Ended December 31, 2016 | |
IA | | $ | 17.52 | | | $ | (0.01 | ) | | $ | 0.33 | (8) | | $ | 0.32 | | | $ | — | | | $ | (1.68 | ) | | $ | (1.68 | ) | | $ | 16.16 | | | | 2.04 | % | | $ | 834,044 | | | | 0.76 | % | | | 0.76 | % | | | (0.08 | )% | | | 94 | % |
IB | | | 16.47 | | | | (0.05 | ) | | | 0.31 | (8) | | | 0.26 | | | | — | | | | (1.68 | ) | | | (1.68 | ) | | | 15.05 | | | | 1.81 | | | | 73,108 | | | | 1.01 | | | | 1.01 | | | | (0.34 | ) | | | 94 | |
|
For the Year Ended December 31, 2015 | |
IA | | $ | 23.33 | | | $ | (0.02 | ) | | $ | (1.43 | ) | | $ | (1.45 | ) | | $ | — | | | $ | (4.36 | ) | | $ | (4.36 | ) | | $ | 17.52 | | | | (8.21 | )% | | $ | 1,117,778 | | | | 0.71 | % | | | 0.71 | % | | | (0.11 | )% | | | 88 | % |
IB | | | 22.24 | | | | (0.07 | ) | | | (1.34 | ) | | | (1.41 | ) | | | — | | | | (4.36 | ) | | | (4.36 | ) | | | 16.47 | | | | (8.45 | ) | | | 98,501 | | | | 0.96 | | | | 0.96 | | | | (0.36 | ) | | | 88 | |
|
For the Year Ended December 31, 2014 | |
IA | | $ | 26.43 | | | $ | (0.09 | ) | | $ | 1.78 | | | $ | 1.69 | | | $ | — | | | $ | (4.79 | ) | | $ | (4.79 | ) | | $ | 23.33 | | | | 7.07 | % | | $ | 1,279,533 | | | | 0.71 | % | | | 0.71 | % | | | (0.35 | )% | | | 90 | % |
IB | | | 25.46 | | | | (0.15 | ) | | | 1.72 | | | | 1.57 | | | | — | | | | (4.79 | ) | | | (4.79 | ) | | | 22.24 | | | | 6.85 | | | | 123,799 | | | | 0.96 | | | | 0.96 | | | | (0.60 | ) | | | 90 | |
|
| Hartford Stock HLS Fund | |
|
For the Year Ended December 31, 2018 | |
IA | | $ | 79.57 | | | $ | 1.31 | | | $ | (1.45 | ) | | $ | (0.14 | ) | | $ | (1.33 | ) | | $ | — | | | $ | (1.33 | ) | | $ | 78.10 | | | | (0.14 | )% | | $ | 1,201,873 | | | | 0.51 | % | | | 0.51 | % | | | 1.60 | % | | | 22 | % |
IB | | | 79.54 | | | | 1.10 | | | | (1.43 | ) | | | (0.33 | ) | | | (1.10 | ) | | | — | | | | (1.10 | ) | | | 78.11 | | | | (0.38 | ) | | | 120,176 | | | | 0.76 | | | | 0.76 | | | | 1.34 | | | | 22 | |
|
For the Year Ended December 31, 2017 | |
IA | | $ | 67.55 | | | $ | 1.30 | | | $ | 12.10 | | | $ | 13.40 | | | $ | (1.38 | ) | | $ | — | | | $ | (1.38 | ) | | $ | 79.57 | | | | 19.85 | % | | $ | 1,378,245 | | | | 0.52 | % | | | 0.52 | % | | | 1.76 | % | | | 14 | % |
IB | | | 67.53 | | | | 1.11 | | | | 12.08 | | | | 13.19 | | | | (1.18 | ) | | | — | | | | (1.18 | ) | | | 79.54 | | | | 19.54 | | | | 143,370 | | | | 0.77 | | | | 0.77 | | | | 1.51 | | | | 14 | |
|
For the Year Ended December 31, 2016 | |
IA | | $ | 64.06 | | | $ | 1.14 | | | $ | 3.61 | | | $ | 4.75 | | | $ | (1.26 | ) | | $ | — | | | $ | (1.26 | ) | | $ | 67.55 | | | | 7.41 | % | | $ | 1,312,626 | | | | 0.52 | % | | | 0.52 | % | | | 1.72 | % | | | 29 | % |
IB | | | 64.03 | | | | 0.97 | | | | 3.61 | | | | 4.58 | | | | (1.08 | ) | | | — | | | | (1.08 | ) | | | 67.53 | | | | 7.14 | | | | 140,317 | | | | 0.77 | | | | 0.77 | | | | 1.47 | | | | 29 | |
|
For the Year Ended December 31, 2015 | |
IA | | $ | 63.49 | | | $ | 1.19 | | | $ | 0.56 | | | $ | 1.75 | | | $ | (1.18 | ) | | $ | — | | | $ | (1.18 | ) | | $ | 64.06 | | | | 2.74 | % | | $ | 1,388,110 | | | | 0.51 | % | | | 0.51 | % | | | 1.86 | % | | | 23 | % |
IB | | | 63.46 | | | | 1.03 | | | | 0.54 | | | | 1.57 | | | | (1.00 | ) | | | — | | | | (1.00 | ) | | | 64.03 | | | | 2.48 | | | | 155,722 | | | | 0.76 | | | | 0.76 | | | | 1.61 | | | | 23 | |
|
For the Year Ended December 31, 2014 | |
IA | | $ | 58.07 | | | $ | 1.07 | | | $ | 5.51 | | | $ | 6.58 | | | $ | (1.16 | ) | | $ | — | | | $ | (1.16 | ) | | $ | 63.49 | | | | 11.31 | % | | $ | 1,552,777 | | | | 0.50 | % | | | 0.50 | % | | | 1.79 | % | | | 20 | % |
IB | | | 58.04 | | | | 0.92 | | | | 5.50 | | | | 6.42 | | | | (1.00 | ) | | | — | | | | (1.00 | ) | | | 63.46 | | | | 11.04 | | | | 182,112 | | | | 0.75 | | | | 0.75 | | | | 1.54 | | | | 20 | |
|
| Hartford Total Return Bond HLS Fund | |
|
For the Year Ended December 31, 2018 | |
IA | | $ | 11.32 | | | $ | 0.35 | | | $ | (0.43 | ) | | $ | (0.08 | ) | | $ | (0.44 | ) | | $ | (0.04 | ) | | $ | (0.48 | ) | | $ | 10.76 | | | | (0.81 | )% | | $ | 1,871,299 | | | | 0.51 | % | | | 0.51 | % | | | 3.23 | % | | | 53 | % |
IB | | | 11.25 | | | | 0.33 | | | | (0.43 | ) | | | (0.10 | ) | | | (0.41 | ) | | | (0.04 | ) | | | (0.45 | ) | | | 10.70 | | | | (0.91 | ) | | | 215,123 | | | | 0.76 | | | | 0.76 | | | | 2.98 | | | | 53 | |
|
For the Year Ended December 31, 2017 | |
IA | | $ | 11.09 | | | $ | 0.34 | | | $ | 0.23 | | | $ | 0.57 | | | $ | (0.34 | ) | | $ | — | | | $ | (0.34 | ) | | $ | 11.32 | | | | 5.16 | % | | $ | 2,157,506 | | | | 0.51 | % | | | 0.51 | % | | | 2.99 | % | | | 89 | % |
IB | | | 11.03 | | | | 0.31 | | | | 0.22 | | | | 0.53 | | | | (0.31 | ) | | | — | | | | (0.31 | ) | | | 11.25 | | | | 4.80 | | | | 248,785 | | | | 0.76 | | | | 0.76 | | | | 2.74 | | | | 89 | |
The accompanying notes are an integral part of these financial statements.
Financial Highlights – (continued)
| | | | | | | | | | | | | | | | | | | | | | | | | | | | | | | | | | | | | | | | | | | | | | | | | | | | | | | | |
| | | — SelectedPer-Share Data(1) — | | | — Ratios and Supplemental Data — | |
Class | | Net Asset
Value at
Beginning
of Period | | | Net
Investment
Income
(Loss) | | | Net
Realized
and
Unrealized
Gain (Loss)
on
Investments | | | Total from
Investment
Operations | | | Dividends
from Net
Investment
Income | | | Distributions
from
Capital
Gains | | | Total
Dividends
and
Distributions | | | Net
Asset
Value at
End of
Period | | | Total
Return(2) | | | Net
Assets at
End of
Period
(000s) | | | Ratio of
Expenses
to
Average
Net
Assets
Before
Adjust-
ments(3) | | | Ratio of
Expenses
to
Average
Net
Assets
After
Adjust-
ments(3) | | | Ratio of
Net
Investment
Income
(Loss) to
Average
Net Assets | | | Portfolio
Turnover | |
|
| Hartford Total Return Bond HLS Fund – (continued) | |
|
For the Year Ended December 31, 2016 | |
IA | | $ | 10.93 | | | $ | 0.36 | | | $ | 0.13 | | | $ | 0.49 | | | $ | (0.29 | ) | | $ | (0.04 | ) | | $ | (0.33 | ) | | $ | 11.09 | | | | 4.49 | % | | $ | 2,244,505 | | | | 0.52 | % | | | 0.52 | % | | | 3.16 | % | | | 36 | % |
IB | | | 10.87 | | | | 0.33 | | | | 0.13 | | | | 0.46 | | | | (0.26 | ) | | | (0.04 | ) | | | (0.30 | ) | | | 11.03 | | | | 4.22 | | | | 262,187 | | | | 0.77 | | | | 0.77 | | | | 2.91 | | | | 36 | |
|
For the Year Ended December 31, 2015 | |
IA | | $ | 11.63 | | | $ | 0.33 | | | $ | (0.39 | ) | | $ | (0.06 | ) | | $ | (0.36 | ) | | $ | (0.28 | ) | | $ | (0.64 | ) | | $ | 10.93 | | | | (0.59 | )% | | $ | 2,448,280 | | | | 0.51 | % | | | 0.51 | % | | | 2.88 | % | | | 66 | % |
IB | | | 11.56 | | | | 0.30 | | | | (0.39 | ) | | | (0.09 | ) | | | (0.32 | ) | | | (0.28 | ) | | | (0.60 | ) | | | 10.87 | | | | (0.81 | ) | | | 295,006 | | | | 0.76 | | | | 0.76 | | | | 2.63 | | | | 66 | |
|
For the Year Ended December 31, 2014 | |
IA | | $ | 11.35 | | | $ | 0.33 | | | $ | 0.34 | | | $ | 0.67 | | | $ | (0.39 | ) | | $ | — | | | $ | (0.39 | ) | | $ | 11.63 | | | | 5.89 | % | | $ | 2,879,633 | | | | 0.50 | % | | | 0.50 | % | | | 2.85 | % | | | 84 | % |
IB | | | 11.27 | | | | 0.30 | | | | 0.34 | | | | 0.64 | | | | (0.35 | ) | | | — | | | | (0.35 | ) | | | 11.56 | | | | 5.68 | | | | 360,006 | | | | 0.75 | | | | 0.75 | | | | 2.60 | | | | 84 | |
|
| Hartford Ultrashort Bond HLS Fund | |
|
For the Year Ended December 31, 2018 | |
IA | | $ | 10.06 | | | $ | 0.18 | | | $ | (0.02 | ) | | $ | 0.16 | | | $ | (0.12 | ) | | $ | — | | | $ | (0.12 | ) | | $ | 10.10 | | | | 1.57 | % | | $ | 437,160 | | | | 0.45 | % | | | 0.45 | % | | | 1.77 | % | | | 51 | % |
IB | | | 10.05 | | | | 0.15 | | | | (0.02 | ) | | | 0.13 | | | | (0.09 | ) | | | — | | | | (0.09 | ) | | | 10.09 | | | | 1.27 | | | | 64,859 | | | | 0.70 | | | | 0.70 | | | | 1.52 | | | | 51 | |
|
For the Year Ended December 31, 2017 | |
IA | | $ | 10.04 | | | $ | 0.10 | | | $ | — | (8) | | $ | 0.10 | | | $ | (0.08 | ) | | $ | — | | | $ | (0.08 | ) | | $ | 10.06 | | | | 1.01 | % | | $ | 460,643 | | | | 0.45 | % | | | 0.45 | % | | | 1.00 | % | | | 60 | % |
IB | | | 10.02 | | | | 0.07 | | | | 0.01 | (8) | | | 0.08 | | | | (0.05 | ) | | | — | | | | (0.05 | ) | | | 10.05 | | | | 0.80 | | | | 65,424 | | | | 0.70 | | | | 0.70 | | | | 0.75 | | | | 60 | |
|
For the Year Ended December 31, 2016 | |
IA | | $ | 9.99 | | | $ | 0.06 | | | $ | 0.04 | | | $ | 0.10 | | | $ | (0.05 | ) | | $ | — | | | $ | (0.05 | ) | | $ | 10.04 | | | | 0.97 | % | | $ | 533,091 | | | | 0.45 | % | | | 0.45 | % | | | 0.61 | % | | | 51 | % |
IB | | | 9.97 | | | | 0.04 | | | | 0.02 | | | | 0.06 | | | | (0.01 | ) | | | — | | | | (0.01 | ) | | | 10.02 | | | | 0.64 | | | | 78,658 | | | | 0.70 | | | | 0.70 | | | | 0.35 | | | | 51 | |
|
For the Year Ended December 31, 2015 | |
IA | | $ | 10.01 | | | $ | 0.03 | | | $ | (0.02 | ) | | $ | 0.01 | | | $ | (0.03 | ) | | $ | — | | | $ | (0.03 | ) | | $ | 9.99 | | | | 0.13 | % | | $ | 611,087 | | | | 0.43 | % | | | 0.43 | % | | | 0.33 | % | | | 35 | % |
IB | | | 9.98 | | | | 0.01 | | | | (0.02 | ) | | | (0.01 | ) | | | — | | | | — | | | | — | | | | 9.97 | | | | (0.09 | ) | | | 96,970 | | | | 0.68 | | | | 0.68 | | | | 0.08 | | | | 35 | |
|
For the Year Ended December 31, 2014 | |
IA | | $ | 10.00 | | | $ | 0.02 | | | $ | (0.01 | ) | | $ | 0.01 | | | $ | — | | | $ | — | | | $ | — | | | $ | 10.01 | | | | 0.10 | % | | $ | 745,597 | | | | 0.43 | % | | | 0.43 | % | | | 0.23 | % | | | 40 | % |
IB | | | 9.99 | | | | — | | | | (0.01 | ) | | | (0.01 | ) | | | — | | | | — | | | | — | | | | 9.98 | | | | (0.10 | ) | | | 121,168 | | | | 0.68 | | | | 0.68 | | | | (0.02 | ) | | | 40 | |
|
| Hartford U.S. Government Securities HLS Fund | |
|
For the Year Ended December 31, 2018 | |
IA | | $ | 10.21 | | | $ | 0.21 | | | $ | (0.13 | ) | | $ | 0.08 | | | $ | (0.24 | ) | | $ | — | | | $ | (0.24 | ) | | $ | 10.05 | | | | 0.85 | % | | $ | 286,243 | | | | 0.52 | % | | | 0.52 | % | | | 2.08 | % | | | 42 | % |
IB | | | 10.20 | | | | 0.18 | | | | (0.13 | ) | | | 0.05 | | | | (0.21 | ) | | | — | | | | (0.21 | ) | | | 10.04 | | | | 0.55 | | | | 59,340 | | | | 0.77 | | | | 0.77 | | | | 1.83 | | | | 42 | |
|
For the Year Ended December 31, 2017 | |
IA | | $ | 10.30 | | | $ | 0.19 | | | $ | (0.05 | ) | | $ | 0.14 | | | $ | (0.23 | ) | | $ | — | | | $ | (0.23 | ) | | $ | 10.21 | | | | 1.32 | % | | $ | 329,889 | | | | 0.51 | % | | | 0.51 | % | | | 1.79 | % | | | 109 | % |
IB | | | 10.28 | | | | 0.16 | | | | (0.04 | ) | | | 0.12 | | | | (0.20 | ) | | | — | | | | (0.20 | ) | | | 10.20 | | | | 1.11 | | | | 70,185 | | | | 0.76 | | | | 0.76 | | | | 1.54 | | | | 109 | |
|
For the Year Ended December 31, 2016 | |
IA | | $ | 10.34 | | | $ | 0.18 | | | $ | (0.02 | )(8) | | $ | 0.16 | | | $ | (0.20 | ) | | $ | — | | | $ | (0.20 | ) | | $ | 10.30 | | | | 1.54 | % | | $ | 368,740 | | | | 0.51 | % | | | 0.51 | % | | | 1.67 | % | | | 81 | % |
IB | | | 10.32 | | | | 0.15 | | | | (0.02 | )(8) | | | 0.13 | | | | (0.17 | ) | | | — | | | | (0.17 | ) | | | 10.28 | | | | 1.27 | | | | 79,489 | | | | 0.76 | | | | 0.76 | | | | 1.42 | | | | 81 | |
|
For the Year Ended December 31, 2015 | |
IA | | $ | 10.37 | | | $ | 0.16 | | | $ | — | | | $ | 0.16 | | | $ | (0.19 | ) | | $ | — | | | $ | (0.19 | ) | | $ | 10.34 | | | | 1.56 | % | | $ | 412,060 | | | | 0.49 | % | | | 0.49 | % | | | 1.53 | % | | | 42 | % |
IB | | | 10.34 | | | | 0.13 | | | | 0.01 | | | | 0.14 | | | | (0.16 | ) | | | — | | | | (0.16 | ) | | | 10.32 | | | | 1.35 | | | | 90,088 | | | | 0.74 | | | | 0.74 | | | | 1.28 | | | | 42 | |
|
For the Year Ended December 31, 2014 | |
IA | | $ | 10.32 | | | $ | 0.15 | | | $ | 0.14 | | | $ | 0.29 | | | $ | (0.24 | ) | | $ | — | | | $ | (0.24 | ) | | $ | 10.37 | | | | 2.81 | % | | $ | 468,967 | | | | 0.48 | % | | | 0.48 | % | | | 1.40 | % | | | 37 | % |
IB | | | 10.28 | | | | 0.12 | | | | 0.15 | | | | 0.27 | | | | (0.21 | ) | | | — | | | | (0.21 | ) | | | 10.34 | | | | 2.59 | | | | 102,235 | | | | 0.73 | | | | 0.73 | | | | 1.15 | | | | 37 | |
The accompanying notes are an integral part of these financial statements.
Financial Highlights – (continued)
| | | | | | | | | | | | | | | | | | | | | | | | | | | | | | | | | | | | | | | | | | | | | | | | | | | | | | | | |
| | | — SelectedPer-Share Data(1) — | | | — Ratios and Supplemental Data — | |
Class | | Net Asset
Value at
Beginning
of Period | | | Net
Investment
Income
(Loss) | | | Net
Realized
and
Unrealized
Gain (Loss)
on
Investments | | | Total from
Investment
Operations | | | Dividends
from Net
Investment
Income | | | Distributions
from
Capital
Gains | | | Total
Dividends
and
Distributions | | | Net
Asset
Value at
End of
Period | | | Total
Return(2) | | | Net
Assets at
End of
Period
(000s) | | | Ratio of
Expenses
to
Average
Net
Assets
Before
Adjust-
ments(3) | | | Ratio of
Expenses
to
Average
Net
Assets
After
Adjust-
ments(3) | | | Ratio of
Net
Investment
Income
(Loss) to
Average
Net Assets | | | Portfolio
Turnover | |
|
| Hartford Value HLS Fund | |
|
For the Year Ended December 31, 2018 | |
IA | | $ | 16.05 | | | $ | 0.28 | | | $ | (1.75 | ) | | $ | (1.47 | ) | | $ | (0.25 | ) | | $ | (1.52 | ) | | $ | (1.77 | ) | | $ | 12.81 | | | | (10.18 | )% | | $ | 353,040 | | | | 0.71 | % | | | 0.71 | % | | | 1.80 | % | | | 28 | % |
IB | | | 16.02 | | | | 0.24 | | | | (1.74 | ) | | | (1.50 | ) | | | (0.21 | ) | | | (1.52 | ) | | | (1.73 | ) | | | 12.79 | | | | (10.40 | ) | | | 58,204 | | | | 0.96 | | | | 0.96 | | | | 1.55 | | | | 28 | |
|
For the Year Ended December 31, 2017 | |
IA | | $ | 15.27 | | | $ | 0.25 | | | $ | 1.98 | | | $ | 2.23 | | | $ | (0.28 | ) | | $ | (1.17 | ) | | $ | (1.45 | ) | | $ | 16.05 | | | | 15.44 | % | | $ | 450,788 | | | | 0.80 | % | | | 0.80 | % | | | 1.56 | % | | | 14 | % |
IB | | | 15.26 | | | | 0.21 | | | | 1.96 | | | | 2.17 | | | | (0.24 | ) | | | (1.17 | ) | | | (1.41 | ) | | | 16.02 | | | | 15.04 | | | | 75,698 | | | | 1.05 | | | | 1.05 | | | | 1.31 | | | | 14 | |
|
For the Year Ended December 31, 2016 | |
IA | | $ | 15.58 | | | $ | 0.28 | | | $ | 1.75 | | | $ | 2.03 | | | $ | (0.26 | ) | | $ | (2.08 | ) | | $ | (2.34 | ) | | $ | 15.27 | | | | 13.69 | % | | $ | 446,411 | | | | 0.80 | % | | | 0.80 | % | | | 1.83 | % | | | 15 | % |
IB | | | 15.57 | | | | 0.24 | | | | 1.75 | | | | 1.99 | | | | (0.22 | ) | | | (2.08 | ) | | | (2.30 | ) | | | 15.26 | | | | 13.46 | | | | 77,796 | | | | 1.05 | | | | 1.05 | | | | 1.58 | | | | 15 | |
|
For the Year Ended December 31, 2015 | |
IA | | $ | 16.89 | | | $ | 0.26 | | | $ | (0.77 | ) | | $ | (0.51 | ) | | $ | (0.26 | ) | | $ | (0.54 | ) | | $ | (0.80 | ) | | $ | 15.58 | | | | (3.08 | )% | | $ | 455,713 | | | | 0.78 | % | | | 0.78 | % | | | 1.56 | % | | | 19 | % |
IB | | | 16.88 | | | | 0.22 | | | | (0.77 | ) | | | (0.55 | ) | | | (0.22 | ) | | | (0.54 | ) | | | (0.76 | ) | | | 15.57 | | | | (3.35 | ) | | | 80,052 | | | | 1.03 | | | | 1.03 | | | | 1.30 | | | | 19 | |
|
For the Year Ended December 31, 2014 | |
IA | | $ | 15.39 | | | $ | 0.24 | | | $ | 1.51 | | | $ | 1.75 | | | $ | (0.25 | ) | | $ | — | | | $ | (0.25 | ) | | $ | 16.89 | | | | 11.37 | % | | $ | 523,661 | | | | 0.77 | % | | | 0.77 | % | | | 1.51 | % | | | 14 | % |
IB | | | 15.38 | | | | 0.20 | | | | 1.51 | | | | 1.71 | | | | (0.21 | ) | | | — | | | | (0.21 | ) | | | 16.88 | | | | 11.10 | | | | 98,407 | | | | 1.02 | | | | 1.02 | | | | 1.26 | | | | 14 | |
| (1) | Information presented relates to a share outstanding throughout the indicated period. Net investment income (loss) per share amounts are calculated based on average shares outstanding unless otherwise noted. |
| (2) | The figures do not include sales charges or other fees which may be applied at the variable contract level or by a qualified pension or retirement plan. Any such additional sales charges or other fees would lower the Fund’s performance. |
| (3) | Adjustments include waivers and reimbursements, if applicable. Ratios do not include fees paid indirectly (see Expenses in the accompanying Notes to Financial Statements). |
| (4) | Commenced operations on April 30, 2014. |
| (7) | During the year ended December 31, 2014, the Fund incurred $61.8 million in sales associated with the transition of assets from Hartford Global Research HLS Fund, which merged into the Fund on June 23, 2014. These sales were excluded from the portfolio turnover rate calculation. |
| (8) | Per share amount was not in accord with the net realized and unrealized gain (loss) for the period because of the timing of transactions in shares of the Fund and the amount and timing ofper-share net realized and unrealized gain (loss) on such shares. |
| (9) | During the year ended December 31, 2014, the Fund incurred $137.9 million in sales associated with the transition of assets from Hartford Growth HLS Fund, which merged into the Fund on June 23, 2014. These sales were excluded from the portfolio turnover rate calculation. |
The accompanying notes are an integral part of these financial statements.
Notes to Financial Statements
December 31, 2018
Hartford Series Fund, Inc. and Hartford HLS Series Fund II, Inc. (each, a “Company” and collectively, the “Companies”) are each anopen-end registered management investment company comprised of fifteen and four series, respectively, as of December 31, 2018. Financial statements for the series of each Company listed below (each, a “Fund” and collectively, the “Funds”) are included in this report.
Hartford Series Fund, Inc.:
Hartford Balanced HLS Fund (the “Balanced HLS Fund”)
Hartford Capital Appreciation HLS Fund (the “Capital Appreciation HLS Fund”)
Hartford Disciplined Equity HLS Fund (the “Disciplined Equity HLS Fund”)
Hartford Dividend and Growth HLS Fund (the “Dividend and Growth HLS Fund”)
Hartford Global Growth HLS Fund (the “Global Growth HLS Fund”)
Hartford Healthcare HLS Fund (the “Healthcare HLS Fund”)
Hartford High Yield HLS Fund (the “High Yield HLS Fund”)
Hartford International Opportunities HLS Fund (the “International Opportunities HLS Fund”)
Hartford MidCap HLS Fund (the “MidCap HLS Fund”)
Hartford MidCap Value HLS Fund (the “MidCap Value HLS Fund”)
Hartford Small Company HLS Fund (the “Small Company HLS Fund”)
Hartford Stock HLS Fund (the “Stock HLS Fund”)
Hartford Total Return Bond HLS Fund (the “Total Return Bond HLS Fund”)
Hartford Ultrashort Bond HLS Fund (the “Ultrashort Bond HLS Fund”)
Hartford Value HLS Fund (the “Value HLS Fund”)
Hartford HLS Series Fund II, Inc.:
Hartford Growth Opportunities HLS Fund (the “Growth Opportunities HLS Fund”)
Hartford MidCap Growth HLS Fund (the “MidCap Growth HLS Fund”) (formerly, Hartford Small/Mid Cap Equity HLS Fund)
Hartford Small Cap Growth HLS Fund (the “Small Cap Growth HLS Fund”)
Hartford U.S. Government Securities HLS Fund (the “U.S. Government Securities HLS Fund”)
The assets of each Fund are separate, and a shareholder’s interest is limited to the Fund in which shares are held. Each Company is organized under the laws of the State of Maryland and is registered with the Securities and Exchange Commission (the “SEC”) under the Investment Company Act of 1940, as amended (the “1940 Act”). Each Fund serves as an underlying investment option for certain variable annuity and variable life insurance separate accounts of insurance companies and certain qualified pension or retirement plans. Owners of variable annuity contracts and policyholders of variable life insurance contracts may choose the Funds if permitted in the variable insurance contract prospectus. In addition, participants in certain qualified pension or retirement plans may choose the Funds if permitted by their plans.
Each Fund is a diversifiedopen-end management investment company. Each Fund applies specialized accounting and reporting standards under Accounting Standards Codification Topic 946, “Financial Services – Investment Companies.”
Each Fund, except Balanced HLS Fund, Capital Appreciation HLS Fund, Dividend and Growth HLS Fund, Global Growth HLS Fund, Growth Opportunities HLS Fund, International Opportunities HLS Fund, MidCap HLS Fund, MidCap Growth HLS Fund and Stock HLS, is divided into Class IA and Class IB shares. Balanced HLS Fund, Capital Appreciation HLS Fund, Dividend and Growth HLS Fund, Global Growth HLS Fund, Growth Opportunities HLS Fund, International Opportunities HLS Fund, MidCap HLS Fund, MidCap Growth HLS Fund and Stock HLS Fund are divided into Class IA, Class IB and Class IC shares. Class IC shares have not commenced operations for Balanced HLS Fund, Dividend and Growth HLS Fund, Global Growth HLS Fund, International Opportunities HLS Fund, MidCap HLS Fund, MidCap Growth HLS and Stock HLS Fund as of the date of this report. Each Fund is closed to certain investors. For more information please see each Fund’s statutory prospectus. Each class is offered at the per share net asset value (“NAV”) without a sales charge and is subject to the same expenses, except certain class specific expenses. Class IB shares are subject to distribution and service fees charged pursuant to a Distribution Plan adopted in accordance with Rule12b-1 under the 1940 Act. Class IC shares are subject to distribution fees charged pursuant to a Distribution Plan adopted in accordance with Rule12b-1 under the 1940 Act and Class IC shares are also subject to an administrative services fee.
| 2. | Significant Accounting Policies: |
The following is a summary of significant accounting policies of each Fund used in the preparation of its financial statements, which are in accordance with United States Generally Accepted Accounting Principles (“U.S. GAAP”). The preparation of financial statements in accordance with U.S. GAAP may require management to make estimates and assumptions that affect the reported amounts of assets and liabilities and disclosure of contingent assets and liabilities at the date of the financial statements and the reported amounts of increases and decreases in net assets from operations during the reporting period. Actual results could differ from those estimates.
Notes to Financial Statements – (continued)
December 31, 2018
| | a) | Determination of Net Asset Value – The NAV of each class of each Fund’s shares is determined as of the close of regular trading (normally 4:00 p.m. Eastern Time) (the “NYSE Close”) on each day that the New York Stock Exchange (the “Exchange”) is open (“Valuation Date”). Information that becomes known to the Funds after the NAV has been calculated on a particular day will not generally be used to retroactively adjust the NAV determined earlier that day. |
| | b) | Investment Valuation and Fair Value Measurements – For purposes of calculating the NAV of each class of each Fund, portfolio securities and other assets held in the Fund’s portfolio for which market prices are readily available are valued at market value. Market value is generally determined on the basis of official close price or last reported trade price. If no trades were reported, market value is based on prices obtained from a quotation reporting system, established market makers (including evaluated prices), or independent pricing services. Pricing vendors may use matrix pricing or valuation models that utilize certain inputs and assumptions to derive values, including transaction data, credit quality information, general market conditions, news, and other factors and assumptions. |
If market prices are not readily available or are deemed unreliable, a Fund will use the fair value of the security or other instrument as determined in good faith under policies and procedures established by and under the supervision of the Board of the Directors of each Company (the “Board of Directors”) (“Valuation Procedures”). Market prices are considered not readily available where there is an absence of current or reliable market-based data (e.g., trade information or broker quotes), including where events occur after the close of the relevant market, but prior to the NYSE Close, that materially affect the values of a Fund’s portfolio holdings or assets. In addition, market prices are considered not readily available when, due to extraordinary circumstances, the exchanges or markets on which the securities or other instruments trade do not open for trading for the entire day and no other market prices are available. Fair value pricing is subjective in nature and the use of fair value pricing by a Fund may cause the NAV of its shares to differ significantly from the NAV that would have been calculated using market prices at the close of the exchange on which a portfolio holding is primarily traded. There can be no assurance that a Fund could obtain the fair value assigned to an investment if the Fund were to sell the investment at approximately the time at which the Fund determines its NAV.
Prices of foreign equities that are principally traded on certain foreign markets will generally be adjusted daily pursuant to a fair value pricing service in order to reflect an adjustment for the factors occurring after the close of certain foreign markets but before the NYSE Close. Securities and other instruments that are primarily traded on foreign markets may trade on days that are not business days of the Funds. The value of the foreign securities or other instruments in which a Fund invests may change on days when a shareholder will not be able to purchase or redeem shares of the Fund.
Fixed income investments (other than short-term obligations) held by a Fund are normally valued at prices supplied by independent pricing services in accordance with the Valuation Procedures. Short-term investments maturing in 60 days or less are generally valued at amortized cost if their original term to maturity was 60 days or less, or by amortizing their value on the 61st day prior to maturity, if the original term exceeded 60 days.
Exchange-traded derivatives, such as options, futures and options on futures, are valued at the last sale price determined by the exchange where such instruments principally trade as of the close of such exchange (“Exchange Close”). If a last sale price is not available, the value will be the mean of the most recently quoted bid and ask prices as of the Exchange Close. If a mean of the bid and ask prices cannot be calculated for the day, the value will be the most recently quoted bid price as of the Exchange Close.Over-the-counter derivatives are normally valued based on prices supplied by independent pricing services in accordance with the Valuation Procedures.
Investments valued in currencies other than U.S. dollars are converted to U.S. dollars using the prevailing spot currency exchange rates obtained from independent pricing services for calculation of the NAV. As a result, the NAV of a Fund’s shares may be affected by changes in the value of currencies in relation to the U.S. dollar. The value of securities or other instruments traded in markets outside the United States or denominated in currencies other than the U.S. dollar may be affected significantly on a day that the Exchange is closed and the market value may change on days when an investor is not able to purchase, redeem or exchange shares of a Fund.
Foreign currency contracts represent agreements to exchange currencies on specific future dates at predetermined rates. Foreign currency contracts are valued using foreign currency exchange rates and forward rates as provided by an independent pricing service on the Valuation Date.
Investments inopen-end mutual funds, if any, are valued at the respective NAV of eachopen-end mutual fund on the Valuation Date. Shares of investment companies listed and traded on an exchange are valued in the same manner as any exchange-listed equity security. Suchopen-end mutual funds and listed investment companies may use fair value pricing as disclosed in their prospectuses.
Financial instruments for which prices are not available from an independent pricing service may be valued using market quotations obtained from one or more dealers that make markets in the respective financial instrument in accordance with the Valuation Procedures.
Notes to Financial Statements – (continued)
December 31, 2018
U.S. GAAP defines fair value as the price that a Fund would receive to sell an asset or pay to transfer a liability in an orderly transaction between market participants. The U.S. GAAP fair value measurement standards require disclosure of a fair value hierarchy for each major category of assets and liabilities. Various inputs are used in determining the fair value of each Fund’s investments. These inputs are summarized into three broad hierarchy levels. This hierarchy is based on whether the valuation inputs are observable or unobservable. These levels are:
| | • | | Level 1 – Quoted prices in active markets for identical investments. Level 1 may include exchange traded instruments, such as domestic equities, some foreign equities, options, futures, mutual funds, exchange traded funds, rights and warrants. |
| | • | | Level 2 – Observable inputs other than Level 1 prices, such as quoted prices for similar investments; quoted prices in markets that are not active; or other inputs that are observable or can be corroborated by observable market data. Level 2 may include debt investments that are traded less frequently than exchange traded instruments and which are valued using independent pricing services; foreign equities, which are principally traded on certain foreign markets and are adjusted daily pursuant to a fair value pricing service in order to reflect an adjustment for the factors occurring after the close of certain foreign markets but before the NYSE Close; senior floating rate interests, which are valued using an aggregate of dealer bids; short-term investments, which are valued at amortized cost; and swaps, which are valued based upon the terms of each swap contract. |
| | • | | Level 3 – Significant unobservable inputs that are supported by limited or no market activity. Level 3 may include financial instruments whose values are determined using indicative market quotes or require significant management judgment or estimation. These unobservable valuation inputs may include estimates for current yields, maturity/duration, prepayment speed, and indicative market quotes for comparable investments along with other assumptions relating to credit quality, collateral value, complexity of the investment structure, general market conditions and liquidity. This category may include investments where trading has been halted or there are certain restrictions on trading. While these investments are priced using unobservable inputs, the valuation of these investments reflects the best available data and management believes the prices are a reasonable representation of exit price. |
The Board of Directors has delegated theday-to-day responsibility for implementing the Valuation Procedures to the Valuation Committee. The Valuation Committee will consider all relevant factors in determining an investment’s fair value, and may seek the advice of such Fund’ssub-adviser, knowledgeable brokers, and legal counsel in making such determination. The Valuation Committee reports to the Audit Committee of the Board of Directors.
Valuation levels are not necessarily indicative of the risk associated with investing in such investments. Individual investments within any of the above mentioned asset classes may be assigned a different hierarchical level than those presented above, as individual circumstances dictate.
For additional information, refer to the Fair Valuation Summary and the Level 3 roll-forward reconciliation, if applicable, which follows each Fund’s Schedule of Investments.
Level 3 Holdings on December 31, 2018
Quantitative Information about Level 3 Fair Value Measurements:
| | | | | | | | | | |
| Hartford Growth Opportunities HLS Fund | |
Security Type / Valuation Technique* | | Unobservable Input | | Input Value(s) Range | | | Fair Value at
December 31, 2018 | |
| | | |
Common Stock | | | | | | | | | | |
Cost | | Trade Price | | | $2.55 to $150.00 | | | $ | 14,233,722 | |
Model | | EV/Estimated Revenue | | | 3.1x | | | | 219,365 | |
Model | | Price/Earnings | | | 17.5x | | | | 1,793,095 | |
| | | |
Preferred Stock | | | | | | | | | | |
Model | | EV/Estimated Revenue | | | 1.2x to 5.7x | | | | 10,774,226 | |
Model | | EV/EBITDA | | | 7.5x | | | | 2,096,503 | |
Cost | | Trade Price | | | $5.70 to $62.01 | | | | 51,666,244 | |
| | | |
Convertible Preferred Stock | | | | | | | | | | |
Model | | EV/Estimated Revenue | | | 2.3x | | | | 3,167,321 | |
| | | |
Escrows | | | | | | | | | | |
Cost | | Trade Price | | | $0 to $2.25 | | | | 267,585 | |
| | | | | | | | | | |
Total | | | | | | | | $ | 84,218,061 | |
| | | | | | | | | | |
Notes to Financial Statements – (continued)
December 31, 2018
| | | | | | | | | | |
| Hartford Small Company HLS Fund | |
Security Type / Valuation Technique* | | Unobservable Input | | Input Value(s) Range | | | Fair Value at
December 31, 2018 | |
| | | |
Common Stock | | | | | | | | | | |
Cost | | Trade Price | | | $2.55 to $55.69 | | | $ | 4,719,392 | |
Model | | EV/EBITDA | | | 5.8x | | | | 1,053,444 | |
| | | |
Preferred Stock | | | | | | | | | | |
Model | | EV/Estimated Revenue | | | 1.2x to 2.3x | | | | 6,821,907 | |
| | | |
Escrow | | | | | | | | | | |
Cost | | Trade Price | | | $0.54 to $2.25 | | | | 178,845 | |
| | | | | | | | | | |
Total | | | | | | | | $ | 12,773,588 | |
| | | | | | | | | | |
| | * | The Valuation Committee may consider applying appropriate valuation methodologies, which may include, but are not limited to: valuation through use of a “proxy” investment or index, discount from market value of a similar freely traded investment, a discount or premium which may consider market or regulatory sentiment (or other subjective determinations, inputs or factors not otherwise quantifiable), and any other appropriate method. |
| | c) | Investment Transactions and Investment Income – Investment transactions are recorded as of the trade date (the date the order to buy or sell is executed) for financial reporting purposes. Investments purchased or sold on a when-issued or delayed-delivery basis may be settled a month or more after the trade date. Realized gains and losses are determined on the basis of identified cost. |
Trade date for senior floating rate interests purchased in the primary loan market is considered the date on which the loan allocations are determined. Trade date for senior floating rate interests purchased in the secondary loan market is the date on which the transaction is entered into.
Dividend income from domestic securities is accrued on theex-dividend date. In general, dividend income from foreign securities is recorded on theex-date; however, dividend notifications in certain foreign jurisdictions may not be available in a timely manner and as a result, a Fund will record the dividend as soon as the relevant details (i.e., rate per share, payment date, shareholders of record, etc.) are publicly available. Interest income, including amortization of premium, accretion of discounts, inflation adjustments and additional principal receivedin-kind in lieu of cash, is accrued on a daily basis. Paydown gains and losses on mortgage-related and other asset-backed securities are included in interest income in the Statements of Operations, as applicable.
Please refer to Note 8 for Securities Lending Information.
| | d) | Taxes – A Fund may be subject to taxes imposed on realized gains on securities of certain foreign countries in which such a Fund invests. A Fund may also be subject to taxes withheld on foreign dividends and interest from securities in which the Fund invests. The amount of any foreign taxes withheld and foreign tax expense is included on the accompanying Statements of Operations as a reduction to investment income or net realized gain on investments in these securities, if applicable. |
| | e) | Foreign Currency Transactions – Assets and liabilities denominated in currencies other than U.S. dollars are translated into U.S. dollars at the exchange rates in effect on the Valuation Date. Purchases and sales of investments, income and expenses are translated into U.S. dollars at the exchange rates on the dates of such transactions. |
A Fund does not isolate that portion of portfolio investment valuation resulting from fluctuations in the foreign currency exchange rates from the fluctuations arising from changes in the market prices of investments held. Exchange rate fluctuations are included with the net realized and unrealized gain or loss on investments in the accompanying financial statements.
Net realized foreign exchange gains or losses arise from sales of foreign currencies and the difference between asset and liability amounts initially stated in foreign currencies and the U.S. dollar value of the amounts actually received or paid. Net unrealized foreign exchange gains or losses arise from changes in the value of other assets and liabilities at the end of the reporting period, resulting from changes in the exchange rates.
| | f) | Joint Trading Account – A Fund may invest cash balances into a joint trading account that may be invested in one or more repurchase agreements. |
| | g) | Fund Share Valuation and Dividend Distributions to Shareholders – Orders for each class of each Fund’s shares are executed in accordance with the investment instructions of the contract holders and plan participants. The NAV of each class of each Fund’s shares is determined as of the close of business on each business day of the Exchange (see Note 2(a)). The NAV is determined separately for each class of shares of a Fund by dividing the Fund’s net assets attributable to that class by the number of shares of the class outstanding. Each class of shares offered by a Fund has equal rights as to assets and voting privileges (except that shareholders of a class have exclusive voting rights regarding any matter relating solely to that class of shares). Income andnon-class specific expenses are allocated daily to each class on the basis of the relative net assets of the class of the Fund. Realized and unrealized gains and losses are allocated daily based on the relative net assets of each class of shares of each Fund . |
Notes to Financial Statements – (continued)
December 31, 2018
Orders for the purchase of a Fund’s shares received prior to the close of the Exchange on any day the Exchange is open for business are priced at the NAV determined as of the close of the Exchange. Orders received after the close of the Exchange, or on a day on which the Exchange and/or the Fund is not open for business, are priced at the next determined NAV.
Dividends are declared pursuant to a policy adopted by each Company’s Board of Directors. Dividends and/or distributions to shareholders are recorded onex-date. The policy of each Fund is to pay dividends from net investment income and realized gains, if any, at least once a year.
Income dividends and capital gains distributions are determined in accordance with federal income tax regulations, which may differ from U.S. GAAP with respect to character and timing (see Federal Income Taxes: Distributions and Components of Distributable Earnings and Reclassification of Capital Accounts notes).
| | h) | Disclosure Update and Simplification – Per the SEC Release#33-10532 “Disclosure Update and Simplification”, it is no longer required to differentiate distributions from earnings as either net investment income or net realized capital gains or disclose a Fund’s undistributed net investment income within a Fund’s Statement of Changes in Net Assets. The presentation within a Fund’s Statement of Changes in Net Assets for the year ended December 31, 2017 has been modified accordingly. |
Below is the characterization of each Fund’s distributions for the year ended December 31, 2017 as previously disclosed in the Statements of Changes in Net Assets within the December 31, 2017 Annual Report:
| | | | | | | | | | | | | | | | |
| | | Distributions to Shareholders Year Ended December 31, 2017: | |
| | | From net investment income | |
Fund | | Class IA | | | Class IB | | | Class IC | | | Total | |
Balanced HLS Fund | | $ | (47,464,119 | ) | | $ | (5,534,060 | ) | | $ | — | | | $ | (52,998,179 | ) |
Capital Appreciation HLS Fund | | | (47,670,675 | ) | | | (4,773,231 | ) | | | (188,398 | ) | | | (52,632,304 | ) |
Disciplined Equity HLS Fund | | | (5,455,397 | ) | | | (551,499 | ) | | | — | | | | (6,006,896 | ) |
Dividend and Growth HLS Fund | | | (50,138,723 | ) | | | (5,905,716 | ) | | | — | | | | (56,044,439 | ) |
Global Growth HLS Fund | | | (2,060,335 | ) | | | (217,828 | ) | | | — | | | | (2,278,163 | ) |
Growth Opportunities HLS Fund | | | — | | | | — | | | | — | | | | — | |
Healthcare HLS Fund | | | (3,196 | ) | | | — | | | | — | | | | (3,196 | ) |
High Yield HLS Fund | | | (14,107,895 | ) | | | (4,345,488 | ) | | | — | | | | (18,453,383 | ) |
International Opportunities HLS Fund | | | (19,083,304 | ) | | | (1,824,269 | ) | | | — | | | | (20,907,573 | ) |
MidCap HLS Fund | | | — | | | | — | | | | — | | | | — | |
MidCap Growth HLS Fund | | | (703,323 | ) | | | (87,957 | ) | | | — | | | | (791,280 | ) |
MidCap Value HLS Fund | | | (1,563,056 | ) | | | (264,904 | ) | | | — | | | | (1,827,960 | ) |
Small Cap Growth HLS Fund | | | (446,628 | ) | | | — | | | | — | | | | (446,628 | ) |
Small Company HLS Fund | | | — | | | | — | | | | — | | | | — | |
Stock HLS Fund | | | (23,707,000 | ) | | | (2,111,519 | ) | | | — | | | | (25,818,519 | ) |
Total Return Bond HLS Fund | | | (64,104,099 | ) | | | (6,840,084 | ) | | | — | | | | (70,944,183 | ) |
Ultrashort Bond HLS Fund | | | (3,863,181 | ) | | | (353,222 | ) | | | — | | | | (4,216,403 | ) |
U.S. Government Securities HLS Fund | | | (7,516,833 | ) | | | (1,395,249 | ) | | | — | | | | (8,912,082 | ) |
Value HLS Fund | | | (7,642,825 | ) | | | (1,096,859 | ) | | | — | | | | (8,739,684 | ) |
| |
| | | From net realized gains | |
Fund | | Class IA | | | Class IB | | | Class IC | | | Total | |
Balanced HLS Fund | | $ | — | | | $ | — | | | $ | — | | | $ | — | |
Capital Appreciation HLS Fund | | | (232,329,918 | ) | | | (30,241,181 | ) | | | (1,534,584 | ) | | | (264,105,683 | ) |
Disciplined Equity HLS Fund | | | (63,822,541 | ) | | | (8,899,981 | ) | | | — | | | | (72,722,522 | ) |
Dividend and Growth HLS Fund | | | (211,321,994 | ) | | | (29,746,780 | ) | | | — | | | | (241,068,774 | ) |
Global Growth HLS Fund | | | (18,738,294 | ) | | | (3,764,027 | ) | | | — | | | | (22,502,321 | ) |
Growth Opportunities HLS Fund | | | (16,106,762 | ) | | | (1,881,415 | ) | | | (403,653 | ) | | | (18,391,830 | ) |
Healthcare HLS Fund | | | (42,554,097 | ) | | | (7,184,474 | ) | | | — | | | | (49,738,571 | ) |
High Yield HLS Fund | | | — | | | | — | | | | — | | | | — | |
International Opportunities HLS Fund | | | — | | | | — | | | | — | | | | — | |
MidCap HLS Fund | | | (94,658,887 | ) | | | (5,084,893 | ) | | | — | | | | (99,743,780 | ) |
MidCap Growth HLS Fund | | | (2,584,547 | ) | | | (462,535 | ) | | | — | | | | (3,047,082 | ) |
MidCap Value HLS Fund | | | (18,745,883 | ) | | | (5,766,845 | ) | | | — | | | | (24,512,728 | ) |
Small Cap Growth HLS Fund | | | — | | | | — | | | | — | | | | — | |
Small Company HLS Fund | | | — | | | | — | | | | — | | | | — | |
Stock HLS Fund | | | — | | | | — | | | | — | | | | — | |
Total Return Bond HLS Fund | | | — | | | | — | | | | — | | | | — | |
Ultrashort Bond HLS Fund | | | — | | | | — | | | | — | | | | — | |
U.S. Government Securities HLS Fund | | | — | | | | — | | | | — | | | | — | |
Value HLS Fund | | | (31,542,050 | ) | | | (5,401,252 | ) | | | — | | | | (36,943,302 | ) |
Notes to Financial Statements – (continued)
December 31, 2018
Below is the Undistributed (Distributions in excess of) Net Investment Income for the year ended December 31, 2017 as previously disclosed in the Statements of Changes in Net Assets within the December 31, 2017 Annual Report:
| | | | |
Fund | | Undistributed (Distributions
in excess of)
Net Investment Income | |
Balanced HLS Fund | | $ | 975,147 | |
Capital Appreciation HLS Fund | | | 3,396,603 | |
Disciplined Equity HLS Fund | | | 490,218 | |
Dividend and Growth HLS Fund | | | 4,161,698 | |
Global Growth HLS Fund | | | 2,472,553 | |
Growth Opportunities HLS Fund | | | (1,183,092 | ) |
Healthcare HLS Fund | | | (135,601 | ) |
High Yield HLS Fund | | | 16,495,652 | |
International Opportunities HLS Fund | | | 26,985,652 | |
MidCap HLS Fund | | | (201,237 | ) |
MidCap Growth HLS Fund | | | 923,002 | |
MidCap Value HLS Fund | | | 1,237,586 | |
Small Cap Growth HLS Fund | | | — | |
Small Company HLS Fund | | | — | |
Stock HLS Fund | | | 893,471 | |
Total Return Bond HLS Fund | | | 89,462,062 | |
Ultrashort Bond HLS Fund | | | 5,554,675 | |
U.S. Government Securities HLS Fund | | | 8,420,308 | |
Value HLS Fund | | | — | |
| 3. | Securities and Other Investments: |
| | a) | Restricted Securities – Each Fund may invest in securities that are subject to legal or contractual restrictions on resale. These securities generally may be resold in transactions exempt from registration or to the public if the securities are registered. Disposal of these securities may involve time-consuming negotiations and expense, and prompt sale at an acceptable price may be difficult. Information regarding restricted securities, if applicable, is included at the end of each Fund’s Schedule of Investments. |
| | b) | Investments Purchased on a When-Issued or Delayed-Delivery Basis – Delivery and payment for investments that have been purchased by a Fund on a forward commitment, or when-issued or delayed-delivery basis, take place beyond the customary settlement period. A Fund may dispose of or renegotiate a delayed-delivery transaction after it is entered into, and may sell delayed-delivery investments before they are delivered, which may result in a realized gain or loss. During this period, such investments are subject to market fluctuations, and a Fund identifies investments segregated in its records with a value at least equal to the amount of the commitment. See each Fund’s Schedule of Investments, if applicable, for when-issued or delayed-delivery investments as of December 31, 2018. |
In connection with a Fund’s ability to purchase investments on a when-issued or forward commitment basis, the Fund may enter intoto-be announced (“TBA”) commitments. TBA commitments are forward agreements for the purchase or sale of mortgage-backed securities for a fixed price, with payment and delivery on an agreed-upon future settlement date. The specific securities to be delivered are not identified at the trade date; however, delivered securities must meet specified terms, including issuer, rate and mortgage terms. Although a Fund may enter into TBA commitments with the intention of acquiring or delivering securities for its portfolio, the Fund can extend the settlement date, roll the transaction, or dispose of a commitment prior to settlement if deemed appropriate to do so. If the TBA commitment is closed through the acquisition of an offsetting TBA commitment, a Fund realizes a gain or loss. In a TBA roll transaction, a Fund generally purchases or sells the initial TBA commitment prior to the agreed upon settlement date and enters into a new TBA commitment for future delivery or receipt of the mortgage backed securities. TBA commitments involve a risk of loss if the value of the security to be purchased or sold declines or increases, respectively, prior to settlement date. These transactions are excluded from a Fund’s portfolio turnover rate. See each Fund’s Schedule of Investments, if applicable, for TBA commitments as of December 31, 2018.
| | c) | Senior Floating Rate Interests – Certain Funds may invest in senior floating rate interests. Senior floating rate interests generally hold the most senior position in the capital structure of a business entity (the “Borrower”), are typically secured by specific collateral and have a claim on the assets and/or stock of the Borrower that is senior to that held by subordinated debtholders and stockholders of the Borrower. Senior floating rate interests are typically structured and administered by a financial institution that acts as the agent of the lenders participating in the senior floating rate interest. A Fund may invest in multiple series or tranches of a senior floating rate interest, which may have varying terms and carry different associated risks. A Fund may also enter into unfunded loan commitments, which are contractual obligations for future funding. Unfunded loan commitments may include revolving credit facilities, which may obligate the Fund to supply additional cash to the Borrower on demand. Unfunded loan commitments represent a future obligation in full. A Fund may receive a commitment fee based on the undrawn portion of the underlying line of credit portion of a senior floating rate interest. In certain circumstances, a Fund may receive various fees upon the restructure of a senior floating rate interest by a borrower. Fees earned/paid may be recorded as a component of income or realized gain/loss in the Statements of Operations. |
Notes to Financial Statements – (continued)
December 31, 2018
Senior floating rate interests are typically rated below-investment-grade, which suggests they are more likely to default and generally pay higher interest rates than investment-grade loans. A default could lead tonon-payment of income, which would result in a reduction of income to a Fund, and there can be no assurance that the liquidation of any collateral would satisfy the Borrower’s obligation in the event ofnon-payment of scheduled interest or principal payments, or that such collateral could be readily liquidated. See each Fund’s Schedule of Investments, if applicable, for outstanding senior floating rate interests as of December 31, 2018.
| | d) | Mortgage-Related and Other Asset-Backed Securities – A Fund may invest in mortgage-related and other asset-backed securities. These securities include mortgage pass-through securities, collateralized mortgage obligations, commercial mortgage-backed securities, stripped mortgage-backed securities, asset-backed securities, collateralized debt obligations and other securities that directly or indirectly represent a participation in, or are secured by and payable from, mortgage loans on real property. Mortgage-related securities are created from pools of residential or commercial mortgage loans, including mortgage loans made by savings and loan institutions, mortgage bankers, commercial banks and others. Asset-backed securities are created from many types of assets, including auto loans, credit card receivables, home equity loans, and student loans. These securities provide a monthly payment that consists of both interest and principal payments. Interest payments may be determined by fixed or adjustable rates. The rate of prepayments on underlying mortgages will affect the price and volatility of a mortgage-related security, and may have the effect of shortening or extending the effective duration of the security relative to what was anticipated at the time of purchase. The timely payment of principal and interest of certain mortgage-related securities is guaranteed by the full faith and credit of the United States Government. Mortgage-related and other asset-backed securities created and guaranteed bynon-governmental issuers, including government-sponsored corporations, may be supported by various forms of insurance or guarantees, but there can be no assurance that the private insurers or guarantors can meet their obligations under the insurance policies or guarantee arrangements. See each Fund’s Schedule of Investments, if applicable, for mortgage-related and other asset-backed securities as of December 31, 2018. |
| | e) | Inflation-Indexed Bonds – A Fund may invest in inflation-indexed bonds. Inflation-indexed bonds are fixed income investments whose principal value is periodically adjusted to the rate of inflation. The interest rate on these bonds is generally fixed at issuance at a rate lower than typical bonds. Over the life of an inflation-indexed bond, however, interest will be paid based on a principal value, which is adjusted for inflation. Any increase or decrease in the principal amount of an inflation-indexed bond will be included as interest income on the Statements of Operations, even though investors do not receive the principal amount until maturity. See each Fund’s Schedule of Investments, if applicable, for inflation-indexed bonds as of December 31, 2018. |
| 4. | Financial Derivative Instruments: |
The following disclosures contain information on how and why a Fund may use derivative instruments, the credit-risk-related contingent features in certain derivative instruments, and how derivative instruments affect a Fund’s financial position and results of operations. The location and fair value amounts of these instruments on the Statements of Assets and Liabilities and the realized gains and losses and changes in unrealized gains and losses on the Statements of Operations, each categorized by type of derivative contract, are included in the following Additional Derivative Instrument Information footnote. The derivative instruments outstanding as ofperiod-end are disclosed in the notes to the Schedules of Investments, if applicable. The amounts of realized gains and losses and changes in unrealized gains and losses on derivative instruments during the period are disclosed in the Statements of Operations.
| | a) | Foreign Currency Contracts – A Fund may enter into foreign currency contracts that obligate the Fund to purchase or sell currencies at specified future dates. Foreign currency contracts may be used in connection with settling purchases or sales of securities to hedge the currency exposure associated with some or all of a Fund’s investments and/or as part of an investment strategy. Foreign currency contracts are marked to market daily and the change in value is recorded by a Fund as an unrealized gain or loss. A Fund will record a realized gain or loss when the foreign currency contract is settled. |
Foreign currency contracts involve elements of market risk in excess of the amounts reflected in the Statements of Assets and Liabilities. In addition, risks may arise upon entering into these contracts from the potential inability of the counterparties to meet the terms of the contracts and from unanticipated movements in the value of the foreign currencies relative to the U.S. dollar. Upon entering into a foreign currency contract, a Fund may be required to post margin equal to its outstanding exposure thereunder.
During the year ended December 31, 2018, Capital Appreciation HLS Fund, High Yield HLS Fund and Total Return Bond HLS Fund had used Foreign Currency Contracts.
| | b) | Futures Contracts – A Fund may enter into futures contracts. A futures contract is an agreement between two parties to buy or sell an asset at a set price on a future date. A Fund may use futures contracts to manage risk or obtain exposure to the investment markets, commodities, or movements in interest rates and currency values. The primary risks associated with the use of futures contracts are the imperfect correlation between the change in market value of the investments held by a Fund and the prices of futures contracts and the possibility of an illiquid market. Upon entering into a futures contract, a Fund is required to deposit with a futures commission merchant (“FCM”) an amount of cash or U.S. Government or Agency Obligations in accordance with the initial margin requirements of the broker or exchange. Futures contracts are marked to market daily and an appropriate amount equal to the change in value (“variation margin”) is paid or received |
Notes to Financial Statements – (continued)
December 31, 2018
| | by a Fund. Gains or losses are recognized but not considered realized until the contracts expire or are closed. Futures contracts involve, to varying degrees, risk of loss in excess of the variation margin disclosed on the Statements of Assets and Liabilities. |
During the year ended December 31, 2018, Balanced HLS Fund, Capital Appreciation HLS Fund, Total Return Bond HLS Fund and U.S. Government Securities HLS Fund had used Futures Contracts.
| | c) | Options Contracts – An option contract is a contract sold by one party to another party that offers the buyer the right, but not the obligation, to buy (call) or sell (put) an investment or other financial asset at an agreed-upon price during a specific period of time or on a specific date. Option contracts are either OTC options or executed in a registered exchange (“exchange-traded options”). A Fund may write (sell) covered call and put options on futures, swaps (“swaptions”), securities, commodities or currencies. “Covered” means that so long as a Fund is obligated as the writer of an option, it will own either the underlying investments or currency or an option to purchase the same underlying investments or currency having an expiration date of the covered option and an exercise price equal to or less than the exercise price of the covered option, or will segregate or earmark cash or other liquid investments having, for written call options, a value equal to the greater of the exercise price or the market value of the underlying instrument and, for written put options, a value equal to the exercise price. Writing put options may increase a Fund’s exposure to the underlying instrument. Writing call options may decrease a Fund’s exposure to the underlying instrument. Premiums received from writing options that expire are treated as realized gains. Premiums received from writing options that are exercised or closed are added to the proceeds or offset amounts paid on the underlying futures, swaps, investments or currency transactions to determine the realized gain or loss. A Fund, as a writer of an option, has no control over whether the underlying instrument may be sold (call) or purchased (put) and as a result bears the market risk of an unfavorable change in the price of the instrument underlying the written option. There is the risk a Fund may not be able to enter into a closing transaction because of an illiquid market. A Fund may also purchase put and call options. Purchasing call options may increase a Fund’s exposure to the underlying instrument. Purchasing put options may decrease a Fund’s exposure to the underlying instrument. A Fund pays a premium, which is included on the Fund’s Statements of Assets and Liabilities as an investment and is subsequently marked to market to reflect the current value of the option. Premiums paid for purchasing options that expire are treated as realized losses. Certain options may be purchased with premiums to be determined on a future date. The premiums for these options are based upon implied volatility parameters at specified terms. The risk associated with purchasing put and call options is generally limited to the premium paid. Premiums paid for purchasing options that are exercised or closed are added to the amounts paid or offset against the proceeds on the underlying investment transaction to determine the realized gain or loss. Entering into OTC options also exposes a Fund to counterparty risk. Counterparty risk is the possibility that the counterparty to the agreements may default on its obligation to perform or disagree as to the meaning of the contractual terms in the agreements. |
During the year ended December 31, 2018, Total Return Bond HLS Fund and U.S. Government Securities HLS Fund had used Options Contracts.
| | d) | Swap Contracts – A Fund may invest in swap contracts. Swap contracts are agreements to exchange or swap investment cash flows, assets, foreign currencies or market-linked returns at specified future intervals. Swap contracts are either privately negotiated in theover-the-counter market (“OTC swaps”) or cleared through a central counterparty or derivatives clearing organization (“centrally cleared swaps”). A Fund may enter into credit default, total return, cross-currency, interest rate, inflation and other forms of swap contracts to manage its exposure to credit, currency, interest rate, commodity and inflation risk. Swap contracts are also used to gain exposure to certain markets. In connection with these contracts, investments or cash may be identified as collateral or margin in accordance with the terms of the respective swap contracts and/or master netting arrangement to provide assets of value and recourse in the event of default or bankruptcy/insolvency. |
Swaps are valued in accordance with the Valuation Procedures. Changes in market value, if any, are reflected as a component of net changes in unrealized appreciation or depreciation on the Statements of Operations. Daily changes in valuation of centrally cleared swaps, if any, are recorded as a receivable or payable for the change in value (“variation margin”) on the Statements of Assets and Liabilities. Realized gains or losses on centrally cleared swaps are recorded upon the termination of the swaps. OTC swap payments received or paid at the beginning of the measurement period are reflected as such on the Statements of Assets and Liabilities and represent premiums paid or received upon entering into the swap contract to compensate for differences between the stated terms of the swap contract and prevailing market conditions (credit spreads, currency exchange rates, interest rates and other relevant factors). These upfront premiums are recorded as realized gains or losses on the Statements of Operations upon termination or maturity of the swap. A liquidation payment received or made at the termination or maturity of the swap is recorded as a realized gain or loss on the Statements of Operations. Net periodic payments received or paid by a Fund are included as part of realized gains or losses on the Statements of Operations.
Entering into these contracts involves, to varying degrees, elements of liquidation, counterparty, credit and market risk in excess of the amounts recognized on the Statements of Assets and Liabilities. Such risks involve the possibility that there will be no liquid market for these contracts, that the counterparty to the contracts may default on its obligation to perform or disagree as to the meaning of contractual terms in the contracts, and that there may be unfavorable changes in market conditions (credit spreads, currency exchange rates, interest rates and other relevant factors).
Notes to Financial Statements – (continued)
December 31, 2018
A Fund’s maximum risk of loss from counterparty risk for OTC swaps is the net value of the discounted cash flows to be received from the counterparty over the contract’s remaining life, and current market value, to the extent that amount is positive. The risk is mitigated by having a master netting arrangement between a Fund and the counterparty, which allows for the netting of payments made or received (although such amounts are presented on a gross basis within the Statements of Assets and Liabilities, as applicable) as well as the posting of collateral to a Fund to cover the Fund’s exposure to the counterparty. In a centrally cleared swap, while a Fund enters into an agreement with a clearing broker to execute contracts with a counterparty, the performance of the swap is guaranteed by the central clearinghouse, which reduces the Fund’s exposure to counterparty risk. However, the Fund is still exposed to a certain amount of counterparty risk through the clearing broker and clearinghouse. The clearinghouse attempts to minimize this risk to its participants through the use of mandatory margin requirements, daily cash settlements and other procedures. Likewise, the clearing broker reduces its risk through margin requirements and required segregation of customer balances.
Credit Default Swap Contracts – The credit default swap market allows a Fund to manage credit risk through buying and selling credit protection on a specific issuer, asset or basket of assets. Certain credit default swaps involve the exchange of a fixed rate premium for protection against the loss in value of an underlying investment or index in the event of a credit event, such as payment default or bankruptcy.
Under a credit default swap contract, one party acts as guarantor by receiving the fixed periodic payment in exchange for the commitment to purchase the underlying investment at par if the defined credit event occurs. Upon the occurrence of a defined credit event, the difference between the value of the reference obligation and the swap’s notional amount is recorded as realized gain or loss on swap transactions in the Statements of Operations. A “buyer” of credit protection agrees to pay a counterparty to assume the credit risk of an issuer upon the occurrence of certain events. The “seller” of the protection receives periodic payments and agrees to assume the credit risk of an issuer upon the occurrence of certain events. Although specified events are contract specific, credit events are generally defined as bankruptcy, failure to pay, restructuring, obligation acceleration, obligation default or repudiation/moratorium. A “seller’s” exposure is limited to the total notional amount of the credit default swap contract. These potential amounts would be partially offset by any recovery values of the respective referenced obligations or upfront payments received upon entering into the contract.
Implied credit spreads, represented in absolute terms, utilized in determining the market value of credit default swap contracts on corporate issues, sovereign government issues or U.S. municipal issues as ofyear-end are disclosed in the notes to the Schedules of Investments, as applicable, and serve as an indicator of the current status of the payment/performance risk and represent the likelihood or risk of default for the credit derivative. The implied credit spread of a particular referenced entity reflects the cost of buying/selling protection and there may also be upfront payments required to be made to enter into the contract. Wider credit spreads represent a deterioration of the referenced entity’s credit soundness and a greater likelihood or risk of default or other credit event occurring as defined under the terms of the contract. For credit default swap contracts on credit indices, the quoted market prices and resulting values serve as the indicator of the current status of the payment/performance risk. Increasing market values, in absolute terms when compared to the notional amount of the swap, represent a deterioration of the referenced equity’s credit soundness and a greater likelihood or risk of default or other credit event occurring as defined under the terms of the contract.
During the year ended December 31, 2018, Total Return Bond HLS Fund had used Credit Default Swap Contracts.
Interest Rate Swap Contracts – Certain Funds are subject to interest rate risk exposure in the normal course of pursuing its investment objectives. A Fund may use interest rate swaps to hedge interest rate and duration risk across a portfolio at particular duration points to maintain its ability to generate income at prevailing market rates. In a typical interest rate swap, one party agrees to make regular payments equal to a floating interest rate, based on a specified interest rate or benchmark (e.g. London Interbank Offered Rate (“LIBOR”)), multiplied by a notional amount, in return for payments equal to a fixed rate multiplied by the same amount, for a specific period of time. The net interest received or paid on interest rate swap contracts is recorded as a realized gain or loss. Interest rate swaps are marked to market daily and the change, if any, is recorded as an unrealized gain or loss in the Statements of Operations. When the interest rate swap contract is terminated early, a Fund records a realized gain or loss equal to the difference between the current market value and the upfront premium or cost.
If an interest rate swap contract provides for payments in different currencies, the parties might agree to exchange the notional amount as well. Interest rate swaps may also depend on other prices or rates, such as the value of an index. The risks of interest rate swaps include changes in market conditions, which will affect the value of the contract or the cash flows and the possible inability of the counterparty to fulfill its obligations under the contract. A Fund’s maximum risk of loss from counterparty credit risk is the discounted net value of the cash flows to be received from the counterparty over the contract’s remaining life, to the extent that amount is positive.
During the year ended December 31, 2018, Total Return Bond HLS Fund and U.S. Government Securities HLS Fund had used Interest Rate Swap Contracts.
Total Return Swap Contracts – Certain Funds may invest in total return swap contracts in pursuit of the Fund’s investment objective or for hedging purposes. An investment in a total return swap allows a Fund to gain or mitigate exposure to underlying reference assets. Total return swap contracts involve commitments where cash flows are exchanged based on the price of underlying reference assets and based
Notes to Financial Statements – (continued)
December 31, 2018
on a fixed or variable interest rate. One party receives payments based on the price appreciation or depreciation of the underlying reference asset, in exchange for paying to or receiving from the counterparty seller an agreed-upon interest rate. A variable interest rate may be correlated to a base rate, such as the LIBOR, and is adjusted each reset period, which is defined at the beginning of the contract. Therefore, if interest rates increase over the term of the swap contract, the party paying the rate may be required to pay a higher rate at each swap reset date.
Total return swap contracts on indices involve commitments to pay interest in exchange for a market-linked return. One party pays out the total return of a specific reference asset, which may be an equity, index, or bond, and in return receives a regular stream of payments. To the extent the total return of the security or index underlying the transaction exceeds or falls short of the offsetting interest rate obligation, a Fund will receive a payment from or make a payment to the counterparty. If the Fund is a payer in a total return swap, it may be subject to unlimited losses. They are also subject to counterparty risk. If the counterparty fails to meet its obligations, the Fund may lose money.
During the year ended December 31, 2018, Total Return Bond HLS Fund had used Total Return Swap Contracts.
| | e) | Additional Derivative Instrument Information: |
Balanced HLS Fund
The Effect of Derivative Instruments on the Statement of Assets and Liabilities as of December 31, 2018:
| | | | | | | | | | | | | | | | | | | | | | | | | | | | |
| | | Risk Exposure Category | |
| | | Interest Rate
Contracts | | | Foreign
Exchange
Contracts | | | Credit
Contracts | | | Equity
Contracts | | | Commodity
Contracts | | | Other
Contracts | | | Total | |
Assets: | |
Unrealized appreciation on futures contracts(1) | | $ | 263,466 | | | $ | — | | | $ | — | | | $ | — | | | $ | — | | | $ | — | | | $ | 263,466 | |
| | | | | | | | | | | | | | | | | | | | | | | | | | | | |
Total | | $ | 263,466 | | | $ | — | | | $ | — | | | $ | — | | | $ | — | | | $ | — | | | $ | 263,466 | |
| | | | | | | | | | | | | | | | | | | | | | | | | | | | |
Liabilities: | |
Unrealized depreciation on futures contracts(1) | | $ | 85,351 | | | $ | — | | | $ | — | | | $ | — | | | $ | — | | | $ | — | | | $ | 85,351 | |
| | | | | | | | | | | | | | | | | | | | | | | | | | | | |
Total | | $ | 85,351 | | | $ | — | | | $ | — | | | $ | — | | | $ | — | | | $ | — | | | $ | 85,351 | |
| | | | | | | | | | | | | | | | | | | | | | | | | | | | |
| | (1) | Amount represents the cumulative appreciation (depreciation) on futures contracts as disclosed within the Schedule of Investments under the open “Futures Contracts” section. Only current day’s variation margin, if any, is reported within the Statement of Assets and Liabilities. |
The Effect of Derivative Instruments on the Statement of Operations for the year ended December 31, 2018
| | | | | | | | | | | | | | | | | | | | | | | | | | | | |
| | | Risk Exposure Category | |
| | | Interest Rate
Contracts | | | Foreign
Exchange
Contracts | | | Credit
Contracts | | | Equity
Contracts | | | Commodity
Contracts | | | Other
Contracts | | | Total | |
Realized Gain (Loss) on Derivatives Recognized
as a Result of Operations: | |
Net realized gain (loss) on futures contracts | | $ | 2,257,919 | | | $ | — | | | $ | — | | | $ | — | | | $ | — | | | $ | — | | | $ | 2,257,919 | |
| | | | | | | | | | | | | | | | | | | | | | | | | | | | |
Total | | $ | 2,257,919 | | | $ | — | | | $ | — | | | $ | — | | | $ | — | | | $ | — | | | $ | 2,257,919 | |
| | | | | | | | | | | | | | | | | | | | | | | | | | | | |
|
Net Change in Unrealized Appreciation (Depreciation)
on Derivatives Recognized as a Result of Operations: | |
Net change in unrealized appreciation (depreciation) of
futures contracts | | $ | (10,187 | ) | | $ | — | | | $ | — | | | $ | — | | | $ | — | | | $ | — | | | $ | (10,187 | ) |
| | | | | | | | | | | | | | | | | | | | | | | | | | | | |
Total | | $ | (10,187 | ) | | $ | — | | | $ | — | | | $ | — | | | $ | — | | | $ | — | | | $ | (10,187 | ) |
| | | | | | | | | | | | | | | | | | | | | | | | | | | | |
For the year ended December 31, 2018, the average amount or number per contract outstanding for each derivative type was as follows:
| | | | |
Derivative Description | | Average Notional
Par, Contracts
or Face Amount | |
Futures Contracts Long at Number of Contracts | | | 349 | |
Futures Contracts Short at Number of Contracts | | | (212 | ) |
Notes to Financial Statements – (continued)
December 31, 2018
Capital Appreciation HLS Fund
The Effect of Derivative Instruments on the Statement of Assets and Liabilities as of December 31, 2018:
| | | | | | | | | | | | | | | | | | | | | | | | | | | | |
| | | Risk Exposure Category | |
| | | Interest Rate
Contracts | | | Foreign
Exchange
Contracts | | | Credit
Contracts | | | Equity
Contracts | | | Commodity
Contracts | | | Other
Contracts | | | Total | |
Liabilities: | |
Unrealized depreciation on futures contracts(1) | | $ | — | | | $ | — | | | $ | — | | | $ | 2,656,926 | | | $ | — | | | $ | — | | | $ | 2,656,926 | |
Unrealized depreciation on foreign currency contracts | | | — | | | | 345,582 | | | | — | | | | — | | | | — | | | | — | | | | 345,582 | |
| | | | | | | | | | | | | | | | | | | | | | | | | | | | |
Total | | $ | — | | | $ | 345,582 | | | $ | — | | | $ | 2,656,926 | | | $ | — | | | $ | — | | | $ | 3,002,508 | |
| | | | | | | | | | | | | | | | | | | | | | | | | | | | |
| | (1) | Amount represents the cumulative appreciation (depreciation) on futures contracts as disclosed within the Schedule of Investments under the open “Futures Contracts” section. Only current day’s variation margin, if any, is reported within the Statement of Assets and Liabilities. |
The Effect of Derivative Instruments on the Statement of Operations for the year ended December 31, 2018
| | | | | | | | | | | | | | | | | | | | | | | | | | | | |
| | | Risk Exposure Category | |
| | | Interest Rate
Contracts | | | Foreign
Exchange
Contracts | | | Credit
Contracts | | | Equity
Contracts | | | Commodity
Contracts | | | Other
Contracts | | | Total | |
Realized Gain (Loss) on Derivatives Recognized as a
Result of Operations: | |
Net realized gain (loss) on futures contracts | | $ | — | | | $ | — | | | $ | — | | | $ | (3,280,817 | ) | | $ | — | | | $ | — | | | $ | (3,280,817 | ) |
Net realized gain (loss) on foreign currency contracts | | | — | | | | 627,283 | | | | — | | | | — | | | | — | | | | — | | | | 627,283 | |
| | | | | | | | | | | | | | | | | | | | | | | | | | | | |
Total | | $ | — | | | $ | 627,283 | | | $ | — | | | $ | (3,280,817 | ) | | $ | — | | | $ | — | | | $ | (2,653,534 | ) |
| | | | | | | | | | | | | | | | | | | | | | | | | | | | |
|
Net Change in Unrealized Appreciation
(Depreciation) on Derivatives Recognized as a
Result of Operations: | |
Net change in unrealized appreciation (depreciation) of futures contracts | | $ | — | | | $ | — | | | $ | — | | | $ | (2,656,926 | ) | | $ | — | | | $ | — | | | $ | (2,656,926 | ) |
Net change in unrealized appreciation (depreciation) of foreign currency contracts | | | — | | | | (115,379 | ) | | | — | | | | — | | | | — | | | | — | | | | (115,379 | ) |
| | | | | | | | | | | | | | | | | | | | | | | | | | | | |
Total | | $ | — | | | $ | (115,379 | ) | | $ | — | | | $ | (2,656,926 | ) | | $ | — | | | $ | — | | | $ | (2,772,305 | ) |
| | | | | | | | | | | | | | | | | | | | | | | | | | | | |
For the year ended December 31, 2018, the average amount or number per contract outstanding for each derivative type was as follows:
| | | | |
Derivative Description | | Average Notional
Par, Contracts
or Face Amount | |
Futures Contracts Long at Number of Contracts | | | 406 | |
Foreign Currency Contracts Purchased at Contract Amount | | $ | 6,116,812 | |
Foreign Currency Contracts Sold at Contract Amount | | $ | 18,950,069 | |
High Yield HLS Fund
The Effect of Derivative Instruments on the Statement of Assets and Liabilities as of December 31, 2018:
| | | | | | | | | | | | | | | | | | | | | | | | | | | | |
| | | Risk Exposure Category | |
| | | Interest Rate
Contracts | | | Foreign
Exchange
Contracts | | | Credit
Contracts | | | Equity
Contracts | | | Commodity
Contracts | | | Other
Contracts | | | Total | |
Assets: | |
Unrealized appreciation on foreign currency contracts | | $ | — | | | $ | 15,850 | | | $ | — | | | $ | — | | | $ | — | | | $ | — | | | $ | 15,850 | |
| | | | | | | | | | | | | | | | | | | | | | | | | | | | |
Total | | $ | — | | | $ | 15,850 | | | $ | — | | | $ | — | | | $ | — | | | $ | — | | | $ | 15,850 | |
| | | | | | | | | | | | | | | | | | | | | | | | | | | | |
Notes to Financial Statements – (continued)
December 31, 2018
High Yield HLS Fund – (continued)
The Effect of Derivative Instruments on the Statement of Operations for the year ended December 31, 2018
| | | | | | | | | | | | | | | | | | | | | | | | | | | | |
| | | Risk Exposure Category | |
| | | Interest Rate
Contracts | | | Foreign
Exchange
Contracts | | | Credit
Contracts | | | Equity
Contracts | | | Commodity
Contracts | | | Other
Contracts | | | Total | |
Realized Gain (Loss) on Derivatives Recognized as a
Result of Operations: | |
Net realized gain (loss) on foreign currency contracts | | $ | — | | | $ | 311,327 | | | $ | — | | | $ | — | | | $ | — | | | $ | — | | | $ | 311,327 | |
| | | | | | | | | | | | | | | | | | | | | | | | | | | | |
Total | | $ | — | | | $ | 311,327 | | | $ | — | | | $ | — | | | $ | — | | | $ | — | | | $ | 311,327 | |
| | | | | | | | | | | | | | | | | | | | | | | | | | | | |
|
Net Change in Unrealized Appreciation
(Depreciation) on Derivatives Recognized as a
Result of Operations: | |
Net change in unrealized appreciation (depreciation) of foreign currency contracts | | $ | — | | | $ | 76,393 | | | $ | — | | | $ | — | | | $ | — | | | $ | — | | | $ | 76,393 | |
| | | | | | | | | | | | | | | | | | | | | | | | | | | | |
Total | | $ | — | | | $ | 76,393 | | | $ | — | | | $ | — | | | $ | — | | | $ | — | | | $ | 76,393 | |
| | | | | | | | | | | | | | | | | | | | | | | | | | | | |
For the year ended December 31, 2018, the average amount or number per contract outstanding for each derivative type was as follows:
| | | | |
Derivative Description | | Average Notional
Par, Contracts
or Face Amount | |
Foreign Currency Contracts Purchased at Contract Amount | | $ | 3,465,145 | |
Foreign Currency Contracts Sold at Contract Amount | | $ | 5,526,672 | |
Total Return Bond HLS Fund
The Effect of Derivative Instruments on the Statement of Assets and Liabilities as of December 31, 2018:
| | | | | | | | | | | | | | | | | | | | | | | | | | | | |
| | | Risk Exposure Category | |
| | | Interest Rate
Contracts | | | Foreign
Exchange
Contracts | | | Credit
Contracts | | | Equity
Contracts | | | Commodity
Contracts | | | Other
Contracts | | | Total | |
Assets: | |
Investments in securities, at value (purchased options), market value | | $ | 5,142,116 | | | $ | — | | | $ | — | | | $ | — | | | $ | — | | | $ | — | | | $ | 5,142,116 | |
Unrealized appreciation on futures contracts(1) | | | 10,417,071 | | | | — | | | | — | | | | — | | | | — | | | | — | | | | 10,417,071 | |
Unrealized appreciation on foreign currency contracts | | | — | | | | 124,519 | | | | — | | | | — | | | | — | | | | — | | | | 124,519 | |
Unrealized appreciation on swap contracts(2) | | | 1,846,814 | | | | — | | | | 616,982 | | | | — | | | | — | | | | — | | | | 2,463,796 | |
| | | | | | | | | | | | | | | | | | | | | | | | | | | | |
Total | | $ | 17,406,001 | | | $ | 124,519 | | | $ | 616,982 | | | $ | — | | | $ | — | | | $ | — | | | $ | 18,147,502 | |
| | | | | | | | | | | | | | | | | | | | | | | | | | | | |
|
Liabilities: | |
Unrealized depreciation on futures contracts(1) | | $ | 4,306,776 | | | $ | — | | | $ | — | | | $ | — | | | $ | — | | | $ | — | | | $ | 4,306,776 | |
Unrealized depreciation on foreign currency contracts | | | — | | | | 43,270 | | | | — | | | | — | | | | — | | | | — | | | | 43,270 | |
Written options, market value | | | 902,699 | | | | — | | | | — | | | | — | | | | — | | | | — | | | | 902,699 | |
Unrealized depreciation on swap contracts(2) | | | 2,795,937 | | | | — | | | | 4,858,513 | | | | — | | | | — | | | | — | | | | 7,654,450 | |
| | | | | | | | | | | | | | | | | | | | | | | | | | | | |
Total | | $ | 8,005,412 | | | $ | 43,270 | | | $ | 4,858,513 | | | $ | — | | | $ | — | | | $ | — | | | $ | 12,907,195 | |
| | | | | | | | | | | | | | | | | | | | | | | | | | | | |
| | (1) | Amount represents the cumulative appreciation (depreciation) on futures contracts as disclosed within the Schedule of Investments under the open “Futures Contracts” section. Only current day’s variation margin, if any, is reported within the Statement of Assets and Liabilities. |
| | (2) | Amount represents the cumulative appreciation (depreciation) on centrally cleared swaps, if applicable, as disclosed within the Schedule of Investments. Only the current day’s variation margin, if any, are reported within the Statement of Assets and Liabilities. OTC swaps are reported within the Statement of Assets and Liabilities within Unrealized appreciation (depreciation) on OTC swap contracts, if applicable. |
Notes to Financial Statements – (continued)
December 31, 2018
Total Return Bond HLS Fund – (continued)
The Effect of Derivative Instruments on the Statement of Operations for the year ended December 31, 2018
| | | | | | | | | | | | | | | | | | | | | | | | | | | | |
| | | Risk Exposure Category | |
| | | Interest Rate
Contracts | | | Foreign
Exchange
Contracts | | | Credit
Contracts | | | Equity
Contracts | | | Commodity
Contracts | | | Other
Contracts | | | Total | |
Realized Gain (Loss) on Derivatives Recognized as a
Result of Operations: | |
Net realized gain (loss) on purchased options contracts | | $ | 385,075 | | | $ | — | | | $ | — | | | $ | — | | | $ | — | | | $ | — | | | $ | 385,075 | |
Net realized gain (loss) on futures contracts | | | (23,920,328 | ) | | | — | | | | — | | | | — | | | | — | | | | — | | | | (23,920,328 | ) |
Net realized gain (loss) on written options contracts | | | 1,094,667 | | | | — | | | | — | | | | — | | | | — | | | | — | | | | 1,094,667 | |
Net realized gain (loss) on swap contracts | | | 2,579,675 | | | | — | | | | (424,400 | ) | | | — | | | | — | | | | — | | | | 2,155,275 | |
Net realized gain (loss) on foreign currency contracts | | | — | | | | (854,578 | ) | | | — | | | | — | | | | — | | | | — | | | | (854,578 | ) |
| | | | | | | | | | | | | | | | | | | | | | | | | | | | |
Total | | $ | (19,860,911 | ) | | $ | (854,578 | ) | | $ | (424,400 | ) | | $ | — | | | $ | — | | | $ | — | | | $ | (21,139,889 | ) |
| | | | | | | | | | | | | | | | | | | | | | | | | | | | |
|
Net Change in Unrealized Appreciation
(Depreciation) on Derivatives Recognized as a
Result of Operations: | |
Net change in unrealized appreciation (depreciation) of investments in purchased options contracts | | $ | (908,053 | ) | | $ | — | | | $ | — | | | $ | — | | | $ | — | | | $ | — | | | $ | (908,053 | ) |
Net change in unrealized appreciation (depreciation) of futures contracts | | | 7,758,743 | | | | — | | | | — | | | | — | | | | — | | | | — | | | | 7,758,743 | |
Net change in unrealized appreciation (depreciation) of written options contracts | | | (224,937 | ) | | | — | | | | — | | | | — | | | | — | | | | — | | | | (224,937 | ) |
Net change in unrealized appreciation (depreciation) of swap contracts | | | (1,184,113 | ) | | | — | | | | (1,167,466 | ) | | | — | | | | — | | | | — | | | | (2,351,579 | ) |
Net change in unrealized appreciation (depreciation) of foreign currency contracts | | | — | | | | 562,943 | | | | — | | | | — | | | | — | | | | — | | | | 562,943 | |
| | | | | | | | | | | | | | | | | | | | | | | | | | | | |
Total | | $ | 5,441,640 | | | $ | 562,943 | | | $ | (1,167,466 | ) | | $ | — | | | $ | — | | | $ | — | | | $ | 4,837,117 | |
| | | | | | | | | | | | | | | | | | | | | | | | | | | | |
For the year ended December 31, 2018, the average amount or number per contract outstanding for each derivative type was as follows:
| | | | |
Derivative Description | | Average Notional
Par, Contracts
or Face Amount | |
Purchased Options Contracts at Number of Contracts | | | 173,410,500 | |
Futures Contracts Long at Number of Contracts | | | 4,142 | |
Futures Contracts Short at Number of Contracts | | | (1,679 | ) |
Written Options Contracts at Number of Contracts | | | (371,897,286 | ) |
Swap Contracts at Notional Amount | | $ | 437,132,812 | |
Foreign Currency Contracts Purchased at Contract Amount | | $ | 5,552,815 | |
Foreign Currency Contracts Sold at Contract Amount | | $ | 29,106,448 | |
U.S. Government Securities HLS Fund
The Effect of Derivative Instruments on the Statement of Assets and Liabilities as of December 31, 2018:
| | | | | | | | | | | | | | | | | | | | | | | | | | | | |
| | | Risk Exposure Category | |
| | | Interest Rate
Contracts | | | Foreign
Exchange
Contracts | | | Credit
Contracts | | | Equity
Contracts | | | Commodity
Contracts | | | Other
Contracts | | | Total | |
Assets: | |
Unrealized appreciation on futures contracts(1) | | $ | 2,293,026 | | | $ | — | | | $ | — | | | $ | — | | | $ | — | | | $ | — | | | $ | 2,293,026 | |
Unrealized appreciation on swap contracts(2) | | | 202,330 | | | | — | | | | — | | | | — | | | | — | | | | — | | | | 202,330 | |
| | | | | | | | | | | | | | | | | | | | | | | | | | | | |
Total | | $ | 2,495,356 | | | $ | — | | | $ | — | | | $ | — | | | $ | — | | | $ | — | | | $ | 2,495,356 | |
| | | | | | | | | | | | | | | | | | | | | | | | | | | | |
|
Liabilities: | |
Unrealized depreciation on futures contracts(1) | | $ | 660,984 | | | $ | — | | | $ | — | | | $ | — | | | $ | — | | | $ | — | | | $ | 660,984 | |
Unrealized depreciation on swap contracts(2) | | | 548,362 | | | | — | | | | — | | | | — | | | | — | | | | — | | | | 548,362 | |
| | | | | | | | | | | | | | | | | | | | | | | | | | | | |
Total | | $ | 1,209,346 | | | $ | — | | | $ | — | | | $ | — | | | $ | — | | | $ | — | | | $ | 1,209,346 | |
| | | | | | | | | | | | | | | | | | | | | | | | | | | | |
| | (1) | Amount represents the cumulative appreciation (depreciation) on futures contracts as disclosed within the Schedule of Investments under the open “Futures Contracts” section. Only current day’s variation margin, if any, is reported within the Statement of Assets and Liabilities. |
| | (2) | Amount represents the cumulative appreciation (depreciation) on centrally cleared swaps, if applicable, as disclosed within the Schedule of Investments. Only the current day’s variation margin, if any, are reported within the Statement of Assets and Liabilities. OTC swaps are reported within the Statement of Assets and Liabilities within Unrealized appreciation (depreciation) on OTC swap contracts, if applicable. |
Notes to Financial Statements – (continued)
December 31, 2018
U.S. Government Securities HLS Fund – (continued)
The Effect of Derivative Instruments on the Statement of Operations for the year ended December 31, 2018
| | | | | | | | | | | | | | | | | | | | | | | | | | | | |
| | | Risk Exposure Category | |
| | | Interest Rate
Contracts | | | Foreign
Exchange
Contracts | | | Credit
Contracts | | | Equity
Contracts | | | Commodity
Contracts | | | Other
Contracts | | | Total | |
Realized Gain (Loss) on Derivatives Recognized as a
Result of Operations: | |
Net realized gain (loss) on futures contracts | | $ | (3,417,130 | ) | | $ | — | | | $ | — | | | $ | — | | | $ | — | | | $ | — | | | $ | (3,417,130 | ) |
Net realized gain (loss) on written options contracts | | | (96,204 | ) | | | — | | | | — | | | | — | | | | — | | | | — | | | | (96,204 | ) |
Net realized gain (loss) on swap contracts | | | 1,089,615 | | | | — | | | | 51,337 | | | | — | | | | — | | | | — | | | | 1,140,952 | |
| | | | | | | | | | | | | | | | | | | | | | | | | | | | |
Total | | $ | (2,423,719 | ) | | $ | — | | | $ | 51,337 | | | $ | — | | | $ | — | | | $ | — | | | $ | (2,372,382 | ) |
| | | | | | | | | | | | | | | | | | | | | | | | | | | | |
|
Net Change in Unrealized Appreciation
(Depreciation) on Derivatives Recognized as a
Result of Operations: | |
Net change in unrealized appreciation (depreciation) of futures contracts | | $ | 1,997,765 | | | $ | — | | | $ | — | | | $ | — | | | $ | — | | | $ | — | | | $ | 1,997,765 | |
Net change in unrealized appreciation (depreciation) of swap contracts | | | (244,648 | ) | | | — | | | | (45,089 | ) | | | — | | | | — | | | | — | | | | (289,737 | ) |
| | | | | | | | | | | | | | | | | | | | | | | | | | | | |
Total | | $ | 1,753,117 | | | $ | — | | | $ | (45,089 | ) | | $ | — | | | $ | — | | | $ | — | | | $ | 1,708,028 | |
| | | | | | | | | | | | | | | | | | | | | | | | | | | | |
For the year ended December 31, 2018, the average amount or number per contract outstanding for each derivative type was as follows:
| | | | |
Derivative Description | | Average Notional
Par, Contracts
or Face Amount | |
Futures Contracts Long at Number of Contracts | | | 843 | |
Futures Contracts Short at Number of Contracts | | | (241 | ) |
Written Options Contracts at Number of Contracts | | | (240 | ) |
Swap Contracts at Notional Amount | | $ | 35,301,083 | |
| | f) | Balance Sheet Offsetting Information – Set forth below are tables which disclose both gross information and net information about instruments and transactions eligible for offset in the financial statements, and instruments and transactions that are subject to a master netting arrangement, as well as amounts related to margin, reflected as financial collateral (including cash collateral), held at clearing brokers, counterparties and a Fund’s custodian. The master netting arrangements allow the clearing brokers to net any collateral held in or on behalf of a Fund, or liabilities or payment obligations of the clearing brokers to a Fund, against any liabilities or payment obligations of a Fund to the clearing brokers. A Fund is required to deposit financial collateral (including cash collateral) at a Fund’s custodian on behalf of clearing brokers and counterparties to continually meet the original and maintenance requirements established by the clearing brokers and counterparties. Such requirements are specific to the respective clearing broker or counterparty. Certain master netting arrangements may not be enforceable in a bankruptcy. |
The following tables present a Fund’s derivative assets and liabilities, presented on a gross basis as no amounts are netted within the Statements of Assets and Liabilities, by counterparty net of amounts available for offset under a master netting agreement or similar agreement (“MNA”) and net of the related collateral received/pledged by a Fund as of December 31, 2018:
Balanced HLS Fund
| | | | | | | | |
Derivative Financial Instruments: | | Assets | | | Liabilities | |
Futures contracts | | $ | 263,466 | | | $ | (85,351 | ) |
| | | | | | | | |
Total gross amount of derivative assets and liabilities in the Statement of Assets and Liabilities | | | 263,466 | | | | (85,351 | ) |
| | | | | | | | |
Derivatives not subject to a MNA | | | (263,466 | ) | | | 85,351 | |
| | | | | | | | |
Total gross amount of assets and liabilities subject to MNA or similar agreements | | $ | — | | | $ | — | |
| | | | | | | | |
Capital Appreciation HLS Fund
| | | | | | | | |
Derivative Financial Instruments: | | Assets | | | Liabilities | |
Foreign currency contracts | | $ | — | | | $ | (345,582 | ) |
Futures contracts | | | — | | | | (2,656,926 | ) |
| | | | | | | | |
Total gross amount of derivative assets and liabilities in the Statement of Assets and Liabilities | | | — | | | | (3,002,508 | ) |
| | | | | | | | |
Derivatives not subject to a MNA | | | — | | | | 2,656,926 | |
| | | | | | | | |
Total gross amount of assets and liabilities subject to MNA or similar agreements | | $ | — | | | $ | (345,582 | ) |
| | | | | | | | |
Notes to Financial Statements – (continued)
December 31, 2018
Capital Appreciation HLS Fund – (continued)
| | | | | | | | | | | | | | | | | | | | |
Counterparty | | Gross Amount
of Liabilities | | | Financial
Instruments
and Derivatives
Available
for Offset | | | Non-cash
Collateral
Pledged* | | | Cash
Collateral
Pledged* | | | Net Amount
of Liabilities | |
Banc of America Securities LLC | | $ | (60,930 | ) | | $ | — | | | $ | — | | | $ | — | | | $ | (60,930 | ) |
Barclays | | | (284,652 | ) | | | — | | | | — | | | | — | | | | (284,652 | ) |
| | | | | | | | | | | | | | | | | | | | |
Total | | $ | (345,582 | ) | | $ | — | | | $ | — | | | $ | — | | | $ | (345,582 | ) |
| | | | | | | | | | | | | | | | | | | | |
| | * | In some instances, the actual collateral received and/or pledged may be more than the amount shown. |
High Yield HLS Fund
| | | | | | | | |
Derivative Financial Instruments: | | Assets | | | Liabilities | |
Foreign currency contracts | | $ | 15,850 | | | $ | — | |
| | | | | | | | |
Total gross amount of derivative assets and liabilities in the Statement of Assets and Liabilities | | | 15,850 | | | | — | |
| | | | | | | | |
Derivatives not subject to a MNA | | | — | | | | — | |
| | | | | | | | |
Total gross amount of assets and liabilities subject to MNA or similar agreements | | $ | 15,850 | | | $ | — | |
| | | | | | | | |
| | | | | | | | | | | | | | | | | | | | |
Counterparty | | Gross Amount
of Assets | | | Financial
Instruments
and Derivatives
Available
for Offset | | | Non-cash
Collateral
Received* | | | Cash
Collateral
Received* | | | Net Amount
of Assets | |
Banc of America Securities LLC | | $ | 15,850 | | | $ | — | | | $ | — | | | $ | — | | | $ | 15,850 | |
| | | | | | | | | | | | | | | | | | | | |
| | * | In some instances, the actual collateral received and/or pledged may be more than the amount shown. |
Total Return Bond HLS Fund
| | | | | | | | | | | | | | |
Derivative Financial Instruments: | | Assets | | | Liabilities | |
Foreign currency contracts | | $ | 124,519 | | | $ | (43,270 | ) |
Futures contracts | | | 10,417,071 | | | | (4,306,776 | ) |
Purchased options | | | 5,142,116 | | | | — | |
Swap contracts | | | 2,463,796 | | | | (7,654,450 | ) |
Written options | | | — | | | | (902,699 | ) |
| | | | | | | | |
Total gross amount of derivative assets and liabilities in the Statement of Assets and Liabilities | | | 18,147,502 | | | | (12,907,195 | ) |
| | | | | | | | |
Derivatives not subject to a MNA | | | (12,305,266 | ) | | | 7,822,504 | |
| | | | | | | | |
Total gross amount of assets and liabilities subject to MNA or similar agreements | | $ | 5,842,236 | | | $ | (5,084,691 | ) |
| | | | | | | | |
| | | | | | | | | | | | | | | | | | | | |
Counterparty | | Gross Amount
of Assets | | | Financial
Instruments
and Derivatives
Available
for Offset | | | Non-cash
Collateral
Received* | | | Cash
Collateral
Received* | | | Net Amount
of Assets | |
Banc of America Securities LLC | | $ | 2,184,120 | | | $ | (43,270 | ) | | $ | — | | | $ | — | | | $ | 2,140,850 | |
Barclays | | | 2,096,500 | | | | (84,772 | ) | | | — | | | | — | | | | 2,011,728 | |
Citibank NA | | | 732,800 | | | | — | | | | — | | | | — | | | | 732,800 | |
Credit Suisse International | | | 134,856 | | | | (134,856 | ) | | | — | | | | — | | | | — | |
Deutsche Bank Securities, Inc. | | | 205,765 | | | | (21,924 | ) | | | — | | | | — | | | | 183,841 | |
Goldman Sachs & Co. | | | 107,598 | | | | (107,598 | ) | | | — | | | | — | | | | — | |
Morgan Stanley | | | 380,436 | | | | (380,436 | ) | | | — | | | | — | | | | — | |
State Street Global Markets LLC | | | 161 | | | | — | | | | — | | | | — | | | | 161 | |
| | | | | | | | | | | | | | | | | | | | |
Total | | $ | 5,842,236 | | | $ | (772,856 | ) | | $ | — | | | $ | — | | | $ | 5,069,380 | |
| | | | | | | | | | | | | | | | | | | | |
Notes to Financial Statements – (continued)
December 31, 2018
Total Return Bond HLS Fund – (continued)
| | | | | | | | | | | | | | | | | | | | |
| | | | | |
Counterparty | | Gross Amount
of Liabilities | | | Financial
Instruments
and Derivatives
Available
for Offset | | | Non-cash
Collateral
Pledged* | | | Cash
Collateral
Pledged* | | | Net Amount
of Liabilities | |
Banc of America Securities LLC | | $ | (43,270 | ) | | $ | 43,270 | | | $ | — | | | $ | — | | | $ | — | |
Barclays | | | (84,772 | ) | | | 84,772 | | | | — | | | | — | | | | — | |
Credit Suisse International | | | (2,484,039 | ) | | | 134,856 | | | | 2,349,183 | | | | — | | | | — | |
Deutsche Bank Securities, Inc. | | | (21,924 | ) | | | 21,924 | | | | — | | | | — | | | | — | |
Goldman Sachs & Co. | | | (1,938,941 | ) | | | 107,598 | | | | 1,831,343 | | | | — | | | | — | |
JP Morgan Chase & Co. | | | (87,993 | ) | | | — | | | | — | | | | — | | | | (87,993 | ) |
Morgan Stanley | | | (423,752 | ) | | | 380,436 | | | | 43,316 | | | | — | | | | — | |
| | | | | | | | | | | | | | | | | | | | |
Total | | $ | (5,084,691 | ) | | $ | 772,856 | | | $ | 4,223,842 | | | $ | — | | | $ | (87,993 | ) |
| | | | | | | | | | | | | | | | | | | | |
| | * | In some instances, the actual collateral received and/or pledged may be more than the amount shown. |
U.S. Government Securities HLS Fund
| | | | | | | | |
Derivative Financial Instruments: | | Assets | | | Liabilities | |
Futures contracts | | $ | 2,293,026 | | | $ | (660,984 | ) |
Swap contracts | | | 202,330 | | | | (548,362 | ) |
| | | | | | | | |
Total gross amount of derivative assets and liabilities in the Statement of Assets and Liabilities | | | 2,495,356 | | | | (1,209,346 | ) |
| | | | | | | | |
Derivatives not subject to a MNA | | | (2,495,356 | ) | | | 1,209,346 | |
| | | | | | | | |
Total gross amount of assets and liabilities subject to MNA or similar agreements | | $ | — | | | $ | — | |
| | | | | | | | |
A Fund’s investments expose it to various types of risks associated with financial instruments and the markets. A Fund may be exposed to the risks described below. Each Fund’s statutory prospectus provides details of its principal risks.
The market values of equity securities, such as common stocks and preferred stocks, or equity related derivative investments, such as futures and options, may decline due to general market conditions which are not specifically related to a particular company, such as real or perceived adverse economic conditions, changes in the general outlook for corporate earnings, changes in interest or currency rates or adverse investor sentiment generally. The market value of equity securities may also decline due to factors which affect a particular industry or industries, such as labor shortages or increased production costs and competitive conditions within an industry. Equity securities and equity related investments generally have greater market price volatility than fixed income securities. The extent of each Fund’s exposure to market risk is the market value of the investments held as shown in the Fund’s Schedule of Investments.
Certain investments held by a Fund expose the Fund to various risks which may include, but are not limited to, interest rate, prepayment, and extension risks. Interest rate risk is the risk that fixed income securities will decline in value because of changes in interest rates. As nominal interest rates rise, the values of certain fixed income securities held by a Fund are likely to decrease. A nominal interest rate can be described as the sum of a real interest rate and an expected inflation rate. Fixed income securities with longer durations tend to be more sensitive to changes in interest rates, usually making them more volatile than securities with shorter durations. Duration is useful primarily as a measure of the sensitivity of a fixed income security’s market price to interest rate (i.e., yield) movements. Senior floating rate interests and securities subject to prepayment and extension risk generally offer less potential for gains when interest rates decline. Rising interest rates may cause prepayments to occur at a slower than expected rate, thereby effectively lengthening the maturity of the security and making the security more sensitive to interest rate changes. Prepayment and extension risk are major risks of mortgage-backed securities, senior floating rate interests and certain asset-backed securities. For certain asset-backed securities, the actual maturity may be less than the stated maturity shown in the Schedule of Investments, if applicable. As a result, the timing of income recognition relating to these securities may vary based upon the actual maturity.
Investing in the securities ofnon-U.S. issuers, whether directly or indirectly, involves certain considerations and risks not typically associated with securities of U.S. issuers. Such risks include, but are not limited to: generally less liquid and less efficient securities markets; generally greater price volatility; exchange rate fluctuations; imposition of restrictions on the expatriation of funds or other protectionist measures; less publicly available information about issuers; the imposition of withholding or other taxes; higher transaction and custody costs; settlement delays and risk of loss attendant in settlement procedures; difficulties in enforcing contractual obligations; less regulation of securities markets; different accounting, disclosure and reporting requirements; more substantial governmental involvement in the economy; higher inflation rates; and greater social, economic and political uncertainties. These risks are heightened for investments in issuers from countries with less developed markets.
Notes to Financial Statements – (continued)
December 31, 2018
Credit risk depends largely on the perceived financial health of bond issuers. In general, the credit rating is inversely related to the credit risk of the issuer. Higher rated bonds generally are deemed to have less credit risk, while lower or unrated bonds are deemed to have higher risk of default. The share price, yield and total return of a fund that holds securities with higher credit risk may be more volatile than those of a fund that holds bonds with lower credit risk. A Fund may be exposed to counterparty risk, or the risk that an institution or other entity with which a Fund has unsettled or open transactions will default.
| | a) | Each Fund intends to continue to qualify as a Regulated Investment Company (“RIC”) under Subchapter M of the Internal Revenue Code (“IRC”) by distributing substantially all of its taxable net investment income and net realized capital gains to its shareholders each year. Each Fund has distributed substantially all of its income and capital gains in prior years, if applicable, and intends to distribute substantially all of its income and capital gains during the calendar year ending December 31, 2018. Accordingly, no provision for federal income or excise taxes has been made in the accompanying financial statements. Distributions from short-term capital gains are treated as ordinary income distributions for federal income tax purposes. |
| | b) | Net Investment Income (Loss), Net Realized Gains (Losses) and Distributions – Net investment income (loss) and net realized gains (losses) may differ for financial statement and tax purposes primarily because of losses deferred due to wash sale adjustments, foreign currency gains and losses, adjustments related to Passive Foreign Investment Companies (“PFICs”), Real Estate Investment Trusts (“REITs”), RICs, certain derivatives and partnerships. The character of distributions made during the year from net investment income or net realized gains may differ from their ultimate characterization for federal income tax purposes. Also, due to the timing of dividend distributions, the fiscal year in which amounts are distributed may differ from the year that the income or realized gains (losses) were recorded by each Fund. |
| | c) | Distributions and Components of Distributable Earnings– The tax character of distributions paid by each Fund for the years ended December 31, 2018 and December 31, 2017 are as follows (as adjusted for dividends payable, if applicable): |
| | | | | | | | | | | | | | | | |
| | | For the Year Ended
December 31, 2018 | | | For the Year Ended
December 31, 2017 | |
Fund | | Ordinary
Income | | | Long-Term
Capital Gains | | | Ordinary
Income | | | Long-Term
Capital Gains | |
Balanced HLS Fund | | $ | 49,937,858 | | | $ | 89,763,845 | | | $ | 52,998,179 | | | $ | — | |
Capital Appreciation HLS Fund | | | 155,684,592 | | | | 357,773,863 | | | | 256,975,919 | | | | 59,762,068 | |
Disciplined Equity HLS Fund | | | 10,105,656 | | | | 57,940,779 | | | | 13,006,932 | | | | 65,722,486 | |
Dividend and Growth HLS Fund | | | 62,479,436 | | | | 354,664,659 | | | | 74,944,481 | | | | 222,168,732 | |
Global Growth HLS Fund | | | 4,474,845 | | | | 41,743,435 | | | | 2,278,163 | | | | 22,502,321 | |
Growth Opportunities HLS Fund | | | 87,935,173 | | | | 121,869,097 | | | | — | | | | 18,391,830 | |
Healthcare HLS Fund | | | 6,465,231 | | | | 13,897,527 | | | | 3,196 | | | | 49,738,571 | |
High Yield HLS Fund | | | 16,383,413 | | | | — | | | | 18,453,383 | | | | — | |
International Opportunities HLS Fund | | | 26,985,679 | | | | — | | | | 20,907,573 | | | | — | |
MidCap HLS Fund | | | 18,326,031 | | | | 193,154,481 | | | | 32,145,069 | | | | 67,598,711 | |
MidCap Growth HLS Fund | | | 745,839 | | | | 8,559,025 | | | | 791,280 | | | | 3,047,082 | |
MidCap Value HLS Fund | | | 3,997,177 | | | | 22,842,554 | | | | 1,827,960 | | | | 24,512,728 | |
Small Cap Growth HLS Fund | | | — | | | | 83,609,724 | | | | 446,623 | | | | 5 | |
Small Company HLS Fund | | | — | | | | 41,270,164 | | | | — | | | | — | |
Stock HLS Fund | | | 21,980,653 | | | | — | | | | 25,818,519 | | | | — | |
Total Return Bond HLS Fund | | | 86,216,331 | | | | 7,769,724 | | | | 70,944,183 | | | | — | |
Ultrashort Bond HLS Fund | | | 5,554,707 | | | | — | | | | 4,216,403 | | | | — | |
U.S. Government Securities HLS Fund | | | 8,467,369 | | | | — | | | | 8,912,082 | | | | — | |
Value HLS Fund | | | 12,380,863 | | | | 40,765,988 | | | | 10,800,129 | | | | 34,882,857 | |
As of December 31, 2018, the components of distributable earnings (deficit) for each Fund on a tax basis are as follows:
| | | | | | | | | | | | | | | | | | | | | | | | |
Fund | | Undistributed
Ordinary
Income | | | Undistributed
Long-Term
Capital Gains | | | Accumulated
Capital and
Other Losses | | | Other
Temporary
Differences | | | Unrealized
Appreciation/
(Depreciation) on
Investments | | | Total
Accumulated
Earnings
(Deficit) | |
Balanced HLS Fund | | $ | 6,565,802 | | | $ | 166,914,194 | | | $ | — | | | $ | (31,871 | ) | | $ | 183,283,828 | | | $ | 356,731,953 | |
Capital Appreciation HLS Fund | | | 28,593,132 | | | | 412,583,926 | | | | — | | | | — | | | | (212,266,007 | ) | | | 228,911,051 | |
Disciplined Equity HLS Fund | | | 1,481,338 | | | | 67,970,109 | | | | — | | | | — | | | | 102,052,652 | | | | 171,504,099 | |
Dividend and Growth HLS Fund | | | 3,605,282 | | | | 373,161,325 | | | | — | | | | — | | | | 564,342,631 | | | | 941,109,238 | |
Global Growth HLS Fund | | | 6,279,724 | | | | 64,635,332 | | | | — | | | | — | | | | 53,690,160 | | | | 124,605,216 | |
Growth Opportunities HLS Fund | | | 97,646,497 | | | | 212,417,774 | | | | — | | | | — | | | | (26,521,277 | ) | | | 283,542,994 | |
Healthcare HLS Fund | | | 136,547 | | | | 28,725,122 | | | | — | | | | — | | | | 19,026,059 | | | | 47,887,728 | |
High Yield HLS Fund | | | 15,580,325 | | | | — | | | | (13,033,255 | ) | | | — | | | | (24,017,546 | ) | | | (21,470,476 | ) |
International Opportunities HLS Fund | | | 21,562,059 | | | | 44,838,605 | | | | — | | | | — | | | | (124,546,450 | ) | | | (58,145,786 | ) |
MidCap HLS Fund | | | 1,860,144 | | | | 304,992,892 | | | | — | | | | — | | | | 134,034,846 | | | | 440,887,882 | |
MidCap Growth HLS Fund | | | 592,554 | | | | 16,563,251 | | | | — | | | | — | | | | (7,311,157 | ) | | | 9,844,648 | |
Notes to Financial Statements – (continued)
December 31, 2018
| | | | | | | | | | | | | | | | | | | | | | | | |
Fund | | Undistributed
Ordinary
Income | | | Undistributed
Long-Term
Capital Gains | | | Accumulated
Capital and
Other Losses | | | Other
Temporary
Differences | | | Unrealized
Appreciation/
(Depreciation) on
Investments | | | Total
Accumulated
Earnings
(Deficit) | |
MidCap Value HLS Fund | | $ | 527,363 | | | $ | 38,032,034 | | | $ | — | | | $ | — | | | $ | (4,875,485 | ) | | $ | 33,683,912 | |
Small Cap Growth HLS Fund | | | 47,885,210 | | | | 169,646,504 | | | | — | | | | — | | | | (75,988,681 | ) | | | 141,543,033 | |
Small Company HLS Fund | | | 14,718,812 | | | | 96,313,975 | | | | — | | | | — | | | | (15,140,054 | ) | | | 95,892,733 | |
Stock HLS Fund | | | 2,153,822 | | | | 116,525,483 | | | | — | | | | — | | | | 223,525,642 | | | | 342,204,947 | |
Total Return Bond HLS Fund | | | 82,153,618 | | | | — | | | | (39,899,100 | ) | | | (819,995 | ) | | | (42,995,630 | ) | | | (1,561,107 | ) |
Ultrashort Bond HLS Fund | | | 8,913,042 | | | | — | | | | (849,996 | ) | | | — | | | | (1,259,626 | ) | | | 6,803,420 | |
U.S. Government Securities HLS Fund | | | 8,237,765 | | | | — | | | | (32,193,835 | ) | | | (347,828 | ) | | | (2,853,700 | ) | | | (27,157,598 | ) |
Value HLS Fund | | | 1,690,269 | | | | 42,429,447 | | | | — | | | | — | | | | 42,665,501 | | | | 86,785,217 | |
| | d) | Reclassification of Capital Accounts– The Funds may record reclassifications in their capital accounts. These reclassifications have no impact on the total net assets of the Funds. The reclassifications are a result of permanent differences between U.S. GAAP and tax accounting for such items as expiration of capital loss carryforwards, nondeductible expenses from partnership investments andwrite-off of net operating losses. Adjustments are made to reflect the impact these items have on current and future distributions to shareholders. Therefore, the source of the Funds’ distributions may be shown in the accompanying Statements of Changes in Net Assets as from distributable earnings or from capital depending on the type of book and tax differences that exist. For the year ended December 31, 2018, the Funds recorded reclassifications to increase (decrease) the accounts listed below: |
| | | | | | | | |
Fund | | Paid-in-Capital | | | Distributable
Earnings (Loss) | |
Balanced HLS Fund | | $ | (9,202 | ) | | $ | 9,202 | |
Capital Appreciation HLS Fund | | | (16,287 | ) | | | 16,287 | |
Dividend and Growth HLS Fund | | | 1 | | | | (1 | ) |
Growth Opportunities HLS Fund | | | (5,329 | ) | | | 5,329 | |
Healthcare HLS Fund | | | (2 | ) | | | 2 | |
High Yield HLS Fund | | | (1 | ) | | | 1 | |
International Opportunities HLS Fund | | | 2 | | | | (2 | ) |
MidCap HLS Fund | | | 1 | | | | (1 | ) |
MidCap Value HLS Fund | | | (2 | ) | | | 2 | |
Small Cap Growth HLS Fund | | | (248,687 | ) | | | 248,687 | |
Small Company HLS Fund | | | (522,333 | ) | | | 522,333 | |
Stock HLS Fund | | | 2,166 | | | | (2,166 | ) |
Total Return Bond HLS Fund | | | (3 | ) | | | 3 | |
U.S. Government Securities HLS Fund | | | (58,149,395 | ) | | | 58,149,395 | |
| | e) | Tax Basis of Investments– The aggregate cost of investments for federal income tax purposes at December 31, 2018 was substantially the same for book purposes. The net unrealized appreciation/(depreciation) on investments, which consists of gross unrealized appreciation and depreciation, is disclosed below: |
| | | | | | | | | | | | | | | | |
Fund | | Tax Cost | | | Gross��Unrealized
Appreciation | | | Gross Unrealized
(Depreciation) | | | Net Unrealized
Appreciation/
(Depreciation) | |
Balanced HLS Fund | | $ | 1,761,196,117 | | | $ | 291,558,417 | | | $ | (108,258,166 | ) | | $ | 183,300,251 | |
Capital Appreciation HLS Fund | | | 4,219,976,392 | | | | 276,430,587 | | | | (488,630,800 | ) | | | (212,200,213 | ) |
Disciplined Equity HLS Fund | | | 467,597,240 | | | | 125,668,608 | | | | (23,615,956 | ) | | | 102,052,652 | |
Dividend and Growth HLS Fund | | | 2,396,690,334 | | | | 705,974,443 | | | | (141,631,904 | ) | | | 564,342,539 | |
Global Growth HLS Fund | | | 394,418,694 | | | | 75,795,003 | | | | (22,089,204 | ) | | | 53,705,799 | |
Growth Opportunities HLS Fund | | | 1,394,645,806 | | | | 119,402,939 | | | | (145,913,857 | ) | | | (26,510,918 | ) |
Healthcare HLS Fund | | | 269,742,075 | | | | 56,972,501 | | | | (37,946,581 | ) | | | 19,025,920 | |
High Yield HLS Fund | | | 269,786,413 | | | | 1,333,846 | | | | (25,351,375 | ) | | | (24,017,529 | ) |
International Opportunities HLS Fund | | | 1,244,960,749 | | | | 36,243,797 | | | | (160,736,360 | ) | | | (124,492,563 | ) |
MidCap HLS Fund | | | 1,686,449,529 | | | | 297,582,872 | | | | (163,548,026 | ) | | | 134,034,846 | |
MidCap Growth HLS Fund | | | 83,221,936 | | | | 515,166 | | | | (7,826,323 | ) | | | (7,311,157 | ) |
MidCap Value HLS Fund | | | 288,599,113 | | | | 35,109,470 | | | | (39,985,730 | ) | | | (4,876,260 | ) |
Small Cap Growth HLS Fund | | | 1,230,187,926 | | | | 95,220,457 | | | | (171,209,138 | ) | | | (75,988,681 | ) |
Small Company HLS Fund | | | 552,850,207 | | | | 49,906,371 | | | | (65,046,425 | ) | | | (15,140,054 | ) |
Stock HLS Fund | | | 1,099,725,570 | | | | 244,654,118 | | | | (21,103,090 | ) | | | 223,551,028 | |
Total Return Bond HLS Fund | | | 2,898,594,752 | | | | 28,601,489 | | | | (71,576,150 | ) | | | (42,974,661 | ) |
Ultrashort Bond HLS Fund | | | 509,739,202 | | | | 189,349 | | | | (1,448,975 | ) | | | (1,259,626 | ) |
U.S. Government Securities HLS Fund | | | 365,256,501 | | | | 3,608,105 | | | | (6,461,805 | ) | | | (2,853,700 | ) |
Value HLS Fund | | | 368,002,451 | | | | 73,541,602 | | | | (30,871,584 | ) | | | 42,670,018 | |
Notes to Financial Statements – (continued)
December 31, 2018
| | f) | Capital Loss Carryforward– At December 31, 2018 (tax year end), each Fund’s capital loss carryforwards for U.S. federal income tax purposes were as follows: |
| | | | | | | | |
Fund | | Short-Term
Capital Loss
Carryforward
with No Expiration | | | Long-Term
Capital Loss
Carryforward
with No Expiration | |
High Yield HLS Fund | | $ | 1,788,416 | | | $ | 11,244,839 | |
Total Return Bond HLS Fund | | | 18,083,082 | | | | 21,816,018 | |
Ultrashort Bond HLS Fund | | | 366,065 | | | | 483,931 | |
U.S. Government Securities HLS Fund | | | 3,622,450 | | | | 28,571,385 | |
Balanced HLS Fund, Capital Appreciation HLS Fund, Disciplined Equity HLS Fund, Dividend and Growth HLS Fund, Global Growth HLS Fund, Growth Opportunities HLS Fund, Healthcare HLS Fund, International Opportunities HLS Fund, MidCap HLS Fund, MidCap Growth HLS Fund, MidCap Value HLS Fund, Small Cap Growth HLS Fund, Small Company HLS Fund, Stock HLS Fund and Value HLS Fund had no capital loss carryforwards for U.S. federal income tax purposes as of December 31, 2018.
During the fiscal year ended December 31, 2018, the High Yield HLS Fund utilized $2,476,286 of prior year capital loss carryforwards.
During the year ended December 31, 2018, U.S. Government Securities HLS Fund had expired $58,149,395 of prior year capital loss carryforwards.
| | g) | Accounting for Uncertainty in Income Taxes – Pursuant to provisions set forth by U.S. GAAP, Hartford Funds Management Company, LLC (“HFMC”) reviews each Fund’s tax positions for all open tax years. As of December 31, 2018, HFMC had reviewed the open tax years and concluded that there was no reason to record a liability for net unrecognized tax obligations relating to uncertain income tax positions. Each Fund files U.S. tax returns. Although the statute of limitations for examining a Fund’s U.S. tax returns remains open for 3 years, no examination is currently in progress. HFMC is not aware of any tax positions for which it is reasonably possible that the total amounts of unrecognized tax obligations will significantly change in the next twelve months. |
| | a) | Investment Management Agreement – HFMC serves as each Fund’s investment manager. Each Company, on behalf of its respective Funds, has entered into an Investment Management Agreement with HFMC. HFMC is an indirect subsidiary of The Hartford Financial Services Group, Inc. (“The Hartford”). HFMC has overall investment supervisory responsibility for each Fund. In addition, HFMC provides administrative personnel, services, equipment, facilities and office space for proper operation of each Fund. HFMC has contracted with Wellington Management Company LLP (“Wellington Management”) under asub-advisory agreement and Wellington Management performs the daily investment of the assets of each Fund, in accordance with the Fund’s investment objective and policies. Each Fund pays a fee to HFMC, a portion of which may be used to compensate Wellington Management. |
The schedule below reflects the rates of compensation paid to HFMC for investment management services rendered as of December 31, 2018; the rates are accrued daily and paid monthly based on each Fund’s average daily net assets, at the following annual rates:
| | |
Fund | | Management Fee Rates |
Balanced HLS Fund* | | 0.6800% on first $250 million and; |
| | 0.6550% on next $250 million and; |
| | 0.6450% on next $500 million and; |
| | 0.5950% on next $4 billion and; |
| | 0.5925% on next $5 billion and; |
| | 0.5900% over $10 billion |
| |
Capital Appreciation HLS Fund | | 0.7750% on first $250 million and; |
| | 0.7250% on next $250 million and; |
| | 0.6750% on next $500 million and; |
| | 0.6250% on next $1.5 billion and; |
| | 0.6200% on next $2.5 billion and; |
| | 0.6150% on next $5 billion and; |
| | 0.6100% over $10 billion |
| |
Disciplined Equity HLS Fund | | 0.7750% on first $250 million and; |
| | 0.7250% on next $250 million and; |
| | 0.6750% on next $500 million and; |
| | 0.6250% on next $4 billion and; |
| | 0.6225% on next $5 billion and; |
| | 0.6200% over $10 billion |
Notes to Financial Statements – (continued)
December 31, 2018
| | |
Fund | | Management Fee Rates |
| |
Dividend and Growth HLS Fund | | 0.7750% on first $250 million and; |
| | 0.7250% on next $250 million and; |
| | 0.6750% on next $500 million and; |
| | 0.6250% on next $1.5 billion and; |
| | 0.6200% on next $2.5 billion and; |
| | 0.6150% on next $5 billion and; |
| | 0.6100% over $10 billion |
| |
Global Growth HLS Fund | | 0.7750% on first $250 million and; |
| | 0.7250% on next $250 million and; |
| | 0.6750% on next $500 million and; |
| | 0.6250% on next $4 billion and; |
| | 0.6225% on next $5 billion and; |
| | 0.6200% over $10 billion |
| |
Growth Opportunities HLS Fund | | 0.7000% on first $100 million and; |
| | 0.6000% on next $4.9 billion and; |
| | 0.5975% on next $5 billion and; |
| | 0.5950% over $10 billion |
| |
Healthcare HLS Fund | | 0.8500% on first $250 million and; |
| | 0.8000% on next $250 million and; |
| | 0.7500% on next $4.5 billion and; |
| | 0.7475% on next $5 billion and; |
| | 0.7450% over $10 billion |
| |
High Yield HLS Fund | | 0.7000% on first $500 million and; |
| | 0.6750% on next $500 million and; |
| | 0.6250% on next $1.5 billion and; |
| | 0.6150% on next $2.5 billion and; |
| | 0.6050% on next $5 billion and; |
| | 0.5950% over $10 billion |
| |
International Opportunities HLS Fund | | 0.7750% on first $250 million and; |
| | 0.7250% on next $250 million and; |
| | 0.6750% on next $500 million and; |
| | 0.6250% on next $1.5 billion and; |
| | 0.6200% on next $2.5 billion and; |
| | 0.6150% on next $5 billion and; |
| | 0.6100% over $10 billion |
| |
MidCap HLS Fund | | 0.7750% on first $250 million and; |
| | 0.7250% on next $250 million and; |
| | 0.6750% on next $500 million and; |
| | 0.6250% on next $4 billion and; |
| | 0.6225% on next $5 billion and; |
| | 0.6200% over $10 billion |
| |
MidCap Growth HLS Fund | | 0.8000% on first $500 million and; |
| | 0.7500% on next $500 million and; |
| | 0.7000% on next $2 billion and; |
| | 0.6900% on next $2 billion and; |
| | 0.6800% on next $5 billion and; |
| | 0.6700% over $10 billion |
| |
MidCap Value HLS Fund | | 0.8000% on first $500 million and; |
| | 0.7250% on next $500 million and; |
| | 0.6750% on next $1.5 billion and; |
| | 0.6700% on next $2.5 billion and; |
| | 0.6650% on next $5 billion and; |
| | 0.6600% over $10 billion |
| |
Small Cap Growth HLS Fund | | 0.7000% on first $100 million and; |
| | 0.6000% on next $4.9 billion and; |
| | 0.5800% on next $5 billion and; |
| | 0.5700% over $10 billion |
| |
Small Company HLS Fund | | 0.7750% on first $250 million and; |
| | 0.7250% on next $250 million and; |
| | 0.6750% on next $500 million and; |
| | 0.6000% on next $500 million and; |
| | 0.5500% on next $3.5 billion and; |
| | 0.5300% on next $5 billion and; |
| | 0.5200% over $10 billion |
Notes to Financial Statements – (continued)
December 31, 2018
| | |
Fund | | Management Fee Rates |
| |
Stock HLS Fund | | 0.5250% on first $250 million and; |
| | 0.5000% on next $250 million and; |
| | 0.4750% on next $500 million and; |
| | 0.4500% on next $4 billion and; |
| | 0.4475% on next $5 billion and; |
| | 0.4450% over $10 billion |
| |
Total Return Bond HLS Fund | | 0.5250% on first $250 million and; |
| | 0.5000% on next $250 million and; |
| | 0.4750% on next $500 million and; |
| | 0.4500% on next $1.5 billion and; |
| | 0.4450% on next $2.5 billion and; |
| | 0.4300% on next $5 billion and; |
| | 0.4200% over $10 billion |
| |
Ultrashort Bond HLS Fund | | 0.4000% on first $5 billion and; |
| | 0.3800% on next $5 billion and; |
| | 0.3700% over $10 billion |
| |
U.S. Government Securities HLS Fund | | 0.4500% on first $500 million and; |
| | 0.4450% on next $500 million and; |
| | 0.4400% on next $1.5 billion and; |
| | 0.4350% on next $2.5 billion and; |
| | 0.4300% on next $5 billion and; |
| | 0.4200% over $10 billion |
| |
Value HLS Fund | | 0.6900% on first $250 million and; |
| | 0.6425% on next $250 million and; |
| | 0.6325% on next $500 million and; |
| | 0.6250% on next $1.5 billion and; |
| | 0.6200% on next $2.5 billion and; |
| | 0.6150% on next $5 billion and; |
| | 0.6100% over $10 billion |
| | * | HFMC contractually agreed to waive investment management fees of 0.03% of average daily net assets until December 31, 2018, for the Balanced HLS Fund. |
| | b) | Accounting Services Agreement– Pursuant to the Fund Accounting Agreement between HFMC and each Company, on behalf of its respective Funds, HFMC provides accounting services to each Fund and receives monthly compensation based on each Fund’s average daily net assets at the rates set forth below. Each Fund’s accounting services fees are accrued daily and paid monthly. |
| | | | |
Balanced HLS Fund, Capital Appreciation HLS Fund, Growth Opportunities HLS Fund,
Small Cap Growth HLS Fund, Small Company HLS Fund
and Total Return Bond HLS Fund | |
| Average Daily Net Assets | | Annual Fees | |
First $3.5 billion and; | | | 0.018% | |
Next $3.5 billion and | | | 0.014% | |
Amount over $7 billion | | | 0.010% | |
| |
Disciplined Equity HLS Fund, Dividend and Growth HLS Fund, Global Growth HLS Fund, Healthcare HLS Fund, High Yield HLS Fund,
International Opportunities HLS Fund, MidCap HLS Fund, MidCap Growth HLS Fund, MidCap Value HLS Fund, Stock HLS Fund,
U.S. Government Securities HLS Fund, Ultrashort Bond HLS Fund and Value HLS Fund | |
| Average Daily Net Assets | | Annual Fees | |
First $3.5 billion and; | | | 0.014% | |
Next $3.5 billion and | | | 0.012% | |
Amount over $7 billion | | | 0.010% | |
HFMC has delegated certain accounting and administrative services functions to State Street Bank and Trust Company (“State Street”). The costs and expenses of such delegation are borne by HFMC, not by the Funds, and HFMC compensates State Street for its services out of its own resources.
| | c) | Operating Expenses– Allocable expenses incurred by each Company are allocated to each series within such Company, and allocated to classes within each such series, in proportion to the average daily net assets of such series and classes, except where allocation of certain expenses is more fairly made directly to a Fund or to specific classes within a Fund. |
| | d) | Fees Paid Indirectly– Hartford HLS Series Fund II, Inc., on behalf of its series except U.S. Government Securities HLS Fund, and Hartford Series Fund, Inc., on behalf of its series except High Yield HLS Fund, Total Return Bond HLS Fund and Ultrashort Bond HLS Fund, have entered into agreements with State Street Global Markets, LLC and Russell Implementation Services, Inc. to partially recapture |
Notes to Financial Statements – (continued)
December 31, 2018
| | non-discounted trade commissions. Such rebates are used to pay a portion of the Funds’ expenses. In addition, the Funds’ custodian bank has agreed to reduce its fees when a Fund maintains cash on deposit in anon-interest-bearing custody account. For the year ended December 31, 2018, these amounts, if any, are included in the Statements of Operations. |
The ratio of expenses to average net assets in the accompanying financial highlights excludes the reduction in expenses related to fees paid indirectly. The annualized expense ratio after waivers reflecting the reduction for fees paid indirectly for the period is as follows:
| | | | | | | | | | | | |
Fund | | Class IA | | | Class IB | | | Class IC | |
Balanced HLS Fund | | | 0.63 | % | | | 0.88 | % | | | N/A | |
Capital Appreciation HLS Fund | | | 0.67 | % | | | 0.92 | % | | | 1.17 | % |
Disciplined Equity HLS Fund | | | 0.78 | % | | | 1.03 | % | | | N/A | |
Dividend and Growth HLS Fund | | | 0.68 | % | | | 0.93 | % | | | N/A | |
Global Growth HLS Fund | | | 0.80 | % | | | 1.05 | % | | | N/A | |
Growth Opportunities HLS Fund | | | 0.65 | % | | | 0.90 | % | | | 1.15 | % |
Healthcare HLS Fund | | | 0.89 | % | | | 1.14 | % | | | N/A | |
High Yield HLS Fund | | | 0.77 | % | | | 1.02 | % | | | N/A | |
International Opportunities HLS Fund | | | 0.73 | % | | | 0.98 | % | | | N/A | |
MidCap HLS Fund | | | 0.69 | % | | | 0.94 | % | | | N/A | |
MidCap Growth HLS Fund | | | 0.91 | % | | | 1.16 | % | | | N/A | |
MidCap Value HLS Fund | | | 0.85 | % | | | 1.10 | % | | | N/A | |
Small Cap Growth HLS Fund | | | 0.64 | % | | | 0.89 | % | | | N/A | |
Small Company HLS Fund | | | 0.78 | % | | | 1.03 | % | | | N/A | |
Stock HLS Fund | | | 0.51 | % | | | 0.76 | % | | | N/A | |
Total Return Bond HLS Fund | | | 0.51 | % | | | 0.76 | % | | | N/A | |
Ultrashort Bond HLS Fund | | | 0.45 | % | | | 0.70 | % | | | N/A | |
U.S. Government Securities HLS Fund | | | 0.52 | % | | | 0.77 | % | | | N/A | |
Value HLS Fund | | | 0.71 | % | | | 0.96 | % | | | N/A | |
| | e) | Distribution Plans for Class IB and Class IC Shares – Hartford Funds Distributors, LLC (“HFD”), an indirect subsidiary of The Hartford, is the principal underwriter and distributor of each Fund. Each Company, on behalf of its respective Funds, has adopted a Distribution Plan pursuant to Rule12b-1 of the 1940 Act for Class IB shares and each Company, on behalf of certain Funds, has adopted a Distribution Plan pursuant to Rule12b-1 of the 1940 Act for Class IC shares. |
Pursuant to the Class IB Distribution Plans, a Fund may pay HFD a fee of up to 0.25% of the average daily net assets of the Fund attributable to its Class IB shares for distribution financing activities and shareholder account servicing activities. The entire amount of the fee may be used for shareholder servicing expenses and/or distribution expenses. Pursuant to the Class IC Distribution Plans, a Fund may pay HFD a fee of up to 0.25% of the average daily net assets of the Fund attributable to its Class IC shares for distribution financing activities.
Each Board has the authority to suspend or reduce these payments at any point in time. The distribution fees paid during the period can be found on the Statements of Operations. Each Fund’s12b-1 fees are accrued daily and paid monthly or at such other intervals as the respective Company’s Board of Directors may determine.
| | f) | Administrative Services Fee for Class IC Shares– Certain Funds may pay an administrative services fee to third party insurance companies annually up to 0.25% of the average daily net assets of the Fund attributable to its Class IC shares for recordkeeping and/or other administrative services provided to such Class IC shares. The total administrative services fees paid during the period are shown on the Statements of Operations. These fees are accrued daily and paid monthly. |
| | g) | Other Related Party Transactions– Certain officers of each Company are directors and/or officers of HFMC and/or The Hartford or its subsidiaries. For the year ended December 31, 2018, a portion of each Company’s Chief Compliance Officer’s (“CCO”) compensation was paid by all of the investment companies in the Hartford fund complex. The portion allocated to each Fund, as represented in other expenses on the Statements of Operations, is outlined in the table below. |
| | | | |
Fund | | CCO Compensation
Paid by Fund | |
Balanced HLS Fund | | $ | 5,004 | |
Capital Appreciation HLS Fund | | | 10,768 | |
Disciplined Equity HLS Fund | | | 1,481 | |
Dividend and Growth HLS Fund | | | 7,593 | |
Global Growth HLS Fund | | | 1,158 | |
Growth Opportunities HLS Fund | | | 3,371 | |
Healthcare HLS Fund | | | 730 | |
High Yield HLS Fund | | | 636 | |
International Opportunities HLS Fund | | | 3,395 | |
Midcap HLS Fund | | | 4,872 | |
MidCap Growth HLS Fund | | | 208 | |
MidCap Value HLS Fund | | | 787 | |
Notes to Financial Statements – (continued)
December 31, 2018
| | | | |
Fund | | CCO Compensation
Paid by Fund | |
Small Cap Growth HLS Fund | | $ | 2,941 | |
Small Company HLS Fund | | | 1,359 | |
Stock HLS Fund | | | 3,226 | |
Total Return Bond HLS Fund | | | 5,065 | |
Ultrashort Bond HLS Fund | | | 1,125 | |
U.S. Government Securities HLS Fund | | | 850 | |
Value HLS Fund | | | 1,102 | |
Hartford Administrative Services Company (“HASCO”), an indirect subsidiary of The Hartford, provides transfer agent services to each Fund. Pursuant to a sub-transfer agency agreement between HASCO and DST Asset Manager Solutions, Inc. (“DST”), HASCO has delegated certain transfer agent, dividend disbursing agent and shareholder servicing agent functions to DST. The costs and expenses of such delegation are borne by HASCO, not by the Funds. Each Fund pays HASCO a fixed fee annually, plus out of pocket expenses for providing such services. The accrued amount shown in the Statements of Operations reflects the amounts charged by HASCO. These fees are accrued daily and paid monthly.
For the year ended December 31, 2018, the effective rate of compensation paid to HASCO for transfer agency services as a percentage of each Class’ average daily net assets is as follows:
| | | | | | | | | | | | |
Fund | | Class IA | | | Class IB | | | Class IC | |
Balanced HLS Fund | | | 0.00 | %* | | | 0.00 | %* | | | N/A | |
Capital Appreciation HLS Fund | | | 0.00 | %* | | | 0.00 | %* | | | 0.00 | %* |
Disciplined Equity HLS Fund | | | 0.00 | %* | | | 0.00 | %* | | | N/A | |
Dividend and Growth HLS Fund | | | 0.00 | %* | | | 0.00 | %* | | | N/A | |
Global Growth HLS Fund | | | 0.00 | %* | | | 0.00 | %* | | | N/A | |
Growth Opportunities HLS Fund | | | 0.00 | %* | | | 0.00 | %* | | | 0.00 | %* |
Healthcare HLS Fund | | | 0.00 | %* | | | 0.00 | %* | | | N/A | |
High Yield HLS Fund | | | 0.00 | %* | | | 0.00 | %* | | | N/A | |
International Opportunities HLS Fund | | | 0.00 | %* | | | 0.00 | %* | | | N/A | |
MidCap HLS Fund | | | 0.00 | %* | | | 0.00 | %* | | | N/A | |
MidCap Growth HLS Fund | | | 0.01 | % | | | 0.01 | % | | | N/A | |
MidCap Value HLS Fund | | | 0.00 | %* | | | 0.00 | %* | | | N/A | |
Small Cap Growth HLS Fund | | | 0.00 | %* | | | 0.00 | %* | | | N/A | |
Small Company HLS Fund | | | 0.00 | %* | | | 0.00 | %* | | | N/A | |
Stock HLS Fund | | | 0.00 | %* | | | 0.00 | %* | | | N/A | |
Total Return Bond HLS Fund | | | 0.00 | %* | | | 0.00 | %* | | | N/A | |
Ultrashort Bond HLS Fund | | | 0.00 | %* | | | 0.00 | %* | | | N/A | |
U.S. Government Securities HLS Fund | | | 0.00 | %* | | | 0.00 | %* | | | N/A | |
Value HLS Fund | | | 0.00 | %* | | | 0.00 | %* | | | N/A | |
| | * | Percentage rounds to zero. |
A Fund may lend portfolio securities to certain borrowers in U.S. andnon-U.S. markets in an amount not to exceed one-third (33 1/3%) of the value of its total assets. If a Fund security is on loan, under the lending agreement, the borrower is required to deposit cash or liquid securities as collateral at least equal to 100% of the market value of the loaned securities; cash collateral is invested for the benefit of the Fund by the Fund’s lending agent pursuant to collateral investment guidelines. The collateral is marked to market daily, in an amount at least equal to the current market value of the securities loaned.
A Fund is subject to certain risks while its securities are on loan, including the following: (i) the risk that the borrower defaults on the loan and the collateral is inadequate to cover the Fund’s loss; (ii) the risk that the earnings on the collateral invested are not sufficient to pay fees incurred in connection with the loan; (iii) the risk that the principal value of the collateral invested may decline; (iv) the risk that the borrower may use the loaned securities to cover a short sale, which may in turn place downward pressure on the market prices of the loaned securities; (v) the risk that return of loaned securities could be delayed and interfere with portfolio management decisions; and (vi) the risk that any efforts to restrict the securities for purposes of voting may not be effective. These events could also trigger adverse tax consequences for the Fund.
At December 31, 2018, the following Funds had securities on loan at market value, cash collateral andnon-cash collateral as follows:
| | | | | | | | | | | | |
Fund | | Market Value of
Securities on Loan(1) | | | Cash
Collateral | | | Non-Cash
Collateral(2)(3) | |
Balanced HLS Fund | | $ | 4,357,478 | | | $ | 4,505,697 | | | $ | — | |
Capital Appreciation HLS Fund | | | 12,788,151 | | | | 7,045,118 | | | | 6,176,088 | |
Dividend and Growth HLS Fund | | | — | | | | — | | | | 36,924 | (4) |
Global Growth HLS Fund | | | 952,122 | | | | 955,004 | | | | — | |
Growth Opportunities HLS Fund | | | 7,766,810 | | | | 7,889,516 | | | | — | |
Notes to Financial Statements – (continued)
December 31, 2018
| | | | | | | | | | | | |
Fund | | Market Value of
Securities on Loan(1) | | | Cash
Collateral | | | Non-Cash
Collateral(2)(3) | |
Healthcare HLS Fund | | $ | 3,181,546 | | | $ | 2,970,261 | | | $ | — | |
International Opportunities HLS Fund | | | 4,459,412 | | | | 53,200 | | | | 4,636,856 | |
MidCap HLS Fund | | | 17,020,702 | | | | 17,290,587 | | | | — | |
MidCap Growth HLS Fund | | | 406,720 | | | | 407,951 | | | | — | |
MidCap Value HLS Fund | | | 6,213,738 | | | | 2,064,156 | | | | 4,243,020 | |
Small Cap Growth HLS Fund | | | 43,530,718 | | | | 43,528,326 | | | | — | |
Small Company HLS Fund | | | 8,978,711 | | | | 9,034,495 | | | | — | |
Total Return Bond HLS Fund | | | 5,298,633 | | | | 5,545,320 | | | | — | |
Ultrashort Bond HLS Fund | | | 7,467,045 | | | | 7,631,270 | | | | — | |
| | (1) | It is each Fund’s policy to obtain additional collateral from, or return excess collateral to, the borrower by the end of the next business day following the valuation date of the securities loaned. Therefore, the value of the collateral held may be temporarily less than that required under the lending contract. |
| | (2) | These securities are held for the benefit of the Fund at the Fund’s custodian. The Fund cannot repledge or resell this collateral. As such, collateral is excluded from the Statement of Assets and Liabilities. |
| | (3) | U.S. Government securities. |
| | (4) | Non-cash collateral is returned to the counterparty after the settlement of securities on loan. As of December 31, 2018, the Fund was awaiting the return of the previously loaned position before the stated collateral is returned. |
The following table reflects a breakdown of transactions accounted for as secured borrowings, the gross obligation by the type of collateral pledged, and the remaining contractual maturity of those transactions as of December 31, 2018.
CERTAIN TRANSFERS ACCOUNTED FOR AS SECURED BORROWINGS
Remaining Contractual Maturity of the Agreements
| | | | | | | | | | | | | | | | | | | | |
| | | Overnight and
Continuous | | | <30 days | | | Between
30 & 90 days | | | >90 days | | | Total | |
| Balanced HLS Fund | | | | | | | | | | | | | | | |
Securities Lending Transactions(1) | | | | | | | | | | | | | | | | | | | | |
Corporate Bonds | | $ | 4,505,697 | | | $ | — | | | $ | — | | | $ | — | | | $ | 4,505,697 | |
| | | | | | | | | | | | | | | | | | | | |
Total Borrowings | | $ | 4,505,697 | | | $ | — | | | $ | — | | | $ | — | | | $ | 4,505,697 | |
| | | | | | | | | | | | | | | | | | | | |
Gross amount of recognized liabilities for securities lending transactions | | | | | | | | | | | | | | | | | | $ | 4,505,697 | |
| | | | | |
| | | | | |
| Capital Appreciation HLS Fund | | | | | | | | | | | | | | | |
Securities Lending Transactions(1) | | | | | | | | | | | | | | | | | | | | |
Common Stocks | | $ | 7,045,118 | | | $ | — | | | $ | — | | | $ | — | | | $ | 7,045,118 | |
| | | | | | | | | | | | | | | | | | | | |
Total Borrowings | | $ | 7,045,118 | | | $ | — | | | $ | — | | | $ | — | | | $ | 7,045,118 | |
| | | | | | | | | | | | | | | | | | | | |
Gross amount of recognized liabilities for securities lending transactions | | | $ | 7,045,118 | |
| | | | | |
| | | | | |
| Global Growth HLS Fund | | | | | | | | | | | | | | | |
Securities Lending Transactions(1) | | | | | | | | | | | | | | | | | | | | |
Common Stocks | | $ | 955,004 | | | $ | — | | | $ | — | | | $ | — | | | $ | 955,004 | |
| | | | | | | | | | | | | | | | | | | | |
Total Borrowings | | $ | 955,004 | | | $ | — | | | $ | — | | | $ | — | | | $ | 955,004 | |
| | | | | | | | | | | | | | | | | | | | |
Gross amount of recognized liabilities for securities lending transactions | | | | | | | | | | | | | | | | | | $ | 955,004 | |
| | | | | |
| | | | | |
| Growth Opportunities HLS Fund | | | | | | | | | | | | | | | |
Securities Lending Transactions(1) | | | | | | | | | | | | | | | | | | | | |
Common Stocks | | $ | 7,889,516 | | | $ | — | | | $ | — | | | $ | — | | | $ | 7,889,516 | |
| | | | | | | | | | | | | | | | | | | | |
Total Borrowings | | $ | 7,889,516 | | | $ | — | | | $ | — | | | $ | — | | | $ | 7,889,516 | |
| | | | | | | | | | | | | | | | | | | | |
Gross amount of recognized liabilities for securities lending transactions | | | $ | 7,889,516 | |
| | | | | |
| | | | | |
| Healthcare HLS Fund | | | | | | | | | | | | | | | |
Securities Lending Transactions(1) | | | | | | | | | | | | | | | | | | | | |
Common Stocks | | $ | 2,970,261 | | | $ | — | | | $ | — | | | $ | — | | | $ | 2,970,261 | |
| | | | | | | | | | | | | | | | | | | | |
Total Borrowings | | $ | 2,970,261 | | | $ | — | | | $ | — | | | $ | — | | | $ | 2,970,261 | |
| | | | | | | | | | | | | | | | | | | | |
Gross amount of recognized liabilities for securities lending transactions | | | $ | 2,970,261 | |
| | | | | |
| | | | | |
| International Opportunities HLS Fund | | | | | | | | | | | | | | | |
Securities Lending Transactions(1) | | | | | | | | | | | | | | | | | | | | |
Common Stocks | | $ | 53,200 | | | $ | — | | | $ | — | | | $ | — | | | $ | 53,200 | |
| | | | | | | | | | | | | | | | | | | | |
Total Borrowings | | $ | 53,200 | | | $ | — | | | $ | — | | | $ | — | | | $ | 53,200 | |
| | | | | | | | | | | | | | | | | | | | |
Gross amount of recognized liabilities for securities lending transactions | | | $ | 53,200 | |
| | | | | |
Notes to Financial Statements – (continued)
December 31, 2018
| | | | | | | | | | | | | | | | | | | | |
| | | Overnight and
Continuous | | | <30 days | | | Between
30 & 90 days | | | >90 days | | | Total | |
| MidCap HLS Fund | | | | | | | | | | | | | | | |
Securities Lending Transactions(1) | | | | | | | | | | | | | | | | | | | | |
Common Stocks | | $ | 17,290,587 | | | $ | — | | | $ | — | | | $ | — | | | $ | 17,290,587 | |
| | | | | | | | | | | | | | | | | | | | |
Total Borrowings | | $ | 17,290,587 | | | $ | — | | | $ | — | | | $ | — | | | $ | 17,290,587 | |
| | | | | | | | | | | | | | | | | | | | |
Gross amount of recognized liabilities for securities lending transactions | | | $ | 17,290,587 | |
| | | | | |
| | | | | |
| MidCap Growth HLS Fund | | | | | | | | | | | | | | | |
Securities Lending Transactions(1) | | | | | | | | | | | | | | | | | | | | |
Common Stocks | | $ | 407,951 | | | $ | — | | | $ | — | | | $ | — | | | $ | 407,951 | |
| | | | | | | | | | | | | | | | | | | | |
Total Borrowings | | $ | 407,951 | | | $ | — | | | $ | — | | | $ | — | | | $ | 407,951 | |
| | | | | | | | | | | | | | | | | | | | |
Gross amount of recognized liabilities for securities lending transactions | | | $ | 407,951 | |
| | | | | |
| | | | | |
| MidCap Value HLS Fund | | | | | | | | | | | | | | | |
Securities Lending Transactions(1) | | | | | | | | | | | | | | | | | | | | |
Common Stocks | | $ | 2,064,156 | | | $ | — | | | $ | — | | | $ | — | | | $ | 2,064,156 | |
| | | | | | | | | | | | | | | | | | | | |
Total Borrowings | | $ | 2,064,156 | | | $ | — | | | $ | — | | | $ | — | | | $ | 2,064,156 | |
| | | | | | | | | | | | | | | | | | | | |
Gross amount of recognized liabilities for securities lending transactions | | | | | | | | | | | | | | | | | | $ | 2,064,156 | |
| | | | | |
| | | | | |
| Small Cap Growth HLS Fund | | | | | | | | | | | | | | | |
Securities Lending Transactions(1) | | | | | | | | | | | | | | | | | | | | |
Common Stocks | | $ | 5,964,105 | | | $ | — | | | $ | — | | | $ | — | | | $ | 5,964,105 | |
Exchange-Traded Funds | | | 37,564,221 | | | | — | | | | — | | | | — | | | | 37,564,221 | |
| | | | | | | | | | | | | | | | | | | | |
Total | | $ | 43,528,326 | | | $ | — | | | $ | — | | | $ | — | | | $ | 43,528,326 | |
| | | | | | | | | | | | | | | | | | | | |
Total Borrowings | | $ | 43,528,326 | | | $ | — | | | $ | — | | | $ | — | | | $ | 43,528,326 | |
| | | | | | | | | | | | | | | | | | | | |
Gross amount of recognized liabilities for securities lending transactions | | | | | | | | | | | | | | | | | | $ | 43,528,326 | |
| | | | | |
| | | | | |
| Small Company HLS Fund | | | | | | | | | | | | | | | |
Securities Lending Transactions(1) | | | | | | | | | | | | | | | | | | | | |
Common Stocks | | $ | 9,034,495 | | | $ | — | | | $ | — | | | $ | — | | | $ | 9,034,495 | |
| | | | | | | | | | | | | | | | | | | | |
Total Borrowings | | $ | 9,034,495 | | | $ | — | | | $ | — | | | $ | — | | | $ | 9,034,495 | |
| | | | | | | | | | | | | | | | | | | | |
Gross amount of recognized liabilities for securities lending transactions | | | | | | | | | | | | | | | | | | $ | 9,034,495 | |
| | | | | |
| | | | | |
| Total Return Bond HLS Fund | | | | | | | | | | | | | | | |
Securities Lending Transactions(1) | |
Corporate Bonds | | $ | 5,545,320 | | | $ | — | | | $ | — | | | $ | — | | | $ | 5,545,320 | |
| | | | | | | | | | | | | | | | | | | | |
Total Borrowings | | $ | 5,545,320 | | | $ | — | | | $ | — | | | $ | — | | | $ | 5,545,320 | |
| | | | | | | | | | | | | | | | | | | | |
Gross amount of recognized liabilities for securities lending transactions | | | | | | | | | | | | | | | | | | $ | 5,545,320 | |
| | | | | |
| | | | | |
| Ultrashort Bond HLS Fund | | | | | | | | | | | | | | | |
Securities Lending Transactions(1) | | | | | | | | | | | | | | | | | | | | |
U.S. Government Securities | | $ | 7,631,270 | | | $ | — | | | $ | — | | | $ | — | | | $ | 7,631,270 | |
| | | | | | | | | | | | | | | | | | | | |
Total Borrowings | | $ | 7,631,270 | | | $ | — | | | $ | — | | | $ | — | | | $ | 7,631,270 | |
| | | | | | | | | | | | | | | | | | | | |
Gross amount of recognized liabilities for securities lending transactions | | | $ | 7,631,270 | |
| | | | | |
| | (1) | Amount represents the payable for cash collateral received on securities on loan. This will generally be in the “Overnight and Continuous” column as the securities are typically callable on demand. |
| 9. | Investment Transactions: |
For the year ended December 31, 2018, the cost of purchases and proceeds from sales of investment securities (excluding short-term investments) were as follows:
| | | | | | | | | | | | | | | | | | | | | | | | |
Fund | | Cost of Purchases
Excluding U.S.
Government
Obligations | | | Sales Proceeds
Excluding U.S.
Government
Obligations | | | Cost of Purchases
For U.S.
Government
Obligations | | | Sales Proceeds
For U.S.
Government
Obligations | | | Total Cost of
Purchases | | | Total Sales
Proceeds | |
Balanced HLS Fund | | $ | 576,912,519 | | | $ | 867,695,839 | | | $ | 96,548,940 | | | $ | 99,028,127 | | | $ | 673,461,459 | | | $ | 966,723,966 | |
Capital Appreciation HLS Fund | | | 3,397,882,147 | | | | 4,103,681,351 | | | | — | | | | — | | | | 3,397,882,147 | | | | 4,103,681,351 | |
Disciplined Equity HLS Fund | | | 141,976,052 | | | | 258,766,945 | | | | — | | | | — | | | | 141,976,052 | | | | 258,766,945 | |
Dividend and Growth HLS Fund | | | 946,949,195 | | | | 1,391,215,794 | | | | — | | | | — | | | | 946,949,195 | | | | 1,391,215,794 | |
Global Growth HLS Fund | | | 289,311,579 | | | | 343,484,081 | | | | — | | | | — | | �� | | 289,311,579 | | | | 343,484,081 | |
Notes to Financial Statements – (continued)
December 31, 2018
| | | | | | | | | | | | | | | | | | | | | | | | |
Fund | | Cost of Purchases
Excluding U.S.
Government
Obligations | | | Sales Proceeds
Excluding U.S.
Government
Obligations | | | Cost of Purchases
For U.S.
Government
Obligations | | | Sales Proceeds
For U.S.
Government
Obligations | | | Total Cost of
Purchases | | | Total Sales
Proceeds | |
Growth Opportunities HLS Fund | | $ | 1,831,365,844 | | | $ | 2,003,901,639 | | | $ | — | | | $ | — | | | $ | 1,831,365,844 | | | $ | 2,003,901,639 | |
Healthcare HLS Fund | | | 94,558,112 | | | | 134,108,698 | | | | — | | | | — | | | | 94,558,112 | | | | 134,108,698 | |
High Yield HLS Fund | | | 70,213,906 | | | | 93,461,879 | | | | — | | | | — | | | | 70,213,906 | | | | 93,461,879 | |
International Opportunities HLS Fund | | | 1,115,672,095 | | | | 1,314,433,860 | | | | — | | | | — | | | | 1,115,672,095 | | | | 1,314,433,860 | |
MidCap HLS Fund | | | 775,136,223 | | | | 1,044,063,643 | | | | — | | | | — | | | | 775,136,223 | | | | 1,044,063,643 | |
MidCap Growth HLS Fund | | | 146,421,607 | | | | 160,901,313 | | | | — | | | | — | | | | 146,421,607 | | | | 160,901,313 | |
MidCap Value HLS Fund | | | 144,314,253 | | | | 185,735,323 | | | | — | | | | — | | | | 144,314,253 | | | | 185,735,323 | |
Small Cap Growth HLS Fund | | | 1,134,516,913 | | | | 1,216,204,541 | | | | — | | | | — | | | | 1,134,516,913 | | | | 1,216,204,541 | |
Small Company HLS Fund | | | 609,683,505 | | | | 690,504,201 | | | | — | | | | — | | | | 609,683,505 | | | | 690,504,201 | |
Stock HLS Fund | | | 311,941,549 | | | | 481,695,942 | | | | — | | | | — | | | | 311,941,549 | | | | 481,695,942 | |
Total Return Bond HLS Fund | | | 641,216,612 | | | | 760,257,572 | | | | 518,436,747 | | | | 512,218,099 | | | | 1,159,653,359 | | | | 1,272,475,671 | |
Ultrashort Bond HLS Fund | | | 170,711,076 | | | | 205,192,173 | | | | 48,158,234 | | | | 88,510,055 | | | | 218,869,310 | | | | 293,702,228 | |
U.S. Government Securities HLS Fund | | | 25,613,909 | | | | 31,262,150 | | | | 124,523,539 | | | | 172,179,231 | | | | 150,137,448 | | | | 203,441,381 | |
Value HLS Fund | | | 135,225,174 | | | | 189,885,326 | | | | — | | | | — | | | | 135,225,174 | | | | 189,885,326 | |
| 10. | Capital Share Transactions: |
The following information is for the year ended December 31, 2018, and the year ended December 31, 2017:
| | | | | | | | | | | | | | | | |
| | | For the Year Ended
December 31, 2018 | | | For the Year Ended
December 31, 2017 | |
| | | Shares | | | Amount | | | Shares | | | Amount | |
| Balanced HLS Fund | | | | | | | | | | | | |
Class IA | | | | | | | | | | | | | | | | |
Shares Sold | | | 377,029 | | | $ | 11,576,568 | | | | 806,404 | | | $ | 24,243,642 | |
Shares Issued for Reinvested Dividends | | | 4,232,006 | | | | 123,979,008 | | | | 1,550,612 | | | | 47,464,119 | |
Shares Redeemed | | | (9,617,908 | ) | | | (296,172,690 | ) | | | (9,237,441 | ) | | | (271,385,497 | ) |
| | | | | | | | | | | | | | | | |
Net Increase (Decrease) | | | (5,008,873 | ) | | | (160,617,114 | ) | | | (6,880,425 | ) | | | (199,677,736 | ) |
| | | | | | | | | | | | | | | | |
Class IB | | | | | | | | | | | | | | | | |
Shares Sold | | | 194,734 | | | $ | 6,046,489 | | | | 98,155 | | | $ | 2,948,319 | |
Shares Issued for Reinvested Dividends | | | 526,962 | | | | 15,722,695 | | | | 178,485 | | | | 5,534,060 | |
Shares Redeemed | | | (1,312,276 | ) | | | (40,893,966 | ) | | | (1,359,464 | ) | | | (40,387,458 | ) |
| | | | | | | | | | | | | | | | |
Net Increase (Decrease) | | | (590,580 | ) | | | (19,124,782 | ) | | | (1,082,824 | ) | | | (31,905,079 | ) |
| | | | | | | | | | | | | | | | |
Total Net Increase (Decrease) | | | (5,599,453 | ) | | $ | (179,741,896 | ) | | | (7,963,249 | ) | | $ | (231,582,815 | ) |
| | | | | | | | | | | | | | | | |
| | | | |
| Capital Appreciation HLS Fund | | | | | | | | | | | | |
Class IA | | | | | | | | | | | | | | | | |
Shares Sold | | | 711,578 | | | $ | 32,492,124 | | | | 1,520,224 | | | $ | 69,676,765 | |
Shares Issued for Reinvested Dividends | | | 10,121,562 | | | | 454,718,791 | | | | 5,849,271 | | | | 280,000,593 | |
Shares Redeemed | | | (14,565,754 | ) | | | (701,373,697 | ) | | | (23,141,724 | ) | | | (1,078,423,340 | ) |
| | | | | | | | | | | | | | | | |
Net Increase (Decrease) | | | (3,732,614 | ) | | | (214,162,782 | ) | | | (15,772,229 | ) | | | (728,745,982 | ) |
| | | | | | | | | | | | | | | | |
Class IB | | | | | | | | | | | | | | | | |
Shares Sold | | | 110,197 | | | $ | 5,115,632 | | | | 111,613 | | | $ | 5,150,495 | |
Shares Issued for Reinvested Dividends | | | 1,249,788 | | | | 55,433,182 | | | | 742,165 | | | | 35,014,412 | |
Shares Redeemed | | | (2,349,094 | ) | | | (111,859,162 | ) | | | (2,304,465 | ) | | | (105,783,037 | ) |
| | | | | | | | | | | | | | | | |
Net Increase (Decrease) | | | (989,109 | ) | | | (51,310,348 | ) | | | (1,450,687 | ) | | | (65,618,130 | ) |
| | | | | | | | | | | | | | | | |
Class IC | | | | | | | | | | | | | | | | |
Shares Sold | | | 79,629 | | | $ | 3,804,757 | | | | 127,654 | | | $ | 5,935,733 | |
Shares Issued for Reinvested Dividends | | | 74,019 | | | | 3,306,482 | | | | 36,298 | | | | 1,722,982 | |
Shares Redeemed | | | (81,252 | ) | | | (3,859,522 | ) | | | (53,091 | ) | | | (2,473,932 | ) |
| | | | | | | | | | | | | | | | |
Net Increase (Decrease) | | | 72,396 | | | | 3,251,717 | | | | 110,861 | | | | 5,184,783 | |
| | | | | | | | | | | | | | | | |
Total Net Increase (Decrease) | | | (4,649,327 | ) | | $ | (262,221,413 | ) | | | (17,112,055 | ) | | $ | (789,179,329 | ) |
| | | | | | | | | | | | | | | | |
| | | | |
| Disciplined Equity HLS Fund | | | | | | | | | | | | |
Class IA | | | | | | | | | | | | | | | | |
Shares Sold | | | 418,081 | | | $ | 6,351,289 | | | | 283,728 | | | $ | 4,383,156 | |
Shares Issued for Reinvested Dividends | | | 3,963,155 | | | | 59,926,121 | | | | 4,779,020 | | | | 69,277,938 | |
Shares Redeemed | | | (7,184,640 | ) | | | (112,570,690 | ) | | | (6,394,841 | ) | | | (97,244,218 | ) |
| | | | | | | | | | | | | | | | |
Net Increase (Decrease) | | | (2,803,404 | ) | | | (46,293,280 | ) | | | (1,332,093 | ) | | | (23,583,124 | ) |
| | | | | | | | | | | | | | | | |
Notes to Financial Statements – (continued)
December 31, 2018
| | | | | | | | | | | | | | | | |
| | | For the Year Ended
December 31, 2018 | | | For the Year Ended
December 31, 2017 | |
| | | Shares | | | Amount | | | Shares | | | Amount | |
| Disciplined Equity HLS Fund – (continued) | | | | | | | | | | | | |
Class IB | | | | | | | | | | | | | | | | |
Shares Sold | | | 125,940 | | | $ | 1,915,988 | | | | 144,937 | | | $ | 2,190,277 | |
Shares Issued for Reinvested Dividends | | | 541,890 | | | | 8,120,313 | | | | 660,646 | | | | 9,451,480 | |
Shares Redeemed | | | (1,097,934 | ) | | | (16,926,882 | ) | | | (1,017,854 | ) | | | (15,281,872 | ) |
| | | | | | | | | | | | | | | | |
Net Increase (Decrease) | | | (430,104 | ) | | | (6,890,581 | ) | | | (212,271 | ) | | | (3,640,115 | ) |
| | | | | | | | | | | | | | | | |
Total Net Increase (Decrease) | | | (3,233,508 | ) | | $ | (53,183,861 | ) | | | (1,544,364 | ) | | $ | (27,223,239 | ) |
| | | | | | | | | | | | | | | | |
| | | | |
| Dividend and Growth HLS Fund | | | | | | | | | | | | |
Class IA | | | | | | | | | | | | | | | | |
Shares Sold | | | 2,238,948 | | | $ | 51,960,388 | | | | 4,155,891 | | | $ | 95,954,389 | |
Shares Issued for Reinvested Dividends | | | 16,643,249 | | | | 367,065,830 | | | | 11,597,227 | | | | 261,460,717 | |
Shares Redeemed | | | (20,816,118 | ) | | | (488,971,318 | ) | | | (19,421,429 | ) | | | (451,326,930 | ) |
| | | | | | | | | | | | | | | | |
Net Increase (Decrease) | | | (1,933,921 | ) | | | (69,945,100 | ) | | | (3,668,311 | ) | | | (93,911,824 | ) |
| | | | | | | | | | | | | | | | |
Class IB | | | | | | | | | | | | | | | | |
Shares Sold | | | 410,222 | | | $ | 9,509,461 | | | | 375,911 | | | $ | 8,685,861 | |
Shares Issued for Reinvested Dividends | | | 2,277,912 | | | | 50,078,265 | | | | 1,593,174 | | | | 35,652,495 | |
Shares Redeemed | | | (3,148,825 | ) | | | (72,751,751 | ) | | | (3,425,042 | ) | | | (79,084,752 | ) |
| | | | | | | | | | | | | | | | |
Net Increase (Decrease) | | | (460,691 | ) | | | (13,164,025 | ) | | | (1,455,957 | ) | | | (34,746,396 | ) |
| | | | | | | | | | | | | | | | |
Total Net Increase (Decrease) | | | (2,394,612 | ) | | $ | (83,109,125 | ) | | | (5,124,268 | ) | | $ | (128,658,220 | ) |
| | | | | | | | | | | | | | | | |
| | | | |
| Global Growth HLS Fund | | | | | | | | | | | | |
Class IA | | | | | | | | | | | | | | | | |
Shares Sold | | | 1,078,775 | | | $ | 31,212,233 | | | | 1,167,362 | | | $ | 30,260,457 | |
Shares Issued for Reinvested Dividends | | | 1,375,789 | | | | 38,893,548 | | | | 811,179 | | | | 20,798,629 | |
Shares Redeemed | | | (2,645,726 | ) | | | (75,484,691 | ) | | | (2,159,005 | ) | | | (55,663,972 | ) |
| | | | | | | | | | | | | | | | |
Net Increase (Decrease) | | | (191,162 | ) | | | (5,378,910 | ) | | | (180,464 | ) | | | (4,604,886 | ) |
| | | | | | | | | | | | | | | | |
Class IB | | | | | | | | | | | | | | | | |
Shares Sold | | | 195,826 | | | $ | 5,672,825 | | | | 205,454 | | | $ | 5,206,011 | |
Shares Issued for Reinvested Dividends | | | 261,598 | | | | 7,324,732 | | | | 156,643 | | | | 3,981,856 | |
Shares Redeemed | | | (574,093 | ) | | | (16,275,227 | ) | | | (611,170 | ) | | | (15,562,567 | ) |
| | | | | | | | | | | | | | | | |
Net Increase (Decrease) | | | (116,669 | ) | | | (3,277,670 | ) | | | (249,073 | ) | | | (6,374,700 | ) |
| | | | | | | | | | | | | | | | |
Total Net Increase (Decrease) | | | (307,831 | ) | | $ | (8,656,580 | ) | | | (429,537 | ) | | $ | (10,979,586 | ) |
| | | | | | | | | | | | | | | | |
| | | | |
| Growth Opportunities HLS Fund | | | | | | | | | | | | |
Class IA | | | | | | | | | | | | | | | | |
Shares Sold | | | 880,238 | | | $ | 34,499,287 | | | | 1,055,813 | | | $ | 35,715,356 | |
Shares Issued for Reinvested Dividends | | | 4,558,515 | | | | 183,161,141 | | | | 456,670 | | | | 16,106,761 | |
Shares Redeemed | | | (4,784,503 | ) | | | (194,145,164 | ) | | | (5,385,187 | ) | | | (187,447,545 | ) |
| | | | | | | | | | | | | | | | |
Net Increase (Decrease) | | | 654,250 | | | | 23,515,264 | | | | (3,872,704 | ) | | | (135,625,428 | ) |
| | | | | | | | | | | | | | | | |
Class IB | | | | | | | | | | | | | | | | |
Shares Sold | | | 247,857 | | | $ | 9,559,584 | | | | 226,887 | | | $ | 7,648,732 | |
Shares Issued for Reinvested Dividends | | | 558,990 | | | | 21,414,890 | | | | 55,466 | | | | 1,881,415 | |
Shares Redeemed | | | (728,619 | ) | | | (28,067,244 | ) | | | (837,366 | ) | | | (27,997,475 | ) |
| | | | | | | | | | | | | | | | |
Net Increase (Decrease) | | | 78,228 | | | | 2,907,230 | | | | (555,013 | ) | | | (18,467,328 | ) |
| | | | | | | | | | | | | | | | |
Class IC | | | | | | | | | | | | | | | | |
Shares Sold | | | 153,006 | | | $ | 6,010,543 | | | | 104,552 | | | $ | 3,540,640 | |
Shares Issued for Reinvested Dividends | | | 133,407 | | | | 5,228,239 | | | | 11,639 | | | | 403,653 | |
Shares Redeemed | | | (84,803 | ) | | | (3,367,405 | ) | | | (81,843 | ) | | | (2,819,857 | ) |
| | | | | | | | | | | | | | | | |
Net Increase (Decrease) | | | 201,610 | | | | 7,871,377 | | | | 34,348 | | | | 1,124,436 | |
| | | | | | | | | | | | | | | | |
Total Net Increase (Decrease) | | | 934,088 | | | $ | 34,293,871 | | | | (4,393,369 | ) | | $ | (152,968,320 | ) |
| | | | | | | | | | | | | | | | |
| | | | |
| Healthcare HLS Fund | | | | | | | | | | | | |
Class IA | | | | | | | | | | | | | | | | |
Shares Sold | | | 1,245,774 | | | $ | 29,306,376 | | | | 1,841,982 | | | $ | 44,835,798 | |
Shares Issued for Reinvested Dividends | | | 745,725 | | | | 17,636,397 | | | | 1,933,544 | | | | 42,557,293 | |
Shares Redeemed | | | (2,811,944 | ) | | | (65,218,731 | ) | | | (2,322,554 | ) | | | (54,827,732 | ) |
| | | | | | | | | | | | | | | | |
Net Increase (Decrease) | | | (820,445 | ) | | | (18,275,958 | ) | | | 1,452,972 | | | | 32,565,359 | |
| | | | | | | | | | | | | | | | |
Notes to Financial Statements – (continued)
December 31, 2018
| | | | | | | | | | | | | | | | |
| | | For the Year Ended
December 31, 2018 | | | For the Year Ended
December 31, 2017 | |
| | | Shares | | | Amount | | | Shares | | | Amount | |
| Healthcare HLS Fund – (continued) | | | | | | | | | | | | |
Class IB | | | | | | | | | | | | | | | | |
Shares Sold | | | 88,489 | | | $ | 1,970,210 | | | | 129,384 | | | $ | 2,994,650 | |
Shares Issued for Reinvested Dividends | | | 121,767 | | | | 2,726,361 | | | | 343,098 | | | | 7,184,474 | |
Shares Redeemed | | | (427,867 | ) | | | (9,515,201 | ) | | | (517,395 | ) | | | (11,565,478 | ) |
| | | | | | | | | | | | | | | | |
Net Increase (Decrease) | | | (217,611 | ) | | | (4,818,630 | ) | | | (44,913 | ) | | | (1,386,354 | ) |
| | | | | | | | | | | | | | | | |
Total Net Increase (Decrease) | | | (1,038,056 | ) | | $ | (23,094,588 | ) | | | 1,408,059 | | | $ | 31,179,005 | |
| | | | | | | | | | | | | | | | |
| | | | |
| High Yield HLS Fund | | | | | | | | | | | | |
Class IA | | | | | | | | | | | | | | | | |
Shares Sold | | | 1,286,518 | | | $ | 10,403,608 | | | | 1,551,820 | | | $ | 12,802,783 | |
Shares Issued for Reinvested Dividends | | | 1,614,321 | | | | 12,607,847 | | | | 1,763,487 | | | | 14,107,895 | |
Shares Redeemed | | | (5,381,959 | ) | | | (43,050,250 | ) | | | (5,352,490 | ) | | | (44,291,170 | ) |
| | | | | | | | | | | | | | | | |
Net Increase (Decrease) | | | (2,481,120 | ) | | | (20,038,795 | ) | | | (2,037,183 | ) | | | (17,380,492 | ) |
| | | | | | | | | | | | | | | | |
Class IB | | | | | | | | | | | | | | | | |
Shares Sold | | | 383,944 | | | $ | 3,004,028 | | | | 398,161 | | | $ | 3,249,143 | |
Shares Issued for Reinvested Dividends | | | 491,610 | | | | 3,775,566 | | | | 551,458 | | | | 4,345,488 | |
Shares Redeemed | | | (1,712,158 | ) | | | (13,431,228 | ) | | | (1,811,097 | ) | | | (14,711,242 | ) |
| | | | | | | | | | | | | | | | |
Net Increase (Decrease) | | | (836,604 | ) | | | (6,651,634 | ) | | | (861,478 | ) | | | (7,116,611 | ) |
| | | | | | | | | | | | | | | | |
Total Net Increase (Decrease) | | | (3,317,724 | ) | | $ | (26,690,429 | ) | | | (2,898,661 | ) | | $ | (24,497,103 | ) |
| | | | | | | | | | | | | | | | |
| | | | |
| International Opportunities HLS Fund | | | | | | | | | | | | |
Class IA | | | | | | | | | | | | | | | | |
Shares Sold | | | 7,906,986 | | | $ | 133,045,266 | | | | 14,013,729 | | | $ | 228,923,920 | |
Shares Issued for Reinvested Dividends | | | 1,511,466 | | | | 24,591,559 | | | | 1,165,749 | | | | 19,083,304 | |
Shares Redeemed | | | (18,708,966 | ) | | | (314,533,972 | ) | | | (10,831,010 | ) | | | (174,609,123 | ) |
| | | | | | | | | | | | | | | | |
Net Increase (Decrease) | | | (9,290,514 | ) | | | (156,897,147 | ) | | | 4,348,468 | | | | 73,398,101 | |
| | | | | | | | | | | | | | | | |
Class IB | | | | | | | | | | | | | | | | |
Shares Sold | | | 682,479 | | | $ | 11,438,242 | | | | 595,017 | | | $ | 9,615,544 | |
Shares Issued for Reinvested Dividends | | | 145,186 | | | | 2,394,120 | | | | 109,962 | | | | 1,824,269 | |
Shares Redeemed | | | (1,453,082 | ) | | | (24,718,563 | ) | | | (1,810,973 | ) | | | (29,172,721 | ) |
| | | | | | | | | | | | | | | | |
Net Increase (Decrease) | | | (625,417 | ) | | | (10,886,201 | ) | | | (1,105,994 | ) | | | (17,732,908 | ) |
| | | | | | | | | | | | | | | | |
Total Net Increase (Decrease) | | | (9,915,931 | ) | | $ | (167,783,348 | ) | | | 3,242,474 | | | $ | 55,665,193 | |
| | | | | | | | | | | | | | | | |
| | | | |
| MidCap HLS Fund | | | | | | | | | | | | |
Class IA | | | | | | | | | | | | | | | | |
Shares Sold | | | 6,486,190 | | | $ | 264,741,334 | | | | 9,676,572 | | | $ | 363,623,668 | |
Shares Issued for Reinvested Dividends | | | 5,086,106 | | | | 206,009,765 | | | | 2,534,154 | | | | 94,658,888 | |
Shares Redeemed | | | (12,978,019 | ) | | | (515,877,276 | ) | | | (9,315,330 | ) | | | (349,644,474 | ) |
| | | | | | | | | | | | | | | | |
Net Increase (Decrease) | | | (1,405,723 | ) | | | (45,126,177 | ) | | | 2,895,396 | | | | 108,638,082 | |
| | | | | | | | | | | | | | | | |
Class IB | | | | | | | | | | | | | | | | |
Shares Sold | | | 85,061 | | | $ | 3,436,405 | | | | 203,031 | | | $ | 7,530,954 | |
Shares Issued for Reinvested Dividends | | | 138,789 | | | | 5,470,747 | | | | 139,137 | | | | 5,084,893 | |
Shares Redeemed | | | (319,892 | ) | | | (12,588,252 | ) | | | (1,660,894 | ) | | | (64,348,851 | ) |
| | | | | | | | | | | | | | | | |
Net Increase (Decrease) | | | (96,042 | ) | | | (3,681,100 | ) | | | (1,318,726 | ) | | | (51,733,004 | ) |
| | | | | | | | | | | | | | | | |
Total Net Increase (Decrease) | | | (1,501,765 | ) | | $ | (48,807,277 | ) | | | 1,576,670 | | | $ | 56,905,078 | |
| | | | | | | | | | | | | | | | |
| | | | |
| MidCap Growth HLS Fund | | | | | | | | | | | | |
Class IA | | | | | | | | | | | | | | | | |
Shares Sold | | | 443,078 | | | $ | 3,855,962 | | | | 546,142 | | | $ | 4,524,831 | |
Shares Issued for Reinvested Dividends | | | 907,298 | | | | 7,929,782 | | | | 415,135 | | | | 3,287,870 | |
Shares Redeemed | | | (1,874,449 | ) | | | (16,135,241 | ) | | | (2,330,941 | ) | | | (19,299,802 | ) |
| | | | | | | | | | | | | | | | |
Net Increase (Decrease) | | | (524,073 | ) | | | (4,349,497 | ) | | | (1,369,664 | ) | | | (11,487,101 | ) |
| | | | | | | | | | | | | | | | |
Class IB | | | | | | | | | | | | | | | | |
Shares Sold | | | 103,365 | | | $ | 916,628 | | | | 206,491 | | | $ | 1,703,656 | |
Shares Issued for Reinvested Dividends | | | 158,237 | | | | 1,375,082 | | | | 69,948 | | | | 550,492 | |
Shares Redeemed | | | (362,990 | ) | | | (3,129,051 | ) | | | (724,359 | ) | | | (5,954,090 | ) |
| | | | | | | | | | | | | | | | |
Net Increase (Decrease) | | | (101,388 | ) | | | (837,341 | ) | | | (447,920 | ) | | | (3,699,942 | ) |
| | | | | | | | | | | | | | | | |
Total Net Increase (Decrease) | | | (625,461 | ) | | $ | (5,186,838 | ) | | | (1,817,584 | ) | | $ | (15,187,043 | ) |
| | | | | | | | | | | | | | | | |
Notes to Financial Statements – (continued)
December 31, 2018
| | | | | | | | | | | | | | | | |
| | | For the Year Ended
December 31, 2018 | | | For the Year Ended
December 31, 2017 | |
| | | Shares | | | Amount | | | Shares | | | Amount | |
| MidCap Value HLS Fund | | | | | | | | | | | | |
Class IA | | | | | | | | | | | | | | | | |
Shares Sold | | | 363,704 | | | $ | 4,488,869 | | | | 474,578 | | | $ | 5,861,095 | |
Shares Issued for Reinvested Dividends | | | 1,760,255 | | | | 20,921,640 | | | | 1,786,186 | | | | 20,308,940 | |
Shares Redeemed | | | (3,101,516 | ) | | | (37,927,053 | ) | | | (3,597,010 | ) | | | (44,123,512 | ) |
| | | | | | | | | | | | | | | | |
Net Increase (Decrease) | | | (977,557 | ) | | | (12,516,544 | ) | | | (1,336,246 | ) | | | (17,953,477 | ) |
| | | | | | | | | | | | | | | | |
Class IB | | | | | | | | | | | | | | | | |
Shares Sold | | | 55,809 | | | $ | 678,984 | | | | 91,141 | | | $ | 1,113,838 | |
Shares Issued for Reinvested Dividends | | | 497,931 | | | | 5,918,091 | | | | 534,256 | | | | 6,031,748 | |
Shares Redeemed | | | (961,412 | ) | | | (11,563,113 | ) | | | (1,189,202 | ) | | | (14,470,579 | ) |
| | | | | | | | | | | | | | | | |
Net Increase (Decrease) | | | (407,672 | ) | | | (4,966,038 | ) | | | (563,805 | ) | | | (7,324,993 | ) |
| | | | | | | | | | | | | | | | |
Total Net Increase (Decrease) | | | (1,385,229 | ) | | $ | (17,482,582 | ) | | | (1,900,051 | ) | | $ | (25,278,470 | ) |
| | | | | | | | | | | | | | | | |
| | | | |
| Small Cap Growth HLS Fund | | | | | | | | | | | | |
Class IA | | | | | | | | | | | | | | | | |
Shares Sold | | | 4,222,713 | | | $ | 140,276,410 | | | | 5,723,808 | | | $ | 165,058,843 | |
Shares Issued for Reinvested Dividends | | | 1,485,036 | | | | 51,501,062 | | | | 13,629 | | | | 391,968 | |
Shares Redeemed | | | (5,574,766 | ) | | | (183,058,917 | ) | | | (12,168,321 | ) | | | (365,607,978 | ) |
| | | | | | | | | | | | | | | | |
Net Increase (Decrease) | | | 132,983 | | | | 8,718,555 | | | | (6,430,884 | ) | | | (200,157,167 | ) |
| | | | | | | | | | | | | | | | |
Class IB | | | | | | | | | | | | | | | | |
Shares Sold | | | 1,901,268 | | | $ | 59,933,616 | | | | 5,928,739 | | | $ | 176,762,856 | |
Shares Issued for Reinvested Dividends | | | 690,752 | | | | 23,243,803 | | | | — | | | | — | |
Shares Redeemed | | | (2,517,531 | ) | | | (81,490,053 | ) | | | (2,636,397 | ) | | | (76,228,471 | ) |
| | | | | | | | | | | | | | | | |
Net Increase (Decrease) | | | 74,489 | | | | 1,687,366 | | | | 3,292,342 | | | | 100,534,385 | |
| | | | | | | | | | | | | | | | |
Total Net Increase (Decrease) | | | 207,472 | | | $ | 10,405,921 | | | | (3,138,542 | ) | | $ | (99,622,782 | ) |
| | | | | | | | | | | | | | | | |
| | | | |
| Small Company HLS Fund | | | | | | | | | | | | |
Class IA | | | | | | | | | | | | | | | | |
Shares Sold | | | 2,279,458 | | | $ | 49,529,365 | | | | 1,793,489 | | | $ | 32,075,623 | |
Shares Issued for Reinvested Dividends | | | 1,609,205 | | | | 37,253,096 | | | | — | | | | — | |
Shares Redeemed | | | (5,131,207 | ) | | | (111,785,237 | ) | | | (26,402,292 | ) | | | (469,703,430 | ) |
| | | | | | | | | | | | | | | | |
Net Increase (Decrease) | | | (1,242,544 | ) | | | (25,002,776 | ) | | | (24,608,803 | ) | | | (437,627,807 | ) |
| | | | | | | | | | | | | | | | |
Class IB | | | | | | | | | | | | | | | | |
Shares Sold | | | 282,487 | | | $ | 5,752,063 | | | | 223,321 | | | $ | 3,768,830 | |
Shares Issued for Reinvested Dividends | | | 188,065 | | | | 4,017,068 | | | | — | | | | — | |
Shares Redeemed | | | (747,252 | ) | | | (14,895,365 | ) | | | (2,064,656 | ) | | | (34,359,403 | ) |
| | | | | | | | | | | | | | | | |
Net Increase (Decrease) | | | (276,700 | ) | | | (5,126,234 | ) | | | (1,841,335 | ) | | | (30,590,573 | ) |
| | | | | | | | | | | | | | | | |
Total Net Increase (Decrease) | | | (1,519,244 | ) | | $ | (30,129,010 | ) | | | (26,450,138 | ) | | $ | (468,218,380 | ) |
| | | | | | | | | | | | | | | | |
| | | | |
| Stock HLS Fund | | | | | | | | | | | | |
Class IA | | | | | | | | | | | | | | | | |
Shares Sold | | | 72,515 | | | $ | 5,954,634 | | | | 82,347 | | | $ | 6,102,812 | |
Shares Issued for Reinvested Dividends | | | 265,343 | | | | 20,294,819 | | | | 299,255 | | | | 23,707,000 | |
Shares Redeemed | | | (2,271,073 | ) | | | (186,699,226 | ) | | | (2,491,889 | ) | | | (184,342,341 | ) |
| | | | | | | | | | | | | | | | |
Net Increase (Decrease) | | | (1,933,215 | ) | | | (160,449,773 | ) | | | (2,110,287 | ) | | | (154,532,529 | ) |
| | | | | | | | | | | | | | | | |
Class IB | | | | | | | | | | | | | | | | |
Shares Sold | | | 25,748 | | | $ | 2,171,547 | | | | 24,541 | | | $ | 1,800,010 | |
Shares Issued for Reinvested Dividends | | | 22,018 | | | | 1,685,834 | | | | 26,673 | | | | 2,111,519 | |
Shares Redeemed | | | (311,649 | ) | | | (25,637,685 | ) | | | (326,619 | ) | | | (24,082,015 | ) |
| | | | | | | | | | | | | | | | |
Net Increase (Decrease) | | | (263,883 | ) | | | (21,780,304 | ) | | | (275,405 | ) | | | (20,170,486 | ) |
| | | | | | | | | | | | | | | | |
Total Net Increase (Decrease) | | | (2,197,098 | ) | | $ | (182,230,077 | ) | | | (2,385,692 | ) | | $ | (174,703,015 | ) |
| | | | | | | | | | | | | | | | |
| | | | |
| Total Return Bond HLS Fund | | | | | | | | | | | | |
Class IA | | | | | | | | | | | | | | | | |
Shares Sold | | | 8,943,428 | | | $ | 98,737,562 | | | | 10,804,579 | | | $ | 121,912,379 | |
Shares Issued for Reinvested Dividends | | | 7,874,151 | | | | 84,804,607 | | | | 5,703,212 | | | | 64,104,099 | |
Shares Redeemed | | | (33,490,964 | ) | | | (367,229,305 | ) | | | (28,263,945 | ) | | | (319,063,315 | ) |
| | | | | | | | | | | | | | | | |
Net Increase (Decrease) | | | (16,673,385 | ) | | | (183,687,136 | ) | | | (11,756,154 | ) | | | (133,046,837 | ) |
| | | | | | | | | | | | | | | | |
Notes to Financial Statements – (continued)
December 31, 2018
| | | | | | | | | | | | | | | | |
| | | For the Year Ended
December 31, 2018 | | | For the Year Ended
December 31, 2017 | |
| | | Shares | | | Amount | | | Shares | | | Amount | |
| Total Return Bond HLS Fund – (continued) | | | | | | | | | | | | |
Class IB | | | | | | | | | | | | | | | | |
Shares Sold | | | 737,317 | | | $ | 8,103,146 | | | | 1,007,204 | | | $ | 11,336,689 | |
Shares Issued for Reinvested Dividends | | | 856,478 | | | | 9,181,448 | | | | 611,268 | | | | 6,840,084 | |
Shares Redeemed | | | (3,590,545 | ) | | | (39,142,701 | ) | | | (3,290,538 | ) | | | (36,973,156 | ) |
| | | | | | | | | | | | | | | | |
Net Increase (Decrease) | | | (1,996,750 | ) | | | (21,858,107 | ) | | | (1,672,066 | ) | | | (18,796,383 | ) |
| | | | | | | | | | | | | | | | |
Total Net Increase (Decrease) | | | (18,670,135 | ) | | $ | (205,545,243 | ) | | | (13,428,220 | ) | | $ | (151,843,220 | ) |
| | | | | | | | | | | | | | | | |
| | | | |
| Ultrashort Bond HLS Fund | | | | | | | | | | | | |
Class IA | | | | | | | | | | | | | | | | |
Shares Sold | | | 5,794,419 | | | $ | 58,434,281 | | | | 3,269,464 | | | $ | 32,898,341 | |
Shares Issued for Reinvested Dividends | | | 499,842 | | | | 5,018,414 | | | | 385,163 | | | | 3,863,181 | |
Shares Redeemed | | | (8,804,753 | ) | | | (88,776,912 | ) | | | (10,954,529 | ) | | | (110,225,740 | ) |
| | | | | | | | | | | | | | | | |
Net Increase (Decrease) | | | (2,510,492 | ) | | | (25,324,217 | ) | | | (7,299,902 | ) | | | (73,464,218 | ) |
| | | | | | | | | | | | | | | | |
Class IB | | | | | | | | | | | | | | | | |
Shares Sold | | | 1,496,586 | | | $ | 15,071,051 | | | | 766,654 | | | $ | 7,701,575 | |
Shares Issued for Reinvested Dividends | | | 53,416 | | | | 536,294 | | | | 35,217 | | | | 353,222 | |
Shares Redeemed | | | (1,634,853 | ) | | | (16,463,268 | ) | | | (2,138,208 | ) | | | (21,476,321 | ) |
| | | | | | | | | | | | | | | | |
Net Increase (Decrease) | | | (84,851 | ) | | | (855,923 | ) | | | (1,336,337 | ) | | | (13,421,524 | ) |
| | | | | | | | | | | | | | | | |
Total Net Increase (Decrease) | | | (2,595,343 | ) | | $ | (26,180,140 | ) | | | (8,636,239 | ) | | $ | (86,885,742 | ) |
| | | | | | | | | | | | | | | | |
| | | | |
| U.S. Government Securities HLS Fund | | | | | | | | | | | | |
Class IA | | | | | | | | | | | | | | | | |
Shares Sold | | | 1,738,359 | | | $ | 17,500,321 | | | | 2,103,061 | | | $ | 21,772,509 | |
Shares Issued for Reinvested Dividends | | | 716,309 | | | | 7,134,442 | | | | 729,790 | | | | 7,516,833 | |
Shares Redeemed | | | (6,266,754 | ) | | | (63,056,532 | ) | | | (6,323,266 | ) | | | (65,421,205 | ) |
| | | | | | | | | | | | | | | | |
Net Increase (Decrease) | | | (3,812,086 | ) | | | (38,421,769 | ) | | | (3,490,415 | ) | | | (36,131,863 | ) |
| | | | | | | | | | | | | | | | |
Class IB | | | | | | | | | | | | | | | | |
Shares Sold | | | 390,678 | | | $ | 3,920,475 | | | | 351,226 | | | $ | 3,626,856 | |
Shares Issued for Reinvested Dividends | | | 133,828 | | | | 1,332,927 | | | | 135,593 | | | | 1,395,250 | |
Shares Redeemed | | | (1,494,961 | ) | | | (14,988,690 | ) | | | (1,335,009 | ) | | | (13,785,552 | ) |
| | | | | | | | | | | | | | | | |
Net Increase (Decrease) | | | (970,455 | ) | | | (9,735,288 | ) | | | (848,190 | ) | | | (8,763,446 | ) |
| | | | | | | | | | | | | | | | |
Total Net Increase (Decrease) | | | (4,782,541 | ) | | $ | (48,157,057 | ) | | | (4,338,605 | ) | | $ | (44,895,309 | ) |
| | | | | | | | | | | | | | | | |
| | | | |
| Value HLS Fund | | | | | | | | | | | | |
Class IA | | | | | | | | | | | | | | | | |
Shares Sold | | | 769,369 | | | $ | 11,763,745 | | | | 695,794 | | | $ | 10,990,889 | |
Shares Issued for Reinvested Dividends | | | 3,182,011 | | | | 45,728,961 | | | | 2,611,798 | | | | 39,184,876 | |
Shares Redeemed | | | (4,476,365 | ) | | | (69,613,039 | ) | | | (4,444,508 | ) | | | (70,230,330 | ) |
| | | | | | | | | | | | | | | | |
Net Increase (Decrease) | | | (524,985 | ) | | | (12,120,333 | ) | | | (1,136,916 | ) | | | (20,054,565 | ) |
| | | | | | | | | | | | | | | | |
Class IB | | | | | | | | | | | | | | | | |
Shares Sold | | | 81,995 | | | $ | 1,246,473 | | | | 75,796 | | | $ | 1,195,727 | |
Shares Issued for Reinvested Dividends | | | 515,685 | | | | 7,417,890 | | | | 435,092 | | | | 6,498,111 | |
Shares Redeemed | | | (771,648 | ) | | | (11,962,532 | ) | | | (886,742 | ) | | | (13,949,988 | ) |
| | | | | | | | | | | | | | | | |
Net Increase (Decrease) | | | (173,968 | ) | | | (3,298,169 | ) | | | (375,854 | ) | | | (6,256,150 | ) |
| | | | | | | | | | | | | | | | |
Total Net Increase (Decrease) | | | (698,953 | ) | | $ | (15,418,502 | ) | | | (1,512,770 | ) | | $ | (26,310,715 | ) |
| | | | | | | | | | | | | | | | |
Each Fund participates in a committed line of credit pursuant to a credit agreement. Each Fund may borrow under the line of credit for temporary or emergency purposes. The Funds (together with certain other Hartford Funds) may borrow up to $400 million in the aggregate, subject to asset coverage and other limitations specified in the credit agreement. The interest rate on borrowings varies depending on the nature of the loan. The facility also charges a commitment fee, which is allocated to each of the funds participating in the line of credit based on average net assets of the funds. During and as of the year ended December 31, 2018, none of the Funds had borrowings under this facility.
Under each Company’s organizational documents, the Company shall indemnify its officers and directors to the full extent required or permitted under Maryland General Corporation Law and federal securities laws. In addition, each Company, on behalf of its respective Funds, may enter
Notes to Financial Statements – (continued)
December 31, 2018
into contracts that contain a variety of indemnifications. Each Company’s maximum exposure under these arrangements is unknown. However, as of the date of these financial statements, each Company has not had prior claims or losses pursuant to these contracts and expects the risk of loss to be remote.
| 13. | Recent Accounting Pronouncement: |
The FASB recently issued ASU2017-08 (the “ASU” or “Update”) to amend the amortization period to the earliest call date for purchased callable debt securities held at a premium. The ASU becomes effective for public entities for fiscal years beginning after December 15, 2018, and for private entities one year later. Management is currently evaluating the implication, if any, of additional disclosure and its impact on the Funds’ financial statements.
In August 2018, the FASB issued Accounting Standards Update2018-13, Fair Value Measurement (Topic 820): Disclosure Framework – Changes to the Disclosure Requirements for Fair Value Measurement (“ASU2018-13”). The update introduces new fair value disclosure requirements, eliminates some prior fair value disclosure requirements, and modifies certain existing fair value disclosure requirements.
ASU2018-13 is effective for fiscal years beginning after December 15, 2019 and for interim periods within those fiscal years, however, an entity is permitted to early adopt either the entire standard or only the provisions that eliminate or modify requirements. Management has elected to early adopt the provisions of ASU2018-13 that eliminate disclosure requirements effective with the current reporting period. The impact of the Funds’ early adoption of these provisions was limited to changes in the Funds’ financial statement disclosures regarding fair value, primarily those disclosures related to transfers between Level 1 and Level 2 of the fair value hierarchy and the timing of transfers between levels of the fair value hierarchy. Management is currently evaluating the potential impact of adopting the additional provisions of ASU2018-13.
In connection with the preparation of the financial statements of the Funds as of and for the year ended December 31, 2018, events and transactions subsequent to December 31, 2018, through the date the financial statements were issued have been evaluated by the Funds’ management for possible adjustment and/or disclosure. The following subsequent events requiring financial statement disclosure have been identified.
Effective January 1, 2019, HFMC agreed to extend the current contractual management fee waiver of 0.03% for the Balanced HLS Fund. In addition, effective January 1, 2019, HFMC agreed to waive 0.04% of the MidCap Value HLS Fund’s contractual management fee. Each of these contractual management fee waivers will remain in effect until April 30, 2020 unless the Board of Directors of Hartford Series Fund, Inc. approves its earlier termination.
|
| Report of Independent Registered Public Accounting Firm |
To the Shareholders and the Board of Directors of
Hartford Series Fund, Inc. and Hartford HLS Series Fund II, Inc.
Opinion on the Financial Statements
We have audited the accompanying statements of assets and liabilities of Hartford Series Fund, Inc. and Hartford HLS Series Fund II, Inc. (the “Companies”) (Hartford Series Fund, Inc. comprising Hartford Balanced HLS Fund, Hartford Capital Appreciation HLS Fund, Hartford Disciplined Equity HLS Fund, Hartford Dividend and Growth HLS Fund, Hartford Global Growth HLS Fund, Hartford Healthcare HLS Fund, Hartford High Yield HLS Fund, Hartford International Opportunities HLS Fund, Hartford MidCap HLS Fund, Hartford MidCap Value HLS Fund, Hartford Small Company HLS Fund, Hartford Stock HLS Fund, Hartford Total Return Bond HLS Fund, Hartford Ultrashort Bond HLS Fund, and Hartford Value HLS Fund and Hartford HLS Series Fund II, Inc. comprising Hartford Growth Opportunities HLS Fund, Hartford MidCap Growth HLS Fund (formerly, Hartford Small/Mid Cap Equity HLS Fund), Hartford Small Cap Growth HLS Fund, and Hartford U.S. Government Securities HLS Fund (collectively referred to as the “Funds”)), including the schedules of investments, as of December 31, 2018, and the related statements of operations for the year then ended, the statements of changes in net assets for each of the two years in the period then ended, the financial highlights for each of the five years in the period then ended and the related notes (collectively referred to as the “financial statements”). In our opinion, the financial statements present fairly, in all material respects, the financial position of each of the Funds comprising the Companies at December 31, 2018, the results of their operations for the year then ended, the changes in their net assets for each of the two years in the period then ended and their financial highlights for each of the five years in the period then ended, in conformity with U.S. generally accepted accounting principles.
Basis for Opinion
These financial statements are the responsibility of the Companies’ management. Our responsibility is to express an opinion on each of the Funds’ financial statements based on our audits. We are a public accounting firm registered with the Public Company Accounting Oversight Board (United States) (“PCAOB”) and are required to be independent with respect to the Companies in accordance with the U.S. federal securities laws and the applicable rules and regulations of the Securities and Exchange Commission and the PCAOB.
We conducted our audits in accordance with the standards of the PCAOB. Those standards require that we plan and perform the audits to obtain reasonable assurance about whether the financial statements are free of material misstatement, whether due to error or fraud. The Companies are not required to have, nor were we engaged to perform, audits of the Companies’ internal control over financial reporting. As part of our audits, we are required to obtain an understanding of internal control over financial reporting, but not for the purpose of expressing an opinion on the effectiveness of the Companies’ internal control over financial reporting. Accordingly, we express no such opinion.
Our audits included performing procedures to assess the risks of material misstatement of the financial statements, whether due to error or fraud, and performing procedures that respond to those risks. Such procedures included examining, on a test basis, evidence regarding the amounts and disclosures in the financial statements. Our procedures included confirmation of securities owned as of December 31, 2018, by correspondence with the custodian and others or by other appropriate auditing procedures where replies from others were not received. Our audits also included evaluating the accounting principles used and significant estimates made by management, as well as evaluating the overall presentation of the financial statements. We believe that our audits provide a reasonable basis for our opinion.

We have served as the auditor of one or more Hartford investment companies since 2002.
Philadelphia, Pennsylvania
February 20, 2019
Directors and Officers of Each Company (Unaudited)
Each of Hartford Series Fund, Inc. and Hartford HLS Series Fund II, Inc. (each a, “Company”) is governed by a Board of Directors (the “Directors”). The following tables present certain information regarding the Directors and officers of each Company as of December 31, 2018. For more information regarding the Directors and officers, please refer to the Statement of Additional Information, which is available, without charge, upon request bycalling 1-888-843-7824.
| | | | | | | | | | |
NAME, YEAR OF BIRTH
AND ADDRESS(1) | | POSITION
HELD WITH
EACH COMPANY | | TERM OF
OFFICE(2) AND
LENGTH OF
TIME SERVED | | PRINCIPAL OCCUPATION(S)
DURING PAST 5 YEARS | | NUMBER OF
PORTFOLIOS
IN FUND
COMPLEX(3)
OVERSEEN
BY DIRECTOR | | OTHER DIRECTORSHIPS
FOR PUBLIC COMPANIES
AND OTHER REGISTERED
INVESTMENT COMPANIES
HELD BY DIRECTOR |
| NON-INTERESTED DIRECTORS |
| | | | | |
HILARY E. ACKERMANN (1956) | | Director | | Since 2014 | | Ms. Ackermann served as Chief Risk Officer at Goldman Sachs Bank USA from October 2008 to November 2011. Ms. Ackermann has served as a Director of Vistra Energy Corporation, formerly known as Dynegy, Inc. (an independent power company) since October 2012 and as a Director of Credit Suisse Holdings (USA), Inc. since January 2017. | | 83 | | None |
| | | | | |
ROBIN C. BEERY (1967) | | Director | | Since 2017 | | Ms. Beery has served as a consultant to ArrowMark Partners (an alternative asset manager) since March of 2015 and since November 2018 has been employed by ArrowMark Partners as a Senior Advisor. Previously, she was Executive Vice President, Head of Distribution, for Janus Capital Group, and Chief Executive Officer and President of the Janus Mutual Funds (a global asset manager) from September 2009 to August 2014. | | 83 | | Ms. Beery serves as a Director of UMB Financial Corporation (January 2015 to present). |
| | | | | |
LYNN S. BIRDSONG (1946) | | Director | | Since 2003 | | Mr. Birdsong currently serves as a Director of Aberdeen Global and Aberdeen Global II (investment funds) (since September 2014), Aberdeen Islamic SICAV and Aberdeen Liquidity Fund (investment funds) (since 2016), and Aberdeen Alpha Fund (since December 2017). Mr. Birdsong served as an Independent Director of Nomura Partners Funds, Inc. (formerly, The Japan Fund) (April 2003 to February 2015) and as a Director of the Sovereign High Yield Investment Company (April 2010 to June 2014). From 2003 to March 2005, Mr. Birdsong was an Independent Director of the Atlantic Whitehall Funds. From 1979 to 2002, Mr. Birdsong was a Managing Director of Zurich Scudder Investments, an investment management firm. During his employment with Scudder, Mr. Birdsong was an Interested Director of The Japan Fund. From January 1981 through December 2013, Mr. Birdsong was a partner in Birdsong Company, an advertising specialty firm. | | 83 | | None |
| | | | | |
CHRISTINE R. DETRICK (1958) | | Director | | Since 2016 | | Ms. Detrick has served as a Director of Reinsurance Group of America since January 2014. Previously, she was a director of Forest City Realty Trust (a real estate company) from November 2014 to March 2018, a Director of Forethought Financial Group, Inc. (a financial services company) from January 2012 to January 2014, and a Senior Partner/Advisor at Bain & Company (a management consulting firm) from September 2002 to December 2012. | | 83 | | None
|
| | | | | |
DUANE E. HILL (1945) | | Director | | Since 2001(4) Since 2002(5) | | Mr. Hill is a Partner of TSG Ventures L.P., a private equity investment company. Mr. Hill is a former partner of TSG Capital Group, a private equity investment firm that served as sponsor and lead investor in leveraged buyouts of middle market companies. | | 83 | | None |
Directors and Officers of Each Company (Unaudited) – (continued)
| | | | | | | | | | |
NAME, YEAR OF BIRTH
AND ADDRESS(1) | | POSITION
HELD WITH
EACH COMPANY | | TERM OF
OFFICE(2) AND
LENGTH OF
TIME SERVED | | PRINCIPAL OCCUPATION(S)
DURING PAST 5 YEARS | | NUMBER OF
PORTFOLIOS
IN FUND
COMPLEX(3)
OVERSEEN
BY DIRECTOR | | OTHER DIRECTORSHIPS
FOR PUBLIC COMPANIES
AND OTHER REGISTERED
INVESTMENT COMPANIES
HELD BY DIRECTOR |
| | | | | |
WILLIAM P. JOHNSTON (1944) | | Director and Chairman of the Board | | Director since 2005 and Chairman of the Board since 2015 | | In June 2006, Mr. Johnston was appointed as Senior Advisor to The Carlyle Group, a global private equity and other alternative asset investment firm and currently serves as an Operating Executive. In August 2007, Mr. Johnston was elected to the Board of Directors of LifeCare Holdings, Inc. and served until June 2013. In February 2008, Mr. Johnston was elected to the Board of Directors ofHCR-ManorCare, Inc. and served until July 2018. In July 2006, Mr. Johnston was elected to the Board of Directors of MultiPlan, Inc. and served as a Director until August 2010. In May 2006, Mr. Johnston was elected to the Supervisory Board of Fresenius Medical Care AG & Co. KGaA, after its acquisition of Renal Care Group, Inc. in March 2006. Mr. Johnston joined Renal Care Group in November 2002 as a member of the Board of Directors and served as Chairman of the Board from March 2003 through March 2006. From 2002 through 2013, Mr. Johnston served as a Board member of the Georgia O’Keefe Museum. From September 1987 to December 2002, Mr. Johnston was with Equitable Securities Corporation (and its successors, SunTrust Equitable Securities and SunTrust Robinson Humphrey) serving in various investment banking and managerial positions, including Managing Director and Head of Investment Banking, Chief Executive Officer and Vice Chairman. | | 83 | | None |
| | | | | |
PHILLIP O. PETERSON (1944) | | Director | | Since 2002(4) Since 2000(5) | | Mr. Peterson is a mutual fund industry consultant. He was a partner of KPMG LLP (an accounting firm) until July 1999. From February 2007 to February 2018, Mr. Peterson served as a member of the Board of Trustees of the William Blair Funds. From February 2012 to February 2014, Mr. Peterson served as a Trustee of Symetra Variable Mutual Funds. From January 2004 to April 2005, Mr. Peterson served as Independent President of the Strong Mutual Funds. | | 83 | | None |
| | | | | |
LEMMA W. SENBET (1946) | | Director | | Since 2005 | | Dr. Senbet currently serves as the William E. Mayer Chair Professor of Finance, and previously was the Founding Director, Center for Financial Policy, in the Robert H. Smith School of Business at the University of Maryland. He was chair of the Finance Department Robert H. Smith School of Business at the University of Maryland from 1998 to 2006. In June 2013, he began a sabbatical from the University to serve as Executive Director of the African Economic Research Consortium which focuses on economic policy research and training, which he completed in 2018. Previously, he was a chaired professor of finance at the University of Wisconsin-Madison. Also, he was a Director of the Fortis Funds from March 2000 to July 2002. Dr. Senbet served as Director of the American Finance Association and President of the Western Finance Association. In 2006, Dr. Senbet was inducted Fellow of Financial Management Association International for his career-long distinguished scholarship and professional service. | | 83 | | None |
| | | | | |
DAVID SUNG (1953) | | Director | | Since 2017 | | Mr. Sung has served as a Director of Nippon Wealth Bank since April 2015 and CITIC-Prudential Fund Management Company, Inc. since January 2016. Mr. Sung is an Independent Director of seven investment funds, including twoclosed-end registered investment companies, sponsored by Ironwood Capital Management. Previously, he was a Partner at Ernst & Young LLP from October 1995 to July 2014. | | 83 | | Mr. Sung serves as a Trustee of Ironwood Institutional Multi-Strategy Fund, LLC and Ironwood Multi-Strategy Fund, LLC (October 2015 to present) (2 portfolios). |
Directors and Officers of Each Company (Unaudited) – (continued)
| | | | | | | | | | |
NAME, YEAR OF BIRTH
AND ADDRESS(1) | | POSITION
HELD WITH
EACH COMPANY | | TERM OF
OFFICE(2) AND
LENGTH OF
TIME SERVED | | PRINCIPAL OCCUPATION(S)
DURING PAST 5 YEARS | | NUMBER OF
PORTFOLIOS
IN FUND
COMPLEX(3)
OVERSEEN
BY DIRECTOR | | OTHER DIRECTORSHIPS
FOR PUBLIC COMPANIES
AND OTHER REGISTERED
INVESTMENT COMPANIES
HELD BY DIRECTOR |
| OFFICERS AND INTERESTED DIRECTORS | | | | |
| | | | | |
JAMES E. DAVEY(6) (1964) | | Director, President and Chief Executive Officer | | President and Chief Executive Officer since 2010; Director since 2012 | | Mr. Davey serves as Executive Vice President of The Hartford Financial Services Group, Inc. Additionally, Mr. Davey serves as Chairman of the Board, Manager, and Senior Managing Director of Hartford Funds Distributors, LLC (“HFD”). He also currently serves as Director, Chairman of the Board, President and Senior Managing Director of Hartford Administrative Services Company (“HASCO”). Mr. Davey also serves as President, Manager, Chairman of the Board, and Senior Managing Director for Hartford Funds Management Company, LLC (“HFMC”), and Director, Chairman, President, and Senior Managing Director for Hartford Funds Management Group, Inc. (“HFMG”). Mr. Davey also serves as Manager, Chairman of the Board, and President of Lattice Strategies LLC (since July 2016). Mr. Davey has served in various positions within The Hartford and its subsidiaries in connection with the operation of the Hartford Funds. Mr. Davey joined The Hartford in 2002. | | 83 | | None |
| | | | | |
ANDREW S. DECKER (1963)
| | AML Compliance Officer | | Since 2015 | | Mr. Decker serves as Chief Compliance Officer and AML Compliance Officer of HASCO (since April 2015) and Vice President of HASCO (since April 2018). Mr. Decker serves as AML Officer of HFD (since May 2015). Mr. Decker also serves as Vice President of HFMG (since April 2018). Prior to joining The Hartford, Mr. Decker served as Vice President and AML Officer at Janney Montgomery Scott (a broker dealer) from April 2011 to January 2015. Mr. Decker served as AML Compliance and Sanctions Enforcement Officer at SEI Investments from December 2007 to April 2011. | | N/A | | N/A |
| | | | | |
AMY N. FURLONG (1979) | | Vice President and Treasurer | | Since 2018 | | Ms. Furlong has served in various positions within The Hartford and its subsidiaries in connection with the operation of the Hartford Funds. Ms. Furlong joined The Hartford in 2004. Prior to joining The Hartford, Ms. Furlong worked at KPMG LLP in audit services. | | N/A | | N/A |
| | | | | |
WALTER F. GARGER (1965) | | Vice President and Chief Legal Officer | | Since 2016 | | Mr. Garger serves as Secretary, Managing Director and General Counsel of HFD, HASCO, HFMC and HFMG (since 2013). Mr. Garger also serves as Secretary and General Counsel of Lattice Strategies LLC (since July 2016). Mr. Garger has served in various positions within The Hartford and its subsidiaries in connection with the operation of the Hartford Funds. Mr. Garger joined The Hartford in 1995. | | N/A | | N/A |
| | | | | |
ALBERT Y. LEE (1979) | | Vice President and Assistant Treasurer | | Since 2017 | | Mr. Lee serves as Head of Systemic Strategies and ETF Operations and Senior Vice President of HFMG (since July 2016). Mr. Lee also serves as Senior Vice President of Lattice Strategies LLC (since June 2017). Previously, Mr. Lee served as Managing Director and Chief Operating Officer, Lattice Strategies LLC (2009-2016); Chief Operating Officer at Avicenna Capital Management (2007-2009); and Chief Financial Officer at Steeple Capital LP (2005-2007). | | N/A | | N/A |
| | | | | |
THEODORE J. LUCAS (1966) | | Vice President | | Since 2017 | | Mr. Lucas serves as Executive Vice President of HFMG (since July 2016) and as Executive Vice President of Lattice Strategies LLC (since June 2017). Previously, Mr. Lucas served as Managing Partner of Lattice Strategies LLC (2003 to 2016). | | N/A | | N/A |
Directors and Officers of Each Company (Unaudited) – (continued)
| | | | | | | | | | |
NAME, YEAR OF BIRTH
AND ADDRESS(1) | | POSITION
HELD WITH
EACH COMPANY | | TERM OF
OFFICE(2) AND
LENGTH OF
TIME SERVED | | PRINCIPAL OCCUPATION(S)
DURING PAST 5 YEARS | | NUMBER OF
PORTFOLIOS
IN FUND
COMPLEX(3)
OVERSEEN
BY DIRECTOR | | OTHER DIRECTORSHIPS
FOR PUBLIC COMPANIES
AND OTHER REGISTERED
INVESTMENT COMPANIES
HELD BY DIRECTOR |
| | | | | |
JOSEPH G. MELCHER (1973) | | Vice President and Chief Compliance Officer | | Since 2013 | | Mr. Melcher serves as President (since April 2018), Chief Executive Officer (since April 2018) and Executive Vice President (since December 2013) of HFD. He also serves as Executive Vice President of HFMG and HASCO (since December 2013). Mr. Melcher also serves as Executive Vice President (since December 2013) and Chief Compliance Officer (since December 2012) of HFMC. Mr. Melcher also serves as Executive Vice President and Chief Compliance Officer of Lattice Strategies, LLC (since July 2016). Mr. Melcher has served in various positions within The Hartford and its subsidiaries in connection with the operation of the Hartford Funds since joining The Hartford in 2012. Prior to joining The Hartford, Mr. Melcher worked at Touchstone Investments, a member of the Western & Southern Financial Group, where he held the position of Vice President and Chief Compliance Officer from 2010 through 2012 and Assistant Vice President, Compliance from 2005 to 2010. | | N/A | | N/A |
| | | | | |
VERNON J. MEYER (1964) | | Vice President | | Since 2006 | | Mr. Meyer serves as Managing Director and Chief Investment Officer of HFMC and Managing Director of HFMG (since 2013). Mr. Meyer has served in various positions within The Hartford and its subsidiaries in connection with the operation of the Hartford Funds. Mr. Meyer joined The Hartford in 2004. | | N/A | | N/A |
| | | | | |
ALICE A. PELLEGRINO (1960) | | Vice President | | Since 2016 | | Ms. Pellegrino serves as Vice President of HFMG (since December 2013). Ms. Pellegrino also serves as Vice President and Assistant Secretary of Lattice Strategies LLC (since June 2017). Ms. Pellegrino is a Senior Counsel and has served in various positions within The Hartford and its subsidiaries in connection with the operation of the Hartford Funds. Ms. Pellegrino joined The Hartford in 2007. | | N/A | | N/A |
| | | | | |
THOMAS R. PHILLIPS (1960) | | Vice President and Secretary | | Since 2017 | | Mr. Phillips currently serves as Vice President (since February 2017) and Assistant Secretary (since June 2017) for HFMG. Mr. Phillips is a Senior Counsel for HFMG. Prior to joining HFMG in 2017, Mr. Phillips was a Director and Chief Legal Officer of Saturna Capital Corporation from 2014–2016. Prior to that, Mr. Phillips was a Partner and Deputy General Counsel of Lord, Abbett & Co. LLC. | | N/A | | N/A |
| | | | | |
LAURA S. QUADE (1969) | | Vice President | | Since 2012 | | Ms. Quade currently serves as Vice President of HASCO and is the Head of Operations of HASCO. Ms. Quade also serves as Vice President of HFD and HFMG (since December 2013). From February 2018 to May 14, 2018, Ms. Quade served as Treasurer of each Company. Formerly, Ms. Quade served as Director, Enterprise Operations of Hartford Life Insurance Company from April 2012 through December 2013. Ms. Quade has served in various positions within The Hartford and its subsidiaries in connection with the operation of the Hartford Funds. Ms. Quade joined The Hartford in 2001. | | N/A | | N/A |
| (1) | The address for each officer and Director is c/o Hartford Funds 690 Lee Road, Wayne, PA 19087. |
| (2) | Each Director holds an indefinite term until the earlier of (i) the election and qualification of his or her successor or (ii) when the Director turns 75 years of age. Each officer shall serve until his or her successor is elected and qualifies. |
| (3) | The portfolios of the “Fund Complex” are series of The Hartford Mutual Funds, Inc., The Hartford Mutual Funds II, Inc., Hartford Series Fund, Inc., Hartford HLS Series Fund II, Inc., Hartford Funds Master Fund, Lattice Strategies Trust, Hartford Funds Exchange-Traded Trust, and Hartford Funds NextShares Trust. |
| (4) | For Hartford Series Fund, Inc. |
| (5) | For Hartford HLS Series Fund II, Inc. |
| (6) | “Interested person,” as defined in the 1940 Act, of each Company because of the person’s affiliation with, or equity ownership of, HFMC, HFD or affiliated companies. |
HOW TO OBTAIN A COPY OF EACH FUND’S PROXY VOTING POLICIES AND VOTING RECORDS (UNAUDITED)
A description of the policies and procedures that each Fund uses to determine how to vote proxies relating to portfolio securities and information about how each Fund voted proxies relating to portfolio securities during the most recent twelve-month period ended June 30, are available (1) without charge, upon request, by calling888-843-7824 and (2) on the SEC’s website at http://www.sec.gov.
QUARTERLY PORTFOLIO HOLDINGS INFORMATION (UNAUDITED)
Each Fund files a complete schedule of portfolio holdings with the SEC for the first and third quarters of each fiscal year on FormN-Q. Each Fund’s FormsN-Q are available (1) without charge, upon request, by calling888-843-7824 and (2) on the SEC’s website at http://www.sec.gov.
Approval of Investment Management and InvestmentSub-Advisory Agreements (Unaudited)
Hartford Series Fund, Inc. and Hartford HLS Series Fund II, Inc.
Hartford Balanced HLS Fund
Hartford Capital Appreciation HLS Fund
Hartford Disciplined Equity HLS Fund
Hartford Dividend and Growth HLS Fund
Hartford Global Growth HLS Fund
Hartford Growth Opportunities HLS Fund
Hartford Healthcare HLS Fund
Hartford High Yield HLS Fund
Hartford International Opportunities HLS Fund
Hartford MidCap Growth HLS Fund (formerly, Hartford Small/Mid Cap Equity HLS Fund)
Hartford MidCap HLS Fund
Hartford MidCap Value HLS Fund
Hartford Small Cap Growth HLS Fund
Hartford Small Company HLS Fund
Hartford Stock HLS Fund
Hartford Total Return Bond HLS Fund
Hartford Ultrashort Bond HLS Fund
Hartford U.S. Government Securities HLS Fund
Hartford Value HLS Fund
Section 15(c) of the Investment Company Act of 1940, as amended (the “1940 Act”), requires that each mutual fund’s board of directors, including a majority of those directors who are not “interested persons” of the mutual fund, as defined in the 1940 Act (the “Independent Directors”), annually review and consider the continuation of the mutual fund’s investment advisory andsub-advisory agreements. At their meeting held on August7-8, 2018, the Boards of Directors (collectively, the “Board”) of Hartford Series Fund, Inc. (“HLS”) and Hartford HLS Series Fund II, Inc. (“HLS II”), including each of the Independent Directors, unanimously voted to approve (i) the continuation of an investment management agreement (the “Management Agreement”) by and between HLS and HLS II, on behalf of each of their respective funds listed above (each a “Fund” and collectively, the “Funds”), and Hartford Funds Management Company, LLC (“HFMC”); and (ii) the continuation of investmentsub-advisory agreements (each, a“Sub-Advisory Agreement” and collectively with the Management Agreement, the “Agreements”) between HFMC and each Fund’ssub-adviser, Wellington Management Company LLP (the“Sub-adviser,” and together with HFMC, the “Advisers”) on behalf of each of HLS and HLS II, as applicable.
In the months preceding the August7-8, 2018 meeting, the Board requested and reviewed written responses from the Advisers to questions posed to the Advisers on behalf of the Independent Directors and supporting materials relating to those questions and responses. In addition, the Board considered such additional information as it deemed reasonably necessary to evaluate the Agreements, as applicable, with respect to each Fund, which included information furnished to the Board at its meetings throughout the year, as well as information specifically prepared in connection with the approval of the Agreements that was presented at the Board’s meetings held on June19-20, 2018 and August7-8, 2018. Information provided to the Board at its meetings throughout the year included, among other things, reports on Fund performance, legal, compliance and risk management matters, sales and marketing activity, shareholder services, and the other services provided to each Fund by the Advisers and their affiliates. The Board also considered the materials andin-person presentations by Fund officers and representatives of HFMC received at the Board’s meetings on June19-20, 2018 and August7-8, 2018 concerning the Agreements.
The Independent Directors, advised by independent legal counsel, engaged service providers to assist them with evaluating the Agreements with respect to each Fund, as applicable. Broadridge Financial Solutions, Inc. (“Broadridge”), an independent provider of investment company data, was retained to provide the Board with reports on how each Fund’s contractual management fees, actual management fees, othernon-management fees, overall expense ratios and investment performance compared to those of comparable mutual funds with similar investment objectives. The Independent Directors also engaged an independent financial services consultant (the “Consultant”) to assist them in evaluating each Fund’s management fees, othernon-management fees, overall expense ratios and investment performance. In addition, the Consultant reviewed the profitability methodologies utilized by HFMC in connection with the continuation of the Management Agreement.
In determining whether to continue the Agreements for a Fund, the members of the Board reviewed and evaluated information and factors they believed to be relevant and appropriate in the exercise of their reasonable business judgment. While individual members of the Board may have weighed certain factors differently, the Board’s determination to continue the Agreements was based on a comprehensive consideration of all information provided to the Board throughout the year and specifically with respect to the continuation of the Agreements. The Board was also furnished with an analysis of its fiduciary obligations in connection with its evaluation of the Agreements and, throughout the evaluation process, the Board was assisted by counsel for the Funds. The Independent Directors were also separately assisted by independent legal counsel. A more detailed summary of the important, but not necessarily all, factors the Board considered with respect to its continuation of the Agreements is provided below.
Approval of Investment Management and InvestmentSub-Advisory Agreements (Unaudited) – (continued)
Nature, Extent and Quality of Services Provided by the Advisers
The Board requested and considered information concerning the nature, extent and quality of the services provided to each Fund by the Advisers. The Board considered, among other things, the terms of the Agreements and the range of services provided by the Advisers. The Board considered the Advisers’ professional personnel who provide services to the Funds, including each Adviser’s ability and experience in attracting and retaining qualified personnel to service the Funds. The Board considered each Adviser’s reputation and overall financial strength, as well as its willingness to consider and implement organizational and operational changes designed to enhance services to the funds managed by HFMC and its affiliates (the “Hartford Funds”). In addition, the Board considered the quality of each Adviser’s communications with the Board and responsiveness to Board inquiries and requests made from time to time with respect to the Funds and other Hartford Funds.
The Board also requested and evaluated information concerning each Adviser’s regulatory and compliance environment. In this regard, the Board requested and reviewed information about each Adviser’s compliance policies and procedures, compliance history, and a report from the Funds’ Chief Compliance Officer about each Adviser’s compliance with applicable laws and regulations, including responses to regulatory developments and any compliance issues raised by regulators. The Board also noted the Advisers’ support of the Funds’ compliance control structure, as applicable, and, in particular, the resources devoted by the Advisers in support of the Funds’ obligations pursuant to Rule38a-1 under the 1940 Act, as well as the efforts of the Advisers to combat cybersecurity risks and invest in business continuity planning.
With respect to HFMC, the Board noted that, under the Management Agreement, HFMC is responsible for the management of the Funds, including oversight of fund operations and service providers, and the provision of administrative and investment advisory services in connection with selecting, monitoring and supervising theSub-adviser. In this regard, the Board evaluated information about the nature and extent of responsibilities retained and risks assumed by HFMC and not delegated to, or assumed by, theSub-adviser. The Board considered HFMC’s ongoing monitoring of people, process and performance, including its quarterly reviews of each of the Hartford Funds, semi-annual meetings with the leaders of each Fund’s portfolio management team, and oversight of the Funds’ portfolio managers. The Board recognized that HFMC has demonstrated a record of making changes to the management and/or investment strategies of the Hartford Funds when warranted. The Board considered HFMC’s periodic due diligence reviews of theSub-adviser and ongoing oversight of theSub-adviser’s investment approach and results, process for monitoring best execution of portfolio trades and other trading operations by theSub-adviser, and approach to risk management with respect to the Funds and the service providers to the Funds. The Board also considered HFMC’sday-to-day oversight of each Fund’s compliance with its investment objective and policies as well as with applicable laws and regulations, noting that regulatory and other developments had over time led to an increase in the scope of HFMC’s services in this regard. Moreover, the Board considered HFMC’s oversight of potential conflicts of interest between the Funds’ investments and those of other funds or accounts managed by the Funds’ portfolio management personnel.
In addition, the Board considered HFMC’s ongoing commitment to review and rationalize the Hartford Funds productline-up. The Board considered that HFMC is responsible for providing the Funds’ officers.
With respect to theSub-adviser, which provides certainday-to-day portfolio management services for the Funds, subject to oversight by HFMC, the Board considered, among other things, the quality of theSub-adviser’s investment personnel, its investment philosophy and process, its investment research capabilities and resources, its performance record, its trade execution capabilities and its experience. The Board considered the experience of each Fund’s portfolio manager(s), the number of accounts managed by the portfolio manager(s), and theSub-adviser’s method for compensating the portfolio manager(s).
The Board considered the benefits to shareholders of being part of the Hartford Funds family of funds. The Board considered HFMC’s efforts to provide investors in the Hartford Funds with a broad range of investment styles and asset classes.
Based on these considerations, the Board concluded that it was satisfied with the nature, extent and quality of the services provided to each Fund by HFMC and theSub-adviser.
Performance of each Fund and the Advisers
The Board considered the investment performance of each Fund. In this regard, the Board reviewed the performance of each Fund over different time periods presented in the materials and evaluated HFMC’s analysis of the Fund’s performance for these time periods. The Board considered information and materials provided to the Board by the Advisers concerning Fund performance, as well as information from Broadridge comparing the investment performance of each Fund to an appropriate universe of peer funds. For details regarding each Fund’s performance, see theFund-by-Fund synopsis below.
The Board considered the detailed investment analytics reports provided by HFMC’s Investment Advisory Group throughout the year, including in connection with the approval of the Agreements. These reports included, among other things, information on each Fund’s gross returns and net returns, the Fund’s investment performance relative to an appropriate benchmark and peer group (if available), various statistics concerning the Fund’s portfolio, and a narrative summary of various factors affecting Fund performance. The Board considered the Advisers’ cooperation with the Investment Committee, which assists the Board in evaluating the performance of each Fund at periodic meetings throughout the year and specifically with respect to the approval of the Agreements. The Board also considered the analysis provided by the Consultant relating to each Fund’s performance track record.
Approval of Investment Management and InvestmentSub-Advisory Agreements (Unaudited) – (continued)
In light of all the considerations noted above, the Board concluded that it had continued confidence in HFMC’s and theSub-adviser’s overall capabilities to manage the Funds.
Costs of the Services and Profitability of the Advisers
The Board reviewed information regarding HFMC’s cost to provide investment management and related services to each Fund and HFMC’s profitability, both overall and for each Fund, on apre-tax basis without regard to distribution expenses. The Board also requested and reviewed information about the profitability to HFMC and its affiliates from all services provided to each Fund and all aspects of their relationship with the Fund, including information regarding profitability trends over time. The Board also requested and received information relating to the operations and profitability of theSub-adviser. The Board considered representations from HFMC and theSub-adviser that theSub-adviser’s fees were negotiated at arm’s length on aFund-by-Fund basis and that thesub-advisory fees would be paid by HFMC and not the Funds. Accordingly, the Board concluded that the profitability of theSub-adviser is a less relevant factor with respect to the Board’s consideration of theSub-Advisory Agreements.
The Board considered the Consultant’s review of the methodologies and estimates used by HFMC in calculating profitability in connection with the continuation of the Management Agreement, including a description of the methodology used to allocate certain expenses. The Board noted the Consultant’s view that HFMC’s process for calculating and reporting Fund profitability is reasonable and consistent with the process previously reviewed by the Consultant. In this regard, the Board noted that the Consultant had previously performed a full review of this process and reported that such process is sound and consistent with common industry practice.
Based on these considerations, the Board concluded that the profits anticipated to be realized by the Advisers and their affiliates from their relationships with the Funds would not be excessive.
Comparison of Fees and Services Provided by the Advisers
The Board considered the comparative information that had been provided at meetings on June19-20, 2018 and August7-8, 2018 with respect to the services rendered to and the management fees to be paid by each Fund to HFMC and the total expense ratios of the Fund. The Board also considered comparative information with respect to thesub-advisory fees to be paid by HFMC to theSub-adviser with respect to each Fund. In this regard, the Board requested and reviewed information from HFMC and theSub-adviser relating to the management andsub-advisory fees, including thesub-advisory fee schedule for each Fund, and total operating expenses for each Fund. The Board also reviewed information from Broadridge comparing each Fund’s contractual management fees, actual management fees and overall expense ratios relative to an appropriate group of funds selected by Broadridge, in consultation with the Consultant. For details regarding each Fund’s expenses, see theFund-by-Fund synopsis below.
While the Board recognized that comparisons between a Fund and its peer funds may be imprecise, given the different service levels and characteristics of mutual funds and the different business models and cost structures of the Advisers, the comparative information provided by Broadridge assisted the Board in evaluating the reasonableness of each Fund’s fees and total operating expenses. In addition, the Board considered the analysis and recommendations of the Consultant relating to each Fund’s fees and total operating expenses.
The Board received information regarding fees charged by HFMC to other clients that are exchange-traded funds (“ETFs”) with investment strategies similar to those of certain Funds. The Board reviewed information about structural, operational and other differences between the ETFs and the Funds, including differences in the marketplace in which each type of product must compete. The Board also received information regarding fees charged by theSub-adviser to any other clients with investment strategies similar to those of the Funds, including institutional separate account clients and registered fund clients for which theSub-adviser serves as either primary investment adviser orsub-adviser. The Board considered any differences between theSub-adviser’s services to the Funds and the services it provides to other types of clients. In this regard, the Board reviewed information about the generally broader scope of services and compliance, reporting and other legal burdens and risks of managing registered funds compared with those associated with managing assets ofnon-registered fund clients such as institutional separate accounts.
Based on these considerations, the Board concluded that each Fund’s fees and total operating expenses, in conjunction with the information about quality of services, profitability, economies of scale, and other matters discussed, were reasonable in light of the services provided.
Economies of Scale
The Board considered information regarding the extent to which economies of scale may be realized as a Fund grows and whether fee levels reflect these economies of scale for the benefit of shareholders of the Fund. The Board reviewed the breakpoints in the management fee schedule for each Fund, if any, which reduce fee rates as the Fund’s assets grow over time. The Board recognized that a Fund with assets beyond the highest breakpoint level will continue to benefit from economies of scale because additional assets are charged the lowest breakpoint fee resulting in lower overall effective management fee rates. The Board also recognized that a fee schedule that reaches a lower breakpoint quickly provides shareholders with the benefit of anticipated or potential economies of scale. In addition, the Board considered that initially setting competitive fee rates and pricing the Funds to scale at inception are other means of sharing potential economies of scale with shareholders. The Board also considered that HFMC has been active in managing expenses. The Board noted the effect of therun-off of the variable annuity business on the HLS Funds and also noted that, for Hartford MidCap Growth HLS Fund, the Fund’s current low asset levels have kept the Fund from fully realizing the benefits of anticipated or
Approval of Investment Management and InvestmentSub-Advisory Agreements (Unaudited) – (continued)
potential economies of scale. The Board also noted that the assets under management had declined for certain Funds and considered the potential impact of such declines on the expense ratios for such Funds. The Board noted the recently completed sale of the annuityrun-off business and considered how the sale may impact the Funds’ asset levels.
The Board reviewed and evaluated materials from Broadridge and the Consultant showing how management fee schedules of peer funds reflect economies of scale for the benefit of shareholders as a peer fund’s assets hypothetically increase over time. Based on information provided by HFMC, Broadridge, and the Consultant, the Board recognized that there is no uniform methodology for establishing breakpoints or uniform pattern in asset levels that trigger breakpoints or the amounts of breakpoints triggered.
After considering all of the information available to it, the Board concluded that it was satisfied with the extent to which economies of scale would be shared for the benefit of each Fund’s shareholders based on currently available information and the effective management fees and expense ratios for the Fund at its current and reasonably anticipated asset levels. The Board noted, however, that it would continue to monitor future growth in each Fund’s assets and the appropriateness of additional breakpoints or other methods to share benefits from economies of scale.
Other Benefits
The Board considered other benefits to the Advisers and their affiliates from their relationships with the Funds.
The Board noted that HFMC receives fees for fund accounting and related services from the Funds. The Board considered information on profits to HFMC for such services. The Board also considered that Hartford Administrative Services Company (“HASCO”), the Funds’ transfer agent and an affiliate of HFMC, receives transfer agency compensation from the Funds, and the Board reviewed information about the profitability to HASCO of the Funds’ transfer agency function. The Board considered information regarding the transfer agency services provided by HASCO to the Funds and the transfer agency fees received therefor. The Board also noted that HFMC and HASCO had delegated certain fund accounting services and transfer agency services, respectively, to external service providers.
The Board also considered that Hartford Funds Distributors, LLC (“HFD”), an affiliate of HFMC, serves as principal underwriter of the Funds. As principal underwriter, HFD receives distribution and service fees from the Funds.
The Board considered the benefits, if any, to theSub-adviser from any use of a Fund’s brokerage commissions to obtain soft dollar research.
Fund-by-Fund Factors
For purposes of theFund-by-Fund discussion below, Fund performance is referred to as “in line with” a Fund’s benchmark where it was 0.5% above or below the benchmark return and each Fund’s performance relative to its benchmark reflects the Fund’s gross performance.
Hartford Balanced HLS Fund
| • | | The Board noted that the Fund’s performance was in the 3rd quintile of its performance universe for the1- and3-year periods, and the 2nd quintile for the5-year period. The Board also noted that the Fund’s performance was above its custom blended benchmark for the1- and5-year periods and in line with its custom blended benchmark for the3-year period. The Board noted upcoming changes to the Fund’s portfolio management team. |
| • | | The Board noted that the Fund’s contractual management fee was in the 4th quintile of its expense group, while its actual management fee and its total expenses (less12b-1 and shareholder service fees) were in the 3rd quintile. The Board noted that the Fund has a contractual management fee waiver of 0.03% through April 30, 2020. |
Hartford Capital Appreciation HLS Fund
| • | | The Board noted that the Fund’s performance was in the 1st quintile of its performance universe for the1-year period, the 3rd quintile for the3-year period and the 2nd quintile for the5-year period. The Board also noted that the Fund’s performance was above its benchmark for the1-year period, below its benchmark for the3-year period and in line with its benchmark for the5-year period. The Board noted that certain changes had recently been made to the Fund’s principal investment strategy. The Board also noted upcoming changes to the Fund’s portfolio management team. |
| • | | The Board noted that the Fund’s contractual management fee, actual management fee and total expenses (less12b-1 and shareholder service fees) were in the 2nd quintile of its expense group. |
Hartford Disciplined Equity HLS Fund
| • | | The Board noted that the Fund’s performance was in the 1st quintile of its performance universe for the1- and5-year periods and the 2nd quintile for the3-year period. The Board also noted that the Fund’s performance was above its benchmark for the1- and5-year periods and in line with its benchmark for the3-year period. |
Approval of Investment Management and InvestmentSub-Advisory Agreements (Unaudited) – (continued)
| • | | The Board noted that the Fund’s contractual management fee and its actual management fee were in the 3rd quintile of its expense group, while its total expenses (less12b-1 and shareholder service fees) were in the 4th quintile. |
Hartford Dividend and Growth HLS Fund
| • | | The Board noted that the Fund’s performance was in the 1st quintile of its performance universe for the1-,3- and5-year periods. The Board also noted that the Fund’s performance was below its benchmark for the1-year period and in line with its benchmark for the3- and5-year periods. |
| • | | The Board noted that the Fund’s contractual management fee was in the 3rd quintile of its expense group, while its actual management fee and total expenses(less12b-1 and shareholder service fees) were in the 2nd quintile. |
Hartford Global Growth HLS Fund
| • | | The Board noted that the Fund’s performance was in the 1st quintile of its performance universe for the1-,3- and5-year periods. The Board also noted that the Fund’s performance was above its benchmark for the1-,3- and5-year periods. |
| • | | The Board noted that the Fund’s contractual management fee and actual management fee were in the 3rd quintile of its expense group and its total expenses (less12b-1 and shareholder service fees) were in the 2nd quintile. |
Hartford Growth Opportunities HLS Fund
| • | | The Board noted that the Fund’s performance was in the 2nd quintile of its performance universe for the1-year period and the 1st quintile for the3- and5-year periods. The Board also noted that the Fund’s performance was above its benchmark for the1-,3- and5-year periods. |
| • | | The Board noted that the Fund’s contractual management fee and total expenses(less12b-1 and shareholder service fees) were in the 1st quintile of its expense group, while its actual management fee was in the 2nd quintile. |
Hartford Healthcare HLS Fund
| • | | The Board noted that the Fund’s performance was in the 3rd quintile of its performance universe for the1-year period, the 1st quintile for the3-year period and the 2nd quintile for the5-year period. The Board also noted that the Fund’s performance was below its benchmark for the1-year period, in line with its benchmark for the3-year period and above its benchmark for the5-year period. |
| • | | The Board noted that the Fund’s contractual management fee, actual management fee and total expenses (less12b-1 and shareholder service fees) were in the 3rd quintile of its expense group. |
Hartford High Yield HLS Fund
| • | | The Board noted that the Fund’s performance was in the 3rd quintile of its performance universe for the1-year period and the 2nd quintile for the3- and5-year periods. The Board also noted that the Fund’s performance was above its benchmark for the1-year period and in line with its benchmark for the3- and5-year periods. |
| • | | The Board noted that the Fund’s contractual management fee and its total expenses (less12b-1 and shareholder service fees) were in the 4th quintile of its expense group, while its actual management fee was in the 5th quintile. |
Hartford International Opportunities HLS Fund
| • | | The Board noted that the Fund’s performance was in the 2nd quintile of its performance universe for the1- and3-year periods and the 1st quintile for the5-year period. The Board also noted that the Fund’s performance was above its benchmark for the1-,3- and5-year periods. |
| • | | The Board noted that the Fund’s contractual management fee, actual management fee and total expenses (less12b-1 and shareholder service fees) were in the 1st quintile of its expense group. In considering the Fund’s expenses, the Board noted that theSub-adviser has limited capacity with respect to the Fund’s strategy which may impact the Fund’ssub-advisory fee levels. |
Hartford MidCap Growth HLS Fund
| • | | The Board noted that the Fund’s performance was in the 3rd quintile of its performance universe for the1-year period and the 5th quintile for the3- and5-year periods. The Board also noted that the Fund’s performance was below its benchmark for the1-,3- and5-year periods. The Board noted upcoming changes to the Fund’s portfolio management team and principal investment strategy. |
| • | | The Board noted that the Fund’s contractual management fee and actual management fee were in the 2nd quintile of its expense group, while its total expenses (less12b-1 and shareholder service fees) were in the 3rd quintile. |
Approval of Investment Management and InvestmentSub-Advisory Agreements (Unaudited) – (continued)
Hartford MidCap HLS Fund
| • | | The Board noted that the Fund’s performance was in the 2nd quintile of its performance universe for the1-year period and the 1st quintile for the3- and5-year periods. The Board also noted that the Fund’s performance was above its benchmark for the1-,3- and5-year periods. |
| • | | The Board noted that the Fund’s contractual management fee, actual management fee and total expenses (less12b-1 and shareholder service fees) were in the 1st quintile of its expense group. |
Hartford MidCap Value HLS Fund
| • | | The Board noted that the Fund’s performance was in the 3rd quintile of its performance universe for the1- and5-year periods and the 4th quintile for the3-year period. The Board also noted that the Fund’s performance was above its benchmark for the1- and5-year periods and below its benchmark for the3-year period. The Board noted upcoming changes to the Fund’s portfolio management team. |
| • | | The Board noted that the Fund’s contractual management fee was in the 3rd quintile of its expense group, while its actual management fee and total expenses(less12b-1 and shareholder service fees) were in the 5th quintile. The Board noted that the Fund has a contractual management fee waiver of 0.04% through April 30, 2020. |
Hartford Small Cap Growth HLS Fund
| • | | The Board noted that the Fund’s performance was in the 4th quintile of its performance universe for the1- and3-year periods and the 3rd quintile for the5-year period. The Board also noted that the Fund’s performance was below its benchmark for the1-year period, in line with its benchmark for the3-year period and above its benchmark for the5-year period. The Board noted upcoming changes to the Fund’s portfolio management team and principal investment strategy. |
| • | | The Board noted that the Fund’s contractual management fee, actual management fee and total expenses(less12b-1 and shareholder service fees) were in the 1st quintile of its expense group. |
Hartford Small Company HLS Fund
| • | | The Board noted that the Fund’s performance was in the 2nd quintile of its performance universe for the1-year period, the 5th quintile for the3-year period and the 4th quintile for the5-year period. The Board also noted that the Fund’s performance was above its benchmark for the1-year period and below its benchmark for the3- and5-year periods. The Board noted recent and upcoming changes to the Fund’s portfolio management team and upcoming changes to the Fund’s principal investment strategy. |
| • | | The Board noted that the Fund’s contractual management fee was in the 2nd quintile of its expense group, while its actual management fee and total expenses (less12b-1 and shareholder service fees) were in the 1st quintile. |
Hartford Stock HLS Fund
| • | | The Board noted that the Fund’s performance was in the 3rd quintile of its performance universe for the1-year period and the 4th quintile for the3- and5-year periods. The Board also noted that the Fund’s performance was below its benchmark for the1-,3- and5-year periods. |
| • | | The Board noted that the Fund’s contractual management fee, actual management fee and total expenses (less12b-1 and shareholder service fees) were in the 1st quintile of its expense group. |
Hartford Total Return Bond HLS Fund
| • | | The Board noted that the Fund’s performance was in the 1st quintile of its performance universe for the1-,3- and5-year periods. The Board also noted that the Fund’s performance was above its benchmark for the1-,3- and5-year periods. |
| • | | The Board noted that the Fund’s contractual management fee and its actual management fee were in the 2nd quintile of its expense group, while its total expenses (less12b-1 and shareholder service fees) were in the 1st quintile. |
Hartford Ultrashort Bond HLS Fund
| • | | The Board noted that the Fund’s performance was in the 1st quintile of its performance universe for the1-year period and the 3rd quintile for the3-year period. The Board also noted that the Fund’s performance was above its benchmark for the1-year period and in line with its benchmark for the3-year period. |
| • | | The Board noted that the Fund’s contractual management fee and its actual management fee were in the 1st quintile of its expense group, while its total expenses (less12b-1 and shareholder service fees) were in the 2nd quintile. |
Approval of Investment Management and InvestmentSub-Advisory Agreements (Unaudited) – (continued)
Hartford U.S. Government Securities HLS Fund
| • | | The Board noted that the Fund’s performance was in the 4th quintile of its performance universe for the1-year period, the 2nd quintile for the3-year period and the 3rd quintile for the5-year period. The Board also noted that the Fund’s performance was above its benchmark for the1-,3- and5-year periods. |
| • | | The Board noted that the Fund’s contractual management fee, actual management fee and its total expenses (less12b-1 and shareholder service fees) were in the 2nd quintile of its expense group. |
Hartford Value HLS Fund
| • | | The Board noted that the Fund’s performance was in the 3rd quintile of its performance universe for the1-,3- and5-year periods. The Board also noted that the Fund’s performance was above its benchmark for the1-year period and in line with its benchmark for the3- and5-year periods. The Board noted upcoming changes to the Fund’s portfolio management team. |
| • | | The Board noted that the Fund’s contractual management fee was in the 3rd quintile of its expense group, while its actual management fee and total expenses(less12b-1 and shareholder service fees) were in the 5th quintile. In considering the Fund’s expenses, the Board noted the shareholder savings expected to result from a permanent fee reduction implemented in 2018. |
* * * *
Based upon its review of these various factors, among others, the Board concluded that it is in the best interests of each Fund and its shareholders for the Board to approve the Agreements for an additional year. In reaching this decision, the Board did not assign relative weights to the factors discussed above or deem any one or group of them to be controlling in and of themselves. In connection with their deliberations, the Independent Directors met separately in executive session on several occasions, with independent legal counsel and the Consultant, to review the relevant materials and consider their responsibilities under relevant laws and regulations.
THIS PRIVACY POLICY IS NOT PART OF THIS REPORT
CUSTOMER PRIVACY NOTICE
The Hartford Financial Services Group, Inc. and Affiliates*
(herein called “we, our, and us”)
This Privacy Policy applies to our United States Operations
We value your trust. We are committed to the responsible:
a) management;
b) use; and
c) protection;
ofPersonal Information.
This notice describes how we collect, disclose, and protectPersonal Information.
We collectPersonal Informationto:
a) service yourTransactionswith us; and
b) support our business functions.
We may obtainPersonal Informationfrom:
a)You;
b) yourTransactionswith us; and
c) third parties such as a consumer-reporting agency.
Based on the type of product or serviceYouapply for or get from us,Personal Informationsuch as:
a) your name;
b) your address;
c) your income;
d) your payment; or
e) your credit history;
may be gathered from sources such as applications,Transactions, and consumer reports.
To serveYouand service our business, we may share certainPersonal Information.We will sharePersonalInformation, only as allowed by law, with affiliates such as:
a) our insurance companies;
b) our employee agents;
c) our brokerage firms; and
d) our administrators.
As allowed by law, we may sharePersonal FinancialInformationwith our affiliates to:
a) market our products; or
b) market our services;
toYouwithout providingYouwith an option to prevent these disclosures.
We may also sharePersonal Information, only as allowed by law, with unaffiliated third parties including:
a) independent agents;
b) brokerage firms;
c) insurance companies;
d) administrators; and
e) service providers;
who help us serveYouand service our business.
When allowed by law, we may share certainPersonalFinancial Informationwith other unaffiliated third parties who assist us by performing services or functions such as:
a) taking surveys;
b) marketing our products or services; or
c) offering financial products or services under a joint agreement between us and one or more financial institutions.
We, and third parties we partner with, may track some of the pagesYouvisit through the use of:
a) cookies;
b) pixel tagging; or
c) other technologies;
and currently do not process or comply with any web browser’s “do not track” signal or other similar mechanism that indicates a request to disable online tracking of individual users who visit our websites or use our services.
For more information, our Online Privacy Policy, which governs information we collect on our website and our affiliate websites, is available at https://www.thehartford.com/online-privacy-policy.
We will not sell or share yourPersonal FinancialInformationwith anyone for purposes unrelated to our business functions without offeringYouthe opportunity to:
a)“opt-out;” or
b)“opt-in;”
as required by law.
We only disclosePersonal Health Informationwith:
a) your authorization; or
b) as otherwise allowed or required by law.
Our employees have access toPersonal Informationin the course of doing their jobs, such as:
a) underwriting policies;
b) paying claims;
c) developing new products; or
d) advising customers of our products and services.
We use manual and electronic security procedures to maintain:
a) the confidentiality; and
b) the integrity of;
Personal Informationthat we have. We use these procedures to guard against unauthorized access.
Some techniques we use to protectPersonalInformationinclude:
a) secured files;
b) user authentication;
c) encryption;
d) firewall technology; and
e) the use of detection software.
We are responsible for and must:
a) identify information to be protected;
b) provide an adequate level of protection for that data;
c) grant access to protected data only to those people who must use it in the performance of theirjob-related duties.
Employees who violate our privacy policies and procedures may be subject to discipline, which may include termination of their employment with us.
We will continue to follow our Privacy Policy regardingPersonal Informationeven when a business relationship no longer exists between us.
As used in this Privacy Notice:
Application means your request for our product or service.
Personal Financial Information means financial information such as:
a) credit history;
b) income;
c) financial benefits; or
d) policy or claim information.
Personal Financial Information may include Social Security Numbers, Driver’s license numbers, or other government-issued identification numbers, or credit, debit card, or bank account numbers.
Personal Health Information means health information such as:
a) your medical records; or
b) information about your illness, disability or injury.
Personal Information means information that identifiesYoupersonally and is not otherwise available to the public. It includes: a)Personal Financial Information; and
b)Personal Health Information.
Transaction means your business dealings with us, such as:
a) yourApplication;
b) your request for us to pay a claim; and
c) your request for us to take an action on your account.
You means an individual who has given usPersonal Informationin conjunction with:
a) asking about;
b) applying for; or
c) obtaining;
a financial product or service from us if the product or service is used mainly for personal, family, or household purposes.
If you have any questions or comments about this privacy notice, please feel free to contact us at The Hartford – Law Department, Privacy Law, One Hartford Plaza, Hartford, CT 06155, or at CorporatePrivacyOffice@thehartford.com.
This Customer Privacy Notice is being provided on behalf of The Hartford Financial Services Group, Inc. and its affiliates (including the following as of March 2018), to the extent required by the Gramm-Leach-Bliley Act and implementing regulations.
1stAGChoice, Inc.; Access CoverageCorp, Inc.; Access CoverageCorp Technologies, Inc.; American Maturity Life Insurance Company; Business Management Group, Inc.; Cervus Claim Solutions, LLC; First State Insurance Company; Fountain Investors I LLC; Fountain Investors II LLC; Fountain Investors III LLC; Fountain Investors IV LLC; FP R, LLC; FTC Resolution Company LLC; Hart Re Group L.L.C.; Hartford Accident and Indemnity Company; Hartford Administrative Services Company; Hartford Casualty General Agency, Inc.; Hartford Casualty Insurance Company; Hartford Financial Services, LLC; Hartford Fire General Agency, Inc.; Hartford Fire Insurance Company; Hartford Funds Distributors, LLC; Hartford Funds Management Company, LLC; Hartford Funds Management Group, Inc.; Hartford Group Benefits Holding Company; Hartford Holdings, Inc.; Hartford Insurance Company of Illinois; Hartford Insurance Company of the Midwest; Hartford Insurance Company of the Southeast; Hartford Insurance, Ltd.; Hartford Integrated Technologies, Inc.; Hartford International Life Reassurance Corporation; Hartford Investment Management Company; Hartford Life and Accident Insurance Company; Hartford Life and Annuity Insurance Company; Hartford Life Insurance Company; Hartford Life, Inc.; Hartford Life International Holding Company; Hartford Life, Ltd.; Hartford Lloyd’s Corporation; Hartford Lloyd’s Insurance Company; Hartford Management, Ltd.; Hartford of Texas General Agency, Inc.; Hartford Residual Market, L.C.C.; Hartford Securities Distribution Company, Inc.; Hartford Specialty Insurance Services of Texas, LLC; Hartford Strategic Investments, LLC; Hartford Underwriters General Agency, Inc.; Hartford Underwriters Insurance Company; Hartford-Comprehensive Employee Benefit Service Company; Heritage Holdings, Inc.; Heritage Reinsurance Company, Ltd.; HIMCO Distribution Services Company; HLA LLC; HL Investment Advisors, LLC; Horizon Management Group, LLC; HRA Brokerage Services, Inc.; Lanidex R, LLC; Lattice Strategies LLC; Maxum Casualty Insurance Company; Maxum Indemnity Company; Maxum Specialty Services Corporation; MPC Resolution Company LLC; New England Insurance Company; New England Reinsurance Corporation; New Ocean Insurance Co., Ltd.; Northern Homelands Company; Nutmeg Insurance Agency, Inc.; Nutmeg Insurance Company; Pacific Insurance Company, Limited; Property and Casualty Insurance Company of Hartford; Sentinel Insurance Company, Ltd.; The Hartford International Asset Management Company Limited; Trumbull Flood Management, L.L.C.; Trumbull Insurance Company; Twin City Fire Insurance Company.
Revised March 2018
Series of Hartford Series Fund, Inc. and Hartford HLS Series Fund II, Inc. (each a “Fund” and collectively, the “Funds”) are not subsidiaries of The Hartford Financial Services Group, Inc. (“The Hartford”) but are underwritten, distributed by and advised by subsidiaries of The Hartford. Investments in the Funds are not guaranteed by The Hartford or any other entity.
This report is submitted for the general information of the shareholders of the Funds referenced in this report. It is not authorized for distribution to persons who are not shareholders of one or more Funds referenced in this report unless preceded or accompanied by a current prospectus for the relevant Fund. Nothing herein contained is to be considered
an offer of sale or a solicitation of an offer to buy shares of any Fund listed in this report. Such offering is only made by prospectus, which includes details as to the offering price and other material information.
Investors should carefully consider the investment objectives, risks, charges and expenses of a Fund. This and other important information is contained in a Fund’s prospectus and summary prospectus, which can be obtained by visiting hartfordfunds.com. Please read it carefully before investing.
The Funds are distributed by Hartford Funds Distributors, LLC (HFD), Member FINRA. Hartford Funds Management Company, LLC (HFMC) is the Funds’ investment manager. The Funds aresub-advised by Wellington Management Company LLP. HFD and HFMC are not affiliated with Wellington Management Company LLP.
HLSSAR18 2-19 209597 Printed in U.S.A.

Item 2. Code of Ethics.
The registrant, as of the end of the period covered by this report, has adopted a code of ethics that applies to the registrant’s principal executive officer, principal financial officer, principal accounting officer or controller, or persons performing similar functions, regardless of whether these individuals are employed by the registrant or a third party. There have been no amendments, during the period covered by this report, to a provision of the code of ethics that applies to the registrant’s principal executive officer, principal financial officer, principal accounting officer or controller, or persons performing similar functions, regardless of whether these individuals are employed by the registrant or a third party, and that relates to any element of the code of ethics description. The registrant has not granted any waivers, including an implicit waiver, from a provision of the code of ethics that applies to the registrant’s principal executive officer, principal financial officer, principal accounting officer or controller, or persons performing similar functions, regardless of whether these individuals are employed by the registrant or a third party, that relates to one or more of the items set forth in paragraph (b) of this item’s instructions. A copy of the code of ethics is filed herewith.
Item 3. Audit Committee Financial Expert.
The Board of Directors of the registrant (the “Board”) has designated Phillip O. Peterson as an Audit Committee Financial Expert. Mr. Peterson is considered by the Board to be an independent director.
Item 4. Principal Accountant Fees and Services.
| | (a) | Audit Fees: The aggregate fees billed for each of the last two fiscal years for professional services rendered by the principal accountant for the audit of the registrant’s annual financial statements or services that are normally provided by the accountant in connection with statutory and regulatory filings or engagements for those fiscal years were: |
| | | $399,086 for the fiscal year ended December 31, 2017; $352,500 for the fiscal year ended December 31, 2018. |
| | (b) | Audit Related Fees: The aggregate fees billed in each of the last two fiscal years for assurance and related services by the principal accountant that are reasonably related to the performance of the audit of the registrant’s financial statements and are not reported under paragraph (a) of this Item were: |
| | | $0 for the fiscal year ended December 31, 2017; $0 for the fiscal year ended December 31, 2018. |
| | (c) | Tax Fees: The aggregate fees billed in each of the last two fiscal years for professional services rendered by the principal accountant for tax compliance, tax advice, and tax planning were: |
| | | $72,715 for the fiscal year ended December 31, 2017; $75,258 for the fiscal year ended December 31, 2018.Tax-related services are principally in connection with, but not limited to, general tax services, excise tax and Passive Foreign Investment Company (PFIC) analysis. |
| | (d) | All Other Fees:The aggregate fees billed in each of the last two fiscal years for products and services provided by the principal accountant, other than the services reported in paragraphs (a) through (c) of this Item were: |
| | | $0 for the fiscal year ended December 31, 2017; $0 for the fiscal year ended December 31, 2018. |
| | (e) | (1) ThePre-Approval Policies and Procedures (the “Policy”) adopted by the Audit Committee of the registrant (also, the “Fund”) sets forth the procedures pursuant to which services performed by the independent registered public accounting firm for the registrant may bepre-approved. The following are some main provisions from the Policy. |
| | 1. | The Audit Committee mustpre-approve all audit services andnon-audit services that the independent registered public accounting firm provides to the Fund. |
| | 2. | The Audit Committee mustpre-approve any engagement of the independent registered public accounting firm to providenon-audit services to any Service Affiliate (which is defined to include any entity controlling, controlled by, or under common control with the investment adviser that provides ongoing services to the Fund) during the period of the independent registered public accounting firm’s engagement to provide audit services to the Fund, if thenon-audit services to the Service Affiliate directly impact the Fund’s operations and financial reporting. |
| | 3. | The Audit Committee shallpre-approve certainnon-audit services to the Fund and its Service Affiliates pursuant to procedures set forth in the Policy. |
| | 4. | The Audit Committee, from time to time, may designate one or more of its members who are Independent Directors (each a “Designated Member”) to consider, on the Audit Committee’s behalf, anynon-audit services, whether to the Fund or to any Service Affiliate, that have not beenpre-approved by the Audit Committee. The Designated Member also shall review, on the Audit Committee’s behalf, any proposed material change in the nature or extent of anynon-audit services previously approved. In considering any requestednon-audit services or proposed material change in such services, the Designated Member shall not authorize services which would exceed $50,000 in fees for such services. |
| | 5. | The independent registered public accounting firm may not provide specified prohibitednon-audit services set forth in the Policy to the Fund, the Fund’s investment adviser, the Service Affiliates or any other member of the investment company complex. |
| | (e) | (2) One hundred percent of the services described in items 4(b) through 4(d) were approved in accordance with the Audit Committee’sPre-Approval Policy. As a result, none of such services was approved pursuant to paragraph (c)(7)(i)(c) of Rule2-01 of RegulationS-X. |
| | (f) | None of the hours expended on the principal accountant’s engagement to audit the registrant’s financial statements for the fiscal year ended December 31, 2018, were attributed to work performed by persons other than the principal accountant’s full-time, permanent employees. |
| | (g) | The aggregatenon-audit fees billed by the registrant’s accountant for services rendered to the registrant, and rendered to the registrant’s investment adviser (not including anysub-adviser whose role is primarily portfolio management and is |
| | | subcontracted with or overseen by another investment adviser), and any entity controlling, controlled by, or under common control with the adviser that provides ongoing services to the registrant for each of the last two fiscal years of the registrant were: |
| | | Non-Audit Fees: $112,215 for the fiscal year ended December 31, 2017; $115,258 for the fiscal year ended December 31, 2018. |
| | (h) | The registrant’s audit committee of the board of directors has considered whether the provision ofnon-audit services that were rendered to the registrant’s investment adviser (not including anysub-adviser whose role is primarily portfolio management and is subcontracted with or overseen by another investment adviser), and any entity controlling, controlled by, or under common control with the investment adviser that provides ongoing services to the registrant that were notpre-approved pursuant to paragraph (c)(7)(ii) of Rule2-01 of RegulationS-X is compatible with maintaining the principal accountant’s independence. |
Item 5. Audit Committee of Listed Registrants.
Not applicable.
Item 6. Investments.
| | (a) | The Schedule of Investments in securities of unaffiliated issuers as of the close of the reporting period is included as part of the annual report filed under Item 1 of this form. |
Item 7. Disclosure of Proxy Voting Policies and Procedures forClosed-End Management Investment Companies.
Not applicable.
Item 8. Portfolio Managers ofClosed-End Management Investment Companies.
Not applicable.
Item 9. Purchases of Equity Securities byClosed-End Management Investment Company and Affiliated Purchasers.
Not applicable.
Item 10. Submission of Matters to a Vote of Security Holders.
There have been no material changes to the procedures by which shareholders may recommend nominees to the registrant’s board of directors since the registrant last provided disclosure in response to this requirement.
Item 11. Controls and Procedures.
| | (a) | The registrant’s principal executive and principal financial officers, or persons performing similar functions, have concluded that the registrant’s disclosure controls and procedures (as defined in Rule30a-3(c) under the Investment Company Act of 1940, as amended (the “1940 Act”) (17 CFR270.30a-3(c))) are generally effective to provide reasonable assurance, as of a date within 90 days of the filing date of the report that includes the disclosure required by this paragraph, based on their evaluation of these controls and procedures required by |
| | Rule30a-3(b) under the 1940 Act (17 CFR270.30a-3(b)) and Rules13a-15(b) or15d-15(b) under the Securities Exchange Act of 1934, as amended (17 CFR240.13a-15(b) or240.15d-15(b)). |
| | (b) | There were no changes in the registrant’s internal control over financial reporting (as defined in Rule30a-3(d) under the 1940 Act (17 CFR270.30a-3(d)) that occurred during the registrant’s second fiscal quarter of the period covered by this report that have materially affected, or is reasonably likely to materially affect, the registrant’s internal control over financial reporting. |
Item 12. Disclosure of Securities Lending Activities forClosed-End Management Investment Companies.
Not applicable.
Item 13. Exhibits.
(a)(1) Code of Ethics is filed herewith.
(a)(2) Separate certifications for each principal executive officer and principal financial officer of the registrant as required by Rule30a-2(a) under the 1940 Act (17 CFR270.30a-2(a)) and Section 302 of the Sarbanes-Oxley Act of 2002 are attached hereto.
(a)(3) Not applicable
(a)(4) Not applicable
(b) Certifications pursuant to Rule30a-2(b) under the 1940 Act and Section 906 of the Sarbanes-Oxley Act of 2002 are attached hereto.
SIGNATURES
Pursuant to the requirements of the Securities Exchange Act of 1934 and the Investment Company Act of 1940, the registrant has duly caused this report to be signed on its behalf by the undersigned, thereunto duly authorized.
| | | | | | |
| | | | HARTFORD SERIES FUND, INC. |
| | | |
| Date: March 4, 2019 | | | | By: | | /s/ James E. Davey |
| | | | | | James E. Davey |
| | | | | | President and Chief Executive Officer |
Pursuant to the requirements of the Securities Exchange Act of 1934 and the Investment Company Act of 1940, this report has been signed below by the following persons on behalf of the registrant and in the capacities and on the dates indicated.
| | | | | | |
| Date: March 4, 2019 | | | | By: | | /s/ James E. Davey |
| | | | | | James E. Davey |
| | | | | | President and Chief Executive Officer |
| | | |
| Date: March 4, 2019 | | | | By: | | /s/ Amy N. Furlong |
| | | | | | Amy N. Furlong |
| | | | | | Treasurer |
| | | | | | (Principal Financial Officer and Principal Accounting Officer) |