UNITED STATES
SECURITIES AND EXCHANGE COMMISSION
Washington, D.C. 20549
FORM N-CSR
CERTIFIED SHAREHOLDER REPORT OF REGISTERED MANAGEMENT
INVESTMENT COMPANIES
Investment Company Act file number: 811-08629
HARTFORD SERIES FUND, INC.
(Exact name of registrant as specified in charter)
5 Radnor Corporate Center, Suite 300, 100 Matsonford Road, Radnor, Pennsylvania 19087
(Address of Principal Executive Offices) (Zip Code)
Edward P. Macdonald, Esquire
Hartford Funds Management Company, LLC
5 Radnor Corporate Center, Suite 300
100 Matsonford Road
Radnor, Pennsylvania 19087
(Name and Address of Agent for Service)
Registrant’s telephone number, including area code: (610) 386-4068
Date of fiscal year end: December 31
Date of reporting period: December 31, 2015
Form N-CSR is to be used by management investment companies to file reports with the Commission not later than 10 days after the transmission to stockholders of any report that is required to be transmitted to stockholders under Rule 30e-1 under the Investment Company Act of 1940 (17 CFR 270.30e-1). The Commission may use the information provided on Form N-CSR in its regulatory, disclosure review, inspection, and policymaking roles.
A registrant is required to disclose the information specified by Form N-CSR, and the Commission will make this information public. A registrant is not required to respond to the collection of information contained in Form N-CSR unless the Form displays a currently valid Office of Management and Budget (“OMB”) control number. Please direct comments concerning the accuracy of the information collection burden estimate and any suggestions for reducing the burden to Secretary, Securities and Exchange Commission, 100 F. Street, NE, Washington, DC 20549. The OMB has reviewed this collection of information under the clearance requirements of 44 U.S.C. § 3507.
Item 1. Reports to Stockholders.
A MESSAGE FROM THE PRESIDENT
Dear Fellow Shareholders:
Thank you for investing in Hartford HLS Funds.
Market Review
During the year ended December 31, 2015, the period of this report, the stock market suffered its first correction (a decline of at least 10%) since 2011.
Although volatility returned to the market, stocks recovered from their summer decline and the S&P 500 Index1 managed to climb back into positive territory, gaining 1.38% through the end of the year.
The correction in domestic markets came as a response to uncertainty abroad. Since China is the second-largest economy in the world, late-summer worries of a slowdown in its economy had far-reaching impacts. The full impact of that slowing growth remains to be seen. Markets stabilized within a few weeks and stocks continued their upward climb, continuing the six-year-old bull market that began in 2009.
From a broader perspective, a strong dollar, low oil prices, and central-bank policies influenced market movements throughout the period this report covers. Investors have been keeping a watchful eye on the U.S. Federal Reserve (the Fed) and international central banks, which continue to influence markets through quantitative-easing programs designed to support growth.
The Fed ended its own quantitative-easing program in late 2014, and its next influential move is to try to normalize interest rates, which have held near zero since 2008. The initial rate hike took place in mid-December, and continuing rate hikes generally are expected to continue at a gradual pace. Stocks took the initial rate hike in stride, however, rising rates are likely to be particularly impactful for fixed-income investors going forward, as bonds tend to be more sensitive to rate changes than equities.
As we begin 2016, we encourage you to maintain a strong relationship with a financial advisor who can help guide you through shifting markets with confidence. As the volatility during the summer of 2015 proved, markets are unpredictable and it’s important to proactively build a portfolio that takes into account your unique investment goals and risk tolerances. Your financial advisor can help you find a fit within our family of mutual funds as you work toward those goals.
Thank you again for investing with Hartford HLS Funds.

James Davey
President
Hartford HLS Funds
| 1 | S&P 500 Index is a market capitalization-weighted price index composed of 500 widely held common stocks. |
Hartford HLS Funds
Table of Contents
The views expressed in each Fund’s Manager Discussion under “Why did the Fund perform this way?” and “What is the outlook?” are views of that Fund’s sub-adviser and portfolio management team through the end of the period and are subject to change based on market and other conditions. Each Fund’s Manager Discussion is for informational purposes only and does not represent an offer, recommendation or solicitation to buy, hold or sell any security. The specific securities identified and described, if any, do not represent all of the securities purchased or sold and you should not assume that investments in the securities identified and discussed will be profitable.
Hartford Balanced HLS Fund inception 03/31/1983
| | |
| (sub-advised by Wellington Management Company LLP) | | Investment objective – The Fund seeks long-term total return. |
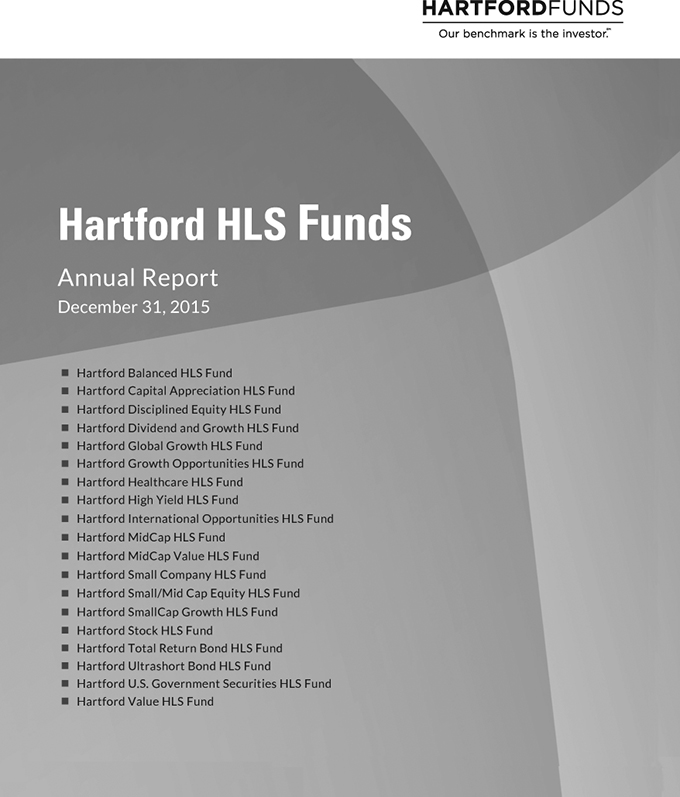
The chart above represents the hypothetical growth of a $10,000 investment in Class IA. Growth results in classes other than Class IA will vary from what is seen above due to differences in the expenses charged to those share classes.
Average Annual Total Return (as of 12/31/15)
| | | | | | | | | | | | |
| | | 1 Year | | | 5 Years | | | 10 Years | |
Balanced IA | | | 0.18% | | | | 8.75% | | | | 6.01% | |
Balanced IB | | | -0.07% | | | | 8.48% | | | | 5.75% | |
S&P 500 Index | | | 1.38% | | | | 12.57% | | | | 7.31% | |
Barclays Government/Credit Bond Index | | | 0.15% | | | | 3.39% | | | | 4.47% | |
Bank of America Merrill Lynch 3-Month U.S. Treasury Bill Index | | | 0.05% | | | | 0.07% | | | | 1.24% | |
Balanced HLS Fund Blended Index | | | 1.13% | | | | 8.84% | | | | 6.31% | |
PERFORMANCE DATA QUOTED REPRESENTS PAST PERFORMANCE AND DOES NOT GUARANTEE FUTURE RESULTS. The investment return and principal value of the investment will fluctuate so that investors’ shares, when redeemed, may be worth more or less than their original cost. Current performance may be lower or higher than the performance data quoted. To obtain performance data current to the most recent month-end, please visit our website www.hartfordfunds.com.
Total returns presented above were calculated using the Fund’s net asset value available to shareholders for sale or redemption of Fund shares on December 31, 2015, which may exclude investment transactions as of this date. All share class returns assume the reinvestment of all distributions at net asset value and the deduction of all fund expenses.
S&P 500 Index is a market capitalization-weighted price index composed of 500 widely held common stocks.
Barclays Government/Credit Bond Index is an unmanaged, market-value-weighted index of all debt obligations of the U.S. Treasury and U.S. Government agencies (excluding mortgaged-backed securities) and of all publicly-issued fixed-rate, nonconvertible, investment grade domestic corporate debt.
Bank of America Merrill Lynch 3-Month U.S. Treasury Bill Index is an unmanaged index that tracks the performance of U.S. dollar denominated U.S. Treasury bills publicly issued in the U.S. domestic markets with maturities of 90 days or less that assumes reinvestment of all income.
Balanced HLS Fund Blended Index is calculated by Hartford Funds Management Company, LLC and represents the weighted return of 60% S&P 500 Index, 35% Barclays Government/Credit Bond Index and 5% Bank of America Merrill Lynch 3-Month U.S. Treasury Bill Index.
The indices are unmanaged, and their results include reinvested dividends and/or distributions, but do not reflect the effect of sales charges, commissions, expenses or taxes.
You cannot invest directly in an index.
As shown in the Fund’s current prospectus dated May 1, 2015, the total annual fund operating expense ratios for Class IA and Class IB were 0.65% and 0.90%, respectively. Actual expenses may be higher. Please see the accompanying Financial Highlights for expense ratios for the year ended December 31, 2015.
All investments are subject to risk including the possible loss of principal. For a discussion of the Fund’s risks, please see the Main Risks section of this report. For more detailed information on the risks associated with an investment in the Fund, please see the prospectus.
The chart and table do not reflect the deductions of taxes, sales charges or other fees which may be applied at the variable life insurance, variable annuity or qualified retirement plan product level. Any such additional sales charges or other fees or expenses would lower the contract’s or plan’s performance.
|
| Hartford Balanced HLS Fund |
Manager Discussion
December 31, 2015 (Unaudited)
Portfolio Managers
Karen H. Grimes, CFA
Senior Managing Director and Equity Portfolio Manager
Wellington Management Company LLP
John C. Keogh
Senior Managing Director and Fixed Income Portfolio Manager
Wellington Management Company LLP
Michael E. Stack, CFA
Senior Managing Director and Fixed Income Portfolio Manager
Wellington Management Company LLP
How did the Fund perform during the period?
The Class IA shares of Hartford Balanced HLS Fund returned 0.18% for the twelve-month period ended December 31, 2015, underperforming the Fund’s custom benchmark, 60% S&P 500 Index, 35% Barclays Government/Credit Bond Index, and 5% Bank of America Merrill Lynch 3-Month U.S. Treasury Bill Index, which returned 1.13% for the same period. The S&P 500, Barclays Government/Credit Bond, and Bank of America Merrill Lynch 3-Month U.S. Treasury Bill Indices returned 1.38%, 0.15% and 0.05%, respectively. The Fund outperformed the -1.53% average return of the Lipper Mixed-Asset Target Allocation Growth Funds peer group, a group of funds that hold between 60%-80% in equity securities, with the remainder invested in bonds, cash, and cash equivalents.
Why did the Fund perform this way?
U.S. equities, as measured by the S&P 500 Index, rose for the period, notwithstanding significant volatility. U.S. stocks retreated briefly early in 2015 – the market pulled back in early March as soft manufacturing data, potentially negative currency- and oil-related earnings, and valuation concerns weighed on investors’ minds. However, risk appetites increased after the March 18 Federal Open Market Committee (FOMC) statement underlined the U.S. Federal Reserve’s (Fed) hesitation to raise rates as U.S. domestic inflation remained subdued and other major central banks maintained an easing bias. Stocks ended June on a sour note after negotiations between Greece and its creditors regarding Greece’s loan repayments broke down. During August and September, the market remained extremely volatile and experienced its first correction (a decline of at least 10%) since October 2011. Oil prices and the Energy sector as a whole remained extremely volatile, with prices recovering from the initial drop earlier in the period and falling sharply towards the end of the year. After much anticipation, the Fed delivered its first rate hike since 2006 in December, approving a small increase in the federal funds rate. The equity market initially reacted positively to the news, but remained volatile through the end of the year as investors digested the impact of the rate increase and global economic developments. Within the S&P 500 Index, five of the ten sectors posted positive gains. Consumer Discretionary (+10%),
Healthcare (+7%), and Consumer Staples (+7%) posted the largest gains while Energy (-21%), Materials (-8%), and Utilities (-5%) lagged the broader index.
Fixed income markets were volatile over the twelve-month period as investors dealt with growing divergences in economic growth and central bank policy. With an improving economic outlook in the U.S. relative to the rest of the world, market participants agonized over the timing of the Fed’s first rate hike and its potential market implications during the year. Increased risk of a Greek exit from the Eurozone and a prolonged drop in commodity prices further muddied the picture. Oil prices were extremely volatile over the period, having rebounded from record lows at the start of the year but falling again in the third and fourth quarters of 2015. Meanwhile, an unexpected devaluation in China’s currency rattled global financial markets, deepening fears about the Chinese economic slowdown and potential spillover effects on the global economy.
Many major central banks eased monetary policy during the period with some resorting to aggressive measures to counter deflation and stimulate growth. The European Central Bank (ECB) launched an open-ended government bond-buying program and the Chinese central bank entered into an aggressive monetary easing cycle to counter deflationary risks and slowing growth. As expected, the Fed raised rates in December, which marked an end to a seven-year period of near-zero interest rates, although the Federal Reserve Open Market Committee (FOMC) stated that the pace of interest-rate hikes would be very gradual and dependent on the direction of economic data.
Globally, most credit risk sectors, with the exception of corporates, posted positive absolute returns as coupon income helped offset the impact of rising interest rates and widening bid-ask spreads. Most sectors underperformed duration-equivalent government bonds as spreads generally widened over the volatile period. High yield, in particular, experienced significant volatility on falling oil prices, China slowdown concerns, and a sharp increase in, high yield mutual fund outflows. The Barclays Government/Credit Bond Index returned 0.15% for the period.
|
| Hartford Balanced HLS Fund |
Manager Discussion – (continued)
December 31, 2015 (Unaudited)
The Fund has three primary levers to generate investment performance: equity investments, fixed income investments, and asset allocation among stocks, bonds, and cash. During the period, the equity portion of the Fund underperformed the S&P 500 Index and the fixed income portion of the Fund outperformed the Barclays Government/Credit Bond Index. Asset allocation detracted from benchmark-relative performance during the period. The Fund was generally overweight equities and fixed income and underweight cash relative to the Barclays Government/Credit Bond Index.
Equity underperformance versus the S&P 500 Index was driven primarily by security selection. Security selection in Consumer Discretionary, Energy and Industrials sectors detracted the most from relative performance; this was partially offset by strong selection in Consumer Staples and Financials. Sector allocation, which is a result of our bottom-up stock selection process, contributed positively to performance relative to the S&P 500 Index over the period. An overweight to Healthcare and an underweight to Energy contributed positively to relative performance, while an underweight to Consumer Discretionary and Consumer Staples detracted during the period.
Stocks that detracted the most from relative returns in the equity portion of the Fund during the period were Amazon.com (Consumer Discretionary), Southwestern Energy (Energy), and Marvell Technology (Information Technology). Shares of Amazon.com, a U.S.-based global ecommerce company, rose after the company reported better-than-expected first-quarter results. Not owning benchmark constituent Amazon.com detracted from benchmark-relative results, as the stock rose during the period. Our position in Southwestern Energy, an oil and natural gas company based in Texas, was weighed down by weakness in the Energy market. Moody’s also put several exploration and production companies, including Southwestern Energy, under review, and the stock traded lower on the news. Shares of Marvell, a U.S.-based manufacturer of consumer semiconductor products, fell as earnings were weak in the third quarter due to poor end-market demand and lower revenue in their storage and networking businesses. Accounting concerns have also weighed on the stock as the company has delayed reporting earnings. Marathon Oil (Energy) also detracted from absolute results during the period.
Top contributors to relative performance in the equity portion of the Fund during the period were Maxim Integrated (Information Technology), Kraft Foods (Consumer Staples), and UCB SA (Healthcare). Maxim Integrated, a U.S.-based semiconductor manufacturer, saw its share price rise as the company reported earnings results that were modestly ahead of expectations and provided earnings guidance that implied better than expected sales trends in future quarters. Kraft Foods, a packaged food company, outperformed this year following the news that the company would merge with Heinz in a deal led by 3G Capital and Berkshire Hathaway. The stock price of UCB SA, a Belgium-based pharmaceutical company, rose this year in particular due to a strong
earnings announcement in October. The company posted strong sales of its core drugs, as revenues for the first nine months of the year jumped 19%, and it raised its full year outlook. The Fund’s holdings in Microsoft (Information Technology) and Alphabet (Information Technology) also contributed positively on an absolute basis.
Outperformance of the fixed income portion of the Fund relative to the Barclays Government/Credit Bond Index during the period was driven by security selection in investment grade corporate credit, particularly within Industrials, and non-corporate investment grade credit. Security selection in high yield credit also contributed positively to relative returns. An out-of-benchmark allocation to asset-backed securities (ABS) also modestly contributed to relative returns during the period. The Fund’s duration and yield curve positioning detracted from results relative to the Barclays Government/Credit Bond Index as rates rose across the yield curve.
Derivatives were not used in a significant manner in the Fund during the period and did not have a material impact on performance during the period.
What is the outlook?
Looking forward to 2016, we perceive increased geopolitical uncertainty globally, with increasing tensions in the Middle-East and Russia, as well as the slowdown in China being key recent examples. We expect to continue to seek what we consider to be balance in the portfolio to allow for upside potential while limiting downside risk. For example, in the equity portion of the Fund, while we believe some bank and insurance equities may benefit from prospective rate increases, we maintain exposure to other sectors of the market that are less interest rate sensitive. We are monitoring developments and focusing on company specific catalysts as a basis for each position.
Healthcare and Telecommunication Services represented our largest sector overweight and underweight, respectively, in the equity portion of the Fund at the end of the period. On the fixed income side we ended the period with a moderately pro-cyclical risk posture, continuing to favor financial issuers within investment grade credit. We continued to be underweight U.S. Treasuries and continued to hold out-of-benchmark allocations to agency mortgage-backed securities, commercial mortgage backed securities (CMBS), and ABS.
At the end of the period, the Fund’s equity exposure was at 63% compared to 60% in its benchmark.
|
| Hartford Balanced HLS Fund |
Manager Discussion – (continued)
December 31, 2015 (Unaudited)
Diversification by Security Type
as of December 31, 2015
| | | | |
| Category | | Percentage of
Net Assets | |
Equity Securities | | | | |
Common Stocks | | | 63.4 | % |
| | | | |
Total | | | 63.4 | % |
| | | | |
Fixed Income Securities | | | | |
Asset & Commercial Mortgage Backed Securities | | | 1.7 | % |
Corporate Bonds | | | 17.0 | |
Foreign Government Obligations | | | 0.2 | |
Municipal Bonds | | | 1.3 | |
U.S. Government Agencies | | | 1.0 | |
U.S. Government Securities | | | 14.1 | |
| | | | |
Total | | | 35.3 | % |
| | | | |
Short-Term Investments | | | 1.3 | |
Other Assets & Liabilities | | | 0.0 | |
| | | | |
Total | | | 100.0 | % |
| | | | |
Hartford Capital Appreciation HLS Fund inception 04/02/1984
| | |
| (sub-advised by Wellington Management Company LLP) | | Investment objective – The Fund seeks growth of capital. |
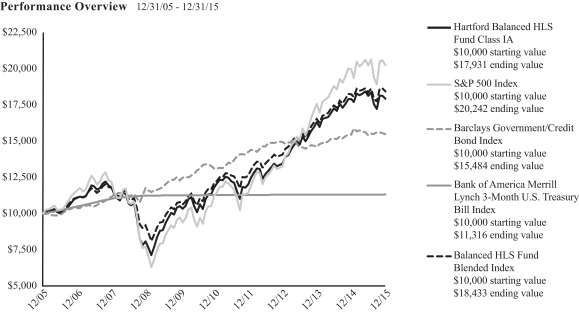
The chart above represents the hypothetical growth of a $10,000 investment in Class IA. Growth results in classes other than Class IA will vary from what is seen above due to differences in the expenses charged to those share classes.
Average Annual Total Return (as of 12/31/15)
| | | | | | | | | | | | |
| | | 1 Year | | | 5 Years | | | 10 Years | |
Capital Appreciation IA | | | 1.02% | | | | 9.59% | | | | 7.11% | |
Capital Appreciation IB | | | 0.79% | | | | 9.32% | | | | 6.85% | |
Capital Appreciation IC | | | 0.53% | | | | 9.05% | | | | 6.58% | |
Russell 3000 Index | | | 0.48% | | | | 12.18% | | | | 7.35% | |
S&P 500 Index | | | 1.38% | | | | 12.57% | | | | 7.31% | |
PERFORMANCE DATA QUOTED REPRESENTS PAST PERFORMANCE AND DOES NOT GUARANTEE FUTURE RESULTS. The investment return and principal value of the investment will fluctuate so that investors’ shares, when redeemed, may be worth more or less than their original cost. Current performance may be lower or higher than the performance data quoted. To obtain performance data current to the most recent month-end, please visit our website www.hartfordfunds.com.
Total returns presented above were calculated using the Fund’s net asset value available to shareholders for sale or redemption of Fund shares on December 31, 2015, which may exclude investment transactions as of this date. All share class returns assume the reinvestment of all distributions at net asset value and the deduction of all fund expenses.
Class IC shares commenced operations on April 30, 2014. Class IC shares performance prior to that date reflects Class IA shares performance adjusted to reflect the 12b-1 fee of 0.25% and the administrative services fee of 0.25% applicable to Class IC shares. The performance after such date reflects actual Class IC shares performance.
Russell 3000 Index is an unmanaged index that measures the performance of the 3,000 largest U.S. companies based on total market capitalization.
S&P 500 Index is a market capitalization-weighted price index composed of 500 widely held common stocks.
The indices are unmanaged, and their results include reinvested dividends and/or distributions, but do not reflect the effect of sales charges, commissions, expenses or taxes.
You cannot invest directly in an index.
As shown in the Fund’s current prospectus dated May 1, 2015, the total annual fund operating expense ratios for Class IA, Class IB and Class IC were 0.66%, 0.91% and 1.16%, respectively. Actual expenses may be higher. Please see the accompanying Financial Highlights for expense ratios for the year ended December 31, 2015.
All investments are subject to risk including the possible loss of principal. For a discussion of the Fund’s risks, please see the Main Risks section of this report. For more detailed information on the risks associated with an investment in the Fund, please see the prospectus.
The chart and table do not reflect the deductions of taxes, sales charges or other fees which may be applied at the variable life insurance, variable annuity or qualified retirement plan product level. Any such additional sales charges or other fees or expenses would lower the contract’s or plan’s performance.
|
| Hartford Capital Appreciation HLS Fund |
Manager Discussion
December 31, 2015 (Unaudited)
Portfolio Managers
Saul J. Pannell, CFA
Senior Managing Director, Equity Portfolio Manager
Wellington Management Company LLP
Gregg R. Thomas, CFA
Senior Managing Director, Associate Director of Investment Strategy & Risk
Wellington Management Company LLP
Kent M. Stahl, CFA
Senior Managing Director, Director of Investment Strategy & Risk
Wellington Management Company LLP
Francis J. Boggan, CFA
Senior Managing Director, Equity Portfolio Manager
Wellington Management Company LLP
Nicolas M. Choumenkovitch
Senior Managing Director, Equity Portfolio Manager
Wellington Management Company LLP
Peter I. Higgins, CFA
Senior Managing Director, Equity Portfolio Manager
Wellington Management Company LLP
Donald J. Kilbride
Senior Managing Director, Equity Portfolio Manager
Wellington Management Company LLP
Philip W. Ruedi, CFA
Senior Managing Director, Equity Portfolio Manager
Wellington Management Company LLP
Stephen Mortimer
Senior Managing Director, Equity Portfolio Manager
Wellington Management Company LLP
David W. Palmer, CFA
Senior Managing Director, Equity Portfolio Manager
Wellington Management Company LLP
How did the Fund perform during the period?
The Class IA shares of Hartford Capital Appreciation HLS Fund returned 1.02% for the twelve-month period ended December 31, 2015, outperforming the Fund’s benchmark, the Russell 3000 Index, which returned 0.48% for the same period and underperformed the Fund’s other benchmark, the S&P 500 Index, which returned 1.38% for the same period. The Fund also outperformed the -2.42% average return of the Lipper Multi-Cap Core Funds peer group, a group of funds with investment strategies similar to those of the Fund.
Why did the Fund perform this way?
U.S. equities, as measured by the S&P 500 Index, rose modestly during the twelve-month period. U.S. stocks retreated briefly early in 2015, but then reached new all-time highs on March 2, April 24, and May 21. The market pulled back in early March as soft manufacturing data, potentially negative currency- and oil-related earnings, and valuation concerns weighed on investors’ minds. However, risk appetite increased after the March 18 Federal Open Market Committee (FOMC) statement underlined the U.S. Federal Reserve’s (Fed) hesitation to raise rates as U.S. domestic inflation remained
|
| Hartford Capital Appreciation HLS Fund |
Manager Discussion – (continued)
December 31, 2015 (Unaudited)
subdued and other major central banks maintained an easing bias. In April, the tech-heavy Nasdaq Composite topped the 5,000 mark for the first time in 15 years and broke its closing record from March 2000. Continued strong merger and acquisition (M&A) activity, a rebound in hiring, and solid housing data helped to fuel risk appetites. May marked the second-best month ever for M&A transactions involving U.S. companies with $234 billion in announced mergers. Stocks ended June on a sour note after negotiations between Greece and its creditors regarding Greece’s loan repayments broke down.
In the second half of the period, the U.S. economy remained on solid footing, with a sharp rebound in Gross Domestic Product (GDP), a seven-year low in unemployment, and a healthy housing market report. While the growth slowdown in China and its implications for global commerce fueled investor anxiety, uncertainty about the Fed’s rate hike timeline also weighed on sentiment. During August and September, the market remained extremely volatile and experienced its first correction (a decline of at least 10%) since October 2011. Oil prices and the Energy sector as a whole remained extremely volatile, with prices recovering from the initial drop earlier in the period and falling sharply towards the end of the year. As many market participants expected, the Fed left rates unchanged at its highly anticipated September meeting. The Fed’s statement appeared to spook some investors as it acknowledged that “recent global economic and financial developments may restrain economic activity somewhat and are likely to put further downward pressure on inflation in the near term.” After much anticipation, the Fed delivered its first rate hike since 2006 in December, approving a small increase in the federal funds rate. The market initially reacted positively to the news, but remained volatile through the end of the year as investors digested the impact of the rate increase and global economic developments.
Returns varied noticeably by market-cap during the period, as small cap (-4%) and mid cap (-2%) equities underperformed large cap (+1%) equities as measured by the Russell 2000, S&P MidCap 400, and S&P 500 Indices, respectively. Within the Russell 3000 Index, Healthcare (+7%), Consumer Discretionary (+6%), and Consumer Staples (+6%) led the index higher while Energy (-23%), Materials (-10%), and Utilities (-5%) lagged on a relative basis during the period.
Sector allocation, a result of our bottom-up security selection process, contributed positively to performance relative to the Russell 3000 Index during the period. An underweight to the Energy sector and an overweight to the Healthcare, Information Technology, and Consumer Discretionary sectors contributed positively to returns relative to the Russell 3000 Index, which was partially offset by an underweight to Consumer Staples. Security selection detracted from performance relative to the Russell 3000 Index during the period. Selection was weakest within the Industrials, Consumer Discretionary, and Materials sectors. This was partially offset by strong selection within the Healthcare and Consumer Staples sectors.
The top contributors to performance relative to the Russell 3000 Index during the period included Activision Blizzard (Information Technology), Bristol-Myers (Healthcare), and Therapeutics MD (Healthcare). Shares of Activision Blizzard, U.S.-based electronic entertainment company, outperformed after it beat earnings forecasts. Shares of Bristol-Myers, a U.S.-based pharmaceutical company, rose during the period after reporting promising clinical trial data for skin cancer drug Opdivo (nivolumab). In addition the company reported better than expected results. Shares of Therapeutics MD, a company that manufactures and distributes products primarily for treating symptoms of menopause related hormone deficiency, outperformed after reporting stronger than expected results from one of their key Phase III trials. Amazon.com (Consumer Discretionary) was among the top absolute contributors during the period.
The largest absolute and relative detractors over the period were Micron Technology (Information Technology), Hertz Global Holding (Industrials), and Southwestern Energy (Energy). Shares of Micron Technology, a semiconductor manufacturer specializing in NAND Flash, Dynamic random-access memory (DRAM), and NOR Flash memory devices, fell amid investor concerns about demand and pricing in the PC market. Hertz Global Holding, a U.S.-based global car and equipment rental company, fell after the current year earnings consensus moved lower over the period. Shares of Southwestern Energy, a U.S.-based energy company engaged in natural gas and oil exploration, development, and production, underperformed due to lower crude prices, compounded by the company’s announcement of disappointing second quarter earnings.
Derivatives were not used in a significant manner in the Fund during the period and did not have a material impact on performance during the period.
What is the outlook?
Despite heightened volatility, we remain broadly positive about the outlook for global markets, driven by ongoing strength in developed economies where we believe buoyant consumption, recovering balance sheets, and accommodative policy should drive moderate growth. While the outlook for growth in China has become a lot more uncertain, we believe that China’s economy continues to grow, albeit at a lower rate of growth, with policy stimulus in areas like housing helping to offset weakness from commodities and exports. Given the increased level of uncertainty around this outcome, we will remain extremely vigilant about developments in this area. At the end of the period, our largest overweights were to the Healthcare, Consumer Discretionary, and Information Technology sectors, while our largest underweights were to Consumer Staples and Energy, relative to the Russell 3000 Index.
|
| Hartford Capital Appreciation HLS Fund |
Manager Discussion – (continued)
December 31, 2015 (Unaudited)
Diversification by Sector
as of December 31, 2015
| | | | |
| Sector | | Percentage of
Net Assets | |
Equity Securities | | | | |
Consumer Discretionary | | | 14.7 | % |
Consumer Staples | | | 5.2 | |
Energy | | | 3.8 | |
Financials | | | 18.2 | |
Health Care | | | 17.5 | |
Industrials | | | 10.3 | |
Information Technology | | | 20.9 | |
Materials | | | 3.7 | |
Telecommunication Services | | | 1.1 | |
Utilities | | | 1.8 | |
| | | | |
Total | | | 97.2 | % |
| | | | |
Short-Term Investments | | | 3.2 | |
Other Assets & Liabilities | | | (0.4 | ) |
| | | | |
Total | | | 100.0 | % |
| | | | |
A sector may be comprised of several industries. For Fund compliance purposes, the Fund may not use the same classification system and these sector classifications are used for financial reporting purposes.
Hartford Disciplined Equity HLS Fund inception 05/29/1998
| | |
| (sub-advised by Wellington Management Company LLP) | | Investment objective – The Fund seeks growth of capital. |
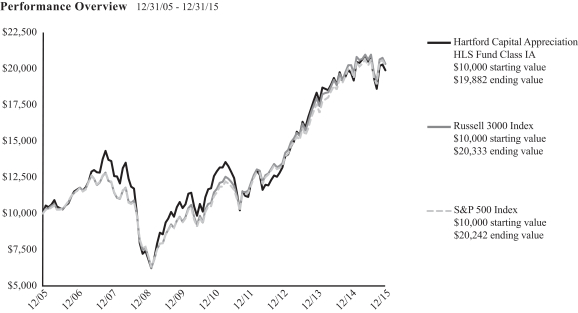
The chart above represents the hypothetical growth of a $10,000 investment in Class IA. Growth results in classes other than Class IA will vary from what is seen above due to differences in the expenses charged to those share classes.
Average Annual Total Return (as of 12/31/15)
| | | | | | | | | | | | |
| | | 1 Year | | | 5 Years | | | 10 Years | |
Disciplined Equity IA | | | 6.83% | | | | 14.94% | | | | 8.19% | |
Disciplined Equity IB | | | 6.59% | | | | 14.65% | | | | 7.92% | |
S&P 500 Index | | | 1.38% | | | | 12.57% | | | | 7.31% | |
PERFORMANCE DATA QUOTED REPRESENTS PAST PERFORMANCE AND DOES NOT GUARANTEE FUTURE RESULTS. The investment return and principal value of the investment will fluctuate so that investors’ shares, when redeemed, may be worth more or less than their original cost. Current performance may be lower or higher than the performance data quoted. To obtain performance data current to the most recent month-end, please visit our website www.hartfordfunds.com.
Total returns presented above were calculated using the Fund’s net asset value available to shareholders for sale or redemption of Fund shares on December 31, 2015, which may exclude investment transactions as of this date. All share class returns assume the reinvestment of all distributions at net asset value and the deduction of all fund expenses.
S&P 500 Index is a market capitalization-weighted price index composed of 500 widely held common stocks.
The index is unmanaged, and its results include reinvested dividends and/or distributions, but do not reflect the effect of sales charges, commissions, expenses or taxes.
You cannot invest directly in an index.
As shown in the Fund’s current prospectus dated May 1, 2015, the total annual fund operating expense ratios for Class IA and Class IB were 0.75% and 1.00%, respectively. Actual expenses may be higher. Please see the accompanying Financial Highlights for expense ratios for the year ended December 31, 2015.
All investments are subject to risk including the possible loss of principal. For a discussion of the Fund’s risks, please see the Main Risks section of this report. For
more detailed information on the risks associated with an investment in the Fund, please see the prospectus.
The chart and table do not reflect the deductions of taxes, sales charges or other fees which may be applied at the variable life insurance, variable annuity or qualified retirement plan product level. Any such additional sales charges or other fees or expenses would lower the contract’s or plan’s performance.
|
| Hartford Disciplined Equity HLS Fund |
Manager Discussion
December 31, 2015 (Unaudited)
Portfolio Manager
Mammen Chally, CFA
Senior Managing Director and Equity Portfolio Manager
Wellington Management Company LLP
How did the Fund perform during the period?
The Class IA shares of Hartford Disciplined Equity HLS Fund returned 6.83% for the twelve-month period ended December 31, 2015, outperforming the Fund’s benchmark, the S&P 500 Index, which returned 1.38% for the same period. The Fund also outperformed the -0.57% average return of the Lipper Large Cap Core Funds peer group, a group of funds with investment strategies similar to those of the Fund.
Why did the Fund perform this way?
U.S. equities, as measured by the S&P 500 Index, rose modestly during the twelve-month period. U.S. stocks retreated briefly early in 2015, but then reached new all-time highs on March 2, April 24, and May 21. The market pulled back in early March as soft manufacturing data, potentially negative currency- and oil-related earnings, and valuation concerns weighed on investors’ minds. However, risk appetites increased after the March 18 Federal Open Market Committee (FOMC) statement underlined the U.S. Federal Reserve’s (Fed) hesitation to raise rates as U.S. domestic inflation remained subdued and other major central banks maintained an easing bias. In April, the tech-heavy Nasdaq Composite topped the 5,000 mark for the first time in 15 years and broke its closing record from March 2000. Continued strong merger and acquisition (M&A) activity, a rebound in hiring, and solid housing data helped to fuel risk appetites. May marked the second-best month ever for M&As involving U.S. companies with $234 billion in announced mergers. Stocks ended June on a sour note after negotiations between Greece and its creditors regarding Greece’s loan repayments broke down.
In the second half of the period, the U.S. economy remained on solid footing, with a sharp rebound in Gross Domestic Product (GDP), a seven-year low in unemployment, and a healthy housing market report. While the growth slowdown in China and its implications for global commerce fueled investor anxiety, uncertainty about the Fed’s rate hike timeline also weighed on sentiment. During August and September, the market remained extremely volatile and experienced its first correction (a decline of at least 10%) since October 2011. Oil prices and the Energy sector as a whole remained extremely volatile, with prices recovering from the initial drop earlier in the period and falling sharply towards the end of the year. As many market participants expected, the Fed left rates unchanged at its highly anticipated September meeting. The Fed’s statement appeared to spook some investors as it acknowledged that “recent global economic and financial developments may restrain economic activity somewhat and are likely to put further downward pressure on inflation in the near term.” After much anticipation, the Fed delivered its first
rate hike since 2006 in December, approving a small increase in the federal funds rate. The market initially reacted positively to the news, but remained volatile through the end of the year as investors digested the impact of the rate increase and global economic developments.
Returns varied noticeably over the period by market-cap, as small cap (-4%) and mid cap (-2%) equities underperformed large cap (+1%) equities as measured by the Russell 2000, S&P MidCap 400, and S&P 500 Indices, respectively. During the twelve-month period, five of the ten sectors within the S&P 500 Index posted positive returns, led by Consumer Discretionary (+10%), Healthcare (+7%), and Consumer Staples (+7%).
The Fund outperformed the S&P 500 Index, during the period primarily due to strong security selection. Strong selection within Information Technology, Consumer Staples, and Industrials more than offset weaker selection within the Consumer Discretionary and Energy sectors. Sector allocation, which is a residual of our bottom-up security selection process, also contributed to relative returns during the period. An underweight allocation to the Energy sector and overweights to the Consumer Staples and Healthcare sectors more than offset the negative impact from an overweight to Utilities and not holding securities in Telecommunication Services.
The largest contributors to performance relative to the S&P 500 Index over the period were Activision Blizzard (Information Technology), Equifax (Industrials), and Omnicare (Healthcare). Shares of Activision Blizzard, a U.S.-based electronic entertainment company, rose during the period on strong earnings results from sales of video game titles. Shares of U.S.-based consumer credit rating agency Equifax rose sharply in February 2015 after management reported record fourth quarter and full year 2014 results. In addition, the board approved a 16% increase in the dividend, the fifth consecutive double-digit annual increase. Shares of Omnicare, a U.S.-based healthcare services company offering long term and specialty care services, rose during the period after it was announced the company was going to be acquired by CVS. The Fund sold out of its position in Omnicare over the period. Owning an overweight position in Alphabet (Information Technology), the U.S.-based holding company for Google, also contributed to absolute returns during the period.
The largest detractors from performance relative to the S&P 500 Index over the period were Amazon.com (Consumer Discretionary), Ralph Lauren (Consumer Discretionary), and Biogen (Healthcare). Shares of Amazon.com, a U.S.-based global ecommerce company, rose during the period, due to record-breaking results for its Prime,
|
| Hartford Disciplined Equity HLS Fund |
Manager Discussion – (continued)
December 31, 2015 (Unaudited)
Original Series, and Devices businesses, and healthy growth in Amazon Web Services, the company’s cloud computing service. Not owning this strong performing benchmark constituent detracted from relative returns during the period. Shares of Ralph Lauren, a U.S.-based producer of apparel, accessories, fragrances, and home furnishings, fell during the period after the company lowered its fiscal-year 2015 revenues guidance. Shares of U.S.-based global biotechnology company Biogen declined over the period due to health care industry-wide concerns about prescription drug prices, and disappointing revenue and earnings results driven by lower than expected sales of the company’s multiple sclerosis treatment. Shares of PVH Corp (Consumer Discretionary), a U.S.-based global apparel company, also detracted from performance on an absolute basis.
Derivatives were not used in a significant manner in the Fund during the period and did not have a material impact on performance during the period.
What is the outlook?
We believe the U.S. economy remains in a period of moderate economic growth, led by a steady expansion of consumption, housing, and technology spending. However, we are starting to have some concerns about the health of the U.S. manufacturing sector. The ISM manufacturing index was below the 50 threshold that indicates expansion in November and December, as the stronger U.S. dollar and weak global demand continued to weigh on manufacturing activity. Ongoing weakness could have negative implications for sectors beyond Industrials. For instance, Financials could be adversely impacted if credit deteriorates in a long-term cycle of manufacturing weakness. Despite this risk, we believe there are plenty of reasons to remain optimistic about the U.S. economy. Employment trends remain very solid, cheap gasoline should support consumption, and housing is unlikely to be derailed by the Fed’s gradual pace of interest rate hikes, in our opinion.
Globally, we believe that China is still a risk and little has changed in that country, despite the recent headlines surrounding its volatile stock market. Chinese manufacturing contracted for the 10th straight month in December, but again, this is not a new development. China registered its slowest quarterly expansion since 2009 as GDP rose 6.9% year over year in the third quarter. The result was slightly higher than the 6.8% forecasted as strength in the services sector helped to offset weaker manufacturing. We may downgrade our view of this market if we begin to see a problem with China’s financial and banking system. To date, we do not see any evidence of this but we continue to monitor the situation closely.
Overall, we continue to find what we consider to be attractively valued stocks with the characteristics we seek. We believe the U.S. economy remains in a period of moderate economic growth, and we continue to monitor policy decisions and economic trends that may impact our holdings. We remain consistent in adhering to our disciplined portfolio construction process that allows us to assess
risk, weight individual positions accordingly, and in the process seek to build a portfolio that focuses largely on stock selection for generating benchmark outperformance relative to the S&P 500. We strongly believe that the portfolio is well-positioned to perform as we look forward to 2016. Based on individual stock decisions, the Fund ended the period most overweight the Consumer Staples and Utilities sectors, and most underweight Energy, Telecommunication Services, and Financials relative to the S&P 500 Index.
Diversification by Sector
as of December 31, 2015
| | | | |
| Sector | | Percentage of
Net Assets | |
Equity Securities | | | | |
Consumer Discretionary | | | 12.5 | % |
Consumer Staples | | | 15.3 | |
Energy | | | 2.1 | |
Financials | | | 14.5 | |
Health Care | | | 15.4 | |
Industrials | | | 8.9 | |
Information Technology | | | 20.5 | |
Materials | | | 3.4 | |
Utilities | | | 4.4 | |
| | | | |
Total | | | 97.0 | % |
| | | | |
Short-Term Investments | | | 2.8 | |
Other Assets & Liabilities | | | 0.2 | |
| | | | |
Total | | | 100.0 | % |
| | | | |
A sector may be comprised of several industries. For Fund compliance purposes, the Fund may not use the same classification system and these sector classifications are used for financial reporting purposes.
Hartford Dividend and Growth HLS Fund inception 03/09/1994
| | |
| (sub-advised by Wellington Management Company LLP) | | Investment objective – The Fund seeks a high level of current income consistent with growth of capital. |
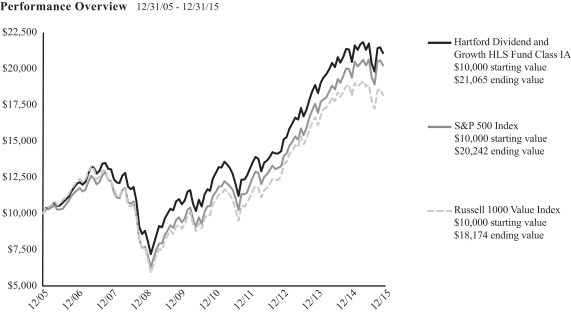
The chart above represents the hypothetical growth of a $10,000 investment in Class IA. Growth results in classes other than Class IA will vary from what is seen above due to differences in the expenses charged to those share classes.
Average Annual Total Return (as of 12/31/15)
| | | | | | | | | | | | |
| | | 1 Year | | | 5 Years | | | 10 Years | |
Dividend and Growth IA | | | -1.16% | | | | 11.13% | | | | 7.73% | |
Dividend and Growth IB | | | -1.41% | | | | 10.85% | | | | 7.47% | |
S&P 500 Index | | | 1.38% | | | | 12.57% | | | | 7.31% | |
Russell 1000 Value Index | | | -3.83% | | | | 11.27% | | | | 6.16% | |
PERFORMANCE DATA QUOTED REPRESENTS PAST PERFORMANCE AND DOES NOT GUARANTEE FUTURE RESULTS. The investment return and principal value of the investment will fluctuate so that investors’ shares, when redeemed, may be worth more or less than their original cost. Current performance may be lower or higher than the performance data quoted. To obtain performance data current to the most recent month-end, please visit our website www.hartfordfunds.com.
Total returns presented above were calculated using the Fund’s net asset value available to shareholders for sale or redemption of Fund shares on December 31, 2015, which may exclude investment transactions as of this date. All share class returns assume the reinvestment of all distributions at net asset value and the deduction of all fund expenses.
S&P 500 Index is a market capitalization-weighted price index composed of 500 widely held common stocks.
Russell 1000 Value Index is an unmanaged index that measures the performance of those Russell 1000 Index companies with lower price-to-book ratios and lower forecasted growth values. The Russell 1000 Index is an unmanaged index that measures the performance of the 1,000 largest companies in the Russell 3000 Index, which measures the performance of the 3,000 largest U.S. companies, based on total market capitalizations.
The indices are unmanaged, and their results include reinvested dividends and/or distributions, but do not reflect the effect of sales charges, commissions, expenses or taxes.
You cannot invest directly in an index.
As shown in the Fund’s current prospectus dated May 1, 2015, the total annual fund operating expense ratios for Class IA and Class IB were 0.67% and 0.92%, respectively. Actual expenses may be higher. Please see the accompanying Financial Highlights for expense ratios for the year ended December 31, 2015.
All investments are subject to risk including the possible loss of principal. For a discussion of the Fund’s risks, please see the Main Risks section of this report. For more detailed information on the risks associated with an investment in the Fund, please see the prospectus.
The chart and table do not reflect the deductions of taxes, sales charges or other fees which may be applied at the variable life insurance, variable annuity or qualified retirement plan product level. Any such additional sales charges or other fees or expenses would lower the contract’s or plan’s performance.
|
| Hartford Dividend and Growth HLS Fund |
Manager Discussion
December 31, 2015 (Unaudited)
Portfolio Managers
Edward P. Bousa, CFA
Senior Managing Director and Equity Portfolio Manager
Wellington Management Company LLP
Donald J. Kilbride
Senior Managing Director and Equity Portfolio Manager
Wellington Management Company LLP
Matthew G. Baker
Senior Managing Director and Equity Portfolio Manager
Wellington Management Company LLP
How did the Fund perform during the period?
The Class IA shares of Hartford Dividend and Growth HLS Fund returned -1.16% for the twelve-month period ended December 31, 2015, underperforming the Fund’s benchmark, the S&P 500 Index, which returned 1.38% for the same period. The Fund outperformed the Russell 1000 Value Index, which returned -3.83% for the same period. The Fund also outperformed the -3.53% average return of the Lipper Equity Income Funds peer group, a group of funds with investment strategies similar to those of the Fund.
Why did the Fund perform this way?
U.S. equities, as measured by the S&P 500 Index, rose modestly during the twelve-month period. U.S. stocks retreated briefly early in 2015, but then reached new all-time highs on March 2, April 24, and May 21. The market pulled back in early March as soft manufacturing data, potentially negative currency- and oil-related earnings, and valuation concerns weighed on investors’ minds. However, risk appetites increased after the March 18 Federal Open Market Committee (FOMC) statement underlined the U.S. Federal Reserve’s (Fed) hesitation to raise rates as U.S. domestic inflation remained subdued and other major central banks maintained an easing bias. In April, the tech-heavy Nasdaq Composite topped the 5,000 mark for the first time in 15 years and broke its closing record from March 2000. Continued strong merger and acquisition (M&A) activity, a rebound in hiring, and solid housing data helped to fuel risk appetites. May marked the second-best month ever for M&As involving U.S. companies with $234 billion in announced mergers. Stocks ended June on a sour note after negotiations between Greece and its creditors regarding Greece’s loan repayments broke down.
In the second half of the period, the U.S. economy remained on solid footing, with a sharp rebound in Gross Domestic Product (GDP), a seven-year low in unemployment, and a healthy housing market report. While the growth slowdown in China and its implications for global commerce fueled investor anxiety, uncertainty about the Fed’s rate hike timeline also weighed on sentiment. During August and September, the market remained extremely volatile and experienced its first correction (a decline of at least 10%) since October 2011. Oil
prices and the Energy sector as a whole remained extremely volatile, with prices recovering from the initial drop earlier in the period and falling sharply towards the end of the year. As many market participants expected, the Fed left rates unchanged at its highly anticipated September meeting. The Fed’s statement appeared to spook some investors as it acknowledged that “recent global economic and financial developments may restrain economic activity somewhat and are likely to put further downward pressure on inflation in the near term.” After much anticipation, the Fed delivered its first rate hike since 2006 in December, approving a small increase in the federal funds rate. The market initially reacted positively to the news, but remained volatile through the end of the year as investors digested the impact of the rate increase and global economic developments.
Returns varied noticeably over the period by market-cap, as small cap (-4%) and mid cap (-2%) equities underperformed large cap (+1%) equities as measured by the Russell 2000, S&P MidCap 400, and S&P 500 Indices, respectively. During the twelve-month period, five of the ten sectors within the S&P 500 Index posted positive returns, led by Consumer Discretionary (+10%), Healthcare (+7%), and Consumer Staples (+7%).
Sector allocation, a result of our bottom up stock selection process, detracted from returns relative to the S&P 500 Index during the period. An underweight to the Consumer Discretionary and Information Technology sectors and an overweight to the Energy sector offset the positive impact of an underweight to Materials and an overweight to the Healthcare sector. Security selection also detracted from benchmark-relative returns during the period. Weak selection within Consumer Discretionary, Utilities, and Consumer Staples was only partially offset by strong selection within Information Technology and Financials.
The Fund’s top detractors from returns relative to the S&P 500 Index were Amazon.com (Consumer Discretionary), Marathon Oil (Energy), and Anadarko Pete (Energy). Shares of Amazon.com, a U.S.-based global ecommerce company, rose during the period, due
|
| Hartford Dividend and Growth HLS Fund |
Manager Discussion – (continued)
December 31, 2015 (Unaudited)
largely to better-than-expected first-quarter results, particularly in Amazon Web Services, the company’s cloud computing service. Not owning the strong performing benchmark constituent detracted from relative returns during the period. Shares of Marathon Oil, a U.S.-based oil and natural gas exploration and production (E&P) company with a major leasehold position in the Eagle Ford Shale formation in South Texas, fell due to a further decline in oil prices. Shares of Anadarko, an independent E&P company, fell during the period due to low commodity prices and the withdrawal of a takeover offer for competitor Apache, which weighed on the stock. Chevron (Energy) also detracted from absolute returns.
The Fund’s top contributors to performance relative to the S&P 500 Index during the period were Eli Lilly (Healthcare), Microsoft (Information Technology), and Kinder Morgan (Energy). Shares of Eli Lilly, a U.S.-based company engaged in the drug manufacturing business, rose during the period as investors anticipated the company would announce positive long-term data on its Alzheimer’s drug. Shares of Microsoft, a U.S.-based developer of software products and services, rose during the period due to increasing optimism that the company’s cloud-based services and Windows 10 operating program could support stronger growth. Kinder Morgan, a pipeline transportation and storage company, underperformed during the period due to weakness in commodity prices. The company’s earnings outlook deteriorated, and management cut the dividend. Not owning the weak-performing benchmark constituent contributed to relative returns during the period. Alphabet (Information Technology) was among the top contributors to absolute performance.
Derivatives were not used in a significant manner in this Fund during this period and did not have a material impact on performance during the period.
What is the outlook?
We believe a sharp decline in oil prices has created a buying opportunity in the very depressed Energy sector. However, timing the bottom in this industry is very difficult, and we feel that it was important to shift to a modest overweight knowing we could be early. Weak global consumption did not slow overall production as quickly as anticipated, which led to heightened uncertainty about oil. During the period, we added to positions in companies we believe will benefit most from what we believe will be an eventual rebound in oil prices. We expect bankruptcies in smaller players to create opportunities for the stronger companies. We believe the price of oil may bottom in the next six to twelve months as oil companies reduce production, and expect the portfolio will be well positioned to advance with the recovery.
Looking ahead to 2016, we continue to seek what we consider to be investment ideas that fit with our process and philosophy. We remain focused on the significance of dividends, positive capital stewardship, and franchise value. We believe we have a solid portfolio of undervalued market leaders, stocks in industries with improving
supply/demand trends, and solid companies that are temporarily out of favor. At the end of the period, our largest overweights were to the Financials and Energy sectors, while we remained underweight the Consumer Discretionary and Information Technology sectors, relative to the S&P 500 Index.
Diversification by Sector
as of December 31, 2015
| | | | |
| Sector | | Percentage of
Net Assets | |
Equity Securities | | | | |
Consumer Discretionary | | | 5.8 | % |
Consumer Staples | | | 8.4 | |
Energy | | | 8.8 | |
Financials | | | 23.0 | |
Health Care | | | 16.5 | |
Industrials | | | 11.9 | |
Information Technology | | | 15.0 | |
Materials | | | 2.3 | |
Telecommunication Services | | | 2.7 | |
Utilities | | | 4.4 | |
| | | | |
Total | | | 98.8 | % |
| | | | |
Short-Term Investments | | | 1.1 | |
Other Assets & Liabilities | | | 0.1 | |
| | | | |
Total | | | 100.0 | % |
| | | | |
A sector may be comprised of several industries. For Fund compliance purposes, the Fund may not use the same classification system and these sector classifications are used for financial reporting purposes.
Hartford Global Growth HLS Fund inception 09/30/1998
| | |
| (sub-advised by Wellington Management Company LLP) | | Investment objective – The Fund seeks growth of capital. |
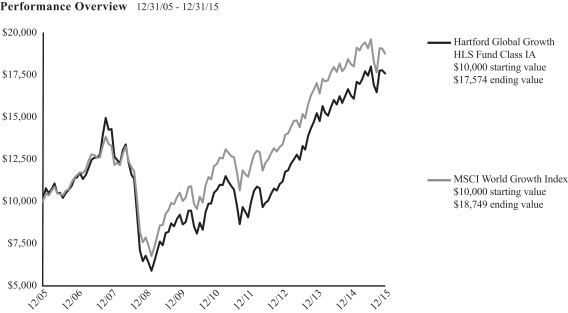
The chart above represents the hypothetical growth of a $10,000 investment in Class IA. Growth results in classes other than Class IA will vary from what is seen above due to differences in the expenses charged to those share classes.
Average Annual Total Return (as of 12/31/15)
| | | | | | | | | | | | |
| | | 1 Year | | | 5 Years | | | 10 Years | |
Global Growth IA | | | 8.04% | | | | 10.82% | | | | 5.80% | |
Global Growth IB | | | 7.76% | | | | 10.54% | | | | 5.54% | |
MSCI World Growth Index | | | 3.50% | | | | 9.19% | | | | 6.49% | |
PERFORMANCE DATA QUOTED REPRESENTS PAST PERFORMANCE AND DOES NOT GUARANTEE FUTURE RESULTS. The investment return and principal value of the investment will fluctuate so that investors’ shares, when redeemed, may be worth more or less than their original cost. Current performance may be lower or higher than the performance data quoted. To obtain performance data current to the most recent month-end, please visit our website www.hartfordfunds.com.
Total returns presented above were calculated using the Fund’s net asset value available to shareholders for sale or redemption of Fund shares on December 31, 2015, which may exclude investment transactions as of this date. All share class returns assume the reinvestment of all distributions at net asset value and the deduction of all fund expenses.
MSCI World Growth Index is a broad-based unmanaged market capitalization-weighted total return index which measures the performance of growth securities in 23 developed-country global equity markets including the United States, Canada, Europe, Australia, New Zealand and the Far East.
The index is unmanaged, and its results include reinvested dividends and/or distributions, but do not reflect the effect of sales charges, commissions, expenses or taxes.
You cannot invest directly in an index.
As shown in the Fund’s current prospectus dated May 1, 2015, the total annual fund operating expense ratios for Class IA and Class IB were 0.81% and 1.06%, respectively. Actual expenses may be higher. Please see the accompanying Financial Highlights for expense ratios for the year ended December 31, 2015.
All investments are subject to risk including the possible loss of principal. For a discussion of the Fund’s risks, please see the Main Risks section of this report. For more detailed information on the risks associated with an investment in the Fund, please see the prospectus.
The chart and table do not reflect the deductions of taxes, sales charges or other fees which may be applied at the variable life insurance, variable annuity or qualified retirement plan product level. Any such additional sales charges or other fees or expenses would lower the contract’s or plan’s performance.
|
| Hartford Global Growth HLS Fund |
Manager Discussion
December 31, 2015 (Unaudited)
Portfolio Managers
Matthew D. Hudson, CFA
Managing Director and Equity Portfolio Manager
Wellington Management Company LLP
John Boselli, CFA
Senior Managing Director and Equity Portfolio Manager
Wellington Management Company LLP
How did the Fund perform during the period?
The Class IA shares of Hartford Global Growth HLS Fund returned 8.04% for the twelve-month period ended December 31, 2015, outperforming the Fund’s benchmark, the MSCI World Growth Index, which returned 3.50% for the same period. The Fund outperformed the 2.59% average return of the Lipper Global Large-Cap Growth Funds peer group, a group of funds with investment strategies similar to those of the Fund.
Why did the Fund perform this way?
Global equities, as measured by the MSCI All Country World Index, fell over the twelve-month period. The rally in stocks that took place toward the beginning of the period came to a halt in the third quarter of 2015 as global equities tumbled. Equities surged in October, but stumbled in November and December and ended the period on a weak note. During the period, U.S. equities outperformed non-U.S. equities and emerging market equities underperformed their developed market counterparts.
Early in the period, there were many negative headlines causing investors to be uneasy. Europe’s economy remained near stall speed, oil prices plunged, Chinese manufacturing data disappointed, and questions again rose around Greece’s future in the European Union. Despite the negative headlines, Europe was a bright spot during the beginning of the period due to further accommodative monetary policy and encouraging economic data, including positive trends in manufacturing, exports, and economic sentiment. During the first half of the fiscal year, the Bank of Japan expanded its quantitative easing policy, the People’s Bank of China surprised markets with further rate cuts, and the European Central Bank (ECB) announced a €1.14 trillion open-ended sovereign debt quantitative easing program to combat record-low inflation and stimulate growth in Europe. In late June, the Greek debt crisis took center stage. Negotiations between Greece and its creditors regarding Greece’s loan repayments broke down and Greece missed its scheduled loan payment due to the International Monetary Fund on June 30.
In the second half of the fiscal year, worries about an economic growth slowdown in China dominated the market narrative. Fears were amplified near the middle of August when China unexpectedly devalued its currency, triggering concerns about global disinflationary trends and a weaker-than-anticipated global growth backdrop. During
September, Chinese manufacturing activity fell to its lowest level since 2009. Risk appetites were also dampened by the ECB’s cut in its Eurozone growth and inflation outlook and the downgrade of Brazil’s debt to below investment-grade. Global equities rallied in October amid increasing signs of extended monetary policy accommodation by major central banks. After much anticipation, the U.S. Federal Reserve (Fed) delivered its first rate hike since 2006 in December, approving a small increase in the federal funds rate. The market initially reacted positively to the news, but remained volatile through the end of the year as investors digested the impact of the rate increase and global economic development.
For the twelve-month period, growth stocks (+3.5%) outperformed value stocks (-4.11%) as measured by the MSCI World Growth Index and the MSCI World Value Index, respectively. Within the MSCI World Growth Index, six of ten sectors posted positive returns for the year. Consumer staples (+10%), Consumer Discretionary (+8%), and Healthcare (+8%) gained the most, while the Energy (-23%), Materials (-7%), and Industrials (-2%) sectors lagged the most on a relative basis.
The Fund’s outperformance relative to the MSCI World Growth Index was driven primarily by security selection, which contributed positively to relative results within all but two sectors. Selection within Consumer Discretionary and Healthcare was especially strong, more than offsetting weak selection within Industrials and Utilities. Sector allocation, a result of bottom-up security selection, also contributed to relative results over the period. Underweights to Energy, Industrials, and Materials contributed to relative performance, which was partially offset by an overweight to Financials and an underweight to Consumer Discretionary, which detracted from performance.
Top contributors to relative performance included Amazon (Consumer Discretionary), Activision Blizzard (Information Technology), and Pandora (Consumer Discretionary). Shares of Amazon, a U.S.-based online e-commerce company, rose on healthy results from the U.S. retail side of the business. In addition, results have been driven by stronger than expected growth in Amazon Web Service (“AWS”). AWS is an early leader in the relatively small but fast growing segment of the cloud-computing services sector. The share price of Activision Blizzard, a U.S.-based video gaming company, increased after successive quarterly earnings releases that
|
| Hartford Global Growth HLS Fund |
Manager Discussion – (continued)
December 31, 2015 (Unaudited)
beat market expectations. The company also announced plans to acquire King Digital Entertainment as it seeks to increase its mobile gaming offerings. Shares of Denmark-based jewelry maker Pandora rose over the period. Pandora’s products, particularly bracelets and charms, benefited from repeat customer purchases. The company also experienced high organic revenue growth, which was driven by product expansion and store growth, particularly in underpenetrated regions. Alphabet (Information Technology), formerly known as Google, was a top absolute contributor during the period.
The top detractors from the Fund’s relative performance were Baidu (Information Technology), Alibaba (Information Technology), and ICICI Bank (Financials). Baidu, a leading Chinese-language Internet search provider, underperformed due to lower than expected earnings and continued concern around ability to crystalize margin expansion. Shares of Alibaba, a leading Chinese e-commerce company, declined due to more stock becoming ‘unlocked’ after the company’s initial public offering. We eliminated our positions in both Baidu and Alibaba during the period. The stock price of ICICI Bank, an Indian-based banking and financial services company, fell over the year as revenues fell short of expectations amid a strengthening U.S. Dollar and overall weakness within Indian equities. Top absolute detractors also included F5 Networks (Information Technology).
Derivatives were not used in a significant manner in the Fund during the period and did not have a material impact on performance during the period.
What is the outlook?
The global macroeconomic indicators that we track continue to point to slower growth, particularly in the large emerging markets of Brazil, Russia, and China where economic weakness has led to lower commodity pricing. We see relatively better growth in the U.S., where growth in U.S. gross domestic product is accelerating due to increased technology spending. Low inflation and energy prices plus an improving labor market and real wage growth support consumer confidence in the U.S. We remain sanguine about the impact from the Fed’s well-telegraphed and slow increase in interest rates which remain at the very low end of the historical range.
We believe the European economy continues to improve slowly, benefiting from lower energy and import prices and loose monetary policies which support stronger retail sales and housing activity. Bigger picture, however, we continue to be skeptical of Europe’s monetary union without a fiscal union or a unified decision-making authority to collect and spend taxes as well as unfavorable business regulations that weigh on economic growth.
Around the world, the risks that we are monitoring show higher stress in the credit system. Despite positive U.S. economic indicators, we have observed rising junk bond yields. In emerging markets, credit default swap spreads also have increased. We are increasingly concerned about the expanding credit bubble in China. Excess
investment, high inventory, and tightening financial conditions with capital outflows and currency weakness all contribute to potential economic instability. We believe the Chinese government must resolve bad debts in the banking system soon to heal the credit cycle. Declining industry beer volumes, lower electricity consumption, weaker employment, and lower industrial production, in our opinion point to a slowing economy while it transitions from capital-intensive heavy industry to being more services-oriented. Financial risks in China weigh on the entire Asian region. Japan is in a technical recession following two quarters of negative growth in gross domestic product. Japan exports heavily to China and the Pacific Rim and thus is heavily exposed to China’s slowdown.
Our focus remains on stock selection that is driven by bottom-up, fundamental research, diligent meetings with the management of what we believe to be high quality, leading companies globally, and leveraging the deep research capabilities of our firm. Amidst the macro debates around the world (oil, currencies, China, monetary policy) and the volatility, we believe there should also be good opportunities. At the end of the period, our largest sector overweights continued to be to the Information Technology, Financials and Healthcare while we were most underweight Industrials, Materials, and Consumer Discretionary, relative to the MSCI World Growth Index.
Diversification by Country
as of December 31, 2015
| | | | |
| Country | | Percentage of
Net Assets | |
Belgium | | | 1.5 | % |
British Virgin Islands | | | 0.0 | |
Canada | | | 0.6 | |
China | | | 2.2 | |
Denmark | | | 1.8 | |
France | | | 1.4 | |
Germany | | | 2.3 | |
Hong Kong | | | 0.6 | |
India | | | 0.5 | |
Ireland | | | 1.6 | |
Israel | | | 1.4 | |
Italy | | | 0.6 | |
Japan | | | 5.0 | |
Netherlands | | | 0.6 | |
Portugal | | | 0.6 | |
Sweden | | | 1.1 | |
Switzerland | | | 3.7 | |
Taiwan | | | 1.0 | |
United Kingdom | | | 9.8 | |
United States | | | 62.3 | |
Short-Term Investments | | | 1.2 | |
Other Assets & Liabilities | | | 0.2 | |
| | | | |
Total | | | 100.0 | % |
| | | | |
Hartford Growth Opportunities HLS Fund inception 03/24/1987
| | |
(sub-advised by Wellington Management Company LLP) | | Investment objective – The Fund seeks capital appreciation. |
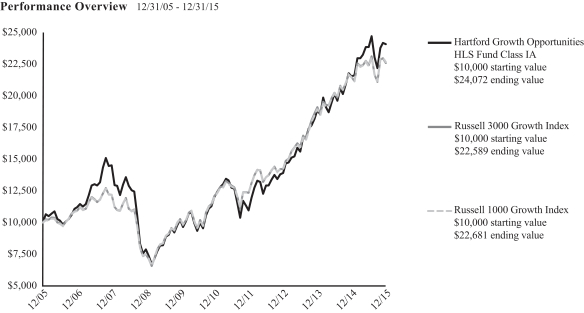
The chart above represents the hypothetical growth of a $10,000 investment in Class IA. Growth results in classes other than Class IA will vary from what is seen above due to differences in the expenses charged to those share classes.
Average Annual Total Return (as of 12/31/15)
| | | | | | | | | | | | |
| | | 1 Year | | | 5 Years | | | 10 Years | |
Growth Opportunities IA | | | 11.74% | | | | 14.89% | | | | 9.18% | |
Growth Opportunities IB | | | 11.47% | | | | 14.60% | | | | 8.91% | |
Growth Opportunities IC | | | 11.18% | | | | 14.32% | | | | 8.64% | |
Russell 3000 Growth Index | | | 5.09% | | | | 13.30% | | | | 8.49% | |
Russell 1000 Growth Index | | | 5.67% | | | | 13.53% | | | | 8.53% | |
PERFORMANCE DATA QUOTED REPRESENTS PAST PERFORMANCE AND DOES NOT GUARANTEE FUTURE RESULTS. The investment return and principal value of the investment will fluctuate so that investors’ shares, when redeemed, may be worth more or less than their original cost. Current performance may be lower or higher than the performance data quoted. To obtain performance data current to the most recent month-end, please visit our website www.hartfordfunds.com.
Total returns presented above were calculated using the Fund’s net asset value available to shareholders for sale or redemption of Fund shares on December 31, 2015, which may exclude investment transactions as of this date. All share class returns assume the reinvestment of all distributions at net asset value and the deduction of all fund expenses.
Class IC shares commenced operations on April 30, 2014. Class IC shares performance prior to that date reflects Class IA shares performance adjusted to reflect the 12b-1 fee of 0.25% and the administrative services fee of 0.25% applicable to Class IC shares. The performance after such date reflects actual Class IC shares performance.
Russell 3000 Growth Index is an unmanaged index that measures the performance of those Russell 3000 Index companies with higher price-to-book ratios and higher forecasted growth values. The Russell 3000 Index is an unmanaged index that measures the performance of the 3,000 largest U.S. companies based on total market capitalization.
Russell 1000 Growth Index is an unmanaged index that measures the performance of those Russell 1000 Index companies with higher price-to-book ratios and higher forecasted growth values. The Russell 1000 Index is an unmanaged index that
measures the performance of the 1,000 largest companies in the Russell 3000 Index, which measures the performance of the 3,000 largest U.S. companies based on total market capitalization.
The indices are unmanaged, and their results include reinvested dividends and/or distributions, but do not reflect the effect of sales charges, commissions, expenses or taxes.
You cannot invest directly in an index.
As shown in the Fund’s current prospectus dated May 1, 2015, the total annual fund operating expense ratios for Class IA, Class IB and Class IC were 0.64%, 0.89% and 1.14%, respectively. Actual expenses may be higher. Please see the accompanying Financial Highlights for expense ratios for the year ended December 31, 2015.
All investments are subject to risk including the possible loss of principal. For a discussion of the Fund’s risks, please see the Main Risks section of this report. For more detailed information on the risks associated with an investment in the Fund, please see the prospectus.
The chart and table do not reflect the deductions of taxes, sales charges or other fees which may be applied at the variable life insurance, variable annuity or qualified retirement plan product level. Any such additional sales charges or other fees or expenses would lower the contract’s or plan’s performance.
|
| Hartford Growth Opportunities HLS Fund |
Manager Discussion
December 31, 2015 (Unaudited)
Portfolio Managers
Michael T. Carmen, CFA
Senior Managing Director and Equity Portfolio Manager
Wellington Management Company LLP
Mario E. Abularach, CFA
Senior Managing Director and Equity Research Analyst
Wellington Management Company LLP
Stephen Mortimer
Senior Managing Director and Equity Portfolio Manager
Wellington Management Company LLP
How did the Fund perform during the period?
The Class IA shares of Hartford Growth Opportunities HLS Fund returned 11.74% for the twelve-month period ended December 31, 2015, outperforming the Fund’s benchmarks, the Russell 3000 Growth Index, which returned 5.09% for the same period, and the Russell 1000 Growth Index, which returned 5.67% for the same period. The Fund also outperformed the 2.17% average return of the Lipper Multi-Cap Growth Funds peer group, a group of funds with investment strategies similar to those of the Fund.
Why did the Fund perform this way?
U.S. equities, as measured by the S&P 500 Index, rose modestly during the twelve-month period. U.S. stocks retreated briefly early in 2015, but then reached new all-time highs on March 2, April 24, and May 21. The market pulled back in early March as soft manufacturing data, potentially negative currency- and oil-related earnings, and valuation concerns weighed on investors’ minds. However, risk appetites increased after the March 18 Federal Open Market Committee (FOMC) statement underlined the U.S. Federal Reserve’s (Fed) hesitation to raise rates as U.S. domestic inflation remained subdued and other major central banks maintained an easing bias. In April, the tech-heavy Nasdaq Composite topped the 5,000 mark for the first time in 15 years and broke its closing record from March 2000. Continued strong merger and acquisition (M&A) activity, a rebound in hiring, and solid housing data helped to fuel risk appetites. May marked the second-best month ever for M&As involving U.S. companies with $234 billion in announced mergers. Stocks ended June on a sour note after negotiations between Greece and its creditors regarding Greece’s loan repayments broke down.
In the second half of the period, the U.S. economy remained on solid footing, with a sharp rebound in Gross Domestic Product (GDP), a seven-year low in unemployment, and a healthy housing market report. While the growth slowdown in China and its implications for global commerce fueled investor anxiety, uncertainty about the Fed’s rate hike timeline also weighed on sentiment. During August and September, the market remained extremely volatile and experienced its first correction (a decline of at least 10%) since October 2011. Oil
prices and the Energy sector as a whole remained extremely volatile, with prices recovering from the initial drop earlier in the period and falling sharply towards the end of the year. As many market participants expected, the Fed left rates unchanged at its highly anticipated September meeting. The Fed’s statement appeared to spook some investors as it acknowledged that “recent global economic and financial developments may restrain economic activity somewhat and are likely to put further downward pressure on inflation in the near term.” After much anticipation, the Fed delivered its first rate hike since 2006 in December, approving a small increase in the federal funds rate. The market initially reacted positively to the news, but remained volatile through the end of the year as investors digested the impact of the rate increase and global economic developments.
Returns varied noticeably by market-cap during the period, as large cap (+1%) equities outperformed small cap (-4%) and mid cap (-2%) equities as measured by the S&P 500, Russell 2000, and S&P MidCap 400 Indices, respectively. Six out of ten sectors in the Russell 3000 Growth Index rose during the period. The Consumer Staples (+11%), Consumer Discretionary (+10%), and Information Technology (+9%) sectors gained the most while Energy (-38%) and Materials (-8%) were the weakest.
Security selection was the main driver of outperformance relative to the Russell 3000 Growth Index during the period. Security selection was strongest in the Consumer Discretionary, Information Technology, and Healthcare sectors and offset slightly by weaker stock selection in Consumer Staples and Materials. Sector allocation, a result of the bottom-up stock selection process, also contributed to benchmark-relative performance over the period, largely due to an underweight in Materials and overweight in Information Technology, which was only partially offset by the negative impact of an underweight to Consumer Staples.
The top contributors to performance relative to the Russell 3000 Growth Index during the period were Amazon.com (Consumer Discretionary), Netflix (Consumer Discretionary), and Uber (Information Technology). Shares of Amazon.com, a U.S.-based
|
| Hartford Growth Opportunities HLS Fund |
Manager Discussion – (continued)
December 31, 2015 (Unaudited)
global ecommerce company, outperformed as investors reacted favorably to strong profitability and improved gross margins, sending the shares higher over the period. Shares of Netflix, a subscription internet streaming company, more than doubled during the year as growth in international markets was stronger than expected. Shares of Uber Technologies, a private technology company that provides an innovative and disruptive ridesharing service, rose due to its continued growth trajectory. Facebook (Information Technology) was among other top absolute contributors. In aggregate, the Fund’s investments in private companies were a positive contributor to relative performance.
The top absolute and relative detractors from performance during the period included GoPro (Consumer Discretionary), Platform Specialty (Materials), and Baidu (Information Technology). Shares of GoPro, a U.S.-based company that produces mountable and wearable cameras and accessories, declined due a significant slowdown in sales and a delay in the release of its new product line. Shares of Platform Specialty, a U.S.-based chemical company, fell due to earnings weakness attributable the slowdown in global growth and the rising cost of capital which has an outsized impact on this acquisition driven growth company. Shares of Baidu, a leading Chinese-language Internet search provider, fell due to lack of margin expansion during the period and increasing competition.
Derivatives were not used in a significant manner in the Fund during the period and did not have a material impact on performance during the period.
What is the outlook?
Despite market concerns regarding the outlook for global growth at the end of the period, the U.S. economy remained on solid footing with healthy consumer confidence, robust employment and a strong housing market. We remain constructive on the U.S. economy for 2016. The long awaited liftoff in rates in the U.S. began in December. We expect any further increases in interest rates to be a gradual process and while something to watch, it hasn’t triggered a material change to portfolio holdings at this point.
At the end of the period, the Fund was most overweight the Healthcare and Financials sectors and most underweight the Consumer Discretionary and Consumer Staples sectors relative to the Russell 3000 Growth Index.
Diversification by Sector
as of December 31, 2015
| | | | |
| Sector | | Percentage of
Net Assets | |
Equity Securities | | | | |
Consumer Discretionary | | | 14.4 | % |
Consumer Staples | | | 5.5 | |
Energy | | | 1.1 | |
Financials | | | 10.8 | |
Health Care | | | 23.3 | |
Industrials | | | 11.2 | |
Information Technology | | | 31.9 | |
Materials | | | 1.2 | |
| | | | |
Total | | | 99.4 | % |
| | | | |
Fixed Income Securities | | | | |
Corporate Bonds | | | 0.1 | % |
Short-Term Investments | | | 0.8 | |
Other Assets & Liabilities | | | (0.3 | ) |
| | | | |
Total | | | 100.0 | % |
| | | | |
A sector may be comprised of several industries. For Fund compliance purposes, the Fund may not use the same classification system and these sector classifications are used for financial reporting purposes.
Hartford Healthcare HLS Fund inception 05/01/2000
| | |
(sub-advised by Wellington Management Company LLP) | | Investment objective – The Fund seeks long-term capital appreciation. |

The chart above represents the hypothetical growth of a $10,000 investment in Class IA. Growth results in classes other than Class IA will vary from what is seen above due to differences in the expenses charged to those share classes.
Average Annual Total Return (as of 12/31/15)
| | | | | | | | | | | | |
| | | 1 Year | | | 5 Years | | | 10 Years | |
Healthcare IA | | | 13.21% | | | | 23.45% | | | | 12.71% | |
Healthcare IB | | | 12.98% | | | | 23.14% | | | | 12.43% | |
S&P North American Health Care Sector Index | | | 6.72% | | | | 20.85% | | | | 11.31% | |
S&P 500 Index | | | 1.38% | | | | 12.57% | | | | 7.31% | |
PERFORMANCE DATA QUOTED REPRESENTS PAST PERFORMANCE AND DOES NOT GUARANTEE FUTURE RESULTS. The investment return and principal value of the investment will fluctuate so that investors’ shares, when redeemed, may be worth more or less than their original cost. Current performance may be lower or higher than the performance data quoted. To obtain performance data current to the most recent month-end, please visit our website www.hartfordfunds.com.
Total returns presented above were calculated using the Fund’s net asset value available to shareholders for sale or redemption of Fund shares on December 31, 2015, which may exclude investment transactions as of this date. All share class returns assume the reinvestment of all distributions at net asset value and the deduction of all fund expenses.
S&P North American Health Care Sector Index is a modified capitalization-weighted index based on United States headquartered health care companies. Stocks in the index are weighted such that each stock is no more than 7.5% of the market capitalization as of the most recent reconstitution date. The companies included in the index must be common stocks and be traded on the NYSE MKT LLC, Nasdaq or the New York Stock Exchange and meet certain established market capitalization levels.
S&P 500 Index is a market capitalization-weighted price index composed of 500 widely held common stocks.
The indices are unmanaged, and their results include reinvested dividends and/or distributions, but do not reflect the effect of sales charges, commissions, expenses or taxes.
You cannot invest directly in an index.
As shown in the Fund’s current prospectus dated May 1, 2015, the total annual fund operating expense ratios for Class IA and Class IB were 0.88% and 1.13%, respectively. Actual expenses may be higher. Please see the accompanying Financial Highlights for expense ratios for the year ended December 31, 2015.
All investments are subject to risk including the possible loss of principal. For a discussion of the Fund’s risks, please see the Main Risks section of this report. For more detailed information on the risks associated with an investment in the Fund, please see the prospectus.
The chart and table do not reflect the deductions of taxes, sales charges or other fees which may be applied at the variable life insurance, variable annuity or qualified retirement plan product level. Any such additional sales charges or other fees or expenses would lower the contract’s or plan’s performance.
|
| Hartford Healthcare HLS Fund |
Manager Discussion
December 31, 2015 (Unaudited)
Portfolio Managers
Jean M. Hynes, CFA
Senior Managing Director and Global Industry Analyst
Wellington Management Company LLP
Ann C. Gallo
Senior Managing Director and Global Industry Analyst
Wellington Management Company LLP
Kirk J. Mayer, CFA
Senior Managing Director and Global Industry Analyst
Wellington Management Company LLP
Robert L. Deresiewicz
Senior Managing Director and Global Industry Analyst
Wellington Management Company LLP
How did the Fund perform during the period?
The Class IA shares of Hartford Healthcare HLS Fund returned 13.21%, for the twelve-month period ended December 31, 2015, outperforming the Fund’s benchmark, the S&P North American Healthcare Sector Index, which returned 6.72% for the same period. The Fund also outperformed the S&P 500 Index, which returned 1.38% for the same period. The Fund also outperformed the 9.07% average return of the Lipper Global Health and Biotechnology peer group, a group of funds with investment strategies similar to those of the Fund.
Why did the Fund perform this way?
Health care stocks (+7%) outperformed both the broader U.S. market (+1%) and the global equity market (0%) during the period, as measured by the S&P North American Healthcare Sector Index, S&P 500 Index and the MSCI World Index, respectively. Within the S&P North American Health Care Sector Index, small cap biopharma returned (-29%), mid cap biopharma returned (+8%), and large cap biopharma returned (+5%), while medical technology returned (+8%) and health services returned (+8%) as well during the period.
The Fund outperformed the S&P North American Health Care Sector Index over the period due primarily to positive security selection. Security selection was especially strong within biopharma across all three capitalization subcategories. Security selection was also positive in health care services over the period. Security selection within medical technology had a negative impact on benchmark-relative performance as did overall sector allocation. Overweights to small cap biopharma and a modest cash position in an upward trending market environment detracted from relative results during the period, more than offsetting an underweight to large cap biopharma and an overweight to medical technology which contributed positively to performance relative to the S&P North American Health Care Sector Index.
Anacor Pharmaceuticals (mid cap biopharma), Galapagos (mid cap biopharma), and Shionogi (large cap biopharma) contributed most to results relative to the S&P North American Health Care Sector Index over the period. Shares of Anacor Pharmaceuticals, a U.S.-based biopharmaceutical company focused on discovering, developing and commercializing small-molecule therapeutics, rose in response to news that its topical treatment for nail fungus was approved. Shares of Galapagos, a Belgium-based biotechnology company, rose as excitement builds for several candidates in their drug pipeline, which include treatments for rheumatoid arthritis and cystic fibrosis. Shares of Shionogi, a Japan-based pharmaceutical firm, rose as the company benefited from continued strength in their HIV franchise. Bristol-Myers Squibb (large cap biopharma) was also a top contributor to absolute performance during the period, driven by strong momentum in their immuno-oncology franchise.
Tetraphase (small cap biopharma), Everyday Health (small cap biopharma), and Arena (small cap biopharma) were the top detractors from performance relative to the S&P North American Health Care Sector Index. Shares of Tetraphase, a U.S.-based clinical stage biopharmaceutical company focused on the development of antibiotics, fell after a Phase 3 study for a drug in their development pipeline missed a primary endpoint. Everyday Health, a U.S.-based owner of a collection of consumer health information websites, saw its share price decline over the period as a result of execution challenges that impacted recent earnings results. Shares of Arena, a clinical-stage biopharmaceutical company based in the U.S., also fell on concerns for the outlook of their weight loss and smoking cessation drug. Cepheid (mid cap biopharma) was a top detractor from absolute performance during the period.
Derivatives were not used in a significant manner in the Fund during the period and did not have a material impact on performance during the period.
|
| Hartford Healthcare HLS Fund |
Manager Discussion – (continued)
December 31, 2015 (Unaudited)
What is the outlook?
Looking forward, we expect more choppiness for the Healthcare sector in 2016. A number of issues may weigh on performance, including global macro factors as well as domestic political considerations, in particular related to pharmaceutical pricing.
For this period of potential market turmoil, our strategy is unchanged: namely, to seek to identify what we consider to be innovative companies that offer meaningful value to the healthcare system. In the biopharma space, our current preference, on the margin, is for mature companies with strong revenue growth, ample cash, and innovative and exciting pipelines. In healthcare products and services, we seek companies that will benefit from and/or facilitate the transition from a fee-for-service-based to a fee-for-value-based health care system.
We remain optimistic about the Healthcare sector overall. We believe that biomedical innovation is as robust as it has ever been. Evolving structures of healthcare markets globally may create clear performance separation between the best and the worst health care services companies. We believe that our approach of evaluating secular themes across a long time horizon will enable us to capitalize on these trends. As is our practice, we will aim to trim stocks on strength and to add on weakness in order to seek to generate favorable returns while minimizing risk.
Diversification by Sector
as of December 31, 2015
| | | | |
| Sector | | Percentage of
Net Assets | |
Equity Securities | | | | |
Consumer Staples | | | 1.3 | % |
Health Care | | | 96.1 | |
Information Technology | | | 0.2 | |
| | | | |
Total | | | 97.6 | % |
| | | | |
Short-Term Investments | | | 2.0 | |
Other Assets & Liabilities | | | 0.4 | |
| | | | |
Total | | | 100.0 | % |
| | | | |
A sector may be comprised of several industries. For Fund compliance purposes, the Fund may not use the same classification system and these sector classifications are used for financial reporting purposes.
Hartford High Yield HLS Fund inception 09/30/1998
| | |
(sub-advised by Wellington Management Company LLP) | | Investment objective – The Fund seeks to provide high current income, and long-term total return. |
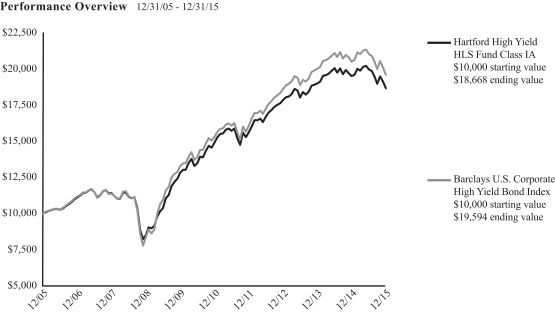
The chart above represents the hypothetical growth of a $10,000 investment in Class IA. Growth results in classes other than Class IA will vary from what is seen above due to differences in the expenses charged to those share classes.
Average Annual Total Return (as of 12/31/15)
| | | | | | | | | | | | |
| | | 1 Year | | | 5 Years | | | 10 Years | |
High Yield IA | | | -4.30% | | | | 4.57% | | | | 6.44% | |
High Yield IB | | | -4.56% | | | | 4.30% | | | | 6.17% | |
Barclays U.S. Corporate High Yield Bond Index | | | -4.47% | | | | 5.04% | | | | 6.96% | |
PERFORMANCE DATA QUOTED REPRESENTS PAST PERFORMANCE AND DOES NOT GUARANTEE FUTURE RESULTS. The investment return and principal value of the investment will fluctuate so that investors’ shares, when redeemed, may be worth more or less than their original cost. Current performance may be lower or higher than the performance data quoted. To obtain performance data current to the most recent month-end, please visit our website www.hartfordfunds.com.
Total returns presented above were calculated using the Fund’s net asset value available to shareholders for sale or redemption of Fund shares on December 31, 2015, which may exclude investment transactions as of this date. All share class returns assume the reinvestment of all distributions at net asset value and the deduction of all fund expenses.
Performance information includes performance under the Fund’s previous sub-adviser, Hartford Investment Management Company. As of March 5, 2012, Hartford Investment Management Company no longer served as the sub-adviser to the Fund.
Barclays U.S. Corporate High Yield Bond Index is an unmanaged broad-based market-value-weighted index that tracks the total return performance of non-investment grade, fixed-rate, publicly placed, dollar denominated and nonconvertible debt registered with the Securities and Exchange Commission.
The index is unmanaged, and its results include reinvested dividends and/or distributions, but do not reflect the effect of sales charges, commissions, expenses or taxes.
You cannot invest directly in an index.
As shown in the Fund’s current prospectus dated May 1, 2015, the total annual fund operating expense ratios for Class IA and Class IB were 0.75% and 1.00%, respectively. Actual expenses may be higher. Please see the accompanying Financial Highlights for expense ratios for the year ended December 31, 2015.
All investments are subject to risk including the possible loss of principal. For a discussion of the Fund’s risks, please see the Main Risks section of this report. For more detailed information on the risks associated with an investment in the Fund, please see the prospectus.
The chart and table do not reflect the deductions of taxes, sales charges or other fees which may be applied at the variable life insurance, variable annuity or qualified retirement plan product level. Any such additional sales charges or other fees or expenses would lower the contract’s or plan’s performance.
|
| Hartford High Yield HLS Fund |
Manager Discussion
December 31, 2015 (Unaudited)
Portfolio Managers
Christopher A. Jones, CFA
Senior Managing Director and Fixed Income Portfolio Manager
Wellington Management Company LLP
David Marshak
Managing Director and Fixed Income Portfolio Manager
Wellington Management Company LLP
How did the Fund perform during the period?
The Class IA shares of Hartford High Yield HLS Fund returned -4.30% for the twelve-month period ended December 31, 2015, outperforming the Fund’s benchmark, the Barclays U.S. Corporate High Yield Bond Index, which returned -4.47% for the same period. The Fund underperformed the -4.01% average return of the Lipper High Yield Funds peer group, a group of funds with investment strategies similar to those of the Fund.
Why did the Fund perform this way?
Fixed income markets were volatile over the twelve-month period as investors dealt with growing divergences in economic growth and central bank policy. With an improving economic outlook in the U.S. relative to the rest of the world, market participants agonized over the timing of the U.S. Federal Reserve Bank’s (Fed) first rate hike and its potential market implications. Increased risk of a Greek exit from the Eurozone and a prolonged drop in commodity prices further muddied the picture. Oil prices were extremely volatile over the period, having rebounded from record lows at the start of the year but falling again in the third and fourth quarters of 2015. Meanwhile, an unexpected devaluation in China’s currency rattled global financial markets, deepening fears about the Chinese economic slowdown and potential spillover effects on the global economy.
Many major central banks eased monetary policy during the period with some resorting to aggressive measures to counter deflation and stimulate growth. In the first half of the period, the European Central Bank (ECB) launched an open-ended government bond-buying program, which prompted other central banks to act to stop their currencies from appreciating. In China, the central bank entered into an aggressive monetary easing cycle to counter deflationary risks and slowing growth. Sub-trend growth and low inflation kept the Bank of England from enacting policy changes while the Fed charted a course for the end of quantitative easing.
Growth in the major developed markets stabilized in 2015 while emerging market growth languished, held back by a slowdown in Asia. Economic data in the Eurozone both improved and broadened out across countries; however, inflationary pressures were non-existent. The U.K. and Japan showed little sign of increased inflation despite the continued strength in their respective labor markets. In the U.S., data released during the period highlighted some conflicting themes affecting the economy. The fragile global economy, a
stronger dollar, and falling oil prices created difficult conditions for the manufacturing sector. On the other hand, domestically centered industries such as housing, retail, and service-based sectors posted solid results. While low commodity prices suppressed headline inflation, core consumer prices started to gradually move higher, giving the Fed confidence to raise rates in December. This widely anticipated rate hike marked an end to a seven-year period of near-zero interest rates, although the Federal Reserve Open Market Committee (FOMC) stated that the pace of interest-rate hikes would be very gradual and dependent on the direction of economic data. The FOMC seemingly achieved a smooth liftoff judging by the market’s relatively muted reaction following the announcement.
Globally, most credit risk sectors, with the exception of corporates, posted positive absolute returns as coupon income helped offset the impact of rising interest rates and widening bid-ask spreads. Most sectors underperformed duration-equivalent government bonds as spreads generally widened over the volatile period. High yield, in particular, experienced significant volatility on falling oil prices, China slowdown concerns, and a sharp increase in, high yield mutual fund outflows.
The Barclays U.S. Corporate High Yield Bond Index returned -4.47% for the twelve-months ended December 31, 2015 and underperformed duration equivalent treasuries by 5.77%. The Option-Adjusted Spread of the High Yield index was 6.60% on December 31, 2015, an increase of 1.77% from December 31, 2014.
The Fund outperformed the Barclays U.S. Corporate High Yield Bond Index, primarily as a result of sector allocation, due largely to underweight allocations to Metals and Mining and Energy as commodity prices remained volatile and fell sharply during the second half of the period. Our underweight to energy companies was a result of our view that many issuers had been voracious users of capital and we were concerned that many issuers were financing uncertain oil exploration projects with debt. Additionally, being overweight the Healthcare and Technology sectors contributed positively to benchmark-relative returns. On the other hand, having no exposure to the gaming sector detracted from relative returns over the period, because the sector posted strong returns. We maintained a cautious view on the sector due to recent increases in gaming capacity at a time when gaming revenues have been declining.
|
| Hartford High Yield HLS Fund |
Manager Discussion – (continued)
December 31, 2015 (Unaudited)
In aggregate, security selection detracted modestly from benchmark-relative results during the period. Security selection was positive in the Energy and Financials sectors. Within Energy, we focused on issuers that we believed had attractive assets and the ability to withstand an extended low oil price environment. Within Financials, our holdings of the subordinated debt of European banks that we consider to have strong credit profiles generated positive returns during a volatile period. However, this selection was partially offset by our negative credit selection within the Metals and Mining sector, where the decline in commodity prices negatively impacted most holdings, including our holdings in U.S. steel manufacturers. Additionally, selection within Utilities and retail stores detracted from relative results over the period.
Our underweight to BB-rated bonds, which outperformed their lower-rated counterparts, detracted from relative performance during the period.
A modest cash position contributed positively to returns relative to the Barclays U.S. Corporate High Yield Bond Index during the period. Our credit default swap positions on the CDX index, which are used to tactically adjust our exposure to the market, had a modestly positive impact on relative performance during the period.
What is the outlook?
We remain generally constructive on high yield, but recognize that credible threats to global growth have increased. In many sectors, particularly those leveraged to U.S. consumer demand, we have a positive view based on what we consider to be attractive valuations and favorable company fundamentals. However, we remain cautious on many issuers in the Energy and Metals and Mining sectors. We believe the economic backdrop for the high-yield market is generally supportive, but continue to closely monitor factors that could cause the commodity-related stress to spread to the broader market, including the potential impact of a strengthening U.S. dollar on the industrial economy, and trends in bank lending standards across sectors. While we expect default rates to increase through 2016, we believe defaults are likely to stay contained to commodity-related sectors.
Diversification by Security Type
as of December 31, 2015
| | | | |
| Category | | Percentage of
Net Assets | |
Equity Securities | | | | |
Common Stocks | | | 0.3 | % |
Preferred Stocks | | | 0.9 | |
| | | | |
Total | | | 1.2 | % |
| | | | |
Fixed Income Securities | | | | |
Asset & Commercial Mortgage Backed Securities | | | 0.0 | % |
Convertible Bonds | | | 0.5 | |
Corporate Bonds | | | 90.2 | |
Senior Floating Rate Interests | | | 1.5 | |
| | | | |
Total | | | 92.2 | % |
| | | | |
Short-Term Investments | | | 5.7 | |
Other Assets & Liabilities | | | 0.9 | |
| | | | |
Total | | | 100.0 | % |
| | | | |
Hartford International Opportunities HLS Fund inception 07/02/1990
| | |
(sub-advised by Wellington Management Company LLP) | | Investment objective – The Fund seeks long-term growth of capital. |
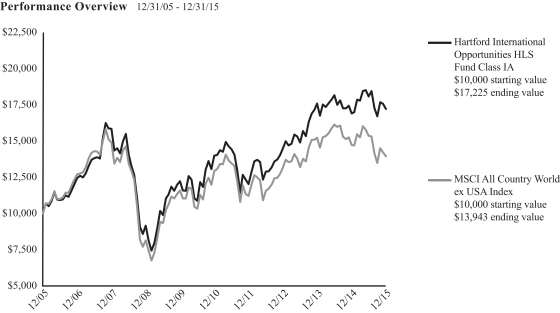
The chart above represents the hypothetical growth of a $10,000 investment in Class IA. Growth results in classes other than Class IA will vary from what is seen above due to differences in the expenses charged to those share classes.
Average Annual Total Return (as of 12/31/15)
| | | | | | | | | | | | |
| | | 1 Year | | | 5 Years | | | 10 Years | |
International Opportunities IA | | | 1.88% | | | | 4.24% | | | | 5.59% | |
International Opportunities IB | | | 1.65% | | | | 3.99% | | | | 5.33% | |
MSCI All Country World ex USA Index | | | -5.25% | | | | 1.51% | | | | 3.38% | |
PERFORMANCE DATA QUOTED REPRESENTS PAST PERFORMANCE AND DOES NOT GUARANTEE FUTURE RESULTS. The investment return and principal value of the investment will fluctuate so that investors’ shares, when redeemed, may be worth more or less than their original cost. Current performance may be lower or higher than the performance data quoted. To obtain performance data current to the most recent month-end, please visit our website www.hartfordfunds.com.
Total returns presented above were calculated using the Fund’s net asset value available to shareholders for sale or redemption of Fund shares on December 31, 2015, which may exclude investment transactions as of this date. All share class returns assume the reinvestment of all distributions at net asset value and the deduction of all fund expenses.
MSCI All Country World ex USA Index is a broad-based, unmanaged, market capitalization weighted, total return index that measures the performance of both developed and emerging stock markets, excluding the U.S. The index is calculated to exclude companies and share classes which cannot be freely purchased by foreigners.
The index is unmanaged, and its results include reinvested dividends and/or distributions, but do not reflect the effect of sales charges, commissions, expenses or taxes.
You cannot invest directly in an index.
As shown in the Fund’s current prospectus dated May 1, 2015, the total annual fund operating expense ratios for Class IA and Class IB were 0.73% and 0.98%, respectively. Actual expenses may be higher. Please see the accompanying Financial Highlights for expense ratios for the year ended December 31, 2015.
All investments are subject to risk including the possible loss of principal. For a discussion of the Fund’s risks, please see the Main Risks section of this report. For more detailed information on the risks associated with an investment in the Fund, please see the prospectus.
The chart and table do not reflect the deductions of taxes, sales charges or other fees which may be applied at the variable life insurance, variable annuity or qualified retirement plan product level. Any such additional sales charges or other fees or expenses would lower the contract’s or plan’s performance.
|
| Hartford International Opportunities HLS Fund |
Manager Discussion
December 31, 2015 (Unaudited)
Portfolio Managers
Nicolas M. Choumenkovitch
Senior Managing Director and Equity Portfolio Manager
Wellington Management Company LLP
Tara E. Stilwell, CFA
Senior Managing Director and Equity Portfolio Manager
Wellington Management Company LLP
How did the Fund perform during the period?
The Class IA shares of Hartford International Opportunities HLS Fund returned 1.88% for the twelve-month period ended December 31, 2015, outperforming the Fund’s benchmark, the MSCI All Country World ex USA Index (“MSCI AC World ex USA Index”), which returned -5.25% for the same period. The Fund outperformed the 0.24% average return of the Lipper International Multi-Cap Growth Fund peer group, a group of funds with investment strategies similar to those of the Fund.
Why did the Fund perform this way?
International equities rebounded in the fourth quarter (+3.3%), but finished the year in the red (-5.3%), as measured by the MSCI AC World ex USA Index. Early in the period, there were many negative headlines causing investors to be uneasy. Europe’s economy remained near stall speed, oil prices plunged, Chinese manufacturing data disappointed, and questions again rose around Greece’s future in the European Union. Despite the negative headlines, Europe was a bright spot during the beginning of the period due to further accommodative monetary policy and encouraging economic data, including positive trends in manufacturing, exports, and economic sentiment. During the first half of the fiscal year, the Bank of Japan expanded its quantitative easing policy, the People’s Bank of China surprised markets with further rate cuts, and the European Central Bank (ECB) announced a €1.14 trillion open-ended sovereign debt quantitative easing program to combat record-low inflation and stimulate growth in Europe. In late June, the Greek debt crisis took center stage. Negotiations between Greece and its creditors regarding Greece’s loan repayments broke down and Greece missed its scheduled loan payment due to the International Monetary Fund on June 30.
In the second half of the fiscal year, worries about an economic growth slowdown in China dominated the market narrative. Fears were amplified near the middle of August when China unexpectedly devalued its currency, triggering concerns about global disinflationary trends and a weaker-than-anticipated global growth backdrop. During September, Chinese manufacturing activity fell to its lowest level since 2009. Risk appetites were also dampened by the ECB’s cut in its Eurozone growth and inflation outlook and the downgrade of Brazil’s debt to below investment-grade. Global equities rallied in October amid increasing signs of extended monetary policy
accommodation by major central banks. Geopolitical tensions flared up during November, including the terrorist attacks in Paris and the downing of a Russian warplane by the Turkish Air Force near the Syrian border. In December, the much anticipated monetary policy divergence came to fruition with the ECB and Bank of Japan (BoJ) announcing additional policy easing, while the U.S. Federal Reserve (Fed) initiated its well-telegraphed interest rates liftoff. The market initially reacted positively to the news, but remained volatile through the end of the year as investors digested the impact of the rate increase and global economic development. Robust global merger and acquisition (M&A) activity continued to fuel bullish sentiment. 2015 global M&A volume surpassed the $5 trillion mark for the first time ever, eclipsing the previous annual record set in 2007 ($4.61 trillion).
Non-U.S. stocks, as measured by the MSCI AC World ex USA Index, fell during the period (-5.25%). Eight of ten sectors in the index posted negative returns during the period; Energy (-21%), Materials (-19%), and Utilities (-9%) fell the most, while Healthcare (+6%) and Consumer Staples (+5%) rose.
The Fund outperformed the MSCI AC World ex USA Index, due predominantly to security selection, while sector allocations also contributed. Security selection was strongest within the Financials, Healthcare, and Consumer Discretionary sectors. This was partially offset by weaker selection within the Information Technology and Energy sectors. Sector allocation, a result of our bottom-up security selection process, also contributed to performance relative to the MSCI AC World ex USA Index during the period. An overweight to the Healthcare sector and an underweight to the Materials and Energy sectors contributed to benchmark relative returns, which was partially offset by an underweight to Consumer Staples.
Top contributors to performance relative to the MSCI AC World ex USA Index during the period included Ono Pharmaceutical (Healthcare), Hong Kong Exchanges (Financials), and Nippon (Telecommunication Services). Ono Pharmaceutical, a Japan-based pharmaceutical company, is a developer of immuno-oncology treatments, and shares the rights and economics with Bristol-Myers Squibb on key immuno-oncology assets. The company’s shares performed well as the prospects for their immuno-oncology drug, Opdivo, remain positive as it expanded into multiple cancer indications. Shares of Hong Kong
|
| Hartford International Opportunities HLS Fund |
Manager Discussion – (continued)
December 31, 2015 (Unaudited)
Exchanges, an operator of the only stock and futures exchange in Hong Kong and their related clearing houses, outperformed as further liberalization of the Chinese financial system drove a large increase in equity market trading volumes, which benefited the exchange’s profitability. The company has also benefited from increased trading volume generated by the new Hong Kong-Shanghai Connect program which facilitates trading between the Hong Kong Exchange and the Shanghai Exchange. The stock price of Nippon, a Japan-based company operating in wired and wireless telecommunications services, rose in the fourth quarter as the company lifted profit guidance for 2016 after their most recent quarterly results were better than anticipated.
The largest relative detractors from returns relative to the MSCI AC World ex USA Index included ICICI Bank (Financials), SK Hynix (Information Technology), and Cemex AB (Materials). Shares of ICICI Bank, an India-based bank and financial services company, underperformed as non-performing loans have been higher than market expectations. Shares of SK Hynix, a Korean semiconductor company, underperformed on concerns of a continued slowdown in PC sales and weak memory pricing. Cemex AB, a global cement company based in Mexico, saw its share price decline as the company continues to face difficult conditions for foreign exchange as well as weaker volumes in Mexico. China Life (Financials) was also an absolute detractor from performance during the period.
Derivatives were not used in a significant manner in the Fund during the period and did not have a material impact on performance during the period.
What is the outlook?
Our outlook for international equities moving forward has deviated little from three months ago. We believe growth will continue to be modest, but choppy, with more focus around the slowdown in China and the broader implications on the world economy. In Europe, the stance of the portfolio remains mostly unchanged from last quarter. We think Europe remains stable as the ECB continues its monetary expansion which has provided support for riskier assets. Domestic demand indicators remain fairly strong and we believe credit conditions should continue to support reasonable growth. We do think volatility will remain elevated overall as the global equity market continues adjusting to the current environment.
At the end of the period, relative to the MSCI AC World ex USA Index, we were most overweight Healthcare, Consumer Discretionary, and Information Technology, and most underweight Materials, Telecommunication Services, and Consumer Staples. On a regional basis, we ended the period with an overweight to Europe ex-UK and Japan. We ended the period underweight Asia Pacific ex Japan and the UK.
Currency Concentration of Securities
as of December 31, 2015
| | | | |
| Description | | Percentage of
Net Assets | |
Brazilian Real | | | 0.2 | % |
British Pound | | | 12.2 | |
Canadian Dollar | | | 6.3 | |
Danish Krone | | | 0.4 | |
Euro | | | 31.4 | |
Hong Kong Dollar | | | 4.5 | |
Indian Rupee | | | 4.8 | |
Japanese Yen | | | 16.9 | |
South Korean Won | | | 1.3 | |
Swedish Krona | | | 1.9 | |
Swiss Franc | | | 7.1 | |
Taiwanese Dollar | | | 2.6 | |
United States Dollar | | | 10.3 | |
Other Assets & Liabilities | | | 0.1 | |
| | | | |
Total | | | 100.0 | % |
| | | | |
Diversification by Sector
as of December 31, 2015
| | | | |
| Sector | | Percentage of
Net Assets | |
Equity Securities | | | | |
Consumer Discretionary | | | 14.5 | % |
Consumer Staples | | | 8.3 | |
Energy | | | 6.0 | |
Financials | | | 26.1 | |
Health Care | | | 17.6 | |
Industrials | | | 9.2 | |
Information Technology | | | 10.1 | |
Materials | | | 1.3 | |
Telecommunication Services | | | 2.3 | |
Utilities | | | 1.6 | |
| | | | |
Total | | | 97.0 | % |
| | | | |
Short-Term Investments | | | 2.9 | |
Other Assets & Liabilities | | | 0.1 | |
| | | | |
Total | | | 100.0 | % |
| | | | |
A sector may be comprised of several industries. For Fund compliance purposes, the Fund may not use the same classification system and these sector classifications are used for financial reporting purposes.
Hartford MidCap HLS Fund inception 07/14/1997
| | |
(sub-advised by Wellington Management Company LLP) | | Investment objective – The Fund seeks long-term growth of capital. |
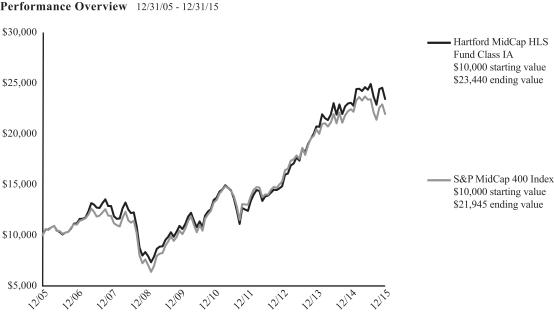
The chart above represents the hypothetical growth of a $10,000 investment in Class IA. Growth results in classes other than Class IA will vary from what is seen above due to differences in the expenses charged to those share classes.
Average Annual Total Return (as of 12/31/15)
| | | | | | | | | | | | |
| | | 1 Year | | | 5 Years | | | 10 Years | |
MidCap IA | | | 1.60% | | | | 11.72% | | | | 8.89% | |
MidCap IB | | | 1.34% | | | | 11.43% | | | | 8.62% | |
S&P MidCap 400 Index | | | -2.18% | | | | 10.68% | | | | 8.18% | |
PERFORMANCE DATA QUOTED REPRESENTS PAST PERFORMANCE AND DOES NOT GUARANTEE FUTURE RESULTS. The investment return and principal value of the investment will fluctuate so that investors’ shares, when redeemed, may be worth more or less than their original cost. Current performance may be lower or higher than the performance data quoted. To obtain performance data current to the most recent month-end, please visit our website www.hartfordfunds.com.
Total returns presented above were calculated using the Fund’s net asset value available to shareholders for sale or redemption of Fund shares on December 31, 2015, which may exclude investment transactions as of this date. All share class returns assume the reinvestment of all distributions at net asset value and the deduction of all fund expenses.
S&P MidCap 400 Index is an unmanaged index of common stocks of companies chosen by S&P designed to represent price movements in the mid-cap U.S. equity market.
The index is unmanaged, and its results include reinvested dividends and/or distributions, but do not reflect the effect of sales charges, commissions, expenses or taxes.
You cannot invest directly in an index.
As shown in the Fund’s current prospectus dated May 1, 2015, the total annual fund operating expense ratios for Class IA and Class IB were 0.70% and 0.95%, respectively. Actual expenses may be higher. Please see the accompanying Financial Highlights for expense ratios for the year ended December 31, 2015.
All investments are subject to risk including the possible loss of principal. For a discussion of the Fund’s risks, please see the Main Risks section of this report. For more detailed information on the risks associated with an investment in the Fund, please see the prospectus.
The chart and table do not reflect the deductions of taxes, sales charges or other fees which may be applied at the variable life insurance, variable annuity or qualified retirement plan product level. Any such additional sales charges or other fees or expenses would lower the contract’s or plan’s performance.
Manager Discussion
December 31, 2015 (Unaudited)
Portfolio Managers
Philip W. Ruedi, CFA
Senior Managing Director and Equity Portfolio Manager
Wellington Management Company LLP
Mark A. Whitaker, CFA
Managing Director and Equity Portfolio Manager
Wellington Management Company LLP
How did the Fund perform during the period?
The Class IA shares of Hartford MidCap HLS Fund returned 1.60% for the twelve-month period ended December 31, 2015, outperforming the Fund’s benchmark, the S&P MidCap 400 Index, which returned -2.18% for the same period. The Fund also outperformed the -4.13% average return of the Lipper Mid-Cap Core Funds peer group, a group of funds with investment strategies similar to those of the Fund.
Why did the Fund perform this way?
U.S. equities, as measured by the S&P 500 Index, rose modestly during the twelve-month period. U.S. stocks retreated briefly early in 2015, but then reached new all-time highs on March 2, April 24, and May 21. The market pulled back in early March as soft manufacturing data, potentially negative currency- and oil-related earnings, and valuation concerns weighed on investors’ minds. However, risk appetites increased after the March 18 Federal Open Market Committee (FOMC) statement underlined the U.S. Federal Reserve’s (Fed) hesitation to raise rates as U.S. domestic inflation remained subdued and other major central banks maintained an easing bias. In April, the tech-heavy Nasdaq Composite topped the 5,000 mark for the first time in 15 years and broke its closing record from March 2000. Continued strong merger and acquisition (M&A) activity, a rebound in hiring, and solid housing data helped to fuel risk appetites. May marked the second-best month ever for M&As involving U.S. companies with $234 billion in announced mergers. Stocks ended June on a sour note after negotiations between Greece and its creditors regarding Greece’s loan repayments broke down.
In the second half of the period, the U.S. economy remained on solid footing, with a sharp rebound in Gross Domestic Product (GDP), a seven-year low in unemployment, and a healthy housing market report. While the growth slowdown in China and its implications for global commerce fueled investor anxiety, uncertainty about the Fed’s rate hike timeline also weighed on sentiment. During August and September, the market remained extremely volatile and experienced its first correction (a decline of at least 10%) since October 2011. Oil prices and the Energy sector as a whole remained extremely volatile, with prices recovering from the initial drop earlier in the period and falling sharply towards the end of the year. As many market participants expected, the Fed left rates unchanged at its highly anticipated September meeting. The Fed’s statement appeared to spook some investors as it acknowledged that “recent global
economic and financial developments may restrain economic activity somewhat and are likely to put further downward pressure on inflation in the near term.” After much anticipation, the Fed delivered its first rate hike since 2006 in December, approving a small increase in the federal funds rate. The market initially reacted positively to the news, but remained volatile through the end of the year as investors digested the impact of the rate increase and global economic developments.
Returns varied noticeably by market-cap during the period, as small cap equities (-4%) and mid cap equities (-2%) underperformed large cap equities (+1%), as represented by the Russell 2000, the S&P MidCap 400, and the S&P 500, Indices, respectively. Within the S&P MidCap 400 Index, only three out of ten sectors posted positive returns during the twelve-month period. The Healthcare (+10%), Financials (+5%), and Information Technology (+1%) sectors posted positive returns while the Energy (-33%), Materials (-13%), and Telecommunication Services (-13%) sectors lagged the most on a relative and absolute basis.
The Fund’s outperformance relative to the S&P MidCap 400 Index during the period was driven primarily by strong security selection. Strong security selection in the Information Technology, Financials, and Industrials sectors offset weaker selection in Consumer Discretionary. Sector allocation, a result of the bottom-up security selection process, also contributed to relative returns over the period. An overweight to Healthcare and an underweight to Materials contributed to relative returns, while an overweight to Energy and an underweight to Financials detracted from relative performance over the period.
Top contributors to relative and absolute performance during the period were Equifax (Industrials), Vantiv (Information Technology), and Genpact (Information Technology). Shares of Equifax, a U.S.-based provider of information solutions and human resources business process outsourcing services, rose on strong revenues and earnings over the period. Shares of Vantiv, a U.S.-based merchant acquirer that connects businesses to credit card companies, rose over the period as they continued to benefit from the secular trend of moving away from payment by cash and check to electronic transactions. Genpact, an Indian company engaged in business process management, outsourcing, shared services and information outsourcing, outperformed over the period as they have seen solid
Manager Discussion – (continued)
December 31, 2015 (Unaudited)
client growth and signed two large transformational deals. Alkermes (Healthcare) was also a top absolute contributor over the period.
Top detractors from performance relative to the S&P MidCap 400 Index during the period were Nimble Storage (Information Technology), Genesee & Wyoming (Industrials), and Harley-Davidson (Consumer Discretionary). Shares of Nimble Storage, a U.S.-based firm that engineers and delivers data storage platforms, fell during the period. The company is facing margin pressures as it seeks to grow rapidly amidst intense competition. Genesee & Wyoming, a U.S.-based short line railroad operator, also underperformed over the period. The stock has been pressured by weak customer demand, particularly in commodities and Industrials, but we believe these pressures are temporary and we remain confident in the value of its assets and management’s capital allocation skill. Shares of Harley-Davidson, a U.S.-based motorcycle manufacturer, fell as the motorcycle retailer’s results fell far short of consensus estimates, sending the company’s shares to a two-year low. Apollo Education (Consumer Discretionary) was also a top absolute detractor over the period.
Derivatives were not used in a significant manner in the Fund during the period and did not have a material impact on performance during the period.
What is the outlook?
While we believe the United States will remain the preferred market for investment on a global basis, emerging market fundamentals remain weak and China’s economic growth rate is adjusting to a new, long term rate. It is unclear whether recent industrial weakness in the U.S. will affect domestic consumer demand.
As a result of our bottom-up, company specific process based on FVE (fundamentals, valuation, and expectations), we ended the period overweight the Industrials, Healthcare, and Information Technology sectors. Our Industrial holdings include market leaders across transportation, waste disposal, temporary staffing, credit reporting agencies, and leading niche manufacturers. In the Healthcare sector, our past emphasis on biotech has shifted to devices and services with strong fundamentals driven by demographics and health care reforms. Within Information Technology, we have strong exposure to the cloud, the internet, merchant acquirers, and solar power. Our largest underweight at year-end was in the Financial sector, where we continue to find what we consider to be unattractive investments in real estate investment trusts.
Diversification by Sector
as of December 31, 2015
| | | | |
| Sector | | Percentage of
Net Assets | |
Equity Securities | | | | |
Consumer Discretionary | | | 11.3 | % |
Consumer Staples | | | 0.7 | |
Energy | | | 5.6 | |
Financials | | | 16.7 | |
Health Care | | | 16.4 | |
Industrials | | | 23.2 | |
Information Technology | | | 20.6 | |
Materials | | | 3.2 | |
Utilities | | | 2.1 | |
| | | | |
Total | | | 99.8 | % |
| | | | |
Short-Term Investments | | | 0.2 | |
Other Assets & Liabilities | | | 0.0 | |
| | | | |
Total | | | 100.0 | % |
| | | | |
A sector may be comprised of several industries. For Fund compliance purposes, the Fund may not use the same classification system and these sector classifications are used for financial reporting purposes.
Hartford MidCap Value HLS Fund inception 04/30/2001
| | |
(sub-advised by Wellington Management Company LLP) | | Investment objective – The Fund seeks long-term capital appreciation. |
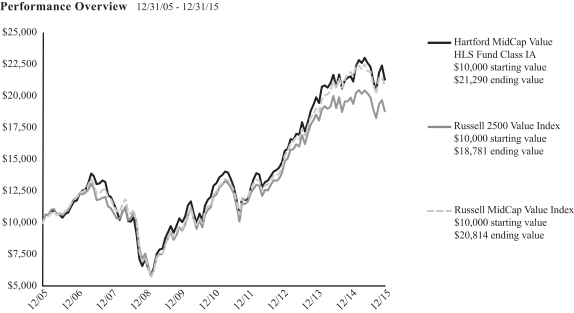
The chart above represents the hypothetical growth of a $10,000 investment in Class IA. Growth results in classes other than Class IA will vary from what is seen above due to differences in the expenses charged to those share classes.
Average Annual Total Return (as of 12/31/15)
| | | | | | | | | | | | |
| | | 1 Year | | | 5 Years | | | 10 Years | |
MidCap Value IA | | | -1.21% | | | | 10.47% | | | | 7.85% | |
MidCap Value IB | | | -1.45% | | | | 10.19% | | | | 7.58% | |
Russell 2500 Value Index | | | -5.49% | | | | 9.23% | | | | 6.51% | |
Russell MidCap Value Index | | | -4.78% | | | | 11.25% | | | | 7.61% | |
PERFORMANCE DATA QUOTED REPRESENTS PAST PERFORMANCE AND DOES NOT GUARANTEE FUTURE RESULTS. The investment return and principal value of the investment will fluctuate so that investors’ shares, when redeemed, may be worth more or less than their original cost. Current performance may be lower or higher than the performance data quoted. To obtain performance data current to the most recent month-end, please visit our website www.hartfordfunds.com.
Total returns presented above were calculated using the Fund’s net asset value available to shareholders for sale or redemption of Fund shares on December 31, 2015, which may exclude investment transactions as of this date. All share class returns assume the reinvestment of all distributions at net asset value and the deduction of all fund expenses.
Russell 2500 Value Index is an unmanaged index that measures the performance of those Russell 2500 Index companies with lower price-to-book ratios and lower forecasted growth values. The Russell 2500 Index is an unmanaged index that measures the performance of the 2,500 smallest U.S. companies based on total market capitalization.
Russell MidCap Value Index measures the performance of the mid-cap value segment of the U.S. equity universe. It includes those Russell MidCap Index companies with lower price-to-book ratios and lower forecasted growth values.
The indices are unmanaged, and their results include reinvested dividends and/or distributions, but do not reflect the effect of sales charges, commissions, expenses or taxes.
You cannot invest directly in an index.
As shown in the Fund’s current prospectus dated May 1, 2015, the total annual fund operating expense ratios for Class IA and Class IB were 0.84% and 1.09%, respectively. Actual expenses may be higher. Please see the accompanying Financial Highlights for expense ratios for the year ended December 31, 2015.
All investments are subject to risk including the possible loss of principal. For a discussion of the Fund’s risks, please see the Main Risks section of this report. For more detailed information on the risks associated with an investment in the Fund, please see the prospectus.
The chart and table do not reflect the deductions of taxes, sales charges or other fees which may be applied at the variable life insurance, variable annuity or qualified retirement plan product level. Any such additional sales charges or other fees or expenses would lower the contract’s or plan’s performance.
|
| Hartford MidCap Value HLS Fund |
Manager Discussion
December 31, 2015 (Unaudited)
Portfolio Manager
James N. Mordy
Senior Managing Director and Equity Portfolio Manager
Wellington Management Company LLP
How did the Fund perform during the period?
The Class IA shares of Hartford MidCap Value HLS Fund returned -1.21% for the twelve-month period ended December 31, 2015, outperforming the Fund’s benchmark, the Russell 2500 Value Index, which returned -5.49% for the same period. The Fund also outperformed the Russell MidCap Value Index, which returned -4.78% for the same period. The Fund also outperformed the -4.13% average return of the Lipper Mid-Cap Core Fund peer group, a group of funds with investment strategies similar to those of the Fund.
Why did the Fund perform this way?
U.S. equities, as measured by the S&P 500 Index, rose modestly during the twelve-month period. U.S. stocks retreated briefly early in 2015, but then reached new all-time highs on March 2, April 24, and May 21. The market pulled back in early March as soft manufacturing data, potentially negative currency- and oil-related earnings, and valuation concerns weighed on investors’ minds. However, risk appetites increased after the March 18 Federal Open Market Committee (FOMC) statement underlined the U.S. Federal Reserve’s (Fed) hesitation to raise rates as U.S. domestic inflation remained subdued and other major central banks maintained an easing bias. In April, the tech-heavy Nasdaq Composite topped the 5,000 mark for the first time in 15 years and broke its closing record from March 2000. Continued strong merger and acquisition (M&A) activity, a rebound in hiring, and solid housing data helped to fuel risk appetites. May marked the second-best month ever for M&As involving U.S. companies with $234 billion in announced mergers. Stocks ended June on a sour note after negotiations between Greece and its creditors regarding Greece’s loan repayments broke down.
In the second half of the period, the U.S. economy remained on solid footing, with a sharp rebound in gross domestic product (GDP), a seven-year low in unemployment, and a healthy housing market report. While the growth slowdown in China and its implications for global commerce fueled investor anxiety, uncertainty about the Fed’s rate hike timeline also weighed on sentiment. During August and September, the market remained extremely volatile and experienced its first correction (a decline of at least 10%) since October 2011. Oil prices and the Energy sector as a whole remained extremely volatile, with prices recovering from the initial drop earlier in the period and falling sharply towards the end of the year. As many market participants expected, the Fed left rates unchanged at its highly anticipated September meeting. The Fed’s statement appeared to spook some investors as it acknowledged that “recent global economic and financial developments may restrain economic activity somewhat and are likely to put further downward pressure on inflation
in the near term.” After much anticipation, the Fed delivered its first rate hike since 2006 in December, approving a small increase in the federal funds rate. The market initially reacted positively to the news, but remained volatile through the end of the year as investors digested the impact of the rate increase and global economic developments.
Returns varied noticeably by market-cap during the period, as small cap equities (-4%) and mid cap equities (-2%) underperformed large cap equities (+1%), as represented by the Russell 2000, the S&P MidCap 400, and the S&P 500, Indices, respectively. Within the Russell 2500 Value Index, only three out of ten sectors posted positive returns during the twelve-month period. The Energy (-41%), Materials (-21%), and Telecommunication Services (-11%) sectors performed the worst while the Healthcare (+7%), Financials (+2%), and Information Technology (-2%) sectors performed the best over the period.
The Fund’s outperformance relative to the Russell 2500 Value Index was driven by strong security selection. Positive stock selection within the Energy, Financials, and Consumer Discretionary sectors more than offset weaker stock selection within the Industrials and Utilities sectors. Sector allocation, a result of the bottom-up security selection process, detracted from relative results over the period, primarily due to an underweight to Financials and overweight allocations to Materials and Consumer Discretionary. An overweight to Healthcare and to Information Technology contributed positively to benchmark-relative performance over the period.
The largest contributors to absolute performance and performance relative to the Russell 2500 Value Index included Ono Pharmaceutical (Healthcare), Extra Space Storage (Financials), and Equity Lifestyle (Financials). Shares of Ono Pharmaceutical, a Japan-based biopharmaceutical company, rose over the period as the U.S. FDA approved their Opdivo drug for multiple cancer treatments during the year, including kidney and lung cancer indications. Shares of Extra Space Storage, a U.S.-based owner and operator of storage facilities, rose after the company reported second quarter 2015 results that beat consensus estimates and raised guidance for fiscal year 2015. Equity Lifestyle, a U.S.-based real estate investment trust (REIT) focused on owning and operating manufactured home communities and recreational vehicle (RV) resorts throughout North America, outperformed over the period due to strong earnings and steady growth in the RV market.
The largest detractors from absolute performance and performance relative to the Russell 2500 Value Index included Performance Sports
|
| Hartford MidCap Value HLS Fund |
Manager Discussion – (continued)
December 31, 2015 (Unaudited)
(Consumer Discretionary), Brookdale Senior Living (Healthcare), and Verint Systems (Information Technology). Shares of Performance Sports, a U.S.-based firm engaged in the design, manufacture and distribution of performance sports equipment, declined over the period due to the weakening Canadian dollar. Brookdale Senior Living, an operator of high quality senior living facilities in the U.S., underperformed due to possible regulation preventing companies from spinning off real estate assets into tax-advantaged REITs. The market had anticipated the company would unlock value through a spin-off, and the stock price declined on the news. Shares of Verint Systems, a U.S. provider of analytical software for the security and business intelligence markets, fell over the period due to weak earnings caused by elongated sales and approval cycles.
Derivatives were not used in a significant manner in the Fund during the period and did not have a material impact on performance during the period.
What is the outlook?
Following the initial Fed interest rate hike in late 2015, we believe that global equity markets will have a rocky start heading into 2016. The U.S. manufacturing economy finished 2015 in recessionary-like fashion with a December Purchasing Managers Index (PMI) of 48.2%, a steep decline from where we were a year ago. Fortunately, the service economy continues to grow and consumer spending is supported by job growth, accelerating wage growth and the lagged benefits of lower energy costs. We believe the negative impacts to the industrial economy from inventory destocking, the stronger dollar and the Energy sector should lessen in 2016; and government spending may add to growth relative to recent years. The global picture is much more complicated as China, Brazil and Russia unwind their excesses, and emerging markets generally feel the burden of rising debt levels. Led by the emerging markets, global nominal GDP growth has slowed to about half the rate that we averaged in the years prior to the global financial crises. We believe that the deflationary impact from this has pressured commodity prices, earnings, and interest rates and is now manifesting in higher credit spreads. Given less room for error we expect stock market volatility to remain high as investors remain anxious about increased vulnerability to any accident which could knock the economy off its course. While most of the traditional signals of imminent recession are not yet flashing red, it is also difficult to imagine catalysts for growth significantly above the base case. It also seems reasonable to expect the Fed to err on the side of caution in upcoming months in our opinion.
In terms of our approach going forward we acknowledge the elevated risk level. We may be less forgiving of companies falling short on fundamentals. As we have done in the Energy sector, if stress levels increase in other areas we will seek to upgrade to stocks of higher quality companies, while seeking to maintain our value discipline and seeking to not pay excessive safety premiums. We ended the period with the largest relative overweights in Consumer Discretionary,
Materials, and Information Technology and the largest underweights in Financials, Utilities, and Consumer Staples relative to the Russell 2500 Value Index.
Diversification by Sector
as of December 31, 2015
| | | | |
| Sector | | Percentage of
Net Assets | |
Equity Securities | | | | |
Consumer Discretionary | | | 14.8 | % |
Consumer Staples | | | 1.7 | |
Energy | | | 5.8 | |
Financials | | | 32.2 | |
Health Care | | | 4.7 | |
Industrials | | | 12.9 | |
Information Technology | | | 11.2 | |
Materials | | | 8.8 | |
Telecommunication Services | | | 0.5 | |
Utilities | | | 6.0 | |
| | | | |
Total | | | 98.6 | % |
| | | | |
Short-Term Investments | | | 1.3 | |
Other Assets & Liabilities | | | 0.1 | |
| | | | |
Total | | | 100.0 | % |
| | | | |
A sector may be comprised of several industries. For Fund compliance purposes, the Fund may not use the same classification system and these sector classifications are used for financial reporting purposes.
Hartford Small Company HLS Fund inception 08/09/1996
| | |
(sub-advised by Wellington Management Company LLP) | | Investment objective – The Fund seeks growth of capital. |
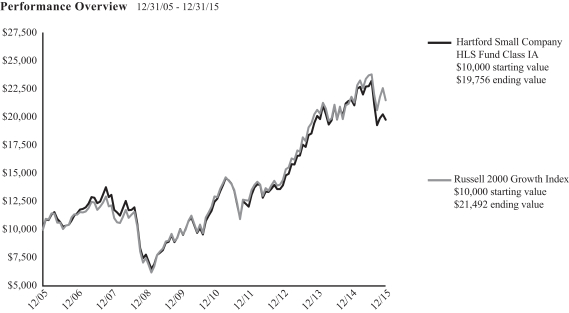
The chart above represents the hypothetical growth of a $10,000 investment in Class IA. Growth results in classes other than Class IA will vary from what is seen above due to differences in the expenses charged to those share classes.
Average Annual Total Return (as of 12/31/15)
| | | | | | | | | | | | |
| | | 1 Year | | | 5 Years | | | 10 Years | |
Small Company IA | | | -8.21% | | | | 9.66% | | | | 7.05% | |
Small Company IB | | | -8.45% | | | | 9.38% | | | | 6.79% | |
Russell 2000 Growth Index | | | -1.38% | | | | 10.67% | | | | 7.95% | |
PERFORMANCE DATA QUOTED REPRESENTS PAST PERFORMANCE AND DOES NOT GUARANTEE FUTURE RESULTS. The investment return and principal value of the investment will fluctuate so that investors’ shares, when redeemed, may be worth more or less than their original cost. Current performance may be lower or higher than the performance data quoted. To obtain performance data current to the most recent month-end, please visit our website www.hartfordfunds.com.
Total returns presented above were calculated using the Fund’s net asset value available to shareholders for sale or redemption of Fund shares on December 31, 2015, which may exclude investment transactions as of this date. All share class returns assume the reinvestment of all distributions at net asset value and the deduction of all fund expenses.
Russell 2000 Growth Index is an unmanaged index of those Russell 2000 Index growth companies with higher price-to-book ratios and higher forecasted growth values. The Russell 2000 Index is a broad-based unmanaged index comprised of 2,000 of the smallest U.S.-domiciled company common stocks (on the basis of capitalization) that are traded in the United States on the New York Stock Exchange, NYSE MKT LLC and Nasdaq.
The index is unmanaged, and its results include reinvested dividends and/or distributions, but do not reflect the effect of sales charges, commissions, expenses or taxes.
You cannot invest directly in an index.
As shown in the Fund’s current prospectus dated May 1, 2015, the total annual fund operating expense ratios for Class IA and Class IB were 0.71% and 0.96%, respectively. Actual expenses may be higher. Please see the accompanying Financial Highlights for expense ratios for the year ended December 31, 2015.
For additional information regarding the prior performance history of the Fund, please see the section entitled “Performance Notes” in the Fund’s prospectus.
All investments are subject to risk including the possible loss of principal. For a discussion of the Fund’s risks, please see the Main Risks section of this report. For more detailed information on the risks associated with an investment in the Fund, please see the prospectus.
The chart and table do not reflect the deductions of taxes, sales charges or other fees which may be applied at the variable life insurance, variable annuity or qualified retirement plan product level. Any such additional sales charges or other fees or expenses would lower the contract’s or plan’s performance.
The Fund is closed to new investors until further notice. For more information, please see the Fund’s prospectus.
|
| Hartford Small Company HLS Fund |
Manager Discussion
December 31, 2015 (Unaudited)
Portfolio Managers
Steven C. Angeli, CFA
Senior Managing Director, Equity Portfolio Manager
Wellington Management Company LLP
Stephen Mortimer
Senior Managing Director, Equity Portfolio Manager
Wellington Management Company LLP
Mario E. Abularach, CFA
Senior Managing Director, Equity Research Analyst
Wellington Management Company LLP
Mammen Chally, CFA
Senior Managing Director, Equity Portfolio Manager
Wellington Management Company LLP
Jamie A. Rome, CFA*
Senior Managing Director, Equity Portfolio Manager
Wellington Management Company LLP
* Effective January 7, 2016, Jamie A. Rome is no longer a portfolio manager for the Fund.
How did the Fund perform during the period?
The Class IA shares of Hartford Small Company HLS Fund returned -8.21% for the twelve-month period ended December 31, 2015, underperforming the Fund’s benchmark, the Russell 2000 Growth Index which returned -1.38% for the same period. The Fund also underperformed the -1.86% average return of the Lipper Small-Cap Growth Funds peer group, a group of funds with investment strategies similar to those of the Fund.
Why did the Fund perform this way?
U.S. equities, as measured by the S&P 500 Index, rose modestly during the twelve-month period. U.S. stocks retreated briefly early in 2015, but then reached new all-time highs on March 2, April 24, and May 21. The market pulled back in early March as soft manufacturing data, potentially negative currency- and oil-related earnings, and valuation concerns weighed on investors’ minds. However, risk appetites increased after the March 18 Federal Open Market Committee (FOMC) statement underlined the U.S. Federal Reserve’s (Fed) hesitation to raise rates as U.S. domestic inflation remained subdued and other major central banks maintained an easing bias. In April, the tech-heavy Nasdaq Composite topped the 5,000 mark for the first time in 15 years and broke its closing record from March 2000. Continued strong merger and acquisition (M&A) activity, a rebound in hiring, and solid housing data helped to fuel risk appetites. May marked the second-best month ever for M&As involving U.S. companies with $234 billion in announced mergers. Stocks ended June on a sour note after negotiations between Greece and its creditors regarding Greece’s loan repayments broke down.
In the second half of the period, the U.S. economy remained on solid footing, with a sharp rebound in Gross Domestic Product (GDP), a
seven-year low in unemployment, and a healthy housing market report. While the growth slowdown in China and its implications for global commerce fueled investor anxiety, uncertainty about the Fed’s rate hike timeline also weighed on sentiment. During August and September, the market remained extremely volatile and experienced its first correction (a decline of at least 10%) since October 2011. Oil prices and the Energy sector as a whole remained extremely volatile, with prices recovering from the initial drop earlier in the period and falling sharply towards the end of the year. As many market participants expected, the Fed left rates unchanged at its highly anticipated September meeting. The Fed’s statement appeared to spook some investors as it acknowledged that “recent global economic and financial developments may restrain economic activity somewhat and are likely to put further downward pressure on inflation in the near term.” After much anticipation, the Fed delivered its first rate hike since 2006 in December, approving a small increase in the federal funds rate. The market initially reacted positively to the news, but remained volatile through the end of the year as investors digested the impact of the rate increase and global economic developments.
Returns varied noticeably over the period by market-cap, as small cap (-4%) and mid cap (-2%) equities underperformed large cap (+1%) equities as measured by the Russell 2000, S&P MidCap 400, and the S&P 500 Indices, respectively. Growth (+5%) stocks outperformed value (-4%) stocks during the period, as measured by the Russell 3000 Growth and Russell 3000 Value Indices. Five of the ten sectors in the Russell 2000 Growth Index had positive returns during the period. Utilities (+16%), Healthcare (+9%), and Information Technology (+5%) performed best, while Energy (-35%), Materials (-17%), and Industrials (-12%) lagged the broader index.
|
| Hartford Small Company HLS Fund |
Manager Discussion – (continued)
December 31, 2015 (Unaudited)
Stock selection was the main driver of underperformance relative to the Russell 2000 Growth Index, primarily due to weak selection within the Information Technology, Industrials, and Healthcare sectors. This was partially offset by stronger selection in the Materials and Energy sectors. Sector allocation, which is the result of bottom-up stock selection, also detracted from relative returns, primarily due to an underweight to Healthcare and an overweight to the Industrials sector which offset the positive impacts of underweight allocations to the Consumer Discretionary and Consumer Staples sectors and an overweight to the Financials sector.
Top detractors from relative returns during the period included Platform Specialty (Materials), Kate Spade (Consumer Discretionary), and Swift Transportation (Industrials). Shares of Platform Specialty, a U.S.-based chemical company, and Swift Transportation, a trucking company, fell as widening bid-ask spreads in the U.S. high yield market led to a broad sell-off of levered companies. We transitioned the Fund’s investment in Swift Transportation to Knight Transportation in light of Knight’s stronger balance sheet in our opinion. Shares of Kate Spade, a U.S.-based designer and marketer of a range of accessories and apparel, fell during the period after the company reported in-store sales that missed expectations. Nomad Foods (Consumer Staples) was also a top detractor from absolute performance.
Top contributors to relative performance during the period included Anacor Pharmaceuticals (Healthcare), DexCom (Healthcare), and WNS (Information Technology). Shares of Anacor Pharmaceuticals, a U.S.-based biopharmaceutical company focused on discovering, developing and commercializing small-molecule therapeutics, rose in response to the news that its topical treatment for nail fungus was approved. Shares of DexCom, a Healthcare equipment company, outperformed during the period after the company announced quarterly results that exceeded expectations on increasing patient additions and technology/equipment upgrades. Shares of WNS, a business process management services company, rose as growth in end market demand and a secular trend toward outsourcing routine business processes supported results. Tyler Technologies (Information Technology) contributed to absolute returns during the period.
Derivatives were not used in a significant manner in the Fund during the period and did not have a material impact on performance during the period.
What is the outlook?
As 2016 begins, we plan to be focused on consistently applying and continuously refining our investment process. With a watchful eye on developments in China and high-yield markets in the U.S., we continue to seek to identify new and exciting opportunities in the small cap growth asset class. This year brought one of the most challenging market environments we have encountered, but we end the year believing the portfolio is well-positioned.
As a result of our bottom-up, stock-by-stock investment decisions, the Fund ended the period most overweight the Financials, Materials, and Energy sectors relative to the Russell 2000 Growth Index. The Fund ended the year most underweight the Healthcare, Consumer Discretionary, and Consumer Staples sectors relative to the Russell 2000 Growth Index.
Diversification by Sector
as of December 31, 2015
| | | | |
| Sector | | Percentage of
Net Assets | |
Equity Securities | | | | |
Consumer Discretionary | | | 13.0 | % |
Consumer Staples | | | 1.1 | |
Energy | | | 2.0 | |
Financials | | | 15.3 | |
Health Care | | | 22.1 | |
Industrials | | | 13.2 | |
Information Technology | | | 23.9 | |
Materials | | | 5.5 | |
| | | | |
Total | | | 96.1 | % |
| | | | |
Short-Term Investments | | | 4.1 | |
Other Assets & Liabilities | | | (0.2 | ) |
| | | | |
Total | | | 100.0 | % |
| | | | |
A sector may be comprised of several industries. For Fund compliance purposes, the Fund may not use the same classification system and these sector classifications are used for financial reporting purposes.
Hartford Small/Mid Cap Equity HLS Fund inception 05/01/1998
| | |
(sub-advised by Wellington Management Company LLP) | | Investment objective – The Fund seeks long-term growth of capital. |
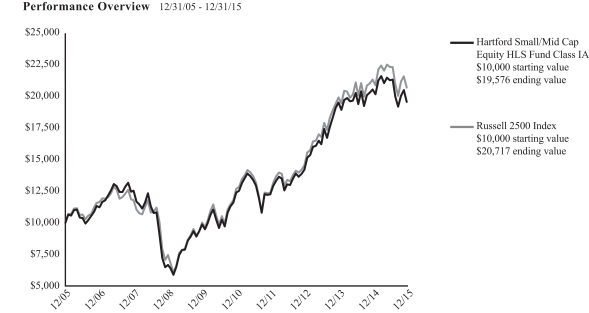
The chart above represents the hypothetical growth of a $10,000 investment in Class IA. Growth results in classes other than Class IA will vary from what is seen above due to differences in the expenses charged to those share classes.
Average Annual Total Return (as of 12/31/15)
| | | | | | | | | | | | |
| | | 1 Year | | | 5 Years | | | 10 Years | |
Small/Mid Cap Equity IA | | | -4.73% | | | | 9.57% | | | | 6.95% | |
Small/Mid Cap Equity IB | | | -4.97% | | | | 9.29% | | | | 6.68% | |
Russell 2500 Index | | | -2.90% | | | | 10.32% | | | | 7.56% | |
PERFORMANCE DATA QUOTED REPRESENTS PAST PERFORMANCE AND DOES NOT GUARANTEE FUTURE RESULTS. The investment return and principal value of the investment will fluctuate so that investors’ shares, when redeemed, may be worth more or less than their original cost. Current performance may be lower or higher than the performance data quoted. To obtain performance data current to the most recent month-end, please visit our website www.hartfordfunds.com.
Total returns presented above were calculated using the Fund’s net asset value available to shareholders for sale or redemption of Fund shares on December 31, 2015, which may exclude investment transactions as of this date. All share class returns assume the reinvestment of all distributions at net asset value and the deduction of all fund expenses.
Performance information from December 4, 2006 through June 4, 2012 includes performance under the Fund’s previous sub-adviser, Hartford Investment Management Company. As of June 4, 2012, Hartford Investment Management Company no longer served as the sub-adviser to the Fund. Performance information prior to December 4, 2006 represents performance of other previous sub-advisers.
Includes the Fund’s performance when it invested, prior to February 1, 2010, at least 80% of its assets in common stocks of mid-capitalization companies.
Class IB shares commenced on March 31, 2008. Class IB shares performance prior to that date reflects Class IA shares performance adjusted to reflect the 12b-1 fee of 0.25% applicable to Class IB shares. The performance after such date reflects actual Class IB shares performance.
Russell 2500 Index measures the performance of the small to mid-cap segment of the U.S. equity universe, commonly referred to as “smid” cap. The Russell 2500 Index is a subset of the Russell 3000 Index and includes approximately 2500 of the smallest
securities based on a combination of their market capitalization and current index membership.
The index is unmanaged, and its results include reinvested dividends and/or distributions, but do not reflect the effect of sales charges, commissions, expenses or taxes.
You cannot invest directly in an index.
As shown in the Fund’s current prospectus dated May 1, 2015, the total annual fund operating expense ratios for Class IA and Class IB were 0.85% and 1.10%, respectively. Actual expenses may be higher. Please see the accompanying Financial Highlights for expense ratios for the year ended December 31, 2015.
All investments are subject to risk including the possible loss of principal. For a discussion of the Fund’s risks, please see the Main Risks section of this report. For more detailed information on the risks associated with an investment in the Fund, please see the prospectus.
The chart and table do not reflect the deductions of taxes, sales charges or other fees which may be applied at the variable life insurance, variable annuity or qualified retirement plan product level. Any such additional sales charges or other fees or expenses would lower the contract’s or plan’s performance.
|
| Hartford Small/Mid Cap Equity HLS Fund |
Manager Discussion
December 31, 2015 (Unaudited)
Portfolio Manager
David J. Elliott, CFA
Managing Director, Co-Director, Quantitative Investments and Portfolio Manager
Wellington Management Company LLP
How did the Fund perform during the period?
The Class IA shares of Hartford Small/Mid Cap Equity HLS Fund returned -4.73% for the twelve-month period ended December 31, 2015, underperforming the Fund’s benchmark, the Russell 2500 Index, which returned -2.90%. For the same period, the Fund also underperformed the -4.13% average return of the Lipper Mid-Cap Core Funds peer group, a group of funds with investment strategies similar to those of the Fund.
Why did the Fund perform this way?
U.S. equities, as measured by the S&P 500 Index, rose modestly during the twelve-month period, although small and mid cap equities lagged, with the Russell 2500 Index posting negative returns. U.S. stocks retreated briefly early in 2015, but then reached new all-time highs on March 2, April 24, and May 21. The market pulled back in early March as soft manufacturing data, potentially negative currency- and oil-related earnings, and valuation concerns weighed on investors’ minds. However, risk appetites increased after the March 18 Federal Open Market Committee (FOMC) statement underlined the U.S. Federal Reserve’s (Fed) hesitation to raise rates as U.S. domestic inflation remained subdued and other major central banks maintained an easing bias. In April, the tech-heavy Nasdaq Composite topped the 5,000 mark for the first time in 15 years and broke its closing record from March 2000. Continued strong merger and acquisition (M&A) activity, a rebound in hiring, and solid housing data helped to fuel risk appetites. May marked the second-best month ever for M&As involving U.S. companies with $234 billion in announced mergers. Stocks ended June on a sour note after negotiations between Greece and its creditors regarding Greece’s loan repayments broke down.
In the second half of the period, the U.S. economy remained on solid footing, with a sharp rebound in Gross Domestic Product (GDP), a seven-year low in unemployment, and a healthy housing market report. While the growth slowdown in China and its implications for global commerce fueled investor anxiety, uncertainty about the Fed’s rate hike timeline also weighed on sentiment. During August and September, the market remained extremely volatile and experienced its first correction (a decline of at least 10%) since October 2011. Oil prices and the Energy sector as a whole remained extremely volatile, with prices recovering from the initial drop earlier in the period and falling sharply towards the end of the year. As many market participants expected, the Fed left rates unchanged at its highly anticipated September meeting. The Fed’s statement appeared to spook some investors as it acknowledged that “recent global economic and financial developments may restrain economic activity
somewhat and are likely to put further downward pressure on inflation in the near term.” After much anticipation, the Fed delivered its first rate hike since 2006 in December, approving a small increase in the federal funds rate. The market initially reacted positively to the news, but remained volatile through the end of the year as investors digested the impact of the rate increase and global economic developments.
Seven of the ten sectors in the Russell 2500 Index posted negative absolute returns during the period. Energy (-40%), Materials (-13%) and Telecommunication Services (-10%) fell the most while Healthcare (+10%), Information Technology (+2%), and Financials (+2%) posted positive returns for the year.
The Fund’s underperformance relative to the Russell 2500 Index was driven by weak stock selection, particularly in the Financials, Consumer Discretionary, and Information Technology sectors. This was partially offset by stronger stock selection in the Energy, Healthcare, and Industrials sectors. Overall sector positioning contributed positively to returns relative to the Russell 2500 Index during the period due primarily to an underweight to Materials and an overweight to Information Technology. An overweight to Energy and an underweight to Healthcare detracted from results relative to the Russell 2500 Index during the period.
The largest detractors from absolute performance and performance relative to the Russell 2500 Index during the period were Dillards (Consumer Discretionary), PDL BioPharma (Healthcare), and Meritor (Industrials). Shares of Dillards, a U.S.-based retailer, fell over the year as it missed revenue and earnings expectations multiple times and lowered forward earnings guidance, as it faces increased competition. PDL BioPharma is a firm based in the U.S. that manages a portfolio of patents and royalty assets, which it licenses out to biotechnology and pharmaceutical companies. The share price of PDL BioPharma fell as the company saw a drop-off in sales in the third quarter, in large part due to Valeant’s failure to pay contractual royalties on sales of Glumetza. PDL BioPharma is also facing questions on its future revenue stream as licensing deals to its top patents are expiring. Meritor, a U.S.-based manufacturer of automobile components, particularly for trucks, saw its share price fall in the second half of 2015 as it saw declines in its revenue year-over-year and as the entire heavy-truck component sector faced difficult conditions.
The largest contributors to absolute performance and performance relative to the Russell 2500 Index during the period were Anacor Pharmaceuticals (Healthcare), Alaska Air (Industrials), and Valero
|
| Hartford Small/Mid Cap Equity HLS Fund |
Manager Discussion – (continued)
December 31, 2015 (Unaudited)
(Energy). Shares of Anacor, a biopharmaceutical company focused on discovering, developing and commercializing small-molecule therapeutics, rose in response to approved topical treatment for nail fungus. Shares of U.S.-based airline Alaska Air rose as it continued to experience revenue growth and the company has added new routes while expanding capacity on its existing routes. The stock price of Valero, an independent oil refiner, soared during the period even as it has faced lower gasoline prices. Cheaper oil prices have allowed the company to expand its profit margin, even as overall revenues have fallen.
Derivatives were not used in a significant manner in the Fund during the period and did not have a material impact on performance during the period.
What is the outlook?
The Fund seeks to add value by utilizing Wellington Management’s proprietary quantitative research and investment tools in a highly disciplined framework. The Fund focuses on stock selection as the key driver of returns and uses quantitative portfolio optimization techniques to seek to minimize unintended and uncompensated risks. Based on individual stock decisions, the Fund ended the period most overweight the Consumer Discretionary and Financials sectors and most underweight the Healthcare and Information Technology sectors relative to the Russell 2500 Index.
Diversification by Sector
as of December 31, 2015
| | | | |
| Sector | | Percentage of
Net Assets | |
Equity Securities | | | | |
Consumer Discretionary | | | 15.1 | % |
Consumer Staples | | | 2.6 | |
Energy | | | 3.4 | |
Financials | | | 26.5 | |
Health Care | | | 11.3 | |
Industrials | | | 15.0 | |
Information Technology | | | 14.4 | |
Materials | | | 5.5 | |
Telecommunication Services | | | 1.0 | |
Utilities | | | 4.3 | |
| | | | |
Total | | | 99.1 | % |
| | | | |
Short-Term Investments | | | 0.7 | |
Other Assets & Liabilities | | | 0.2 | |
| | | | |
Total | | | 100.0 | % |
| | | | |
A sector may be comprised of several industries. For Fund compliance purposes, the Fund may not use the same classification system and these sector classifications are used for financial reporting purposes.
Hartford SmallCap Growth HLS Fund inception 05/02/1994
| | |
(sub-advised by Wellington Management Company LLP) | | Investment objective – The Fund seeks long-term capital appreciation. |
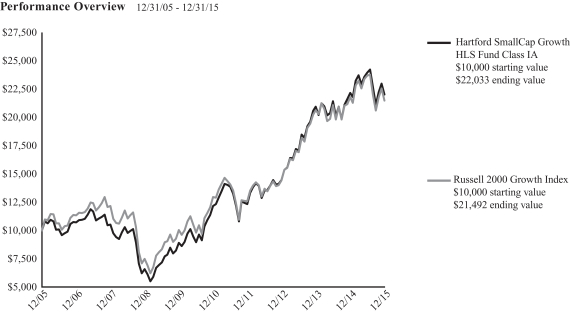
The chart above represents the hypothetical growth of a $10,000 investment in Class IA. Growth results in classes other than Class IA will vary from what is seen above due to differences in the expenses charged to those share classes.
Average Annual Total Return (as of 12/31/15)
| | | | | | | | | | | | |
| | | 1 Year | | | 5 Years | | | 10 Years | |
SmallCap Growth IA | | | -0.55% | | | | 12.67% | | | | 8.22% | |
SmallCap Growth IB | | | -0.79% | | | | 12.39% | | | | 7.95% | |
Russell 2000 Growth Index | | | -1.38% | | | | 10.67% | | | | 7.95% | |
PERFORMANCE DATA QUOTED REPRESENTS PAST PERFORMANCE AND DOES NOT GUARANTEE FUTURE RESULTS. The investment return and principal value of the investment will fluctuate so that investors’ shares, when redeemed, may be worth more or less than their original cost. Current performance may be lower or higher than the performance data quoted. To obtain performance data current to the most recent month-end, please visit our website www.hartfordfunds.com.
Total returns presented above were calculated using the Fund’s net asset value available to shareholders for sale or redemption of Fund shares on December 31, 2015, which may exclude investment transactions as of this date. All share class returns assume the reinvestment of all distributions at net asset value and the deduction of all fund expenses.
Russell 2000 Growth Index is an unmanaged index of those Russell 2000 Index growth companies with higher price-to-book ratios and higher forecasted growth values. The Russell 2000 Index is a broad-based unmanaged index comprised of 2,000 of the smallest U.S.-domiciled company common stocks (on the basis of capitalization) that are traded in the United States on the New York Stock Exchange, NYSE MKT LLC and Nasdaq.
The index is unmanaged, and its results include reinvested dividends and/or distributions, but do not reflect the effect of sales charges, commissions, expenses or taxes.
You cannot invest directly in an index.
As shown in the Fund’s current prospectus dated May 1, 2015, the total annual fund operating expense ratios for Class IA and Class IB were 0.65% and 0.90%,
respectively. Actual expenses may be higher. Please see the accompanying Financial Highlights for expense ratios for the year ended December 31, 2015.
For additional information regarding the prior performance history of the Fund, please see the section entitled “Performance Notes” in the Fund’s prospectus.
All investments are subject to risk including the possible loss of principal. For a discussion of the Fund’s risks, please see the Main Risks section of this report. For more detailed information on the risks associated with an investment in the Fund, please see the prospectus.
The chart and table do not reflect the deductions of taxes, sales charges or other fees which may be applied at the variable life insurance, variable annuity or qualified retirement plan product level. Any such additional sales charges or other fees or expenses would lower the contract’s or plan’s performance.
The Fund is closed to new investors until further notice. For more information, please see the Fund’s prospectus.
|
| Hartford SmallCap Growth HLS Fund |
Manager Discussion
December 31, 2015 (Unaudited)
Portfolio Managers
Mammen Chally, CFA
Senior Managing Director and Equity Portfolio Manager
Wellington Management Company LLP
David J. Elliott, CFA
Managing Director, Co-Director, Quantitative Investments and Portfolio Manager
Wellington Management Company LLP
How did the Fund perform during the period?
The Class IA shares of Hartford SmallCap Growth HLS Fund returned -0.55% for the twelve-month period ended December 31, 2015, outperforming the Fund’s benchmark, the Russell 2000 Growth Index, which returned -1.38%. For the same period, the Fund also outperformed the -1.86% average return of the Lipper Small-Cap Growth Funds peer group, a group of funds with investment strategies similar to those of the Fund.
Why did the Fund perform this way?
U.S. equities, as measured by the S&P 500 Index, rose modestly during the twelve-month period. U.S. stocks retreated briefly early in 2015, but then reached new all-time highs on March 2, April 24, and May 21. The market pulled back in early March as soft manufacturing data, potentially negative currency- and oil-related earnings, and valuation concerns weighed on investors’ minds. However, risk appetites increased after the March 18 Federal Open Market Committee (FOMC) statement underlined the U.S. Federal Reserve’s (Fed) hesitation to raise rates as U.S. domestic inflation remained subdued and other major central banks maintained an easing bias. In April, the tech-heavy Nasdaq Composite topped the 5,000 mark for the first time in 15 years and broke its closing record from March 2000. Continued strong merger and acquisition (M&A) activity, a rebound in hiring, and solid housing data helped to fuel risk appetites. May marked the second-best month ever for M&As involving U.S. companies with $234 billion in announced mergers. Stocks ended June on a sour note after negotiations between Greece and its creditors regarding Greece’s loan repayments broke down.
In the second half of the period, the U.S. economy remained on solid footing, with a sharp rebound in Gross Domestic Product (GDP), a seven-year low in unemployment, and a healthy housing market report. While the growth slowdown in China and its implications for global commerce fueled investor anxiety, uncertainty about the Fed’s rate hike timeline also weighed on sentiment. During August and September, the market remained extremely volatile and experienced its first correction (a decline of at least 10%) since October 2011. Oil prices and the Energy sector as a whole remained extremely volatile, with prices recovering from the initial drop earlier in the period and falling sharply towards the end of the year. As many market participants expected, the Fed left rates unchanged at its highly anticipated September meeting. The Fed’s statement appeared to
spook some investors as it acknowledged that “recent global economic and financial developments may restrain economic activity somewhat and are likely to put further downward pressure on inflation in the near term.” After much anticipation, the Fed delivered its first rate hike since 2006 in December, approving a small increase in the federal funds rate. The market initially reacted positively to the news, but remained volatile through the end of the year as investors digested the impact of the rate increase and global economic developments.
Large cap equities (+1%) outperformed small cap equities (-4%) during the period, as measured by the S&P 500 and Russell 2000 Indices, respectively. Growth equities (+5%) outperformed value equities (-4%) during the period, as measured by the Russell 3000 Growth and Russell 3000 Value Indices, respectively. Five of the ten sectors in the Russell 2000 Growth Index had positive returns during the period. Utilities (+16%), Healthcare (+9%), and Information Technology (+5%) performed best, while Energy (-35%) and Materials (-17%) lagged the broader index.
Security selection was the primary driver of the Fund’s outperformance relative to the Russell 2000 Growth Index. Selection was strongest within the Information Technology, Healthcare, and Financials sectors and weakest within the Consumer Discretionary sector. Sector allocation, which is a result of bottom-up security selection, contributed modestly to relative results. Underweights to Consumer Discretionary and overweights to Consumer Staples and Financials contributed positively to benchmark-relative performance, while an underweight to Healthcare detracted.
Anacor (Healthcare), Heartland Payment (Information Technology), and DexCom (Healthcare) were top relative contributors to results relative to the Russell 2000 Growth Index over the period. Shares of Anacor, a biopharmaceutical company focused on discovering, developing and commercializing small-molecule therapeutics, rose in response to the recently approved (2014) topical treatment for nail fungus. Shares of Heartland Payment, a company that provides end-to-end electronic payment processing services to merchants, rose after Global Payments announced it would acquire Heartland for a substantial premium. Shares of DexCom, a Healthcare equipment company, outperformed during the period after the company announced quarterly results that exceeded expectations on increasing patient additions and technology/equipment upgrades.
|
| Hartford SmallCap Growth HLS Fund |
Manager Discussion – (continued)
December 31, 2015 (Unaudited)
DexCom’s Management announced strong quarterly revenue growth and raised sales guidance for the full fiscal year. Top absolute contributors during the period also included Tyler Technologies (Information Technology).
The top relative detractors from performance relative to the Russell 2000 Growth Index over the period were Vince (Consumer Discretionary), Kate Spade (Consumer Discretionary), and Synageva (Healthcare). Shares of Vince, an apparel vendor primarily focused on high-end department stores, fell after company management positioned 2015 performance below Street expectations due to a slowdown in their wholesale business. Shares of Kate Spade, a U.S.-based designer and marketer of a range of accessories and apparel, fell during the period after the company reported in-store sales that missed expectations. Sales at the company’s brick-and-mortar stores rose 6% in the first quarter from a year ago, but analysts were expecting 8% growth. Shares of Synageva, a biopharmaceutical firm focused on developing therapies for patients with rare “orphan” diseases, outperformed on news of a merger with Alexion; not holding this benchmark constituent detracted from results. Swift Transportation (Industrials) and La Quinta Holdings (Consumer Discretionary) were among top detractors from absolute performance over the period.
Derivatives were not used in a significant manner in the Fund during the period and did not have a material impact on performance during the period.
What is the outlook?
We believe the U.S. economy remains in a period of moderate economic growth, led by a steady expansion of consumption, housing, and technology spending. However, we are starting to have some concerns about the health of the U.S. manufacturing sector. The ISM Purchasing Managers Index (PMI) was below the 50 threshold during November and December. This indicated a contraction of the manufacturing sector in November and December, as difficult conditions from the stronger U.S. dollar and weak global demand continued to weigh on activity. Ongoing weakness could have negative implications for sectors beyond just Industrials. For instance, Financials could be adversely impacted if credit deteriorates in a long-term cycle of manufacturing weakness. Despite this risk, there are plenty of reasons to remain optimistic about the U.S. Employment trends remain very solid, cheap gasoline should support consumption, and housing is unlikely to be derailed by the Fed’s gradual pace of interest rate hikes, in our opinion.
Overall, we continue to find what we view as attractively valued stocks with the characteristics we seek. We continue to monitor policy decisions and economic trends which may impact our holdings. We remain consistent in adhering to our disciplined portfolio construction process that we believe allows us to assess risk and weigh individual positions accordingly, and in the process build a
portfolio that focuses largely on stock selection for seeking to generate outperformance relative to the Russell 2000 Growth Index.
As a result of bottom-up stock selection, the Fund’s top overweights at the end of the period included Consumer Staples, Financials, and Materials. Healthcare, Information Technology, and Consumer Discretionary constituted the greatest underweights relative to the Russell 2000 Growth Index at the end of the period.
Diversification by Sector
as of December 31, 2015
| | | | |
| Sector | | Percentage of
Net Assets | |
Equity Securities | | | | |
Consumer Discretionary | | | 15.4 | % |
Consumer Staples | | | 4.4 | |
Energy | | | 1.2 | |
Financials | | | 11.5 | |
Health Care | | | 26.0 | |
Industrials | | | 12.0 | |
Information Technology | | | 23.9 | |
Materials | | | 4.3 | |
Telecommunication Services | | | 0.5 | |
| | | | |
Total | | | 99.2 | % |
| | | | |
Short-Term Investments | | | 1.1 | |
Other Assets & Liabilities | | | (0.3 | ) |
| | | | |
Total | | | 100.0 | % |
| | | | |
A sector may be comprised of several industries. For Fund compliance purposes, the Fund may not use the same classification system and these sector classifications are used for financial reporting purposes.
Hartford Stock HLS Fund inception 08/31/1977
| | |
(sub-advised by Wellington Management Company LLP) | | Investment objective – The Fund seeks long-term growth of capital. |
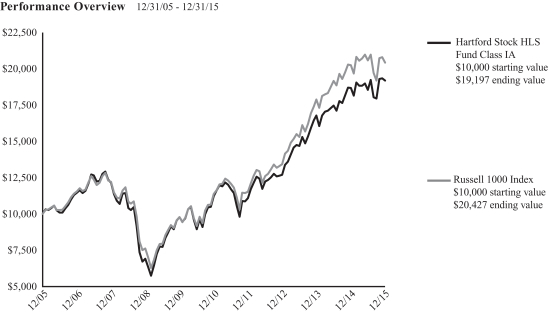
The chart above represents the hypothetical growth of a $10,000 investment in Class IA. Growth results in classes other than Class IA will vary from what is seen above due to differences in the expenses charged to those share classes.
Average Annual Total Return (as of 12/31/15)
| | | | | | | | | | | | |
| | | 1 Year | | | 5 Years | | | 10 Years | |
Stock IA | | | 2.74% | | | | 11.34% | | | | 6.74% | |
Stock IB | | | 2.48% | | | | 11.06% | | | | 6.47% | |
Russell 1000 Index | | | 0.92% | | | | 12.44% | | | | 7.40% | |
PERFORMANCE DATA QUOTED REPRESENTS PAST PERFORMANCE AND DOES NOT GUARANTEE FUTURE RESULTS. The investment return and principal value of the investment will fluctuate so that investors’ shares, when redeemed, may be worth more or less than their original cost. Current performance may be lower or higher than the performance data quoted. To obtain performance data current to the most recent month-end, please visit our website www.hartfordfunds.com.
Total returns presented above were calculated using the Fund’s net asset value available to shareholders for sale or redemption of Fund shares on December 31, 2015, which may exclude investment transactions as of this date. All share class returns assume the reinvestment of all distributions at net asset value and the deduction of all fund expenses.
Russell 1000 Index is an unmanaged index that measures the performance of the 1,000 largest companies in the Russell 3000 Index, which measures the performance of the 3,000 largest U.S. companies, based on total market capitalizations.
The index is unmanaged, and its results include reinvested dividends and/or distributions, but do not reflect the effect of sales charges, commissions, expenses or taxes.
You cannot invest directly in an index.
As shown in the Fund’s current prospectus dated May 1, 2015, the total annual fund operating expense ratios for Class IA and Class IB were 0.50% and 0.75%, respectively. Actual expenses may be higher. Please see the accompanying Financial Highlights for expense ratios for the year ended December 31, 2015.
All investments are subject to risk including the possible loss of principal. For a discussion of the Fund’s risks, please see the Main Risks section of this report. For
more detailed information on the risks associated with an investment in the Fund, please see the prospectus.
The chart and table do not reflect the deductions of taxes, sales charges or other fees which may be applied at the variable life insurance, variable annuity or qualified retirement plan product level. Any such additional sales charges or other fees or expenses would lower the contract’s or plan’s performance.
Manager Discussion
December 31, 2015 (Unaudited)
Portfolio Manager
Donald J. Kilbride
Senior Managing Director, Equity Portfolio Manager
Wellington Management Company LLP
How did the Fund perform during the period?
The Class IA shares of Hartford Stock HLS Fund returned 2.74% for the twelve-month period ended December 31, 2015, outperforming the Russell 1000 Index, which returned 0.92% for the same period. The Fund also outperformed the -0.57% average return of the Lipper Large-Cap Core Funds peer group, a group of funds with investment strategies similar to those of the Fund.
Why did the Fund perform this way?
U.S. equities, as measured by the S&P 500 Index, rose modestly during the twelve-month period. U.S. stocks retreated briefly early in 2015, but then reached new all-time highs on March 2, April 24, and May 21. The market pulled back in early March as soft manufacturing data, potentially negative currency- and oil-related earnings, and valuation concerns weighed on investors’ minds. However, risk appetites increased after the March 18 Federal Open Market Committee (FOMC) statement underlined the U.S. Federal Reserve’s (Fed) hesitation to raise rates as U.S. domestic inflation remained subdued and other major central banks maintained an easing bias. In April, the tech-heavy Nasdaq Composite topped the 5,000 mark for the first time in 15 years and broke its closing record from March 2000. Continued strong merger and acquisition (M&A) activity, a rebound in hiring, and solid housing data helped to fuel risk appetites. May marked the second-best month ever for M&As involving U.S. companies with $234 billion in announced mergers. Stocks ended June on a sour note after negotiations between Greece and its creditors regarding Greece’s loan repayments broke down.
In the second half of the period, the U.S. economy remained on solid footing, with a sharp rebound in Gross Domestic Product (GDP), a seven-year low in unemployment, and a healthy housing market report. While the growth slowdown in China and its implications for global commerce fueled investor anxiety, uncertainty about the Fed’s rate hike timeline also weighed on sentiment. During August and September, the market remained extremely volatile and experienced its first correction (a decline of at least 10%) since October 2011. Oil prices and the Energy sector as a whole remained extremely volatile, with prices recovering from the initial drop earlier in the period and falling sharply towards the end of the year. As many market participants expected, the Fed left rates unchanged at its highly anticipated September meeting. The Fed’s statement appeared to spook some investors as it acknowledged that “recent global economic and financial developments may restrain economic activity somewhat and are likely to put further downward pressure on inflation in the near term.” After much anticipation, the Fed delivered its first rate hike since 2006 in December, approving a small increase in the
federal funds rate. The market initially reacted positively to the news, but remained volatile through the end of year as investors digested the impact of the rate increase and global economic developments.
Overall large cap equities outperformed mid cap and small cap equities during the period, as measured by the Russell 1000 (+1%), the S&P MidCap 400 (-2%), and the Russell 2000 (-4%) indices, respectively. During the twelve-month period, five of the ten sectors within the Russell 1000 Index rose, led by Consumer Discretionary (+8%), Healthcare (+7%), and Consumer Staples (+6%). Energy (-23%) and Materials (-9%) lagged on a relative basis.
The Fund’s outperformance versus the Russell 1000 Index was primarily driven by strong security selection within Financials, Energy, and Consumer Discretionary, which offset weaker selection within Consumer Staples. Sector allocation, a residual of the bottom-up stock selection process, contributed to relative returns due primarily to overweight allocations to Consumer Staples and Healthcare. This was partially offset by an underweight to the Information Technology sector, which detracted from performance.
Top contributors to performance relative to the Russell 1000 Index during the period included Nike (Consumer Discretionary), McDonald’s (Consumer Discretionary), and Chubb Corp (Financials). Shares of Nike, a U.S.-based manufacturer of athletic apparel and gear, rose as the company posted strong earnings and continued to perform well in China. Shares of McDonald’s, a U.S.-based fast food chain, rose during the period after the company announced a rebound in quarterly sales in October, giving investors hope that the turnaround effort by the company and its new CEO could be successful. Shares of Chubb, a U.S.-based property and casualty insurer, rose during the period after it was announced that ACE Limited, a global insurance company, would purchase Chubb for $28.3 billion. Microsoft (Information Technology) also contributed to performance on an absolute basis.
Stocks that detracted the most from returns relative to the Russell 1000 Index during the period were Amazon (Consumer Discretionary), Wal-Mart (Consumer Staples), and Praxair (Industrials). The Fund did not own shares of benchmark-component Amazon, a U.S.-based online retailer, which detracted from relative performance during the year, as the stock price of Amazon rose due to its continued strength in its retail business and stronger than expected growth in its Amazon Web Service (“AWS”). The stock price of Walmart fell after it issued a warning to investors in October that higher wages and continued price pressure from online retailers could cut earnings per share as much as 12% in its next fiscal year.
Manager Discussion – (continued)
December 31, 2015 (Unaudited)
Shares of Praxair, a U.S.-based industrial gases company, underperformed during the period after the company reported disappointing revenues amid slowdown in global growth and a strengthening U.S. Dollar negatively affecting exports and making future growth difficult. Oracle (Information Technology) also detracted from performance on an absolute basis.
Derivatives were not used in a significant manner in the Fund during the period and did not have a material impact on performance during the period.
What is the outlook?
From our perspective, the global investment narrative is slowly coalescing around a single dominant theme: China. It should be no surprise though. Not only is China the world’s second largest economy, it has been the dominant source of incremental global growth for much of the last decade. The fortunes of the country have had a profoundly positive impact on markets for some time now. And yet we believe it was highly predictable that the eventual slowdown would be equally impactful.
Global markets, be they in commodities, equities or currencies, continue to swoon in the face of the country’s weakness. Complicating the matter is a lack of comfort on the facts. Is the country’s growth rate slowing from 10% to 7% as the official data would suggest? Or is the slowdown far more severe? It is clear that 7% growth is very different from 2% growth in the U.S.
Interestingly, there are times when we need to remind ourselves that there are other factors likely to weigh on markets in the next year. A few would include: the U.S. Presidential election; oil prices; global central bank policy, rates and currencies; and geopolitical strife. These are only a few of the factors, along with China, that are worthy of our consideration. Our central view continues to be one of caution as many of these considerations appear to be headwinds to healthy economic activity and healthy markets. And while the portfolio’s progress would benefit from a better global landscape, we feel comfortable with our positioning given the current outlook.
At the end of the period, our bottom-up investment approach resulted in overweight exposures in Consumer Staples, Industrials, and Healthcare as we continued to find what we believe to be attractive investment opportunities in these sectors. The Fund’s largest underweights relative to the Russell 1000 Index were in Information Technology, Utilities, and Telecommunication Services.
Diversification by Sector
as of December 31, 2015
| | | | |
| Sector | | Percentage of
Net Assets | |
Equity Securities | | | | |
Consumer Discretionary | | | 10.8 | % |
Consumer Staples | | | 16.2 | |
Energy | | | 6.8 | |
Financials | | | 15.4 | |
Health Care | | | 16.4 | |
Industrials | | | 18.1 | |
Information Technology | | | 10.3 | |
Materials | | | 4.0 | |
| | | | |
Total | | | 98.0 | % |
| | | | |
Short-Term Investments | | | 0.9 | |
Other Assets & Liabilities | | | 1.1 | |
| | | | |
Total | | | 100.0 | % |
| | | | |
A sector may be comprised of several industries. For Fund compliance purposes, the Fund may not use the same classification system and these sector classifications are used for financial reporting purposes.
Hartford Total Return Bond HLS Fund inception 08/31/1977
| | |
(sub-advised by Wellington Management Company LLP) | | Investment objective – The Fund seeks a competitive total return, with income as a secondary objective. |
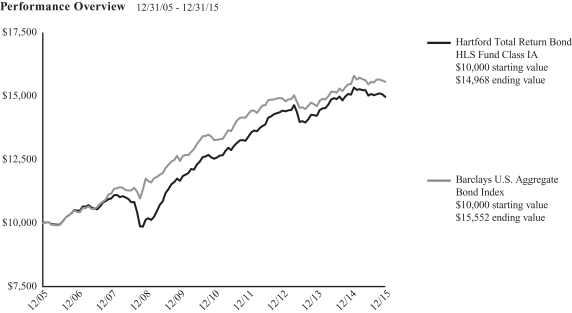
The chart above represents the hypothetical growth of a $10,000 investment in Class IA. Growth results in classes other than Class IA will vary from what is seen above due to differences in the expenses charged to those share classes.
Average Annual Total Return (as of 12/31/15)
| | | | | | | | | | | | |
| | | 1 Year | | | 5 Years | | | 10 Years | |
Total Return Bond IA | | | -0.59% | | | | 3.62% | | | | 4.12% | |
Total Return Bond IB | | | -0.81% | | | | 3.37% | | | | 3.86% | |
Barclays U.S. Aggregate Bond Index | | | 0.55% | | | | 3.25% | | | | 4.51% | |
PERFORMANCE DATA QUOTED REPRESENTS PAST PERFORMANCE AND DOES NOT GUARANTEE FUTURE RESULTS. The investment return and principal value of the investment will fluctuate so that investors’ shares, when redeemed, may be worth more or less than their original cost. Current performance may be lower or higher than the performance data quoted. To obtain performance data current to the most recent month-end, please visit our website www.hartfordfunds.com.
Total returns presented above were calculated using the Fund’s net asset value available to shareholders for sale or redemption of Fund shares on December 31, 2015, which may exclude investment transactions as of this date. All share class returns assume the reinvestment of all distributions at net asset value and the deduction of all fund expenses.
Performance information includes performance under the Fund’s previous sub-adviser, Hartford Investment Management Company. As of March 5, 2012, Hartford Investment Management Company no longer served as the sub-adviser to the Fund.
Barclays U.S. Aggregate Bond Index is an unmanaged index and is composed of securities that are SEC-registered, taxable, and dollar denominated. The index covers the U.S. investment grade fixed rate bond market, with index components for government and corporate securities, mortgage pass-through securities, and asset-backed securities. These major sectors are subdivided into more specific indices that are calculated and reported on a regular basis.
The index is unmanaged, and its results include reinvested dividends and/or distributions, but do not reflect the effect of sales charges, commissions, expenses or taxes.
You cannot invest directly in an index.
As shown in the Fund’s current prospectus dated May 1, 2015, the total annual fund operating expense ratios for Class IA and Class IB were 0.50% and 0.75%, respectively. Actual expenses may be higher. Please see the accompanying Financial Highlights for expense ratios for the year ended December 31, 2015.
All investments are subject to risk including the possible loss of principal. For a discussion of the Fund’s risks, please see the Main Risks section of this report. For more detailed information on the risks associated with an investment in the Fund, please see the prospectus.
The chart and table do not reflect the deductions of taxes, sales charges or other fees which may be applied at the variable life insurance, variable annuity or qualified retirement plan product level. Any such additional sales charges or other fees or expenses would lower the contract’s or plan’s performance.
|
| Hartford Total Return Bond HLS Fund |
Manager Discussion
December 31, 2015 (Unaudited)
Portfolio Managers
Joseph F. Marvan, CFA
Senior Managing Director and Fixed Income Portfolio Manager
Wellington Management Company LLP
Lucius T. (L.T.) Hill, III
Senior Managing Director and Fixed Income Portfolio Manager
Wellington Management Company LLP
Campe Goodman, CFA
Senior Managing Director and Fixed Income Portfolio Manager
Wellington Management Company LLP
How did the Fund perform during the period?
The Class IA shares of Hartford Total Return Bond HLS Fund returned -0.59%, for the twelve-month period ended December 31, 2015, underperforming the Fund’s benchmark, the Barclays U.S. Aggregate Bond Index, which returned 0.55% for the same period. The Fund also underperformed the -0.16% average return of the Lipper Core Bond Funds peer group, a group of funds with investment strategies similar to those of the Fund.
Why did the Fund perform this way?
Fixed income markets were volatile over the twelve-month period as investors dealt with growing divergences in economic growth and central bank policy. With an improving economic outlook in the U.S. relative to the rest of the world, market participants agonized over the timing of the U.S. Federal Reserve Bank’s (Fed) first rate hike and its potential market implications. Increased risk of a Greek exit from the Eurozone and a prolonged drop in commodity prices further muddied the picture. Oil prices were extremely volatile over the period, having rebounded from record lows at the start of the year but falling again in the third and fourth quarters of 2015. Meanwhile, an unexpected devaluation in China’s currency rattled global financial markets, deepening fears about the Chinese economic slowdown and potential spillover effects on the global economy.
Many major central banks eased monetary policy during the period with some resorting to aggressive measures to counter deflation and stimulate growth. In the first half of the period, the European Central Bank (ECB) launched an open-ended government bond-buying program, which prompted other central banks to act to stop their currencies from appreciating. In China, the central bank entered into an aggressive monetary easing cycle to counter deflationary risks and slowing growth. Sub-trend growth and low inflation kept the Bank of England from enacting policy changes while the Fed charted a course for the end of quantitative easing.
Growth in the major developed markets stabilized in 2015 while emerging market growth languished, held back by a slowdown in Asia. Economic data in the Eurozone both improved and broadened out across countries; however, inflationary pressures were non-existent.
The U.K. and Japan showed little sign of increased inflation despite the continued strength in their respective labor markets. In the U.S., data released during the period highlighted some conflicting themes affecting the economy. The fragile global economy, a stronger dollar, and falling oil prices created difficult conditions for the manufacturing sector. On the other hand, domestically centered industries such as housing, retail, and service-based sectors posted solid results. While low commodity prices suppressed headline inflation, core consumer prices started to gradually move higher, giving the Fed confidence to raise rates in December. This widely anticipated rate hike marked an end to a seven-year period of near-zero interest rates, although the Federal Reserve Open Market Committee (FOMC) stated that the pace of interest-rate hikes would be very gradual and dependent on the direction of economic data. The FOMC seemingly achieved a smooth liftoff judging by the market’s relatively muted reaction following the announcement.
Globally, most credit risk sectors, with the exception of corporates, posted positive absolute returns as coupon income helped offset the impact of rising interest rates and widening bid-ask spreads. Most sectors underperformed duration-equivalent government bonds as spreads generally widened over the volatile period. High yield, in particular, experienced significant volatility on falling oil prices, China slowdown concerns, and a sharp increase in, high yield mutual fund outflows.
The primary drivers of the Fund’s underperformance relative to the Barclays U.S. Aggregate Bond Index over the period were an allocation to unhedged local currency emerging markets debt and breakeven inflation positioning. Emerging markets debt exhibited very mixed performance during the period; local debt significantly lagged U.S. dollar denominated sovereign and corporate credit as emerging market currencies depreciated against the USD over the period. Additionally, we positioned the portfolio for an increase in inflation expectations as we believed a tightening labor market would lead inflation higher. Breakeven inflation positioning detracted from benchmark-relative performance as inflation expectations fell sharply, particularly in the third quarter. The Fund’s out-of-benchmark allocation to non-agency Residential Mortgage Backed Securities
|
| Hartford Total Return Bond HLS Fund |
Manager Discussion – (continued)
December 31, 2015 (Unaudited)
(RMBS) as well as positioning in high quality Commercial Mortgage Backed Securities (CMBS) and collateralized loan obligations (CLOs), all contributed positively to returns relative to the Barclays U.S. Aggregate Bond Index over the period.
Derivatives were used to manage the Fund’s duration/yield curve positioning. They were also used to seek liquidity and to manage the overall risk positioning of the Fund. High yield credit default swap (CDS) index positions detracted from relative performance, but this was partially offset by positive results from an allocation to European Financials.
What is the outlook?
At the end of the period, we continued to maintain a moderately pro-cyclical risk stance in credit markets based on what we believe to be positive U.S. economic momentum, supportive monetary policy, and attractive valuations. We continue to believe capacity constraints will pressure inflation higher so we were positioned for an increase in inflation expectations at the end of the period. We were also positioned with a neutral U.S. duration posture. At the end of the period, we held allocations to non-agency MBS and high quality CLOs and maintained an overweight to CMBS. Within investment grade credit we continued to favor Financials. We were also overweight agency MBS based on attractive valuations versus Treasuries. Within high yield, we favored BB-rated securities, bank loans, and contingent convertibles (CoCos) of large European banks. We were positioned for widening U.S. dollar denominated EMD spreads.
Diversification by Security Type
as of December 31, 2015
| | | | |
| Category | | Percentage of
Net Assets | |
Equity Securities | | | | |
Preferred Stocks | | | 0.1 | % |
| | | | |
Total | | | 0.1 | % |
| | | | |
Fixed Income Securities | | | | |
Asset & Commercial Mortgage Backed Securities | | | 33.6 | % |
Corporate Bonds | | | 33.7 | |
Foreign Government Obligations | | | 3.3 | |
Municipal Bonds | | | 1.1 | |
Senior Floating Rate Interests | | | 5.8 | |
U.S. Government Agencies | | | 39.7 | |
U.S. Government Securities | | | 2.6 | |
| | | | |
Total | | | 119.8 | % |
| | | | |
Short-Term Investments | | | 3.2 | |
Purchased Options | | | 0.0 | |
Other Assets & Liabilities | | | (23.1 | ) |
| | | | |
Total | | | 100.0 | % |
| | | | |
Hartford Ultrashort Bond HLS Fund inception 08/31/1977
| | |
(sub-advised by Wellington Management Company LLP) | | Investment objective – The Fund seeks total return and income consistent with preserving capital and maintaining liquidity. |
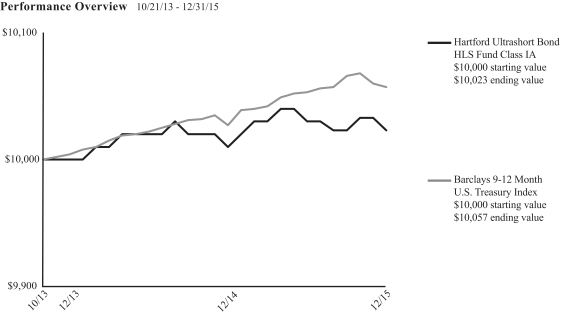
The chart above represents the hypothetical growth of a $10,000 investment in Class IA. Growth results in classes other than Class IA will vary from what is seen above due to differences in the expenses charged to those share classes.
Average Annual Total Return (as of 12/31/15)
| | | | | | | | |
| | | 1 Year | | | Since
Inception1 | |
Ultrashort Bond IA | | | 0.13% | | | | 0.10% | |
Ultrashort Bond IB | | | -0.09% | | | | -0.13% | |
Barclays 9-12 Month U.S. Treasury Index | | | 0.30% | | | | 0.26% | |
| 1 | On October 21, 2013, the Fund converted from a money market fund to an ultrashort bond fund. Total returns shown are from conversion date (October 21, 2013) to December 31, 2015. |
PERFORMANCE DATA QUOTED REPRESENTS PAST PERFORMANCE AND DOES NOT GUARANTEE FUTURE RESULTS. The investment return and principal value of the investment will fluctuate so that investors’ shares, when redeemed, may be worth more or less than their original cost. Current performance may be lower or higher than the performance data quoted. To obtain performance data current to the most recent month-end, please visit our website www.hartfordfunds.com.
Total returns presented above were calculated using the Fund’s net asset value available to shareholders for sale or redemption of Fund shares on December 31, 2015, which may exclude investment transactions as of this date. All share class returns assume the reinvestment of all distributions at net asset value and the deduction of all fund expenses.
Prior to October 21, 2013, the Fund was managed as a money market fund. Accordingly, performance of the Fund prior to October 21, 2013 is not shown. Past performance information for when the Fund was managed as a money market fund is available upon request by calling 1-888-843-7824.
Barclays 9-12 Month U.S. Treasury Index measures the performance of U.S. Treasury securities that have a remaining maturity between one and twelve months.
The index is unmanaged, and its results include reinvested dividends and/or distributions, but do not reflect the effect of sales charges, commissions, expenses or taxes.
You cannot invest directly in an index.
As shown in the Fund’s current prospectus dated May 1, 2015, the total annual fund operating expense ratios for Class IA and Class IB were 0.43% and 0.68%, respectively. Actual expenses may be higher. Please see the accompanying Financial Highlights for expense ratios for the year ended December 31, 2015.
All investments are subject to risk including the possible loss of principal. For a discussion of the Fund’s risks, please see the Main Risks section of this report. For more detailed information on the risks associated with an investment in the Fund, please see the prospectus.
The chart and table do not reflect the deductions of taxes, sales charges or other fees which may be applied at the variable life insurance, variable annuity or qualified retirement plan product level. Any such additional sales charges or other fees or expenses would lower the contract’s or plan’s performance.
|
| Hartford Ultrashort Bond HLS Fund |
Manager Discussion
December 31, 2015 (Unaudited)
Portfolio Manager
Timothy E. Smith
Senior Managing Director and Fixed Income Portfolio Manager
Wellington Management Company LLP
How did the Fund perform during the period?
The Class IA shares of Hartford Ultrashort Bond HLS Fund returned 0.13%, for the twelve-month period ended December 31, 2015, underperforming the Fund’s benchmark, the Barclays 9-12 Month U.S. Treasury Index, which returned 0.30% for the same period. The Fund also underperformed the 0.26% average return of the Lipper Short Investment Grade Debt Funds peer group, a group of funds that invest primarily in investment grade issues with dollar-weighted average maturities of one to five years.
Why did the Fund perform this way?
Fixed income markets were volatile over the twelve-month period as investors dealt with growing divergences in economic growth and central bank policy. With an improving economic outlook in the U.S. relative to the rest of the world, market participants agonized over the timing of the U.S. Federal Reserve Bank’s (Fed) first rate hike and its potential market implications. Increased risk of a Greek exit from the Eurozone and a prolonged drop in commodity prices further muddied the picture. Oil prices were extremely volatile over the period, having rebounded from record lows at the start of the year but falling again in the third and fourth quarters of 2015. Meanwhile, an unexpected devaluation in China’s currency rattled global financial markets, deepening fears about the Chinese economic slowdown and potential spillover effects on the global economy.
Many major central banks eased monetary policy during the period with some resorting to aggressive measures to counter deflation and stimulate growth. In the first half of the period, the European Central Bank (ECB) launched an open-ended government bond-buying program, which prompted other central banks to act to stop their currencies from appreciating. In China, the central bank entered into an aggressive monetary easing cycle to counter deflationary risks and slowing growth. Sub-trend growth and low inflation kept the Bank of England from enacting policy changes while the Fed charted a course for the end of quantitative easing.
Growth in the major developed markets stabilized in 2015 while emerging market growth languished, held back by a slowdown in Asia. Economic data in the Eurozone both improved and broadened out across countries; however, inflationary pressures were non-existent. The U.K. and Japan showed little sign of increased inflation despite the continued strength in their respective labor markets. In the U.S., data released during the period highlighted some conflicting themes affecting the economy. The fragile global economy, a stronger dollar, and falling oil prices created difficult conditions for the manufacturing sector. On the other hand, domestically centered
industries such as housing, retail, and service-based sectors posted solid results. While low commodity prices suppressed headline inflation, core consumer prices started to gradually move higher, giving the Fed confidence to raise rates in December. This widely anticipated rate hike marked an end to a seven-year period of near-zero interest rates, although the Federal Reserve Open Market Committee (FOMC) stated that the pace of interest-rate hikes would be very gradual and dependent on the direction of economic data. The FOMC seemingly achieved a smooth liftoff judging by the market’s relatively muted reaction following the announcement.
Globally, most credit risk sectors, with the exception of corporates, posted positive absolute returns as coupon income helped offset the impact of rising interest rates and widening bid-ask spreads. Most sectors underperformed duration-equivalent government bonds as spreads generally widened over the volatile period. High yield, in particular, experienced significant volatility on falling oil prices, China slowdown concerns, and a sharp increase in, high yield mutual fund outflows.
All sectors held by the Fund contributed to performance relative to the Barclays 9-12 Month U.S. Treasury Index during the period. An out-of-benchmark allocation to investment grade corporate credit, particularly within Financials and Industrials, contributed to relative performance during the period. An out-of-benchmark allocation to Asset Backed Securities (ABS) was also additive, specifically within auto and credit card ABS. Yield curve and duration positioning contributed positively to performance relative to the Barclays 9-12 Month U.S. Treasury Index during the period as we were short duration relative to the benchmark as short rates rose during the period. Allocation to the Investment Grade Credit during the period detracted from overall Fund performance. A heavy supply of new issue corporate bonds during the third quarter and the fourth quarter, combined with a risk adverse market sentiment, pressured performance of the sector as demand could not keep up with supply during the period. We use Treasury futures and interest rate swaps to manage duration and yield curve exposure which were modestly additive to performance.
What is the outlook?
U.S. economic momentum appears to be positive, and we expect moderately stronger U.S. growth in 2016. However, challenges to the global growth outlook and uncertainty surrounding China and emerging markets broadly remain. On balance, the Fund is positioned with a moderately pro-cyclical risk posture.
|
| Hartford Ultrashort Bond HLS Fund |
Manager Discussion – (continued)
December 31, 2015 (Unaudited)
We continue to expect the Fed to raise the Fed Funds rate gradually in 2016 as the data allows; as a result, at the end of the period our duration positioning was short relative to the Barclays 9-12 Month U.S. Treasury Index. We believe that U.S. governments remain the most liquid sector, and continue to own select agencies with maturities of 3 years and or less. Commodity prices have kept inflation low but we believe wage pressures are likely to build.
We continued to be positioned with out-of-benchmark allocations to investment grade corporates, ABS, and Commercial Mortgage Backed Securities (CMBS) at the end of the period. Within investment grade corporates, we favor U.S. Financials, as financial companies have de-levered significantly. Within ABS, we favor auto, credit card and equipment issuers. We also continue to believe CMBS valuations and long term fundamentals remain attractive.
Diversification by Security Type
as of December 31, 2015
| | | | |
| Category | | Percentage of
Net Assets | |
Fixed Income Securities | | | | |
Asset & Commercial Mortgage Backed Securities | | | 20.3 | % |
Corporate Bonds | | | 49.4 | |
Municipal Bonds | | | 0.5 | |
U.S. Government Agencies | | | 17.1 | |
U.S. Government Securities | | | 11.2 | |
| | | | |
Total | | | 98.5 | % |
| | | | |
Short-Term Investments | | | 1.5 | |
Other Assets & Liabilities | | | 0.0 | |
| | | | |
Total | | | 100.0 | % |
| | | | |
Hartford U.S. Government Securities HLS Fund inception 03/24/1987
| | |
(sub-advised by Wellington Management Company LLP) | | Investment objective – The Fund seeks to maximize total return while providing shareholders with a high level of current income consistent with prudent investment risk. |
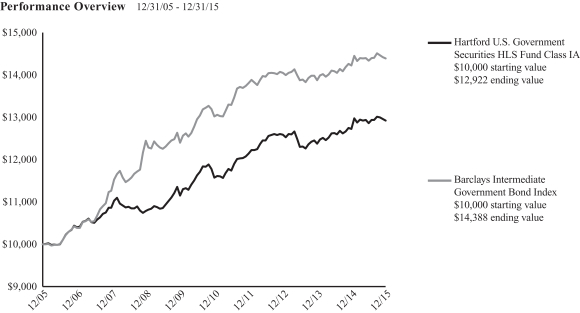
The chart above represents the hypothetical growth of a $10,000 investment in Class IA. Growth results in classes other than Class IA will vary from what is seen above due to differences in the expenses charged to those share classes.
Average Annual Total Return (as of 12/31/15)
| | | | | | | | | | | | |
| | | 1 Year | | | 5 Years | | | 10 Years | |
U.S. Government Securities IA | | | 1.56% | | | | 2.23% | | | | 2.60% | |
U.S. Government Securities IB | | | 1.35% | | | | 1.98% | | | | 2.34% | |
Barclays Intermediate Government Bond Index | | | 1.18% | | | | 2.03% | | | | 3.71% | |
PERFORMANCE DATA QUOTED REPRESENTS PAST PERFORMANCE AND DOES NOT GUARANTEE FUTURE RESULTS. The investment return and principal value of the investment will fluctuate so that investors’ shares, when redeemed, may be worth more or less than their original cost. Current performance may be lower or higher than the performance data quoted. To obtain performance data current to the most recent month-end, please visit our website www.hartfordfunds.com.
Total returns presented above were calculated using the Fund’s net asset value available to shareholders for sale or redemption of Fund shares on December 31, 2015, which may exclude investment transactions as of this date. All share class returns assume the reinvestment of all distributions at net asset value and the deduction of all fund expenses.
Performance information includes performance under the Fund’s previous sub-adviser, Hartford Investment Management Company. As of March 5, 2012, Hartford Investment Management Company no longer served as the sub-adviser to the Fund.
Barclays Intermediate Government Bond Index is an unmanaged index of government bonds with maturities of between one and ten years.
The index is unmanaged, and its results include reinvested dividends and/or distributions, but do not reflect the effect of sales charges, commissions, expenses or taxes.
You cannot invest directly in an index.
As shown in the Fund’s current prospectus dated May 1, 2015, the total annual fund operating expense ratios for Class IA and Class IB were 0.48% and 0.73%,
respectively. Actual expenses may be higher. Please see the accompanying Financial Highlights for expense ratios for the year ended December 31, 2015.
All investments are subject to risk including the possible loss of principal. For a discussion of the Fund’s risks, please see the Main Risks section of this report. For more detailed information on the risks associated with an investment in the Fund, please see the prospectus.
The chart and table do not reflect the deductions of taxes, sales charges or other fees which may be applied at the variable life insurance, variable annuity or qualified retirement plan product level. Any such additional sales charges or other fees or expenses would lower the contract’s or plan’s performance.
|
| Hartford U.S. Government Securities HLS Fund |
Manager Discussion
December 31, 2015 (Unaudited)
Portfolio Manager
Michael F. Garrett
Senior Managing Director and Fixed Income Portfolio Manager
Wellington Management Company LLP
How did the Fund perform during the period?
The Class IA shares of Hartford U.S. Government Securities HLS Fund returned 1.56% for the twelve-month period ended December 31, 2015, outperforming the Fund’s benchmark, the Barclays Intermediate Government Bond Index, which returned 1.18% for the same period. The Fund also outperformed the 0.80% average return of the Lipper Intermediate U.S. Government Funds peer group, a group of funds that invest primarily in U.S. government and agency issues.
Why did the Fund perform this way?
Fixed income markets were volatile over the twelve-month period as investors dealt with growing divergences in economic growth and central bank policy. With an improving economic outlook in the U.S. relative to the rest of the world, market participants agonized over the timing of the U.S. Federal Reserve Bank’s (Fed) first rate hike and its potential market implications. Increased risk of a Greek exit from the Eurozone and a prolonged drop in commodity prices further muddied the picture. Oil prices were extremely volatile over the period, having rebounded from record lows at the start of the year but falling again in the third and fourth quarters of 2015. Meanwhile, an unexpected devaluation in China’s currency rattled global financial markets, deepening fears about the Chinese economic slowdown and potential spillover effects on the global economy.
Many major central banks eased monetary policy during the period with some resorting to aggressive measures to counter deflation and stimulate growth. In the first half of the period, the European Central Bank (ECB) launched an open-ended government bond-buying program, which prompted other central banks to act to stop their currencies from appreciating. In China, the central bank entered into an aggressive monetary easing cycle to counter deflationary risks and slowing growth. Sub-trend growth and low inflation kept the Bank of England from enacting policy changes while the Fed charted a course for the end of quantitative easing.
Growth in the major developed markets stabilized in 2015 while emerging market growth languished, held back by a slowdown in Asia. Economic data in the Eurozone both improved and broadened out across countries; however, inflationary pressures were non-existent. The U.K. and Japan showed little sign of increased inflation despite the continued strength in their respective labor markets. In the U.S., data released during the period highlighted some conflicting themes affecting the economy. The fragile global economy, a stronger dollar, and falling oil prices created difficult conditions for the manufacturing sector. On the other hand, domestically centered
industries such as housing, retail, and service-based sectors posted solid results. While low commodity prices suppressed headline inflation, core consumer prices started to gradually move higher, giving the Fed confidence to raise rates in December. This widely anticipated rate hike marked an end to a seven-year period of near-zero interest rates, although the Federal Reserve Open Market Committee (FOMC) stated that the pace of interest-rate hikes would be very gradual and dependent on the direction of economic data. The FOMC seemingly achieved a smooth liftoff judging by the market’s relatively muted reaction following the announcement.
Globally, most credit risk sectors, with the exception of corporates, posted positive absolute returns as coupon income helped offset the impact of rising interest rates and widening bid-ask spreads. Most sectors underperformed duration-equivalent government bonds as spreads generally widened over the volatile period. High yield, in particular, experienced significant volatility on falling oil prices, China slowdown concerns, and a sharp increase in, high yield mutual fund outflows.
Out-of-benchmark allocations to mortgage backed securities (MBS), Asset Backed Securities (ABS), and Commercial Mortgage Backed Securities (CMBS) were the main drivers of outperformance relative to the Barclays Intermediate Government Bond Index over the period. Specifically within MBS, allocations to agency collateralized mortgage obligations (CMOs), Delegated Underwriting Servicing bonds (DUS), and non-agency residential mortgage-backed securities (RMBS) contributed to the Fund’s relative outperformance over the period. Within ABS, exposure to collateralized loan obligations (CLOs) was the primary driver of benchmark-relative returns over the period.
During the period, we used Treasury futures and interest rate swaps to manage duration and yield curve exposures; overall these components had a neutral impact on performance relative to the Barclays Intermediate Government Bond Index over the period. On the other hand, an out-of-benchmark allocation to U.S. TIPS and duration and yield curve positioning detracted from returns relative to the Barclays Intermediate Government Bond Index over the period.
What is the outlook?
We maintain our view that the Fed will continue to raise short term interest rates going into 2016 based on what we consider to be an improving domestic economy, which we believe should put upward pressure on the front end of the yield curve. We expect volatility in MBS spreads over the short term to be relatively low. MBS spreads
|
| Hartford U.S. Government Securities HLS Fund |
Manager Discussion – (continued)
December 31, 2015 (Unaudited)
have tightened since the mid-December Fed meeting, back toward the tight-end of their recent range. The Fed also stated their intention to continue reinvesting MBS principal payments until the normalization process is “well under way”, likely into 2016 at the earliest.
As the year progresses, we expect Fed uncertainty, concerns over the implications of tightening monetary policy, and higher rates, with the potential to pressure MBS spreads. Additionally, we believe that spreads will likely widen if the Fed eventually ceases reinvestment, and we expect this to be priced into the market well in advance of when the end of reinvestment is announced. Consequently, with spreads close to the tight end of the historical range, we are less convinced that they can sustain these levels as the year progresses.
We have a constructive outlook on most non-agency RMBS, given the continuing recovery of the U.S. housing market. Spreads have tightened substantially in the wake of the global financial crisis; however, we still believe the sector is attractively valued versus other credit markets, especially given our assessment of the relative risks. We continue to expect home-price appreciation to normalize toward the historical range of 3-5% which should continue to support the sector. Despite recovering housing starts, inventory remains low after years of underdevelopment, and underwriting standards remain quite conservative. In this environment, we believe the credit performance of residential mortgages should continue to improve.
Our longer term outlook on CMBS is constructive due to favorable commercial real estate (CRE) fundamentals and compelling valuations in our opinion. However, we are cautious in the near term given the heavy expected supply and deteriorating underwriting standards on new issuance. We believe fundamentals remain positive as the sector continues to be supported by the recovering economy, an improved CRE lending environment, and a manageable near-term loan-maturity schedule. Occupancy and rents have risen, resulting in continued price appreciation. Within new issuance, underwriting standards continue to deteriorate with an increase in leverage, more interest only (IO) loans, and non-traditional property types, which requires us to be judicious in security selection, both within and across mergers and acquisitions. Rising interest rates remain a risk factor, but as long as that is accompanied by a recovering economy and improving rents, we believe the impact on CMBS should be limited.
Overall, we continue to be constructive on the ABS sector driven by strong consumer fundamentals. We believe a strengthening employment picture combined with low energy prices should continue to benefit consumers, especially those with a lower income. In addition, we continue to see value in senior CLOs, but are more neutral relative to other structured credit.
Diversification by Security Type
as of December 31, 2015
| | | | |
| Category | | Percentage of
Net Assets | |
Fixed Income Securities | | | | |
Asset & Commercial Mortgage Backed Securities | | | 24.2 | % |
U.S. Government Agencies | | | 45.2 | |
U.S. Government Securities | | | 41.5 | |
| | | | |
Total | | | 110.9 | % |
| | | | |
Short-Term Investments | | | 4.1 | |
Other Assets & Liabilities | | | (15.0 | ) |
| | | | |
Total | | | 100.0 | % |
| | | | |
Hartford Value HLS Fund inception 04/30/2001
| | |
(sub-advised by Wellington Management Company LLP) | | Investment objective – The Fund seeks long-term total return. |
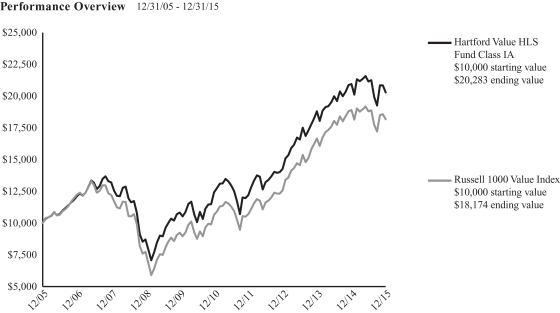
The chart above represents the hypothetical growth of a $10,000 investment in Class IA. Growth results in classes other than Class IA will vary from what is seen above due to differences in the expenses charged to those share classes.
Average Annual Total Return (as of 12/31/15)
| | | | | | | | | | | | |
| | | 1 Year | | | 5 Years | | | 10 Years | |
Value IA | | | -3.08% | | | | 10.31% | | | | 7.33% | |
Value IB | | | -3.35% | | | | 10.04% | | | | 7.12% | |
Russell 1000 Value Index | | | -3.83% | | | | 11.27% | | | | 6.16% | |
PERFORMANCE DATA QUOTED REPRESENTS PAST PERFORMANCE AND DOES NOT GUARANTEE FUTURE RESULTS. The investment return and principal value of the investment will fluctuate so that investors’ shares, when redeemed, may be worth more or less than their original cost. Current performance may be lower or higher than the performance data quoted. To obtain performance data current to the most recent month-end, please visit our website www.hartfordfunds.com.
Total returns presented above were calculated using the Fund’s net asset value available to shareholders for sale or redemption of Fund shares on December 31, 2015, which may exclude investment transactions as of this date. All share class returns assume the reinvestment of all distributions at net asset value and the deduction of all fund expenses.
Russell 1000 Value Index is an unmanaged index that measures the performance of those Russell 1000 Index companies with lower price-to-book ratios and lower forecasted growth values. The Russell 1000 Index is an unmanaged index that measures the performance of the 1,000 largest companies in the Russell 3000 Index, which measures the performance of the 3,000 largest U.S. companies, based on total market capitalizations.
The index is unmanaged, and its results include reinvested dividends and/or distributions, but do not reflect the effect of sales charges, commissions, expenses or taxes.
You cannot invest directly in an index.
As shown in the Fund’s current prospectus dated May 1, 2015, the total annual fund operating expense ratios for Class IA and Class IB were 0.77% and 1.02%,
respectively. Actual expenses may be higher. Please see the accompanying Financial Highlights for expense ratios for the year ended December 31, 2015.
All investments are subject to risk including the possible loss of principal. For a discussion of the Fund’s risks, please see the Main Risks section of this report. For more detailed information on the risks associated with an investment in the Fund, please see the prospectus.
The chart and table do not reflect the deductions of taxes, sales charges or other fees which may be applied at the variable life insurance, variable annuity or qualified retirement plan product level. Any such additional sales charges or other fees or expenses would lower the contract’s or plan’s performance.
Manager Discussion
December 31, 2015 (Unaudited)
Portfolio Managers
Karen H. Grimes, CFA
Senior Managing Director and Equity Portfolio Manager
Wellington Management Company LLP
W. Michael Reckmeyer, III, CFA
Senior Managing Director and Equity Portfolio Manager
Wellington Management Company LLP
Ian R. Link, CFA
Senior Managing Director and Equity Portfolio Manager
Wellington Management Company LLP
How did the Fund perform during the period?
The Class IA shares of Hartford Value HLS Fund returned -3.08% for the twelve-month period ended December 31, 2015, outperforming the Fund’s benchmark, the Russell 1000 Value Index, which returned -3.83% for the same period. The Fund also outperformed the -3.82% average return of the Lipper Large Cap Value Funds peer group, a group of funds with investment strategies similar to those of the Fund.
Why did the Fund perform this way?
U.S. equities, as measured by the S&P 500 Index, rose modestly during the twelve-month period. U.S. stocks retreated briefly early in 2015, but then reached new all-time highs on March 2, April 24, and May 21. The market pulled back in early March as soft manufacturing data, potentially negative currency- and oil-related earnings, and valuation concerns weighed on investors’ minds. However, risk appetites increased after the March 18 Federal Open Market Committee statement underlined the U.S. Federal Reserve’s (Fed) hesitation to raise rates as U.S. domestic inflation remained subdued and other major central banks maintained an easing bias. In April, the tech-heavy Nasdaq Composite topped the 5,000 mark for the first time in 15 years and broke its closing record from March 2000. Continued strong merger and acquisition (M&A) activity, a rebound in hiring, and solid housing data helped to fuel risk appetites. May marked the second-best month ever for M&As involving U.S. companies with $234 billion in announced mergers. Stocks ended June on a sour note after negotiations between Greece and its creditors regarding Greece’s loan repayments broke down.
In the second half of the period, the U.S. economy remained on solid footing, with a sharp rebound in Gross Domestic Product (GDP), a seven-year low in unemployment, and a healthy housing market report. While the growth slowdown in China and its implications for global commerce fueled investor anxiety, uncertainty about the Fed’s rate hike timeline also weighed on sentiment. During August and September, the market remained extremely volatile and experienced its first correction (a decline of at least 10%) since October 2011. Oil prices and the Energy sector as a whole remained extremely volatile,
with prices recovering from the initial drop earlier in the period and falling sharply towards the end of the year. As many market participants expected, the Fed left rates unchanged at its highly anticipated September meeting. The Fed’s statement appeared to spook some investors as it acknowledged that “recent global economic and financial developments may restrain economic activity somewhat and are likely to put further downward pressure on inflation in the near term.” After much anticipation, the Fed delivered its first rate hike since 2006 in December, approving a small increase in the federal funds rate. The market initially reacted positively to the news, but remained volatile through the end of year as investors digested the impact of the rate increase and global economic developments.
Returns varied noticeably over the period by market-cap, as small cap (-4%) and mid cap (-2%) equities underperformed large cap (+1%) equities as measured by the Russell 2000, S&P MidCap 400, and S&P 500 Indices, respectively. In this environment, seven of the ten sectors within the Russell 1000 Value Index posted negative returns during the period. The Energy (-23%), Materials (-11%), and Consumer Discretionary (-6%) sectors lagged the most while Healthcare (+8%), Telecommunications Services (+4%), and Industrials (+1%) posted positive returns for the year.
The Fund’s outperformance relative to the Russell 1000 Value Index during the period was primarily driven by positive security selection. Strong security selection within the Consumer Staples, Information Technology, and Financials sectors more than offset weaker selection within the Energy and Healthcare sectors. Sector allocation, a residual of the bottom-up stock selection process, marginally detracted from benchmark-relative performance, largely due to benchmark-relative overweights to the Information Technology and Consumer Discretionary sectors, which offset the positive impact of an underweight to Energy.
The largest contributors to returns relative to the Russell 1000 Value Index were Kraft Foods Group (Consumer Staples), Kinder Morgan (Energy), and Home Depot (Consumer Discretionary). Shares of Kraft Foods Group, a packaged food company, rose during the
Manager Discussion – (continued)
December 31, 2015 (Unaudited)
period on news of its merger with Heinz, a move that was viewed favorably by investors. Shares of Kinder Morgan, a U.S.-based oil pipeline transportation and storage company, fell over the period as oil prices continued to deteriorate. Not holding the benchmark constituent contributed positively to benchmark-relative returns over the period. Shares of U.S.-based home improvement retailer Home Depot rose as the company benefited from a sturdy U.S. housing market amid a continuing low interest rate environment. Top absolute contributors during the period also included Microsoft (Information Technology).
The top detractors from returns relative to the Russell 1000 Value Index over the period were Southwestern Energy (Energy), Marathon Oil (Energy), and PVH Corp (Consumer Discretionary). Shares of U.S.-based natural gas and oil exploration, development, and production companies Southwestern Energy and Marathon Oil were weighed down by weakness in the energy markets. Shares of PVH Corp, a U.S.-based global apparel company, fell over the period due to worries about the strong U.S. dollar negatively impacting earnings, despite what appeared to be competent management execution of its business plan. Chevron (Energy) also detracted on an absolute basis.
Derivatives were not used in a significant manner in the Fund during the period and did not have a material impact on performance during the period.
What is the outlook?
Looking ahead to 2016, we continue to seek what we consider to be balance in the portfolio to allow for upside potential while limiting downside risk. For example, while some bank and insurance stocks should benefit from prospective rate increases, we expect to continue to maintain exposure to other sectors of the market that are less interest rate sensitive. We likely will avoid Financials with higher exposure to energy markets. Within Energy, we appreciate that the moderation of commodity prices may follow several different paths, and we are looking to incorporate a broad range of possible prices into our analysis. We are positioning the portfolio to have exposure to companies we believe are best capitalized to withstand a protracted period of depressed prices. Based on individual stock decisions, the Fund ended the period most overweight to the Consumer Discretionary, Healthcare, and Industrials sectors, and most underweight the Financials, Utilities, and Energy sectors relative to the Russell 1000 Value Index.
Diversification by Sector
as of December 31, 2015
| | | | |
| Sector | | Percentage of
Net Assets | |
Equity Securities | | | | |
Consumer Discretionary | | | 11.3 | % |
Consumer Staples | | | 4.6 | |
Energy | | | 9.2 | |
Financials | | | 26.1 | |
Health Care | | | 13.8 | |
Industrials | | | 11.6 | |
Information Technology | | | 11.6 | |
Materials | | | 3.5 | |
Telecommunication Services | | | 1.5 | |
Utilities | | | 3.2 | |
| | | | |
Total | | | 96.4 | % |
| | | | |
Short-Term Investments | | | 1.0 | |
Other Assets & Liabilities | | | 2.6 | |
| | | | |
Total | | | 100.0 | % |
| | | | |
A sector may be comprised of several industries. For Fund compliance purposes, the Fund may not use the same classification system and these sector classifications are used for financial reporting purposes.
Expense Examples (Unaudited)
Your Fund’s Expenses
As a shareholder of a Fund, you incur two types of costs: (1) transaction costs and (2) ongoing costs, including investment management fees, distribution and/or service (12b-1) fees, if any, and other fund expenses. This example is intended to help you understand your ongoing costs (in dollars) of investing in a Fund and to compare these costs with the ongoing costs of investing in other mutual funds. The example is based on an investment of $1,000 invested at the beginning of the period and held for the entire period of July 1, 2015 through December 31, 2015.
Actual Expenses
The first set of columns of the table below provides information about actual account values and actual expenses. You may use this information, together with the amount you invested, to estimate the expenses that you paid over the period. Simply divide your account value by $1,000 (for example, an $8,600 account value divided by $1,000 = 8.6), then multiply the result by the number in the line under the heading entitled “Expenses Paid During Period” to estimate the expenses you paid on your account during this period.
Hypothetical Example for Comparison Purposes
The second set of columns of the table below provides information about hypothetical account values and hypothetical expenses based on a Fund’s actual expense ratio and an assumed rate of return of 5% per year before expenses, which is not the Fund’s actual return. The hypothetical account values and expenses may not be used to estimate the actual ending account balance or expenses you paid for the period. You may use this information to compare the ongoing costs of investing in a Fund and other funds. To do so, compare this 5% hypothetical example with the 5% hypothetical examples that appear in the shareholder reports of the other funds.
Please note that the expenses shown in the table are meant to highlight your ongoing costs only and do not reflect any transactional costs, such as sales charges (loads) or fees which may be applied at the variable life insurance, variable annuity, or qualified retirement plan product level. Therefore, the second set of columns of the table is useful in comparing ongoing costs only, and will not help you determine the relative total costs of owning different funds. In addition, if these transactional costs were included, your costs would be higher. Expenses are equal to a Fund’s annualized expense ratios multiplied by average account value over the period, multiplied by 184/365 (to reflect the one-half year period).
Hartford Balanced HLS Fund
| | | | | | | | | | | | | | | | | | | | | | | | | | | | | | | | | | | | |
| | | Actual Return | | | Hypothetical (5% return before expenses) | | | | | | | | | | |
| | | Beginning
Account
Value
July 1,
2015 | | | Ending
Account
Value
December 31,
2015 | | | Expenses paid
during the period
July 1, 2015
through December 31,
2015 | | | Beginning
Account
Value
July 1,
2015 | | | Ending
Account
Value
December 31,
2015 | | | Expenses paid
during the period
July 1, 2015
through December 31,
2015 | | | Annualized
expense
ratio | | | Days in
the
current
1/2 year | | | Days in
the full
year | |
Class IA | | $ | 1,000.00 | | | $ | 989.70 | | | $ | 3.16 | | | $ | 1,000.00 | | | $ | 1,022.03 | | | $ | 3.21 | | | | 0.63 | % | | | 184 | | | | 365 | |
Class IB | | $ | 1,000.00 | | | $ | 988.50 | | | $ | 4.41 | | | $ | 1,000.00 | | | $ | 1,020.77 | | | $ | 4.48 | | | | 0.88 | % | | | 184 | | | | 365 | |
Hartford Capital Appreciation HLS Fund
| | | | | | | | | | | | | | | | | | | | | | | | | | | | | | | | | | | | |
| | | Actual Return | | | Hypothetical (5% return before expenses) | | | | | | | | | | |
| | | Beginning
Account
Value
July 1,
2015 | | | Ending
Account
Value
December 31,
2015 | | | Expenses paid
during the period
July 1, 2015
through December 31,
2015 | | | Beginning
Account
Value
July 1,
2015 | | | Ending
Account
Value
December 31,
2015 | | | Expenses paid
during the period
July 1, 2015
through December 31,
2015 | | | Annualized
expense
ratio | | | Days in
the
current
1/2 year | | | Days in
the full
year | |
Class IA | | $ | 1,000.00 | | | $ | 970.10 | | | $ | 3.33 | | | $ | 1,000.00 | | | $ | 1,021.83 | | | $ | 3.41 | | | | 0.67 | % | | | 184 | | | | 365 | |
Class IB | | $ | 1,000.00 | | | $ | 969.10 | | | $ | 4.57 | | | $ | 1,000.00 | | | $ | 1,020.57 | | | $ | 4.69 | | | | 0.92 | % | | | 184 | | | | 365 | |
Class IC | | $ | 1,000.00 | | | $ | 967.80 | | | $ | 5.80 | | | $ | 1,000.00 | | | $ | 1,019.31 | | | $ | 5.96 | | | | 1.17 | % | | | 184 | | | | 365 | |
Expense Examples (Unaudited) – (continued)
Hartford Disciplined Equity HLS Fund
| | | | | | | | | | | | | | | | | | | | | | | | | | | | | | | | | | | | |
| | | Actual Return | | | Hypothetical (5% return before expenses) | | | | | | | | | | |
| | | Beginning
Account
Value
July 1,
2015 | | | Ending
Account
Value
December 31,
2015 | | | Expenses paid
during the period
July 1, 2015
through December 31,
2015 | | | Beginning
Account
Value
July 1,
2015 | | | Ending
Account
Value
December 31,
2015 | | | Expenses paid
during the period
July 1, 2015
through December 31,
2015 | | |
Annualized
expense
ratio | | | Days in
the
current
1/2 year | | | Days in
the full
year | |
Class IA | | $ | 1,000.00 | | | $ | 1,020.70 | | | $ | 3.92 | | | $ | 1,000.00 | | | $ | 1,021.32 | | | $ | 3.92 | | | | 0.77 | % | | | 184 | | | | 365 | |
Class IB | | $ | 1,000.00 | | | $ | 1,019.10 | | | $ | 5.19 | | | $ | 1,000.00 | | | $ | 1,020.06 | | | $ | 5.19 | | | | 1.02 | % | | | 184 | | | | 365 | |
Hartford Dividend and Growth HLS Fund
| | | | | | | | | | | | | | | | | | | | | | | | | | | | | | | | | | | | |
| | | Actual Return | | | Hypothetical (5% return before expenses) | | | | | | | | | | |
| | | Beginning
Account
Value
July 1,
2015 | | | Ending
Account
Value
December 31,
2015 | | | Expenses paid
during the period
July 1, 2015
through December 31,
2015 | | | Beginning
Account
Value
July 1,
2015 | | | Ending
Account
Value
December 31,
2015 | | | Expenses paid
during the period
July 1, 2015
through December 31,
2015 | | |
Annualized
expense
ratio | | | Days in
the
current
1/2 year | | | Days in
the full
year | |
Class IA | | $ | 1,000.00 | | | $ | 988.80 | | | $ | 3.41 | | | $ | 1,000.00 | | | $ | 1,021.78 | | | $ | 3.47 | | | | 0.68 | % | | | 184 | | | | 365 | |
Class IB | | $ | 1,000.00 | | | $ | 987.40 | | | $ | 4.66 | | | $ | 1,000.00 | | | $ | 1,020.52 | | | $ | 4.74 | | | | 0.93 | % | | | 184 | | | | 365 | |
Hartford Global Growth HLS Fund
| | | | | | | | | | | | | | | | | | | | | | | | | | | | | | | | | | | | |
| | | Actual Return | | | Hypothetical (5% return before expenses) | | | | | | | | | | |
| | | Beginning
Account
Value
July 1,
2015 | | | Ending
Account
Value
December 31,
2015 | | | Expenses paid
during the period
July 1, 2015 through December 31,
2015 | | | Beginning
Account
Value
July 1,
2015 | | | Ending
Account
Value
December 31,
2015 | | | Expenses paid
during the period
July 1, 2015
through December 31,
2015 | | |
Annualized
expense
ratio | | | Days in
the
current
1/2 year | | | Days in
the full
year | |
Class IA | | $ | 1,000.00 | | | $ | 1,007.40 | | | $ | 4.10 | | | $ | 1,000.00 | | | $ | 1,021.12 | | | $ | 4.13 | | | | 0.81 | % | | | 184 | | | | 365 | |
Class IB | | $ | 1,000.00 | | | $ | 1,006.30 | | | $ | 5.36 | | | $ | 1,000.00 | | | $ | 1,019.86 | | | $ | 5.40 | | | | 1.06 | % | | | 184 | | | | 365 | |
Hartford Growth Opportunities HLS Fund
| | | | | | | | | | | | | | | | | | | | | | | | | | | | | | | | | | | | |
| | | Actual Return | | | Hypothetical (5% return before expenses) | | | | | | | | | | |
| | | Beginning
Account
Value
July 1,
2015 | | | Ending
Account
Value
December 31,
2015 | | | Expenses paid
during the period
July 1, 2015 through December 31,
2015 | | | Beginning
Account
Value
July 1,
2015 | | | Ending
Account
Value
December 31,
2015 | | | Expenses paid
during the period
July 1, 2015
through December 31,
2015 | | |
Annualized
expense
ratio | | | Days in
the
current
1/2 year | | | Days in
the full
year | |
Class IA | | $ | 1,000.00 | | | $ | 1,009.40 | | | $ | 3.29 | | | $ | 1,000.00 | | | $ | 1,021.93 | | | $ | 3.31 | | | | 0.65 | % | | | 184 | | | | 365 | |
Class IB | | $ | 1,000.00 | | | $ | 1,008.10 | | | $ | 4.56 | | | $ | 1,000.00 | | | $ | 1,020.67 | | | $ | 4.58 | | | | 0.90 | % | | | 184 | | | | 365 | |
Class IC | | $ | 1,000.00 | | | $ | 1,006.80 | | | $ | 5.87 | | | $ | 1,000.00 | | | $ | 1,019.36 | | | $ | 5.90 | | | | 1.16 | % | | | 184 | | | | 365 | |
Expense Examples (Unaudited) – (continued)
Hartford Healthcare HLS Fund
| | | | | | | | | | | | | | | | | | | | | | | | | | | | | | | | | | | | |
| | | Actual Return | | | Hypothetical (5% return before expenses) | | | | | | | | | | |
| | | Beginning
Account
Value
July 1,
2015 | | | Ending
Account
Value
December 31,
2015 | | | Expenses paid
during the period
July 1, 2015
through December 31,
2015 | | | Beginning
Account
Value
July 1,
2015 | | | Ending
Account
Value
December 31,
2015 | | | Expenses paid
during the period
July 1, 2015
through December 31,
2015 | | |
Annualized
expense
ratio | | | Days in
the
current
1/2 year | | | Days in
the full
year | |
Class IA | | $ | 1,000.00 | | | $ | 981.10 | | | $ | 4.34 | | | $ | 1,000.00 | | | $ | 1,020.82 | | | $ | 4.43 | | | | 0.87 | % | | | 184 | | | | 365 | |
Class IB | | $ | 1,000.00 | | | $ | 980.20 | | | $ | 5.54 | | | $ | 1,000.00 | | | $ | 1,019.61 | | | $ | 5.65 | | | | 1.11 | % | | | 184 | | | | 365 | |
Hartford High Yield HLS Fund
| | | | | | | | | | | | | | | | | | | | | | | | | | | | | | | | | | | | |
| | | Actual Return | | | Hypothetical (5% return before expenses) | | | | | | | | | | |
| | | Beginning
Account
Value
July 1,
2015 | | | Ending
Account
Value
December 31,
2015 | | | Expenses paid
during the period
July 1, 2015
through December 31,
2015 | | | Beginning
Account
Value
July 1,
2015 | | | Ending
Account
Value
December 31,
2015 | | | Expenses paid
during the period
July 1, 2015
through December 31,
2015 | | | Annualized
expense
ratio | | | Days in
the
current
1/2 year | | | Days in
the full
year | |
Class IA | | $ | 1,000.00 | | | $ | 934.80 | | | $ | 3.71 | | | $ | 1,000.00 | | | $ | 1,021.37 | | | $ | 3.87 | | | | 0.76 | % | | | 184 | | | | 365 | |
Class IB | | $ | 1,000.00 | | | $ | 933.10 | | | $ | 4.92 | | | $ | 1,000.00 | | | $ | 1,020.11 | | | $ | 5.14 | | | | 1.01 | % | | | 184 | | | | 365 | |
Hartford International Opportunities HLS Fund
| | | | | | | | | | | | | | | | | | | | | | | | | | | | | | | | | | | | |
| | | Actual Return | | | Hypothetical (5% return before expenses) | | | | | | | | | | |
| | | Beginning
Account
Value
July 1,
2015 | | | Ending
Account
Value
December 31,
2015 | | | Expenses paid
during the period
July 1, 2015
through December 31,
2015 | | | Beginning
Account
Value
July 1,
2015 | | | Ending
Account
Value
December 31,
2015 | | | Expenses paid
during the period
July 1, 2015
through December 31,
2015 | | |
Annualized
expense
ratio | | | Days in
the
current
1/2 year | | | Days in
the full
year | |
Class IA | | $ | 1,000.00 | | | $ | 952.70 | | | $ | 3.64 | | | $ | 1,000.00 | | | $ | 1,021.48 | | | $ | 3.77 | | | | 0.74 | % | | | 184 | | | | 365 | |
Class IB | | $ | 1,000.00 | | | $ | 951.90 | | | $ | 4.87 | | | $ | 1,000.00 | | | $ | 1,020.22 | | | $ | 5.04 | | | | 0.99 | % | | | 184 | | | | 365 | |
Hartford MidCap HLS Fund
| | | | | | | | | | | | | | | | | | | | | | | | | | | | | | | | | | | | |
| | | Actual Return | | | Hypothetical (5% return before expenses) | | | | | | | | | | |
| | | Beginning
Account
Value
July 1,
2015 | | | Ending
Account
Value
December 31,
2015 | | | Expenses paid
during the period
July 1, 2015
through December 31,
2015 | | | Beginning
Account
Value
July 1,
2015 | | | Ending
Account
Value
December 31,
2015 | | | Expenses paid
during the period
July 1, 2015
through December 31,
2015 | | |
Annualized
expense
ratio | | | Days in
the
current
1/2 year | | | Days in
the full
year | |
Class IA | | $ | 1,000.00 | | | $ | 962.00 | | | $ | 3.46 | | | $ | 1,000.00 | | | $ | 1,021.68 | | | $ | 3.57 | | | | 0.70 | % | | | 184 | | | | 365 | |
Class IB | | $ | 1,000.00 | | | $ | 960.90 | | | $ | 4.70 | | | $ | 1,000.00 | | | $ | 1,020.42 | | | $ | 4.84 | | | | 0.95 | % | | | 184 | | | | 365 | |
Expense Examples (Unaudited) – (continued)
Hartford MidCap Value HLS Fund
| | | | | | | | | | | | | | | | | | | | | | | | | | | | | | | | | | | | |
| | | Actual Return | | | Hypothetical (5% return before expenses) | | | | | | | | | | |
| | | Beginning
Account
Value
July 1,
2015 | | | Ending
Account
Value
December 31,
2015 | | | Expenses paid
during the period
July 1, 2015
through December 31,
2015 | | | Beginning
Account
Value
July 1,
2015 | | | Ending
Account
Value
December 31,
2015 | | | Expenses paid
during the period
July 1, 2015
through December 31,
2015 | | |
Annualized
expense
ratio | | | Days in
the
current
1/2 year | | | Days in
the full
year | |
Class IA | | $ | 1,000.00 | | | $ | 942.10 | | | $ | 4.11 | | | $ | 1,000.00 | | | $ | 1,020.97 | | | $ | 4.28 | | | | 0.84 | % | | | 184 | | | | 365 | |
Class IB | | $ | 1,000.00 | | | $ | 940.10 | | | $ | 5.33 | | | $ | 1,000.00 | | | $ | 1,019.71 | | | $ | 5.55 | | | | 1.09 | % | | | 184 | | | | 365 | |
Hartford Small Company HLS Fund
| | | | | | | | | | | | | | | | | | | | | | | | | | | | | | | | | | | | |
| | | Actual Return | | | Hypothetical (5% return before expenses) | | | | | | | | | | |
| | | Beginning
Account
Value
July 1,
2015 | | | Ending
Account
Value
December 31,
2015 | | | Expenses paid
during the period
July 1, 2015
through December 31,
2015 | | | Beginning
Account
Value
July 1,
2015 | | | Ending
Account
Value
December 31,
2015 | | | Expenses paid
during the period
July 1, 2015
through December 31,
2015 | | |
Annualized
expense
ratio | | | Days in
the
current
1/2 year | | | Days in
the full
year | |
Class IA | | $ | 1,000.00 | | | $ | 869.10 | | | $ | 3.39 | | | $ | 1,000.00 | | | $ | 1,021.58 | | | $ | 3.67 | | | | 0.72 | % | | | 184 | | | | 365 | |
Class IB | | $ | 1,000.00 | | | $ | 867.90 | | | $ | 4.57 | | | $ | 1,000.00 | | | $ | 1,020.32 | | | $ | 4.94 | | | | 0.97 | % | | | 184 | | | | 365 | |
Hartford Small/Mid Cap Equity HLS Fund
| | | | | | | | | | | | | | | | | | | | | | | | | | | | | | | | | | | | |
| | | Actual Return | | | Hypothetical (5% return before expenses) | | | | | | | | | | |
| | | Beginning
Account
Value
July 1,
2015 | | | Ending
Account
Value
December 31,
2015 | | | Expenses paid
during the period
July 1, 2015 through December 31,
2015 | | | Beginning
Account
Value
July 1, 2015 | | | Ending
Account
Value
December 31,
2015 | | | Expenses paid
during the period
July 1, 2015 through December 31,
2015 | | |
Annualized
expense
ratio | | | Days in
the
current
1/2 year | | | Days in
the full
year | |
Class IA | | $ | 1,000.00 | | | $ | 919.60 | | | $ | 4.40 | | | $ | 1,000.00 | | | $ | 1,020.62 | | | $ | 4.63 | | | | 0.91 | % | | | 184 | | | | 365 | |
Class IB | | $ | 1,000.00 | | | $ | 918.10 | | | $ | 5.61 | | | $ | 1,000.00 | | | $ | 1,019.36 | | | $ | 5.90 | | | | 1.16 | % | | | 184 | | | | 365 | |
Hartford SmallCap Growth HLS Fund
| | | | | | | | | | | | | | | | | | | | | | | | | | | | | | | | | | | | |
| | | Actual Return | | | Hypothetical (5% return before expenses) | | | | | | | | | | |
| | | Beginning
Account
Value
July 1, 2015 | | | Ending
Account
Value
December 31,
2015 | | | Expenses paid
during the period
July 1, 2015 through December 31,
2015 | | | Beginning
Account
Value
July 1, 2015 | | | Ending
Account
Value
December 31,
2015 | | | Expenses paid
during the period
July 1, 2015 through December 31,
2015 | | |
Annualized
expense
ratio | | | Days in
the
current
1/2 year | | | Days in
the full
year | |
Class IA | | $ | 1,000.00 | | | $ | 920.10 | | | $ | 3.15 | | | $ | 1,000.00 | | | $ | 1,021.93 | | | $ | 3.31 | | | | 0.65 | % | | | 184 | | | | 365 | |
Class IB | | $ | 1,000.00 | | | $ | 919.10 | | | $ | 4.35 | | | $ | 1,000.00 | | | $ | 1,020.67 | | | $ | 4.58 | | | | 0.90 | % | | | 184 | | | | 365 | |
Hartford Stock HLS Fund
| | | | | | | | | | | | | | | | | | | | | | | | | | | | | | | | | | | | |
| | | Actual Return | | | Hypothetical (5% return before expenses) | | | | | | | | | | |
| | | Beginning
Account
Value
July 1,
2015 | | | Ending
Account
Value
December 31,
2015 | | | Expenses paid
during the period
July 1, 2015 through December 31,
2015 | | | Beginning
Account
Value
July 1, 2015 | | | Ending
Account
Value
December 31,
2015 | | | Expenses paid
during the period
July 1, 2015 through December 31,
2015 | | |
Annualized
expense
ratio | | | Days in
the
current
1/2 year | | | Days in
the full
year | |
Class IA | | $ | 1,000.00 | | | $ | 1,035.40 | | | $ | 2.62 | | | $ | 1,000.00 | | | $ | 1,022.64 | | | $ | 2.60 | | | | 0.51 | % | | | 184 | | | | 365 | |
Class IB | | $ | 1,000.00 | | | $ | 1,034.30 | | | $ | 3.90 | | | $ | 1,000.00 | | | $ | 1,021.37 | | | $ | 3.87 | | | | 0.76 | % | | | 184 | | | | 365 | |
Expense Examples (Unaudited) – (continued)
Hartford Total Return Bond HLS Fund
| | | | | | | | | | | | | | | | | | | | | | | | | | | | | | | | | | | | |
| | | Actual Return | | | Hypothetical (5% return before expenses) | | | | | | | | | | |
| | | Beginning
Account
Value
July 1, 2015 | | | Ending
Account
Value
December 31,
2015 | | | Expenses paid
during the period
July 1, 2015 through December 31,
2015 | | | Beginning
Account
Value
July 1, 2015 | | | Ending
Account
Value
December
31, 2015 | | | Expenses paid
during the period
July 1, 2015 through December 31,
2015 | | |
Annualized
expense
ratio | | | Days in
the
current
1/2 year | | | Days in
the full
year | |
Class IA | | $ | 1,000.00 | | | $ | 996.70 | | | $ | 2.57 | | | $ | 1,000.00 | | | $ | 1,022.64 | | | $ | 2.60 | | | | 0.51 | % | | | 184 | | | | 365 | |
Class IB | | $ | 1,000.00 | | | $ | 995.30 | | | $ | 3.82 | | | $ | 1,000.00 | | | $ | 1,021.37 | | | $ | 3.87 | | | | 0.76 | % | | | 184 | | | | 365 | |
Hartford Ultrashort Bond HLS Fund
| | | | | | | | | | | | | | | | | | | | | | | | | | | | | | | | | | | | |
| | | Actual Return | | | Hypothetical (5% return before expenses) | | | | | | | | | | |
| | | Beginning
Account
Value
July 1, 2015 | | | Ending
Account
Value
December 31,
2015 | | | Expenses paid
during the period
July 1, 2015 through December 31,
2015 | | | Beginning
Account
Value
July 1, 2015 | | | Ending
Account
Value
December 31,
2015 | | | Expenses paid
during the period
July 1, 2015 through December 31,
2015 | | |
Annualized
expense
ratio | | | Days in
the
current
1/2 year | | | Days in
the full
year | |
Class IA | | $ | 1,000.00 | | | $ | 999.30 | | | $ | 2.22 | | | $ | 1,000.00 | | | $ | 1,022.99 | | | $ | 2.24 | | | | 0.44 | % | | | 184 | | | | 365 | |
Class IB | | $ | 1,000.00 | | | $ | 998.10 | | | $ | 3.48 | | | $ | 1,000.00 | | | $ | 1,021.73 | | | $ | 3.52 | | | | 0.69 | % | | | 184 | | | | 365 | |
Hartford U.S. Government Securities HLS Fund
| | | | | | | | | | | | | | | | | | | | | | | | | | | | | | | | | | | | |
| | | Actual Return | | | Hypothetical (5% return before expenses) | | | | | | | | | | |
| | | Beginning
Account
Value
July 1, 2015 | | | Ending
Account
Value
December 31,
2015 | | | Expenses paid
during the period
July 1, 2015 through December 31,
2015 | | | Beginning
Account
Value
July 1, 2015 | | | Ending
Account
Value
December 31,
2015 | | | Expenses paid
during the period
July 1, 2015 through December 31,
2015 | | |
Annualized
expense
ratio | | | Days in
the
current
1/2 year | | | Days in
the full
year | |
Class IA | | $ | 1,000.00 | | | $ | 1,005.00 | | | $ | 2.53 | | | $ | 1,000.00 | | | $ | 1,022.69 | | | $ | 2.55 | | | | 0.50 | % | | | 184 | | | | 365 | |
Class IB | | $ | 1,000.00 | | | $ | 1,003.80 | | | $ | 3.79 | | | $ | 1,000.00 | | | $ | 1,021.43 | | | $ | 3.82 | | | | 0.75 | % | | | 184 | | | | 365 | |
Hartford Value HLS Fund
| | | | | | | | | | | | | | | | | | | | | | | | | | | | | | | | | | | | |
| | | Actual Return | | | Hypothetical (5% return before expenses) | | | | | | | | | | |
| | | Beginning
Account
Value
July 1, 2015 | | | Ending
Account
Value
December 31,
2015 | | | Expenses paid
during the period
July 1, 2015 through December 31,
2015 | | | Beginning
Account
Value
July 1, 2015 | | | Ending
Account
Value
December 31,
2015 | | | Expenses paid
during the period
July 1, 2015 through December 31,
2015 | | |
Annualized
expense
ratio | | | Days in
the
current
1/2 year | | | Days in
the full
year | |
Class IA | | $ | 1,000.00 | | | $ | 959.50 | | | $ | 3.90 | | | $ | 1,000.00 | | | $ | 1,021.22 | | | $ | 4.02 | | | | 0.79 | % | | | 184 | | | | 365 | |
Class IB | | $ | 1,000.00 | | | $ | 958.50 | | | $ | 5.13 | | | $ | 1,000.00 | | | $ | 1,019.96 | | | $ | 5.30 | | | | 1.04 | % | | | 184 | | | | 365 | |
|
| Hartford Balanced HLS Fund |
Schedule of Investments
December 31, 2015
| | | | | | | | |
| Shares or Principal Amount | | Market Value† | |
| COMMON STOCKS - 63.4% | |
| | | | Automobiles & Components - 0.5% | |
| | 901,860 | | | Ford Motor Co. | | $ | 12,707,207 | |
| | | | | | | | |
| | | | Banks - 6.9% | |
| | 571,790 | | | Citigroup, Inc. | | | 29,590,132 | |
| | 774,570 | | | JP Morgan Chase & Co. | | | 51,144,857 | |
| | 113,520 | | | M&T Bank Corp. | | | 13,756,354 | |
| | 303,130 | | | PNC Financial Services Group, Inc. | | | 28,891,320 | |
| | 918,060 | | | Wells Fargo & Co. | | | 49,905,742 | |
| | | | | | | | |
| | | | | | | 173,288,405 | |
| | | | | | | | |
| | | | Capital Goods - 4.5% | |
| | 211,830 | | | 3M Co. | | | 31,910,071 | |
| | 435,660 | | | Eaton Corp. plc | | | 22,671,747 | |
| | 458,130 | | | Fortune Brands Home & Security, Inc. | | | 25,426,215 | |
| | 325,010 | | | Ingersoll-Rand plc | | | 17,969,803 | |
| | 158,820 | | | United Technologies Corp. | | | 15,257,837 | |
| | | | | | | | |
| | | | | | | 113,235,673 | |
| | | | | | | | |
| | | | Commercial & Professional Services - 0.7% | |
| | 354,650 | | | Nielsen Holdings plc | | | 16,526,690 | |
| | | | | | | | |
| | | | Consumer Durables & Apparel - 0.3% | |
| | 118,950 | | | PVH Corp. | | | 8,760,667 | |
| | | | | | | | |
| | | | Consumer Services - 1.2% | |
| | 91,360 | | | McDonald’s Corp. | | | 10,793,270 | |
| | 347,020 | | | Norwegian Cruise Line Holdings Ltd.* | | | 20,335,372 | |
| | | | | | | | |
| | | | | | | 31,128,642 | |
| | | | | | | | |
| | | | Diversified Financials - 2.9% | |
| | 125,470 | | | Ameriprise Financial, Inc. | | | 13,352,517 | |
| | 78,200 | | | BlackRock, Inc. | | | 26,628,664 | |
| | 88,090 | | | Goldman Sachs Group, Inc. | | | 15,876,461 | |
| | 517,000 | | | Invesco Ltd. | | | 17,309,160 | |
| | | | | | | | |
| | | | | | | 73,166,802 | |
| | | | | | | | |
| | | | Energy - 3.9% | |
| | 167,260 | | | Anadarko Petroleum Corp. | | | 8,125,491 | |
| | 202,960 | | | Chevron Corp. | | | 18,258,282 | |
| | 156,930 | | | EOG Resources, Inc. | | | 11,109,075 | |
| | 291,210 | | | Exxon Mobil Corp. | | | 22,699,819 | |
| | 366,770 | | | Halliburton Co. | | | 12,484,851 | |
| | 585,860 | | | Marathon Oil Corp. | | | 7,375,977 | |
| | 183,270 | | | Occidental Petroleum Corp. | | | 12,390,885 | |
| | 638,730 | | | Southwestern Energy Co.* | | | 4,541,370 | |
| | | | | | | | |
| | | | | | | 96,985,750 | |
| | | | | | | | |
| | | | Food & Staples Retailing - 1.2% | |
| | 303,380 | | | CVS Health Corp. | | | 29,661,463 | |
| | | | | | | | |
| | | | Food, Beverage & Tobacco - 3.5% | |
| | 110,430 | | | Anheuser-Busch InBev N.V. ADR | | | 13,803,750 | |
| | 323,913 | | | British American Tobacco plc | | | 17,988,181 | |
| | 410,550 | | | Coca-Cola Co. | | | 17,637,228 | |
| | 242,656 | | | Kraft Heinz Co. | | | 17,655,651 | |
| | 462,580 | | | Mondelez International, Inc. Class A | | | 20,742,087 | |
| | | | | | | | |
| | | | | | | 87,826,897 | |
| | | | | | | | |
| | | | Health Care Equipment & Services - 3.0% | |
| | 217,260 | | | Baxter International, Inc. | | | 8,288,469 | |
| | 495,895 | | | Medtronic plc | | | 38,144,244 | |
| | 241,160 | | | UnitedHealth Group, Inc. | | | 28,370,062 | |
| | | | | | | | |
| | | | | | | 74,802,775 | |
| | | | | | | | |
| | | | | | | | |
| Shares or Principal Amount | | Market Value† | |
| COMMON STOCKS - 63.4% - (continued) | |
| | | | Household & Personal Products - 0.6% | |
| | 173,510 | | | Estee Lauder Cos., Inc. Class A | | $ | 15,279,291 | |
| | | | | | | | |
| | | | Insurance - 2.5% | |
| | 368,830 | | | American International Group, Inc. | | | 22,856,395 | |
| | 557,340 | | | Marsh & McLennan Cos., Inc. | | | 30,904,503 | |
| | 238,180 | | | Unum Group | | | 7,929,012 | |
| | | | | | | | |
| | | | | | | 61,689,910 | |
| | | | | | | | |
| | | | Materials - 1.7% | |
| | 409,810 | | | Dow Chemical Co. | | | 21,097,019 | |
| | 336,490 | | | International Paper Co. | | | 12,685,673 | |
| | 209,200 | | | Nucor Corp. | | | 8,430,760 | |
| | | | | | | | |
| | | | | | | 42,213,452 | |
| | | | | | | | |
| | | | Media - 2.4% | |
| | 335,570 | | | CBS Corp. Class B | | | 15,815,414 | |
| | 313,190 | | | Comcast Corp. Class A | | | 17,673,312 | |
| | 385,470 | | | Thomson Reuters Corp. | | | 14,590,039 | |
| | 116,100 | | | Walt Disney Co. | | | 12,199,788 | |
| | | | | | | | |
| | | | | | | 60,278,553 | |
| | | | | | | | |
| | | | Pharmaceuticals, Biotechnology & Life Sciences - 9.6% | |
| | 64,240 | | | Allergan plc* | | | 20,075,000 | |
| | 149,330 | | | Amgen, Inc. | | | 24,240,739 | |
| | 541,360 | | | AstraZeneca plc ADR | | | 18,379,172 | |
| | 123,860 | | | Baxalta, Inc. | | | 4,834,256 | |
| | 525,480 | | | Bristol-Myers Squibb Co. | | | 36,147,769 | |
| | 181,800 | | | Eisai Co., Ltd. | | | 12,026,206 | |
| | 262,510 | | | Gilead Sciences, Inc. | | | 26,563,387 | |
| | 745,710 | | | Merck & Co., Inc. | | | 39,388,402 | |
| | 70,646 | | | Roche Holding AG | | | 19,576,599 | |
| | 268,359 | | | UCB S.A. | | | 24,222,900 | |
| | 133,800 | | | Vertex Pharmaceuticals, Inc.* | | | 16,836,054 | |
| | | | | | | | |
| | | | | | | 242,290,484 | |
| | | | | | | | |
| | | | Retailing - 3.0% | |
| | 11,702,200 | | | Allstar Co.*(1)(2) | | | 11,117,090 | |
| | 201,620 | | | Dollar General Corp. | | | 14,490,429 | |
| | 248,790 | | | Home Depot, Inc. | | | 32,902,478 | |
| | 212,740 | | | Nordstrom, Inc. | | | 10,596,579 | |
| | 163,241 | | | Tory Burch LLC*(1)(2) | | | 8,638,690 | |
| | | | | | | | |
| | | | | | | 77,745,266 | |
| | | | | | | | |
| | | | Semiconductors & Semiconductor Equipment - 3.2% | |
| | 287,830 | | | Analog Devices, Inc. | | | 15,922,756 | |
| | 945,530 | | | Intel Corp. | | | 32,573,508 | |
| | 816,800 | | | Maxim Integrated Products, Inc. | | | 31,038,400 | |
| | | | | | | | |
| | | | | | | 79,534,664 | |
| | | | | | | | |
| | | | Software & Services - 6.9% | |
| | 264,770 | | | Accenture plc Class A | | | 27,668,465 | |
| | 58,645 | | | Alphabet, Inc. Class C* | | | 44,504,517 | |
| | 257,100 | | | Genpact Ltd.* | | | 6,422,358 | |
| | 1,020,850 | | | Microsoft Corp. | | | 56,636,758 | |
| | 467,000 | | | Oracle Corp. | | | 17,059,510 | |
| | 978,820 | | | Symantec Corp. | | | 20,555,220 | |
| | | | | | | | |
| | | | | | | 172,846,828 | |
| | | | | | | | |
| | | | Technology Hardware & Equipment - 2.9% | |
| | 206,760 | | | Apple, Inc. | | | 21,763,558 | |
| | 1,922,930 | | | Cisco Systems, Inc. | | | 52,217,164 | |
| | | | | | | | |
| | | | | | | 73,980,722 | |
| | | | | | | | |
The accompanying notes are an integral part of these financial statements.
|
| Hartford Balanced HLS Fund |
Schedule of Investments – (continued)
December 31, 2015
| | | | | | | | |
| Shares or Principal Amount | | Market Value† | |
| COMMON STOCKS - 63.4% - (continued) | |
| | | | Telecommunication Services - 0.3% | |
| | 188,290 | | | Verizon Communications, Inc. | | $ | 8,702,764 | |
| | | | | | | | |
| | | | Transportation - 0.5% | |
| | 151,240 | | | Union Pacific Corp. | | | 11,826,968 | |
| | | | | | | | |
| | | | Utilities - 1.2% | |
| | 294,040 | | | NextEra Energy, Inc. | | | 30,547,816 | |
| | | | | | | | |
| | | | Total Common Stocks
(cost $1,185,586,271) | | $ | 1,595,027,689 | |
| | | | | | | | |
|
| ASSET & COMMERCIAL MORTGAGE BACKED SECURITIES - 1.7% | |
| | | | Asset-Backed - Automobile - 0.6% | |
| $ | 225,000 | | | CarMax Auto Owner Trust
1.95%, 09/16/2019 | | $ | 223,517 | |
| | 1,245,000 | | | Drive Auto Receivables Trust
2.12%, 06/17/2019(3) | | | 1,242,232 | |
| | 1,278,490 | | | Exeter Automobile Receivables Trust
1.54%, 11/15/2019(3) | | | 1,272,815 | |
| | 1,625,000 | | | First Investors Automotive Owner Trust
1.67%, 11/16/2020(3) | | | 1,614,898 | |
| | 515,000 | | | Hyundai Automotive Receivables Trust
2.48%, 03/15/2019 | | | 521,671 | |
| | 600,000 | | | Prestige Automotive Receivables Trust
1.91%, 04/15/2020(3) | | | 593,875 | |
| | | | Santander Drive Automotive Receivables Trust | |
| | 1,630,000 | | | 1.97%, 11/15/2019 | | | 1,632,391 | |
| | 675,000 | | | 2.25%, 06/17/2019 | | | 677,409 | |
| | 400,000 | | | 2.33%, 11/15/2019 | | | 400,600 | |
| | 2,420,000 | | | 2.36%, 04/15/2020 | | | 2,423,781 | |
| | 655,000 | | | 2.57%, 03/15/2019 | | | 659,199 | |
| | | | Westlake Automobile Receivables Trust | |
| | 722,936 | | | 0.97%, 10/16/2017(3) | | | 722,045 | |
| | 1,355,000 | | | 1.83%, 01/15/2021(3) | | | 1,342,482 | |
| | | | | | | | |
| | | | | | | 13,326,915 | |
| | | | | | | | |
| | | | Asset-Backed - Finance & Insurance - 0.6% | |
| | | | Ally Master Owner Trust | |
| | 4,885,000 | | | 1.54%, 09/15/2019 | | | 4,855,783 | |
| | 4,890,000 | | | 1.60%, 10/15/2019 | | | 4,864,728 | |
| | 430,000 | | | Ford Credit Floorplan Master Owner Trust
2.09%, 03/15/2022(3) | | | 429,043 | |
| | 1,260,000 | | | Green Tree Agency Advance Funding Trust
2.30%, 10/15/2046(3) | | | 1,257,785 | |
| | 1,565,000 | | | SBA Tower Trust
2.90%, 10/15/2044(3) | | | 1,529,332 | |
| | | | Springleaf Funding Trust | |
| | 1,765,000 | | | 3.16%, 11/15/2024(3) | | | 1,752,405 | |
| | 755,000 | | | 3.48%, 05/15/2028(3) | | | 740,287 | |
| | | | | | | | |
| | | | | | | 15,429,363 | |
| | | | | | | | |
| | | | Asset-Backed - Home Equity - 0.0% | |
| | 7,906 | | | New Century Home Equity Loan Trust
1.00%, 03/25/2035(4) | | | 7,893 | |
| | | | | | | | |
| | | | Commercial Mortgage-Backed Securities - 0.5% | |
| | 1,765,000 | | | Hilton USA Trust
2.66%, 11/05/2030 | | | 1,766,322 | |
| | 2,287,288 | | | JP Morgan Chase Commercial Mortgage Securities Trust
5.70%, 02/12/2049(4) | | | 2,359,166 | |
| | 922,934 | | | LB-UBS Commercial Mortgage Trust
6.09%, 04/15/2041(4) | | | 972,058 | |
| | | | | | | | |
| Shares or Principal Amount | | Market Value† | |
| ASSET & COMMERCIAL MORTGAGE BACKED SECURITIES - 1.7% - (continued) | |
| | | | Commercial Mortgage-Backed Securities - 0.5% - (continued) | |
| $ | 3,412,966 | | | Merrill Lynch/Countrywide Commercial Mortgage Trust
5.74%, 06/12/2050(4) | | $ | 3,541,794 | |
| | 2,500,000 | | | SFAVE Commercial Mortgage Securities Trust
4.14%, 01/05/2035(3)(4) | | | 2,365,131 | |
| | 2,282,288 | | | Wachovia Bank Commercial Mortgage Trust
5.31%, 11/15/2048 | | | 2,313,463 | |
| | | | | | | | |
| | | | | | | 13,317,934 | |
| | | | | | | | |
| | | | Total Asset & Commercial Mortgage Backed Securities
(cost $42,781,541) | | $ | 42,082,105 | |
| | | | | | | | |
|
| CORPORATE BONDS - 17.0% | |
| | | | Aerospace/Defense - 0.2% | |
| $ | 850,000 | | | BAE Systems Holdings, Inc.
3.85%, 12/15/2025(3) | | $ | 841,475 | |
| | | | Lockheed Martin Corp. | |
| | 470,000 | | | 2.50%, 11/23/2020 | | | 467,212 | |
| | 1,625,000 | | | 4.07%, 12/15/2042 | | | 1,503,809 | |
| | 256,000 | | | 4.50%, 05/15/2036 | | | 259,173 | |
| | 640,000 | | | 4.70%, 05/15/2046 | | | 655,598 | |
| | 560,000 | | | 4.85%, 09/15/2041 | | | 576,592 | |
| | | | | | | | |
| | | | | | | 4,303,859 | |
| | | | | | | | |
| | | | Agriculture - 0.3% | |
| | | | Altria Group, Inc. | |
| | 880,000 | | | 4.50%, 05/02/2043 | | | 835,338 | |
| | 1,995,000 | | | 4.75%, 05/05/2021 | | | 2,164,617 | |
| | | | BAT International Finance plc | |
| | 685,000 | | | 2.75%, 06/15/2020(3) | | | 684,801 | |
| | 2,775,000 | | | 3.25%, 06/07/2022(3) | | | 2,779,537 | |
| | 290,000 | | | 3.50%, 06/15/2022(3) | | | 297,274 | |
| | 1,065,000 | | | Imperial Tobacco Finance plc
3.75%, 07/21/2022(3) | | | 1,069,263 | |
| | 270,000 | | | Philip Morris International, Inc.
5.65%, 05/16/2018 | | | 294,577 | |
| | | | | | | | |
| | | | | | | 8,125,407 | |
| | | | | | | | |
| | | | Airlines - 0.4% | |
| | 3,272,183 | | | Continental Airlines, Inc.
5.98%, 10/19/2023 | | | 3,613,471 | |
| | | | Southwest Airlines Co. | |
| | 2,700,000 | | | 5.75%, 12/15/2016 | | | 2,806,245 | |
| | 2,453,283 | | | 6.15%, 02/01/2024 | | | 2,747,677 | |
| | | | | | | | |
| | | | | | | 9,167,393 | |
| | | | | | | | |
| | | | Auto Manufacturers - 0.5% | |
| | 5,600,000 | | | Daimler Finance NA LLC
2.63%, 09/15/2016(3) | | | 5,648,440 | |
| | 150,000 | | | Daimler Finance North America LLC
2.25%, 07/31/2019(3) | | | 148,032 | |
| | | | Ford Motor Credit Co. LLC | |
| | 2,985,000 | | | 2.38%, 03/12/2019 | | | 2,942,628 | |
| | 1,955,000 | | | 3.16%, 08/04/2020 | | | 1,948,149 | |
| | 580,000 | | | Volkswagen Group of America Finance LLC
2.45%, 11/20/2019(3) | | | 555,942 | |
| | | | | | | | |
| | | | | | | 11,243,191 | |
| | | | | | | | |
| | | | Beverages - 0.3% | |
| | | | Anheuser-Busch InBev Worldwide, Inc. | |
| | 480,000 | | | 3.75%, 07/15/2042 | | | 412,420 | |
| | 3,205,000 | | | 7.75%, 01/15/2019 | | | 3,704,772 | |
The accompanying notes are an integral part of these financial statements.
|
| Hartford Balanced HLS Fund |
Schedule of Investments – (continued)
December 31, 2015
| | | | | | | | |
| Shares or Principal Amount | | Market Value† | |
| CORPORATE BONDS - 17.0% - (continued) | |
| | | | Beverages - 0.3% - (continued) | |
| | | | Coca-Cola Femsa S.A.B. de C.V. | |
| $ | 1,176,000 | | | 2.38%, 11/26/2018 | | $ | 1,174,291 | |
| | 1,300,000 | | | 3.88%, 11/26/2023 | | | 1,304,460 | |
| | | | Heineken N.V. | |
| | 790,000 | | | 2.75%, 04/01/2023(3) | | | 764,341 | |
| | 50,000 | | | 4.00%, 10/01/2042(3) | | | 44,505 | |
| | | | Molson Coors Brewing Co. | |
| | 765,000 | | | 3.50%, 05/01/2022 | | | 769,206 | |
| | 295,000 | | | 5.00%, 05/01/2042 | | | 284,086 | |
| | | | | | | | |
| | | | | | | 8,458,081 | |
| | | | | | | | |
| | | | Biotechnology - 0.2% | |
| | 1,340,000 | | | Biogen, Inc.
2.90%, 09/15/2020 | | | 1,336,477 | |
| | | | Celgene Corp. | |
| | 230,000 | | | 2.25%, 05/15/2019 | | | 227,979 | |
| | 770,000 | | | 3.55%, 08/15/2022 | | | 777,485 | |
| | 535,000 | | | 3.63%, 05/15/2024 | | | 526,173 | |
| | | | Gilead Sciences, Inc. | |
| | 335,000 | | | 2.55%, 09/01/2020 | | | 334,873 | |
| | 935,000 | | | 3.50%, 02/01/2025 | | | 942,798 | |
| | 930,000 | | | 3.70%, 04/01/2024 | | | 952,617 | |
| | 405,000 | | | 4.50%, 02/01/2045 | | | 396,156 | |
| | | | | | | | |
| | | | | | | 5,494,558 | |
| | | | | | | | |
| | | | Chemicals - 0.0% | |
| | 1,145,000 | | | LyondellBasell Industries N.V.
4.63%, 02/26/2055 | | | 928,572 | |
| | 300,000 | | | Monsanto Co.
4.70%, 07/15/2064 | | | 227,795 | |
| | | | | | | | |
| | | | | | | 1,156,367 | |
| | | | | | | | |
| | | | Commercial Banks - 4.4% | |
| | 6,350,000 | | | American Express Centurion Bank
6.00%, 09/13/2017 | | | 6,801,745 | |
| | | | Bank of America Corp. | |
| | 1,220,000 | | | 2.63%, 10/19/2020 | | | 1,204,654 | |
| | 3,400,000 | | | 4.20%, 08/26/2024 | | | 3,373,405 | |
| | 1,655,000 | | | 5.00%, 05/13/2021 | | | 1,808,170 | |
| | 1,000,000 | | | 6.40%, 08/28/2017 | | | 1,071,198 | |
| | 6,000,000 | | | 6.88%, 04/25/2018 | | | 6,619,542 | |
| | | | Bank of New York Mellon Corp. | |
| | 2,020,000 | | | 2.15%, 02/24/2020 | | | 1,998,075 | |
| | 925,000 | | | 3.00%, 02/24/2025 | | | 909,640 | |
| | 2,830,000 | | | Banque Federative du Credit Mutuel S.A.
2.75%, 10/15/2020(3) | | | 2,841,246 | |
| | | | Barclays Bank plc | |
| | 1,100,000 | | | 2.50%, 02/20/2019 | | | 1,102,490 | |
| | 1,300,000 | | | 3.75%, 05/15/2024 | | | 1,325,055 | |
| | 800,000 | | | 6.05%, 12/04/2017(3) | | | 853,333 | |
| | 2,075,000 | | | BNP Paribas S.A.
2.40%, 12/12/2018 | | | 2,091,316 | |
| | | | BPCE S.A. | |
| | 365,000 | | | 2.50%, 12/10/2018 | | | 368,093 | |
| | 1,000,000 | | | 2.50%, 07/15/2019 | | | 1,003,353 | |
| | 1,075,000 | | | 4.00%, 04/15/2024 | | | 1,104,458 | |
| | 1,475,000 | | | 5.15%, 07/21/2024(3) | | | 1,487,396 | |
| | | | Capital One Financial Corp. | |
| | 2,875,000 | | | 3.75%, 04/24/2024 | | | 2,893,610 | |
| | 815,000 | | | 4.20%, 10/29/2025 | | | 804,691 | |
| | | | Citigroup, Inc. | |
| | 1,220,000 | | | 2.50%, 07/29/2019 | | | 1,218,162 | |
| | 1,000,000 | | | 4.95%, 11/07/2043 | | | 1,050,772 | |
| | | | | | | | |
| Shares or Principal Amount | | Market Value† | |
| CORPORATE BONDS - 17.0% - (continued) | |
| | | | Commercial Banks - 4.4% - (continued) | |
| $ | 690,000 | | | 5.30%, 05/06/2044 | | $ | 717,721 | |
| | 290,000 | | | 8.13%, 07/15/2039 | | | 415,940 | |
| | 505,000 | | | Compass Bank
2.75%, 09/29/2019 | | | 499,948 | |
| | | | Credit Agricole S.A. | |
| | 1,950,000 | | | 2.50%, 04/15/2019(3) | | | 1,960,162 | |
| | 790,000 | | | 4.38%, 03/17/2025(3) | | | 764,278 | |
| | | | Credit Suisse AG | |
| | 945,000 | | | 2.30%, 05/28/2019 | | | 945,813 | |
| | 855,000 | | | 3.00%, 10/29/2021 | | | 851,598 | |
| | 250,000 | | | 3.63%, 09/09/2024 | | | 251,966 | |
| | | | Credit Suisse Group Funding Guernsey Ltd. | |
| | 1,425,000 | | | 3.75%, 03/26/2025(3) | | | 1,378,380 | |
| | 1,885,000 | | | 3.80%, 09/15/2022(3) | | | 1,883,513 | |
| | | | Goldman Sachs Group, Inc. | |
| | 3,335,000 | | | 2.38%, 01/22/2018 | | | 3,363,814 | |
| | 2,975,000 | | | 5.63%, 01/15/2017 | | | 3,090,058 | |
| | 1,700,000 | | | 6.15%, 04/01/2018 | | | 1,846,057 | |
| | 2,590,000 | | | 6.25%, 02/01/2041 | | | 3,089,357 | |
| | 2,160,000 | | | HSBC Holdings plc
6.10%, 01/14/2042 | | | 2,734,243 | |
| | | | Huntington National Bank | |
| | 2,120,000 | | | 2.20%, 11/06/2018 | | | 2,114,140 | |
| | 760,000 | | | 2.20%, 04/01/2019 | | | 754,368 | |
| | 1,490,000 | | | 2.40%, 04/01/2020 | | | 1,470,593 | |
| | 5,200,000 | | | ING Bank N.V.
3.75%, 03/07/2017(3) | | | 5,327,369 | |
| | | | JP Morgan Chase & Co. | |
| | 2,240,000 | | | 3.25%, 09/23/2022 | | | 2,252,929 | |
| | 2,000,000 | | | 4.95%, 03/25/2020 | | | 2,168,652 | |
| | 1,080,000 | | | 5.40%, 01/06/2042 | | | 1,214,422 | |
| | 2,600,000 | | | Korea Development Bank
2.50%, 03/11/2020 | | | 2,610,306 | |
| | 470,000 | | | Macquarie Bank Ltd.
2.40%, 01/21/2020(3) | | | 465,607 | |
| | | | Morgan Stanley | |
| | 4,875,000 | | | 2.50%, 01/24/2019 | | | 4,901,613 | |
| | 1,000,000 | | | 3.70%, 10/23/2024 | | | 1,004,809 | |
| | 515,000 | | | 4.30%, 01/27/2045 | | | 491,366 | |
| | 250,000 | | | 5.63%, 09/23/2019 | | | 275,900 | |
| | 4,250,000 | | | National City Corp.
6.88%, 05/15/2019 | | | 4,801,314 | |
| | 4,795,000 | | | Santander Bank NA
8.75%, 05/30/2018 | | | 5,411,853 | |
| | 1,800,000 | | | Santander Issuances SAU
5.18%, 11/19/2025 | | | 1,772,726 | |
| | 780,000 | | | U.S. Bancorp
3.70%, 01/30/2024 | | | 816,789 | |
| | 1,665,000 | | | UBS Group Funding Jersey Ltd.
2.95%, 09/24/2020(3) | | | 1,649,457 | |
| | 1,000,000 | | | Wachovia Corp.
5.75%, 06/15/2017 | | | 1,058,605 | |
| | 4,344,000 | | | Wells Fargo & Co.
4.48%, 01/16/2024 | | | 4,568,867 | |
| | | | | | | | |
| | | | | | | 110,854,937 | |
| | | | | | | | |
| | | | Commercial Services - 0.2% | |
| | 765,000 | | | Catholic Health Initiatives
2.60%, 08/01/2018 | | | 768,151 | |
| | | | ERAC USA Finance LLC | |
| | 655,000 | | | 2.35%, 10/15/2019(3) | | | 645,647 | |
The accompanying notes are an integral part of these financial statements.
|
| Hartford Balanced HLS Fund |
Schedule of Investments – (continued)
December 31, 2015
| | | | | | | | |
| Shares or Principal Amount | | Market Value† | |
| CORPORATE BONDS - 17.0% - (continued) | |
| | | | Commercial Services - 0.2% - (continued) | |
| $ | 340,000 | | | 2.75%, 03/15/2017(3) | | $ | 344,137 | |
| | 1,800,000 | | | 4.50%, 08/16/2021(3) | | | 1,904,558 | |
| | 1,500,000 | | | 5.63%, 03/15/2042(3) | | | 1,609,865 | |
| | | | | | | | |
| | | | | | | 5,272,358 | |
| | | | | | | | |
| | | | Country Funds-Closed-end - 0.1% | |
| | 2,475,000 | | | CDP Financial, Inc.
4.40%, 11/25/2019(3) | | | 2,674,584 | |
| | | | | | | | |
| | | | Diversified Financial Services - 1.3% | |
| | 1,655,000 | | | Capital One Bank USA NA
2.15%, 11/21/2018 | | | 1,640,739 | |
| | 3,620,000 | | | Discover Financial Services
6.45%, 06/12/2017 | | | 3,824,631 | |
| | 614,000 | | | Eaton Vance Corp.
6.50%, 10/02/2017 | | | 655,633 | |
| | | | GE Capital International Funding Co. | |
| | 3,489,000 | | | 2.34%, 11/15/2020(3) | | | 3,459,902 | |
| | 4,597,000 | | | 4.42%, 11/15/2035(3) | | | 4,691,156 | |
| | 1,910,000 | | | LeasePlan Corp. N.V.
2.88%, 01/22/2019(3) | | | 1,885,409 | |
| | 10,178,393 | | | Postal Square L.P.
8.95%, 06/15/2022 | | | 12,343,021 | |
| | | | Synchrony Financial | |
| | 2,045,000 | | | 2.60%, 01/15/2019 | | | 2,037,652 | |
| | 520,000 | | | 2.70%, 02/03/2020 | | | 510,029 | |
| | 355,000 | | | 3.00%, 08/15/2019 | | | 354,507 | |
| | | | | | | | |
| | | | | | | 31,402,679 | |
| | | | | | | | |
| | | | Electric - 1.1% | |
| | 1,700,000 | | | Berkshire Hathaway Energy Co.
4.50%, 02/01/2045 | | | 1,633,346 | |
| | 2,605,000 | | | Consolidated Edison Co. of New York, Inc.
5.30%, 12/01/2016 | | | 2,701,948 | |
| | 2,850,000 | | | Dominion Resources, Inc.
3.63%, 12/01/2024 | | | 2,822,637 | |
| | 1,200,000 | | | Duke Energy Carolinas LLC
6.10%, 06/01/2037 | | | 1,451,064 | |
| | 2,375,000 | | | Electricite de France S.A.
5.63%, 01/22/2024(3)(4)(5) | | | 2,258,625 | |
| | 285,000 | | | Eversource Energy
3.15%, 01/15/2025 | | | 278,178 | |
| | 1,275,000 | | | Indianapolis Power and Light
6.60%, 06/01/2037(3) | | | 1,608,347 | |
| | 4,750,000 | | | NextEra Energy Capital Holdings, Inc.
2.06%, 09/01/2017 | | | 4,754,427 | |
| | 340,000 | | | NiSource Finance Corp.
4.80%, 02/15/2044 | | | 345,571 | |
| | | | Pacific Gas & Electric Co. | |
| | 695,000 | | | 3.85%, 11/15/2023 | | | 722,101 | |
| | 435,000 | | | 5.13%, 11/15/2043 | | | 475,870 | |
| | 4,000,000 | | | Southern California Edison Co.
5.55%, 01/15/2037 | | | 4,646,352 | |
| | 1,450,000 | | | Southern Co.
2.75%, 06/15/2020 | | | 1,435,262 | |
| | 1,795,000 | | | State Grid Overseas Investment
2.75%, 05/07/2019(3) | | | 1,813,410 | |
| | | | | | | | |
| | | | | | | 26,947,138 | |
| | | | | | | | |
| | | | Food - 0.4% | |
| | 630,000 | | | Grupo Bimbo S.A.B. de C.V.
3.88%, 06/27/2024(3) | | | 612,290 | |
| | | | | | | | |
| Shares or Principal Amount | | Market Value† | |
| CORPORATE BONDS - 17.0% - (continued) | |
| | | | Food - 0.4% - (continued) | |
| $ | 555,000 | | | Kraft Foods Group, Inc.
2.25%, 06/05/2017 | | $ | 559,010 | |
| | 2,030,000 | | | Kraft Heinz Foods Co.
3.50%, 07/15/2022(3) | | | 2,043,997 | |
| | | | Kroger Co. | |
| | 620,000 | | | 3.30%, 01/15/2021 | | | 629,425 | |
| | 1,065,000 | | | 4.00%, 02/01/2024 | | | 1,103,767 | |
| | | | Mondelez International, Inc. | |
| | 225,000 | | | 4.00%, 02/01/2024 | | | 231,929 | |
| | 3,800,000 | | | 4.13%, 02/09/2016 | | | 3,809,800 | |
| | | | | | | | |
| | | | | | | 8,990,218 | |
| | | | | | | | |
| | | | Gas - 0.3% | |
| | 5,875,000 | | | Atmos Energy Corp.
6.35%, 06/15/2017 | | | 6,258,896 | |
| | | | | | | | |
| | | | Healthcare-Products - 0.1% | |
| | | | Medtronic, Inc. | |
| | 545,000 | | | 2.50%, 03/15/2020 | | | 548,867 | |
| | 775,000 | | | 3.15%, 03/15/2022 | | | 783,461 | |
| | 1,230,000 | | | 3.50%, 03/15/2025 | | | 1,240,049 | |
| | 310,000 | | | 3.63%, 03/15/2024 | | | 317,525 | |
| | 205,000 | | | 4.38%, 03/15/2035 | | | 207,222 | |
| | | | | | | | |
| | | | | | | 3,097,124 | |
| | | | | | | | |
| | | | Healthcare-Services - 0.4% | |
| | 421,000 | | | Anthem, Inc.
3.30%, 01/15/2023 | | | 409,136 | |
| | 2,125,000 | | | Cigna Corp.
3.25%, 04/15/2025 | | | 2,085,188 | |
| | | | Dignity Health | |
| | 180,000 | | | 2.64%, 11/01/2019 | | | 180,719 | |
| | 380,000 | | | 3.81%, 11/01/2024 | | | 386,158 | |
| | | | Kaiser Foundation Hospitals | |
| | 521,000 | | | 3.50%, 04/01/2022 | | | 529,368 | |
| | 660,000 | | | 4.88%, 04/01/2042 | | | 671,368 | |
| | 530,000 | | | Memorial Sloan-Kettering Cancer Center
4.20%, 07/01/2055 | | | 510,227 | |
| | 950,000 | | | NewYork-Presbyterian Hospital
4.02%, 08/01/2045 | | | 897,472 | |
| | 1,120,000 | | | Toledo Hospital
4.98%, 11/15/2045 | | | 1,177,247 | |
| | | | UnitedHealth Group, Inc. | |
| | 920,000 | | | 3.35%, 07/15/2022 | | | 941,015 | |
| | 1,440,000 | | | 3.75%, 07/15/2025 | | | 1,484,461 | |
| | | | | | | | |
| | | | | | | 9,272,359 | |
| | | | | | | | |
| | | | Holding Companies-Diversified - 0.0% | |
| | 1,000,000 | | | Hutchison Whampoa International Ltd.
3.63%, 10/31/2024(3) | | | 992,182 | |
| | | | | | | | |
| | | | Household Products - 0.3% | |
| | 6,863,360 | | | Procter & Gamble Co.
9.36%, 01/01/2021 | | | 8,191,777 | |
| | | | | | | | |
| | | | Insurance - 0.4% | |
| | | | Ace INA Holdings, Inc. | |
| | 495,000 | | | 2.30%, 11/03/2020 | | | 491,441 | |
| | 840,000 | | | 3.35%, 05/15/2024 | | | 847,946 | |
| | 1,315,000 | | | 4.35%, 11/03/2045 | | | 1,336,214 | |
| | 1,045,000 | | | American International Group, Inc.
3.88%, 01/15/2035 | | | 921,723 | |
| | 200,000 | | | Five Corners Funding Trust
4.42%, 11/15/2023(3) | | | 208,797 | |
The accompanying notes are an integral part of these financial statements.
|
| Hartford Balanced HLS Fund |
Schedule of Investments – (continued)
December 31, 2015
| | | | | | | | |
| Shares or Principal Amount | | Market Value† | |
| CORPORATE BONDS - 17.0% - (continued) | |
| | | | Insurance - 0.4% - (continued) | |
| $ | 550,000 | | | Liberty Mutual Group, Inc.
4.25%, 06/15/2023(3) | | $ | 558,837 | |
| | | | MetLife, Inc. | |
| | 305,000 | | | 1.90%, 12/15/2017 | | | 306,794 | |
| | 2,205,000 | | | 3.60%, 04/10/2024 | | | 2,262,330 | |
| | 795,000 | | | 4.88%, 11/13/2043 | | | 834,039 | |
| | 1,500,000 | | | Prudential Financial, Inc.
3.50%, 05/15/2024 | | | 1,506,231 | |
| | 505,000 | | | Teachers Insurance & Annuity Association of America
4.90%, 09/15/2044(3) | | | 510,093 | |
| | | | | | | | |
| | | | | | | 9,784,445 | |
| | | | | | | | |
| | | | Internet - 0.1% | |
| | 200,000 | | | Alibaba Group Holding Ltd.
2.50%, 11/28/2019 | | | 195,392 | |
| | | | Amazon.com, Inc. | |
| | 1,250,000 | | | 2.50%, 11/29/2022 | | | 1,209,330 | |
| | 1,020,000 | | | 4.80%, 12/05/2034 | | | 1,073,932 | |
| | 570,000 | | | 4.95%, 12/05/2044 | | | 607,014 | |
| | | | | | | | |
| | | | | | | 3,085,668 | |
| | | | | | | | |
| | | | IT Services - 0.1% | |
| | 1,360,000 | | | Apple, Inc.
3.45%, 05/06/2024 | | | 1,408,884 | |
| | 1,851,000 | | | EMC Corp.
1.88%, 06/01/2018 | | | 1,727,127 | |
| | | | | | | | |
| | | | | | | 3,136,011 | |
| | | | | | | | |
| | | | Lodging - 0.1% | |
| | 1,900,000 | | | Marriott International, Inc.
2.88%, 03/01/2021 | | | 1,885,070 | |
| | | | | | | | |
| | | | Machinery-Construction & Mining - 0.1% | |
| | 1,500,000 | | | Caterpillar Financial Services Corp.
3.30%, 06/09/2024 | | | 1,489,749 | |
| | | | Caterpillar, Inc. | |
| | 835,000 | | | 3.40%, 05/15/2024 | | | 845,865 | |
| | 135,000 | | | 4.30%, 05/15/2044 | | | 130,371 | |
| | | | | | | | |
| | | | | | | 2,465,985 | |
| | | | | | | | |
| | | | Media - 0.8% | |
| | | | 21st Century Fox America, Inc. | |
| | 385,000 | | | 4.00%, 10/01/2023 | | | 397,671 | |
| | 1,275,000 | | | 4.50%, 02/15/2021 | | | 1,371,941 | |
| | 645,000 | | | CCO Safari II LLC
6.48%, 10/23/2045(3) | | | 646,057 | |
| | 2,450,000 | | | Comcast Corp.
4.40%, 08/15/2035 | | | 2,464,597 | |
| | 2,320,000 | | | Cox Communications, Inc.
4.80%, 02/01/2035(3) | | | 1,919,243 | |
| | | | DirecTV Holdings LLC | |
| | 355,000 | | | 3.95%, 01/15/2025 | | | 349,963 | |
| | 2,185,000 | | | 4.45%, 04/01/2024 | | | 2,244,196 | |
| | | | Grupo Televisa S.A.B. | |
| | 420,000 | | | 5.00%, 05/13/2045 | | | 361,118 | |
| | 700,000 | | | 6.13%, 01/31/2046 | | | 695,870 | |
| | | | Sky plc | |
| | 1,265,000 | | | 2.63%, 09/16/2019(3) | | | 1,259,156 | |
| | 2,386,000 | | | 3.75%, 09/16/2024(3) | | | 2,330,347 | |
| | | | Time Warner Cable, Inc. | |
| | 4,120,000 | | | 5.85%, 05/01/2017 | | | 4,310,035 | |
| | 395,000 | | | 6.55%, 05/01/2037 | | | 399,734 | |
| | 250,000 | | | 7.30%, 07/01/2038 | | | 271,039 | |
| | | | | | | | |
| Shares or Principal Amount | | Market Value† | |
| CORPORATE BONDS - 17.0% - (continued) | |
| | | | Media - 0.8% - (continued) | |
| $ | 480,000 | | | 8.25%, 04/01/2019 | | $ | 551,184 | |
| | 40,000 | | | 8.75%, 02/14/2019 | | | 46,402 | |
| | 130,000 | | | Time Warner Entertainment Co., L.P.
8.38%, 03/15/2023 | | | 159,652 | |
| | 835,000 | | | Viacom, Inc.
3.88%, 12/15/2021 | | | 820,896 | |
| | | | | | | | |
| | | | | | | 20,599,101 | |
| | | | | | | | |
| | | | Mining - 0.2% | |
| | 2,465,000 | | | BHP Billiton Finance USA Ltd.
3.85%, 09/30/2023 | | | 2,333,904 | |
| | 1,905,000 | | | Rio Tinto Finance USA Ltd.
3.75%, 09/20/2021 | | | 1,851,723 | |
| | | | | | | | |
| | | | | | | 4,185,627 | |
| | | | | | | | |
| | | | Miscellaneous Manufacturing - 0.1% | |
| | 450,000 | | | Parker-Hannifin Corp.
4.45%, 11/21/2044 | | | 467,683 | |
| | 2,375,000 | | | Pentair Finance S.A.
2.90%, 09/15/2018 | | | 2,364,370 | |
| | | | | | | | |
| | | | | | | 2,832,053 | |
| | | | | | | | |
| | | | Oil & Gas - 1.1% | |
| | 2,450,000 | | | BG Energy Capital plc
4.00%, 10/15/2021(3) | | | 2,542,627 | |
| | | | BP Capital Markets plc | |
| | 655,000 | | | 2.32%, 02/13/2020 | | | 645,345 | |
| | 1,640,000 | | | 3.51%, 03/17/2025 | | | 1,588,174 | |
| | 140,000 | | | 3.99%, 09/26/2023 | | | 143,172 | |
| | 2,850,000 | | | 4.75%, 03/10/2019 | | | 3,047,551 | |
| | | | ConocoPhillips Co. | |
| | 200,000 | | | 2.88%, 11/15/2021 | | | 194,215 | |
| | 270,000 | | | 3.35%, 05/15/2025 | | | 243,994 | |
| | 395,000 | | | 4.30%, 11/15/2044 | | | 328,254 | |
| | | | Devon Energy Corp. | |
| | 370,000 | | | 3.25%, 05/15/2022 | | | 314,514 | |
| | 705,000 | | | 5.00%, 06/15/2045 | | | 534,322 | |
| | 1,535,000 | | | 5.85%, 12/15/2025 | | | 1,492,855 | |
| | 2,785,000 | | | EnCana Corp.
6.50%, 05/15/2019 | | | 2,715,308 | |
| | 360,000 | | | Phillips 66
4.88%, 11/15/2044 | | | 321,179 | |
| | | | Pioneer Natural Resources Co. | |
| | 1,315,000 | | | 4.45%, 01/15/2026 | | | 1,184,044 | |
| | 3,540,000 | | | 7.50%, 01/15/2020 | | | 3,759,852 | |
| | 500,000 | | | Shell International Finance B.V.
4.38%, 03/25/2020 | | | 537,015 | |
| | 3,950,000 | | | Sinopec Group Overseas Development 2015 Ltd.
2.50%, 04/28/2020(3) | | | 3,885,816 | |
| | | | Statoil ASA | |
| | 340,000 | | | 2.25%, 11/08/2019 | | | 338,794 | |
| | 160,000 | | | 2.45%, 01/17/2023 | | | 151,672 | |
| | 495,000 | | | 2.75%, 11/10/2021 | | | 491,867 | |
| | 1,850,000 | | | 2.90%, 11/08/2020 | | | 1,880,255 | |
| | 210,000 | | | 3.25%, 11/10/2024 | | | 205,966 | |
| | 45,000 | | | 3.70%, 03/01/2024 | | | 45,591 | |
| | 615,000 | | | Suncor Energy, Inc.
3.60%, 12/01/2024 | | | 579,255 | |
| | 1,375,000 | | | Total Capital International S.A.
2.70%, 01/25/2023 | | | 1,318,145 | |
| | | | | | | | |
| | | | | | | 28,489,782 | |
| | | | | | | | |
The accompanying notes are an integral part of these financial statements.
|
| Hartford Balanced HLS Fund |
Schedule of Investments – (continued)
December 31, 2015
| | | | | | | | |
| Shares or Principal Amount | | Market Value† | |
| CORPORATE BONDS - 17.0% - (continued) | |
| | | | Oil & Gas Services - 0.1% | |
| $ | 1,085,000 | | | Halliburton Co.
3.38%, 11/15/2022 | | $ | 1,067,786 | |
| | 940,000 | | | Schlumberger Holdings Corp.
3.00%, 12/21/2020(3) | | | 927,856 | |
| | 1,625,000 | | | Schlumberger Investment S.A.
3.65%, 12/01/2023 | | | 1,648,606 | |
| | | | | | | | |
| | | | | | | 3,644,248 | |
| | | | | | | | |
| | | | Pharmaceuticals - 0.9% | |
| | 270,000 | | | AbbVie, Inc.
3.20%, 11/06/2022 | | | 265,770 | |
| | | | Actavis Funding SCS | |
| | 610,000 | | | 3.00%, 03/12/2020 | | | 609,515 | |
| | 1,035,000 | | | 3.45%, 03/15/2022 | | | 1,036,129 | |
| | 330,000 | | | 3.80%, 03/15/2025 | | | 328,315 | |
| | 600,000 | | | 4.85%, 06/15/2044 | | | 593,652 | |
| | | | Bayer US Finance LLC | |
| | 260,000 | | | 2.38%, 10/08/2019(3) | | | 260,163 | |
| | 1,215,000 | | | 3.00%, 10/08/2021(3) | | | 1,225,257 | |
| | 395,000 | | | 3.38%, 10/08/2024(3) | | | 397,811 | |
| | | | Cardinal Health, Inc. | |
| | 990,000 | | | 2.40%, 11/15/2019 | | | 989,621 | |
| | 880,000 | | | 3.50%, 11/15/2024 | | | 881,022 | |
| | 1,035,000 | | | 4.50%, 11/15/2044 | | | 998,985 | |
| | 450,000 | | | Eli Lilly & Co.
2.75%, 06/01/2025 | | | 444,267 | |
| | | | EMD Finance LLC | |
| | 2,015,000 | | | 2.95%, 03/19/2022(3) | | | 1,944,175 | |
| | 3,000,000 | | | 3.25%, 03/19/2025(3) | | | 2,844,441 | |
| | 1,525,000 | | | Express Scripts Holding Co.
2.25%, 06/15/2019 | | | 1,516,012 | |
| | 305,000 | | | Forest Laboratories, Inc.
4.88%, 02/15/2021(3) | | | 330,255 | |
| | | | McKesson Corp. | |
| | 100,000 | | | 2.85%, 03/15/2023 | | | 95,936 | |
| | 990,000 | | | 3.80%, 03/15/2024 | | | 995,176 | |
| | | | Merck & Co., Inc. | |
| | 1,960,000 | | | 2.75%, 02/10/2025 | | | 1,908,076 | |
| | 1,640,000 | | | 2.80%, 05/18/2023 | | | 1,631,880 | |
| | 630,000 | | | 4.15%, 05/18/2043 | | | 625,260 | |
| | 1,925,000 | | | Mylan N.V.
3.00%, 12/15/2018(3) | | | 1,920,751 | |
| | | | | | | | |
| | | | | | | 21,842,469 | |
| | | | | | | | |
| | | | Pipelines - 0.5% | |
| | 990,000 | | | Columbia Pipeline Group, Inc.
2.45%, 06/01/2018(3) | | | 967,941 | |
| | 1,300,000 | | | Energy Transfer Partners L.P.
5.15%, 03/15/2045 | | | 918,865 | |
| | 2,850,000 | | | Kinder Morgan Energy Partners L.P.
6.95%, 01/15/2038 | | | 2,447,885 | |
| | 2,425,000 | | | Phillips 66 Partners L.P.
3.61%, 02/15/2025 | | | 2,086,079 | |
| | 2,510,000 | | | Regency Energy Partners L.P.
5.88%, 03/01/2022 | | | 2,365,828 | |
| | 2,375,000 | | | Sunoco Logistics Partners Operations L.P.
4.40%, 04/01/2021 | | | 2,301,544 | |
| | 2,470,000 | | | Western Gas Partners L.P.
4.00%, 07/01/2022 | | | 2,184,752 | |
| | | | | | | | |
| | | | | | | 13,272,894 | |
| | | | | | | | |
| | | | | | | | |
| Shares or Principal Amount | | Market Value† | |
| CORPORATE BONDS - 17.0% - (continued) | |
| | | | Real Estate - 0.1% | |
| | | | WEA Finance LLC / Westfield UK & Europe Finance plc | |
| $ | 480,000 | | | 1.75%, 09/15/2017(3) | | $ | 475,882 | |
| | 730,000 | | | 2.70%, 09/17/2019(3) | | | 723,986 | |
| | 1,400,000 | | | 3.25%, 10/05/2020(3)(6) | | | 1,405,358 | |
| | | | | | | | |
| | | | | | | 2,605,226 | |
| | | | | | | | |
| | | | Real Estate Investment Trusts - 0.4% | |
| | 975,000 | | | American Tower Corp.
3.45%, 09/15/2021 | | | 979,779 | |
| | 760,000 | | | AvalonBay Communities, Inc.
3.63%, 10/01/2020 | | | 788,913 | |
| | 2,010,000 | | | Brandywine Operating Partnership L.P.
6.00%, 04/01/2016 | | | 2,030,399 | |
| | | | HCP, Inc. | |
| | 2,960,000 | | | 4.00%, 06/01/2025 | | | 2,890,182 | |
| | 2,030,000 | | | 6.00%, 01/30/2017 | | | 2,114,649 | |
| | 1,735,000 | | | Scentre Group
2.38%, 11/05/2019(3) | | | 1,711,578 | |
| | | | | | | | |
| | | | | | | 10,515,500 | |
| | | | | | | | |
| | | | Retail - 0.5% | |
| | | | AutoZone, Inc. | |
| | 900,000 | | | 3.13%, 07/15/2023 | | | 882,786 | |
| | 1,908,000 | | | 3.70%, 04/15/2022 | | | 1,941,142 | |
| | | | CVS Health Corp. | |
| | 2,100,000 | | | 4.00%, 12/05/2023 | | | 2,182,360 | |
| | 1,370,000 | | | 4.88%, 07/20/2035 | | | 1,414,512 | |
| | 1,585,000 | | | 5.13%, 07/20/2045 | | | 1,669,688 | |
| | 325,000 | | | Home Depot, Inc.
4.40%, 03/15/2045 | | | 335,906 | |
| | 2,650,000 | | | Lowe’s Cos., Inc.
4.63%, 04/15/2020 | | | 2,868,185 | |
| | 1,435,000 | | | O’Reilly Automotive, Inc.
3.80%, 09/01/2022 | | | 1,452,382 | |
| | | | | | | | |
| | | | | | | 12,746,961 | |
| | | | | | | | |
| | | | Savings & Loans - 0.1% | |
| | 1,610,000 | | | Nationwide Building Society
2.35%, 01/21/2020(3) | | | 1,599,174 | |
| | | | | | | | |
| | | | Telecommunications - 0.7% | |
| | | | America Movil S.A.B. de C.V. | |
| | 635,000 | | | 3.13%, 07/16/2022 | | | 623,962 | |
| | 530,000 | | | 4.38%, 07/16/2042 | | | 468,125 | |
| | 1,000,000 | | | AT&T, Inc.
6.80%, 05/15/2036 | | | 1,149,414 | |
| | 715,000 | | | GTP Acquisition Partners I LLC
2.35%, 06/15/2045(3) | | | 694,849 | |
| | | | Orange S.A. | |
| | 3,200,000 | | | 4.13%, 09/14/2021 | | | 3,386,218 | |
| | 420,000 | | | 9.00%, 03/01/2031 | | | 592,801 | |
| | | | Verizon Communications, Inc. | |
| | 425,000 | | | 3.45%, 03/15/2021 | | | 434,813 | |
| | 2,415,000 | | | 3.50%, 11/01/2021 | | | 2,465,713 | |
| | 4,795,000 | | | 4.50%, 09/15/2020 | | | 5,151,781 | |
| | 2,386,000 | | | 4.52%, 09/15/2048 | | | 2,133,793 | |
| | 715,000 | | | 4.75%, 11/01/2041 | | | 659,410 | |
| | 263,000 | | | 6.40%, 09/15/2033 | | | 299,630 | |
| | | | | | | | |
| | | | | | | 18,060,509 | |
| | | | | | | | |
The accompanying notes are an integral part of these financial statements.
|
| Hartford Balanced HLS Fund |
Schedule of Investments – (continued)
December 31, 2015
| | | | | | | | |
| Shares or Principal Amount | | Market Value† | |
| CORPORATE BONDS - 17.0% - (continued) | |
| | | | Transportation - 0.2% | |
| | | | FedEx Corp. | |
| $ | 270,000 | | | 2.63%, 08/01/2022 | | $ | 263,021 | |
| | 405,000 | | | 2.70%, 04/15/2023 | | | 393,088 | |
| | 845,000 | | | 4.90%, 01/15/2034 | | | 868,081 | |
| | 1,435,000 | | | 5.10%, 01/15/2044 | | | 1,486,835 | |
| | 1,685,000 | | | Penske Truck Leasing Co. L.P. / PTL Finance Corp.
3.20%, 07/15/2020(3) | | | 1,668,091 | |
| | | | | | | | |
| | | | | | | 4,679,116 | |
| | | | | | | | |
| | | | Total Corporate Bonds
(cost $419,397,465) | | $ | 427,332,947 | |
| | | | | | | | |
|
| FOREIGN GOVERNMENT OBLIGATIONS - 0.2% | |
| | | | Mexico - 0.2% | |
| | | | Mexico Government International Bond | |
| $ | 1,674,000 | | | 3.50%, 01/21/2021 | | $ | 1,699,110 | |
| | 2,375,000 | �� | | 3.60%, 01/30/2025 | | | 2,314,438 | |
| | | | | | | | |
| | | | Total Foreign Government Obligations (cost $4,022,208) | | $ | 4,013,548 | |
| | | | | | | | |
|
| MUNICIPAL BONDS - 1.3% | |
| | | | General - 0.2% | |
| $ | 585,000 | | | Chicago Transit Auth
6.90%, 12/01/2040 | | $ | 679,899 | |
| | 1,785,000 | | | Kansas Dev Finance Auth
4.93%, 04/15/2045 | | | 1,774,593 | |
| | 2,400,000 | | | New Jersey State, Economic Auth Rev
3.80%, 06/15/2018 | | | 2,388,336 | |
| | | | | | | | |
| | | | | | | 4,842,828 | |
| | | | | | | | |
| | | | General Obligation - 0.3% | |
| | 1,235,000 | | | California State GO, Taxable
7.55%, 04/01/2039 | | | 1,793,850 | |
| | 685,000 | | | Chicago, IL, Metropolitan Water Reclamation GO
5.72%, 12/01/2038 | | | 791,237 | |
| | 1,640,000 | | | Illinois State, GO
5.10%, 06/01/2033 | | | 1,550,866 | |
| | 2,800,000 | | | Los Angeles, CA, USD GO
5.75%, 07/01/2034 | | | 3,370,668 | |
| | | | | | | | |
| | | | | | | 7,506,621 | |
| | | | | | | | |
| | | | Higher Education - 0.1% | |
| | 1,960,000 | | | University of California, Build America Bonds Rev
5.77%, 05/15/2043 | | | 2,401,666 | |
| | | | | | | | |
| | | | Medical - 0.1% | |
| | 1,935,000 | | | University of California, Regents MedCenter Pooled Rev
6.58%, 05/15/2049 | | | 2,499,885 | |
| | | | | | | | |
| | | | Power - 0.0% | |
| | 485,000 | | | Utility Debt Securitization Auth, New York
3.44%, 12/15/2025 | | | 502,673 | |
| | | | | | | | |
| | | | Transportation - 0.5% | |
| | 1,560,000 | | | Bay Area, CA, Toll Auth Bridge Rev
6.26%, 04/01/2049 | | | 2,102,412 | |
| | 1,500,000 | | | Dallas, TX, Area Rapid Transit Sales Tax Rev
6.00%, 12/01/2044 | | | 1,958,385 | |
| | | | | | | | |
| Shares or Principal Amount | | Market Value† | |
| MUNICIPAL BONDS - 1.3% - (continued) | |
| | | | Transportation - 0.5% - (continued) | |
| $ | 1,875,000 | | | Illinois State Toll Highway Auth, Taxable Rev
6.18%, 01/01/2034 | | $ | 2,345,100 | |
| | 1,050,000 | | | Maryland State Transportation Auth
5.89%, 07/01/2043 | | | 1,276,999 | |
| | | | New York and New Jersey PA, Taxable Rev | |
| | 685,000 | | | 4.81%, 10/15/2065 | | | 696,460 | |
| | 975,000 | | | 5.86%, 12/01/2024 | | | 1,190,573 | |
| | 570,000 | | | 6.04%, 12/01/2029 | | | 690,378 | |
| | 2,400,000 | | | North Texas Tollway Auth Rev
6.72%, 01/01/2049 | | | 3,306,336 | |
| | | | | | | | |
| | | | | | | 13,566,643 | |
| | | | | | | | |
| | | | Utility - Electric - 0.1% | |
| | 905,000 | | | Municipal Electric Auth. Georgia
6.64%, 04/01/2057 | | | 1,086,100 | |
| | | | | | | | |
| | | | Total Municipal Bonds
(cost $27,587,494) | | $ | 32,406,416 | |
| | | | | | | | |
|
| U.S. GOVERNMENT AGENCIES - 1.0% | |
| | | | FHLMC - 0.4% | |
| $ | 66,937 | | | 2.43%, 04/01/2029(4) | | $ | 69,036 | |
| | 43,319 | | | 4.00%, 03/01/2041 | | | 45,911 | |
| | 1,081,648 | | | 4.50%, 08/01/2033 | | | 1,169,977 | |
| | 414,574 | | | 4.50%, 09/01/2033 | | | 448,369 | |
| | 25,141 | | | 4.50%, 12/01/2034 | | | 27,189 | |
| | 56,133 | | | 4.50%, 05/01/2035 | | | 60,688 | |
| | 59,428 | | | 4.50%, 09/01/2035 | | | 64,276 | |
| | 40,489 | | | 4.50%, 12/01/2035 | | | 43,603 | |
| | 1,326,615 | | | 4.50%, 10/01/2039 | | | 1,430,996 | |
| | 162,816 | | | 4.50%, 01/01/2040 | | | 175,589 | |
| | 9,800 | | | 4.50%, 04/01/2040 | | | 10,559 | |
| | 43,028 | | | 4.50%, 09/01/2040 | | | 46,956 | |
| | 381,936 | | | 4.50%, 02/01/2041 | | | 412,181 | |
| | 632,078 | | | 4.50%, 10/01/2041 | | | 682,478 | |
| | 113,149 | | | 4.50%, 11/01/2043 | | | 122,612 | |
| | 4,107,447 | | | 4.50%, 01/01/2044 | | | 4,435,620 | |
| | | | | | | | |
| | | | 9,246,040 | |
| | | | | | | | |
| | | | FNMA - 0.3% | |
| | 136,462 | | | 4.50%, 11/01/2023 | | | 147,382 | |
| | 238,907 | | | 4.50%, 03/01/2038 | | | 258,715 | |
| | 138,546 | | | 4.50%, 11/01/2039 | | | 149,774 | |
| | 299,484 | | | 4.50%, 04/01/2040 | | | 324,948 | |
| | 203,643 | | | 4.50%, 05/01/2040 | | | 220,392 | |
| | 515,382 | | | 4.50%, 08/01/2040 | | | 557,352 | |
| | 116,097 | | | 4.50%, 11/01/2040 | | | 125,388 | |
| | 78,398 | | | 4.50%, 02/01/2041 | | | 84,854 | |
| | 215,728 | | | 4.50%, 03/01/2041 | | | 233,326 | |
| | 1,415,709 | | | 4.50%, 04/01/2041 | | | 1,531,857 | |
| | 117,813 | | | 4.50%, 05/01/2041 | | | 127,241 | |
| | 623,773 | | | 4.50%, 06/01/2041 | | | 674,567 | |
| | 939,919 | | | 4.50%, 07/01/2041 | | | 1,017,119 | |
| | 368,330 | | | 4.50%, 09/01/2041 | | | 398,592 | |
| | 23,858 | | | 4.50%, 11/01/2043 | | | 25,768 | |
| | 550,964 | | | 4.50%, 06/01/2044 | | | 597,397 | |
| | 279,280 | | | 4.50%, 07/01/2044 | | | 301,639 | |
| | 1,800,000 | | | 4.50%, 01/01/2046(7) | | | 1,943,775 | |
| | 4,758 | | | 5.00%, 02/01/2019 | | | 4,948 | |
| | 47,137 | | | 5.00%, 04/01/2019 | | | 48,809 | |
| | | | | | | | |
| | | | 8,773,843 | |
| | | | | | | | |
The accompanying notes are an integral part of these financial statements.
|
| Hartford Balanced HLS Fund |
Schedule of Investments – (continued)
December 31, 2015
| | | | | | | | |
| Shares or Principal Amount | | Market Value† | |
| U.S. GOVERNMENT AGENCIES - 1.0% - (continued) | |
| | | | GNMA - 0.3% | |
| $ | 174,458 | | | 5.00%, 07/15/2037 | | $ | 194,463 | |
| | 25,925 | | | 6.00%, 06/15/2024 | | | 29,285 | |
| | 6,871 | | | 6.00%, 07/15/2026 | | | 7,708 | |
| | 12,195 | | | 6.00%, 01/15/2028 | | | 13,680 | |
| | 3,196 | | | 6.00%, 03/15/2028 | | | 3,697 | |
| | 87,564 | | | 6.00%, 04/15/2028 | | | 98,552 | |
| | 114,677 | | | 6.00%, 05/15/2028 | | | 128,642 | |
| | 24,749 | | | 6.00%, 06/15/2028 | | | 27,762 | |
| | 75,128 | | | 6.00%, 07/15/2028 | | | 85,180 | |
| | 22,782 | | | 6.00%, 08/15/2028 | | | 25,682 | |
| | 100,526 | | | 6.00%, 09/15/2028 | | | 113,064 | |
| | 182,630 | | | 6.00%, 10/15/2028 | | | 205,283 | |
| | 295,287 | | | 6.00%, 11/15/2028 | | | 331,789 | |
| | 168,978 | | | 6.00%, 12/15/2028 | | | 190,020 | |
| | 6,293 | | | 6.00%, 12/15/2031 | | | 7,234 | |
| | 36,345 | | | 6.00%, 09/15/2032 | | | 41,488 | |
| | 12,470 | | | 6.00%, 11/15/2032 | | | 14,403 | |
| | 21,054 | | | 6.00%, 01/15/2033 | | | 23,618 | |
| | 6,075 | | | 6.00%, 04/15/2033 | | | 6,815 | |
| | 137,009 | | | 6.00%, 06/15/2033 | | | 157,290 | |
| | 55,117 | | | 6.00%, 10/15/2033 | | | 63,606 | |
| | 7,746 | | | 6.00%, 11/15/2033 | | | 8,943 | |
| | 140,730 | | | 6.00%, 10/15/2034 | | | 159,728 | |
| | 64,083 | | | 6.00%, 01/15/2035 | | | 71,886 | |
| | 8,308 | | | 6.00%, 05/15/2035 | | | 9,320 | |
| | 26,490 | | | 6.00%, 06/15/2035 | | | 30,501 | |
| | 1,214 | | | 6.50%, 03/15/2026 | | | 1,388 | |
| | 22 | | | 6.50%, 04/15/2026 | | | 25 | |
| | 5,804 | | | 6.50%, 01/15/2028 | | | 6,640 | |
| | 472 | | | 6.50%, 02/15/2028 | | | 540 | |
| | 94,188 | | | 6.50%, 03/15/2028 | | | 107,763 | |
| | 174,001 | | | 6.50%, 04/15/2028 | | | 199,078 | |
| | 61,747 | | | 6.50%, 05/15/2028 | | | 70,649 | |
| | 242,935 | | | 6.50%, 06/15/2028 | | | 277,949 | |
| | 14,923 | | | 6.50%, 10/15/2028 | | | 17,074 | |
| | 5,117 | | | 6.50%, 02/15/2035 | | | 5,966 | |
| | 34,374 | | | 7.00%, 11/15/2031 | | | 39,439 | |
| | 16,843 | | | 7.00%, 03/15/2032 | | | 19,600 | |
| | 1,793,818 | | | 7.00%, 11/15/2032 | | | 2,170,616 | |
| | 258,001 | | | 7.00%, 01/15/2033 | | | 306,656 | |
| | 282,059 | | | 7.00%, 05/15/2033 | | | 333,374 | |
| | 55,609 | | | 7.00%, 07/15/2033 | | | 65,423 | |
| | 339,642 | | | 7.00%, 11/15/2033 | | | 401,763 | |
| | 136,052 | | | 7.50%, 09/16/2035 | | | 155,795 | |
| | 253 | | | 8.00%, 09/15/2026 | | | 284 | |
| | 160 | | | 8.00%, 11/15/2026 | | | 179 | |
| | 16,146 | | | 8.00%, 12/15/2026 | | | 19,404 | |
| | 180 | | | 8.00%, 09/15/2027 | | | 191 | |
| | 10,626 | | | 8.00%, 07/15/2029 | | | 12,914 | |
| | 5,571 | | | 8.00%, 10/15/2029 | | | 5,652 | |
| | 4,344 | | | 8.00%, 11/15/2029 | | | 4,361 | |
| | 23,364 | | | 8.00%, 12/15/2029 | | | 25,087 | |
| | 4,995 | | | 8.00%, 01/15/2030 | | | 5,217 | |
| | 7,093 | | | 8.00%, 02/15/2030 | | | 7,365 | |
| | 1,183 | | | 8.00%, 03/15/2030 | | | 1,210 | |
| | 62,320 | | | 8.00%, 04/15/2030 | | | 63,517 | |
| | 12,018 | | | 8.00%, 05/15/2030 | | | 12,445 | |
| | 50,810 | | | 8.00%, 06/15/2030 | | | 54,365 | |
| | 4,000 | | | 8.00%, 07/15/2030 | | | 4,447 | |
| | 87,392 | | | 8.00%, 08/15/2030 | | | 90,272 | |
| | 17,809 | | | 8.00%, 09/15/2030 | | | 18,223 | |
| | | | | | | | |
| Shares or Principal Amount | | Market Value† | |
| U.S. GOVERNMENT AGENCIES - 1.0% - (continued) | |
| | | | GNMA - 0.3% - (continued) | |
| $ | 10,802 | | | 8.00%, 11/15/2030 | | $ | 11,145 | |
| | 184,149 | | | 8.00%, 12/15/2030 | | | 203,903 | |
| | 283 | | | 8.00%, 02/15/2031 | | | 301 | |
| | 2,583 | | | 9.00%, 07/20/2016 | | | 2,591 | |
| | 10,164 | | | 9.00%, 06/15/2022 | | | 10,342 | |
| | | | | | | | |
| | | | 6,782,792 | |
| | | | | | | | |
| | | | Total U.S. Government Agencies
(cost $23,753,947) | | $ | 24,802,675 | |
| | | | | | | | |
|
| U.S. GOVERNMENT SECURITIES - 14.1% | |
| | | | U.S. Treasury Securities - 14.1% | |
| | | | U.S. Treasury Bonds - 3.2% | |
| $ | 18,060,000 | | | 2.50%, 02/15/2045 | | $ | 16,203,920 | |
| | 17,645,800 | | | 2.88%, 05/15/2043 | | | 17,204,655 | |
| | 235,000 | | | 3.00%, 11/15/2044 | | | 234,146 | |
| | 361,500 | | | 3.13%, 02/15/2043 | | | 370,509 | |
| | 10,095,000 | | | 3.13%, 08/15/2044 | | | 10,317,009 | |
| | 4,630,000 | | | 3.38%, 05/15/2044 | | | 4,968,930 | |
| | 22,000,000 | | | 4.38%, 02/15/2038(8) | | | 27,762,966 | |
| | 1,750,000 | | | 6.00%, 02/15/2026 | | | 2,336,455 | |
| | | | | | | | |
| | | | | | | 79,398,590 | |
| | | | | | | | |
| | | | U.S. Treasury Notes - 10.9% | |
| | 50,000,000 | | | 0.50%, 08/31/2016 | | | 49,943,350 | |
| | 4,300,000 | | | 0.50%, 03/31/2017 | | | 4,280,349 | |
| | 22,475,000 | | | 0.63%, 12/31/2016 | | | 22,437,242 | |
| | 8,300,000 | | | 0.63%, 05/31/2017 | | | 8,263,364 | |
| | 25,000,000 | | | 0.63%, 08/31/2017 | | | 24,839,850 | |
| | 3,800,000 | | | 0.63%, 09/30/2017 | | | 3,773,727 | |
| | 5,343,000 | | | 0.88%, 01/31/2017 | | | 5,343,417 | |
| | 11,800,000 | | | 1.00%, 09/15/2017 | | | 11,793,085 | |
| | 8,935,000 | | | 1.38%, 09/30/2018 | | | 8,962,922 | |
| | 2,025,000 | | | 1.38%, 09/30/2020 | | | 1,990,036 | |
| | 37,000,000 | | | 1.63%, 07/31/2019 | | | 37,128,649 | |
| | 1,665,000 | | | 1.63%, 06/30/2020 | | | 1,658,170 | |
| | 17,835,000 | | | 1.75%, 09/30/2019 | | | 17,955,529 | |
| | 7,475,000 | | | 2.00%, 02/15/2025 | | | 7,307,104 | |
| | 8,000,000 | | | 2.13%, 05/15/2025 | | | 7,895,624 | |
| | 16,670,000 | | | 2.25%, 11/15/2024 | | | 16,661,532 | |
| | 13,095,000 | | | 2.38%, 08/15/2024 | | | 13,231,581 | |
| | 16,070,000 | | | 2.75%, 02/15/2019 | | | 16,744,811 | |
| | 7,650,000 | | | 2.75%, 11/15/2023 | | | 7,983,792 | |
| | 5,950,000 | | | 2.75%, 02/15/2024 | | | 6,197,532 | |
| | | | | | | | |
| | | | | | | 274,391,666 | |
| | | | | | | | |
| | | | Total U.S. Government Securities
(cost $345,033,532) | | $ | 353,790,256 | |
| | | | | | | | |
| | |
| | | | Total Long-Term Investments
(cost $2,048,162,458) | | $ | 2,479,455,636 | |
| | | | | | | | |
The accompanying notes are an integral part of these financial statements.
|
| Hartford Balanced HLS Fund |
Schedule of Investments – (continued)
December 31, 2015
| | | | | | | | |
| Shares or Principal Amount | | Market Value† | |
| SHORT-TERM INVESTMENTS - 1.3% | |
| | | | Discount Notes - 1.1% | |
| | | | Sovereign - 1.1% | |
| | | | FHLB | |
| $ | 1,469,000 | | | 0.18%, 02/04/2016(9) | | $ | 1,468,750 | |
| | 25,279,000 | | | 0.19%, 02/12/2016(9) | | | 25,273,397 | |
| | | | | | | | |
| | | | | | | 26,742,147 | |
| | | | | | | | |
| | | | | | | 26,742,147 | |
| | | | | | | | |
| | | | Other Investment Pools & Funds - 0.2% | |
| | 4,579,370 | | | Federated Prime Obligations Fund | | | 4,579,370 | |
| | | | | | | | |
| | |
| | | | Total Short-Term Investments
(cost $31,321,517) | | $ | 31,321,517 | |
| | | | | | | | |
| | | | | | | | | | |
| | | |
| | Total Investments
(cost $2,079,483,975)^ | | | 100.0 | % | | $ | 2,510,777,153 | |
| | Other Assets and Liabilities | | | 0.0 | % | | | 1,106,059 | |
| | | | | | | | | | |
| | Total Net Assets | | | 100.0 | % | | $ | 2,511,883,212 | |
| | | | | | | | | | |
The accompanying notes are an integral part of these financial statements.
|
| Hartford Balanced HLS Fund |
Schedule of Investments – (continued)
December 31, 2015
| Note: | Percentage of investments as shown is the ratio of the total market value to total net assets. |
| | Prices of foreign equities that are principally traded on certain foreign markets may be adjusted daily pursuant to a fair value pricing service approved by the Board of Directors in order to reflect an adjustment for factors occurring after the close of certain foreign markets but before the close of the New York Stock Exchange. |
| | The Fund may refer to any one or more of the industry classifications used by one or more widely recognized market indices, ratings group indices and/or as defined by Fund management. Industry classifications may not be identical across all security types. |
| | Equity industry classifications used in this report are the Global Industry Classification Standard, which was developed by and is the exclusive property and service mark of MSCI, Inc. and Standard & Poor’s. |
| | For Fund compliance purposes, the Fund may not use the same classification system shown in this report as these classifications are used for financial reporting purposes. |
| ^ | At December 31, 2015, the cost of securities for federal income tax purposes was $2,096,519,649 and the aggregate gross unrealized appreciation and depreciation based on that cost were: |
| | | | |
Unrealized Appreciation | | $ | 479,586,190 | |
Unrealized Depreciation | | | (65,328,686 | ) |
| | | | |
Net Unrealized Appreciation | | $ | 414,257,504 | |
| | | | |
| (1) | These securities are valued in good faith at fair value as determined under policies and procedures established by and under the supervision of the Board of Directors. At December 31, 2015, the aggregate fair value of these securities was $19,755,780, which represents 0.8% of total net assets. This amount excludes securities that are principally traded in certain foreign markets and whose prices are adjusted pursuant to a third party pricing service methodology approved by the Board of Directors. |
| (2) | The following securities are considered illiquid. Illiquid securities are often purchased in private placement transactions, are often not registered under the Securities Act of 1933, as amended, and may have contractual restrictions on resale. A security may also be considered illiquid if the security lacks a readily available market or if its valuation has not changed for a certain period of time. |
| | | | | | | | | | |
Period
Acquired | | Shares/Par | | | Security | | Cost | |
| 08/2011 | | | 11,702,200 | | | Allstar Co. | | $ | 5,090,681 | |
| 11/2013 | | | 163,241 | | | Tory Burch LLC | | | 12,794,224 | |
| | | | | | | | | | |
| | | | | | | | $ | 17,884,905 | |
| | | | | | | | | | |
| | At December 31, 2015, the aggregate value of these securities was $19,755,780, which represents 0.8% of total net assets. |
| (3) | Securities issued within terms of a private placement memorandum, exempt from registration under Rule 144A under the Securities Act of 1933, as amended, and may be sold only to qualified institutional buyers. Unless otherwise indicated, these holdings are determined to be liquid. At December 31, 2015, the aggregate value of these securities was $105,809,331, which represents 4.2% of total net assets. |
| (4) | Variable rate securities; the rate reported is the coupon rate in effect at December 31, 2015. |
| (5) | Perpetual maturity security. Maturity date shown is the next call date or final legal maturity date, whichever comes first. |
| (6) | This security, or a portion of this security, was purchased on a when-issued, delayed-delivery or delayed-draw basis. The cost of this security was $1,395,198 at December 31, 2015. |
| (7) | Represents or includes a TBA transaction. |
| (8) | This security, or a portion of this security, has been pledged as collateral in connection with futures contracts. |
| (9) | The rate shown represents current yield to maturity. |
The accompanying notes are an integral part of these financial statements.
|
| Hartford Balanced HLS Fund |
Schedule of Investments – (continued)
December 31, 2015
Futures Contracts Outstanding at December 31, 2015
| | | | | | | | | | | | | | | | | | | | |
Description | | Number of
Contracts | | | Expiration
Date | | | Notional
Amount | | | Market
Value† | | | Unrealized
Appreciation/
(Depreciation) | |
Long position contracts: | | | | | | | | | | | | | | | | | | | | |
U.S. Treasury 10-Year Note Future | | | 15 | | | | 03/21/2016 | | | $ | 1,894,091 | | | $ | 1,888,594 | | | $ | (5,497 | ) |
U.S. Treasury 5-Year Note Future | | | 141 | | | | 03/31/2016 | | | | 16,738,513 | | | | 16,683,164 | | | | (55,349 | ) |
| | | | | | | | | | | | | | | | | | | | |
Total | | | $ | (60,846 | ) |
| | | | | | | | | | | | | | | | | | | | |
Total futures contracts | | | | | | | | | | | | | | | | | | $ | (60,846 | ) |
| | | | | | | | | | | | | | | | | | | | |
TBA Sale Commitments Outstanding at December 31, 2015
| | | | | | | | | | | | | | | | |
Description | | Principal
Amount | | | Maturity
Date | | | Market
Value† | | | Unrealized
Appreciation/
(Depreciation) | |
FHLMC, 4.50% | | $ | 5,000,000 | | | | 01/01/2046 | | | $ | (5,386,250 | ) | | $ | (3,969 | ) |
| | | | | | | | | | | | | | | | |
Total (proceeds $5,382,281) | | | $ | (5,386,250 | ) | | $ | (3,969 | ) |
| | | | | | | | | | | | | | | | |
| | At December 31, 2015, the aggregate market value of these securities represents (0.2)% of total net assets. |
| † | See Significant Accounting Policies of accompanying Notes to Financial Statements regarding valuation of investments. |
| | |
| GLOSSARY: (abbreviations used in preceding Schedule of Investments) |
|
| Other Abbreviations: |
ADR | | American Depositary Receipt |
FHLB | | Federal Home Loan Bank |
FHLMC | | Federal Home Loan Mortgage Corp. |
FNMA | | Federal National Mortgage Association |
GNMA | | Government National Mortgage Association |
TBA | | To Be Announced |
|
| Municipal Abbreviations: |
GO | | General Obligation |
PA | | Port Authority |
Rev | | Revenue |
USD | | United School District |
The accompanying notes are an integral part of these financial statements.
|
| Hartford Balanced HLS Fund |
Schedule of Investments – (continued)
December 31, 2015
Fair Valuation Summary
The following is a summary of the fair valuations according to the inputs used as of December 31, 2015 in valuing the Fund’s investments.
| | | | | | | | | | | | | | | | |
| | | Total | | | Level 1(1) | | | Level 2(1) | | | Level 3 | |
Assets | |
Common Stocks | |
Automobiles & Components | | $ | 12,707,207 | | | $ | 12,707,207 | | | $ | — | | | $ | — | |
Banks | | | 173,288,405 | | | | 173,288,405 | | | | — | | | | — | |
Capital Goods | | | 113,235,673 | | | | 113,235,673 | | | | — | | | | — | |
Commercial & Professional Services | | | 16,526,690 | | | | 16,526,690 | | | | — | | | | — | |
Consumer Durables & Apparel | | | 8,760,667 | | | | 8,760,667 | | | | — | | | | — | |
Consumer Services | | | 31,128,642 | | | | 31,128,642 | | | | — | | | | — | |
Diversified Financials | | | 73,166,802 | | | | 73,166,802 | | | | — | | | | — | |
Energy | | | 96,985,750 | | | | 96,985,750 | | | | — | | | | — | |
Food & Staples Retailing | | | 29,661,463 | | | | 29,661,463 | | | | — | | | | — | |
Food, Beverage & Tobacco | | | 87,826,897 | | | | 69,838,716 | | | | 17,988,181 | | | | — | |
Health Care Equipment & Services | | | 74,802,775 | | | | 74,802,775 | | | | — | | | | — | |
Household & Personal Products | | | 15,279,291 | | | | 15,279,291 | | | | — | | | | — | |
Insurance | | | 61,689,910 | | | | 61,689,910 | | | | — | | | | — | |
Materials | | | 42,213,452 | | | | 42,213,452 | | | | — | | | | — | |
Media | | | 60,278,553 | | | | 60,278,553 | | | | — | | | | — | |
Pharmaceuticals, Biotechnology & Life Sciences | | | 242,290,484 | | | | 186,464,779 | | | | 55,825,705 | | | | — | |
Retailing | | | 77,745,266 | | | | 57,989,486 | | | | — | | | | 19,755,780 | |
Semiconductors & Semiconductor Equipment | | | 79,534,664 | | | | 79,534,664 | | | | — | | | | — | |
Software & Services | | | 172,846,828 | | | | 172,846,828 | | | | — | | | | — | |
Technology Hardware & Equipment | | | 73,980,722 | | | | 73,980,722 | | | | — | | | | — | |
Telecommunication Services | | | 8,702,764 | | | | 8,702,764 | | | | — | | | | — | |
Transportation | | | 11,826,968 | | | | 11,826,968 | | | | — | | | | — | |
Utilities | | | 30,547,816 | | | | 30,547,816 | | | | — | | | | — | |
Asset & Commercial Mortgage Backed Securities | | | 42,082,105 | | | | — | | | | 42,082,105 | | | | — | |
Corporate Bonds | | | 427,332,947 | | | | — | | | | 427,332,947 | | | | — | |
Foreign Government Obligations | | | 4,013,548 | | | | — | | | | 4,013,548 | | | | — | |
Municipal Bonds | | | 32,406,416 | | | | — | | | | 32,406,416 | | | | — | |
U.S. Government Agencies | | | 24,802,675 | | | | — | | | | 24,802,675 | | | | — | |
U.S. Government Securities | | | 353,790,256 | | | | — | | | | 353,790,256 | | | | — | |
Short-Term Investments | | | 31,321,517 | | | | 4,579,370 | | | | 26,742,147 | | | | — | |
| | | | | | | | | | | | | | | | |
Total | | $ | 2,510,777,153 | | | $ | 1,506,037,393 | | | $ | 984,983,980 | | | $ | 19,755,780 | |
| | | | | | | | | | | | | | | | |
Liabilities | | | | | | | | | | | | | | | | |
Futures Contracts(2) | | $ | (60,846 | ) | | $ | (60,846 | ) | | $ | — | | | $ | — | |
TBA Sale Commitments | | | (5,386,250 | ) | | | — | | | | (5,386,250 | ) | | | — | |
| | | | | | | | | | | | | | | | |
Total | | $ | (5,447,096 | ) | | $ | (60,846 | ) | | $ | (5,386,250 | ) | | $ | — | |
| | | | | | | | | | | | | | | | |
| (1) | For the year ended December 31, 2015, there were no transfers between Level 1 and Level 2. |
| (2) | Derivative instruments (excluding purchased and written options, if applicable) are valued at the unrealized appreciation/depreciation on the investments. |
The accompanying notes are an integral part of these financial statements.
|
| Hartford Balanced HLS Fund |
Schedule of Investments – (continued)
December 31, 2015
The following is a rollforward of the Fund’s investments that were valued using unobservable inputs (Level 3) for the year ended December 31, 2015:
| | | | | | | | | | | | | | | | |
| | | Asset & Commercial
Mortgage Backed
Securities | | | Common
Stocks | | | Corporate
Bonds | | | Total | |
Beginning balance | | $ | 7,898 | | | $ | 21,745,766 | | | $ | 20,629,007 | | | $ | 42,382,671 | |
Purchases | | | — | | | | — | | | | — | | | | — | |
Sales | | | — | | | | — | | | | — | | | | — | |
Accrued discounts/(premiums) | | | — | | | | — | | | | — | | | | — | |
Total realized gain/(loss) | | | — | | | | — | | | | — | | | | — | |
Net change in unrealized appreciation/depreciation | | | — | | | | (1,989,986 | ) | | | — | | | | (1,989,986 | ) |
Transfers into Level 3(1) | | | — | | | | — | | | | — | | | | — | |
Transfers out of Level 3(1) | | | (7,898 | ) | | | — | | | | (20,629,007 | ) | | | (20,636,905 | ) |
| | | | | | | | | | | | | | | | |
Ending balance | | $ | — | | | $ | 19,755,780 | | | $ | — | | | $ | 19,755,780 | |
| | | | | | | | | | | | | | | | |
The change in net unrealized appreciation/depreciation relating to the Level 3 investments held at December 31, 2015 was $(1,989,986).
| (1) | Investments are transferred into and out of Level 3 for a variety of reasons including, but not limited to: |
| | a) | Investments where trading has been halted (transfer into Level 3) or investments where trading has resumed (transfer out of Level 3). |
| | b) | Broker quoted investments (transfer into Level 3) or quoted prices in active markets (transfer out of Level 3). |
| | c) | Investments that have certain restrictions on trading (transfer into Level 3) or investments where trading restrictions have expired (transfer out of Level 3). |
| Note: | For purposes of reporting transfers between different hierarchy levels, both transfers in and out of each level, as applicable, are shown as if they occurred at the beginning of the period. |
The accompanying notes are an integral part of these financial statements.
|
| Hartford Capital Appreciation HLS Fund |
Schedule of Investments
December 31, 2015
| | | | | | | | |
Shares or Principal Amount | | Market Value† | |
| COMMON STOCKS - 96.1% | |
| | | | Automobiles & Components - 1.8% | |
| | 483,884 | | | Delphi Automotive plc | | $ | 41,483,375 | |
| | 243,845 | | | Fiat Chrysler Automobiles N.V.* | | | 3,386,482 | |
| | 253,742 | | | General Motors Co. | | | 8,629,765 | |
| | 941,910 | | | Goodyear Tire & Rubber Co. | | | 30,772,200 | |
| | 174,600 | | | Honda Motor Co., Ltd. | | | 5,580,480 | |
| | 107,900 | | | Magna International, Inc. | | | 4,376,200 | |
| | 21,661 | | | Tesla Motors, Inc.* | | | 5,198,857 | |
| | 104,636 | | | Volkswagen AG (Preference Shares) | | | 15,107,279 | |
| | | | | | | | |
| | | | | | | 114,534,638 | |
| | | | | | | | |
| | | | Banks - 6.5% | |
| | 2,218,161 | | | Alpha Bank A.E.* | | | 5,944,406 | |
| | 2,112,094 | | | Bank of America Corp. | | | 35,546,542 | |
| | 173,409 | | | BNP Paribas S.A. | | | 9,811,017 | |
| | 1,105,542 | | | CaixaBank S.A. | | | 3,847,960 | |
| | 7,153,000 | | | China Construction Bank Corp. Class H | | | 4,879,402 | |
| | 1,406,422 | | | Citigroup, Inc. | | | 72,782,339 | |
| | 307,532 | | | Citizens Financial Group, Inc. | | | 8,054,263 | |
| | 473,200 | | | HSBC Holdings plc | | | 3,735,540 | |
| | 1,366,417 | | | ICICI Bank Ltd. ADR | | | 10,699,045 | |
| | 1,804,376 | | | JP Morgan Chase & Co. | | | 119,142,947 | |
| | 154,638 | | | M&T Bank Corp. | | | 18,739,033 | |
| | 1,150,600 | | | Mitsubishi UFJ Financial Group, Inc. | | | 7,127,103 | |
| | 579,037 | | | Nordea Bank AB | | | 6,353,051 | |
| | 745,777 | | | PNC Financial Services Group, Inc. | | | 71,080,006 | |
| | 2,815,100 | | | Sberbank of Russia PJSC ADR | | | 16,299,429 | |
| | 267,322 | | | Svenska Handelsbanken AB Class A | | | 3,550,430 | |
| | 344,344 | | | Wells Fargo & Co. | | | 18,718,540 | |
| | | | | | | | |
| | | | | | | 416,311,053 | |
| | | | | | | | |
| | | | Capital Goods - 5.2% | |
| | 87,888 | | | 3M Co. | | | 13,239,448 | |
| | 1,047,131 | | | AerCap Holdings N.V.* | | | 45,194,174 | |
| | 138,174 | | | Airbus Group SE | | | 9,311,175 | |
| | 453,875 | | | Builders FirstSource, Inc.* | | | 5,028,935 | |
| | 282,956 | | | Capstone Turbine Corp.* | | | 396,138 | |
| | 67,705 | | | Caterpillar, Inc. | | | 4,601,232 | |
| | 50,104 | | | Danaher Corp. | | | 4,653,659 | |
| | 22,340 | | | DigitalGlobe, Inc.* | | | 349,844 | |
| | 484,793 | | | Eaton Corp. plc | | | 25,228,628 | |
| | 126,374 | | | Fastenal Co. | | | 5,158,587 | |
| | 93,602 | | | Fortune Brands Home & Security, Inc. | | | 5,194,911 | |
| | 134,615 | | | Generac Holdings, Inc.* | | | 4,007,489 | |
| | 78,283 | | | General Electric Co. | | | 2,438,515 | |
| | 350,600 | | | HF Global, Inc.(1)(2) | | | 4,242,246 | |
| | 297,786 | | | Honeywell International, Inc. | | | 30,841,696 | |
| | 7,055 | | | KLX, Inc.* | | | 217,223 | |
| | 73,334 | | | Lockheed Martin Corp. | | | 15,924,478 | |
| | 37,123 | | | Middleby Corp.* | | | 4,004,458 | |
| | 523,786 | | | Owens Corning | | | 24,633,656 | |
| | 336,735 | | | Raytheon Co. | | | 41,933,610 | |
| | 87,811 | | | Safran S.A. | | | 6,032,856 | |
| | 548,800 | | | Sanwa Holdings Corp. | | | 4,340,461 | |
| | 137,351 | | | Schneider Electric SE | | | 7,802,076 | |
| | 53,567 | | | Siemens AG | | | 5,182,383 | |
| | 34,301 | | | Sulzer AG | | | 3,224,073 | |
| | 54,760 | | | TransDigm Group, Inc.* | | | 12,509,922 | |
| | 377,707 | | | United Technologies Corp. | | | 36,286,311 | |
| | 75,241 | | | Wabco Holdings, Inc.* | | | 7,694,145 | |
| | 82,376 | | | WESCO International, Inc.* | | | 3,598,184 | |
| | | | | | | | |
| | | | | | | 333,270,513 | |
| | | | | | | | |
| | | | | | | | |
Shares or Principal Amount | | Market Value† | |
| COMMON STOCKS - 96.1% - (continued) | |
| | | | Commercial & Professional Services - 0.4% | |
| | 156,120 | | | Clean Harbors, Inc.* | | $ | 6,502,398 | |
| | 124,024 | | | Equifax, Inc. | | | 13,812,553 | |
| | 22,362 | | | FTI Consulting, Inc.* | | | 775,067 | |
| | 238,100 | | | TriNet Group, Inc.* | | | 4,607,235 | |
| | | | | | | | |
| | | | | | | 25,697,253 | |
| | | | | | | | |
| | | | Consumer Durables & Apparel - 2.5% | |
| | 269,150 | | | Asics Corp. | | | 5,584,188 | |
| | 240,611 | | | D.R. Horton, Inc. | | | 7,706,770 | |
| | 120,390 | | | Deckers Outdoor Corp.* | | | 5,682,408 | |
| | 138,831 | | | Electrolux AB Series B | | | 3,349,631 | |
| | 29,708,000 | | | Global Brands Group Holding Ltd.* | | | 5,625,770 | |
| | 271,892 | | | Harman International Industries, Inc. | | | 25,614,945 | |
| | 467,216 | | | Kate Spade & Co.* | | | 8,302,428 | |
| | 339,551 | | | Lennar Corp. Class A | | | 16,607,439 | |
| | 70,498 | | | Luxottica Group S.p.A. | | | 4,594,006 | |
| | 1,786,870 | | | PulteGroup, Inc. | | | 31,842,023 | |
| | 63,013 | | | Ralph Lauren Corp. | | | 7,024,689 | |
| | 1,330,300 | | | Sony Corp. | | | 32,694,501 | |
| | 216,767 | | | Vera Bradley, Inc.* | | | 3,416,248 | |
| | | | | | | | |
| | | | | | | 158,045,046 | |
| | | | | | | | |
| | | | Consumer Services - 3.2% | |
| | 283,203 | | | American Public Education, Inc.* | | | 5,270,408 | |
| | 17,704 | | | Chipotle Mexican Grill, Inc.* | | | 8,495,264 | |
| | 105,700 | | | Grand Canyon Education, Inc.* | | | 4,240,684 | |
| | 962,296 | | | Hilton Worldwide Holdings, Inc. | | | 20,593,135 | |
| | 58,276 | | | Jack in the Box, Inc. | | | 4,470,352 | |
| | 558,354 | | | Las Vegas Sands Corp. | | | 24,478,239 | |
| | 282,790 | | | LifeLock, Inc.* | | | 4,058,037 | |
| | 203,735 | | | McDonald’s Corp. | | | 24,069,253 | |
| | 675,400 | | | Norwegian Cruise Line Holdings Ltd.* | | | 39,578,440 | |
| | 48,840 | | | Panera Bread Co. Class A* | | | 9,513,055 | |
| | 220,073 | | | Planet Fitness, Inc. Class A* | | | 3,439,741 | |
| | 811,200 | | | Sands China Ltd. | | | 2,750,125 | |
| | 675,634 | | | Wyndham Worldwide Corp. | | | 49,084,810 | |
| | 24,814 | | | Wynn Resorts Ltd. | | | 1,716,881 | |
| | | | | | | | |
| | | | | | | 201,758,424 | |
| | | | | | | | |
| | | | Diversified Financials - 4.7% | |
| | 278,320 | | | American Express Co. | | | 19,357,156 | |
| | 22,070 | | | Ameriprise Financial, Inc. | | | 2,348,689 | |
| | 171,674 | | | Banca Generali S.p.A. | | | 5,400,175 | |
| | 125,453 | | | BlackRock, Inc. | | | 42,719,256 | |
| | 1,282,300 | | | Blackstone Group L.P. | | | 37,494,452 | |
| | 1,420,920 | | | Henderson Group plc | | | 6,458,106 | |
| | 43,641 | | | Intercontinental Exchange, Inc. | | | 11,183,443 | |
| | 61,068 | | | Julius Baer Group Ltd.* | | | 2,954,296 | |
| | 335,050 | | | LendingClub Corp. PIPE* | | | 3,702,303 | |
| | 299,734 | | | Markit, Ltd.* | | | 9,042,975 | |
| | 337,900 | | | McGraw Hill Financial, Inc. | | | 33,310,182 | |
| | 488,022 | | | MSCI, Inc. | | | 35,201,027 | |
| | 144,790 | | | Northern Trust Corp. | | | 10,437,911 | |
| | 1,055,099 | | | OneMain Holdings Inc.* | | | 43,828,812 | |
| | 214,150 | | | PRA Group, Inc.* | | | 7,428,864 | |
| | 261,960 | | | Raymond James Financial, Inc. | | | 15,185,821 | |
| | 242,340 | | | Santander Consumer USA Holdings, Inc.* | | | 3,841,089 | |
| | 74,700 | | | Solar Cayman Ltd.*(1)(2) | | | 16,135 | |
| | 5,060 | | | Synchrony Financial* | | | 153,875 | |
| | 118,638 | | | Waddell & Reed Financial, Inc. Class A | | | 3,400,165 | |
| | 193,500 | | | WisdomTree Investments, Inc. | | | 3,034,080 | |
| | | | | | | | |
| | | | | | | 296,498,812 | |
| | | | | | | | |
The accompanying notes are an integral part of these financial statements.
|
| Hartford Capital Appreciation HLS Fund |
Schedule of Investments – (continued)
December 31, 2015
| | | | | | | | |
Shares or Principal Amount | | Market Value† | |
| COMMON STOCKS - 96.1% - (continued) | |
| | | | Energy - 3.8% | |
| | 181,839 | | | Anadarko Petroleum Corp. | | $ | 8,833,739 | |
| | 318,618 | | | Atwood Oceanics, Inc. | | | 3,259,462 | |
| | 362,598 | | | Canadian Natural Resources Ltd. | | | 7,915,514 | |
| | 243,803 | | | Chevron Corp. | | | 21,932,518 | |
| | 1,984,165 | | | Cobalt International Energy, Inc.* | | | 10,714,491 | |
| | 134,050 | | | Continental Resources, Inc.* | | | 3,080,469 | |
| | 117,631 | | | Diamondback Energy, Inc.* | | | 7,869,514 | |
| | 46,160 | | | Energen Corp. | | | 1,892,098 | |
| | 373,000 | | | Ensco plc Class A | | | 5,740,470 | |
| | 56,619 | | | EOG Resources, Inc. | | | 4,008,059 | |
| | 193,780 | | | Golar LNG Ltd. | | | 3,059,786 | |
| | 311,176 | | | Halliburton Co. | | | 10,592,431 | |
| | 98,302 | | | Helmerich & Payne, Inc. | | | 5,264,072 | |
| | 124,591 | | | HollyFrontier Corp. | | | 4,969,935 | |
| | 814,938 | | | Imperial Oil Ltd. | | | 26,501,784 | |
| | 3,296,103 | | | Karoon Gas Australia Ltd.* | | | 4,212,001 | |
| | 612,223 | | | Laredo Petroleum, Inc.* | | | 4,891,662 | |
| | 539,789 | | | Marathon Oil Corp. | | | 6,795,944 | |
| | 456,332 | | | McDermott International, Inc.* | | | 1,528,712 | |
| | 101,260 | | | National Oilwell Varco, Inc. | | | 3,391,197 | |
| | 69,240 | | | Newfield Exploration Co.* | | | 2,254,454 | |
| | 199,730 | | | Occidental Petroleum Corp. | | | 13,503,745 | |
| | 272,438 | | | Pioneer Natural Resources Co. | | | 34,158,276 | |
| | 263,319 | | | QEP Resources, Inc. | | | 3,528,475 | |
| | 271,221 | | | Rice Energy, Inc.* | | | 2,956,309 | |
| | 231,818 | | | Royal Dutch Shell plc Class B | | | 5,283,346 | |
| | 1,997,999 | | | Southwestern Energy Co.* | | | 14,205,773 | |
| | 552,696 | | | Suncor Energy, Inc. | | | 14,259,557 | |
| | 127,880 | | | Total S.A. | | | 5,733,035 | |
| | 1,960,125 | | | Trican Well Service Ltd.* | | | 906,613 | |
| | 99,300 | | | Whiting Petroleum Corp.* | | | 937,392 | |
| | | | | | | | |
| | | | | | | 244,180,833 | |
| | | | | | | | |
| | | | Food & Staples Retailing - 0.4% | |
| | 94,328 | | | Costco Wholesale Corp. | | | 15,233,972 | |
| | 210,405 | | | Seven & I Holdings Co., Ltd. | | | 9,633,300 | |
| | | | | | | | |
| | | | | | | 24,867,272 | |
| | | | | | | | |
| | | | Food, Beverage & Tobacco - 3.8% | |
| | 763,925 | | | British American Tobacco plc | | | 42,423,803 | |
| | 1,145,545 | | | Coca-Cola Co. | | | 49,212,613 | |
| | 555,510 | | | ConAgra Foods, Inc. | | | 23,420,302 | |
| | 659,601 | | | Freshpet, Inc.* | | | 5,600,013 | |
| | 276,600 | | | Molson Coors Brewing Co. Class B | | | 25,978,272 | |
| | 1,458,992 | | | Mondelez International, Inc. Class A | | | 65,421,201 | |
| | 192,189 | | | Monster Beverage Corp.* | | | 28,628,473 | |
| | | | | | | | |
| | | | | | | 240,684,677 | |
| | | | | | | | |
| | | | Health Care Equipment & Services - 4.5% | |
| | 284,248 | | | Becton Dickinson and Co. | | | 43,799,774 | |
| | 297,392 | | | Cardinal Health, Inc. | | | 26,548,184 | |
| | 10,082,792 | | | CareView Communications, Inc.* | | | 2,903,844 | |
| | 117,510 | | | Cerner Corp.* | | | 7,070,577 | |
| | 28,800 | | | Cigna Corp. | | | 4,214,304 | |
| | 2,831,842 | | | Corindus Vascular Robotics, Inc.* | | | 9,090,213 | |
| | 172,959 | | | Dentsply International, Inc. | | | 10,524,555 | |
| | 59,283 | | | DexCom, Inc.* | | | 4,855,278 | |
| | 223,260 | | | Edwards Lifesciences Corp.* | | | 17,633,075 | |
| | 321,068 | | | Envision Healthcare Holdings, Inc.* | | | 8,338,136 | |
| | 73,154 | | | Essilor International S.A. | | | 9,117,610 | |
| | 675,744 | | | HCA Holdings, Inc.* | | | 45,700,567 | |
| | 49,275 | | | HeartWare International, Inc.* | | | 2,483,460 | |
| | | | | | | | |
Shares or Principal Amount | | Market Value† | |
| COMMON STOCKS - 96.1% - (continued) | |
| | | | Health Care Equipment & Services - 4.5% - (continued) | |
| | 133,278 | | | Hologic, Inc.* | | $ | 5,156,526 | |
| | 430,705 | | | IMS Health Holdings, Inc.* | | | 10,970,056 | |
| | 14,029 | | | Intuitive Surgical, Inc.* | | | 7,662,079 | |
| | 57,000 | | | McKesson Corp. | | | 11,242,110 | |
| | 260,307 | | | Medtronic plc | | | 20,022,814 | |
| | 220,467 | | | UnitedHealth Group, Inc. | | | 25,935,738 | |
| | 31,182 | | | Universal Health Services, Inc. Class B | | | 3,725,937 | |
| | 175,410 | | | Veeva Systems, Inc. Class A* | | | 5,060,578 | |
| | 45,000 | | | Zimmer Biomet Holdings, Inc. | | | 4,616,550 | |
| | | | | | | | |
| | | | | | | 286,671,965 | |
| | | | | | | | |
| | | | Household & Personal Products - 1.0% | |
| | 459,395 | | | Avon Products, Inc. | | | 1,860,550 | |
| | 99,790 | | | Beiersdorf AG | | | 9,070,046 | |
| | 297,747 | | | Colgate-Palmolive Co. | | | 19,835,905 | |
| | 309,902 | | | Estee Lauder Cos., Inc. Class A | | | 27,289,970 | |
| | 36,961 | | | Procter & Gamble Co. | | | 2,935,073 | |
| | | | | | | | |
| | | | | | | 60,991,544 | |
| | | | | | | | |
| | | | Insurance - 5.2% | |
| | 832,838 | | | ACE Ltd. | | | 97,317,120 | |
| | 626,432 | | | American International Group, Inc. | | | 38,819,991 | |
| | 194,549 | | | Arthur J Gallagher & Co. | | | 7,964,836 | |
| | 313,463 | | | Assicurazioni Generali S.p.A. | | | 5,725,930 | |
| | 2,282,000 | | | China Life Insurance Co., Ltd. Class H | | | 7,325,669 | |
| | 335,752 | | | Delta Lloyd N.V. | | | 1,979,235 | |
| | 126,120 | | | Lincoln National Corp. | | | 6,338,791 | |
| | 15,056 | | | Markel Corp.* | | | 13,299,718 | |
| | 491,203 | | | Marsh & McLennan Cos., Inc. | | | 27,237,206 | |
| | 867,092 | | | MetLife, Inc. | | | 41,802,505 | |
| | 319,326 | | | Principal Financial Group, Inc. | | | 14,363,283 | |
| | 515,200 | | | Prudential Financial, Inc. | | | 41,942,432 | |
| | 170,556 | | | Torchmark Corp. | | | 9,748,981 | |
| | 229,313 | | | Unum Group | | | 7,633,830 | |
| | 42,679 | | | Zurich Insurance Group AG | | | 10,964,227 | |
| | | | | | | | |
| | | | | | | 332,463,754 | |
| | | | | | | | |
| | | | Materials - 3.7% | | | |
| | 48,500 | | | Agrium, Inc. | | | 4,332,990 | |
| | 45,775 | | | Akzo Nobel N.V. | | | 3,058,623 | |
| | 97,673 | | | Bemis Co., Inc. | | | 4,365,006 | |
| | 325,320 | | | BRAAS Monier Building Group S.A. | | | 9,388,293 | |
| | 90,603 | | | Cabot Corp. | | | 3,703,851 | |
| | 130,201 | | | Celanese Corp. Series A | | | 8,766,433 | |
| | 230,619 | | | Chemours Co. | | | 1,236,118 | |
| | 309,369 | | | Constellium N.V. Class A* | | | 2,382,141 | |
| | 459,900 | | | Dow Chemical Co. | | | 23,675,652 | |
| | 51,280 | | | E.I. DuPont de Nemours & Co. | | | 3,415,248 | |
| | 368,508 | | | Huntsman Corp. | | | 4,189,936 | |
| | 282,046 | | | International Paper Co. | | | 10,633,134 | |
| | 9,025,200 | | | Ivanhoe Mines Ltd. Class A* | | | 3,978,732 | |
| | 1,280,962 | | | Louisiana-Pacific Corp.* | | | 23,070,126 | |
| | 752,253 | | | Methanex Corp. | | | 24,842,145 | |
| | 472,933 | | | Norbord, Inc. | | | 9,211,205 | |
| | 84,120 | | | Nucor Corp. | | | 3,390,036 | |
| | 294,530 | | | Packaging Corp. of America | | | 18,570,117 | |
| | 267,143 | | | Platform Specialty Products Corp.* | | | 3,427,445 | |
| | 261,967 | | | Praxair, Inc. | | | 26,825,421 | |
| | 254,140 | | | Reliance Steel & Aluminum Co. | | | 14,717,247 | |
| | 333,328 | | | Wacker Chemie AG | | | 27,869,742 | |
| | | | | | | | |
| | | | | | | 235,049,641 | |
| | | | | | | | |
The accompanying notes are an integral part of these financial statements.
|
| Hartford Capital Appreciation HLS Fund |
Schedule of Investments – (continued)
December 31, 2015
| | | | | | | | |
Shares or Principal Amount | | Market Value† | |
| COMMON STOCKS - 96.1% - (continued) | |
| | | | Media - 1.6% | | | |
| | 144,430 | | | CBS Corp. Class B | | $ | 6,806,986 | |
| | 60,255 | | | DISH Network Corp. Class A* | | | 3,445,381 | |
| | 88,669 | | | IMAX Corp.* | | | 3,151,296 | |
| | 288,600 | | | Quebecor, Inc. Class B | | | 7,066,393 | |
| | 113,644 | | | SES S.A. | | | 3,149,040 | |
| | 2,649,620 | | | Sky plc | | | 43,434,540 | |
| | 36,657 | | | Tribune Media Co. Class A | | | 1,239,373 | |
| | 1,226,200 | | | Twenty-First Century Fox, Inc. Class A | | | 33,303,592 | |
| | | | | | | | |
| | | | | | | 101,596,601 | |
| | | | | | | | |
| | | | Pharmaceuticals, Biotechnology & Life Sciences - 13.0% | |
| | 112,770 | | | Alder Biopharmaceuticals, Inc.* | | | 3,724,793 | |
| | 216,530 | | | Alkermes plc* | | | 17,188,151 | |
| | 281,793 | | | Allergan plc* | | | 88,060,312 | |
| | 41,800 | | | Amgen, Inc. | | | 6,785,394 | |
| | 185,504 | | | AstraZeneca plc ADR | | | 6,297,861 | |
| | 316,386 | | | AstraZeneca plc | | | 21,371,024 | |
| | 46,160 | | | Biogen, Inc.* | | | 14,141,116 | |
| | 2,858,416 | | | Bristol-Myers Squibb Co. | | | 196,630,437 | |
| | 76,561 | | | Celgene Corp.* | | | 9,168,945 | |
| | 575,005 | | | Eisai Co., Ltd. | | | 38,037,009 | |
| | 171,914 | | | Gilead Sciences, Inc. | | | 17,395,978 | |
| | 159,210 | | | ICON plc* | | | 12,370,617 | |
| | 15,496 | | | Illumina, Inc.* | | | 2,974,380 | |
| | 119,293 | | | Incyte Corp.* | | | 12,937,326 | |
| | 33,362 | | | Ionis Pharmaceuticals, Inc.* | | | 2,066,109 | |
| | 362,439 | | | Johnson & Johnson | | | 37,229,734 | |
| | 2,999,874 | | | Merck & Co., Inc. | | | 158,453,345 | |
| | 24,868 | | | Mettler-Toledo International, Inc.* | | | 8,433,485 | |
| | 505,011 | | | Mylan N.V.* | | | 27,305,945 | |
| | 41,471 | | | Perrigo Co. plc | | | 6,000,854 | |
| | 183,532 | | | Portola Pharmaceuticals, Inc.* | | | 9,442,721 | |
| | 37,942 | | | Regeneron Pharmaceuticals, Inc.* | | | 20,597,573 | |
| | 94,823 | | | Roche Holding AG | | | 26,276,248 | |
| | 77,222 | | | TESARO, Inc.* | | | 4,040,255 | |
| | 4,468,975 | | | TherapeuticsMD, Inc.* | | | 46,343,271 | |
| | 124,472 | | | Vertex Pharmaceuticals, Inc.* | | | 15,662,312 | |
| | 323,300 | | | Zoetis, Inc. | | | 15,492,536 | |
| | | | | | | | |
| | | | | | | 824,427,731 | |
| | | | | | | | |
| | | | Real Estate - 1.6% | | | |
| | 205,639 | | | American Tower Corp. REIT | | | 19,936,701 | |
| | 44,576 | | | AvalonBay Communities, Inc. REIT | | | 8,207,779 | |
| | 302,970 | | | Castellum AB | | | 4,314,673 | |
| | 216,138 | | | CBRE Group, Inc. Class A* | | | 7,474,052 | |
| | 316,909 | | | Columbia Property Trust, Inc. REIT | | | 7,441,023 | |
| | 20,016 | | | Equinix, Inc. REIT | | | 6,052,838 | |
| | 222,384 | | | Host Hotels & Resorts, Inc. REIT | | | 3,411,370 | |
| | 54,319 | | | ICADE REIT | | | 3,645,888 | |
| | 281,646 | | | UNITE Group plc | | | 2,720,847 | |
| | 1,081,942 | | | Vonovia SE | | | 33,424,515 | |
| | 161,412 | | | Weyerhaeuser Co. REIT | | | 4,839,132 | |
| | | | | | | | |
| | | | | | | 101,468,818 | |
| | | | | | | | |
| | | | Retailing - 5.6% | |
| | 111,260 | | | Advance Auto Parts, Inc. | | | 16,745,743 | |
| | 8,451,700 | | | Allstar Co.*(1)(2) | | | 8,029,115 | |
| | 153,335 | | | Amazon.com, Inc.* | | | 103,637,593 | |
| | 189,343 | | | CarMax, Inc.* | | | 10,218,842 | |
| | 1,190,100 | | | Chico’s FAS, Inc. | | | 12,698,367 | |
| | 106,065 | | | Dollar Tree, Inc.* | | | 8,190,339 | |
| | 73,875 | | | DSW, Inc. Class A | | | 1,762,658 | |
| | | | | | | | |
Shares or Principal Amount | | Market Value† | |
| COMMON STOCKS - 96.1% - (continued) | |
| | | | Retailing - 5.6% - (continued) | |
| | 204,920 | | | Home Depot, Inc. | | $ | 27,100,670 | |
| | 17,385 | | | Honest Co.(1)(2) | | | 788,062 | |
| | 12,945 | | | HSN, Inc. | | | 655,923 | |
| | 106,120 | | | L Brands, Inc. | | | 10,168,418 | |
| | 257,512 | | | Lowe’s Cos., Inc. | | | 19,581,212 | |
| | 420,535 | | | Michaels Cos., Inc.* | | | 9,298,029 | |
| | 32,180 | | | Nordstrom, Inc. | | | 1,602,886 | |
| | 141,170 | | | Party City Holdco, Inc.* | | | 1,822,505 | |
| | 13,998 | | | Priceline Group, Inc.* | | | 17,846,750 | |
| | 307,102 | | | Signet Jewelers Ltd. | | | 37,985,446 | |
| | 470,344 | | | TJX Cos., Inc. | | | 33,352,093 | |
| | 280,504 | | | Tory Burch LLC*(1)(2) | | | 14,844,246 | |
| | 185,737 | | | TripAdvisor, Inc.* | | | 15,834,079 | |
| | 336,700 | | | Tuesday Morning Corp.* | | | 2,188,550 | |
| | 28,685 | | | Williams-Sonoma, Inc. | | | 1,675,491 | |
| | | | | | | | |
| | | | | | | 356,027,017 | |
| | | | | | | | |
| | | | Semiconductors & Semiconductor Equipment - 4.4% | |
| | 231,862 | | | Applied Materials, Inc. | | | 4,328,864 | |
| | 79,100 | | | Avago Technologies Ltd. | | | 11,481,365 | |
| | 369,005 | | | Cypress Semiconductor Corp. | | | 3,619,939 | |
| | 55,837 | | | First Solar, Inc.* | | | 3,684,684 | |
| | 14,486,235 | | | GCL-Poly Energy Holdings Ltd. | | | 2,153,861 | |
| | 2,660,466 | | | Intel Corp. | | | 91,653,054 | |
| | 327,186 | | | Maxim Integrated Products, Inc. | | | 12,433,068 | |
| | 189,613 | | | Micron Technology, Inc.* | | | 2,684,920 | |
| | 599,070 | | | NXP Semiconductors N.V.* | | | 50,471,647 | |
| | 105,716 | | | Silicon Motion Technology Corp. ADR | | | 3,315,254 | |
| | 210,021 | | | SK Hynix, Inc. | | | 5,425,459 | |
| | 99,531 | | | Skyworks Solutions, Inc. | | | 7,646,967 | |
| | 1,014,060 | | | Sumco Corp. | | | 7,650,573 | |
| | 449,572 | | | SunEdison Semiconductor Ltd.* | | | 3,524,644 | |
| | 744,150 | | | SunEdison, Inc.* | | | 3,787,724 | |
| | 1,871,838 | | | SunPower Corp.* | | | 56,173,858 | |
| | 104,098 | | | Synaptics, Inc.* | | | 8,363,233 | |
| | | | | | | | |
| | | | | | | 278,399,114 | |
| | | | | | | | |
| | | | Software & Services - 12.6% | |
| | 263,635 | | | Accenture plc Class A | | | 27,549,858 | |
| | 2,238,810 | | | Activision Blizzard, Inc. | | | 86,664,335 | |
| | 499,911 | | | Adobe Systems, Inc.* | | | 46,961,639 | |
| | 293,897 | | | Akamai Technologies, Inc.* | | | 15,467,799 | |
| | 455,752 | | | Alibaba Group Holding Ltd. ADR* | | | 37,038,965 | |
| | 15,022 | | | Alphabet, Inc. Class A* | | | 11,687,266 | |
| | 174,323 | | | Alphabet, Inc. Class C* | | | 132,290,238 | |
| | 191,736 | | | Automatic Data Processing, Inc. | | | 16,243,874 | |
| | 133,430 | | | Baidu, Inc. ADR* | | | 25,223,607 | |
| | 110,500 | | | Blackhawk Network Holdings, Inc.* | | | 4,885,205 | |
| | 111,800 | | | Cognizant Technology Solutions Corp. Class A* | | | 6,710,236 | |
| | 128,169 | | | CoStar Group, Inc.* | | | 26,491,251 | |
| | 184,967 | | | Dropbox, Inc. Class B(1)(2) | | | 2,811,498 | |
| | 315,165 | | | Enernoc, Inc.* | | | 1,213,385 | |
| | 131,875 | | | Envestnet, Inc.* | | | 3,936,469 | |
| | 409,300 | | | Everyday Health, Inc.* | | | 2,463,986 | |
| | 843,401 | | | Facebook, Inc. Class A* | | | 88,270,349 | |
| | 620,459 | | | Genpact Ltd.* | | | 15,499,066 | |
| | 293,862 | | | Gogo, Inc.* | | | 5,230,744 | |
| | 1,975,570 | | | Microsoft Corp. | | | 109,604,624 | |
| | 55,913 | | | Mobileye N.V.* | | | 2,364,002 | |
| | 307,274 | | | Monster Worldwide, Inc.* | | | 1,760,680 | |
| | 143,300 | | | Nintendo Co., Ltd. | | | 19,705,190 | |
| | 704,779 | | | Paysafe Group plc* | | | 3,835,008 | |
The accompanying notes are an integral part of these financial statements.
|
| Hartford Capital Appreciation HLS Fund |
Schedule of Investments – (continued)
December 31, 2015
| | | | | | | | |
Shares or Principal Amount | | Market Value† | |
| COMMON STOCKS - 96.1% - (continued) | |
| | | | Software & Services - 12.6% - (continued) | |
| | 1,022,043 | | | Quotient Technology, Inc.* | | $ | 6,970,333 | |
| | 156,943 | | | Salesforce.com, Inc.* | | | 12,304,331 | |
| | 215,145 | | | ServiceNow, Inc.* | | | 18,622,951 | |
| | 11,515 | | | Shutterstock, Inc.* | | | 372,395 | |
| | 23,400 | | | Tableau Software, Inc. Class A* | | | 2,204,748 | |
| | 125,462 | | | Tangoe, Inc.* | | | 1,052,626 | |
| | 16,751 | | | Tyler Technologies, Inc.* | | | 2,920,034 | |
| | 142,784 | | | Verint Systems, Inc.* | | | 5,791,319 | |
| | 160,433 | | | VeriSign, Inc.* | | | 14,015,427 | |
| | 684,733 | | | Web.com Group, Inc.* | | | 13,701,507 | |
| | 202,034 | | | Workday, Inc. Class A* | | | 16,098,069 | |
| | 193,640 | | | Yandex N.V. Class A* | | | 3,044,021 | |
| | 39,400 | | | Zendesk, Inc.* | | | 1,041,736 | |
| | 46,002 | | | Zillow Group, Inc. Class A* | | | 1,197,892 | |
| | 323,288 | | | Zillow Group, Inc. Class C* | | | 7,590,802 | |
| | | | | | | | |
| | | | | | | 800,837,465 | |
| | | | | | | | |
| | | | Technology Hardware & Equipment - 3.1% | |
| | 233,584 | | | Amphenol Corp. Class A | | | 12,200,092 | |
| | 200,484 | | | Apple, Inc. | | | 21,102,946 | |
| | 87,897 | | | Arista Networks, Inc.* | | | 6,841,903 | |
| | 388,174 | | | ARRIS Group, Inc.* | | | 11,866,479 | |
| | 274,018 | | | Belden, Inc. | | | 13,065,178 | |
| | 416,244 | | | CDW Corp. of Delaware | | | 17,498,898 | |
| | 2,912,763 | | | Cisco Systems, Inc. | | | 79,096,079 | |
| | 25,457 | | | Palo Alto Networks, Inc.* | | | 4,483,996 | |
| | 446,121 | | | ParkerVision, Inc. PIPE(1)(2) | | | 93,812 | |
| | 4,920,773 | | | ParkerVision, Inc.* | | | 1,144,080 | |
| | 118,300 | | | Pure Storage, Inc. Class A* | | | 1,841,931 | |
| | 466,941 | | | Pure Storage, Inc. Class B*(1)(2) | | | 6,886,563 | |
| | 143,391 | | | Qualcomm, Inc. | | | 7,167,399 | |
| | 5,789 | | | Samsung Electronics Co., Ltd. | | | 6,174,442 | |
| | 65,326 | | | Stratasys Ltd.* | | | 1,533,854 | |
| | 104,794 | | | Western Digital Corp. | | | 6,292,880 | |
| | | | | | | | |
| | | | | | | 197,290,532 | |
| | | | | | | | |
| | | | Telecommunication Services - 1.1% | |
| | 385,700 | | | Nippon Telegraph & Telephone Corp. | | | 15,350,132 | |
| | 403,100 | | | NTT DoCoMo, Inc. | | | 8,268,220 | |
| | 46,730 | | | SoftBank Group Corp. | | | 2,358,482 | |
| | 108,195 | | | T-Mobile US, Inc.* | | | 4,232,588 | |
| | 358,016 | | | Telenor ASA | | | 5,967,611 | |
| | 563,339 | | | Verizon Communications, Inc. | | | 26,037,529 | |
| | 4,078,528 | | | Zegona Communications plc* | | | 8,147,027 | |
| | | | | | | | |
| | | | | | | 70,361,589 | |
| | | | | | | | |
| | | | Transportation - 4.6% | |
| | 111,420 | | | Alaska Air Group, Inc. | | | 8,970,424 | |
| | 139,560 | | | American Airlines Group, Inc. | | | 5,910,366 | |
| | 339,400 | | | Canadian National Railway Co. | | | 18,972,747 | |
| | 277,495 | | | CSX Corp. | | | 7,200,995 | |
| | 138,465 | | | Deutsche Post AG | | | 3,871,174 | |
| | 224,500 | | | FedEx Corp. | | | 33,448,255 | |
| | 133,415 | | | Genesee & Wyoming, Inc. Class A* | | | 7,163,052 | |
| | 2,547,800 | | | Hertz Global Holdings, Inc.* | | | 36,255,194 | |
| | 6,496,000 | | | Jiangsu Expressway Co., Ltd. Class H | | | 8,718,350 | |
| | 48,209 | | | Kansas City Southern | | | 3,599,766 | |
| | 207,483 | | | Landstar System, Inc. | | | 12,168,878 | |
| | 59,126 | | | Macquarie Infrastructure Corp. | | | 4,292,548 | |
| | 53,510 | | | Norfolk Southern Corp. | | | 4,526,411 | |
| | 48,285 | | | Scorpio Bulkers, Inc.* | | | 477,534 | |
| | 1,237,616 | | | Swift Transportation Co.* | | | 17,103,853 | |
| | | | | | | | |
Shares or Principal Amount | | Market Value† | |
| COMMON STOCKS - 96.1% - (continued) | |
| | | | Transportation - 4.6% - (continued) | |
| | 332,938 | | | Union Pacific Corp. | | $ | 26,035,752 | |
| | 809,800 | | | United Continental Holdings, Inc.* | | | 46,401,540 | |
| | 384,862 | | | United Parcel Service, Inc. Class B | | | 37,035,270 | |
| | 411,409 | | | XPO Logistics, Inc.* | | | 11,210,895 | |
| | | | | | | | |
| | | | | | | 293,363,004 | |
| | | | | | | | |
| | | | Utilities - 1.8% | |
| | 1,775,868 | | | Centrica plc | | | 5,702,264 | |
| | 22,721,000 | | | China Longyuan Power Group Corp. Ltd. Class H | | | 17,085,715 | |
| | 258,669 | | | Dominion Resources, Inc. | | | 17,496,371 | |
| | 75,596 | | | Edison International | | | 4,476,039 | |
| | 500,760 | | | Exelon Corp. | | | 13,906,105 | |
| | 264,970 | | | Gas Natural SDG S.A. | | | 5,403,331 | |
| | 303,074 | | | National Grid plc | | | 4,179,867 | |
| | 276,334 | | | OGE Energy Corp. | | | 7,264,821 | |
| | 98,855 | | | Pattern Energy Group, Inc. | | | 2,067,058 | |
| | 302,101 | | | PG&E Corp. | | | 16,068,752 | |
| | 848,000 | | | Power Assets Holdings Ltd. | | | 7,774,080 | |
| | 385,662 | | | Xcel Energy, Inc. | | | 13,849,123 | |
| | | | | | | | |
| | | | | | | 115,273,526 | |
| | | | | | | | |
| | |
| | | | Total Common Stocks
(cost $5,944,454,354) | | $ | 6,110,070,822 | |
| | | | | | | | |
|
| EXCHANGE TRADED FUNDS - 0.1% | |
| | | | Other Investment Pools & Funds - 0.1% | |
| | 19,667 | | | SPDR S&P 500 ETF Trust | | $ | 4,009,905 | |
| | | | | | | | |
| | |
| | | | Total Exchange Traded Funds
(cost $3,984,965) | | $ | 4,009,905 | |
| | | | | | | | |
|
| PREFERRED STOCKS - 1.0% | |
| | | | Consumer Durables & Apparel - 0.0% | |
| | 127,917 | | | One Kings Lane, Inc.(1)(2) | | $ | 1,664,200 | |
| | | | | | | | |
| | | | Consumer Services - 0.1% | |
| | 16,619 | | | Airbnb, Inc. Series E(1)(2) | | | 1,664,060 | |
| | 161,097 | | | DraftKings, Inc. Series D(1)(2) | | | 504,234 | |
| | 139,659 | | | DraftKings, Inc. Series D-1(1)(2) | | | 565,619 | |
| | | | | | | | |
| | | | | | | 2,733,913 | |
| | | | | | | | |
| | | | Diversified Financials - 0.1% | |
| | 284,119 | | | Social Finance, Inc.(1)(2) | | | 4,034,112 | |
| | | | | | | | |
| | | | Media - 0.0% | |
| | 29,800 | | | Harvey Weinstein Co. Holdings(1)(2) | | | — | |
| | | | | | | | |
| | | | Software & Services - 0.8% | |
| | 56,702 | | | Cloudera, Inc.(1)(2) | | | 1,456,674 | |
| | 29,504 | | | Magic Leap Inc. Series C(1)(2) | | | 679,565 | |
| | 50,200 | | | Nanigans, Inc.(1)(2) | | | 493,298 | |
| | 158,682 | | | Pinterest, Inc. Series G(1)(2) | | | 5,126,367 | |
| | 20,891 | | | Sharecare(1)(2) | | | 4,698,031 | |
| | 815,160 | | | Uber Technologies, Inc.(1)(2) | | | 39,757,169 | |
| | 293,655 | | | Zuora, Inc. Series F(1)(2) | | | 1,215,732 | |
| | | | | | | | |
| | | | | | | 53,426,836 | |
| | | | | | | | |
| | | | Telecommunication Services - 0.0% | |
| | 3,739 | | | DocuSign, Inc. Series B(1)(2) | | | 71,340 | |
| | 1,120 | | | DocuSign, Inc. Series B-1(1)(2) | | | 21,370 | |
| | 2,687 | | | DocuSign, Inc. Series D(1)(2) | | | 51,268 | |
The accompanying notes are an integral part of these financial statements.
|
| Hartford Capital Appreciation HLS Fund |
Schedule of Investments – (continued)
December 31, 2015
| | | | | | | | |
Shares or Principal Amount | | Market Value† | |
| PREFERRED STOCKS - 1.0% - (continued) | |
| | | | Telecommunication Services - 0.0% - (continued) | |
| | 69,493 | | | DocuSign, Inc. Series E(1)(2) | | $ | 1,325,926 | |
| | 10,835 | | | DocuSign, Inc. Series F(1)(2) | | | 206,732 | |
| | | | | | | | |
| | | | | | | 1,676,636 | |
| | | | | | | | |
| | |
| | | | Total Preferred Stocks
(cost $65,839,866) | | $ | 63,535,697 | |
| | | | | | | | |
|
| CONVERTIBLE PREFERRED STOCKS - 0.0% | |
| | | | Retailing - 0.0% | |
| | 40,566 | | | Honest Co. Series C (1)(2) | | $ | 1,838,857 | |
| | | | | | | | |
| | |
| | | | Total Convertible Preferred Stocks
(cost $1,097,606) | | $ | 1,838,857 | |
| | | | | | | | |
|
| RIGHTS - 0.0% | |
| | | | Semiconductors & Semiconductor Equipment - 0.0% | |
| | 2,897,247 | | | GCL-Poly Energy Holdings Ltd. Expires 1/20/16* | | $ | 14,953 | |
| | | | | | | | |
| | |
| | | | Total Rights
(cost $ —) | | $ | 14,953 | |
| | | | | | | | |
| | |
| | | | Total Long-Term Investments
(cost $6,015,376,791) | | $ | 6,179,470,234 | |
| | | | | | | | |
|
| SHORT-TERM INVESTMENTS - 3.2% | |
| | | | Other Investment Pools & Funds - 3.2% | | | |
| | 202,444,709 | | | BlackRock Liquidity Funds TempFund Portfolio | | $ | 202,444,709 | |
| | | | | | | | |
| | |
| | | | Total Short-Term Investments
(cost $202,444,709) | | $ | 202,444,709 | |
| | | | | | | | |
| | | | | | | | | | |
| | | |
| | Total Investments
(cost $6,217,821,500)^ | | | 100.4 | % | | $ | 6,381,914,943 | |
| | Other Assets and Liabilities | | | (0.4 | )% | | | (22,883,836 | ) |
| | | | | | | | | | |
| | Total Net Assets | | | 100.0 | % | | $ | 6,359,031,107 | |
| | | | | | | | | | |
The accompanying notes are an integral part of these financial statements.
|
| Hartford Capital Appreciation HLS Fund |
Schedule of Investments – (continued)
December 31, 2015
| Note: | Percentage of investments as shown is the ratio of the total market value to total net assets. |
| | Prices of foreign equities that are principally traded on certain foreign markets may be adjusted daily pursuant to a fair value pricing service approved by the Board of Directors in order to reflect an adjustment for factors occurring after the close of certain foreign markets but before the close of the New York Stock Exchange. |
| | Equity industry classifications used in this report are the Global Industry Classification Standard, which was developed by and is the exclusive property and service mark of MSCI, Inc. and Standard & Poor’s. |
| | For Fund compliance purposes, the Fund may not use the same classification system shown in this report as these classifications are used for financial reporting purposes. |
| ^ | At December 31, 2015, the cost of securities for federal income tax purposes was $6,302,089,695 and the aggregate gross unrealized appreciation and depreciation based on that cost were: |
| | | | |
Unrealized Appreciation | | $ | 609,646,770 | |
Unrealized Depreciation | | | (529,821,522 | ) |
| | | | |
Net Unrealized Appreciation | | $ | 79,825,248 | |
| | | | |
| (1) | These securities are valued in good faith at fair value as determined under policies and procedures established by and under the supervision of the Board of Directors. At December 31, 2015, the aggregate fair value of these securities was $103,086,231, which represents 1.6% of total net assets. This amount excludes securities that are principally traded in certain foreign markets and whose prices are adjusted pursuant to a third party pricing service methodology approved by the Board of Directors. |
| (2) | The following securities are considered illiquid. Illiquid securities are often purchased in private placement transactions, are often not registered under the Securities Act of 1933, as amended, and may have contractual restrictions on resale. A security may also be considered illiquid if the security lacks a readily available market or if its valuation has not changed for a certain period of time. |
| | | | | | | | | | |
Period
Acquired | | Shares/Par | | | Security | | Cost | |
| 06/2015 | | | 16,619 | | | Airbnb, Inc. Series E Preferred | | $ | 1,547,136 | |
| 08/2011 | | | 8,451,700 | | | Allstar Co. | | | 3,676,649 | |
| 02/2014 | | | 56,702 | | | Cloudera, Inc. Preferred | | | 825,581 | |
| 02/2014 | | | 3,739 | | | DocuSign, Inc. Series B Preferred | | | 49,102 | |
| 02/2014 | | | 1,120 | | | DocuSign, Inc. Series B-1 Preferred | | | 14,708 | |
| 02/2014 | | | 2,687 | | | DocuSign, Inc. Series D Preferred | | | 35,287 | |
| 02/2014 | | | 69,493 | | | DocuSign, Inc. Series E Preferred | | | 912,610 | |
| 04/2015 | | | 10,835 | | | DocuSign, Inc. Series F Preferred | | | 206,874 | |
| 07/2015 | | | 161,097 | | | DraftKings, Inc. Series D Preferred | | | 867,652 | |
| 08/2015 | | | 139,659 | | | DraftKings, Inc. Series D-1 Preferred | | | 1,070,543 | |
| 05/2012 | | | 184,967 | | | Dropbox, Inc. Class B | | | 1,674,267 | |
| 06/2015 | | | 350,600 | | | HF Global, Inc. | | | 4,713,607 | |
| 10/2005 | | | 29,800 | | | Harvey Weinstein Co. Holdings Preferred | | | 27,950,957 | |
| 08/2014 | | | 17,385 | | | Honest Co. | | | 470,391 | |
| 08/2014 | | | 40,566 | | | Honest Co. Series C Convertible Preferred | | | 1,097,606 | |
| 12/2015 | | | 29,504 | | | Magic Leap Inc. Series C Preferred | | | 679,566 | |
| 03/2015 | | | 50,200 | | | Nanigans, Inc. Preferred | | | 548,109 | |
| 01/2014 | | | 127,917 | | | One Kings Lane, Inc. Preferred | | | 1,972,096 | |
| 12/2015 | | | 446,121 | | | ParkerVision, Inc. PIPE | | | 84,763 | |
| 03/2015 | | | 158,682 | | | Pinterest, Inc. Series G Preferred | | | 5,695,963 | |
| 10/2015 | | | 466,941 | | | Pure Storage, Inc. Class B | | | 7,343,067 | |
| 03/2015 | | | 20,891 | | | Sharecare Preferred | | | 5,220,034 | |
| 09/2015 | | | 284,119 | | | Social Finance, Inc. Preferred | | | 4,482,347 | |
| 03/2007 | | | 74,700 | | | Solar Cayman Ltd. | | | 21,894 | |
| 11/2013 | | | 280,504 | | | Tory Burch LLC | | | 21,984,886 | |
| 06/2014 | | | 815,160 | | | Uber Technologies, Inc. Preferred | | | 12,645,618 | |
| 01/2015 | | | 293,655 | | | Zuora, Inc. Series F Preferred | | | 1,115,683 | |
| | | | | | | | | | |
| | | | | | | | $ | 106,906,996 | |
| | | | | | | | | | |
| | At December 31, 2015, the aggregate value of these securities was $103,086,231, which represents 1.6% of total net assets. |
The accompanying notes are an integral part of these financial statements.
|
| Hartford Capital Appreciation HLS Fund |
Schedule of Investments – (continued)
December 31, 2015
| | | | | | | | | | | | | | | | | | | | | | | | |
| Foreign Currency Contracts Outstanding at December 31, 2015 | |
Currency | | Buy/Sell | | | Delivery
Date | | | Counterparty | | | Contract
Amount | | | Market
Value† | | | Unrealized
Appreciation/
(Depreciation) | |
EUR | | | Sell | | | | 03/16/16 | | | | CBK | | | $ | 47,706,749 | | | $ | 47,271,310 | | | $ | 435,439 | |
EUR | | | Sell | | | | 03/16/16 | | | | GSC | | | | 11,965,669 | | | | 11,865,739 | | | | 99,930 | |
EUR | | | Sell | | | | 03/16/16 | | | | HSBC | | | | 3,140,424 | | | | 3,134,942 | | | | 5,482 | |
GBP | | | Sell | | | | 03/16/16 | | | | CBK | | | | 8,321,846 | | | | 8,079,672 | | | | 242,174 | |
| | | | | | | | | | | | | | | | | | | | | | | | |
Total | | | $ | 783,025 | |
| | | | | | | | | | | | | | | | | | | | | | | | |
| † | See Significant Accounting Policies of accompanying Notes to Financial Statements regarding valuation of investments. |
| | |
| GLOSSARY: (abbreviations used in preceding Schedule of Investments) |
|
| Counterparty Abbreviations: |
CBK | | Citibank NA |
GSC | | Goldman Sachs & Co. |
HSBC | | HSBC Bank USA |
|
| Currency Abbreviations: |
EUR | | Euro |
GBP | | British Pound |
|
| Other Abbreviations: |
ADR | | American Depositary Receipt |
ETF | | Exchange Traded Fund |
PIPE | | Private Investment in Public Equity |
PJSC | | Private Joint Stock Company |
REIT | | Real Estate Investment Trust |
SPDR | | Standard & Poor’s Depositary Receipt |
The accompanying notes are an integral part of these financial statements.
|
| Hartford Capital Appreciation HLS Fund |
Schedule of Investments – (continued)
December 31, 2015
Fair Valuation Summary
The following is a summary of the fair valuations according to the inputs used as of December 31, 2015 in valuing the Fund’s investments.
| | | | | | | | | | | | | | | | |
| | | Total | | | Level 1(1) | | | Level 2(1) | | | Level 3 | |
Assets | |
Common Stocks | | | | | | | | | | | | | | | | |
Automobiles & Components | | $ | 114,534,638 | | | $ | 90,460,397 | | | $ | 24,074,241 | | | $ | — | |
Banks | | | 416,311,053 | | | | 371,062,144 | | | | 45,248,909 | | | | — | |
Capital Goods | | | 333,270,513 | | | | 293,135,243 | | | | 35,893,024 | | | | 4,242,246 | |
Commercial & Professional Services | | | 25,697,253 | | | | 25,697,253 | | | | — | | | | — | |
Consumer Durables & Apparel | | | 158,045,046 | | | | 106,196,950 | | | | 51,848,096 | | | | — | |
Consumer Services | | | 201,758,424 | | | | 199,008,299 | | | | 2,750,125 | | | | — | |
Diversified Financials | | | 296,498,812 | | | | 281,670,100 | | | | 14,812,577 | | | | 16,135 | |
Energy | | | 244,180,833 | | | | 228,952,451 | | | | 15,228,382 | | | | — | |
Food & Staples Retailing | | | 24,867,272 | | | | 15,233,972 | | | | 9,633,300 | | | | — | |
Food, Beverage & Tobacco | | | 240,684,677 | | | | 198,260,874 | | | | 42,423,803 | | | | — | |
Health Care Equipment & Services | | | 286,671,965 | | | | 277,554,355 | | | | 9,117,610 | | | | — | |
Household & Personal Products | | | 60,991,544 | | | | 51,921,498 | | | | 9,070,046 | | | | — | |
Insurance | | | 332,463,754 | | | | 306,468,693 | | | | 25,995,061 | | | | — | |
Materials | | | 235,049,641 | | | | 204,121,276 | | | | 30,928,365 | | | | — | |
Media | | | 101,596,601 | | | | 55,013,021 | | | | 46,583,580 | | | | — | |
Pharmaceuticals, Biotechnology & Life Sciences | | | 824,427,731 | | | | 738,743,450 | | | | 85,684,281 | | | | — | |
Real Estate | | | 101,468,818 | | | | 57,362,895 | | | | 44,105,923 | | | | — | |
Retailing | | | 356,027,017 | | | | 332,365,594 | | | | — | | | | 23,661,423 | |
Semiconductors & Semiconductor Equipment | | | 278,399,114 | | | | 263,169,221 | | | | 15,229,893 | | | | — | |
Software & Services | | | 800,837,465 | | | | 774,485,769 | | | | 23,540,198 | | | | 2,811,498 | |
Technology Hardware & Equipment | | | 197,290,532 | | | | 184,135,715 | | | | 6,174,442 | | | | 6,980,375 | |
Telecommunication Services | | | 70,361,589 | | | | 38,417,144 | | | | 31,944,445 | | | | — | |
Transportation | | | 293,363,004 | | | | 280,773,480 | | | | 12,589,524 | | | | — | |
Utilities | | | 115,273,526 | | | | 75,128,269 | | | | 40,145,257 | | | | — | |
Exchange Traded Funds | | | 4,009,905 | | | | 4,009,905 | | | | — | | | | — | |
Preferred Stocks | | | 63,535,697 | | | | — | | | | — | | | | 63,535,697 | |
Convertible Preferred Stocks | | | 1,838,857 | | | | — | | | | — | | | | 1,838,857 | |
Rights | | | 14,953 | | | | — | | | | 14,953 | | | | — | |
Short-Term Investments | | | 202,444,709 | | | | 202,444,709 | | | | — | | | | — | |
Foreign Currency Contracts(2) | | | 783,025 | | | | — | | | | 783,025 | | | | — | |
| | | | | | | | | | | | | | | | |
Total | | $ | 6,382,697,968 | | | $ | 5,655,792,677 | | | $ | 623,819,060 | | | $ | 103,086,231 | |
| | | | | | | | | | | | | | | | |
| (1) | For the year ended December 31, 2015, there were no transfers between Level 1 and Level 2. |
| (2) | Derivative instruments (excluding purchased and written options, if applicable) are valued at the unrealized appreciation/depreciation on the investments. |
The accompanying notes are an integral part of these financial statements.
|
| Hartford Capital Appreciation HLS Fund |
Schedule of Investments – (continued)
December 31, 2015
The following is a rollforward of the Fund’s investments that were valued using unobservable inputs (Level 3) for the year ended December 31, 2015:
| | | | | | | | | | | | | | | | |
| | | Common
Stocks | | | Preferred
Stocks | | | Convertible
Preferred Stocks | | | Total | |
Beginning balance | | $ | 57,844,998 | | | $ | 35,884,435 | | | $ | 1,107,452 | | | $ | 94,836,885 | |
Purchases | | | 12,141,437 | | | | 21,433,905 | | | | | | | | 33,575,342 | |
Sales | | | (13,753,601 | ) | | | (7,343,067 | ) | | | | | | | (21,096,668 | ) |
Accrued discounts/(premiums) | | | — | | | | — | | | | — | | | | — | |
Total realized gain/(loss) | | | 3,544,578 | | | | — | | | | — | | | | 3,544,578 | |
Net change in unrealized appreciation/depreciation | | | (22,065,735 | ) | | | 13,560,424 | | | | 731,405 | | | | (7,773,906 | ) |
Transfers into Level 3(1) | | | — | | | | — | | | | — | | | | — | |
Transfers out of Level 3(1) | | | — | | | | — | | | | — | | | | — | |
| | | | | | | | | | | | | | | | |
Ending balance | | $ | 37,711,677 | | | $ | 63,535,697 | | | $ | 1,838,857 | | | $ | 103,086,231 | |
| | | | | | | | | | | | | | | | |
The change in net unrealized appreciation/depreciation relating to the Level 3 investments held at December 31, 2015 was $11,656,034.
| (1) | Investments are transferred into and out of Level 3 for a variety of reasons including, but not limited to: |
| | a) | Investments where trading has been halted (transfer into Level 3) or investments where trading has resumed (transfer out of Level 3). |
| | b) | Broker quoted investments (transfer into Level 3) or quoted prices in active markets (transfer out of Level 3). |
| | c) | Investments that have certain restrictions on trading (transfer into Level 3) or investments where trading restrictions have expired (transfer out of Level 3). |
| Note: | For purposes of reporting transfers between different hierarchy levels, both transfers in and out of each level, as applicable, are shown as if they occurred at the beginning of the period. |
The accompanying notes are an integral part of these financial statements.
|
| Hartford Disciplined Equity HLS Fund |
Schedule of Investments
December 31, 2015
| | | | | | | | |
Shares or Principal Amount | | Market Value† | |
| COMMON STOCKS - 97.0% | |
| | | | Banks - 9.0% | |
| | 781,320 | | | Bank of America Corp. | | $ | 13,149,616 | |
| | 222,850 | | | Citigroup, Inc. | | | 11,532,487 | |
| | 570,520 | | | EverBank Financial Corp. | | | 9,116,910 | |
| | 274,556 | | | JP Morgan Chase & Co. | | | 18,128,933 | |
| | 151,340 | | | PNC Financial Services Group, Inc. | | | 14,424,215 | |
| | | | | | | | |
| | | | | | | 66,352,161 | |
| | | | | | | | |
| | | | Capital Goods - 4.3% | |
| | 130,657 | | | AMETEK, Inc. | | | 7,001,909 | |
| | 74,650 | | | Fortune Brands Home & Security, Inc. | | | 4,143,075 | |
| | 119,364 | | | Honeywell International, Inc. | | | 12,362,530 | |
| | 92,055 | | | Illinois Tool Works, Inc. | | | 8,531,657 | |
| | | | | | | | |
| | | | | | | 32,039,171 | |
| | | | | | | | |
| | | | Commercial & Professional Services - 3.6% | |
| | 104,450 | | | Equifax, Inc. | | | 11,632,597 | |
| | 154,174 | | | Nielsen Holdings plc | | | 7,184,508 | |
| | 104,871 | | | Verisk Analytics, Inc. Class A* | | | 8,062,482 | |
| | | | | | | | |
| | | | | | | 26,879,587 | |
| | | | | | | | |
| | | | Consumer Durables & Apparel - 1.5% | |
| | 176,614 | | | VF Corp. | | | 10,994,221 | |
| | | | | | | | |
| | | | Consumer Services - 1.2% | |
| | 143,406 | | | Starbucks Corp. | | | 8,608,662 | |
| | | | | | | | |
| | | | Diversified Financials - 0.9% | |
| | 70,660 | | | McGraw Hill Financial, Inc. | | | 6,965,663 | |
| | | | | | | | |
| | | | Energy - 2.1% | |
| | 41,445 | | | Anadarko Petroleum Corp. | | | 2,013,398 | |
| | 62,500 | | | Concho Resources, Inc.* | | | 5,803,750 | |
| | 112,055 | | | EOG Resources, Inc. | | | 7,932,374 | |
| | | | | | | | |
| | | | | | | 15,749,522 | |
| | | | | | | | |
| | | | Food & Staples Retailing - 6.5% | |
| | 106,490 | | | Costco Wholesale Corp. | | | 17,198,135 | |
| | 192,180 | | | CVS Health Corp. | | | 18,789,439 | |
| | 295,088 | | | Kroger Co. | | | 12,343,531 | |
| | | | | | | | |
| | | | | | | 48,331,105 | |
| | | | | | | | |
| | | | Food, Beverage & Tobacco - 5.5% | |
| | 251,853 | | | Altria Group, Inc. | | | 14,660,363 | |
| | 371,600 | | | Mondelez International, Inc. Class A | | | 16,662,544 | |
| | 64,156 | | | Monster Beverage Corp.* | | | 9,556,678 | |
| | | | | | | | |
| | | | | | | 40,879,585 | |
| | | | | | | | |
| | | | Health Care Equipment & Services - 7.5% | |
| | 52,462 | | | Aetna, Inc. | | | 5,672,191 | |
| | 164,435 | | | Cerner Corp.* | | | 9,894,054 | |
| | 166,535 | | | Envision Healthcare Holdings, Inc.* | | | 4,324,914 | |
| | 67,815 | | | McKesson Corp. | | | 13,375,153 | |
| | 121,411 | | | Medtronic plc | | | 9,338,934 | |
| | 107,934 | | | UnitedHealth Group, Inc. | | | 12,697,356 | |
| | | | | | | | |
| | | | | | | 55,302,602 | |
| | | | | | | | |
| | | | Household & Personal Products - 3.3% | |
| | 161,650 | | | Colgate-Palmolive Co. | | | 10,769,123 | |
| | 158,643 | | | Estee Lauder Cos., Inc. Class A | | | 13,970,103 | |
| | | | | | | | |
| | | | | | | 24,739,226 | |
| | | | | | | | |
| | | | Insurance - 4.6% | |
| | 129,481 | | | ACE Ltd. | | | 15,129,855 | |
| | 166,880 | | | Marsh & McLennan Cos., Inc. | | | 9,253,496 | |
| | | | | | | | |
Shares or Principal Amount | | Market Value† | |
| COMMON STOCKS - 97.0% - (continued) | |
| | | | Insurance - 4.6% - (continued) | |
| | 241,022 | | | XL Group plc | | $ | 9,443,242 | |
| | | | | | | | |
| | | | | | | 33,826,593 | |
| | | | | | | | |
| | | | Materials - 3.4% | |
| | 179,305 | | | Crown Holdings, Inc.* | | | 9,090,763 | |
| | 44,400 | | | Ecolab, Inc. | | | 5,078,472 | |
| | 43,071 | | | Sherwin-Williams Co. | | | 11,181,232 | |
| | | | | | | | |
| | | | | | | 25,350,467 | |
| | | | | | | | |
| | | | Media - 1.7% | |
| | 224,205 | | | Comcast Corp. Class A | | | 12,651,888 | |
| | | | | | | | |
| | | | Pharmaceuticals, Biotechnology & Life Sciences - 7.9% | |
| | 48,950 | | | Allergan plc* | | | 15,296,875 | |
| | 208,460 | | | Bristol-Myers Squibb Co. | | | 14,339,963 | |
| | 126,475 | | | Eli Lilly & Co. | | | 10,656,784 | |
| | 56,512 | | | Gilead Sciences, Inc. | | | 5,718,449 | |
| | 242,873 | | | Merck & Co., Inc. | | | 12,828,552 | |
| | | | | | | | |
| | | | | | | 58,840,623 | |
| | | | | | | | |
| | | | Retailing - 8.1% | |
| | 14,815 | | | AutoZone, Inc.* | | | 10,991,397 | |
| | 153,878 | | | Dollar Tree, Inc.* | | | 11,882,459 | |
| | 180,440 | | | Lowe’s Cos., Inc. | | | 13,720,658 | |
| | 216,614 | | | Ross Stores, Inc. | | | 11,655,999 | |
| | 160,705 | | | TJX Cos., Inc. | | | 11,395,591 | |
| | | | | | | | |
| | | | | | | 59,646,104 | |
| | | | | | | | |
| | | | Software & Services - 16.8% | |
| | 101,915 | | | Accenture plc Class A | | | 10,650,117 | |
| | 151,226 | | | Activision Blizzard, Inc. | | | 5,853,958 | |
| | 22,750 | | | Alliance Data Systems Corp.* | | | 6,291,967 | |
| | 22,965 | | | Alphabet, Inc. Class A* | | | 17,867,000 | |
| | 6,436 | | | Alphabet, Inc. Class C* | | | 4,884,152 | |
| | 158,563 | | | Automatic Data Processing, Inc. | | | 13,433,457 | |
| | 96,810 | | | Cognizant Technology Solutions Corp. Class A* | | | 5,810,536 | |
| | 74,580 | | | Fiserv, Inc.* | | | 6,821,087 | |
| | 242,620 | | | Genpact Ltd.* | | | 6,060,648 | |
| | 53,850 | | | Intuit, Inc. | | | 5,196,525 | |
| | 114,161 | | | Jack Henry & Associates, Inc. | | | 8,911,408 | |
| | 115,675 | | | Mastercard, Inc. Class A | | | 11,262,118 | |
| | 383,964 | | | Microsoft Corp. | | | 21,302,323 | |
| | | | | | | | |
| | | | | | | 124,345,296 | |
| | | | | | | | |
| | | | Technology Hardware & Equipment - 3.7% | |
| | 155,022 | | | Apple, Inc. | | | 16,317,616 | |
| | 405,389 | | | Cisco Systems, Inc. | | | 11,008,338 | |
| | | | | | | | |
| | | | | | | 27,325,954 | |
| | | | | | | | |
| | | | Transportation - 1.0% | |
| | 49,540 | | | FedEx Corp. | | | 7,380,965 | |
| | | | | | | | |
| | | | Utilities - 4.4% | |
| | 202,410 | | | American Electric Power Co., Inc. | | | 11,794,431 | |
| | 120,995 | | | NextEra Energy, Inc. | | | 12,570,170 | |
| | 127,565 | | | Pinnacle West Capital Corp. | | | 8,225,391 | |
| | | | | | | | |
| | | | | | | 32,589,992 | |
| | | | | | | | |
| | |
| | | | Total Common Stocks
(cost $561,673,634) | | $ | 718,799,387 | |
| | | | | | | | |
| | |
| | | | Total Long-Term Investments
(cost $561,673,634) | | $ | 718,799,387 | |
| | | | | | | | |
The accompanying notes are an integral part of these financial statements.
|
| Hartford Disciplined Equity HLS Fund |
Schedule of Investments – (continued)
December 31, 2015
| | | | | | | | |
Shares or Principal Amount | | Market Value† | |
| SHORT-TERM INVESTMENTS - 2.8% | |
| | | | Other Investment Pools & Funds - 2.8% | |
| | 20,448,109 | | | BlackRock Liquidity Funds TempFund Portfolio | | $ | 20,448,109 | |
| | | | | | | | |
| | |
| | | | Total Short-Term Investments
(cost $20,448,109) | | $ | 20,448,109 | |
| | | | | | | | |
| | | | | | | | | | |
| | | |
| | Total Investments
(cost $582,121,743)^ | | | 99.8 | % | | $ | 739,247,496 | |
| | Other Assets and Liabilities | | | 0.2 | % | | | 1,343,187 | |
| | | | | | | | | | |
| | Total Net Assets | | | 100.0 | % | | $ | 740,590,683 | |
| | | | | | | | | | |
The accompanying notes are an integral part of these financial statements.
|
| Hartford Disciplined Equity HLS Fund |
Schedule of Investments – (continued)
December 31, 2015
| Note: | Percentage of investments as shown is the ratio of the total market value to total net assets. |
| | Equity industry classifications used in this report are the Global Industry Classification Standard, which was developed by and is the exclusive property and service mark of MSCI, Inc. and Standard & Poor’s. |
| | For Fund compliance purposes, the Fund may not use the same classification system shown in this report as these classifications are used for financial reporting purposes. |
| ^ | At December 31, 2015, the cost of securities for federal income tax purposes was $582,521,966 and the aggregate gross unrealized appreciation and depreciation based on that cost were: |
| | | | |
Unrealized Appreciation | | $ | 168,741,319 | |
Unrealized Depreciation | | | (12,015,789 | ) |
| | | | |
Net Unrealized Appreciation | | $ | 156,725,530 | |
| | | | |
Futures Contracts Outstanding at December 31, 2015
| | | | | | | | | | | | | | | | | | | | |
Description | | Number of
Contracts | | | Expiration
Date | | | Notional
Amount | | | Market
Value† | | | Unrealized
Appreciation/
(Depreciation) | |
Long position contracts: | | | | | | | | | | | | | | | | | | | | |
S&P 500 (E-Mini) Future | | | 164 | | | | 03/18/2016 | | | $ | 16,408,521 | | | $ | 16,690,280 | | | $ | 281,759 | |
| | | | | | | | | | | | | | | | | | | | |
Total futures contracts | | | $ | 281,759 | |
| | | | | | | | | | | | | | | | | | | | |
| † | See Significant Accounting Policies of accompanying Notes to Financial Statements regarding valuation of investments. |
The accompanying notes are an integral part of these financial statements.
|
| Hartford Disciplined Equity HLS Fund |
Schedule of Investments – (continued)
December 31, 2015
Fair Valuation Summary
The following is a summary of the fair valuations according to the inputs used as of December 31, 2015 in valuing the Fund’s investments.
| | | | | | | | | | | | | | | | |
| | | Total | | | Level 1(1) | | | Level 2(1) | | | Level 3 | |
Assets | |
Common Stocks | | | | | | | | | | | | | | | | |
Banks | | $ | 66,352,161 | | | $ | 66,352,161 | | | $ | — | | | $ | — | |
Capital Goods | | | 32,039,171 | | | | 32,039,171 | | | | — | | | | — | |
Commercial & Professional Services | | | 26,879,587 | | | | 26,879,587 | | | | — | | | | — | |
Consumer Durables & Apparel | | | 10,994,221 | | | | 10,994,221 | | | | — | | | | — | |
Consumer Services | | | 8,608,662 | | | | 8,608,662 | | | | — | | | | — | |
Diversified Financials | | | 6,965,663 | | | | 6,965,663 | | | | — | | | | — | |
Energy | | | 15,749,522 | | | | 15,749,522 | | | | — | | | | — | |
Food & Staples Retailing | | | 48,331,105 | | | | 48,331,105 | | | | — | | | | — | |
Food, Beverage & Tobacco | | | 40,879,585 | | | | 40,879,585 | | | | — | | | | — | |
Health Care Equipment & Services | | | 55,302,602 | | | | 55,302,602 | | | | — | | | | — | |
Household & Personal Products | | | 24,739,226 | | | | 24,739,226 | | | | — | | | | — | |
Insurance | | | 33,826,593 | | | | 33,826,593 | | | | — | | | | — | |
Materials | | | 25,350,467 | | | | 25,350,467 | | | | — | | | | — | |
Media | | | 12,651,888 | | | | 12,651,888 | | | | — | | | | — | |
Pharmaceuticals, Biotechnology & Life Sciences | | | 58,840,623 | | | | 58,840,623 | | | | — | | | | — | |
Retailing | | | 59,646,104 | | | | 59,646,104 | | | | — | | | | — | |
Software & Services | | | 124,345,296 | | | | 124,345,296 | | | | — | | | | — | |
Technology Hardware & Equipment | | | 27,325,954 | | | | 27,325,954 | | | | — | | | | — | |
Transportation | | | 7,380,965 | | | | 7,380,965 | | | | — | | | | — | |
Utilities | | | 32,589,992 | | | | 32,589,992 | | | | — | | | | — | |
Short-Term Investments | | | 20,448,109 | | | | 20,448,109 | | | | — | | | | — | |
Futures Contracts(2) | | | 281,759 | | | | 281,759 | | | | — | | | | — | |
| | | | | | | | | | | | | | | | |
Total | | $ | 739,529,255 | | | $ | 739,529,255 | | | $ | — | | | $ | — | |
| | | | | | | | | | | | | | | | |
| (1) | For the year ended December 31, 2015, there were no transfers between Level 1 and Level 2. |
| (2) | Derivative instruments (excluding purchased and written options, if applicable) are valued at the unrealized appreciation/depreciation on the investments. |
| Note: | For purposes of reporting transfers between different hierarchy levels, both transfers in and out of each level, as applicable, are shown as if they occurred at the beginning of the period. |
The accompanying notes are an integral part of these financial statements.
|
| Hartford Dividend and Growth HLS Fund |
Schedule of Investments
December 31, 2015
| | | | | | | | |
Shares or Principal Amount | | Market Value† | |
| COMMON STOCKS - 98.8% | | | |
| | | | Automobiles & Components - 1.3% | |
| | 3,286,266 | | | Ford Motor Co. | | $ | 46,303,488 | |
| | | | | | | | |
| | | | Banks - 12.6% | |
| | 2,725,550 | | | Bank of America Corp. | | | 45,871,007 | |
| | 490,559 | | | Bank of Nova Scotia | | | 19,838,206 | |
| | 758,744 | | | Citigroup, Inc. | | | 39,265,002 | |
| | 1,366,390 | | | JP Morgan Chase & Co. | | | 90,222,732 | |
| | 666,814 | | | PNC Financial Services Group, Inc. | | | 63,554,042 | |
| | 387,929 | | | US Bancorp | | | 16,552,930 | |
| | 2,892,094 | | | Wells Fargo & Co. | | | 157,214,230 | |
| | | | | | | | |
| | | | | | | 432,518,149 | |
| | | | | | | | |
| | | | Capital Goods - 5.9% | |
| | 331,970 | | | Caterpillar, Inc. | | | 22,560,681 | |
| | 528,381 | | | Eaton Corp. plc | | | 27,496,947 | |
| | 563,755 | | | General Electric Co. | | | 17,560,968 | |
| | 501,122 | | | Honeywell International, Inc. | | | 51,901,206 | |
| | 150,128 | | | Illinois Tool Works, Inc. | | | 13,913,863 | |
| | 121,826 | | | Lockheed Martin Corp. | | | 26,454,516 | |
| | 133,999 | | | Raytheon Co. | | | 16,686,896 | |
| | 273,030 | | | United Technologies Corp. | | | 26,229,992 | |
| | | | | | | | |
| | | | | | | 202,805,069 | |
| | | | | | | | |
| | | | Commercial & Professional Services - 1.5% | |
| | 109,174 | | | Equifax, Inc. | | | 12,158,708 | |
| | 850,880 | | | Nielsen Holdings plc | | | 39,651,008 | |
| | | | | | | | |
| | | | | | | 51,809,716 | |
| | | | | | | | |
| | | | Consumer Services - 0.6% | |
| | 982,464 | | | Hilton Worldwide Holdings, Inc. | | | 21,024,730 | |
| | | | | | | | |
| | | | Diversified Financials - 3.3% | |
| | 70,000 | | | American Express Co. | | | 4,868,500 | |
| | 206,607 | | | Ameriprise Financial, Inc. | | | 21,987,117 | |
| | 141,130 | | | BlackRock, Inc. | | | 48,057,588 | |
| | 299,550 | | | Northern Trust Corp. | | | 21,594,559 | |
| | 537,761 | | | Synchrony Financial* | | | 16,353,312 | |
| | | | | | | | |
| | | | | | | 112,861,076 | |
| | | | | | | | |
| | | | Energy - 8.8% | |
| | 534,155 | | | Anadarko Petroleum Corp. | | | 25,949,250 | |
| | 604,390 | | | Canadian Natural Resources Ltd. | | | 13,193,834 | |
| | 806,566 | | | Chevron Corp. | | | 72,558,677 | |
| | 313,790 | | | EOG Resources, Inc. | | | 22,213,194 | |
| | 832,937 | | | Exxon Mobil Corp. | | | 64,927,439 | |
| | 635,030 | | | Hess Corp. | | | 30,786,254 | |
| | 663,030 | | | Imperial Oil Ltd. | | | 21,561,736 | |
| | 878,680 | | | Marathon Oil Corp. | | | 11,062,581 | |
| | 137,060 | | | Marathon Petroleum Corp. | | | 7,105,190 | |
| | 231,146 | | | Schlumberger Ltd. | | | 16,122,434 | |
| | 414,543 | | | Total S.A. ADR | | | 18,633,708 | |
| | | | | | | | |
| | | | | | | 304,114,297 | |
| | | | | | | | |
| | | | Food & Staples Retailing - 3.4% | |
| | 79,330 | | | Costco Wholesale Corp. | | | 12,811,795 | |
| | 757,251 | | | CVS Health Corp. | | | 74,036,430 | |
| | 314,184 | | | Wal-Mart Stores, Inc. | | | 19,259,479 | |
| | 120,176 | | | Walgreens Boots Alliance, Inc. | | | 10,233,588 | |
| | | | | | | | |
| | | | | | | 116,341,292 | |
| | | | | | | | |
| | | | Food, Beverage & Tobacco - 4.3% | |
| | 953,310 | | | Coca-Cola Co. | | | 40,954,198 | |
| | 761,859 | | | Mondelez International, Inc. Class A | | | 34,161,757 | |
| | 338,600 | | | PepsiCo, Inc. | | | 33,832,912 | |
| | | | | | | | |
Shares or Principal Amount | | Market Value† | |
| COMMON STOCKS - 98.8% - (continued) | | | |
| | | | Food, Beverage & Tobacco - 4.3% - (continued) | |
| | 437,352 | | | Philip Morris International, Inc. | | $ | 38,447,614 | |
| | | | | | | | |
| | | | | | | 147,396,481 | |
| | | | | | | | |
| | | | Health Care Equipment & Services - 4.8% | |
| | 760,200 | | | Baxter International, Inc. | | | 29,001,630 | |
| | 432,069 | | | Cardinal Health, Inc. | | | 38,570,800 | |
| | 802,649 | | | Medtronic plc | | | 61,739,761 | |
| | 317,027 | | | UnitedHealth Group, Inc. | | | 37,295,056 | |
| | | | | | | | |
| | | | | | | 166,607,247 | |
| | | | | | | | |
| | | | Household & Personal Products - 0.7% | |
| | 346,140 | | | Colgate-Palmolive Co. | | | 23,059,847 | |
| | | | | | | | |
| | | | Insurance - 7.1% | |
| | 672,418 | | | ACE Ltd. | | | 78,572,043 | |
| | 655,495 | | | Marsh & McLennan Cos., Inc. | | | 36,347,198 | |
| | 511,671 | | | MetLife, Inc. | | | 24,667,659 | |
| | 898,120 | | | Principal Financial Group, Inc. | | | 40,397,438 | |
| | 779,576 | | | Prudential Financial, Inc. | | | 63,465,282 | |
| | | | | | | | |
| | | | | | | 243,449,620 | |
| | | | | | | | |
| | | | Materials - 2.3% | |
| | 129,140 | | | Ball Corp. | | | 9,392,352 | |
| | 408,730 | | | Celanese Corp. Series A | | | 27,519,791 | |
| | 742,109 | | | International Paper Co. | | | 27,977,509 | |
| | 133,560 | | | Praxair, Inc. | | | 13,676,544 | |
| | | | | | | | |
| | | | | | | 78,566,196 | |
| | | | | | | | |
| | | | Media - 3.1% | |
| | 1,546,903 | | | Comcast Corp. Class A | | | 87,291,736 | |
| | 777,192 | | | Twenty-First Century Fox, Inc. Class A | | | 21,108,535 | |
| | | | | | | | |
| | | | | | | 108,400,271 | |
| | | | | | | | |
| | | | Pharmaceuticals, Biotechnology & Life Sciences - 11.7% | |
| | 1,671,026 | | | AstraZeneca plc ADR | | | 56,731,333 | |
| | 1,029,376 | | | Bristol-Myers Squibb Co. | | | 70,810,775 | |
| | 424,555 | | | Eli Lilly & Co. | | | 35,773,004 | |
| | 668,195 | | | Johnson & Johnson | | | 68,636,990 | |
| | 2,278,013 | | | Merck & Co., Inc. | | | 120,324,647 | |
| | 1,574,059 | | | Pfizer, Inc. | | | 50,810,625 | |
| | | | | | | | |
| | | | | | | 403,087,374 | |
| | | | | | | | |
| | | | Retailing - 0.8% | |
| | 371,041 | | | Lowe’s Cos., Inc. | | | 28,213,958 | |
| | | | | | | | |
| | | | Semiconductors & Semiconductor Equipment - 2.8% | |
| | 2,341,831 | | | Intel Corp. | | | 80,676,078 | |
| | 264,944 | | | Texas Instruments, Inc. | | | 14,521,581 | |
| | | | | | | | |
| | | | | | | 95,197,659 | |
| | | | | | | | |
| | | | Software & Services - 7.5% | |
| | 457,794 | | | Accenture plc Class A | | | 47,839,473 | |
| | 109,550 | | | Alphabet, Inc. Class A* | | | 85,230,995 | |
| | 2,287,112 | | | Microsoft Corp. | | | 126,888,974 | |
| | | | | | | | |
| | | | | | | 259,959,442 | |
| | | | | | | | |
| | | | Technology Hardware & Equipment - 4.7% | |
| | 449,585 | | | Apple, Inc. | | | 47,323,317 | |
| | 317,880 | | | Avnet, Inc. | | | 13,617,979 | |
| | 2,190,195 | | | Cisco Systems, Inc. | | | 59,474,745 | |
| | 271,000 | | | Motorola Solutions, Inc. | | | 18,549,950 | |
| | 355,711 | | | Western Digital Corp. | | | 21,360,446 | |
| | | | | | | | |
| | | | | | | 160,326,437 | |
| | | | | | | | |
The accompanying notes are an integral part of these financial statements.
|
| Hartford Dividend and Growth HLS Fund |
Schedule of Investments – (continued)
December 31, 2015
| | | | | | | | |
Shares or Principal Amount | | Market Value† | |
| COMMON STOCKS - 98.8% - (continued) | | | |
| | | | Telecommunication Services - 2.7% | |
| | 1,990,929 | | | Verizon Communications, Inc. | | $ | 92,020,738 | |
| | | | | | | | |
| | | | Transportation - 4.5% | |
| | 224,011 | | | Canadian National Railway Co. | | | 12,517,735 | |
| | 1,147,882 | | | CSX Corp. | | | 29,787,538 | |
| | 597,747 | | | Delta Air Lines, Inc. | | | 30,299,795 | |
| | 167,337 | | | FedEx Corp. | | | 24,931,539 | |
| | 586,438 | | | United Parcel Service, Inc. Class B | | | 56,432,929 | |
| | | | | | | | |
| | | | | | | 153,969,536 | |
| | | | | | | | |
| | | | Utilities - 4.4% | |
| | 530,806 | | | Dominion Resources, Inc. | | | 35,903,718 | |
| | 586,852 | | | Edison International | | | 34,747,507 | |
| | 135,900 | | | Eversource Energy | | | 6,940,413 | |
| | 870,792 | | | Exelon Corp. | | | 24,181,894 | |
| | 481,088 | | | NextEra Energy, Inc. | | | 49,980,232 | |
| | | | | | | | |
| | | | | | | 151,753,764 | |
| | | | | | | | |
| | |
| | | | Total Common Stocks
(cost $2,568,681,975) | | $ | 3,399,786,387 | |
| | | | | | | | |
| | |
| | | | Total Long-Term Investments
(cost $2,568,681,975) | | $ | 3,399,786,387 | |
| | | | | | | | |
| |
| SHORT-TERM INVESTMENTS - 1.1% | | | |
| | | | Other Investment Pools &
Funds - 1.1% | | | |
| | 38,738,089 | | | Fidelity Money Market Class 1 | | $ | 38,738,089 | |
| | | | | | | | |
| | |
| | | | Total Short-Term Investments
(cost $38,738,089) | | $ | 38,738,089 | |
| | | | | | | | |
| | | | | | | | | | |
| | | |
| | Total Investments
(cost $2,607,420,064)^ | | | 99.9 | % | | $ | 3,438,524,476 | |
| | Other Assets and Liabilities | | | 0.1 | % | | | 2,979,233 | |
| | | | | | | | | | |
| | Total Net Assets | | | 100.0 | % | | $ | 3,441,503,709 | |
| | | | | | | | | | |
The accompanying notes are an integral part of these financial statements.
|
| Hartford Dividend and Growth HLS Fund |
Schedule of Investments – (continued)
December 31, 2015
| Note: | Percentage of investments as shown is the ratio of the total market value to total net assets. |
| | Equity industry classifications used in this report are the Global Industry Classification Standard, which was developed by and is the exclusive property and service mark of MSCI, Inc. and Standard & Poor’s. |
| | For Fund compliance purposes, the Fund may not use the same classification system shown in this report as these classifications are used for financial reporting purposes. |
| ^ | At December 31, 2015, the cost of securities for federal income tax purposes was $2,608,576,282 and the aggregate gross unrealized appreciation and depreciation based on that cost were: |
| | | | |
Unrealized Appreciation | | $ | 965,065,332 | |
Unrealized Depreciation | | | (135,117,138 | ) |
| | | | |
Net Unrealized Appreciation | | $ | 829,948,194 | |
| | | | |
| † | See Significant Accounting Policies of accompanying Notes to Financial Statements regarding valuation of investments. |
| | |
| GLOSSARY: (abbreviations used in preceding Schedule of Investments) |
|
| Other Abbreviations: |
ADR | | American Depositary Receipt |
The accompanying notes are an integral part of these financial statements.
|
| Hartford Dividend and Growth HLS Fund |
Schedule of Investments – (continued)
December 31, 2015
Fair Valuation Summary
The following is a summary of the fair valuations according to the inputs used as of December 31, 2015 in valuing the Fund’s investments.
| | | | | | | | | | | | | | | | |
| | | Total | | | Level 1(1) | | | Level 2(1) | | | Level 3 | |
Assets | |
Common Stocks | | | | | | | | | | | | | | | | |
Automobiles & Components | | $ | 46,303,488 | | | $ | 46,303,488 | | | $ | — | | | $ | — | |
Banks | | | 432,518,149 | | | | 432,518,149 | | | | — | | | | — | |
Capital Goods | | | 202,805,069 | | | | 202,805,069 | | | | — | | | | — | |
Commercial & Professional Services | | | 51,809,716 | | | | 51,809,716 | | | | — | | | | — | |
Consumer Services | | | 21,024,730 | | | | 21,024,730 | | | | — | | | | — | |
Diversified Financials | | | 112,861,076 | | | | 112,861,076 | | | | — | | | | — | |
Energy | | | 304,114,297 | | | | 304,114,297 | | | | — | | | | — | |
Food & Staples Retailing | | | 116,341,292 | | | | 116,341,292 | | | | — | | | | — | |
Food, Beverage & Tobacco | | | 147,396,481 | | | | 147,396,481 | | | | — | | | | — | |
Health Care Equipment & Services | | | 166,607,247 | | | | 166,607,247 | | | | — | | | | — | |
Household & Personal Products | | | 23,059,847 | | | | 23,059,847 | | | | — | | | | — | |
Insurance | | | 243,449,620 | | | | 243,449,620 | | | | — | | | | — | |
Materials | | | 78,566,196 | | | | 78,566,196 | | | | — | | | | — | |
Media | | | 108,400,271 | | | | 108,400,271 | | | | — | | | | — | |
Pharmaceuticals, Biotechnology & Life Sciences | | | 403,087,374 | | | | 403,087,374 | | | | — | | | | — | |
Retailing | | | 28,213,958 | | | | 28,213,958 | | | | — | | | | — | |
Semiconductors & Semiconductor Equipment | | | 95,197,659 | | | | 95,197,659 | | | | — | | | | — | |
Software & Services | | | 259,959,442 | | | | 259,959,442 | | | | — | | | | — | |
Technology Hardware & Equipment | | | 160,326,437 | | | | 160,326,437 | | | | — | | | | — | |
Telecommunication Services | | | 92,020,738 | | | | 92,020,738 | | | | — | | | | — | |
Transportation | | | 153,969,536 | | | | 153,969,536 | | | | — | | | | — | |
Utilities | | | 151,753,764 | | | | 151,753,764 | | | | — | | | | — | |
Short-Term Investments | | | 38,738,089 | | | | 38,738,089 | | | | — | | | | — | |
| | | | | | | | | | | | | | | | |
Total | | $ | 3,438,524,476 | | | $ | 3,438,524,476 | | | $ | — | | | $ | — | |
| | | | | | | | | | | | | | | | |
| (1) | For the year ended December 31, 2015, there were no transfers between Level 1 and Level 2. |
| Note: | For purposes of reporting transfers between different hierarchy levels, both transfers in and out of each level, as applicable, are shown as if they occurred at the beginning of the period. |
The accompanying notes are an integral part of these financial statements.
|
| Hartford Global Growth HLS Fund |
Schedule of Investments
December 31, 2015
| | | | | | | | |
Shares or Principal Amount | | Market Value† | |
| COMMON STOCKS - 98.6% | |
| | | | Banks - 4.1% | |
| | 207,041 | | | Bank of America Corp. | | $ | 3,484,500 | |
| | 7,004,700 | | | Bank of Ireland* | | | 2,564,801 | |
| | 43,805 | | | BNP Paribas S.A. | | | 2,478,369 | |
| | 308,833 | | | ICICI Bank Ltd. ADR | | | 2,418,162 | |
| | 32,799 | | | PNC Financial Services Group, Inc. | | | 3,126,073 | |
| | 388,850 | | | Unione di Banche Italiane S.p.A. | | | 2,598,080 | |
| | 55,363 | | | Wells Fargo & Co. | | | 3,009,533 | |
| | | | | | | | |
| | | | 19,679,518 | |
| | | | | | | | |
| | | | Capital Goods - 3.2% | |
| | 137,061 | | | Assa Abloy AB Class B | | | 2,869,058 | |
| | 51,800 | | | Fortune Brands Home & Security, Inc. | | | 2,874,900 | |
| | 35,900 | | | Nidec Corp. | | | 2,603,323 | |
| | 37,775 | | | Safran S.A. | | | 2,595,246 | |
| | 30,028 | | | Schneider Electric SE | | | 1,705,708 | |
| | 10,722 | | | SMC Corp. | | | 2,784,865 | |
| | | | | | | | |
| | | | 15,433,100 | |
| | | | | | | | |
| | | | Commercial & Professional Services - 1.9% | |
| | 31,470 | | | Equifax, Inc. | | | 3,504,814 | |
| | 55,551 | | | Nielsen Holdings plc | | | 2,588,676 | |
| | 60,199 | | | Robert Half International, Inc. | | | 2,837,781 | |
| | | | | | | | |
| | | | 8,931,271 | |
| | | | | | | | |
| | | | Consumer Durables & Apparel - 3.8% | |
| | 97,118 | | | Electrolux AB Series B | | | 2,343,205 | |
| | 30,200 | | | Harman International Industries, Inc. | | | 2,845,142 | |
| | 51,559 | | | lululemon athletica, Inc.* | | | 2,705,300 | |
| | 31,078 | | | Pandora A/S | | | 3,918,433 | |
| | 88,905 | | | Persimmon plc* | | | 2,652,332 | |
| | 153,700 | | | Sony Corp. | | | 3,777,452 | |
| | | | | | | | |
| | | | 18,241,864 | |
| | | | | | | | |
| | | | Consumer Services - 1.6% | |
| | 111,833 | | | MGM Resorts International* | | | 2,540,846 | |
| | 764,862 | | | Sands China Ltd. | | | 2,593,031 | |
| | 42,578 | | | Starbucks Corp. | | | 2,555,957 | |
| | | | | | | | |
| | | | 7,689,834 | |
| | | | | | | | |
| | | | Diversified Financials - 7.5% | |
| | 8,470 | | | BlackRock, Inc. | | | 2,884,205 | |
| | 20,396 | | | Factset Research Systems, Inc. | | | 3,315,778 | |
| | 229,670 | | | IG Group Holdings plc | | | 2,715,277 | |
| | 12,235 | | | Intercontinental Exchange, Inc. | | | 3,135,341 | |
| | 66,522 | | | Julius Baer Group Ltd.* | | | 3,218,145 | |
| | 26,054 | | | McGraw Hill Financial, Inc. | | | 2,568,403 | |
| | 34,786 | | | Moody’s Corp. | | | 3,490,427 | |
| | 53,394 | | | MSCI, Inc. | | | 3,851,309 | |
| | 39,374 | | | Northern Trust Corp. | | | 2,838,472 | |
| | 7,211 | | | Partners Group Holding AG | | | 2,593,322 | |
| | 57,755 | | | Schroders plc | | | 2,529,610 | |
| | 49,770 | | | SEI Investments Co. | | | 2,607,948 | |
| | | | | | | | |
| | | | 35,748,237 | |
| | | | | | | | |
| | | | Energy - 1.4% | |
| | 246,643 | | | Galp Energia SGPS S.A. | | | 2,877,995 | |
| | 31,267 | | | Pioneer Natural Resources Co. | | | 3,920,257 | |
| | | | | | | | |
| | | | 6,798,252 | |
| | | | | | | | |
| | | | Food & Staples Retailing - 2.3% | |
| | 74,770 | | | CVS Health Corp. | | | 7,310,263 | |
| | 77,725 | | | Seven & I Holdings Co., Ltd. | | | 3,558,604 | |
| | | | | | | | |
| | | | 10,868,867 | |
| | | | | | | | |
| | | | | | | | |
Shares or Principal Amount | | Market Value† | |
| COMMON STOCKS - 98.6% - (continued) | |
| | | | Food, Beverage & Tobacco - 6.2% | |
| | 76,466 | | | Altria Group, Inc. | | $ | 4,451,086 | |
| | 32,187 | | | Anheuser-Busch InBev N.V. | | | 4,005,580 | |
| | 125,231 | | | British American Tobacco plc | | | 6,954,577 | |
| | 51,794 | | | Imperial Tobacco Group plc | | | 2,735,636 | |
| | 113,940 | | | Mondelez International, Inc. Class A | | | 5,109,069 | |
| | 23,260 | | | Monster Beverage Corp.* | | | 3,464,810 | |
| | 36,266 | | | Philip Morris International, Inc. | | | 3,188,144 | |
| | | | | | | | |
| | | | 29,908,902 | |
| | | | | | | | |
| | | | Health Care Equipment & Services - 3.4% | |
| | 159,900 | | | Boston Scientific Corp.* | | | 2,948,556 | |
| | 40,882 | | | Edwards Lifesciences Corp.* | | | 3,228,860 | |
| | 65,000 | | | Hoya Corp. | | | 2,658,017 | |
| | 41,350 | | | Medtronic plc | | | 3,180,642 | |
| | 34,495 | | | UnitedHealth Group, Inc. | | | 4,057,992 | |
| | | | | | | | |
| | | | 16,074,067 | |
| | | | | | | | |
| | | | Household & Personal Products - 2.7% | |
| | 82,320 | | | Estee Lauder Cos., Inc. Class A | | | 7,249,099 | |
| | 63,344 | | | Reckitt Benckiser Group plc | | | 5,860,984 | |
| | | | | | | | |
| | | | 13,110,083 | |
| | | | | | | | |
| | | | Insurance - 4.0% | |
| | 112,001 | | | American International Group, Inc. | | | 6,940,702 | |
| | 28,310 | | | Aon plc | | | 2,610,465 | |
| | 126,483 | | | Assured Guaranty Ltd. | | | 3,342,945 | |
| | 1,286,480 | | | PICC Property & Casualty Co., Ltd. Class H | | | 2,538,887 | |
| | 249,916 | | | St James’s Place plc | | | 3,704,173 | |
| | | | | | | | |
| | | | 19,137,172 | |
| | | | | | | | |
| | | | Materials - 1.0% | |
| | 32,887 | | | HeidelbergCement AG | | | 2,680,209 | |
| | 178,975 | | | James Hardie Industries plc | | | 2,256,505 | |
| | | | | | | | |
| | | | 4,936,714 | |
| | | | | | | | |
| | | | Media - 2.7% | |
| | 50,913 | | | Comcast Corp. Class A | | | 2,873,021 | |
| | 49,815 | | | ProSiebenSat.1 Media SE | | | 2,513,232 | |
| | 178,144 | | | Sky plc | | | 2,920,269 | |
| | 85,102 | | | Twenty-First Century Fox, Inc. Class A | | | 2,311,370 | |
| | 21,010 | | | Walt Disney Co. | | | 2,207,731 | |
| | | | | | | | |
| | | | 12,825,623 | |
| | | | | | | | |
| | | | Pharmaceuticals, Biotechnology & Life Sciences - 14.3% | |
| | 21,087 | | | Actelion Ltd.* | | | 2,929,902 | |
| | 14,118 | | | Allergan plc* | | | 4,411,875 | |
| | 31,574 | | | Amgen, Inc. | | | 5,125,408 | |
| | 40,275 | | | AstraZeneca plc | | | 2,720,468 | |
| | 179,166 | | | Bristol-Myers Squibb Co. | | | 12,324,829 | |
| | 68,470 | | | Celgene Corp.* | | | 8,199,967 | |
| | 47,800 | | | Eisai Co., Ltd. | | | 3,162,006 | |
| | 36,794 | | | ICON plc* | | | 2,858,894 | |
| | 55,756 | | | Novartis AG | | | 4,796,090 | |
| | 85,017 | | | Novo Nordisk A/S Class B | | | 4,922,332 | |
| | 6,897 | | | Regeneron Pharmaceuticals, Inc.* | | | 3,744,174 | |
| | 15,279 | | | Roche Holding AG | | | 4,233,939 | |
| | 37,059 | | | UCB S.A. | | | 3,345,058 | |
| | 22,895 | | | Vertex Pharmaceuticals, Inc.* | | | 2,880,878 | |
| | 56,100 | | | Zoetis, Inc. | | | 2,688,312 | |
| | | | | | | | |
| | | | 68,344,132 | |
| | | | | | | | |
| | | | Real Estate - 0.7% | | | |
| | 34,193 | | | American Tower Corp. REIT | | | 3,315,011 | |
| | | | | | | | |
The accompanying notes are an integral part of these financial statements.
|
| Hartford Global Growth HLS Fund |
Schedule of Investments – (continued)
December 31, 2015
| | | | | | | | |
Shares or Principal Amount | | Market Value† | |
| COMMON STOCKS - 98.6% - (continued) | |
| | | | Retailing - 10.3% | | | |
| | 19,359 | | | Amazon.com, Inc.* | | $ | 13,084,555 | |
| | 22,955 | | | Expedia, Inc. | | | 2,853,307 | |
| | 46,359 | | | Home Depot, Inc. | | | 6,130,978 | |
| | 116,912 | | | Lowe’s Cos., Inc. | | | 8,889,988 | |
| | 26,144 | | | Next plc | | | 2,807,103 | |
| | 5,431 | | | Priceline Group, Inc.* | | | 6,924,253 | |
| | 57,439 | | | Ross Stores, Inc. | | | 3,090,793 | |
| | 165,793 | | | Vipshop Holdings Ltd. ADR* | | | 2,531,659 | |
| | 79,485 | | | Zalando SE*(1) | | | 3,144,243 | |
| | | | | | | | |
| | | | 49,456,879 | |
| | | | | | | | |
| | | | Semiconductors & Semiconductor Equipment - 1.8% | |
| | 185,534 | | | ARM Holdings plc | | | 2,827,914 | |
| | 196,924 | | | Infineon Technologies AG | | | 2,870,897 | |
| | 34,700 | | | NXP Semiconductors N.V.* | | | 2,923,475 | |
| | | | | | | | |
| | | | 8,622,286 | |
| | | | | | | | |
| | | | Software & Services - 21.1% | | | |
| | 43,091 | | | Accenture plc Class A | | | 4,503,009 | |
| | 76,962 | | | Adobe Systems, Inc.* | | | 7,229,810 | |
| | 19,749 | | | Alphabet, Inc. Class C* | | | 14,987,121 | |
| | 43,358 | | | Automatic Data Processing, Inc. | | | 3,673,290 | |
| | 39,887 | | | Check Point Software Technologies Ltd.* | | | 3,246,004 | |
| | 55,797 | | | Cognizant Technology Solutions Corp. Class A* | | | 3,348,936 | |
| | 3,575 | | | Dropbox, Inc. Class B(2)(3) | | | 54,340 | |
| | 51,476 | | | Facebook, Inc. Class A* | | | 5,387,478 | |
| | 37,710 | | | Fiserv, Inc.* | | | 3,448,957 | |
| | 42,741 | | | Gartner, Inc. Class A* | | | 3,876,609 | |
| | 36,464 | | | Intuit, Inc. | | | 3,518,776 | |
| | 47,277 | | | Jack Henry & Associates, Inc. | | | 3,690,443 | |
| | 86,765 | | | Mastercard, Inc. Class A | | | 8,447,440 | |
| | 65,208 | | | Microsoft Corp. | | | 3,617,740 | |
| | 75,527 | | | Mobileye N.V.* | | | 3,193,282 | |
| | 20,900 | | | Nintendo Co., Ltd. | | | 2,873,960 | |
| | 46,303 | | | Salesforce.com, Inc.* | | | 3,630,155 | |
| | 26,600 | | | ServiceNow, Inc.* | | | 2,302,496 | |
| | 289,600 | | | Tencent Holdings Ltd. | | | 5,670,359 | |
| | 54,332 | | | Vantiv, Inc. Class A* | | | 2,576,423 | |
| | 42,017 | | | VeriSign, Inc.* | | | 3,670,605 | |
| | 73,009 | | | Visa, Inc. Class A | | | 5,661,848 | |
| | 33,660 | | | Zillow Group, Inc. Class A* | | | 876,506 | |
| | 75,120 | | | Zillow Group, Inc. Class C* | | | 1,763,818 | |
| | | | | | | | |
| | | | 101,249,405 | |
| | | | | | | | |
| | | | Technology Hardware & Equipment - 2.1% | |
| | 265,000 | | | Catcher Technology Co., Ltd. | | | 2,209,150 | |
| | 89,345 | | | Cisco Systems, Inc. | | | 2,426,163 | |
| | 30,135 | | | F5 Networks, Inc.* | | | 2,921,890 | |
| | 36,700 | | | Largan Precision Co., Ltd. | | | 2,511,188 | |
| | 2,372 | | | Pure Storage, Inc. Class B*(2)(3) | | | 34,983 | |
| | | | | | | | |
| | | | 10,103,374 | |
| | | | | | | | |
| | | | Telecommunication Services - 1.2% | | | |
| | 117,500 | | | NTT DoCoMo, Inc. | | | 2,410,111 | |
| | 84,541 | | | T-Mobile US, Inc.* | | | 3,307,244 | |
| | | | | | | | |
| | | | 5,717,355 | |
| | | | | | | | |
| | | | | | | | |
Shares or Principal Amount | | Market Value† | |
| COMMON STOCKS - 98.6% - (continued) | |
| | | | Transportation - 1.3% | | | |
| | 49,833 | | | United Continental Holdings, Inc.* | | $ | 2,855,431 | |
| | 36,070 | | | United Parcel Service, Inc. Class B | | | 3,471,016 | |
| | | | | | | | |
| | | | 6,326,447 | |
| | | | | | | | |
| | | | Total Common Stocks
(cost $401,901,757) | | $ | 472,518,393 | |
| | | | | | | | |
|
| WARRANTS - 0.0% | |
| | | | Diversified Financials - 0.0% | | | |
| | 16,228 | | | Atlas Mara Ltd. Expires 8/21/17* | | $ | 2,029 | |
| | 1,035 | | | Imperial Holdings, Inc.,
Expires 4/11/19*(2)(3) | | | — | |
| | | | | | | | |
| | |
| | | | Total Warrants
(cost $162) | | $ | 2,029 | |
| | | | | | | | |
|
| RIGHTS - 0.0% | |
| | | | Banks - 0.0% | | | |
| | 356,891 | | | Unione di Banche Italiane S.p.A. Expires 1/12/16* | | $ | 4 | |
| | | | | | | | |
| | |
| | | | Total Rights
(cost $ — ) | | $ | 4 | |
| | | | | | | | |
| | |
| | | | Total Long-Term Investments
(cost $401,901,919) | | $ | 472,520,426 | |
| | | | | | | | |
|
| SHORT-TERM INVESTMENTS - 1.2% | |
| | | | Other Investment Pools & Funds - 1.2% | | | |
| | 5,452,375 | | | Fidelity Money Market Class 1 | | $ | 5,452,375 | |
| | | | | | | | |
| | |
| | | | Total Short-Term Investments
(cost $5,452,375) | | $ | 5,452,375 | |
| | | | | | | | |
| | | | | | | | | | |
| | | |
| | Total Investments
(cost $407,354,294)^ | | | 99.8 | % | | $ | 477,972,801 | |
| | Other Assets and Liabilities | | | 0.2 | % | | | 1,087,992 | |
| | | | | | | | | | |
| | Total Net Assets | | | 100.0 | % | | $ | 479,060,793 | |
| | | | | | | | | | |
The accompanying notes are an integral part of these financial statements.
|
| Hartford Global Growth HLS Fund |
Schedule of Investments – (continued)
December 31, 2015
| Note: | Percentage of investments as shown is the ratio of the total market value to total net assets. |
| | Prices of foreign equities that are principally traded on certain foreign markets may be adjusted daily pursuant to a fair value pricing service approved by the Board of Directors in order to reflect an adjustment for factors occurring after the close of certain foreign markets but before the close of the New York Stock Exchange. |
| | Equity industry classifications used in this report are the Global Industry Classification Standard, which was developed by and is the exclusive property and service mark of MSCI, Inc. and Standard & Poor’s. |
| | For Fund compliance purposes, the Fund may not use the same classification system shown in this report as these classifications are used for financial reporting purposes. |
| ^ | At December 31, 2015, the cost of securities for federal income tax purposes was $407,545,865 and the aggregate gross unrealized appreciation and depreciation based on that cost were: |
| | | | |
Unrealized Appreciation | | $ | 81,992,777 | |
Unrealized Depreciation | | | (11,565,841 | ) |
| | | | |
Net Unrealized Appreciation | | $ | 70,426,936 | |
| | | | |
| (1) | Securities issued within terms of a private placement memorandum, exempt from registration under Rule 144A under the Securities Act of 1933, as amended, and may be sold only to qualified institutional buyers. Unless otherwise indicated, this holding is determined to be liquid. At December 31, 2015, the aggregate value of this security was $3,144,243, which represents 0.7% of total net assets. |
| (2) | The following securities are considered illiquid. Illiquid securities are often purchased in private placement transactions, are often not registered under the Securities Act of 1933, as amended, and may have contractual restrictions on resale. A security may also be considered illiquid if the security lacks a readily available market or if its valuation has not changed for a certain period of time. |
| | | | | | | | | | |
Period
Acquired | | Shares/Par | | | Security | | Cost | |
| 05/2012 | | | 3,575 | | | Dropbox, Inc. Class B | | $ | 32,360 | |
| 04/2014 | | | 1,035 | | | Imperial Holdings, Inc., Warrants | | | — | |
| 04/2014 | | | 2,372 | | | Pure Storage, Inc. Class B | | | 37,302 | |
| | | | | | | | | | |
| | | | | | | | $ | 69,662 | |
| | | | | | | | | | |
| | At December 31, 2015, the aggregate value of these securities was $89,323, which represents 0.0% of total net assets. |
| (3) | These securities are valued in good faith at fair value as determined under policies and procedures established by and under the supervision of the Board of Directors. At December 31, 2015, the aggregate fair value of these securities was $89,323, which represents 0.0% of total net assets. This amount excludes securities that are principally traded in certain foreign markets and whose prices are adjusted pursuant to a third party pricing service methodology approved by the Board of Directors. |
| † | See Significant Accounting Policies of accompanying Notes to Financial Statements regarding valuation of investments. |
| | |
| GLOSSARY: (abbreviations used in preceding Schedule of Investments) |
|
| Other Abbreviations: |
ADR | | American Depositary Receipt |
REIT | | Real Estate Investment Trust |
The accompanying notes are an integral part of these financial statements.
|
| Hartford Global Growth HLS Fund |
Schedule of Investments – (continued)
December 31, 2015
Fair Valuation Summary
The following is a summary of the fair valuations according to the inputs used as of December 31, 2015 in valuing the Fund’s investments.
| | | | | | | | | | | | | | | | |
| | | Total | | | Level 1(1) | | | Level 2(1) | | | Level 3 | |
Assets | |
Common Stocks | | | | | | | | | | | | | | | | |
Banks | | $ | 19,679,518 | | | $ | 12,038,268 | | | $ | 7,641,250 | | | $ | — | |
Capital Goods | | | 15,433,100 | | | | 2,874,900 | | | | 12,558,200 | | | | — | |
Commercial & Professional Services | | | 8,931,271 | | | | 8,931,271 | | | | — | | | | — | |
Consumer Durables & Apparel | | | 18,241,864 | | | | 5,550,442 | | | | 12,691,422 | | | | — | |
Consumer Services | | | 7,689,834 | | | | 5,096,803 | | | | 2,593,031 | | | | — | |
Diversified Financials | | | 35,748,237 | | | | 24,691,883 | | | | 11,056,354 | | | | — | |
Energy | | | 6,798,252 | | | | 3,920,257 | | | | 2,877,995 | | | | — | |
Food & Staples Retailing | | | 10,868,867 | | | | 7,310,263 | | | | 3,558,604 | | | | — | |
Food, Beverage & Tobacco | | | 29,908,902 | | | | 16,213,109 | | | | 13,695,793 | | | | — | |
Health Care Equipment & Services | | | 16,074,067 | | | | 13,416,050 | | | | 2,658,017 | | | | — | |
Household & Personal Products | | | 13,110,083 | | | | 7,249,099 | | | | 5,860,984 | | | | — | |
Insurance | | | 19,137,172 | | | | 12,894,112 | | | | 6,243,060 | | | | — | |
Materials | | | 4,936,714 | | | | — | | | | 4,936,714 | | | | — | |
Media | | | 12,825,623 | | | | 7,392,122 | | | | 5,433,501 | | | | — | |
Pharmaceuticals, Biotechnology & Life Sciences | | | 68,344,132 | | | | 42,234,337 | | | | 26,109,795 | | | | — | |
Real Estate | | | 3,315,011 | | | | 3,315,011 | | | | — | | | | — | |
Retailing | | | 49,456,879 | | | | 46,649,776 | | | | 2,807,103 | | | | — | |
Semiconductors & Semiconductor Equipment | | | 8,622,286 | | | | 2,923,475 | | | | 5,698,811 | | | | — | |
Software & Services | | | 101,249,405 | | | | 92,650,746 | | | | 8,544,319 | | | | 54,340 | |
Technology Hardware & Equipment | | | 10,103,374 | | | | 5,348,053 | | | | 4,720,338 | | | | 34,983 | |
Telecommunication Services | | | 5,717,355 | | | | 3,307,244 | | | | 2,410,111 | | | | — | |
Transportation | | | 6,326,447 | | | | 6,326,447 | | | | — | | | | — | |
Warrants | | | 2,029 | | | | 2,029 | | | | — | | | | — | |
Rights | | | 4 | | | | 4 | | | | — | | | | — | |
Short-Term Investments | | | 5,452,375 | | | | 5,452,375 | | | | — | | | | — | |
| | | | | | | | | | | | | | | | |
Total | | $ | 477,972,801 | | | $ | 335,788,076 | | | $ | 142,095,402 | | | $ | 89,323 | |
| | | | | | | | | | | | | | | | |
| (1) | For the year ended December 31, 2015, there were no transfers between Level 1 and Level 2. |
The following is a rollforward of the Fund’s investments that were valued using unobservable inputs (Level 3) for the year ended December 31, 2015:
| | | | | | | | | | | | | | | | |
| | | Common Stocks | | | Preferred Stocks | | | Warrants | | | Total | |
Beginning balance | | $ | 61,458 | | | $ | 33,572 | | | $ | — | | | $ | 95,030 | |
Purchases | | | 37,302 | | | | — | | | | — | | | | 37,302 | |
Sales | | | — | | | | (37,302 | ) | | | — | | | | (37,302 | ) |
Accrued discounts/(premiums) | | | — | | | | — | | | | — | | | | — | |
Total realized gain/(loss) | | | — | | | | — | | | | — | | | | — | |
Net change in unrealized appreciation/depreciation | | | (9,437 | ) | | | 3,730 | | | | — | | | | (5,707 | ) |
Transfers into Level 3(1) | | | — | | | | — | | | | — | | | | — | |
Transfers out of Level 3(1) | | | — | | | | — | | | | — | | | | — | |
| | | | | | | | | | | | | | | | |
Ending balance | | $ | 89,323 | | | $ | — | | | $ | — | | | $ | 89,323 | |
| | | | | | | | | | | | | | | | |
The change in net unrealized appreciation/depreciation relating to the Level 3 investments held at December 31, 2015 was $(9,437).
| (1) | Investments are transferred into and out of Level 3 for a variety of reasons including, but not limited to: |
| | a) | Investments where trading has been halted (transfer into Level 3) or investments where trading has resumed (transfer out of Level 3). |
| | b) | Broker quoted investments (transfer into Level 3) or quoted prices in active markets (transfer out of Level 3). |
| | c) | Investments that have certain restrictions on trading (transfer into Level 3) or investments where trading restrictions have expired (transfer out of Level 3). |
| Note: | For purposes of reporting transfers between different hierarchy levels, both transfers in and out of each level, as applicable, are shown as if they occurred at the beginning of the period. |
The accompanying notes are an integral part of these financial statements.
|
| Hartford Growth Opportunities HLS Fund |
Schedule of Investments
December 31, 2015
| | | | | | | | | | |
Shares or Principal Amount | | Market Value† | |
| COMMON STOCKS - 91.4% | |
| | | | | | Automobiles & Components - 0.6% | |
| | | 33,624 | | | Tesla Motors, Inc.* | | $ | 8,070,096 | |
| | | | | | | | | | |
| | | | | | Banks - 3.6% | |
| | | 1,033,589 | | | Bank of America Corp. | | | 17,395,303 | |
| | | 617,114 | | | Citizens Financial Group, Inc. | | | 16,162,216 | |
| | | 170,565 | | | PNC Financial Services Group, Inc. | | | 16,256,550 | |
| | | | | | | | | | |
| | | | | | | | | 49,814,069 | |
| | | | | | | | | | |
| | | | | | Capital Goods - 7.3% | |
| | | 341,633 | | | AerCap Holdings N.V.* | | | 14,744,880 | |
| | | 242,866 | | | AMETEK, Inc. | | | 13,015,189 | |
| | | 204,037 | | | Danaher Corp. | | | 18,950,957 | |
| | | 51,326 | | | DigitalGlobe, Inc.* | | | 803,765 | |
| | | 432,785 | | | Fastenal Co. | | | 17,666,284 | |
| | | 291,665 | | | Fortune Brands Home & Security, Inc. | | | 16,187,407 | |
| | | 175,900 | | | Middleby Corp.* | | | 18,974,333 | |
| | | | | | | | | | |
| | | | | | | | | 100,342,815 | |
| | | | | | | | | | |
| | | | | | Commercial & Professional Services - 1.2% | |
| | | 18,785 | | | Klarna Holding AB*(1)(2) | | | 1,928,452 | |
| | | 126,162 | | | Stericycle, Inc.* | | | 15,215,137 | |
| | | | | | | | | | |
| | | | | | | | | 17,143,589 | |
| | | | | | | | | | |
| | | | | | Consumer Durables & Apparel - 2.1% | |
| | | 187,892 | | | Harman International Industries, Inc. | | | 17,701,305 | |
| | | 3,892,130 | | | Samsonite International S.A. | | | 11,664,624 | |
| | | | | | | | | | |
| | | | | | | | | 29,365,929 | |
| | | | | | | | | | |
| | | | | | Consumer Services - 3.6% | |
| | | 515,611 | | | Diamond Resorts International, Inc.* | | | 13,153,236 | |
| | | 116,423 | | | Panera Bread Co. Class A* | | | 22,676,872 | |
| | | 195,141 | | | Wyndham Worldwide Corp. | | | 14,176,994 | |
| | | | | | | | | | |
| | | | | | | | | 50,007,102 | |
| | | | | | | | | | |
| | | | | | Diversified Financials - 3.4% | |
| | | 621,393 | | | Double Eagle Acquisition Corp.* | | | 6,213,930 | |
| | | 102,400 | | | Invesco Ltd. | | | 3,428,352 | |
| | | 137,565 | | | McGraw Hill Financial, Inc. | | | 13,561,157 | |
| | | 178,698 | | | Northern Trust Corp. | | | 12,882,339 | |
| | | 193,900 | | | Raymond James Financial, Inc. | | | 11,240,383 | |
| | | | | | | | | | |
| | | | | | | | | 47,326,161 | |
| | | | | | | | | | |
| | | | | | Energy - 1.1% | |
| | | 51,009 | | | Concho Resources, Inc.* | | | 4,736,696 | |
| | | 77,080 | | | Diamondback Energy, Inc.* | | | 5,156,652 | |
| | | 42,322 | | | Pioneer Natural Resources Co. | | | 5,306,332 | |
| | | | | | | | | | |
| | | | | | | | | 15,199,680 | |
| | | | | | | | | | |
| | | | | | Food, Beverage & Tobacco - 4.4% | |
| | | 541,007 | | | Mondelez International, Inc. Class A | | | 24,258,754 | |
| | | 159,581 | | | Monster Beverage Corp.* | | | 23,771,186 | |
| | | 1,056,248 | | | Nomad Foods Ltd.* | | | 12,463,726 | |
| | | | | | | | | | |
| | | | | | | | | 60,493,666 | |
| | | | | | | | | | |
| | | | | | Health Care Equipment & Services - 9.2% | |
| | | 74,097 | | | athenahealth, Inc.* | | | 11,927,394 | |
| | | 138,985 | | | Becton Dickinson and Co. | | | 21,416,199 | |
| | | 962,507 | | | Boston Scientific Corp.* | | | 17,748,629 | |
| | | 383,714 | | | Cerner Corp.* | | | 23,088,071 | |
| | | 156,820 | | | ConforMIS, Inc.* | | | 2,711,418 | |
| | | 60,621 | | | DexCom, Inc.* | | | 4,964,860 | |
| | | 592,857 | | | Hologic, Inc.* | | | 22,937,637 | |
| | | | | | | | | | |
Shares or Principal Amount | | Market Value† | |
| COMMON STOCKS - 91.4% - (continued) | |
| | | | | | Health Care Equipment & Services - 9.2% - (continued) | |
| | | 38,760 | | | Intuitive Surgical, Inc.* | | $ | 21,169,162 | |
| | | | | | | | | | |
| | | | | | | | | 125,963,370 | |
| | | | | | | | | | |
| | | | | | Household & Personal Products - 1.1% | |
| | | 166,993 | | | Estee Lauder Cos., Inc. Class A | | | 14,705,404 | |
| | | | | | | | | | |
| | | | | | Insurance - 0.9% | |
| | | 207,132 | | | American International Group, Inc. | | | 12,835,970 | |
| | | | | | | | | | |
| | | | | | Materials - 1.2% | |
| | | 1,259,516 | | | Platform Specialty Products Corp.* | | | 16,159,590 | |
| | | | | | | | | | |
| | | | | | Pharmaceuticals, Biotechnology & Life
Sciences - 14.1% | |
| | | 87,433 | | | Allergan plc* | | | 27,322,812 | |
| | | 297,493 | | | AstraZeneca plc | | | 20,094,853 | |
| | | 698,135 | | | Bristol-Myers Squibb Co. | | | 48,024,707 | |
| | | 143,542 | | | Celgene Corp.* | | | 17,190,590 | |
| | | 223,980 | | | Eisai Co., Ltd. | | | 14,816,444 | |
| | | 36,068 | | | Illumina, Inc.* | | | 6,923,072 | |
| | | 33,597 | | | Incyte Corp.* | | | 3,643,595 | |
| | | 367,688 | | | Merck & Co., Inc. | | | 19,421,280 | |
| | | 484,945 | | | Mylan N.V.* | | | 26,220,976 | |
| | | 19,647 | | | Regeneron Pharmaceuticals, Inc.* | | | 10,665,767 | |
| | | | | | | | | | |
| | | | | | | | | 194,324,096 | |
| | | | | | | | | | |
| | | | | | Real Estate - 2.8% | |
| | | 247,543 | | | American Tower Corp. REIT | | | 23,999,294 | |
| | | 395,417 | | | CBRE Group, Inc. Class A* | | | 13,673,520 | |
| | | 29,318 | | | WeWork Companies, Inc. Class A(1)(2) | | | 1,214,938 | |
| | | | | | | | | | |
| | | | | | | | | 38,887,752 | |
| | | | | | | | | | |
| | | | | | Retailing - 7.2% | |
| | | 60,904 | | | Advance Auto Parts, Inc. | | | 9,166,661 | |
| | | 89,642 | | | Amazon.com, Inc.* | | | 60,588,131 | |
| | | 43,732 | | | Honest Co.(1)(2) | | | 1,982,372 | |
| | | 41,578 | | | JAND, Inc. Class A(1)(2) | | | 429,782 | |
| | | 16,351 | | | Priceline Group, Inc.* | | | 20,846,708 | |
| | | 94,537 | | | Tory Burch LLC*(1)(2) | | | 5,002,893 | |
| | | | | | | | | | |
| | | | | | | | | 98,016,547 | |
| | | | | | | | | | |
| | | | | | Semiconductors & Semiconductor Equipment - 1.9% | |
| | | 157,953 | | | ASML Holding N.V. | | | 14,021,488 | |
| | | 151,187 | | | NXP Semiconductors N.V.* | | | 12,737,505 | |
| | | | | | | | | | |
| | | | | | | | | 26,758,993 | |
| | | | | | | | | | |
| | | | | | Software & Services - 19.4% | |
| | | 233,522 | | | Akamai Technologies, Inc.* | | | 12,290,263 | |
| | | 191,016 | | | Alibaba Group Holding Ltd. ADR* | | | 15,523,870 | |
| | | 46,762 | | | Alphabet, Inc. Class A* | | | 36,381,304 | |
| | | 45,846 | | | Alphabet, Inc. Class C* | | | 34,791,613 | |
| | | 176,884 | | | Apigee Corp.* | | | 1,420,379 | |
| | | 120,808 | | | CoStar Group, Inc.* | | | 24,969,806 | |
| | | 440,502 | | | Facebook, Inc. Class A* | | | 46,102,939 | |
| | | 199,329 | | | Mobileye N.V.* | | | 8,427,630 | |
| | | 228,196 | | | ServiceNow, Inc.* | | | 19,752,646 | |
| | | 184,586 | | | SS&C Technologies Holdings, Inc. | | | 12,601,686 | |
| | | 75,900 | | | Tableau Software, Inc. Class A* | | | 7,151,298 | |
| | | 973,100 | | | Tencent Holdings Ltd. | | | 19,053,267 | |
| | | 213,177 | | | Workday, Inc. Class A* | | | 16,985,943 | |
| | | 130,209 | | | Zillow Group, Inc. Class A* | | | 3,390,642 | |
| | | 316,792 | | | Zillow Group, Inc. Class C* | | | 7,438,276 | |
| | | | | | | | | | |
| | | | | | | | | 266,281,562 | |
| | | | | | | | | | |
| | | | | | Technology Hardware & Equipment - 5.0% | |
| | | 218,488 | | | Apple, Inc. | | | 22,998,047 | |
| | | 166,526 | | | Arista Networks, Inc.* | | | 12,962,384 | |
The accompanying notes are an integral part of these financial statements.
|
| Hartford Growth Opportunities HLS Fund |
Schedule of Investments – (continued)
December 31, 2015
| | | | | | | | | | | | |
Shares or Principal Amount | | Market Value† | |
| COMMON STOCKS - 91.4% - (continued) | |
| | | | | | | Technology Hardware & Equipment - 5.0% - (continued) | |
| | | | | 335,392 | | | CDW Corp. of Delaware | | $ | 14,099,880 | |
| | | | | 80,424 | | | Palo Alto Networks, Inc.* | | | 14,165,883 | |
| | | | | 27,200 | | | Pure Storage, Inc. Class A* | | | 423,504 | |
| | | | | 268,363 | | | Pure Storage, Inc. Class B*(1)(2) | | | 3,957,884 | |
| | | | | | | | | | | | |
| | | | | | | | | | | 68,607,582 | |
| | | | | | | | | | | | |
| | | | | | | Transportation - 1.3% | |
| | | | | 231,745 | | | Kansas City Southern | | | 17,304,399 | |
| | | | | | | | | | | | |
| | | |
| | | | | | | | Total Common Stocks
(cost $1,172,998,141) | | $ | 1,257,608,372 | |
| | | | | | | | | | | | |
|
| CORPORATE BONDS - 0.1% | |
| | | | | | | Internet - 0.1% | | | |
| | $ | | | | 705,896 | | | DraftKings, Inc.
5.00%, 12/23/2016*(1)(2) | | $ | 705,896 | |
| | | | | | | | | | | | |
| | | |
| | | | | | | | Total Corporate Bonds
(cost $705,896) | | $ | 705,896 | |
| | | | | | | | | | | | |
|
| PREFERRED STOCKS - 7.7% | |
| | | | | | | Capital Goods - 0.6% | |
| | | | | 1,458,400 | | | Lithium Technology Corp.*(1)(2) | | $ | 8,152,456 | |
| | | | | | | | | | | | |
| | | | | | | Consumer Services - 0.1% | | | |
| | | | | 874,073 | | | DraftKings, Inc.(1)(2) | | | 1,774,368 | |
| | | | | | | | | | | | |
| | | | | | | Real Estate - 1.0% | | | |
| | | | | 879,569 | | | Redfin Corp. Series G(1)(2) | | | 3,148,857 | |
| | | | | 145,709 | | | WeWork Companies, Inc.
Class D-1(1)(2) | | | 6,038,181 | |
| | | | | 114,486 | | | WeWork Companies, Inc.
Class D-2(1)(2) | | | 4,744,300 | |
| | | | | | | | | | | | |
| | | | | | | | | | | 13,931,338 | |
| | | | | | | | | | | | |
| | | | | | | Retailing - 0.5% | | | |
| | | | | 160,575 | | | Forward Ventures, Inc.(1)(2) | | | 6,450,298 | |
| | | | | 92,843 | | | JAND, Inc. Series D(1)(2) | | | 959,696 | |
| | | | | | | | | | | | |
| | | | | | | | | | | 7,409,994 | |
| | | | | | | | | | | | |
| | | | | | | Software & Services - 5.2% | | | |
| | | | | 535,139 | | | Birst, Inc. Series F(1)(2) | | | 2,793,426 | |
| | | | | 1,871,878 | | | Essence Group Holdings Corp.(1)(2) | | | 3,388,099 | |
| | | | | 236,310 | | | ForeScout Technologies, Inc.(1)(2) | | | 2,523,862 | |
| | | | | 50,806 | | | General Assembly Space, Inc.(1)(2) | | | 2,241,500 | |
| | | | | 287,204 | | | Lookout, Inc. Series F(1)(2) | | | 2,263,168 | |
| | | | | 366,944 | | | MarkLogic Corp. Series F(1)(2) | | | 4,282,236 | |
| | | | | 227,914 | | | Nutanix, Inc.(1)(2) | | | 3,724,115 | |
| | | | | 97,758 | | | Pinterest, Inc. Series G(1)(2) | | | 3,158,162 | |
| | | | | 759,876 | | | Uber Technologies, Inc.(1)(2) | | | 37,060,845 | |
| | | | | 210,735 | | | Veracode, Inc.(1)(2) | | | 5,719,348 | |
| | | | | 1,160,072 | | | Zuora, Inc. Series F(1)(2) | | | 4,802,698 | |
| | | | | | | | | | | | |
| | | | | | | | | | | 71,957,459 | |
| | | | | | | | | | | | |
| | | | | | | Telecommunication Services - 0.3% | | | |
| | | | | 7,944 | | | DocuSign, Inc. Series B(1)(2) | | | 151,571 | |
| | | | | 2,379 | | | DocuSign, Inc. Series B-1(1)(2) | | | 45,391 | |
| | | | | 5,708 | | | DocuSign, Inc. Series D(1)(2) | | | 108,909 | |
| | | | | 147,634 | | | DocuSign, Inc. Series E(1)(2) | | | 2,816,857 | |
| | | | | 25,098 | | | DocuSign, Inc. Series F(1)(2) | | | 478,870 | |
| | | | | | | | | | | | |
| | | | | | | | | | | 3,601,598 | |
| | | | | | | | | | | | |
| | | |
| | | | | | | | Total Preferred Stocks
(cost $70,181,781) | | $ | 106,827,213 | |
| | | | | | | | | | | | |
| | | | | | |
Shares or Principal Amount | | Market Value† |
| | | | | | | | | | | | | | |
| CONVERTIBLE PREFERRED STOCKS - 0.3% | |
| | | | | | Retailing - 0.3% | | | | | | |
| | | 102,040 | | | Honest Co. Series C(1)(2) | | | | | | $ | 4,625,473 | |
| | | | | | | | | | | | | | |
| | | | |
| | | | | | Total Convertible Preferred Stocks
(cost $2,760,927) | | | | | | $ | 4,625,473 | |
| | | | | | | | | | | | | | |
| | | | |
| | | | | | Total Long-Term Investments
(cost $1,246,646,745) | | | | | | $ | 1,369,766,954 | |
| | | | | | | | | | | | | | |
|
| SHORT-TERM INVESTMENTS - 0.8% | |
| | | | | | Other Investment Pools & Funds - 0.8% | |
| | | 10,436,602 | | | Federated Prime Obligations Fund | | | | | | $ | 10,436,602 | |
| | | | | | | | | | | | | | |
| | | | |
| | | | | | Total Short-Term Investments
(cost $10,436,602) | | | | | | $ | 10,436,602 | |
| | | | | | | | | | | | | | |
| | | | |
| | | | | | Total Investments
(cost $1,257,083,347)^ | | | 100.3 | % | | $ | 1,380,203,556 | |
| | | | | | Other Assets and Liabilities | | | (0.3 | )% | | | (4,216,758 | ) |
| | | | | | | | | | | | | | |
| | | | | | Total Net Assets | | | 100.0 | % | | $ | 1,375,986,798 | |
| | | | | | | | | | | | | | |
The accompanying notes are an integral part of these financial statements.
|
| Hartford Growth Opportunities HLS Fund |
Schedule of Investments – (continued)
December 31, 2015
| Note: | Percentage of investments as shown is the ratio of the total market value to total net assets. |
| | Prices of foreign equities that are principally traded on certain foreign markets may be adjusted daily pursuant to a fair value pricing service approved by the Board of Directors in order to reflect an adjustment for factors occurring after the close of certain foreign markets but before the close of the New York Stock Exchange. |
| | Equity industry classifications used in this report are the Global Industry Classification Standard, which was developed by and is the exclusive property and service mark of MSCI, Inc. and Standard & Poor’s. |
| | For Fund compliance purposes, the Fund may not use the same classification system shown in this report as these classifications are used for financial reporting purposes. |
| ^ | At December 31, 2015, the cost of securities for federal income tax purposes was $1,266,201,383 and the aggregate gross unrealized appreciation and depreciation based on that cost were: |
| | | | |
Unrealized Appreciation | | $ | 157,664,519 | |
Unrealized Depreciation | | | (43,662,346 | ) |
| | | | |
Net Unrealized Appreciation | | $ | 114,002,173 | |
| | | | |
| (1) | The following securities are considered illiquid. Illiquid securities are often purchased in private placement transactions, are often not registered under the Securities Act of 1933, as amended, and may have contractual restrictions on resale. A security may also be considered illiquid if the security lacks a readily available market or if its valuation has not changed for a certain period of time. |
| | | | | | | | | | |
Period
Acquired | | Shares/Par | | | Security | | Cost Basis | |
| 03/2015 | | | 535,139 | | | Birst, Inc. Series F Preferred | | $ | 3,125,693 | �� |
| 02/2014 | | | 7,944 | | | DocuSign, Inc. Series B Preferred | | | 104,324 | |
| 02/2014 | | | 2,379 | | | DocuSign, Inc. Series B-1 Preferred | | | 31,242 | |
| 02/2014 | | | 5,708 | | | DocuSign, Inc. Series D Preferred | | | 74,960 | |
| 02/2014 | | | 147,634 | | | DocuSign, Inc. Series E Preferred | | | 1,938,789 | |
| 04/2015 | | | 25,098 | | | DocuSign, Inc. Series F Preferred | | | 479,198 | |
| 12/2015 | | | 705,896 | | | DraftKings, Inc. | | | 705,896 | |
| 12/2014 | | | 874,073 | | | DraftKings, Inc. Preferred | | | 1,574,452 | |
| 05/2014 | | | 1,871,878 | | | Essence Group Holdings Corp. Preferred | | | 2,960,001 | |
| 11/2015 | | | 236,310 | | | ForeScout Technologies, Inc. Preferred | | | 2,804,291 | |
| 11/2014 | | | 160,575 | | | Forward Ventures, Inc. Preferred | | | 4,998,894 | |
| 07/2015 | | | 50,806 | | | General Assembly Space, Inc. Preferred | | | 2,490,556 | |
| 08/2014 | | | 43,732 | | | Honest Co. | | | 1,183,270 | |
| 08/2014 | | | 102,040 | | | Honest Co. Series C Convertible Preferred | | | 2,760,927 | |
| 04/2015 | | | 41,578 | | | JAND, Inc. Class A | | | 477,536 | |
| 04/2015 | | | 92,843 | | | JAND, Inc. Series D Preferred | | | 1,066,330 | |
| 08/2015 | | | 18,785 | | | Klarna Holding AB | | | 2,060,349 | |
| 08/2013 | | | 1,458,400 | | | Lithium Technology Corp. Preferred | | | 7,108,242 | |
| 07/2014 | | | 287,204 | | | Lookout, Inc. Series F Preferred | | | 3,280,760 | |
| 04/2015 | | | 366,944 | | | MarkLogic Corp. Series F Preferred | | | 4,261,761 | |
| 08/2014 | | | 227,914 | | | Nutanix, Inc. Preferred | | | 3,053,250 | |
| 03/2015 | | | 97,758 | | | Pinterest, Inc. Series G Preferred | | | 3,509,068 | |
| 10/2015 | | | 268,363 | | | Pure Storage, Inc. Class B | | | 4,220,250 | |
| 12/2014 | | | 879,569 | | | Redfin Corp. Series G Preferred | | | 2,900,554 | |
| 11/2013 | | | 94,537 | | | Tory Burch LLC | | | 7,409,472 | |
| 06/2014 | | | 759,876 | | | Uber Technologies, Inc. Preferred | | | 11,787,994 | |
| 08/2014 | | | 210,735 | | | Veracode, Inc. Preferred | | | 3,891,411 | |
| 12/2014 | | | 29,318 | | | WeWork Companies, Inc. Class A | | | 488,179 | |
| 12/2014 | | | 145,709 | | | WeWork Companies, Inc. Class D-1 Preferred | | | 2,426,224 | |
| 12/2014 | | | 114,486 | | | WeWork Companies, Inc. Class D-2 Preferred | | | 1,906,325 | |
| 01/2015 | | | 1,160,072 | | | Zuora, Inc. Series F Preferred | | | 4,407,462 | |
| | | | | | | | | | |
| | | | | | | | $ | 89,487,660 | |
| | | | | | | | | | |
| | At December 31, 2015, the aggregate value of these securities was $126,674,903, which represents 9.2% of total net assets. |
| (2) | These securities are valued in good faith at fair value as determined under policies and procedures established by and under the supervision of the Board of Directors. At December 31, 2015, the aggregate fair value of these securities was $126,674,903, which represents 9.2% of total net assets. This amount excludes securities that are principally traded in certain foreign markets and whose prices are adjusted pursuant to a third party pricing service methodology approved by the Board of Directors. |
| † | See Significant Accounting Policies of accompanying Notes to Financial Statements regarding valuation of investments. |
The accompanying notes are an integral part of these financial statements.
|
| Hartford Growth Opportunities HLS Fund |
Schedule of Investments – (continued)
December 31, 2015
| | |
| GLOSSARY: (abbreviations used in preceding Schedule of Investments) |
|
| Other Abbreviations: |
ADR | | American Depositary Receipt |
REIT | | Real Estate Investment Trust |
The accompanying notes are an integral part of these financial statements.
|
| Hartford Growth Opportunities HLS Fund |
Schedule of Investments – (continued)
December 31, 2015
Fair Valuation Summary
The following is a summary of the fair valuations according to the inputs used as of December 31, 2015 in valuing the Fund’s investments.
| | | | | | | | | | | | | | | | |
| | | Total | | | Level 1(1) | | | Level 2(1) | | | Level 3 | |
Assets | | | | | | | | | | | | | | | | |
Common Stocks | | | | | | | | | | | | | | | | |
Automobiles & Components | | $ | 8,070,096 | | | $ | 8,070,096 | | | $ | — | | | $ | — | |
Banks | | | 49,814,069 | | | | 49,814,069 | | | | — | | | | — | |
Capital Goods | | | 100,342,815 | | | | 100,342,815 | | | | — | | | | — | |
Commercial & Professional Services | | | 17,143,589 | | | | 15,215,137 | | | | — | | | | 1,928,452 | |
Consumer Durables & Apparel | | | 29,365,929 | | | | 17,701,305 | | | | 11,664,624 | | | | — | |
Consumer Services | | | 50,007,102 | | | | 50,007,102 | | | | — | | | | — | |
Diversified Financials | | | 47,326,161 | | | | 47,326,161 | | | | — | | | | — | |
Energy | | | 15,199,680 | | | | 15,199,680 | | | | — | | | | — | |
Food, Beverage & Tobacco | | | 60,493,666 | | | | 60,493,666 | | | | — | | | | — | |
Health Care Equipment & Services | | | 125,963,370 | | | | 125,963,370 | | | | — | | | | — | |
Household & Personal Products | | | 14,705,404 | | | | 14,705,404 | | | | — | | | | — | |
Insurance | | | 12,835,970 | | | | 12,835,970 | | | | — | | | | — | |
Materials | | | 16,159,590 | | | | 16,159,590 | | | | — | | | | — | |
Pharmaceuticals, Biotechnology & Life Sciences | | | 194,324,096 | | | | 159,412,799 | | | | 34,911,297 | | | | — | |
Real Estate | | | 38,887,752 | | | | 37,672,814 | | | | — | | | | 1,214,938 | |
Retailing | | | 98,016,547 | | | | 90,601,500 | | | | — | | | | 7,415,047 | |
Semiconductors & Semiconductor Equipment | | | 26,758,993 | | | | 26,758,993 | | | | — | | | | — | |
Software & Services | | | 266,281,562 | | | | 247,228,295 | | | | 19,053,267 | | | | — | |
Technology Hardware & Equipment | | | 68,607,582 | | | | 64,649,698 | | | | — | | | | 3,957,884 | |
Transportation | | | 17,304,399 | | | | 17,304,399 | | | | — | | | | — | |
Corporate Bonds | | | 705,896 | | | | — | | | | — | | | | 705,896 | |
Preferred Stocks | | | 106,827,213 | | | | — | | | | — | | | | 106,827,213 | |
Convertible Preferred Stocks | | | 4,625,473 | | | | — | | | | — | | | | 4,625,473 | |
Short-Term Investments | | | 10,436,602 | | | | 10,436,602 | | | | — | | | | — | |
| | | | | | | | | | | | | | | | |
Total | | $ | 1,380,203,556 | | | $ | 1,187,899,465 | | | $ | 65,629,188 | | | $ | 126,674,903 | |
| | | | | | | | | | | | | | | | |
| (1) | For the year ended December 31, 2015, investments valued at $5,358,579 were transferred from Level 2 to Level 1, and there were no transfers from Level 1 to Level 2. Investments are transferred between Level 1 and Level 2 for a variety of reasons including, but not limited to: |
| | a) | Foreign equities for which a fair value price is more representative of exit value than the local market close (transfer into Level 2). Foreign equities for which the local market close is more representative of exit value (transfer into Level 1). |
| | b) | Equity investments with no observable trading but a bid or mean price is used (transfer into Level 2). Equity investments using observable quoted prices in an active market (transfer into Level 1). |
The accompanying notes are an integral part of these financial statements.
|
| Hartford Growth Opportunities HLS Fund |
Schedule of Investments – (continued)
December 31, 2015
The following is a rollforward of the Fund’s investments that were valued using unobservable inputs (Level 3) for the year ended December 31, 2015:
| | | | | | | | | | | | | | | | | | | | |
| | | Common
Stocks | | | Preferred
Stocks | | | Convertible
Bonds | | | Convertible
Preferred Stocks | | | Total | |
Beginning balance | | $ | 9,291,769 | | | $ | 76,924,499 | | | $ | — | | | $ | 2,785,692 | | | $ | 89,001,960 | |
Purchases | | | 6,758,135 | | | | 22,144,360 | | | | 705,896 | | | | — | | | | 29,608,391 | |
Sales | | | (1,850,156 | ) | | | (18,744,235 | ) | | | — | | | | — | | | | (20,594,391 | ) |
Accrued discounts/(premiums) | | | — | | | | — | | | | — | | | | — | | | | — | |
Total realized gain/(loss) | | | — | | | | 3,267,872 | | | | — | | | | — | | | | 3,267,872 | |
Net change in unrealized appreciation/depreciation | | | 316,573 | | | | 23,234,717 | | | | — | | | | 1,839,781 | | | | 25,391,071 | |
Transfers into Level 3(1) | | | — | | | | — | | | | — | | | | — | | | | — | |
Transfers out of Level 3(1) | | | — | | | | — | | | | — | | | | — | | | | — | |
| | | | | | | | | | | | | | | | | | | | |
Ending balance | | $ | 14,516,321 | | | $ | 106,827,213 | | | $ | 705,896 | | | $ | 4,625,473 | | | $ | 126,674,903 | |
| | | | | | | | | | | | | | | | | | | | |
The change in net unrealized appreciation/depreciation relating to the Level 3 investments held at December 31, 2015 was $27,718,830.
| (1) | Investments are transferred into and out of Level 3 for a variety of reasons including, but not limited to: |
| | a) | Investments where trading has been halted (transfer into Level 3) or investments where trading has resumed (transfer out of Level 3). |
| | b) | Broker quoted investments (transfer into Level 3) or quoted prices in active markets (transfer out of Level 3). |
| | c) | Investments that have certain restrictions on trading (transfer into Level 3) or investments where trading restrictions have expired (transfer out of Level 3). |
| Note: | For purposes of reporting transfers between different hierarchy levels, both transfers in and out of each level, as applicable, are shown as if they occurred at the beginning of the period. |
The accompanying notes are an integral part of these financial statements.
|
| Hartford Healthcare HLS Fund |
Schedule of Investments
December 31, 2015
| | | | | | | | |
Shares or Principal Amount | | Market Value† | |
| COMMON STOCKS - 97.6% | |
| | | | Biotechnology - 24.8% | |
| | 31,790 | | | Acorda Therapeutics, Inc.* | | $ | 1,359,976 | |
| | 18,110 | | | Alder Biopharmaceuticals, Inc.* | | | 598,173 | |
| | 144,732 | | | Alkermes plc* | | | 11,488,826 | |
| | 44,480 | | | Alnylam Pharmaceuticals, Inc.* | | | 4,187,347 | |
| | 52,627 | | | Anacor Pharmaceuticals, Inc.* | | | 5,945,272 | |
| | 642,780 | | | Arena Pharmaceuticals, Inc.* | | | 1,221,282 | |
| | 190,170 | | | BioCryst Pharmaceuticals, Inc.* | | | 1,962,554 | |
| | 7,182 | | | Biogen, Inc.* | | | 2,200,206 | |
| | 89,630 | | | Cepheid* | | | 3,274,184 | |
| | 3,030 | | | Chiasma, Inc.* | | | 59,297 | |
| | 135,857 | | | Dicerna Pharmaceuticals, Inc.* | | | 1,612,623 | |
| | 61,705 | | | Five Prime Therapeutics, Inc.* | | | 2,560,757 | |
| | 92,269 | | | Galapagos N.V.* | | | 5,697,615 | |
| | 169,379 | | | Gilead Sciences, Inc. | | | 17,139,461 | |
| | 131,230 | | | GlycoMimetics, Inc.* | | | 750,636 | |
| | 61,983 | | | Incyte Corp.* | | | 6,722,056 | |
| | 40,680 | | | Innate Pharma S.A.* | | | 597,198 | |
| | 134,483 | | | Ironwood Pharmaceuticals, Inc.* | | | 1,558,658 | |
| | 42,759 | | | Nivalis Therapeutics, Inc.* | | | 330,955 | |
| | 134,720 | | | Otonomy, Inc.* | | | 3,738,480 | |
| | 52,495 | | | Portola Pharmaceuticals, Inc.* | | | 2,700,868 | |
| | 24,040 | | | PTC Therapeutics, Inc.* | | | 778,896 | |
| | 23,656 | | | Regeneron Pharmaceuticals, Inc.* | | | 12,842,133 | |
| | 116,160 | | | Regulus Therapeutics, Inc.* | | | 1,012,915 | |
| | 228,710 | | | Rigel Pharmaceuticals, Inc.* | | | 692,991 | |
| | 19,632 | | | Seattle Genetics, Inc.* | | | 881,084 | |
| | 49,170 | | | T2 Biosystems, Inc.* | | | 537,920 | |
| | 86,485 | | | TESARO, Inc.* | | | 4,524,895 | |
| | 100,719 | | | Trevena, Inc.* | | | 1,057,550 | |
| | 39,531 | | | Vertex Pharmaceuticals, Inc.* | | | 4,974,186 | |
| | 85,700 | | | Voyager Therapeutics, Inc.* | | | 1,876,830 | |
| | | | | | | | |
| | | | | | | 104,885,824 | |
| | | | | | | | |
| | | | Drug Retail - 1.3% | |
| | 38,540 | | | CVS Health Corp. | | | 3,768,056 | |
| | 19,465 | | | Walgreens Boots Alliance, Inc. | | | 1,657,542 | |
| | | | | | | | |
| | | | | | | 5,425,598 | |
| | | | | | | | |
| | | | Health Care Distributors - 3.8% | |
| | 75,760 | | | Cardinal Health, Inc. | | | 6,763,095 | |
| | 47,390 | | | McKesson Corp. | | | 9,346,730 | |
| | | | | | | | |
| | | | | | | 16,109,825 | |
| | | | | | | | |
| | | | Health Care Equipment - 19.6% | |
| | 212,110 | | | Abbott Laboratories | | | 9,525,860 | |
| | 99,310 | | | AtriCure, Inc.* | | | 2,228,516 | |
| | 163,781 | | | Baxter International, Inc. | | | 6,248,245 | |
| | 46,193 | | | Becton Dickinson and Co. | | | 7,117,879 | |
| | 536,450 | | | Boston Scientific Corp.* | | | 9,892,138 | |
| | 46,880 | | | ConforMIS, Inc.* | | | 810,555 | |
| | 65,500 | | | EndoChoice Holdings, Inc.* | | | 546,925 | |
| | 170,072 | | | Globus Medical, Inc. Class A* | | | 4,731,403 | |
| | 24,420 | | | HeartWare International, Inc.* | | | 1,230,768 | |
| | 34,995 | | | Invuity, Inc.* | | | 308,656 | |
| | 162,870 | | | K2M Group Holdings, Inc.* | | | 3,215,054 | |
| | 246,792 | | | Medtronic plc | | | 18,983,241 | |
| | 106,858 | | | St. Jude Medical, Inc. | | | 6,600,619 | |
| | 62,550 | | | Stryker Corp. | | | 5,813,397 | |
| | 22,615 | | | Teleflex, Inc. | | | 2,972,742 | |
| | 179,547 | | | TriVascular Techonologies, Inc.* | | | 1,193,988 | |
| | 15,673 | | | Zimmer Biomet Holdings, Inc. | | | 1,607,893 | |
| | | | | | | | |
| | | | | | | 83,027,879 | |
| | | | | | | | |
| | | | | | | | |
Shares or Principal Amount | | Market Value† | |
| COMMON STOCKS - 97.6% - (continued) | |
| | | | Health Care Facilities - 2.9% | |
| | 26,490 | | | Acadia Healthcare Co., Inc.* | | $ | 1,654,565 | |
| | 36,734 | | | Al Noor Hospitals Group plc | | | 599,187 | |
| | 128,700 | | | Georgia Healthcare Group plc*(1) | | | 294,081 | |
| | 87,830 | | | HCA Holdings, Inc.* | | | 5,939,943 | |
| | 7,200 | | | LifePoint Health, Inc.* | | | 528,480 | |
| | 34,785 | | | NMC Health plc | | | 431,009 | |
| | 23,680 | | | Universal Health Services, Inc. Class B | | | 2,829,523 | |
| | | | | | | | |
| | | | | | | 12,276,788 | |
| | | | | | | | |
| | | | Health Care Services - 1.6% | |
| | 128,400 | | | Envision Healthcare Holdings, Inc.* | | | 3,334,548 | |
| | 27,570 | | | Team Health Holdings, Inc.* | | | 1,210,047 | |
| | 118,967 | | | Teladoc, Inc.* | | | 2,136,647 | |
| | | | | | | | |
| | | | | | | 6,681,242 | |
| | | | | | | | |
| | | | Health Care Supplies - 0.5% | |
| | 24,914 | | | Dentsply International, Inc. | | | 1,516,017 | |
| | 54,760 | | | Endologix, Inc.* | | | 542,124 | |
| | | | | | | | |
| | | | | | | 2,058,141 | |
| | | | | | | | |
| | | | Health Care Technology - 3.1% | |
| | 112,640 | | | Allscripts Healthcare Solutions, Inc.* | | | 1,732,403 | |
| | 23,670 | | | athenahealth, Inc.* | | | 3,810,160 | |
| | 86,269 | | | Cerner Corp.* | | | 5,190,806 | |
| | 51,640 | | | IMS Health Holdings, Inc.* | | | 1,315,271 | |
| | 61,364 | | | Inovalon Holdings, Inc. Class A* | | | 1,043,188 | |
| | | | | | | | |
| | | | | | | 13,091,828 | |
| | | | | | | | |
| | | | Internet Software & Services - 0.2% | |
| | 166,816 | | | Everyday Health, Inc.* | | | 1,004,232 | |
| | | | | | | | |
| | | | Life Sciences Tools & Services - 4.6% | |
| | 78,140 | | | Agilent Technologies, Inc. | | | 3,267,033 | |
| | 24,920 | | | Illumina, Inc.* | | | 4,783,270 | |
| | 35,960 | | | PRA Health Sciences, Inc.* | | | 1,627,909 | |
| | 25,090 | | | Quintiles Transnational Holdings, Inc.* | | | 1,722,679 | |
| | 56,000 | | | Thermo Fisher Scientific, Inc. | | | 7,943,600 | |
| | | | | | | | |
| | | | | | | 19,344,491 | |
| | | | | | | | |
| | | | Managed Health Care - 7.5% | |
| | 81,300 | | | Aetna, Inc. | | | 8,790,156 | |
| | 238,960 | | | Qualicorp S.A. | | | 853,461 | |
| | 164,140 | | | UnitedHealth Group, Inc. | | | 19,309,429 | |
| | 39,260 | | | WellCare Health Plans, Inc.* | | | 3,070,525 | |
| | | | | | | | |
| | | | | | | 32,023,571 | |
| | | | | | | | |
| | | | Pharmaceuticals - 27.7% | |
| | 134,390 | | | Aerie Pharmaceuticals, Inc.* | | | 3,272,397 | |
| | 82,342 | | | Allergan plc* | | | 25,731,875 | |
| | 313,940 | | | AstraZeneca plc ADR | | | 10,658,263 | |
| | 327,450 | | | Bristol-Myers Squibb Co. | | | 22,525,286 | |
| | 78,760 | | | Daiichi Sankyo Co., Ltd. | | | 1,625,582 | |
| | 48,170 | | | Eisai Co., Ltd. | | | 3,186,481 | |
| | 84,020 | | | Eli Lilly & Co. | | | 7,079,525 | |
| | 64,070 | | | Intersect ENT, Inc.* | | | 1,441,575 | |
| | 19,740 | | | Johnson & Johnson | | | 2,027,693 | |
| | 107,500 | | | Medicines Co.* | | | 4,014,050 | |
| | 78,140 | | | MediWound Ltd.* | | | 667,316 | |
| | 93,720 | | | Merck & Co., Inc. | | | 4,950,290 | |
| | 176,970 | | | Mylan N.V.* | | | 9,568,768 | |
| | 94,600 | | | MyoKardia, Inc.* | | | 1,386,836 | |
| | 203,698 | | | Navbriva Therapeutics AG ADR* | | | 1,945,316 | |
| | 42,560 | | | Ocular Therapeutix, Inc.* | | | 398,787 | |
The accompanying notes are an integral part of these financial statements.
|
| Hartford Healthcare HLS Fund |
Schedule of Investments – (continued)
December 31, 2015
| | | | | | | | |
Shares or Principal Amount | | Market Value† | |
| COMMON STOCKS - 97.6% - (continued) | |
| | | | Pharmaceuticals - 27.7% - (continued) | |
| | 15,100 | | | Ono Pharmaceutical Co., Ltd. | | $ | 2,692,506 | |
| | 17,459 | | | Revance Therapeutics, Inc.* | | | 596,399 | |
| | 174,270 | | | Shionogi & Co., Ltd. | | | 7,882,271 | |
| | 145,300 | | | Tetraphase Pharmaceuticals, Inc.* | | | 1,457,359 | |
| | 38,463 | | | UCB S.A. | | | 3,471,788 | |
| | 151,608 | | | XenoPort, Inc.* | | | 832,328 | |
| | | | | | | | |
| | | | | | | 117,412,691 | |
| | | | | | | | |
| | |
| | | | Total Common Stocks
(cost $308,141,545) | | $ | 413,342,110 | |
| | | | | | | | |
| | |
| | | | Total Long-Term Investments
(cost $308,141,545) | | $ | 413,342,110 | |
| | | | | | | | |
|
| SHORT-TERM INVESTMENTS - 2.0% | |
| | | | Other Investment Pools & Funds - 2.0% | |
| | 8,441,857 | | | Fidelity Money Market Class 1 | | $ | 8,441,857 | |
| | | | | | | | |
| | |
| | | | Total Short-Term Investments
(cost $8,441,857) | | $ | 8,441,857 | |
| | | | | | | | |
| | | | | | | | | | |
| | | |
| | Total Investments
(cost $316,583,402)^ | | | 99.6 | % | | $ | 421,783,967 | |
| | Other Assets and Liabilities | | | 0.4 | % | | | 1,643,306 | |
| | | | | | | | | | |
| | Total Net Assets | | | 100.0 | % | | $ | 423,427,273 | |
| | | | | | | | | | |
The accompanying notes are an integral part of these financial statements.
|
| Hartford Healthcare HLS Fund |
Schedule of Investments – (continued)
December 31, 2015
| Note: | Percentage of investments as shown is the ratio of the total market value to total net assets. |
| | Prices of foreign equities that are principally traded on certain foreign markets may be adjusted daily pursuant to a fair value pricing service approved by the Board of Directors in order to reflect an adjustment for factors occurring after the close of certain foreign markets but before the close of the New York Stock Exchange. |
| | Equity industry classifications used in this report are the Global Industry Classification Standard, which was developed by and is the exclusive property and service mark of MSCI, Inc. and Standard & Poor’s. |
| | For Fund compliance purposes, the Fund may not use the same classification system shown in this report as these classifications are used for financial reporting purposes. |
| ^ | At December 31, 2015, the cost of securities for federal income tax purposes was $325,868,377 and the aggregate gross unrealized appreciation and depreciation based on that cost were: |
| | | | |
Unrealized Appreciation | | $ | 108,891,595 | |
Unrealized Depreciation | | | (12,976,005 | ) |
| | | | |
Net Unrealized Appreciation | | $ | 95,915,590 | |
| | | | |
| (1) | Securities issued within terms of a private placement memorandum, exempt from registration under Rule 144A under the Securities Act of 1933, as amended, and may be sold only to qualified institutional buyers. Unless otherwise indicated, this holding is determined to be liquid. At December 31, 2015, the aggregate value of this security was $294,081, which represents 0.1% of total net assets. |
| † | See Significant Accounting Policies of accompanying Notes to Financial Statements regarding valuation of investments. |
| | |
| GLOSSARY: (abbreviations used in preceding Schedule of Investments) |
|
| Other Abbreviations: |
ADR | | American Depositary Receipt |
The accompanying notes are an integral part of these financial statements.
|
| Hartford Healthcare HLS Fund |
Schedule of Investments – (continued)
December 31, 2015
Fair Valuation Summary
The following is a summary of the fair valuations according to the inputs used as of December 31, 2015 in valuing the Fund’s investments.
| | | | | | | | | | | | | | | | |
| | | Total | | | Level 1(1) | | | Level 2(1) | | | Level 3 | |
Assets | |
Common Stocks | | | | | | | | | | | | | | | | |
Biotechnology | | $ | 104,885,824 | | | $ | 98,591,011 | | | $ | 6,294,813 | | | $ | — | |
Drug Retail | | | 5,425,598 | | | | 5,425,598 | | | | — | | | | — | |
Health Care Distributors | | | 16,109,825 | | | | 16,109,825 | | | | — | | | | — | |
Health Care Equipment | | | 83,027,879 | | | | 83,027,879 | | | | — | | | | — | |
Health Care Facilities | | | 12,276,788 | | | | 11,677,601 | | | | 599,187 | | | | — | |
Health Care Services | | | 6,681,242 | | | | 6,681,242 | | | | — | | | | — | |
Health Care Supplies | | | 2,058,141 | | | | 2,058,141 | | | | — | | | | — | |
Health Care Technology | | | 13,091,828 | | | | 13,091,828 | | | | — | | | | — | |
Internet Software & Services | | | 1,004,232 | | | | 1,004,232 | | | | — | | | | — | |
Life Sciences Tools & Services | | | 19,344,491 | | | | 19,344,491 | | | | — | | | | — | |
Managed Health Care | | | 32,023,571 | | | | 32,023,571 | | | | — | | | | — | |
Pharmaceuticals | | | 117,412,691 | | | | 98,554,063 | | | | 18,858,628 | | | | — | |
Short-Term Investments | | | 8,441,857 | | | | 8,441,857 | | | | — | | | | — | |
| | | | | | | | | | | | | | | | |
Total | | $ | 421,783,967 | | | $ | 396,031,339 | | | $ | 25,752,628 | | | $ | — | |
| | | | | | | | | | | | | | | | |
| (1) | For the year ended December 31, 2015, investments valued at $1,248,469 were transferred from Level 1 to Level 2, and investments valued at $1,387,256 were transferred from Level 2 to Level 1. Investments are transferred between Level 1 and Level 2 for a variety of reasons including, but not limited to: |
| | a) | Foreign equities for which a fair value price is more representative of exit value than the local market close (transfer into Level 2). Foreign equities for which the local market close is more representative of exit value (transfer into Level 1). |
| | b) | Equity investments with no observable trading but a bid or mean price is used (transfer into Level 2). Equity investments using observable quoted prices in an active market (transfer into Level 1). |
| Note: | For purposes of reporting transfers between different hierarchy levels, both transfers in and out of each level, as applicable, are shown as if they occurred at the beginning of the period. |
The accompanying notes are an integral part of these financial statements.
|
| Hartford High Yield HLS Fund |
Schedule of Investments
December 31, 2015
| | | | | | | | | | | | |
Shares or Principal Amount | | Market Value† | |
ASSET & COMMERCIAL MORTGAGE BACKED
SECURITIES - 0.0% | |
| | | | | | | Asset-Backed - Finance & Insurance - 0.0% | |
| | $ | | | | 2,490,000 | | | Soundview NIM Trust
8.25%, 12/25/2036(1)(2)(3) | | $ | — | |
| | | | | | | | | | | | |
| | | |
| | | | | | | | Total Asset & Commercial Mortgage Backed Securities
(cost $2,478,958) | | $ | — | |
| | | | | | | | | | | | |
| | | |
| | | | | | | | | | | | |
| CORPORATE BONDS - 90.2% | | | |
| | | | | | | Auto Manufacturers - 0.3% | |
| | $ | | | | 915,000 | | | General Motors Co.
6.25%, 10/02/2043 | | $ | 966,730 | |
| | | | | | | | | | | | |
| | | | | | | Auto Parts & Equipment - 0.5% | |
| | | | | | | | ZF North America Capital, Inc. | | | | |
| | | | | 515,000 | | | 4.50%, 04/29/2022(1) | | | 503,413 | |
| | | | | 1,220,000 | | | 4.75%, 04/29/2025(1) | | | 1,162,050 | |
| | | | | | | | | | | | |
| | | | | | | | | | | 1,665,463 | |
| | | | | | | | | | | | |
| | | | | | | Chemicals - 0.7% | |
| | | | | | | | Ineos Group Holdings S.A. | | | | |
| | | | | 1,700,000 | | | 5.88%, 02/15/2019(1) | | | 1,649,000 | |
| | | | | 535,000 | | | 6.13%, 08/15/2018(1) | | | 529,650 | |
| | | | | | | | | | | | |
| | | | | | | | | | | 2,178,650 | |
| | | | | | | | | | | | |
| | | | | | | Commercial Banks - 5.7% | |
| | EUR | | | | 2,600,000 | | | Banco Bilbao Vizcaya Argentaria S.A.
7.00%, 02/19/2019(4)(5)(6) | | | 2,772,209 | |
| | $ | | | | 3,640,000 | | | Barclays plc
8.25%, 12/15/2018(4)(6) | | | 3,875,512 | |
| | | | | 2,261,000 | | | CIT Group, Inc.
5.25%, 03/15/2018 | | | 2,334,482 | |
| | | | | 1,015,000 | | | Credit Agricole S.A.
7.88%, 01/23/2024(1)(4)(6) | | | 1,037,838 | |
| | | | | 1,530,000 | | | Credit Suisse Group AG
6.25%, 12/18/2024(4)(5)(6) | | | 1,528,849 | |
| | | | | 720,000 | | | ING Groep N.V.
6.00%, 04/16/2020(4)(6) | | | 720,000 | |
| | | | | | | | Royal Bank of Scotland Group plc | | | | |
| | | | | 2,105,000 | | | 6.99%, 10/05/2017(1)(4)(6) | | | 2,436,537 | |
| | | | | 2,070,000 | | | 7.50%, 08/10/2020(4)(6) | | | 2,155,388 | |
| | | | | 1,000,000 | | | 7.64%, 09/30/2017(4)(6) | | | 1,045,000 | |
| | | | | 640,000 | | | Societe Generale S.A.
8.25%, 11/29/2018(4)(5)(6) | | | 678,400 | |
| | | | | | | | | | | | |
| | | | | | | | | | | 18,584,215 | |
| | | | | | | | | | | | |
| | | | | | | Commercial Services - 0.5% | |
| | | | | 2,385,000 | | | Quad/Graphics, Inc.
7.00%, 05/01/2022 | | | 1,496,588 | |
| | | | | | | | | | | | |
| | | | | | | Construction Materials - 4.1% | |
| | | | | 1,965,000 | | | Builders FirstSource, Inc.
10.75%, 08/15/2023(1) | | | 1,950,262 | |
| | | | | 3,945,000 | | | Building Materials Corp. of America
5.38%, 11/15/2024(1) | | | 3,935,137 | |
| | | | | 2,580,000 | | | Cemex Finance LLC
6.00%, 04/01/2024(1) | | | 2,212,350 | |
| | | | | | | | Cemex S.A.B. de C.V. | | | | |
| | | | | 1,190,000 | | | 5.70%, 01/11/2025(1) | | | 995,138 | |
| | | | | 760,000 | | | 6.13%, 05/05/2025(1) | | | 649,800 | |
| | | | | 2,060,000 | | | Nortek, Inc.
8.50%, 04/15/2021 | | | 2,137,456 | |
| | | | | 1,875,000 | | | Ply Gem Industries, Inc.
6.50%, 02/01/2022 | | | 1,715,625 | |
| | | | | | | | | | | | |
| | | | | | | | | | | 13,595,768 | |
| | | | | | | | | | | | |
| | | | | | | | | | | | |
Shares or Principal Amount | | Market Value† | |
| CORPORATE BONDS - 90.2% - (continued) | | | |
| | | | | | | Distribution/Wholesale - 0.2% | |
| | $ | | | | 625,000 | | | American Builders & Contractors Supply Co., Inc.
5.75%, 12/15/2023(1) | | $ | 629,688 | |
| | | | | | | | | | | | |
| | | | | | | Diversified Financial Services - 3.4% | |
| | | | | | | | International Lease Finance Corp. | | | | |
| | | | | 6,416,000 | | | 5.88%, 04/01/2019 | | | 6,800,960 | |
| | | | | 665,000 | | | 5.88%, 08/15/2022 | | | 708,225 | |
| | | | | 970,000 | | | 6.25%, 05/15/2019 | | | 1,039,112 | |
| | | | | 3,115,000 | | | Nationstar Mortgage LLC / Nationstar Capital Corp.
6.50%, 07/01/2021 | | | 2,756,775 | |
| | | | | | | | | | | | |
| | | | | | | | | | | 11,305,072 | |
| | | | | | | | | | | | |
| | | | | | | Electric - 1.5% | |
| | | | | | | | Dynegy, Inc. | | | | |
| | | | | 1,005,000 | | | 5.88%, 06/01/2023 | | | 806,513 | |
| | | | | 1,070,000 | | | 7.38%, 11/01/2022 | | | 930,900 | |
| | | | | 720,000 | | | 7.63%, 11/01/2024 | | | 615,456 | |
| | | | | | | | GenOn Americas Generation LLC | | | | |
| | | | | 1,605,000 | | | 8.50%, 10/01/2021 | | | 1,175,662 | |
| | | | | 1,670,000 | | | 9.13%, 05/01/2031 | | | 1,156,475 | |
| | | | | 415,000 | | | Texas Competitive Electric Holdings Co. LLC 11.50%, 10/01/2020(1)(2) | | | 137,988 | |
| | | | | | | | | | | | |
| | | | | | | | | | | 4,822,994 | |
| | | | | | | | | | | | |
| | | | | | | Entertainment - 0.4% | |
| | | | | 1,350,000 | | | Carmike Cinemas, Inc.
6.00%, 06/15/2023(1) | | | 1,383,750 | |
| | | | | | | | | | | | |
| | | | | | | Food - 1.0% | |
| | | | | 719,000 | | | Albertson’s Holdings LLC/Safeway, Inc.
7.75%, 10/15/2022(1) | | | 763,485 | |
| | | | | 686,000 | | | Post Holdings, Inc.
7.38%, 02/15/2022 | | | 715,155 | |
| | | | | 2,045,000 | | | TreeHouse Foods, Inc.
4.88%, 03/15/2022 | | | 1,947,862 | |
| | | | | | | | | | | | |
| | | | | | | | | | | 3,426,502 | |
| | | | | | | | | | | | |
| | | | | | | Food Service - 0.8% | |
| | | | | | | | Aramark Services, Inc. | | | | |
| | | | | 255,000 | | | 5.13%, 01/15/2024(1) | | | 259,781 | |
| | | | | 2,245,000 | | | 5.75%, 03/15/2020 | | | 2,322,172 | |
| | | | | | | | | | | | |
| | | | | | | | | | | 2,581,953 | |
| | | | | | | | | | | | |
| | | | | | | Forest Products & Paper - 0.7% | |
| | | | | 3,380,000 | | | Tembec Industries, Inc.
9.00%, 12/15/2019(1) | | | 2,197,000 | |
| | | | | | | | | | | | |
| | | | | | | Healthcare-Products - 2.3% | |
| | | | | | | | Alere, Inc. | | | | |
| | | | | 1,865,000 | | | 6.38%, 07/01/2023(1) | | | 1,743,775 | |
| | | | | 3,115,000 | | | 6.50%, 06/15/2020 | | | 2,990,400 | |
| | | | | 2,895,000 | | | Sterigenics-Nordion Holdings LLC
6.50%, 05/15/2023(1) | | | 2,764,725 | |
| | | | | | | | | | | | |
| | | | | | | | | 7,498,900 | |
| | | | | | | | | | | | |
| | | | | | | Healthcare-Services - 8.6% | |
| | | | | 2,575,000 | | | Amsurg Corp.
5.63%, 07/15/2022 | | | 2,549,250 | |
| | | | | | | | Community Health Systems, Inc. | | | | |
| | | | | 1,296,000 | | | 5.13%, 08/15/2018 | | | 1,302,480 | |
| | | | | 4,305,000 | | | 6.88%, 02/01/2022 | | | 4,084,369 | |
| | | | | 2,010,000 | | | 7.13%, 07/15/2020 | | | 2,002,462 | |
The accompanying notes are an integral part of these financial statements.
|
| Hartford High Yield HLS Fund |
Schedule of Investments – (continued)
December 31, 2015
| | | | | | | | | | | | |
Shares or Principal Amount | | Market Value† | |
| CORPORATE BONDS - 90.2% - (continued) | | | |
| | | | | | | Healthcare-Services - 8.6% - (continued) | |
| | $ | | | | 1,040,000 | | | Envision Healthcare Corp.
5.13%, 07/01/2022(1) | | $ | 1,019,200 | |
| | | | | 1,835,000 | | | HCA Holdings, Inc.
6.25%, 02/15/2021 | | | 1,940,513 | |
| | | | | 1,085,000 | | | HCA, Inc.
5.38%, 02/01/2025 | | | 1,071,438 | |
| | | | | 4,209,000 | | | 7.50%, 11/15/2095 | | | 3,998,550 | |
| | | | | 535,000 | | | inVentiv Health, Inc.
9.00%, 01/15/2018(1) | | | 548,375 | |
| | | | | 1,965,000 | | | LifePoint Health, Inc.
5.88%, 12/01/2023 | | | 1,994,475 | |
| | | | | 945,000 | | | MEDNAX, Inc.
5.25%, 12/01/2023(1) | | | 949,725 | |
| | | | | | | | Tenet Healthcare Corp. | | | | |
| | | | | 3,305,000 | | | 5.00%, 03/01/2019 | | | 3,048,862 | |
| | | | | 500,000 | | | 6.75%, 06/15/2023 | | | 463,750 | |
| | | | | 3,265,000 | | | 8.13%, 04/01/2022 | | | 3,256,837 | |
| | | | | | | | | | | | |
| | | | | | | | | 28,230,286 | |
| | | | | | | | | | | | |
| | | | | | | Holding Companies-Diversified - 0.7% | |
| | | | | 2,290,000 | | | Argos Merger Sub, Inc.
7.13%, 03/15/2023(1) | | | 2,270,535 | |
| | | | | | | | | | | | |
| | | | | | | Home Builders - 3.3% | |
| | | | | | | | DR Horton, Inc. | | | | |
| | | | | 265,000 | | | 4.00%, 02/15/2020 | | | 266,511 | |
| | | | | 956,000 | | | 4.38%, 09/15/2022 | | | 950,025 | |
| | | | | 240,000 | | | 5.75%, 08/15/2023 | | | 255,840 | |
| | | | | | | | KB Home | | | | |
| | | | | 926,000 | | | 7.50%, 09/15/2022 | | | 921,370 | |
| | | | | 2,930,000 | | | 8.00%, 03/15/2020 | | | 3,175,387 | |
| | | | | | | | Lennar Corp. | | | | |
| | | | | 1,015,000 | | | 4.75%, 12/15/2017 | | | 1,042,913 | |
| | | | | 1,155,000 | | | 4.75%, 11/15/2022 | | | 1,145,182 | |
| | | | | 370,000 | | | 4.88%, 12/15/2023 | | | 368,150 | |
| | | | | 2,115,000 | | | M/I Homes, Inc.
6.75%, 01/15/2021(1) | | | 2,083,275 | |
| | | | | 530,000 | | | Toll Brothers Finance Corp.
4.88%, 11/15/2025 | | | 520,725 | |
| | | | | | | | | | | | |
| | | | | | | | | | | 10,729,378 | |
| | | | | | | | | | | | |
| | | | | | | Household Products/Wares - 0.5% | |
| | | | | 2,080,000 | | | Sun Products Corp.
7.75%, 03/15/2021(1) | | | 1,804,400 | |
| | | | | | | | | | | | |
| | | | | | | Insurance - 0.4% | |
| | | | | | | | CNO Financial Group, Inc. | | | | |
| | | | | 340,000 | | | 4.50%, 05/30/2020 | | | 346,800 | |
| | | | | 835,000 | | | 5.25%, 05/30/2025 | | | 849,613 | |
| | | | | | | | | | | | |
| | | | | | | | | 1,196,413 | |
| | | | | | | | | | | | |
| | | | | | | Internet - 0.9% | |
| | | | | | | | Zayo Group LLC / Zayo Capital, Inc. | | | | |
| | | | | 2,145,000 | | | 6.00%, 04/01/2023 | | | 2,027,025 | |
| | | | | 1,165,000 | | | 6.38%, 05/15/2025 | | | 1,083,450 | |
| | | | | | | | | | | | |
| | | | | | | | | 3,110,475 | |
| | | | | | | | | | | | |
| | | | | | | Iron/Steel - 0.9% | |
| | | | | | | | AK Steel Corp. | | | | |
| | | | | 760,000 | | | 7.63%, 05/15/2020 | | | 296,248 | |
| | | | | 1,015,000 | | | 7.63%, 10/01/2021 | | | 406,000 | |
| | | | | 840,000 | | | 8.38%, 04/01/2022 | | | 331,800 | |
| | | | | | | | | | | | |
Shares or Principal Amount | | Market Value† | |
| CORPORATE BONDS - 90.2% - (continued) | | | |
| | | | | | | Iron/Steel - 0.9% - (continued) | |
| | $ | | | | 1,130,000 | | | Steel Dynamics, Inc.
5.50%, 10/01/2024 | | $ | 1,031,125 | |
| | | | | 1,811,000 | | | United States Steel Corp.
7.38%, 04/01/2020 | | | 940,996 | |
| | | | | | | | | | | | |
| | | | | | | | | 3,006,169 | |
| | | | | | | | | | | | |
| | | | | | | Machinery-Diversified - 0.9% | |
| | | | | 2,386,000 | | | Case New Holland Industrial, Inc.
7.88%, 12/01/2017 | | | 2,523,195 | |
| | | | | 445,000 | | | CNH Industrial Capital LLC
4.38%, 11/06/2020 | | | 419,413 | |
| | | | | | | | | | | | |
| | | | | | | | | 2,942,608 | |
| | | | | | | | | | | | |
| | | | | | | Media - 11.2% | |
| | | | | | | | CCO Holdings LLC / CCO Holdings Capital Corp. | | | | |
| | | | | 120,000 | | | 5.13%, 02/15/2023 | | | 120,150 | |
| | | | | 245,000 | | | 5.13%, 05/01/2023(1) | | | 245,000 | |
| | | | | 95,000 | | | 5.25%, 09/30/2022 | | | 95,950 | |
| | | | | 545,000 | | | 5.75%, 09/01/2023 | | | 558,625 | |
| | | | | 105,000 | | | 5.75%, 01/15/2024 | | | 107,888 | |
| | | | | 3,077,000 | | | 7.38%, 06/01/2020 | | | 3,203,926 | |
| | | | | 1,355,000 | | | CCO Safari II LLC
4.91%, 07/23/2025(1) | | | 1,353,682 | |
| | | | | 1,355,000 | | | CCOH Safari LLC
5.75%, 02/15/2026(1) | | | 1,358,387 | |
| | | | | 4,305,000 | | | Cequel Communications Holdings I LLC / Cequel Capital Corp.
5.13%, 12/15/2021(1) | | | 3,874,500 | |
| | | | | | | | DISH DBS Corp. | | | | |
| | | | | 2,170,000 | | | 5.00%, 03/15/2023 | | | 1,882,475 | |
| | | | | 2,150,000 | | | 5.88%, 07/15/2022 | | | 2,004,875 | |
| | | | | 945,000 | | | 6.75%, 06/01/2021 | | | 952,088 | |
| | | | | 2,016,000 | | | 7.88%, 09/01/2019 | | | 2,192,400 | |
| | | | | 996,000 | | | Gray Television, Inc.
7.50%, 10/01/2020 | | | 1,023,390 | |
| | | | | 1,645,000 | | | Liberty Interactive LLC
8.25%, 02/01/2030 | | | 1,636,775 | |
| | | | | 370,000 | | | LIN Television Corp.
5.88%, 11/15/2022 | | | 368,150 | |
| | | | | 2,180,000 | | | NBCUniversal Enterprise, Inc.
5.25%, 03/29/2049(1)(4) | | | 2,310,800 | |
| | | | | 1,955,000 | | | Sirius XM Radio, Inc.
4.63%, 05/15/2023(1) | | | 1,915,900 | |
| | | | | | | | TEGNA, Inc. | | | | |
| | | | | 1,515,000 | | | 4.88%, 09/15/2021(1) | | | 1,518,787 | |
| | | | | 3,355,000 | | | 5.13%, 10/15/2019 | | | 3,472,425 | |
| | | | | 250,000 | | | 5.50%, 09/15/2024(1) | | | 250,000 | |
| | | | | 750,000 | | | 6.38%, 10/15/2023 | | | 791,250 | |
| | | | | 3,095,000 | | | Tribune Media Co.
5.88%, 07/15/2022(1) | | | 3,095,000 | |
| | | | | 2,555,000 | | | Unitymedia Hessen GmbH & Co. KG / Unitymedia NRW GmbH
5.50%, 01/15/2023(1) | | | 2,548,612 | |
| | | | | | | | | | | | |
| | | | | | | | | | | 36,881,035 | |
| | | | | | | | | | | | |
| | | | | | | Office/Business Equipment - 1.2% | |
| | | | | | | | CDW LLC / CDW Finance Corp. | | | | |
| | | | | 885,000 | | | 5.00%, 09/01/2023 | | | 898,275 | |
| | | | | 970,000 | | | 5.50%, 12/01/2024 | | | 1,016,075 | |
| | | | | 1,780,000 | | | 6.00%, 08/15/2022 | | | 1,877,900 | |
| | | | | | | | | | | | |
| | | | | | | | | 3,792,250 | |
| | | | | | | | | | | | |
The accompanying notes are an integral part of these financial statements.
|
| Hartford High Yield HLS Fund |
Schedule of Investments – (continued)
December 31, 2015
| | | | | | | | | | | | |
Shares or Principal Amount | | Market Value† | |
| CORPORATE BONDS - 90.2% - (continued) | | | |
| | | | | | | Oil & Gas - 8.7% | |
| | | | | | | | Antero Resources Corp. | | | | |
| | $ | | | | 810,000 | | | 5.63%, 06/01/2023(1) | | $ | 631,800 | |
| | | | | 2,340,000 | | | 6.00%, 12/01/2020 | | | 1,953,900 | |
| | | | | 2,120,000 | | | Blue Racer Midstream LLC / Blue Racer Finance Corp.
6.13%, 11/15/2022(1) | | | 1,462,800 | |
| | | | | 1,475,000 | | | Bonanza Creek Energy, Inc.
6.75%, 04/15/2021 | | | 892,375 | |
| | | | | | | | Concho Resources, Inc. | | | | |
| | | | | 1,910,000 | | | 5.50%, 10/01/2022 | | | 1,738,100 | |
| | | | | 325,000 | | | 5.50%, 04/01/2023 | | | 300,625 | |
| | | | | | | | Continental Resources, Inc. | | | | |
| | | | | 450,000 | | | 3.80%, 06/01/2024 | | | 316,992 | |
| | | | | 700,000 | | | 4.90%, 06/01/2044 | | | 422,083 | |
| | | | | 2,700,000 | | | Diamondback Energy, Inc.
7.63%, 10/01/2021 | | | 2,727,000 | |
| | | | | 300,000 | | | Energen Corp.
4.63%, 09/01/2021 | | | 267,000 | |
| | | | | 2,642,000 | | | Everest Acquisition Finance, Inc.
9.38%, 05/01/2020 | | | 1,684,275 | |
| | | | | | | | Laredo Petroleum, Inc. | | | | |
| | | | | 740,000 | | | 5.63%, 01/15/2022 | | | 643,800 | |
| | | | | 1,360,000 | | | 6.25%, 03/15/2023 | | | 1,183,200 | |
| | | | | 600,000 | | | 7.38%, 05/01/2022 | | | 552,000 | |
| | | | | 380,000 | | | Matador Resources Co.
6.88%, 04/15/2023 | | | 353,400 | |
| | | | | | | | MEG Energy Corp. | | | | |
| | | | | 900,000 | | | 6.38%, 01/30/2023(1) | | | 616,500 | |
| | | | | 1,940,000 | | | 7.00%, 03/31/2024(1) | | | 1,377,400 | |
| | | | | | | | Noble Energy, Inc. | | | | |
| | | | | 1,875,000 | | | 5.63%, 05/01/2021 | | | 1,834,101 | |
| | | | | 1,860,000 | | | 5.88%, 06/01/2022 | | | 1,769,418 | |
| | | | | 2,895,000 | | | Paragon Offshore plc
6.75%, 07/15/2022(1) | | | 405,300 | |
| | | | | | | | QEP Resources, Inc. | | | | |
| | | | | 2,105,000 | | | 5.25%, 05/01/2023 | | | 1,494,550 | |
| | | | | 205,000 | | | 5.38%, 10/01/2022 | | | 147,600 | |
| | | | | 245,000 | | | 6.80%, 03/01/2020 | | | 220,500 | |
| | | | | 500,000 | | | Range Resources Corp.
5.00%, 08/15/2022 | | | 373,750 | |
| | | | | 515,000 | | | Rice Energy, Inc.
7.25%, 05/01/2023(1) | | | 375,950 | |
| | | | | | | | RSP Permian, Inc. | | | | |
| | | | | 1,085,000 | | | 6.63%, 10/01/2022(1) | | | 998,200 | |
| | | | | 55,000 | | | 6.63%, 10/01/2022 | | | 50,600 | |
| | | | | | | | Tullow Oil plc | | | | |
| | | | | 1,015,000 | | | 6.00%, 11/01/2020(1) | | | 705,425 | |
| | | | | 2,065,000 | | | 6.25%, 04/15/2022(1) | | | 1,383,550 | |
| | | | | | | | WPX Energy, Inc. | | | | |
| | | | | 1,420,000 | | | 5.25%, 09/15/2024 | | | 937,200 | |
| | | | | 950,000 | | | 6.00%, 01/15/2022 | | | 665,000 | |
| | | | | | | | | | | | |
| | | | | | | | | | | 28,484,394 | |
| | | | | | | | | | | | |
| | | | | | | Packaging & Containers - 3.2% | |
| | | | | 1,074,728 | | | Ardagh Finance Holdings S.A.
8.63%, 06/15/2019(1)(7) | | | 1,059,273 | |
| | | | | | | | Ardagh Packaging Finance plc | | | | |
| | | | | 2,065,000 | | | 6.00%, 06/30/2021(1) | | | 1,925,613 | |
| | | | | 511,000 | | | 9.13%, 10/15/2020(1) | | | 526,330 | |
| | | | | | | | Ball Corp. | | | | |
| | EUR | | | | 315,000 | | | 3.50%, 12/15/2020 | | | 351,398 | |
| | | | | 420,000 | | | 4.38%, 12/15/2023 | | | 468,987 | |
| | | | | | | | | | | | |
Shares or Principal Amount | | Market Value† | |
| CORPORATE BONDS - 90.2% - (continued) | | | |
| | | | | | | Packaging & Containers - 3.2% - (continued) | |
| | $ | | | | 2,060,000 | | | Berry Plastics Corp.
6.00%, 10/15/2022(1) | | $ | 2,098,625 | |
| | | | | | | | Owens-Brockway Glass Container, Inc. | | | | |
| | | | | 1,795,000 | | | 5.88%, 08/15/2023(1) | | | 1,821,925 | |
| | | | | 2,215,000 | | | 6.38%, 08/15/2025(1) | | | 2,275,912 | |
| | | | | | | | | | | | |
| | | | | | | | | 10,528,063 | |
| | | | | | | | | | | | |
| | | | | | | Pharmaceuticals - 3.0% | |
| | | | | | | | Endo Finance LLC | | | | |
| | | | | 561,000 | | | 6.00%, 07/15/2023(1) | | | 558,195 | |
| | | | | 3,075,000 | | | 6.00%, 02/01/2025(1) | | | 3,028,875 | |
| | | | | 1,908,000 | | | PRA Holdings, Inc.
9.50%, 10/01/2023(1) | | | 2,074,950 | |
| | | | | 2,050,000 | | | Quintiles Transnational Corp.
4.88%, 05/15/2023(1) | | | 2,060,250 | |
| | | | | | | | Valeant Pharmaceuticals International, Inc. | | | | |
| | | | | 1,320,000 | | | 5.50%, 03/01/2023(1) | | | 1,161,600 | |
| | | | | 1,265,000 | | | 5.88%, 05/15/2023(1) | | | 1,129,012 | |
| | | | | | | | | | | | |
| | | | | | | | | 10,012,882 | |
| | | | | | | | | | | | |
| | | | | | | Pipelines - 1.3% | |
| | | | | | | | Energy Transfer Equity L.P. | | | | |
| | | | | 2,745,000 | | | 5.50%, 06/01/2027 | | | 2,086,200 | |
| | | | | 1,773,000 | | | 7.50%, 10/15/2020 | | | 1,640,025 | |
| | | | | 450,000 | | | Kinder Morgan Finance Co.
6.00%, 01/15/2018(1) | | | 453,718 | |
| | | | | | | | | | | | |
| | | | | | | | | 4,179,943 | |
| | | | | | | | | | | | |
| | | | | | | REITS - 0.3% | |
| | | | | 1,110,000 | | | Equinix, Inc.
5.88%, 01/15/2026 | | | 1,143,300 | |
| | | | | | | | | | | | |
| | | | | | | Retail - 2.5% | |
| | | | | 1,595,000 | | | CEC Entertainment, Inc.
8.00%, 02/15/2022 | | | 1,507,275 | |
| | | | | 1,465,000 | | | Chinos Intermediate Holdings A, Inc.
7.75%, 05/01/2019(1)(7) | | | 366,250 | |
| | | | | 2,430,000 | | | L Brands, Inc.
6.88%, 11/01/2035(1) | | | 2,496,825 | |
| | | | | 2,315,000 | | | Michaels Stores, Inc.
5.88%, 12/15/2020(1) | | | 2,393,131 | |
| | | | | 1,440,000 | | | Party City Holdings, Inc.
6.13%, 08/15/2023(1) | | | 1,396,800 | |
| | | | | | | | | | | | |
| | | | | | | | | | | 8,160,281 | |
| | | | | | | | | | | | |
| | | | | | | Semiconductors - 2.5% | |
| | | | | 2,515,000 | | | Entegris, Inc.
6.00%, 04/01/2022(1) | | | 2,546,437 | |
| | | | | 3,560,000 | | | Freescale Semiconductor, Inc.
6.00%, 01/15/2022(1) | | | 3,729,100 | |
| | | | | | | | Sensata Technologies B.V. | | | | |
| | | | | 1,185,000 | | | 5.00%, 10/01/2025(1) | | | 1,158,338 | |
| | | | | 775,000 | | | 5.63%, 11/01/2024(1) | | | 792,438 | |
| | | | | | | | | | | | |
| | | | | | | | | | | 8,226,313 | |
| | | | | | | | | | | | |
| | | | | | | Shipbuilding - 0.1% | |
| | | | | 440,000 | | | Huntington Ingalls Industries, Inc.
5.00%, 11/15/2025(1) | | | 446,600 | |
| | | | | | | | | | | | |
| | | | | | | Software - 7.7% | |
| | | | | | | | Activision Blizzard, Inc. | | | | |
| | | | | 4,357,000 | | | 5.63%, 09/15/2021(1) | | | 4,563,957 | |
| | | | | 910,000 | | | 6.13%, 09/15/2023(1) | | | 964,600 | |
| | | | | 3,440,000 | | | Audatex North America, Inc.
6.00%, 06/15/2021(1) | | | 3,465,800 | |
The accompanying notes are an integral part of these financial statements.
|
| Hartford High Yield HLS Fund |
Schedule of Investments – (continued)
December 31, 2015
| | | | | | | | | | | | |
Shares or Principal Amount | | Market Value† | |
| CORPORATE BONDS - 90.2% - (continued) | | | |
| | | | | | | Software - 7.7% - (continued) | |
| | | | | | | | Emdeon, Inc. | | | | |
| | $ | | | | 1,140,000 | | | 6.00%, 02/15/2021(1) | | $ | 1,060,200 | |
| | | | | 1,640,000 | | | 11.00%, 12/31/2019 | | | 1,709,700 | |
| | | | | | | | First Data Corp. | | | | |
| | | | | 2,935,000 | | | 5.38%, 08/15/2023(1) | | | 2,949,675 | |
| | | | | 4,106,000 | | | 5.75%, 01/15/2024(1) | | | 4,044,410 | |
| | | | | 1,815,000 | | | 7.00%, 12/01/2023(1) | | | 1,815,000 | |
| | | | | 2,870,000 | | | Infor Software Parent LLC
7.13%, 05/01/2021(1)(7) | | | 2,073,575 | |
| | | | | 2,075,000 | | | Infor U.S., Inc.
6.50%, 05/15/2022(1) | | | 1,753,375 | |
| | | | | | | | MSCI, Inc. | | | | |
| | | | | 196,000 | | | 5.25%, 11/15/2024(1) | | | 198,940 | |
| | | | | 625,000 | | | 5.75%, 08/15/2025(1) | | | 640,625 | |
| | | | | | | | | | | | |
| | | | | | | | | | | 25,239,857 | |
| | | | | | | | | | | | |
| | | | | | | Telecommunications - 10.2% | |
| | | | | | | | Alcatel-Lucent USA, Inc. | | | | |
| | | | | 2,681,000 | | | 6.45%, 03/15/2029 | | | 2,714,512 | |
| | | | | 765,000 | | | 6.50%, 01/15/2028 | | | 768,825 | |
| | | | | 653,000 | | | 6.75%, 11/15/2020(1) | | | 688,099 | |
| | | | | | | | Altice Financing S.A. | | | | |
| | | | | 885,000 | | | 6.50%, 01/15/2022(1) | | | 876,150 | |
| | | | | 380,000 | | | 6.63%, 02/15/2023(1) | | | 375,250 | |
| | | | | 1,500,000 | | | 7.88%, 12/15/2019(1) | | | 1,560,000 | |
| | | | | | | | Frontier Communications Corp. | | | | |
| | | | | 840,000 | | | 10.50%, 09/15/2022(1) | | | 836,850 | |
| | | | | 2,065,000 | | | 11.00%, 09/15/2025(1) | | | 2,044,350 | |
| | | | | | | | Level 3 Financing, Inc. | | | | |
| | | | | 970,000 | | | 5.13%, 05/01/2023(1) | | | 962,725 | |
| | | | | 2,515,000 | | | 5.38%, 08/15/2022 | | | 2,552,725 | |
| | | | | 920,000 | | | 5.63%, 02/01/2023 | | | 938,400 | |
| | | | | 1,820,000 | | | SoftBank Group Corp.
4.50%, 04/15/2020(1) | | | 1,810,900 | |
| | | | | | | | Sprint Communications, Inc. | | | | |
| | | | | 507,000 | | | 7.00%, 03/01/2020(1) | | | 508,268 | |
| | | | | 3,092,000 | | | 9.00%, 11/15/2018(1) | | | 3,254,330 | |
| | | | | | | | Sprint Corp. | | | | |
| | | | | 2,495,000 | | | 7.25%, 09/15/2021 | | | 1,882,976 | |
| | | | | 2,005,000 | | | 7.88%, 09/15/2023 | | | 1,505,755 | |
| | | | | 3,470,000 | | | Syniverse Holdings, Inc.
9.13%, 01/15/2019 | | | 1,570,175 | |
| | | | | | | | T-Mobile USA, Inc. | | | | |
| | | | | 330,000 | | | 6.13%, 01/15/2022 | | | 339,075 | |
| | | | | 2,490,000 | | | 6.46%, 04/28/2019 | | | 2,564,252 | |
| | | | | 1,425,000 | | | 6.63%, 11/15/2020 | | | 1,481,273 | |
| | | | | 635,000 | | | 6.63%, 04/28/2021 | | | 658,812 | |
| | | | | 375,000 | | | 6.73%, 04/28/2022 | | | 390,938 | |
| | | | | | | | Wind Acquisition Finance S.A. | | | | |
| | EUR | | | | 2,640,000 | | | 4.00%, 07/15/2020(1) | | | 2,854,674 | |
| | $ | | | | 215,000 | | | 6.50%, 04/30/2020(1) | | | 224,944 | |
| | | | | | | | | | | | |
| | | | | | | | | | | 33,364,258 | |
| | | | | | | | | | | | |
| | | |
| | | | | | | | Total Corporate Bonds
(cost $320,146,974) | | $ | 296,082,713 | |
| | | | | | | | | | | | |
| | | |
| | | | | | | | | | | | |
| SENIOR FLOATING RATE INTERESTS - 1.5%(8) | |
| | | | | | | Electric - 0.4% | |
| | $ | | | | 4,525,000 | | | Texas Competitive Electric Holdings Co. LLC 4.73%, 10/10/2017(9) | | $ | 1,395,963 | |
| | | | | | | | | | | | |
| | | | | | | | | | | | |
Shares or Principal Amount | | Market Value† | |
| SENIOR FLOATING RATE INTERESTS - 1.5%(8) - (continued) | |
| | | | | | | Insurance - 0.2% | |
| | $ | | | | 550,000 | | | Asurion LLC
8.50%, 03/03/2021 | | $ | 466,125 | |
| | | | | | | | | | | | |
| | | | | | | Internet - 0.3% | |
| | | | | 1,286,182 | | | Lands’ End, Inc.
4.25%, 04/04/2021 | | | 1,106,116 | |
| | | | | | | | | | | | |
| | | | | | | Machinery-Diversified - 0.3% | |
| | | | | 979,675 | | | Gardner Denver, Inc.
4.25%, 07/30/2020 | | | 879,014 | |
| | | | | | | | | | | | |
| | | | | | | Retail - 0.3% | |
| | | | | 1,178,862 | | | Neiman Marcus Group, Inc.
4.25%, 10/25/2020 | | | 1,040,345 | |
| | | | | | | | | | | | |
| | | |
| | | | | | | | Total Senior Floating Rate Interests
(cost $7,296,690) | | $ | 4,887,563 | |
| | | | | | | | | | | | |
|
| CONVERTIBLE BONDS - 0.5% | |
| | | | | | | Home Builders - 0.2% | |
| | $ | | | | 566,000 | | | M/I Homes, Inc.
3.00%, 03/01/2018 | | $ | 553,265 | |
| | | | | | | | | | | | |
| | | | | | | Oil & Gas - 0.3% | |
| | | | | 1,790,000 | | | Cobalt International Energy, Inc.
2.63%, 12/01/2019 | | | 1,003,519 | |
| | | | | | | | | | | | |
| | | |
| | | | | | | | Total Convertible Bonds
(cost $2,493,443) | | $ | 1,556,784 | |
| | | | | | | | | | | | |
|
| COMMON STOCKS - 0.3% | |
| | | | | | | Energy - 0.3% | |
| | | | | 206,275,142 | | | KCA Deutag*(3)(10) | | $ | 921,843 | |
| | | | | | | | | | | | |
| | | |
| | | | | | | | Total Common Stocks
(cost $2,795,441) | | $ | 921,843 | |
| | | | | | | | | | | | |
|
| PREFERRED STOCKS - 0.9% | |
| | | | | | | Diversified Financials - 0.9% | | | |
| | | | | 120,700 | | | GMAC Capital Trust I Series 2 | | $ | 3,060,952 | |
| | | | | | | | | | | | |
| | | |
| | | | | | | | Total Preferred Stocks
(cost $2,866,999) | | $ | 3,060,952 | |
| | | | | | | | | | | | |
| | | |
| | | | | | | | Total Long-Term Investments
(cost $338,078,505) | | $ | 306,509,855 | |
| | | | | | | | | | | | |
|
| SHORT-TERM INVESTMENTS - 5.7% | |
| | | | | | | Other Investment Pools &
Funds - 5.7% | | | |
| | | | | 18,765,395 | | | Fidelity Money Market Class 1 | | $ | 18,765,395 | |
| | | | | | | | | | | | |
| | | |
| | | | | | | | Total Short-Term Investments
(cost $18,765,395) | | $ | 18,765,395 | |
| | | | | | | | | | | | |
| | | | | | | | | | | | | | |
| | | | | |
| | | | | | Total Investments
(cost $356,843,900)^ | | | 99.1 | % | | $ | 325,275,250 | |
| | | | | | Other Assets and Liabilities | | | 0.9 | % | | | 3,050,860 | |
| | | | | | | | | | | | | | |
| | | | | | Total Net Assets | | | 100.0 | % | | $ | 328,326,110 | |
| | | | | | | | | | | | | | |
The accompanying notes are an integral part of these financial statements.
|
| Hartford High Yield HLS Fund |
Schedule of Investments – (continued)
December 31, 2015
| Note: | Percentage of investments as shown is the ratio of the total market value to total net assets. |
| | The Fund may refer to any one or more of the industry classifications used by one or more widely recognized market indices, ratings group indices and/or as defined by Fund management. Industry classifications may not be identical across all security types. |
| | Equity Industry classifications used in this report are the Global Industry Classification Standard, which was developed by and is the exclusive property and service mark of MSCI, Inc. and Standard & Poor’s. |
| | For Fund compliance purposes, the Fund may not use the same classification system shown in this report as these classifications are used for financial reporting purposes. |
| ^ | At December 31, 2015, the cost of securities for federal income tax purposes was $357,045,579 and the aggregate gross unrealized appreciation and depreciation based on that cost were: |
| | | | |
Unrealized Appreciation | | $ | 5,021,574 | |
Unrealized Depreciation | | | (36,791,903) | |
| | | | |
Net Unrealized Depreciation | | $ | (31,770,329) | |
| | | | |
| (1) | Securities issued within terms of a private placement memorandum, exempt from registration under Rule 144A under the Securities Act of 1933, as amended, and may be sold only to qualified institutional buyers. Unless otherwise indicated, these holdings are determined to be liquid. At December 31, 2015, the aggregate value of these securities was $137,071,364, which represents 41.7% of total net assets. |
| (2) | Non-income producing. For long-term debt securities, items identified are in default as to payment of interest and/or principal. |
| (3) | These securities are valued in good faith at fair value as determined under policies and procedures established by and under the supervision of the Board of Directors. At December 31, 2015, the aggregate fair value of these securities was $921,843, which represents 0.3% of total net assets. This amount excludes securities that are principally traded in certain foreign markets and whose prices are adjusted pursuant to a third party pricing service methodology approved by the Board of Directors. |
| (4) | Perpetual maturity security. Maturity date shown is the next call date or final legal maturity date, whichever comes first. |
| (5) | These securities were sold to the Fund under Regulation S, rules governing offers and sales made outside the United States without registration under the Securities Act of 1933, as amended. The Fund may only be able to resell these securities in the United States if an exemption from registration under the federal and state securities laws is available, or the Fund may only be able to sell these securities outside of the United States (such as on a foreign exchange) to a non-U.S. person. Unless otherwise indicated, these holdings are determined to be liquid. At December 31, 2015, the aggregate value of these securities was $4,979,458, which represents 1.5% of total net assets. |
| (6) | Variable rate securities; the rate reported is the coupon rate in effect at December 31, 2015. |
| (7) | This security may pay interest in additional principal instead of cash. |
| (8) | Senior floating rate interests generally pay interest rates which are periodically adjusted by reference to a base short-term, floating lending rate plus a premium. The base lending rates are primarily the LIBOR, and secondarily the prime rate offered by one or more major United States banks (the “Prime Rate”) and the certificate of deposit rate or other base lending rates used by commercial lenders. Senior floating rate interests often require prepayments from excess cash flows or permit the borrower to repay at its election. The rate at which the borrower repays cannot be predicted with accuracy. As a result, the actual remaining maturity may be substantially less than the stated maturities shown. Unless otherwise noted, the interest rate disclosed for these securities represents the average coupon as of December 31, 2015. |
| (9) | The issuer is in bankruptcy. However, the investment held by the Fund is current with respect to interest payments. |
| (10) | The following security is considered illiquid. Illiquid securities are often purchased in private placement transactions, are often not registered under the Securities Act of 1933, as amended, and may have contractual restrictions on resale. A security may also be considered illiquid if the security lacks a readily available market or if its valuation has not changed for a certain period of time. |
| | | | | | | | | | |
Period
Acquired | | Shares/Par | | | Security | | Cost | |
| 03/2011 | | | 206,275,142 | | | KCA Deutag | | $ | 2,795,441 | |
The accompanying notes are an integral part of these financial statements.
|
| Hartford High Yield HLS Fund |
Schedule of Investments – (continued)
December 31, 2015
At December 31, 2015, the aggregate value of these securities was $921,843, which represents 0.3% of total net assets.
| | | | | | | | | | | | | | | | | | | | | | | | | | | | |
| Centrally Cleared Credit Default Swap Contracts Outstanding at December 31, 2015 | |
Reference Entity | | Notional
Amount(a) | | | (Pay)/Receive
Fixed Rate | | | Expiration
Date | | | Cost
Basis | | | Market
Value† | | | Unrealized
Appreciation/
(Depreciation) | |
Credit default swaps on indices: | | | | | | | | | | | | | | | | | | | | | | | | | | | | |
Sell protection: | | | | | | | | | | | | | | | | | | | | | | | | | | | | |
CDX.NA.HY.25 | | | USD | | | | 7,675,000 | | | | 5.00% | | | | 12/20/20 | | | $ | 170,986 | | | $ | 102,730 | | | $ | (68,256 | ) |
| | | | | | | | | | | | | | | | | | | | | | | | | | | | |
Total | | | | | | | | | | | | | | | | | | $ | 170,986 | | | $ | 102,730 | | | $ | (68,256 | ) |
| | | | | | | | | | | | | | | | | | | | | | | | | | | | |
| (a) | The maximum potential amount the Fund could be required to pay as a seller of credit protection if a credit event occurs as defined under the terms of that particular swap agreement. |
| | | | | | | | | | | | | | | | | | | | |
| Foreign Currency Contracts Outstanding at December 31, 2015 | |
Currency | | Buy/Sell | | Delivery
Date | | | Counterparty | | Contract
Amount | | | Market
Value† | | | Unrealized
Appreciation/
(Depreciation) | |
EUR | | Buy | | | 01/29/16 | | | BNP | | $ | 386,726 | | | $ | 386,081 | | | $ | (645 | ) |
EUR | | Sell | | | 01/29/16 | | | BOA | | | 6,981,308 | | | | 6,916,833 | | | | 64,475 | |
| | | | | | | | | | | | | | | | | | | | |
Total | | | $ | 63,830 | |
| | | | | | | | | | | | | | | | | | | | |
| † | See Significant Accounting Policies of accompanying Notes to Financial Statements regarding valuation of investments. |
| | |
| GLOSSARY: (abbreviations used in preceding Schedule of Investments) |
|
| Counterparty Abbreviations: |
BNP | | BNP Paribas Securities Services |
BOA | | Banc of America Securities LLC |
|
| Currency Abbreviations: |
EUR | | Euro |
USD | | United States Dollar |
|
| Index Abbreviations: |
CDX.NA.HY | | Credit Derivatives North American High Yield |
|
| Other Abbreviations: |
LIBOR | | London Interbank Offered Rate |
The accompanying notes are an integral part of these financial statements.
|
| Hartford High Yield HLS Fund |
Schedule of Investments – (continued)
December 31, 2015
Fair Valuation Summary
The following is a summary of the fair valuations according to the inputs used as of December 31, 2015 in valuing the Fund’s investments.
| | | | | | | | | | | | | | | | |
| | | Total | | | Level 1(1) | | | Level 2(1) | | | Level 3 | |
Assets | | | | | | | | | | | | | | | | |
Asset & Commercial Mortgage Backed Securities | | $ | — | | | $ | — | | | $ | — | | | $ | — | |
Corporate Bonds | | | 296,082,713 | | | | — | | | | 296,082,713 | | | | — | |
Senior Floating Rate Interests | | | 4,887,563 | | | | — | | | | 4,887,563 | | | | — | |
Convertible Bonds | | | 1,556,784 | | | | — | | | | 1,556,784 | | | | — | |
Common Stocks | | | | | | | | | | | | | | | | |
Energy | | | 921,843 | | | | — | | | | — | | | | 921,843 | |
Preferred Stocks | | | 3,060,952 | | | | 3,060,952 | | | | — | | | | — | |
Short-Term Investments | | | 18,765,395 | | | | 18,765,395 | | | | — | | | | — | |
Foreign Currency Contracts(2) | | | 64,475 | | | | — | | | | 64,475 | | | | — | |
| | | | | | | | | | | | | | | | |
Total | | $ | 325,339,725 | | | $ | 21,826,347 | | | $ | 302,591,535 | | | $ | 921,843 | |
| | | | | | | | | | | | | | | | |
| | | | |
Liabilities | | | | | | | | | | | | | | | | |
Foreign Currency Contracts(2) | | $ | (645 | ) | | $ | — | | | $ | (645 | ) | | $ | — | |
Swaps - Credit Default(2) | | | (68,256 | ) | | | — | | | | (68,256 | ) | | | — | |
| | | | | | | | | | | | | | | | |
Total | | $ | (68,901 | ) | | $ | — | | | $ | (68,901 | ) | | $ | — | |
| | | | | | | | | | | | | | | | |
| (1) | For the year ended December 31, 2015, there were no transfers between Level 1 and Level 2. |
| (2) | Derivative instruments (excluding purchased and written options, if applicable) are valued at the unrealized appreciation/depreciation on the investments. |
The following is a rollforward of the Fund’s investments that were valued using unobservable inputs (Level 3) for the year ended December 31, 2015:
| | | | | | | | |
| | | Common
Stocks | | | Total | |
Beginning balance | | $ | 423,689 | | | $ | 423,689 | |
Purchases | | | — | | | | — | |
Sales | | | — | | | | — | |
Accrued discounts/(premiums) | | | — | | | | — | |
Total realized gain/(loss) | | | — | | | | — | |
Net change in unrealized appreciation/depreciation | | | 498,154 | | | | 498,154 | |
Transfers into Level 3(1) | | | — | | | | — | |
Transfers out of Level 3(1) | | | — | | | | — | |
| | | | | | | | |
Ending balance | | $ | 921,843 | | | $ | 921,843 | |
| | | | | | | | |
The change in net unrealized appreciation/depreciation relating to the Level 3 investments held at December 31, 2015 was $498,154.
| (1) | Investments are transferred into and out of Level 3 for a variety of reasons including, but not limited to: |
| | a) | Investments where trading has been halted (transfer into Level 3) or investments where trading has resumed (transfer out of Level 3). |
| | b) | Broker quoted investments (transfer into Level 3) or quoted prices in active markets (transfer out of Level 3). |
| | c) | Investments that have certain restrictions on trading (transfer into Level 3) or investments where trading restrictions have expired (transfer out of Level 3). |
| Note: | For purposes of reporting transfers between different hierarchy levels, both transfers in and out of each level, as applicable, are shown as if they occurred at the beginning of the period. |
The accompanying notes are an integral part of these financial statements.
|
| Hartford International Opportunities HLS Fund |
Schedule of Investments
December 31, 2015
| | | | | | | | |
Shares or Principal Amount | | Market Value† | |
| COMMON STOCKS - 97.0% | |
| | | | Belgium - 1.9% | |
| | 203,754 | | | Anheuser-Busch InBev N.V. | | $ | 25,356,601 | |
| | | | | | | | |
| | | | Brazil - 0.2% | |
| | 387,010 | | | BB Seguridade Participacoes S.A. | | | 2,380,020 | |
| | | | | | | | |
| | | | Canada - 6.3% | | | |
| | 450,865 | | | Canadian National Railway Co. | | | 25,203,735 | |
| | 449,500 | | | Canadian Natural Resources Ltd. | | | 9,817,077 | |
| | 388,810 | | | Imperial Oil Ltd. | | | 12,667,164 | |
| | 293,100 | | | Magna International, Inc. | | | 11,887,528 | |
| | 707,070 | | | TransCanada Corp. | | | 23,092,067 | |
| | | | | | | | |
| | | | | | | 82,667,571 | |
| | | | | | | | |
| | | | China - 6.2% | |
| | 248,398 | | | Alibaba Group Holding Ltd. ADR* | | | 20,187,306 | |
| | 48,526 | | | Baidu, Inc. ADR* | | | 9,173,355 | |
| | 6,089,000 | | | China Life Insurance Co., Ltd. Class H | | | 19,546,887 | |
| | 10,068,000 | | | CNOOC Ltd. | | | 10,478,526 | |
| | 1,779,260 | | | ENN Energy Holdings Ltd. | | | 9,438,281 | |
| | 177,790 | | | Hollysys Automation Technologies Ltd. | | | 3,943,382 | |
| | 4,800,000 | | | PICC Property & Casualty Co., Ltd. Class H | | | 9,472,869 | |
| | | | | | | | |
| | | | | | | 82,240,606 | |
| | | | | | | | |
| | | | Denmark - 0.4% | |
| | 155,776 | | | H. Lundbeck A/S* | | | 5,319,014 | |
| | | | | | | | |
| | | | Finland - 0.3% | |
| | 95,497 | | | Kone Oyj Class B | | | 4,043,444 | |
| | | | | | | | |
| | | | France - 12.5% | |
| | 21,936 | | | Air Liquide S.A. | | | 2,462,678 | |
| | 374,016 | | | Airbus Group SE | | | 25,203,934 | |
| | 496,349 | | | BNP Paribas S.A. | | | 28,082,096 | |
| | 219,047 | | | Essilor International S.A. | | | 27,301,108 | |
| | 265,020 | | | Groupe Eurotunnel SE | | | 3,297,134 | |
| | 64,519 | | | Legrand S.A. | | | 3,649,533 | |
| | 326,068 | | | Schneider Electric SE | | | 18,521,943 | |
| | 502,695 | | | Total S.A. | | | 22,536,504 | |
| | 70,726 | | | Unibail-Rodamco SE REIT | | | 17,959,522 | |
| | 98,363 | | | Valeo S.A. | | | 15,165,076 | |
| | | | | | | | |
| | | | | | | 164,179,528 | |
| | | | | | | | |
| | | | Germany - 6.4% | |
| | 75,684 | | | adidas AG | | | 7,345,815 | |
| | 294,116 | | | Beiersdorf AG | | | 26,732,596 | |
| | 172,387 | | | Brenntag AG | | | 8,982,693 | |
| | 41,562 | | | Continental AG | | | 10,054,254 | |
| | 225,574 | | | Schaeffler AG (Preference Shares)* | | | 3,983,566 | |
| | 891,299 | | | Vonovia SE | | | 27,534,967 | |
| | | | | | | | |
| | | | | | | 84,633,891 | |
| | | | | | | | |
| | | | Greece - 0.7% | |
| | 2,186,243 | | | Alpha Bank A.E.* | | | 5,858,870 | |
| | 2,752,328 | | | Eurobank Ergasias S.A.* | | | 3,083,424 | |
| | | | | | | | |
| | | | | | | 8,942,294 | |
| | | | | | | | |
| | | | Hong Kong - 0.8% | |
| | 438,707 | | | Hong Kong Exchanges and Clearing Ltd. | | | 11,175,968 | |
| | | | | | | | |
| | | | India - 5.2% | |
| | 1,433,213 | | | Bharti Infratel Ltd. | | | 9,246,951 | |
| | 77,518 | | | Divi’s Laboratories Ltd. | | | 1,350,616 | |
| | 84,980 | | | HDFC Bank Ltd. ADR | | | 5,234,768 | |
| | 5,821,587 | | | ICICI Bank Ltd. | | | 22,993,717 | |
| | 56,100 | | | ICICI Bank Ltd. ADR | | | 439,263 | |
| | 108,442 | | | Maruti Suzuki India Ltd. | | | 7,552,032 | |
| | | | | | | | |
Shares or Principal Amount | | Market Value† | |
| COMMON STOCKS - 97.0% - (continued) | |
| | | | India - 5.2% - (continued) | |
| | 971,300 | | | Power Grid Corp. of India Ltd. | | $ | 2,066,967 | |
| | 3,346,882 | | | State Bank of India | | | 11,309,995 | |
| | 222,129 | | | Tata Consultancy Services Ltd. | | | 8,166,254 | |
| | | | | | | | |
| | | | | | | 68,360,563 | |
| | | | | | | | |
| | | | Ireland - 1.1% | |
| | 503,301 | | | CRH plc | | | 14,571,421 | |
| | | | | | | | |
| | | | Italy - 5.1% | |
| | 1,082,092 | | | Assicurazioni Generali S.p.A. | | | 19,766,234 | |
| | 259,273 | | | Banca Generali S.p.A. | | | 8,155,688 | |
| | 716,526 | | | FinecoBank Banca Fineco S.p.A. | | | 5,891,922 | |
| | 4,333,746 | | | Intesa Sanpaolo S.p.A. | | | 14,392,365 | |
| | 212,450 | | | Luxottica Group S.p.A. | | | 13,844,314 | |
| | 1,032,202 | | | Snam S.p.A. | | | 5,386,995 | |
| | | | | | | | |
| | | | | | | 67,437,518 | |
| | | | | | | | |
| | | | Japan - 16.9% | |
| | 553,460 | | | Asics Corp. | | | 11,482,907 | |
| | 219,280 | | | Daito Trust Construction Co., Ltd. | | �� | 25,329,141 | |
| | 121,845 | | | Daiwa House Industry Co., Ltd. | | | 3,502,598 | |
| | 326,210 | | | Eisai Co., Ltd. | | | 21,579,035 | |
| | 544,700 | | | Honda Motor Co., Ltd. | | | 17,409,436 | |
| | 144,410 | | | M3, Inc. | | | 2,994,223 | |
| | 3,197,000 | | | NEC Corp. | | | 10,129,754 | |
| | 458,700 | | | Nippon Telegraph & Telephone Corp. | | | 18,255,395 | |
| | 190,505 | | | Olympus Corp. | | | 7,499,928 | |
| | 183,200 | | | Omron Corp. | | | 6,109,152 | |
| | 184,645 | | | Ono Pharmaceutical Co., Ltd. | | | 32,924,358 | |
| | 539,230 | | | Seven & I Holdings Co., Ltd. | | | 24,688,406 | |
| | 547,700 | | | Sumco Corp. | | | 4,132,121 | |
| | 370,800 | | | Sumitomo Mitsui Financial Group, Inc. | | | 13,994,375 | |
| | 365,160 | | | T&D Holdings, Inc. | | | 4,817,750 | |
| | 281,105 | | | Takeda Pharmaceutical Co., Ltd. | | | 14,015,741 | |
| | 115,033 | | | Tokio Marine Holdings, Inc. | | | 4,443,104 | |
| | | | | | | | |
| | | | | | | 223,307,424 | |
| | | | | | | | |
| | | | Netherlands - 2.3% | |
| | 190,340 | | | AerCap Holdings N.V.* | | | 8,215,074 | |
| | 260,302 | | | NXP Semiconductors N.V.* | | | 21,930,444 | |
| | | | | | | | |
| | | | | | | 30,145,518 | |
| | | | | | | | |
| | | | Russia - 1.4% | |
| | 230,122 | | | MegaFon PJSC GDR | | | 2,680,921 | |
| | 2,455,100 | | | Sberbank of Russia PJSC ADR | | | 14,215,029 | |
| | 135,550 | | | Yandex N.V. Class A* | | | 2,130,846 | |
| | | | | | | | |
| | | | | | | 19,026,796 | |
| | | | | | | | |
| | | | South Korea- 1 .3% | |
| | 79,712 | | | Korea Electric Power Corp. | | | 3,377,173 | |
| | 525,673 | | | SK Hynix, Inc. | | | 13,579,678 | |
| | | | | | | | |
| | | | | | | 16,956,851 | |
| | | | | | | | |
| | | | Spain - 2.6% | |
| | 3,971,947 | | | CaixaBank S.A. | | | 13,824,797 | |
| | 581,241 | | | Industria de Diseno Textil S.A. | | | 19,968,015 | |
| | | | | | | | |
| | | | | | | 33,792,812 | |
| | | | | | | | |
| | | | Sweden - 1.9% | |
| | 606,321 | | | Assa Abloy AB Class B | | | 12,691,938 | |
| | 329,774 | | | Hennes & Mauritz AB Class B | | | 11,730,154 | |
| | | | | | | | |
| | | | | | | 24,422,092 | |
| | | | | | | | |
The accompanying notes are an integral part of these financial statements.
|
| Hartford International Opportunities HLS Fund |
Schedule of Investments – (continued)
December 31, 2015
| | | | | | | | |
Shares or Principal Amount | | Market Value† | |
| COMMON STOCKS - 97.0% - (continued) | |
| | | | Switzerland - 7.1% | |
| | 67,642 | | | Adecco S.A. | | $ | 4,629,600 | |
| | 136,101 | | | Cie Financiere Richemont S.A. | | | 9,741,147 | |
| | 276,501 | | | Julius Baer Group Ltd.* | | | 13,376,331 | |
| | 395,042 | | | Novartis AG | | | 33,981,224 | |
| | 60,239 | | | Roche Holding AG | | | 16,692,732 | |
| | 756,124 | | | UBS Group AG | | | 14,668,398 | |
| | | | | | | | |
| | | | | | | 93,089,432 | |
| | | | | | | | |
| | | | Taiwan - 2.6% | |
| | 8,043,035 | | | Taiwan Semiconductor Manufacturing Co., Ltd. | | | 34,699,586 | |
| | | | | | | | |
| | | | United Kingdom - 13.8% | |
| | 534,249 | | | AstraZeneca plc | | | 36,087,084 | |
| | 68,248 | | | Derwent London plc REIT | | | 3,691,362 | |
| | 304,640 | | | Diageo plc | | | 8,319,029 | |
| | 179,716 | | | Hikma Pharmaceuticals plc | | | 6,092,276 | |
| | 743,398 | | | International Consolidated Airlines Group S.A. | | | 6,683,937 | |
| | 324,820 | | | Markit, Ltd.* | | | 9,799,819 | |
| | 211,531 | | | Schroders plc | | | 9,264,840 | |
| | 2,160,765 | | | Sky plc | | | 35,420,866 | |
| | 1,495,438 | | | Smith & Nephew plc | | | 26,651,794 | |
| | 575,929 | | | Unilever N.V. | | | 25,101,348 | |
| | 652,076 | | | WPP plc | | | 14,998,901 | |
| | | | | | | | |
| | | | | | | 182,111,256 | |
| | | | | | | | |
| | |
| | | | Total Common Stocks
(cost $1,254,186,030) | | $ | 1,278,860,206 | |
| | | | | | | | |
| | |
| | | | Total Long-Term Investments
(cost $1,254,186,030) | | $ | 1,278,860,206 | |
| | | | | | | | |
|
| SHORT-TERM INVESTMENTS - 2.9% | |
| | | | Other Investment Pools & Funds - 2.9% | | | |
| | 37,642,203 | | | BlackRock Liquidity Funds TempFund Portfolio | | $ | 37,642,203 | |
| | | | | | | | |
| | |
| | | | Total Short-Term Investments
(cost $37,642,203) | | $ | 37,642,203 | |
| | | | | | | | |
| | | | | | | | | | |
| | | |
| | Total Investments
(cost $1,291,828,233)^ | | | 99.9 | % | | $ | 1,316,502,409 | |
| | Other Assets and Liabilities | | | 0.1 | % | | | 1,285,529 | |
| | | | | | | | | | |
| | Total Net Assets | | | 100.0 | % | | $ | 1,317,787,938 | |
| | | | | | | | | | |
The accompanying notes are an integral part of these financial statements.
|
| Hartford International Opportunities HLS Fund |
Schedule of Investments – (continued)
December 31, 2015
| Note: | Percentage of investments as shown is the ratio of the total market value to total net assets. |
| | Prices of foreign equities that are principally traded on certain foreign markets may be adjusted daily pursuant to a fair value pricing service approved by the Board of Directors in order to reflect an adjustment for factors occurring after the close of certain foreign markets but before the close of the New York Stock Exchange. |
| | Equity industry classifications used in this report are the Global Industry Classification Standard, which was developed by and is the exclusive property and service mark of MSCI, Inc. and Standard & Poor’s. |
| | For Fund compliance purposes, the Fund may not use the same classification system shown in this report as these classifications are used for financial reporting purposes. |
| ^ | At December 31, 2015, the cost of securities for federal income tax purposes was $1,294,168,697 and the aggregate gross unrealized appreciation and depreciation based on that cost were: |
| | | | |
Unrealized Appreciation | | $ | 99,770,805 | |
Unrealized Depreciation | | | (77,437,093 | ) |
| | | | |
Net Unrealized Appreciation | | $ | 22,333,712 | |
| | | | |
| † | See Significant Accounting Policies of accompanying Notes to Financial Statements regarding valuation of investments. |
| | |
| GLOSSARY: (abbreviations used in preceding Schedule of Investments) |
|
| Other Abbreviations: |
ADR | | American Depositary Receipt |
GDR | | Global Depositary Receipt |
PJSC | | Private Joint Stock Company |
REIT | | Real Estate Investment Trust |
The accompanying notes are an integral part of these financial statements.
|
| Hartford International Opportunities HLS Fund |
Schedule of Investments – (continued)
December 31, 2015
Fair Valuation Summary
The following is a summary of the fair valuations according to the inputs used as of December 31, 2015 in valuing the Fund’s investments.
| | | | | | | | | | | | | | | | |
| | | Total | | | Level 1(1) | | | Level 2(1) | | | Level 3 | |
Assets | |
Common Stocks | | | | | | | | | | | | | | | | |
Belgium | | $ | 25,356,601 | | | $ | — | | | $ | 25,356,601 | | | $ | — | |
Brazil | | | 2,380,020 | | | | 2,380,020 | | | | — | | | | — | |
Canada | | | 82,667,571 | | | | 82,667,571 | | | | — | | | | — | |
China | | | 82,240,606 | | | | 33,304,043 | | | | 48,936,563 | | | | — | |
Denmark | | | 5,319,014 | | | | — | | | | 5,319,014 | | | | — | |
Finland | | | 4,043,444 | | | | — | | | | 4,043,444 | | | | — | |
France | | | 164,179,528 | | | | — | | | | 164,179,528 | | | | — | |
Germany | | | 84,633,891 | | | | 3,983,566 | | | | 80,650,325 | | | | — | |
Greece | | | 8,942,294 | | | | — | | | | 8,942,294 | | | | — | |
Hong Kong | | | 11,175,968 | | | | — | | | | 11,175,968 | | | | — | |
India | | | 68,360,563 | | | | 5,674,031 | | | | 62,686,532 | | | | — | |
Ireland | | | 14,571,421 | | | | — | | | | 14,571,421 | | | | — | |
Italy | | | 67,437,518 | | | | — | | | | 67,437,518 | | | | — | |
Japan | | | 223,307,424 | | | | — | | | | 223,307,424 | | | | — | |
Netherlands | | | 30,145,518 | | | | 30,145,518 | | | | — | | | | — | |
Russia | | | 19,026,796 | | | | 19,026,796 | | | | — | | | | — | |
South Korea | | | 16,956,851 | | | | — | | | | 16,956,851 | | | | — | |
Spain | | | 33,792,812 | | | | — | | | | 33,792,812 | | | | — | |
Sweden | | | 24,422,092 | | | | — | | | | 24,422,092 | | | | — | |
Switzerland | | | 93,089,432 | | | | — | | | | 93,089,432 | | | | — | |
Taiwan | | | 34,699,586 | | | | — | | | | 34,699,586 | | | | — | |
United Kingdom | | | 182,111,256 | | | | 34,901,167 | | | | 147,210,089 | | | | — | |
Short-Term Investments | | | 37,642,203 | | | | 37,642,203 | | | | — | | | | — | |
| | | | | | | | | | | | | | | | |
Total | | $ | 1,316,502,409 | | | $ | 249,724,915 | | | $ | 1,066,777,494 | | | $ | — | |
| | | | | | | | | | | | | | | | |
| (1) | For the year ended December 31, 2015, investments valued at $25,017,546 were transferred from Level 1 to Level 2, and there were no transfers from Level 2 to Level 1. Investments are transferred between Level 1 and Level 2 for a variety of reasons including, but not limited to: |
| | a) | Foreign equities for which a fair value price is more representative of exit value than the local market close (transfer into Level 2). Foreign equities for which the local market close is more representative of exit value (transfer into Level 1). |
| | b) | Equity investments with no observable trading but a bid or mean price is used (transfer into Level 2). Equity investments using observable quoted prices in an active market (transfer into Level 1). |
| Note: | For purposes of reporting transfers between different hierarchy levels, both transfers in and out of each level, as applicable, are shown as if they occurred at the beginning of the period. |
The accompanying notes are an integral part of these financial statements.
Schedule of Investments
December 31, 2015
| | | | | | | | |
Shares or Principal Amount | | Market Value† | |
| COMMON STOCKS - 99.8% | |
| | | | Automobiles & Components - 1.2% | |
| | 450,171 | | | Harley-Davidson, Inc. | | $ | 20,433,262 | |
| | | | | | | | |
| | | | Banks - 4.4% | |
| | 93,275 | | | Cullen/Frost Bankers, Inc. | | | 5,596,500 | |
| | 199,653 | | | East West Bancorp, Inc. | | | 8,297,579 | |
| | 15,828 | | | First Citizens BancShares, Inc. Class A | | | 4,086,315 | |
| | 325,138 | | | First Republic Bank | | | 21,478,616 | |
| | 306,929 | | | M&T Bank Corp. | | | 37,193,656 | |
| | | | | | | | |
| | | | | | | 76,652,666 | |
| | | | | | | | |
| | | | Capital Goods - 7.3% | |
| | 689,527 | | | Allison Transmission Holdings, Inc. | | | 17,851,854 | |
| | 211,239 | | | Colfax Corp.* | | | 4,932,431 | |
| | 354,465 | | | Fastenal Co. | | | 14,469,261 | |
| | 354,522 | | | IDEX Corp. | | | 27,159,930 | |
| | 74,175 | | | Jacobs Engineering Group, Inc.* | | | 3,111,641 | |
| | 257,242 | | | Lennox International, Inc. | | | 32,129,526 | |
| | 264,162 | | | MSC Industrial Direct Co., Inc. Class A | | | 14,864,396 | |
| | 278,200 | | | PACCAR, Inc. | | | 13,186,680 | |
| | | | | | | | |
| | | | | | | 127,705,719 | |
| | | | | | | | |
| | | | Commercial & Professional Services - 11.0% | |
| | 308,747 | | | Clean Harbors, Inc.* | | | 12,859,312 | |
| | 401,242 | | | Equifax, Inc. | | | 44,686,321 | |
| | 422,905 | | | ManpowerGroup, Inc. | | | 35,646,662 | |
| | 716,219 | | | Robert Half International, Inc. | | | 33,762,564 | |
| | 52,560 | | | Towers Watson & Co. Class A | | | 6,751,858 | |
| | 603,454 | | | TransUnion* | | | 16,637,227 | |
| | 562,517 | | | TriNet Group, Inc.* | | | 10,884,704 | |
| | 561,346 | | | Waste Connections, Inc. | | | 31,615,007 | |
| | | | | | | | |
| | | | | | | 192,843,655 | |
| | | | | | | | |
| | | | Consumer Durables & Apparel - 3.0% | |
| | 194,032 | | | Harman International Industries, Inc. | | | 18,279,755 | |
| | 19,326 | | | NVR, Inc.* | | | 31,752,618 | |
| | 40,033 | | | Tempur Sealy International, Inc.* | | | 2,820,725 | |
| | | | | | | | |
| | | | | | | 52,853,098 | |
| | | | | | | | |
| | | | Consumer Services - 1.1% | |
| | 278,056 | | | Choice Hotels International, Inc. | | | 14,016,803 | |
| | 77,110 | | | Wynn Resorts Ltd. | | | 5,335,241 | |
| | | | | | | | |
| | | | | | | 19,352,044 | |
| | | | | | | | |
| | | | Diversified Financials - 6.2% | |
| | 147,273 | | | Factset Research Systems, Inc. | | | 23,942,172 | |
| | 244,969 | | | Invesco Ltd. | | | 8,201,562 | |
| | 149,180 | | | Moody’s Corp. | | | 14,968,721 | |
| | 303,560 | | | MSCI, Inc. | | | 21,895,783 | |
| | 271,366 | | | Northern Trust Corp. | | | 19,562,775 | |
| | 377,400 | | | SEI Investments Co. | | | 19,775,760 | |
| | | | | | | | |
| | | | | | | 108,346,773 | |
| | | | | | | | |
| | | | Energy - 5.6% | |
| | 102,455 | | | Cimarex Energy Co. | | | 9,157,428 | |
| | 1,297,170 | | | Cobalt International Energy, Inc.* | | | 7,004,718 | |
| | 163,137 | | | Diamondback Energy, Inc.* | | | 10,913,865 | |
| | 286,994 | | | Energen Corp. | | | 11,763,884 | |
| | 592,606 | | | Memorial Resource Development Corp.* | | | 9,570,587 | |
| | 327,469 | | | Newfield Exploration Co.* | | | 10,662,391 | |
| | 528,186 | | | Patterson-UTI Energy, Inc. | | | 7,965,045 | |
| | 82,653 | | | Pioneer Natural Resources Co. | | | 10,363,033 | |
| | 913,553 | | | QEP Resources, Inc. | | | 12,241,610 | |
| | 224,354 | | | World Fuel Services Corp. | | | 8,628,655 | |
| | | | | | | | |
| | | | | | | 98,271,216 | |
| | | | | | | | |
| | | | | | | | |
Shares or Principal Amount | | Market Value† | |
| COMMON STOCKS - 99.8% - (continued) | |
| | | | Food & Staples Retailing - 0.7% | |
| | 154,394 | | | PriceSmart, Inc. | | $ | 12,813,158 | |
| | | | | | | | |
| | | | Health Care Equipment & Services - 8.9% | |
| | 667,033 | | | Envision Healthcare Holdings, Inc.* | | | 17,322,847 | |
| | 773,306 | | | IMS Health Holdings, Inc.* | | | 19,696,104 | |
| | 307,333 | | | MEDNAX, Inc.* | | | 22,023,483 | |
| | 473,468 | | | Patterson Cos., Inc. | | | 21,405,488 | |
| | 257,249 | | | Sirona Dental Systems, Inc.* | | | 28,186,773 | |
| | 23,101 | | | STERIS plc | | | 1,740,429 | |
| | 315,970 | | | Team Health Holdings, Inc.* | | | 13,867,923 | |
| | 147,324 | | | Universal Health Services, Inc. Class B | | | 17,603,745 | |
| | 176,676 | | | Varian Medical Systems, Inc.* | | | 14,275,421 | |
| | | | | | | | |
| | | | | | | 156,122,213 | |
| | | | | | | | |
| | | | Insurance - 6.1% | |
| | 37,555 | | | Alleghany Corp.* | | | 17,948,661 | |
| | 43,047 | | | Fairfax Financial Holdings Ltd. | | | 20,436,514 | |
| | 46,902 | | | Markel Corp.* | | | 41,430,882 | |
| | 18,847 | | | White Mountains Insurance Group Ltd. | | | 13,698,188 | |
| | 247,783 | | | WR Berkley Corp. | | | 13,566,119 | |
| | | | | | | | |
| | | | | | | 107,080,364 | |
| | | | | | | | |
| | | | Materials - 3.2% | |
| | 247,563 | | | Ball Corp. | | | 18,005,257 | |
| | 223,030 | | | Packaging Corp. of America | | | 14,062,042 | |
| | 45,689 | | | Sherwin-Williams Co. | | | 11,860,864 | |
| | 236,047 | | | Silgan Holdings, Inc. | | | 12,680,445 | |
| | | | | | | | |
| | | | | | | 56,608,608 | |
| | | | | | | | |
| | | | Pharmaceuticals, Biotechnology & Life
Sciences - 7.5% | |
| | 163,056 | | | Agios Pharmaceuticals, Inc.* | | | 10,585,596 | |
| | 459,888 | | | Alkermes plc* | | | 36,505,909 | |
| | 97,723 | | | Alnylam Pharmaceuticals, Inc.* | | | 9,199,643 | |
| | 830,884 | | | Ironwood Pharmaceuticals, Inc.* | | | 9,629,946 | |
| | 108,058 | | | Jazz Pharmaceuticals plc* | | | 15,188,632 | |
| | 79,973 | | | Mettler-Toledo International, Inc.* | | | 27,121,244 | |
| | 173,140 | | | Waters Corp.* | | | 23,301,181 | |
| | | | | | | | |
| | | | | | | 131,532,151 | |
| | | | | | | | |
| | | | Retailing - 6.0% | |
| | 245,094 | | | Advance Auto Parts, Inc. | | | 36,889,098 | |
| | 499,449 | | | CarMax, Inc.* | | | 26,955,263 | |
| | 230,566 | | | Tiffany & Co. | | | 17,589,880 | |
| | 279,638 | | | TripAdvisor, Inc.* | | | 23,839,139 | |
| | | | | | | | |
| | | | | | | 105,273,380 | |
| | | | | | | | |
| | | | Semiconductors & Semiconductor Equipment - 1.4% | |
| | 199,931 | | | First Solar, Inc.* | | | 13,193,447 | |
| | 394,585 | | | SunPower Corp.* | | | 11,841,496 | |
| | | | | | | | |
| | | | | | | 25,034,943 | |
| | | | | | | | |
| | | | Software & Services - 12.3% | |
| | 490,652 | | | Akamai Technologies, Inc.* | | | 25,823,015 | |
| | 163,698 | | | Cadence Design Systems, Inc.* | | | 3,406,555 | |
| | 2,034,725 | | | Genpact Ltd.* | | | 50,827,430 | |
| | 350,003 | | | Global Payments, Inc. | | | 22,578,694 | |
| | 251,240 | | | Guidewire Software, Inc.* | | | 15,114,598 | |
| | 861,074 | | | Vantiv, Inc. Class A* | | | 40,832,129 | |
| | 270,772 | | | VeriSign, Inc.* | | | 23,654,642 | |
| | 223,855 | | | WEX, Inc.* | | | 19,788,782 | |
| | 180,413 | | | Zillow Group, Inc. Class A* | | | 4,697,955 | |
| | 355,178 | | | Zillow Group, Inc. Class C* | | | 8,339,579 | |
| | | | | | | | |
| | | | | | | 215,063,379 | |
| | | | | | | | |
The accompanying notes are an integral part of these financial statements.
Schedule of Investments – (continued)
December 31, 2015
| | | | | | | | |
Shares or Principal Amount | | Market Value† | |
| COMMON STOCKS - 99.8% - (continued) | |
| | | | Technology Hardware & Equipment - 6.9% | |
| | 400,066 | | | Amphenol Corp. Class A | | $ | 20,895,447 | |
| | 130,029 | | | Arista Networks, Inc.* | | | 10,121,457 | |
| | 491,644 | | | CDW Corp. of Delaware | | | 20,668,714 | |
| | 175,211 | | | FEI Co. | | | 13,980,086 | |
| | 895,550 | | | National Instruments Corp. | | | 25,693,330 | |
| | 528,701 | | | Nimble Storage, Inc.* | | | 4,864,049 | |
| | 210,554 | | | Pure Storage, Inc. Class A* | | | 3,278,326 | |
| | 975,314 | | | Trimble Navigation Ltd.* | | | 20,920,485 | |
| | | | | | | | |
| | | | | | | 120,421,894 | |
| | | | | | | | |
| | | | Transportation - 4.9% | |
| | 171,792 | | | Alaska Air Group, Inc. | | | 13,830,974 | |
| | 35,491 | | | AMERCO | | | 13,823,744 | |
| | 360,808 | | | Genesee & Wyoming, Inc. Class A* | | | 19,371,782 | |
| | 269,578 | | | J.B. Hunt Transport Services, Inc. | | | 19,776,242 | |
| | 755,808 | | | JetBlue Airways Corp.* | | | 17,119,051 | |
| | 41,427 | | | Spirit Airlines, Inc.* | | | 1,650,866 | |
| | | | | | | | |
| | | | | | | 85,572,659 | |
| | | | | | | | |
| | | | Utilities - 2.1% | |
| | 138,006 | | | Eversource Energy | | | 7,047,966 | |
| | 645,543 | | | UGI Corp. | | | 21,793,532 | |
| | 175,071 | | | WEC Energy Group, Inc. | | | 8,982,893 | |
| | | | | | | | |
| | | | | | | 37,824,391 | |
| | | | | | | | |
| | |
| | | | Total Common Stocks
(cost $1,491,358,246) | | $ | 1,749,805,573 | |
| | | | | | | | |
| | |
| | | | Total Long-Term Investments
(cost $1,491,358,246) | | $ | 1,749,805,573 | |
| | | | | | | | |
|
| SHORT-TERM INVESTMENTS - 0.2% | |
| | | | Other Investment Pools & Funds - 0.2% | | | |
| | 2,985,735 | | | Fidelity Money Market Class 1 | | $ | 2,985,735 | |
| | | | | | | | |
| | |
| | | | Total Short-Term Investments
(cost $2,985,735) | | $ | 2,985,735 | |
| | | | | | | | |
| | | | | | | | | | |
| | | |
| | Total Investments
(cost $1,494,343,981)^ | | | 100.0 | % | | $ | 1,752,791,308 | |
| | Other Assets and Liabilities | | | 0.0 | % | | | (681,057 | ) |
| | | | | | | | | | |
| | Total Net Assets | | | 100.0% | | | $ | 1,752,110,251 | |
| | | | | | | | | | |
The accompanying notes are an integral part of these financial statements.
Schedule of Investments – (continued)
December 31, 2015
| Note: | Percentage of investments as shown is the ratio of the total market value to total net assets. |
| | Prices of foreign equities that are principally traded on certain foreign markets may be adjusted daily pursuant to a fair value pricing service approved by the Board of Directors in order to reflect an adjustment for factors occurring after the close of certain foreign markets but before the close of the New York Stock Exchange. |
| | Equity industry classifications used in this report are the Global Industry Classification Standard, which was developed by and is the exclusive property and service mark of MSCI, Inc. and Standard & Poor’s. |
| | For Fund compliance purposes, the Fund may not use the same classification system shown in this report as these classifications are used for financial reporting purposes. |
| ^ | At December 31, 2015, the cost of securities for federal income tax purposes was $1,497,406,292 and the aggregate gross unrealized appreciation and depreciation based on that cost were: |
| | | | |
Unrealized Appreciation | | $ | 371,041,475 | |
Unrealized Depreciation | | | (115,656,459 | ) |
| | | | |
Net Unrealized Appreciation | | $ | 255,385,016 | |
| | | | |
| † | See Significant Accounting Policies of accompanying Notes to Financial Statements regarding valuation of investments. |
The accompanying notes are an integral part of these financial statements.
Schedule of Investments – (continued)
December 31, 2015
Fair Valuation Summary
The following is a summary of the fair valuations according to the inputs used as of December 31, 2015 in valuing the Fund’s investments.
| | | | | | | | | | | | | | | | |
| | | Total | | | Level 1(1) | | | Level 2(1) | | | Level 3 | |
Assets | |
Common Stocks | | | | | | | | | | | | | | | | |
Automobiles & Components | | $ | 20,433,262 | | | $ | 20,433,262 | | | $ | — | | | $ | — | |
Banks | | | 76,652,666 | | | | 76,652,666 | | | | — | | | | — | |
Capital Goods | | | 127,705,719 | | | | 127,705,719 | | | | — | | | | — | |
Commercial & Professional Services | | | 192,843,655 | | | | 192,843,655 | | | | — | | | | — | |
Consumer Durables & Apparel | | | 52,853,098 | | | | 52,853,098 | | | | — | | | | — | |
Consumer Services | | | 19,352,044 | | | | 19,352,044 | | | | — | | | | — | |
Diversified Financials | | | 108,346,773 | | | | 108,346,773 | | | | — | | | | — | |
Energy | | | 98,271,216 | | | | 98,271,216 | | | | — | | | | — | |
Food & Staples Retailing | | | 12,813,158 | | | | 12,813,158 | | | | — | | | | — | |
Health Care Equipment & Services | | | 156,122,213 | | | | 156,122,213 | | | | — | | | | — | |
Insurance | | | 107,080,364 | | | | 107,080,364 | | | | — | | | | — | |
Materials | | | 56,608,608 | | | | 56,608,608 | | | | — | | | | — | |
Pharmaceuticals, Biotechnology & Life Sciences | | | 131,532,151 | | | | 131,532,151 | | | | — | | | | — | |
Retailing | | | 105,273,380 | | | | 105,273,380 | | | | — | | | | — | |
Semiconductors & Semiconductor Equipment | | | 25,034,943 | | | | 25,034,943 | | | | — | | | | — | |
Software & Services | | | 215,063,379 | | | | 215,063,379 | | | | — | | | | — | |
Technology Hardware & Equipment | | | 120,421,894 | | | | 120,421,894 | | | | — | | | | — | |
Transportation | | | 85,572,659 | | | | 85,572,659 | | | | — | | | | — | |
Utilities | | | 37,824,391 | | | | 37,824,391 | | | | — | | | | — | |
Short-Term Investments | | | 2,985,735 | | | | 2,985,735 | | | | — | | | | — | |
| | | | | | | | | | | | | | | | |
Total | | $ | 1,752,791,308 | | | $ | 1,752,791,308 | | | $ | — | | | $ | — | |
| | | | | | | | | | | | | | | | |
| (1) | For the year ended December 31, 2015, there were no transfers between Level 1 and Level 2. |
| Note: | For purposes of reporting transfers between different hierarchy levels, both transfers in and out of each level, as applicable, are shown as if they occurred at the beginning of the period. |
The accompanying notes are an integral part of these financial statements.
|
| Hartford MidCap Value HLS Fund |
Schedule of Investments
December 31, 2015
| | | | | | | | |
Shares or Principal Amount | | Market Value† | |
| COMMON STOCKS - 98.6% | |
| | | | Automobiles & Components - 0.7% | |
| | 85,312 | | | Goodyear Tire & Rubber Co. | | $ | 2,787,143 | |
| | | | | | | | |
| | | | Banks - 10.0% | |
| | 161,785 | | | BankUnited, Inc. | | | 5,833,967 | |
| | 54,501 | | | CIT Group, Inc. | | | 2,163,690 | |
| | 181,293 | | | Comerica, Inc. | | | 7,583,486 | |
| | 155,102 | | | EverBank Financial Corp. | | | 2,478,530 | |
| | 102,709 | | | IBERIABANK Corp. | | | 5,656,185 | |
| | 139,633 | | | Provident Financial Services, Inc. | | | 2,813,605 | |
| | 45,197 | | | South State Corp. | | | 3,251,924 | |
| | 308,601 | | | Zions Bancorporation | | | 8,424,807 | |
| | | | | | | | |
| | | | | | | 38,206,194 | |
| | | | | | | | |
| | | | Capital Goods - 11.8% | |
| | 162,700 | | | Barnes Group, Inc. | | | 5,757,953 | |
| | 63,347 | | | Curtiss-Wright Corp. | | | 4,339,269 | |
| | 60,653 | | | Esterline Technologies Corp.* | | | 4,912,893 | |
| | 133,027 | | | Generac Holdings, Inc.* | | | 3,960,214 | |
| | 73,306 | | | Hubbell, Inc. Class B | | | 7,406,838 | |
| | 95,217 | | | Moog, Inc. Class A* | | | 5,770,150 | |
| | 10,272 | | | Orbital ATK, Inc. | | | 917,700 | |
| | 159,541 | | | Rexel S.A. | | | 2,124,411 | |
| | 578,285 | | | Sanwa Holdings Corp. | | | 4,573,658 | |
| | 93,934 | | | Sensata Technologies Holding N.V.* | | | 4,326,600 | |
| | 23,595 | | | WESCO International, Inc.* | | | 1,030,630 | |
| | | | | | | | |
| | | | | | | 45,120,316 | |
| | | | | | | | |
| | | | Consumer Durables & Apparel - 8.4% | |
| | 132,494 | | | D.R. Horton, Inc. | | | 4,243,783 | |
| | 23,595,130 | | | Global Brands Group Holding Ltd.* | | | 4,468,183 | |
| | 141,637 | | | Lennar Corp. Class A | | | 6,927,466 | |
| | 106,230 | | | Newell Rubbermaid, Inc. | | | 4,682,618 | |
| | 461,047 | | | Performance Sports Group Ltd.* | | | 4,439,883 | |
| | 120,749 | | | PulteGroup, Inc. | | | 2,151,747 | |
| | 758,760 | | | Samsonite International S.A. | | | 2,273,986 | |
| | 88,141 | | | Toll Brothers, Inc.* | | | 2,935,095 | |
| | | | | | | | |
| | | | | | | 32,122,761 | |
| | | | | | | | |
| | | | Consumer Services - 2.0% | |
| | 129,225 | | | Norwegian Cruise Line Holdings Ltd.* | | | 7,572,585 | |
| | | | | | | | |
| | | | Diversified Financials - 2.7% | | | |
| | 104,832 | | | Markit, Ltd.* | | | 3,162,782 | |
| | 74,946 | | | MSCI, Inc. | | | 5,405,855 | |
| | 27,500 | | | Raymond James Financial, Inc. | | | 1,594,175 | |
| | 451,900 | | | Solar Cayman Ltd.*(1)(2)(3) | | | 97,610 | |
| | | | | | | | |
| | | | | | | 10,260,422 | |
| | | | | | | | |
| | | | Energy - 5.8% | |
| | 416,400 | | | Cobalt International Energy, Inc.* | | | 2,248,560 | |
| | 115,067 | | | Diamondback Energy, Inc.* | | | 7,697,982 | |
| | 49,808 | | | Energen Corp. | | | 2,041,630 | |
| | 28,685 | | | HollyFrontier Corp. | | | 1,144,245 | |
| | 164,786 | | | Newfield Exploration Co.* | | | 5,365,432 | |
| | 270,779 | | | QEP Resources, Inc. | | | 3,628,439 | |
| | 258,900 | | | Trican Well Service Ltd.* | | | 119,748 | |
| | | | | | | | |
| | | | | | | 22,246,036 | |
| | | | | | | | |
| | | | Food, Beverage & Tobacco - 1.7% | |
| | 68,157 | | | Ingredion, Inc. | | | 6,532,167 | |
| | | | | | | | |
| | | | Health Care Equipment & Services - 1.5% | |
| | 117,404 | | | Brookdale Senior Living, Inc.* | | | 2,167,278 | |
| | 132,594 | | | Envision Healthcare Holdings, Inc.* | | | 3,443,466 | |
| | | | | | | | |
| | | | | | | 5,610,744 | |
| | | | | | | | |
| | | | | | | | |
Shares or Principal Amount | | Market Value† | |
| COMMON STOCKS - 98.6% - (continued) | |
| | | | Insurance - 9.5% | |
| | 83,475 | | | Argo Group International Holdings Ltd. | | $ | 4,995,144 | |
| | 201,620 | | | CNO Financial Group, Inc. | | | 3,848,926 | |
| | 62,328 | | | Hanover Insurance Group, Inc. | | | 5,069,759 | |
| | 90,609 | | | Reinsurance Group of America, Inc. | | | 7,751,600 | |
| | 245,226 | | | Unum Group | | | 8,163,574 | |
| | 171,104 | | | XL Group plc | | | 6,703,855 | |
| | | | | | | | |
| | | | | | | 36,532,858 | |
| | | | | | | | |
| | | | Materials - 8.8% | |
| | 89,574 | | | Bemis Co., Inc. | | | 4,003,062 | |
| | 118,774 | | | Cabot Corp. | | | 4,855,481 | |
| | 63,096 | | | Celanese Corp. Series A | | | 4,248,254 | |
| | 186,851 | | | Huntsman Corp. | | | 2,124,496 | |
| | 102,834 | | | KapStone Paper & Packaging Corp. | | | 2,323,020 | |
| | 392,432 | | | Louisiana-Pacific Corp.* | | | 7,067,700 | |
| | 189,403 | | | Methanex Corp. | | | 6,252,193 | |
| | 21,572 | | | Packaging Corp. of America | | | 1,360,115 | |
| | 88,975 | | | Steel Dynamics, Inc. | | | 1,589,983 | |
| | | | | | | | |
| | | | | | | 33,824,304 | |
| | | | | | | | |
| | | | Media - 2.3% | |
| | 205,503 | | | Interpublic Group of Cos., Inc. | | | 4,784,110 | |
| | 160,985 | | | Quebecor, Inc. Class B | | | 3,941,730 | |
| | | | | | | | |
| | | | | | | 8,725,840 | |
| | | | | | | | |
| | | | Pharmaceuticals, Biotechnology & Life Sciences - 3.2% | |
| | 188,502 | | | Almirall S.A. | | | 3,809,833 | |
| | 47,760 | | | Ono Pharmaceutical Co., Ltd. | | | 8,516,165 | |
| | | | | | | | |
| | | | | | | 12,325,998 | |
| | | | | | | | |
| | | | Real Estate - 10.0% | |
| | 145,218 | | | American Assets Trust, Inc. REIT | | | 5,569,110 | |
| | 95,875 | | | Blackstone Mortgage Trust, Inc. Class A REIT | | | 2,565,615 | |
| | 121,091 | | | Equity LifeStyle Properties, Inc. REIT | | | 8,073,137 | |
| | 88,883 | | | Extra Space Storage, Inc. REIT | | | 7,840,370 | |
| | 244,551 | | | Forest City Enterprises, Inc. Class A* | | | 5,363,003 | |
| | 55,791 | | | PS Business Parks, Inc. REIT | | | 4,877,807 | |
| | 36,998 | | | SL Green Realty Corp. REIT | | | 4,180,034 | |
| | | | | | | | |
| | | | | | | 38,469,076 | |
| | | | | | | | |
| | | | Retailing - 1.4% | |
| | 224,998 | | | DSW, Inc. Class A | | | 5,368,452 | |
| | | | | | | | |
| | | | Semiconductors & Semiconductor Equipment - 5.1% | |
| | 212,460 | | | Microsemi Corp.* | | | 6,924,071 | |
| | 94,744 | | | Qorvo, Inc.* | | | 4,822,470 | |
| | 105,172 | | | Silicon Motion Technology Corp. ADR | | | 3,298,194 | |
| | 54,907 | | | Synaptics, Inc.* | | | 4,411,228 | |
| | | | | | | | |
| | | | | | | 19,455,963 | |
| | | | | | | | |
| | | | Software & Services - 3.0% | |
| | 172,262 | | | Booz Allen Hamilton Holding Corp. | | | 5,314,282 | |
| | 152,396 | | | Verint Systems, Inc.* | | | 6,181,182 | |
| | | | | | | | |
| | | | | | | 11,495,464 | |
| | | | | | | | |
| | | | Technology Hardware & Equipment - 3.1% | |
| | 134,775 | | | ARRIS Group, Inc.* | | | 4,120,072 | |
| | 141,012 | | | Arrow Electronics, Inc.* | | | 7,640,030 | |
| | | | | | | | |
| | | | | | | 11,760,102 | |
| | | | | | | | |
| | | | Telecommunication Services - 0.5% | |
| | 35,131 | | | Millicom International Cellular S.A. | | | 2,015,820 | |
| | | | | | | | |
| | | | Transportation - 1.1% | |
| | 77,472 | | | Genesee & Wyoming, Inc. Class A* | | | 4,159,472 | |
| | | | | | | | |
The accompanying notes are an integral part of these financial statements.
|
| Hartford MidCap Value HLS Fund |
Schedule of Investments – (continued)
December 31, 2015
| | | | | | | | |
Shares or Principal Amount | | Market Value† | |
| COMMON STOCKS - 98.6% - (continued) | |
| | | | Utilities - 6.0% | |
| | 69,825 | | | Alliant Energy Corp. | | $ | 4,360,571 | |
| | 142,161 | | | Great Plains Energy, Inc. | | | 3,882,417 | |
| | 137,610 | | | Portland General Electric Co. | | | 5,004,875 | |
| | 199,663 | | | UGI Corp. | | | 6,740,623 | |
| | 71,553 | | | Westar Energy, Inc. | | | 3,034,564 | |
| | | | | | | | |
| | | | | | | 23,023,050 | |
| | | | | | | | |
| | |
| | | | Total Common Stocks
(cost $330,002,637) | | $ | 377,614,767 | |
| | | | | | | | |
| | |
| | | | Total Long-Term Investments
(cost $330,002,637) | | $ | 377,614,767 | |
| | | | | | | | |
|
| SHORT-TERM INVESTMENTS - 1.3% | |
| | | | Other Investment Pools & Funds - 1.3% | |
| | 4,804,796 | | | Federated Prime Obligations Fund | | $ | 4,804,796 | |
| | | | | | | | |
| | |
| | | | Total Short-Term Investments
(cost $4,804,796) | | $ | 4,804,796 | |
| | | | | | | | |
| | | | | | | | | | |
| | | |
| | Total Investments
(cost $334,807,433)^ | | | 99.9 | % | | $ | 382,419,563 | |
| | Other Assets and Liabilities | | | 0.1 | % | | | 474,547 | |
| | | | | | | | | | |
| | Total Net Assets | | | 100.0 | % | | $ | 382,894,110 | |
| | | | | | | | | | |
The accompanying notes are an integral part of these financial statements.
|
| Hartford MidCap Value HLS Fund |
Schedule of Investments – (continued)
December 31, 2015
| Note: | Percentage of investments as shown is the ratio of the total market value to total net assets. |
| | Prices of foreign equities that are principally traded on certain foreign markets may be adjusted daily pursuant to a fair value pricing service approved by the Board of Directors in order to reflect an adjustment for factors occurring after the close of certain foreign markets but before the close of the New York Stock Exchange. |
| | Equity industry classifications used in this report are the Global Industry Classification Standard, which was developed by and is the exclusive property and service mark of MSCI, Inc. and Standard & Poor’s. |
| | For Fund compliance purposes, the Fund may not use the same classification system shown in this report as these classifications are used for financial reporting purposes. |
| ^ | At December 31, 2015, the cost of securities for federal income tax purposes was $336,744,054 and the aggregate gross unrealized appreciation and depreciation based on that cost were: |
| | | | |
Unrealized Appreciation | | $ | 70,208,127 | |
Unrealized Depreciation | | | (24,532,618 | ) |
| | | | |
Net Unrealized Appreciation | | $ | 45,675,509 | |
| | | | |
| (1) | This security is valued in good faith at fair value as determined under policies and procedures established by and under the supervision of the Board of Directors. At December 31, 2015, the aggregate fair value of this security was $97,610, which represents 0.0% of total net assets. This amount excludes securities that are principally traded in certain foreign markets and whose prices are adjusted pursuant to a third party pricing service methodology approved by the Board of Directors. |
| (2) | Securities issued within terms of a private placement memorandum, exempt from registration under Rule 144A under the Securities Act of 1933, as amended, and may be sold only to qualified institutional buyers. Unless otherwise indicated, this holding is determined to be liquid. At December 31, 2015, the aggregate value of this security was $97,610, which represents 0.0% of total net assets. |
| (3) | The following security is considered illiquid. Illiquid securities are often purchased in private placement transactions, are often not registered under the Securities Act of 1933, as amended, and may have contractual restrictions on resale. A security may also be considered illiquid if the security lacks a readily available market or if its valuation has not changed for a certain period of time. |
| | | | | | | | | | |
Period
Acquired | | Shares/Par | | | Security | | Cost | |
03/2007 | | | 451,900 | | | Solar Cayman Ltd. | | $ | 132,446 | |
At December 31, 2015, the aggregate value of these securities was $97,610, which represents 0.0% of total net assets.
| † | See Significant Accounting Policies of accompanying Notes to Financial Statements regarding valuation of investments. |
| | |
| GLOSSARY: (abbreviations used in preceding Schedule of Investments) |
|
| Other Abbreviations: |
ADR | | American Depositary Receipt |
REIT | | Real Estate Investment Trust |
The accompanying notes are an integral part of these financial statements.
|
| Hartford MidCap Value HLS Fund |
Schedule of Investments – (continued)
December 31, 2015
Fair Valuation Summary
The following is a summary of the fair valuations according to the inputs used as of December 31, 2015 in valuing the Fund’s investments.
| | | | | | | | | | | | | | | | |
| | | Total | | | Level 1(1) | | | Level 2(1) | | | Level 3 | |
Assets | |
Common Stocks | | | | | | | | | | | | | | | | |
Automobiles & Components | | $ | 2,787,143 | | | $ | 2,787,143 | | | $ | — | | | $ | — | |
Banks | | | 38,206,194 | | | | 38,206,194 | | | | — | | | | — | |
Capital Goods | | | 45,120,316 | | | | 38,422,247 | | | | 6,698,069 | | | | — | |
Consumer Durables & Apparel | | | 32,122,761 | | | | 25,380,592 | | | | 6,742,169 | | | | — | |
Consumer Services | | | 7,572,585 | | | | 7,572,585 | | | | — | | | | — | |
Diversified Financials | | | 10,260,422 | | | | 10,162,812 | | | | — | | | | 97,610 | |
Energy | | | 22,246,036 | | | | 22,246,036 | | | | — | | | | — | |
Food, Beverage & Tobacco | | | 6,532,167 | | | | 6,532,167 | | | | — | | | | — | |
Health Care Equipment & Services | | | 5,610,744 | | | | 5,610,744 | | | | — | | | | — | |
Insurance | | | 36,532,858 | | | | 36,532,858 | | | | — | | | | — | |
Materials | | | 33,824,304 | | | | 33,824,304 | | | | — | | | | — | |
Media | | | 8,725,840 | | | | 8,725,840 | | | | — | | | | — | |
Pharmaceuticals, Biotechnology & Life Sciences | | | 12,325,998 | | | | — | | | | 12,325,998 | | | | — | |
Real Estate | | | 38,469,076 | | | | 38,469,076 | | | | — | | | | — | |
Retailing | | | 5,368,452 | | | | 5,368,452 | | | | — | | | | — | |
Semiconductors & Semiconductor Equipment | | | 19,455,963 | | | | 19,455,963 | | | | — | | | | — | |
Software & Services | | | 11,495,464 | | | | 11,495,464 | | | | — | | | | — | |
Technology Hardware & Equipment | | | 11,760,102 | | | | 11,760,102 | | | | — | | | | — | |
Telecommunication Services | | | 2,015,820 | | | | — | | | | 2,015,820 | | | | — | |
Transportation | | | 4,159,472 | | | | 4,159,472 | | | | — | | | | — | |
Utilities | | | 23,023,050 | | | | 23,023,050 | | | | — | | | | — | |
Short-Term Investments | | | 4,804,796 | | | | 4,804,796 | | | | — | | | | — | |
| | | | | | | | | | | | | | | | |
Total | | $ | 382,419,563 | | | $ | 354,539,897 | | | $ | 27,782,056 | | | $ | 97,610 | |
| | | | | | | | | �� | | | | | | | |
| (1) | For the year ended December 31, 2015, there were no transfers between Level 1 and Level 2. |
The following is a rollforward of the Fund’s investments that were valued using unobservable inputs (Level 3) for the year ended December 31, 2015:
| | | | | | | | |
| | | Common
Stocks | | | Total | |
Beginning balance | | $ | 31,633 | | | $ | 31,633 | |
Purchases | | | — | | | | — | |
Sales | | | — | | | | — | |
Accrued discounts/(premiums) | | | — | | | | — | |
Total realized gain/(loss) | | | — | | | | — | |
Net change in unrealized appreciation/depreciation | | | 65,977 | | | | 65,977 | |
Transfers into Level 3(1) | | | — | | | | — | |
Transfers out of Level 3(1) | | | — | | | | — | |
| | | | | | | | |
Ending balance | | $ | 97,610 | | | $ | 97,610 | |
| | | | | | | | |
The change in net unrealized appreciation/depreciation relating to the Level 3 investments held at December 31, 2015 was $65,977.
| (1) | Investments are transferred into and out of Level 3 for a variety of reasons including, but not limited to: |
| | a) | Investments where trading has been halted (transfer into Level 3) or investments where trading has resumed (transfer out of Level 3). |
| | b) | Broker quoted investments (transfer into Level 3) or quoted prices in active markets (transfer out of Level 3). |
| | c) | Investments that have certain restrictions on trading (transfer into Level 3) or investments where trading restrictions have expired (transfer out of Level 3). |
| Note: | For purposes of reporting transfers between different hierarchy levels, both transfers in and out of each level, as applicable, are shown as if they occurred at the beginning of the period. |
The accompanying notes are an integral part of these financial statements.
|
| Hartford Small Company HLS Fund |
Schedule of Investments
December 31, 2015
| | | | | | | | |
Shares or Principal Amount | | Market Value† | |
| COMMON STOCKS - 91.6% | | | |
| | | | Automobiles & Components - 0.0% | |
| | 6,135 | | | Tenneco, Inc.* | | $ | 281,658 | |
| | 270 | | | Tesla Motors, Inc.* | | | 64,803 | |
| | | | | | | | |
| | | | | | | 346,461 | |
| | | | | | | | |
| | | | Banks - 4.9% | |
| | 2,154 | | | Ameris Bancorp | | | 73,215 | |
| | 917,190 | | | Associated Banc-Corp | | | 17,197,313 | |
| | 1,346 | | | Bank of Marin Bancorp | | | 71,876 | |
| | 3,952 | | | BBCN Bancorp, Inc. | | | 68,053 | |
| | 5,145 | | | Blue Hills Bancorp, Inc. | | | 78,770 | |
| | 599,296 | | | EverBank Financial Corp. | | | 9,576,750 | |
| | 4,451 | | | FCB Financial Holdings, Inc. Class A* | | | 159,301 | |
| | 9,686 | | | First Merchants Corp. | | | 246,218 | |
| | 7,719 | | | Flushing Financial Corp. | | | 167,039 | |
| | 5,277 | | | Great Western Bancorp, Inc. | | | 153,139 | |
| | 4,371 | | | Heritage Financial Corp. of Washington | | | 82,350 | |
| | 17,643 | | | MGIC Investment Corp.* | | | 155,788 | |
| | 346,806 | | | PrivateBancorp, Inc. | | | 14,225,982 | |
| | 6,217 | | | Sandy Spring Bancorp, Inc. | | | 167,610 | |
| | 390,029 | | | Sterling Bancorp | | | 6,326,270 | |
| | 3,876 | | | Umpqua Holdings Corp. | | | 61,628 | |
| | 545,128 | | | United Community Banks, Inc. | | | 10,624,545 | |
| | 2,375 | | | WSFS Financial Corp. | | | 76,855 | |
| | | | | | | | |
| | | | | | | 59,512,702 | |
| | | | | | | | |
| | | | Capital Goods - 6.7% | |
| | 7,743 | | | AAON, Inc. | | | 179,792 | |
| | 551,620 | | | Advanced Drainage Systems, Inc. | | | 13,255,429 | |
| | 1,283 | | | Alamo Group, Inc. | | | 66,844 | |
| | 361,009 | | | Altra Industrial Motion Corp. | | | 9,054,106 | |
| | 154,402 | | | Astronics Corp.* | | | 6,285,705 | |
| | 1,627 | | | Astronics Corp. Class B* | | | 66,137 | |
| | 4,131 | | | AZZ, Inc. | | | 229,560 | |
| | 12,380 | | | CAI International, Inc.* | | | 124,790 | |
| | 1,098 | | | Carlisle Cos., Inc. | | | 97,382 | |
| | 1,314 | | | Crane Co. | | | 62,862 | |
| | 67,616 | | | DigitalGlobe, Inc.* | | | 1,058,867 | |
| | 1,611 | | | EMCOR Group, Inc. | | | 77,392 | |
| | 1,842 | | | Esterline Technologies Corp.* | | | 149,202 | |
| | 358,028 | | | Generac Holdings, Inc.* | | | 10,658,493 | |
| | 4,455 | | | H&E Equipment Services, Inc. | | | 77,873 | |
| | 5,763 | | | Heico Corp. Class A | | | 283,540 | |
| | 3,574 | | | Insteel Industries, Inc. | | | 74,768 | |
| | 2,164 | | | Lennox International, Inc. | | | 270,284 | |
| | 10,119 | | | Luxfer Holdings plc ADR | | | 99,571 | |
| | 1,956 | | | Lydall, Inc.* | | | 69,399 | |
| | 295,644 | | | Masonite International Corp.* | | | 18,102,282 | |
| | 111,417 | | | Middleby Corp.* | | | 12,018,552 | |
| | 820 | | | Moog, Inc. Class A* | | | 49,692 | |
| | 5,590 | | | NN, Inc. | | | 89,105 | |
| | 2,255 | | | Teledyne Technologies, Inc.* | | | 200,018 | |
| | 5,417 | | | Textainer Group Holdings Ltd. | | | 76,434 | |
| | 16,851 | | | Titan International, Inc. | | | 66,393 | |
| | 3,540 | | | Toro Co. | | | 258,668 | |
| | 167,633 | | | Watts Water Technologies, Inc. Class A | | | 8,326,331 | |
| | | | | | | | |
| | | | | | | 81,429,471 | |
| | | | | | | | |
| | | | Commercial & Professional Services - 3.1% | |
| | 377,910 | | | Advisory Board Co.* | | | 18,748,115 | |
| | 9,769 | | | CECO Environmental Corp. | | | 75,026 | |
| | 3,740 | | | Deluxe Corp. | | | 203,980 | |
| | 6,579 | | | Exponent, Inc. | | | 328,621 | |
| | | | | | | | |
Shares or Principal Amount | | Market Value† | |
| COMMON STOCKS - 91.6% - (continued) | | | |
| | | | Commercial & Professional Services - 3.1% - (continued) | |
| | 4,228 | | | Franklin Covey Co.* | | $ | 70,777 | |
| | 5,352 | | | GP Strategies Corp.* | | | 134,389 | |
| | 6,887 | | | Heritage Crystal Clean, Inc.* | | | 73,002 | |
| | 1,732 | | | Huron Consulting Group, Inc.* | | | 102,881 | |
| | 6,276 | | | On Assignment, Inc.* | | | 282,106 | |
| | 384,980 | | | TriNet Group, Inc.* | | | 7,449,363 | |
| | 212,096 | | | WageWorks, Inc.* | | | 9,622,795 | |
| | | | | | | | |
| | | | | | | 37,091,055 | |
| | | | | | | | |
| | | | Consumer Durables & Apparel - 2.2% | |
| | 4,936 | | | Arctic Cat, Inc. | | | 80,852 | |
| | 10,451 | | | Crocs, Inc.* | | | 107,018 | |
| | 5,702 | | | G-III Apparel Group Ltd.* | | | 252,370 | |
| | 13,178 | | | Kate Spade & Co.* | | | 234,173 | |
| | 3,349 | | | M/I Homes, Inc.* | | | 73,410 | |
| | 7,083 | | | New Home Co., Inc.* | | | 91,796 | |
| | 2,888 | | | Oxford Industries, Inc. | | | 184,312 | |
| | 3,011,380 | | | Samsonite International S.A. | | | 9,025,036 | |
| | 555,093 | | | Steven Madden Ltd.* | | | 16,774,910 | |
| | 6,884 | | | Taylor Morrison Home Corp. Class A* | | | 110,144 | |
| | 4,845 | | | TopBuild Corp.* | | | 149,081 | |
| | 12,427 | | | Vince Holding Corp.* | | | 56,916 | |
| | 4,782 | | | Vista Outdoor, Inc.* | | | 212,847 | |
| | | | | | | | |
| | | | | | | 27,352,865 | |
| | | | | | | | |
| | | | Consumer Services - 7.4% | |
| | 17,100 | | | Bloomin’ Brands, Inc. | | | 288,819 | |
| | 3,531 | | | Brinker International, Inc. | | | 169,311 | |
| | 871 | | | Buffalo Wild Wings, Inc.* | | | 139,055 | |
| | 558,851 | | | ClubCorp Holdings, Inc. | | | 10,210,208 | |
| | 17,968 | | | Del Frisco’s Restaurant Group, Inc.* | | | 287,847 | |
| | 896,441 | | | Diamond Resorts International, Inc.* | | | 22,868,210 | |
| | 3,720 | | | Dunkin’ Brands Group, Inc. | | | 158,435 | |
| | 193,308 | | | Jack in the Box, Inc. | | | 14,828,657 | |
| | 16,647 | | | La Quinta Holdings, Inc.* | | | 226,566 | |
| | 3,635 | | | Marcus Corp. | | | 68,956 | |
| | 3,780 | | | Marriott Vacations Worldwide Corp. | | | 215,271 | |
| | 129,220 | | | Panera Bread Co. Class A* | | | 25,169,472 | |
| | 1,094 | | | Red Robin Gourmet Burgers, Inc.* | | | 67,543 | |
| | 4,333 | | | Ruth’s Hospitality Group, Inc. | | | 68,981 | |
| | 417,384 | | | Texas Roadhouse, Inc. | | | 14,929,826 | |
| | 6,924 | | | Wingstop, Inc.* | | | 157,936 | |
| | | | | | | | |
| | | | | | | 89,855,093 | |
| | | | | | | | |
| | | | Diversified Financials - 3.3% | |
| | 4,369 | | | Alaris Royalty Corp. | | | 74,201 | |
| | 164,503 | | | Evercore Partners, Inc. Class A | | | 8,894,677 | |
| | 301,092 | | | HFF, Inc. Class A | | | 9,354,929 | |
| | 116,203 | | | MarketAxess Holdings, Inc. | | | 12,967,093 | |
| | 5,994 | | | Regional Management Corp.* | | | 92,727 | |
| | 519,521 | | | WisdomTree Investments, Inc. | | | 8,146,089 | |
| | | | | | | | |
| | | | | | | 39,529,716 | |
| | | | | | | | |
| | | | Energy - 2.0% | |
| | 64,154 | | | Abraxas Petroleum Corp.* | | | 68,003 | |
| | 9,087 | | | Aspen Aerogels, Inc.* | | | 55,158 | |
| | 138,574 | | | Diamondback Energy, Inc.* | | | 9,270,601 | |
| | 4,964 | | | Forum Energy Technologies, Inc.* | | | 61,851 | |
| | 604,646 | | | QEP Resources, Inc. | | | 8,102,256 | |
| | 298,533 | | | RSP Permian, Inc.* | | | 7,281,220 | |
| | 6,138 | | | Synergy Resources Corp.* | | | 52,296 | |
| | | | | | | | |
| | | | | | | 24,891,385 | |
| | | | | | | | |
The accompanying notes are an integral part of these financial statements.
|
| Hartford Small Company HLS Fund |
Schedule of Investments – (continued)
December 31, 2015
| | | | | | | | |
Shares or Principal Amount | | Market Value† | |
| COMMON STOCKS - 91.6% - (continued) | | | |
| | | | Food & Staples Retailing - 0.1% | |
| | 3,665 | | | Casey’s General Stores, Inc. | | $ | 441,449 | |
| | 9,786 | | | Natural Grocers by Vitamin Cottage, Inc.* | | | 199,341 | |
| | 3,166 | | | PriceSmart, Inc. | | | 262,746 | |
| | | | | | | | |
| | | | | | | 903,536 | |
| | | | | | | | |
| | | | Food, Beverage & Tobacco - 1.0% | |
| | 14,455 | | | Freshpet, Inc.* | | | 122,723 | |
| | 1,055,681 | | | Greencore Group plc | | | 5,507,951 | |
| | 538,498 | | | Nomad Foods Ltd.* | | | 6,354,276 | |
| | 4,110 | | | Post Holdings, Inc.* | | | 253,587 | |
| | 4,205 | | | TreeHouse Foods, Inc.* | | | 329,924 | |
| | | | | | | | |
| | | | | | | 12,568,461 | |
| | | | | | | | |
| | | | Health Care Equipment & Services - 9.7% | |
| | 223,933 | | | Acadia Healthcare Co., Inc.* | | | 13,986,855 | |
| | 2,718 | | | Aceto Corp. | | | 73,332 | |
| | 6,692 | | | Anika Therapeutics, Inc.* | | | 255,367 | |
| | 580 | | | Atrion Corp. | | | 221,096 | |
| | 4,971 | | | Cynosure, Inc. Class A* | | | 222,055 | |
| | 145,159 | | | DexCom, Inc.* | | | 11,888,522 | |
| | 621,258 | | | Endologix, Inc.* | | | 6,150,454 | |
| | 4,015 | | | Ensign Group, Inc. | | | 90,859 | |
| | 424,847 | | | Envision Healthcare Holdings, Inc.* | | | 11,033,277 | |
| | 15,764 | | | Globus Medical, Inc. Class A* | | | 438,554 | |
| | 7,716 | | | HealthSouth Corp. | | | 268,594 | |
| | 121,785 | | | HeartWare International, Inc.* | | | 6,137,964 | |
| | 2,269 | | | ICU Medical, Inc.* | | | 255,898 | |
| | 596,725 | | | Insulet Corp.* | | | 22,562,172 | |
| | 291,167 | | | LDR Holding Corp.* | | | 7,311,203 | |
| | 111,366 | | | LifePoint Health, Inc.* | | | 8,174,264 | |
| | 2,691 | | | LivaNova plc* | | | 159,765 | |
| | 7,150 | | | Omnicell, Inc.* | | | 222,222 | |
| | 153,912 | | | Team Health Holdings, Inc.* | | | 6,755,198 | |
| | 4,126 | | | U.S. Physical Therapy, Inc. | | | 221,484 | |
| | 7,556 | | | Vascular Solutions, Inc.* | | | 259,851 | |
| | 709,907 | | | Veeva Systems, Inc. Class A* | | | 20,480,817 | |
| | 3,736 | | | WellCare Health Plans, Inc.* | | | 292,192 | |
| | | | | | | | |
| | | | | | | 117,461,995 | |
| | | | | | | | |
| | | | Insurance - 2.8% | |
| | 4,966 | | | AMERISAFE, Inc. | | | 252,769 | |
| | 149,297 | | | Assurant, Inc. | | | 12,024,380 | |
| | 202,322 | | | Assured Guaranty Ltd. | | | 5,347,371 | |
| | 451,881 | | | First American Financial Corp. | | | 16,222,528 | |
| | 8,018 | | | James River Group Holdings Ltd. | | | 268,924 | |
| | | | | | | | |
| | | | | | | 34,115,972 | |
| | | | | | | | |
| | | | Materials - 5.5% | |
| | 7,068 | | | Boise Cascade Co.* | | | 180,446 | |
| | 1,095,008 | | | Graphic Packaging Holding Co. | | | 14,048,953 | |
| | 1,135,320 | | | Headwaters, Inc.* | | | 19,152,848 | |
| | 791,602 | | | KapStone Paper & Packaging Corp. | | | 17,882,289 | |
| | 5,107 | | | Myers Industries, Inc. | | | 68,025 | |
| | 19,424 | | | OMNOVA Solutions, Inc.* | | | 119,069 | |
| | 6,991 | | | Orion Engineered Carbons S.A. | | | 88,087 | |
| | 1,149,487 | | | Platform Specialty Products Corp.* | | | 14,747,918 | |
| | 7,602 | | | PolyOne Corp. | | | 241,440 | |
| | 4,086 | | | Silgan Holdings, Inc. | | | 219,500 | |
| | | | | | | | |
| | | | | | | 66,748,575 | |
| | | | | | | | |
| | | | Media - 1.2% | |
| | 411,563 | | | IMAX Corp.* | | | 14,626,949 | |
| | | | | | | | |
| | | | | | | | |
Shares or Principal Amount | | Market Value† | |
| COMMON STOCKS - 91.6% - (continued) | | | |
| | | | Pharmaceuticals, Biotechnology & Life
Sciences - 12.4% | |
| | 11,878 | | | Achillion Pharmaceuticals, Inc.* | | $ | 128,164 | |
| | 3,917 | | | Acorda Therapeutics, Inc.* | | | 167,569 | |
| | 288,065 | | | Aerie Pharmaceuticals, Inc.* | | | 7,014,383 | |
| | 91,113 | | | Agios Pharmaceuticals, Inc.* | | | 5,915,056 | |
| | 3,698 | | | Albany Molecular Research, Inc.* | | | 73,405 | |
| | 5,634 | | | Alder Biopharmaceuticals, Inc.* | | | 186,091 | |
| | 11,293 | | | Amicus Therapeutics, Inc.* | | | 109,542 | |
| | 125,329 | | | Anacor Pharmaceuticals, Inc.* | | | 14,158,417 | |
| | 254,616 | | | Aratana Therapeutics, Inc.* | | | 1,420,757 | |
| | 45,288 | | | Arena Pharmaceuticals, Inc.* | | | 86,047 | |
| | 724,005 | | | BioCryst Pharmaceuticals, Inc.* | | | 7,471,732 | |
| | 20,094 | | | BioDelivery Sciences International, Inc.* | | | 96,250 | |
| | 4,923 | | | Cara Therapeutics, Inc.* | | | 83,002 | |
| | 222,957 | | | Cepheid* | | | 8,144,619 | |
| | 6,734 | | | Dicerna Pharmaceuticals, Inc.* | | | 79,933 | |
| | 272,802 | | | Five Prime Therapeutics, Inc.* | | | 11,321,283 | |
| | 252,230 | | | Flexion Therapeutics, Inc.* | | | 4,860,472 | |
| | 173,367 | | | Galapagos N.V. ADR* | | | 10,901,317 | |
| | 3,670 | | | Global Blood Therapeutics, Inc.* | | | 118,651 | |
| | 6,764 | | | GlycoMimetics, Inc.* | | | 38,690 | |
| | 368,886 | | | Intersect ENT, Inc.* | | | 8,299,935 | |
| | 373,166 | | | Ironwood Pharmaceuticals, Inc.* | | | 4,324,994 | |
| | 5,065 | | | KemPharm, Inc.* | | | 100,591 | |
| | 5,500 | | | Medicines Co.* | | | 205,370 | |
| | 4,651 | | | Neurocrine Biosciences, Inc.* | | | 263,107 | |
| | 1,036,340 | | | Novavax, Inc.* | | | 8,694,893 | |
| | 3,349 | | | Ophthotech Corp.* | | | 262,997 | |
| | 224,471 | | | Otonomy, Inc.* | | | 6,229,070 | |
| | 4,382 | | | PAREXEL International Corp.* | | | 298,502 | |
| | 231,567 | | | Portola Pharmaceuticals, Inc.* | | | 11,914,122 | |
| | 204,231 | | | PTC Therapeutics, Inc.* | | | 6,617,084 | |
| | 891 | | | Puma Biotechnology, Inc.* | | | 69,854 | |
| | 179,317 | | | Relypsa, Inc.* | | | 5,081,844 | |
| | 179,065 | | | TESARO, Inc.* | | | 9,368,681 | |
| | 297,889 | | | Tetraphase Pharmaceuticals, Inc.* | | | 2,987,827 | |
| | 13,744 | | | TherapeuticsMD, Inc.* | | | 142,525 | |
| | 8,462 | | | Trevena, Inc.* | | | 88,851 | |
| | 116,211 | | | Ultragenyx Pharmaceutical, Inc.* | | | 13,036,550 | |
| | 14,209 | | | XenoPort, Inc.* | | | 78,008 | |
| | | | | | | | |
| | | | | | | 150,440,185 | |
| | | | | | | | |
| | | | Real Estate - 2.8% | |
| | 10,773 | | | Arbor Realty Trust, Inc. REIT | | | 77,027 | |
| | 7,618 | | | Armada Hoffler Properties, Inc. REIT | | | 79,837 | |
| | 6,182 | | | CareTrust, Inc. REIT | | | 67,693 | |
| | 4,715 | | | Coresite Realty Corp. REIT | | | 267,435 | |
| | 3,831 | | | Easterly Government Properties, Inc. REIT | | | 65,817 | |
| | 565,808 | | | Hannon Armstrong Sustainable Infrastructure Capital, Inc. REIT | | | 10,705,087 | |
| | 709,668 | | | Kennedy-Wilson Holdings, Inc. REIT | | | 17,088,805 | |
| | 5,035 | | | Medical Properties Trust, Inc. REIT | | | 57,953 | |
| | 198,966 | | | Pebblebrook Hotel Trust REIT | | | 5,575,027 | |
| | 3,030 | | | STAG Industrial, Inc. REIT | | | 55,903 | |
| | 5,979 | | | Summit Hotel Properties, Inc. REIT | | | 71,449 | |
| | 12,865 | | | Sunstone Hotel Investors, Inc. REIT | | | 160,684 | |
| | | | | | | | |
| | | | | | | 34,272,717 | |
| | | | | | | | |
| | | | Retailing - 2.3% | |
| | 5,016,400 | | | Allstar Co.*(1)(2) | | | 4,765,580 | |
| | 7,701 | | | Burlington Stores, Inc.* | | | 330,373 | |
| | 2,588 | | | Core-Mark Holding Co., Inc. | | | 212,061 | |
The accompanying notes are an integral part of these financial statements.
|
| Hartford Small Company HLS Fund |
Schedule of Investments – (continued)
December 31, 2015
| | | | | | | | |
Shares or Principal Amount | | Market Value† | |
| COMMON STOCKS - 91.6% - (continued) | | | |
| | | | Retailing - 2.3% - (continued) | |
| | 9,171 | | | DSW, Inc. Class A | | $ | 218,820 | |
| | 312,810 | | | Five Below, Inc.* | | | 10,041,201 | |
| | 156,367 | | | HSN, Inc. | | | 7,923,116 | |
| | 8,915 | | | Party City Holdco, Inc.* | | | 115,092 | |
| | 3,669 | | | Shoe Carnival, Inc. | | | 85,121 | |
| | 104,986 | | | Tory Burch LLC*(1)(2) | | | 5,555,846 | |
| | | | | | | | |
| | | | | | | 29,247,210 | |
| | | | | | | | |
| | | | Semiconductors & Semiconductor Equipment - 3.5% | |
| | 448,064 | | | Entegris, Inc.* | | | 5,945,809 | |
| | 12,333 | | | Exar Corp.* | | | 75,601 | |
| | 127,549 | | | First Solar, Inc.* | | | 8,416,958 | |
| | 2,176 | | | Inphi Corp.* | | | 58,796 | |
| | 9,819 | | | Integrated Device Technology, Inc.* | | | 258,731 | |
| | 424,985 | | | Mellanox Technologies Ltd.* | | | 17,908,868 | |
| | 6,085 | | | MKS Instruments, Inc. | | | 219,060 | |
| | 5,315 | | | SunEdison Semiconductor Ltd.* | | | 41,670 | |
| | 311,516 | | | SunPower Corp.* | | | 9,348,595 | |
| | | | | | | | |
| | | | | | | 42,274,088 | |
| | | | | | | | |
| | | | Software & Services - 15.7% | |
| | 190,094 | | | Apigee Corp.* | | | 1,526,455 | |
| | 4,764 | | | Aspen Technology, Inc.* | | | 179,889 | |
| | 113,355 | | | Atlassian Corp. plc Class A* | | | 3,409,718 | |
| | 1,793 | | | CACI International, Inc. Class A* | | | 166,354 | |
| | 9,806 | | | Cardtronics, Inc.* | | | 329,972 | |
| | 3,735 | | | Cass Information Systems, Inc. | | | 192,203 | |
| | 216,152 | | | comScore, Inc.* | | | 8,894,655 | |
| | 2,336 | | | Constant Contact, Inc.* | | | 68,305 | |
| | 132,828 | | | CoStar Group, Inc.* | | | 27,454,219 | |
| | 2,385 | | | CSG Systems International, Inc. | | | 85,812 | |
| | 40,031 | | | Demandware, Inc.* | | | 2,160,473 | |
| | 8,702 | | | Envestnet, Inc.* | | | 259,755 | |
| | 3,348 | | | EPAM Systems, Inc.* | | | 263,220 | |
| | 23,974 | | | Everi Holdings, Inc.* | | | 105,246 | |
| | 11,544 | | | Everyday Health, Inc.* | | | 69,495 | |
| | 8,318 | | | Exlservice Holdings, Inc.* | | | 373,728 | |
| | 171,739 | | | Fair Isaac Corp. | | | 16,174,379 | |
| | 16,554 | | | Five9, Inc.* | | | 144,020 | |
| | 86,598 | | | Fleetmatics Group plc* | | | 4,398,312 | |
| | 192,804 | | | Guidewire Software, Inc.* | | | 11,599,089 | |
| | 118,948 | | | Heartland Payment Systems, Inc. | | | 11,278,649 | |
| | 217,461 | | | HubSpot, Inc.* | | | 12,245,229 | |
| | 4,724 | | | j2 Global, Inc. | | | 388,880 | |
| | 3,669 | | | Manhattan Associates, Inc.* | | | 242,778 | |
| | 11,332 | | | Marchex, Inc. Class B | | | 44,081 | |
| | 3,596 | | | Marketo, Inc.* | | | 103,241 | |
| | 210,910 | | | MAXIMUS, Inc. | | | 11,863,687 | |
| | 4,192 | | | Paycom Software, Inc.* | | | 157,745 | |
| | 4,758 | | | Perficient, Inc.* | | | 81,457 | |
| | 4,723 | | | PTC, Inc.* | | | 163,557 | |
| | 3,242 | | | Q2 Holdings, Inc.* | | | 85,492 | |
| | 7,847 | | | Sapiens International Corp. N.V. | | | 80,039 | |
| | 4,446 | | | Silver Spring Networks, Inc.* | | | 64,067 | |
| | 53,800 | | | Tableau Software, Inc. Class A* | | | 5,069,036 | |
| | 11,767 | | | Tangoe, Inc.* | | | 98,725 | |
| | 1,069,389 | | | Telogis, Inc.*(1)(2) | | | 2,021,145 | |
| | 8,640 | | | Textura Corp.* | | | 186,451 | |
| | 102,554 | | | Tyler Technologies, Inc.* | | | 17,877,213 | |
| | 73,026 | | | Verint Systems, Inc.* | | | 2,961,935 | |
| | 201,093 | | | Virtusa Corp.* | | | 8,313,185 | |
| | 4,646 | | | WebMD Health Corp.* | | | 224,402 | |
| | | | | | | | |
Shares or Principal Amount | | Market Value† | |
| COMMON STOCKS - 91.6% - (continued) | | | |
| | | | Software & Services - 15.7% - (continued) | |
| | 117,649 | | | WEX, Inc.* | | $ | 10,400,172 | |
| | 517,226 | | | WNS Holdings Ltd. ADR* | | | 16,132,279 | |
| | 93,351 | | | Zendesk, Inc.* | | | 2,468,200 | |
| | 133,014 | | | Zillow Group, Inc. Class A* | | | 3,463,685 | |
| | 307,201 | | | Zillow Group, Inc. Class C* | | | 7,213,079 | |
| | | | | | | | |
| | | | | | | 191,083,708 | |
| | | | | | | | |
| | | | Technology Hardware & Equipment - 2.0% | |
| | 5,287 | | | Applied Optoelectronics, Inc.* | | | 90,725 | |
| | 170,463 | | | Arista Networks, Inc.* | | | 13,268,840 | |
| | 3,678 | | | CalAmp Corp.* | | | 73,302 | |
| | 4,321 | | | CDW Corp. of Delaware | | | 181,655 | |
| | 160,765 | | | Ciena Corp.* | | | 3,326,228 | |
| | 4,765 | | | Control4 Corp.* | | | 34,641 | |
| | 2,781 | | | ePlus, Inc.* | | | 259,356 | |
| | 3,211 | | | Fabrinet* | | | 76,486 | |
| | 2,462 | | | FEI Co. | | | 196,443 | |
| | 11,526 | | | Mitel Networks Corp.* | | | 88,635 | |
| | 8,484 | | | NetScout Systems, Inc.* | | | 260,459 | |
| | 4,985 | | | Newport Corp.* | | | 79,112 | |
| | 180,624 | | | ParkerVision, Inc.* | | | 41,995 | |
| | 222,292 | | | Pure Storage, Inc. Class A* | | | 3,461,086 | |
| | 197,006 | | | Pure Storage, Inc. Class B*(1)(2) | | | 2,905,494 | |
| | 3,079 | | | Radware Ltd.* | | | 47,232 | |
| | 2,924 | | | Rogers Corp.* | | | 150,791 | |
| | | | | | | | |
| | | | | | | 24,542,480 | |
| | | | | | | | |
| | | | Telecommunication Services - 0.0% | |
| | 18,398 | | | Vonage Holdings Corp.* | | | 105,605 | |
| | | | | | | | |
| | | | Transportation - 3.0% | |
| | 14,823 | | | Celadon Group, Inc. | | | 146,599 | |
| | 500,962 | | | Knight Transportation, Inc. | | | 12,138,309 | |
| | 306,968 | | | Landstar System, Inc. | | | 18,003,673 | |
| | 5,095 | | | Marten Transport Ltd. | | | 90,182 | |
| | 2,306 | | | Park-Ohio Holdings Corp. | | | 84,815 | |
| | 8,164 | | | Swift Transportation Co.* | | | 112,827 | |
| | 215,645 | | | XPO Logistics, Inc.* | | | 5,876,326 | |
| | | | | | | | |
| | | | | | | 36,452,731 | |
| | | | | | | | |
| | | | Utilities - 0.0% | |
| | 972 | | | ALLETE, Inc. | | | 49,407 | |
| | 4,560 | | | Pattern Energy Group, Inc. | | | 95,350 | |
| | 3,110 | | | Spark Energy, Inc. Class A | | | 64,439 | |
| | | | | | | | |
| | | | | | | 209,196 | |
| | | | | | | | |
| | |
| | | | Total Common Stocks
(cost $1,127,906,580) | | $ | 1,115,062,156 | |
| | | | | | | | |
|
| EXCHANGE TRADED FUNDS - 1.5% | |
| | | | Other Investment Pools & Funds - 1.5% | |
| | 126,871 | | | iShares Russell 2000 Growth ETF | | $ | 17,687,086 | |
| | | | | | | | |
| | |
| | | | Total Exchange Traded Funds
(cost $17,739,636) | | $ | 17,687,086 | |
| | | | | | | | |
| | |
| | | | | | | | |
| PREFERRED STOCKS - 3.0% | |
| | | | Consumer Services - 0.2% | | | |
| | 277,018 | | | DraftKings, Inc. Series D(1)(2) | | $ | 867,067 | |
| | 252,844 | | | DraftKings, Inc. Series D-1(1)(2) | | | 1,024,018 | |
| | | | | | | | |
| | | | | | | 1,891,085 | |
| | | | | | | | |
The accompanying notes are an integral part of these financial statements.
|
| Hartford Small Company HLS Fund |
Schedule of Investments – (continued)
December 31, 2015
| | | | | | | | |
Shares or Principal Amount | | Market Value† | |
| PREFERRED STOCKS - 3.0% - (continued) | |
| | | | Pharmaceuticals, Biotechnology & Life Sciences - 0.0% | |
| | 92,420 | | | Sancilio & Co., Inc.(1)(2) | | $ | 604,427 | |
| | | | | | | | |
| | | | Retailing - 0.3% | |
| | 74,004 | | | Honest Co.(1)(2) | | | 3,354,601 | |
| | | | | | | | |
| | | | Software & Services - 2.3% | |
| | 169,989 | | | Cloudera, Inc.(1)(2) | | | 4,367,017 | |
| | 410,300 | | | MarkLogic Corp. Series F(1)(2) | | | 4,788,201 | |
| | 206,888 | | | Nutanix, Inc.(1)(2) | | | 3,380,550 | |
| | 1,456,330 | | | Telogis, Inc.(1)(2) | | | 6,422,415 | |
| | 157,023 | | | Veracode, Inc.(1)(2) | | | 4,261,604 | |
| | 1,026,132 | | | Zuora, Inc. Series F(1)(2) | | | 4,248,187 | |
| | | | | | | | |
| | | | | | | 27,467,974 | |
| | | | | | | | |
| | | | Telecommunication Services - 0.2% | |
| | 6,478 | | | DocuSign, Inc. Series B(1)(2) | | | 123,600 | |
| | 1,940 | | | DocuSign, Inc. Series B-1(1)(2) | | | 37,015 | |
| | 4,655 | | | DocuSign, Inc. Series D(1)(2) | | | 88,817 | |
| | 120,393 | | | DocuSign, Inc. Series E(1)(2) | | | 2,297,099 | |
| | 21,928 | | | DocuSign, Inc. Series F(1)(2) | | | 418,386 | |
| | | | | | | | |
| | | | | | | 2,964,917 | |
| | | | | | | | |
| | |
| | | | Total Preferred Stocks
(cost $29,352,413) | | $ | 36,283,004 | |
| | | | | | | | |
|
| CONVERTIBLE PREFERRED STOCKS - 0.0% | |
| | | | Capital Goods - 0.0% | |
| | 1,262 | | | William Lyon Homes, Inc., 6.50% | | $ | 111,763 | |
| | | | | | | | |
| | |
| | | | Total Convertible Preferred Stocks
(cost $124,261) | | $ | 111,763 | |
| | | | | | | | |
| | |
| | | | Total Long-Term Investments
(cost $1,175,122,890) | | $ | 1,169,144,009 | |
| | | | | | | | |
|
| SHORT-TERM INVESTMENTS - 4.1% | |
| | | | Other Investment Pools & Funds - 4.1% | |
| | 49,714,858 | | | BlackRock Liquidity Funds TempFund Portfolio | | $ | 49,714,858 | |
| | | | | | | | |
| | |
| | | | Total Short-Term Investments
(cost $49,714,858) | | $ | 49,714,858 | |
| | | | | | | | |
| | | | | | | | | | |
| | | |
| | Total Investments
(cost $1,224,837,748)^ | | | 100.2 | % | | $ | 1,218,858,867 | |
| | Other Assets and Liabilities | | | (0.2 | )% | | | (2,580,541 | ) |
| | | | | | | | | | |
| | Total Net Assets | | | 100.0 | % | | $ | 1,216,278,326 | |
| | | | | | | | | | |
The accompanying notes are an integral part of these financial statements.
|
| Hartford Small Company HLS Fund |
Schedule of Investments – (continued)
December 31, 2015
| Note: | Percentage of investments as shown is the ratio of the total market value to total net assets. |
| | Prices of foreign equities that are principally traded on certain foreign markets may be adjusted daily pursuant to a fair value pricing service approved by the Board of Directors in order to reflect an adjustment for factors occurring after the close of certain foreign markets but before the close of the New York Stock Exchange. |
| | Equity industry classifications used in this report are the Global Industry Classification Standard, which was developed by and is the exclusive property and service mark of MSCI, Inc. and Standard & Poor’s. |
| | For Fund compliance purposes, the Fund may not use the same classification system shown in this report as these classifications are used for financial reporting purposes. |
| ^ | At December 31, 2015, the cost of securities for federal income tax purposes was $1,237,428,182 and the aggregate gross unrealized appreciation and depreciation based on that cost were: |
| | | | |
Unrealized Appreciation | | $ | 112,445,949 | |
Unrealized Depreciation | | | (131,015,264 | ) |
| | | | |
Net Unrealized Depreciation | | $ | (18,569,315 | ) |
| | | | |
| (1) | These securities are valued in good faith at fair value as determined under policies and procedures established by and under the supervision of the Board of Directors. At December 31, 2015, the aggregate fair value of these securities was $51,531,069, which represents 4.2% of total net assets. This amount excludes securities that are principally traded in certain foreign markets and whose prices are adjusted pursuant to a third party pricing service methodology approved by the Board of Directors. |
| (2) | The following securities are considered illiquid. Illiquid securities are often purchased in private placement transactions, are often not registered under the Securities Act of 1933, as amended, and may have contractual restrictions on resale. A security may also be considered illiquid if the security lacks a readily available market or if its valuation has not changed for a certain period of time. |
| | | | | | | | | | |
Period
Acquired | | Shares/Par | | | Security | | Cost | |
| 08/2011 | | | 5,016,400 | | | Allstar Co. | | $ | 2,182,228 | |
| 02/2014 | | | 169,989 | | | Cloudera, Inc. Preferred | | | 2,475,040 | |
| 02/2014 | | | 6,478 | | | DocuSign, Inc. Series B Preferred | | | 85,072 | |
| 02/2014 | | | 1,940 | | | DocuSign, Inc. Series B-1 Preferred | | | 25,477 | |
| 02/2014 | | | 4,655 | | | DocuSign, Inc. Series D Preferred | | | 61,131 | |
| 02/2014 | | | 120,393 | | | DocuSign, Inc. Series E Preferred | | | 1,581,049 | |
| 04/2015 | | | 21,928 | | | DocuSign, Inc. Series F Preferred | | | 418,673 | |
| 08/2015 | | | 277,018 | | | DraftKings, Inc. Series D Preferred | | | 1,491,990 | |
| 08/2015 | | | 252,844 | | | DraftKings, Inc. Series D-1 Preferred | | | 1,938,153 | |
| 08/2015 | | | 74,004 | | | Honest Co. Preferred | | | 3,386,053 | |
| 04/2015 | | | 410,300 | | | MarkLogic Corp. Series F Preferred | | | 4,765,306 | |
| 08/2014 | | | 206,888 | | | Nutanix, Inc. Preferred | | | 2,771,575 | |
| 04/2014 | | | 197,006 | | | Pure Storage, Inc. Class B | | | 3,098,097 | |
| 07/2015 | | | 92,420 | | | Sancilio & Co., Inc. Preferred | | | 349,066 | |
| 09/2013 | | | 1,069,389 | | | Telogis, Inc. | | | 2,118,567 | |
| 09/2013 | | | 1,456,330 | | | Telogis, Inc. Preferred | | | 3,205,674 | |
| 11/2013 | | | 104,986 | | | Tory Burch LLC | | | 8,228,416 | |
| 08/2014 | | | 157,023 | | | Veracode, Inc. Preferred | | | 2,899,571 | |
| 01/2015 | | | 1,026,132 | | | Zuora, Inc. Series F Preferred | | | 3,898,583 | |
| | | | | | | | | | |
| | | | | | | | $ | 44,979,721 | |
| | | | | | | | | | |
| | At December 31, 2015, the aggregate value of these securities was $51,531,069, which represents 4.2% of total net assets. |
| † | See Significant Accounting Policies of accompanying Notes to Financial Statements regarding valuation of investments. |
| | |
| GLOSSARY: (abbreviations used in preceding Schedule of Investments) |
|
| Other Abbreviations: |
ADR | | American Depositary Receipt |
ETF | | Exchange Traded Fund |
REIT | | Real Estate Investment Trust |
The accompanying notes are an integral part of these financial statements.
|
| Hartford Small Company HLS Fund |
Schedule of Investments – (continued)
December 31, 2015
Fair Valuation Summary
The following is a summary of the fair valuations according to the inputs used as of December 31, 2015 in valuing the Fund’s investments.
| | | | | | | | | | | | | | | | |
| | | Total | | | Level 1(1) | | | Level 2(1) | | | Level 3 | |
Assets | |
Common Stocks | | | | | | | | | | | | | | | | |
Automobiles & Components | | $ | 346,461 | | | $ | 346,461 | | | $ | — | | | $ | — | |
Banks | | | 59,512,702 | | | | 59,512,702 | | | | — | | | | — | |
Capital Goods | | | 81,429,471 | | | | 81,429,471 | | | | — | | | | — | |
Commercial & Professional Services | | | 37,091,055 | | | | 37,091,055 | | | | — | | | | — | |
Consumer Durables & Apparel | | | 27,352,865 | | | | 18,327,829 | | | | 9,025,036 | | | | — | |
Consumer Services | | | 89,855,093 | | | | 89,855,093 | | | | — | | | | — | |
Diversified Financials | | | 39,529,716 | | | | 39,529,716 | | | | — | | | | — | |
Energy | | | 24,891,385 | | | | 24,891,385 | | | | — | | | | — | |
Food & Staples Retailing | | | 903,536 | | | | 903,536 | | | | — | | | | — | |
Food, Beverage & Tobacco | | | 12,568,461 | | | | 7,060,510 | | | | 5,507,951 | | | | — | |
Health Care Equipment & Services | | | 117,461,995 | | | | 117,461,995 | | | | — | | | | — | |
Insurance | | | 34,115,972 | | | | 34,115,972 | | | | — | | | | — | |
Materials | | | 66,748,575 | | | | 66,748,575 | | | | — | | | | — | |
Media | | | 14,626,949 | | | | 14,626,949 | | | | — | | | | — | |
Pharmaceuticals, Biotechnology & Life Sciences | | | 150,440,185 | | | | 150,440,185 | | | | — | | | | — | |
Real Estate | | | 34,272,717 | | | | 34,272,717 | | | | — | | | | — | |
Retailing | | | 29,247,210 | | | | 18,925,784 | | | | — | | | | 10,321,426 | |
Semiconductors & Semiconductor Equipment | | | 42,274,088 | | | | 42,274,088 | | | | — | | | | — | |
Software & Services | | | 191,083,708 | | | | 189,062,563 | | | | — | | | | 2,021,145 | |
Technology Hardware & Equipment | | | 24,542,480 | | | | 21,636,986 | | | | — | | | | 2,905,494 | |
Telecommunication Services | | | 105,605 | | | | 105,605 | | | | — | | | | — | |
Transportation | | | 36,452,731 | | | | 36,452,731 | | | | — | | | | — | |
Utilities | | | 209,196 | | | | 209,196 | | | | — | | | | — | |
Exchange Traded Funds | | | 17,687,086 | | | | 17,687,086 | | | | — | | | | — | |
Preferred Stocks | | | 36,283,004 | | | | — | | | | — | | | | 36,283,004 | |
Convertible Preferred Stocks | | | 111,763 | | | | 111,763 | | | | — | | | | — | |
Short-Term Investments | | | 49,714,858 | | | | 49,714,858 | | | | — | | | | — | |
| | | | | | | | | | | | | | | | |
Total | | $ | 1,218,858,867 | | | $ | 1,152,794,811 | | | $ | 14,532,987 | | | $ | 51,531,069 | |
| | | | | | | | | | | | | | | | |
| (1) | For the year ended December 31, 2015, there were no transfers between Level 1 and Level 2. |
The following is a rollforward of the Fund’s investments that were valued using unobservable inputs (Level 3) for the year ended December 31, 2015:
| | | | | | | | | | | | |
| | | Common
Stocks | | | Preferred
Stocks | | | Total | |
Beginning balance | | $ | 42,110,830 | | | $ | 26,618,705 | | | $ | 68,729,535 | |
Purchases | | | 3,098,097 | | | | 16,247,825 | | | | 19,345,922 | |
Sales | | | (14,063,534 | ) | | | (7,503,255 | ) | | | (21,566,789 | ) |
Accrued discounts/(premiums) | | | — | | | | — | | | | — | |
Total realized gain/(loss) | | | 8,790,109 | | | | — | | | | 8,790,109 | |
Net change in unrealized appreciation/depreciation | | | (24,687,437 | ) | | | 919,729 | | | | (23,767,708 | ) |
Transfers into Level 3(1) | | | — | | | | — | | | | — | |
Transfers out of Level 3(1) | | | — | | | | — | | | | — | |
| | | | | | | | | | | | |
Ending balance | | $ | 15,248,065 | | | $ | 36,283,004 | | | $ | 51,531,069 | |
| | | | | | | | | | | | |
The change in net unrealized appreciation/depreciation relating to the Level 3 investments held at December 31, 2015 was $1,376,595.
| (1) | Investments are transferred into and out of Level 3 for a variety of reasons including, but not limited to: |
| | a) | Investments where trading has been halted (transfer into Level 3) or investments where trading has resumed (transfer out of Level 3). |
| | b) | Broker quoted investments (transfer into Level 3) or quoted prices in active markets (transfer out of Level 3). |
| | c) | Investments that have certain restrictions on trading (transfer into Level 3) or investments where trading restrictions have expired (transfer out of Level 3). |
| Note: | For purposes of reporting transfers between different hierarchy levels, both transfers in and out of each level, as applicable, are shown as if they occurred at the beginning of the period. |
The accompanying notes are an integral part of these financial statements.
|
| Hartford Small/Mid Cap Equity HLS Fund |
Schedule of Investments
December 31, 2015
| | | | | | | | |
Shares or Principal Amount | | Market Value† | |
| COMMON STOCKS - 99.1% | |
| | | | Automobiles & Components - 1.6% | |
| | 7,510 | | | Cooper Tire & Rubber Co. | | $ | 284,254 | |
| | 24,241 | | | Goodyear Tire & Rubber Co. | | | 791,953 | |
| | 4,261 | | | Visteon Corp.* | | | 487,885 | |
| | | | | | | | |
| | | | | | | 1,564,092 | |
| | | | | | | | |
| | | | Banks - 7.4% | |
| | 23,200 | | | Banc of California, Inc. | | | 339,184 | |
| | 12,700 | | | Banco Latinoamericano de Comercio Exterior S.A. ADR | | | 329,311 | |
| | 8,463 | | | Berkshire Hills Bancorp, Inc. | | | 246,358 | |
| | 9,056 | | | BofI Holding, Inc.* | | | 190,629 | |
| | 14,800 | | | Central Pacific Financial Corp. | | | 325,896 | |
| | 18,400 | | | Customers Bancorp, Inc.* | | | 500,848 | |
| | 21,600 | | | Fidelity Southern Corp. | | | 481,896 | |
| | 45,763 | | | Fifth Third Bancorp | | | 919,836 | |
| | 5,105 | | | First NBC Bank Holding Co.* | | | 190,876 | |
| | 16,500 | | | Flagstar Bancorp, Inc.* | | | 381,315 | |
| | 6,384 | | | Great Western Bancorp, Inc. | | | 185,264 | |
| | 15,349 | | | HomeStreet, Inc.* | | | 333,227 | |
| | 21,500 | | | Huntington Bancshares, Inc. | | | 237,790 | |
| | 26,154 | | | KeyCorp | | | 344,971 | |
| | 3,153 | | | LendingTree, Inc.* | | | 281,500 | |
| | 7,903 | | | MainSource Financial Group, Inc. | | | 180,821 | |
| | 33,100 | | | MGIC Investment Corp.* | | | 292,273 | |
| | 26,198 | | | Popular, Inc. | | | 742,451 | |
| | 21,840 | | | Walker & Dunlop, Inc.* | | | 629,210 | |
| | | | | | | | |
| | | | | | | 7,133,656 | |
| | | | | | | | |
| | | | Capital Goods - 8.7% | | | |
| | 4,930 | | | Acuity Brands, Inc. | | | 1,152,634 | |
| | 17,100 | | | Aerojet Rocketdyne Holdings, Inc.* | | | 267,786 | |
| | 13,376 | | | AGCO Corp. | | | 607,137 | |
| | 3,217 | | | Alamo Group, Inc. | | | 167,606 | |
| | 9,300 | | | American Woodmark Corp.* | | | 743,814 | |
| | 10,500 | | | Argan, Inc. | | | 340,200 | |
| | 19,007 | | | BWX Technologies, Inc. | | | 603,852 | |
| | 6,236 | | | Comfort Systems USA, Inc. | | | 177,227 | |
| | 9,600 | | | Continental Building Products, Inc.* | | | 167,616 | |
| | 5,540 | | | Dycom Industries, Inc.* | | | 387,578 | |
| | 6,400 | | | Encore Wire Corp. | | | 237,376 | |
| | 16,617 | | | General Cable Corp. | | | 223,166 | |
| | 3,800 | | | Huntington Ingalls Industries, Inc. | | | 482,030 | |
| | 4,300 | | | Hyster-Yale Materials Handling, Inc. | | | 225,535 | |
| | 27,871 | | | KBR, Inc. | | | 471,577 | |
| | 11,200 | | | LB Foster Co. Class A | | | 152,992 | |
| | 3,914 | | | Lennox International, Inc. | | | 488,859 | |
| | 3,028 | | | Lydall, Inc.* | | | 107,433 | |
| | 48,800 | | | Meritor, Inc.* | | | 407,480 | |
| | 9,993 | | | Spirit Aerosystems Holdings, Inc. Class A* | | | 500,350 | |
| | 17,387 | | | Taser International, Inc.* | | | 300,621 | |
| | 2,485 | | | Triumph Group, Inc. | | | 98,779 | |
| | | | | | | | |
| | | | | | | 8,311,648 | |
| | | | | | | | |
| | | | Commercial & Professional Services - 4.1% | |
| | 6,100 | | | CEB, Inc. | | | 374,479 | |
| | 7,700 | | | Deluxe Corp. | | | 419,958 | |
| | 6,100 | | | Essendant, Inc. | | | 198,311 | |
| | 11,664 | | | Herman Miller, Inc. | | | 334,757 | |
| | 3,055 | | | Insperity, Inc. | | | 147,098 | |
| | 15,100 | | | Interface, Inc. | | | 289,014 | |
| | 19,500 | | | Kimball International, Inc. Class B | | | 190,515 | |
| | 13,021 | | | Korn/Ferry International | | | 432,037 | |
| | | | | | | | |
Shares or Principal Amount | | Market Value† | |
| COMMON STOCKS - 99.1% - (continued) | |
| | | | Commercial & Professional Services - 4.1% - (continued) | |
| | 24,100 | | | Pitney Bowes, Inc. | | $ | 497,665 | |
| | 12,100 | | | Quad/Graphics, Inc. | | | 112,530 | |
| | 25,700 | | | R.R. Donnelley & Sons Co. | | | 378,304 | |
| | 19,100 | | | RPX Corp.* | | | 210,100 | |
| | 3,400 | | | UniFirst Corp. | | | 354,280 | |
| | | | | | | | |
| | | | | | | 3,939,048 | |
| | | | | | | | |
| | | | Consumer Durables & Apparel - 3.9% | | | |
| | 7,200 | | | Bassett Furniture Industries, Inc. | | | 180,576 | |
| | 5,497 | | | Carter’s, Inc. | | | 489,398 | |
| | 5,097 | | | CSS Industries, Inc. | | | 144,653 | |
| | 8,286 | | | Helen of Troy Ltd.* | | | 780,956 | |
| | 8,899 | | | Movado Group, Inc. | | | 228,793 | |
| | 23,600 | | | Nautilus, Inc.* | | | 394,592 | |
| | 3,212 | | | Oxford Industries, Inc. | | | 204,990 | |
| | 4,697 | | | Polaris Industries, Inc. | | | 403,707 | |
| | 11,090 | | | Smith & Wesson Holding Corp.* | | | 243,758 | |
| | 4,000 | | | Sturm Ruger & Co., Inc. | | | 238,440 | |
| | 6,080 | | | Tempur Sealy International, Inc.* | | | 428,397 | |
| | | | | | | | |
| | | | | | | 3,738,260 | |
| | | | | | | | |
| | | | Consumer Services - 3.8% | | | |
| | 8,500 | | | American Public Education, Inc.* | | | 158,185 | |
| | 14,328 | | | Apollo Education Group, Inc.* | | | 109,896 | |
| | 6,901 | | | Brinker International, Inc. | | | 330,903 | |
| | 4,984 | | | Capella Education Co. | | | 230,360 | |
| | 6,582 | | | Chuy’s Holdings, Inc.* | | | 206,280 | |
| | 10,420 | | | Domino’s Pizza, Inc. | | | 1,159,225 | |
| | 5,521 | | | Grand Canyon Education, Inc.* | | | 221,502 | |
| | 5,708 | | | International Speedway Corp. Class A | | | 192,474 | |
| | 16,896 | | | LifeLock, Inc.* | | | 242,458 | |
| | 5,390 | | | Papa John’s International, Inc. | | | 301,139 | |
| | 7,900 | | | Pinnacle Entertainment, Inc.* | | | 245,848 | |
| | 4,540 | | | Strayer Education, Inc.* | | | 272,945 | |
| | | | | | | | |
| | | | | | | 3,671,215 | |
| | | | | | | | |
| | | | Diversified Financials - 1.4% | | | |
| | 108,941 | | | Apollo Investment Corp. | | | 568,672 | |
| | 18,700 | | | Arlington Asset Investment Corp. Class A | | | 247,401 | |
| | 23,195 | | | Ezcorp, Inc. Class A* | | | 115,743 | |
| | 11,090 | | | Nelnet, Inc. Class A | | | 372,291 | |
| | | | | | | | |
| | | | | | | 1,304,107 | |
| | | | | | | | |
| | | | Energy - 3.4% | |
| | 6,500 | | | CVR Energy, Inc. | | | 255,775 | |
| | 16,367 | | | Noble Corp. plc | | | 172,672 | |
| | 17,800 | | | Nordic American Tankers Ltd. | | | 276,612 | |
| | 15,343 | | | Oil States International, Inc.* | | | 418,097 | |
| | 8,064 | | | Par Pacific Holdings, Inc.* | | | 189,827 | |
| | 33,661 | | | Pioneer Energy Services Corp.* | | | 73,044 | |
| | 2,400 | | | REX American Resources Corp.* | | | 129,768 | |
| | 26,052 | | | Superior Energy Services, Inc. | | | 350,920 | |
| | 15,050 | | | Valero Energy Corp. | | | 1,064,185 | |
| | 9,780 | | | Western Refining, Inc. | | | 348,364 | |
| | | | | | | | |
| | | | | | | 3,279,264 | |
| | | | | | | | |
| | | | Food, Beverage & Tobacco - 1.6% | |
| | 16,672 | | | Dean Foods Co. | | | 285,925 | |
| | 31,200 | | | Pilgrim’s Pride Corp. | | | 689,208 | |
| | 2,928 | | | Sanderson Farms, Inc. | | | 226,979 | |
| | 6,267 | | | Universal Corp. | | | 351,453 | |
| | | | | | | | |
| | | | | | | 1,553,565 | |
| | | | | | | | |
The accompanying notes are an integral part of these financial statements.
|
| Hartford Small/Mid Cap Equity HLS Fund |
Schedule of Investments – (continued)
December 31, 2015
| | | | | | | | |
Shares or Principal Amount | | Market Value† | |
| COMMON STOCKS - 99.1% - (continued) | |
| | | | Health Care Equipment & Services - 2.8% | |
| | 3,265 | | | ABIOMED, Inc.* | | $ | 294,764 | |
| | 12,400 | | | Centene Corp.* | | | 816,044 | |
| | 18,700 | | | InVivo Therapeutics Holdings Corp.* | | | 134,640 | |
| | 6,309 | | | Masimo Corp.* | | | 261,887 | |
| | 2,900 | | | Molina Healthcare, Inc.* | | | 174,377 | |
| | 44,212 | | | Quality Systems, Inc. | | | 712,697 | |
| | 10,537 | | | Triple-S Management Corp., Class B* | | | 251,940 | |
| | | | | | | | |
| | | | | | | 2,646,349 | |
| | | | | | | | |
| | | | Household & Personal Products - 1.0% | |
| | 5,600 | | | Herbalife Ltd.* | | | 300,272 | |
| | 5,513 | | | Medifast, Inc. | | | 167,485 | |
| | 3,500 | | | Usana Health Sciences, Inc.* | | | 447,125 | |
| | | | | | | | |
| | | | | | | 914,882 | |
| | | | | | | | |
| | | | Insurance - 5.2% | |
| | 9,688 | | | Ambac Financial Group, Inc.* | | | 136,504 | |
| | 5,159 | | | AmTrust Financial Services, Inc. | | | 317,691 | |
| | 3,987 | | | Aspen Insurance Holdings Ltd. | | | 192,572 | |
| | 7,400 | | | Assurant, Inc. | | | 595,996 | |
| | 8,898 | | | Assured Guaranty Ltd. | | | 235,174 | |
| | 18,000 | | | Endurance Specialty Holdings Ltd. | | | 1,151,820 | |
| | 5,594 | | | Everest Re Group Ltd. | | | 1,024,205 | |
| | 3,900 | | | FBL Financial Group Class A | | | 248,196 | |
| | 23,936 | | | Greenlight Capital Re Ltd. Class A* | | | 447,843 | |
| | 3,290 | | | Reinsurance Group of America, Inc. | | | 281,460 | |
| | 7,500 | | | Validus Holdings Ltd. | | | 347,175 | |
| | | | | | | | |
| | | | | | | 4,978,636 | |
| | | | | | | | |
| | | | Materials - 5.5% | |
| | 7,232 | | | Berry Plastics Group, Inc.* | | | 261,654 | |
| | 7,012 | | | Chemtura Corp.* | | | 191,217 | |
| | 9,696 | | | Clearwater Paper Corp.* | | | 441,459 | |
| | 11,800 | | | Domtar Corp. | | | 436,010 | |
| | 10,180 | | | Innospec, Inc. | | | 552,876 | |
| | 4,000 | | | Kaiser Aluminum Corp. | | | 334,640 | |
| | 32,700 | | | Rayonier Advanced Materials, Inc. | | | 320,133 | |
| | 4,900 | | | Reliance Steel & Aluminum Co. | | | 283,759 | |
| | 30,600 | | | Resolute Forest Products, Inc.* | | | 231,642 | |
| | 13,275 | | | Schnitzer Steel Industries, Inc. Class A | | | 190,761 | |
| | 6,100 | | | Schweitzer-Mauduit International, Inc. | | | 256,139 | |
| | 27,718 | | | Sealed Air Corp. | | | 1,236,223 | |
| | 10,700 | | | Steel Dynamics, Inc. | | | 191,209 | |
| | 7,881 | | | Stepan Co. | | | 391,607 | |
| | | | | | | | |
| | | | | | | 5,319,329 | |
| | | | | | | | |
| | | | Media - 0.7% | |
| | 17,038 | | | MSG Networks, Inc. Class A* | | | 354,390 | |
| | 20,100 | | | World Wrestling Entertainment, Inc. Class A | | | 358,584 | |
| | | | | | | | |
| | | | | | | 712,974 | |
| | | | | | | | |
| | | | Pharmaceuticals, Biotechnology & Life Sciences - 8.5% | |
| | 1,999 | | | Anacor Pharmaceuticals, Inc.* | | | 225,827 | |
| | 5,600 | | | Bio-Rad Laboratories, Inc. Class A* | | | 776,496 | |
| | 4,257 | | | BioSpecifics Technologies Corp.* | | | 182,923 | |
| | 9,200 | | | Cambrex Corp.* | | | 433,228 | |
| | 17,146 | | | Cytokinetics, Inc.* | | | 179,347 | |
| | 5,146 | | | Emergent Biosolutions, Inc.* | | | 205,892 | |
| | 61,891 | | | Geron Corp.* | | | 299,552 | |
| | 14,599 | | | Halozyme Therapeutics, Inc.* | | | 253,001 | |
| | 10,533 | | | ImmunoGen, Inc.* | | | 142,933 | |
| | 8,684 | | | Insys Therapeutics, Inc.* | | | 248,623 | |
| | | | | | | | |
Shares or Principal Amount | | Market Value† | |
| COMMON STOCKS - 99.1% - (continued) | |
| | | | Pharmaceuticals, Biotechnology & Life Sciences -
8.5% - (continued) | |
| | 6,192 | | | Medivation, Inc.* | | $ | 299,321 | |
| | 1,184 | | | Mettler-Toledo International, Inc.* | | | 401,530 | |
| | 7,565 | | | Myriad Genetics, Inc.* | | | 326,505 | |
| | 2,976 | | | PAREXEL International Corp.* | | | 202,725 | |
| | 98,244 | | | PDL Biopharma, Inc. | | | 347,784 | |
| | 29,808 | | | Pozen, Inc.* | | | 203,589 | |
| | 9,269 | | | Prestige Brands Holdings, Inc.* | | | 477,168 | |
| | 11,123 | | | Quintiles Transnational Holdings, Inc.* | | | 763,705 | |
| | 24,900 | | | Sciclone Pharmaceuticals, Inc.* | | | 229,080 | |
| | 35,245 | | | Spectrum Pharmaceuticals, Inc.* | | | 212,527 | |
| | 16,200 | | | Sucampo Pharmaceuticals, Inc. Class A* | | | 280,098 | |
| | 14,374 | | | Supernus Pharmaceuticals, Inc.* | | | 193,187 | |
| | 6,800 | | | United Therapeutics Corp.* | | | 1,064,948 | |
| | 24,923 | | | ZIOPHARM Oncology, Inc.* | | | 207,110 | |
| | | | | | | | |
| | | | | | | 8,157,099 | |
| | | | | | | | |
| | | | Real Estate - 12.5% | |
| | 14,900 | | | AG Mortgage Investment Trust, Inc. REIT | | | 191,316 | |
| | 15,437 | | | Altisource Residential Corp. REIT | | | 191,573 | |
| | 34,920 | | | American Capital Mortgage Investment Corp. REIT | | | 487,483 | |
| | 14,129 | | | Apollo Commercial Real Estate Finance, Inc. REIT | | | 243,443 | |
| | 9,697 | | | ARMOUR Residential, Inc. REIT | | | 211,007 | |
| | 55,800 | | | Brandywine Realty Trust REIT | | | 762,228 | |
| | 12,700 | | | Brixmor Property Group, Inc. REIT | | | 327,914 | |
| | 64,200 | | | Capstead Mortgage Corp. REIT | | | 561,108 | |
| | 18,153 | | | CBL & Associates Properties, Inc. REIT | | | 224,553 | |
| | 19,554 | | | Chimera Investment Corp. REIT | | | 266,716 | |
| | 9,938 | | | Colony Capital, Inc. Class A, REIT | | | 193,592 | |
| | 14,500 | | | Colony Starwood Homes REIT | | | 328,280 | |
| | 26,328 | | | CYS Investments, Inc. REIT | | | 187,719 | |
| | 11,520 | | | DDR Corp. REIT | | | 193,997 | |
| | 71,900 | | | Gramercy Property Trust REIT | | �� | 555,068 | |
| | 29,375 | | | Hatteras Financial Corp. REIT | | | 386,281 | |
| | 8,100 | | | Hospitality Properties Trust REIT | | | 211,815 | |
| | 15,317 | | | Invesco Mortgage Capital, Inc. REIT | | | 189,778 | |
| | 6,260 | | | Jones Lang LaSalle, Inc. | | | 1,000,724 | |
| | 26,900 | | | Ladder Capital Corp. REIT | | | 334,098 | |
| | 54,038 | | | Mack-Cali Realty Corp. REIT | | | 1,261,787 | |
| | 7,900 | | | Marcus & Millichap, Inc. REIT* | | | 230,206 | |
| | 28,370 | | | MFA Financial, Inc. REIT | | | 187,242 | |
| | 20,050 | | | New Residential Investment Corp. REIT | | | 243,808 | |
| | 31,160 | | | New York Mortgage Trust, Inc. REIT | | | 166,083 | |
| | 24,120 | | | PennyMac Mortgage Investment Trust REIT | | | 368,071 | |
| | 7,416 | | | Piedmont Office Realty Trust, Inc. Class A, REIT | | | 140,014 | |
| | 28,151 | | | Redwood Trust, Inc. REIT | | | 371,593 | |
| | 25,025 | | | Resource Capital Corp. REIT | | | 319,319 | |
| | 599 | | | RMR Group, Inc. REIT* | | | 8,632 | |
| | 26,297 | | | Select Income REIT | | | 521,206 | |
| | 14,600 | | | Starwood Property Trust, Inc. REIT | | | 300,176 | |
| | 47,300 | | | Two Harbors Investment Corp. REIT | | | 383,130 | |
| | 16,400 | | | Western Asset Mortgage Capital Corp. REIT | | | 167,608 | |
| | 20,673 | | | WP Glimcher, Inc. REIT | | | 219,340 | |
| | | | | | | | |
| | | | 11,936,908 | |
| | | | | | | | |
| | | | Retailing - 5.1% | |
| | 21,824 | | | American Eagle Outfitters, Inc. | | | 338,272 | |
| | 9,600 | | | Big Lots, Inc. | | | 369,984 | |
| | 12,100 | | | Buckle, Inc. | | | 372,438 | |
| | 7,438 | | | Caleres, Inc. | | | 199,487 | |
| | 11,045 | | | Express, Inc.* | | | 190,858 | |
The accompanying notes are an integral part of these financial statements.
|
| Hartford Small/Mid Cap Equity HLS Fund |
Schedule of Investments – (continued)
December 31, 2015
| | | | | | | | |
Shares or Principal Amount | | Market Value† | |
| COMMON STOCKS - 99.1% - (continued) | |
| | | | Retailing - 5.1% - (continued) | |
| | 13,690 | | | Foot Locker, Inc. | | $ | 891,082 | |
| | 11,821 | | | Francescas Holding Corp.* | | | 205,804 | |
| | 6,751 | | | Hibbett Sports, Inc.* | | | 204,150 | |
| | 35,082 | | | JC Penney Co., Inc.* | | | 233,646 | |
| | 25,374 | | | Nutrisystem, Inc. | | | 549,093 | |
| | 5,000 | | | Outerwall, Inc. | | | 182,700 | |
| | 24,900 | | | Overstock.com, Inc.* | | | 305,772 | |
| | 14,200 | | | Select Comfort Corp.* | | | 304,022 | |
| | 16,373 | | | Tile Shop Holdings, Inc.* | | | 268,517 | |
| | 5,398 | | | Wayfair, Inc. Class A* | | | 257,053 | |
| | | | | | | | |
| | | | 4,872,878 | |
| | | | | | | | |
| | | | Semiconductors & Semiconductor Equipment - 1.9% | |
| | 9,200 | | | Advanced Energy Industries, Inc.* | | | 259,716 | |
| | 4,700 | | | Ambarella, Inc.* | | | 261,978 | |
| | 15,600 | | | Integrated Device Technology, Inc.* | | | 411,060 | |
| | 13,969 | | | Marvell Technology Group Ltd. | | | 123,206 | |
| | 8,020 | | | Skyworks Solutions, Inc. | | | 616,177 | |
| | 6,000 | | | Tessera Technologies, Inc. | | | 180,060 | |
| | | | | | | | |
| | | | 1,852,197 | |
| | | | | | | | |
| | | | Software & Services - 8.4% | |
| | 14,460 | | | Amdocs Ltd. | | | 789,082 | |
| | 17,530 | | | Aspen Technology, Inc.* | | | 661,933 | |
| | 25,600 | | | Convergys Corp. | | | 637,184 | |
| | 1,090 | | | DST Systems, Inc. | | | 124,326 | |
| | 4,600 | | | Ellie Mae, Inc.* | | | 277,058 | |
| | 8,814 | | | Fleetmatics Group plc* | | | 447,663 | |
| | 9,780 | | | Gigamon, Inc.* | | | 259,855 | |
| | 9,196 | | | Global Payments, Inc. | | | 593,234 | |
| | 3,919 | | | Global Sources Ltd.* | | | 30,568 | |
| | 5,936 | | | Imperva, Inc.* | | | 375,808 | |
| | 3,700 | | | Luxoft Holding, Inc.* | | | 285,381 | |
| | 9,642 | | | Manhattan Associates, Inc.* | | | 638,011 | |
| | 35,903 | | | Mentor Graphics Corp. | | | 661,333 | |
| | 6,368 | | | Paycom Software, Inc.* | | | 239,628 | |
| | 2,771 | | | Stamps.com, Inc.* | | | 303,729 | |
| | 13,913 | | | Synopsys, Inc.* | | | 634,572 | |
| | 4,965 | | | Vantiv, Inc. Class A* | | | 235,440 | |
| | 6,238 | | | Verint Systems, Inc.* | | | 253,013 | |
| | 9,000 | | | Web.com Group, Inc.* | | | 180,090 | |
| | 19,074 | | | Wix.com Ltd.* | | | 433,934 | |
| | | | | | | | |
| | | | 8,061,842 | |
| | | | | | | | |
| | | | Technology Hardware & Equipment - 4.1% | |
| | 13,489 | | | Alliance Fiber Optic Products, Inc. | | | 204,493 | |
| | 3,034 | | | Arista Networks, Inc.* | | | 236,167 | |
| | 12,789 | | | Avnet, Inc. | | | 547,881 | |
| | 9,424 | | | AVX Corp. | | | 114,407 | |
| | 64,735 | | | Brocade Communications Systems, Inc. | | | 594,267 | |
| | 12,100 | | | Ciena Corp.* | | | 250,349 | |
| | 7,391 | | | Insight Enterprises, Inc.* | | | 185,662 | |
| | 4,701 | | | Palo Alto Networks, Inc.* | | | 828,034 | |
| | 12,308 | | | Sanmina Corp.* | | | 253,299 | |
| | 2,082 | | | SYNNEX Corp. | | | 187,234 | |
| | 4,050 | | | Tech Data Corp.* | | | 268,839 | |
| | 4,236 | | | Universal Display Corp.* | | | 230,608 | |
| | | | | | | | |
| | | | 3,901,240 | |
| | | | | | | | |
| | | | Telecommunication Services - 1.0% | |
| | 18,100 | | | Inteliquent, Inc. | | | 321,637 | |
| | 17,796 | | | Telephone & Data Systems, Inc. | | | 460,739 | |
| | | | | | | | |
Shares or Principal Amount | | Market Value† | |
| COMMON STOCKS - 99.1% - (continued) | |
| | | | Telecommunication Services - 1.0% - (continued) | |
| | 4,725 | | | United States Cellular Corp.* | | $ | 192,827 | |
| | | | | | | | |
| | | | 975,203 | |
| | | | | | | | |
| | | | Transportation - 2.2% | |
| | 17,758 | | | Alaska Air Group, Inc. | | | 1,429,697 | |
| | 1,067 | | | Allegiant Travel Co. | | | 179,075 | |
| | 7,225 | | | Hawaiian Holdings, Inc.* | | | 255,259 | |
| | 11,005 | | | JetBlue Airways Corp.* | | | 249,263 | |
| | | | | | | | |
| | | | 2,113,294 | |
| | | | | | | | |
| | | | Utilities - 4.3% | |
| | 58,048 | | | Atlantic Power Corp. | | | 114,355 | |
| | 3,984 | | | Chesapeake Utilities Corp. | | | 226,092 | |
| | 34,107 | | | Great Plains Energy, Inc. | | | 931,462 | |
| | 15,350 | | | National Fuel Gas Co. | | | 656,212 | |
| | 18,595 | | | Pinnacle West Capital Corp. | | | 1,199,006 | |
| | 5,953 | | | UGI Corp. | | | 200,973 | |
| | 18,881 | | | Westar Energy, Inc. | | | 800,743 | |
| | | | | | | | |
| | | | 4,128,843 | |
| | | | | | | | |
| | |
| | | | Total Common Stocks
(cost $90,643,583) | | $ | 95,066,529 | |
| | | | | | | | |
| | |
| | | | Total Long-Term Investments
(cost $90,643,583) | | $ | 95,066,529 | |
| | | | | | | | |
|
| SHORT-TERM INVESTMENTS - 0.7% | |
| | | | Other Investment Pools & Funds - 0.7% | |
| | 641,182 | | | Federated Prime Obligations Fund | | $ | 641,182 | |
| | | | | | | | |
| | |
| | | | Total Short-Term Investments
(cost $641,182) | | $ | 641,182 | |
| | | | | | | | |
| | | | | | | | | | |
| | | |
| | Total Investments
(cost $91,284,765)^ | | | 99.8 | % | | $ | 95,707,711 | |
| | Other Assets and Liabilities | | | 0.2 | % | | | 172,179 | |
| | | | | | | | | | |
| | Total Net Assets | | | 100.0 | % | | $ | 95,879,890 | |
| | | | | | | | | | |
The accompanying notes are an integral part of these financial statements.
|
| Hartford Small/Mid Cap Equity HLS Fund |
Schedule of Investments – (continued)
December 31, 2015
| Note: | Percentage of investments as shown is the ratio of the total market value to total net assets. |
| | Equity industry classifications used in this report are the Global Industry Classification Standard, which was developed by and is the exclusive property and service mark of MSCI, Inc. and Standard & Poor’s. |
| | For Fund compliance purposes, the Fund may not use the same classification system shown in this report as these classifications are used for financial reporting purposes. |
| ^ | At December 31, 2015, the cost of securities for federal income tax purposes was $91,249,335 and the aggregate gross unrealized appreciation and depreciation based on that cost were: |
| | | | |
Unrealized Appreciation | | $ | 13,209,559 | |
Unrealized Depreciation | | | (8,751,183 | ) |
| | | | |
Net Unrealized Appreciation | | $ | 4,458,376 | |
| | | | |
| † | See Significant Accounting Policies of accompanying Notes to Financial Statements regarding valuation of investments. |
| | |
| GLOSSARY: (abbreviations used in preceding Schedule of Investments) |
|
| Other Abbreviations: |
ADR | | American Depositary Receipt |
REIT | | Real Estate Investment Trust |
The accompanying notes are an integral part of these financial statements.
|
| Hartford Small/Mid Cap Equity HLS Fund |
Schedule of Investments – (continued)
December 31, 2015
Fair Valuation Summary
The following is a summary of the fair valuations according to the inputs used as of December 31, 2015 in valuing the Fund’s investments.
| | | | | | | | | | | | | | | | |
| | | Total | | | Level 1(1) | | | Level 2(1) | | | Level 3 | |
Assets | | | | | | | | | | | | | | | | |
Common Stocks | | | | | | | | | | | | | | | | |
Automobiles & Components | | $ | 1,564,092 | | | $ | 1,564,092 | | | $ | — | | | $ | — | |
Banks | | | 7,133,656 | | | | 7,133,656 | | | | — | | | | — | |
Capital Goods | | | 8,311,648 | | | | 8,311,648 | | | | — | | | | — | |
Commercial & Professional Services | | | 3,939,048 | | | | 3,939,048 | | | | — | | | | — | |
Consumer Durables & Apparel | | | 3,738,260 | | | | 3,738,260 | | | | — | | | | — | |
Consumer Services | | | 3,671,215 | | | | 3,671,215 | | | | — | | | | — | |
Diversified Financials | | | 1,304,107 | | | | 1,304,107 | | | | — | | | | — | |
Energy | | | 3,279,264 | | | | 3,279,264 | | | | — | | | | — | |
Food, Beverage & Tobacco | | | 1,553,565 | | | | 1,553,565 | | | | — | | | | — | |
Health Care Equipment & Services | | | 2,646,349 | | | | 2,646,349 | | | | — | | | | — | |
Household & Personal Products | | | 914,882 | | | | 914,882 | | | | — | | | | — | |
Insurance | | | 4,978,636 | | | | 4,978,636 | | | | — | | | | — | |
Materials | | | 5,319,329 | | | | 5,319,329 | | | | — | | | | — | |
Media | | | 712,974 | | | | 712,974 | | | | — | | | | — | |
Pharmaceuticals, Biotechnology & Life Sciences | | | 8,157,099 | | | | 8,157,099 | | | | — | | | | — | |
Real Estate | | | 11,936,908 | | | | 11,936,908 | | | | — | | | | — | |
Retailing | | | 4,872,878 | | | | 4,872,878 | | | | — | | | | — | |
Semiconductors & Semiconductor Equipment | | | 1,852,197 | | | | 1,852,197 | | | | — | | | | — | |
Software & Services | | | 8,061,842 | | | | 8,061,842 | | | | — | | | | — | |
Technology Hardware & Equipment | | | 3,901,240 | | | | 3,901,240 | | | | — | | | | — | |
Telecommunication Services | | | 975,203 | | | | 975,203 | | | | — | | | | — | |
Transportation | | | 2,113,294 | | | | 2,113,294 | | | | — | | | | — | |
Utilities | | | 4,128,843 | | | | 4,128,843 | | | | — | | | | — | |
Short-Term Investments | | | 641,182 | | | | 641,182 | | | | — | | | | — | |
| | | | | | | | | | | | | | | | |
Total | | $ | 95,707,711 | | | $ | 95,707,711 | | | $ | — | | | $ | — | |
| | | | | | | | | | | | | | | | |
| (1) | For the year ended December 31, 2015, there were no transfers between Level 1 and Level 2. |
| Note: | For purposes of reporting transfers between different hierarchy levels, both transfers in and out of each level, as applicable, are shown as if they occurred at the beginning of the period. |
The accompanying notes are an integral part of these financial statements.
|
| Hartford SmallCap Growth HLS Fund |
Schedule of Investments
December 31, 2015
| | | | | | | | |
Shares or Principal Amount | | Market Value† | |
| COMMON STOCKS - 96.1% | |
| | | | Automobiles & Components - 0.9% | |
| | 34,230 | | | American Axle & Manufacturing Holdings, Inc.* | | $ | 648,316 | |
| | 42,287 | | | Cooper Tire & Rubber Co. | | | 1,600,563 | |
| | 179,678 | | | Tenneco, Inc.* | | | 8,249,017 | |
| | | | | | | | |
| | | | 10,497,896 | |
| | | | | | | | |
| | | | Banks - 3.5% | |
| | 59,607 | | | BofI Holding, Inc.* | | | 1,254,728 | |
| | 345,253 | | | EverBank Financial Corp. | | | 5,517,143 | |
| | 123,970 | | | FCB Financial Holdings, Inc. Class A* | | | 4,436,886 | |
| | 280,467 | | | First Merchants Corp. | | | 7,129,471 | |
| | 100,383 | | | Flushing Financial Corp. | | | 2,172,288 | |
| | 146,965 | | | Great Western Bancorp, Inc. | | | 4,264,924 | |
| | 13,638 | | | HomeStreet, Inc.* | | | 296,081 | |
| | 9,442 | | | LendingTree, Inc.* | | | 842,982 | |
| | 692,662 | | | MGIC Investment Corp.* | | | 6,116,206 | |
| | 107,171 | | | Sandy Spring Bancorp, Inc. | | | 2,889,330 | |
| | 216,260 | | | Sterling Bancorp | | | 3,507,737 | |
| | 28,799 | | | Walker & Dunlop, Inc.* | | | 829,699 | |
| | | | | | | | |
| | | | 39,257,475 | |
| | | | | | | | |
| | | | Capital Goods - 6.9% | |
| | 224,200 | | | AAON, Inc. | | | 5,205,924 | |
| | 16,000 | | | Aegion Corp.* | | | 308,960 | |
| | 64,154 | | | Aerojet Rocketdyne Holdings, Inc.* | | | 1,004,652 | |
| | 194,328 | | | Altra Industrial Motion Corp. | | | 4,873,746 | |
| | 14,530 | | | American Woodmark Corp.* | | | 1,162,109 | |
| | 20,142 | | | Argan, Inc. | | | 652,601 | |
| | 144,778 | | | Astronics Corp.* | | | 5,893,912 | |
| | 137,146 | | | AZZ, Inc. | | | 7,621,203 | |
| | 26,622 | | | Comfort Systems USA, Inc. | | | 756,597 | |
| | 22,000 | | | Continental Building Products, Inc.* | | | 384,120 | |
| | 11,800 | | | Douglas Dynamics, Inc. | | | 248,626 | |
| | 12,600 | | | DXP Enterprises, Inc.* | | | 287,280 | |
| | 15,819 | | | Dycom Industries, Inc.* | | | 1,106,697 | |
| | 14,639 | | | Encore Wire Corp. | | | 542,961 | |
| | 53,369 | | | Esterline Technologies Corp.* | | | 4,322,889 | |
| | 16,800 | | | FreightCar America, Inc. | | | 326,424 | |
| | 202,795 | | | Generac Holdings, Inc.* | | | 6,037,207 | |
| | 46,901 | | | General Cable Corp. | | | 629,881 | |
| | 27,002 | | | Global Brass & Copper Holdings, Inc. | | | 575,143 | |
| | 167,080 | | | Heico Corp. Class A | | | 8,220,336 | |
| | 23,189 | | | Hyster-Yale Materials Handling, Inc. | | | 1,216,263 | |
| | 62,676 | | | Lennox International, Inc. | | | 7,828,233 | |
| | 12,500 | | | Lydall, Inc.* | | | 443,500 | |
| | 120,224 | | | Meritor, Inc.* | | | 1,003,870 | |
| | 13,782 | | | Moog, Inc. Class A* | | | 835,189 | |
| | 8,376 | | | Patrick Industries, Inc.* | | | 364,356 | |
| | 73,510 | | | Taser International, Inc.* | | | 1,270,988 | |
| | 63,782 | | | Teledyne Technologies, Inc.* | | | 5,657,463 | |
| | 102,512 | | | Toro Co. | | | 7,490,552 | |
| | 79,543 | | | Wabash National Corp.* | | | 940,994 | |
| | | | | | | | |
| | | | 77,212,676 | |
| | | | | | | | |
| | | | Commercial & Professional Services - 3.8% | |
| | 18,113 | | | Brink’s Co. | | | 522,741 | |
| | 23,860 | | | CEB, Inc. | | | 1,464,765 | |
| | 139,326 | | | Deluxe Corp. | | | 7,598,840 | |
| | 190,504 | | | Exponent, Inc. | | | 9,515,675 | |
| | 154,959 | | | GP Strategies Corp.* | | | 3,891,021 | |
| | 54,694 | | | Herman Miller, Inc. | | | 1,569,718 | |
| | 13,903 | | | Insperity, Inc. | | | 669,430 | |
| | 43,630 | | | Interface, Inc. | | | 835,078 | |
| | | | | | | | |
Shares or Principal Amount | | Market Value† | |
| COMMON STOCKS - 96.1% - (continued) | |
| | | | Commercial & Professional Services - 3.8% - (continued) | |
| | 25,119 | | | Korn/Ferry International | | $ | 833,448 | |
| | 6,003 | | | Multi-Color Corp. | | | 359,039 | |
| | 183,181 | | | On Assignment, Inc.* | | | 8,233,986 | |
| | 60,523 | | | RPX Corp.* | | | 665,753 | |
| | 9,669 | | | UniFirst Corp. | | | 1,007,510 | |
| | 113,796 | | | WageWorks, Inc.* | | | 5,162,925 | |
| | | | | | | | |
| | | | 42,329,929 | |
| | | | | | | | |
| | | | Consumer Durables & Apparel - 4.5% | |
| | 142,933 | | | Arctic Cat, Inc. | | | 2,341,243 | |
| | 161,403 | | | G-III Apparel Group Ltd.* | | | 7,143,697 | |
| | 19,064 | | | Helen of Troy Ltd.* | | | 1,796,782 | |
| | 381,567 | | | Kate Spade & Co.* | | | 6,780,446 | |
| | 18,879 | | | Movado Group, Inc. | | | 485,379 | |
| | 47,273 | | | Nautilus, Inc.* | | | 790,405 | |
| | 101,601 | | | Oxford Industries, Inc. | | | 6,484,176 | |
| | 1,610 | | | Polaris Industries, Inc. | | | 138,379 | |
| | 67,327 | | | Smith & Wesson Holding Corp.* | | | 1,479,847 | |
| | 250,827 | | | Steven Madden Ltd.* | | | 7,579,992 | |
| | 16,781 | | | Sturm Ruger & Co., Inc. | | | 1,000,315 | |
| | 188,600 | | | Taylor Morrison Home Corp. Class A* | | | 3,017,600 | |
| | 141,520 | | | TopBuild Corp.* | | | 4,354,570 | |
| | 295,823 | | | Vince Holding Corp.* | | | 1,354,869 | |
| | 140,233 | | | Vista Outdoor, Inc.* | | | 6,241,771 | |
| | | | | | | | |
| | | | 50,989,471 | |
| | | | | | | | |
| | | | Consumer Services - 5.1% | |
| | 13,300 | | | American Public Education, Inc.* | | | 247,513 | |
| | 8,565 | | | BJ’s Restaurants, Inc.* | | | 372,320 | |
| | 495,130 | | | Bloomin’ Brands, Inc. | | | 8,362,746 | |
| | 30,811 | | | Boyd Gaming Corp.* | | | 612,215 | |
| | 102,240 | | | Brinker International, Inc. | | | 4,902,408 | |
| | 20,457 | | | Buffalo Wild Wings, Inc.* | | | 3,265,960 | |
| | 23,248 | | | Capella Education Co. | | | 1,074,523 | |
| | 26,101 | | | Chuy’s Holdings, Inc.* | | | 818,005 | |
| | 337,070 | | | Del Frisco’s Restaurant Group, Inc.* | | | 5,399,861 | |
| | 15,140 | | | Domino’s Pizza, Inc. | | | 1,684,325 | |
| | 108,640 | | | Dunkin’ Brands Group, Inc. | | | 4,626,978 | |
| | 42,142 | | | Grand Canyon Education, Inc.* | | | 1,690,737 | |
| | 43,896 | | | Isle of Capri Casinos, Inc.* | | | 611,471 | |
| | 482,228 | | | La Quinta Holdings, Inc.* | | | 6,563,123 | |
| | 72,137 | | | LifeLock, Inc.* | | | 1,035,166 | |
| | 119,019 | | | Marriott Vacations Worldwide Corp. | | | 6,778,132 | |
| | 32,172 | | | Papa John’s International, Inc. | | | 1,797,450 | |
| | 63,713 | | | Pinnacle Entertainment, Inc.* | | | 1,982,748 | |
| | 21,809 | | | Sonic Corp. | | | 704,649 | |
| | 13,789 | | | Strayer Education, Inc.* | | | 828,995 | |
| | 193,040 | | | Wingstop, Inc.* | | | 4,403,242 | |
| | | | | | | | |
| | | | | | | 57,762,567 | |
| | | | | | | | |
| | | | Diversified Financials - 1.8% | |
| | 68,300 | | | Cowen Group, Inc. Class A* | | | 261,589 | |
| | 111,783 | | | Evercore Partners, Inc. Class A | | | 6,044,107 | |
| | 192,417 | | | HFF, Inc. Class A | | | 5,978,396 | |
| | 49,921 | | | KCG Holdings, Inc. Class A* | | | 614,528 | |
| | 50,187 | | | MarketAxess Holdings, Inc. | | | 5,600,367 | |
| | 78,144 | | | WisdomTree Investments, Inc. | | | 1,225,298 | |
| | | | | | | | |
| | | | | | | 19,724,285 | |
| | | | | | | | |
| | | | Energy - 1.2% | |
| | 53,472 | | | Alon USA Energy, Inc. | | | 793,524 | |
| | 23,086 | | | CVR Energy, Inc. | | | 908,434 | |
The accompanying notes are an integral part of these financial statements.
|
| Hartford SmallCap Growth HLS Fund |
Schedule of Investments – (continued)
December 31, 2015
| | | | | | | | |
Shares or Principal Amount | | Market Value† | |
| COMMON STOCKS - 96.1% - (continued) | |
| | | | Energy - 1.2% - (continued) | |
| | 135,982 | | | Forum Energy Technologies, Inc.* | | $ | 1,694,336 | |
| | 11,737 | | | Matrix Service Co.* | | | 241,078 | |
| | 48,858 | | | Pioneer Energy Services Corp.* | | | 106,022 | |
| | 14,415 | | | REX American Resources Corp.* | | | 779,419 | |
| | 304,779 | | | RSP Permian, Inc.* | | | 7,433,560 | |
| | 38,259 | | | Western Refining, Inc. | | | 1,362,786 | |
| | | | | | | | |
| | | | | | | 13,319,159 | |
| | | | | | | | |
| | | | Food & Staples Retailing - 2.4% | |
| | 106,114 | | | Casey’s General Stores, Inc. | | | 12,781,431 | |
| | 16,078 | | | Fresh Market, Inc.* | | | 376,547 | |
| | 10,908 | | | Ingles Markets, Inc. Class A | | | 480,825 | |
| | 276,776 | | | Natural Grocers by Vitamin Cottage, Inc.* | | | 5,637,927 | |
| | 89,539 | | | PriceSmart, Inc. | | | 7,430,841 | |
| | | | | | | | |
| | | | | | | 26,707,571 | |
| | | | | | | | |
| | | | Food, Beverage & Tobacco - 1.9% | |
| | 22,400 | | | Cal-Maine Foods, Inc. | | | 1,038,016 | |
| | 66,541 | | | Dean Foods Co. | | | 1,141,178 | |
| | 69,591 | | | Pilgrim’s Pride Corp. | | | 1,537,265 | |
| | 116,233 | | | Post Holdings, Inc.* | | | 7,171,576 | |
| | 13,700 | | | Sanderson Farms, Inc. | | | 1,062,024 | |
| | 121,745 | | | TreeHouse Foods, Inc.* | | | 9,552,113 | |
| | | | | | | | |
| | | | | | | 21,502,172 | |
| | | | | | | | |
| | | | Health Care Equipment & Services - 10.2% | |
| | 17,797 | | | ABIOMED, Inc.* | | | 1,606,713 | |
| | 82,855 | | | Acadia Healthcare Co., Inc.* | | | 5,175,123 | |
| | 6,000 | | | Amedisys, Inc.* | | | 235,920 | |
| | 34,400 | | | AMN Healthcare Services, Inc.* | | | 1,068,120 | |
| | 16,705 | | | Amsurg Corp.* | | | 1,269,580 | |
| | 139,010 | | | Anika Therapeutics, Inc.* | | | 5,304,622 | |
| | 16,794 | | | Atrion Corp. | | | 6,401,873 | |
| | 27,422 | | | Centene Corp.* | | | 1,804,642 | |
| | 140,600 | | | Cynosure, Inc. Class A* | | | 6,280,602 | |
| | 65,807 | | | DexCom, Inc.* | | | 5,389,593 | |
| | 43,128 | | | Ensign Group, Inc. | | | 975,987 | |
| | 375,504 | | | Globus Medical, Inc. Class A* | | | 10,446,521 | |
| | 40,155 | | | HealthEquity, Inc.* | | | 1,006,686 | |
| | 223,410 | | | HealthSouth Corp. | | | 7,776,902 | |
| | 33,229 | | | HeartWare International, Inc.* | | | 1,674,742 | |
| | 75,451 | | | ICU Medical, Inc.* | | | 8,509,364 | |
| | 38,530 | | | InVivo Therapeutics Holdings Corp.* | | | 277,416 | |
| | 77,931 | | | LivaNova plc* | | | 4,626,764 | |
| | 12,500 | | | Magellan Health, Inc.* | | | 770,750 | |
| | 41,787 | | | Masimo Corp.* | | | 1,734,578 | |
| | 14,098 | | | Medidata Solutions, Inc.* | | | 694,890 | |
| | 15,700 | | | Meridian Bioscience, Inc. | | | 322,164 | |
| | 39,680 | | | Molina Healthcare, Inc.* | | | 2,385,958 | |
| | 5,900 | | | Natus Medical, Inc.* | | | 283,495 | |
| | 207,096 | | | Omnicell, Inc.* | | | 6,436,544 | |
| | 8,590 | | | Orthofix International N.V.* | | | 336,814 | |
| | 109,560 | | | Quality Systems, Inc. | | | 1,766,107 | |
| | 50,831 | | | Rockwell Medical, Inc.* | | | 520,510 | |
| | 146,325 | | | Team Health Holdings, Inc.* | | | 6,422,204 | |
| | 40,896 | | | Triple-S Management Corp., Class B* | | | 977,823 | |
| | 116,707 | | | U.S. Physical Therapy, Inc. | | | 6,264,832 | |
| | 213,715 | | | Vascular Solutions, Inc.* | | | 7,349,659 | |
| | 108,178 | | | WellCare Health Plans, Inc.* | | | 8,460,601 | |
| | | | | | | | |
| | | | | | | 114,558,099 | |
| | | | | | | | |
| | | | | | | | |
Shares or Principal Amount | | Market Value† | |
| COMMON STOCKS - 96.1% - (continued) | |
| | | | Household & Personal Products - 0.1% | |
| | 15,542 | | | Medifast, Inc. | | $ | 472,166 | |
| | 8,900 | | | Natural Health Trends Corp. | | | 298,417 | |
| | 5,700 | | | Usana Health Sciences, Inc.* | | | 728,175 | |
| | | | | | | | |
| | | | | | | 1,498,758 | |
| | | | | | | | |
| | | | Insurance - 1.6% | |
| | 49,941 | | | Ambac Financial Group, Inc.* | | | 703,669 | |
| | 144,775 | | | AMERISAFE, Inc. | | | 7,369,048 | |
| | 9,300 | | | Federated National Holding Co. | | | 274,908 | |
| | 55,411 | | | Greenlight Capital Re Ltd. Class A* | | | 1,036,740 | |
| | 28,805 | | | Heritage Insurance Holdings, Inc. | | | 628,525 | |
| | 167,621 | | | James River Group Holdings Ltd. | | | 5,622,008 | |
| | 94,996 | | | Maiden Holdings Ltd. | | | 1,416,390 | |
| | 56,516 | | | Universal Insurance Holdings, Inc. | | | 1,310,041 | |
| | | | | | | | |
| | | | | | | 18,361,329 | |
| | | | | | | | |
| | | | Materials - 4.3% | |
| | 7,498 | | | AEP Industries, Inc.* | | | 578,471 | |
| | 56,512 | | | Berry Plastics Group, Inc.* | | | 2,044,604 | |
| | 204,642 | | | Boise Cascade Co.* | | | 5,224,510 | |
| | 60,605 | | | Chemtura Corp.* | | | 1,652,698 | |
| | 20,090 | | | Clearwater Paper Corp.* | | | 914,698 | |
| | 597,116 | | | Graphic Packaging Holding Co. | | | 7,660,998 | |
| | 445,255 | | | Headwaters, Inc.* | | | 7,511,452 | |
| | 11,602 | | | Innospec, Inc. | | | 630,105 | |
| | 5,292 | | | Kaiser Aluminum Corp. | | | 442,729 | |
| | 27,638 | | | Koppers Holdings, Inc.* | | | 504,394 | |
| | 562,414 | | | OMNOVA Solutions, Inc.* | | | 3,447,598 | |
| | 220,124 | | | PolyOne Corp. | | | 6,991,138 | |
| | 37,359 | | | Schweitzer-Mauduit International, Inc. | | | 1,568,704 | |
| | 118,301 | | | Silgan Holdings, Inc. | | | 6,355,130 | |
| | 23,260 | | | Stepan Co. | | | 1,155,789 | |
| | 21,232 | | | Trinseo S.A.* | | | 598,742 | |
| | 15,630 | | | Worthington Industries, Inc. | | | 471,088 | |
| | | | | | | | |
| | | | | | | 47,752,848 | |
| | | | | | | | |
| | | | Media - 0.1% | |
| | 46,800 | | | Gray Television, Inc.* | | | 762,840 | |
| | 40,657 | | | World Wrestling Entertainment, Inc. Class A | | | 725,321 | |
| | | | | | | | |
| | | | | | | 1,488,161 | |
| | | | | | | | |
| | | | Pharmaceuticals, Biotechnology & Life
Sciences - 15.8% | |
| | 346,776 | | | Achillion Pharmaceuticals, Inc.* | | | 3,741,713 | |
| | 113,425 | | | Acorda Therapeutics, Inc.* | | | 4,852,321 | |
| | 238,719 | | | Aerie Pharmaceuticals, Inc.* | | | 5,812,808 | |
| | 27,715 | | | Affymetrix, Inc.* | | | 279,644 | |
| | 110,009 | | | Agenus, Inc.* | | | 499,441 | |
| | 48,779 | | | Agios Pharmaceuticals, Inc.* | | | 3,166,733 | |
| | 159,360 | | | Alder Biopharmaceuticals, Inc.* | | | 5,263,661 | |
| | 309,390 | | | Amicus Therapeutics, Inc.* | | | 3,001,083 | |
| | 96,539 | | | Anacor Pharmaceuticals, Inc.* | | | 10,906,011 | |
| | 94,121 | | | Anthera Pharmaceuticals, Inc.* | | | 436,721 | |
| | 342,340 | | | Aratana Therapeutics, Inc.* | | | 1,910,257 | |
| | 379,917 | | | BioCryst Pharmaceuticals, Inc.* | | | 3,920,743 | |
| | 559,660 | | | BioDelivery Sciences International, Inc.* | | | 2,680,771 | |
| | 20,579 | | | BioSpecifics Technologies Corp.* | | | 884,280 | |
| | 31,543 | | | Cambrex Corp.* | | | 1,485,360 | |
| | 147,524 | | | Cepheid* | | | 5,389,052 | |
| | 97,720 | | | Cytokinetics, Inc.* | | | 1,022,151 | |
| | 10,900 | | | Eagle Pharmaceuticals, Inc.* | | | 966,503 | |
| | 66,394 | | | Emergent Biosolutions, Inc.* | | | 2,656,424 | |
| | 16,948 | | | Enanta Pharmaceuticals, Inc.* | | | 559,623 | |
The accompanying notes are an integral part of these financial statements.
|
| Hartford SmallCap Growth HLS Fund |
Schedule of Investments – (continued)
December 31, 2015
| | | | | | | | |
Shares or Principal Amount | | Market Value† | |
| COMMON STOCKS - 96.1% - (continued) | |
| | | | Pharmaceuticals, Biotechnology & Life Sciences -
15.8% - (continued) | |
| | 146,581 | | | Five Prime Therapeutics, Inc.* | | $ | 6,083,111 | |
| | 169,320 | | | Flexion Therapeutics, Inc.* | | | 3,262,796 | |
| | 222,200 | | | Geron Corp.* | | | 1,075,448 | |
| | 101,550 | | | Global Blood Therapeutics, Inc.* | | | 3,283,112 | |
| | 114,085 | | | GlycoMimetics, Inc.* | | | 652,566 | |
| | 107,741 | | | Halozyme Therapeutics, Inc.* | | | 1,867,152 | |
| | 89,780 | | | ImmunoGen, Inc.* | | | 1,218,315 | |
| | 23,465 | | | INC Research Holdings, Inc. Class A* | | | 1,138,287 | |
| | 61,369 | | | Insys Therapeutics, Inc.* | | | 1,756,994 | |
| | 201,231 | | | Intersect ENT, Inc.* | | | 4,527,697 | |
| | 90,829 | | | Ironwood Pharmaceuticals, Inc.* | | | 1,052,708 | |
| | 18,750 | | | Lannett Co., Inc.* | | | 752,250 | |
| | 9,125 | | | Ligand Pharmaceuticals, Inc.* | | | 989,333 | |
| | 40,744 | | | Luminex Corp.* | | | 871,514 | |
| | 159,247 | | | Medicines Co.* | | | 5,946,283 | |
| | 60,862 | | | MiMedx Group, Inc.* | | | 570,277 | |
| | 39,516 | | | Myriad Genetics, Inc.* | | | 1,705,511 | |
| | 135,670 | | | Neurocrine Biosciences, Inc.* | | | 7,674,852 | |
| | 13,166 | | | NewLink Genetics Corp.* | | | 479,111 | |
| | 64,932 | | | Northwest Biotherapeutics, Inc.* | | | 207,782 | |
| | 572,723 | | | Novavax, Inc.* | | | 4,805,146 | |
| | 96,977 | | | Ophthotech Corp.* | | | 7,615,604 | |
| | 398,505 | | | Orexigen Therapeutics, Inc.* | | | 685,429 | |
| | 144,058 | | | Otonomy, Inc.* | | | 3,997,609 | |
| | 153,265 | | | PAREXEL International Corp.* | | | 10,440,412 | |
| | 500,880 | | | PDL Biopharma, Inc. | | | 1,773,115 | |
| | 18,300 | | | Pfenex, Inc.* | | | 226,554 | |
| | 165,669 | | | Portola Pharmaceuticals, Inc.* | | | 8,523,670 | |
| | 25,443 | | | PRA Health Sciences, Inc.* | | | 1,151,805 | |
| | 35,729 | | | Prestige Brands Holdings, Inc.* | | | 1,839,329 | |
| | 36,100 | | | Progenics Pharmaceuticals, Inc.* | | | 221,293 | |
| | 7,012 | | | Prothena Corp. plc* | | | 477,587 | |
| | 89,318 | | | PTC Therapeutics, Inc.* | | | 2,893,903 | |
| | 25,719 | | | Puma Biotechnology, Inc.* | | | 2,016,370 | |
| | 221,676 | | | Relypsa, Inc.* | | | 6,282,298 | |
| | 16,154 | | | Repligen Corp.* | | | 456,997 | |
| | 151,830 | | | Sciclone Pharmaceuticals, Inc.* | | | 1,396,836 | |
| | 98,804 | | | Spectrum Pharmaceuticals, Inc.* | | | 595,788 | |
| | 54,917 | | | Sucampo Pharmaceuticals, Inc. Class A* | | | 949,515 | |
| | 83,019 | | | Supernus Pharmaceuticals, Inc.* | | | 1,115,775 | |
| | 119,094 | | | TESARO, Inc.* | | | 6,230,998 | |
| | 58,037 | | | Ultragenyx Pharmaceutical, Inc.* | | | 6,510,591 | |
| | 379,851 | | | XenoPort, Inc.* | | | 2,085,382 | |
| | 117,719 | | | ZIOPHARM Oncology, Inc.* | | | 978,245 | |
| | | | | | | | |
| | | | | | | 177,820,650 | |
| | | | | | | | |
| | | | Real Estate - 1.5% | |
| | 90,381 | | | Apollo Residential Mortgage, Inc. REIT | | | 1,080,053 | |
| | 58,065 | | | CareTrust, Inc. REIT | | | 635,812 | |
| | 143,619 | | | Coresite Realty Corp. REIT | | | 8,146,070 | |
| | 20,438 | | | Marcus & Millichap, Inc. REIT* | | | 595,563 | |
| | 12,960 | | | Omega Healthcare Investors, Inc. REIT | | | 453,341 | |
| | 49,290 | | | RLJ Lodging Trust REIT | | | 1,066,143 | |
| | 32,767 | | | Sabra Healthcare, Inc. REIT | | | 662,876 | |
| | 372,507 | | | Sunstone Hotel Investors, Inc. REIT | | | 4,652,612 | |
| | | | | | | | |
| | | | | | | 17,292,470 | |
| | | | | | | | |
| | | | Retailing - 4.8% | |
| | 97,176 | | | American Eagle Outfitters, Inc. | | | 1,506,228 | |
| | 13,187 | | | Big Lots, Inc. | | | 508,227 | |
| | | | | | | | |
Shares or Principal Amount | | Market Value† | |
| COMMON STOCKS - 96.1% - (continued) | |
| | | | Retailing - 4.8% - (continued) | |
| | 60,236 | | | Buckle, Inc. | | $ | 1,854,064 | |
| | 229,515 | | | Burlington Stores, Inc.* | | | 9,846,193 | |
| | 14,842 | | | Cato Corp. Class A | | | 546,482 | |
| | 29,184 | | | Chico’s FAS, Inc. | | | 311,393 | |
| | 74,941 | | | Core-Mark Holding Co., Inc. | | | 6,140,666 | |
| | 265,552 | | | DSW, Inc. Class A | | | 6,336,071 | |
| | 60,451 | | | Express, Inc.* | | | 1,044,593 | |
| | 215,528 | | | Five Below, Inc.* | | | 6,918,449 | |
| | 68,010 | | | Francescas Holding Corp.* | | | 1,184,054 | |
| | 51,971 | | | Hibbett Sports, Inc.* | | | 1,571,603 | |
| | 148,230 | | | HSN, Inc. | | | 7,510,814 | |
| | 65,862 | | | Nutrisystem, Inc. | | | 1,425,254 | |
| | 19,400 | | | Outerwall, Inc. | | | 708,876 | |
| | 26,063 | | | Overstock.com, Inc.* | | | 320,054 | |
| | 252,138 | | | Party City Holdco, Inc.* | | | 3,255,102 | |
| | 35,900 | | | PetMed Express, Inc. | | | 615,326 | |
| | 56,733 | | | Select Comfort Corp.* | | | 1,214,654 | |
| | 40,560 | | | Tile Shop Holdings, Inc.* | | | 665,184 | |
| | 17,741 | | | Wayfair, Inc. Class A* | | | 844,826 | |
| | | | | | | | |
| | | | | | | 54,328,113 | |
| | | | | | | | |
| | | | Semiconductors & Semiconductor Equipment - 2.5% | |
| | 15,200 | | | Advanced Energy Industries, Inc.* | | | 429,096 | |
| | 21,273 | | | Ambarella, Inc.* | | | 1,185,757 | |
| | 388,952 | | | Integrated Device Technology, Inc.* | | | 10,248,885 | |
| | 106,550 | | | Kulicke & Soffa Industries, Inc.* | | | 1,243,438 | |
| | 176,887 | | | MKS Instruments, Inc. | | | 6,367,932 | |
| | 106,382 | | | SunEdison Semiconductor Ltd.* | | | 834,035 | |
| | 179,626 | | | SunPower Corp.* | | | 5,390,576 | |
| | 63,160 | | | Tessera Technologies, Inc. | | | 1,895,432 | |
| | | | | | | | |
| | | | | | | 27,595,151 | |
| | | | | | | | |
| | | | Software & Services - 17.8% | | | |
| | 181,434 | | | Aspen Technology, Inc.* | | | 6,850,948 | |
| | 26,927 | | | AVG Technologies N.V.* | | | 539,886 | |
| | 12,291 | | | BroadSoft, Inc.* | | | 434,610 | |
| | 51,922 | | | CACI International, Inc. Class A* | | | 4,817,323 | |
| | 286,425 | | | Cardtronics, Inc.* | | | 9,638,201 | |
| | 105,637 | | | Cass Information Systems, Inc. | | | 5,436,080 | |
| | 149,727 | | | comScore, Inc.* | | | 6,161,266 | |
| | 65,736 | | | CSG Systems International, Inc. | | | 2,365,181 | |
| | 47,677 | | | Demandware, Inc.* | | | 2,573,128 | |
| | 36,290 | | | Ellie Mae, Inc.* | | | 2,185,747 | |
| | 246,224 | | | Envestnet, Inc.* | | | 7,349,786 | |
| | 101,080 | | | EPAM Systems, Inc.* | | | 7,946,910 | |
| | 4,500 | | | Euronet Worldwide, Inc.* | | | 325,935 | |
| | 239,409 | | | Everyday Health, Inc.* | | | 1,441,242 | |
| | 189,113 | | | Exlservice Holdings, Inc.* | | | 8,496,847 | |
| | 102,630 | | | Fair Isaac Corp. | | | 9,665,693 | |
| | 478,744 | | | Five9, Inc.* | | | 4,165,073 | |
| | 173,381 | | | Fleetmatics Group plc* | | | 8,806,021 | |
| | 48,256 | | | Gigamon, Inc.* | | | 1,282,162 | |
| | 103,091 | | | Heartland Payment Systems, Inc. | | | 9,775,089 | |
| | 99,015 | | | HubSpot, Inc.* | | | 5,575,535 | |
| | 27,729 | | | Imperva, Inc.* | | | 1,755,523 | |
| | 113,000 | | | j2 Global, Inc. | | | 9,302,160 | |
| | 24,350 | | | LogMeIn, Inc.* | | | 1,633,885 | |
| | 19,867 | | | Luxoft Holding, Inc.* | | | 1,532,342 | |
| | 149,283 | | | Manhattan Associates, Inc.* | | | 9,878,056 | |
| | 104,125 | | | Marketo, Inc.* | | | 2,989,429 | |
| | 155,842 | | | MAXIMUS, Inc. | | | 8,766,112 | |
The accompanying notes are an integral part of these financial statements.
|
| Hartford SmallCap Growth HLS Fund |
Schedule of Investments – (continued)
December 31, 2015
| | | | | | | | |
Shares or Principal Amount | | Market Value† | |
| COMMON STOCKS - 96.1% - (continued) | |
| | | | Software & Services - 17.8% - (continued) | | | |
| | 47,041 | | | NeuStar, Inc. Class A* | | $ | 1,127,573 | |
| | 16,200 | | | NIC, Inc. | | | 318,816 | |
| | 137,489 | | | Paycom Software, Inc.* | | | 5,173,711 | |
| | 13,225 | | | Pegasystems, Inc. | | | 363,688 | |
| | 6,210 | | | Proofpoint, Inc.* | | | 403,712 | |
| | 132,772 | | | PTC, Inc.* | | | 4,597,894 | |
| | 93,870 | | | Q2 Holdings, Inc.* | | | 2,475,352 | |
| | 2,416 | | | Qualys, Inc.* | | | 79,945 | |
| | 16,380 | | | Stamps.com, Inc.* | | | 1,795,412 | |
| | 58,314 | | | Sykes Enterprises, Inc.* | | | 1,794,905 | |
| | 12,381 | | | Take-Two Interactive Software, Inc.* | | | 431,354 | |
| | 151,890 | | | Textura Corp.* | | | 3,277,786 | |
| | 70,719 | | | Tyler Technologies, Inc.* | | | 12,327,736 | |
| | 198,520 | | | Verint Systems, Inc.* | | | 8,051,971 | |
| | 78,296 | | | Web.com Group, Inc.* | | | 1,566,703 | |
| | 134,512 | | | WebMD Health Corp.* | | | 6,496,930 | |
| | 71,990 | | | WEX, Inc.* | | | 6,363,916 | |
| | 76,239 | | | Wix.com Ltd.* | | | 1,734,437 | |
| | | | | | | | |
| | | | | | | 200,072,011 | |
| | | | | | | | |
| | | | Technology Hardware & Equipment - 3.6% | |
| | 20,400 | | | Alliance Fiber Optic Products, Inc. | | | 309,264 | |
| | 125,194 | | | CDW Corp. of Delaware | | | 5,263,156 | |
| | 316,593 | | | Ciena Corp.* | | | 6,550,309 | |
| | 24,308 | | | DTS, Inc.* | | | 548,875 | |
| | 59,098 | | | ePlus, Inc.* | | | 5,511,479 | |
| | 71,567 | | | FEI Co. | | | 5,710,331 | |
| | 33,700 | | | Infinera Corp.* | | | 610,644 | |
| | 18,309 | | | InterDigital, Inc. | | | 897,873 | |
| | 58,676 | | | Ixia* | | | 729,343 | |
| | 240,866 | | | NetScout Systems, Inc.* | | | 7,394,586 | |
| | 6,693 | | | Plantronics, Inc. | | | 317,382 | |
| | 84,660 | | | Rogers Corp.* | | | 4,365,916 | |
| | 35,755 | | | Ubiquiti Networks, Inc.* | | | 1,133,076 | |
| | 18,600 | | | Universal Display Corp.* | | | 1,012,584 | |
| | | | | | | | |
| | | | | | | 40,354,818 | |
| | | | | | | | |
| | | | Telecommunication Services - 0.5% | | | |
| | 168,300 | | | Cincinnati Bell, Inc.* | | | 605,880 | |
| | 36,800 | | | IDT Corp. Class B | | | 429,088 | |
| | 58,459 | | | Inteliquent, Inc. | | | 1,038,816 | |
| | 560,156 | | | Vonage Holdings Corp.* | | | 3,215,296 | |
| | | | | | | | |
| | | | | | | 5,289,080 | |
| | | | | | | | |
| | | | Transportation - 1.3% | | | |
| | 7,425 | | | Alaska Air Group, Inc. | | | 597,787 | |
| | 11,683 | | | Allegiant Travel Co. | | | 1,960,758 | |
| | 202,222 | | | Celadon Group, Inc. | | | 1,999,975 | |
| | 54,900 | | | Hawaiian Holdings, Inc.* | | | 1,939,617 | |
| | 21,200 | | | JetBlue Airways Corp.* | | | 480,180 | |
| | 85,300 | | | Knight Transportation, Inc. | | | 2,066,819 | |
| | 147,512 | | | Marten Transport Ltd. | | | 2,610,962 | |
| | 174,593 | | | Swift Transportation Co.* | | | 2,412,875 | |
| | 15,581 | | | Werner Enterprises, Inc. | | | 364,440 | |
| | | | | | | | |
| | | | | | | 14,433,413 | |
| | | | | | | | |
| | |
| | | | Total Common Stocks
(cost $1,071,975,306) | | $ | 1,080,148,102 | |
| | | | | | | | |
| | | | | | | | |
Shares or Principal Amount | | Market Value† | |
| WARRANTS - 0.0% | |
| | | | Diversified Financials - 0.0% | | | |
| | 891 | | | Imperial Holdings, Inc.,
Expires 4/11/19*(1)(2) | | $ | — | |
| | | | | | | | |
| | |
| | | | Total Warrants
(cost $—) | | $ | — | |
| | | | | | | | |
|
| EXCHANGE TRADED FUNDS - 3.1% | |
| | | | Other Investment Pools & Funds - 3.1% | |
| | 249,300 | | | iShares Russell 2000 Growth ETF | | $ | 34,754,913 | |
| | | | | | | | |
| | |
| | | | Total Exchange Traded Funds
(cost $35,868,536) | | $ | 34,754,913 | |
| | | | | | | | |
| | |
| | | | Total Long-Term Investments
(cost $1,107,843,842) | | $ | 1,114,903,015 | |
| | | | | | | | |
|
| SHORT-TERM INVESTMENTS - 1.1% | |
| | | | Other Investment Pools & Funds - 1.1% | |
| | 12,355,247 | | | Federated Prime Obligations Fund | | $ | 12,355,247 | |
| | | | | | | | |
| | |
| | | | Total Short-Term Investments
(cost $12,355,247) | | $ | 12,355,247 | |
| | | | | | | | |
| | | | | | | | | | |
| | | |
| | Total Investments
(cost $1,120,199,089)^ | | | 100.3 | % | | $ | 1,127,258,262 | |
| | Other Assets and Liabilities | | | (0.3 | )% | | | (3,895,840 | ) |
| | | | | | | | | | |
| | Total Net Assets | | | 100.0 | % | | $ | 1,123,362,422 | |
| | | | | | | | | | |
The accompanying notes are an integral part of these financial statements.
|
| Hartford SmallCap Growth HLS Fund |
Schedule of Investments – (continued)
December 31, 2015
| Note: | Percentage of investments as shown is the ratio of the total market value to total net assets. |
| | Other than the industry classifications “Other Investment Pools & Funds,” equity industry classifications used in this report are the Global Industry Classification Standard, which was developed by and is the exclusive property and service mark of MSCI, Inc. and Standard & Poor’s. |
| | For Fund compliance purposes, the Fund may not use the same classification system shown in this report as these classifications are used for financial reporting purposes. |
| ^ | At December 31, 2015, the cost of securities for federal income tax purposes was $1,125,392,547 and the aggregate gross unrealized appreciation and depreciation based on that cost were: |
| | | | |
Unrealized Appreciation | | $ | 105,418,247 | |
Unrealized Depreciation | | | (103,552,532) | |
| | | | |
Net Unrealized Appreciation | | $ | 1,865,715 | |
| | | | |
| (1) | This security is valued in good faith at fair value as determined under policies and procedures established by and under the supervision of the Board of Directors. At December 31, 2015, the aggregate fair value of this security was $0, which represents 0.0% of total net assets. This amount excludes securities that are principally traded in certain foreign markets and whose prices are adjusted pursuant to a third party pricing service methodology approved by the Board of Directors. |
| (2) | The following security is considered illiquid. Illiquid securities are often purchased in private placement transactions, are often not registered under the Securities Act of 1933, as amended, and may have contractual restrictions on resale. A security may also be considered illiquid if the security lacks a readily available market or if its valuation has not changed for a certain period of time. |
| | | | | | | | | | |
Period
Acquired | | Shares/Par | | | Security | | Cost | |
12/2014 | | | 891 | | | Imperial Holdings, Inc., Warrants | | $ | — | |
| | At December 31, 2015, the aggregate value of this security was $0, which represents 0.0% of total net assets. |
| † | See Significant Accounting Policies of accompanying Notes to Financial Statements regarding valuation of investments. |
| | |
| GLOSSARY: (abbreviations used in preceding Schedule of Investments) |
|
| Other Abbreviations: |
ETF | | Exchange Traded Fund |
REIT | | Real Estate Investment Trust |
The accompanying notes are an integral part of these financial statements.
|
| Hartford SmallCap Growth HLS Fund |
Schedule of Investments – (continued)
December 31, 2015
Fair Valuation Summary
The following is a summary of the fair valuations according to the inputs used as of December 31, 2015 in valuing the Fund’s investments.
| | | | | | | | | | | | | | | | |
| | | Total | | | Level 1(1) | | | Level 2(1) | | | Level 3 | |
Assets | | | | | | | | | | | | | | | | |
Common Stocks | | | | | | | | | | | | | | | | |
Automobiles & Components | | $ | 10,497,896 | | | $ | 10,497,896 | | | $ | — | | | $ | — | |
Banks | | | 39,257,475 | | | | 39,257,475 | | | | — | | | | — | |
Capital Goods | | | 77,212,676 | | | | 77,212,676 | | | | — | | | | — | |
Commercial & Professional Services | | | 42,329,929 | | | | 42,329,929 | | | | — | | | | — | |
Consumer Durables & Apparel | | | 50,989,471 | | | | 50,989,471 | | | | — | | | | — | |
Consumer Services | | | 57,762,567 | | | | 57,762,567 | | | | — | | | | — | |
Diversified Financials | | | 19,724,285 | | | | 19,724,285 | | | | — | | | | — | |
Energy | | | 13,319,159 | | | | 13,319,159 | | | | — | | | | — | |
Food & Staples Retailing | | | 26,707,571 | | | | 26,707,571 | | | | — | | | | — | |
Food, Beverage & Tobacco | | | 21,502,172 | | | | 21,502,172 | | | | — | | | | — | |
Health Care Equipment & Services | | | 114,558,099 | | | | 114,558,099 | | | | — | | | | — | |
Household & Personal Products | | | 1,498,758 | | | | 1,498,758 | | | | — | | | | — | |
Insurance | | | 18,361,329 | | | | 18,361,329 | | | | — | | | | — | |
Materials | | | 47,752,848 | | | | 47,752,848 | | | | — | | | | — | |
Media | | | 1,488,161 | | | | 1,488,161 | | | | — | | | | — | |
Pharmaceuticals, Biotechnology & Life Sciences | | | 177,820,650 | | | | 177,820,650 | | | | — | | | | — | |
Real Estate | | | 17,292,470 | | | | 17,292,470 | | | | — | | | | — | |
Retailing | | | 54,328,113 | | | | 54,328,113 | | | | — | | | | — | |
Semiconductors & Semiconductor Equipment | | | 27,595,151 | | | | 27,595,151 | | | | — | | | | — | |
Software & Services | | | 200,072,011 | | | | 200,072,011 | | | | — | | | | — | |
Technology Hardware & Equipment | | | 40,354,818 | | | | 40,354,818 | | | | — | | | | — | |
Telecommunication Services | | | 5,289,080 | | | | 5,289,080 | | | | — | | | | — | |
Transportation | | | 14,433,413 | | | | 14,433,413 | | | | — | | | | — | |
Warrants | | | — | | | | — | | | | — | | | | — | |
Exchange Traded Funds | | | 34,754,913 | | | | 34,754,913 | | | | — | | | | — | |
Short-Term Investments | | | 12,355,247 | | | | 12,355,247 | | | | — | | | | — | |
| | | | | | | | | | | | | | | | |
Total | | $ | 1,127,258,262 | | | $ | 1,127,258,262 | | | $ | — | | | $ | — | |
| | | | | | | | | | | | | | | | |
| (1) | For the year ended December 31, 2015, there were no transfers between Level 1 and Level 2. |
The following is a rollforward of the Fund’s investments that were valued using unobservable inputs (Level 3) for the year ended December 31, 2015:
| | | | | | | | |
| | | Warrants | | | Total | |
Beginning balance | | $ | — | | | $ | — | |
Purchases | | | — | | | | — | |
Sales | | | — | | | | — | |
Accrued discounts/(premiums) | | | — | | | | — | |
Total realized gain/(loss) | | | — | | | | — | |
Net change in unrealized appreciation/depreciation | | | — | | | | — | |
Transfers into Level 3(1) | | | — | | | | — | |
Transfers out of Level 3(1) | | | — | | | | — | |
| | | | | | | | |
Ending balance | | $ | — | | | $ | — | |
| | | | | | | | |
The change in net unrealized appreciation/depreciation relating to the Level 3 investments held at December 31, 2015 was $-.
| (1) | Investments are transferred into and out of Level 3 for a variety of reasons including, but not limited to: |
| | a) | Investments where trading has been halted (transfer into Level 3) or investments where trading has resumed (transfer out of Level 3). |
| | b) | Broker quoted investments (transfer into Level 3) or quoted prices in active markets (transfer out of Level 3). |
| | c) | Investments that have certain restrictions on trading (transfer into Level 3) or investments where trading restrictions have expired (transfer out of Level 3). |
| Note: | For purposes of reporting transfers between different hierarchy levels, both transfers in and out of each level, as applicable, are shown as if they occurred at the beginning of the period. |
The accompanying notes are an integral part of these financial statements.
Schedule of Investments
December 31, 2015
| | | | | | | | |
Shares or Principal Amount | | Market Value† | |
| COMMON STOCKS - 98.0% | |
| | | | Banks - 4.0% | |
| | 326,964 | | | PNC Financial Services Group, Inc. | | $ | 31,162,939 | |
| | 562,781 | | | Wells Fargo & Co. | | | 30,592,775 | |
| | | | | | | | |
| | | | | | | 61,755,714 | |
| | | | | | | | |
| | | | Capital Goods - 10.4% | | | |
| | 132,506 | | | General Dynamics Corp. | | | 18,201,024 | |
| | 417,278 | | | Honeywell International, Inc. | | | 43,217,482 | |
| | 171,745 | | | Lockheed Martin Corp. | | | 37,294,427 | |
| | 124,444 | | | Northrop Grumman Corp. | | | 23,496,272 | |
| | 398,060 | | | United Technologies Corp. | | | 38,241,624 | |
| | | | | | | | |
| | | | | | | 160,450,829 | |
| | | | | | | | |
| | | | Consumer Durables & Apparel - 2.4% | | | |
| | 581,895 | | | NIKE, Inc. Class B | | | 36,368,438 | |
| | | | | | | | |
| | | | Consumer Services - 2.6% | | | |
| | 340,289 | | | McDonald’s Corp. | | | 40,201,742 | |
| | | | | | | | |
| | | | Diversified Financials - 3.2% | | | |
| | 320,549 | | | American Express Co. | | | 22,294,183 | |
| | 77,741 | | | BlackRock, Inc. | | | 26,472,365 | |
| | | | | | | | |
| | | | | | | 48,766,548 | |
| | | | | | | | |
| | | | Energy - 6.8% | | | |
| | 429,359 | | | Chevron Corp. | | | 38,625,136 | |
| | 442,941 | | | Exxon Mobil Corp. | | | 34,527,251 | |
| | 452,552 | | | Schlumberger Ltd. | | | 31,565,502 | |
| | | | | | | | |
| | | | | | | 104,717,889 | |
| | | | | | | | |
| | | | Food & Staples Retailing - 6.7% | | | |
| | 239,770 | | | Costco Wholesale Corp. | | | 38,722,855 | |
| | 337,242 | | | CVS Health Corp. | | | 32,972,150 | |
| | 375,142 | | | Walgreens Boots Alliance, Inc. | | | 31,945,217 | |
| | | | | | | | |
| | | | | | | 103,640,222 | |
| | | | | | | | |
| | | | Food, Beverage & Tobacco - 5.2% | | | |
| | 123,071 | | | Anheuser-Busch InBev N.V. | | | 15,315,833 | |
| | 896,867 | | | Coca-Cola Co. | | | 38,529,406 | |
| | 972,346 | | | Diageo plc | | | 26,552,570 | |
| | | | | | | | |
| | | | | | | 80,397,809 | |
| | | | | | | | |
| | | | Health Care Equipment & Services - 7.5% | | | |
| | 448,227 | | | Cardinal Health, Inc. | | | 40,013,224 | |
| | 467,308 | | | Medtronic plc | | | 35,945,332 | |
| | 343,566 | | | UnitedHealth Group, Inc. | | | 40,417,104 | |
| | | | | | | | |
| | | | | | | 116,375,660 | |
| | | | | | | | |
| | | | Household & Personal Products - 4.3% | | | |
| | 645,162 | | | Colgate-Palmolive Co. | | | 42,980,692 | |
| | 303,666 | | | Procter & Gamble Co. | | | 24,114,117 | |
| | | | | | | | |
| | | | | | | 67,094,809 | |
| | | | | | | | |
| | | | Insurance - 6.4% | | | |
| | 374,257 | | | ACE Ltd. | | | 43,731,931 | |
| | 121,252 | | | Chubb Corp. | | | 16,082,865 | |
| | 703,405 | | | Marsh & McLennan Cos., Inc. | | | 39,003,807 | |
| | | | | | | | |
| | | | | | | 98,818,603 | |
| | | | | | | | |
| | | | Materials - 4.0% | | | |
| | 227,856 | | | Ecolab, Inc. | | | 26,062,169 | |
| | 341,034 | | | Praxair, Inc. | | | 34,921,882 | |
| | | | | | | | |
| | | | | | | 60,984,051 | |
| | | | | | | | |
| | | | | | | | |
Shares or Principal Amount | | Market Value† | |
| COMMON STOCKS - 98.0% - (continued) | |
| | | | Media - 1.3% | | | |
| | 197,819 | | | Walt Disney Co. | | $ | 20,786,821 | |
| | | | | | | | |
| | | | Pharmaceuticals, Biotechnology & Life
Sciences - 8.9% | |
| | 167,229 | | | Amgen, Inc. | | | 27,146,284 | |
| | 381,229 | | | Johnson & Johnson | | | 39,159,843 | |
| | 712,403 | | | Merck & Co., Inc. | | | 37,629,126 | |
| | 119,719 | | | Roche Holding AG | | | 33,175,139 | |
| | | | | | | | |
| | | | | | | 137,110,392 | |
| | | | | | | | |
| | | | Real Estate - 1.8% | | | |
| | 111,190 | | | Public Storage REIT | | | 27,541,763 | |
| | | | | | | | |
| | | | Retailing - 5.1% | |
| | 9,440,100 | | | Allstar Co.*(1)(2) | | | 8,968,095 | |
| | 351,748 | | | Lowe’s Cos., Inc. | | | 26,746,918 | |
| | 606,508 | | | TJX Cos., Inc. | | | 43,007,482 | |
| | | | | | | | |
| | | | | | | 78,722,495 | |
| | | | | | | | |
| | | | Software & Services - 10.3% | | | |
| | 364,219 | | | Accenture plc Class A | | | 38,060,886 | |
| | 448,025 | | | Automatic Data Processing, Inc. | | | 37,956,678 | |
| | 860,201 | | | Microsoft Corp. | | | 47,723,951 | |
| | 985,509 | | | Oracle Corp. | | | 36,000,644 | |
| | | | | | | | |
| | | | | | | 159,742,159 | |
| | | | | | | | |
| | | | Transportation - 7.1% | | | |
| | 610,760 | | | Canadian National Railway Co. | | | 34,142,000 | |
| | 366,871 | | | Union Pacific Corp. | | | 28,689,313 | |
| | 478,055 | | | United Parcel Service, Inc. Class B | | | 46,003,233 | |
| | | | | | | | |
| | | | | | | 108,834,546 | |
| | | | | | | | |
| | |
| | | | Total Common Stocks
(cost $1,220,999,833) | | $ | 1,512,310,490 | |
| | | | | | | | |
| | |
| | | | Total Long-Term Investments
(cost $1,220,999,833) | | $ | 1,512,310,490 | |
| | | | | | | | |
|
| SHORT-TERM INVESTMENTS - 0.9% | |
| | | | Other Investment Pools & Funds - 0.9% | |
| | 14,468,534 | | | Fidelity Money Market Class 1 | | $ | 14,468,534 | |
| | | | | | | | |
| | |
| | | | Total Short-Term Investments
(cost $14,468,534) | | $ | 14,468,534 | |
| | | | | | | | |
| | | | | | | | | | |
| | | |
| | Total Investments
(cost $1,235,468,367)^ | | | 98.9 | % | | $ | 1,526,779,024 | |
| | Other Assets and Liabilities | | | 1.1 | % | | | 17,053,899 | |
| | | | | | | | | | |
| | Total Net Assets | | | 100.0 | % | | $ | 1,543,832,923 | |
| | | | | | | | | | |
The accompanying notes are an integral part of these financial statements.
Schedule of Investments – (continued)
December 31, 2015
| Note: | Percentage of investments as shown is the ratio of the total market value to total net assets. |
| | Prices of foreign equities that are principally traded on certain foreign markets may be adjusted daily pursuant to a fair value pricing service approved by the Board of Directors in order to reflect an adjustment for factors occurring after the close of certain foreign markets but before the close of the New York Stock Exchange. |
| | Equity industry classifications used in this report are the Global Industry Classification Standard, which was developed by and is the exclusive property and service mark of MSCI, Inc. and Standard & Poor’s. |
| | For Fund compliance purposes, the Fund may not use the same classification system shown in this report as these classifications are used for financial reporting purposes. |
| ^ | At December 31, 2015, the cost of securities for federal income tax purposes was $1,237,482,391 and the aggregate gross unrealized appreciation and depreciation based on that cost were: |
| | | | |
Unrealized Appreciation | | $ | 330,414,478 | |
Unrealized Depreciation | | | (41,117,845 | ) |
| | | | |
Net Unrealized Appreciation | | $ | 289,296,633 | |
| | | | |
| (1) | This security is valued in good faith at fair value as determined under policies and procedures established by and under the supervision of the Board of Directors. At December 31, 2015, the aggregate fair value of this security was $8,968,095, which represents 0.6% of total net assets. This amount excludes securities that are principally traded in certain foreign markets and whose prices are adjusted pursuant to a third party pricing service methodology approved by the Board of Directors. |
| (2) | The following security is considered illiquid. Illiquid securities are often purchased in private placement transactions, are often not registered under the Securities Act of 1933, as amended, and may have contractual restrictions on resale. A security may also be considered illiquid if the security lacks a readily available market or if its valuation has not changed for a certain period of time. |
| | | | | | | | | | |
Period
Acquired | | Shares/Par | | | Security | | Cost | |
| 08/2011 | | | 9,440,100 | | | Allstar Co. | | $ | 4,106,619 | |
| | At December 31, 2015, the aggregate value of this security was $8,968,095, which represents 0.6% of total net assets. |
| † | See Significant Accounting Policies of accompanying Notes to Financial Statements regarding valuation of investments. |
| | |
| GLOSSARY: (abbreviations used in preceding Schedule of Investments) |
|
| Other Abbreviations: |
REIT | | Real Estate Investment Trust |
The accompanying notes are an integral part of these financial statements.
Schedule of Investments – (continued)
December 31, 2015
Fair Valuation Summary
The following is a summary of the fair valuations according to the inputs used as of December 31, 2015 in valuing the Fund’s investments.
| | | | | | | | | | | | | | | | |
| | | Total | | | Level 1(1) | | | Level 2(1) | | | Level 3 | |
Assets | | | | | | | | | | | | | | | | |
Common Stocks | | | | | | | | | | | | | | | | |
Banks | | $ | 61,755,714 | | | $ | 61,755,714 | | | $ | — | | | $ | — | |
Capital Goods | | | 160,450,829 | | | | 160,450,829 | | | | — | | | | — | |
Consumer Durables & Apparel | | | 36,368,438 | | | | 36,368,438 | | | | — | | | | — | |
Consumer Services | | | 40,201,742 | | | | 40,201,742 | | | | — | | | | — | |
Diversified Financials | | | 48,766,548 | | | | 48,766,548 | | | | — | | | | — | |
Energy | | | 104,717,889 | | | | 104,717,889 | | | | — | | | | — | |
Food & Staples Retailing | | | 103,640,222 | | | | 103,640,222 | | | | — | | | | — | |
Food, Beverage & Tobacco | | | 80,397,809 | | | | 38,529,406 | | | | 41,868,403 | | | | — | |
Health Care Equipment & Services | | | 116,375,660 | | | | 116,375,660 | | | | — | | | | — | |
Household & Personal Products | | | 67,094,809 | | | | 67,094,809 | | | | — | | | | — | |
Insurance | | | 98,818,603 | | | | 98,818,603 | | | | — | | | | — | |
Materials | | | 60,984,051 | | | | 60,984,051 | | | | — | | | | — | |
Media | | | 20,786,821 | | | | 20,786,821 | | | | — | | | | — | |
Pharmaceuticals, Biotechnology & Life Sciences | | | 137,110,392 | | | | 103,935,253 | | | | 33,175,139 | | | | — | |
Real Estate | | | 27,541,763 | | | | 27,541,763 | | | | — | | | | — | |
Retailing | | | 78,722,495 | | | | 69,754,400 | | | | — | | | | 8,968,095 | |
Software & Services | | | 159,742,159 | | | | 159,742,159 | | | | — | | | | — | |
Transportation | | | 108,834,546 | | | | 108,834,546 | | | | — | | | | — | |
Short-Term Investments | | | 14,468,534 | | | | 14,468,534 | | | | — | | | | — | |
| | | | | | | | | | | | | | | | |
Total | | $ | 1,526,779,024 | | | $ | 1,442,767,387 | | | $ | 75,043,542 | | | $ | 8,968,095 | |
| | | | | | | | | | | | | | | | |
| (1) | For the year ended December 31, 2015, there were no transfers between Level 1 and Level 2. |
| The | following is a rollforward of the Fund’s investments that were valued using unobservable inputs (Level 3) for the year ended December 31, 2015: |
| | | | | | | | |
| | | Common
Stocks | | | Total | |
Beginning balance | | $ | 9,754,455 | | | $ | 9,754,455 | |
Purchases | | | — | | | | — | |
Sales | | | — | | | | — | |
Accrued discounts/(premiums) | | | — | | | | — | |
Total realized gain/(loss) | | | — | | | | — | |
Net change in unrealized appreciation/depreciation | | | (786,360 | ) | | | (786,360 | ) |
Transfers into Level 3(1) | | | — | | | | — | |
Transfers out of Level 3(1) | | | — | | | | — | |
| | | | | | | | |
Ending balance | | $ | 8,968,095 | | | $ | 8,968,095 | |
| | | | | | | | |
The change in net unrealized appreciation/depreciation relating to the Level 3 investments held at December 31, 2015 was $(786,360).
| (1) | Investments are transferred into and out of Level 3 for a variety of reasons including, but not limited to: |
| | a) | Investments where trading has been halted (transfer into Level 3) or investments where trading has resumed (transfer out of Level 3). |
| | b) | Broker quoted investments (transfer into Level 3) or quoted prices in active markets (transfer out of Level 3). |
| | c) | Investments that have certain restrictions on trading (transfer into Level 3) or investments where trading restrictions have expired (transfer out of Level 3). |
| Note: | For purposes of reporting transfers between different hierarchy levels, both transfers in and out of each level, as applicable, are shown as if they occurred at the beginning of the period. |
The accompanying notes are an integral part of these financial statements.
|
| Hartford Total Return Bond HLS Fund |
Schedule of Investments
December 31, 2015
| | | | | | | | | | | | |
Shares or Principal Amount | | Market Value† | |
ASSET & COMMERCIAL MORTGAGE BACKED
SECURITIES - 33.6% | |
| | | | | | | Asset-Backed-Automobile - 1.4% | |
| | $ | | | | 3,800,000 | | | AmeriCredit Automobile Receivables Trust
2.72%, 09/09/2019 | | $ | 3,825,914 | |
| | | | | 129,587 | | | CPS Automotive Trust
5.01%, 06/17/2019(1) | | | 130,397 | |
| | | | | 8,005,000 | | | Credit Acceptance Automotive Loan Trust
1.88%, 03/15/2022(1) | | | 7,967,358 | |
| | | | | | | | First Investors Automotive Owner Trust | | | | |
| | | | | 6,495,000 | | | 1.67%, 11/16/2020(1) | | | 6,454,623 | |
| | | | | 1,295,000 | | | 1.81%, 10/15/2018(1) | | | 1,295,092 | |
| | | | | 1,750,000 | | | 2.39%, 11/16/2020(1) | | | 1,741,964 | |
| | | | | 1,260,000 | | | GM Financial Automobile Leasing Trust
1.96%, 03/20/2018(1) | | | 1,255,141 | |
| | | | | | | | Santander Drive Automotive Receivables Trust | | | | |
| | | | | 1,920,000 | | | 1.82%, 05/15/2019 | | | 1,921,721 | |
| | | | | 1,385,000 | | | 2.25%, 06/17/2019 | | | 1,389,943 | |
| | | | | 4,500,000 | | | 2.36%, 04/15/2020 | | | 4,507,030 | |
| | | | | 8,275,000 | | | Westlake Automobile Receivables Trust
1.58%, 04/15/2020(1) | | | 8,259,139 | |
| | | | | | | | | | | | |
| | | | | | | | | | | 38,748,322 | |
| | | | | | | | | | | | |
| | | | | | | Asset-Backed-Finance & Insurance - 14.0% | |
| | | | | 9,180,000 | | | American Money Management Corp.
1.77%, 07/27/2026(1)(2) | | | 9,079,020 | |
| | | | | | | | Apidos CLO | |
| | | | | 6,015,000 | | | 1.77%, 01/19/2025(1)(2) | | | 5,957,256 | |
| | | | | 2,555,000 | | | 2.17%, 07/15/2023(1)(2) | | | 2,505,689 | |
| | | | | 10,350,000 | | | Ares CLO Ltd.
1.84%, 04/17/2026(1)(2) | | | 10,277,550 | |
| | | | | | | | Atlas Senior Loan Fund Ltd. | |
| | | | | 7,610,000 | | | 1.86%, 10/15/2026(1)(2) | | | 7,543,793 | |
| | | | | 4,200,000 | | | 1.87%, 07/16/2026(1)(2) | | | 4,153,380 | |
| | | | | | | | Atrium CDO Corp. | |
| | | | | 790,000 | | | 1.44%, 07/16/2025(1)(2) | | | 773,726 | |
| | | | | 3,535,000 | | | 2.07%, 11/16/2022(1)(2) | | | 3,477,026 | |
| | | | | 10,050,000 | | | Avery Point IV CLO Ltd.
1.84%, 04/25/2026(1)(2) | | | 9,970,605 | |
| | | | | 2,330,000 | | | Babson CLO Ltd.
1.81%, 07/20/2025(1)(2) | | | 2,307,399 | |
| | | | | 1,397,417 | | | Cal Funding II Ltd.
3.47%, 10/25/2027(1) | | | 1,376,200 | |
| | | | | 7,890,000 | | | Carlyle Global Market Strategies Ltd.
1.79%, 04/27/2027(1)(2) | | | 7,815,045 | |
| | | | | | | | Cent CLO Ltd. | |
| | | | | 9,345,000 | | | 1.80%, 01/25/2026(1)(2) | | | 9,199,218 | |
| | | | | 8,090,000 | | | 1.81%, 04/17/2026(1)(2) | | | 7,987,257 | |
| | | | | 6,305,000 | | | 1.81%, 07/27/2026(1)(2) | | | 6,237,537 | |
| | | | | 3,115,000 | | | 2.37%, 04/17/2026(1)(2) | | | 3,030,895 | |
| | | | | | | | CIFC Funding Ltd. | |
| | | | | 8,965,000 | | | 1.86%, 05/24/2026(1)(2) | | | 8,875,350 | |
| | | | | 7,240,000 | | | 2.41%, 08/14/2024(1)(2) | | | 7,167,600 | |
| | | | | 1,254,475 | | | Consumer Credit Origination Loan Trust
2.82%, 03/15/2021(1) | | | 1,254,285 | |
| | | | | | | | Dryden Senior Loan Fund | |
| | | | | 10,915,000 | | | 1.67%, 04/18/2026(1)(2) | | | 10,779,654 | |
| | | | | 6,710,000 | | | 1.75%, 07/15/2027(1)(2) | | | 6,621,428 | |
| | | | | 10,870,000 | | | 1.80%, 07/15/2026(1)(2) | | | 10,803,693 | |
| | | | | 1,735,429 | | | Fieldstone Mortgage Investment Corp.
0.69%, 05/25/2036(2) | | | 1,151,436 | |
| | | | | | | | | | | | |
Shares or Principal Amount | | Market Value† | |
| ASSET & COMMERCIAL MORTGAGE BACKED SECURITIES - 33.6% - (continued) | |
| | | | | | | Asset-Backed-Finance & Insurance - 14.0% - (continued) | |
| | $ | | | | 3,267,261 | | | First Franklin Mortgage Loan Trust
0.66%, 04/25/2036(2) | | $ | 2,094,899 | |
| | | | | 2,210,000 | | | Flatiron CLO Ltd.
2.22%, 07/17/2026(1)(2) | | | 2,168,894 | |
| | | | | 3,795,000 | | | Green Tree Agency Advance Funding Trust
3.10%, 10/15/2048(1) | | | 3,754,545 | |
| | | | | 4,421,123 | | | GSAMP Trust
0.51%, 01/25/2037(2) | | | 2,637,351 | |
| | | | | 4,965,000 | | | Highbridge Loan Management Ltd.
1.78%, 05/05/2027(1)(2) | | | 4,891,518 | |
| | | | | 3,335,000 | | | ING Investment Management CLO Ltd.
2.19%, 03/14/2022(1)(2) | | | 3,296,314 | |
| | | | | 1,345,000 | | | LCM Ltd.
2.22%, 04/15/2022(1)(2) | | | 1,330,474 | |
| | | | | 11,335,000 | | | Limerock CLO
1.82%, 04/18/2026(1)(2) | | | 11,239,786 | |
| | | | | | | | Madison Park Funding Ltd. | |
| | | | | 7,200,000 | | | 1.60%, 10/23/2025(1)(2) | | | 7,104,960 | |
| | | | | 6,520,000 | | | 1.77%, 01/19/2025(1)(2) | | | 6,448,932 | |
| | | | | 9,860,000 | | | 1.82%, 07/20/2026(1)(2) | | | 9,796,896 | |
| | | | | | | | Magnetite CLO Ltd. | | | | |
| | | | | 8,310,000 | | | 1.74%, 07/25/2026(1)(2) | | | 8,216,928 | |
| | | | | 6,540,000 | | | 1.80%, 04/15/2026(1)(2) | | | 6,497,490 | |
| | | | | 5,835,000 | | | 1.82%, 04/15/2027(1)(2) | | | 5,769,648 | |
| | | | | 6,695,000 | | | 2.27%, 07/25/2026(1)(2) | | | 6,567,795 | |
| | | | | 6,100,000 | | | 4.82%, 01/15/2025(1)(2) | | | 6,048,150 | |
| | | | | | | | Neuberger Berman CLO Ltd. | |
| | | | | 8,335,000 | | | 1.79%, 04/15/2026(1)(2) | | | 8,266,653 | |
| | | | | 8,265,000 | | | 1.80%, 08/04/2025(1)(2) | | | 8,189,788 | |
| | | | | 7,885,000 | | | Oaktree EIF II Ltd.
1.91%, 02/15/2026(1)(2) | | | 7,825,862 | |
| | | | | 6,780,000 | | | OCP CLO Ltd.
1.85%, 04/17/2027(1)(2) | | | 6,714,234 | |
| | | | | 6,165,000 | | | Ocwen Master Advance Receivables Trust
2.54%, 09/17/2046(1) | | | 6,159,610 | |
| | | | | 3,030,000 | | | OHA Credit Partners Ltd.
1.79%, 07/20/2026(1)(2) | | | 2,996,064 | |
| | | | | 9,445,000 | | | OHA Loan Funding Ltd.
1.86%, 02/15/2027(1)(2) | | | 9,373,218 | |
| | | | | | | | OZLM Funding Ltd. | | | | |
| | | | | 7,495,000 | | | 1.77%, 04/30/2027(1)(2) | | | 7,387,072 | |
| | | | | 10,530,000 | | | 1.87%, 04/17/2026(1)(2) | | | 10,464,714 | |
| | | | | 9,700,000 | | | Race Point CLO Ltd.
1.83%, 04/15/2027(1)(2) | | | 9,563,230 | |
| | | | | 5,250,000 | | | SBA Tower Trust
2.90%, 10/15/2044(1) | | | 5,130,346 | |
| | | | | 529,360 | | | Securitized Asset Backed Receivables LLC
0.51%, 07/25/2036(2) | | | 255,083 | |
| | | | | 7,325,000 | | | Shackleton CLO Ltd.
1.80%, 07/17/2026(1)(2) | | | 7,261,273 | |
| | | | | | | | Sound Point CLO Ltd. | | | | |
| | | | | 6,354,000 | | | 1.69%, 01/21/2026(1)(2) | | | 6,273,304 | |
| | | | | 7,680,000 | | | 1.85%, 04/15/2027(1)(2) | | | 7,610,112 | |
| | | | | 2,137,000 | | | 4.92%, 07/15/2025(1)(2) | | | 1,817,091 | |
| | | | | 5,144,206 | | | SpringCastle America Funding LLC
2.70%, 05/25/2023(1) | | | 5,132,843 | |
| | | | | 7,805,000 | | | Springleaf Funding Trust
2.41%, 12/15/2022(1) | | | 7,782,830 | |
The accompanying notes are an integral part of these financial statements.
|
| Hartford Total Return Bond HLS Fund |
Schedule of Investments – (continued)
December 31, 2015
| | | | | | | | | | | | |
Shares or Principal Amount | | Market Value† | |
| ASSET & COMMERCIAL MORTGAGE BACKED SECURITIES - 33.6% - (continued) | |
| | | | | | | Asset-Backed-Finance & Insurance - 14.0% - (continued) | |
| | $ | | | | 8,660,000 | | | Symphony CLO Ltd.
1.80%, 07/14/2026(1)(2) | | $ | 8,597,648 | |
| | | | | 7,955,000 | | | Tremen Park Ltd.
1.82%, 04/20/2027(1)(2) | | | 7,896,928 | |
| | | | | 2,915,000 | | | Voya CLO Ltd.
1.77%, 07/17/2026(1)(2) | | | 2,890,223 | |
| | | | | 7,550,000 | | | 1.80%, 04/18/2027(1)(2) | | | 7,482,050 | |
| | | | | 10,895,000 | | | 1.82%, 04/18/2026(1)(2) | | | 10,791,497 | |
| | | | | 2,670,000 | | | 2.42%, 04/18/2027(1)(2) | | | 2,639,028 | |
| | | | | | | | | | | | |
| | | | | | | | | | | 384,710,323 | |
| | | | | | | | | | | | |
| | | | | | | Asset-Backed-Home Equity - 1.5% | |
| | | | | | | | GSAA Home Equity Trust | |
| | | | | 1,545,290 | | | 0.49%, 12/25/2046(2) | | | 786,946 | |
| | | | | 13,305,811 | | | 0.50%, 02/25/2037(2) | | | 6,994,685 | |
| | | | | 6,862,025 | | | 0.52%, 03/25/2037(2) | | | 3,565,029 | |
| | | | | 4,878,905 | | | 0.60%, 11/25/2036(2) | | | 2,474,757 | |
| | | | | 163,611 | | | 0.66%, 11/25/2036(2) | | | 95,724 | |
| | | | | 1,351,637 | | | 0.72%, 03/25/2036(2) | | | 923,624 | |
| | | | | 778,174 | | | 5.88%, 09/25/2036 | | | 429,011 | |
| | | | | 785,089 | | | 5.99%, 06/25/2036(2) | | | 419,571 | |
| | | | | 607,422 | | | Morgan Stanley Asset-Backed Securities Capital I Inc.,Trust
0.57%, 06/25/2036(2) | | | 516,542 | |
| | | | | 1,764,362 | | | Morgan Stanley Mortgage Loan Trust
0.59%, 11/25/2036(2) | | | 786,818 | |
| | | | | 20,275,000 | | | NRZ Advance Receivables Trust
3.30%, 08/17/2048(1) | | | 20,078,333 | |
| | | | | 438,534 | | | Renaissance Home Equity Loan Trust
5.91%, 04/25/2037 | | | 240,246 | |
| | | | | | | | Soundview Home Loan Trust | | | | |
| | | | | 3,225,000 | | | 0.60%, 07/25/2037(2) | | | 2,035,259 | |
| | | | | 1,090,000 | | | 0.67%, 11/25/2036(2) | | | 749,965 | |
| | | | | | | | | | | | |
| | | | | | | | | | | 40,096,510 | |
| | | | | | | | | | | | |
| | | | | | | Collateralized-Mortgage Obligations - 0.0% | |
| | | | | 141,328 | | | National Credit Union Administration
1.84%, 10/07/2020 | | | 141,377 | |
| | | | | | | | | | | | |
| | | | | | | Commercial Mortgage-Backed Securities - 11.6% | |
| | | | | | | | Banc of America Commercial Mortgage Trust | | | | |
| | | | | 535,000 | | | 3.71%, 09/15/2048 | | | 545,379 | |
| | | | | 3,255,255 | | | 5.49%, 02/10/2051 | | | 3,371,620 | |
| | | | | | | | Bear Stearns Commercial Mortgage Securities, Inc. | | | | |
| | | | | 1,105,000 | | | 5.18%, 10/12/2042(2) | | | 1,103,227 | |
| | | | | 2,419,730 | | | 5.33%, 02/11/2044 | | | 2,487,750 | |
| | | | | 510,000 | | | 5.62%, 04/12/2038(2) | | | 513,441 | |
| | | | | 3,465,697 | | | 5.69%, 06/11/2050(2) | | | 3,614,611 | |
| | | | | | | | Citigroup Commercial Mortgage Trust | | | | |
| | | | | 25,424,177 | | | 1.13%, 07/10/2047(2)(3) | | | 1,719,091 | |
| | | | | 27,443,157 | | | 1.18%, 04/10/2048(2)(3) | | | 2,026,024 | |
| | | | | 465,000 | | | 2.94%, 04/10/2048 | | | 448,303 | |
| | | | | 3,170,000 | | | 3.11%, 04/10/2048(1) | | | 2,215,528 | |
| | | | | 690,000 | | | 3.19%, 04/10/2048 | | | 676,496 | |
| | | | | 1,530,000 | | | 3.62%, 07/10/2047 | | | 1,561,796 | |
| | | | | 1,535,000 | | | 3.76%, 06/10/2048 | | | 1,569,130 | |
| | | | | 970,000 | | | 3.82%, 11/10/2048 | | | 988,333 | |
| | | | | 1,175,000 | | | 4.40%, 03/10/2047(1)(2) | | | 892,496 | |
| | | | | 445,000 | | | 4.90%, 03/10/2047(1)(2) | | | 385,397 | |
| | | | | | | | | | | | |
Shares or Principal Amount | | Market Value† | |
| ASSET & COMMERCIAL MORTGAGE BACKED SECURITIES - 33.6% - (continued) | |
| | | | | | | Commercial Mortgage-Backed Securities -
11.6% -
(continued) | |
| | $ | | | | 8,567,448 | | | Citigroup/Deutsche Bank Commercial Mortgage Trust
5.32%, 12/11/2049 | | $ | 8,711,667 | |
| | | | | 1,100,000 | | | Cobalt CMBS Commercial Mortgage Trust
5.25%, 08/15/2048 | | | 1,114,750 | |
| | | | | 9,109,917 | | | Commercial Mortgage Loan Trust
6.04%, 12/10/2049(2) | | | 9,391,193 | |
| | | | | | | | Commercial Mortgage Pass-Through Certificates | | | | |
| | | | | 10,026,847 | | | 1.01%, 02/10/2047(2) | | | 403,145 | |
| | | | | 970,000 | | | 2.82%, 10/15/2045 | | | 958,982 | |
| | | | | 535,000 | | | 4.24%, 02/10/2047 | | | 571,946 | |
| | | | | 1,315,000 | | | 4.75%, 10/15/2045(1)(2) | | | 1,037,088 | |
| | | | | | | | Commercial Mortgage Trust | | | | |
| | | | | 8,319,534 | | | 2.02%, 07/10/2046(1)(2)(3) | | | 603,959 | |
| | | | | 1,035,000 | | | 2.54%, 12/10/2045 | | | 1,007,014 | |
| | | | | 2,890,000 | | | 2.85%, 10/15/2045 | | | 2,864,753 | |
| | | | | 785,000 | | | 3.10%, 03/10/2046 | | | 784,716 | |
| | | | | 350,000 | | | 3.18%, 02/10/2048 | | | 343,187 | |
| | | | | 35,000 | | | 3.21%, 03/10/2046 | | | 35,200 | |
| | | | | 20,000 | | | 3.29%, 12/10/2044 | | | 20,440 | |
| | | | | 1,760,000 | | | 3.35%, 02/10/2048 | | | 1,744,067 | |
| | | | | 6,780,000 | | | 3.42%, 03/10/2031(1) | | | 6,838,404 | |
| | | | | 1,210,000 | | | 3.46%, 08/10/2055 | | | 897,023 | |
| | | | | 2,545,000 | | | 3.47%, 10/10/2048(1)(2) | | | 1,850,215 | |
| | | | | 1,900,000 | | | 3.50%, 05/10/2048 | | | 1,906,427 | |
| | | | | 2,655,000 | | | 3.53%, 12/10/2047 | | | 2,676,205 | |
| | | | | 1,260,000 | | | 3.61%, 06/10/2046(2) | | | 1,297,663 | |
| | | | | 1,795,000 | | | 3.61%, 10/10/2048 | | | 1,803,975 | |
| | | | | 705,000 | | | 3.62%, 07/10/2050 | | | 712,578 | |
| | | | | 1,860,000 | | | 3.70%, 08/10/2055 | | | 1,890,551 | |
| | | | | 450,133 | | | 3.80%, 08/10/2047 | | | 463,870 | |
| | | | | 1,140,000 | | | 3.90%, 07/10/2050 | | | 1,173,716 | |
| | | | | 3,555,000 | | | 4.02%, 07/10/2045 | | | 3,761,868 | |
| | | | | 630,000 | | | 4.07%, 02/10/2047(2) | | | 665,560 | |
| | | | | 1,016,965 | | | 5.44%, 03/10/2039 | | | 1,039,622 | |
| | | | | 6,721,874 | | | 5.74%, 12/10/2049 | | | 6,935,152 | |
| | | | | 2,848,526 | | | 5.77%, 06/10/2046(2) | | | 2,871,992 | |
| | | | | 254,644 | | | 5.83%, 07/10/2038(2) | | | 255,815 | |
| | | | | | | | Community or Commercial Mortgage Trust | | | | |
| | | | | 2,120,000 | | | 3.69%, 08/10/2047 | | | 2,153,805 | |
| | | | | 4,515,000 | | | 4.23%, 07/10/2045(2) | | | 4,851,779 | |
| | | | | 352,243 | | | Credit Suisse Commercial Mortgage Trust
5.70%, 06/15/2039(2) | | | 361,638 | |
| | | | | 5,713,171 | | | Credit Suisse Mortgage Capital Certificates
5.47%, 09/15/2039 | | | 5,773,538 | |
| | | | | | | | CS First Boston Mortgage Securities Corp. | | | | |
| | | | | 57,678 | | | 4.77%, 07/15/2037 | | | 57,642 | |
| | | | | 2,286,210 | | | 4.88%, 04/15/2037 | | | 2,284,048 | |
| | | | | | | | CSAIL Commercial Mortgage Trust | | | | |
| | | | | 65,765,434 | | | 0.90%, 06/15/2057(2)(3) | | | 3,766,281 | |
| | | | | 2,215,000 | | | 3.36%, 08/15/2048(2) | | | 1,601,414 | |
| | | | | 8,453,000 | | | 3.72%, 08/15/2048 | | | 8,563,371 | |
| | | | | 3,520,000 | | | 3.81%, 11/15/2048 | | | 3,588,473 | |
The accompanying notes are an integral part of these financial statements.
|
| Hartford Total Return Bond HLS Fund |
Schedule of Investments – (continued)
December 31, 2015
| | | | | | | | | | | | |
Shares or Principal Amount | | Market Value† | |
| ASSET & COMMERCIAL MORTGAGE BACKED SECURITIES - 33.6% - (continued) | |
| | | | | | | Commercial Mortgage-Backed Securities -
11.6% -
(continued) | |
| | $ | | | | 14,034,794 | | | DBUBS Mortgage Trust
1.13%, 11/10/2046(1)(2)(3) | | $ | 313,186 | |
| | | | | 3,175,000 | | | Four Times Square Trust Commercial Mortgage Pass-Through Certificates
5.40%, 12/13/2028(1) | | | 3,502,987 | |
| | | | | 4,680,000 | | | FREMF Mortgage Trust
3.01%, 10/25/2047(1)(2) | | | 4,641,416 | |
| | | | | 5,485,000 | | | 5.25%, 09/25/2043(1)(2) | | | 5,921,643 | |
| | | | | 2,979,510 | | | GE Business Loan Trust
1.33%, 05/15/2034(1)(2) | | | 2,473,254 | |
| | | | | 1,020,000 | | | GE Commercial Mortgage Corp.
5.61%, 12/10/2049(2) | | | 1,037,077 | |
| | | | | 52,473,952 | | | GS Mortgage Securities Trust
0.28%, 07/10/2046(2)(3) | | | 456,697 | |
| | | | | 10,618,171 | | | 1.64%, 08/10/2044(1)(2)(3) | | | 458,547 | |
| | | | | 4,340,000 | | | 2.95%, 11/05/2034(1) | | | 4,266,514 | |
| | | | | 1,040,000 | | | 3.27%, 11/10/2048 | | | 752,725 | |
| | | | | 2,815,000 | | | 3.38%, 05/10/2050 | | | 2,800,336 | |
| | | | | 1,060,000 | | | 3.58%, 06/10/2047(1) | | | 729,607 | |
| | | | | 1,580,166 | | | 3.67%, 04/10/2047(1) | | | 1,119,010 | |
| | | | | 4,110,000 | | | 4.00%, 04/10/2047 | | | 4,296,294 | |
| | | | | 1,700,121 | | | 4.07%, 01/10/2047 | | | 1,790,013 | |
| | | | | 1,115,000 | | | 4.51%, 11/10/2047(1)(2) | | | 932,292 | |
| | | | | 2,960,000 | | | 4.87%, 04/10/2047(1)(2) | | | 2,525,341 | |
| | | | | | | | Hilton USA Trust | | | | |
| | | | | 5,985,000 | | | 2.66%, 11/05/2030 | | | 5,989,483 | |
| | | | | 1,088,057 | | | 3.02%, 11/05/2030(1)(2) | | | 1,088,148 | |
| | | | | 1,675,924 | | | JP Morgan Chase Commercial Mortgage Securities Corp.
4.42%, 12/15/2047(1)(2) | | | 1,399,718 | |
| | | | | | | | JP Morgan Chase Commercial Mortgage Securities Trust | | | | |
| | | | | 8,800,578 | | | 1.82%, 02/12/2051(2) | | | 8,688,650 | |
| | | | | 2,185,000 | | | 2.73%, 10/15/2045(1)(2) | | | 1,479,835 | |
| | | | | 3,510,967 | | | 3.91%, 05/05/2030(1) | | | 3,643,877 | |
| | | | | 470,000 | | | 4.00%, 08/15/2046(1)(2) | | | 412,001 | |
| | | | | 1,075,000 | | | 4.67%, 10/15/2045(1)(2) | | | 1,029,568 | |
| | | | | 9,183,089 | | | 5.34%, 05/15/2047 | | | 9,352,846 | |
| | | | | 1,815,029 | | | 5.72%, 02/15/2051 | | | 1,895,706 | |
| | | | | | | | JPMBB Commercial Mortgage Securities Trust | | | | |
| | | | | 29,916,520 | | | 0.88%, 09/15/2047(2)(3) | | | 1,302,643 | |
| | | | | 8,360,265 | | | 0.96%, 05/15/2048(2)(3) | | | 402,739 | |
| | | | | 1,915,000 | | | 3.18%, 02/15/2048 | | | 1,872,648 | |
| | | | | 1,795,000 | | | 3.60%, 11/15/2048 | | | 1,807,027 | |
| | | | | 810,060 | | | 3.61%, 05/15/2048 | | | 816,928 | |
| | | | | 1,300,000 | | | 3.74%, 10/15/2048(1)(2) | | | 946,465 | |
| | | | | 415,000 | | | 3.78%, 08/15/2047 | | | 426,945 | |
| | | | | | | | LB-UBS Commercial Mortgage Trust | | | | |
| | | | | 6,256,451 | | | 5.86%, 07/15/2040(2) | | | 6,436,700 | |
| | | | | 1,265,808 | | | 6.09%, 04/15/2041(2) | | | 1,333,182 | |
| | | | | 645,577 | | | Lehman Brothers Small Balance Commercial
5.52%, 09/25/2030(1)(2) | | | 642,898 | |
| | | | | | | | Merrill Lynch/Countrywide Commercial Mortgage Trust | | | | |
| | | | | 5,655,223 | | | 5.38%, 08/12/2048 | | | 5,789,020 | |
| | | | | 2,285,000 | | | 5.42%, 08/12/2048 | | | 2,326,014 | |
| | | | | 4,695,284 | | | 5.70%, 09/12/2049 | | | 4,884,112 | |
| | | | | 5,920,358 | | | 5.74%, 06/12/2050(2) | | | 6,143,832 | |
| | | | | | | | | | | | |
Shares or Principal Amount | | Market Value† | |
| ASSET & COMMERCIAL MORTGAGE BACKED SECURITIES - 33.6% - (continued) | |
| | | | | | | Commercial Mortgage-Backed Securities -
11.6% -
(continued) | |
| | $ | | | | 1,619,095 | | | Morgan Stanley Bank of America Merrill Lynch Trust
1.13%, 10/15/2048(2)(3) | | $ | 125,156 | |
| | | | | 16,280,522 | | | 1.16%, 12/15/2047(2)(3) | | | 1,053,840 | |
| | | | | 1,925,000 | | | 3.06%, 10/15/2048(1) | | | 1,367,328 | |
| | | | | 1,030,000 | | | 3.13%, 12/15/2048 | | | 1,030,387 | |
| | | | | 1,320,000 | | | 3.18%, 08/15/2045 | | | 1,340,110 | |
| | | | | 840,000 | | | 3.53%, 12/15/2047 | | | 849,273 | |
| | | | | 4,320,000 | | | 3.74%, 08/15/2047 | | | 4,446,799 | |
| | | | | 1,530,000 | | | 4.06%, 02/15/2047 | | | 1,614,409 | |
| | | | | 1,605,000 | | | 4.50%, 08/15/2045(1) | | | 1,304,004 | |
| | | | | | | | Morgan Stanley Capital I Trust | | | | |
| | | | | 52,562,168 | | | 0.64%, 09/15/2047(1)(2)(3) | | | 845,326 | |
| | | | | 4,920,000 | | | 3.47%, 08/11/2029(1) | | | 5,035,265 | |
| | | | | 1,460,000 | | | 5.18%, 07/15/2049(1)(2) | | | 1,269,725 | |
| | | | | 920,000 | | | 5.40%, 10/12/2052(1)(2) | | | 862,750 | |
| | | | | 485,200 | | | 5.57%, 12/15/2044 | | | 504,903 | |
| | | | | 7,124,000 | | | 5.69%, 04/15/2049(2) | | | 7,306,557 | |
| | | | | 127,098 | | | 5.78%, 10/15/2042(2) | | | 126,928 | |
| | | | | 4,135,780 | | | 5.81%, 12/12/2049 | | | 4,320,228 | |
| | | | | 1,050,000 | | | 6.27%, 01/11/2043(1)(2) | | | 1,073,001 | |
| | | | | | | | Morgan Stanley Re-Remic Trust | | | | |
| | | | | 4,216,098 | | | 5.80%, 08/12/2045(1)(2) | | | 4,331,254 | |
| | | | | 2,272,507 | | | 5.80%, 08/15/2045(1)(2) | | | 2,332,032 | |
| | | | | | | | SFAVE Commercial Mortgage Securities Trust | | | | |
| | | | | 1,365,000 | | | 3.87%, 01/05/2035(1)(2) | | | 1,334,943 | |
| | | | | 2,580,000 | | | 4.14%, 01/05/2035(1)(2) | | | 2,440,815 | |
| | | | | | | | UBS-Barclays Commercial Mortgage Trust | | | | |
| | | | | 1,930,000 | | | 3.09%, 08/10/2049 | | | 1,933,550 | |
| | | | | 4,680,000 | | | 3.19%, 03/10/2046 | | | 4,697,118 | |
| | | | | 985,000 | | | 4.09%, 03/10/2046(1)(2) | | | 796,184 | |
| | | | | 979,482 | | | Wachovia Bank Commercial Mortgage Trust
5.31%, 11/15/2048 | | | 992,861 | |
| | | | | | | | Wells Fargo Commercial Mortgage Trust | | | | |
| | | | | 21,794,978 | | | 1.21%, 05/15/2048(2)(3) | | | 1,604,577 | |
| | | | | 6,965,000 | | | 2.92%, 10/15/2045 | | | 6,923,330 | |
| | | | | 390,000 | | | 3.96%, 12/15/2047(1)(2) | | | 305,862 | |
| | | | | 665,000 | | | 4.11%, 05/15/2048(2) | | | 535,138 | |
| | | | | 665,000 | | | 4.23%, 06/15/2048(2) | | | 522,511 | |
| | | | | | | | WF-RBS Commercial Mortgage Trust | | | | |
| | | | | 255,115 | | | 2.88%, 12/15/2045 | | | 251,961 | |
| | | | | 450,000 | | | 3.07%, 03/15/2045 | | | 448,650 | |
| | | | | 175,000 | | | 3.44%, 04/15/2045 | | | 179,729 | |
| | | | | 905,000 | | | 3.63%, 11/15/2047 | | | 918,539 | |
| | | | | 7,015,000 | | | 3.68%, 08/15/2047 | | | 7,175,876 | |
| | | | | 120,000 | | | 3.88%, 08/15/2046 | | | 125,297 | |
| | | | | 4,775,000 | | | 4.00%, 05/15/2047 | | | 5,004,302 | |
| | | | | 4,145,000 | | | 4.05%, 03/15/2047 | | | 4,362,245 | |
| | | | | 680,286 | | | 4.10%, 03/15/2047 | | | 718,635 | |
| | | | | 315,000 | | | 4.35%, 03/15/2048(2) | | | 292,058 | |
| | | | | 550,000 | | | 4.90%, 06/15/2044(1)(2) | | | 604,328 | |
| | | | | 710,000 | | | 5.00%, 06/15/2044(1)(2) | | | 666,058 | |
| | | | | 815,000 | | | 5.00%, 04/15/2045(1)(2) | | | 634,372 | |
| | | | | 1,045,000 | | | 5.56%, 04/15/2045(1)(2) | | | 1,041,727 | |
| | | | | | | | | | | | |
| | | | | | | | | | | 317,531,219 | |
| | | | | | | | | | | | |
The accompanying notes are an integral part of these financial statements.
|
| Hartford Total Return Bond HLS Fund |
Schedule of Investments – (continued)
December 31, 2015
| | | | | | | | | | | | |
Shares or Principal Amount | | Market Value† | |
| ASSET & COMMERCIAL MORTGAGE BACKED SECURITIES - 33.6% - (continued) | |
| | | | | | | Whole Loan Collateral CMO - 5.1% | |
| | $ | | | | 1,430,648 | | | Adjustable Rate Mortgage Trust
0.68%, 01/25/2036(2) | | $ | 1,176,673 | |
| | | | | 949,806 | | | 0.69%, 11/25/2035(2) | | | 865,682 | |
| | | | | 1,317,515 | | | 0.92%, 01/25/2036(2) | | | 1,140,755 | |
| | | | | | | | Alternative Loan Trust | | | | |
| | | | | 350,020 | | | 0.69%, 01/25/2036(2) | | | 311,936 | |
| | | | | 3,083,669 | | | 0.74%, 11/25/2035(2) | | | 2,543,217 | |
| | | | | 2,505,108 | | | 5.75%, 05/25/2036 | | | 2,102,269 | |
| | | | | | | | American Home Mortgage Assets Trust | | | | |
| | | | | 1,247,704 | | | 0.61%, 09/25/2046(2) | | | 885,838 | |
| | | | | 2,139,860 | | | 1.20%, 10/25/2046(2) | | | 1,519,215 | |
| | | | | | | | Banc of America Funding Trust | | | | |
| | | | | 298,716 | | | 0.59%, 10/20/2036(2) | | | 231,911 | |
| | | | | 721,645 | | | 0.63%, 02/20/2047(2) | | | 587,818 | |
| | | | | 5,480,963 | | | 0.70%, 05/20/2047(2) | | | 4,506,366 | |
| | | | | 6,775,017 | | | 5.77%, 05/25/2037(2) | | | 6,067,491 | |
| | | | | 300,819 | | | 5.85%, 01/25/2037 | | | 250,414 | |
| | | | | | | | BCAP LLC Trust | | | | |
| | | | | 1,218,848 | | | 0.59%, 01/25/2037(2) | | | 975,313 | |
| | | | | 3,206,335 | | | 0.60%, 03/25/2037(2) | | | 2,716,866 | |
| | | | | 957,980 | | | Bear Stearns Adjustable Rate Mortgage Trust
2.66%, 10/25/2035(2) | | | 941,873 | |
| | | | | 3,571,617 | | | Bear Stearns Alt-A Trust
0.92%, 01/25/2036(2) | | | 2,823,768 | |
| | | | | 2,063,875 | | | Bear Stearns Mortgage Funding Trust
0.60%, 10/25/2036(2) | | | 1,708,519 | |
| | | | | 633,970 | | | CHL Mortgage Pass-Through Trust
2.59%, 03/20/2036(2) | | | 563,239 | |
| | | | | | | | Connecticut Avenue Securities | |
| | | | | 2,240,000 | | | 3.02%, 05/25/2024(2) | | | 1,980,399 | |
| | | | | 2,605,000 | | | 3.32%, 07/25/2024(2) | | | 2,377,213 | |
| | | | | 5,095,000 | | | 3.42%, 07/25/2024(2) | | | 4,619,935 | |
| | | | | 890,000 | | | 4.42%, 05/25/2025(2) | | | 845,670 | |
| | | | | 1,575,000 | | | 5.32%, 11/25/2024(2) | | | 1,604,672 | |
| | | | | | | | Countrywide Home Loans, Inc. | |
| | | | | 905,395 | | | 2.62%, 11/20/2035(2) | | | 808,028 | |
| | | | | 5,307,188 | | | 2.72%, 09/25/2047(2) | | | 4,755,368 | |
| | | | | 973,784 | | | 2.74%, 04/20/2036(2) | | | 811,559 | |
| | | | | 2,624,800 | | | 5.75%, 08/25/2037 | | | 2,460,480 | |
| | | | | 3,578,653 | | | CS First Boston Mortgage Securities Corp.
5.50%, 06/25/2035 | | | 3,369,963 | |
| | | | | 2,304,850 | | | Downey S & L Association Mortgage Loan Trust
1.16%, 03/19/2046(2) | | | 1,671,993 | |
| | | | | | | | GMAC Mortgage Corp. Loan Trust | | | | |
| | | | | 3,762,119 | | | 3.07%, 09/19/2035(2) | | | 3,473,059 | |
| | | | | 69,154 | | | 3.10%, 04/19/2036(2) | | | 62,442 | |
| | | | | 6,633,646 | | | GSR Mortgage Loan Trust
2.87%, 01/25/2036(2) | | | 6,088,721 | |
| | | | | | | | HarborView Mortgage Loan Trust | |
| | | | | 2,948,043 | | | 0.59%, 01/19/2038(2) | | | 2,404,499 | |
| | | | | 8,597,449 | | | 0.64%, 12/19/2036(2) | | | 5,961,047 | |
| | | | | 1,191,622 | | | 1.10%, 01/19/2035(2) | | | 800,811 | |
| | | | | | | | IndyMac Index Mortgage Loan Trust | | | | |
| | | | | 3,839,905 | | | 0.70%, 07/25/2035(2) | | | 3,153,703 | |
| | | | | 2,210,813 | | | 0.71%, 01/25/2036(2) | | | 1,516,655 | |
| | | | | 3,030,865 | | | 0.82%, 07/25/2046(2) | | | 1,699,791 | |
| | | | | 3,297,343 | | | 2.67%, 03/25/2036(2) | | | 2,550,827 | |
| | | | | 1,442,643 | | | 2.67%, 08/25/2035(2) | | | 1,147,476 | |
| | | | | 2,007,581 | | | 2.70%, 01/25/2036(2) | | | 1,870,092 | |
| | | | | | | | | | | | |
Shares or Principal Amount | | Market Value† | |
| ASSET & COMMERCIAL MORTGAGE BACKED SECURITIES - 33.6% - (continued) | |
| | | | | | | Whole Loan Collateral CMO - 5.1% - (continued) | |
| | | | | | | | JP Morgan Mortgage Trust | | | | |
| | $ | | | | 622,073 | | | 2.67%, 04/25/2037(2) | | $ | 545,557 | |
| | | | | 2,472,504 | | | 2.75%, 09/25/2035(2) | | | 2,356,180 | |
| | | | | 1,501,537 | | | 2.87%, 05/25/2036(2) | | | 1,353,715 | |
| | | | | 2,308,903 | | | Lehman XS Trust
0.63%, 07/25/2046(2) | | | 1,808,348 | |
| | | | | | | | LSTAR Securities Investment Trust | |
| | | | | 7,075,899 | | | 2.24%, 04/01/2020(1)(2) | | | 6,974,183 | |
| | | | | 8,416,431 | | | 2.24%, 10/01/2020(1)(2) | | | 8,251,469 | |
| | | | | | | | Luminent Mortgage Trust | |
| | | | | 331,355 | | | 0.62%, 10/25/2046(2) | | | 282,395 | |
| | | | | 1,480,125 | | | 0.68%, 11/25/2035(2) | | | 1,334,562 | |
| | | | | | | | Merrill Lynch Mortgage Investors Trust | |
| | | | | 125,497 | | | 2.66%, 12/25/2035(2) | | | 119,685 | |
| | | | | 1,314,867 | | | 2.70%, 07/25/2035(2) | | | 1,045,678 | |
| | | | | 226,830 | | | Morgan Stanley Mortgage Loan Trust
2.75%, 05/25/2036(2) | | | 162,852 | |
| | | | | 117,610 | | | Nomura Asset Acceptance Corp. Alternative Loan Trust
3.71%, 06/25/2036(2) | | | 87,905 | |
| | | | | 2,700,278 | | | RBSGC Mortgage Pass-Through Certificates
6.25%, 01/25/2037 | | | 2,464,526 | |
| | | | | | | | Residential Accredit Loans, Inc. | |
| | | | | 398,634 | | | 0.64%, 02/25/2046(2) | | | 169,825 | |
| | | | | 809,627 | | | 0.72%, 04/25/2036(2) | | | 551,712 | |
| | | | | 816,663 | | | 1.06%, 09/25/2046(2) | | | 573,589 | |
| | | | | 5,783,057 | | | 1.53%, 11/25/2037(2) | | | 3,624,066 | |
| | | | | 1,489,194 | | | 6.00%, 12/25/2035 | | | 1,298,130 | |
| | | | | | | | Residential Asset Securitization Trust | |
| | | | | 3,182,927 | | | 0.87%, 03/25/2035(2) | | | 2,578,745 | |
| | | | | 1,528,106 | | | 6.25%, 11/25/2036 | | | 1,071,122 | |
| | | | | 772,663 | | | Sequoia Mortgage Trust
2.67%, 07/20/2037(2) | | | 664,002 | |
| | | | | 1,395,111 | | | Structured Adjustable Rate Mortgage Loan Trust
0.72%, 09/25/2034(2) | | | 1,072,789 | |
| | | | | 3,405,000 | | | Structured Agency Credit Risk Debt Notes
2.07%, 04/25/2024(2) | | | 3,346,500 | |
| | | | | | | | WaMu Mortgage Pass-Through Certificates Trust | |
| | | | | 1,185,740 | | | 0.84%, 06/25/2044(2) | | | 1,066,958 | |
| | | | | 657,023 | | | 2.15%, 11/25/2046(2) | | | 587,831 | |
| | | | | | | | Wells Fargo Commercial Mortgage Trust | |
| | | | | 46,838,930 | | | 1.20%, 09/15/2057(2)(3) | | | 3,359,194 | |
| | | | | 3,250,000 | | | 2.88%, 05/15/2048(1)(2) | | | 2,049,745 | |
| | | | | 1,685,000 | | | 3.36%, 09/15/2058(1) | | | 1,043,183 | |
| | | | | 1,015,000 | | | 3.84%, 09/15/2058 | | | 1,041,738 | |
| | | | | | | | | | | | |
| | | | | | | | | | | 138,839,750 | |
| | | | | | | | | | | | |
| | | |
| | | | | | | | Total Asset & Commercial Mortgage Backed Securities
(cost $925,427,972) | | $ | 920,067,501 | |
| | | | | | | | | | | | |
|
| CORPORATE BONDS - 33.7% | |
| | | | | | | Aerospace/Defense - 0.2% | |
| | $ | | | | 690,000 | | | BAE Systems Holdings, Inc.
2.85%, 12/15/2020(1) | | $ | 688,243 | |
| | | | | | | | Lockheed Martin Corp. | |
| | | | | 1,385,000 | | | 2.50%, 11/23/2020 | | | 1,376,785 | |
| | | | | 2,076,000 | | | 4.70%, 05/15/2046 | | | 2,126,594 | |
The accompanying notes are an integral part of these financial statements.
|
| Hartford Total Return Bond HLS Fund |
Schedule of Investments – (continued)
December 31, 2015
| | | | | | | | | | | | |
Shares or Principal Amount | | Market Value† | |
| CORPORATE BONDS - 33.7% - (continued) | |
| | | | | | | Aerospace/Defense - 0.2% - (continued) | |
| | $ | | | | 1,115,000 | | | Triumph Group, Inc.
5.25%, 06/01/2022 | | $ | 897,575 | |
| | | | | | | | | | | | |
| | | | | | | | | | | 5,089,197 | |
| | | | | | | | | | | | |
| | | | | | | Agriculture - 0.5% | |
| | | | | 903,000 | | | Altria Group, Inc.
10.20%, 02/06/2039 | | | 1,480,787 | |
| | | | | 2,515,000 | | | BAT International Finance plc
2.75%, 06/15/2020(1) | | | 2,514,268 | |
| | | | | | | | Imperial Tobacco Finance plc | |
| | | | | 1,420,000 | | | 2.05%, 07/20/2018(1) | | | 1,412,125 | |
| | | | | 3,000,000 | | | 2.95%, 07/21/2020(1) | | | 3,005,880 | |
| | | | | 4,905,000 | | | Reynolds American, Inc.
3.25%, 06/12/2020 | | | 4,984,966 | |
| | | | | | | | | | | | |
| | | | | | | | | | | 13,398,026 | |
| | | | | | | | | | | | |
| | | | | | | Apparel - 0.1% | |
| | | | | 1,770,000 | | | William Carter Co.
5.25%, 08/15/2021 | | | 1,818,675 | |
| | | | | | | | | | | | |
| | | | | | | Auto Manufacturers - 1.5% | |
| | | | | 8,030,000 | | | Daimler Finance NA LLC
1.65%, 03/02/2018(1) | | | 7,933,833 | |
| | | | | | | | Ford Motor Credit Co. LLC | |
| | | | | 9,530,000 | | | 1.46%, 03/27/2017 | | | 9,439,579 | |
| | | | | 745,000 | | | 2.24%, 06/15/2018 | | | 738,227 | |
| | | | | 3,380,000 | | | 3.20%, 01/15/2021 | | | 3,357,141 | |
| | | | | 775,000 | | | 4.21%, 04/15/2016 | | | 781,205 | |
| | | | | 1,985,000 | | | 4.25%, 02/03/2017 | | | 2,028,092 | |
| | | | | | | | General Motors Financial Co., Inc. | |
| | | | | 3,150,000 | | | 2.40%, 04/10/2018 | | | 3,134,537 | |
| | | | | 4,985,000 | | | 3.50%, 07/10/2019 | | | 5,001,700 | |
| | | | | 4,735,000 | | | 4.75%, 08/15/2017 | | | 4,907,548 | |
| | | | | 4,300,000 | | | Volkswagen Group of America Finance LLC
1.60%, 11/20/2017(1) | | | 4,175,055 | |
| | | | | | | | | | | | |
| | | | | | | | | | | 41,496,917 | |
| | | | | | | | | | | | |
| | | | | | | Auto Parts & Equipment - 0.1% | |
| | | | | 1,950,000 | | | Delphi Automotive plc
3.15%, 11/19/2020 | | | 1,947,479 | |
| | | | | | | | ZF North America Capital, Inc. | |
| | | | | 180,000 | | | 4.50%, 04/29/2022(1) | | | 175,950 | |
| | | | | 330,000 | | | 4.75%, 04/29/2025(1) | | | 314,325 | |
| | | | | | | | | | | | |
| | | | | | | | | | | 2,437,754 | |
| | | | | | | | | | | | |
| | | | | | | Beverages - 0.1% | |
| | | | | 850,000 | | | Anheuser-Busch InBev Finance, Inc.
2.15%, 02/01/2019 | | | 845,088 | |
| | | | | | | | Anheuser-Busch InBev Worldwide, Inc. | |
| | | | | 1,440,000 | | | 2.50%, 07/15/2022 | | | 1,385,401 | |
| | | | | 2,220,000 | | | 3.75%, 07/15/2042 | | | 1,907,442 | |
| | | | | | | | | | | | |
| | | | | | | | | | | 4,137,931 | |
| | | | | | | | | | | | |
| | | | | | | Biotechnology - 0.2% | |
| | | | | 3,585,000 | | | Celgene Corp.
4.63%, 05/15/2044 | | | 3,386,345 | |
| | | | | 1,095,000 | | | Gilead Sciences, Inc.
3.25%, 09/01/2022 | | | 1,102,587 | |
| | | | | | | | | | | | |
| | | | | | | | | | | 4,488,932 | |
| | | | | | | | | | | | |
| | | | | | | | | | | | |
Shares or Principal Amount | | Market Value† | |
| CORPORATE BONDS - 33.7% - (continued) | |
| | | | | | | Chemicals - 0.2% | |
| | | | | | | | CF Industries, Inc. | |
| | $ | | | | 2,700,000 | | | 4.95%, 06/01/2043 | | $ | 2,295,737 | |
| | | | | 4,570,000 | | | 5.15%, 03/15/2034 | | | 4,020,293 | |
| | | | | | | | | | | | |
| | | | | | | | | | | 6,316,030 | |
| | | | | | | | | | | | |
| | | | | | | Coal - 0.0% | |
| | | | | 1,640,000 | | | Peabody Energy Corp.
6.50%, 09/15/2020 | | | 225,500 | |
| | | | | | | | | | | | |
| | | | | | | Commercial Banks - 12.4% | |
| | | | | | | | Banco Bilbao Vizcaya Argentaria S.A. | |
| | EUR | | | | 6,000,000 | | | 7.00%, 02/19/2019(2)(4)(5) | | | 6,397,405 | |
| | $ | | | | 3,400,000 | | | 9.00%, 05/09/2018(2)(4)(5) | | | 3,640,183 | |
| | | | | | | | Banco Santander S.A. | |
| | EUR | | | | 7,400,000 | | | 6.25%, 03/12/2019(2)(4)(5) | | | 7,599,641 | |
| | | | | 1,000,000 | | | 6.25%, 09/11/2021(2)(4)(5) | | | 1,016,111 | |
| | | | | | | | Bank of America Corp. | |
| | $ | | | | 4,000,000 | | | 4.00%, 01/22/2025 | | | 3,915,712 | |
| | | | | 8,235,000 | | | 4.20%, 08/26/2024 | | | 8,170,586 | |
| | | | | 1,540,000 | | | 5.00%, 01/21/2044 | | | 1,607,283 | |
| | | | | 2,481,000 | | | 5.70%, 05/02/2017 | | | 2,587,375 | |
| | | | | 6,950,000 | | | 6.05%, 05/16/2016 | | | 7,064,612 | |
| | | | | 4,510,000 | | | 7.75%, 05/14/2038 | | | 6,119,087 | |
| | | | | 5,805,000 | | | Bank of New York Mellon Corp.
2.60%, 08/17/2020 | | | 5,827,936 | |
| | | | | 8,030,000 | | | Bank of Nova Scotia
4.50%, 12/16/2025 | | | 7,992,845 | |
| | | | | 10,200,000 | | | Barclays Bank plc
6.05%, 12/04/2017(1) | | | 10,879,993 | |
| | | | | | | | Barclays plc | |
| | EUR | | | | 1,010,000 | | | 6.50%, 09/15/2019(2)(5) | | | 1,111,063 | |
| | | | | 1,420,000 | | | 8.00%, 12/15/2020(2)(5) | | | 1,672,426 | |
| | $ | | | | 3,245,000 | | | 8.25%, 12/15/2018(2)(5) | | | 3,454,955 | |
| | | | | | | | BPCE S.A. | |
| | | | | 1,410,000 | | | 5.15%, 07/21/2024(1) | | | 1,421,850 | |
| | | | | 3,305,000 | | | 5.70%, 10/22/2023(1) | | | 3,470,068 | |
| | | | | 8,750,000 | | | Branch Banking & Trust Co.
3.63%, 09/16/2025 | | | 8,832,294 | |
| | | | | 2,880,000 | | | Capital One Financial Corp.
6.15%, 09/01/2016 | | | 2,967,509 | |
| | | | | | | | Capital One NA/Mclean VA | |
| | | | | 10,450,000 | | | 1.65%, 02/05/2018 | | | 10,346,608 | |
| | | | | 2,645,000 | | | 2.35%, 08/17/2018 | | | 2,649,970 | |
| | | | | 3,063,000 | | | CIT Group, Inc.
5.50%, 02/15/2019(1) | | | 3,200,835 | |
| | | | | | | | Citigroup, Inc. | |
| | | | | 6,525,000 | | | 1.85%, 11/24/2017 | | | 6,515,369 | |
| | | | | 1,025,000 | | | 2.50%, 09/26/2018 | | | 1,033,902 | |
| | | | | 1,550,000 | | | 4.30%, 11/20/2026 | | | 1,542,349 | |
| | | | | 2,450,000 | | | 4.40%, 06/10/2025 | | | 2,474,520 | |
| | | | | 9,335,000 | | | 4.45%, 09/29/2027 | | | 9,273,193 | |
| | | | | 5,510,000 | | | 4.65%, 07/30/2045 | | | 5,591,537 | |
| | | | | 1,015,000 | | | 5.50%, 09/13/2025 | | | 1,101,776 | |
| | | | | 2,195,000 | | | 6.68%, 09/13/2043 | | | 2,691,434 | |
| | | | | | | | Credit Agricole S.A. | |
| | EUR | | | | 2,940,000 | | | 6.50%, 06/23/2021(2)(4)(5) | | | 3,278,914 | |
| | $ | | | | 1,710,000 | | | 6.63%, 09/23/2019(1)(2)(5) | | | 1,680,930 | |
| | | | | 4,930,000 | | | Credit Suisse Group AG
6.25%, 12/18/2024(1)(2)(5) | | | 4,926,293 | |
| | | | | 5,250,000 | | | Credit Suisse Group Funding Guernsey Ltd.
3.13%, 12/10/2020(1) | | | 5,226,154 | |
The accompanying notes are an integral part of these financial statements.
|
| Hartford Total Return Bond HLS Fund |
Schedule of Investments – (continued)
December 31, 2015
| | | | | | | | | | | | |
Shares or Principal Amount | | Market Value† | |
| CORPORATE BONDS - 33.7% - (continued) | |
| | | | | | | Commercial Banks - 12.4% - (continued) | |
| | $ | | | | 1,640,000 | | | Credit Suisse Group Guernsey I Ltd.
7.88%, 02/24/2041(2)(4) | | $ | 1,689,200 | |
| | | | | 5,080,000 | | | Deutsche Bank AG
4.50%, 04/01/2025 | | | 4,673,138 | |
| | | | | | | | Goldman Sachs Group, Inc. | |
| | | | | 550,000 | | | 1.48%, 04/23/2020(2) | | | 550,815 | |
| | | | | 2,000,000 | | | 2.38%, 01/22/2018 | | | 2,017,280 | |
| | | | | 2,785,000 | | | 2.60%, 04/23/2020 | | | 2,763,851 | |
| | | | | 2,215,000 | | | 2.75%, 09/15/2020 | | | 2,213,545 | |
| | | | | 210,000 | | | 4.25%, 10/21/2025 | | | 208,395 | |
| | | | | 1,115,000 | | | 4.75%, 10/21/2045 | | | 1,107,615 | |
| | | | | 3,490,000 | | | 5.15%, 05/22/2045 | | | 3,392,388 | |
| | | | | 3,687,000 | | | 6.00%, 06/15/2020 | | | 4,166,716 | |
| | | | | 2,655,000 | | | 6.25%, 02/01/2041 | | | 3,166,889 | |
| | | | | 4,400,000 | | | 6.45%, 05/01/2036 | | | 4,973,993 | |
| | | | | 5,710,000 | | | 6.75%, 10/01/2037 | | | 6,674,625 | |
| | | | | | | | HSBC Holdings plc | |
| | | | | 5,950,000 | | | 4.25%, 08/18/2025 | | | 5,904,822 | |
| | EUR | | | | 1,275,000 | | | 5.25%, 09/16/2022(2)(4)(5) | | | 1,364,822 | |
| | $ | | | | 1,800,000 | | | 5.25%, 03/14/2044 | | | 1,867,723 | |
| | | | | 1,375,000 | | | 5.63%, 01/17/2020(2)(5) | | | 1,376,719 | |
| | | | | 1,865,000 | | | 6.38%, 09/17/2024(2)(5) | | | 1,841,687 | |
| | | | | 1,765,000 | | | 6.50%, 09/15/2037 | | | 2,117,501 | |
| | | | | 1,130,000 | | | 6.80%, 06/01/2038 | | | 1,406,566 | |
| | | | | 1,350,000 | | | HSBC USA, Inc.
2.75%, 08/07/2020 | | | 1,350,135 | |
| | | | | | | | JP Morgan Chase & Co. | |
| | | | | 1,055,000 | | | 2.55%, 10/29/2020 | | | 1,046,147 | |
| | | | | 1,050,000 | | | 2.60%, 01/15/2016 | | | 1,050,439 | |
| | | | | 14,030,000 | | | 4.25%, 10/01/2027 | | | 13,996,468 | |
| | | | | 3,820,000 | | | 4.35%, 08/15/2021 | | | 4,065,370 | |
| | | | | 760,000 | | | 5.60%, 07/15/2041 | | | 877,246 | |
| | | | | 9,885,000 | | | 5.63%, 08/16/2043 | | | 10,756,857 | |
| | | | | 3,125,000 | | | 6.00%, 01/15/2018 | | | 3,375,191 | |
| | EUR | | | | 1,290,000 | | | KBC Groep N.V.
5.63%, 03/19/2019(2)(4)(5) | | | 1,401,907 | |
| | | | | | | | Lloyds Banking Group plc | |
| | | | | 4,115,000 | | | 6.38%, 06/27/2020(2)(4)(5) | | | 4,716,861 | |
| | GBP | | | | 2,345,000 | | | 7.00%, 06/27/2019(2)(4)(5) | | | 3,508,854 | |
| | | | | | | | Morgan Stanley | |
| | $ | | | | 5,275,000 | | | 3.95%, 04/23/2027 | | | 5,119,804 | |
| | | | | 3,275,000 | | | 4.00%, 07/23/2025 | | | 3,372,510 | |
| | | | | 4,270,000 | | | 4.30%, 01/27/2045 | | | 4,074,041 | |
| | | | | 2,915,000 | | | 4.35%, 09/08/2026 | | | 2,924,529 | |
| | | | | 500,000 | | | 4.88%, 11/01/2022 | | | 530,626 | |
| | | | | 5,925,000 | | | 5.55%, 04/27/2017 | | | 6,216,753 | |
| | | | | 5,240,000 | | | 6.25%, 08/28/2017 | | | 5,610,589 | |
| | | | | 1,600,000 | | | 7.30%, 05/13/2019 | | | 1,837,934 | |
| | | | | 1,024,000 | | | PNC Bank NA
6.88%, 04/01/2018 | | | 1,122,164 | |
| | | | | | | | Royal Bank of Scotland Group plc | |
| | | | | 1,815,000 | | | 6.13%, 12/15/2022 | | | 1,975,987 | |
| | | | | 4,270,000 | | | 7.50%, 08/10/2020(2)(5) | | | 4,446,137 | |
| | | | | 910,000 | | | 8.00%, 08/10/2025(2)(5) | | | 962,325 | |
| | | | | 14,000,000 | | | Santander Issuances SAU
5.18%, 11/19/2025 | | | 13,787,872 | |
| | | | | 3,610,000 | | | Santander UK Group Holdings plc
4.75%, 09/15/2025(1) | | | 3,562,373 | |
| | | | | 5,785,000 | | | Societe Generale S.A.
8.25%, 11/29/2018(2)(4)(5) | | | 6,132,100 | |
| | | | | 1,800,000 | | | Standard Chartered plc
6.50%, 04/02/2020(1)(2)(5) | | | 1,739,126 | |
| | | | | | | | | | | | |
Shares or Principal Amount | | Market Value† | |
| CORPORATE BONDS - 33.7% - (continued) | |
| | | | | | | Commercial Banks - 12.4% - (continued) | |
| | $ | | | | 4,795,000 | | | SunTrust Banks, Inc.
3.50%, 01/20/2017 | | $ | 4,877,762 | |
| | | | | 1,600,000 | | | UBS AG
7.63%, 08/17/2022 | | | 1,824,000 | |
| | | | | | | | Wells Fargo & Co. | |
| | | | | 2,895,000 | | | 2.60%, 07/22/2020 | | | 2,887,583 | |
| | | | | 4,500,000 | | | 4.90%, 11/17/2045 | | | 4,540,131 | |
| | | | | 74,000 | | | 5.38%, 11/02/2043 | | | 79,198 | |
| | | | | 5,270,000 | | | 5.61%, 01/15/2044 | | | 5,854,438 | |
| | | | | | | | | | | | |
| | | | | | | | | | | 340,384,465 | |
| | | | | | | | | | | | |
| | | | | | | Commercial Services - 0.2% | |
| | | | | 2,045,000 | | | ADT Corp.
6.25%, 10/15/2021 | | | 2,136,105 | |
| | | | | 1,430,000 | | | Cardtronics, Inc.
5.13%, 08/01/2022 | | | 1,379,950 | |
| | | | | | | | United Rentals North America, Inc. | |
| | | | | 470,000 | | | 4.63%, 07/15/2023 | | | 468,825 | |
| | | | | 600,000 | | | 5.50%, 07/15/2025 | | | 582,000 | |
| | | | | | | | | | | | |
| | | | | | | | | | | 4,566,880 | |
| | | | | | | | | | | | |
| | | | | | | Construction Materials - 0.2% | |
| | | | | | | | Building Materials Corp. of America | |
| | | | | 1,130,000 | | | 5.38%, 11/15/2024(1) | | | 1,127,175 | |
| | | | | 930,000 | | | 6.00%, 10/15/2025(1) | | | 948,600 | |
| | | | | 3,000,000 | | | CRH America, Inc.
5.13%, 05/18/2045(1) | | | 3,001,719 | |
| | | | | 1,015,000 | | | Norbord, Inc.
6.25%, 04/15/2023(1) | | | 1,002,312 | |
| | | | | 35,000 | | | USG Corp.
5.50%, 03/01/2025(1) | | | 35,525 | |
| | | | | | | | | | | | |
| | | | | | | | | | | 6,115,331 | |
| | | | | | | | | | | | |
| | | | | | | Diversified Financial Services - 1.2% | |
| | | | | 255,000 | | | Aircastle Ltd.
5.50%, 02/15/2022 | | | 261,375 | |
| | | | | 3,992,000 | | | Bear Stearns Cos LLC
5.55%, 01/22/2017 | | | 4,148,518 | |
| | | | | | | | GE Capital International Funding Co. | |
| | | | | 315,000 | | | 2.34%, 11/15/2020(1) | | | 312,373 | |
| | | | | 1,871,000 | | | 4.42%, 11/15/2035(1) | | | 1,909,322 | |
| | | | | | | | General Electric Capital Corp. | |
| | | | | 154,000 | | | 5.88%, 01/14/2038 | | | 188,428 | |
| | | | | 388,000 | | | 6.88%, 01/10/2039 | | | 528,872 | |
| | | | | 2,285,000 | | | Intercontinental Exchange, Inc.
2.75%, 12/01/2020 | | | 2,284,433 | |
| | | | | | | | International Lease Finance Corp. | |
| | | | | 3,920,000 | | | 5.88%, 04/01/2019 | | | 4,155,200 | |
| | | | | 1,620,000 | | | 6.75%, 09/01/2016(1) | | | 1,664,550 | |
| | | | | | | | Navient Corp. | |
| | | | | 1,590,000 | | | 5.50%, 01/15/2019 | | | 1,486,650 | |
| | | | | 1,005,000 | | | 7.25%, 01/25/2022 | | | 939,675 | |
| | | | | 3,925,000 | | | Synchrony Financial
2.60%, 01/15/2019 | | | 3,910,898 | |
| | | | | | | | Visa, Inc. | |
| | | | | 4,280,000 | | | 1.20%, 12/14/2017 | | | 4,275,202 | |
| | | | | 5,140,000 | | | 2.80%, 12/14/2022 | | | 5,161,244 | |
| | | | | 3,360,000 | | | 4.30%, 12/14/2045 | | | 3,408,918 | |
| | | | | | | | | | | | |
| | | | | | | | | | | 34,635,658 | |
| | | | | | | | | | | | |
| | | | | | | Electric - 0.5% | |
| | | | | 460,000 | | | AES Corp.
5.50%, 03/15/2024 | | | 410,550 | |
The accompanying notes are an integral part of these financial statements.
|
| Hartford Total Return Bond HLS Fund |
Schedule of Investments – (continued)
December 31, 2015
| | | | | | | | | | | | |
Shares or Principal Amount | | Market Value† | |
| CORPORATE BONDS - 33.7% - (continued) | |
| | | | | | | Electric - 0.5% - (continued) | |
| | $ | | | | 1,935,000 | | | Duke Energy Carolinas LLC
4.25%, 12/15/2041 | | $ | 1,928,713 | |
| | | | | 3,015,000 | | | Duke Energy Progress LLC
4.38%, 03/30/2044 | | | 3,062,507 | |
| | | | | 3,600,000 | | | Electricite de France S.A.
4.95%, 10/13/2045(1) | | | 3,495,431 | |
| | | | | 3,070,000 | | | Exelon Corp.
2.85%, 06/15/2020 | | | 3,053,216 | |
| | | | | 1,100,000 | | | Pacific Gas & Electric Co.
8.25%, 10/15/2018 | | | 1,278,493 | |
| | | | | | | | | | | | |
| | | | | | | | | | | 13,228,910 | |
| | | | | | | | | | | | |
| | | | | | | Electrical Components & Equipment - 0.0% | |
| | | | | 945,000 | | | EnerSys
5.00%, 04/30/2023(1) | | | 940,275 | |
| | | | | | | | | | | | |
| | | | | | | Engineering & Construction - 0.5% | |
| | | | | 5,620,000 | | | SBA Tower Trust
2.93%, 12/15/2042(1) | | | 5,686,462 | |
| | | | | 7,645,000 | | | 3.60%, 04/15/2043(1) | | | 7,617,507 | |
| | | | | | | | | | | | |
| | | | | | | | | | | 13,303,969 | |
| | | | | | | | | | | | |
| | | | | | | Environmental Control - 0.1% | |
| | | | | | | | Clean Harbors, Inc. | |
| | | | | 345,000 | | | 5.13%, 06/01/2021 | | | 349,312 | |
| | | | | 1,385,000 | | | 5.25%, 08/01/2020 | | | 1,412,700 | |
| | | | | | | | | | | | |
| | | | | | | | | | | 1,762,012 | |
| | | | | | | | | | | | |
| | | | | | | Food - 0.4% | |
| | | | | | | | Kraft Heinz Foods Co. | |
| | | | | 7,100,000 | | | 2.00%, 07/02/2018(1) | | | 7,066,488 | |
| | | | | 1,355,000 | | | 2.80%, 07/02/2020(1) | | | 1,351,496 | |
| | | | | 1,645,000 | | | Minerva Luxembourg S.A.
7.75%, 01/31/2023(1) | | | 1,546,300 | |
| | | | | | | | | | | | |
| | | | | | | | | | | 9,964,284 | |
| | | | | | | | | | | | |
| | | | | | | Forest Products & Paper - 0.1% | |
| | | | | | | | Cascades, Inc. | |
| | | | | 335,000 | | | 5.50%, 07/15/2022(1) | | | 324,950 | |
| | | | | 560,000 | | | 5.75%, 07/15/2023(1) | | | 537,600 | |
| | | | | 1,415,000 | | | Clearwater Paper Corp.
5.38%, 02/01/2025(1) | | | 1,369,012 | |
| | | | | | | | | | | | |
| | | | | | | | | | | 2,231,562 | |
| | | | | | | | | | | | |
| | | | | | | Gas - 0.0% | |
| | | | | 160,000 | | | Southern Star Central Corp.
5.13%, 07/15/2022(1) | | | 132,000 | |
| | | | | | | | | | | | |
| | | | | | | Healthcare-Products - 0.6% | |
| | | | | | | | Danaher Corp. | |
| | | | | 1,790,000 | | | 2.40%, 09/15/2020 | | | 1,789,945 | |
| | | | | 1,060,000 | | | 3.35%, 09/15/2025 | | | 1,076,105 | |
| | | | | 280,000 | | | Hologic, Inc.
5.25%, 07/15/2022(1) | | | 285,600 | |
| | | | | | | | Medtronic, Inc. | |
| | | | | 3,220,000 | | | 2.50%, 03/15/2020 | | | 3,242,846 | |
| | | | | 2,205,000 | | | 3.15%, 03/15/2022 | | | 2,229,072 | |
| | | | | 2,700,000 | | | 4.38%, 03/15/2035 | | | 2,729,273 | |
| | | | | 5,495,000 | | | Zimmer Biomet Holdings, Inc.
1.45%, 04/01/2017 | | | 5,468,239 | |
| | | | | | | | | | | | |
| | | | | | | | | | | 16,821,080 | |
| | | | | | | | | | | | |
| | | | | | | | | | | | |
Shares or Principal Amount | | Market Value† | |
| CORPORATE BONDS - 33.7% - (continued) | |
| | | | | | | Healthcare-Services - 0.9% | |
| | $ | | | | | | | Anthem, Inc. | | $ | | |
| | | | | 6,210,000 | | | 3.50%, 08/15/2024 | | | 6,063,332 | |
| | | | | 2,450,000 | | | 4.63%, 05/15/2042 | | | 2,313,574 | |
| | | | | 805,000 | | | Community Health Systems, Inc.
5.13%, 08/01/2021 | | | 800,975 | |
| | | | | 3,660,000 | | | HCA, Inc.
6.50%, 02/15/2020 | | | 3,987,570 | |
| | | | | 660,000 | | | LifePoint Health, Inc.
5.88%, 12/01/2023 | | | 669,900 | |
| | | | | 220,000 | | | MEDNAX, Inc.
5.25%, 12/01/2023(1) | | | 221,100 | |
| | | | | 3,695,000 | | | Tenet Healthcare Corp.
6.00%, 10/01/2020 | | | 3,888,988 | |
| | | | | | | | UnitedHealth Group, Inc. | |
| | | | | 2,775,000 | | | 3.35%, 07/15/2022 | | | 2,838,387 | |
| | | | | 2,550,000 | | | 3.75%, 07/15/2025 | | | 2,628,734 | |
| | | | | 925,000 | | | 4.75%, 07/15/2045 | | | 974,293 | |
| | | | | | | | | | | | |
| | | | | | | | | | | 24,386,853 | |
| | | | | | | | | | | | |
| | | | | | | Holding Companies-Diversified - 0.2% | |
| | | | | 5,700,000 | | | Hutchison Whampoa International Ltd.
2.00%, 11/08/2017(1) | | | 5,697,555 | |
| | | | | | | | | | | | |
| | | | | | | Home Builders - 0.1% | |
| | | | | 920,000 | | | Agile Property Holdings Ltd.
8.88%, 04/28/2017(4) | | | 926,900 | |
| | | | | 1,805,000 | | | Lennar Corp.
4.50%, 06/15/2019 | | | 1,835,459 | |
| | | | | 1,050,000 | | | Meritage Homes Corp.
6.00%, 06/01/2025 | | | 1,047,375 | |
| | | | | 65,000 | | | Toll Brothers Finance Corp.
4.88%, 11/15/2025 | | | 63,863 | |
| | | | | | | | | | | | |
| | | | | | | | | | | 3,873,597 | |
| | | | | | | | | | | | |
| | | | | | | Insurance - 0.4% | |
| | | | | 3,305,000 | | | American International Group, Inc.
4.70%, 07/10/2035 | | | 3,284,942 | |
| | | | | | | | CNO Financial Group, Inc. | |
| | | | | 55,000 | | | 4.50%, 05/30/2020 | | | 56,100 | |
| | | | | 240,000 | | | 5.25%, 05/30/2025 | | | 244,200 | |
| | | | | | | | Marsh & McLennan Cos., Inc. | |
| | | | | 1,140,000 | | | 2.55%, 10/15/2018 | | | 1,150,859 | |
| | | | | 2,070,000 | | | 3.50%, 03/10/2025 | | | 2,037,863 | |
| | | | | 2,333,000 | | | Massachusetts Mutual Life Insurance Co.
8.88%, 06/01/2039(1) | | | 3,387,749 | |
| | | | | 325,000 | | | Pacific Life Insurance Co.
9.25%, 06/15/2039(1) | | | 472,114 | |
| | | | | | | | | | | | |
| | | | | | | | | | | 10,633,827 | |
| | | | | | | | | | | | |
| | | | | | | Iron/Steel - 0.1% | |
| | | | | | | | ArcelorMittal | |
| | | | | 800,000 | | | 5.13%, 06/01/2020 | | | 664,000 | |
| | | | | 320,000 | | | 6.13%, 06/01/2025 | | | 232,800 | |
| | | | | | | | Steel Dynamics, Inc. | |
| | | | | 240,000 | | | 5.13%, 10/01/2021 | | | 222,000 | |
| | | | | 255,000 | | | 5.50%, 10/01/2024 | | | 232,687 | |
| | | | | 1,265,000 | | | United States Steel Corp.
7.38%, 04/01/2020 | | | 657,294 | |
| | | | | | | | | | | | |
| | | | | | | | | | | 2,008,781 | |
| | | | | | | | | | | | |
The accompanying notes are an integral part of these financial statements.
|
| Hartford Total Return Bond HLS Fund |
Schedule of Investments – (continued)
December 31, 2015
| | | | | | | | | | | | |
Shares or Principal Amount | | Market Value† | |
| CORPORATE BONDS - 33.7% - (continued) | |
| | | | | | | IT Services - 0.1% | |
| | $ | | | | 2,825,000 | | | Apple, Inc.
3.45%, 02/09/2045 | | $ | 2,432,206 | |
| | | | | | | | | | | | |
| | | | | | | Lodging - 0.0% | |
| | | | | 1,205,000 | | | Wynn Las Vegas LLC / Wynn Las Vegas Capital Corp.
5.38%, 03/15/2022 | | | 1,145,027 | |
| | | | | | | | | | | | |
| | | | | | | Machinery-Construction & Mining - 0.0% | |
| | | | | 525,000 | | | Oshkosh Corp.
5.38%, 03/01/2025 | | | 514,500 | |
| | | | | | | | | | | | |
| | | | | | | Machinery-Diversified - 0.1% | |
| | | | | 1,301,000 | | | Case New Holland Industrial, Inc.
7.88%, 12/01/2017 | | | 1,375,807 | |
| | | | | | | | | | | | |
| | | | | | | Media - 2.6% | |
| | | | | | | | 21st Century Fox America, Inc. | |
| | | | | 1,640,000 | | | 3.70%, 10/15/2025(1) | | | 1,635,934 | |
| | | | | 2,775,000 | | | 6.15%, 03/01/2037 | | | 3,093,539 | |
| | | | | 1,175,000 | | | 6.20%, 12/15/2034 | | | 1,334,147 | |
| | | | | 1,955,000 | | | 8.00%, 10/17/2016 | | | 2,056,652 | |
| | | | | | | | CCO Holdings LLC / CCO Holdings Capital Corp. | | | | |
| | | | | 80,000 | | | 5.13%, 02/15/2023 | | | 80,100 | |
| | | | | 65,000 | | | 5.25%, 09/30/2022 | | | 65,650 | |
| | | | | 385,000 | | | 5.75%, 09/01/2023 | | | 394,625 | |
| | | | | | | | CCO Safari II LLC | |
| | | | | 3,345,000 | | | 3.58%, 07/23/2020(1) | | | 3,324,960 | |
| | | | | 2,250,000 | | | 4.46%, 07/23/2022(1) | | | 2,242,147 | |
| | | | | 5,390,000 | | | 4.91%, 07/23/2025(1) | | | 5,384,756 | |
| | | | | 6,105,000 | | | 6.48%, 10/23/2045(1) | | | 6,115,006 | |
| | | | | 1,270,000 | | | CCOH Safari LLC
5.75%, 02/15/2026(1) | | | 1,273,175 | |
| | | | | | | | Comcast Corp. | |
| | | | | 2,745,000 | | | 4.75%, 03/01/2044 | | | 2,851,253 | |
| | | | | 425,000 | | | 5.70%, 07/01/2019 | | | 476,514 | |
| | | | | | | | Cox Communications, Inc. | |
| | | | | 1,045,000 | | | 3.25%, 12/15/2022(1) | | | 949,605 | |
| | | | | 1,985,000 | | | 3.85%, 02/01/2025(1) | | | 1,818,580 | |
| | | | | 1,985,000 | | | DIRECTV Holdings LLC
3.80%, 03/15/2022 | | | 1,997,551 | |
| | | | | | | | DISH DBS Corp. | |
| | | | | 860,000 | | | 5.88%, 11/15/2024 | | | 765,400 | |
| | | | | 1,785,000 | | | 7.88%, 09/01/2019 | | | 1,941,188 | |
| | | | | | | | Grupo Televisa S.A.B. | |
| | | | | 500,000 | | | 5.00%, 05/13/2045 | | | 429,902 | |
| | | | | 1,905,000 | | | 6.13%, 01/31/2046 | | | 1,893,761 | |
| | | | | 1,720,000 | | | Liberty Interactive LLC
8.25%, 02/01/2030 | | | 1,711,400 | |
| | | | | 1,715,000 | | | NBC Universal Media LLC
5.95%, 04/01/2041 | | | 2,050,994 | |
| | | | | 645,000 | | | Numericable-SFR SAS
4.88%, 05/15/2019(1) | | | 639,356 | |
| | | | | | | | Sky plc | |
| | | | | 1,395,000 | | | 2.63%, 09/16/2019(1) | | | 1,388,555 | |
| | | | | 2,290,000 | | | 3.13%, 11/26/2022(1) | | | 2,223,180 | |
| | | | | | | | TEGNA, Inc. | |
| | | | | 4,005,000 | | | 5.13%, 10/15/2019 | | | 4,145,175 | |
| | | | | 565,000 | | | 5.13%, 07/15/2020 | | | 586,188 | |
| | | | | | | | Time Warner Cable, Inc. | |
| | | | | 2,110,000 | | | 4.50%, 09/15/2042 | | | 1,655,890 | |
| | | | | 1,350,000 | | | 8.75%, 02/14/2019 | | | 1,566,072 | |
| | | | | | | | | | | | |
Shares or Principal Amount | | Market Value† | |
| CORPORATE BONDS - 33.7% - (continued) | |
| | | | | | | Media - 2.6% - (continued) | |
| | | | | | | | Time Warner Entertainment Co., L.P. | | | | |
| | $ | | | | 80,000 | | | 8.38%, 03/15/2023 | | $ | 98,247 | |
| | | | | 7,100,000 | | | 8.38%, 07/15/2033 | | | 8,375,934 | |
| | | | | | | | Time Warner, Inc. | |
| | | | | 2,010,000 | | | 3.60%, 07/15/2025 | | | 1,956,693 | |
| | | | | 2,725,000 | | | 6.10%, 07/15/2040 | | | 2,943,381 | |
| | | | | 1,900,000 | | | 6.50%, 11/15/2036 | | | 2,145,771 | |
| | | | | 650,000 | | | Unitymedia Hessen GmbH & Co. KG / Unitymedia NRW GmbH
5.50%, 01/15/2023(1) | | | 648,375 | |
| | | | | | | | | | | | |
| | | | | | | | | | | 72,259,656 | |
| | | | | | | | | | | | |
| | | | | | | Mining - 0.1% | |
| | | | | 3,065,000 | | | Corp. Nacional del Cobre de Chile
4.50%, 09/16/2025(1) | | | 2,886,268 | |
| | | | | | | | | | | | |
| | | | | | | Miscellaneous Manufacturing - 0.2% | |
| | | | | 4,618,770 | | | General Electric Co.
4.10%, 12/15/2022(2)(5) | | | 4,607,223 | |
| | | | | | | | | | | | |
| | | | | | | Oil & Gas - 2.1% | |
| | | | | 2,590,000 | | | Anadarko Petroleum Corp.
6.38%, 09/15/2017 | | | 2,715,931 | |
| | | | | 435,000 | | | Antero Resources Corp.
5.63%, 06/01/2023(1) | | | 339,300 | |
| | | | | 1,760,000 | | | BP Capital Markets plc
2.52%, 01/15/2020 | | | 1,754,276 | |
| | | | | 2,515,000 | | | Cenovus Energy, Inc.
5.20%, 09/15/2043 | | | 1,968,714 | |
| | | | | 6,110,000 | | | CNPC General Capital Ltd
1.45%, 04/16/2016(1) | | | 6,108,106 | |
| | | | | 2,695,000 | | | ConocoPhillips Co.
3.35%, 11/15/2024 | | | 2,464,621 | |
| | | | | 1,465,000 | | | Continental Resources, Inc.
5.00%, 09/15/2022 | | | 1,080,437 | |
| | | | | 775,000 | | | Devon Energy Corp.
5.85%, 12/15/2025 | | | 753,722 | |
| | | | | 3,225,000 | | | Ecopetrol S.A.
5.88%, 05/28/2045 | | | 2,289,750 | |
| | | | | 4,090,000 | | | EnCana Corp.
6.50%, 05/15/2019 | | | 3,987,652 | |
| | | | | 1,695,000 | | | Harvest Operations Corp.
6.88%, 10/01/2017 | | | 1,296,675 | |
| | | | | | | | Hess Corp. | |
| | | | | 1,145,000 | | | 5.60%, 02/15/2041 | | | 965,141 | |
| | | | | 1,370,000 | | | 6.00%, 01/15/2040 | | | 1,214,517 | |
| | | | | 2,425,000 | | | Kerr-McGee Corp.
6.95%, 07/01/2024 | | | 2,605,187 | |
| | | | | 2,780,000 | | | Marathon Oil Corp.
2.70%, 06/01/2020 | | | 2,451,246 | |
| | | | | 3,315,000 | | | Pertamina Persero PT
5.63%, 05/20/2043(4) | | | 2,594,462 | |
| | | | | | | | Petrobras Global Finance B.V. | |
| | GBP | | | | 2,275,000 | | | 5.38%, 10/01/2029 | | | 1,922,565 | |
| | $ | | | | 3,230,000 | | | 6.75%, 01/27/2041 | | | 2,067,200 | |
| | | | | | | | Petroleos Mexicanos | |
| | | | | 4,105,000 | | | 6.63%, 06/15/2035 | | | 3,668,844 | |
| | MXN | | | | 70,000,000 | | | 7.47%, 11/12/2026 | | | 3,631,576 | |
| | | | | | | | Pioneer Natural Resources Co. | |
| | $ | | | | 660,000 | | | 6.65%, 03/15/2017 | | | 681,425 | |
| | | | | 2,090,000 | | | 7.50%, 01/15/2020 | | | 2,219,799 | |
The accompanying notes are an integral part of these financial statements.
|
| Hartford Total Return Bond HLS Fund |
Schedule of Investments – (continued)
December 31, 2015
| | | | | | | | | | | | |
Shares or Principal Amount | | Market Value† | |
| CORPORATE BONDS - 33.7% - (continued) | |
| | | | | | | Oil & Gas - 2.1% - (continued) | |
| | | | | | | | QEP Resources, Inc. | | | | |
| | $ | | | | 10,000 | | | 5.25%, 05/01/2023 | | $ | 7,100 | |
| | | | | 45,000 | | | 5.38%, 10/01/2022 | | | 32,400 | |
| | | | | 55,000 | | | 6.80%, 03/01/2020 | | | 49,500 | |
| | | | | 255,000 | | | SM Energy Co.
6.13%, 11/15/2022 | | | 187,425 | |
| | | | | | | | Statoil ASA | |
| | | | | 15,000 | | | 3.70%, 03/01/2024 | | | 15,197 | |
| | | | | 3,400,000 | | | 3.95%, 05/15/2043 | | | 3,073,454 | |
| | | | | 250,000 | | | Tesoro Corp.
5.13%, 04/01/2024 | | | 248,750 | |
| | | | | 190,000 | | | WPX Energy, Inc.
5.25%, 09/15/2024 | | | 125,400 | |
| | | | | 4,350,000 | | | YPF S.A.
8.50%, 07/28/2025(4) | | | 4,143,375 | |
| | | | | 1,365,000 | | | Zhaikmunai LLP
7.13%, 11/13/2019(4) | | | 1,061,288 | |
| | | | | | | | | | | | |
| | | | | | | | | | | 57,725,035 | |
| | | | | | | | | | | | |
| | | | | | | Oil & Gas Services - 0.1% | |
| | | | | 1,555,000 | | | Halliburton Co.
2.70%, 11/15/2020 | | | 1,537,037 | |
| | | | | | | | | | | | |
| | | | | | | Packaging & Containers - 0.1% | |
| | | | | 310,000 | | | Ball Corp.
4.38%, 12/15/2020 | | | 314,844 | |
| | | | | 1,020,000 | | | Graphic Packaging International, Inc.
4.88%, 11/15/2022 | | | 1,032,750 | |
| | | | | 505,000 | | | Owens-Brockway Glass Container, Inc.
5.88%, 08/15/2023(1) | | | 512,575 | |
| | | | | | | | | | | | |
| | | | | | | | | | | 1,860,169 | |
| | | | | | | | | | | | |
| | | | | | | Pharmaceuticals - 1.1% | |
| | | | | | | | Actavis Funding SCS | |
| | | | | 8,270,000 | | | 2.35%, 03/12/2018 | | | 8,278,617 | |
| | | | | 7,600,000 | | | 3.00%, 03/12/2020 | | | 7,593,958 | |
| | | | | | | | Cardinal Health, Inc. | |
| | | | | 1,350,000 | | | 1.95%, 06/15/2018 | | | 1,346,484 | |
| | | | | 4,880,000 | | | 3.50%, 11/15/2024 | | | 4,885,666 | |
| | | | | 3,525,000 | | | EMD Finance LLC
2.95%,
03/19/2022(1) | | | 3,401,100 | |
| | | | | | | | Mylan N.V. | |
| | | | | 1,485,000 | | | 3.00%, 12/15/2018(1) | | | 1,481,723 | |
| | | | | 1,705,000 | | | 3.75%, 12/15/2020(1) | | | 1,706,787 | |
| | | | | 1,770,000 | | | Perrigo Co. plc
1.30%, 11/08/2016 | | | 1,757,482 | |
| | | | | 395,000 | | | Quintiles Transnational Corp.
4.88%, 05/15/2023(1) | | | 396,975 | |
| | | | | | | | | | | | |
| | | | | | | | | | | 30,848,792 | |
| | | | | | | | | | | | |
| | | | | | | Pipelines - 0.9% | |
| | | | | 430,000 | | | Crestwood Midstream Partners L.P. / Crestwood Midstream Finance Corp.
6.25%, 04/01/2023(1) | | | 299,925 | |
| | | | | | | | DCP Midstream LLC | |
| | | | | 120,000 | | | 5.35%, 03/15/2020(1) | | | 103,205 | |
| | | | | 145,000 | | | 9.75%, 03/15/2019(1) | | | 147,646 | |
| | | | | | | | DCP Midstream Operating L.P. | |
| | | | | 200,000 | | | 2.70%, 04/01/2019 | | | 162,018 | |
| | | | | 100,000 | | | 3.88%, 03/15/2023 | | | 75,483 | |
| | | | | 326,000 | | | 4.95%, 04/01/2022 | | | 266,801 | |
| | | | | 215,000 | | | 5.60%, 04/01/2044 | | | 130,574 | |
| | | | | | | | | | | | |
Shares or Principal Amount | | Market Value† | |
| CORPORATE BONDS - 33.7% - (continued) | |
| | | | | | | Pipelines - 0.9% - (continued) | |
| | $ | | | | 3,137,000 | | | Energy Transfer Equity L.P.
7.50%, 10/15/2020 | | $ | 2,901,725 | |
| | | | | | | | Energy Transfer Partners L.P. | |
| | | | | 435,000 | | | 4.75%, 01/15/2026 | | | 365,871 | |
| | | | | 9,305,000 | | | 5.95%, 10/01/2043 | | | 7,464,936 | |
| | | | | 3,500,000 | | | Kinder Morgan, Inc.
5.05%, 02/15/2046 | | | 2,595,642 | |
| | | | | | | | MPLX L.P. | |
| | | | | 480,000 | | | 4.88%, 12/01/2024(1) | | | 430,800 | |
| | | | | 495,000 | | | 4.88%, 06/01/2025(1) | | | 443,025 | |
| | | | | 1,575,000 | | | Regency Energy Partners L.P.
5.88%, 03/01/2022 | | | 1,484,534 | |
| | | | | 1,550,000 | | | Sunoco Logistics Partners Operations L.P.
4.25%, 04/01/2024 | | | 1,340,562 | |
| | | | | | | | Tesoro Logistics L.P. | |
| | | | | 605,000 | | | 5.50%, 10/15/2019(1) | | | 586,850 | |
| | | | | 905,000 | | | 6.25%, 10/15/2022(1) | | | 857,488 | |
| | | | | | | | Williams Partners L.P. | |
| | | | | 6,110,000 | | | 3.60%, 03/15/2022 | | | 4,805,020 | |
| | | | | 1,140,000 | | | 4.30%, 03/04/2024 | | | 903,383 | |
| | | | | | | | | | | | |
| | | | | | | | | | | 25,365,488 | |
| | | | | | | | | | | | |
| | | | | | | Real Estate - 0.2% | |
| | | | | 5,110,000 | | | ProLogis L.P.
3.35%, 02/01/2021 | | | 5,174,268 | |
| | | | | | | | | | | | |
| | | | | | | Real Estate Investment Trusts - 1.3% | |
| | | | | | | | American Tower Corp. | |
| | | | | 3,065,000 | | | 3.40%, 02/15/2019 | | | 3,144,043 | |
| | | | | 1,760,000 | | | 4.50%, 01/15/2018 | | | 1,835,492 | |
| | | | | 3,650,000 | | | Brandywine Operating Partnership L.P.
3.95%, 02/15/2023 | | | 3,553,290 | |
| | | | | | | | Duke Realty L.P. | |
| | | | | 2,530,000 | | | 3.63%, 04/15/2023 | | | 2,471,979 | |
| | | | | 940,000 | | | 3.75%, 12/01/2024 | | | 914,261 | |
| | | | | | | | HCP, Inc. | |
| | | | | 3,100,000 | | | 4.00%, 06/01/2025 | | | 3,026,880 | |
| | | | | 2,810,000 | | | 4.25%, 11/15/2023 | | | 2,813,951 | |
| | | | | | | | Kimco Realty Corp. | |
| | | | | 3,610,000 | | | 3.13%, 06/01/2023 | | | 3,495,130 | |
| | | | | 1,485,000 | | | 3.40%, 11/01/2022 | | | 1,471,025 | |
| | | | | | | | Liberty Property L.P. | |
| | | | | 2,165,000 | | | 3.38%, 06/15/2023 | | | 2,053,357 | |
| | | | | 1,430,000 | | | 4.13%, 06/15/2022 | | | 1,446,291 | |
| | | | | 2,766,000 | | | Realty Income Corp.
3.25%, 10/15/2022 | | | 2,669,320 | |
| | | | | 1,245,000 | | | UDR, Inc.
3.70%, 10/01/2020 | | | 1,286,060 | |
| | | | | 1,275,000 | | | Ventas Realty L.P. / Ventas Capital Corp.
3.25%, 08/15/2022 | | | 1,241,201 | |
| | | | | 4,955,000 | | | Welltower, Inc.
4.50%, 01/15/2024 | | | 5,069,089 | |
| | | | | | | | | | | | |
| | | | | | | | | | | 36,491,369 | |
| | | | | | | | | | | | |
| | | | | | | Retail - 0.7% | |
| | | | | | | | CVS Health Corp. | |
| | | | | 6,580,000 | | | 2.80%, 07/20/2020 | | | 6,609,557 | |
| | | | | 2,020,000 | | | 3.88%, 07/20/2025 | | | 2,061,572 | |
| | | | | 3,800,000 | | | 5.13%, 07/20/2045 | | | 4,003,038 | |
The accompanying notes are an integral part of these financial statements.
|
| Hartford Total Return Bond HLS Fund |
Schedule of Investments – (continued)
December 31, 2015
| | | | | | | | | | | | |
Shares or Principal Amount | | Market Value† | |
| CORPORATE BONDS - 33.7% - (continued) | |
| | | | | | | Retail - 0.7% - (continued) | |
| | $ | | | | 1,684,857 | | | CVS Pass-Through Trust
8.35%, 07/10/2031(1) | | $ | 2,084,899 | |
| | | | | | | | Group 1 Automotive, Inc. | |
| | | | | 600,000 | | | 5.00%, 06/01/2022 | | | 594,000 | |
| | | | | 115,000 | | | 5.25%, 12/15/2023(1) | | | 113,850 | |
| | | | | 2,750,000 | | | Home Depot, Inc.
4.25%, 04/01/2046 | | | 2,811,300 | |
| | | | | 1,225,000 | | | McDonald’s Corp.
2.75%, 12/09/2020 | | | 1,224,156 | |
| | | | | 300,000 | | | Sally Holdings LLC / Sally Capital, Inc.
5.63%, 12/01/2025 | | | 303,000 | |
| | | | | | | | | | | | |
| | | | | | | | | | | 19,805,372 | |
| | | | | | | | | | | | |
| | | | | | | Savings & Loans - 0.3% | |
| | | | | | | | Nationwide Building Society | |
| | | | | 1,025,000 | | | 2.35%, 01/21/2020(1) | | | 1,018,108 | |
| | GBP | | | | 4,235,000 | | | 6.88%, 06/20/2019(2)(4)(5) | | | 6,258,845 | |
| | | | | | | | | | | | |
| | | | | | | | | | | 7,276,953 | |
| | | | | | | | | | | | |
| | | | | | | Semiconductors - 0.2% | |
| | | | | | | | NXP B.V. / NXP Funding LLC | |
| | $ | | | | 420,000 | | | 4.13%, 06/15/2020(1) | | | 420,000 | |
| | | | | 500,000 | | | 4.63%, 06/15/2022(1) | | | 491,250 | |
| | | | | 1,290,000 | | | QUALCOMM, Inc.
3.45%, 05/20/2025 | | | 1,237,315 | |
| | | | | 525,000 | | | Sensata Technologies B.V.
5.00%, 10/01/2025(1) | | | 513,188 | |
| | | | | 310,000 | | | Sensata Technologies UK Financing Co. plc
6.25%, 02/15/2026(1) | | | 322,400 | |
| | | | | 3,561,000 | | | TSMC Global Ltd.
1.63%, 04/03/2018(1) | | | 3,490,225 | |
| | | | | | | | | | | | |
| | | | | | | | | | | 6,474,378 | |
| | | | | | | | | | | | |
| | | | | | | Shipbuilding - 0.0% | |
| | | | | 145,000 | | | Huntington Ingalls Industries, Inc.
5.00%, 11/15/2025(1) | | | 147,175 | |
| | | | | | | | | | | | |
| | | | | | | Software - 0.5% | |
| | | | | 3,915,000 | | | Activision Blizzard, Inc.
5.63%, 09/15/2021(1) | | | 4,100,962 | |
| | | | | 1,850,000 | | | Audatex North America, Inc.
6.00%, 06/15/2021(1) | | | 1,863,875 | |
| | | | | | | | First Data Corp. | |
| | | | | 100,000 | | | 5.00%, 01/15/2024(1) | | | 99,500 | |
| | | | | 1,180,000 | | | 5.38%, 08/15/2023(1) | | | 1,185,900 | |
| | | | | 162,000 | | | 6.75%, 11/01/2020(1) | | | 169,898 | |
| | | | | 4,330,000 | | | Hewlett Packard Enterprise Co.
2.45%, 10/05/2017(1) | | | 4,326,328 | |
| | | | | | | | MSCI, Inc. | |
| | | | | 385,000 | | | 5.25%, 11/15/2024(1) | | | 390,775 | |
| | | | | 465,000 | | | 5.75%, 08/15/2025(1) | | | 476,625 | |
| | | | | 350,000 | | | Open Text Corp.
5.63%, 01/15/2023(1) | | | 346,500 | |
| | | | | | | | | | | | |
| | | | | | | | | | | 12,960,363 | |
| | | | | | | | | | | | |
| | | | | | | Telecommunications - 1.7% | |
| | | | | 345,000 | | | Altice Financing S.A.
6.63%, 02/15/2023(1) | | | 340,688 | |
| | | | | | | | AT&T, Inc. | |
| | | | | 1,245,000 | | | 4.50%, 05/15/2035 | | | 1,151,452 | |
| | | | | 3,095,000 | | | 4.75%, 05/15/2046 | | | 2,833,770 | |
| | | | | 205,000 | | | 5.80%, 02/15/2019 | | | 226,166 | |
| | | | | | | | | | | | |
Shares or Principal Amount | | Market Value† | |
| CORPORATE BONDS - 33.7% - (continued) | |
| | | | | | | Telecommunications - 1.7% - (continued) | |
| | $ | | | | 610,000 | | | CommScope, Inc.
4.38%, 06/15/2020(1) | | $ | 614,575 | |
| | | | | 3,005,000 | | | Digicel Group Ltd.
7.13%, 04/01/2022(4) | | | 2,253,750 | |
| | | | | 370,000 | | | Frontier Communications Corp.
10.50%, 09/15/2022(1) | | | 368,613 | |
| | | | | 7,400,000 | | | GTP Acquisition Partners I LLC
3.48%, 06/15/2050(1) | | | 7,285,300 | |
| | | | | 890,000 | | | Inmarsat Finance plc
4.88%, 05/15/2022(1) | | | 867,750 | |
| | | | | 955,000 | | | Nokia Oyj
6.63%, 05/15/2039 | | | 977,089 | |
| | | | | | | | Sprint Communications, Inc. | |
| | | | | 2,370,000 | | | 7.00%, 03/01/2020(1) | | | 2,375,925 | |
| | | | | 1,766,000 | | | 9.00%, 11/15/2018(1) | | | 1,858,715 | |
| | | | | | | | T-Mobile USA, Inc. | |
| | | | | 1,995,000 | | | 6.46%, 04/28/2019 | | | 2,054,491 | |
| | | | | 860,000 | | | 6.63%, 04/28/2021 | | | 892,250 | |
| | | | | | | | Verizon Communications, Inc. | |
| | | | | 6,623,000 | | | 4.27%, 01/15/2036 | | | 5,979,231 | |
| | | | | 3,185,000 | | | 4.40%, 11/01/2034 | | | 2,938,573 | |
| | | | | 4,926,000 | | | 4.52%, 09/15/2048 | | | 4,405,307 | |
| | | | | 8,189,000 | | | 4.67%, 03/15/2055 | | | 7,109,698 | |
| | | | | 1,240,000 | | | Wind Acquisition Finance S.A.
4.75%, 07/15/2020(1) | | | 1,227,600 | |
| | | | | | | | | | | | |
| | | | | | | | | | | 45,760,943 | |
| | | | | | | | | | | | |
| | | | | | | Transportation - 0.6% | |
| | | | | 1,180,000 | | | Canadian Pacific Railway Co.
9.45%, 08/01/2021 | | | 1,524,238 | |
| | | | | 5,625,000 | | | Kansas City Southern
3.00%, 05/15/2023(1) | | | 5,322,898 | |
| | | | | | | | Penske Truck Leasing Co. L.P. / PTL Finance Corp. | | | | |
| | | | | 970,000 | | | 2.50%, 06/15/2019(1) | | | 954,158 | |
| | | | | 5,380,000 | | | 2.88%, 07/17/2018(1) | | | 5,413,862 | |
| | | | | 1,490,000 | | | 4.88%, 07/11/2022(1) | | | 1,549,740 | |
| | | | | 1,435,000 | | | Ryder System, Inc.
2.55%, 06/01/2019 | | | 1,426,284 | |
| | | | | | | | | | | | |
| | | | | | | | | | | 16,191,180 | |
| | | | | | | | | | | | |
| | | |
| | | | | | | | Total Corporate Bonds
(cost $952,439,171) | | $ | 922,935,210 | |
| | | | | | | | | | | | |
| | | |
| | | | | | | | | | | | |
| FOREIGN GOVERNMENT OBLIGATIONS - 3.3% | |
| | | | | | | Angola - 0.0% | |
| | $ | | | | 1,130,000 | | | Republic of Angola
9.50%, 11/12/2025(1) | | $ | 1,050,900 | |
| | | | | | | | | | | | |
| | | | | | | Brazil - 0.3% | |
| | | | | | | | Brazil Notas do Tesouro Nacional Series B | | | | |
| | BRL | | | | 12,530,626 | | | 6.00%, 05/15/2019 (6) | | | 3,078,805 | |
| | | | | 22,725,269 | | | 6.00%, 08/15/2022 (6) | | | 5,395,365 | |
| | | | | 2,270,000 | | | Brazilian Government International Bond
10.25%, 01/10/2028 | | | 504,923 | |
| | | | | | | | | | | | |
| | | | | | | | | | | 8,979,093 | |
| | | | | | | | | | | | |
The accompanying notes are an integral part of these financial statements.
|
| Hartford Total Return Bond HLS Fund |
Schedule of Investments – (continued)
December 31, 2015
| | | | | | | | | | | | |
Shares or Principal Amount | | Market Value† | |
| FOREIGN GOVERNMENT OBLIGATIONS - 3.3% - (continued) | |
| | | | | | | Cameroon - 0.1% | |
| | $ | | | | 3,796,000 | | | Republic of Cameroon International Bond
9.50%, 11/19/2025(1) | | $ | 3,530,280 | |
| | | | | | | | | | | | |
| | | | | | | Colombia - 0.1% | |
| | | | | | | | Colombian TES | | | | |
| | COP | | | | 7,567,097,460 | | | 3.00%, 03/25/2033 (6) | | | 2,022,040 | |
| | | | | 3,536,334,053 | | | 3.50%, 03/10/2021 (6) | | | 1,117,529 | |
| | | | | | | | | | | | |
| | | | | | | | | | | 3,139,569 | |
| | | | | | | | | | | | |
| | | | | | | Costa Rica - 0.1% | |
| | CRC | | | | 756,700,000 | | | Costa Rica Government International Bond
9.20%, 03/27/2019(1) | | | 1,470,850 | |
| | | | | | | | | | | | |
| | | | | | | Dominican Republic - 0.1% | |
| | $ | | | | 2,990,000 | | | Dominican Republic International Bond
5.50%, 01/27/2025(1) | | | 2,877,875 | |
| | | | | | | | | | | | |
| | | | | | | Gabon - 0.1% | |
| | | | | 3,355,000 | | | Gabon Government International Bond
6.38%, 12/12/2024(4) | | | 2,662,461 | |
| | | | | | | | | | | | |
| | | | | | | Hungary - 0.0% | |
| | HUF | | | | 137,490,000 | | | Hungary Government Bond
5.50%, 06/24/2025 | | | 553,483 | |
| | | | | | | | | | | | |
| | | | | | | Indonesia - 0.4% | |
| | $ | | | | 4,305,000 | | | Indonesia Government International Bond
4.75%, 01/08/2026(1) | | | 4,251,885 | |
| | | | | | | | Indonesia Treasury Bond | |
| | IDR | | | | 63,456,000,000 | | | 7.00%, 05/15/2027 | | | 3,955,907 | |
| | | | | 45,837,000,000 | | | 8.38%, 03/15/2034 | | | 3,113,724 | |
| | | | | | | | | | | | |
| | | | | | | | | | | 11,321,516 | |
| | | | | | | | | | | | |
| | | | | | | Jamaica - 0.1% | |
| | $ | | | | 1,435,000 | | | Jamaica Government International Bond
6.75%, 04/28/2028 | | | 1,424,237 | |
| | | | | | | | | | | | |
| | | | | | | Malaysia - 0.1% | |
| | MYR | | | | 8,670,000 | | | Malaysia Government Bond
3.49%, 03/31/2020 | | | 2,009,891 | |
| | | | | | | | | | | | |
| | | | | | | Mexico - 0.3% | |
| | MXN | | | | 37,392,300 | | | Mexican Bonos
10.00%, 12/05/2024 | | | 2,731,214 | |
| | | | | | | | Mexico Government International Bond | |
| | $ | | | | 5,950,000 | | | 4.60%, 01/23/2046 | | | 5,265,773 | |
| | GBP | | | | 460,000 | | | 5.63%, 03/19/2114 | | | 620,477 | |
| | | | | | | | | | | | |
| | | | | | | | | | | 8,617,464 | |
| | | | | | | | | | | | |
| | | | | | | Peru - 0.2% | |
| | PEN | | | | 15,541,000 | | | Peru Government Bond
5.20%, 09/12/2023 | | | 4,077,550 | |
| | $ | | | | 1,635,000 | | | Peruvian Government International Bond
4.13%, 08/25/2027 | | | 1,602,300 | |
| | | | | | | | | | | | |
| | | | | | | | | | | 5,679,850 | |
| | | | | | | | | | | | |
| | | | | | | Poland - 0.1% | |
| | PLN | | | | 6,262,000 | | | Poland Government Bond
3.25%, 07/25/2025 | | | 1,641,881 | |
| | | | | | | | | | | | |
| | | | | | | Romania - 0.0% | |
| | RON | | | | 2,030,000 | | | Romania Government Bond
5.85%, 04/26/2023 | | | 562,837 | |
| | | | | | | | | | | | |
| | | | | | | | | | | | |
Shares or Principal Amount | | Market Value† | |
| FOREIGN GOVERNMENT OBLIGATIONS - 3.3% - (continued) | |
| | | | | | | Russia - 0.2% | |
| | | | | | | | Russian Federal Bond - OFZ | | | | |
| | RUB | | | | 100,485,000 | | | 7.50%, 02/27/2019 | | $ | 1,292,127 | |
| | | | | 348,065,000 | | | 14.42%, 01/29/2020(2) | | | 4,894,366 | |
| | | | | | | | | | | | |
| | | | | | | | | | | 6,186,493 | |
| | | | | | | | | | | | |
| | | | | | | South Africa - 0.1% | |
| | ZAR | | | | 44,965,000 | | | South Africa Government Bond
7.75%, 02/28/2023 | | | 2,640,985 | |
| | | | | | | | | | | | |
| | | | | | | Thailand - 0.1% | |
| | THB | | | | 56,979,000 | | | Thailand Government Bond
3.85%, 12/12/2025 | | | 1,767,468 | |
| | | | | | | | | | | | |
| | | | | | | Tunisia - 0.1% | |
| | $ | | | | 2,975,000 | | | Banque Centrale de Tunisie S.A.
5.75%, 01/30/2025(4) | | | 2,574,773 | |
| | | | | | | | | | | | |
| | | | | | | Turkey - 0.3% | |
| | | | | | | | Turkey Government Bond | |
| | TRY | | | | 17,081,003 | | | 2.00%, 04/16/2025 (6) | | | 5,498,321 | |
| | | | | 6,207,668 | | | 2.50%, 05/04/2016 (6) | | | 2,119,492 | |
| | | | | 5,240,000 | | | 7.10%, 03/08/2023 | | | 1,484,553 | |
| | | | | | | | | | | | |
| | | | | | | | | | | 9,102,366 | |
| | | | | | | | | | | | |
| | | | | | | Uruguay - 0.5% | |
| | | | | | | | Uruguay Government International Bond | | | | |
| | UYU | | | | 98,773,607 | | | 3.70%, 06/26/2037 (6) | | | 2,583,831 | |
| | | | | 160,538,455 | | | 4.25%, 04/05/2027 (6) | | | 4,848,621 | |
| | $ | | | | 4,590,000 | | | 4.38%, 10/27/2027 | | | 4,509,675 | |
| | UYU | | | | 35,545,044 | | | 4.38%, 12/15/2028 (6) | | | 1,069,381 | |
| | | | | | | | | | | | |
| | | | | | | | | | | 13,011,508 | |
| | | | | | | | | | | | |
| | | |
| | | | | | | | Total Foreign Government Obligations
(cost $100,184,951) | | $ | 90,805,780 | |
| | | | | | | | | | | | |
|
| MUNICIPAL BONDS - 1.1% | |
| | | | | | | Development - 0.1% | |
| | | | | | | | State of California | |
| | $ | | | | 790,000 | | | 7.60%, 11/01/2040 | | $ | 1,172,558 | |
| | | | | 175,000 | | | 7.63%, 03/01/2040 | | | 254,847 | |
| | | | | | | | | | | | |
| | | | | | | | | | | 1,427,405 | |
| | | | | | | | | | | | |
| | | | | | | General - 0.3% | |
| | | | | 4,560,000 | | | Chicago Transit Auth
6.90%, 12/01/2040 | | | 5,299,723 | |
| | | | | | | | Puerto Rico Commonwealth Gov’t Employees Retirement System | | | | |
| | | | | 3,325,000 | | | 6.15%, 07/01/2038 | | | 989,187 | |
| | | | | 1,575,000 | | | 6.20%, 07/01/2039 | | | 468,563 | |
| | | | | 7,965,000 | | | 6.30%, 07/01/2043 | | | 2,369,587 | |
| | | | | 1,995,000 | | | 6.55%, 07/01/2058 | | | 593,513 | |
| | | | | | | | | | | | |
| | | | | | | | | | | 9,720,573 | |
| | | | | | | | | | | | |
| | | | | | | General Obligation - 0.4% | |
| | | | | 6,650,000 | | | California State GO, Taxable
7.55%, 04/01/2039 | | | 9,659,192 | |
| | | | | 2,300,000 | | | Illinois State, GO
5.10%, 06/01/2033 | | | 2,174,995 | |
| | | | | | | | | | | | |
| | | | | | | | | | | 11,834,187 | |
| | | | | | | | | | | | |
| | | | | | | Higher Education - 0.2% | |
| | | | | 5,580,000 | | | University of California
4.60%, 05/15/2031 | | | 5,947,666 | |
| | | | | | | | | | | | |
The accompanying notes are an integral part of these financial statements.
|
| Hartford Total Return Bond HLS Fund |
Schedule of Investments – (continued)
December 31, 2015
| | | | | | | | | | | | |
Shares or Principal Amount | | Market Value† | |
| MUNICIPAL BONDS - 1.1% - (continued) | |
| | | | | | | Utility - Electric - 0.1% | |
| | $ | | | | 1,485,000 | | | Municipal Electric Auth. Georgia
6.64%, 04/01/2057 | | $ | 1,782,163 | |
| | | | | | | | | | | | |
| | | |
| | | | | | | | Total Municipal Bonds
(cost $33,898,344) | | $ | 30,711,994 | |
| | | | | | | | | | | | |
| | | |
| | | | | | | | | | | | |
| SENIOR FLOATING RATE INTERESTS - 5.8%(7) | |
| | | | | | | Advertising - 0.0% | |
| | $ | | | | 875,425 | | | Acosta Holdco, Inc.
4.25%, 09/26/2021 | | $ | 830,717 | |
| | | | | | | | | | | | |
| | | | | | | Aerospace/Defense - 0.1% | |
| | | | | 1,759,091 | | | BE Aerospace, Inc.
4.00%, 12/16/2021 | | | 1,755,133 | |
| | | | | 259,760 | | | DigitalGlobe, Inc.
4.75%, 01/31/2020 | | | 254,349 | |
| | | | | 992,861 | | | Transdigm, Inc.
3.50%, 05/14/2022 | | | 959,530 | |
| | | | | | | | | | | | |
| | | | | | | | | | | 2,969,012 | |
| | | | | | | | | | | | |
| | | | | | | Agriculture - 0.0% | |
| | | | | 721,641 | | | Pinnacle Operating Corp.
4.75%, 11/15/2018 | | | 685,559 | |
| | | | | | | | | | | | |
| | | | | | | Airlines - 0.0% | |
| | | | | 940,900 | | | Delta Air Lines, Inc.
3.25%, 10/18/2018 | | | 936,327 | |
| | | | | | | | | | | | |
| | | | | | | Auto Manufacturers - 0.2% | |
| | | | | | | | Chrysler Group LLC | |
| | | | | 1,515,500 | | | 3.25%, 12/31/2018 | | | 1,499,587 | |
| | | | | 2,634,637 | | | 3.50%, 05/24/2017 | | | 2,623,282 | |
| | | | | 527,350 | | | Jaguar Holding Co.
4.25%, 08/18/2022 | | | 511,529 | |
| | | | | 542,193 | | | MPG Holdco I Inc.
3.75%, 10/20/2021 | | | 528,893 | |
| | | | | | | | | | | | |
| | | | | | | | | | | 5,163,291 | |
| | | | | | | | | | | | |
| | | | | | | Auto Parts & Equipment - 0.1% | |
| | | | | 455,707 | | | Affinia Group Intermediate Holdings, Inc.
4.75%, 04/27/2020 | | | 453,716 | |
| | | | | 768,300 | | | CS Intermediate Holdco 2 LLC
4.00%, 04/04/2021 | | | 754,855 | |
| | | | | 1,627,261 | | | Tower Automotive Holdings USA LLC
4.00%, 04/23/2020 | | | 1,554,034 | |
| | | | | | | | | | | | |
| | | | | | | | | | | 2,762,605 | |
| | | | | | | | | | | | |
| | | | | | | Chemicals - 0.2% | |
| | | | | 468,415 | | | AIlnex (Luxembourg) & Cy SCA
4.50%, 10/03/2019 | | | 464,611 | |
| | | | | 243,038 | | | AIlnex USA, Inc.
4.50%, 10/03/2019 | | | 241,065 | |
| | | | | 1,149,225 | | | Chemours Co.
3.75%, 05/12/2022 | | | 1,049,622 | |
| | | | | 3,435,734 | | | Ineos U.S. Finance LLC
3.75%, 05/04/2018 | | | 3,340,289 | |
| | | | | 606,290 | | | Nexeo Solutions LLC
5.00%, 09/08/2017 | | | 575,599 | |
| | | | | 681,848 | | | Univar, Inc.
4.25%, 07/01/2022 | | | 658,644 | |
| | | | | | | | | | | | |
| | | | | | | | | | | 6,329,830 | |
| | | | | | | | | | | | |
| | | | | | | | | | | | |
Shares or Principal Amount | | Market Value† | |
| SENIOR FLOATING RATE INTERESTS - 5.8%(7) - (continued) | |
| | | | | | | Coal - 0.1% | |
| | $ | | | | 540,000 | | | American Energy - Marcellus LLC
5.25%, 08/04/2020 | | $ | 141,750 | |
| | | | | 2,865,808 | | | Arch Coal, Inc.
6.25%, 05/16/2018 | | | 1,261,758 | |
| | | | | | | | | | | | |
| | | | | | | | | | | 1,403,508 | |
| | | | | | | | | | | | |
| | | | | | | Commercial Services - 0.1% | |
| | | | | 989,147 | | | Moneygram International, Inc.
4.25%, 03/27/2020 | | | 900,945 | |
| | | | | 649,406 | | | ON Assignment, Inc.
3.75%, 06/03/2022 | | | 645,886 | |
| | | | | 1,262,883 | | | ServiceMaster Co.
4.25%, 07/01/2021 | | | 1,247,097 | |
| | | | | | | | | | | | |
| | | | | | | | | | | 2,793,928 | |
| | | | | | | | | | | | |
| | | | | | | Distribution/Wholesale - 0.0% | |
| | | | | 730,850 | | | ABC Supply Co., Inc.
3.50%, 04/16/2020 | | | 723,768 | |
| | | | | | | | | | | | |
| | | | | | | Diversified Financial Services - 0.1% | |
| | | | | 765,000 | | | Delos Finance S.a.r.l.
3.50%, 03/06/2021 | | | 761,037 | |
| | | | | 292,054 | | | TransFirst, Inc.
4.75%, 11/12/2021 | | | 289,186 | |
| | | | | 1,084,426 | | | Walter Investment Management Corp.
4.75%, 12/19/2020 | | | 929,223 | |
| | | | | | | | | | | | |
| | | | | | | | | | | 1,979,446 | |
| | | | | | | | | | | | |
| | | | | | | Electric - 0.1% | |
| | | | | 1,367,007 | | | Calpine Corp.
3.25%, 01/31/2022 | | | 1,291,822 | |
| | | | | 625,000 | | | Chief Exploration & Development LLC
7.50%, 05/12/2021 | | | 416,669 | |
| | | | | 600,000 | | | Energy Future Intermediate Holding Co. LLC
4.25%, 06/19/2016 | | | 597,150 | |
| | | | | 2,128,209 | | | Seadrill Partners Finco LLC
4.00%, 02/21/2021 | | | 879,652 | |
| | | | | 800,000 | | | Texas Competitive Electric Holdings Co. LLC
4.73%, 10/10/2017(8) | | | 246,800 | |
| | | | | | | | | | | | |
| | | | | | | | | | | 3,432,093 | |
| | | | | | | | | | | | |
| | | | | | | Electronics - 0.1% | |
| | | | | 2,810,547 | | | CDW LLC
3.25%, 04/29/2020 | | | 2,736,068 | |
| | | | | | | | | | | | |
| | | | | | | Entertainment - 0.0% | |
| | | | | 579,150 | | | Scientific Games International, Inc.
6.00%, 10/01/2021 | | | 526,198 | |
| | | | | | | | | | | | |
| | | | | | | Food - 0.2% | |
| | | | | | | | Albertsons LLC | |
| | | | | 798,963 | | | 5.50%, 08/25/2021 | | | 791,277 | |
| | | | | 310,000 | | | 5.50%, 12/21/2022 | | | 307,830 | |
| | | | | 999,688 | | | Aramark Services, Inc.
3.25%, 02/24/2021 | | | 988,441 | |
| | | | | 395,000 | | | B&G Foods, Inc.
3.75%, 11/02/2022 | | | 394,135 | |
| | | | | 458,850 | | | Hostess Brands LLC
4.50%, 08/03/2022 | | | 455,982 | |
| | | | | 1,105,000 | | | JBS USA LLC
4.00%, 10/30/2022 | | | 1,100,856 | |
The accompanying notes are an integral part of these financial statements.
|
| Hartford Total Return Bond HLS Fund |
Schedule of Investments – (continued)
December 31, 2015
| | | | | | | | | | | | |
Shares or Principal Amount | | Market Value† | |
| SENIOR FLOATING RATE INTERESTS - 5.8%(7) - (continued) | |
| | | | | | | Food - 0.2% - (continued) | |
| | $ | | | | 1,124,150 | | | U.S. Foods, Inc.
4.50%, 03/31/2019 | | $ | 1,108,220 | |
| | | | | | | | | | | | |
| | | | | | | | | | | 5,146,741 | |
| | | | | | | | | | | | |
| | | | | | | Food Service - 0.0% | |
| | | | | 591,000 | | | Hearthside Food Solutions
4.50%, 06/02/2021 | | | 578,193 | |
| | | | | | | | | | | | |
| | | | | | | Forest Products & Paper - 0.0% | |
| | | | | 834,554 | | | Wilsonart LLC
4.00%, 10/31/2019 | | | 812,296 | |
| | | | | | | | | | | | |
| | | | | | | Healthcare-Products - 0.1% | |
| | | | | 1,498,313 | | | Mallinckrodt International Finance S.A.
3.25%, 03/19/2021 | | | 1,449,618 | |
| | | | | 433,913 | | | Sterigenics-Nordion Holdings LLC
4.25%, 05/15/2022 | | | 420,895 | |
| | | | | | | | | | | | |
| | | | | | | | | | | 1,870,513 | |
| | | | | | | | | | | | |
| | | | | | | Healthcare-Services - 0.5% | |
| | | | | 1,176,133 | | | American Renal Holdings, Inc.
4.50%, 09/20/2019 | | | 1,152,610 | |
| | | | | 201,925 | | | Catalent Pharma Solutions, Inc.
4.25%, 05/20/2021 | | | 199,906 | |
| | | | | 370,313 | | | CDRH Parent, Inc.
5.25%, 07/01/2021 | | | 289,770 | |
| | | | | | | | Community Health Systems, Inc. | |
| | | | | 1,687,250 | | | 3.66%, 12/31/2018 | | | 1,661,233 | |
| | | | | 491,286 | | | 3.75%, 12/31/2019 | | | 478,085 | |
| | | | | 903,953 | | | 4.00%, 01/27/2021 | | | 888,459 | |
| | | | | 1,817,325 | | | DaVita HealthCare Partners, Inc.
3.50%, 06/24/2021 | | | 1,807,475 | |
| | | | | 840,000 | | | Envision Healthcare Corp.
4.50%, 10/28/2022 | | | 833,700 | |
| | | | | 2,135,838 | | | HCA, Inc.
3.36%, 05/01/2018 | | | 2,131,844 | |
| | | | | 1,008,636 | | | IMS Health, Inc.
3.50%, 03/17/2021 | | | 983,420 | |
| | | | | 428,447 | | | Opal Acquisition, Inc.
5.00%, 11/27/2020 | | | 346,327 | |
| | | | | 1,585,850 | | | Ortho-Clinical Diagnostics, Inc.
4.75%, 06/30/2021 | | | 1,338,061 | |
| | | | | 514,800 | | | Surgery Center Holdings, Inc.
5.25%, 11/03/2020 | | | 507,505 | |
| | | | | 1,395,000 | | | U.S. Renal Care, Inc.
0.00%, 12/31/2022(9) | | | 1,381,050 | |
| | | | | | | | | | | | |
| | | | | | | | | | | 13,999,445 | |
| | | | | | | | | | | | |
| | | | | | | Insurance - 0.5% | |
| | | | | | | | Asurion LLC | |
| | | | | 583,150 | | | 5.00%, 05/24/2019 | | | 545,065 | |
| | | | | 1,811,477 | | | 5.00%, 08/04/2022 | | | 1,652,067 | |
| | | | | 1,870,000 | | | 8.50%, 03/03/2021 | | | 1,584,825 | |
| | | | | 794,625 | | | CGSC of Delaware Holdings Corp.
5.00%, 04/16/2020 | | | 760,194 | |
| | | | | 4,603,928 | | | Evertec Group LLC
3.25%, 04/17/2020 | | | 4,412,082 | |
| | | | | 413,166 | | | National Financial Partners Corp.
4.50%, 07/01/2020 | | | 395,949 | |
| | | | | | | | Sedgwick Claims Management Services, Inc. | |
| | | | | 2,922,461 | | | 3.75%, 03/01/2021 | | | 2,798,256 | |
| | | | | 1,250,000 | | | 6.75%, 02/28/2022 | | | 1,125,000 | |
| | | | | 999,738 | | | USI, Inc.
4.25%, 12/27/2019 | | | 965,497 | |
| | | | | | | | | | | | |
| | | | | | | | | | | 14,238,935 | |
| | | | | | | | | | | | |
| | | | | | | | | | | | |
Shares or Principal Amount | | Market Value† | |
| SENIOR FLOATING RATE INTERESTS - 5.8%(7) - (continued) | |
| | | | | | | Internet - 0.1% | |
| | $ | | | | 731,466 | | | Lands’ End, Inc.
4.25%, 04/04/2021 | | $ | 629,061 | |
| | | | | 1,802,057 | | | Zayo Group LLC / Zayo Capital, Inc.
3.75%, 05/06/2021 | | | 1,769,548 | |
| | | | | | | | | | | | |
| | | | | | | | | | | 2,398,609 | |
| | | | | | | | | | | | |
| | | | | | | Leisure Time - 0.2% | |
| | | | | 1,060,462 | | | Aristocrat Leisure Ltd.
4.75%, 10/20/2021 | | | 1,054,406 | |
| | | | | | | | Delta 2 (LUX) S.a.r.l. | |
| | | | | 2,675,000 | | | 4.75%, 07/30/2021 | | | 2,580,118 | |
| | | | | 1,390,000 | | | 7.75%, 07/31/2022 | | | 1,278,105 | |
| | | | | | | | | | | | |
| | | | | | | | | | | 4,912,629 | |
| | | | | | | | | | | | |
| | | | | | | Lodging - 0.3% | |
| | | | | 3,460,431 | | | Caesars Entertainment Operating Co.
11.25%, 03/01/2017(10) | | | 3,059,020 | |
| | | | | 783,075 | | | Caesars Growth Properties Holdings LLC
6.25%, 05/08/2021 | | | 685,191 | |
| | | | | 512,425 | | | Eldorado Resorts LLC
4.25%, 07/13/2022 | | | 507,301 | |
| | | | | 995,313 | | | Hilton Worldwide Finance LLC
3.50%, 10/26/2020 | | | 992,516 | |
| | | | | 1,186,672 | | | La Quinta Intermediate Holdings LLC
3.75%, 04/14/2021 | | | 1,154,038 | |
| | | | | 1,343,450 | | | MGM Resorts International
3.50%, 12/20/2019 | | | 1,323,298 | |
| | | | | 364,237 | | | Station Casinos LLC
4.25%, 03/02/2020 | | | 356,271 | |
| | | | | | | | | | | | |
| | | | | | | | | | | 8,077,635 | |
| | | | | | | | | | | | |
| | | | | | | Machinery-Construction & Mining - 0.1% | |
| | | | | 1,547,380 | | | American Rock Salt Holdings LLC
4.75%, 05/20/2021 | | | 1,474,855 | |
| | | | | 608,122 | | | Neff Rental LLC
7.25%, 06/09/2021 | | | 492,578 | |
| | | | | | | | | | | | |
| | | | | | | | | | | 1,967,433 | |
| | | | | | | | | | | | |
| | | | | | | Machinery-Diversified - 0.1% | |
| | | | | 1,876,250 | | | Gates Global, Inc.
4.25%, 07/05/2021 | | | 1,755,626 | |
| | | | | | | | | | | | |
| | | | | | | Media - 0.4% | |
| | | | | 938,866 | | | Advantage Sales & Marketing, Inc.
4.25%, 07/23/2021 | | | 901,048 | |
| | | | | 1,778,970 | | | AVSC Holding Corp.
4.50%, 01/24/2021 | | | 1,705,588 | |
| | | | | | | | Charter Communications Operating LLC | |
| | | | | 2,998,125 | | | 3.00%, 07/01/2020 | | | 2,938,792 | |
| | | | | 375,000 | | | 3.50%, 01/24/2023 | | | 374,220 | |
| | | | | 434,850 | | | Media General, Inc.
4.00%, 07/31/2020 | | | 428,462 | |
| | | | | 710,000 | | | Neptune Finco Corp.
5.00%, 10/09/2022 | | | 708,005 | |
| | | | | 1,029,600 | | | Numericable U.S. LLC
4.50%, 05/21/2020 | | | 989,446 | |
| | | | | 1,816,566 | | | Tribune Media Co.
3.75%, 12/27/2020 | | | 1,786,484 | |
| | | | | 1,952,632 | | | Virgin Media Investment Holdings Ltd.
3.50%, 06/30/2023 | | | 1,909,615 | |
| | | | | | | | | | | | |
| | | | | | | | | | | 11,741,660 | |
| | | | | | | | | | | | |
The accompanying notes are an integral part of these financial statements.
|
| Hartford Total Return Bond HLS Fund |
Schedule of Investments – (continued)
December 31, 2015
| | | | | | | | | | | | |
Shares or Principal Amount | | Market Value† | |
| SENIOR FLOATING RATE INTERESTS - 5.8%(7) - (continued) | |
| | | | | | | Metal Fabricate/Hardware - 0.0% | |
| | $ | | | | 1,306,159 | | | Rexnord LLC
4.00%, 08/21/2020 | | $ | 1,262,900 | |
| | | | | | | | | | | | |
| | | | | | | Mining - 0.1% | |
| | | | | 461,775 | | | Ardagh Holdings USA, Inc.
4.00%, 12/17/2019 | | | 453,002 | |
| | | | | 2,017,270 | | | FMG Resources August 2006 Pty Ltd.
4.25%, 06/30/2019 | | | 1,490,460 | |
| | | | | 639,462 | | | Minerals Technologies, Inc.
3.77%, 05/09/2021 | | | 636,264 | |
| | | | | | | | | | | | |
| | | | | | | | | | | 2,579,726 | |
| | | | | | | | | | | | |
| | | | | | | Miscellaneous Manufacturing - 0.0% | |
| | | | | 216,126 | | | Husky Injection Molding Systems Ltd.
4.25%, 06/30/2021 | | | 207,211 | |
| | | | | | | | | | | | |
| | | | | | | Oil & Gas - 0.1% | |
| | | | | 533,250 | | | Drillships Ocean Ventures, Inc.
5.50%, 07/25/2021 | | | 249,294 | |
| | | | | 1,514,040 | | | Fieldwood Energy LLC
3.88%, 09/28/2018 | | | 984,126 | |
| | | | | 600,000 | | | Templar Energy LLC
8.50%, 11/25/2020 | | | 63,000 | |
| | | | | | | | | | | | |
| | | | | | | | | | | 1,296,420 | |
| | | | | | | | | | | | |
| | | | | | | Packaging & Containers - 0.3% | |
| | | | | 3,282,188 | | | Berry Plastics Holding Corp.
3.50%, 02/08/2020 | | | 3,214,312 | |
| | | | | 1,227,868 | | | BWAY Holding Co., Inc.
5.50%, 08/14/2020 | | | 1,174,922 | |
| | | | | 516,155 | | | Mauser U.S. Corp.
4.50%, 07/31/2021 | | | 503,251 | |
| | | | | 339,150 | | | Owens-Illinois, Inc.
3.50%, 08/06/2022 | | | 337,244 | |
| | | | | 1,846,731 | | | Reynolds Group Holdings, Inc.
4.50%, 12/01/2018 | | | 1,826,343 | |
| | | | | 709,167 | | | Signode Industrial Group U.S., Inc.
3.75%, 05/01/2021 | | | 682,573 | |
| | | | | | | | | | | | |
| | | | | | | | | | | 7,738,645 | |
| | | | | | | | | | | | |
| | | | | | | Pharmaceuticals - 0.1% | |
| | | | | 1,400,000 | | | Endo Luxembourg Finance Company I S.a r.l.
3.75%, 09/26/2022 | | | 1,379,588 | |
| | | | | 875,619 | | | Valeant Pharmaceuticals International, Inc.
4.00%, 04/01/2022 | | | 840,376 | |
| | | | | | | | | | | | |
| | | | | | | | | | | 2,219,964 | |
| | | | | | | | | | | | |
| | | | | | | Pipelines - 0.1% | |
| | | | | 738,882 | | | Energy Transfer Equity L.P.
4.00%, 12/02/2019 | | | 661,300 | |
| | | | | 1,404,375 | | | EP Energy LLC
4.50%, 04/30/2019 | | | 1,084,880 | |
| | | | | 807,175 | | | Philadelphia Energy Solutions LLC
6.25%, 04/04/2018 | | | 758,744 | |
| | | | | | | | | | | | |
| | | | | | | | | | | 2,504,924 | |
| | | | | | | | | | | | |
| | | | | | | Real Estate - 0.1% | |
| | | | | | | | DTZ U.S. Borrower LLC | |
| | | | | 995,000 | | | 4.25%, 11/04/2021 | | | 969,190 | |
| | | | | 415,000 | | | 9.25%, 11/04/2022 | | | 408,082 | |
| | | | | | | | | | | | |
Shares or Principal Amount | | Market Value† | |
| SENIOR FLOATING RATE INTERESTS - 5.8%(7) - (continued) | |
| | | | | | | Real Estate - 0.1% - (continued) | |
| | $ | | | | 245,000 | | | Equinix, Inc.
0.00%, 11/20/2022(9) | | $ | 245,612 | |
| | | | | | | | | | | | |
| | | | | | | | | | | 1,622,884 | |
| | | | | | | | | | | | |
| | | | | | | Retail - 0.3% | |
| | | | | 511,138 | | | Bass Pro Group LLC
4.00%, 06/05/2020 | | | 491,116 | |
| | | | | 604,125 | | | Burger King
3.75%, 12/12/2021 | | | 598,084 | |
| | | | | 205,000 | | | Coty, Inc.
3.75%, 10/27/2022 | | | 203,079 | |
| | | | | 675,017 | | | Dollar Tree, Inc.
3.50%, 07/06/2022 | | | 672,067 | |
| | | | | 410,000 | | | Galleria Co.
0.00%, 10/22/2022(9) | | | 406,158 | |
| | | | | 936,739 | | | Michaels Stores, Inc.
4.00%, 01/28/2020 | | | 929,320 | |
| | | | | 1,555,727 | | | Neiman Marcus Group, Inc.
4.25%, 10/25/2020 | | | 1,372,929 | |
| | | | | 570,413 | | | Party City Holdings, Inc.
4.25%, 08/19/2022 | | | 552,947 | |
| | | | | 1,815,875 | | | PetSmart, Inc.
4.25%, 03/11/2022 | | | 1,765,485 | |
| | | | | 250,000 | | | Rite Aid Corp.
5.75%, 08/21/2020 | | | 250,125 | |
| | | | | 570,000 | | | Staples, Inc.
0.00%, 04/07/2021(9) | | | 562,636 | |
| | | | | | | | | | | | |
| | | | | | | | | | | 7,803,946 | |
| | | | | | | | | | | | |
| | | | | | | Semiconductors - 0.2% | |
| | | | | | | | Avago Technologies Cayman Ltd. | |
| | | | | 1,550,000 | | | 0.00%, 11/06/2022(9) | | | 1,531,602 | |
| | | | | 1,284,025 | | | 3.75%, 05/06/2021 | | | 1,279,749 | |
| | | | | 868,189 | | | Lattice Semiconductor Corp.
5.25%, 03/10/2021 | | | 807,416 | |
| | | | | | | | NXP B.V. | |
| | | | | 1,045,274 | | | 3.25%, 01/11/2020 | | | 1,030,640 | |
| | | | | 1,105,000 | | | 3.75%, 12/07/2020 | | | 1,098,646 | |
| | | | | | | | | | | | |
| | | | | | | | | | | 5,748,053 | |
| | | | | | | | | | | | |
| | | | | | | Software - 0.6% | |
| | | | | 358,200 | | | Epicor Software Corp.
4.75%, 06/01/2022 | | | 348,862 | |
| | | | | | | | First Data Corp. | |
| | | | | 5,740,000 | | | 3.92%, 03/24/2018 | | | 5,657,861 | |
| | | | | 845,000 | | | 4.42%, 03/24/2021 | | | 840,775 | |
| | | | | 835,152 | | | Hyland Software, Inc.
4.75%, 07/01/2022 | | | 821,372 | |
| | | | | 1,626,921 | | | Infor U.S., Inc.
3.75%, 06/03/2020 | | | 1,523,888 | |
| | | | | | | | Kronos, Inc. | |
| | | | | 2,693,237 | | | 4.50%, 10/30/2019 | | | 2,644,436 | |
| | | | | 593,762 | | | 9.75%, 04/30/2020 | | | 588,816 | |
| | | | | | | | SS&C Technologies, Inc. | |
| | | | | 1,086,813 | | | 4.01%, 07/08/2022 | | | 1,077,303 | |
| | | | | 160,518 | | | 4.02%, 07/08/2022 | | | 159,114 | |
| | | | | 1,675,504 | | | Verint Systems, Inc.
3.50%, 09/06/2019 | | | 1,664,613 | |
| | | | | | | | | | | | |
| | | | | | | | | | | 15,327,040 | |
| | | | | | | | | | | | |
The accompanying notes are an integral part of these financial statements.
|
| Hartford Total Return Bond HLS Fund |
Schedule of Investments – (continued)
December 31, 2015
| | | | | | | | | | | | |
Shares or Principal Amount | | Market Value† | |
| SENIOR FLOATING RATE INTERESTS - 5.8%(7) - (continued) | |
| | | | | | | Telecommunications - 0.3% | |
| | $ | | | | 572,125 | | | Altice Financing S.A.
5.25%, 02/04/2022 | | $ | 569,087 | |
| | | | | 304,238 | | | CommScope, Inc.
3.83%, 12/29/2022 | | | 301,767 | |
| | | | | 2,020,000 | | | Level 3 Financing, Inc.
3.50%, 05/31/2022 | | | 1,986,165 | |
| | | | | 427,806 | | | LTS Buyer LLC
4.00%, 04/13/2020 | | | 415,614 | |
| | | | | 1,825,866 | | | SBA Senior Finance II LLC
3.25%, 03/24/2021 | | | 1,784,784 | |
| | | | | 425,000 | | | T-Mobile USA, Inc.
3.50%, 11/09/2022 | | | 424,537 | |
| | | | | 205,000 | | | TransFirst, Inc.
9.00%, 11/12/2022 | | | 200,131 | |
| | | | | 2,625,000 | | | Ziggo Financing Partnership
3.50%, 01/15/2022 | | | 2,545,882 | |
| | | | | | | | | | | | |
| | | | | | | | | | | 8,227,967 | |
| | | | | | | | | | | | |
| | | | | | | Transportation - 0.0% | |
| | | | | | | | Kenan Advantage Group, Inc. | |
| | | | | 60,000 | | | 1.50%, 01/23/2017(11) | | | 59,250 | |
| | | | | 539,648 | | | 4.00%, 07/31/2022 | | | 532,902 | |
| | | | | | | | | | | | |
| | | | | | | | | | | 592,152 | |
| | | | | | | | | | | | |
| | | | | | | Trucking & Leasing - 0.0% | |
| | | | | 1,161,000 | | | Consolidated Container Co.
5.00%, 07/03/2019 | | | 1,049,544 | |
| | | | | | | | | | | | |
| | | |
| | | | | | | | Total Senior Floating Rate Interests
(cost $169,708,990) | | $ | 158,953,441 | |
| | | | | | | | | | | | |
| | | |
| | | | | | | | | | | | |
| U.S. GOVERNMENT AGENCIES - 39.7% | |
| | | | | | | FHLMC - 12.9% | |
| | $ | | | | 318,131 | | | 0.00%, 11/15/2036(12) | | $ | 283,820 | |
| | | | | 65,156,398 | | | 0.32%, 10/25/2020(2)(3) | | | 635,294 | |
| | | | | 31,149,431 | | | 1.97%, 08/25/2018(2)(3) | | | 1,340,229 | |
| | | | | 2,880,000 | | | 2.27%, 10/25/2027(2) | | | 2,840,575 | |
| | | | | 3,200,000 | | | 2.62%, 02/25/2024(2) | | | 3,189,270 | |
| | | | | 3,301,000 | | | 2.82%, 10/25/2024(2) | | | 3,310,501 | |
| | | | | 3,100,000 | | | 2.82%, 01/25/2025(2) | | | 3,147,431 | |
| | | | | 3,500,000 | | | 2.92%, 08/25/2024(2) | | | 3,530,598 | |
| | | | | 4,823,750 | | | 3.00%, 08/01/2029 | | | 4,989,114 | |
| | | | | 16,350,000 | | | 3.00%, 01/01/2031(13) | | | 16,848,243 | |
| | | | | 1,478,622 | | | 3.00%, 03/15/2033 | | | 200,709 | |
| | | | | 34,350,000 | | | 3.00%, 01/01/2046(13) | | | 34,293,261 | |
| | | | | 11,200,000 | | | 3.02%, 12/25/2027(2) | | | 11,138,392 | |
| | | | | 3,300,000 | | | 3.07%, 03/25/2028(2) | | | 3,268,579 | |
| | | | | 14,126,000 | | | 3.27%, 04/25/2028(2) | | | 14,098,025 | |
| | | | | 9,200,000 | | | 3.50%, 01/01/2031(13) | | | 9,616,012 | |
| | | | | 9,306,386 | | | 3.50%, 08/01/2034 | | | 9,712,843 | |
| | | | | 51,850,000 | | | 3.50%, 01/01/2046(13) | | | 53,373,597 | |
| | | | | 9,772,729 | | | 4.00%, 08/01/2025 | | | 10,321,137 | |
| | | | | 6,732,754 | | | 4.00%, 07/15/2027(3) | | | 788,507 | |
| | | | | 7,272,723 | | | 4.00%, 05/01/2042 | | | 7,704,711 | |
| | | | | 1,983,135 | | | 4.00%, 08/01/2042 | | | 2,098,873 | |
| | | | | 3,286,644 | | | 4.00%, 09/01/2042 | | | 3,483,537 | |
| | | | | 968,643 | | | 4.00%, 07/01/2044 | | | 1,028,981 | |
| | | | | 483,282 | | | 4.00%, 06/01/2045 | | | 511,341 | |
| | | | | 81,775,000 | | | 4.00%, 01/01/2046(13) | | | 86,386,014 | |
| | | | | 1,578,488 | | | 4.50%, 03/15/2041 | | | 1,796,724 | |
| | | | | 20,850,000 | | | 4.50%, 01/01/2046(13) | | | 22,460,663 | |
| | | | | | | | | | | | |
Shares or Principal Amount | | Market Value† | |
| U.S. GOVERNMENT AGENCIES - 39.7% - (continued) | |
| | | | | | | FHLMC - 12.9% - (continued) | |
| | $ | | | | 5,582,327 | | | 4.75%, 07/15/2039 | | $ | 6,027,161 | |
| | | | | 2,640 | | | 5.50%, 10/01/2018 | | | 2,734 | |
| | | | | 103,003 | | | 5.50%, 03/01/2028 | | | 113,756 | |
| | | | | 189,216 | | | 5.50%, 04/01/2033 | | | 209,869 | |
| | | | | 1,859,557 | | | 5.50%, 05/01/2034 | | | 2,067,163 | |
| | | | | 3,076 | | | 5.50%, 11/01/2035 | | | 3,398 | |
| | | | | 51,872 | | | 5.50%, 05/01/2037 | | | 57,718 | |
| | | | | 118,591 | | | 5.50%, 11/01/2037 | | | 131,915 | |
| | | | | 202,373 | | | 5.50%, 02/01/2038 | | | 225,198 | |
| | | | | 85,665 | | | 5.50%, 04/01/2038 | | | 95,312 | |
| | | | | 104,995 | | | 5.50%, 06/01/2038 | | | 116,665 | |
| | | | | 11,835,837 | | | 5.50%, 08/01/2038 | | | 13,163,841 | |
| | | | | 1,118,333 | | | 5.50%, 09/01/2038 | | | 1,243,381 | |
| | | | | 22,732 | | | 5.50%, 12/01/2039 | | | 25,267 | |
| | | | | 300,443 | | | 5.50%, 02/01/2040 | | | 334,196 | |
| | | | | 946,107 | | | 5.50%, 05/01/2040 | | | 1,052,317 | |
| | | | | 979,493 | | | 5.50%, 08/01/2040 | | | 1,089,555 | |
| | | | | 3,664,444 | | | 5.50%, 06/01/2041 | | | 4,075,327 | |
| | | | | 87 | | | 6.00%, 04/01/2017 | | | 89 | |
| | | | | 99 | | | 6.00%, 05/01/2017 | | | 101 | |
| | | | | 159 | | | 6.00%, 07/01/2017 | | | 161 | |
| | | | | 1,796 | | | 6.00%, 07/01/2029 | | | 2,018 | |
| | | | | 469,126 | | | 6.00%, 10/01/2032 | | | 535,718 | |
| | | | | 511,554 | | | 6.00%, 11/01/2032 | | | 576,399 | |
| | | | | 569,538 | | | 6.00%, 12/01/2032 | | | 650,900 | |
| | | | | 34,715 | | | 6.00%, 11/01/2033 | | | 39,673 | |
| | | | | 62,049 | | | 6.00%, 01/01/2034 | | | 70,853 | |
| | | | | 38,773 | | | 6.00%, 02/01/2034 | | | 44,310 | |
| | | | | 472,630 | | | 6.00%, 08/01/2034 | | | 539,909 | |
| | | | | 519,322 | | | 6.00%, 09/01/2034 | | | 593,491 | |
| | | | | 447,516 | | | 6.00%, 01/01/2035 | | | 508,450 | |
| | | | | 4,065,994 | | | 6.00%, 11/01/2037 | | | 4,591,838 | |
| | | | | 1,100,000 | | | 6.00%, 01/01/2046(13) | | | 1,237,027 | |
| | | | | 275 | | | 6.50%, 07/01/2031 | | | 313 | |
| | | | | 374 | | | 6.50%, 08/01/2032 | | | 426 | |
| | | | | 1,997,859 | | | 6.50%, 07/15/2036 | | | 2,256,372 | |
| | | | | 292,653 | | | 6.50%, 12/01/2037 | | | 333,290 | |
| | | | | 218 | | | 7.50%, 09/01/2029 | | | 233 | |
| | | | | 3,359 | | | 7.50%, 11/01/2031 | | | 3,841 | |
| | | | | | | | | | | | |
| | | | | | | | | | | 354,417,166 | |
| | | | | | | | | | | | |
| | | | | | | FNMA - 17.9% | |
| | | | | 263,781 | | | 0.00%, 03/25/2036(12) | | | 226,079 | |
| | | | | 2,341,208 | | | 0.00%, 06/25/2036(12) | | | 2,081,679 | |
| | | | | 8,757,123 | | | 1.88%, 04/25/2055(2)(3) | | | 595,003 | |
| | | | | 135,000 | | | 2.44%, 01/01/2023 | | | 133,624 | |
| | | | | 1,709,360 | | | 2.50%, 06/25/2028(3) | | | 156,587 | |
| | | | | 35,075,000 | | | 2.50%, 01/01/2031(13) | | | 35,352,271 | |
| | | | | 307,183 | | | 2.50%, 01/01/2043 | | | 296,851 | |
| | | | | 6,358,541 | | | 2.50%, 02/01/2043 | | | 6,145,072 | |
| | | | | 2,654,471 | | | 2.50%, 03/01/2043 | | | 2,565,068 | |
| | | | | 5,220,067 | | | 2.50%, 05/01/2043 | | | 5,044,463 | |
| | | | | 3,222,727 | | | 2.50%, 06/01/2043 | | | 3,114,177 | |
| | | | | 2,399,997 | | | 2.50%, 04/01/2045 | | | 2,319,133 | |
| | | | | 1,874,582 | | | 2.64%, 03/01/2027 | | | 1,812,981 | |
| | | | | 9,780,000 | | | 2.65%, 06/01/2025 | | | 9,559,784 | |
| | | | | 13,400,000 | | | 2.69%, 04/01/2025 | | | 13,144,031 | |
| | | | | 4,115,000 | | | 2.78%, 02/01/2027 | | | 4,026,794 | |
| | | | | 5,090,000 | | | 2.82%, 07/01/2025 | | | 5,050,731 | |
| | | | | 4,705,000 | | | 2.85%, 02/01/2027 | | | 4,623,243 | |
| | | | | 11,555,658 | | | 3.00%, 01/25/2028(3) | | | 1,149,729 | |
The accompanying notes are an integral part of these financial statements.
|
| Hartford Total Return Bond HLS Fund |
Schedule of Investments – (continued)
December 31, 2015
| | | | | | | | | | | | |
Shares or Principal Amount | | Market Value† | |
| U.S. GOVERNMENT AGENCIES - 39.7% - (continued) | |
| | | | | | | FNMA - 17.9% - (continued) | |
| | $ | | | | 4,824,256 | | | 3.00%, 04/25/2028(3) | | $ | 493,013 | |
| | | | | 31,625,000 | | | 3.00%, 01/01/2046(13) | | | 31,625,288 | |
| | | | | 540,000 | | | 3.16%, 12/01/2026 | | | 543,495 | |
| | | | | 1,055,000 | | | 3.21%, 05/01/2023 | | | 1,090,870 | |
| | | | | 505,200 | | | 3.24%, 12/01/2026 | | | 513,067 | |
| | | | | 1,454,490 | | | 3.26%, 05/01/2024 | | | 1,500,796 | |
| | | | | 575,000 | | | 3.34%, 04/01/2024 | | | 596,444 | |
| | | | | 217,011 | | | 3.45%, 01/01/2024 | | | 226,478 | |
| | | | | 228,777 | | | 3.47%, 01/01/2024 | | | 239,062 | |
| | | | | 2,678,865 | | | 3.50%, 05/25/2030(3) | | | 350,188 | |
| | | | | 4,400,000 | | | 3.50%, 01/01/2031(13) | | | 4,607,799 | |
| | | | | 209,700,000 | | | 3.50%, 01/01/2046(13) | | | 216,352,355 | |
| | | | | 571,888 | | | 3.67%, 08/01/2023 | | | 605,667 | |
| | | | | 155,000 | | | 3.70%, 10/01/2023 | | | 164,084 | |
| | | | | 2,053,281 | | | 3.74%, 06/01/2026 | | | 2,166,556 | |
| | | | | 210,000 | | | 3.76%, 03/01/2024 | | | 223,167 | |
| | | | | 315,000 | | | 3.86%, 12/01/2025 | | | 335,456 | |
| | | | | 165,000 | | | 3.86%, 11/01/2023 | | | 176,447 | |
| | | | | 542,789 | | | 3.87%, 10/01/2025 | | | 578,243 | |
| | | | | 694,196 | | | 3.89%, 05/01/2030 | | | 758,542 | |
| | | | | 730,286 | | | 3.93%, 10/01/2023 | | | 782,992 | |
| | | | | 303,459 | | | 3.96%, 05/01/2034 | | | 336,551 | |
| | | | | 195,000 | | | 3.97%, 05/01/2029 | | | 207,672 | |
| | | | | 4,899,905 | | | 4.00%, 06/01/2025 | | | 5,198,997 | |
| | | | | 1,364,114 | | | 4.00%, 10/01/2025 | | | 1,446,923 | |
| | | | | 1,203,817 | | | 4.00%, 03/25/2042(3) | | | 185,340 | |
| | | | | 1,126,971 | | | 4.00%, 08/01/2042 | | | 1,195,142 | |
| | | | | 707,358 | | | 4.00%, 11/25/2042(3) | | | 118,005 | |
| | | | | 1,595,730 | | | 4.00%, 04/01/2045 | | | 1,692,075 | |
| | | | | 1,905,322 | | | 4.00%, 05/01/2045 | | | 2,020,358 | |
| | | | | 1,467,734 | | | 4.00%, 06/01/2045 | | | 1,556,351 | |
| | | | | 26,475,000 | | | 4.00%, 01/01/2046(13) | | | 28,015,101 | |
| | | | | 2,852,020 | | | 4.02%, 11/01/2028 | | | 3,051,599 | |
| | | | | 453,956 | | | 4.06%, 10/01/2028 | | | 494,223 | |
| | | | | 1,655,718 | | | 4.50%, 04/01/2025 | | | 1,788,235 | |
| | | | | 1,806,443 | | | 4.50%, 07/25/2027(3) | | | 212,730 | |
| | | | | 7,639,131 | | | 4.50%, 08/01/2040 | | | 8,311,705 | |
| | | | | 7,689,665 | | | 4.50%, 10/01/2040 | | | 8,323,241 | |
| | | | | 3,413,970 | | | 4.50%, 10/01/2041 | | | 3,687,181 | |
| | | | | 3,204,066 | | | 4.50%, 09/01/2043 | | | 3,460,478 | |
| | | | | 4,075,000 | | | 4.50%, 01/01/2046(13) | | | 4,400,491 | |
| | | | | 4,351 | | | 5.00%, 02/01/2018 | | | 4,506 | |
| | | | | 90,432 | | | 5.00%, 04/01/2018 | | | 93,637 | |
| | | | | 597,055 | | | 5.00%, 05/01/2018 | | | 618,798 | |
| | | | | 694,080 | | | 5.00%, 06/01/2018 | | | 719,097 | |
| | | | | 18,152 | | | 5.00%, 07/01/2018 | | | 18,864 | |
| | | | | 208,096 | | | 5.00%, 09/01/2018 | | | 215,814 | |
| | | | | 458,945 | | | 5.00%, 01/01/2020 | | | 475,207 | |
| | | | | 1,625,111 | | | 5.00%, 06/01/2022 | | | 1,746,495 | |
| | | | | 594,418 | | | 5.00%, 06/01/2025 | | | 643,783 | |
| | | | | 1,503,746 | | | 5.00%, 04/25/2038 | | | 1,617,388 | |
| | | | | 13,400,000 | | | 5.00%, 01/01/2046(13) | | | 14,749,108 | |
| | | | | 1,099,087 | | | 5.46%, 05/25/2042(2)(3) | | | 142,963 | |
| | | | | 7,063 | | | 5.50%, 01/01/2017 | | | 7,165 | |
| | | | | 103,994 | | | 5.50%, 02/01/2018 | | | 106,476 | |
| | | | | 2,841 | | | 5.50%, 06/01/2018 | | | 2,947 | �� |
| | | | | 17,484 | | | 5.50%, 11/01/2018 | | | 18,002 | |
| | | | | 87,180 | | | 5.50%, 08/01/2019 | | | 91,821 | |
| | | | | 166,287 | | | 5.50%, 09/01/2019 | | | 173,661 | |
| | | | | 43,524 | | | 5.50%, 10/01/2019 | | | 45,490 | |
| | | | | 18,761 | | | 5.50%, 01/01/2020 | | | 19,506 | |
| | | | | | | | | | | | |
Shares or Principal Amount | | Market Value† | |
| U.S. GOVERNMENT AGENCIES - 39.7% - (continued) | |
| | | | | | | FNMA - 17.9% - (continued) | |
| | $ | | | | 13,139 | | | 5.50%, 03/01/2020 | | $ | 13,734 | |
| | | | | 842,155 | | | 5.50%, 05/01/2020 | | | 887,178 | |
| | | | | 389,552 | | | 5.50%, 06/01/2022 | | | 420,840 | |
| | | | | 475,651 | | | 5.50%, 06/01/2033 | | | 534,754 | |
| | | | | 436,890 | | | 5.50%, 08/01/2033 | | | 491,282 | |
| | | | | 2,206,575 | | | 5.50%, 09/01/2033 | | | 2,475,070 | |
| | | | | 2,142,957 | | | 5.50%, 12/01/2033 | | | 2,431,093 | |
| | | | | 1,846,488 | | | 5.50%, 01/01/2034 | | | 2,072,198 | |
| | | | | 7,995,716 | | | 5.50%, 11/01/2035 | | | 9,006,157 | |
| | | | | 2,588,261 | | | 5.50%, 04/01/2036 | | | 2,902,495 | |
| | | | | 1,927,615 | | | 5.50%, 09/01/2036 | | | 2,164,622 | |
| | | | | 221,906 | | | 5.50%, 01/01/2037 | | | 247,491 | |
| | | | | 1,311,192 | | | 5.50%, 04/25/2037 | | | 1,456,709 | |
| | | | | 5,209,296 | | | 5.50%, 06/25/2042(3) | | | 850,124 | |
| | | | | 3,168 | | | 6.00%, 04/01/2016 | | | 3,170 | |
| | | | | 9,162 | | | 6.00%, 06/01/2016 | | | 9,203 | |
| | | | | 7,721 | | | 6.00%, 07/01/2016 | | | 7,743 | |
| | | | | 231 | | | 6.00%, 10/01/2016 | | | 233 | |
| | | | | 5,507 | | | 6.00%, 03/01/2022 | | | 5,937 | |
| | | | | 755,331 | | | 6.00%, 12/01/2032 | | | 854,351 | |
| | | | | 907,404 | | | 6.00%, 01/01/2033 | | | 1,031,969 | |
| | | | | 149,954 | | | 6.00%, 02/01/2033 | | | 169,631 | |
| | | | | 1,061,375 | | | 6.00%, 03/01/2033 | | | 1,205,701 | |
| | | | | 2,308,572 | | | 6.00%, 02/01/2037 | | | 2,605,150 | |
| | | | | 22 | | | 6.50%, 07/01/2016 | | | 23 | |
| | | | | 548 | | | 6.50%, 05/01/2017 | | | 559 | |
| | | | | 1,819 | | | 6.50%, 05/01/2031 | | | 2,079 | |
| | | | | 1,564 | | | 6.50%, 09/01/2031 | | | 1,813 | |
| | | | | 2,861 | | | 6.50%, 07/01/2032 | | | 3,282 | |
| | | | | 1 | | | 7.00%, 02/01/2016 | | | 1 | |
| | | | | 2,507 | | | 7.00%, 07/01/2029 | | | 2,907 | |
| | | | | 104 | | | 7.00%, 12/01/2030 | | | 107 | |
| | | | | 948 | | | 7.00%, 02/01/2032 | | | 1,039 | |
| | | | | 415 | | | 7.00%, 03/01/2032 | | | 482 | |
| | | | | 2,248 | | | 7.00%, 09/01/2032 | | | 2,418 | |
| | | | | 66,705 | | | 7.00%, 10/01/2037 | | | 68,973 | |
| | | | | 4,494 | | | 7.50%, 10/01/2022 | | | 5,019 | |
| | | | | 2,557 | | | 7.50%, 06/01/2027 | | | 3,028 | |
| | | | | 3,267 | | | 7.50%, 10/01/2029 | | | 3,431 | |
| | | | | 25,965 | | | 7.50%, 03/01/2030 | | | 29,783 | |
| | | | | 14,886 | | | 7.50%, 04/01/2030 | | | 16,816 | |
| | | | | 1,777 | | | 7.50%, 06/01/2030 | | | 2,092 | |
| | | | | 3,093 | | | 7.50%, 07/01/2030 | | | 3,554 | |
| | | | | 817 | | | 7.50%, 08/01/2030 | | | 953 | |
| | | | | 6,461 | | | 7.50%, 10/01/2030 | | | 6,584 | |
| | | | | 8,695 | | | 7.50%, 01/01/2031 | | | 8,941 | |
| | | | | 5,004 | | | 7.50%, 02/01/2031 | | | 5,200 | |
| | | | | 38,823 | | | 7.50%, 05/01/2031 | | | 47,556 | |
| | | | | 23,570 | | | 7.50%, 06/01/2031 | | | 26,663 | |
| | | | | 2,931 | | | 7.50%, 08/01/2031 | | | 3,425 | |
| | | | | 43,372 | | | 7.50%, 09/01/2031 | | | 45,528 | |
| | | | | 439 | | | 7.50%, 05/01/2032 | | | 520 | |
| | | | | 425 | | | 8.00%, 04/01/2032 | | | 427 | |
| | | | | | | | | | | | |
| | | | | | | | | | | 490,680,473 | |
| | | | | | | | | | | | |
| | | | | | | GNMA - 8.9% | |
| | | | | 11,939,044 | | | 3.00%, 03/15/2045 | | | 12,103,344 | |
| | | | | 557,715 | | | 3.00%, 04/15/2045 | | | 565,390 | |
| | | | | 2,944,766 | | | 3.00%, 06/20/2045 | | | 2,988,703 | |
| | | | | 7,650,344 | | | 3.00%, 07/15/2045 | | | 7,755,625 | |
| | | | | 18,751,665 | | | 3.00%, 07/20/2045 | | | 19,031,449 | |
The accompanying notes are an integral part of these financial statements.
|
| Hartford Total Return Bond HLS Fund |
Schedule of Investments – (continued)
December 31, 2015
| | | | | | | | | | | | |
Shares or Principal Amount | | Market Value† | |
| U.S. GOVERNMENT AGENCIES - 39.7% - (continued) | |
| | | | | | | GNMA - 8.9% - (continued) | |
| | $ | | | | 138,425 | | | 3.00%, 08/15/2045 | | $ | 140,330 | |
| | | | | 613,810 | | | 3.50%, 11/15/2042 | | | 642,546 | |
| | | | | 19,760 | | | 3.50%, 12/15/2042 | | | 20,614 | |
| | | | | 430,643 | | | 3.50%, 02/15/2043 | | | 448,442 | |
| | | | | 19,099 | | | 3.50%, 03/15/2043 | | | 19,922 | |
| | | | | 2,675,033 | | | 3.50%, 04/15/2043 | | | 2,790,306 | |
| | | | | 9,458,261 | | | 3.50%, 05/15/2043 | | | 9,863,263 | |
| | | | | 56,550,000 | | | 3.50%, 01/01/2046(13) | | | 58,951,170 | |
| | | | | 11,180,954 | | | 4.00%, 07/20/2040 | | | 11,975,524 | |
| | | | | 12,440,839 | | | 4.00%, 09/20/2040 | | | 13,324,768 | |
| | | | | 18,532,244 | | | 4.00%, 10/20/2040 | | | 19,857,311 | |
| | | | | 2,547,520 | | | 4.00%, 12/20/2040 | | | 2,723,429 | |
| | | | | 850,875 | | | 4.00%, 05/16/2042(3) | | | 123,408 | |
| | | | | 524,728 | | | 4.00%, 01/20/2044 | | | 120,885 | |
| | | | | 13,825,000 | | | 4.00%, 01/01/2046(13) | | | 14,681,500 | |
| | | | | 407,080 | | | 4.50%, 11/15/2039 | | | 439,839 | |
| | | | | 3,993,834 | | | 4.50%, 05/15/2040 | | | 4,357,924 | |
| | | | | 13,540,716 | | | 4.50%, 05/20/2040 | | | 14,749,930 | |
| | | | | 472,812 | | | 4.50%, 06/15/2041 | | | 509,646 | |
| | | | | 536,482 | | | 4.50%, 07/15/2041 | | | 584,563 | |
| | | | | 3,300,000 | | | 4.50%, 01/01/2046(13) | | | 3,545,437 | |
| | | | | 1,402,886 | | | 5.00%, 05/20/2040 | | | 1,550,044 | |
| | | | | 3,448,745 | | | 5.00%, 06/15/2041 | | | 3,806,776 | |
| | | | | 4,164,628 | | | 5.00%, 10/16/2041(3) | | | 726,011 | |
| | | | | 5,428,889 | | | 5.00%, 03/15/2044 | | | 5,992,581 | |
| | | | | 5,600,000 | | | 5.00%, 01/01/2046(13) | | | 6,134,853 | |
| | | | | 838,590 | | | 5.50%, 03/15/2033 | | | 940,454 | |
| | | | | 1,317,345 | | | 5.50%, 04/15/2033 | | | 1,515,991 | |
| | | | | 1,301,077 | | | 5.50%, 05/15/2033 | | | 1,496,963 | |
| | | | | 2,218,270 | | | 5.50%, 10/20/2034 | | | 2,472,258 | |
| | | | | 2,312 | | | 6.00%, 12/15/2023 | | | 2,594 | |
| | | | | 1,394 | | | 6.00%, 01/15/2029 | | | 1,575 | |
| | | | | 2,412 | | | 6.00%, 04/15/2029 | | | 2,784 | |
| | | | | 84,295 | | | 6.00%, 12/15/2031 | | | 97,215 | |
| | | | | 1,509 | | | 6.00%, 10/15/2032 | | | 1,743 | |
| | | | | 35,695 | | | 6.00%, 06/15/2033 | | | 41,234 | |
| | | | | 3,789 | | | 6.00%, 03/15/2034 | | | 4,250 | |
| | | | | 85,070 | | | 6.00%, 08/15/2034 | | | 96,160 | |
| | | | | 204,366 | | | 6.00%, 09/15/2034 | | | 235,779 | |
| | | | | 71,735 | | | 6.00%, 02/15/2035 | | | 81,123 | |
| | | | | 447,212 | | | 6.00%, 12/15/2035 | | | 513,653 | |
| | | | | 94,453 | | | 6.00%, 02/15/2036 | | | 105,954 | |
| | | | | 350,993 | | | 6.00%, 03/15/2036 | | | 402,494 | |
| | | | | 52,887 | | | 6.00%, 04/15/2036 | | | 59,327 | |
| | | | | 259,556 | | | 6.00%, 05/15/2036 | | | 299,362 | |
| | | | | 560,899 | | | 6.00%, 06/15/2036 | | | 643,227 | |
| | | | | 400,441 | | | 6.00%, 07/15/2036 | | | 458,594 | |
| | | | | 67,057 | | | 6.00%, 08/15/2036 | | | 77,136 | |
| | | | | 346,376 | | | 6.00%, 02/15/2037 | | | 397,097 | |
| | | | | 2,112 | | | 6.00%, 05/15/2037 | | | 2,386 | |
| | | | | 746,968 | | | 6.00%, 06/15/2037 | | | 859,601 | |
| | | | | 622,653 | | | 6.00%, 07/15/2037 | | | 703,958 | |
| | | | | 138,928 | | | 6.00%, 08/15/2037 | | | 158,691 | |
| | | | | 93,804 | | | 6.00%, 09/15/2037 | | | 105,227 | |
| | | | | 181,358 | | | 6.00%, 10/15/2037 | | | 204,991 | |
| | | | | 210,978 | | | 6.00%, 11/15/2037 | | | 238,408 | |
| | | | | 205,538 | | | 6.00%, 12/15/2037 | | | 235,452 | |
| | | | | 360,529 | | | 6.00%, 01/15/2038 | | | 410,780 | |
| | | | | 35,821 | | | 6.00%, 02/15/2038 | | �� | 40,511 | |
| | | | | 61,409 | | | 6.00%, 05/15/2038 | | | 69,512 | |
| | | | | 12,410 | | | 6.00%, 06/15/2038 | | | 14,024 | |
| | | | | | | | | | | | |
Shares or Principal Amount | | Market Value† | |
| U.S. GOVERNMENT AGENCIES - 39.7% - (continued) | |
| | | | | | | GNMA - 8.9% - (continued) | |
| | $ | | | | 86,991 | | | 6.00%, 08/15/2038 | | $ | 98,433 | |
| | | | | 251,538 | | | 6.00%, 09/15/2038 | | | 284,581 | |
| | | | | 248,830 | | | 6.00%, 10/15/2038 | | | 287,364 | |
| | | | | 558,911 | | | 6.00%, 11/15/2038 | | | 631,588 | |
| | | | | 332,514 | | | 6.00%, 12/15/2038 | | | 377,521 | |
| | | | | 3,545 | | | 6.00%, 01/15/2039 | | | 4,006 | |
| | | | | 44,960 | | | 6.00%, 08/15/2039 | | | 50,438 | |
| | | | | 179,277 | | | 6.00%, 11/15/2039 | | | 202,587 | |
| | | | | 143,878 | | | 6.00%, 02/15/2040 | | | 161,399 | |
| | | | | 1,875,202 | | | 6.00%, 06/15/2040 | | | 2,119,016 | |
| | | | | 359,673 | | | 6.00%, 07/15/2040 | | | 406,437 | |
| | | | | 1,921,431 | | | 6.00%, 06/15/2041 | | | 2,171,278 | |
| | | | | 29,561 | | | 6.50%, 06/15/2028 | | | 33,821 | |
| | | | | 992 | | | 6.50%, 07/15/2028 | | | 1,135 | |
| | | | | 4,695 | | | 6.50%, 08/15/2028 | | | 5,372 | |
| | | | | 21,832 | | | 6.50%, 09/15/2028 | | | 24,978 | |
| | | | | 18,955 | | | 6.50%, 10/15/2028 | | | 21,686 | |
| | | | | 6,868 | | | 6.50%, 11/15/2028 | | | 7,858 | |
| | | | | 13,719 | | | 6.50%, 12/15/2028 | | | 15,696 | |
| | | | | 21,251 | | | 6.50%, 01/15/2029 | | | 24,314 | |
| | | | | 41,661 | | | 6.50%, 02/15/2029 | | | 47,665 | |
| | | | | 383,896 | | | 6.50%, 03/15/2029 | | | 439,228 | |
| | | | | 53,708 | | | 6.50%, 04/15/2029 | | | 61,450 | |
| | | | | 34,080 | | | 6.50%, 05/15/2029 | | | 38,992 | |
| | | | | 225,725 | | | 6.50%, 06/15/2029 | | | 258,259 | |
| | | | | 21,165 | | | 6.50%, 07/15/2029 | | | 24,215 | |
| | | | | 667 | | | 6.50%, 03/15/2031 | | | 763 | |
| | | | | 312,328 | | | 6.50%, 04/15/2031 | | | 357,343 | |
| | | | | 95,827 | | | 6.50%, 05/15/2031 | | | 111,029 | |
| | | | | 15,009 | | | 6.50%, 06/15/2031 | | | 17,238 | |
| | | | | 304,169 | | | 6.50%, 07/15/2031 | | | 348,009 | |
| | | | | 176,443 | | | 6.50%, 08/15/2031 | | | 201,873 | |
| | | | | 179,664 | | | 6.50%, 09/15/2031 | | | 205,560 | |
| | | | | 172,464 | | | 6.50%, 10/15/2031 | | | 197,322 | |
| | | | | 630,747 | | | 6.50%, 11/15/2031 | | | 721,657 | |
| | | | | 93,954 | | | 6.50%, 12/15/2031 | | | 107,496 | |
| | | | | 416,026 | | | 6.50%, 01/15/2032 | | | 476,060 | |
| | | | | 97,925 | | | 6.50%, 02/15/2032 | | | 114,284 | |
| | | | | 86,988 | | | 6.50%, 03/15/2032 | | | 99,526 | |
| | | | | 311,255 | | | 6.50%, 04/15/2032 | | | 361,836 | |
| | | | | 1,103 | | | 6.50%, 05/15/2032 | | | 1,262 | |
| | | | | 81,767 | | | 6.50%, 06/15/2032 | | | 93,552 | |
| | | | | 1,333 | | | 6.50%, 09/15/2032 | | | 1,531 | |
| | | | | 11,279 | | | 7.00%, 06/20/2030 | | | 12,649 | |
| | | | | 1,265 | | | 7.00%, 02/15/2031 | | | 1,419 | |
| | | | | 217 | | | 7.00%, 06/15/2031 | | | 232 | |
| | | | | 236 | | | 7.00%, 08/15/2031 | | | 271 | |
| | | | | 894 | | | 8.50%, 11/15/2024 | | | 898 | |
| | | | | | | | | | | | |
| | | | | | | | | | | 244,747,168 | |
| | | | | | | | | | | | |
| | | |
| | | | | | | | Total U.S. Government Agencies
(cost $1,081,768,585) | | $ | 1,089,844,807 | |
| | | | | | | | | | | | |
| | | |
| | | | | | | | | | | | |
| U.S. GOVERNMENT SECURITIES - 2.6% | |
| | | | | | | U.S. Treasury Securities - 2.6% | | | |
| | | | | | | U.S. Treasury Bonds - 2.5% | | | |
| $ | | | | | 43,266,673 | | | 0.25%, 01/15/2025(6)(14) | | $ | 41,297,693 | |
| | | | | 1,350,000 | | | 2.50%, 02/15/2045(14) | | | 1,211,256 | |
| | | | | 2,800,000 | | | 3.00%, 11/15/2044(14)(15)(16) | | | 2,789,828 | |
| | | | | 5,595,000 | | | 3.00%, 05/15/2045(14) | | | 5,569,431 | |
The accompanying notes are an integral part of these financial statements.
|
| Hartford Total Return Bond HLS Fund |
Schedule of Investments – (continued)
December 31, 2015
| | | | | | | | | | | | |
Shares or Principal Amount | | Market Value† | |
| U.S. GOVERNMENT SECURITIES - 2.6% - (continued) | |
| | | | | | | U.S. Treasury Securities - 2.6% - (continued) | |
| $ | | | | | 9,544,000 | | | 3.00%, 11/15/2045 | | $ | 9,515,292 | |
| | | | | 9,260,000 | | | 3.13%, 08/15/2044(14)(15)(16) | | | 9,463,646 | |
| | | | | | | | | | | | |
| | | | | | | | | | | 69,847,146 | |
| | | | | | | | | | | | |
| | | | | | | U.S. Treasury Notes - 0.1% | | | |
| | | | | 1,300,000 | | | 0.50%, 09/30/2016(14) | | | 1,297,917 | |
| | | | | 200,000 | | | 2.38%, 08/15/2024(14) | | | 202,086 | |
| | | | | | | | | | | | |
| | | | | | | | | | | 1,500,003 | |
| | | | | | | | | | | | |
| | | |
| | | | | | | | Total U.S. Government Securities
(cost $74,427,132) | | $ | 71,347,149 | |
| | | | | | | | | | | | |
|
| PREFERRED STOCKS - 0.1% | |
| | | | | | | Banks - 0.1% | | | |
| | | | | 2,242 | | | U.S. Bancorp Series A | | $ | 1,782,457 | |
| | | | | | | | | | | | |
| | | | | | | Diversified Financials - 0.0% | | | |
| | | | | 30,000 | | | Citigroup Capital XIII | | | 779,700 | |
| | | | | 8,400 | | | Discover Financial Services Series B | | | 222,348 | |
| | | | | | | | | | | | |
| | | | | | | | | | | 1,002,048 | |
| | | | | | | | | | | | |
| | | |
| | | | | | | | Total Preferred Stocks
(cost $2,635,460) | | $ | 2,784,505 | |
| | | | | | | | | | | | |
| | | |
| | | | | | | | Total Long-Term Investments
(cost $3,340,490,605) | | $ | 3,287,450,387 | |
| | | | | | | | | | | | |
|
| SHORT-TERM INVESTMENTS - 3.2% | |
| | | | | | | Other Investment Pools & Funds -3.2% | |
| | | | | 88,216,749 | | | Federated Prime Obligations Fund | | $ | 88,216,749 | |
| | | | | | | | | | | | |
| | | |
| | | | | | | | Total Short-Term Investments
(cost $88,216,749) | | $ | 88,216,749 | |
| | | | | | | | | | | | |
| | | | | | | | | | | | | | |
| | | | | |
| | | | | | Total Investments Excluding Purchased Options
(cost $3,428,707,354) | | | 123.1 | % | | $ | 3,375,667,136 | |
| | | | | |
| | | | | | Total Purchased Options
(cost $30,292) | | | 0.0 | % | | $ | 18,238 | |
| | | | | | | | | | | | | | |
| | | | | |
| | | | | | Total Investments
(cost $3,428,737,646)^ | | | 123.1 | % | | $ | 3,375,685,374 | |
| | | | | | Other Assets and Liabilities | | | (23.1 | )% | | | (632,399,097 | ) |
| | | | | | | | | | | | | | |
| | | | | | Total Net Assets | | | 100.0 | % | | $ | 2,743,286,277 | |
| | | | | | | | | | | | | | |
The accompanying notes are an integral part of these financial statements.
|
| Hartford Total Return Bond HLS Fund |
Schedule of Investments – (continued)
December 31, 2015
| Note: | Percentage of investments as shown is the ratio of the total market value to total net assets. |
| | The Fund may refer to any one or more of the industry classifications used by one or more widely recognized market indices, ratings group indices and/or as defined by Fund management. Industry classifications may not be identical across all security types. |
| | Equity Industry classifications used in this report are the Global Industry Classification Standard, which was developed by and is the exclusive property and service mark of MSCI, Inc. and Standard & Poor’s. |
| | For Fund compliance purposes, the Fund may not use the same classification system shown in this report as these classifications are used for financial reporting purposes. |
| ^ | At December 31, 2015, the cost of securities for federal income tax purposes was $3,429,359,943 and the aggregate gross unrealized appreciation and depreciation based on that cost were: |
| | | | |
Unrealized Appreciation | | $ | 32,100,628 | |
Unrealized Depreciation | | | (85,775,197 | ) |
| | | | |
Net Unrealized Depreciation | | $ | (53,674,569 | ) |
| | | | |
| (1) | Securities issued within terms of a private placement memorandum, exempt from registration under Rule 144A under the Securities Act of 1933, as amended, and may be sold only to qualified institutional buyers. Unless otherwise indicated, these holdings are determined to be liquid. At December 31, 2015, the aggregate value of these securities was $738,395,539, which represents 26.9% of total net assets. |
| (2) | Variable rate securities; the rate reported is the coupon rate in effect at December 31, 2015. |
| (3) | Securities disclosed are interest-only strips. |
| (4) | These securities were sold to the Fund under Regulation S, rules governing offers and sales made outside the United States without registration under the Securities Act of 1933, as amended. The Fund may only be able to resell these securities in the United States if an exemption from registration under the federal and state securities laws is available, or the Fund may only be able to sell these securities outside of the United States (such as on a foreign exchange) to a non-U.S. person. Unless otherwise indicated, these holdings are determined to be liquid. At December 31, 2015, the aggregate value of these securities was $63,221,852, which represents 2.3% of total net assets. |
| (5) | Perpetual maturity security. Maturity date shown is the next call date or final legal maturity date, whichever comes first. |
| (6) | The principal amount for these securities are adjusted for inflation and the interest payments equal a fixed percentage of the inflation-adjusted principal amount. |
| (7) | Senior floating rate interests generally pay interest rates which are periodically adjusted by reference to a base short-term, floating lending rate plus a premium. The base lending rates are primarily the LIBOR, and secondarily the prime rate offered by one or more major United States banks (the “Prime Rate”) and the certificate of deposit rate or other base lending rates used by commercial lenders. Senior floating rate interests often require prepayments from excess cash flows or permit the borrower to repay at its election. The rate at which the borrower repays cannot be predicted with accuracy. As a result, the actual remaining maturity may be substantially less than the stated maturities shown. Unless otherwise noted, the interest rate disclosed for these securities represents the average coupon as of December 31, 2015. |
| (8) | The issuer is in bankruptcy. However, the investment held by the Fund is current with respect to interest payments. |
| (9) | All or a portion of this position represents an unsettled loan commitment. The coupon rate will be determined at time of settlement. |
| (10) | Non-income producing. For long-term debt securities, items identified are in default as to payment of interest and/or principal. |
| (11) | This security, or a portion of this security, has unfunded loan commitments. As of December 31, 2015, the aggregate value of the unfunded commitment was $59,250, which rounds to zero percent of total net assets. |
| (12) | Securities disclosed are principal-only strips. |
| (13) | Represents or includes a TBA transaction. |
| (14) | This security, or a portion of this security, has been pledged as collateral in connection with centrally cleared swap contracts. |
| (15) | This security, or a portion of this security, has been pledged as collateral in connection with futures contracts. |
| (16) | This security, or a portion of this security, has been pledged as collateral in connection with OTC swap contracts. |
The accompanying notes are an integral part of these financial statements.
|
| Hartford Total Return Bond HLS Fund |
Schedule of Investments – (continued)
December 31, 2015
| | | | | | | | | | | | | | | | | | | | | | | | | | | | | | | | |
| OTC Option Contracts Outstanding at December 31, 2015 | |
Description | | Counter-
party | | | Exercise Price/
FX Rate/ Rate | | | Expiration
Date | | | Number of
Contracts | | | Market
Value† | | | Premiums
Paid
(Received)
by Fund | | | Unrealized
Appreciation/
(Depreciation) | |
Purchased option contracts: | | | | | | | | | | | | | | | | | | | | | | | | | | | | | | | | |
Calls | | | | | | | | | | | | | | | | | | | | | | | | | | | | | | | | |
HKD Call/USD Put | | | GSC | | | | 7.75 HKD per USD | | | | 03/01/16 | | | | HKD | | | | 69,290,000 | | | $ | 18,238 | | | $ | 30,292 | | | $ | (12,054 | ) |
| | | | | | | | | | | | | | | | | | | | | | | | | | | | | | | | |
Total purchased option contracts | | | | 69,290,000 | | | $ | 18,238 | | | $ | 30,292 | | | $ | (12,054 | ) |
| | | | | | | | | | | | | | | | | | | | | | | | | | | | | | | | |
| | | | | | | | | | | | | | | | | | | | | | | | | | | | | | | | |
| OTC Swaption Contracts Outstanding at December 31, 2015 | |
Description | | Counter-
party | | | Exercise Price/
FX Rate/ Rate | | | Expiration
Date | | | Number of
Contracts | | | Market
Value† | | | Premiums
Paid
(Received)
by Fund | | | Unrealized
Appreciation/
(Depreciation) | |
Written swaption contracts: | | | | | | | | | | | | | | | | | | | | | | | | | | | | | | | | |
Calls | | | | | | | | | | | | | | | | | | | | | | | | | | | | | | | | |
Credit Default Swaption CDX.NA.IG.25 | | | JPM | | | | 97.50 USD | | | | 01/20/16 | | | | USD | | | | (69,695,000 | ) | | $ | (304,532 | ) | | $ | (207,343 | ) | | $ | (97,189 | ) |
| | | | | | | | | | | | | | | | | | | | | | | | | | | | | | | | |
Written swaption contracts: | | | | | | | | | | | | | | | | | | | | | | | | | | | | | | | | |
Puts | | | | | | | | | | | | | | | | | | | | | | | | | | | | | | | | |
Credit Default Swaption CDX.NA.IG.25 | | | JPM | | | | 97.50 USD | | | | 01/20/16 | | | | USD | | | | (69,690,000 | ) | | $ | (47,421 | ) | | $ | (137,638 | ) | | $ | 90,217 | |
| | | | | | | | | | | | | | | | | | | | | | | | | | | | | | | | |
Total written swaption contracts | | | | (139,385,000 | ) | | $ | (351,953 | ) | | $ | (344,981 | ) | | $ | (6,972 | ) |
| | | | | | | | | | | | | | | | | | | | | | | | | | | | | | | | |
| | | | | | | | | | | | | | | | | | | | |
| Futures Contracts Outstanding at December 31, 2015 | |
Description | | Number of
Contracts | | | Expiration
Date | | | Notional
Amount | | | Market
Value† | | | Unrealized
Appreciation/
(Depreciation) | |
Long position contracts: | | | | | | | | | | | | | | | | | | | | |
90 Day Euro Future | | | 569 | | | | 12/19/2016 | | | $ | 140,713,835 | | | $ | 140,500,325 | | | $ | (213,510 | ) |
U.S. Treasury 2-Year Note Future | | | 340 | | | | 03/31/2016 | | | | 73,939,135 | | | | 73,859,688 | | | | (79,447 | ) |
U.S. Treasury 5-Year Note Future | | | 6,125 | | | | 03/31/2016 | | | | 726,471,700 | | | | 724,711,917 | | | | (1,759,783 | ) |
U.S. Treasury CME Ultra Long Term Future | | | 346 | | | | 03/21/2016 | | | | 54,585,346 | | | | 54,905,875 | | | | 320,529 | |
U.S. Treasury Long Bond Future | | | 292 | | | | 03/21/2016 | | | | 44,950,263 | | | | 44,895,000 | | | | (55,263 | ) |
| | | | | | | | | | | | | | | | | | | | |
Total | | | $ | (1,787,474 | ) |
| | | | | | | | | | | | | | | | | | | | |
Short position contracts: | | | | | | | | | | | | | | | | | | | | |
90 Day Euro Future | | | 570 | | | | 12/18/2017 | | | $ | 140,259,482 | | | $ | 139,970,625 | | | $ | 288,857 | |
U.S. Treasury 10-Year Note Future | | | 3,428 | | | | 03/21/2016 | | | | 432,903,777 | | | | 431,606,625 | | | | 1,297,152 | |
| | | | | | | | | | | | | | | | | | | | |
Total | | | $ | 1,586,009 | |
| | | | | | | | | | | | | | | | | | | | |
Total futures contracts | | | $ | (201,465 | ) |
| | | | | | | | | | | | | | | | | | | | |
| | | | | | | | | | | | | | | | |
| TBA Sale Commitments Outstanding at December 31, 2015 | |
Description | | Principal
Amount | | | Maturity
Date | | | Market
Value† | | | Unrealized
Appreciation/
(Depreciation) | |
FHLMC, 5.00% | | $ | 2,900,000 | | | | 01/01/2046 | | | $ | (3,167,672 | ) | | $ | 12,812 | |
FHLMC, 5.50% | | | 5,100,000 | | | | 01/01/2046 | | | | (5,640,461 | ) | | | 28,110 | |
FNMA, 3.00% | | | 11,700,000 | | | | 01/01/2031 | | | | (12,052,673 | ) | | | 34,022 | |
FNMA, 4.00% | | | 9,400,000 | | | | 01/01/2031 | | | | (9,800,969 | ) | | | 13,218 | |
FNMA, 5.50% | | | 22,600,000 | | | | 01/01/2046 | | | | (25,192,733 | ) | | | 23,923 | |
FNMA, 6.00% | | | 7,200,000 | | | | 01/01/2046 | | | | (8,134,765 | ) | | | 10,235 | |
GNMA, 3.00% | | | 900,000 | | | | 01/01/2046 | | | | (912,199 | ) | | | (528 | ) |
GNMA, 4.00% | | | 89,100,000 | | | | 01/01/2046 | | | | (94,620,012 | ) | | | (196,004 | ) |
| | | | | | | | | | | | | | | | |
Total (proceeds $159,447,272) | | | $ | (159,521,484 | ) | | $ | (74,212 | ) |
| | | | | | | | | | | | | | | | |
The accompanying notes are an integral part of these financial statements.
|
| Hartford Total Return Bond HLS Fund |
Schedule of Investments – (continued)
December 31, 2015
| | At December 31, 2015, the aggregate market value of these securities represents (5.8)% of total net assets. |
| | | | | | | | | | | | | | | | | | | | | | | | | | | | | | | | |
| OTC Credit Default Swap Contracts Outstanding at December 31, 2015 | |
Reference Entity | | Counter-
party | | Notional
Amount(a) | | | (Pay)/Receive
Fixed Rate/
Implied Credit
Spread(b) | | Expiration
Date | | | Upfront
Premiums
Paid | | | Upfront
Premiums
Received | | | Market
Value† | | | Unrealized
Appreciation/
(Depreciation) | |
Credit default swaps on indices: | | | | | | | | | | | | | | | | | | | | | | | | | | | | | | | | |
Buy protection: | | | | | | | | | | | | | | | | | | | | | | | | | | | | | | | | |
ABX.HE.AA.06-1 | | BCLY | | | USD | | | | 259,063 | | | (0.32)% | | | 07/25/45 | | | $ | 146,373 | | | $ | — | | | $ | 51,265 | | | $ | (95,108 | ) |
ABX.HE.AA.06-1 | | BCLY | | | USD | | | | 299,968 | | | (0.32)% | | | 07/25/45 | | | | 169,484 | | | | — | | | | 59,359 | | | | (110,125 | ) |
ABX.HE.AA.06-1 | | BCLY | | | USD | | | | 1,554,378 | | | (0.32)% | | | 07/25/45 | | | | 472,142 | | | | — | | | | 307,589 | | | | (164,553 | ) |
ABX.HE.AAA.06-1 | | JPM | | | USD | | | | 150,794 | | | (0.18)% | | | 07/25/45 | | | | 3,590 | | | | — | | | | 2,985 | | | | (605 | ) |
ABX.HE.AAA.06-1 | | GSC | | | USD | | | | 18,053 | | | (0.18)% | | | 07/25/45 | | | | 1,478 | | | | — | | | | 357 | | | | (1,121 | ) |
ABX.HE.AAA.06-1 | | BOA | | | USD | | | | 183,714 | | | (0.18)% | | | 07/25/45 | | | | 9,989 | | | | — | | | | 3,637 | | | | (6,352 | ) |
ABX.HE.AAA.06-1 | | MSC | | | USD | | | | 139,113 | | | (0.18)% | | | 07/25/45 | | | | 11,390 | | | | — | | | | 2,755 | | | | (8,635 | ) |
ABX.HE.AAA.06-1 | | BCLY | | | USD | | | | 176,280 | | | (0.18)% | | | 07/25/45 | | | | 16,417 | | | | — | | | | 3,490 | | | | (12,927 | ) |
ABX.HE.AAA.06-1 | | BCLY | | | USD | | | | 190,085 | | | (0.18)% | | | 07/25/45 | | | | 21,898 | | | | — | | | | 3,764 | | | | (18,134 | ) |
ABX.HE.AAA.06-2 | | JPM | | | USD | | | | 941,823 | | | (0.11)% | | | 05/25/46 | | | | 125,117 | | | | — | | | | 109,765 | | | | (15,352 | ) |
ABX.HE.AAA.06-2 | | CSI | | | USD | | | | 500,490 | | | (0.11)% | | | 05/25/46 | | | | 114,384 | | | | — | | | | 95,972 | | | | (18,412 | ) |
ABX.HE.AAA.06-2 | | BOA | | | USD | | | | 4,590,700 | | | (0.11)% | | | 05/25/46 | | | | 927,543 | | | | — | | | | 880,292 | | | | (47,251 | ) |
ABX.HE.AAA.06-2 | | BOA | | | USD | | | | 1,584,601 | | | (0.11)% | | | 05/25/46 | | | | 360,497 | | | | — | | | | 184,678 | | | | (175,819 | ) |
ABX.HE.AAA.07-1 | | MSC | | | USD | | | | 190,613 | | | (0.09)% | | | 08/25/37 | | | | 46,964 | | | | — | | | | 43,822 | | | | (3,142 | ) |
ABX.HE.AAA.07-1 | | MSC | | | USD | | | | 2,349,592 | | | (0.09)% | | | 08/25/37 | | | | 549,693 | | | | — | | | | 540,176 | | | | (9,517 | ) |
ABX.HE.AAA.07-1 | | GSC | | | USD | | | | 1,742,744 | | | (0.09)% | | | 08/25/37 | | | | 419,819 | | | | — | | | | 400,660 | | | | (19,159 | ) |
ABX.HE.AAA.07-1 | | CSI | | | USD | | | | 4,236,268 | | | (0.09)% | | | 08/25/37 | | | | 1,173,387 | | | | — | | | | 973,927 | | | | (199,460 | ) |
ABX.HE.PENAAA.06-2 | | BCLY | | | USD | | | | 607,258 | | | (0.11)% | | | 05/25/46 | | | | 99,439 | | | | — | | | | 70,773 | | | | (28,666 | ) |
ABX.HE.PENAAA.06-2 | | JPM | | | USD | | | | 814,643 | | | (0.11)% | | | 05/25/46 | | | | 213,844 | | | | — | | | | 94,943 | | | | (118,901 | ) |
ABX.HE.PENAAA.06-2 | | GSC | | | USD | | | | 1,491,793 | | | (0.11)% | | | 05/25/46 | | | | 372,948 | | | | — | | | | 173,861 | | | | (199,087 | ) |
ABX.HE.PENAAA.06-2 | | JPM | | | USD | | | | 1,877,918 | | | (0.11)% | | | 05/25/46 | | | | 443,071 | | | | — | | | | 218,862 | | | | (224,209 | ) |
ABX.HE.PENAAA.06-2 | | MSC | | | USD | | | | 1,879,064 | | | (0.11)% | | | 05/25/46 | | | | 455,673 | | | | — | | | | 218,995 | | | | (236,678 | ) |
CDX.EMS.24 | | BCLY | | | USD | | | | 22,618,400 | | | (1.00)% | | | 12/20/20 | | | | 2,137,915 | | | | — | | | | 2,520,075 | | | | 382,160 | |
CDX.EMS.24 | | CBK | | | USD | | | | 19,306,000 | | | (1.00)% | | | 12/20/20 | | | | 1,871,089 | | | | — | | | | 2,151,017 | | | | 279,928 | |
CDX.EMS.24 | | BCLY | | | USD | | | | 69,927,900 | | | (1.00)% | | | 12/20/20 | | | | 7,514,949 | | | | — | | | | 7,791,158 | | | | 276,209 | |
CMBX.NA.A.7 | | JPM | | | USD | | | | 2,965,000 | | | (2.00)% | | | 01/17/47 | | | | — | | | | (60,130 | ) | | | 141,501 | | | | 201,631 | |
CMBX.NA.A.7 | | BCLY | | | USD | | | | 320,000 | | | (2.00)% | | | 01/17/47 | | | | — | | | | (1,826 | ) | | | 15,293 | | | | 17,119 | |
CMBX.NA.AA.2 | | CSI | | | USD | | | | 3,318,926 | | | (0.15)% | | | 03/15/49 | | | | 998,382 | | | | — | | | | 1,111,743 | | | | 113,361 | |
CMBX.NA.AA.2 | | GSC | | | USD | | | | 2,325,506 | | | (0.15)% | | | 03/15/49 | | | | 732,481 | | | | — | | | | 778,986 | | | | 46,505 | |
CMBX.NA.AA.2 | | GSC | | | USD | | | | 45,155 | | | (0.15)% | | | 03/15/49 | | | | 16,060 | | | | — | | | | 15,126 | | | | (934 | ) |
CMBX.NA.AA.2 | | CSI | | | USD | | | | 1,020,513 | | | (0.15)% | | | 03/15/49 | | | | 355,808 | | | | — | | | | 341,847 | | | | (13,961 | ) |
CMBX.NA.AA.2 | | BOA | | | USD | | | | 3,264,740 | | | (0.15)% | | | 03/15/49 | | | | 1,237,053 | | | | — | | | | 1,093,592 | | | | (143,461 | ) |
CMBX.NA.AA.2 | | BOA | | | USD | | | | 3,924,009 | | | (0.15)% | | | 03/15/49 | | | | 1,486,859 | | | | — | | | | 1,314,428 | | | | (172,431 | ) |
CMBX.NA.AA.7 | | CSI | | | USD | | | | 3,745,000 | | | (1.50)% | | | 01/17/47 | | | | — | | | | (19,098 | ) | | | 104,813 | | | | 123,911 | |
CMBX.NA.AA.7 | | CSI | | | USD | | | | 2,750,000 | | | (1.50)% | | | 01/17/47 | | | | — | | | | (24,580 | ) | | | 76,829 | | | | 101,409 | |
CMBX.NA.AA.7 | | CSI | | | USD | | | | 2,725,000 | | | (1.50)% | | | 01/17/47 | | | | 10,541 | | | | — | | | | 76,131 | | | | 65,590 | |
CMBX.NA.AA.7 | | MSC | | | USD | | | | 1,745,000 | | | (1.50)% | | | 01/17/47 | | | | — | | | | (14,802 | ) | | | 48,751 | | | | 63,553 | |
CMBX.NA.AA.7 | | CSI | | | USD | | | | 2,580,000 | | | (1.50)% | | | 01/17/47 | | | | 11,785 | | | | — | | | | 72,079 | | | | 60,294 | |
CMBX.NA.AA.7 | | CSI | | | USD | | | | 2,575,000 | | | (1.50)% | | | 01/17/47 | | | | 13,692 | | | | — | | | | 71,939 | | | | 58,247 | |
CMBX.NA.AA.7 | | MSC | | | USD | | | | 545,000 | | | (1.50)% | | | 01/17/47 | | | | — | | | | (6,322 | ) | | | 15,226 | | | | 21,548 | |
CMBX.NA.AA.8 | | BCLY | | | USD | | | | 1,410,000 | | | (1.50)% | | | 10/17/57 | | | | 62,691 | | | | — | | | | 63,363 | | | | 672 | |
CMBX.NA.AJ.1 | | BOA | | | USD | | | | 269,213 | | | (0.84)% | | | 10/12/52 | | | | 4,305 | | | | — | | | | 1,857 | | | | (2,448 | ) |
CMBX.NA.AJ.1 | | DEUT | | | USD | | | | 375,585 | | | (0.84)% | | | 10/12/52 | | | | 26,291 | | | | — | | | | 2,582 | | | | (23,709 | ) |
CMBX.NA.AJ.1 | | MSC | | | USD | | | | 669,749 | | | (0.84)% | | | 10/12/52 | | | | 46,882 | | | | — | | | | 4,604 | | | | (42,278 | ) |
CMBX.NA.AJ.2 | | GSC | | | USD | | | | 4,691,471 | | | (1.09)% | | | 03/15/49 | | | | 342,002 | | | | — | | | | 446,103 | | | | 104,101 | |
CMBX.NA.AJ.2 | | CSI | | | USD | | | | 3,632,426 | | | (1.09)% | | | 03/15/49 | | | | 290,005 | | | | — | | | | 345,401 | | | | 55,396 | |
CMBX.NA.AJ.2 | | DEUT | | | USD | | | | 4,552,904 | | | (1.09)% | | | 03/15/49 | | | | 399,077 | | | | — | | | | 433,065 | | | | 33,988 | |
CMBX.NA.AJ.2 | | GSC | | | USD | | | | 1,138,226 | | | (1.09)% | | | 03/15/49 | | | | 82,974 | | | | — | | | | 108,266 | | | | 25,292 | |
CMBX.NA.AJ.2 | | CBK | | | USD | | | | 687,884 | | | (1.09)% | | | 03/15/49 | | | | 58,082 | | | | — | | | | 65,431 | | | | 7,349 | |
CMBX.NA.AJ.3 | | MLI | | | USD | | | | 1,865,909 | | | (1.47)% | | | 12/13/49 | | | | 359,964 | | | | — | | | | 405,862 | | | | 45,898 | |
CMBX.NA.AJ.3 | | GSC | | | USD | | | | 1,486,819 | | | (1.47)% | | | 12/13/49 | | | | 282,551 | | | | — | | | | 323,404 | | | | 40,853 | |
CMBX.NA.AJ.3 | | GSC | | | USD | | | | 329,857 | | | (1.47)% | | | 12/13/49 | | | | 71,927 | | | | — | | | | 71,748 | | | | (179 | ) |
CMBX.NA.AJ.4 | | MSC | | | USD | | | | 5,238,551 | | | (0.96)% | | | 02/17/51 | | | | 949,864 | | | | — | | | | 1,141,550 | | | | 191,686 | |
The accompanying notes are an integral part of these financial statements.
|
| Hartford Total Return Bond HLS Fund |
Schedule of Investments – (continued)
December 31, 2015
| | | | | | | | | | | | | | | | | | | | | | | | | | | | | | | | |
| OTC Credit Default Swap Contracts Outstanding at December 31, 2015 - (continued) | |
Reference Entity | | Counter-
party | | Notional
Amount(a) | | | (Pay)/Receive
Fixed Rate/
Implied Credit
Spread(b) | | Expiration
Date | | | Upfront
Premiums
Paid | | | Upfront
Premiums
Received | | | Market
Value† | | | Unrealized
Appreciation/
(Depreciation) | |
Credit default swaps on indices: - (continued) | | | | | | | | | | | | | | | | | | | | | | | | | | | | | | |
Buy protection: - (continued) | | | | | | | | | | | | | | | | | | | | | | | | | | | | | | | | |
CMBX.NA.AJ.4 | | GSC | | | USD | | | | 2,286,003 | | | (0.96)% | | | 02/17/51 | | | $ | 379,918 | | | $ | — | | | $ | 498,150 | | | $ | 118,232 | |
CMBX.NA.AJ.4 | | CSI | | | USD | | | | 3,066,108 | | | (0.96)% | | | 02/17/51 | | | | 556,764 | | | | — | | | | 668,145 | | | | 111,381 | |
CMBX.NA.AJ.4 | | DEUT | | | USD | | | | 2,937,736 | | | (0.96)% | | | 02/17/51 | | | | 554,757 | | | | — | | | | 640,172 | | | | 85,415 | |
CMBX.NA.AJ.4 | | CBK | | | USD | | | | 2,355,126 | | | (0.96)% | | | 02/17/51 | | | | 431,867 | | | | — | | | | 513,276 | | | | 81,409 | |
CMBX.NA.AJ.4 | | MSC | | | USD | | | | 93,810 | | | (0.96)% | | | 02/17/51 | | | | 15,899 | | | | — | | | | 20,443 | | | | 4,544 | |
CMBX.NA.AJ.4 | | MSC | | | USD | | | | 4,157,267 | | | (0.96)% | | | 02/17/51 | | | | 1,625,328 | | | | — | | | | 905,924 | | | | (719,404 | ) |
CMBX.NA.AM.2 | | MSC | | | USD | | | | 3,357,000 | | | (0.50)% | | | 03/15/49 | | | | 16,508 | | | | — | | | | 12,225 | | | | (4,283 | ) |
CMBX.NA.AM.2 | | DEUT | | | USD | | | | 6,555,000 | | | (0.50)% | | | 03/15/49 | | | | 376,913 | | | | — | | | | 23,781 | | | | (353,132 | ) |
CMBX.NA.AM.2 | | CSI | | | USD | | | | 6,560,000 | | | (0.50)% | | | 03/15/49 | | | | 401,800 | | | | — | | | | 23,798 | | | | (378,002 | ) |
CMBX.NA.AM.4 | | CBK | | | USD | | | | 605,000 | | | (0.50)% | | | 02/17/51 | | | | 13,651 | | | | — | | | | 12,231 | | | | (1,420 | ) |
CMBX.NA.AM.4 | | MSC | | | USD | | | | 2,410,000 | | | (0.50)% | | | 02/17/51 | | | | 540,111 | | | | — | | | | 48,689 | | | | (491,422 | ) |
CMBX.NA.AS.6 | | CSI | | | USD | | | | 6,520,000 | | | (1.00)% | | | 05/11/63 | | | | 84,777 | | | | — | | | | 112,833 | | | | 28,056 | |
CMBX.NA.AS.6 | | CSI | | | USD | | | | 1,035,000 | | | (1.00)% | | | 05/11/63 | | | | — | | | | (2,034 | ) | | | 17,940 | | | | 19,974 | |
CMBX.NA.AS.7 | | CSI | | | USD | | | | 490,000 | | | (1.00)% | | | 01/17/47 | | | | 2,566 | | | | — | | | | 12,303 | | | | 9,737 | |
CMBX.NA.AS.7 | | CSI | | | USD | | | | 3,650,000 | | | (1.00)% | | | 01/17/47 | | | | 83,359 | | | | — | | | | 91,538 | | | | 8,179 | |
CMBX.NA.AS.7 | | CBK | | | USD | | | | 2,900,000 | | | (1.00)% | | | 01/17/47 | | | | 65,955 | | | | — | | | | 72,730 | | | | 6,775 | |
| | | | | | | | | | | | | | | | | | | | | | | | | | | | | | | | |
Total | | | | | | | | | | | | | | | | | | $ | 30,668,542 | | | $ | (128,792 | ) | | $ | 29,269,875 | | | $ | (1,269,875 | ) |
| | | | | | | | | | | | | | | | | | | | | | | | | | | | | | | | |
Sell protection: | | | | | | | | | | | | | | | | | | | | | | | | | | | | | | | | |
CMBX.NA.A.2 | | MLI | | | USD | | | | 333,403 | | | 0.25% | | | 03/15/49 | | | $ | — | | | $ | (208,906 | ) | | $ | (211,478 | ) | | $ | (2,572 | ) |
CMBX.NA.A.2 | | MSC | | | USD | | | | 600,125 | | | 0.25% | | | 03/15/49 | | | | — | | | | (372,492 | ) | | | (380,660 | ) | | | (8,168 | ) |
CMBX.NA.A.2 | | MLI | | | USD | | | | 1,086,501 | | | 0.25% | | | 03/15/49 | | | | — | | | | (680,787 | ) | | | (689,169 | ) | | | (8,382 | ) |
CMBX.NA.A.2 | | GSC | | | USD | | | | 580,513 | | | 0.25% | | | 03/15/49 | | | | — | | | | (359,401 | ) | | | (368,220 | ) | | | (8,819 | ) |
CMBX.NA.A.2 | | MLI | | | USD | | | | 1,066,889 | | | 0.25% | | | 03/15/49 | | | | — | | | | (667,566 | ) | | | (676,729 | ) | | | (9,163 | ) |
CMBX.NA.A.2 | | BOA | | | USD | | | | 819,779 | | | 0.25% | | | 03/15/49 | | | | — | | | | (508,664 | ) | | | (519,987 | ) | | | (11,323 | ) |
CMBX.NA.A.2 | | CSI | | | USD | | | | 1,663,092 | | | 0.25% | | | 03/15/49 | | | | — | | | | (1,043,457 | ) | | | (1,054,901 | ) | | | (11,444 | ) |
CMBX.NA.A.2 | | GSC | | | USD | | | | 1,247,319 | | | 0.25% | | | 03/15/49 | | | | — | | | | (779,235 | ) | | | (791,185 | ) | | | (11,950 | ) |
CMBX.NA.A.2 | | MSC | | | USD | | | | 1,204,173 | | | 0.25% | | | 03/15/49 | | | | — | | | | (747,892 | ) | | | (763,809 | ) | | | (15,917 | ) |
CMBX.NA.A.2 | | BOA | | | USD | | | | 1,604,256 | | | 0.25% | | | 03/15/49 | | | | — | | | | (896,954 | ) | | | (1,017,593 | ) | | | (120,639 | ) |
CMBX.NA.A.6 | | GSC | | | USD | | | | 2,010,000 | | | 2.00% | | | 05/11/63 | | | | 26,238 | | | | — | | | | (57,579 | ) | | | (83,817 | ) |
CMBX.NA.AAA.6 | | UBS | | | USD | | | | 15,710,000 | | | 0.50% | | | 05/11/63 | | | | — | | | | (418,543 | ) | | | (361,389 | ) | | | 57,154 | |
CMBX.NA.AAA.6 | | DEUT | | | USD | | | | 12,125,000 | | | 0.50% | | | 05/11/63 | | | | — | | | | (295,543 | ) | | | (278,921 | ) | | | 16,622 | |
CMBX.NA.AAA.6 | | CSI | | | USD | | | | 10,895,000 | | | 0.50% | | | 05/11/63 | | | | — | | | | (244,208 | ) | | | (250,626 | ) | | | (6,418 | ) |
CMBX.NA.AAA.6 | | CSI | | | USD | | | | 2,500,000 | | | 0.50% | | | 05/11/63 | | | | — | | | | (48,030 | ) | | | (57,509 | ) | | | (9,479 | ) |
CMBX.NA.AAA.6 | | GSC | | | USD | | | | 14,810,000 | | | 0.50% | | | 05/11/63 | | | | — | | | | (174,917 | ) | | | (340,686 | ) | | | (165,769 | ) |
CMBX.NA.AAA.7 | | CSI | | | USD | | | | 785,000 | | | 0.50% | | | 01/17/47 | | | | — | | | | (19,680 | ) | | | (27,601 | ) | | | (7,921 | ) |
CMBX.NA.AAA.7 | | CSI | | | USD | | | | 3,000,000 | | | 0.50% | | | 01/17/47 | | | | — | | | | (82,463 | ) | | | (105,483 | ) | | | (23,020 | ) |
CMBX.NA.AAA.7 | | BOA | | | USD | | | | 5,070,000 | | | 0.50% | | | 01/17/47 | | | | — | | | | (120,790 | ) | | | (178,266 | ) | | | (57,476 | ) |
CMBX.NA.AAA.8 | | GSC | | | USD | | | | 6,660,000 | | | 0.50% | | | 10/17/57 | | | | — | | | | (325,224 | ) | | | (320,922 | ) | | | 4,302 | |
CMBX.NA.AAA.8 | | GSC | | | USD | | | | 3,330,000 | | | 0.50% | | | 10/17/57 | | | | — | | | | (162,612 | ) | | | (160,461 | ) | | | 2,151 | |
CMBX.NA.AAA.8 | | GSC | | | USD | | | | 3,330,000 | | | 0.50% | | | 10/17/57 | | | | — | | | | (162,351 | ) | | | (160,461 | ) | | | 1,890 | |
CMBX.NA.AAA.8 | | GSC | | | USD | | | | 650,000 | | | 0.50% | | | 10/17/57 | | | | — | | | | (31,081 | ) | | | (31,321 | ) | | | (240 | ) |
CMBX.NA.AAA.8 | | GSC | | | USD | | | | 3,255,000 | | | 0.50% | | | 10/17/57 | | | | — | | | | (155,004 | ) | | | (156,847 | ) | | | (1,843 | ) |
CMBX.NA.AAA.8 | | MSC | | | USD | | | | 3,890,000 | | | 0.50% | | | 10/17/57 | | | | — | | | | (185,243 | ) | | | (187,445 | ) | | | (2,202 | ) |
CMBX.NA.AAA.8 | | BCLY | | | USD | | | | 7,750,000 | | | 0.50% | | | 10/17/57 | | | | — | | | | (370,580 | ) | | | (373,445 | ) | | | (2,865 | ) |
CMBX.NA.AAA.8 | | GSC | | | USD | | | | 1,095,000 | | | 0.50% | | | 10/17/57 | | | | — | | | | (46,588 | ) | | | (52,764 | ) | | | (6,176 | ) |
CMBX.NA.AAA.8 | | CSI | | | USD | | | | 3,665,000 | | | 0.50% | | | 10/17/57 | | | | — | | | | (167,698 | ) | | | (176,604 | ) | | | (8,906 | ) |
CMBX.NA.AAA.8 | | DEUT | | | USD | | | | 1,600,000 | | | 0.50% | | | 10/17/57 | | | | — | | | | (68,074 | ) | | | (77,098 | ) | | | (9,024 | ) |
CMBX.NA.AAA.8 | | MSC | | | USD | | | | 1,605,000 | | | 0.50% | | | 10/17/57 | | | | — | | | | (68,287 | ) | | | (77,339 | ) | | | (9,052 | ) |
CMBX.NA.AAA.8 | | BCLY | | | USD | | | | 3,490,000 | | | 0.50% | | | 10/17/57 | | | | — | | | | (158,324 | ) | | | (168,170 | ) | | | (9,846 | ) |
CMBX.NA.AAA.8 | | CSI | | | USD | | | | 3,128,000 | | | 0.50% | | | 10/17/57 | | | | — | | | | (140,844 | ) | | | (150,727 | ) | | | (9,883 | ) |
CMBX.NA.AAA.8 | | CSI | | | USD | | | | 3,250,000 | | | 0.50% | | | 10/17/57 | | | | — | | | | (138,275 | ) | | | (156,605 | ) | | | (18,330 | ) |
CMBX.NA.AAA.8 | | MLI | | | USD | | | | 7,535,000 | | | 0.50% | | | 10/17/57 | | | | — | | | | (343,301 | ) | | | (363,085 | ) | | | (19,784 | ) |
CMBX.NA.AAA.8 | | MLI | | | USD | | | | 3,820,000 | | | 0.50% | | | 10/17/57 | | | | — | | | | (163,276 | ) | | | (184,073 | ) | | | (20,797 | ) |
CMBX.NA.AAA.8 | | GSC | | | USD | | | | 3,018,000 | | | 0.50% | | | 10/17/57 | | | | — | | | | (121,296 | ) | | | (145,426 | ) | | | (24,130 | ) |
The accompanying notes are an integral part of these financial statements.
|
| Hartford Total Return Bond HLS Fund |
Schedule of Investments – (continued)
December 31, 2015
| | | | | | | | | | | | | | | | | | | | | | | | | | | | | | | | |
| OTC Credit Default Swap Contracts Outstanding at December 31, 2015 - (continued) | |
Reference Entity | | Counter-
party | | Notional
Amount(a) | | | (Pay)/Receive
Fixed Rate/
Implied Credit
Spread(b) | | Expiration
Date | | | Upfront
Premiums
Paid | | | Upfront
Premiums
Received | | | Market
Value† | | | Unrealized
Appreciation/
(Depreciation) | |
Credit default swaps on indices: - (continued) | | | | | | | | | | | | | | | | | | | | | | | | | | | | | | |
Sell protection: - (continued) | | | | | | | | | | | | | | | | | | | | | | | | | | | | | | | | |
CMBX.NA.AAA.8 | | MLI | | | USD | | | | 7,510,000 | | | 0.50% | | | 10/17/57 | | | $ | — | | | $ | (331,848 | ) | | $ | (361,880 | ) | | $ | (30,032 | ) |
CMBX.NA.AAA.8 | | JPM | | | USD | | | | 6,935,000 | | | 0.50% | | | 10/17/57 | | | | — | | | | (297,777 | ) | | | (334,173 | ) | | | (36,396 | ) |
CMBX.NA.AAA.8 | | CSI | | | USD | | | | 8,575,000 | | | 0.50% | | | 10/17/57 | | | | — | | | | (302,398 | ) | | | (413,199 | ) | | | (110,801 | ) |
CMBX.NA.BB.6 | | CSI | | | USD | | | | 128,000 | | | 5.00% | | | 05/11/63 | | | | 1,627 | | | | — | | | | (5,485 | ) | | | (7,112 | ) |
CMBX.NA.BB.6 | | CSI | | | USD | | | | 300,000 | | | 5.00% | | | 05/11/63 | | | | — | | | | — | | | | (12,855 | ) | | | (12,855 | ) |
CMBX.NA.BB.6 | | CBK | | | USD | | | | 433,000 | | | 5.00% | | | 05/11/63 | | | | — | | | | (3,256 | ) | | | (18,553 | ) | | | (15,297 | ) |
CMBX.NA.BB.6 | | BOA | | | USD | | | | 2,980,000 | | | 5.00% | | | 05/11/63 | | | | — | | | | (28,050 | ) | | | (127,691 | ) | | | (99,641 | ) |
CMBX.NA.BB.6 | | CSI | | | USD | | | | 5,425,000 | | | 5.00% | | | 05/11/63 | | | | 90,915 | | | | — | | | | (232,457 | ) | | | (323,372 | ) |
CMBX.NA.BB.8 | | MLI | | | USD | | | | 610,000 | | | 5.00% | | | 10/17/57 | | | | — | | | | (74,948 | ) | | | (83,161 | ) | | | (8,213 | ) |
CMBX.NA.BB.8 | | MLI | | | USD | | | | 1,350,000 | | | 5.00% | | | 10/17/57 | | | | — | | | | (175,663 | ) | | | (184,797 | ) | | | (9,134 | ) |
CMBX.NA.BB.8 | | CSI | | | USD | | | | 645,000 | | | 5.00% | | | 10/17/57 | | | | — | | | | (77,371 | ) | | | (87,934 | ) | | | (10,563 | ) |
CMBX.NA.BB.8 | | CSI | | | USD | | | | 870,000 | | | 5.00% | | | 10/17/57 | | | | — | | | | (106,894 | ) | | | (118,608 | ) | | | (11,714 | ) |
CMBX.NA.BB.8 | | GSC | | | USD | | | | 1,350,000 | | | 5.00% | | | 10/17/57 | | | | — | | | | (161,693 | ) | | | (184,797 | ) | | | (23,104 | ) |
CMBX.NA.BB.8 | | BCLY | | | USD | | | | 1,535,000 | | | 5.00% | | | 10/17/57 | | | | — | | | | (184,945 | ) | | | (209,481 | ) | | | (24,536 | ) |
CMBX.NA.BB.8 | | BCLY | | | USD | | | | 1,350,000 | | | 5.00% | | | 10/17/57 | | | | — | | | | (158,035 | ) | | | (184,047 | ) | | | (26,012 | ) |
CMBX.NA.BB.8 | | CSI | | | USD | | | | 1,535,000 | | | 5.00% | | | 10/17/57 | | | | — | | | | (182,216 | ) | | | (209,481 | ) | | | (27,265 | ) |
CMBX.NA.BB.8 | | MSC | | | USD | | | | 1,410,000 | | | 5.00% | | | 10/17/57 | | | | — | | | | (164,882 | ) | | | (192,226 | ) | | | (27,344 | ) |
CMBX.NA.BB.8 | | UBS | | | USD | | | | 1,455,000 | | | 5.00% | | | 10/17/57 | | | | — | | | | (170,382 | ) | | | (198,361 | ) | | | (27,979 | ) |
CMBX.NA.BB.8 | | CSI | | | USD | | | | 1,955,000 | | | 5.00% | | | 10/17/57 | | | | — | | | | (235,505 | ) | | | (266,799 | ) | | | (31,294 | ) |
CMBX.NA.BB.8 | | GSC | | | USD | | | | 1,270,000 | | | 5.00% | | | 10/17/57 | | | | — | | | | (132,011 | ) | | | (173,317 | ) | | | (41,306 | ) |
CMBX.NA.BB.8 | | CSI | | | USD | | | | 3,070,000 | | | 5.00% | | | 10/17/57 | | | | — | | | | (373,453 | ) | | | (418,962 | ) | | | (45,509 | ) |
CMBX.NA.BB.8 | | CSI | | | USD | | | | 765,000 | | | 5.00% | | | 10/17/57 | | | | — | | | | (56,743 | ) | | | (104,293 | ) | | | (47,550 | ) |
CMBX.NA.BB.8 | | JPM | | | USD | | | | 770,000 | | | 5.00% | | | 10/17/57 | | | | — | | | | (57,114 | ) | | | (104,974 | ) | | | (47,860 | ) |
CMBX.NA.BB.8 | | GSC | | | USD | | | | 680,000 | | | 5.00% | | | 10/17/57 | | | | — | | | | (35,367 | ) | | | (92,800 | ) | | | (57,433 | ) |
CMBX.NA.BB.8 | | MLI | | | USD | | | | 1,500,000 | | | 5.00% | | | 10/17/57 | | | | — | | | | (139,845 | ) | | | (204,496 | ) | | | (64,651 | ) |
CMBX.NA.BB.8 | | CSI | | | USD | | | | 1,535,000 | | | 5.00% | | | 10/17/57 | | | | — | | | | (129,893 | ) | | | (209,267 | ) | | | (79,374 | ) |
CMBX.NA.BB.8 | | BCLY | | | USD | | | | 4,235,000 | | | 5.00% | | | 10/17/57 | | | | — | | | | (482,971 | ) | | | (577,361 | ) | | | (94,390 | ) |
CMBX.NA.BB.8 | | GSC | | | USD | | | | 1,365,000 | | | 5.00% | | | 10/17/57 | | | | — | | | | (71,998 | ) | | | (186,281 | ) | | | (114,283 | ) |
CMBX.NA.BB.8 | | BCLY | | | USD | | | | 1,410,000 | | | 5.00% | | | 10/17/57 | | | | — | | | | (75,827 | ) | | | (192,422 | ) | | | (116,595 | ) |
CMBX.NA.BB.8 | | BOA | | | USD | | | | 2,095,000 | | | 5.00% | | | 10/17/57 | | | | — | | | | (149,018 | ) | | | (285,613 | ) | | | (136,595 | ) |
CMBX.NA.BB.8 | | BCLY | | | USD | | | | 2,085,000 | | | 5.00% | | | 10/17/57 | | | | — | | | | (128,002 | ) | | | (284,249 | ) | | | (156,247 | ) |
PrimeX.ARM.2 | | MSC | | | USD | | | | 4,012,183 | | | 4.58% | | | 12/25/37 | | | | — | | | | (294,444 | ) | | | 170,586 | | | | 465,030 | |
| | | | | | | | | | | | | | | | | | | | | | | | | | | | | | | | |
Total | | | | | | | | | | | | | | | | | | $ | 118,780 | | | $ | (15,260,135 | ) | | $ | (17,164,018 | ) | | $ | (2,022,663 | ) |
| | | | | | | | | | | | | | | | | | | | | | | | | | | | | | | | |
Total traded indices | | | | | | | | | | | | | | | | | | $ | 30,787,322 | | | $ | (15,388,927 | ) | | $ | 12,105,857 | | | $ | (3,292,538 | ) |
| | | | | | | | | | | | | | | | | | | | | | | | | | | | | | | | |
Credit default swaps on single-name issues: | | | | | | | | | | | | | | | | | | | | | | | |
Sell protection: | | | | | | | | | | | | | | | | | | | | | | | | | | | | | | | | |
Mexico Government International Bond | | BCLY | | | USD | | | | 2,305,000 | | | 1.00%/1.72% | | | 12/20/20 | | | $ | — | | | $ | (38,706 | ) | | $ | (76,780 | ) | | $ | (38,074 | ) |
Peruvian Government International Bond | | GSC | | | USD | | | | 4,330,000 | | | 1.00%/1.87% | | | 12/20/20 | | | | — | | | | (178,125 | ) | | | (173,846 | ) | | | 4,279 | |
Philippines Government International Bond | | BOA | | | USD | | | | 5,587,000 | | | 1.00%/1.09% | | | 12/20/20 | | | | 1,306 | | | | — | | | | (22,938 | ) | | | (24,244 | ) |
Republic of China | | BOA | | | USD | | | | 5,580,000 | | | 1.00%/1.08% | | | 12/20/20 | | | | — | | | | (2,607 | ) | | | (18,856 | ) | | | (16,249 | ) |
United Mexican States | | GSC | | | USD | | | | 4,810,000 | | | 1.00%/1.72% | | | 12/20/20 | | | | — | | | | (111,827 | ) | | | (160,223 | ) | | | (48,396 | ) |
| | | | | | | | | | | | | | | | | | | | | | | | | | | | | | | | |
Total | | | | | | | | | | | | | | | | | | $ | 1,306 | | | $ | (331,265 | ) | | $ | (452,643 | ) | | $ | (122,684 | ) |
| | | | | | | | | | | | | | | | | | | | | | | | | | | | | | | | |
Total single-name issues | | | | | | | | | | | | | | | | | | $ | 1,306 | | | $ | (331,265 | ) | | $ | (452,643 | ) | | $ | (122,684 | ) |
| | | | | | | | | | | | | | | | | | | | | | | | | | | | | | | | |
Total OTC contracts | | | | | | | | | | | | | | | | | | $ | 30,788,628 | | | $ | (15,720,192 | ) | | $ | 11,653,214 | | | $ | (3,415,222 | ) |
| | | | | | | | | | | | | | | | | | | | | | | | | | | | | | | | |
| (a) | The maximum potential amount the Fund could be required to pay as a seller of credit protection or receive as a buyer of credit protection if a credit event occurs as defined under the terms of that particular swap agreement. |
| (b) | Implied credit spreads, represented in absolute terms, utilized in determining the market value of credit default swap agreements on corporate issues, U.S. municipal issues or sovereign government issues as of period end serve as an indicator of the current status of the payment/performance risk and represent the likelihood or risk of default for the credit derivative. The implied credit spread of a particular entity reflects the cost of buying/selling protection and may include upfront payments required to be made to enter into the agreement. Wider credit spreads represent a deterioration of the reference entity’s credit soundness and a greater likelihood or risk of default or other credit event occurring as defined under the terms of the agreement. The percentage shown is the implied credit spread on December 31, 2015. For credit default swap agreements on indices, the quoted market prices and resulting values serve as the indicator of the current status of the payment/performance risk. Credit spreads are unaudited. |
The accompanying notes are an integral part of these financial statements.
|
| Hartford Total Return Bond HLS Fund |
Schedule of Investments – (continued)
December 31, 2015
| | | | | | | | | | | | | | | | | | | | | | | | |
| Centrally Cleared Credit Default Swap Contracts Outstanding at December 31, 2015 | |
Reference Entity | | Notional
Amount(a) | | | (Pay)/Receive
Fixed Rate | | | Expiration
Date | | Cost
Basis | | | Market
Value† | | | Unrealized
Appreciation/
(Depreciation) | |
Credit default swaps on indices: | | | | | | | | | | | | | | | | | | | | | | | | |
Buy protection: | | | | | | | | | | | | | | | | | | | | | | | | |
CDX.NA.HY.25 | | USD | | | 79,954,000 | | | | (5.00 | )% | | 12/20/20 | | $ | (149,716 | ) | | $ | (1,069,438 | ) | | $ | (919,722 | ) |
CDX.NA.IGS.24 | | USD | | | 168,982,000 | | | | (1.00 | )% | | 12/20/20 | | | (1,004,991 | ) | | | (967,334 | ) | | | 37,657 | |
ITRAXX.EUR.24 | | EUR | | | 31,618,000 | | | | (5.00 | )% | | 12/20/20 | | | (2,445,502 | ) | | | (2,819,226 | ) | | | (373,724 | ) |
ITRAXX.XOV.23 | | EUR | | | 5,059,000 | | | | (5.00 | )% | | 06/20/20 | | | (386,355 | ) | | | (356,383 | ) | | | 29,972 | |
| | | | | | | | | | | | | | | | | | | | | | | | |
Total | | | | | | | | | | | | | | $ | (3,986,564 | ) | | $ | (5,212,381 | ) | | $ | (1,225,817 | ) |
| | | | | | | | | | | | | | | | | | | | | | | | |
Credit default swaps on indices: | | | | | | | | | | | | | | | | | | | | | | | | |
Sell protection: | | | | | | | | | | | | | | | | | | | | | | | | |
ITRAXX.EUR.24 | | EUR | | | 41,714,000 | | | | 1.00 | % | | 12/20/20 | | $ | (442,753 | ) | | $ | (505,548 | ) | | $ | (62,795 | ) |
| | | | | | | | | | | | | | | | | | | | | | | | |
Total | | | | | | | | | | | | | | $ | (4,429,317 | ) | | $ | (5,717,929 | ) | | $ | (1,288,612 | ) |
| | | | | | | | | | | | | | | | | | | | | | | | |
| (a) | The maximum potential amount the Fund could be required to pay as a seller of credit protection or receive as a buyer of credit protection if a credit event occurs as defined under the terms of that particular swap agreement. |
| | | | | | | | | | | | | | | | | | | | | | | | | | | | | | | | |
| Cross Currency Swap Contracts Outstanding at December 31, 2015 | |
Receive | | Pay | | Maturity
Date(1) | | Counter-
party | | | Notional
Amount of
Currency
Received | | | Notional
Amount of
Currency
Delivered | | | Upfront
Premiums
Paid | | | Upfront
Premiums
Received | | | Market
Value† | | | Unrealized
Appreciation/
(Depreciation) | |
Fixed Rate equal to 3.500% based on the notional amount of currency delivered | | Variable Rate equal to the
3M USD LIBOR Rate
based on the notional
amount of currency | | 03/16/17 | | | BOA | | | | CNY 55,000,000 | | | | USD 8,308,157 | | | $ | 204,457 | | | $ | — | | | $ | 75,856 | | | $ | (128,601 | ) |
Variable Rate equal to the 3M USD LIBOR Rate based on the notional amount of currency delivered | | Fixed Rate equal to
3.500% based on the
notional amount of
currency delivered | | 03/16/17 | | | BOA | | | | USD 8,308,157 | | | | CNY 55,000,000 | | | | — | | | | (204,457 | ) | | | (161,721 | ) | | | 42,736 | |
| | | | | | | | | | | | | | | | | | | | | | | | | | | | | | | | |
Total | | | | | | | | | | | | | | | | | | $ | 204,457 | | | $ | (204,457 | ) | | $ | (85,865 | ) | | $ | (85,865 | ) |
| | | | | | | | | | | | | | | | | | | | | | | | | | | | | | | | |
| (1) | At the maturity date, the notional amount of the currency received will be exchanged back for the notional amount of the currency delivered. |
| | | | | | | | | | | | | | | | | | | | | | | | | | | | | | | | |
| OTC Interest Rate Swap Contracts Outstanding at December 31, 2015 | |
Counterparty | | Payments made
by Fund | | Payments received
by Fund | | | Notional
Amount | | Expiration
Date | | | Upfront
Premiums
Paid | | | Upfront
Premiums
Received | | | Market
Value† | | | Unrealized
Appreciation/
(Depreciation) | |
BCLY | | 2.15% Fixed | | | CPURNSA | | | | USD | | | 6,010,000 | | | 09/22/25 | | | $ | — | | | $ | — | | | $ | 15,679 | | | $ | 15,679 | |
BCLY | | 2.15% Fixed | | | CPURNSA | | | | USD | | | 3,670,000 | | | 09/22/25 | | | | — | | | | — | | | | 9,575 | | | | 9,575 | |
BOA | | 1.81% Fixed | | | CPURNSA | | | | USD | | | 50,115,000 | | | 09/04/25 | | | | — | | | | — | | | | 82,960 | | | | 82,960 | |
BOA | | 1.82% Fixed | | | CPURNSA | | | | USD | | | 39,085,000 | | | 09/22/25 | | | | — | | | | — | | | | 37,612 | | | | 37,612 | |
DEUT | | 2.16% Fixed | | | CPURNSA | | | | USD | | | 6,025,000 | | | 09/22/25 | | | | — | | | | — | | | | 13,076 | | | | 13,076 | |
| | | | | | | | | | | | | | | | | | | | | | | | | | | | | | | | |
Total | | | | | | | | | | | | | | | | | | $ | — | | | $ | — | | | $ | 158,902 | | | $ | 158,902 | |
| | | | | | | | | | | | | | | | | | | | | | | | | | | | | | | | |
The accompanying notes are an integral part of these financial statements.
|
| Hartford Total Return Bond HLS Fund |
Schedule of Investments – (continued)
December 31, 2015
| | | | | | | | | | | | | | | | | | | | |
| Foreign Currency Contracts Outstanding at December 31, 2015 | |
Currency | | Buy/Sell | | Delivery
Date | | | Counterparty | | Contract
Amount | | | Market Value† | | | Unrealized
Appreciation/
(Depreciation) | |
BRL | | Sell | | | 03/02/16 | | | SCB | | $ | 5,406,523 | | | $ | 5,215,967 | | | $ | 190,556 | |
BRL | | Sell | | | 03/02/16 | | | SSG | | | 2,658,815 | | | | 2,628,671 | | | | 30,144 | |
CNY | | Buy | | | 07/28/16 | | | JPM | | | 2,666,294 | | | | 2,545,435 | | | | (120,859 | ) |
CNY | | Sell | | | 07/28/16 | | | GSC | | | 523,954 | | | | 524,620 | | | | (666 | ) |
CNY | | Sell | | | 07/28/16 | | | DEUT | | | 2,013,657 | | | | 2,020,816 | | | | (7,159 | ) |
COP | | Sell | | | 03/16/16 | | | SSG | | | 105,418 | | | | 108,964 | | | | (3,546 | ) |
COP | | Sell | | | 03/16/16 | | | SCB | | | 998,465 | | | | 1,022,541 | | | | (24,076 | ) |
CRC | | Sell | | | 03/16/16 | | | CBK | | | 1,507,659 | | | | 1,516,349 | | | | (8,690 | ) |
CZK | | Sell | | | 03/16/16 | | | CBK | | | 3,195,674 | | | | 3,156,589 | | | | 39,085 | |
EUR | | Buy | | | 01/29/16 | | | BNP | | | 697,197 | | | | 696,034 | | | | (1,163 | ) |
EUR | | Buy | | | 03/16/16 | | | CBK | | | 1,650,593 | | | | 1,635,527 | | | | (15,066 | ) |
EUR | | Buy | | | 03/15/17 | | | BOA | | | 962,014 | | | | 928,332 | | | | (33,682 | ) |
EUR | | Buy | | | 03/15/17 | | | BOA | | | 1,283,414 | | | | 1,237,777 | | | | (45,637 | ) |
EUR | | Buy | | | 03/15/17 | | | UBS | | | 1,622,467 | | | | 1,563,798 | | | | (58,669 | ) |
EUR | | Sell | | | 01/29/16 | | | BOA | | | 29,676,049 | | | | 29,401,979 | | | | 274,070 | |
EUR | | Sell | | | 03/16/16 | | | CBA | | | 5,564,895 | | | | 5,716,723 | | | | (151,828 | ) |
EUR | | Sell | | | 03/15/17 | | | BOA | | | 5,923,641 | | | | 6,089,419 | | | | (165,778 | ) |
GBP | | Buy | | | 01/29/16 | | | BNP | | | 296,365 | | | | 294,865 | | | | (1,500 | ) |
GBP | | Sell | | | 01/29/16 | | | JPM | | | 10,202,331 | | | | 10,088,810 | | | | 113,521 | |
GBP | | Sell | | | 03/16/16 | | | CBK | | | 2,903,535 | | | | 2,819,039 | | | | 84,496 | |
HKD | | Sell | | | 03/03/16 | | | GSC | | | 4,467,901 | | | | 4,472,642 | | | | (4,741 | ) |
HKD | | Sell | | | 03/16/16 | | | RBC | | | 2,479,372 | | | | 2,479,932 | | | | (560 | ) |
HUF | | Sell | | | 03/16/16 | | | CBK | | | 567,337 | | | | 562,037 | | | | 5,300 | |
IDR | | Buy | | | 05/18/16 | | | GSC | | | 2,688,608 | | | | 2,909,165 | | | | 220,557 | |
IDR | | Sell | | | 03/16/16 | | | BOA | | | 6,967,894 | | | | 7,128,566 | | | | (160,672 | ) |
IDR | | Sell | | | 05/18/16 | | | BCLY | | | 1,465,120 | | | | 1,481,161 | | | | (16,041 | ) |
IDR | | Sell | | | 05/18/16 | | | JPM | | | 1,408,636 | | | | 1,428,005 | | | | (19,369 | ) |
MXN | | Sell | | | 03/16/16 | | | RBC | | | 6,725,650 | | | | 6,667,292 | | | | 58,358 | |
MYR | | Sell | | | 03/16/16 | | | CBK | | | 1,110,929 | | | | 1,100,744 | | | | 10,185 | |
MYR | | Sell | | | 03/16/16 | | | JPM | | | 599,273 | | | | 591,836 | | | | 7,437 | |
MYR | | Sell | | | 03/16/16 | | | SCB | | | 207,228 | | | | 204,536 | | | | 2,692 | |
MYR | | Sell | | | 03/16/16 | | | CSFB | | | 105,547 | | | | 104,237 | | | | 1,310 | |
PEN | | Buy | | | 03/16/16 | | | SCB | | | 464,735 | | | | 459,362 | | | | (5,373 | ) |
PEN | | Sell | | | 03/16/16 | | | SCB | | | 4,611,168 | | | | 4,574,531 | | | | 36,637 | |
PLN | | Sell | | | 03/16/16 | | | BOA | | | 1,624,367 | | | | 1,640,544 | | | | (16,177 | ) |
RON | | Sell | | | 03/16/16 | | | JPM | | | 591,781 | | | | 585,662 | | | | 6,119 | |
RUB | | Sell | | | 03/16/16 | | | CBK | | | 3,949,780 | | | | 3,740,962 | | | | 208,818 | |
RUB | | Sell | | | 03/16/16 | | | JPM | | | 2,593,306 | | | | 2,505,974 | | | | 87,332 | |
THB | | Sell | | | 03/16/16 | | | CBK | | | 1,752,365 | | | | 1,759,687 | | | | (7,322 | ) |
TRY | | Sell | | | 03/16/16 | | | BCLY | | | 2,014,513 | | | | 2,023,229 | | | | (8,716 | ) |
UYU | | Sell | | | 03/03/16 | | | HSBC | | | 5,418,365 | | | | 5,464,513 | | | | (46,148 | ) |
UYU | | Sell | | | 03/16/16 | | | HSBC | | | 599,018 | | | | 601,720 | | | | (2,702 | ) |
UYU | | Sell | | | 03/16/16 | | | HSBC | | | 866,782 | | | | 877,527 | | | | (10,745 | ) |
UYU | | Sell | | | 03/16/16 | | | HSBC | | | 1,004,471 | | | | 1,027,973 | | | | (23,502 | ) |
ZAR | | Sell | | | 03/16/16 | | | BCLY | | | 2,827,033 | | | | 2,795,831 | | | | 31,202 | |
| | | | | | | | | | | | | | | | | | | | |
Total | | | $ | 447,432 | |
| | | | | | | | | | | | | | | | | | | | |
| † | See Significant Accounting Policies of accompanying Notes to Financial Statements regarding valuation of investments. |
The accompanying notes are an integral part of these financial statements.
|
| Hartford Total Return Bond HLS Fund |
Schedule of Investments – (continued)
December 31, 2015
| | |
| GLOSSARY: (abbreviations used in preceding Schedule of Investments) |
|
| Counterparty Abbreviations: |
BCLY | | Barclays |
BNP | | BNP Paribas Securities Services |
BOA | | Banc of America Securities LLC |
CBA | | Commonwealth Bank of Australia |
CBK | | Citibank NA |
CSFB | | Credit Suisse First Boston Corp. |
CSI | | Credit Suisse International |
DEUT | | Deutsche Bank Securities, Inc. |
GSC | | Goldman Sachs & Co. |
HSBC | | HSBC Bank USA |
JPM | | JP Morgan Chase & Co. |
MLI | | Merrill Lynch International |
MSC | | Morgan Stanley |
RBC | | RBC Dominion Securities, Inc. |
SCB | | Standard Chartered Bank |
SSG | | State Street Global Markets LLC |
UBS | | UBS AG |
|
| Currency Abbreviations: |
BRL | | Brazilian Real |
CNY | | Chinese Yuan |
COP | | Colombian Peso |
CRC | | Costa Rican Colon |
CZK | | Czech Koruna |
EUR | | Euro |
GBP | | British Pound |
HKD | | Hong Kong Dollar |
HUF | | Hungarian Forint |
IDR | | Indonesian Rupiah |
MXN | | Mexican Peso |
MYR | | Malaysian Ringgit |
PEN | | Peruvian Nuevo Sol |
PLN | | Polish Zloty |
RON | | New Romanian Leu |
RUB | | Russian Ruble |
THB | | Thai Baht |
TRY | | Turkish Lira |
USD | | United States Dollar |
UYU | | Uruguayan Peso |
ZAR | | South African Rand |
|
| Index Abbreviations: |
ABX.HE | | Markit Asset Backed Security Home Equity |
CDX.EM | | Credit Derivatives Emerging Markets |
CDX.NA.HY | | Credit Derivatives North American High Yield |
CDX.NA.IG | | Credit Derivatives North American Investment Grade |
CMBX.NA | | Markit Commercial Mortgage Backed North American |
CPURNSA | | Consumer Price All Urban Non-Seasonally Adjusted |
ITRAXX.EUR | | Markit i Traxx—Europe |
ITRAXX.XOV | | Markit i Traxx Index—Europe Crossover |
PrimeX.ARM | | Markit PrimeX Adjustable Rate Mortgage Backed Security |
| | |
| Other Abbreviations: |
CDO | | Collateralized Debt Obligation |
CLO | | Collateralized Loan Obligation |
CMO | | Collateralized Mortgage Obligation |
FHLMC | | Federal Home Loan Mortgage Corp. |
FNMA | | Federal National Mortgage Association |
FX | | Foreign Exchange |
GNMA | | Government National Mortgage Association |
LIBOR | | London Interbank Offered Rate |
OTC | | Over-the-Counter |
TBA | | To Be Announced |
|
| Municipal Abbreviations: |
GO | | General Obligation |
The accompanying notes are an integral part of these financial statements.
|
| Hartford Total Return Bond HLS Fund |
Schedule of Investments – (continued)
December 31, 2015
Fair Valuation Summary
The following is a summary of the fair valuations according to the inputs used as of December 31, 2015 in valuing the Fund’s investments.
| | | | | | | | | | | | | | | | |
| | | Total | | | Level 1(1) | | | Level 2(1) | | | Level 3 | |
Assets | |
Asset & Commercial Mortgage Backed Securities | | $ | 920,067,501 | | | $ | — | | | $ | 920,067,501 | | | $ | — | |
Corporate Bonds | | | 922,935,210 | | | | — | | | | 922,935,210 | | | | — | |
Foreign Government Obligations | | | 90,805,780 | | | | — | | | | 90,805,780 | | | | — | |
Municipal Bonds | | | 30,711,994 | | | | — | | | | 30,711,994 | | | | — | |
Senior Floating Rate Interests | | | 158,953,441 | | | | — | | | | 158,953,441 | | | | — | |
U.S. Government Agencies | | | 1,089,844,807 | | | | — | | | | 1,089,844,807 | | | | — | |
U.S. Government Securities | | | 71,347,149 | | | | — | | | | 71,347,149 | | | | — | |
Preferred Stocks | | | 2,784,505 | | | | 2,784,505 | | | | — | | | | — | |
Short-Term Investments | | | 88,216,749 | | | | 88,216,749 | | | | — | | | | — | |
Purchased Options | | | 18,238 | | | | — | | | | 18,238 | | | | — | |
Foreign Currency Contracts(2) | | | 1,407,819 | | | | — | | | | 1,407,819 | | | | — | |
Futures Contracts(2) | | | 1,906,538 | | | | 1,906,538 | | | | — | | | | — | |
Swaps - Credit Default(2) | | | 3,409,459 | | | | — | | | | 3,409,459 | | | | — | |
Swaps - Cross Currency(2) | | | 42,736 | | | | — | | | | 42,736 | | | | — | |
Swaps - Interest Rate(2) | | | 158,902 | | | | — | | | | 158,902 | | | | — | |
| | | | | | | | | | | | | | | | |
Total | | $ | 3,382,610,828 | | | $ | 92,907,792 | | | $ | 3,289,703,036 | | | $ | — | |
| | | | | | | | | | | | | | | | |
Liabilities | | | | | | | | | | | | | | | | |
Foreign Currency Contracts(2) | | $ | (960,387 | ) | | $ | — | | | $ | (960,387 | ) | | $ | — | |
Futures Contracts(2) | | | (2,108,003 | ) | | | (2,108,003 | ) | | | — | | | | — | |
Swaps - Credit Default(2) | | | (8,113,293 | ) | | | — | | | | (8,113,293 | ) | | | — | |
Swaps - Cross Currency(2) | | | (128,601 | ) | | | — | | | | (128,601 | ) | | | — | |
TBA Sale Commitments | | | (159,521,484 | ) | | | — | | | | (159,521,484 | ) | | | — | |
Written Options | | | (351,953 | ) | | | — | | | | (351,953 | ) | | | — | |
| | | | | | | | | | | | | | | | |
Total | | $ | (171,183,721 | ) | | $ | (2,108,003 | ) | | $ | (169,075,718 | ) | | $ | — | |
| | | | | | | | | | | | | | | | |
| (1) | For the year ended December 31, 2015, investments valued at $24,775,863 were transferred from Level 1 to Level 2, and there were no transfers from Level 2 to Level 1. Investments are transferred between Level 1 and Level 2 for a variety of reasons including, but not limited to: |
| | a) | Foreign equities for which a fair value price is more representative of exit value than the local market close (transfer into Level 2). Foreign equities for which the local market close is more representative of exit value (transfer into Level 1). |
| | b) | Equity investments with no observable trading but a bid or mean price is used (transfer into Level 2). Equity investments using observable quoted prices in an active market (transfer into Level 1). |
| (2) | Derivative instruments (excluding purchased and written options, if applicable) are valued at the unrealized appreciation/depreciation on the investments. |
The accompanying notes are an integral part of these financial statements.
|
| Hartford Total Return Bond HLS Fund |
Schedule of Investments – (continued)
December 31, 2015
The following is a rollforward of the Fund’s investments that were valued using unobservable inputs (Level 3) for the year ended December 31, 2015:
| | | | | | | | |
| | | Asset &
Commercial
Mortgage Backed
Securities | | | Total | |
Beginning balance | | $ | 76,042,449 | | | $ | 76,042,449 | |
Purchases | | | — | | | | — | |
Sales | | | (19,804,513 | ) | | | (19,804,513 | ) |
Accrued discounts/(premiums) | | | 65,223 | | | | 65,223 | |
Total realized gain/(loss) | | | 2,377,013 | | | | 2,377,013 | |
Net change in unrealized appreciation/depreciation | | | (2,355,540 | ) | | | (2,355,540 | ) |
Transfers into Level 3(1) | | | — | | | | — | |
Transfers out of Level 3(1) | | | (56,324,632 | ) | | | (56,324,632 | ) |
| | | | | | | | |
Ending balance | | $ | — | | | $ | — | |
| | | | | | | | |
The change in net unrealized appreciation/depreciation relating to the Level 3 investments held at December 31, 2015 was $-.
| (1) | Investments are transferred into and out of Level 3 for a variety of reasons including, but not limited to: |
| | a) | Investments where trading has been halted (transfer into Level 3) or investments where trading has resumed (transfer out of Level 3). |
| | b) | Broker quoted investments (transfer into Level 3) or quoted prices in active markets (transfer out of Level 3). |
| | c) | Investments that have certain restrictions on trading (transfer into Level 3) or investments where trading restrictions have expired (transfer out of Level 3). |
| Note: | For purposes of reporting transfers between different hierarchy levels, both transfers in and out of each level, as applicable, are shown as if they occurred at the beginning of the period. |
The accompanying notes are an integral part of these financial statements.
|
| Hartford Ultrashort Bond HLS Fund |
Schedule of Investments
December 31, 2015
| | | | | | | | | | | | |
Shares or Principal Amount | | Market Value† | |
| ASSET & COMMERCIAL MORTGAGE BACKED SECURITIES - 20.3% | |
| | | | | | | Asset-Backed - Automobile - 7.3% | |
| | | | | | | | Ally Auto Receivables Trust | | | | |
| | $ | | | | 330,702 | | | 0.63%, 05/15/2017 | | $ | 330,603 | |
| | | | | 1,685,017 | | | 0.75%, 02/21/2017 | | | 1,683,337 | |
| | | | | | | | AmeriCredit Automobile Receivables | | | | |
| | | | | 1,660,000 | | | 1.26%, 04/08/2019 | | | 1,657,009 | |
| | | | | 850,000 | | | 1.26%, 11/08/2019 | | | 845,826 | |
| | | | | 1,055,712 | | | ARI Fleet Lease Trust
0.63%, 01/15/2021(1)(2) | | | 1,054,772 | |
| | | | | | | | Capital Automotive Receivables Asset Trust | | | | |
| | | | | 2,000,000 | | | 0.99%, 10/20/2017 | | | 1,993,696 | |
| | | | | 2,200,000 | | | 1.62%, 03/20/2019 | | | 2,186,855 | |
| | | | | 1,885,000 | | | CarMax Auto Owner Trust
1.09%, 04/15/2019 | | | 1,878,932 | |
| | | | | 1,494,219 | | | Chesapeake Funding LLC
0.69%, 03/07/2026(1)(2) | | | 1,489,088 | |
| | | | | 2,000,000 | | | Chrysler Capital Auto Receivables Trust
1.76%, 12/16/2019(2) | | | 1,994,364 | |
| | | | | 1,540,273 | | | Credit Acceptance Automotive Loan Trust
1.50%, 04/15/2021(2) | | | 1,538,726 | |
| | | | | | | | Enterprise Fleet Financing LLC | | | | |
| | | | | 606,258 | | | 0.87%, 09/20/2019(2) | | | 604,341 | |
| | | | | 712,866 | | | 1.06%, 03/20/2019(2) | | | 711,844 | |
| | | | | 1,750,000 | | | Fifth Third Auto Trust
1.42%, 03/16/2020 | | | 1,736,577 | |
| | | | | 1,510,664 | | | First Investors Automotive Owner Trust
1.06%, 11/15/2018(2) | | | 1,508,969 | |
| | | | | 3,000,000 | | | Ford Credit Auto Lease Trust
1.38%, 12/15/2018 | | | 2,982,252 | |
| | | | | | | | Ford Credit Auto Owner Trust | | | | |
| | | | | 660,517 | | | 0.57%, 10/15/2017 | | | 660,050 | |
| | | | | 855,000 | | | 0.95%, 08/15/2018 | | | 853,926 | |
| | | | | 2,000,000 | | | GM Financial Automobile Leasing Trust
1.30%, 05/21/2018(2) | | | 1,997,138 | |
| | | | | | | | M&T Bank Automotive Receivables Trust | | | | |
| | | | | 1,985,459 | | | 1.06%, 11/15/2017(2) | | | 1,985,615 | |
| | | | | 4,250,000 | | | 1.57%, 08/15/2018(2) | | | 4,257,690 | |
| | | | | 2,500,000 | | | Nissan Auto Lease Trust
1.18%, 12/15/2017 | | | 2,495,975 | |
| | | | | 4,000,000 | | | Nissan Automotive Lease Trust
1.04%, 10/15/2019 | | | 3,991,498 | |
| | | | | 493,948 | | | Prestige Automotive Receivables Trust
0.97%, 03/15/2018(2) | | | 492,982 | |
| | | | | | | | Westlake Automobile Receivables Trust | | | | |
| | | | | 19,292 | | | 0.70%, 05/15/2017(2) | | | 19,286 | |
| | | | | 365,970 | | | 1.17%, 03/15/2018(2) | | | 365,470 | |
| | | | | 2,525,000 | | | 1.28%, 07/16/2018(2) | | | 2,518,705 | |
| | | | | 390,744 | | | Wheels SPV LLC
0.84%, 03/20/2023(2) | | | 388,950 | |
| | | | | 1,680,000 | | | World Omni Auto Receivables Trust
0.96%, 07/15/2019 | | | 1,674,627 | |
| | | | | | | | World Omni Automobile Lease Securitization Trust | | | | |
| | | | | 1,115,000 | | | 1.06%, 05/15/2018 | | | 1,110,085 | |
| | | | | 4,250,000 | | | 1.40%, 02/15/2019 | | | 4,250,402 | |
| | | | | | | | | | | | |
| | | | | | | | | | | 51,259,590 | |
| | | | | | | | | | | | |
| | | | | | | Asset-Backed - Credit Card - 5.4% | | | |
| | | | | | | | American Express Credit Account Master Trust | |
| | | | | 1,520,000 | | | 0.98%, 05/15/2019 | | | 1,518,648 | |
| | | | | 1,485,000 | | | 1.26%, 01/15/2020 | | | 1,481,987 | |
| | | | | 2,995,000 | | | Bank of America Credit Card Trust
0.71%, 06/15/2021(1) | | | 2,989,821 | |
| | | | | | | | | | | | |
Shares or Principal Amount | | Market Value† | |
| ASSET & COMMERCIAL MORTGAGE BACKED SECURITIES - 20.3% - (continued) | |
| | | | | | | Asset-Backed - Credit Card - 5.4% - (continued) | | | |
| | $ | | | | 1,085,000 | | | Cabela’s Master Credit Card Trust
0.68%, 03/16/2020(1) | | $ | 1,082,927 | |
| | | | | 3,605,000 | | | Capital One Multi-Asset Execution Trust
0.96%, 09/16/2019 | | | 3,599,803 | |
| | | | | 6,000,000 | | | Chase Issuance Trust
0.75%, 11/16/2020(1) | | | 6,000,172 | |
| | | | | | | | Citibank Credit Card Issuance Trust | | | | |
| | | | | 3,660,000 | | | 0.57%, 11/07/2018(1) | | | 3,658,428 | |
| | | | | 2,045,000 | | | 1.02%, 02/22/2019 | | | 2,040,101 | |
| | | | | 4,965,000 | | | 1.32%, 09/07/2018 | | | 4,974,684 | |
| | | | | | | | Golden Credit Card Trust | | | | |
| | | | | 4,465,000 | | | 0.58%, 02/15/2018(1)(2) | | | 4,463,895 | |
| | | | | 3,125,000 | | | 0.75%, 03/15/2019(1)(2) | | | 3,111,475 | |
| | | | | 3,500,000 | | | Synchrony Credit Card Master Note Trust
1.61%, 11/15/2020 | | | 3,488,817 | |
| | | | | | | | | | | | |
| | | | | | | | | | | 38,410,758 | |
| | | | | | | | | | | | |
| | | | | | | Asset-Backed - Finance & Insurance - 4.2% | | | |
| | | | | | | | Ally Master Owner Trust | |
| | | | | 4,410,000 | | | 0.70%, 01/16/2018(1) | | | 4,410,000 | |
| | | | | 4,380,000 | | | 0.80%, 01/15/2019(1) | | | 4,374,019 | |
| | | | | 2,500,000 | | | 0.82%, 10/15/2019(1) | | | 2,492,036 | |
| | | | | | | | Ford Credit Floorplan Master Owner Trust | | | | |
| | | | | 2,105,000 | | | 0.73%, 02/15/2019(1) | | | 2,097,894 | |
| | | | | 2,450,000 | | | 0.85%, 01/15/2018 | | | 2,449,848 | |
| | | | | 1,380,000 | | | 0.93%, 08/15/2020(1) | | | 1,376,676 | |
| | | | | 1,150,000 | | | GMF Floorplan Owner Revolving Trust
0.83%, 05/15/2020(1)(2) | | | 1,145,521 | |
| | | | | 2,550,595 | | | John Deere Owner Trust
0.87%, 08/15/2017 | | | 2,547,752 | |
| | | | | 1,850,000 | | | Kubota Credit Owner Trust
1.16%, 05/15/2018(2) | | | 1,843,923 | |
| | | | | 1,290,000 | | | MMAF Equipment Finance LLC
0.96%, 09/18/2017(2) | | | 1,287,577 | |
| | | | | | | | New York City Tax Lien | | | | |
| | | | | 145,085 | | | 1.03%, 11/10/2027(2) | | | 144,360 | |
| | | | | 1,894,546 | | | 1.34%, 11/10/2028(2) | | | 1,884,695 | |
| | | | | 1,235,000 | | | Ocwen Master Advance Receivables Trust
2.53%, 11/15/2046(2) | | | 1,234,876 | |
| | | | | 2,209,949 | | | Volvo Financial Equipment LLC
0.82%, 04/16/2018(2) | | | 2,203,562 | |
| | | | | | | | | | | | |
| | | | | | | | | | | 29,492,739 | |
| | | | | | | | | | | | |
| | | | | | | Commercial Mortgage-Backed Securities - 3.4% | |
| | | | | | | | Bear Stearns Commercial Mortgage Securities, Inc. | |
| | | | | 2,322,715 | | | 5.54%, 09/11/2041 | | | 2,344,707 | |
| | | | | 1,875,810 | | | 5.71%, 09/11/2038(1) | | | 1,887,923 | |
| | | | | 2,328,391 | | | Cobalt CMBS Commercial Mortgage Trust
5.22%, 08/15/2048 | | | 2,365,509 | |
| | | | | 1,300,000 | | | Commercial Mortgage Trust
1.91%, 01/10/2046 | | | 1,297,387 | |
| | | | | | | | Community or Commercial Mortgage Trust | |
| | | | | 1,130,000 | | | 1.13%, 03/15/2029(1)(2) | | | 1,117,858 | |
| | | | | 1,500,000 | | | 2.37%, 02/10/2029(2) | | | 1,509,787 | |
| | | | | 2,516,034 | | | Credit Suisse Mortgage Capital Certificates
5.47%, 09/15/2039 | | | 2,542,619 | |
| | | | | 1,709,157 | | | Hilton USA Trust
1.27%, 11/05/2030(1)(2) | | | 1,701,144 | |
| | | | | | | | JP Morgan Chase Commercial Mortgage Securities Trust | |
| | | | | 33,057 | | | 3.85%, 06/15/2043(2) | | | 32,926 | |
| | | | | 749,877 | | | 5.91%, 04/15/2045(1) | | | 752,279 | |
The accompanying notes are an integral part of these financial statements.
|
| Hartford Ultrashort Bond HLS Fund |
Schedule of Investments – (continued)
December 31, 2015
| | | | | | | | | | | | |
Shares or Principal Amount | | Market Value† | |
| ASSET & COMMERCIAL MORTGAGE BACKED SECURITIES - 20.3% - (continued) | |
| | | | | | | Commercial Mortgage-Backed Securities - 3.4% - (continued) | |
| | $ | | | | 1,662,343 | | | LB-UBS Commercial Mortgage Trust
6.09%, 04/15/2041(1) | | $ | 1,750,824 | |
| | | | | | | | Morgan Stanley Capital I Trust | |
| | | | | 2,500,000 | | | 2.11%, 03/15/2045 | | | 2,506,848 | |
| | | | | 2,392,519 | | | 5.51%, 11/12/2049(1) | | | 2,443,135 | |
| | | | | 1,785,000 | | | WFRBS Commercial Mortgage Trust
2.19%, 04/15/2045 | | | 1,792,365 | |
| | | | | | | | | | | | |
| | | | | | | | | | | 24,045,311 | |
| | | | | | | | | | | | |
| | | | | | | Machinery - Construction & Mining - 0.0% | |
| | | | | 187,765 | | | Kubota Credit Owner Trust
0.58%, 02/15/2017(2) | | | 187,654 | |
| | | | | | | | | | | | |
| | | |
| | | | | | | | Total Asset & Commercial Mortgage Backed Securities
(cost $144,069,989) | | $ | 143,396,052 | |
| | | | | | | | | | | | |
| CORPORATE BONDS - 49.4% | | | |
| | | | | | | Aerospace/Defense - 0.3% | |
| | $ | | | | 2,300,000 | | | Rockwell Collins, Inc.
0.86%, 12/15/2016(1) | | $ | 2,295,757 | |
| | | | | | | | | | | | |
| | | | | | | Agriculture - 1.3% | |
| | | | | 2,000,000 | | | BAT International Finance plc
1.02%, 06/15/2018(1)(2) | | | 1,997,288 | |
| | | | | 6,000,000 | | | Philip Morris International, Inc.
2.50%, 05/16/2016 | | | 6,036,858 | |
| | | | | 1,425,000 | | | Reynolds American, Inc.
2.30%, 06/12/2018 | | | 1,433,950 | |
| | | | | | | | | | | | |
| | | | | | | | | | | 9,468,096 | |
| | | | | | | | | | | | |
| | | | | | | Auto Manufacturers - 5.0% | |
| | | | | | | | American Honda Finance Corp. | |
| | | | | 2,500,000 | | | 0.78%, 07/13/2018(1) | | | 2,494,237 | |
| | | | | 3,250,000 | | | 0.82%, 10/07/2016(1) | | | 3,255,957 | |
| | | | | 2,000,000 | | | Daimler Finance NA LLC
0.84%, 03/02/2018(1)(2) | | | 1,977,322 | |
| | | | | 2,000,000 | | | Daimler Finance North America LLC
1.65%, 05/18/2018(2) | | | 1,971,804 | |
| | | | | | | | Ford Motor Credit Co. LLC | |
| | | | | 2,150,000 | | | 1.10%, 01/17/2017(1) | | | 2,133,462 | |
| | | | | 2,500,000 | | | 1.33%, 03/12/2019(1) | | | 2,447,300 | |
| | | | | 2,000,000 | | | 1.72%, 12/06/2017 | | | 1,969,194 | |
| | | | | 2,600,000 | | | Harley-Davidson Financial Services, Inc.
3.88%, 03/15/2016(2) | | | 2,617,280 | |
| | | | | | | | Nissan Motor Acceptance Corp. | |
| | | | | 1,375,000 | | | 0.97%, 03/03/2017(1)(2) | | | 1,371,490 | |
| | | | | 1,975,000 | | | 1.30%, 09/26/2016(1)(2) | | | 1,974,603 | |
| | | | | 2,000,000 | | | 1.50%, 03/02/2018(2) | | | 1,980,626 | |
| | | | | | | | PACCAR Financial Corp. | |
| | | | | 1,500,000 | | | 1.05%, 12/06/2018(1) | | | 1,502,940 | |
| | | | | 1,000,000 | | | 1.40%, 05/18/2018 | | | 990,514 | |
| | | | | | | | Toyota Motor Credit Corp. | |
| | | | | 1,850,000 | | | 0.64%, 01/12/2018(1) | | | 1,839,585 | |
| | | | | 2,000,000 | | | 0.65%, 05/17/2016(1) | | | 2,000,512 | |
| | | | | 2,000,000 | | | 1.13%, 05/16/2017 | | | 1,996,638 | |
| | | | | 3,000,000 | | | Volkswagen Group of America Finance LLC
0.85%, 05/22/2018(1)(2) | | | 2,846,550 | |
| | | | | | | | | | | | |
| | | | | | | | | | | 35,370,014 | |
| | | | | | | | | | | | |
| | | | | | | Beverages - 1.5% | |
| | | | | 5,000,000 | | | Anheuser-Busch InBev Worldwide, Inc.
0.73%, 02/01/2019(1) | | | 4,909,250 | |
| | | | | | | | | | | | |
Shares or Principal Amount | | Market Value† | |
| CORPORATE BONDS - 49.4% - (continued) | | | |
| | | | | | | Beverages - 1.5% - (continued) | |
| | $ | | | | 6,000,000 | | | SABMiller Holdings, Inc.
1.02%, 08/01/2018(1)(2) | | $ | 5,952,606 | |
| | | | | | | | | | | | |
| | | | | | | | | | | 10,861,856 | |
| | | | | | | | | | | | |
| | | | | | | Chemicals - 0.3% | |
| | | | | | | | Monsanto Co. | |
| | | | | 2,000,000 | | | 1.15%, 06/30/2017 | | | 1,985,480 | |
| | | | | | | | | | | | |
| | | | | | | Commercial Banks - 22.7% | |
| | | | | | | | Abbey National Treasury Services plc | |
| | | | | 1,500,000 | | | 1.01%, 09/29/2017(1) | | | 1,487,426 | |
| | | | | 2,500,000 | | | 1.23%, 08/24/2018(1) | | | 2,499,060 | |
| | | | | 2,150,000 | | | ABN Amro Bank N.V.
0.86%, 06/06/2016(1)(2) | | | 2,149,551 | |
| | | | | 3,000,000 | | | Australia & New Zealand Banking Group Ltd.
0.70%, 01/10/2017(1)(2) | | | 3,002,289 | |
| | | | | | | | Bank of America Corp. | |
| | | | | 2,000,000 | | | 1.36%, 01/15/2019(1) | | | 2,007,342 | |
| | | | | 2,000,000 | | | 1.66%, 03/22/2018(1) | | | 2,006,416 | |
| | | | | 2,000,000 | | | 1.70%, 08/25/2017 | | | 1,994,282 | |
| | | | | 1,280,000 | | | 2.00%, 01/11/2018 | | | 1,278,368 | |
| | | | | 720,000 | | | 5.65%, 05/01/2018 | | | 774,222 | |
| | | | | | | | Bank of Montreal | |
| | | | | 4,000,000 | | | 0.84%, 07/15/2016(1) | | | 4,003,384 | |
| | | | | 2,000,000 | | | 1.40%, 04/10/2018 | | | 1,981,556 | |
| | | | | 6,000,000 | | | Bank of Nova Scotia
0.84%, 07/15/2016(1) | | | 6,006,276 | |
| | | | | 2,000,000 | | | Bank of Tokyo-Mitsubishi UFJ Ltd.
0.77%, 09/08/2017(1)(2) | | | 1,986,486 | |
| | | | | 2,815,000 | | | Barclays Bank plc
0.94%, 02/17/2017(1) | | | 2,813,410 | |
| | | | | 2,500,000 | | | BB&T Corp.
0.99%, 02/01/2019(1) | | | 2,478,332 | |
| | | | | 5,000,000 | | | BNP Paribas S.A.
1.09%, 12/12/2016(1) | | | 4,999,930 | |
| | | | | 6,000,000 | | | BPCE S.A.
1.19%, 02/10/2017(1) | | | 6,010,728 | |
| | | | | 2,500,000 | | | Branch Banking & Trust Co.
0.84%, 12/01/2016(1) | | | 2,498,900 | |
| | | | | 6,000,000 | | | Canadian Imperial Bank of Commerce
0.84%, 07/18/2016(1) | | | 6,005,370 | |
| | | | | | | | Citigroup, Inc. | |
| | | | | 2,500,000 | | | 1.04%, 11/15/2016(1) | | | 2,502,615 | |
| | | | | 4,000,000 | | | 1.09%, 04/08/2019(1) | | | 3,973,316 | |
| | | | | 2,000,000 | | | Commonwealth Bank of Australia
1.07%, 09/20/2016(1)(2) | | | 2,002,450 | |
| | | | | | | | Credit Agricole S.A. | |
| | | | | 2,500,000 | | | 1.46%, 06/10/2020(1)(2) | | | 2,494,635 | |
| | | | | 3,000,000 | | | 1.46%, 10/03/2016(1)(2) | | | 3,009,075 | |
| | | | | 2,250,000 | | | Credit Suisse AG
1.00%, 04/27/2018(1) | | | 2,239,330 | |
| | | | | 1,700,000 | | | Credit Suisse AG
1.38%, 05/26/2017 | | | 1,691,969 | |
| | | | | 2,250,000 | | | Credit Suisse New York
1.70%, 04/27/2018 | | | 2,233,845 | |
| | | | | | | | Deutsche Bank AG London | |
| | | | | 2,000,000 | | | 0.97%, 02/13/2017(1) | | | 1,987,446 | |
| | | | | 2,000,000 | | | 1.35%, 05/30/2017 | | | 1,987,110 | |
| | | | | | | | Fifth Third Bancorp | |
| | | | | 2,000,000 | | | 1.28%, 08/20/2018(1) | | | 2,002,906 | |
| | | | | 2,500,000 | | | 1.35%, 06/01/2017 | | | 2,493,000 | |
The accompanying notes are an integral part of these financial statements.
|
| Hartford Ultrashort Bond HLS Fund |
Schedule of Investments – (continued)
December 31, 2015
| | | | | | | | | | | | |
Shares or Principal Amount | | Market Value† | |
| CORPORATE BONDS - 49.4% - (continued) | | | |
| | | | | | | Commercial Banks - 22.7% - (continued) | |
| | | | | | | | Goldman Sachs Group, Inc. | |
| | $ | | | | 2,000,000 | | | 1.46%, 11/15/2018(1) | | $ | 2,008,122 | |
| | | | | 2,000,000 | | | 1.48%, 04/23/2020(1) | | | 2,002,962 | |
| | | | | 3,000,000 | | | 1.52%, 04/30/2018(1) | | | 3,013,626 | |
| | | | | 3,000,000 | | | HSBC Bank plc
1.00%, 05/15/2018(1)(2) | | | 2,988,468 | |
| | | | | 1,000,000 | | | Huntington National Bank
0.75%, 04/24/2017(1) | | | 994,989 | |
| | | | | 2,300,000 | | | ING Bank N.V.
1.07%, 03/16/2018(1)(2) | | | 2,292,014 | |
| | | | | | | | JP Morgan Chase & Co. | |
| | | | | 1,500,000 | | | 0.92%, 03/01/2018(1) | | | 1,489,902 | |
| | | | | 3,000,000 | | | 0.95%, 01/28/2019(1) | | | 2,977,809 | |
| | | | | 1,500,000 | | | 1.03%, 02/26/2016(1) | | | 1,500,119 | |
| | | | | 1,600,000 | | | Key Bank NA
0.93%, 06/01/2018(1) | | | 1,596,163 | |
| | | | | 2,000,000 | | | Lloyds Bank plc
1.04%, 03/16/2018(1) | | | 1,989,416 | |
| | | | | | | | Manufacturers & Traders Trust Co. | |
| | | | | 3,000,000 | | | 0.70%, 01/30/2017(1) | | | 2,995,614 | |
| | | | | 1,500,000 | | | 1.40%, 07/25/2017 | | | 1,493,117 | |
| | | | | | | | Morgan Stanley | |
| | | | | 3,000,000 | | | 1.17%, 01/24/2019(1) | | | 2,992,305 | |
| | | | | 1,525,000 | | | 1.64%, 02/25/2016(1) | | | 1,526,278 | |
| | | | | 1,275,000 | | | 5.95%, 12/28/2017 | | | 1,371,042 | |
| | | | | 3,000,000 | | | Nordea Bank AB
0.97%, 04/04/2017(1)(2) | | | 2,997,408 | |
| | | | | 7,500,000 | | | PNC Bank NA
1.15%, 11/01/2016 | | | 7,500,817 | |
| | | | | 3,000,000 | | | Royal Bank of Canada
0.65%, 01/23/2017(1) | | | 2,997,288 | |
| | | | | 2,000,000 | | | Santander Bank NA
1.25%, 01/12/2018(1) | | | 1,985,666 | |
| | | | | 3,000,000 | | | Societe Generale S.A.
1.69%, 10/01/2018(1) | | | 3,024,120 | |
| | | | | 2,000,000 | | | Standard Chartered plc
0.96%, 04/17/2018(1)(2) | | | 1,988,162 | |
| | | | | 3,000,000 | | | Sumitomo Mitsui Banking Corp.
0.75%, 01/10/2017(1) | | | 2,991,153 | |
| | | | | 3,000,000 | | | SunTrust Banks, Inc.
0.80%, 02/15/2017(1) | | | 2,989,230 | |
| | | | | 6,000,000 | | | Svenska Handelsbanken AB
1.06%, 09/23/2016(1) | | | 6,001,584 | |
| | | | | | | | Toronto-Dominion Bank | |
| | | | | 3,000,000 | | | 0.57%, 05/02/2017(1) | | | 2,993,268 | |
| | | | | 3,000,000 | | | 0.94%, 09/09/2016(1) | | | 3,002,763 | |
| | | | | 875,000 | | | U.S. Bancorp
0.85%, 11/15/2018(1) | | | 875,139 | |
| | | | | 2,000,000 | | | Wells Fargo & Co.
1.15%, 06/02/2017 | | | 1,992,464 | |
| | | | | 1,450,000 | | | Wells Fargo Bank NA
0.57%, 06/02/2016(1) | | | 1,448,841 | |
| | | | | | | | | | | | |
| | | | | | | | | | | 160,620,874 | |
| | | | | | | | | | | | |
| | | | | | | Diversified Financial Services - 3.4% | |
| | | | | | | | American Express Credit Corp. | |
| | | | | 1,500,000 | | | 0.83%, 07/29/2016(1) | | | 1,500,252 | |
| | | | | 2,500,000 | | | 1.08%, 03/18/2019(1) | | | 2,470,812 | |
| | | | | 1,500,000 | | | 1.13%, 06/05/2017 | | | 1,493,084 | |
| | | | | | | | | | | | |
Shares or Principal Amount | | Market Value† | |
| CORPORATE BONDS - 49.4% - (continued) | | | |
| | | | | | | Diversified Financial Services - 3.4% - (continued) | |
| | | | | | | | Capital One Bank USA NA | |
| | $ | | | | 2,500,000 | | | 1.15%, 11/21/2016 | | $ | 2,493,980 | |
| | | | | 1,500,000 | | | 1.30%, 06/05/2017 | | | 1,487,957 | |
| | | | | | | | General Electric Capital Corp. | |
| | | | | 2,000,000 | | | 0.64%, 05/15/2017(1) | | | 1,999,960 | |
| | | | | 3,000,000 | | | 1.32%, 04/02/2018(1) | | | 3,017,235 | |
| | | | | 3,750,000 | | | Macquarie Bank Ltd.
1.33%, 01/31/2017(1)(2) | | | 3,754,972 | |
| | | | | 4,000,000 | | | National Rural Utilities Cooperative Finance Corp. 0.68%, 11/23/2016(1) | | | 4,003,844 | |
| | | | | 1,700,000 | | | Synchrony Financial
1.56%, 02/03/2020(1) | | | 1,673,142 | |
| | | | | | | | | | | | |
| | | | | | | | | | | 23,895,238 | |
| | | | | | | | | | | | |
| | | | | | | Electric - 1.4% | |
| | | | | 6,000,000 | | | Duke Energy Indiana, Inc.
0.67%, 07/11/2016(1) | | | 6,000,024 | |
| | | | | 905,000 | | | Exelon Corp.
1.55%, 06/09/2017 | | | 901,184 | |
| | | | | 3,165,000 | | | NSTAR Electric Co.
0.60%, 05/17/2016(1) | | | 3,160,784 | |
| | | | | | | | | | | | |
| | | | | | | | | | | 10,061,992 | |
| | | | | | | | | | | | |
| | | | | | | Electronics - 0.2% | |
| | | | | 1,450,000 | | | Thermo Fisher Scientific, Inc.
1.30%, 02/01/2017 | | | 1,444,873 | |
| | | | | | | | | | | | |
| | | | | | | Gas - 0.6% | |
| | | | | 4,000,000 | | | Dominion Gas Holdings LLC
1.05%, 11/01/2016 | | | 3,995,768 | |
| | | | | | | | | | | | |
| | | | | | | Healthcare-Products - 0.5% | |
| | | | | 1,820,000 | | | Medtronic, Inc.
1.50%, 03/15/2018 | | | 1,818,944 | |
| | | | | 1,750,000 | | | Zimmer Biomet Holdings, Inc.
1.45%, 04/01/2017 | | | 1,741,478 | |
| | | | | | | | | | | | |
| | | | | | | | | | | 3,560,422 | |
| | | | | | | | | | | | |
| | | | | | | Healthcare-Services - 0.4% | |
| | | | | 2,700,000 | | | UnitedHealth Group, Inc.
0.77%, 01/17/2017(1) | | | 2,701,801 | |
| | | | | | | | | | | | |
| | | | | | | Home Furnishings - 0.4% | |
| | | | | 2,645,000 | | | Whirlpool Corp.
1.35%, 03/01/2017 | | | 2,629,508 | |
| | | | | | | | | | | | |
| | | | | | | Insurance - 2.0% | |
| | | | | 3,500,000 | | | New York Life Global Funding
1.13%, 03/01/2017(2) | | | 3,498,488 | |
| | | | | 3,500,000 | | | Pricoa Global Funding I
1.15%, 11/25/2016(2) | | | 3,499,604 | |
| | | | | | | | Principal Life Global Funding II | |
| | | | | 2,000,000 | | | 1.13%, 02/24/2017(2) | | | 1,995,188 | |
| | | | | 1,450,000 | | | 1.20%, 05/19/2017(2) | | | 1,445,160 | |
| | | | | 4,000,000 | | | Prudential Financial, Inc.
1.14%, 08/15/2018(1) | | | 3,998,476 | |
| | | | | | | | | | | | |
| | | | | | | | | | | 14,436,916 | |
| | | | | | | | | | | | |
| | | | | | | Machinery - Construction & Mining - 0.3% | |
| | | | | 2,175,000 | | | Caterpillar Financial Services Corp.
0.65%, 03/03/2017(1) | | | 2,169,719 | |
| | | | | | | | | | | | |
| | | | | | | Media - 0.9% | |
| | | | | 3,000,000 | | | NBCUniversal Enterprise, Inc.
1.01%, 04/15/2018(1)(2) | | | 2,994,996 | |
The accompanying notes are an integral part of these financial statements.
|
| Hartford Ultrashort Bond HLS Fund |
Schedule of Investments – (continued)
December 31, 2015
| | | | | | | | | | | | |
Shares or Principal Amount | | Market Value† | |
| CORPORATE BONDS - 49.4% - (continued) | | | |
| | | | | | | Media - 0.9% - (continued) | |
| | | | | | | | Thomson Reuters Corp. | |
| | $ | | | | 700,000 | | | 0.88%, 05/23/2016 | | $ | 699,454 | |
| | | | | 3,000,000 | | | 1.30%, 02/23/2017 | | | 2,985,651 | |
| | | | | | | | | | | | |
| | | | | | | | | | | 6,680,101 | |
| | | | | | | | | | | | |
| | | | | | | Oil & Gas - 2.7% | | | |
| | | | | | | | BP Capital Markets plc | |
| | | | | 3,000,000 | | | 0.76%, 11/07/2016(1) | | | 2,995,794 | |
| | | | | 4,000,000 | | | 1.23%, 09/26/2018(1) | | | 3,957,452 | |
| | | | | 2,345,000 | | | 1.67%, 02/13/2018 | | | 2,342,355 | |
| | | | | 3,000,000 | | | ConocoPhillips Co.
0.69%, 05/15/2018(1) | | | 2,977,920 | |
| | | | | 4,250,000 | | | Devon Energy Corp.
1.05%, 12/15/2016(1) | | | 4,206,510 | |
| | | | | 3,000,000 | | | Statoil ASA
0.80%, 11/08/2018(1) | | | 2,976,483 | |
| | | | | | | | | | | | |
| | | | | | | | | | | 19,456,514 | |
| | | | | | | | | | | | |
| | | | | | | Oil & Gas Services - 0.3% | |
| | | | | 1,800,000 | | | Schlumberger Holdings Corp.
1.90%, 12/21/2017(2) | | | 1,793,304 | |
| | | | | | | | | | | | |
| | | | | | | Pharmaceuticals - 2.3% | |
| | | | | | | | Actavis Funding SCS | |
| | | | | 2,000,000 | | | 1.30%, 06/15/2017 | | | 1,980,984 | |
| | | | | 4,700,000 | | | 1.58%, 03/12/2018(1) | | | 4,715,106 | |
| | | | | 1,750,000 | | | Baxalta, Inc.
1.37%, 06/22/2018(1)(2) | | | 1,744,540 | |
| | | | | 2,000,000 | | | Bayer US Finance LLC
0.89%, 10/06/2017(1)(2) | | | 1,994,070 | |
| | | | | 1,500,000 | | | Express Scripts Holding Co.
1.25%, 06/02/2017 | | | 1,490,001 | |
| | | | | 3,300,000 | | | McKesson Corp.
1.29%, 03/10/2017 | | | 3,290,724 | |
| | | | | 935,000 | | | Perrigo Co. plc
1.30%, 11/08/2016 | | | 928,387 | |
| | | | | | | | | | | | |
| | | | | | | | | | | 16,143,812 | |
| | | | | | | | | | | | |
| | | | | | | Pipelines - 0.5% | |
| | | | | | | | Enbridge, Inc. | |
| | | | | 1,800,000 | | | 0.87%, 06/02/2017(1) | | | 1,762,961 | |
| | | | | 2,000,000 | | | 1.26%, 10/01/2016(1) | | | 1,985,004 | |
| | | | | | | | | | | | |
| | | | | | | | | | | 3,747,965 | |
| | | | | | | | | | | | |
| | | | | | | Real Estate Investment Trusts - 0.6% | |
| | | | | | | | Ventas Realty L.P. | |
| | | | | 570,000 | | | 1.25%, 04/17/2017 | | | 565,797 | |
| | | | | 4,000,000 | | | 1.55%, 09/26/2016 | | | 4,002,760 | |
| | | | | | | | | | | | |
| | | | | | | | | | | 4,568,557 | |
| | | | | | | | | | | | |
| | | | | | | Retail - 0.4% | |
| | | | | | | | CVS Health Corp. | |
| | | | | 1,085,000 | | | 1.20%, 12/05/2016 | | | 1,085,193 | |
| | | | | 1,500,000 | | | 1.90%, 07/20/2018 | | | 1,499,105 | |
| | | | | | | | | | | | |
| | | | | | | | | | | 2,584,298 | |
| | | | | | | | | | | | |
| | | | | | | Software - 0.6% | |
| | | | | 405,000 | | | Fidelity National Information Services, Inc.
1.45%, 06/05/2017 | | | 399,519 | |
| | | | | 3,500,000 | | | Hewlett Packard Enterprise Co.
2.45%, 10/05/2017(2) | | | 3,497,032 | |
| | | | | | | | | | | | |
| | | | | | | | | | | 3,896,551 | |
| | | | | | | | | | | | |
| | | | | | | | | | | | |
Shares or Principal Amount | | Market Value† | |
| CORPORATE BONDS - 49.4% - (continued) | | | |
| | | | | | | Telecommunications - 0.6% | |
| | | | | | | | British Telecommunications plc | |
| | $ | | | | 1,190,000 | | | 1.25%, 02/14/2017 | | $ | 1,184,381 | |
| | | | | 3,135,000 | | | 1.63%, 06/28/2016 | | | 3,138,906 | |
| | | | | | | | | | | | |
| | | | | | | | | | | 4,323,287 | |
| | | | | | | | | | | | |
| | | | | | | Trucking & Leasing - 0.2% | |
| | | | | 1,145,000 | | | GATX Corp.
1.25%, 03/04/2017 | | | 1,133,529 | |
| | | | | | | | | | | | |
| | | |
| | | | | | | | Total Corporate Bonds
(cost $351,073,735) | | $ | 349,826,232 | |
| | | | | | | | | | | | |
| MUNICIPAL BONDS - 0.5% | | | |
| | | | | | | Education - 0.3% | |
| | $ | | | | 2,000,000 | | | New Jersey State Econ DA
1.10%, 06/15/2016 | | $ | 1,999,020 | |
| | | | | | | | | | | | |
| | | | | | | General - 0.2% | |
| | | | | 1,750,000 | | | State of Illinois
5.13%, 07/01/2017 | | | 1,809,570 | |
| | | | | | | | | | | | |
| | | |
| | | | | | | | Total Municipal Bonds
(cost $3,835,977) | | $ | 3,808,590 | |
| | | | | | | | | | | | |
| | | | U.S. GOVERNMENT AGENCIES - 17.1% | |
| | | | | | | FFCB - 11.5% | |
| | $ | | | | 20,000,000 | | | 0.45%, 04/18/2016 | | $ | 20,004,380 | |
| | | | | 27,000,000 | | | 0.45%, 09/08/2016 | | | 26,977,590 | |
| | | | | 34,150,000 | | | 0.50%, 06/27/2016 | | | 34,140,609 | |
| | | | | | | | | | | | |
| | | | | | | | | | | 81,122,579 | |
| | | | | | | | | | | | |
| | | | | | | FHLMC - 1.7% | | | |
| | | | | 7,165,000 | | | 0.63%, 11/01/2016 | | | 7,155,420 | |
| | | | | 5,000,000 | | | 0.88%, 10/14/2016 | | | 5,003,695 | |
| | | | | | | | | | | | |
| | | | | | | | | | | 12,159,115 | |
| | | | | | | | | | | | |
| | | | | | | FNMA - 3.9% | | | |
| | | | | 12,500,000 | | | 0.50%, 03/30/2016 | | | 12,500,963 | |
| | | | | 7,500,000 | | | 0.63%, 08/26/2016 | | | 7,500,375 | |
| | | | | 7,500,000 | | | 1.25%, 09/28/2016 | | | 7,527,180 | |
| | | | | | | | | | | | |
| | | | | | | | | | | 27,528,518 | |
| | | | | | | | | | | | |
| | | |
| | | | | | | | Total U.S. Government Agencies
(cost $120,897,811) | | $ | 120,810,212 | |
| | | | | | | | | | | | |
| U.S. GOVERNMENT SECURITIES - 11.2% | |
| | | | | | | Other Direct Federal Obligations - 11.2% | |
| | | | | | | FHLB - 11.2% | |
| | $ | | | | 10,000,000 | | | 0.38%, 08/25/2016 | | $ | 9,981,600 | |
| | | | | 5,580,000 | | | 0.33%, 06/17/2016 | | | 5,573,896 | |
| | | | | 5,000,000 | | | 0.38%, 07/22/2016 | | | 4,994,185 | |
| | | | | 20,000,000 | | | 0.32%, 03/18/2016 | | | 19,997,020 | |
| | | | | 38,660,000 | | | 0.38%, 06/24/2016 | | | 38,611,559 | |
| | | | | | | | | | | | |
| | | | | | | | | | | 79,158,260 | |
| | | | | | | | | | | | |
| | | |
| | | | | | | | Total U.S. Government Securities
(cost $79,184,119) | | $ | 79,158,260 | |
| | | | | | | | | | | | |
| | | |
| | | | | | | | Total Long-Term Investments
(cost $699,061,631) | | $ | 696,999,346 | |
| | | | | | | | | | | | |
The accompanying notes are an integral part of these financial statements.
|
| Hartford Ultrashort Bond HLS Fund |
Schedule of Investments – (continued)
December 31, 2015
| | | | | | | | | | |
Shares or Principal Amount | | Market Value† | |
| SHORT-TERM INVESTMENTS - 1.5% | | | |
| | | | | | Other Investment Pools & Funds - 1.5% | | | |
| | | 10,809,760 | | | Fidelity Money Market Class 1 | | $ | 10,809,760 | |
| | | | | | | | | | |
| | | |
| | | | | | Total Short-Term Investments
(cost $10,809,760) | | $ | 10,809,760 | |
| | | | | | | | | | |
| | | | | | | | | | | | |
| | | | |
| | | | Total Investments
(cost $709,871,391)^ | | | 100.0 | % | | $ | 707,809,106 | |
| | | | Other Assets and Liabilities | | | 0.0 | % | | | 248,484 | |
| | | | | | | | | | | | |
| | | | Total Net Assets | | | 100.0 | % | | $ | 708,057,590 | |
| | | | | | | | | | | | |
The accompanying notes are an integral part of these financial statements.
|
| Hartford Ultrashort Bond HLS Fund |
Schedule of Investments – (continued)
December 31, 2015
| Note: | Percentage of investments as shown is the ratio of the total market value to total net assets. |
| | The Fund may refer to any one or more of the industry classifications used by one or more widely recognized market indices, ratings group indices and/or as defined by Fund management. Industry classifications may not be identical across all security types. |
| | For Fund compliance purposes, the Fund may not use the same classification system shown in this report as these classifications are used for financial reporting purposes. |
| ^ | At December 31, 2015, the cost of securities for federal income tax purposes was $709,871,391 and the aggregate gross unrealized appreciation and depreciation based on that cost were: |
| | | | |
Unrealized Appreciation | | $ | 114,565 | |
Unrealized Depreciation | | | (2,176,850 | ) |
| | | | |
Net Unrealized Depreciation | | $ | (2,062,285 | ) |
| | | | |
| (1) | Variable rate securities; the rate reported is the coupon rate in effect at December 31, 2015. |
| (2) | Securities issued within terms of a private placement memorandum, exempt from registration under Rule 144A under the Securities Act of 1933, as amended, and may be sold only to qualified institutional buyers. Unless otherwise indicated, these holdings are determined to be liquid. At December 31, 2015, the aggregate value of these securities was $116,614,654, which represents 16.5% of total net assets. |
| † | See Significant Accounting Policies of accompanying Notes to Financial Statements regarding valuation of investments. |
| | |
| GLOSSARY: (abbreviations used in preceding Schedule of Investments) |
|
| Other Abbreviations: |
FFCB | | Federal Farm Credit Bank |
FHLB | | Federal Home Loan Bank |
FHLMC | | Federal Home Loan Mortgage Corp. |
FNMA | | Federal National Mortgage Association |
| Municipal Abbreviations: |
DA | | Development Authority |
The accompanying notes are an integral part of these financial statements.
|
| Hartford Ultrashort Bond HLS Fund |
Schedule of Investments – (continued)
December 31, 2015
Fair Valuation Summary
The following is a summary of the fair valuations according to the inputs used as of December 31, 2015 in valuing the Fund’s investments.
| | | | | | | | | | | | | | | | |
| | | Total | | | Level 1(1) | | | Level 2(1) | | | Level 3 | |
Assets | | | | | | | | | | | | | | | | |
Asset & Commercial Mortgage Backed Securities | | $ | 143,396,052 | | | $ | — | | | $ | 143,396,052 | | | $ | — | |
Corporate Bonds | | | 349,826,232 | | | | — | | | | 349,826,232 | | | | — | |
Municipal Bonds | | | 3,808,590 | | | | — | | | | 3,808,590 | | | | — | |
U.S. Government Agencies | | | 120,810,212 | | | | — | | | | 120,810,212 | | | | — | |
U.S. Government Securities | | | 79,158,260 | | | | — | | | | 79,158,260 | | | | — | |
Short-Term Investments | | | 10,809,760 | | | | 10,809,760 | | | | — | | | | — | |
| | | | | | | | | | | | | | | | |
Total | | $ | 707,809,106 | | | $ | 10,809,760 | | | $ | 696,999,346 | | | $ | — | |
| | | | | | | | | | | | | | | | |
| (1) | For the year ended December 31, 2015, there were no transfers between Level 1 and Level 2. |
The following is a rollforward of the Fund’s investments that were valued using unobservable inputs (Level 3) for the year ended December 31, 2015:
| | | | | | | | |
| | | Asset & Commercial
Mortgage Backed
Securities | | | Total | |
Beginning balance | | $ | 3,787,652 | | | $ | 3,787,652 | |
Purchases | | | — | | | | — | |
Sales | | | — | | | | — | |
Accrued discounts/(premiums) | | | — | | | | — | |
Total realized gain/(loss) | | | — | | | | — | |
Net change in unrealized appreciation/depreciation | | | — | | | | — | |
Transfers into Level 3(1) | | | — | | | | — | |
Transfers out of Level 3(1) | | | (3,787,652 | ) | | | (3,787,652 | ) |
| | | | | | | | |
Ending balance | | $ | — | | | $ | — | |
| | | | | | | | |
The change in net unrealized appreciation/depreciation relating to the Level 3 investments held at December 31, 2015 was $-.
| (1) | Investments are transferred into and out of Level 3 for a variety of reasons including, but not limited to: |
| | a) | Investments where trading has been halted (transfer into Level 3) or investments where trading has resumed (transfer out of Level 3). |
| | b) | Broker quoted investments (transfer into Level 3) or quoted prices in active markets (transfer out of Level 3). |
| | c) | Investments that have certain restrictions on trading (transfer into Level 3) or investments where trading restrictions have expired (transfer out of Level 3). |
| Note: | For purposes of reporting transfers between different hierarchy levels, both transfers in and out of each level, as applicable, are shown as if they occurred at the beginning of the period. |
The accompanying notes are an integral part of these financial statements.
|
| Hartford U.S. Government Securities HLS Fund |
Schedule of Investments
December 31, 2015
| | | | | | | | | | | | |
Shares or Principal Amount | | Market Value† | |
| ASSET & COMMERCIAL MORTGAGE BACKED SECURITIES - 24.2% | |
| | | | | | | Asset-Backed - Automobile - 3.0% | |
| $ | | | | | 4,435,000 | | | Ally Auto Receivables Trust
1.49%, 11/15/2019 | | $ | 4,417,237 | |
| | | | | 2,595,000 | | | Capital Auto Receivables Asset Trust
2.22%, 01/22/2019 | | | 2,602,722 | |
| | | | | 3,430,000 | | | Drive Auto Receivables Trust
2.12%, 06/17/2019(1) | | | 3,422,375 | |
| | | | | 1,240,000 | | | Huntington Automotive Trust
1.07%, 02/15/2018 | | | 1,237,526 | |
| | | | | 3,350,000 | | | Westlake Automobile Receivables Trust
3.40%, 01/15/2021(1) | | | 3,317,785 | |
| | | | | | | | | | | | |
| | | | | | | | | | | 14,997,645 | |
| | | | | | | | | | | | |
| | | | | | | Asset-Backed - Credit Card - 0.7% | |
| | | | | 3,380,000 | | | Cabela’s Master Credit Card Trust
0.80%, 07/15/2022(2) | | | 3,350,553 | |
| | | | | | | | | | | | |
| | | | | | | Asset-Backed - Finance & Insurance - 10.7% | |
| | | | | | | | Ares CLO Ltd. | |
| | | | | 4,755,000 | | | 1.77%, 04/20/2023(1)(2) | | | 4,647,061 | |
| | | | | 3,135,000 | | | 1.84%, 04/17/2026(1)(2) | | | 3,113,055 | |
| | | | | 1,205,000 | | | Avalon IV Capital Ltd.
2.14%, 04/17/2023(1)(2) | | | 1,195,963 | |
| | | | | 3,457,667 | | | Cal Funding II Ltd.
3.47%, 10/25/2027(1) | | | 3,405,170 | |
| | | | | 4,085,000 | | | Dryden Senior Loan Fund
1.67%, 04/18/2026(1)(2) | | | 4,034,346 | |
| | | | | 2,000,000 | | | Flatiron CLO Ltd.
2.22%, 07/17/2026(1)(2) | | | 1,962,800 | |
| | | | | 695,000 | | | Ford Credit Floorplan Master Owner Trust
2.32%, 01/15/2019 | | | 701,099 | |
| | | | | 1,405,000 | | | Green Tree Agency Advance Funding Trust
2.30%, 10/15/2046(1) | | | 1,402,530 | |
| | | | | 3,400,000 | | | ING Investment Management CLO Ltd.
2.19%, 03/14/2022(1)(2) | | | 3,360,560 | |
| | | | | 3,400,000 | | | Limerock CLO
1.82%, 04/18/2026(1)(2) | | | 3,371,440 | |
| | | | | 3,400,000 | | | Madison Park Funding Ltd.
1.60%, 10/23/2025(1)(2) | | | 3,355,120 | |
| | | | | 2,990,000 | | | Magnetite CLO Ltd.
2.27%, 07/25/2026(1)(2) | | | 2,933,190 | |
| | | | | 1,815,000 | | | Nationstar Agency Advance Funding Trust
1.89%, 02/18/2048(1) | | | 1,779,423 | |
| | | | | 2,220,000 | | | Ocwen Master Advance Receivables Trust
2.54%, 09/17/2046(1) | | | 2,218,059 | |
| | | | | 2,727,807 | | | SpringCastle America Funding LLC
2.70%, 05/25/2023(1) | | | 2,721,781 | |
| | | | | | | | Springleaf Funding Trust | |
| | | | | 2,890,000 | | | 2.41%, 12/15/2022(1) | | | 2,881,791 | |
| | | | | 4,720,000 | | | 3.16%, 11/15/2024(1) | | | 4,686,319 | |
| | | | | 1,138,763 | | | Structured Asset Securities Corp.
1.92%, 02/25/2033(2) | | | 1,131,697 | |
| | | | | 3,246,500 | | | TAL Advantage LLC
2.83%, 02/22/2038(1) | | | 3,227,674 | |
| | | | | 1,370,000 | | | Voya CLO Ltd.
1.77%, 07/17/2026(1)(2) | | | 1,358,355 | |
| | | | | | | | | | | | |
| | | | | | | | | | | 53,487,433 | |
| | | | | | | | | | | | |
| | | | | | | Asset-Backed - Home Equity - 0.2% | |
| | | | | 53,754 | | | Master Asset Backed Securities Trust
3.12%, 05/25/2033(2) | | | 53,779 | |
| | | | | | | | | | | | |
Shares or Principal Amount | | Market Value† | |
| ASSET & COMMERCIAL MORTGAGE BACKED SECURITIES - 24.2% - (continued) | |
| | | | | | | Asset-Backed - Home Equity - 0.2% - (continued) | |
| $ | | | | | 1,121,303 | | | Morgan Stanley Asset Backed Securities Capital I
1.92%, 11/25/2032(2) | | $ | 1,105,162 | |
| | | | | | | | | | | | |
| | | | | | | | | | | 1,158,941 | |
| | | | | | | | | | | | |
| | | | | | | Commercial Mortgage-Backed Securities - 2.8% | |
| | | | | | | | CSAIL Commercial Mortgage Trust | |
| | | | | 2,140,000 | | | 3.50%, 06/15/2057 | | | 2,159,223 | |
| | | | | 5,100,000 | | | 3.72%, 08/15/2048 | | | 5,166,591 | |
| | | | | 2,050,000 | | | FREMF Mortgage Trust
3.82%, 06/25/2047(1)(2) | | | 2,091,615 | |
| | | | | 4,750,000 | | | New Residential Advance Receivables Trust
2.32%, 08/15/2046(1) | | | 4,746,869 | |
| | | | | | | | | | | | |
| | | | | | | | | | | 14,164,298 | |
| | | | | | | | | | | | |
| | | | | | | Whole Loan Collateral CMO - 6.8% | |
| | | | | | | | LSTAR Securities Investment Trust | |
| | | | | 2,044,555 | | | 2.24%, 04/01/2020(1)(2) | | | 2,015,165 | |
| | | | | 4,424,422 | | | 2.24%, 05/01/2020(1)(2) | | | 4,332,836 | |
| | | | | 4,253,819 | | | 2.24%, 08/01/2020(1)(2) | | | 4,137,689 | |
| | | | | 2,325,640 | | | Morgan Stanley Dean Witter Capital I
1.76%, 03/25/2033(2) | | | 2,130,008 | |
| | | | | 2,122,259 | | | Sequoia Mortgage Trust
0.86%, 02/20/2035(2) | | | 2,004,556 | |
| | | | | 4,750,121 | | | Springleaf Mortgage Loan Trust
1.27%, 06/25/2058(1)(2) | | | 4,730,885 | |
| | | | | 2,694,290 | | | Thornburg Mortgage Securities Trust
2.27%, 04/25/2045(2) | | | 2,691,649 | |
| | | | | | | | Towd Point Mortgage Trust | |
| | | | | 2,468,673 | | | 2.75%, 04/25/2055(1)(2) | | | 2,441,188 | |
| | | | | 3,387,227 | | | 3.00%, 03/25/2054(1)(2) | | | 3,377,404 | |
| | | | | | | | WaMu Mortgage Pass-Through Certificates | |
| | | | | 2,083,524 | | | 2.18%, 03/25/2033(2) | | | 2,080,322 | |
| | | | | 2,331,169 | | | 2.43%, 10/25/2035(2) | | | 2,232,060 | |
| | | | | 2,210,359 | | | Wells Fargo Mortgage Backed Securities Trust
2.61%, 09/25/2033(2) | | | 2,200,670 | |
| | | | | | | | | | | | |
| | | | | | | | | | | 34,374,432 | |
| | | | | | | | | | | | |
| | | | | | | | Total Asset & Commercial Mortgage Backed Securities
(cost $121,841,737) | | $ | 121,533,302 | |
| | | | | | | | | | | | |
| U.S. GOVERNMENT AGENCIES - 45.2% | | | |
| | | | | | | FHLMC - 13.4% | |
| $ | | | | | 5,638,447 | | | 0.80%, 04/25/2020(2) | | $ | 5,638,904 | |
| | | | | 10,895,412 | | | 1.57%, 01/25/2022 | | | 10,796,680 | |
| | | | | 939,338 | | | 3.00%, 03/15/2033 | | | 127,506 | |
| | | | | 150,001 | | | 3.00%, 08/01/2045 | | | 149,875 | |
| | | | | 236,999 | | | 3.00%, 09/01/2045 | | | 236,854 | |
| | | | | 1,877,994 | | | 3.00%, 10/01/2045 | | | 1,876,422 | |
| | | | | 8,135,005 | | | 3.00%, 12/01/2045 | | | 8,128,202 | |
| | | | | 6,205,000 | | | 3.50%, 11/15/2025 | | | 6,550,633 | |
| | | | | 1,600,000 | | | 3.50%, 12/01/2045 | | | 1,648,362 | |
| | | | | 546,556 | | | 4.00%, 06/01/2044 | | | 577,858 | |
| | | | | 15,900,000 | | | 4.00%, 01/01/2046(3) | | | 16,796,547 | |
| | | | | 85,886 | | | 4.50%, 12/01/2018 | | | 88,855 | |
| | | | | 7,496 | | | 5.50%, 06/01/2034 | | | 8,315 | |
| | | | | 64,607 | | | 5.50%, 10/01/2035 | | | 71,800 | |
| | | | | 110,499 | | | 5.50%, 04/01/2037 | | | 122,487 | |
| | | | | 1,343,870 | | | 5.50%, 12/01/2037 | | | 1,487,179 | |
| | | | | 466,440 | | | 5.50%, 04/01/2038 | | | 515,792 | |
| | | | | 31,530 | | | 5.50%, 05/01/2038 | | | 35,082 | |
| | | | | 2,648,733 | | | 5.50%, 08/01/2038 | | | 2,946,078 | |
The accompanying notes are an integral part of these financial statements.
|
| Hartford U.S. Government Securities HLS Fund |
Schedule of Investments – (continued)
December 31, 2015
| | | | | | | | | | | | |
Shares or Principal Amount | | Market Value† | |
| U.S. GOVERNMENT AGENCIES - 45.2% - (continued) | | | |
| | | | | | | FHLMC - 13.4% - (continued) | |
| $ | | | | | 5,187 | | | 5.50%, 12/01/2039 | | $ | 5,765 | |
| | | | | 70,153 | | | 6.00%, 10/01/2021 | | | 78,735 | |
| | | | | 89,993 | | | 6.00%, 10/01/2022 | | | 101,052 | |
| | | | | 110,753 | | | 6.00%, 01/01/2028 | | | 125,733 | |
| | | | | 36,887 | | | 6.00%, 04/15/2028 | | | 41,478 | |
| | | | | 70,258 | | | 6.00%, 05/15/2028(4) | | | 79,174 | |
| | | | | 81,476 | | | 6.00%, 11/15/2028 | | | 92,112 | |
| | | | | 149,737 | | | 6.00%, 12/15/2028 | | | 169,329 | |
| | | | | 310,019 | | | 6.00%, 01/15/2029 | | | 350,798 | |
| | | | | 73,480 | | | 6.00%, 02/15/2029 | | | 83,499 | |
| | | | | 82,066 | | | 6.00%, 03/15/2029 | | | 92,517 | |
| | | | | 51,275 | | | 6.00%, 05/15/2029 | | | 58,252 | |
| | | | | 12,894 | | | 6.00%, 06/15/2029 | | | 14,629 | |
| | | | | 3,540 | | | 6.00%, 03/15/2031 | | | 4,024 | |
| | | | | 149,141 | | | 6.00%, 04/15/2031 | | | 168,964 | |
| | | | | 71,844 | | | 6.00%, 10/15/2031 | | | 81,853 | |
| | | | | 79,067 | | | 6.00%, 12/01/2031 | | | 90,124 | |
| | | | | 532,208 | | | 6.00%, 12/15/2031(4) | | | 603,500 | |
| | | | | 633,284 | | | 6.00%, 12/15/2031 | | | 717,401 | |
| | | | | 25,791 | | | 6.00%, 05/15/2032 | | | 29,000 | |
| | | | | 1,495,269 | | | 6.00%, 06/15/2032 | | | 1,685,248 | |
| | | | | 1,224,289 | | | 6.00%, 09/15/2032 | | | 1,376,986 | |
| | | | | 116,367 | | | 6.00%, 10/15/2032 | | | 132,913 | |
| | | | | 892 | | | 6.00%, 11/01/2032 | | | 1,017 | |
| | | | | 83,249 | | | 6.00%, 11/15/2032 | | | 94,405 | |
| | | | | 16,339 | | | 6.00%, 04/01/2033 | | | 18,358 | |
| | | | | 24,392 | | | 6.00%, 09/01/2034 | | | 27,491 | |
| | | | | 13,825 | | | 6.50%, 02/01/2017 | | | 14,130 | |
| | | | | 10,444 | | | 6.50%, 04/01/2028 | | | 11,894 | |
| | | | | 470,599 | | | 6.50%, 08/15/2028 | | | 520,085 | |
| | | | | 1,141,233 | | | 6.50%, 05/15/2032 | | | 1,300,042 | |
| | | | | 157,913 | | | 6.50%, 08/01/2032 | | | 183,643 | |
| | | | | 361,970 | | | 6.50%, 09/01/2032 | | | 412,507 | |
| | | | | 28,756 | | | 7.00%, 10/01/2026 | | | 30,079 | |
| | | | | 7,048 | | | 7.00%, 03/01/2027 | | | 7,896 | |
| | | | | 4,703 | | | 7.00%, 12/01/2027 | | | 4,866 | |
| | | | | 1,521 | | | 7.00%, 02/01/2029 | | | 1,793 | |
| | | | | 1,140 | | | 7.00%, 05/01/2029 | | | 1,331 | |
| | | | | 2,141 | | | 7.00%, 09/01/2029 | | | 2,408 | |
| | | | | 778 | | | 7.00%, 02/01/2031 | | | 919 | |
| | | | | 125,484 | | | 7.00%, 04/01/2032 | | | 147,607 | |
| | | | | 63,571 | | | 7.00%, 05/01/2032 | | | 65,367 | |
| | | | | 84,967 | | | 7.00%, 06/01/2032 | | | 99,674 | |
| | | | | 143,001 | | | 7.00%, 11/01/2032 | | | 165,687 | |
| | | | | 4,328 | | | 7.50%, 05/01/2024 | | | 4,857 | |
| | | | | 789 | | | 7.50%, 06/01/2024 | | | 800 | |
| | | | | 2,175 | | | 7.50%, 06/01/2025 | | | 2,401 | |
| | | | | 6,262 | | | 8.00%, 08/01/2024 | | | 6,536 | |
| | | | | 5,857 | | | 8.00%, 09/01/2024 | | | 6,147 | |
| | | | | 9,420 | | | 8.00%, 10/01/2024 | | | 9,902 | |
| | | | | 367 | | | 8.50%, 10/01/2024 | | | 369 | |
| | | | | 2,697 | | | 10.00%, 11/01/2020 | | | 2,732 | |
| | | | | | | | | | | | |
| | | | | | | | | | | 67,131,460 | |
| | | | | | | | | | | | |
| | | | | | | FNMA - 30.2% | |
| | | | | 8,135,626 | | | 1.49%, 03/01/2018 | | | 8,158,132 | |
| | | | | 3,534,314 | | | 2.22%, 10/01/2022 | | | 3,483,134 | |
| | | | | 6,312,931 | | | 2.25%, 10/01/2022 | | | 6,210,594 | |
| | | | | 3,559,320 | | | 2.31%, 10/01/2022 | | | 3,520,092 | |
| | | | | 2,040,203 | | | 2.56%, 01/01/2019 | | | 2,076,070 | |
| | | | | 1,547,902 | | | 2.65%, 07/01/2019 | | | 1,581,261 | |
| | | | | | | | | | | | |
Shares or Principal Amount | | Market Value† | |
| U.S. GOVERNMENT AGENCIES - 45.2% - (continued) | | | |
| | | | | | | FNMA - 30.2% - (continued) | |
| $ | | | | | 2,500,000 | | | 2.68%, 05/01/2025 | | $ | 2,446,763 | |
| | | | | 2,000,000 | | | 3.00%, 01/01/2031(3) | | | 2,060,286 | |
| | | | | 3,561,104 | | | 3.00%, 03/01/2043 | | | 3,569,087 | |
| | | | | 13,402,716 | | | 3.00%, 08/01/2043 | | | 13,429,703 | |
| | | | | 10,400,000 | | | 3.00%, 01/01/2046(3) | | | 10,400,095 | |
| | | | | 7,779,845 | | | 3.11%, 10/01/2021 | | | 8,071,400 | |
| | | | | 274,989 | | | 3.41%, 11/01/2020 | | | 288,308 | |
| | | | | 230,244 | | | 3.50%, 11/01/2020 | | | 242,008 | |
| | | | | 4,100,000 | | | 3.50%, 01/01/2031(3) | | | 4,293,631 | |
| | | | | 1,035,050 | | | 3.59%, 09/01/2030 | | | 1,061,010 | |
| | | | | 7,575,225 | | | 3.74%, 06/01/2018 | | | 7,855,408 | |
| | | | | 631,304 | | | 4.00%, 08/01/2045 | | | 670,976 | |
| | | | | 3,531,022 | | | 4.00%, 11/01/2045 | | | 3,741,765 | |
| | | | | 10,950,000 | | | 4.00%, 01/01/2046(3) | | | 11,586,982 | |
| | | | | 2,462,703 | | | 4.50%, 10/01/2040 | | | 2,665,613 | |
| | | | | 1,093,363 | | | 4.50%, 10/01/2041 | | | 1,180,862 | |
| | | | | 3,133,580 | | | 4.50%, 01/01/2043 | | | 3,390,265 | |
| | | | | 1,026,139 | | | 4.50%, 09/01/2043 | | | 1,108,258 | |
| | | | | 8,125,000 | | | 4.50%, 01/01/2046(3) | | | 8,773,984 | |
| | | | | 99,627 | | | 5.00%, 08/01/2018 | | | 103,546 | |
| | | | | 285,455 | | | 5.00%, 10/01/2018 | | | 296,786 | |
| | | | | 242,735 | | | 5.00%, 06/01/2025 | | | 262,893 | |
| | | | | 21,400,000 | | | 5.00%, 01/01/2046(3) | | | 23,554,546 | |
| | | | | 695,457 | | | 5.46%, 05/25/2042(2)(5) | | | 90,461 | |
| | | | | 28,101 | | | 5.50%, 11/01/2016 | | | 28,325 | |
| | | | | 30,946 | | | 5.50%, 10/01/2017 | | | 31,828 | |
| | | | | 24,929 | | | 5.50%, 12/01/2017 | | | 25,594 | |
| | | | | 132,638 | | | 5.50%, 04/01/2018 | | | 136,268 | |
| | | | | 89,386 | | | 5.50%, 06/01/2018 | | | 91,850 | |
| | | | | 7,415 | | | 5.50%, 07/01/2018 | | | 7,701 | |
| | | | | 1,116,273 | | | 5.50%, 08/01/2019 | | | 1,176,858 | |
| | | | | 359,483 | | | 6.00%, 10/01/2023 | | | 405,666 | |
| | | | | 45,625 | | | 6.00%, 10/25/2028 | | | 51,545 | |
| | | | | 16,844 | | | 6.00%, 11/25/2028 | | | 19,077 | |
| | | | | 67,456 | | | 6.00%, 04/25/2029 | | | 76,253 | |
| | | | | 1,044 | | | 6.00%, 05/01/2029 | | | 1,191 | |
| | | | | 55,167 | | | 6.00%, 05/25/2029 | | | 62,313 | |
| | | | | 47,632 | | | 6.00%, 06/25/2029 | | | 53,871 | |
| | | | | 101,251 | | | 6.00%, 07/25/2029 | | | 114,516 | |
| | | | | 545,332 | | | 6.00%, 05/25/2031(4) | | | 619,854 | |
| | | | | 178,665 | | | 6.00%, 09/25/2031 | | | 203,603 | |
| | | | | 43,447 | | | 6.00%, 11/25/2031 | | | 49,165 | |
| | | | | 676,579 | | | 6.00%, 12/25/2031 | | | 764,272 | |
| | | | | 291,735 | | | 6.00%, 01/01/2032 | | | 332,304 | |
| | | | | 433 | | | 6.00%, 04/01/2032 | | | 490 | |
| | | | | 565 | | | 6.00%, 05/01/2032 | | | 644 | |
| | | | | 2,716 | | | 6.00%, 09/25/2032 | | | 2,985 | |
| | | | | 102,567 | | | 6.00%, 11/01/2032 | | | 115,774 | |
| | | | | 70,322 | | | 6.00%, 02/01/2033 | | | 80,252 | |
| | | | | 387,877 | | | 6.00%, 03/01/2033 | | | 442,426 | |
| | | | | 1,267,120 | | | 6.00%, 05/01/2033 | | | 1,445,115 | |
| | | | | 19,601 | | | 6.00%, 08/01/2034 | | | 22,140 | |
| | | | | 215,319 | | | 6.00%, 01/01/2035 | | | 242,980 | |
| | | | | 4,126,338 | | | 6.00%, 02/01/2037 | | | 4,656,441 | |
| | | | | 54 | | | 6.50%, 04/01/2024 | | | 62 | |
| | | | | 234 | | | 6.50%, 04/01/2027 | | | 267 | |
| | | | | 18,566 | | | 6.50%, 04/01/2028 | | | 21,218 | |
| | | | | 328 | | | 6.50%, 05/01/2028 | | | 375 | |
| | | | | 11,539 | | | 6.50%, 10/01/2028 | | | 13,222 | |
| | | | | 221,782 | | | 6.50%, 11/01/2028 | | | 255,225 | |
| | | | | 111,866 | | | 6.50%, 12/01/2028 | | | 128,666 | |
The accompanying notes are an integral part of these financial statements.
|
| Hartford U.S. Government Securities HLS Fund |
Schedule of Investments – (continued)
December 31, 2015
| | | | | | | | | | | | |
Shares or Principal Amount | | Market Value† | |
| U.S. GOVERNMENT AGENCIES - 45.2% - (continued) | | | |
| | | | | | | FNMA - 30.2% - (continued) | |
| $ | | | | | 572,270 | | | 6.50%, 06/25/2029(4) | | $ | 628,965 | |
| | | | | 385,145 | | | 6.50%, 08/01/2029 | | | 440,162 | |
| | | | | 19 | | | 6.50%, 09/01/2029 | | | 21 | |
| | | | | 974 | | | 6.50%, 11/01/2030 | | | 1,113 | |
| | | | | 8,099 | | | 6.50%, 05/01/2031 | | | 9,397 | |
| | | | | 284,133 | | | 6.50%, 10/25/2031 | | | 317,322 | |
| | | | | 1,751,153 | | | 6.50%, 08/01/2032 | | | 2,016,951 | |
| | | | | 57,601 | | | 6.50%, 09/01/2032 | | | 65,829 | |
| | | | | 64 | | | 7.00%, 03/01/2016 | | | 64 | |
| | | | | 74 | | | 7.00%, 04/01/2016 | | | 74 | |
| | | | | 84 | | | 7.00%, 08/01/2016 | | | 85 | |
| | | | | 21,217 | | | 7.00%, 06/01/2017 | | | 21,431 | |
| | | | | 1,230 | | | 7.00%, 11/01/2031 | | | 1,383 | |
| | | | | 355 | | | 7.00%, 12/01/2031 | | | 365 | |
| | | | | 309,195 | | | 7.00%, 02/01/2032 | | | 361,427 | |
| | | | | 12,017 | | | 7.50%, 06/01/2023 | | | 13,524 | |
| | | | | 2,772 | | | 8.00%, 10/01/2029 | | | 3,334 | |
| | | | | 122 | | | 8.00%, 03/01/2030 | | | 126 | |
| | | | | 9,472 | | | 8.00%, 04/01/2030 | | | 11,740 | |
| | | | | 34 | | | 8.00%, 06/01/2030 | | | 34 | |
| | | | | 23,797 | | | 8.00%, 10/01/2030 | | | 29,412 | |
| | | | | 28,688 | | | 8.00%, 12/01/2030 | | | 32,854 | |
| | | | | 509 | | | 8.50%, 04/01/2017 | | | 522 | |
| | | | | 277 | | | 9.00%, 08/01/2020 | | | 301 | |
| | | | | 22,390 | | | 9.00%, 09/01/2021 | | | 22,697 | |
| | | | | | | | | | | | |
| | | | | | | | | | | 151,833,388 | |
| | | | | | | | | | | | |
| | | | | | | GNMA - 1.6% | |
| | | | | 349,819 | | | 4.00%, 01/20/2044 | | | 80,590 | |
| | | | | 1,359,418 | | | 5.00%, 01/20/2034 | | | 1,503,381 | |
| | | | | 1,538,158 | | | 5.50%, 09/20/2033 | | | 1,678,048 | |
| | | | | 674,304 | | | 6.00%, 01/15/2033 | | | 778,462 | |
| | | | | 426,948 | | | 6.00%, 02/15/2033 | | | 491,411 | |
| | | | | 57,090 | | | 6.50%, 12/15/2028 | | | 65,318 | |
| | | | | 43,606 | | | 6.50%, 05/15/2029 | | | 51,048 | |
| | | | | 661,679 | | | 6.50%, 05/16/2031 | | | 765,757 | |
| | | | | 61,282 | | | 6.50%, 09/15/2031 | | | 70,114 | |
| | | | | 258,982 | | | 6.50%, 10/15/2031 | | | 296,309 | |
| | | | | 286,080 | | | 6.50%, 11/15/2031 | | | 327,314 | |
| | | | | 376,883 | | | 6.50%, 01/15/2032 | | | 431,204 | |
| | | | | 20,842 | | | 7.00%, 06/20/2030 | | | 23,373 | |
| | | | | 21,676 | | | 7.00%, 05/15/2032 | | | 25,935 | |
| | | | | 48,937 | | | 7.00%, 07/15/2032 | | | 54,681 | |
| | | | | 127,679 | | | 7.00%, 09/15/2032 | | | 138,060 | |
| | | | | 746,033 | | | 7.00%, 10/15/2032 | | | 859,982 | |
| | | | | 2,383 | | | 7.50%, 04/15/2022 | | | 2,391 | |
| | | | | 4,412 | | | 7.50%, 01/15/2023 | | | 4,463 | |
| | | | | 1,017 | | | 7.50%, 05/15/2023 | | | 1,104 | |
| | | | | 6,635 | | | 7.50%, 06/15/2023 | | | 7,231 | |
| | | | | 1,847 | | | 7.50%, 07/15/2023 | | | 1,856 | |
| | | | | 19,055 | | | 7.50%, 08/15/2023 | | | 19,459 | |
| | | | | 7,788 | | | 7.50%, 09/15/2023 | | | 7,858 | |
| | | | | 11,786 | | | 7.50%, 10/15/2023 | | | 12,292 | |
| | | | | 23,691 | | | 7.50%, 11/15/2023 | | | 25,348 | |
| | | | | 9,705 | | | 7.50%, 12/15/2023 | | | 10,042 | |
| | | | | 10,499 | | | 7.50%, 02/15/2024 | | | 10,946 | |
| | | | | 2,928 | | | 7.50%, 04/15/2024 | | | 2,981 | |
| | | | | 2,621 | | | 7.50%, 05/15/2024 | | | 2,642 | |
| | | | | 91,499 | | | 7.50%, 07/15/2027 | | | 101,897 | |
| | | | | 59,212 | | | 7.50%, 04/20/2030 | | | 69,984 | |
| | | | | 119 | | | 8.50%, 09/15/2019 | | | 119 | |
| | | | | | | | | | | | |
Shares or Principal Amount | | Market Value† | |
| U.S. GOVERNMENT AGENCIES - 45.2% - (continued) | | | |
| | | | | | | GNMA - 1.6% - (continued) | |
| $ | | | | | 10,350 | | | 8.50%, 09/15/2024 | | $ | 11,657 | |
| | | | | 1,271 | | | 8.50%, 06/15/2029 | | | 1,358 | |
| | | | | 184 | | | 8.50%, 09/15/2029 | | | 185 | |
| | | | | 6,574 | | | 8.50%, 10/15/2029 | | | 7,111 | |
| | | | | 2,856 | | | 8.50%, 01/15/2030 | | | 3,273 | |
| | | | | 8,932 | | | 8.50%, 02/15/2030 | | | 9,059 | |
| | | | | 983 | | | 8.50%, 03/15/2030 | | | 1,064 | |
| | | | | | | | | | | | |
| | | | | | | | | | | 7,955,307 | |
| | | | | | | | | | | | |
| | | |
| | | | | | | | Total U.S. Government Agencies
(cost $224,688,345) | | $ | 226,920,155 | |
| | | | | | | | | | | | |
| U.S. GOVERNMENT SECURITIES - 41.5% | | | |
| | | | | | | Other Direct Federal Obligations - 24.0% | |
| | | | | | | FHLB - 24.0% | |
| $ | | | | | 16,335,000 | | | 1.75%, 12/14/2018 | | $ | 16,490,133 | |
| | | | | 4,825,000 | | | 1.88%, 08/01/2019 | | | 4,858,288 | |
| | | | | 19,965,000 | | | 4.13%, 03/13/2020 | | | 21,878,426 | |
| | | | | 26,000,000 | | | 5.25%, 12/09/2022 | | | 30,888,234 | |
| | | | | 45,500,000 | | | 5.38%, 05/18/2016 | | | 46,313,449 | |
| | | | | | | | | | | | |
| | | | | | | | | | | 120,428,530 | |
| | | | | | | | | | | | |
| | | | | | | U.S. Treasury Securities - 17.5% | |
| | | | | | | U.S. Treasury Notes - 17.5% | |
| | | | | 18,875,000 | | | 1.13%, 04/30/2020 | | | 18,443,669 | |
| | | | | 45,235,000 | | | 1.50%, 01/31/2019 | | | 45,394,046 | |
| | | | | 25,000,000 | | | 2.00%, 08/15/2025 | | | 24,375,975 | |
| | | | | | | | | | | | |
| | | | | | | | | | | 88,213,690 | |
| | | | | | | | | | | | |
| | | |
| | | | | | | | Total U.S. Government Securities
(cost $206,099,392) | | $ | 208,642,220 | |
| | | | | | | | | | | | |
| | | |
| | | | | | | | Total Long-Term Investments
(cost $552,629,474) | | $ | 557,095,677 | |
| | | | | | | | | | | | |
| | | |
| | | | | | | | | | | | |
| SHORT-TERM INVESTMENTS - 4.1% | | | |
| | | | | | | Other Investment Pools & Funds - 4.1% | |
| | | | | 20,592,817 | | | Fidelity Money Market Class 1 | | $ | 20,592,817 | |
| | | | | | | | | | | | |
| | | |
| | | | | | | | Total Short-Term Investments
(cost $20,592,817) | | $ | 20,592,817 | |
| | | | | | | | | | | | |
| | | | | | | | | | |
| | | |
| | Total Investments
(cost $573,222,291)^ | | | 115.0 | % | | $ | 577,688,494 | |
| | Other Assets and Liabilities | | | (15.0 | )% | | | (75,540,683 | ) |
| | | | | | | | | | |
| | Total Net Assets | | | 100.0 | % | | $ | 502,147,811 | |
| | | | | | | | | | |
The accompanying notes are an integral part of these financial statements.
|
| Hartford U.S. Government Securities HLS Fund |
Schedule of Investments – (continued)
December 31, 2015
| Note: | Percentage of investments as shown is the ratio of the total market value to total net assets. |
| | The Fund may refer to any one or more of the industry classifications used by one or more widely recognized market indices, ratings group indices and/or as defined by Fund management. Industry classifications may not be identical across all security types. |
| | For Fund compliance purposes, the Fund may not use the same classification system shown in this report as these classifications are used for financial reporting purposes. |
| ^ | At December 31, 2015, the cost of securities for federal income tax purposes was $573,222,291 and the aggregate gross unrealized appreciation and depreciation based on that cost were: |
| | | | |
Unrealized Appreciation | | $ | 6,560,182 | |
Unrealized Depreciation | | | (2,093,979 | ) |
| | | | |
Net Unrealized Appreciation | | $ | 4,466,203 | |
| | | | |
| (1) | Securities issued within terms of a private placement memorandum, exempt from registration under Rule 144A under the Securities Act of 1933, as amended, and may be sold only to qualified institutional buyers. Unless otherwise indicated, these holdings are determined to be liquid. At December 31, 2015, the aggregate value of these securities was $86,268,448, which represents 17.2% of total net assets. |
| (2) | Variable rate securities; the rate reported is the coupon rate in effect at December 31, 2015. |
| (3) | Represents or includes a TBA transaction. |
| (4) | These securities pay no principal or interest during their initial accrual period, but accrue additional principal at a specified coupon rate. |
| (5) | Security disclosed is interest-only strip. |
| | | | | | | | | | | | | | | | | | | | |
| Futures Contracts Outstanding at December 31, 2015 | |
Description | | Number of
Contracts | | | Expiration
Date | | | Notional
Amount | | | Market
Value † | | | Unrealized
Appreciation/
(Depreciation) | |
Long position contracts: | | | | | | | | | | | | | | | | | | | | |
U.S. Treasury 10-Year Note Future | | | 294 | | | | 03/21/2016 | | | $ | 37,124,169 | | | $ | 37,016,437 | | | $ | (107,732 | ) |
U.S. Treasury 2-Year Note Future | | | 45 | | | | 03/31/2016 | | | | 9,790,396 | | | | 9,775,547 | | | | (14,849 | ) |
U.S. Treasury 5-Year Note Future | | | 35 | | | | 03/31/2016 | | | | 4,141,562 | | | | 4,141,211 | | | | (351 | ) |
U.S. Treasury Long Bond Future | | | 5 | | | | 03/21/2016 | | | | 767,352 | | | | 768,750 | | | | 1,398 | |
| | | | | | | | | | | | | | | | | | | | |
Total | | | $ | (121,534 | ) |
| | | | | | | | | | | | | | | | | | | | |
Total futures contracts | | | $ | (121,534 | ) |
| | | | | | | | | | | | | | | | | | | | |
| | | | | | | | | | | | | | | | |
| TBA Sale Commitments Outstanding at December 31, 2015 | |
Description | | Principal
Amount | | | Maturity
Date | | | Market Value † | | | Unrealized
Appreciation/
(Depreciation) | |
FHLMC, 3.00% | | $ | 10,400,000 | | | | 01/01/2046 | | | $ | (10,382,821 | ) | | $ | 25,304 | |
FHLMC, 5.50% | | | 4,800,000 | | | | 01/01/2046 | | | | (5,308,669 | ) | | | 26,456 | |
FNMA, 3.50% | | | 3,500,000 | | | | 01/01/2046 | | | | (3,611,031 | ) | | | 2,719 | |
| | | | | | | | | | | | | | | | |
Total (proceeds $19,357,000) | | | $ | (19,302,521 | ) | | $ | 54,479 | |
| | | | | | | | | | | | | | | | |
| | At December 31, 2015, the aggregate market value of these securities represents (3.8)% of total net assets. |
| † | See Significant Accounting Policies of accompanying Notes to Financial Statements regarding valuation of investments. |
| | |
| GLOSSARY: (abbreviations used in preceding Schedule of Investments) |
|
| Other Abbreviations: |
CLO | | Collateralized Loan Obligation |
CMO | | Collateralized Mortgage Obligation |
FHLB | | Federal Home Loan Bank |
FHLMC | | Federal Home Loan Mortgage Corp. |
FNMA | | Federal National Mortgage Association |
GNMA | | Government National Mortgage Association |
TBA | | To Be Announced |
The accompanying notes are an integral part of these financial statements.
|
| Hartford U.S. Government Securities HLS Fund |
Schedule of Investments – (continued)
December 31, 2015
Fair Valuation Summary
The following is a summary of the fair valuations according to the inputs used as of December 31, 2015 in valuing the Fund’s investments.
| | | | | | | | | | | | | | | | |
| | | Total | | | Level 1(1) | | | Level 2(1) | | | Level 3 | |
Assets | | | | | | | | | | | | | | | | |
Asset & Commercial Mortgage Backed Securities | | $ | 121,533,302 | | | $ | — | | | $ | 121,533,302 | | | $ | — | |
U.S. Government Agencies | | | 226,920,155 | | | | — | | | | 226,920,155 | | | | — | |
U.S. Government Securities | | | 208,642,220 | | | | — | | | | 208,642,220 | | | | — | |
Short-Term Investments | | | 20,592,817 | | | | 20,592,817 | | | | — | | | | — | |
Futures Contracts(2) | | | 1,398 | | | | 1,398 | | | | — | | | | — | |
| | | | | | | | | | | | | | | | |
Total | | $ | 577,689,892 | | | $ | 20,594,215 | | | $ | 557,095,677 | | | $ | — | |
| | | | | | | | | | | | | | | | |
Liabilities | | | | | | | | | | | | | | | | |
Futures Contracts(2) | | $ | (122,932 | ) | | $ | (122,932 | ) | | $ | — | | | $ | — | |
TBA Sale Commitments | | | (19,302,521 | ) | | | — | | | | (19,302,521 | ) | | | — | |
| | | | | | | | | | | | | | | | |
Total | | $ | (19,425,453 | ) | | $ | (122,932 | ) | | $ | (19,302,521 | ) | | $ | — | |
| | | | | | | | | | | | | | | | |
| (1) | For the year ended December 31, 2015, there were no transfers between Level 1 and Level 2. |
| (2) | Derivative instruments (excluding purchased and written options, if applicable) are valued at the unrealized appreciation/depreciation on the investments. |
The following is a rollforward of the Fund’s investments that were valued using unobservable inputs (Level 3) for the year ended December 31, 2015:
| | | | | | | | |
| | | Asset & Commercial
Mortgage Backed
Securities | | | Total | |
Beginning balance | | $ | 15,253,099 | | | $ | 15,253,099 | |
Purchases | | | — | | | | — | |
Sales | | | (4,499,139 | ) | | | (4,499,139 | ) |
Accrued discounts/(premiums) | | | 4 | | | | 4 | |
Total realized gain/(loss) | | | 10,340 | | | | 10,340 | |
Net change in unrealized appreciation/depreciation | | | 1,858 | | | | 1,858 | |
Transfers into Level 3(1) | | | — | | | | — | |
Transfers out of Level 3(1) | | | (10,766,162 | ) | | | (10,766,162 | ) |
| | | | | | | | |
Ending balance | | $ | — | | | $ | — | |
| | | | | | | | |
The change in net unrealized appreciation/depreciation relating to the Level 3 investments held at December 31, 2015 was $—.
| (1) | Investments are transferred into and out of Level 3 for a variety of reasons including, but not limited to: |
| | a) | Investments where trading has been halted (transfer into Level 3) or investments where trading has resumed (transfer out of Level 3). |
| | b) | Broker quoted investments (transfer into Level 3) or quoted prices in active markets (transfer out of Level 3). |
| | c) | Investments that have certain restrictions on trading (transfer into Level 3) or investments where trading restrictions have expired (transfer out of Level 3). |
| Note: | For purposes of reporting transfers between different hierarchy levels, both transfers in and out of each level, as applicable, are shown as if they occurred at the beginning of the period. |
The accompanying notes are an integral part of these financial statements.
Schedule of Investments
December 31, 2015
| | | | | | | | |
Shares or Principal Amount | | Market Value† | |
| COMMON STOCKS - 96.4% | |
| | | | Banks - 13.9% | |
| | 250,245 | | | Citigroup, Inc. | | $ | 12,950,179 | |
| | 318,272 | | | JP Morgan Chase & Co. | | | 21,015,500 | |
| | 53,090 | | | M&T Bank Corp. | | | 6,433,446 | |
| | 127,490 | | | PNC Financial Services Group, Inc. | | | 12,151,072 | |
| | 398,795 | | | Wells Fargo & Co. | | | 21,678,496 | |
| | | | | | | | |
| | | | 74,228,693 | |
| | | | | | | | |
| | | | Capital Goods - 9.7% | |
| | 37,555 | | | 3M Co. | | | 5,657,285 | |
| | 152,625 | | | Eaton Corp. plc | | | 7,942,605 | |
| | 155,380 | | | Fortune Brands Home & Security, Inc. | | | 8,623,590 | |
| | 359,750 | | | General Electric Co. | | | 11,206,212 | |
| | 52,150 | | | Illinois Tool Works, Inc. | | | 4,833,262 | |
| | 80,835 | | | Ingersoll-Rand plc | | | 4,469,367 | |
| | 49,700 | | | Triumph Group, Inc. | | | 1,975,575 | |
| | 77,510 | | | United Technologies Corp. | | | 7,446,386 | |
| | | | | | | | |
| | | | 52,154,282 | |
| | | | | | | | |
| | | | Commercial & Professional Services - 1.1% | |
| | 131,300 | | | Nielsen Holdings plc | | | 6,118,580 | |
| | | | | | | | |
| | | | Consumer Durables & Apparel - 1.6% | |
| | 268,035 | | | PulteGroup, Inc. | | | 4,776,384 | |
| | 49,225 | | | PVH Corp. | | | 3,625,421 | |
| | | | | | | | |
| | | | 8,401,805 | |
| | | | | | | | |
| | | | Consumer Services - 2.1% | |
| | 202,590 | | | Hilton Worldwide Holdings, Inc. | | | 4,335,426 | |
| | 121,310 | | | Norwegian Cruise Line Holdings Ltd.* | | | 7,108,766 | |
| | | | | | | | |
| | | | 11,444,192 | |
| | | | | | | | |
| | | | Diversified Financials - 6.0% | |
| | 58,180 | | | Ameriprise Financial, Inc. | | | 6,191,516 | |
| | 24,955 | | | BlackRock, Inc. | | | 8,497,677 | |
| | 32,580 | | | Goldman Sachs Group, Inc. | | | 5,871,893 | |
| | 19,985 | | | Intercontinental Exchange, Inc. | | | 5,121,356 | |
| | 187,260 | | | Invesco Ltd. | | | 6,269,465 | |
| | 230,200 | | | Solar Cayman Ltd. *(1)(2)(3) | | | 49,723 | |
| | | | | | | | |
| | | | 32,001,630 | |
| | | | | | | | |
| | | | Energy - 9.2% | |
| | 55,515 | | | Anadarko Petroleum Corp. | | | 2,696,919 | |
| | 126,505 | | | Chevron Corp. | | | 11,380,390 | |
| | 90,350 | | | EOG Resources, Inc. | | | 6,395,876 | |
| | 101,545 | | | Exxon Mobil Corp. | | | 7,915,433 | |
| | 167,325 | | | Halliburton Co. | | | 5,695,743 | |
| | 378,820 | | | Marathon Oil Corp. | | | 4,769,344 | |
| | 57,170 | | | Occidental Petroleum Corp. | | | 3,865,264 | |
| | 40,020 | | | Pioneer Natural Resources Co. | | | 5,017,707 | |
| | 251,320 | | | Southwestern Energy Co. * | | | 1,786,885 | |
| | | | | | | | |
| | | | 49,523,561 | |
| | | | | | | | |
| | | | Food & Staples Retailing - 1.2% | |
| | 65,370 | | | CVS Health Corp. | | | 6,391,225 | |
| | | | | | | | |
| | | | Food, Beverage & Tobacco - 3.4% | |
| | 98,667 | | | British American Tobacco plc | | | 5,479,372 | |
| | 26,315 | | | Diageo plc ADR | | | 2,870,177 | |
| | 44,670 | | | Ingredion, Inc. | | | 4,281,173 | |
| | 76,683 | | | Kraft Heinz Co. | | | 5,579,455 | |
| | | | | | | | |
| | | | 18,210,177 | |
| | | | | | | | |
| | | | Health Care Equipment & Services - 3.5% | |
| | 68,330 | | | Baxter International, Inc. | | | 2,606,790 | |
| | 113,636 | | | Medtronic plc | | | 8,740,881 | |
| | | | | | | | |
Shares or Principal Amount | | Market Value† | |
| COMMON STOCKS - 96.4% - (continued) | |
| | | | Health Care Equipment & Services - 3.5% - (continued) | |
| | 61,405 | | | UnitedHealth Group, Inc. | | $ | 7,223,684 | |
| | | | | | | | |
| | | | 18,571,355 | |
| | | | | | | | |
| | | | Insurance - 6.2% | |
| | 72,190 | | | ACE Ltd. | | | 8,435,402 | |
| | 95,205 | | | American International Group, Inc. | | | 5,899,854 | |
| | 103,120 | | | Marsh & McLennan Cos., Inc. | | | 5,718,004 | |
| | 135,920 | | | MetLife, Inc. | | | 6,552,703 | |
| | 83,395 | | | Principal Financial Group, Inc. | | | 3,751,107 | |
| | 88,205 | | | Unum Group | | | 2,936,344 | |
| | | | | | | | |
| | | | 33,293,414 | |
| | | | | | | | |
| | | | Materials - 3.5% | |
| | 26,800 | | | Agrium, Inc. | | | 2,394,312 | |
| | 132,180 | | | Dow Chemical Co. | | | 6,804,626 | |
| | 96,145 | | | International Paper Co. | | | 3,624,667 | |
| | 55,665 | | | Nucor Corp. | | | 2,243,300 | |
| | 197,435 | | | Steel Dynamics, Inc. | | | 3,528,163 | |
| | | | | | | | |
| | | | 18,595,068 | |
| | | | | | | | |
| | | | Media - 2.9% | |
| | 112,430 | | | CBS Corp. Class B | | | 5,298,826 | |
| | 97,445 | | | Comcast Corp. Class A | | | 5,498,821 | |
| | 126,860 | | | Thomson Reuters Corp. | | | 4,801,651 | |
| | | | | | | | |
| | | | 15,599,298 | |
| | | | | | | | |
| | | | Pharmaceuticals, Biotechnology & Life Sciences - 10.3% | |
| | 17,100 | | | Allergan plc* | | | 5,343,750 | |
| | 34,890 | | | Amgen, Inc. | | | 5,663,694 | |
| | 175,150 | | | AstraZeneca plc ADR | | | 5,946,343 | |
| | 39,810 | | | Baxalta, Inc. | | | 1,553,784 | |
| | 120,300 | | | Bristol-Myers Squibb Co. | | | 8,275,437 | |
| | 42,270 | | | Gilead Sciences, Inc. | | | 4,277,301 | |
| | 242,250 | | | Merck & Co., Inc. | | | 12,795,645 | |
| | 135,924 | | | Pfizer, Inc. | | | 4,387,627 | |
| | 25,283 | | | Roche Holding AG | | | 7,006,131 | |
| | | | | | | | |
| | | | 55,249,712 | |
| | | | | | | | |
| | | | Retailing - 4.7% | |
| | 53,820 | | | Dollar General Corp. | | | 3,868,043 | |
| | 61,770 | | | Home Depot, Inc. | | | 8,169,082 | |
| | 78,970 | | | Lowe’s Cos., Inc. | | | 6,004,879 | |
| | 58,550 | | | Nordstrom, Inc. | | | 2,916,376 | |
| | 34,750 | | | Signet Jewelers Ltd. | | | 4,298,228 | |
| | | | | | | | |
| | | | | | | 25,256,608 | |
| | | | | | | | |
| | | | Semiconductors & Semiconductor Equipment - 4.4% | |
| | 47,790 | | | Analog Devices, Inc. | | | 2,643,743 | |
| | 331,710 | | | Intel Corp. | | | 11,427,409 | |
| | 245,315 | | | Maxim Integrated Products, Inc. | | | 9,321,970 | |
| | | | | | | | |
| | | | 23,393,122 | |
| | | | | | | | |
| | | | Software & Services - 4.0% | |
| | 273,105 | | | Microsoft Corp. | | | 15,151,865 | |
| | 299,675 | | | Symantec Corp. | | | 6,293,175 | |
| | | | | | | | |
| | | | | | | 21,445,040 | |
| | | | | | | | |
| | | | Technology Hardware & Equipment - 3.2% | |
| | 636,060 | | | Cisco Systems, Inc. | | | 17,272,209 | |
| | | | | | | | |
| | | | Telecommunication Services - 1.5% | |
| | 174,040 | | | Verizon Communications, Inc. | | | 8,044,129 | |
| | | | | | | | |
| | | | Transportation - 0.8% | |
| | 52,220 | | | Union Pacific Corp. | | | 4,083,604 | |
| | | | | | | | |
The accompanying notes are an integral part of these financial statements.
Schedule of Investments – (continued)
December 31, 2015
| | | | | | | | |
Shares or Principal Amount | | Market Value† | |
| COMMON STOCKS - 96.4% - (continued) | |
| | | | Utilities - 3.2% | |
| | 41,070 | | | Dominion Resources, Inc. | | $ | 2,777,975 | |
| | 78,590 | | | Edison International | | | 4,653,314 | |
| | 131,745 | | | Eversource Energy | | | 6,728,217 | |
| | 28,865 | | | NextEra Energy, Inc. | | | 2,998,785 | |
| | | | | | | | |
| | | | | | | 17,158,291 | |
| | | | | | | | |
| | |
| | | | Total Common Stocks
(cost $412,539,713) | | $ | 516,435,995 | |
| | | | | | | | |
| | |
| | | | Total Long-Term Investments
(cost $412,539,713) | | $ | 516,435,995 | |
| | | | | | | | |
|
| SHORT-TERM INVESTMENTS - 1.0% | |
| | | | Other Investment Pools & Funds - 1.0% | |
| | 5,181,996 | | | BlackRock Liquidity Funds TempFund Portfolio | | $ | 5,181,996 | |
| | | | | | | | |
| | |
| | | | Total Short-Term Investments
(cost $5,181,996) | | $ | 5,181,996 | |
| | | | | | | | |
| | | | | | | | | | |
| | | |
| | Total Investments
(cost $417,721,709)^ | | | 97.4 | % | | $ | 521,617,991 | |
| | Other Assets and Liabilities | | | 2.6 | % | | | 14,147,108 | |
| | | | | | | | | | |
| | Total Net Assets | | | 100.0 | % | | $ | 535,765,099 | |
| | | | | | | | | | |
The accompanying notes are an integral part of these financial statements.
Schedule of Investments – (continued)
December 31, 2015
| Note: | Percentage of investments as shown is the ratio of the total market value to total net assets. |
| | Prices of foreign equities that are principally traded on certain foreign markets may be adjusted daily pursuant to a fair value pricing service approved by the Board of Directors in order to reflect an adjustment for factors occurring after the close of certain foreign markets but before the close of the New York Stock Exchange. |
| | Equity industry classifications used in this report are the Global Industry Classification Standard, which was developed by and is the exclusive property and service mark of MSCI, Inc. and Standard & Poor’s. |
| | For Fund compliance purposes, the Fund may not use the same classification system shown in this report as these classifications are used for financial reporting purposes. |
| ^ | At December 31, 2015, the cost of securities for federal income tax purposes was $420,570,761 and the aggregate gross unrealized appreciation and depreciation based on that cost were: |
| | | | |
Unrealized Appreciation | | $ | 126,006,409 | |
Unrealized Depreciation | | | (24,959,179 | ) |
| | | | |
Net Unrealized Appreciation | | $ | 101,047,230 | |
| | | | |
| (1) | The following security is considered illiquid. Illiquid securities are often purchased in private placement transactions, are often not registered under the Securities Act of 1933, as amended, and may have contractual restrictions on resale. A security may also be considered illiquid if the security lacks a readily available market or if its valuation has not changed for a certain period of time. |
| | | | | | | | | | |
Period
Acquired | | Shares/ Par | | | Security | | Cost | |
| 03/2007 | | | 230,200 | | | Solar Cayman Ltd. | | $ | 67,469 | |
| | At December 31, 2015, the aggregate value of this security was $49,723, which represents 0.0% of total net assets. |
| (2) | This security is valued in good faith at fair value as determined under policies and procedures established by and under the supervision of the Board of Directors. At December 31, 2015, the aggregate fair value of this security was $49,723, which represents 0.0% of total net assets. This amount excludes securities that are principally traded in certain foreign markets and whose prices are adjusted pursuant to a third party pricing service methodology approved by the Board of Directors. |
| (3) | Securities issued within terms of a private placement memorandum, exempt from registration under Rule 144A under the Securities Act of 1933, as amended, and may be sold only to qualified institutional buyers. Unless otherwise indicated, this holding is determined to be liquid. At December 31, 2015, the aggregate value of this security was $49,723, which represents 0.0% of total net assets. |
| † | See Significant Accounting Policies of accompanying Notes to Financial Statements regarding valuation of investments. |
| | |
| GLOSSARY: (abbreviations used in preceding Schedule of Investments) |
|
| Other Abbreviations: |
ADR | | American Depositary Receipt |
The accompanying notes are an integral part of these financial statements.
Schedule of Investments – (continued)
December 31, 2015
Fair Valuation Summary
The following is a summary of the fair valuations according to the inputs used as of December 31, 2015 in valuing the Fund’s investments.
| | | | | | | | | | | | | | | | |
| | | Total | | | Level 1(1) | | | Level 2(1) | | | Level 3 | |
Assets | | | | | | | | | | | | | | | | |
Common Stocks | | | | | | | | | | | | | | | | |
Banks | | $ | 74,228,693 | | | $ | 74,228,693 | | | $ | — | | | $ | — | |
Capital Goods | | | 52,154,282 | | | | 52,154,282 | | | | — | | | | — | |
Commercial & Professional Services | | | 6,118,580 | | | | 6,118,580 | | | | — | | | | — | |
Consumer Durables & Apparel | | | 8,401,805 | | | | 8,401,805 | | | | — | | | | — | |
Consumer Services | | | 11,444,192 | | | | 11,444,192 | | | | — | | | | — | |
Diversified Financials | | | 32,001,630 | | | | 31,951,907 | | | | — | | | | 49,723 | |
Energy | | | 49,523,561 | | | | 49,523,561 | | | | — | | | | — | |
Food & Staples Retailing | | | 6,391,225 | | | | 6,391,225 | | | | — | | | | — | |
Food, Beverage & Tobacco | | | 18,210,177 | | | | 12,730,805 | | | | 5,479,372 | | | | — | |
Health Care Equipment & Services | | | 18,571,355 | | | | 18,571,355 | | | | — | | | | — | |
Insurance | | | 33,293,414 | | | | 33,293,414 | | | | — | | | | — | |
Materials | | | 18,595,068 | | | | 18,595,068 | | | | — | | | | — | |
Media | | | 15,599,298 | | | | 15,599,298 | | | | — | | | | — | |
Pharmaceuticals, Biotechnology & Life Sciences | | | 55,249,712 | | | | 48,243,581 | | | | 7,006,131 | | | | — | |
Retailing | | | 25,256,608 | | | | 25,256,608 | | | | — | | | | — | |
Semiconductors & Semiconductor Equipment | | | 23,393,122 | | | | 23,393,122 | | | | — | | | | — | |
Software & Services | | | 21,445,040 | | | | 21,445,040 | | | | — | | | | — | |
Technology Hardware & Equipment | | | 17,272,209 | | | | 17,272,209 | | | | — | | | | — | |
Telecommunication Services | | | 8,044,129 | | | | 8,044,129 | | | | — | | | | — | |
Transportation | | | 4,083,604 | | | | 4,083,604 | | | | — | | | | — | |
Utilities | | | 17,158,291 | | | | 17,158,291 | | | | — | | | | — | |
Short-Term Investments | | | 5,181,996 | | | | 5,181,996 | | | | — | | | | — | |
| | | | | | | | | | | | | | | | |
Total | | $ | 521,617,991 | | | $ | 509,082,765 | | | $ | 12,485,503 | | | $ | 49,723 | |
| | | | | | | | | | | | | | | | |
| (1) | For the year ended December 31, 2015, there were no transfers between Level 1 and Level 2. |
The following is a rollforward of the Fund’s investments that were valued using unobservable inputs (Level 3) for the year ended December 31, 2015:
| | | | | | | | |
| | | Common Stocks | | | Total | |
Beginning balance | | $ | 16,114 | | | $ | 16,114 | |
Purchases | | | — | | | | — | |
Sales | | | — | | | | — | |
Accrued discounts/(premiums) | | | — | | | | — | |
Total realized gain/(loss) | | | — | | | | — | |
Net change in unrealized appreciation/depreciation | | | 33,609 | | | | 33,609 | |
Transfers into Level 3(1) | | | — | | | | — | |
Transfers out of Level 3(1) | | | — | | | | — | |
| | | | | | | | |
Ending balance | | $ | 49,723 | | | $ | 49,723 | |
| | | | | | | | |
The change in net unrealized appreciation/depreciation relating to the Level 3 investments held at December 31, 2015 was $33,609.
| (1) | Investments are transferred into and out of Level 3 for a variety of reasons including, but not limited to: |
| | a) | Investments where trading has been halted (transfer into Level 3) or investments where trading has resumed (transfer out of Level 3). |
| | b) | Broker quoted investments (transfer into Level 3) or quoted prices in active markets (transfer out of Level 3). |
| | c) | Investments that have certain restrictions on trading (transfer into Level 3) or investments where trading restrictions have expired (transfer out of Level 3). |
| Note: | For purposes of reporting transfers between different hierarchy levels, both transfers in and out of each level, as applicable, are shown as if they occurred at the beginning of the period. |
The accompanying notes are an integral part of these financial statements.
[This page is intentionally left blank]
Statements of Assets and Liabilities
December 31, 2015
| | | | | | | | | | | | |
| | | Hartford
Balanced HLS
Fund | | |
Hartford
Capital Appreciation
HLS Fund | | | Hartford
Disciplined Equity
HLS Fund | |
Assets: | | | | | | | | | | | | |
Investments in securities, at market value | | $ | 2,510,777,153 | | | $ | 6,381,914,943 | | | $ | 739,247,496 | |
Cash | | | 94,253 | | | | 217,762 | | | | 48,204 | |
Cash collateral due from broker | | | — | | | | — | | | | 754,400 | |
Foreign currency | | | — | | | | 65,158 | | | | — | |
Unrealized appreciation on foreign currency contracts | | | — | | | | 783,025 | | | | — | |
Receivables: | | | | | | | | | | | | |
Investment securities sold | | | 5,382,281 | | | | 42,581,878 | | | | 2,175,408 | |
Fund shares sold | | | 36,188 | | | | 375,360 | | | | 7,456 | |
Dividends and interest | | | 9,391,191 | | | | 7,827,852 | | | | 703,953 | |
Variation margin on financial derivative instruments | | | 24,290 | | | | — | | | | — | |
Other assets | | | 5,702 | | | | — | | | | 13,367 | |
| | | | | | | | | | | | |
Total assets | | | 2,525,711,058 | | | | 6,433,765,978 | | | | 742,950,284 | |
| | | | | | | | | | | | |
Liabilities: | | | | | | | | | | | | |
Unrealized depreciation on foreign currency contracts | | | — | | | | — | | | | — | |
TBA sale commitments, at market value | | | 5,386,250 | | | | — | | | | — | |
Payables: | | | | | | | | | | | | |
Investment securities purchased | | | 5,345,074 | | | | 65,912,410 | | | | 1,496,249 | |
Fund shares redeemed | | | 1,594,482 | | | | 4,932,586 | | | | 170,529 | |
Investment management fees | | | 1,287,980 | | | | 3,458,095 | | | | 461,137 | |
Variation margin on financial derivative instruments | | | — | | | | — | | | | 157,444 | |
Distribution fees | | | 64,497 | | | | 141,050 | | | | 19,649 | |
Accrued expenses | | | 149,563 | | | | 290,730 | | | | 54,593 | |
| | | | | | | | | | | | |
Total liabilities | | | 13,827,846 | | | | 74,734,871 | | | | 2,359,601 | |
| | | | | | | | | | | | |
Net assets | | $ | 2,511,883,212 | | | $ | 6,359,031,107 | | | $ | 740,590,683 | |
| | | | | | | | | | | | |
Summary of Net Assets: | | | | | | | | | | | | |
Capital stock and paid-in-capital | | $ | 2,268,898,789 | | | $ | 5,737,690,820 | | | $ | 496,305,011 | |
Undistributed (distributions in excess of) net investment income | | | 28,777,300 | | | | 5,652,191 | | | | 979,743 | |
Accumulated net realized gain (loss) | | | (216,954,478 | ) | | | 451,027,560 | | | | 85,898,411 | |
Unrealized appreciation (depreciation) of investments and the translation of assets and liabilities denominated in foreign currency | | | 431,161,601 | | | | 164,660,536 | | | | 157,407,518 | |
| | | | | | | | | | | | |
Net assets | | $ | 2,511,883,212 | | | $ | 6,359,031,107 | | | $ | 740,590,683 | |
| | | | | | | | | | | | |
Shares authorized | | | 9,700,000,000 | | | | 5,450,000,000 | | | | 3,500,000,000 | |
| | | | | | | | | | | | |
Par value | | $ | 0.0010 | | | $ | 0.0010 | | | $ | 0.0010 | |
| | | | | | | | | | | | |
Class IA: Net asset value per share | | $ | 26.62 | | | $ | 44.44 | | | $ | 15.58 | |
| | | | | | | | | | | | |
Shares outstanding | | | 83,047,251 | | | | 128,277,553 | | | | 41,648,391 | |
| | | | | | | | | | | | |
Net Assets | | $ | 2,210,938,096 | | | $ | 5,701,268,594 | | | $ | 648,747,094 | |
| | | | | | | | | | | | |
Class IB: Net asset value per share | | $ | 26.99 | | | $ | 43.93 | | | $ | 15.46 | |
| | | | | | | | | | | | |
Shares outstanding | | | 11,148,633 | | | | 14,605,206 | | | | 5,941,660 | |
| | | | | | | | | | | | |
Net Assets | | $ | 300,945,116 | | | $ | 641,547,573 | | | $ | 91,843,589 | |
| | | | | | | | | | | | |
Class IC: Net asset value per share | | $ | — | | | $ | 44.21 | | | $ | — | |
| | | | | | | | | | | | |
Shares outstanding | | | — | | | | 366,783 | | | | — | |
| | | | | | | | | | | | |
Net Assets | | $ | — | | | $ | 16,214,940 | | | $ | — | |
| | | | | | | | | | | | |
Cost of investments | | $ | 2,079,483,975 | | | $ | 6,217,821,500 | | | $ | 582,121,743 | |
Cost of foreign currency | | $ | — | | | $ | 64,928 | | | $ | — | |
Proceeds of TBA sale commitments | | $ | 5,382,281 | | | $ | — | | | $ | — | |
Proceeds of written option contracts | | $ | — | | | $ | — | | | $ | — | |
The accompanying notes are an integral part of these financial statements.
Statements of Assets and Liabilities – (continued)
December 31, 2015
| | | | | | | | | | | | | | | | | | | | | | | | | | |
Hartford
Dividend and
Growth HLS
Fund | | | Hartford
Global Growth HLS
Fund | | | Hartford
Growth Opportunities
HLS Fund | | | Hartford
Healthcare HLS
Fund | | | Hartford
High Yield
HLS Fund | | | Hartford
International
Opportunities
HLS Fund | | | Hartford
MidCap HLS
Fund | |
| | | | | | | | | | | | | | | | | | | | | | | | | | |
| $ | 3,438,524,476 | | | $ | 477,972,801 | | | $ | 1,380,203,556 | | | $ | 421,783,967 | | | $ | 325,275,250 | | | $ | 1,316,502,409 | | | $ | 1,752,791,308 | |
| | 286,943 | | | | — | | | | — | | | | — | | | | — | | | | — | | | | — | |
| | — | | | | — | | | | — | | | | — | | | | 469,751 | | | | — | | | | — | |
| | — | | | | 37,494 | | | | — | | | | — | | | | — | | | | 150,164 | | | | — | |
| | — | | | | — | | | | — | | | | — | | | | 64,475 | | | | — | | | | — | |
| | | | | | | | | | | | | | | | | | | | | | | | | | |
| | 1,360,515 | | | | 818,211 | | | | 4,619,915 | | | | 462,347 | | | | 481,906 | | | | 382,175 | | | | 467,833 | |
| | 425,145 | | | | 26,627 | | | | 187,346 | | | | 1,739,628 | | | | 6,128 | | | | 105,889 | | | | 492,961 | |
| | 5,132,814 | | | | 736,623 | | | | 1,013,662 | | | | 409,637 | | | | 4,850,907 | | | | 3,365,136 | | | | 1,156,771 | |
| | — | | | | — | | | | — | | | | — | | | | 7,656 | | | | — | | | | — | |
| | 4,854 | | | | 14,370 | | | | 17,681 | | | | 11,580 | | | | 14,808 | | | | 11,333 | | | | 8,892 | |
| | | | | | | | | | | | | | | | | | | | | | | | | | |
| | 3,445,734,747 | | | | 479,606,126 | | | | 1,386,042,160 | | | | 424,407,159 | | | | 331,170,881 | | | | 1,320,517,106 | | | | 1,754,917,765 | |
| | | | | | | | | | | | | | | | | | | | | | | | | | |
| | | | | | | | | | | | | | | | | | | | | | | | | | |
| | — | | | | — | | | | — | | | | — | | | | 645 | | | | — | | | | — | |
| | — | | | | — | | | | — | | | | — | | | | — | | | | — | | | | — | |
| | | | | | | | | | | | | | | | | | | | | | | | | | |
| | — | | | | — | | | | 8,453,560 | | | | 138,172 | | | | — | | | | 1,324,686 | | | | 886,180 | |
| | 2,078,574 | | | | 168,157 | | | | 755,638 | | | | 515,001 | | | | 2,584,017 | | | | 473,381 | | | | 828,628 | |
| | 1,920,921 | | | | 307,464 | | | | 714,368 | | | | 297,443 | | | | 201,225 | | | | 781,303 | | | | 1,017,165 | |
| | — | | | | — | | | | — | | | | — | | | | — | | | | — | | | | — | |
| | 96,664 | | | | 18,620 | | | | 37,799 | | | | 13,384 | | | | 17,469 | | | | 36,835 | | | | 22,523 | |
| | 134,879 | | | | 51,092 | | | | 93,997 | | | | 15,886 | | | | 41,415 | | | | 112,963 | | | | 53,018 | |
| | | | | | | | | | | | | | | | | | | | | | | | | | |
| | 4,231,038 | | | | 545,333 | | | | 10,055,362 | | | | 979,886 | | | | 2,844,771 | | | | 2,729,168 | | | | 2,807,514 | |
| | | | | | | | | | | | | | | | | | | | | | | | | | |
| $ | 3,441,503,709 | | | $ | 479,060,793 | | | $ | 1,375,986,798 | | | $ | 423,427,273 | | | $ | 328,326,110 | | | $ | 1,317,787,938 | | | $ | 1,752,110,251 | |
| | | | | | | | | | | | | | | | | | | | | | | | | | |
| | | | | | | | | | | | | | | | | | | | | | | | | | |
| $ | 2,236,598,936 | | | $ | 359,293,497 | | | $ | 1,061,919,250 | | | $ | 250,496,941 | | | $ | 361,648,848 | | | $ | 1,657,486,611 | | | $ | 1,316,140,502 | |
| | 5,287,312 | | | | 2,754,031 | | | | 5,172,640 | | | | 11,704,604 | | | | 20,098,553 | | | | 19,001,664 | | | | 777,579 | |
| | 368,514,208 | | | | 46,438,090 | | | | 185,787,424 | | | | 56,025,935 | | | | (21,847,286 | ) | | | (383,117,925 | ) | | | 176,744,843 | |
| | | | | | |
| | 831,103,253 | | | | 70,575,175 | | | | 123,107,484 | | | | 105,199,793 | | | | (31,574,005 | ) | | | 24,417,588 | | | | 258,447,327 | |
| | | | | | | | | | | | | | | | | | | | | | | | | | |
| $ | 3,441,503,709 | | | $ | 479,060,793 | | | $ | 1,375,986,798 | | | $ | 423,427,273 | | | $ | 328,326,110 | | | $ | 1,317,787,938 | | | $ | 1,752,110,251 | |
| | | | | | | | | | | | | | | | | | | | | | | | | | |
| | 4,200,000,000 | | | | 3,600,000,000 | | | | 900,000,000 | | | | 800,000,000 | | | | 2,800,000,000 | | | | 2,825,000,000 | | | | 2,600,000,000 | |
| | | | | | | | | | | | | | | | | | | | | | | | | | |
| $ | 0.0010 | | | $ | 0.0010 | | | $ | 0.0010 | | | $ | 0.0010 | | | $ | 0.0010 | | | $ | 0.0010 | | | $ | 0.0010 | |
| | | | | | | | | | | | | | | | | | | | | | | | | | |
| $ | 22.09 | | | $ | 24.39 | | | $ | 34.86 | | | $ | 30.32 | | | $ | 7.55 | | | $ | 14.19 | | | $ | 33.66 | |
| | | | | | | | | | | | | | | | | | | | | | | | | | |
| | 135,463,830 | | | | 16,084,827 | | | | 34,341,662 | | | | 11,897,395 | | | | 33,281,939 | | | | 80,766,223 | | | | 48,953,874 | |
| | | | | | | | | | | | | | | | | | | | | | | | | | |
| $ | 2,991,811,209 | | | $ | 392,301,876 | | | $ | 1,197,187,495 | | | $ | 360,782,922 | | | $ | 251,312,640 | | | $ | 1,146,249,787 | | | $ | 1,647,714,855 | |
| | | | | | | | | | | | | | | | | | | | | | | | | | |
| $ | 22.02 | | | $ | 24.19 | | | $ | 33.76 | | | $ | 29.36 | | | $ | 7.43 | | | $ | 14.36 | | | $ | 33.11 | |
| | | | | | | | | | | | | | | | | | | | | | | | | | |
| | 20,424,791 | | | | 3,587,092 | | | | 4,689,337 | | | | 2,133,803 | | | | 10,361,488 | | | | 11,947,541 | | | | 3,153,087 | |
| | | | | | | | | | | | | | | | | | | | | | | | | | |
| $ | 449,692,500 | | | $ | 86,758,917 | | | $ | 158,303,905 | | | $ | 62,644,351 | | | $ | 77,013,470 | | | $ | 171,538,151 | | | $ | 104,395,396 | |
| | | | | | | | | | | | | | | | | | | | | | | | | | |
| $ | — | | | $ | — | | | $ | 34.57 | | | $ | — | | | $ | — | | | $ | — | | | $ | — | |
| | | | | | | | | | | | | | | | | | | | | | | | | | |
| | — | | | | — | | | | 592,914 | | | | — | | | | — | | | | — | | | | — | |
| | | | | | | | | | | | | | | | | | | | | | | | | | |
| $ | — | | | $ | — | | | $ | 20,495,398 | | | $ | — | | | $ | — | | | $ | — | | | $ | — | |
| | | | | | | | | | | | | | | | | | | | | | | | | | |
| $ | 2,607,420,064 | | | $ | 407,354,294 | | | $ | 1,257,083,347 | | | $ | 316,583,402 | | | $ | 356,843,900 | | | $ | 1,291,828,233 | | | $ | 1,494,343,981 | |
| $ | — | | | $ | 37,691 | | | $ | — | | | $ | — | | | $ | — | | | $ | 149,634 | | | $ | — | |
| $ | — | | | $ | — | | | $ | — | | | $ | — | | | $ | — | | | $ | — | | | $ | — | |
| $ | — | | | $ | — | | | $ | — | | | $ | — | | | $ | — | | | $ | — | | | $ | — | |
The accompanying notes are an integral part of these financial statements.
Statements of Assets and Liabilities – (continued)
December 31, 2015
| | | | | | | | | | | | |
| | |
Hartford
MidCap Value
HLS Fund | | | Hartford
Small Company
HLS Fund | | | Hartford
Small/Mid Cap
Equity HLS Fund | |
Assets: | | | | | | | | | | | | |
Investments in securities, at market value | | $ | 382,419,563 | | | $ | 1,218,858,867 | | | $ | 95,707,711 | |
Cash | | | 78,588 | | | | — | | | | 1,067 | |
Cash collateral due from broker | | | — | | | | — | | | | — | |
Foreign currency | | | 11 | | | | — | | | | — | |
Unrealized appreciation on foreign currency contracts | | | — | | | | — | | | | — | |
Unrealized appreciation on OTC swap contracts | | | — | | | | — | | | | — | |
Receivables: | | | | | | | | | | | | |
Investment securities sold | | | 1,523,586 | | | | 7,448,252 | | | | — | |
Fund shares sold | | | 4,957 | | | | 93,619 | | | | 13,853 | |
Dividends and interest | | | 403,766 | | | | 681,898 | | | | 298,968 | |
Variation margin on financial derivative instruments | | | — | | | | — | | | | — | |
OTC swap premiums paid | | | — | | | | — | | | | — | |
Other assets | | | 14,645 | | | | 11,237 | | | | 16,691 | |
| | | | | | | | | | | | |
Total assets | | | 384,445,116 | | | | 1,227,093,873 | | | | 96,038,290 | |
| | | | | | | | | | | | |
Liabilities: | | | | | | | | | | | | |
Unrealized depreciation on foreign currency contracts | | | — | | | | — | | | | — | |
Bank overdraft | | | — | | | | 530,258 | | | | — | |
Unrealized depreciation on OTC swap contracts | | | — | | | | — | | | | — | |
Cash collateral due to broker | | | — | | | | — | | | | — | |
TBA sale commitments, at market value | | | — | | | | — | | | | — | |
Unfunded loan commitments | | | — | | | | — | | | | — | |
Payables: | | | | | | | | | | | | |
Investment securities purchased | | | 1,097,349 | | | | 8,563,319 | | | | — | |
Fund shares redeemed | | | 139,696 | | | | 914,861 | | | | 76,528 | |
Investment management fees | | | 265,043 | | | | 717,553 | | | | 66,700 | |
Distribution fees | | | 19,889 | | | | 21,010 | | | | 3,587 | |
Written options | | | — | | | | — | | | | — | |
Accrued expenses | | | 29,029 | | | | 68,546 | | | | 11,585 | |
OTC swap premiums received | | | — | | | | — | | | | — | |
| | | | | | | | | | | | |
Total liabilities | | | 1,551,006 | | | | 10,815,547 | | | | 158,400 | |
| | | | | | | | | | | | |
Net assets | | $ | 382,894,110 | | | $ | 1,216,278,326 | | | $ | 95,879,890 | |
| | | | | | | | | | | | |
Summary of Net Assets: | | | | | | | | | | | | |
Capital stock and paid-in-capital | | $ | 286,352,082 | | | $ | 1,138,662,240 | | | $ | 84,530,153 | |
Undistributed (distributions in excess of) net investment income | | | 890,780 | | | | — | | | | 1,254,573 | |
Accumulated net realized gain (loss) | | | 48,041,746 | | | | 83,597,861 | | | | 5,672,218 | |
Unrealized appreciation (depreciation) of investments and the translation of assets and liabilities denominated in foreign currency | | | 47,609,502 | | | | (5,981,775 | ) | | | 4,422,946 | |
| | | | | | | | | | | | |
Net assets | | $ | 382,894,110 | | | $ | 1,216,278,326 | | | $ | 95,879,890 | |
| | | | | | | | | | | | |
Shares authorized | | | 1,200,000,000 | | | | 1,500,000,000 | | | | 900,000,000 | |
| | | | | | | | | | | | |
Par value | | $ | 0.0010 | | | $ | 0.0010 | | | $ | 0.0010 | |
| | | | | | | | | | | | |
Class IA: Net asset value per share | | $ | 12.33 | | | $ | 17.52 | | | $ | 7.45 | |
| | | | | | | | | | | | |
Shares outstanding | | | 23,614,361 | | | | 63,813,201 | | | | 10,659,841 | |
| | | | | | | | | | | | |
Net Assets | | $ | 291,174,257 | | | $ | 1,117,777,760 | | | $ | 79,378,502 | |
| | | | | | | | | | | | |
Class IB: Net asset value per share | | $ | 12.24 | | | $ | 16.47 | | | $ | 7.40 | |
| | | | | | | | | | | | |
Shares outstanding | | | 7,491,320 | | | | 5,981,256 | | | | 2,230,628 | |
| | | | | | | | | | | | |
Net Assets | | $ | 91,719,853 | | | $ | 98,500,566 | | | $ | 16,501,388 | |
| | | | | | | | | | | | |
Cost of investments | | $ | 334,807,433 | | | $ | 1,224,837,748 | | | $ | 91,284,765 | |
Cost of foreign currency | | $ | 11 | | | $ | — | | | $ | — | |
Proceeds of TBA sale commitments | | $ | — | | | $ | — | | | $ | — | |
Proceeds of written option contracts | | $ | — | | | $ | — | | | $ | — | |
The accompanying notes are an integral part of these financial statements.
Statements of Assets and Liabilities – (continued)
December 31, 2015
| | | | | | | | | | | | | | | | | | | | | | |
Hartford
SmallCap Growth
HLS Fund | | | Hartford
Stock HLS Fund | | | Hartford
Total Return Bond
HLS Fund | | | Hartford
Ultrashort Bond
HLS Fund | | | Hartford
U.S. Government
Securities
HLS Fund | | | Hartford
Value HLS Fund | |
| | | | | | | | | | | | | | | | | | | | | | |
| $ | 1,127,258,262 | | | $ | 1,526,779,024 | | | $ | 3,375,685,374 | | | $ | 707,809,106 | | | $ | 577,688,494 | | | $ | 521,617,991 | |
| | — | | | | — | | | | 233,574 | | | | — | | | | — | | | | 23,616 | |
| | — | | | | — | | | | 43,613 | | | | — | | | | 475,650 | | | | — | |
| | — | | | | 118,532 | | | | — | | | | — | | | | — | | | | — | |
| | — | | | | — | | | | 1,407,819 | | | | — | | | | — | | | | — | |
| | — | | | | — | | | | 3,543,468 | | | | — | | | | — | | | | — | |
| | | | | | | | | | | | | | | | | | | | | | |
| | 1,355,977 | | | | 16,119,931 | | | | 294,735,404 | | | | — | | | | 19,357,000 | | | | 118,429 | |
| | 446,135 | | | | 22,378 | | | | 251,901 | | | | 90,196 | | | | 4,252 | | | | 16,582,855 | |
| | 949,285 | | | | 2,707,302 | | | | 18,474,619 | | | | 1,039,786 | | | | 1,850,865 | | | | 872,462 | |
| | — | | | | — | | | | 244,692 | | | | — | | | | 106,051 | | | | — | |
| | — | | | | — | | | | 30,993,085 | | | | — | | | | — | | | | — | |
| | 13,779 | | | | 8,631 | | | | 6,870 | | | | 11,995 | | | | 15,955 | | | | 15,459 | |
| | | | | | | | | | | | | | | | | | | | | | |
| | 1,130,023,438 | | | | 1,545,755,798 | | | | 3,725,620,419 | | | | 708,951,083 | | | | 599,498,267 | | | | 539,230,812 | |
| | | | | | | | | | | | | | | | | | | | | | |
| | | | | | | | | | | | | | | | | | | | | | |
| | — | | | | — | | | | 960,387 | | | | — | | | | — | | | | — | |
| | — | | | | — | | | | — | | | | — | | | | 169,130 | | | | — | |
| | — | | | | — | | | | 6,885,653 | | | | — | | | | — | | | | — | |
| | — | | | | — | | | | 14,047,001 | | | | — | | | | — | | | | — | |
| | — | | | | — | | | | 159,521,484 | | | | — | | | | 19,302,521 | | | | — | |
| | — | | | | — | | | | 60,000 | | | | — | | | | — | | | | — | |
| | | | | | | | | | | | | | | | | | | | | | |
| | 5,418,978 | | | | — | | | | 781,883,078 | | | | — | | | | 77,321,471 | | | | 2,779,292 | |
| | 561,360 | | | | 1,176,539 | | | | 1,295,438 | | | | 587,224 | | | | 300,565 | | | | 304,095 | |
| | 587,196 | | | | 630,927 | | | | 1,086,983 | | | | 242,516 | | | | 192,779 | | | | 333,551 | |
| | 45,117 | | | | 33,369 | | | | 63,180 | | | | 20,871 | | | | 19,242 | | | | 17,234 | |
| | — | | | | — | | | | 351,953 | | | | — | | | | — | | | | — | |
| | 48,365 | | | | 82,040 | | | | 254,336 | | | | 42,882 | | | | 44,748 | | | | 31,541 | |
| | — | | | | — | | | | 15,924,649 | | | | — | | | | — | | | | — | |
| | | | | | | | | | | | | | | | | | | | | | |
| | 6,661,016 | | | | 1,922,875 | | | | 982,334,142 | | | | 893,493 | | | | 97,350,456 | | | | 3,465,713 | |
| | | | | | | | | | | | | | | | | | | | | | |
| $ | 1,123,362,422 | | | $ | 1,543,832,923 | | | $ | 2,743,286,277 | | | $ | 708,057,590 | | | $ | 502,147,811 | | | $ | 535,765,099 | |
| | | | | | | | | | | | | | | | | | | | | | |
| | | | | | | | | | | | | | | | | | | | | | |
| $ | 1,070,429,156 | | | $ | 1,512,463,825 | | | $ | 2,724,742,692 | | | $ | 707,790,221 | | | $ | 602,418,536 | | | $ | 369,851,117 | |
| | 1,318,657 | | | | 2,566,050 | | | | 66,990,645 | | | | 2,672,136 | | | | 9,029,448 | | | | 781,816 | |
| | 44,555,436 | | | | (262,433,588 | ) | | | 9,108,489 | | | | (342,482 | ) | | | (113,699,321 | ) | | | 61,247,618 | |
| | | | | |
| | 7,059,173 | | | | 291,236,636 | | | | (57,555,549 | ) | | | (2,062,285 | ) | | | 4,399,148 | | | | 103,884,548 | |
| | | | | | | | | | | | | | | | | | | | | | |
| $ | 1,123,362,422 | | | $ | 1,543,832,923 | | | $ | 2,743,286,277 | | | $ | 708,057,590 | | | $ | 502,147,811 | | | $ | 535,765,099 | |
| | | | | | | | | | | | | | | | | | | | | | |
| | 700,000,000 | | | | 4,200,000,000 | | | | 5,000,000,000 | | | | 14,000,000,000 | | | | 700,000,000 | | | | 800,000,000 | |
| | | | | | | | | | | | | | | | | | | | | | |
| $ | 0.0010 | | | $ | 0.0010 | | | $ | 0.0010 | | | $ | 0.0100 | | | $ | 0.0010 | | | $ | 0.0010 | |
| | | | | | | | | | | | | | | | | | | | | | |
| $ | 24.93 | | | $ | 64.06 | | | $ | 10.93 | | | $ | 9.99 | | | $ | 10.34 | | | $ | 15.58 | |
| | | | | | | | | | | | | | | | | | | | | | |
| | 36,635,588 | | | | 21,669,780 | | | | 224,014,514 | | | | 61,153,524 | | | | 39,856,676 | | | | 29,250,548 | |
| | | | | | | | | | | | | | | | | | | | | | |
| $ | 913,413,965 | | | $ | 1,388,110,424 | | | $ | 2,448,280,342 | | | $ | 611,087,293 | | | $ | 412,059,967 | | | $ | 455,713,159 | |
| | | | | | | | | | | | | | | | | | | | | | |
| $ | 24.38 | | | $ | 64.03 | | | $ | 10.87 | | | $ | 9.97 | | | $ | 10.32 | | | $ | 15.57 | |
| | | | | | | | | | | | | | | | | | | | | | |
| | 8,611,633 | | | | 2,431,961 | | | | 27,150,164 | | | | 9,726,761 | | | | 8,733,095 | | | | 5,141,462 | |
| | | | | | | | | | | | | | | | | | | | | | |
| $ | 209,948,457 | | | $ | 155,722,499 | | | $ | 295,005,935 | | | $ | 96,970,297 | | | $ | 90,087,844 | | | $ | 80,051,940 | |
| | | | | | | | | | | | | | | | | | | | | | |
| $ | 1,120,199,089 | | | $ | 1,235,468,367 | | | $ | 3,428,737,646 | | | $ | 709,871,391 | | | $ | 573,222,291 | | | $ | 417,721,709 | |
| $ | — | | | $ | 118,114 | | | $ | — | | | $ | — | | | $ | — | | | $ | — | |
| $ | — | | | $ | — | | | $ | 159,447,272 | | | $ | — | | | $ | 19,357,000 | | | $ | — | |
| $ | — | | | $ | — | | | $ | 344,981 | | | $ | — | | | $ | — | | | $ | — | |
The accompanying notes are an integral part of these financial statements.
Statements of Operations
For the Year Ended December 31, 2015
| | | | | | | | | | | | |
| | | Hartford
Balanced HLS
Fund | | | Hartford
Capital Appreciation
HLS Fund | | |
Hartford
Disciplined Equity
HLS Fund | |
Investment Income: | | | | | | | | | | | | |
Dividends | | $ | 40,414,789 | | | $ | 104,917,271 | | | $ | 11,984,333 | |
Interest | | | 28,472,431 | | | | 161,825 | | | | 15,044 | |
Less: Foreign tax withheld | | | (302,558 | ) | | | (1,753,536 | ) | | | (12,003 | ) |
| | | | | | | | | | | | |
Total investment income, net | | | 68,584,662 | | | | 103,325,560 | | | | 11,987,374 | |
| | | | | | | | | | | | |
Expenses: | | | | | | | | | | | | |
Investment management fees | | | 16,927,685 | | | | 43,560,451 | | | | 5,699,248 | |
Administrative services fees | | | | | | | | | | | | |
Class IC | | | — | | | | 25,033 | | | | — | |
Transfer agent fees | | | | | | | | | | | | |
Class IA | | | 4,909 | | | | 8,403 | | | | 4,692 | |
Class IB | | | 683 | | | | 975 | | | | 669 | |
Class IC | | | — | | | | 14 | | | | — | |
Distribution fees | | | | | | | | | | | | |
Class IB | | | 837,549 | | | | 1,786,007 | | | | 246,272 | |
Class IC | | | — | | | | 25,033 | | | | — | |
Custodian fees | | | 19,113 | | | | 105,458 | | | | 4,195 | |
Registration and filing fees | | | 20,599 | | | | 39,883 | | | | 14,765 | |
Accounting services fees | | | 438,728 | | | | 1,163,165 | | | | 94,653 | |
Board of Directors’ fees | | | 77,359 | | | | 192,371 | | | | 22,773 | |
Audit fees | | | 35,445 | | | | 34,111 | | | | 21,184 | |
Other expenses | | | 366,222 | | | | 730,124 | | | | 154,253 | |
| | | | | | | | | | | | |
Total expenses (before waivers and fees paid indirectly) | | | 18,728,292 | | | | 47,671,028 | | | | 6,262,704 | |
Management fee waivers | | | (548,410 | ) | | | — | | | | — | |
Commission recapture | | | (10,202 | ) | | | (148,512 | ) | | | (7,898 | ) |
| | | | | | | | | | | | |
Total waivers and fees paid indirectly | | | (558,612 | ) | | | (148,512 | ) | | | (7,898 | ) |
| | | | | | | | | | | | |
Total expenses, net | | | 18,169,680 | | | | 47,522,516 | | | | 6,254,806 | |
| | | | | | | | | | | | |
Net Investment Income (Loss) | | | 50,414,982 | | | | 55,803,044 | | | | 5,732,568 | |
| | | | | | | | | | | | |
Net Realized Gain (Loss) on Investments, Other Financial Instruments and Foreign Currency Transactions: | | | | | | | | | | | | |
Net realized gain (loss) on investments | | | 219,028,783 | | | | 487,573,981 | | | | 86,618,835 | |
Net realized gain (loss) on purchased options contracts | | | — | | | | (19,529 | ) | | | — | |
Net realized gain (loss) on futures contracts | | | (574,265 | ) | | | — | | | | (259,876 | ) |
Net realized gain (loss) on swap contracts | | | — | | | | — | | | | — | |
Net realized gain (loss) on foreign currency contracts | | | — | | | | 12,365,127 | | | | — | |
Net realized gain (loss) on other foreign currency transactions | | | (34,977 | ) | | | (728,633 | ) | | | — | |
| | | | | | | | | | | | |
Net Realized Gain (Loss) on Investments, Other Financial Instruments and Foreign Currency Transactions | | | 218,419,541 | | | | 499,190,946 | | | | 86,358,959 | |
| | | | | | | | | | | | |
Net Changes in Unrealized Appreciation (Depreciation) of Investments, Other Financial Instruments and Foreign Currency Transactions: | | | | | | | | | | | | |
Net unrealized appreciation (depreciation) of investments | | | (261,082,152 | ) | | | (462,887,172 | ) | | | (39,844,158 | ) |
Net unrealized appreciation (depreciation) of futures contracts | | | (123,477 | ) | | | — | | | | 281,759 | |
Net unrealized appreciation (depreciation) of swap contracts | | | — | | | | — | | | | — | |
Net unrealized appreciation (depreciation) of foreign currency contracts | | | — | | | | (3,308,109 | ) | | | — | |
Net unrealized appreciation (depreciation) of translation of other assets and liabilities in foreign currencies | | | (9,021 | ) | | | (62,993 | ) | | | 6 | |
| | | | | | | | | | | | |
Net Changes in Unrealized Appreciation (Depreciation) of Investments, Other Financial Instruments and Foreign Currency Transactions | | | (261,214,650 | ) | | | (466,258,274 | ) | | | (39,562,393 | ) |
| | | | | | | | | | | | |
Net Gain (Loss) on Investments, Other Financial Instruments and Foreign Currency Transactions: | | | (42,795,109 | ) | | | 32,932,672 | | | | 46,796,566 | |
| | | | | | | | | | | | |
Net Increase (Decrease) in Net Assets Resulting from Operations | | $ | 7,619,873 | | | $ | 88,735,716 | | | $ | 52,529,134 | |
| | | | | | | | | | | | |
The accompanying notes are an integral part of these financial statements.
Statements of Operations – (continued)
For the Year Ended December 31, 2015
| | | | | | | | | | | | | | | | | | | | | | | | | | |
Hartford
Dividend and
Growth HLS
Fund | | | Hartford
Global Growth
HLS Fund | | | Hartford
Growth Opportunities
HLS Fund | | | Hartford
Healthcare HLS
Fund | | | Hartford
High Yield
HLS Fund | | | Hartford
International
Opportunities
HLS Fund | | | Hartford
MidCap HLS
Fund | |
| | | | | | | | | | | | | | | | | | | | | | | | | | |
| $ | 94,838,564 | | | $ | 7,241,984 | | | $ | 9,775,733 | | | $ | 3,616,136 | | | $ | 319,819 | | | $ | 35,010,599 | | | $ | 14,280,119 | |
| | 48,180 | | | | 15,642 | | | | 7,291 | | | | 9,487 | | | | 24,029,958 | | | | 32,057 | | | | 3,696 | |
| | (637,230 | ) | | | (281,575 | ) | | | (90,980 | ) | | | (44,462 | ) | | | — | | | | (3,455,035 | ) | | | (58,721 | ) |
| | | | | | | | | | | | | | | | | | | | | | | | | | |
| | 94,249,514 | | | | 6,976,051 | | | | 9,692,044 | | | | 3,581,161 | | | | 24,349,777 | | | | 31,587,621 | | | | 14,225,094 | |
| | | | | | | | | | | | | | | | | | | | | | | | | | |
| | | | | | | | | | | | | | | | | | | | | | | | | | |
| | 24,266,487 | | | | 3,655,333 | | | | 8,482,482 | | | | 3,467,850 | | | | 2,765,886 | | | | 9,834,521 | | | | 12,363,820 | |
| | | | | | | | | | | | | | | | | | | | | | | | | | |
| | — | | | | — | | | | 22,815 | | | | — | | | | — | | | | — | | | | — | |
| | | | | | | | | | | | | | | | | | | | | | | | | | |
| | 5,312 | | | | 4,398 | | | | 6,960 | | | | 4,509 | | | | 4,275 | | | | 5,661 | | | | 5,814 | |
| | 812 | | | | 1,010 | | | | 928 | | | | 844 | | | | 1,377 | | | | 850 | | | | 387 | |
| | — | | | | — | | | | 52 | | | | — | | | | — | | | | — | | | | — | |
| | | | | | | | | | | | | | | | | | | | | | | | | | |
| | 1,244,794 | | | | 227,437 | | | | 408,204 | | | | 164,641 | | | | 240,658 | | | | 467,721 | | | | 286,990 | |
| | — | | | | — | | | | 22,815 | | | | — | | | | — | | | | — | | | | — | |
| | 17,052 | | | | 17,984 | | | | 17,859 | | | | 7,587 | | | | 4,611 | | | | 92,616 | | | | 9,763 | |
| | 20,914 | | | | 14,100 | | | | 50,440 | | | | 16,096 | | | | 14,115 | | | | 16,505 | | | | 16,874 | |
| | 450,319 | | | | 68,177 | | | | 139,708 | | | | 41,786 | | | | 79,025 | | | | 229,364 | | | | 183,820 | |
| | 105,742 | | | | 14,092 | | | | 39,415 | | | | 11,888 | | | | 11,673 | | | | 40,577 | | | | 51,955 | |
| | 27,601 | | | | 43,966 | | | | 23,858 | | | | 21,762 | | | | 31,878 | | | | 51,515 | | | | 24,497 | |
| | 423,029 | | | | 120,284 | | | | 271,704 | | | | 38,762 | | | | 97,360 | | | | 282,943 | | | | 155,890 | |
| | | | | | | | | | | | | | | | | | | | | | | | | | |
| | 26,562,062 | | | | 4,166,781 | | | | 9,487,240 | | | | 3,775,725 | | | | 3,250,858 | | | | 11,022,273 | | | | 13,099,810 | |
| | — | | | | — | | | | — | | | | — | | | | — | | | | — | | | | — | |
| | (30,260 | ) | | | (934 | ) | | | (30,973 | ) | | | (5,166 | ) | | | — | | | | (16,099 | ) | | | (26,083 | ) |
| | | | | | | | | | | | | | | | | | | | | | | | | | |
| | (30,260 | ) | | | (934 | ) | | | (30,973 | ) | | | (5,166 | ) | | | — | | | | (16,099 | ) | | | (26,083 | ) |
| | | | | | | | | | | | | | | | | | | | | | | | | | |
| | 26,531,802 | | | | 4,165,847 | | | | 9,456,267 | | | | 3,770,559 | | | | 3,250,858 | | | | 11,006,174 | | | | 13,073,727 | |
| | | | | | | | | | | | | | | | | | | | | | | | | | |
| | 67,717,712 | | | | 2,810,204 | | | | 235,777 | | | | (189,398 | ) | | | 21,098,919 | | | | 20,581,447 | | | | 1,151,367 | |
| | | | | | | | | | | | | | | | | | | | | | | | | | |
| | | | | | | | | | | | | | | | | | | | | | | | | | |
| | 382,574,426 | | | | 46,861,138 | | | | 195,613,761 | | | | 69,065,771 | | | | (13,898,504 | ) | | | 45,302,244 | | | | 179,589,506 | |
| | — | | | | — | | | | — | | | | — | | | | — | | | | — | | | | — | |
| | — | | | | — | | | | — | | | | — | | | | — | | | | — | | | | — | |
| | — | | | | — | | | | — | | | | — | | | | (51,895 | ) | | | — | | | | — | |
| | — | | | | — | | | | — | | | | (28,402 | ) | | | 1,406,433 | | | | — | | | | — | |
| | (14,922 | ) | | | (18,003 | ) | | | (84,682 | ) | | | 5,473 | | | | (126,675 | ) | | | (698,795 | ) | | | (568 | ) |
| | | | | | | | | | | | | | | | | | | | | | | | | | |
|
382,559,504 |
| | | 46,843,135 | | | | 195,529,079 | | | | 69,042,842 | | | | (12,670,641 | ) | | | 44,603,449 | | | | 179,588,938 | |
| | | | | | | | | | | | | | | | | | | | | | | | | | |
| | | | | | |
| | | | | | | | | | | | | | | | | | | | | | | | | | |
| | (492,431,050 | ) | | | (12,480,647 | ) | | | (41,497,799 | ) | | | (21,656,841 | ) | | | (22,578,572 | ) | | | (34,275,581 | ) | | | (152,431,577 | ) |
| | — | | | | — | | | | — | | | | — | | | | — | | | | — | | | | — | |
| | — | | | | — | | | | — | | | | — | | | | (66,230 | ) | | | — | | | | — | |
| | — | | | | — | | | | (848 | ) | | | (3,944 | ) | | | (218,266 | ) | | | (13,288 | ) | | | — | |
| | 1,557 | | | | (14,942 | ) | | | (3,208 | ) | | | 490 | | | | 5,898 | | | | (63,584 | ) | | | — | |
| | | | | | | | | | | | | | | | | | | | | | | | | | |
| | | | | | |
| | (492,429,493 | ) | | | (12,495,589 | ) | | | (41,501,855 | ) | | | (21,660,295 | ) | | | (22,857,170 | ) | | | (34,352,453 | ) | | | (152,431,577 | ) |
| | | | | | | | | | | | | | | | | | | | | | | | | | |
| | (109,869,989 | ) | | | 34,347,546 | | | | 154,027,224 | | | | 47,382,547 | | | | (35,527,811 | ) | | | 10,250,996 | | | | 27,157,361 | |
| | | | | | | | | | | | | | | | | | | | | | | | | | |
| $ | (42,152,277 | ) | | $ | 37,157,750 | | | $ | 154,263,001 | | | $ | 47,193,149 | | | $ | (14,428,892 | ) | | $ | 30,832,443 | | | $ | 28,308,728 | |
| | | | | | | | | | | | | | | | | | | | | | | | | | |
The accompanying notes are an integral part of these financial statements.
Statements of Operations – (continued)
For the Year Ended December 31, 2015
| | | | | | | | | | | | |
| | |
Hartford
MidCap Value
HLS Fund | | | Hartford
Small Company
HLS Fund | | | Hartford
Small/Mid Cap
Equity HLS Fund | |
Investment Income: | | | | | | | | | | | | |
Dividends | | $ | 5,865,996 | | | $ | 8,252,244 | | | $ | 2,561,411 | |
Interest | | | 3,126 | | | | 49,160 | | | | 491 | |
Less: Foreign tax withheld | | | (108,800 | ) | | | (4,886 | ) | | | (2,715 | ) |
| | | | | | | | | | | | |
Total investment income, net | | | 5,760,322 | | | | 8,296,518 | | | | 2,559,187 | |
| | | | | | | | | | | | |
Expenses: | | | | | | | | | | | | |
Investment management fees | | | 3,450,120 | | | | 9,400,972 | | | | 901,889 | |
Transfer agent fees | | | | | | | | | | | | |
Class IA | | | 3,891 | | | | 6,208 | | | | 4,124 | |
Class IB | | | 1,257 | | | | 578 | | | | 931 | |
Distribution fees | | | | | | | | | | | | |
Class IB | | | 263,315 | | | | 294,017 | | | | 52,083 | |
Custodian fees | | | 8,973 | | | | 12,818 | | | | 2,268 | |
Registration and filing fees | | | 14,121 | | | | 15,749 | | | | 20,025 | |
Accounting services fees | | | 43,126 | | | | 165,520 | | | | 15,783 | |
Board of Directors’ fees | | | 12,681 | | | | 39,403 | | | | 3,788 | |
Audit fees | | | 21,079 | | | | 23,055 | | | | 16,828 | |
Other expenses | | | 79,556 | | | | 186,989 | | | | 30,015 | |
| | | | | | | | | | | | |
Total expenses (before waivers and fees paid indirectly) | | | 3,898,119 | | | | 10,145,309 | | | | 1,047,734 | |
Commission recapture | | | (5,738 | ) | | | (68,295 | ) | | | (21 | ) |
| | | | | | | | | | | | |
Total waivers and fees paid indirectly | | | (5,738 | ) | | | (68,295 | ) | | | (21 | ) |
| | | | | | | | | | | | |
Total expenses, net | | | 3,892,381 | | | | 10,077,014 | | | | 1,047,713 | |
| | | | | | | | | | | | |
Net Investment Income (Loss) | | | 1,867,941 | | | | (1,780,496 | ) | | | 1,511,474 | |
| | | | | | | | | | | | |
Net Realized Gain (Loss) on Investments, Other Financial Instruments and Foreign Currency Transactions: | | | | | | | | | | | | |
Net realized gain (loss) on investments | | | 49,325,686 | | | | 88,027,896 | | | | 5,335,423 | |
Less: Foreign taxes paid on realized capital gains | | | — | | | | — | | | | — | |
Net realized gain (loss) on purchased options contracts | | | — | | | | — | | | | — | |
Net realized gain (loss) on futures contracts | | | — | | | | — | | | | — | |
Net realized gain (loss) on written options contracts | | | — | | | | — | | | | — | |
Net realized gain (loss) on swap contracts | | | — | | | | — | | | | — | |
Net realized gain (loss) on foreign currency contracts | | | — | | | | 392 | | | | — | |
Net realized gain (loss) on other foreign currency transactions | | | (12,852 | ) | | | (63 | ) | | | (107 | ) |
| | | | | | | | | | | | |
Net Realized Gain (Loss) on Investments, Other Financial Instruments and Foreign Currency Transactions | | | 49,312,834 | | | | 88,028,225 | | | | 5,335,316 | |
| | | | | | | | | | | | |
Net Changes in Unrealized Appreciation (Depreciation) of Investments, Other Financial Instruments and Foreign Currency Transactions: | | | | | | | | | | | | |
Net unrealized appreciation (depreciation) of investments | | | (53,903,213 | ) | | | (198,108,689 | ) | | | (11,517,750 | ) |
Net unrealized appreciation (depreciation) of purchased options contracts | | | — | | | | — | | | | — | |
Net unrealized appreciation (depreciation) of futures contracts | | | — | | | | — | | | | — | |
Net unrealized appreciation (depreciation) of written option contracts | | | — | | | | — | | | | — | |
Net unrealized appreciation (depreciation) of swap contracts | | | — | | | | — | | | | — | |
Net unrealized appreciation (depreciation) of foreign currency contracts | | | 538 | | | | — | | | | — | |
Net unrealized appreciation (depreciation) of translation of other assets and liabilities in foreign currencies | | | (2,245 | ) | | | (2,894 | ) | | | — | |
| | | | | | | | | | | | |
Net Changes in Unrealized Appreciation (Depreciation) of Investments, Other Financial Instruments and Foreign Currency Transactions | | | (53,904,920 | ) | | | (198,111,583 | ) | | | (11,517,750 | ) |
| | | | | | | | | | | | |
Net Gain (Loss) on Investments, Other Financial Instruments and Foreign Currency Transactions: | | | (4,592,086 | ) | | | (110,083,358 | ) | | | (6,182,434 | ) |
| | | | | | | | | | | | |
Net Increase (Decrease) in Net Assets Resulting from Operations | | $ | (2,724,145 | ) | | $ | (111,863,854 | ) | | $ | (4,670,960 | ) |
| | | | | | | | | | | | |
The accompanying notes are an integral part of these financial statements.
Statements of Operations – (continued)
For the Year Ended December 31, 2015
| | | | | | | | | | | | | | | | | | | | | | |
Hartford
SmallCap Growth
HLS Fund | | | Hartford
Stock HLS Fund | | | Hartford
Total Return Bond
HLS Fund | | | Hartford
Ultrashort Bond
HLS Fund | | | Hartford
U.S. Government
Securities
HLS Fund | | | Hartford
Value HLS Fund | |
| | | | | | | | | | | | | | | | | | | | | | |
| $ | 7,779,221 | | | $ | 38,996,616 | | | $ | 282,261 | | | $ | 82 | | | $ | 410 | | | $ | 13,510,964 | |
| | 7,052 | | | | 18,733 | | | | 102,243,750 | | | | 5,966,651 | | | | 10,900,924 | | | | 6,192 | |
| | (1,547 | ) | | | (392,494 | ) | | | (42,890 | ) | | | (144 | ) | | | — | | | | (84,326 | ) |
| | | | | | | | | | | | | | | | | | | | | | |
| | 7,784,726 | | | | 38,622,855 | | | | 102,483,121 | | | | 5,966,589 | | | | 10,901,334 | | | | 13,432,830 | |
| | | | | | | | | | | | | | | | | | | | | | |
| | | | | | | | | | | | | | | | | | | | | | |
| | 5,353,305 | | | | 7,769,540 | | | | 14,007,858 | | | | 3,132,109 | | | | 2,425,792 | | | | 4,263,777 | |
| | | | | | | | | | | | | | | | | | | | | | |
| | 6,249 | | | | 4,874 | | | | 5,349 | | | | 4,731 | | | | 4,313 | | | | 4,865 | |
| | 1,508 | | | | 561 | | | | 657 | | | | 763 | | | | 935 | | | | 905 | |
| | | | | | | | | | | | | | | | | | | | | | |
| | 423,108 | | | | 420,838 | | | | 826,299 | | | | 271,819 | | | | 240,375 | | | | 225,962 | |
| | 8,929 | | | | 9,907 | | | | 82,294 | | | | 4,930 | | | | 5,708 | | | | 4,347 | |
| | 28,705 | | | | 18,228 | | | | 19,384 | | | | 4,400 | | | | 1,188 | | | | 13,487 | |
| | 105,066 | | | | 162,934 | | | | 604,286 | | | | 78,303 | | | | 64,741 | | | | 57,611 | |
| | 23,984 | | | | 45,661 | | | | 85,653 | | | | 22,717 | | | | 15,863 | | | | 16,175 | |
| | 18,222 | | | | 22,453 | | | | 35,752 | | | | 31,185 | | | | 26,181 | | | | 19,118 | |
| | 129,515 | | | | 239,486 | | | | 493,565 | | | | 123,864 | | | | 117,116 | | | | 95,244 | |
| | | | | | | | | | | | | | | | | | | | | | |
| | 6,098,591 | | | | 8,694,482 | | | | 16,161,097 | | | | 3,674,821 | | | | 2,902,212 | | | | 4,701,491 | |
| | (14,440 | ) | | | (7,345 | ) | | | — | | | | — | | | | — | | | | (959 | ) |
| | | | | | | | | | | | | | | | | | | | | | |
| | (14,440 | ) | | | (7,345 | ) | | | — | | | | — | | | | — | | | | (959 | ) |
| | | | | | | | | | | | | | | | | | | | | | |
| | 6,084,151 | | | | 8,687,137 | | | | 16,161,097 | | | | 3,674,821 | | | | 2,902,212 | | | | 4,700,532 | |
| | | | | | | | | | | | | | | | | | | | | | |
| | 1,700,575 | | | | 29,935,718 | | | | 86,322,024 | | | | 2,291,768 | | | | 7,999,122 | | | | 8,732,298 | |
| | | | | | | | | | | | | | | | | | | | | | |
| | | | | | | | | | | | | | | | | | | | | | |
| | 45,902,185 | | | | 155,075,989 | | | | (3,632,830 | ) | | | 6,610 | | | | 7,154,012 | | | | 66,867,181 | |
| | — | | | | — | | | | (2,823 | ) | | | — | | | | — | | | | — | |
| | — | | | | — | | | | (2,281,900 | ) | | | — | | | | — | | | | — | |
| | 127,536 | | | | — | | | | 2,496,231 | | | | — | | | | (444,637 | ) | | | — | |
| | — | | | | — | | | | 3,205,667 | | | | — | | | | — | | | | — | |
| | — | | | | — | | | | (11,992,832 | ) | | | — | | | | — | | | | — | |
| | — | | | | — | | | | 8,101,539 | | | | — | | | | — | | | | — | |
| | — | | | | (80,699 | ) | | | (437,671 | ) | | | — | | | | — | | | | (7,972 | ) |
| | | | | | | | | | | | | | | | | | | | | | |
| | 46,029,721 | | | | 154,995,290 | | | | (4,544,619 | ) | | | 6,610 | | | | 6,709,375 | | | | 66,859,209 | |
| | | | | | | | | | | | | | | | | | | | | | |
| | | | | |
| | | | | | | | | | | | | | | | | | | | | | |
| | (76,627,391 | ) | | | (142,046,431 | ) | | | (97,923,220 | ) | | | (1,395,680 | ) | | | (5,900,425 | ) | | | (92,710,512 | ) |
| | — | | | | — | | | | 1,325,906 | | | | — | | | | — | | | | — | |
| | — | | | | — | | | | (461,264 | ) | | | — | | | | (385,760 | ) | | | — | |
| | — | | | | — | | | | (6,972 | ) | | | — | | | | — | | | | — | |
| | — | | | | — | | | | 1,398,639 | | | | — | | | | — | | | | — | |
| | — | | | | — | | | | (703,054 | ) | | | — | | | | — | | | | — | |
| | — | | | | (13,827 | ) | | | 36,468 | | | | — | | | | — | | | | (2,164 | ) |
| | | | | | | | | | | | | | | | | | | | | | |
| | | | | |
| | (76,627,391 | ) | | | (142,060,258 | ) | | | (96,333,497 | ) | | | (1,395,680 | ) | | | (6,286,185 | ) | | | (92,712,676 | ) |
| | | | | | | | | | | | | | | | | | | | | | |
| | (30,597,670 | ) | | | 12,935,032 | | | | (100,878,116 | ) | | | (1,389,070 | ) | | | 423,190 | | | | (25,853,467 | ) |
| | | | | | | | | | | | | | | | | | | | | | |
| $ | (28,897,095 | ) | | $ | 42,870,750 | | | $ | (14,556,092 | ) | | $ | 902,698 | | | $ | 8,422,312 | | | $ | (17,121,169 | ) |
| | | | | | | | | | | | | | | | | | | | | | |
The accompanying notes are an integral part of these financial statements.
Statements of Changes in Net Assets
| | | | | | | | |
| |
| | | Hartford Balanced HLS Fund | |
| | | For the
Year Ended
December 31,
2015
| | | For the
Year Ended
December 31,
2014
| |
Operations: | | | | | | | | |
Net investment income (loss) | | $ | 50,414,982 | | | $ | 51,655,887 | |
Net realized gain (loss) on investments, other financial instruments and foreign currency transactions | | | 218,419,541 | | | | 276,352,031 | |
Net changes in unrealized appreciation (depreciation) of investments, other financial instruments and foreign currency transactions | | | (261,214,650 | ) | | | (47,566,921 | ) |
| | | | | | | | |
Net Increase (Decrease) in Net Assets Resulting from Operations | | | 7,619,873 | | | | 280,440,997 | |
| | | | | | | | |
Distributions to Shareholders: | | | | | | | | |
From net investment income | | | | | | | | |
Class IA | | | (43,115,909 | ) | | | (45,323,982 | ) |
Class IB | | | (4,997,202 | ) | | | (5,428,017 | ) |
Class IC | | | — | | | | — | |
| | | | | | | | |
Total from net investment income | | | (48,113,111 | ) | | | (50,751,999 | ) |
| | | | | | | | |
From net realized gain on investments | | | | | | | | |
Class IA | | | — | | | | — | |
Class IB | | | — | | | | — | |
Class IC | | | — | | | | — | |
| | | | | | | | |
Total from net realized gain on investments | | | — | | | | — | |
| | | | | | | | |
Total distributions | | | (48,113,111 | ) | | | (50,751,999 | ) |
| | | | | | | | |
Capital Share Transactions: | | | | | | | | |
Sold | | | 16,708,307 | | | | 29,948,231 | |
Issued in merger | | | — | | | | — | |
Issued on reinvestment of distributions | | | 48,113,111 | | | | 50,751,999 | |
Redeemed | | | (436,469,018 | ) | | | (568,743,885 | ) |
| | | | | | | | |
Net increase (decrease) from capital share transactions | | | (371,647,600 | ) | | | (488,043,655 | ) |
| | | | | | | | |
Net Increase (Decrease) in Net Assets | | | (412,140,838 | ) | | | (258,354,657 | ) |
| | | | | | | | |
Net Assets: | | | | | | | | |
Beginning of period | | | 2,924,024,050 | | | | 3,182,378,707 | |
| | | | | | | | |
End of period | | $ | 2,511,883,212 | | | $ | 2,924,024,050 | |
| | | | | | | | |
Undistributed (distributions in excess of) net investment income | | $ | 28,777,300 | | | $ | 12,146,180 | |
| | | | | | | | |
The accompanying notes are an integral part of these financial statements.
Statements of Changes in Net Assets – (continued)
| | | | | | | | | | | | | | | | | | | | | | | | | | | | | | |
| Hartford Capital Appreciation HLS Fund | | | Hartford Disciplined Equity HLS Fund | | | Hartford Dividend and Growth HLS Fund | | | Hartford Global Growth HLS Fund | |
For the
Year Ended
December 31,
2015
| | | For the
Year Ended
December 31,
2014
| | | For the
Year Ended
December 31,
2015
| | | For the
Year Ended
December 31,
2014
| | | For the
Year Ended
December 31,
2015
| | | For the
Year Ended
December 31,
2014
| | | For the
Year Ended
December 31,
2015
| | | For the
Year Ended
December 31,
2014
| |
| | | | | | | | | | | | | | | | | | | | | | | | | | | | | | |
| $ | 55,803,044 | | | $ | 70,854,450 | | | $ | 5,732,568 | | | $ | 5,988,213 | | | $ | 67,717,712 | | | $ | 73,253,569 | | | $ | 2,810,204 | | | $ | 2,376,685 | |
| | 499,190,946 | | | | 1,321,954,289 | | | | 86,358,959 | | | | 247,155,443 | | | | 382,559,504 | | | | 526,074,623 | | | | 46,843,135 | | | | 81,799,082 | |
| | (466,258,274 | ) | | | (862,281,313 | ) | | | (39,562,393 | ) | | | (125,763,344 | ) | | | (492,429,493 | ) | | | (90,165,449 | ) | | | (12,495,589 | ) | | | (55,459,197 | ) |
| | | | | | | | | | | | | | | | | | | | | | | | | | | | | | |
| | 88,735,716 | | | | 530,527,426 | | | | 52,529,134 | | | | 127,380,312 | | | | (42,152,277 | ) | | | 509,162,743 | | | | 37,157,750 | | | | 28,716,570 | |
| | | | | | | | | | | | | | | | | | | | | | | | | | | | | | |
| | | | | | | | | | | | | | | | | | | | | | | | | | | | | | |
| | | | | | | | | | | | | | | | | | | | | | | | | | | | | | |
| | (52,995,203 | ) | | | (58,028,812 | ) | | | (5,191,407 | ) | | | (4,941,220 | ) | | | (56,949,781 | ) | | | (64,043,916 | ) | | | (2,064,712 | ) | | | (1,805,993 | ) |
| | (4,290,700 | ) | | | (4,922,730 | ) | | | (493,379 | ) | | | (458,078 | ) | | | (7,355,049 | ) | | | (8,635,172 | ) | | | (265,636 | ) | | | (242,510 | ) |
| | (91,794 | ) | | | (22,513 | ) | | | — | | | | — | | | | — | | | | — | | | | — | | | | — | |
| | | | | | | | | | | | | | | | | | | | | | | | | | | | | | |
| | (57,377,697 | ) | | | (62,974,055 | ) | | | (5,684,786 | ) | | | (5,399,298 | ) | | | (64,304,830 | ) | | | (72,679,088 | ) | | | (2,330,348 | ) | | | (2,048,503 | ) |
| | | | | | | | | | | | | | | | | | | | | | | | | | | | | | |
| | | | | | | | | | | | | | | | | | | | | | | | | | | | | | |
| | (1,143,708,705 | ) | | | (939,864,465 | ) | | | (208,795,133 | ) | | | (6,976,085 | ) | | | (446,508,332 | ) | | | (428,416,451 | ) | | | (17,807,958 | ) | | | — | |
| | (133,658,050 | ) | | | (115,099,182 | ) | | | (29,781,590 | ) | | | (1,024,081 | ) | | | (67,944,325 | ) | | | (71,756,795 | ) | | | (4,152,455 | ) | | | — | |
| | (2,343,239 | ) | | | (94,687 | ) | | | — | | | | — | | | | — | | | | — | | | | — | | | | — | |
| | | | | | | | | | | | | | | | | | | | | | | | | | | | | | |
| | (1,279,709,994 | ) | | | (1,055,058,334 | ) | | | (238,576,723 | ) | | | (8,000,166 | ) | | | (514,452,657 | ) | | | (500,173,246 | ) | | | (21,960,413 | ) | | | — | |
| | | | | | | | | | | | | | | | | | | | | | | | | | | | | | |
| | (1,337,087,691 | ) | | | (1,118,032,389 | ) | | | (244,261,509 | ) | | | (13,399,464 | ) | | | (578,757,487 | ) | | | (572,852,334 | ) | | | (24,290,761 | ) | | | (2,048,503 | ) |
| | | | | | | | | | | | | | | | | | | | | | | | | | | | | | |
| | | | | | | | | | | | | | | | | | | | | | | | | | | | | | |
| | 188,886,238 | | | | 415,488,651 | | | | 13,385,373 | | | | 11,590,066 | | | | 66,003,700 | | | | 88,827,777 | | | | 30,124,439 | | | | 16,640,070 | |
| | — | | | | — | | | | — | | | | — | | | | — | | | | — | | | | — | | | | 84,599,762 | |
| | 1,337,087,691 | | | | 1,118,032,389 | | | | 244,261,509 | | | | 13,399,464 | | | | 578,757,487 | | | | 572,852,334 | | | | 24,290,761 | | | | 2,048,503 | |
| | (1,157,183,786 | ) | | | (1,706,234,966 | ) | | | (167,010,558 | ) | | | (226,981,043 | ) | | | (630,845,783 | ) | | | (931,427,860 | ) | | | (69,742,484 | ) | | | (88,344,788 | ) |
| | | | | | | | | | | | | | | | | | | | | | | | | | | | | | |
| | 368,790,143 | | | | (172,713,926 | ) | | | 90,636,324 | | | | (201,991,513 | ) | | | 13,915,404 | | | | (269,747,749 | ) | | | (15,327,284 | ) | | | 14,943,547 | |
| | | | | | | | | | | | | | | | | | | | | | | | | | | | | | |
| | (879,561,832 | ) | | | (760,218,889 | ) | | | (101,096,051 | ) | | | (88,010,665 | ) | | | (606,994,360 | ) | | | (333,437,340 | ) | | | (2,460,295 | ) | | | 41,611,614 | |
| | | | | | | | | | | | | | | | | | | | | | | | | | | | | | |
| | | | | | | | | | | | | | | | | | | | | | | | | | | | | | |
| | 7,238,592,939 | | | | 7,998,811,828 | | | | 841,686,734 | | | | 929,697,399 | | | | 4,048,498,069 | | | | 4,381,935,409 | | | | 481,521,088 | | | | 439,909,474 | |
| | | | | | | | | | | | | | | | | | | | | | | | | | | | | | |
| $ | 6,359,031,107 | | | $ | 7,238,592,939 | | | $ | 740,590,683 | | | $ | 841,686,734 | | | $ | 3,441,503,709 | | | $ | 4,048,498,069 | | | $ | 479,060,793 | | | $ | 481,521,088 | |
| | | | | | | | | | | | | | | | | | | | | | | | | | | | | | |
| $ | 5,652,191 | | | $ | 11,138,263 | | | $ | 979,743 | | | $ | 984,798 | | | $ | 5,287,312 | | | $ | 3,104,685 | | | $ | 2,754,031 | | | $ | 2,330,460 | |
| | | | | | | | | | | | | | | | | | | | | | | | | | | | | | |
The accompanying notes are an integral part of these financial statements.
Statements of Changes in Net Assets – (continued)
| | | | | | | | |
| | | Hartford Growth Opportunities HLS
Fund | |
| | | For the
Year Ended
December 31,
2015
| | | For the
Year Ended
December 31,
2014
| |
Operations: | | | | | | | | |
Net investment income (loss) | | $ | 235,777 | | | $ | 1,663,894 | |
Net realized gain (loss) on investments, other financial instruments and foreign currency transactions | | | 195,529,079 | | | | 279,584,109 | |
Net changes in unrealized appreciation (depreciation) of investments, other financial instruments and foreign currency transactions | | | (41,501,855 | ) | | | (112,843,943 | ) |
| | | | | | | | |
Net Increase (Decrease) in Net Assets Resulting from Operations | | | 154,263,001 | | | | 168,404,060 | |
| | | | | | | | |
Distributions to Shareholders: | | | | | | | | |
From net investment income | | | | | | | | |
Class IA | | | (1,563,969 | ) | | | (2,042,095 | ) |
Class IB | | | — | | | | (17,409 | ) |
Class IC | | | — | | | | (483 | ) |
| | | | | | | | |
Total from net investment income | | | (1,563,969 | ) | | | (2,059,987 | ) |
| | | | | | | | |
From net realized gain on investments | | | | | | | | |
Class IA | | | (246,075,850 | ) | | | (192,350,961 | ) |
Class IB | | | (33,542,514 | ) | | | (27,496,799 | ) |
Class IC | | | (2,276,630 | ) | | | (45,561 | ) |
| | | | | | | | |
Total from net realized gain on investments | | | (281,894,994 | ) | | | (219,893,321 | ) |
| | | | | | | | |
Total distributions | | | (283,458,963 | ) | | | (221,953,308 | ) |
| | | | | | | | |
Capital Share Transactions: | | | | | | | | |
Sold | | | 73,681,828 | | | | 31,350,218 | |
Issued in merger | | | — | | | | 222,041,000 | |
Issued on reinvestment of distributions | | | 283,458,963 | | | | 221,953,308 | |
Redeemed | | | (217,081,410 | ) | | | (265,282,613 | ) |
| | | | | | | | |
Net increase (decrease) from capital share transactions | | | 140,059,381 | | | | 210,061,913 | |
| | | | | | | | |
Net Increase (Decrease) in Net Assets | | | 10,863,419 | | | | 156,512,665 | |
| | | | | | | | |
Net Assets: | | | | | | | | |
Beginning of period | | | 1,365,123,379 | | | | 1,208,610,714 | |
| | | | | | | | |
End of period | | $ | 1,375,986,798 | | | $ | 1,365,123,379 | |
| | | | | | | | |
Undistributed (distributions in excess of) net investment income | | $ | 5,172,640 | | | $ | 1,563,941 | |
| | | | | | | | |
The accompanying notes are an integral part of these financial statements.
Statements of Changes in Net Assets – (continued)
| | | | | | | | | | | | | | | | | | | | | | | | | | | | | | |
| Hartford Healthcare HLS Fund | | | Hartford High Yield HLS Fund | | | Hartford International Opportunities
HLS Fund | | | Hartford MidCap HLS Fund | |
For the
Year Ended
December 31,
2015
| | | For the
Year Ended
December 31,
2014
| | | For the
Year Ended
December 31,
2015
| | | For the
Year Ended
December 31,
2014
| | | For the
Year Ended
December 31,
2015
| | | For the
Year Ended
December 31,
2014
| | | For the
Year Ended
December 31,
2015
| | | For the
Year Ended
December 31,
2014
| |
| | | | | | | | | | | | | | | | | | | | | | | | | | | | | | |
| $ | (189,398 | ) | | $ | (61,309 | ) | | $ | 21,098,919 | | | $ | 25,325,337 | | | $ | 20,581,447 | | | $ | 19,445,004 | | | $ | 1,151,367 | | | $ | 1,517,535 | |
| | 69,042,842 | | | | 49,979,363 | | | | (12,670,641 | ) | | | 9,413,824 | | | | 44,603,449 | | | | 137,265,055 | | | | 179,588,938 | | | | 225,619,133 | |
| | (21,660,295 | ) | | | 27,743,069 | | | | (22,857,170 | ) | | | (21,035,054 | ) | | | (34,352,453 | ) | | | (218,169,124 | ) | | | (152,431,577 | ) | | | (47,543,903 | ) |
| | | | | | | | | | | | | | | | | | | | | | | | | | | | | | |
| | 47,193,149 | | | | 77,661,123 | | | | (14,428,892 | ) | | | 13,704,107 | | | | 30,832,443 | | | | (61,459,065 | ) | | | 28,308,728 | | | | 179,592,765 | |
| | | | | | | | | | | | | | | | | | | | | | | | | | | | | | |
| | | | | | | | | | | | | | | | | | | | | | | | | | | | | | |
| | | | | | | | | | | | | | | | | | | | | | | | | | | | | | |
| | — | | | | (678,876 | ) | | | (18,980,813 | ) | | | (26,651,985 | ) | | | (17,879,578 | ) | | | (28,436,476 | ) | | | (1,399,724 | ) | | | (1,569,593 | ) |
| | — | | | | (23,622 | ) | | | (5,933,685 | ) | | | (8,502,614 | ) | | | (2,176,492 | ) | | | (4,045,018 | ) | | | (90,171 | ) | | | — | |
| | — | | | | — | | | | — | | | | — | | | | — | | | | — | | | | — | | | | — | |
| | | | | | | | | | | | | | | | | | | | | | | | | | | | | | |
| | — | | | | (702,498 | ) | | | (24,914,498 | ) | | | (35,154,599 | ) | | | (20,056,070 | ) | | | (32,481,494 | ) | | | (1,489,895 | ) | | | (1,569,593 | ) |
| | | | | | | | | | | | | | | | | | | | | | | | | | | | | | |
| | | | | | | | | | | | | | | | | | | | | | | | | | | | | | |
| | (41,644,271 | ) | | | (21,244,591 | ) | | | — | | | | — | | | | — | | | | — | | | | (197,172,246 | ) | | | (190,670,431 | ) |
| | (7,763,435 | ) | | | (4,809,571 | ) | | | — | | | | — | | | | — | | | | — | | | | (12,701,934 | ) | | | (10,000,370 | ) |
| | — | | | | — | | | | — | | | | — | | | | — | | | | — | | | | — | | | | — | |
| | | | | | | | | | | | | | | | | | | | | | | | | | | | | | |
| | (49,407,706 | ) | | | (26,054,162 | ) | | | — | | | | — | | | | — | | | | — | | | | (209,874,180 | ) | | | (200,670,801 | ) |
| | | | | | | | | | | | | | | | | | | | | | | | | | | | | | |
| | (49,407,706 | ) | | | (26,756,660 | ) | | | (24,914,498 | ) | | | (35,154,599 | ) | | | (20,056,070 | ) | | | (32,481,494 | ) | | | (211,364,075 | ) | | | (202,240,394 | ) |
| | | | | | | | | | | | | | | | | | | | | | | | | | | | | | |
| | | | | | | | | | | | | | | | | | | | | | | | | | | | | | |
| | 117,587,462 | | | | 94,759,735 | | | | 26,601,652 | | | | 31,892,841 | | | | 79,856,988 | | | | 200,998,632 | | | | 287,047,471 | | | | 350,150,072 | |
| | — | | | | — | | | | — | | | | — | | | | — | | | | — | | | | — | | | | — | |
| | 49,407,706 | | | | 26,756,660 | | | | 24,914,498 | | | | 35,154,599 | | | | 20,056,070 | | | | 32,481,494 | | | | 211,364,075 | | | | 202,240,394 | |
| | (103,345,971 | ) | | | (111,334,189 | ) | | | (111,075,638 | ) | | | (133,409,107 | ) | | | (221,900,580 | ) | | | (380,006,851 | ) | | | (316,201,121 | ) | | | (342,895,605 | ) |
| | | | | | | | | | | | | | | | | | | | | | | | | | | | | | |
| | 63,649,197 | | | | 10,182,206 | | | | (59,559,488 | ) | | | (66,361,667 | ) | | | (121,987,522 | ) | | | (146,526,725 | ) | | | 182,210,425 | | | | 209,494,861 | |
| | | | | | | | | | | | | | | | | | | | | | | | | | | | | | |
| | 61,434,640 | | | | 61,086,669 | | | | (98,902,878 | ) | | | (87,812,159 | ) | | | (111,211,149 | ) | | | (240,467,284 | ) | | | (844,922 | ) | | | 186,847,232 | |
| | | | | | | | | | | | | | | | | | | | | | | | | | | | | | |
| | | | | | | | | | | | | | | | | | | | | | | | | | | | | | |
| | 361,992,633 | | | | 300,905,964 | | | | 427,228,988 | | | | 515,041,147 | | | | 1,428,999,087 | | | | 1,669,466,371 | | | | 1,752,955,173 | | | | 1,566,107,941 | |
| | | | | | | | | | | | | | | | | | | | | | | | | | | | | | |
| $ | 423,427,273 | | | $ | 361,992,633 | | | $ | 328,326,110 | | | $ | 427,228,988 | | | $ | 1,317,787,938 | | | $ | 1,428,999,087 | | | $ | 1,752,110,251 | | | $ | 1,752,955,173 | |
| | | | | | | | | | | | | | | | | | | | | | | | | | | | | | |
| $ | 11,704,604 | | | $ | (453,384 | ) | | $ | 20,098,553 | | | $ | 24,717,833 | | | $ | 19,001,664 | | | $ | 16,429,199 | | | $ | 777,579 | | | $ | 1,489,848 | |
| | | | | | | | | | | | | | | | | | | | | | | | | | | | | | |
The accompanying notes are an integral part of these financial statements.
Statements of Changes in Net Assets – (continued)
| | | | | | | | |
| | | Hartford MidCap Value
HLS Fund | |
| | | For the
Year Ended
December 31,
2015
| | | For the
Year Ended
December 31,
2014
| |
Operations: | | | | | | | | |
Net investment income (loss) | | $ | 1,867,941 | | | $ | 2,586,015 | |
Net realized gain (loss) on investments, other financial instruments and foreign currency transactions | | | 49,312,834 | | | | 59,484,905 | |
Net changes in unrealized appreciation (depreciation) of investments and foreign currency transactions | | | (53,904,920 | ) | | | (24,577,736 | ) |
| | | | | | | | |
Net Increase (Decrease) in Net Assets Resulting from Operations | | | (2,724,145 | ) | | | 37,493,184 | |
| | | | | | | | |
Distributions to Shareholders: | | | | | | | | |
From net investment income | | | | | | | | |
Class IA | | | (1,833,760 | ) | | | (2,401,785 | ) |
Class IB | | | (310,161 | ) | | | (480,216 | ) |
| | | | | | | | |
Total from net investment income | | | (2,143,921 | ) | | | (2,882,001 | ) |
| | | | | | | | |
From net realized gain on investments | | | | | | | | |
Class IA | | | (44,253,137 | ) | | | (45,536,344 | ) |
Class IB | | | (14,602,875 | ) | | | (14,755,531 | ) |
| | | | | | | | |
Total from net realized gain on investments | | | (58,856,012 | ) | | | (60,291,875 | ) |
| | | | | | | | |
Total distributions | | | (60,999,933 | ) | | | (63,173,876 | ) |
| | | | | | | | |
Capital Share Transactions: | | | | | | | | |
Sold | | | 8,423,245 | | | | 14,676,497 | |
Issued on reinvestment of distributions | | | 60,999,933 | | | | 63,173,876 | |
Redeemed | | | (78,708,045 | ) | | | (97,421,767 | ) |
| | | | | | | | |
Net increase (decrease) from capital share transactions | | | (9,284,867 | ) | | | (19,571,394 | ) |
| | | | | | | | |
Net Increase (Decrease) in Net Assets | | | (73,008,945 | ) | | | (45,252,086 | ) |
| | | | | | | | |
Net Assets: | | | | | | | | |
Beginning of period | | | 455,903,055 | | | | 501,155,141 | |
| | | | | | | | |
End of period | | $ | 382,894,110 | | | $ | 455,903,055 | |
| | | | | | | | |
Undistributed (distributions in excess of) net investment income | | $ | 890,780 | | | $ | 1,158,145 | |
| | | | | | | | |
The accompanying notes are an integral part of these financial statements.
Statements of Changes in Net Assets – (continued)
| | | | | | | | | | | | | | | | | | | | | | | | | | | | | | |
| Hartford Small Company HLS Fund | | | Hartford Small/Mid Cap Equity HLS
Fund | | | Hartford SmallCap Growth HLS Fund | | | Hartford Stock HLS Fund | |
For the
Year Ended
December 31,
2015
| | | For the
Year Ended
December 31,
2014
| | | For the
Year Ended
December 31,
2015
| | | For the
Year Ended
December 31,
2014
| | | For the
Year Ended
December 31,
2015
| | | For the
Year Ended
December 31,
2014
| | | For the
Year Ended
December 31,
2015
| | | For the
Year Ended
December 31,
2014
| |
| | | | | | | | | | | | | | | | | | | | | | | | | | | | | | |
| $ | (1,780,496 | ) | | $ | (5,434,363 | ) | | $ | 1,511,474 | | | $ | 1,491,873 | | | $ | 1,700,575 | | | $ | 892,478 | | | $ | 29,935,718 | | | $ | 31,165,049 | |
| | 88,028,225 | | | | 260,712,949 | | | | 5,335,316 | | | | 17,795,825 | | | | 46,029,721 | | | | 98,705,848 | | | | 154,995,290 | | | | 145,989,283 | |
| | (198,111,583 | ) | | | (161,616,916 | ) | | | (11,517,750 | ) | | | (13,114,377 | ) | | | (76,627,391 | ) | | | (60,032,088 | ) | | | (142,060,258 | ) | | | 8,836,263 | |
| | | | | | | | | | | | | | | | | | | | | | | | | | | | | | |
| | (111,863,854 | ) | | | 93,661,670 | | | | (4,670,960 | ) | | | 6,173,321 | | | | (28,897,095 | ) | | | 39,566,238 | | | | 42,870,750 | | | | 185,990,595 | |
| | | | | | | | | | | | | | | | | | | | | | | | | | | | | | |
| | | | | | | | | | | | | | | | | | | | | | | | | | | | | | |
| | | | | | | | | | | | | | | | | | | | | | | | | | | | | | |
| | — | | | | — | | | | (1,119,387 | ) | | | (1,610,847 | ) | | | (562,638 | ) | | | (370,992 | ) | | | (25,254,549 | ) | | | — | |
| | — | | | | — | | | | (189,421 | ) | | | (274,653 | ) | | | — | | | | — | | | | (2,429,965 | ) | | | — | |
| | | | | | | | | | | | | | | | | | | | | | | | | | | | | | |
| | — | | | | — | | | | (1,308,808 | ) | | | (1,885,500 | ) | | | (562,638 | ) | | | (370,992 | ) | | | (27,684,514 | ) | | | — | |
| | | | | | | | | | | | | | | | | | | | | | | | | | | | | | |
| | | | | | | | | | | | | | | | | | | | | | | | | | | | | | |
| | (235,415,969 | ) | | | (226,746,631 | ) | | | (14,586,015 | ) | | | (19,560,822 | ) | | | (74,730,595 | ) | | | (104,367,708 | ) | | | — | | | | (28,166,569 | ) |
| | (22,082,672 | ) | | | (23,620,519 | ) | | | (3,233,544 | ) | | | (4,152,245 | ) | | | (23,707,028 | ) | | | (22,471,437 | ) | | | — | | | | (2,831,617 | ) |
| | | | | | | | | | | | | | | | | | | | | | | | | | | | | | |
| | (257,498,641 | ) | | | (250,367,150 | ) | | | (17,819,559 | ) | | | (23,713,067 | ) | | | (98,437,623 | ) | | | (126,839,145 | ) | | | — | | | | (30,998,186 | ) |
| | | | | | | | | | | | | | | | | | | | | | | | | | | | | | |
| | (257,498,641 | ) | | | (250,367,150 | ) | | | (19,128,367 | ) | | | (25,598,567 | ) | | | (99,000,261 | ) | | | (127,210,137 | ) | | | (27,684,514 | ) | | | (30,998,186 | ) |
| | | | | | | | | | | | | | | | | | | | | | | | | | | | | | |
| | | | | | | | | | | | | | | | | | | | | | | | | | | | | | |
| | 166,334,124 | | | | 190,640,175 | | | | 4,931,280 | | | | 8,923,364 | | | | 681,534,004 | | | | 259,035,106 | | | | 9,402,151 | | | | 24,354,691 | |
| | 257,498,641 | | | | 250,367,150 | | | | 19,128,367 | | | | 25,598,567 | | | | 99,000,261 | | | | 127,210,137 | | | | 27,684,514 | | | | 30,998,186 | |
| | (241,524,090 | ) | | | (377,580,543 | ) | | | (25,688,609 | ) | | | (37,546,080 | ) | | | (201,704,918 | ) | | | (216,309,600 | ) | | | (243,328,995 | ) | | | (347,171,203 | ) |
| | | | | | | | | | | | | | | | | | | | | | | | | | | | | | |
| | 182,308,675 | | | | 63,426,782 | | | | (1,628,962 | ) | | | (3,024,149 | ) | | | 578,829,347 | | | | 169,935,643 | | | | (206,242,330 | ) | | | (291,818,326 | ) |
| | | | | | | | | | | | | | | | | | | | | | | | | | | | | | |
| | (187,053,820 | ) | | | (93,278,698 | ) | | | (25,428,289 | ) | | | (22,449,395 | ) | | | 450,931,991 | | | | 82,291,744 | | | | (191,056,094 | ) | | | (136,825,917 | ) |
| | | | | | | | | | | | | | | | | | | | | | | | | | | | | | |
| | | | | | | | | | | | | | | | | | | | | | | | | | | | | | |
| | 1,403,332,146 | | | | 1,496,610,844 | | | | 121,308,179 | | | | 143,757,574 | | | | 672,430,431 | | | | 590,138,687 | | | | 1,734,889,017 | | | | 1,871,714,934 | |
| | | | | | | | | | | | | | | | | | | | | | | | | | | | | | |
| $ | 1,216,278,326 | | | $ | 1,403,332,146 | | | $ | 95,879,890 | | | $ | 121,308,179 | | | $ | 1,123,362,422 | | | $ | 672,430,431 | | | $ | 1,543,832,923 | | | $ | 1,734,889,017 | |
| | | | | | | | | | | | | | | | | | | | | | | | | | | | | | |
| $ | — | | | $ | — | | | $ | 1,254,573 | | | $ | 1,496,963 | | | $ | 1,318,657 | | | $ | 756,011 | | | $ | 2,566,050 | | | $ | 1,119,394 | |
| | | | | | | | | | | | | | | | | | | | | | | | | | | | | | |
The accompanying notes are an integral part of these financial statements.
Statements of Changes in Net Assets – (continued)
| | | | | | | | |
| | | Hartford Total Return Bond
HLS Fund | |
| | | For the
Year Ended
December 31,
2015
| | | For the
Year Ended
December 31,
2014
| |
Operations: | | | | | | | | |
Net investment income (loss) | | $ | 86,322,024 | | | $ | 98,771,667 | |
Net realized gain (loss) on investments, other financial instruments and foreign currency transactions | | | (4,544,619 | ) | | | 98,015,103 | |
Net changes in unrealized appreciation (depreciation) of investments, other financial instruments and foreign currency transactions | | | (96,333,497 | ) | | | 6,484,653 | |
| | | | | | | | |
Net Increase (Decrease) in Net Assets Resulting from Operations | | | (14,556,092 | ) | | | 203,271,423 | |
| | | | | | | | |
Distributions to Shareholders: | | | | | | | | |
From net investment income | | | | | | | | |
Class IA | | | (81,109,076 | ) | | | (97,443,902 | ) |
Class IB | | | (8,982,691 | ) | | | (11,323,208 | ) |
| | | | | | | | |
Total from net investment income | | | (90,091,767 | ) | | | (108,767,110 | ) |
| | | | | | | | |
From net realized gain on investments | | | | | | | | |
Class IA | | | (63,383,205 | ) | | | — | |
Class IB | | | (7,785,123 | ) | | | — | |
| | | | | | | | |
Total from net realized gain on investments | | | (71,168,328 | ) | | | — | |
| | | | | | | | |
Total distributions | | | (161,260,095 | ) | | | (108,767,110 | ) |
| | | | | | | | |
Capital Share Transactions: | | | | | | | | |
Sold | | | 124,109,254 | | | | 173,198,435 | |
Issued on reinvestment of distributions | | | 161,260,095 | | | | 108,767,110 | |
Redeemed | | | (605,905,708 | ) | | | (842,363,284 | ) |
| | | | | | | | |
Net decrease from capital share transactions | | | (320,536,359 | ) | | | (560,397,739 | ) |
| | | | | | | | |
Net Increase (Decrease) in Net Assets | | | (496,352,546 | ) | | | (465,893,426 | ) |
| | | | | | | | |
Net Assets: | | | | | | | | |
Beginning of period | | | 3,239,638,823 | | | | 3,705,532,249 | |
| | | | | | | | |
End of period | | $ | 2,743,286,277 | | | $ | 3,239,638,823 | |
| | | | | | | | |
Undistributed (distributions in excess of) net investment income | | $ | 66,990,645 | | | $ | 91,320,978 | |
| | | | | | | | |
The accompanying notes are an integral part of these financial statements.
Statements of Changes in Net Assets – (continued)
| | | | | | | | | | | | | | | | | | | | | | |
| Hartford Ultrashort Bond HLS Fund | | | Hartford U.S. Government Securities HLS
Fund | | | Hartford Value HLS Fund | |
For the
Year Ended
December 31,
2015
| | | For the
Year Ended
December 31,
2014
| | | For the
Year Ended
December 31,
2015
| | | For the
Year Ended
December 31,
2014
| | | For the
Year Ended
December 31,
2015
| | | For the
Year Ended
December 31,
2014
| |
| | | | | | | | | | | | | | | | | | | | | | |
| $ | 2,291,768 | | | $ | 1,949,747 | | | $ | 7,999,122 | | | $ | 8,655,207 | | | $ | 8,732,298 | | | $ | 9,355,873 | |
| | 6,610 | | | | 209,094 | | | | 6,709,375 | | | | 2,774,638 | | | | 66,859,209 | | | | 67,490,131 | |
| | (1,395,680 | ) | | | (467,328 | ) | | | (6,286,185 | ) | | | 6,685,288 | | | | (92,712,676 | ) | | | (9,274,603 | ) |
| | | | | | | | | | | | | | | | | | | | | | |
| | 902,698 | | | | 1,691,513 | | | | 8,422,312 | | | | 18,115,133 | | | | (17,121,169 | ) | | | 67,571,401 | |
| | | | | | | | | | | | | | | | | | | | | | |
| | | | | | | | | | | | | | | | | | | | | | |
| | | | | | | | | | | | | | | | | | | | | | |
| | (2,080,640 | ) | | | — | | | | (7,889,540 | ) | | | (11,648,041 | ) | | | (7,270,798 | ) | | | (7,727,803 | ) |
| | — | | | | — | | | | (1,434,327 | ) | | | (2,201,980 | ) | | | (1,103,600 | ) | | | (1,210,174 | ) |
| | | | | | | | | | | | | | | | | | | | | | |
| | (2,080,640 | ) | | | — | | | | (9,323,867 | ) | | | (13,850,021 | ) | | | (8,374,398 | ) | | | (8,937,977 | ) |
| | | | | | | | | | | | | | | | | | | | | | |
| | | | | | | | | | | | | | | | | | | | | | |
| | (63,898 | ) | | | — | | | | — | | | | — | | | | (15,308,517 | ) | | | — | |
| | (10,342 | ) | | | — | | | | — | | | | — | | | | (2,826,296 | ) | | | — | |
| | | | | | | | | | | | | | | | | | | | | | |
| | (74,240 | ) | | | — | | | | — | | | | — | | | | (18,134,813 | ) | | | — | |
| | | | | | | | | | | | | | | | | | | | | | |
| | (2,154,880 | ) | | | — | | | | (9,323,867 | ) | | | (13,850,021 | ) | | | (26,509,211 | ) | | | (8,937,977 | ) |
| | | | | | | | | | | | | | | | | | | | | | |
| | | | | | | | | | | | | | | | | | | | | | |
| | 56,291,513 | | | | 57,930,562 | | | | 42,133,789 | | | | 35,891,840 | | | | 42,392,764 | | | | 35,888,662 | |
| | 2,154,880 | | | | — | | | | 9,323,867 | | | | 13,850,021 | | | | 26,509,211 | | | | 8,937,977 | |
| | (215,901,855 | ) | | | (369,023,528 | ) | | | (119,610,042 | ) | | | (162,881,468 | ) | | | (111,574,821 | ) | | | (141,823,013 | ) |
| | | | | | | | | | | | | | | | | | | | | | |
| | (157,455,462 | ) | | | (311,092,966 | ) | | | (68,152,386 | ) | | | (113,139,607 | ) | | | (42,672,846 | ) | | | (96,996,374 | ) |
| | | | | | | | | | | | | | | | | | | | | | |
| | (158,707,644 | ) | | | (309,401,453 | ) | | | (69,053,941 | ) | | | (108,874,495 | ) | | | (86,303,226 | ) | | | (38,362,950 | ) |
| | | | | | | | | | | | | | | | | | | | | | |
| | | | | | | | | | | | | | | | | | | | | | |
| | 866,765,234 | | | | 1,176,166,687 | | | | 571,201,752 | | | | 680,076,247 | | | | 622,068,325 | | | | 660,431,275 | |
| | | | | | | | | | | | | | | | | | | | | | |
| $ | 708,057,590 | | | $ | 866,765,234 | | | $ | 502,147,811 | | | $ | 571,201,752 | | | $ | 535,765,099 | | | $ | 622,068,325 | |
| | | | | | | | | | | | | | | | | | | | | | |
| $ | 2,672,136 | | | $ | 2,080,601 | | | $ | 9,029,448 | | | $ | 9,323,809 | | | $ | 781,816 | | | $ | 855,425 | |
| | | | | | | | | | | | | | | | | | | | | | |
The accompanying notes are an integral part of these financial statements.
Financial Highlights
| | | | | | | | | | | | | | | | | | | | | | | | | | | | | | | | | | | | | | | | | | | | | | | | | | | | | | | | |
| | | — Selected Per-Share Data(1) — | | | — Ratios and Supplemental Data — | |
Class | | Net Asset
Value at
Beginning
of Period | | | Net
Investment
Income
(Loss) | | | Net
Realized
and
Unrealized
Gain (Loss)
on
Investments | | | Total from
Investment
Operations | | | Dividends
from Net
Investment
Income | | | Distributions
from
Realized
Gains | | | Total
Dividends
and
Distributions | | | Net
Asset
Value at
End of
Period | | | Total
Return(2) | | | Net
Assets at
End of
Period
(000s) | | | Ratio of
Expenses
to
Average
Net
Assets
Before
Adjust-
ments(3) | | | Ratio of
Expenses
to
Average
Net
Assets
After
Adjust-
ments(3) | | | Ratio of
Net
Investment
Income
(Loss) to
Average
Net Assets | | | Portfolio
Turnover | |
| Hartford Balanced HLS Fund | | | | | | | | | | | | | | | | | | | | | | | | | | | | | | | | | | | | | |
For the Year Ended December 31, 2015 | | | | | | | | | | | | | | | | | | | | | | | | | | | | | | | | | | | | | |
IA | | $ | 27.09 | | | $ | 0.51 | | | $ | (0.46 | ) | | $ | 0.05 | | | $ | (0.52 | ) | | $ | — | | | $ | (0.52 | ) | | $ | 26.62 | | | | 0.18 | % | | $ | 2,210,938 | | | | 0.65 | % | | | 0.63 | % | | | 1.87 | % | | | 18 | % |
IB | | | 27.45 | | | | 0.45 | | | | (0.47 | ) | | | (0.02 | ) | | | (0.44 | ) | | | — | | | | (0.44 | ) | | | 26.99 | | | | (0.07 | ) | | | 300,945 | | | | 0.90 | | | | 0.88 | | | | 1.62 | | | | 18 | |
| | | | | | | | | |
For the Year Ended December 31, 2014 | | | | | | | | | | | | | | | | | | | | | | | | | | | | | | | | | | | | | |
IA | | $ | 25.11 | | | $ | 0.45 | | | $ | 2.01 | | | $ | 2.46 | | | $ | (0.48 | ) | | $ | — | | | $ | (0.48 | ) | | $ | 27.09 | | | | 9.79 | % | | $ | 2,561,814 | | | | 0.65 | % | | | 0.65 | % | | | 1.73 | % | | | 29 | % |
IB | | | 25.44 | | | | 0.39 | | | | 2.03 | | | | 2.42 | | | | (0.41 | ) | | | — | | | | (0.41 | ) | | | 27.45 | | | | 9.51 | | | | 362,210 | | | | 0.90 | | | | 0.90 | | | | 1.49 | | | | 29 | |
| | | | | | | | | |
For the Year Ended December 31, 2013 | | | | | | | | | | | | | | | | | | | | | | | | | | | | | | | | | | | | | |
IA | | $ | 21.03 | | | $ | 0.41 | | | $ | 4.04 | | | $ | 4.45 | | | $ | (0.37 | ) | | $ | — | | | $ | (0.37 | ) | | $ | 25.11 | | | | 21.19 | % | | $ | 2,782,698 | | | | 0.65 | % | | | 0.65 | % | | | 1.75 | % | | | 31 | % |
IB | | | 21.30 | | | | 0.35 | | | | 4.10 | | | | 4.45 | | | | (0.31 | ) | | | — | | | | (0.31 | ) | | | 25.44 | | | | 20.88 | | | | 399,681 | | | | 0.90 | | | | 0.90 | | | | 1.50 | | | | 31 | |
| | | | | | | | | |
For the Year Ended December 31, 2012(4) | | | | | | | | | | | | | | | | | | | | | | | | | | | | | | | | | | | | | |
IA | | $ | 19.34 | | | $ | 0.47 | | | $ | 1.85 | | | $ | 2.32 | | | $ | (0.63 | ) | | $ | — | | | $ | (0.63 | ) | | $ | 21.03 | | | | 12.02 | % | | $ | 2,754,114 | | | | 0.65 | % | | | 0.65 | % | | | 1.98 | % | | | 28 | % |
IB | | | 19.58 | | | | 0.43 | | | | 1.86 | | | | 2.29 | | | | (0.57 | ) | | | — | | | | (0.57 | ) | | | 21.30 | | | | 11.74 | | | | 406,156 | | | | 0.90 | | | | 0.90 | | | | 1.73 | | | | 28 | |
| | | | | | | | | |
For the Year Ended December 31, 2011(4) | | | | | | | | | | | | | | | | | | | | | | | | | | | | | | | | | | | | | |
IA | | $ | 19.32 | | | $ | 0.41 | | | $ | (0.06 | ) | | $ | 0.35 | | | $ | (0.33 | ) | | $ | — | | | $ | (0.33 | ) | | $ | 19.34 | | | | 1.86 | % | | $ | 2,959,019 | | | | 0.64 | % | | | 0.64 | % | | | 1.84 | % | | | 34 | % |
IB | | | 19.55 | | | | 0.36 | | | | (0.05 | ) | | | 0.31 | | | | (0.28 | ) | | | — | | | | (0.28 | ) | | | 19.58 | | | | 1.61 | | | | 455,939 | | | | 0.89 | | | | 0.89 | | | | 1.59 | | | | 34 | |
| | | | | | | | | |
| Hartford Capital Appreciation HLS Fund | | | | | | | | | | | | | | | | | | | | | | | | | | | | | | | | | | | | | |
For the Year Ended December 31, 2015 | | | | | | | | | | | | | | | | | | | | | | | | | | | | | | | | | | | | | |
IA | | $ | 54.71 | | | $ | 0.43 | | | $ | 0.38 | | | $ | 0.81 | | | $ | (0.43 | ) | | $ | (10.65 | ) | | $ | (11.08 | ) | | $ | 44.44 | | | | 1.02 | % | | $ | 5,701,269 | | | | 0.67 | % | | | 0.67 | % | | | 0.84 | % | | | 75 | % |
IB | | | 54.20 | | | | 0.30 | | | | 0.39 | | | | 0.69 | | | | (0.31 | ) | | | (10.65 | ) | | | (10.96 | ) | | | 43.93 | | | | 0.79 | | | | 641,548 | | | | 0.92 | | | | 0.92 | | | | 0.59 | | | | 75 | |
IC | | | 54.59 | | | | 0.17 | | | | 0.39 | | | | 0.56 | | | | (0.29 | ) | | | (10.65 | ) | | | (10.94 | ) | | | 44.21 | | | | 0.53 | | | | 16,215 | | | | 1.17 | | | | 1.17 | | | | 0.34 | | | | 75 | |
| | | | | | | | | |
For the Year Ended December 31, 2014 | | | | | | | | | | | | | | | | | | | | | | | | | | | | | | | | | | | | | |
IA | | $ | 59.65 | | | $ | 0.56 | | | $ | 3.81 | | | $ | 4.37 | | | $ | (0.50 | ) | | $ | (8.81 | ) | | $ | (9.31 | ) | | $ | 54.71 | | | | 7.31 | % | | $ | 6,470,599 | | | | 0.66 | % | | | 0.66 | % | | | 0.96 | % | | | 89 | % |
IB | | | 59.18 | | | | 0.42 | | | | 3.77 | | | | 4.19 | | | | (0.36 | ) | | | (8.81 | ) | | | (9.17 | ) | | | 54.20 | | | | 7.04 | | | | 764,541 | | | | 0.91 | | | | 0.91 | | | | 0.72 | | | | 89 | |
IC(5) | | | 60.21 | | | | 0.09 | | | | 3.53 | | | | 3.62 | | | | (0.43 | ) | | | (8.81 | ) | | | (9.24 | ) | | | 54.59 | | | | 5.97 | (6) | | | 3,453 | | | | 1.16 | (7) | | | 1.16 | (7) | | | 0.23 | (7) | | | 89 | |
| | | | | | | | | |
For the Year Ended December 31, 2013 | | | | | | | | | | | | | | | | | | | | | | | | | | | | | | | | | | | | | |
IA | | $ | 43.37 | | | $ | 0.45 | | | $ | 16.49 | | | $ | 16.94 | | | $ | (0.51 | ) | | $ | (0.15 | ) | | $ | (0.66 | ) | | $ | 59.65 | | | | 39.08 | % | | $ | 7,029,201 | | | | 0.67 | % | | | 0.67 | % | | | 0.88 | % | | | 86 | % |
IB | | | 43.05 | | | | 0.32 | | | | 16.33 | | | | 16.65 | | | | (0.37 | ) | | | (0.15 | ) | | | (0.52 | ) | | | 59.18 | | | | 38.72 | | | | 969,611 | | | | 0.92 | | | | 0.92 | | | | 0.63 | | | | 86 | |
| | | | | | | | | |
For the Year Ended December 31, 2012 | | | | | | | | | | | | | | | | | | | | | | | | | | | | | | | | | | | | | |
IA | | $ | 37.20 | | | $ | 0.57 | | | $ | 6.24 | | | $ | 6.81 | | | $ | (0.64 | ) | | $ | — | | | $ | (0.64 | ) | | $ | 43.37 | | | | 18.34 | % | | $ | 7,750,924 | | | | 0.67 | % | | | 0.67 | % | | | 1.24 | % | | | 142 | % |
IB | | | 36.90 | | | | 0.52 | | | | 6.14 | | | | 6.66 | | | | (0.51 | ) | | | — | | | | (0.51 | ) | | | 43.05 | | | | 18.04 | | | | 874,386 | | | | 0.92 | | | | 0.92 | | | | 0.99 | | | | 142 | |
| | | | | | | | | |
For the Year Ended December 31, 2011 | | | | | | | | | | | | | | | | | | | | | | | | | | | | | | | | | | | | | |
IA | | $ | 42.36 | | | $ | 0.37 | | | $ | (5.20 | ) | | $ | (4.83 | ) | | $ | (0.33 | ) | | $ | — | | | $ | (0.33 | ) | | $ | 37.20 | | | | (11.41 | )% | | $ | 8,169,178 | | | | 0.67 | % | | | 0.67 | % | | | 0.95 | % | | | 113 | % |
IB | | | 42.00 | | | | 0.32 | | | | (5.20 | ) | | | (4.88 | ) | | | (0.22 | ) | | | — | | | | (0.22 | ) | | | 36.90 | | | | (11.62 | ) | | | 1,102,054 | | | | 0.92 | | | | 0.92 | | | | 0.71 | | | | 113 | |
The accompanying notes are an integral part of these financial statements.
Financial Highlights – (continued)
| | | | | | | | | | | | | | | | | | | | | | | | | | | | | | | | | | | | | | | | | | | | | | | | | | | | | | | | |
| | | — Selected Per-Share Data(1) — | | | — Ratios and Supplemental Data — | |
Class | | Net Asset
Value at
Beginning
of Period | | | Net
Investment
Income
(Loss) | | | Net
Realized
and
Unrealized
Gain (Loss)
on
Investments | | | Total from
Investment
Operations | | | Dividends
from Net
Investment
Income | | | Distributions
from
Realized
Gains | | | Total
Dividends
and
Distributions | | | Net
Asset
Value at
End of
Period | | | Total
Return(2) | | | Net
Assets at
End of
Period
(000s) | | | Ratio of
Expenses
to
Average
Net
Assets
Before
Adjust-
ments(3) | | | Ratio of
Expenses
to
Average
Net
Assets
After
Adjust-
ments(3) | | | Ratio of
Net
Investment
Income
(Loss) to
Average
Net Assets | | | Portfolio
Turnover | |
| Hartford Disciplined Equity HLS Fund | | | | | | | | | | | | | | | | | | | | | | | | | | | | | | | | | | | | | |
For the Year Ended December 31, 2015 | | | | | | | | | | | | | | | | | | | | | | | | | | | | | | | | | | | | | |
IA | | $ | 20.99 | | | $ | 0.14 | | | $ | 1.41 | | | $ | 1.55 | | | $ | (0.13 | ) | | $ | (6.83 | ) | | $ | (6.96 | ) | | $ | 15.58 | | | | 6.83 | % | | $ | 648,747 | | | | 0.76 | % | | | 0.76 | % | | | 0.76 | % | | | 29 | % |
IB | | | 20.88 | | | | 0.10 | | | | 1.40 | | | | 1.50 | | | | (0.09 | ) | | | (6.83 | ) | | | (6.92 | ) | | | 15.46 | | | | 6.59 | | | | 91,844 | | | | 1.01 | | | | 1.01 | | | | 0.51 | | | | 29 | |
| | | | | | | | | |
For the Year Ended December 31, 2014 | | | | | | | | | | | | | | | | | | | | | | | | | | | | | | | | | | | | | |
IA | | $ | 18.36 | | | $ | 0.14 | | | $ | 2.83 | | | $ | 2.97 | | | $ | (0.14 | ) | | $ | (0.20 | ) | | $ | (0.34 | ) | | $ | 20.99 | | | | 16.18 | % | | $ | 734,110 | | | | 0.75 | % | | | 0.75 | % | | | 0.73 | % | | | 63 | % |
IB | | | 18.27 | | | | 0.09 | | | | 2.81 | | | | 2.90 | | | | (0.09 | ) | | | (0.20 | ) | | | (0.29 | ) | | | 20.88 | | | | 15.87 | | | | 107,577 | | | | 1.00 | | | | 1.00 | | | | 0.47 | | | | 63 | |
| | | | | | | | | |
For the Year Ended December 31, 2013 | | | | | | | | | | | | | | | | | | | | | | | | | | | | | | | | | | | | | |
IA | | $ | 13.64 | | | $ | 0.17 | | | $ | 4.72 | | | $ | 4.89 | | | $ | (0.17 | ) | | $ | — | | | $ | (0.17 | ) | | $ | 18.36 | | | | 35.82 | % | | $ | 811,099 | | | | 0.76 | % | | | 0.76 | % | | | 1.07 | % | | | 23 | % |
IB | | | 13.58 | | | | 0.13 | | | | 4.68 | | | | 4.81 | | | | (0.12 | ) | | | — | | | | (0.12 | ) | | | 18.27 | | | | 35.47 | | | | 118,598 | | | | 1.01 | | | | 1.01 | | | | 0.82 | | | | 23 | |
| | | | | | | | | |
For the Year Ended December 31, 2012(4) | | | | | | | | | | | | | | | | | | | | | | | | | | | | | | | | | | | | | |
IA | | $ | 11.78 | | | $ | 0.22 | | | $ | 1.86 | | | $ | 2.08 | | | $ | (0.22 | ) | | $ | — | | | $ | (0.22 | ) | | $ | 13.64 | | | | 17.62 | % | | $ | 798,148 | | | | 0.75 | % | | | 0.75 | % | | | 1.45 | % | | | 34 | % |
IB | | | 11.73 | | | | 0.18 | | | | 1.85 | | | | 2.03 | | | | (0.18 | ) | | | — | | | | (0.18 | ) | | | 13.58 | | | | 17.33 | | | | 116,113 | | | | 1.00 | | | | 1.00 | | | | 1.20 | | | | 34 | |
| | | | | | | | | |
For the Year Ended December 31, 2011(4) | | | | | | | | | | | | | | | | | | | | | | | | | | | | | | | | | | | | | |
IA | | $ | 11.79 | | | $ | 0.14 | | | $ | (0.01 | ) | | $ | 0.13 | | | $ | (0.14 | ) | | $ | — | | | $ | (0.14 | ) | | $ | 11.78 | | | | 1.15 | % | | $ | 852,312 | | | | 0.74 | % | | | 0.74 | % | | | 1.06 | % | | | 44 | % |
IB | | | 11.73 | | | | 0.11 | | | | — | | | | 0.11 | | | | (0.11 | ) | | | — | | | | (0.11 | ) | | | 11.73 | | | | 0.90 | | | | 129,416 | | | | 0.99 | | | | 0.99 | | | | 0.81 | | | | 44 | |
| | | | | | | | | |
| Hartford Dividend and Growth HLS Fund | | | | | | | | | | | | | | | | | | | | | | | | | | | | | | | | | | | | | |
For the Year Ended December 31, 2015 | | | | | | | | | | | | | | | | | | | | | | | | | | | | | | | | | | | | | |
IA | | $ | 26.45 | | | $ | 0.46 | | | $ | (0.70 | ) | | $ | (0.24 | ) | | $ | (0.43 | ) | | $ | (3.69 | ) | | $ | (4.12 | ) | | $ | 22.09 | | | | (1.16 | )% | | $ | 2,991,811 | | | | 0.67 | % | | | 0.67 | % | | | 1.84 | % | | | 20 | % |
IB | | | 26.38 | | | | 0.40 | | | | (0.70 | ) | | | (0.30 | ) | | | (0.37 | ) | | | (3.69 | ) | | | (4.06 | ) | | | 22.02 | | | | (1.41 | ) | | | 449,693 | | | | 0.92 | | | | 0.92 | | | | 1.59 | | | | 20 | |
| | | | | | | | | |
For the Year Ended December 31, 2014 | | | | | | | | | | | | | | | | | | | | | | | | | | | | | | | | | | | | | |
IA | | $ | 27.05 | | | $ | 0.49 | | | $ | 2.92 | | | $ | 3.41 | | | $ | (0.49 | ) | | $ | (3.52 | ) | | $ | (4.01 | ) | | $ | 26.45 | | | | 12.96 | % | | $ | 3,502,492 | | | | 0.67 | % | | | 0.67 | % | | | 1.78 | % | | | 19 | % |
IB | | | 26.99 | | | | 0.42 | | | | 2.91 | | | | 3.33 | | | | (0.42 | ) | | | (3.52 | ) | | | (3.94 | ) | | | 26.38 | | | | 12.68 | | | | 546,006 | | | | 0.92 | | | | 0.92 | | | | 1.53 | | | | 19 | |
| | | | | | | | | |
For the Year Ended December 31, 2013 | | | | | | | | | | | | | | | | | | | | | | | | | | | | | | | | | | | | | |
IA | | $ | 21.46 | | | $ | 0.46 | | | $ | 6.33 | | | $ | 6.79 | | | $ | (0.51 | ) | | $ | (0.69 | ) | | $ | (1.20 | ) | | $ | 27.05 | | | | 31.92 | % | | $ | 3,760,183 | | | | 0.67 | % | | | 0.67 | % | | | 1.88 | % | | | 25 | % |
IB | | | 21.42 | | | | 0.40 | | | | 6.31 | | | | 6.71 | | | | (0.45 | ) | | | (0.69 | ) | | | (1.14 | ) | | | 26.99 | | | | 31.58 | | | | 621,751 | | | | 0.92 | | | | 0.92 | | | | 1.62 | | | | 25 | |
| | | | | | | | | |
For the Year Ended December 31, 2012(4) | | | | | | | | | | | | | | | | | | | | | | | | | | | | | | | | | | | | | |
IA | | $ | 19.34 | | | $ | 0.49 | | | $ | 2.13 | | | $ | 2.62 | | | $ | (0.50 | ) | | $ | — | | | $ | (0.50 | ) | | $ | 21.46 | | | | 13.59 | % | | $ | 3,658,076 | | | | 0.67 | % | | | 0.67 | % | | | 2.13 | % | | | 20 | % |
IB | | | 19.30 | | | | 0.45 | | | | 2.11 | | | | 2.56 | | | | (0.44 | ) | | | — | | | | (0.44 | ) | | | 21.42 | | | | 13.31 | | | | 589,194 | | | | 0.92 | | | | 0.92 | | | | 1.88 | | | | 20 | |
| | | | | | | | | |
For the Year Ended December 31, 2011(4) | | | | | | | | | | | | | | | | | | | | | | | | | | | | | | | | | | | | | |
IA | | $ | 19.50 | | | $ | 0.42 | | | $ | (0.16 | ) | | $ | 0.26 | | | $ | (0.42 | ) | | $ | — | | | $ | (0.42 | ) | | $ | 19.34 | | | | 1.32 | % | | $ | 3,851,657 | | | | 0.67 | % | | | 0.67 | % | | | 1.98 | % | | | 24 | % |
IB | | | 19.46 | | | | 0.36 | | | | (0.16 | ) | | | 0.20 | | | | (0.36 | ) | | | — | | | | (0.36 | ) | | | 19.30 | | | | 1.06 | | | | 658,419 | | | | 0.92 | | | | 0.92 | | | | 1.73 | | | | 24 | |
The accompanying notes are an integral part of these financial statements.
Financial Highlights – (continued)
| | | | | | | | | | | | | | | | | | | | | | | | | | | | | | | | | | | | | | | | | | | | | | | | | | | | | | | | |
| | | — Selected Per-Share Data(1) — | | | — Ratios and Supplemental Data — | |
Class | | Net Asset
Value at
Beginning
of Period | | | Net
Investment
Income
(Loss) | | | Net
Realized
and
Unrealized
Gain (Loss)
on
Investments | | | Total from
Investment
Operations | | | Dividends
from Net
Investment
Income | | | Distributions
from
Realized
Gains | | | Total
Dividends
and
Distributions | | | Net
Asset
Value at
End of
Period | | | Total
Return(2) | | | Net
Assets at
End of
Period
(000s) | | | Ratio of
Expenses
to
Average
Net
Assets
Before
Adjust-
ments(3) | | | Ratio of
Expenses
to
Average
Net
Assets
After
Adjust-
ments(3) | | | Ratio of
Net
Investment
Income
(Loss) to
Average
Net Assets | | | Portfolio
Turnover | |
| Hartford Global Growth HLS Fund | | | | | | | | | | | | | | | | | | | | | | | | | | | | | | | | | | | | | |
For the Year Ended December 31, 2015 | | | | | | | | | | | | | | | | | | | | | | | | | | | | | | | | | | | | | |
IA | | $ | 23.74 | | | $ | 0.15 | | | $ | 1.77 | | | $ | 1.92 | | | $ | (0.13 | ) | | $ | (1.14 | ) | | $ | (1.27 | ) | | $ | 24.39 | | | | 8.04 | % | | $ | 392,302 | | | | 0.81 | % | | | 0.81 | % | | | 0.62 | % | | | 67 | % |
IB | | | 23.56 | | | | 0.09 | | | | 1.75 | | | | 1.84 | | | | (0.07 | ) | | | (1.14 | ) | | | (1.21 | ) | | | 24.19 | | | | 7.76 | | | | 86,759 | | | | 1.06 | | | | 1.06 | | | | 0.38 | | | | 67 | |
| | | | | | | | | |
For the Year Ended December 31, 2014 | | | | | | | | | | | | | | | | | | | | | | | | | | | | | | | | | | | | | |
IA | | $ | 22.33 | | | $ | 0.13 | | | $ | 1.39 | | | $ | 1.52 | | | $ | (0.11 | ) | | $ | — | | | $ | (0.11 | ) | | $ | 23.74 | | | | 6.79 | % | | $ | 388,542 | | | | 0.81 | % | | | 0.81 | % | | | 0.57 | % | | | 82 | %(8) |
IB | | | 22.16 | | | | 0.07 | | | | 1.39 | | | | 1.46 | | | | (0.06 | ) | | | — | | | | (0.06 | ) | | | 23.56 | | | | 6.58 | | | | 92,979 | | | | 1.06 | | | | 1.06 | | | | 0.30 | | | | 82 | (8) |
| | | | | | | | | |
For the Year Ended December 31, 2013 | | | | | | | | | | | | | | | | | | | | | | | | | | | | | | | | | | | | | |
IA | | $ | 16.50 | | | $ | 0.11 | | | $ | 5.86 | | | $ | 5.97 | | | $ | (0.14 | ) | | $ | — | | | $ | (0.14 | ) | | $ | 22.33 | | | | 36.30 | % | | $ | 360,086 | | | | 0.82 | % | | | 0.82 | % | | | 0.56 | % | | | 71 | % |
IB | | | 16.38 | | | | 0.06 | | | | 5.81 | | | | 5.87 | | | | (0.09 | ) | | | — | | | | (0.09 | ) | | | 22.16 | | | | 35.90 | | | | 79,823 | | | | 1.07 | | | | 1.07 | | | | 0.32 | | | | 71 | |
| | | | | | | | | |
For the Year Ended December 31, 2012(4) | | | | | | | | | | | | | | | | | | | | | | | | | | | | | | | | | | | | | |
IA | | $ | 13.45 | | | $ | 0.14 | | | $ | 3.00 | | | $ | 3.14 | | | $ | (0.09 | ) | | $ | — | | | $ | (0.09 | ) | | $ | 16.50 | | | | 23.41 | % | | $ | 321,371 | | | | 0.82 | % | | | 0.82 | % | | | 0.73 | % | | | 108 | % |
IB | | | 13.34 | | | | 0.09 | | | | 2.99 | | | | 3.08 | | | | (0.04 | ) | | | — | | | | (0.04 | ) | | | 16.38 | | | | 23.10 | | | | 77,224 | | | | 1.07 | | | | 1.07 | | | | 0.47 | | | | 108 | |
| | | | | | | | | |
For the Year Ended December 31, 2011(4) | | | | | | | | | | | | | | | | | | | | | | | | | | | | | | | | | | | | | |
IA | | $ | 15.62 | | | $ | 0.08 | | | $ | (2.24 | ) | | $ | (2.16 | ) | | $ | (0.01 | ) | | $ | — | | | $ | (0.01 | ) | | $ | 13.45 | | | | (13.89 | )% | | $ | 352,947 | | | | 0.80 | % | | | 0.80 | % | | | 0.46 | % | | | 57 | % |
IB | | | 15.53 | | | | 0.04 | | | | (2.23 | ) | | | (2.19 | ) | | | — | | | | — | | | | — | | | | 13.34 | | | | (14.10 | ) | | | 82,204 | | | | 1.05 | | | | 1.05 | | | | 0.22 | | | | 57 | |
| | | | | | | | | |
| Hartford Growth Opportunities HLS Fund | | | | | | | | | | | | | | | | | | | | | | | | | | | | | | | | | | | | | |
For the Year Ended December 31, 2015 | | | | | | | | | | | | | | | | | | | | | | | | | | | | | | | | | | | | | |
IA | | $ | 38.88 | | | $ | 0.02 | | | $ | 4.66 | | | $ | 4.68 | | | $ | (0.05 | ) | | $ | (8.65 | ) | | $ | (8.70 | ) | | $ | 34.86 | | | | 11.74 | % | | $ | 1,197,187 | | | | 0.65 | % | | | 0.65 | % | | | 0.05 | % | | | 109 | % |
IB | | | 37.93 | | | | (0.08 | ) | | | 4.56 | | | | 4.48 | | | | — | | | | (8.65 | ) | | | (8.65 | ) | | | 33.76 | | | | 11.47 | | | | 158,304 | | | | 0.90 | | | | 0.90 | | | | (0.20 | ) | | | 109 | |
IC | | | 38.75 | | | | (0.18 | ) | | | 4.65 | | | | 4.47 | | | | — | | | | (8.65 | ) | | | (8.65 | ) | | | 34.57 | | | | 11.18 | | | | 20,495 | | | | 1.16 | | | | 1.16 | | | | (0.48 | ) | | | 109 | |
| | | | | | | | | |
For the Year Ended December 31, 2014 | | | | | | | | | | | | | | | | | | | | | | | | | | | | | | | | | | | | | |
IA | | $ | 40.58 | | | $ | 0.06 | | | $ | 5.31 | | | $ | 5.37 | | | $ | (0.07 | ) | | $ | (7.00 | ) | | $ | (7.07 | ) | | $ | 38.88 | | | | 14.14 | % | | $ | 1,203,366 | | | | 0.64 | % | | | 0.64 | % | | | 0.16 | % | | | 145 | %(9) |
IB | | | 39.79 | | | | (0.04 | ) | | | 5.18 | | | | 5.14 | | | | — | | | | (7.00 | ) | | | (7.00 | ) | | | 37.93 | | | | 13.82 | | | | 160,040 | | | | 0.89 | | | | 0.89 | | | | (0.11 | ) | | | 145 | (9) |
IC(5) | | | 40.23 | | | | (0.10 | ) | | | 5.69 | | | | 5.59 | | | | (0.07 | ) | | | (7.00 | ) | | | (7.07 | ) | | | 38.75 | | | | 14.79 | (6) | | | 1,717 | | | | 1.14 | (7) | | | 1.14 | (7) | | | (0.37 | )(7) | | | 145 | (9) |
| | | | | | | | | |
For the Year Ended December 31, 2013 | | | | | | | | | | | | | | | | | | | | | | | | | | | | | | | | | | | | | |
IA | | $ | 29.90 | | | $ | 0.07 | | | $ | 10.61 | | | $ | 10.68 | | | $ | — | | | $ | — | | | $ | — | | | $ | 40.58 | | | | 35.74 | % | | $ | 1,097,380 | | | | 0.65 | % | | | 0.65 | % | | | 0.21 | % | | | 119 | % |
IB | | | 29.38 | | | | (0.01 | ) | | | 10.42 | | | | 10.41 | | | | — | | | | — | | | | — | | | | 39.79 | | | | 35.42 | | | | 111,230 | | | | 0.90 | | | | 0.90 | | | | (0.04 | ) | | | 119 | |
| | | | | | | | | |
For the Year Ended December 31, 2012 | | | | | | | | | | | | | | | | | | | | | | | | | | | | | | | | | | | | | |
IA | | $ | 23.57 | | | $ | 0.03 | | | $ | 6.30 | | | $ | 6.33 | | | $ | — | | | $ | — | | | $ | — | | | $ | 29.90 | | | | 26.86 | % | | $ | 951,372 | | | | 0.65 | % | | | 0.65 | % | | | 0.11 | % | | | 105 | % |
IB | | | 23.22 | | | | (0.05 | ) | | | 6.21 | | | | 6.16 | | | | — | | | | — | | | | — | | | | 29.38 | | | | 26.54 | | | | 108,506 | | | | 0.90 | | | | 0.90 | | | | (0.15 | ) | | | 105 | |
| | | | | | | | | |
For the Year Ended December 31, 2011 | | | | | | | | | | | | | | | | | | | | | | | | | | | | | | | | | | | | | |
IA | | $ | 25.86 | | | $ | 0.01 | | | $ | (2.30 | ) | | $ | (2.29 | ) | | $ | — | | | $ | — | | | $ | — | | | $ | 23.57 | | | | (8.87 | )% | | $ | 881,352 | | | | 0.66 | % | | | 0.66 | % | | | 0.03 | % | | | 113 | % |
IB | | | 25.54 | | | | (0.06 | ) | | | (2.26 | ) | | | (2.32 | ) | | | — | | | | — | | | | — | | | | 23.22 | | | | (9.10 | ) | | | 108,905 | | | | 0.91 | | | | 0.91 | | | | (0.22 | ) | | | 113 | |
The accompanying notes are an integral part of these financial statements.
Financial Highlights – (continued)
| | | | | | | | | | | | | | | | | | | | | | | | | | | | | | | | | | | | | | | | | | | | | | | | | | | | | | | | |
| | | — Selected Per-Share Data(1) — | | | — Ratios and Supplemental Data — | |
Class | | Net Asset
Value at
Beginning
of Period | | | Net
Investment
Income
(Loss) | | | Net
Realized
and
Unrealized
Gain (Loss)
on
Investments | | | Total from
Investment
Operations | | | Dividends
from Net
Investment
Income | | | Distributions
from
Realized
Gains | | | Total
Dividends
and
Distributions | | | Net
Asset
Value at
End of
Period | | | Total
Return(2) | | | Net
Assets at
End of
Period
(000s) | | | Ratio of
Expenses
to
Average
Net
Assets
Before
Adjust-
ments(3) | | | Ratio of
Expenses
to
Average
Net
Assets
After
Adjust-
ments(3) | | | Ratio of
Net
Investment
Income
(Loss) to
Average
Net Assets | | | Portfolio
Turnover | |
| Hartford Healthcare HLS Fund | | | | | | | | | | | | | | | | | | | | | | | | | | | | | | | | | | | | | |
For the Year Ended December 31, 2015 | | | | | | | | | | | | | | | | | | | | | | | | | | | | | | | | | | | | | |
IA | | $ | 30.02 | | | $ | — | | | $ | 4.08 | | | $ | 4.08 | | | $ | — | | | $ | (3.78 | ) | | $ | (3.78 | ) | | $ | 30.32 | | | | 13.21 | % | | $ | 360,783 | | | | 0.86 | % | | | 0.86 | % | | | (0.01 | )% | | | 38 | % |
IB | | | 29.23 | | | | (0.08 | ) | | | 3.99 | | | | 3.91 | | | | — | | | | (3.78 | ) | | | (3.78 | ) | | | 29.36 | | | | 12.98 | | | | 62,644 | | | | 1.11 | | | | 1.11 | | | | (0.26 | ) | | | 38 | |
| | | | | | | | | |
For the Year Ended December 31, 2014 | | | | | | | | | | | | | | | | | | | | | | | | | | | | | | | | | | | | | |
IA | | $ | 25.67 | | | $ | 0.01 | | | $ | 6.75 | | | $ | 6.76 | | | $ | (0.07 | ) | | $ | (2.34 | ) | | $ | (2.41 | ) | | $ | 30.02 | | | | 27.39 | % | | $ | 301,580 | | | | 0.88 | % | | | 0.88 | % | | | 0.03 | % | | | 33 | % |
IB | | | 25.07 | | | | (0.06 | ) | | | 6.57 | | | | 6.51 | | | | (0.01 | ) | | | (2.34 | ) | | | (2.35 | ) | | | 29.23 | | | | 27.00 | | | | 60,413 | | | | 1.13 | | | | 1.13 | | | | (0.22 | ) | | | 33 | |
| | | | | | | | | |
For the Year Ended December 31, 2013 | | | | | | | | | | | | | | | | | | | | | | | | | | | | | | | | | | | | | |
IA | | $ | 18.11 | | | $ | 0.04 | | | $ | 9.12 | | | $ | 9.16 | | | $ | (0.12 | ) | | $ | (1.48 | ) | | $ | (1.60 | ) | | $ | 25.67 | | | | 51.84 | % | | $ | 243,719 | | | | 0.89 | % | | | 0.89 | % | | | 0.19 | % | | | 33 | % |
IB | | | 17.71 | | | | (0.01 | ) | | | 8.92 | | | | 8.91 | | | | (0.07 | ) | | | (1.48 | ) | | | (1.55 | ) | | | 25.07 | | | | 51.50 | | | | 57,187 | | | | 1.14 | | | | 1.14 | | | | (0.06 | ) | | | 33 | |
| | | | | | | | | |
For the Year Ended December 31, 2012(4) | | | | | | | | | | | | | | | | | | | | | | | | | | | | | | | | | | | | | |
IA | | $ | 15.07 | | | $ | 0.13 | | | $ | 2.98 | | | $ | 3.11 | | | $ | (0.07 | ) | | $ | — | | | $ | (0.07 | ) | | $ | 18.11 | | | | 20.62 | % | | $ | 149,801 | | | | 0.91 | % | | | 0.91 | % | | | 0.69 | % | | | 46 | % |
IB | | | 14.74 | | | | 0.09 | | | | 2.90 | | | | 2.99 | | | | (0.02 | ) | | | — | | | | (0.02 | ) | | | 17.71 | | | | 20.32 | | | | 45,306 | | | | 1.16 | | | | 1.16 | | | | 0.43 | | | | 46 | |
| | | | | | | | | |
For the Year Ended December 31, 2011(4) | | | | | | | | | | | | | | | | | | | | | | | | | | | | | | | | | | | | | |
IA | | $ | 13.89 | | | $ | 0.06 | | | $ | 1.13 | | | $ | 1.19 | | | $ | (0.01 | ) | | $ | — | | | $ | (0.01 | ) | | $ | 15.07 | | | | 8.54 | % | | $ | 137,088 | | | | 0.91 | % | | | 0.91 | % | | | 0.33 | % | | | 45 | % |
IB | | | 13.61 | | | | 0.02 | | | | 1.11 | | | | 1.13 | | | | — | | | | — | | | | — | | | | 14.74 | | | | 8.27 | | | | 48,933 | | | | 1.16 | | | | 1.16 | | | | 0.08 | | | | 45 | |
| | | | | | | | | |
| Hartford High Yield HLS Fund | | | | | | | | | | | | | | | | | | | | | | | | | | | | | | | | | | | | | |
For the Year Ended December 31, 2015 | | | | | | | | | | | | | | | | | | | | | | | | | | | | | | | | | | | | | |
IA | | $ | 8.45 | | | $ | 0.45 | | | $ | (0.79 | ) | | $ | (0.34 | ) | | $ | (0.56 | ) | | $ | — | | | $ | (0.56 | ) | | $ | 7.55 | | | | (4.30 | )% | | $ | 251,313 | | | | 0.76 | % | | | 0.76 | % | | | 5.40 | % | | | 34 | % |
IB | | | 8.32 | | | | 0.42 | | | | (0.77 | ) | | | (0.35 | ) | | | (0.54 | ) | | | — | | | | (0.54 | ) | | | 7.43 | | | | (4.56 | ) | | | 77,013 | | | | 1.01 | | | | 1.01 | | | | 5.15 | | | | 34 | |
| | | | | | | | | |
For the Year Ended December 31, 2014 | | | | | | | | | | | | | | | | | | | | | | | | | | | | | | | | | | | | | |
IA | | $ | 8.90 | | | $ | 0.47 | | | $ | (0.22 | ) | | $ | 0.25 | | | $ | (0.70 | ) | | $ | — | | | $ | (0.70 | ) | | $ | 8.45 | | | | 2.58 | % | | $ | 321,650 | | | | 0.75 | % | | | 0.75 | % | | | 5.28 | % | | | 39 | % |
IB | | | 8.77 | | | | 0.44 | | | | (0.22 | ) | | | 0.22 | | | | (0.67 | ) | | | — | | | | (0.67 | ) | | | 8.32 | | | | 2.31 | | | | 105,579 | | | | 1.00 | | | | 1.00 | | | | 5.02 | | | | 39 | |
| | | | | | | | | |
For the Year Ended December 31, 2013 | | | | | | | | | | | | | | | | | | | | | | | | | | | | | | | | | | | | | |
IA | | $ | 9.09 | | | $ | 0.54 | | | $ | 0.01 | | | $ | 0.55 | | | $ | (0.74 | ) | | $ | — | | | $ | (0.74 | ) | | $ | 8.90 | | | | 6.43 | % | | $ | 389,340 | | | | 0.75 | % | | | 0.75 | % | | | 5.90 | % | | | 46 | % |
IB | | | 8.96 | | | | 0.50 | | | | 0.03 | | | | 0.53 | | | | (0.72 | ) | | | — | | | | (0.72 | ) | | | 8.77 | | | | 6.17 | | | | 125,701 | | | | 1.00 | | | | 1.00 | | | | 5.64 | | | | 46 | |
| | | | | | | | | |
For the Year Ended December 31, 2012 | | | | | | | | | | | | | | | | | | | | | | | | | | | | | | | | | | | | | |
IA | | $ | 8.70 | | | $ | 0.58 | | | $ | 0.63 | | | $ | 1.21 | | | $ | (0.82 | ) | | $ | — | | | $ | (0.82 | ) | | $ | 9.09 | | | | 14.31 | % | | $ | 504,042 | | | | 0.75 | % | | | 0.75 | % | | | 6.37 | % | | | 94 | % |
IB | | | 8.59 | | | | 0.55 | | | | 0.62 | | | | 1.17 | | | | (0.80 | ) | | | — | | | | (0.80 | ) | | | 8.96 | | | | 14.03 | | | | 149,050 | | | | 1.00 | | | | 1.00 | | | | 6.12 | | | | 94 | |
| | | | | | | | | |
For the Year Ended December 31, 2011 | | | | | | | | | | | | | | | | | | | | | | | | | | | | | | | | | | | | | |
IA | | $ | 9.15 | | | $ | 0.71 | | | $ | (0.31 | ) | | $ | 0.40 | | | $ | (0.85 | ) | | $ | — | | | $ | (0.85 | ) | | $ | 8.70 | | | | 4.69 | % | | $ | 548,608 | | | | 0.74 | % | | | 0.74 | % | | | 7.68 | % | | | 88 | % |
IB | | | 9.04 | | | | 0.67 | | | | (0.30 | ) | | | 0.37 | | | | (0.82 | ) | | | — | | | | (0.82 | ) | | | 8.59 | | | | 4.44 | | | | 160,060 | | | | 0.99 | | | | 0.99 | | | | 7.43 | | | | 88 | |
The accompanying notes are an integral part of these financial statements.
Financial Highlights – (continued)
| | | | | | | | | | | | | | | | | | | | | | | | | | | | | | | | | | | | | | | | | | | | | | | | | | | | | | | | |
| | | — Selected Per-Share Data(1) — | | | — Ratios and Supplemental Data — | |
Class | | Net Asset
Value at
Beginning
of Period | | | Net
Investment
Income
(Loss) | | | Net
Realized
and
Unrealized
Gain (Loss)
on
Investments | | | Total from
Investment
Operations | | | Dividends
from Net
Investment
Income | | | Distributions
from
Realized
Gains | | | Total
Dividends
and
Distributions | | | Net
Asset
Value at
End of
Period | | | Total
Return(2) | | | Net
Assets at
End of
Period
(000s) | | | Ratio of
Expenses
to
Average
Net
Assets
Before
Adjust-
ments(3) | | | Ratio of
Expenses
to
Average
Net
Assets
After
Adjust-
ments(3) | | | Ratio of
Net
Investment
Income
(Loss) to
Average
Net Assets | | | Portfolio
Turnover | |
| Hartford International Opportunities HLS Fund | | | | | | | | | | | | | | | | | | | | | | | | | | | | | | | | | | | | | |
For the Year Ended December 31, 2015 | | | | | | | | | | | | | | | | | | | | | | | | | | | | | | | | | | | | | |
IA | | $ | 14.13 | | | $ | 0.22 | | | $ | 0.06 | | | $ | 0.28 | | | $ | (0.22 | ) | | $ | — | | | $ | (0.22 | ) | | $ | 14.19 | | | | 1.88 | % | | $ | 1,146,250 | | | | 0.74 | % | | | 0.74 | % | | | 1.47 | % | | | 68 | % |
IB | | | 14.29 | | | | 0.18 | | | | 0.06 | | | | 0.24 | | | | (0.17 | ) | | | — | | | | (0.17 | ) | | | 14.36 | | | | 1.65 | | | | 171,538 | | | | 0.99 | | | | 0.99 | | | | 1.21 | | | | 68 | |
| | | | | | | | | |
For the Year Ended December 31, 2014 | | | | | | | | | | | | | | | | | | | | | | | | | | | | | | | | | | | | | |
IA | | $ | 15.03 | | | $ | 0.19 | | | $ | (0.75 | ) | | $ | (0.56 | ) | | $ | (0.34 | ) | | $ | — | | | $ | (0.34 | ) | | $ | 14.13 | | | | (3.87 | )% | | $ | 1,239,946 | | | | 0.73 | % | | | 0.73 | % | | | 1.30 | % | | | 90 | % |
IB | | | 15.20 | | | | 0.15 | | | | (0.76 | ) | | | (0.61 | ) | | | (0.30 | ) | | | — | | | | (0.30 | ) | | | 14.29 | | | | (4.14 | ) | | | 189,053 | | | | 0.98 | | | | 0.98 | | | | 1.02 | | | | 90 | |
| | | | | | | | | |
For the Year Ended December 31, 2013 | | | | | | | | | | | | | | | | | | | | | | | | | | | | | | | | | | | | | |
IA | | $ | 12.63 | | | $ | 0.24 | | | $ | 2.45 | | | $ | 2.69 | | | $ | (0.29 | ) | | $ | — | | | $ | (0.29 | ) | | $ | 15.03 | | | | 21.55 | % | | $ | 1,454,018 | | | | 0.74 | % | | | 0.74 | % | | | 1.76 | % | | | 100 | % |
IB | | | 12.76 | | | | 0.21 | | | | 2.49 | | | | 2.70 | | | | (0.26 | ) | | | — | | | | (0.26 | ) | | | 15.20 | | | | 21.28 | | | | 215,447 | | | | 0.99 | | | | 0.99 | | | | 1.55 | | | | 100 | |
| | | | | | | | | |
For the Year Ended December 31, 2012(4) | | | | | | | | | | | | | | | | | | | | | | | | | | | | | | | | | | | | | |
IA | | $ | 10.72 | | | $ | 0.26 | | | $ | 1.88 | | | $ | 2.14 | | | $ | (0.23 | ) | | $ | — | | | $ | (0.23 | ) | | $ | 12.63 | | | | 20.20 | % | | $ | 1,303,209 | | | | 0.74 | % | | | 0.74 | % | | | 1.88 | % | | | 95 | % |
IB | | | 10.82 | | | | 0.25 | | | | 1.88 | | | | 2.13 | | | | (0.19 | ) | | | — | | | | (0.19 | ) | | | 12.76 | | | | 19.89 | | | | 220,699 | | | | 0.99 | | | | 0.99 | | | | 1.64 | | | | 95 | |
| | | | | | | | | |
For the Year Ended December 31, 2011(4) | | | | | | | | | | | | | | | | | | | | | | | | | | | | | | | | | | | | | |
IA | | $ | 12.46 | | | $ | 0.21 | | | $ | (1.94 | ) | | $ | (1.73 | ) | | $ | (0.01 | ) | | $ | — | | | $ | (0.01 | ) | | $ | 10.72 | | | | (13.97 | )% | | $ | 1,287,917 | | | | 0.73 | % | | | 0.73 | % | | | 1.66 | % | | | 111 | % |
IB | | | 12.61 | | | | 0.19 | | | | (1.97 | ) | | | (1.78 | ) | | | (0.01 | ) | | | — | | | | (0.01 | ) | | | 10.82 | | | | (14.19 | ) | | | 232,707 | | | | 0.98 | | | | 0.98 | | | | 1.41 | | | | 111 | |
| | | | | | | | | |
| Hartford MidCap HLS Fund | | | | | | | | | | | | | | | | | | | | | | | | | | | | | | | | | | | | | |
For the Year Ended December 31, 2015 | | | | | | | | | | | | | | | | | | | | | | | | | | | | | | | | | | | | | |
IA | | $ | 37.28 | | | $ | 0.03 | | | $ | 0.83 | | | $ | 0.86 | | | $ | (0.03 | ) | | $ | (4.45 | ) | | $ | (4.48 | ) | | $ | 33.66 | | | | 1.60 | % | | $ | 1,647,715 | | | | 0.70 | % | | | 0.70 | % | | | 0.08 | % | | | 38 | % |
IB | | | 36.83 | | | | (0.06 | ) | | | 0.82 | | | | 0.76 | | | | (0.03 | ) | | | (4.45 | ) | | | (4.48 | ) | | | 33.11 | | | | 1.34 | | | | 104,395 | | | | 0.95 | | | | 0.95 | | | | (0.16 | ) | | | 38 | |
| | | | | | | | | |
For the Year Ended December 31, 2014 | | | | | | | | | | | | | | | | | | | | | | | | | | | | | | | | | | | | | |
IA | | $ | 37.87 | | | $ | 0.04 | | | $ | 4.22 | | | $ | 4.26 | | | $ | (0.04 | ) | | $ | (4.81 | ) | | $ | (4.85 | ) | | $ | 37.28 | | | | 11.37 | % | | $ | 1,669,393 | | | | 0.70 | % | | | 0.70 | % | | | 0.10 | % | | | 42 | % |
IB | | | 37.52 | | | | (0.06 | ) | | | 4.18 | | | | 4.12 | | | | — | | | | (4.81 | ) | | | (4.81 | ) | | | 36.83 | | | | 11.09 | | | | 83,562 | | | | 0.95 | | | | 0.95 | | | | (0.15 | ) | | | 42 | |
| | | | | | | | | |
For the Year Ended December 31, 2013 | | | | | | | | | | | | | | | | | | | | | | | | | | | | | | | | | | | | | |
IA | | $ | 28.16 | | | $ | 0.07 | | | $ | 11.02 | | | $ | 11.09 | | | $ | (0.04 | ) | | $ | (1.34 | ) | | $ | (1.38 | ) | | $ | 37.87 | | | | 39.82 | % | | $ | 1,483,626 | | | | 0.71 | % | | | 0.71 | % | | | 0.21 | % | | | 34 | % |
IB | | | 27.95 | | | | (0.02 | ) | | | 10.94 | | | | 10.92 | | | | (0.01 | ) | | | (1.34 | ) | | | (1.35 | ) | | | 37.52 | | | | 39.46 | | | | 82,483 | | | | 0.96 | | | | 0.96 | | | | (0.05 | ) | | | 34 | |
| | | | | | | | | |
For the Year Ended December 31, 2012(4) | | | | | | | | | | | | | | | | | | | | | | | | | | | | | | | | | | | | | |
IA | | $ | 23.77 | | | $ | 0.24 | | | $ | 4.38 | | | $ | 4.62 | | | $ | (0.23 | ) | | $ | — | | | $ | (0.23 | ) | | $ | 28.16 | | | | 19.44 | % | | $ | 1,325,221 | | | | 0.71 | % | | | 0.71 | % | | | 0.84 | % | | | 51 | % |
IB | | | 23.59 | | | | 0.17 | | | | 4.35 | | | | 4.52 | | | | (0.16 | ) | | | — | | | | (0.16 | ) | | | 27.95 | | | | 19.14 | | | | 70,997 | | | | 0.96 | | | | 0.96 | | | | 0.59 | | | | 51 | |
| | | | | | | | | |
For the Year Ended December 31, 2011(4) | | | | | | | | | | | | | | | | | | | | | | | | | | | | | | | | | | | | | |
IA | | $ | 26.01 | | | $ | 0.15 | | | $ | (2.20 | ) | | $ | (2.05 | ) | | $ | (0.19 | ) | | $ | — | | | $ | (0.19 | ) | | $ | 23.77 | | | | (7.92 | )% | | $ | 1,212,257 | | | | 0.71 | % | | | 0.71 | % | | | 0.48 | % | | | 69 | % |
IB | | | 25.74 | | | | 0.07 | | | | (2.17 | ) | | | (2.10 | ) | | | (0.05 | ) | | | — | | | | (0.05 | ) | | | 23.59 | | | | (8.16 | ) | | | 70,188 | | | | 0.96 | | | | 0.96 | | | | 0.18 | | | | 69 | |
The accompanying notes are an integral part of these financial statements.
Financial Highlights – (continued)
| | | | | | | | | | | | | | | | | | | | | | | | | | | | | | | | | | | | | | | | | | | | | | | | | | | | | | | | |
| | | — Selected Per-Share Data(1) — | | | — Ratios and Supplemental Data — | |
Class | | Net Asset
Value at
Beginning
of Period | | | Net
Investment
Income
(Loss) | | | Net
Realized
and
Unrealized
Gain (Loss)
on
Investments | | | Total from
Investment
Operations | | | Dividends
from Net
Investment
Income | | | Distributions
from
Realized
Gains | | | Total
Dividends
and
Distributions | | | Net
Asset
Value at
End of
Period | | | Total
Return(2) | | | Net
Assets at
End of
Period
(000s) | | | Ratio of
Expenses
to
Average
Net
Assets
Before
Adjust-
ments(3) | | | Ratio of
Expenses
to
Average
Net
Assets
After
Adjust-
ments(3) | | | Ratio of
Net
Investment
Income
(Loss) to
Average
Net Assets | | | Portfolio
Turnover | |
| Hartford MidCap Value HLS Fund | | | | | | | | | | | | | | | | | | | | | | | | | | | | | | | | | | | | | |
For the Year Ended December 31, 2015 | | | | | | | | | | | | | | | | | | | | | | | | | | | | | | | | | | | | | |
IA | | $ | 14.60 | | | $ | 0.07 | | | $ | (0.15 | ) | | $ | (0.08 | ) | | $ | (0.09 | ) | | $ | (2.10 | ) | | $ | (2.19 | ) | | $ | 12.33 | | | | (1.21 | )% | | $ | 291,174 | | | | 0.84 | % | | | 0.84 | % | | | 0.49 | % | | | 29 | % |
IB | | | 14.50 | | | | 0.03 | | | | (0.15 | ) | | | (0.12 | ) | | | (0.04 | ) | | | (2.10 | ) | | | (2.14 | ) | | | 12.24 | | | | (1.45 | ) | | | 91,720 | | | | 1.09 | | | | 1.09 | | | | 0.24 | | | | 29 | |
| | | | | | | | | |
For the Year Ended December 31, 2014 | | | | | | | | | | | | | | | | | | | | | | | | | | | | | | | | | | | | | |
IA | | $ | 15.51 | | | $ | 0.09 | | | $ | 1.19 | | | $ | 1.28 | | | $ | (0.11 | ) | | $ | (2.08 | ) | | $ | (2.19 | ) | | $ | 14.60 | | | | 8.22 | % | | $ | 345,084 | | | | 0.84 | % | | | 0.84 | % | | | 0.60 | % | | | 31 | % |
IB | | | 15.42 | | | | 0.05 | | | | 1.18 | | | | 1.23 | | | | (0.07 | ) | | | (2.08 | ) | | | (2.15 | ) | | | 14.50 | | | | 7.91 | | | | 110,819 | | | | 1.09 | | | | 1.09 | | | | 0.35 | | | | 31 | |
| | | | | | | | | |
For the Year Ended December 31, 2013 | | | | | | | | | | | | | | | | | | | | | | | | | | | | | | | | | | | | | |
IA | | $ | 11.65 | | | $ | 0.08 | | | $ | 3.95 | | | $ | 4.03 | | | $ | (0.17 | ) | | $ | — | | | $ | (0.17 | ) | | $ | 15.51 | | | | 34.71 | % | | $ | 377,272 | | | | 0.84 | % | | | 0.84 | % | | | 0.56 | % | | | 49 | % |
IB | | | 11.59 | | | | 0.04 | | | | 3.93 | | | | 3.97 | | | | (0.14 | ) | | | — | | | | (0.14 | ) | | | 15.42 | | | | 34.37 | | | | 123,884 | | | | 1.09 | | | | 1.09 | | | | 0.31 | | | | 49 | |
| | | | | | | | | |
For the Year Ended December 31, 2012(4) | | | | | | | | | | | | | | | | | | | | | | | | | | | | | | | | | | | | | |
IA | | $ | 9.44 | | | $ | 0.14 | | | $ | 2.20 | | | $ | 2.34 | | | $ | (0.13 | ) | | $ | — | | | $ | (0.13 | ) | | $ | 11.65 | | | | 24.95 | % | | $ | 323,934 | | | | 0.85 | % | | | 0.85 | % | | | 1.03 | % | | | 45 | % |
IB | | | 9.38 | | | | 0.10 | | | | 2.21 | | | | 2.31 | | | | (0.10 | ) | | | — | | | | (0.10 | ) | | | 11.59 | | | | 24.64 | | | | 112,996 | | | | 1.10 | | | | 1.10 | | | | 0.79 | | | | 45 | |
| | | | | | | | | |
For the Year Ended December 31, 2011(4) | | | | | | | | | | | | | | | | | | | | | | | | | | | | | | | | | | | | | |
IA | | $ | 10.32 | | | $ | 0.07 | | | $ | (0.95 | ) | | $ | (0.88 | ) | | $ | — | | | $ | — | | | $ | — | | | $ | 9.44 | | | | (8.56 | )% | | $ | 341,583 | | | | 0.83 | % | | | 0.83 | % | | | 0.57 | % | | | 43 | % |
IB | | | 10.29 | | | | 0.04 | | | | (0.95 | ) | | | (0.91 | ) | | | — | | | | — | | | | — | | | | 9.38 | | | | (8.79 | ) | | | 116,563 | | | | 1.08 | | | | 1.08 | | | | 0.32 | | | | 43 | |
| | | | | | | | | |
| Hartford Small Company HLS Fund | | | | | | | | | | | | | | | | | | | | | | | | | | | | | | | | | | | | | |
For the Year Ended December 31, 2015 | | | | | | | | | | | | | | | | | | | | | | | | | | | | | | | | | | | | | |
IA | | $ | 23.33 | | | $ | (0.02 | ) | | $ | (1.43 | ) | | $ | (1.45 | ) | | $ | — | | | $ | (4.36 | ) | | $ | (4.36 | ) | | $ | 17.52 | | | | (8.21 | )% | | $ | 1,117,778 | | | | 0.71 | % | | | 0.71 | % | | | (0.11 | )% | | | 88 | % |
IB | | | 22.24 | | | | (0.07 | ) | | | (1.34 | ) | | | (1.41 | ) | | | — | | | | (4.36 | ) | | | (4.36 | ) | | | 16.47 | | | | (8.45 | ) | | | 98,501 | | | | 0.96 | | | | 0.96 | | | | (0.36 | ) | | | 88 | |
| | | | | | | | | |
For the Year Ended December 31, 2014 | | | | | | | | | | | | | | | | | | | | | | | | | | | | | | | | | | | | | |
IA | | $ | 26.43 | | | $ | (0.09 | ) | | $ | 1.78 | | | $ | 1.69 | | | $ | — | | | $ | (4.79 | ) | | $ | (4.79 | ) | | $ | 23.33 | | | | 7.07 | % | | $ | 1,279,533 | | | | 0.71 | % | | | 0.71 | % | | | (0.35 | )% | | | 90 | % |
IB | | | 25.46 | | | | (0.15 | ) | | | 1.72 | | | | 1.57 | | | | — | | | | (4.79 | ) | | | (4.79 | ) | | | 22.24 | | | | 6.85 | | | | 123,799 | | | | 0.96 | | | | 0.96 | | | | (0.60 | ) | | | 90 | |
| | | | | | | | | |
For the Year Ended December 31, 2013 | | | | | | | | | | | | | | | | | | | | | | | | | | | | | | | | | | | | | |
IA | | $ | 19.74 | | | $ | (0.07 | ) | | $ | 8.60 | | | $ | 8.53 | | | $ | (0.02 | ) | | $ | (1.82 | ) | | $ | (1.84 | ) | | $ | 26.43 | | | | 44.38 | % | | $ | 1,354,821 | | | | 0.71 | % | | | 0.71 | % | | | (0.29 | )% | | | 96 | % |
IB | | | 19.06 | | | | (0.12 | ) | | | 8.34 | | | | 8.22 | | | | — | | | | (1.82 | ) | | | (1.82 | ) | | | 25.46 | | | | 44.28 | | | | 141,791 | | | | 0.96 | | | | 0.96 | | | | (0.54 | ) | | | 96 | |
| | | | | | | | | |
For the Year Ended December 31, 2012(4) | | | | | | | | | | | | | | | | | | | | | | | | | | | | | | | | | | | | | |
IA | | $ | 17.07 | | | $ | 0.03 | | | $ | 2.64 | | | $ | 2.67 | | | $ | — | | | $ | — | | | $ | — | | | $ | 19.74 | | | | 15.64 | % | | $ | 1,126,350 | | | | 0.72 | % | | | 0.72 | % | | | 0.16 | % | | | 110 | % |
IB | | | 16.56 | | | | (0.03 | ) | | | 2.53 | | | | 2.50 | | | | — | | | | — | | | | — | | | | 19.06 | | | | 15.10 | | | | 117,133 | | | | 0.97 | | | | 0.97 | | | | (0.13 | ) | | | 110 | |
| | | | | | | | | |
For the Year Ended December 31, 2011(4) | | | | | | | | | | | | | | | | | | | | | | | | | | | | | | | | | | | | | |
IA | | $ | 17.66 | | | $ | (0.02 | ) | | $ | (0.57 | ) | | $ | (0.59 | ) | | $ | — | | | $ | — | | | $ | — | | | $ | 17.07 | | | | (3.36 | )% | | $ | 1,090,883 | | | | 0.71 | % | | | 0.71 | % | | | (0.13 | )% | | | 99 | % |
IB | | | 17.18 | | | | (0.09 | ) | | | (0.53 | ) | | | (0.62 | ) | | | — | | | | — | | | | — | | | | 16.56 | | | | (3.62 | ) | | | 155,970 | | | | 0.96 | | | | 0.96 | | | | (0.38 | ) | | | 99 | |
The accompanying notes are an integral part of these financial statements.
Financial Highlights – (continued)
| | | | | | | | | | | | | | | | | | | | | | | | | | | | | | | | | | | | | | | | | | | | | | | | | | | | | | | | |
| | | — Selected Per-Share Data(1) — | | | — Ratios and Supplemental Data — | |
Class | | Net Asset
Value at
Beginning
of Period | | | Net
Investment
Income
(Loss) | | | Net
Realized
and
Unrealized
Gain (Loss)
on
Investments | | | Total from
Investment
Operations | | | Dividends
from Net
Investment
Income | | | Distributions
from
Realized
Gains | | | Total
Dividends
and
Distributions | | | Net
Asset
Value at
End of
Period | | | Total
Return(2) | | | Net
Assets at
End of
Period
(000s) | | | Ratio of
Expenses
to
Average
Net
Assets
Before
Adjust-
ments(3) | | | Ratio of
Expenses
to
Average
Net
Assets
After
Adjust-
ments(3) | | | Ratio of
Net
Investment
Income
(Loss) to
Average
Net Assets | | | Portfolio
Turnover | |
| Hartford Small/Mid Cap Equity HLS Fund | | | | | | | | | | | | | | | | | | | | | | | | | | | | | | | | | | | | | |
For the Year Ended December 31, 2015 | | | | | | | | | | | | | | | | | | | | | | | | | | | | | | | | | | | | | |
IA | | $ | 9.47 | | | $ | 0.12 | | | $ | (0.46 | ) | | $ | (0.34 | ) | | $ | (0.12 | ) | | $ | (1.56 | ) | | $ | (1.68 | ) | | $ | 7.45 | | | | (4.73 | )% | | $ | 79,379 | | | | 0.88 | % | | | 0.88 | % | | | 1.39 | % | | | 80 | % |
IB | | | 9.41 | | | | 0.10 | | | | (0.46 | ) | | | (0.36 | ) | | | (0.09 | ) | | | (1.56 | ) | | | (1.65 | ) | | | 7.40 | | | | (4.97 | ) | | | 16,501 | | | | 1.13 | | | | 1.13 | | | | 1.12 | | | | 80 | |
| | | | | | | | | |
For the Year Ended December 31, 2014 | | | | | | | | | | | | | | | | | | | | | | | | | | | | | | | | | | | | | |
IA | | $ | 11.29 | | | $ | 0.13 | | | $ | 0.43 | | | $ | 0.56 | | | $ | (0.18 | ) | | $ | (2.20 | ) | | $ | (2.38 | ) | | $ | 9.47 | | | | 5.22 | % | | $ | 98,069 | | | | 0.85 | % | | | 0.85 | % | | | 1.20 | % | | | 108 | % |
IB | | | 11.22 | | | | 0.10 | | | | 0.44 | | | | 0.54 | | | | (0.15 | ) | | | (2.20 | ) | | | (2.35 | ) | | | 9.41 | | | | 5.00 | | | | 23,239 | | | | 1.10 | | | | 1.10 | | | | 0.96 | | | | 108 | |
| | | | | | | | | |
For the Year Ended December 31, 2013 | | | | | | | | | | | | | | | | | | | | | | | | | | | | | | | | | | | | | |
IA | | $ | 8.90 | | | $ | 0.16 | | | $ | 3.08 | | | $ | 3.24 | | | $ | (0.14 | ) | | $ | (0.71 | ) | | $ | (0.85 | ) | | $ | 11.29 | | | | 37.51 | % | | $ | 117,395 | | | | 0.85 | % | | | 0.85 | % | | | 1.58 | % | | | 128 | % |
IB | | | 8.85 | | | | 0.13 | | | | 3.07 | | | | 3.20 | | | | (0.12 | ) | | | (0.71 | ) | | | (0.83 | ) | | | 11.22 | | | | 37.08 | | | | 26,362 | | | | 1.10 | | | | 1.10 | | | | 1.32 | | | | 128 | |
| | | | | | | | | |
For the Year Ended December 31, 2012(4) | | | | | | | | | | | | | | | | | | | | | | | | | | | | | | | | | | | | | |
IA | | $ | 8.93 | | | $ | 0.15 | | | $ | 1.21 | | | $ | 1.36 | | | $ | (0.06 | ) | | $ | (1.33 | ) | | $ | (1.39 | ) | | $ | 8.90 | | | | 15.87 | % | | $ | 106,339 | | | | 0.88 | % | | | 0.88 | % | | | 1.57 | % | | | 150 | % |
IB | | | 8.88 | | | | 0.13 | | | | 1.20 | | | | 1.33 | | | | (0.03 | ) | | | (1.33 | ) | | | (1.36 | ) | | | 8.85 | | | | 15.58 | | | | 24,774 | | | | 1.13 | | | | 1.13 | | | | 1.26 | | | | 150 | |
| | | | | | | | | |
For the Year Ended December 31, 2011(4) | | | | | | | | | | | | | | | | | | | | | | | | | | | | | | | | | | | | | |
IA | | $ | 9.85 | | | $ | 0.06 | | | $ | (0.23 | ) | | $ | (0.17 | ) | | $ | — | | | $ | (0.75 | ) | | $ | (0.75 | ) | | $ | 8.93 | | | | (1.13 | )% | | $ | 107,762 | | | | 0.87 | % | | | 0.87 | % | | | 0.60 | % | | | 196 | % |
IB | | | 9.83 | | | | 0.04 | | | | (0.24 | ) | | | (0.20 | ) | | | — | | | | (0.75 | ) | | | (0.75 | ) | | | 8.88 | | | | (1.38 | ) | | | 28,441 | | | | 1.12 | | | | 1.12 | | | | 0.34 | | | | 196 | |
| | | | | | | | | |
| Hartford SmallCap Growth HLS Fund | | | | | | | | | | | | | | | | | | | | | | | | | | | | | | | | | | | | | |
For the Year Ended December 31, 2015 | | | | | | | | | | | | | | | | | | | | | | | | | | | | | | | | | | | | | |
IA | | $ | 27.95 | | | $ | 0.07 | | | $ | (0.02 | ) | | $ | 0.05 | | | $ | (0.02 | ) | | $ | (3.05 | ) | | $ | (3.07 | ) | | $ | 24.93 | | | | (0.55 | )% | | $ | 913,414 | | | | 0.65 | % | | | 0.65 | % | | | 0.25 | % | | | 59 | % |
IB | | | 27.44 | | | | (0.01 | ) | | | — | | | | (0.01 | ) | | | — | | | | (3.05 | ) | | | (3.05 | ) | | | 24.38 | | | | (0.79 | ) | | | 209,948 | | | | 0.90 | | | | 0.90 | | | | (0.03 | ) | | | 59 | |
| | | | | | | | | |
For the Year Ended December 31, 2014 | | | | | | | | | | | | | | | | | | | | | | | | | | | | | | | | | | | | | |
IA | | $ | 32.60 | | | $ | 0.06 | | | $ | 1.48 | | | $ | 1.54 | | | $ | (0.02 | ) | | $ | (6.17 | ) | | $ | (6.19 | ) | | $ | 27.95 | | | | 5.83 | % | | $ | 557,200 | | | | 0.65 | % | | | 0.65 | % | | | 0.19 | % | | | 117 | % |
IB | | | 32.17 | | | | (0.02 | ) | | | 1.46 | | | | 1.44 | | | | — | | | | (6.17 | ) | | | (6.17 | ) | | | 27.44 | | | | 5.57 | | | | 115,230 | | | | 0.90 | | | | 0.90 | | | | (0.06 | ) | | | 117 | |
| | | | | | | | | |
For the Year Ended December 31, 2013 | | | | | | | | | | | | | | | | | | | | | | | | | | | | | | | | | | | | | |
IA | | $ | 25.44 | | | $ | 0.05 | | | $ | 10.92 | | | $ | 10.97 | | | $ | (0.12 | ) | | $ | (3.69 | ) | | $ | (3.81 | ) | | $ | 32.60 | | | | 44.87 | % | | $ | 466,173 | | | | 0.67 | % | | | 0.67 | % | | | 0.16 | % | | | 81 | % |
IB | | | 25.14 | | | | (0.02 | ) | | | 10.77 | | | | 10.75 | | | | (0.03 | ) | | | (3.69 | ) | | | (3.72 | ) | | | 32.17 | | | | 44.50 | | | | 123,966 | | | | 0.92 | | | | 0.92 | | | | (0.08 | ) | | | 81 | |
| | | | | | | | | |
For the Year Ended December 31, 2012(4) | | | | | | | | | | | | | | | | | | | | | | | | | | | | | | | | | | | | | |
IA | | $ | 21.67 | | | $ | 0.11 | | | $ | 3.66 | | | $ | 3.77 | | | $ | — | | | $ | — | | | $ | — | | | $ | 25.44 | | | | 17.40 | % | | $ | 378,318 | | | | 0.67 | % | | | 0.67 | % | | | 0.41 | % | | | 85 | % |
IB | | | 21.47 | | | | 0.04 | | | | 3.63 | | | | 3.67 | | | | — | | | | — | | | | — | | | | 25.14 | | | | 17.10 | | | | 134,404 | | | | 0.92 | | | | 0.92 | | | | 0.16 | | | | 85 | |
| | | | | | | | | |
For the Year Ended December 31, 2011(4) | | | | | | | | | | | | | | | | | | | | | | | | | | | | | | | | | | | | | |
IA | | $ | 21.37 | | | $ | (0.02 | ) | | $ | 0.32 | | | $ | 0.30 | | | $ | — | | | $ | — | | | $ | — | | | $ | 21.67 | | | | 1.42 | % | | $ | 397,662 | | | | 0.67 | % | | | 0.67 | % | | | (0.07 | )% | | | 62 | % |
IB | | | 21.22 | | | | (0.07 | ) | | | 0.32 | | | | 0.25 | | | | — | | | | — | | | | — | | | | 21.47 | | | | 1.17 | | | | 144,022 | | | | 0.92 | | | | 0.92 | | | | (0.32 | ) | | | 62 | |
The accompanying notes are an integral part of these financial statements.
Financial Highlights – (continued)
| | | | | | | | | | | | | | | | | | | | | | | | | | | | | | | | | | | | | | | | | | | | | | | | | | | | | | | | |
| | | — Selected Per-Share Data(1) — | | | — Ratios and Supplemental Data — | |
Class | | Net Asset
Value at
Beginning
of Period | | | Net
Investment
Income
(Loss) | | | Net
Realized
and
Unrealized
Gain (Loss)
on
Investments | | | Total from
Investment
Operations | | | Dividends
from Net
Investment
Income | | | Distributions
from
Realized
Gains | | | Total
Dividends
and
Distributions | | | Net
Asset
Value at
End of
Period | | | Total
Return(2) | | | Net
Assets at
End of
Period
(000s) | | | Ratio of
Expenses
to
Average
Net
Assets
Before
Adjust-
ments(3) | | | Ratio of
Expenses
to
Average
Net
Assets
After
Adjust-
ments(3) | | | Ratio of
Net
Investment
Income
(Loss) to
Average
Net Assets | | | Portfolio
Turnover | |
| Hartford Stock HLS Fund | | | | | | | | | | | | | | | | | | | | | | | | | | | | | | | | | | | | | |
For the Year Ended December 31, 2015 | | | | | | | | | | | | | | | | | | | | | | | | | | | | | | | | | | | | | |
IA | | $ | 63.49 | | | $ | 1.19 | | | $ | 0.56 | | | $ | 1.75 | | | $ | (1.18 | ) | | $ | — | | | $ | (1.18 | ) | | $ | 64.06 | | | | 2.74 | % | | $ | 1,388,110 | | | | 0.51 | % | | | 0.51 | % | | | 1.86 | % | | | 23 | % |
IB | | | 63.46 | | | | 1.03 | | | | 0.54 | | | | 1.57 | | | | (1.00 | ) | | | — | | | | (1.00 | ) | | | 64.03 | | | | 2.48 | | | | 155,722 | | | | 0.76 | | | | 0.76 | | | | 1.61 | | | | 23 | |
| | | | | | | | | |
For the Year Ended December 31, 2014 | | | | | | | | | | | | | | | | | | | | | | | | | | | | | | | | | | | | | |
IA | | $ | 58.07 | | | $ | 1.07 | | | $ | 5.51 | | | $ | 6.58 | | | $ | (1.16 | ) | | $ | — | | | $ | (1.16 | ) | | $ | 63.49 | | | | 11.31 | % | | $ | 1,552,777 | | | | 0.50 | % | | | 0.50 | % | | | 1.79 | % | | | 20 | % |
IB | | | 58.04 | | | | 0.92 | | | | 5.50 | | | | 6.42 | | | | (1.00 | ) | | | — | | | | (1.00 | ) | | | 63.46 | | | | 11.04 | | | | 182,112 | | | | 0.75 | | | | 0.75 | | | | 1.54 | | | | 20 | |
| | | | | | | | | |
For the Year Ended December 31, 2013 | | | | | | | | | | | | | | | | | | | | | | | | | | | | | | | | | | | | | |
IA | | $ | 44.73 | | | $ | 0.99 | | | $ | 13.41 | | | $ | 14.40 | | | $ | (1.06 | ) | | $ | — | | | $ | (1.06 | ) | | $ | 58.07 | | | | 32.25 | % | | $ | 1,667,278 | | | | 0.51 | % | | | 0.51 | % | | | 1.89 | % | | | 27 | % |
IB | | | 44.71 | | | | 0.85 | | | | 13.40 | | | | 14.25 | | | | (0.92 | ) | | | — | | | | (0.92 | ) | | | 58.04 | | | | 31.92 | | | | 204,437 | | | | 0.76 | | | | 0.76 | | | | 1.64 | | | | 27 | |
| | | | | | | | | |
For the Year Ended December 31, 2012(4) | | | | | | | | | | | | | | | | | | | | | | | | | | | | | | | | | | | | | |
IA | | $ | 39.95 | | | $ | 0.91 | | | $ | 4.83 | | | $ | 5.74 | | | $ | (0.96 | ) | | $ | — | | | $ | (0.96 | ) | | $ | 44.73 | | | | 14.38 | % | | $ | 1,532,116 | | | | 0.51 | % | | | 0.51 | % | | | 1.86 | % | | | 82 | % |
IB | | | 39.92 | | | | 0.82 | | | | 4.81 | | | | 5.63 | | | | (0.84 | ) | | | — | | | | (0.84 | ) | | | 44.71 | | | | 14.10 | | | | 200,153 | | | | 0.76 | | | | 0.76 | | | | 1.61 | | | | 82 | |
| | | | | | | | | |
For the Year Ended December 31, 2011(4) | | | | | | | | | | | | | | | | | | | | | | | | | | | | | | | | | | | | | |
IA | | $ | 40.98 | | | $ | 0.62 | | | $ | (1.07 | ) | | $ | (0.45 | ) | | $ | (0.58 | ) | | $ | — | | | $ | (0.58 | ) | | $ | 39.95 | | | | (1.09 | )% | | $ | 1,614,788 | | | | 0.50 | % | | | 0.50 | % | | | 1.37 | % | | | 43 | % |
IB | | | 40.94 | | | | 0.51 | | | | (1.06 | ) | | | (0.55 | ) | | | (0.47 | ) | | | — | | | | (0.47 | ) | | | 39.92 | | | | (1.34 | ) | | | 231,377 | | | | 0.75 | | | | 0.75 | | | | 1.11 | | | | 43 | |
| | | | | | | | | |
| Hartford Total Return Bond HLS Fund | | | | | | | | | | | | | | | | | | | | | | | | | | | | | | | | | | | | | |
For the Year Ended December 31, 2015 | | | | | | | | | | | | | | | | | | | | | | | | | | | | | | | | | | | | | |
IA | | $ | 11.63 | | | $ | 0.33 | | | $ | (0.39 | ) | | $ | (0.06 | ) | | $ | (0.36 | ) | | $ | (0.28 | ) | | $ | (0.64 | ) | | $ | 10.93 | | | | (0.59 | )% | | $ | 2,448,280 | | | | 0.51 | % | | | 0.51 | % | | | 2.88 | % | | | 66 | % |
IB | | | 11.56 | | | | 0.30 | | | | (0.39 | ) | | | (0.09 | ) | | | (0.32 | ) | | | (0.28 | ) | | | (0.60 | ) | | | 10.87 | | | | (0.81 | ) | | | 295,006 | | | | 0.76 | | | | 0.76 | | | | 2.63 | | | | 66 | |
| | | | | | | | | |
For the Year Ended December 31, 2014 | | | | | | | | | | | | | | | | | | | | | | | | | | | | | | | | | | | | | |
IA | | $ | 11.35 | | | $ | 0.33 | | | $ | 0.34 | | | $ | 0.67 | | | $ | (0.39 | ) | | $ | — | | | $ | (0.39 | ) | | $ | 11.63 | | | | 5.89 | % | | $ | 2,879,633 | | | | 0.50 | % | | | 0.50 | % | | | 2.85 | % | | | 84 | % |
IB | | | 11.27 | | | | 0.30 | | | | 0.34 | | | | 0.64 | | | | (0.35 | ) | | | — | | | | (0.35 | ) | | | 11.56 | | | | 5.68 | | | | 360,006 | | | | 0.75 | | | | 0.75 | | | | 2.60 | | | | 84 | |
| | | | | | | | | |
For the Year Ended December 31, 2013 | | | | | | | | | | | | | | | | | | | | | | | | | | | | | | | | | | | | | |
IA | | $ | 11.99 | | | $ | 0.32 | | | $ | (0.49 | ) | | $ | (0.17 | ) | | $ | (0.47 | ) | | $ | — | | | $ | (0.47 | ) | | $ | 11.35 | | | | (1.36 | )% | | $ | 3,290,622 | | | | 0.50 | % | | | 0.50 | % | | | 2.76 | % | | | 81 | % |
IB | | | 11.91 | | | | 0.29 | | | | (0.50 | ) | | | (0.21 | ) | | | (0.43 | ) | | | — | | | | (0.43 | ) | | | 11.27 | | | | (1.66 | ) | | | 414,910 | | | | 0.75 | | | | 0.75 | | | | 2.51 | | | | 81 | |
| | | | | | | | | |
For the Year Ended December 31, 2012(4) | | | | | | | | | | | | | | | | | | | | | | | | | | | | | | | | | | | | | |
IA | | $ | 11.63 | | | $ | 0.41 | | | $ | 0.45 | | | $ | 0.86 | | | $ | (0.50 | ) | | $ | — | | | $ | (0.50 | ) | | $ | 11.99 | | | | 7.54 | % | | $ | 3,572,511 | | | | 0.50 | % | | | 0.50 | % | | | 3.01 | % | | | 88 | % |
IB | | | 11.55 | | | | 0.40 | | | | 0.43 | | | | 0.83 | | | | (0.47 | ) | | | — | | | | (0.47 | ) | | | 11.91 | | | | 7.27 | | | | 566,274 | | | | 0.75 | | | | 0.75 | | | | 2.76 | | | | 88 | |
| | | | | | | | | |
For the Year Ended December 31, 2011(4) | | | | | | | | | | | | | | | | | | | | | | | | | | | | | | | | | | | | | |
IA | | $ | 10.90 | | | $ | 0.44 | | | $ | 0.31 | | | $ | 0.75 | | | $ | (0.02 | ) | | $ | — | | | $ | (0.02 | ) | | $ | 11.63 | | | | 6.99 | % | | $ | 3,718,609 | | | | 0.49 | % | | | 0.49 | % | | | 3.60 | % | | | 107 | % |
IB | | | 10.84 | | | | 0.42 | | | | 0.31 | | | | 0.73 | | | | (0.02 | ) | | | — | | | | (0.02 | ) | | | 11.55 | | | | 6.72 | | | | 632,685 | | | | 0.74 | | | | 0.74 | | | | 3.35 | | | | 107 | |
The accompanying notes are an integral part of these financial statements.
Financial Highlights – (continued)
| | | | | | | | | | | | | | | | | | | | | | | | | | | | | | | | | | | | | | | | | | | | | | | | | | | | | | | | |
| | | — Selected Per-Share Data(1) — | | | — Ratios and Supplemental Data — | |
Class | | Net Asset
Value at
Beginning
of Period | | | Net
Investment
Income
(Loss) | | | Net
Realized
and
Unrealized
Gain (Loss)
on
Investments | | | Total from
Investment
Operations | | | Dividends
from Net
Investment
Income | | | Distributions
from
Realized
Gains | | | Total
Dividends
and
Distributions | | | Net
Asset
Value at
End of
Period | | | Total
Return(2) | | | Net
Assets at
End of
Period
(000s) | | | Ratio of
Expenses
to
Average
Net
Assets
Before
Adjust-
ments(3) | | | Ratio of
Expenses
to
Average
Net
Assets
After
Adjust-
ments(3) | | | Ratio of
Net
Investment
Income
(Loss) to
Average
Net Assets | | | Portfolio
Turnover | |
| Hartford Ultrashort Bond HLS Fund | | | | | | | | | | | | | | | | | | | | | | | | | | | | | | | | | | | | | |
For the Year Ended December 31, 2015 | | | | | | | | | | | | | | | | | | | | | | | | | | | | | | | | | | | | | |
IA | | $ | 10.01 | | | $ | 0.03 | | | $ | (0.02 | ) | | $ | 0.01 | | | $ | (0.03 | ) | | $ | — | | | $ | (0.03 | ) | | $ | 9.99 | | | | 0.13 | % | | $ | 611,087 | | | | 0.43 | % | | | 0.43 | % | | | 0.33 | % | | | 35 | % |
IB | | | 9.98 | | | | 0.01 | | | | (0.02 | ) | | | (0.01 | ) | | | — | | | | — | | | | — | | | | 9.97 | | | | (0.09 | ) | | | 96,970 | | | | 0.68 | | | | 0.68 | | | | 0.08 | | | | 35 | |
| | | | | | | | | |
For the Year Ended December 31, 2014 | | | | | | | | | | | | | | | | | | | | | | | | | | | | | | | | | | | | | |
IA | | $ | 10.00 | | | $ | 0.02 | | | $ | (0.01 | ) | | $ | 0.01 | | | $ | — | | | $ | — | | | $ | — | | | $ | 10.01 | | | | 0.10 | % | | $ | 745,597 | | | | 0.43 | % | | | 0.43 | % | | | 0.23 | % | | | 40 | % |
IB | | | 9.99 | | | | — | | | | (0.01 | ) | | | (0.01 | ) | | | — | | | | — | | | | — | | | | 9.98 | | | | (0.10 | ) | | | 121,168 | | | | 0.68 | | | | 0.68 | | | | (0.02 | ) | | | 40 | |
| | | | | | | | | |
For the Year Ended December 31, 2013(4)(10) | | | | | | | | | | | | | | | | | | | | | | | | | | | | | | | | | | | | | |
IA | | $ | 10.00 | | | $ | — | | | $ | — | | | $ | — | | | $ | — | | | $ | — | | | $ | — | | | $ | 10.00 | | | | — | % | | $ | 1,013,110 | | | | 0.45 | % | | | 0.21 | % | | | (0.02 | )% | | | 6 | %(11) |
IB | | | 10.00 | | | | (0.01 | ) | | | — | | | | (0.01 | ) | | | — | | | | — | | | | — | | | | 9.99 | | | | (0.10 | ) | | | 163,058 | | | | 0.49 | | | | 0.25 | | | | (0.06 | ) | | | 6 | (11) |
| | | | | | | | | |
For the Year Ended December 31, 2012(4)(10) | | | | | | | | | | | | | | | | | | | | | | | | | | | | | | | | | | | | | |
IA | | $ | 10.00 | | | $ | — | | | $ | — | | | $ | — | | | $ | — | | | $ | — | | | $ | — | | | $ | 10.00 | | | | — | % | | $ | 1,603,657 | | | | 0.42 | % | | | 0.18 | % | | | — | % | | | — | %(12) |
IB | | | 10.00 | | | | — | | | | — | | | | — | | | | — | | | | — | | | | — | | | | 10.00 | | | | — | | | | 272,464 | | | | 0.42 | | | | 0.18 | | | | — | | | | — | (12) |
| | | | | | | | | |
For the Year Ended December 31, 2011(4)(10) | | | | | | | | | | | | | | | | | | | | | | | | | | | | | | | | | | | | | |
IA | | $ | 10.00 | | | $ | — | | | $ | — | | | $ | — | | | $ | — | | | $ | — | | | $ | — | | | $ | 10.00 | | | | — | % | | $ | 1,970,312 | | | | 0.42 | % | | | 0.16 | % | | | — | % | | | — | %(12) |
IB | | | 10.00 | | | | — | | | | — | | | | — | | | | — | | | | — | | | | — | | | | 10.00 | | | | — | | | | 376,648 | | | | 0.42 | | | | 0.16 | | | | — | | | | — | (12) |
| | | | | | | | | |
| Hartford U.S. Government Securities HLS Fund | | | | | | | | | | | | | | | | | | | | | | | | | | | | | | | | | | | | | |
For the Year Ended December 31, 2015 | | | | | | | | | | | | | | | | | | | | | | | | | | | | | | | | | | | | | |
IA | | $ | 10.37 | | | $ | 0.16 | | | $ | — | | | $ | 0.16 | | | $ | (0.19 | ) | | $ | — | | | $ | (0.19 | ) | | $ | 10.34 | | | | 1.56 | % | | $ | 412,060 | | | | 0.49 | % | | | 0.49 | % | | | 1.53 | % | | | 42 | % |
IB | | | 10.34 | | | | 0.13 | | | | 0.01 | | | | 0.14 | | | | (0.16 | ) | | | — | | | | (0.16 | ) | | | 10.32 | | | | 1.35 | | | | 90,088 | | | | 0.74 | | | | 0.74 | | | | 1.28 | | | | 42 | |
| | | | | | | | | |
For the Year Ended December 31, 2014 | | | | | | | | | | | | | | | | | | | | | | | | | | | | | | | | | | | | | |
IA | | $ | 10.32 | | | $ | 0.15 | | | $ | 0.14 | | | $ | 0.29 | | | $ | (0.24 | ) | | $ | — | | | $ | (0.24 | ) | | $ | 10.37 | | | | 2.81 | % | | $ | 468,967 | | | | 0.48 | % | | | 0.48 | % | | | 1.40 | % | | | 37 | % |
IB | | | 10.28 | | | | 0.12 | | | | 0.15 | | | | 0.27 | | | | (0.21 | ) | | | — | | | | (0.21 | ) | | | 10.34 | | | | 2.59 | | | | 102,235 | | | | 0.73 | | | | 0.73 | | | | 1.15 | | | | 37 | |
| | | | | | | | | |
For the Year Ended December 31, 2013 | | | | | | | | | | | | | | | | | | | | | | | | | | | | | | | | | | | | | |
IA | | $ | 10.75 | | | $ | 0.12 | | | $ | (0.30 | ) | | $ | (0.18 | ) | | $ | (0.25 | ) | | $ | — | | | $ | (0.25 | ) | | $ | 10.32 | | | | (1.68 | )% | | $ | 556,169 | | | | 0.49 | % | | | 0.49 | % | | | 1.14 | % | | | 39 | % |
IB | | | 10.71 | | | | 0.09 | | | | (0.30 | ) | | | (0.21 | ) | | | (0.22 | ) | | | — | | | | (0.22 | ) | | | 10.28 | | | | (1.97 | ) | | | 123,908 | | | | 0.74 | | | | 0.74 | | | | 0.89 | | | | 39 | |
| | | | | | | | | |
For the Year Ended December 31, 2012(4) | | | | | | | | | | | | | | | | | | | | | | | | | | | | | | | | | | | | | |
IA | | $ | 10.68 | | | $ | 0.16 | | | $ | 0.22 | | | $ | 0.38 | | | $ | (0.31 | ) | | $ | — | | | $ | (0.31 | ) | | $ | 10.75 | | | | 3.70 | % | | $ | 833,735 | | | | 0.48 | % | | | 0.48 | % | | | 1.20 | % | | | 86 | % |
IB | | | 10.63 | | | | 0.13 | | | | 0.23 | | | | 0.36 | | | | (0.28 | ) | | | — | | | | (0.28 | ) | | | 10.71 | | | | 3.44 | | | | 173,937 | | | | 0.73 | | | | 0.73 | | | | 0.95 | | | | 86 | |
| | | | | | | | | |
For the Year Ended December 31, 2011(4) | | | | | | | | | | | | | | | | | | | | | | | | | | | | | | | | | | | | | |
IA | | $ | 10.46 | | | $ | 0.21 | | | $ | 0.30 | | | $ | 0.51 | | | $ | (0.29 | ) | | $ | — | | | $ | (0.29 | ) | | $ | 10.68 | | | | 4.87 | % | | $ | 907,046 | | | | 0.48 | % | | | 0.48 | % | | | 1.61 | % | | | 426 | % |
IB | | | 10.40 | | | | 0.19 | | | | 0.29 | | | | 0.48 | | | | (0.25 | ) | | | — | | | | (0.25 | ) | | | 10.63 | | | | 4.61 | | | | 194,273 | | | | 0.73 | | | | 0.73 | | | | 1.36 | | | | 426 | |
The accompanying notes are an integral part of these financial statements.
Financial Highlights – (continued)
| | | | | | | | | | | | | | | | | | | | | | | | | | | | | | | | | | | | | | | | | | | | | | | | | | | | | | | | |
| | | — Selected Per-Share Data(1) — | | | — Ratios and Supplemental Data — | |
Class | | Net Asset
Value at
Beginning
of Period | | | Net
Investment
Income
(Loss) | | | Net
Realized
and
Unrealized
Gain (Loss)
on
Investments | | | Total from
Investment
Operations | | | Dividends
from Net
Investment
Income | | | Distributions
from
Realized
Gains | | | Total
Dividends
and
Distributions | | | Net
Asset
Value at
End of
Period | | | Total
Return(2) | | | Net
Assets at
End of
Period
(000s) | | | Ratio of
Expenses
to
Average
Net
Assets
Before
Adjust-
ments(3) | | | Ratio of
Expenses
to
Average
Net
Assets
After
Adjust-
ments(3) | | | Ratio of
Net
Investment
Income
(Loss) to
Average
Net Assets | | | Portfolio
Turnover | |
| Hartford Value HLS Fund | | | | | | | | | | | | | | | | | | | | | | | | | | | | | | | | | | | | | |
For the Year Ended December 31, 2015 | | | | | | | | | | | | | | | | | | | | | | | | | | | | | | | | | | | | | |
IA | | $ | 16.89 | | | $ | 0.26 | | | $ | (0.77 | ) | | $ | (0.51 | ) | | $ | (0.26 | ) | | $ | (0.54 | ) | | $ | (0.80 | ) | | $ | 15.58 | | | | (3.08 | )% | | $ | 455,713 | | | | 0.78 | % | | | 0.78 | % | | | 1.56 | % | | | 19 | % |
IB | | | 16.88 | | | | 0.22 | | | | (0.77 | ) | | | (0.55 | ) | | | (0.22 | ) | | | (0.54 | ) | | | (0.76 | ) | | | 15.57 | | | | (3.35 | ) | | | 80,052 | | | | 1.03 | | | | 1.03 | | | | 1.30 | | | | 19 | |
| | | | | | | | | |
For the Year Ended December 31, 2014 | | | | | | | | | | | | | | | | | | | | | | | | | | | | | | | | | | | | | |
IA | | $ | 15.39 | | | $ | 0.24 | | | $ | 1.51 | | | $ | 1.75 | | | $ | (0.25 | ) | | $ | — | | | $ | (0.25 | ) | | $ | 16.89 | | | | 11.37 | % | | $ | 523,661 | | | | 0.77 | % | | | 0.77 | % | | | 1.51 | % | | | 14 | % |
IB | | | 15.38 | | | | 0.20 | | | | 1.51 | | | | 1.71 | | | | (0.21 | ) | | | — | | | | (0.21 | ) | | | 16.88 | | | | 11.10 | | | | 98,407 | | | | 1.02 | | | | 1.02 | | | | 1.26 | | | | 14 | |
| | | | | | | | | |
For the Year Ended December 31, 2013 | | | | | | | | | | | | | | | | | | | | | | | | | | | | | | | | | | | | | |
IA | | $ | 11.86 | | | $ | 0.23 | | | $ | 3.55 | | | $ | 3.78 | | | $ | (0.25 | ) | | $ | — | | | $ | (0.25 | ) | | $ | 15.39 | | | | 31.94 | % | | $ | 551,350 | | | | 0.76 | % | | | 0.76 | % | | | 1.66 | % | | | 19 | % |
IB | | | 11.85 | | | | 0.20 | | | | 3.54 | | | | 3.74 | | | | (0.21 | ) | | | — | | | | (0.21 | ) | | | 15.38 | | | | 31.65 | | | | 109,081 | | | | 1.01 | | | | 1.01 | | | | 1.41 | | | | 19 | |
| | | | | | | | | |
For the Year Ended December 31, 2012(4) | | | | | | | | | | | | | | | | | | | | | | | | | | | | | | | | | | | | | |
IA | | $ | 10.37 | | | $ | 0.26 | | | $ | 1.50 | | | $ | 1.76 | | | $ | (0.27 | ) | | $ | — | | | $ | (0.27 | ) | | $ | 11.86 | | | | 16.99 | % | | $ | 549,228 | | | | 0.76 | % | | | 0.76 | % | | | 2.02 | % | | | 22 | % |
IB | | | 10.36 | | | | 0.23 | | | | 1.50 | | | | 1.73 | | | | (0.24 | ) | | | — | | | | (0.24 | ) | | | 11.85 | | | | 16.69 | | | | 103,438 | | | | 1.01 | | | | 1.01 | | | | 1.77 | | | | 22 | |
| | | | | | | | | |
For the Year Ended December 31, 2011(4) | | | | | | | | | | | | | | | | | | | | | | | | | | | | | | | | | | | | | |
IA | | $ | 10.77 | | | $ | 0.20 | | | $ | (0.41 | ) | | $ | (0.21 | ) | | $ | (0.19 | ) | | $ | — | | | $ | (0.19 | ) | | $ | 10.37 | | | | (1.96 | )% | | $ | 591,278 | | | | 0.75 | % | | | 0.75 | % | | | 1.65 | % | | | 16 | % |
IB | | | 10.76 | | | | 0.17 | | | | (0.41 | ) | | | (0.24 | ) | | | (0.16 | ) | | | — | | | | (0.16 | ) | | | 10.36 | | | | (2.20 | ) | | | 111,486 | | | | 1.00 | | | | 1.00 | | | | 1.40 | | | | 16 | |
| (1) | Information presented relates to a share outstanding throughout the indicated period. Net investment income (loss) per share amounts are calculated based on average shares outstanding unless otherwise noted. |
| (2) | The figures do not include sales charges or other fees which may be applied at the variable life insurance, variable annuity or qualified retirement plan product level. Any such additional sales charges or other fees would lower the Fund’s performance. |
| (3) | Adjustments include waivers and reimbursements, if applicable. Ratios do not include fees paid indirectly (see Expenses in the accompanying Notes to Financial Statements). |
| (4) | Net investment income (loss) per share amounts have been calculated using the Securities and Exchange Commission method. |
| (5) | Commenced operations on April 30, 2014. |
| (8) | During the year ended December 31, 2014, the Fund incurred $61.8 million in sales associated with the transition of assets from The Hartford Global Research HLS Fund, which merged into the Fund on June 23, 2014. These sales were excluded from the portfolio turnover rate calculation. |
| (9) | During the year ended December 31, 2014, the Fund incurred $137.9 million in sales associated with the transition of assets from Hartford International Growth HLS Fund, which merged into the Fund on June 23, 2014. These sales were excluded from the portfolio turnover rate calculation. |
| (10) | Per share amounts have been restated to reflect a reverse stock split effective October 21, 2013. Please see Notes to Financial Statements. |
| (11) | Portfolio turnover shown is from October 21, 2013 (conversion date) through December 31, 2013. |
| (12) | The Fund was managed as a money market fund and portfolio turnover was not calculated. |
The accompanying notes are an integral part of these financial statements.
Notes to Financial Statements
December 31, 2015
Hartford Series Fund, Inc. and Hartford HLS Series Fund II, Inc. (collectively, the “Companies” and each, a “Company”) are each an open-end registered management investment company comprised of fifteen and four series, respectively, as of December 31, 2015. Each Company is organized under the laws of the State of Maryland and is registered with the Securities and Exchange Commission (“SEC”) under the Investment Company Act of 1940, as amended (the “1940 Act”). The assets of each Fund are separate, and a shareholder’s interest is limited to the Fund in which shares are held. Financial statements for each series of each Company (individually, a “Fund” and collectively, the “Funds”) listed below, are included in this report.
Hartford Series Fund, Inc.:
Hartford Balanced HLS Fund (the “Balanced HLS Fund”)
Hartford Capital Appreciation HLS Fund (the “Capital Appreciation HLS Fund”)
Hartford Disciplined Equity HLS Fund (the “Disciplined Equity HLS Fund”)
Hartford Dividend and Growth HLS Fund (the “Dividend and Growth HLS Fund”)
Hartford Global Growth HLS Fund (the “Global Growth HLS Fund”)
Hartford Healthcare HLS Fund (the “Healthcare HLS Fund”)
Hartford High Yield HLS Fund (the “High Yield HLS Fund”)
Hartford International Opportunities HLS Fund (the “International Opportunities HLS Fund”)
Hartford MidCap HLS Fund (the “MidCap HLS Fund”)
Hartford MidCap Value HLS Fund (the “MidCap Value HLS Fund”)
Hartford Small Company HLS Fund (the “Small Company HLS Fund”)
Hartford Stock HLS Fund (the “Stock HLS Fund”)
Hartford Total Return Bond HLS Fund (the “Total Return Bond HLS Fund”)
Hartford Ultrashort Bond HLS Fund (the “Ultrashort Bond HLS Fund”)
Hartford Value HLS Fund (the “Value HLS Fund”)
Hartford HLS Series Fund II, Inc.:
Hartford Growth Opportunities HLS Fund (the “Growth Opportunities HLS Fund”)
Hartford Small/Mid Cap Equity HLS Fund (the “Small/Mid Cap Equity HLS Fund”)
Hartford SmallCap Growth HLS Fund (the “SmallCap Growth HLS Fund”)
Hartford U.S. Government Securities HLS Fund (the “U.S. Government Securities HLS Fund”)
Each Fund serves as an underlying investment option for certain variable annuity and variable life insurance separate accounts of Hartford Life Insurance Company (“HLIC”) and its affiliates and certain qualified retirement plans. Each Fund may also serve as an underlying investment option for certain variable annuity and variable life separate accounts of other insurance companies. Owners of variable annuity contracts and policyholders of variable life insurance contracts may choose the funds permitted in the variable insurance contract prospectus. In addition, participants in certain qualified retirement plans may choose the Funds if permitted by their plans.
The Global Growth HLS Fund’s portfolio managers are Matthew D. Hudson (50%) and John A. Boselli (50%) as of December 31, 2015. The SmallCap Growth HLS Fund’s portfolio managers are Mammen Chally (80%) and David J. Elliot (20%) as of December 31, 2015. The Small Company HLS Fund’s portfolio managers are Steven C. Angeli (97%), Mammen Chally (2%) and Jamie A. Rome (1%) as of December 31, 2015. The Small Company HLS Fund portfolio management team also includes Mario E. Abularach and Stephen Mortimer as of December 31, 2015.
Each Fund is a diversified open-end management investment company. Each Fund applies specialized accounting and reporting under Accounting Standards and Codification Topic 946, “Financial Services – Investment Companies”.
Each Fund, except Balanced HLS Fund, Capital Appreciation HLS Fund, Dividend and Growth HLS Fund, Global Growth HLS Fund, Growth Opportunities HLS Fund, International Opportunities HLS Fund, MidCap HLS Fund, Small/Mid Cap Equity HLS Fund and Stock HLS, is divided into Class IA and Class IB shares. Balanced HLS Fund, Capital Appreciation HLS Fund, Dividend and Growth HLS Fund, Global Growth HLS Fund, Growth Opportunities HLS Fund, International Opportunities HLS Fund, MidCap HLS Fund, Small/Mid Cap Equity HLS Fund and Stock HLS Fund are divided into Class IA, Class IB and Class IC shares. Class IC shares have not commenced operations for Balanced HLS Fund, Dividend and Growth HLS Fund, Global Growth HLS Fund, International Opportunities HLS Fund, MidCap HLS Fund, Small/Mid Cap Equity HLS Fund and Stock HLS Fund as of the date of this report. Small Company HLS Fund and Small Cap Growth HLS Fund are now closed to new investors until further notice. For more information please see the Fund’s prospectus.
Notes to Financial Statements – (continued)
December 31, 2015
Each class is offered at the per share net asset value (“NAV”) without a sales charge and is subject to the same expenses, except certain class specific expenses. Class IB shares are subject to distribution and service fees charged pursuant to a Distribution Plan adopted in accordance with Rule 12b-1 under the 1940 Act. Class IC shares are subject to distribution fees charged pursuant to a Distribution Plan adopted in accordance with Rule 12b-1 under the 1940 Act and Class IC shares are also subject to an administrative service fee.
2. Significant Accounting Policies:
The following is a summary of significant accounting policies of each Fund used in the preparation of its financial statements, which are in accordance with United States Generally Accepted Accounting Principles (“U.S. GAAP”). The preparation of financial statements in accordance with U.S. GAAP may require management to make estimates and assumptions that affect the reported amounts of assets and liabilities and disclosure of contingent assets and liabilities at the date of the financial statements and the reported amounts of increases and decreases in net assets from operations during the reporting period. Actual results could differ from those estimates.
| | a) | Determination of Net Asset Value – The NAV of each class of each Fund’s shares is determined as of the close of regular trading (normally 4:00 p.m. Eastern Time) (the “NYSE Close”) on each day that the New York Stock Exchange (the “Exchange”) is open (“Valuation Date”). Information that becomes known to the Funds after the NAV has been calculated on a particular day will not generally be used to retroactively adjust the NAV determined earlier that day. |
| | b) | Investment Valuation and Fair Value Measurements – For purposes of calculating the NAV of each Fund, portfolio investments and other assets held by the Fund’s portfolio for which market quotes are readily available are valued at market value. Market value is generally determined on the basis of last reported sales prices or official close price. If no sales are reported, market value is based on quotes obtained from a quotation reporting system, established market makers, or independent pricing services. If market prices are not readily available or are deemed unreliable, a Fund will use the fair value of the investment as determined in good faith under policies and procedures established by and under the supervision of the respective Company’s Board of Directors. Market quotes are considered not readily available where there is an absence of current or reliable market-based data (e.g., trade information or indicative market quotes), including where events occur after the close of the relevant market, but prior to the NYSE Close, that materially affect the values of a Fund’s portfolio investments or assets. In addition, market quotes are considered not readily available when, due to extraordinary circumstances, the exchanges or markets on which the investments trade do not open for trading for the entire day and no other market prices are available. In addition, prices of foreign equities that are principally traded on certain foreign markets may be adjusted daily pursuant to a fair value pricing service approved by the respective Company’s Board of Directors in order to reflect an adjustment for the factors occurring after the close of certain foreign markets but before the NYSE Close. Investments that are primarily traded on foreign markets may trade on days that are not business days of the Funds. The value of the foreign investments in which a Fund invests may change on days when a shareholder will not be able to purchase or redeem shares of the Fund. Fair value pricing is subjective in nature and the use of fair value pricing by a Fund may cause the NAV of its shares to differ significantly from the NAV that would have been calculated using market prices at the close of the exchange on which a portfolio investment is primarily traded. There can be no assurance that a Fund could obtain the fair market value assigned to an investment if the Fund were to sell the investment at approximately the time at which the Fund determines its NAV. |
Fixed income investments (other than short-term obligations), non-exchange traded derivatives and centrally cleared swaps held by a Fund are normally valued on the basis of quotes obtained from independent pricing services or brokers and dealers in accordance with procedures established by the respective Company’s Board of Directors. Prices obtained from independent pricing services use information provided by market makers or estimates of market values through accepted market modeling, trading and pricing conventions. Inputs to the models may include, but are not limited to, prepayment speeds, pricing spread, yield, trade information, dealer quotes, market color, cash flow models and the investment’s terms and conditions. Generally, a Fund may use fair valuation in regard to fixed income investments when the Fund holds defaulted or distressed investments or investments in a company in which a reorganization is pending. Senior floating rate interests generally trade in over-the-counter (“OTC”) markets and are priced through an independent pricing service utilizing independent market quotations from loan dealers or financial institutions. A composite bid price is used, which is an average of the dealer marks and dealer runs. Short-term investments maturing in 60 days or less are generally valued at amortized cost, if their original term to maturity was 60 days or less, or by amortizing their value on the 61st day prior to maturity, if the original term to maturity exceeded 60 days, which approximates fair value.
Exchange traded options, futures and options on futures are valued at the settlement price or last trade price determined by the relevant exchange as of the NYSE Close. If the last trade price for exchange traded options does not fall between the bid and ask prices, the value will be the mean of the bid and ask prices as of the NYSE Close. If a last trade price is not available, the value will be
Notes to Financial Statements – (continued)
December 31, 2015
the mean of the bid and ask prices as of the NYSE Close. If a mean of the bid and ask prices cannot be calculated for the day, the value will be the bid price as of the NYSE Close. In the case of OTC options and such instruments that do not trade on an exchange, values may be supplied by a pricing service using a formula or other objective method that may take into consideration the style, direction, expiration, strike price, notional value and volatility or other special adjustments.
Investments valued in currencies other than U.S. dollars are converted to U.S. dollars using exchange rates obtained from independent pricing services for calculation of the NAV. As a result, the NAV of a Fund’s shares may be affected by changes in the value of currencies in relation to the U.S. dollar. The value of investments traded in markets outside the United States or denominated in currencies other than the U.S. dollar may be affected significantly on a day that the NYSE is closed and the market value may change on days when an investor is not able to purchase, redeem or exchange shares of a Fund.
Foreign currency contracts represent agreements to exchange currencies on specific future dates at predetermined rates. Foreign currency contracts are valued using foreign currency exchange rates and forward rates as provided by an independent pricing service on the Valuation Date.
Investments in open-end mutual funds are valued at the respective NAV of each open-end mutual fund on the Valuation Date.
Financial instruments for which prices are not available from an independent pricing service may be valued using market quotations obtained from one or more dealers that make markets in the respective financial instrument in accordance with procedures established by the respective Company’s Board of Directors.
U.S. GAAP defines fair value as the price that a Fund would receive to sell an asset or pay to transfer a liability in an orderly transaction between market participants. The U.S. GAAP fair value measurement standards require disclosure of a fair value hierarchy for each major category of assets and liabilities. Various inputs are used in determining the fair value of each Fund’s investments. These inputs are summarized into three broad hierarchy levels. This hierarchy is based on whether the valuation inputs are observable or unobservable. These levels are:
| | • | | Level 1 – Quoted prices in active markets for identical investments. Level 1 may include exchange traded instruments, such as domestic equities, some foreign equities, options, futures, mutual funds, exchange traded funds, rights and warrants. |
| | • | | Level 2 – Observable inputs other than Level 1 prices, such as quoted prices for similar investments; quoted prices in markets that are not active; or other inputs that are observable or can be corroborated by observable market data. Level 2 may include debt investments that are traded less frequently than exchange traded instruments and which are valued using independent pricing services; foreign equities, which are principally traded on certain foreign markets and are adjusted daily pursuant to a fair value pricing service in order to reflect an adjustment for the factors occurring after the close of certain foreign markets but before the NYSE Close; senior floating rate interests, which are valued using an aggregate of dealer bids; short-term investments, which are valued at amortized cost; and swaps, which are valued based upon the terms of each swap contract. |
| | • | | Level 3 – Significant unobservable inputs that are supported by limited or no market activity. Level 3 may include financial instruments whose values are determined using indicative market quotes or require significant management judgment or estimation. These unobservable valuation inputs may include estimates for current yields, maturity/duration, prepayment speed, and indicative market quotes for comparable investments along with other assumptions relating to credit quality, collateral value, complexity of the investment structure, general market conditions and liquidity. This category may include investments where trading has been halted or there are certain restrictions on trading. While these investments are priced using unobservable inputs, the valuation of these investments reflects the best available data and management believes the prices are a reasonable representation of exit price. |
The Board of Directors of each Company generally reviews and approves the “Procedures for Valuation of Portfolio Investments” at least once a year. These procedures define how investments are to be valued, including the formation and activities of a Valuation Committee. The Valuation Committee is responsible for determining in good faith the fair value of investments when the value cannot be obtained from primary pricing services or alternative sources or if the valuation of an investment as provided by the primary pricing service or alternative source is believed not to reflect the investment’s fair value as of the Valuation Date. Voting members of the Valuation Committee include each Company’s Treasurer or designee and a Vice President of the investment manager or designee. A Vice President of each Company with legal expertise or designee is also included on the Valuation Committee as a non-voting advisory member. In addition, each Company’s Chief Compliance Officer shall designate a member of the compliance group to attend Valuation Committee meetings as a non-voting resource, to monitor for and provide guidance with respect to compliance with these
Notes to Financial Statements – (continued)
December 31, 2015
procedures. Two members of the Valuation Committee or their designees, representing different departments, shall constitute a quorum for purposes of permitting the Valuation Committee to take action. The Valuation Committee will consider all relevant factors in determining an investment’s fair value, and may seek the advice of each Fund’s sub-adviser, as applicable, knowledgeable brokers, and legal counsel in making such determination. The Valuation Committee reports to the Audit Committee of each Company’s Board of Directors. The Audit Committee receives quarterly written reports which include details of all fair-valued investments, including the reason for the fair valuation, and an indication, when possible, of the accuracy of the valuation by disclosing the next available reliable public price quotation or the disposition price of such investments (the “lookback” test). The Board of Directors of each Company then must consider for ratification all of the fair value determinations made during the previous quarter.
Valuation levels are not necessarily indicative of the risk associated with investing in such investments. Individual investments within any of the above mentioned asset classes may be assigned a different hierarchical level than those presented above, as individual circumstances dictate.
For additional information, refer to the Fair Valuation Summary and the Level 3 roll-forward reconciliation, if applicable, which follows each Fund’s Schedule of Investments.
Following is quantitative information about Level 3 fair value measurements:
Growth Opportunities HLS Fund
| | | | | | | | |
Security Type / Valuation Technique | | Unobservable Input(1) | | Input Value(s)
Range | | Fair Value at
December 31, 2015 | |
Common Stock | | | | | | | | |
Model(2) | | EV/Estimated 2016 Revenue | | 3.4x to 5.1x | | $ | 1,982,372 | |
Model(2) | | EV/Estimated 2017 EBITDA | | 5.01x to 12.63x | | | 5,002,893 | |
Cost(2) | | Recent Trade Price; Date | | $41.44; 11/27/2015 | | | 1,214,938 | |
Cost(2) | | Recent Trade Price; Date | | SEK 866.59; 8/7/2015 | | | 1,928,452 | |
Cost(2) | | Recent Trade Price; Date | | $10.34; 4/23/2015 | | | 429,782 | |
Intrinsic Value | | Amortized Discount | | $14.75 | | | 3,957,885 | |
| | | |
Preferred Stock | | | | | | | | |
Cost(2) | | Recent Trade Price; Date | | $44.12; 7/31/2015 | | | 2,241,500 | |
Cost(2) | | Recent Trade Price; Date | | $10.68; 11/24/2016 | | | 2,523,862 | |
Cost(2) | | Recent Trade Price; Date | | $10.34; 4/23/2015 | | | 959,697 | |
Cost(2) | | Recent Trade Price; Date | | $32.31; 3/16/2015 | | | 3,158,162 | |
Cost | | Recent Trade Price; Date | | $48.77; 12/4/2015 | | | 37,060,846 | |
Cost(2) | | Recent Trade Price; Date | | $41.44; 11/27/2015 | | | 10,782,481 | |
Cost | | Recent Trade Price; Date | | $2.03; 12/22/2015 | | | 1,774,368 | |
Model(2) | | EV/Estimated 2016 Revenue | | 4.1x to 7.2x | | | 4,802,698 | |
Model(2) | | EV/Estimated 2016 Gross Profit | | 4.1x to 7.1x | | | 6,450,298 | |
Model(2) | | EV/Estimated 2016 Revenue | | 4.31x to 9.85x | | | 3,601,598 | |
Model(2) | | EV/Estimated 2016 Revenue(3) | | 3.65x to 7.58x | | | 8,152,456 | |
Model(2) | | EV/Estimated 2015 Revenue | | 2.0x to 9.7x | | | 2,263,168 | |
Model(2) | | EV/Estimated 2017 Revenue | | 2.3x to 4.3x | | | 4,282,236 | |
Model(2) | | EV/Estimated 2016 Revenue | | 4.6x to 6.0x | | | 3,724,115 | |
Model(2) | | EV/Estimated 2018 Revenue | | 1.2x to 5.7x | | | 3,148,857 | |
Model(2) | | EV/Estimated 2015 Revenue | | 5.82x to 9.66x | | | 5,719,348 | |
Model(2) | | EV/Estimated 2018 Revenue | | 3.8x to 7.5x | | | 2,793,426 | |
Model(2) | | EV/Estimated 2017 Revenue | | 0.04x to 4.8x | | | 3,388,099 | |
Model(2) | | EV/Estimated 2016 Revenue | | 3.4x to 5.1x | | | 4,625,473 | |
| | | |
Convertible Bond | | | | | | | | |
Cost | | Recent Trade Price | | $100.00 | | | 705,896 | |
| | Date | | 12/22/2015 | | | | |
Total | | | | | | $ | 126,674,903 | |
| (1) | Significant changes to any unobservable inputs may result in a significant change to the fair value. |
| (2) | An additional discount may be applied to the valuation to account for company specific issues inherent in nonpublic investments. |
| (3) | The Option Pricing Model (OPM) is used to allocate enterprise value between multiple tiers of equity. |
Notes to Financial Statements – (continued)
December 31, 2015
Small Company HLS Fund
| | | | | | | | |
Security Type / Valuation Technique | | Unobservable Input(1) | | Input Value(s)
Range | | Fair Value
at
December 31, 2015 | |
Common Stock | | | | | | | | |
Model(2) | | EV/LTM EBITDA | | 5.63x to 13.63x | | $ | 4,765,580 | |
Model(2) | | EV/Estimated 2017 EBITDA | | 5.01x to 12.63x | | | 5,555,845 | |
Model(2) | | EV/Estimated 2016 Revenue(3) | | 2.8x to 5.5x | | | 2,021,145 | |
Intrinsic Value | | Amortized Discount | | $14.75 | | | 2,905,494 | |
| | | |
Preferred Stock | | | | | | | | |
Cost | | Recent Trade Price; Date | | $4.05; 12/22/2015 | | | 1,024,018 | |
Cost | | Recent Trade Price; Date | | $3.13; 12/22/2015 | | | 867,066 | |
Model(2) | | EV/Estimated 2016 Revenue | | 4.1x to 7.2x | | | 4,248,186 | |
Model(2) | | EV/Estimated 2015 Revenue | | 9.6x to 14.1x | | | 4,367,017 | |
Model(2) | | EV/Estimated 2016 Revenue | | 4.31x to 9.85x | | | 2,964,918 | |
Model(2) | | EV/Estimated 2017 Revenue | | 2.3x to 4.3x | | | 4,788,201 | |
Model(2) | | EV/Estimated 2016 Revenue | | 4.6x to 6.0x | | | 3,380,550 | |
Model(2) | | EV/Estimated 2016 Revenue(3) | | 2.8x to 5.5x | | | 6,422,415 | |
Model(2) | | EV/Estimated 2015 Revenue | | 5.82x to 9.66x | | | 4,261,604 | |
Model(2) | | EV/Estimated 2017 Revenue | | 1.7x to 3.9x | | | 604,427 | |
Model(2) | | EV/Estimated 2016 Revenue | | 3.4x to 5.1x | | | 3,354,601 | |
Total | | | | | | $ | 51,531,069 | |
| (1) | Significant changes to any unobservable inputs may result in a significant change to the fair value. |
| (2) | An additional discount may be applied to the valuation to account for company specific issues inherent in nonpublic investments. |
| (3) | The OPM is used to allocate enterprise value between multiple tiers of equity. |
| | c) | Investment Transactions and Investment Income – Investment transactions are recorded as of the trade date (the date the order to buy or sell is executed) for financial reporting purposes. Investments purchased or sold on a when-issued or delayed-delivery basis may be settled a month or more after the trade date. Realized gains and losses are determined on the basis of identified cost. |
Trade date for senior floating rate interests purchased in the primary loan market is considered the date on which the loan allocations are determined. Trade date for senior floating rate interests purchased in the secondary loan market is the date on which the transaction is entered into.
Dividend income from domestic securities is accrued on the ex-dividend date. In general, dividend income from foreign securities is recorded on the ex-date; however, dividend notifications in certain foreign jurisdictions may not be available in a timely manner and as a result, a Fund will record the dividend as soon as the relevant details (i.e., rate per share, payment date, shareholders of record, etc.) are publicly available. Interest income, including amortization of premium, accretion of discounts, inflation adjustments and additional principal received in-kind in lieu of cash, is accrued on a daily basis. Paydown gains and losses on mortgage related and other asset backed securities are included in interest income in the Statements of Operations, as applicable.
| | d) | Taxes – A Fund may be subject to taxes imposed on realized gains on securities of certain foreign countries in which such Fund invests. The amount of foreign tax expense is included on the accompanying Statements of Operations as a reduction to net realized gain on investments in these securities, if applicable. |
| | e) | Foreign Currency Transactions – Assets and liabilities denominated in currencies other than U.S. dollars are translated into U.S. dollars at the exchange rates in effect on the Valuation Date. Purchases and sales of investments, income and expenses are translated into U.S. dollars at the exchange rates on the dates of such transactions. |
A Fund does not isolate that portion of portfolio investment valuation resulting from fluctuations in the foreign currency exchange rates from the fluctuations arising from changes in the market prices of investments held. Exchange rate fluctuations are included with the net realized and unrealized gain or loss on investments in the accompanying financial statements.
Net realized foreign exchange gains or losses arise from sales of foreign currencies and the difference between asset and liability amounts initially stated in foreign currencies and the U.S. dollar value of the amounts actually received or paid. Net unrealized foreign exchange gains or losses arise from changes in the value of other assets and liabilities at the end of the reporting period, resulting from changes in the exchange rates.
Notes to Financial Statements – (continued)
December 31, 2015
| | f) | Joint Trading Account – Each Fund may invest cash balances into a joint trading account that may be invested in one or more repurchase agreements. |
| | g) | Fund Share Valuation and Dividend Distributions to Shareholders – Orders for each Fund’s shares are executed in accordance with the investment instructions of the contract holders and plan participants. The NAV of each Fund’s shares is determined as of the close of business on each business day of the Exchange (see Note 2(a)). The NAV is determined separately for each class of shares of a Fund by dividing the Fund’s net assets attributable to that class by the number of shares of the class outstanding. Each class of shares offered by a Fund has equal rights as to assets and voting privileges (except that shareholders of a class have exclusive voting rights regarding any matter relating solely to that class of shares). Income and non-class specific expenses are allocated daily to each class on the basis of the relative net assets of the class. Realized and unrealized gains and losses are allocated daily based on the relative net assets of each class of shares of each Fund. |
Orders for the purchase of a Fund’s shares received prior to the close of the Exchange on any day the Exchange is open for business are priced at the NAV determined as of the close of the Exchange. Orders received after the close of the Exchange, or on a day on which the Exchange and/or the Funds are not open for business, are priced at the next determined NAV.
Dividends are declared pursuant to a policy adopted by the respective Company’s Board of Directors. Dividends and/or distributions to shareholders are recorded on ex-date. The policy of each Fund is to pay dividends from net investment income and realized gains, if any, at least once a year.
Income dividends and capital gains distributions are determined in accordance with federal income tax regulations, which may differ from U.S. GAAP with respect to character and timing (see Federal Income Taxes: Distributions and Components of Distributable Earnings and Reclassification of Capital Accounts notes).
| 3. | Securities and Other Investments: |
| | a) | Repurchase Agreements – A repurchase agreement is an agreement by which a counterparty agrees to sell an investment and agrees to repurchase the investment sold from the buyer at a mutually agreed upon time and price. During the period of the repurchase agreement, the counterparty will deposit cash and or securities in a third party custodial account to serve as collateral. At the time a Fund enters into a repurchase agreement, the value of the underlying collateral, including accrued interest, will be equal to or exceed the value of the repurchase agreement. Repurchase agreements expose a Fund to counterparty risk – that is, the risk that the counterparty will not fulfill its obligations. To minimize counterparty risk, the investments that serve to collateralize the repurchase agreement are held by a Fund’s custodian in book entry or physical form in the custodial account of the Fund or in a third party custodial account. Repurchase agreements are valued at cost plus accrued interest, which approximates fair value. Repurchase agreements have master netting arrangements which allow a Fund to offset amounts owed to a counterparty with amounts owed by the counterparty, including any collateral. Upon an event of default under a master repurchase agreement, the nondefaulting party may close out all transactions traded under such agreement and net amounts owed under each transaction to one net amount payable by one party to the other. Absent an event of default, the master repurchase agreement does not result in an offset of reported amounts of assets and liabilities in the Statements of Assets and Liabilities across transactions between a Fund and the applicable counterparty. There were no outstanding repurchase agreements as of December 31, 2015. |
| | b) | Illiquid and Restricted Investments – Each Fund is permitted to invest up to 15% of its net assets in illiquid investments. Illiquid investments are those that may not be sold or disposed of in the ordinary course of business within seven days, at approximately the price used to determine a Fund’s NAV. A Fund may not be able to sell illiquid investments when its sub-adviser considers it desirable to do so or may have to sell such investments at a price that is lower than the price that could be obtained if the investments were more liquid. A sale of illiquid investments may require more time and may result in higher dealer discounts and other selling expenses than does the sale of those that are liquid. Illiquid investments also may be more difficult to value due to the unavailability of reliable market quotations for such investments, and an investment in them may have an adverse impact on a Fund’s NAV. Each Fund may also purchase certain restricted investments that can only be resold to certain qualified investors and may be determined to be liquid pursuant to policies and guidelines established by the respective Company’s Board of Directors. See each Fund’s Schedule of Investments, if applicable, for illiquid or restricted investments as of December 31, 2015. |
| | c) | Investments Purchased on a When-Issued or Delayed-Delivery Basis – Delivery and payment for investments that have been purchased by a Fund on a forward commitment, or when-issued or delayed-delivery basis, take place beyond the customary settlement period. A Fund may dispose of or renegotiate a delayed-delivery transaction after it is entered into, and may sell delayed- |
Notes to Financial Statements – (continued)
December 31, 2015
| | delivery investments before they are delivered, which may result in a realized gain or loss. During this period, such investments are subject to market fluctuations, and a Fund identifies investments segregated in its records with a value at least equal to the amount of the commitment. See each Fund’s Schedule of Investments, if applicable, for when-issued or delayed-delivery investments as of December 31, 2015. |
In connection with a Fund’s ability to purchase investments on a when-issued or forward commitment basis, the Fund may enter into to-be announced (“TBA”) commitments. TBA commitments are forward agreements for the purchase or sale of mortgage backed securities for a fixed price, with payment and delivery on an agreed-upon future settlement date. The specific securities to be delivered are not identified at the trade date; however, delivered securities must meet specified terms, including issuer, rate and mortgage terms. Although a Fund may enter into TBA commitments with the intention of acquiring or delivering securities for its portfolio, the Fund can extend the settlement date, roll the transaction, or dispose of a commitment prior to settlement if deemed appropriate to do so. If the TBA commitment is closed through the acquisition of an offsetting TBA commitment, a Fund realizes a gain or loss. In a TBA roll transaction, a Fund generally purchases or sells the initial TBA commitment prior to the agreed upon settlement date and enters into a new TBA commitment for future delivery or receipt of the mortgage backed securities. TBA commitments involve a risk of loss if the value of the security to be purchased or sold declines or increases, respectively, prior to settlement date.
| | d) | Senior Floating Rate Interests – Certain Funds may invest in senior floating rate interests. Senior floating rate interests hold the most senior position in the capital structure of a business entity (the “Borrower”), are typically secured by specific collateral and have a claim on the assets and/or stock of the Borrower that is senior to that held by subordinated debtholders and stockholders of the Borrower. Senior floating rate interests are typically structured and administered by a financial institution that acts as the agent of the lenders participating in the senior floating rate interest. A Fund may invest in multiple series or tranches of a senior floating rate interest, which may have varying terms and carry different associated risks. A Fund may also enter into unfunded loan commitments, which are contractual obligations for future funding. Unfunded loan commitments may include revolving credit facilities, which may obligate the Fund to supply additional cash to the borrower on demand. Unfunded loan commitments represent a future obligation in full. A Fund may receive a commitment fee based on the undrawn portion of the underlying line of credit portion of a senior floating rate interest. In certain circumstances, a Fund may receive various fees upon the restructure of a senior floating rate interest by a borrower. Fees earned/paid may be recorded as a component of income or realized gain/loss in the Statements of Operations. |
Senior floating rate interests are typically rated below-investment-grade, which suggests they are more likely to default and generally pay higher interest rates than investment-grade loans. A default could lead to non-payment of income, which would result in a reduction of income to a Fund, and there can be no assurance that the liquidation of any collateral would satisfy the Borrower’s obligation in the event of non-payment of scheduled interest or principal payments, or that such collateral could be readily liquidated. See each Fund’s Schedule of Investments, if applicable, for outstanding senior floating rate interests as of December 31, 2015.
| | e) | Mortgage Related and Other Asset Backed Securities – Certain Funds may invest in mortgage related and other asset backed securities. These securities include mortgage pass-through securities, collateralized mortgage obligations, commercial mortgage backed securities, stripped mortgage backed securities, asset backed securities, collateralized debt obligations and other securities that directly or indirectly represent a participation in, or are secured by and payable from, mortgage loans on real property. Mortgage related securities are created from pools of residential or commercial mortgage loans, including mortgage loans made by savings and loan institutions, mortgage bankers, commercial banks and others. Asset backed securities are created from many types of assets, including auto loans, credit card receivables, home equity loans, and student loans. These securities provide a monthly payment that consists of both interest and principal payments. Interest payments may be determined by fixed or adjustable rates. The rate of prepayments on underlying mortgages will affect the price and volatility of a mortgage related security, and may have the effect of shortening or extending the effective duration of the security relative to what was anticipated at the time of purchase. The timely payment of principal and interest of certain mortgage related securities is guaranteed by the full faith and credit of the United States Government. Mortgage related and other asset backed securities created and guaranteed by non-governmental issuers, including government-sponsored corporations, may be supported by various forms of insurance or guarantees, but there can be no assurance that the private insurers or guarantors can meet their obligations under the insurance policies or guarantee arrangements. See each Fund’s Schedule of Investments, if applicable, for mortgage related and other asset backed securities as of December 31, 2015. |
| | f) | Inflation Indexed Bonds – Certain Funds may invest in inflation indexed bonds. Inflation indexed bonds are fixed income investments whose principal value is periodically adjusted to the rate of inflation. The interest rate on these bonds is generally fixed at issuance at a rate lower than typical bonds. Over the life of an inflation indexed bond, however, interest will be paid based on a principal value, which is adjusted for inflation. Any increase or decrease in the principal amount of an inflation indexed bond will be included as |
Notes to Financial Statements – (continued)
December 31, 2015
| | interest income on the Statements of Operations, even though investors do not receive the principal amount until maturity. See each Fund’s Schedule of Investments, if applicable, for inflation indexed bonds as of December 31, 2015. |
| 4. | Financial Derivative Instruments: |
The following disclosures contain information on how and why a Fund uses derivative instruments, the credit-risk-related contingent features in certain derivative instruments, and how derivative instruments affect a Fund’s financial position and results of operations. The location and fair value amounts of these instruments on the Statements of Assets and Liabilities and the realized gains and losses and changes in unrealized gains and losses on the Statements of Operations, each categorized by type of derivative contract, are included in the following Additional Derivative Instrument Information footnote. The derivative instruments outstanding as of period-end are disclosed in the notes to the Schedules of Investments, if applicable. The amounts of realized gains and losses and changes in unrealized gains and losses on derivative instruments during the period are disclosed in the Statements of Operations.
| | a) | Foreign Currency Contracts – A Fund may enter into foreign currency contracts that obligate the Fund to purchase or sell currencies at specified future dates. Foreign currency contracts are used to hedge the currency exposure associated with some or all of a Fund’s investments and/or as part of an investment strategy. Foreign currency contracts are marked to market daily and the change in value is recorded by a Fund as an unrealized gain or loss. A Fund will record a realized gain or loss when the foreign currency contract is settled. |
Foreign currency contracts involve elements of market risk in excess of the amounts reflected in the Statements of Assets and Liabilities. In addition, risks may arise upon entering into these contracts from the potential inability of the counterparties to meet the terms of the contracts and from unanticipated movements in the value of the foreign currencies relative to the U.S. dollar. See each Fund’s Schedule of Investments, if applicable, for outstanding foreign currency contracts as of December 31, 2015.
| | b) | Futures Contracts – A Fund may enter into futures contracts. A futures contract is an agreement between two parties to buy or sell an asset at a set price on a future date. A Fund uses futures contracts to manage or obtain exposure to the investment markets, commodities, or movements in interest rates and currency values. The primary risks associated with the use of futures contracts are the imperfect correlation between the change in market value of the investments held by a Fund and the prices of futures contracts and the possibility of an illiquid market. Upon entering into a futures contract, a Fund is required to deposit with a futures commission merchant (“FCM”) an amount of cash or U.S. Government or Agency Obligations in accordance with the initial margin requirements of the broker or exchange. Futures contracts are marked to market daily at the most recent settlement price reported by an exchange on which, over time, they are traded most extensively, and an appropriate payable or receivable for the change in value (“variation margin”) is recorded by a Fund. Gains or losses are recognized but not considered realized until the contracts expire or are closed. Futures contracts involve, to varying degrees, risk of loss in excess of the variation margin disclosed on the Statements of Assets and Liabilities; however, a Fund seeks to reduce this risk through the use of an FCM. See each Fund’s Schedule of Investments, if applicable, for outstanding futures contracts as of December 31, 2015. |
| | c) | Options Contracts – An option contract is a contract sold by one party to another party that offers the buyer the right, but not the obligation, to buy (call) or sell (put) an investment or other financial asset at an agreed-upon price during a specific period of time or on a specific date. Option contracts are either privately negotiated in the over-the-counter market (“OTC options”) or executed in a registered exchange (“exchange traded options”). A Fund may write (sell) covered call and put options on futures, swaps (“swaptions”), securities, commodities or currencies. “Covered” means that so long as a Fund is obligated as the writer of an option, it will own either the underlying investments or currency or an option to purchase the same underlying investments or currency having an expiration date of the covered option and an exercise price equal to or less than the exercise price of the covered option, or will pledge cash or other liquid investments having a value equal to or greater than the fluctuating market value of the option investment or currency. Writing put options increases a Fund’s exposure to the underlying instrument. Writing call options decreases a Fund’s exposure to the underlying instrument. Premiums received from writing options that expire are treated as realized gains. Premiums received from writing options that are exercised or closed are added to the proceeds or offset amounts paid on the underlying futures, swap, investment or currency transaction to determine the realized gain or loss. A Fund, as a writer of an option, has no control over whether the underlying instrument may be sold (call) or purchased (put) and as a result bears the market risk of an unfavorable change in the price of the instrument underlying the written option. There is the risk a Fund may not be able to enter into a closing transaction because of an illiquid market. A Fund may also purchase put and call options. Purchasing call options increases a Fund’s exposure to the underlying instrument. Purchasing put options decreases a Fund’s exposure to the underlying instrument. A Fund pays a premium, which is included on the Fund’s Statements of Assets and Liabilities as an investment and is subsequently marked to |
Notes to Financial Statements – (continued)
December 31, 2015
| | market to reflect the current value of the option. Premiums paid for purchasing options that expire are treated as realized losses. Certain options may be purchased with premiums to be determined on a future date. The premiums for these options are based upon implied volatility parameters at specified terms. The risk associated with purchasing put and call options is generally limited to the premium paid. Premiums paid for purchasing options that are exercised or closed are added to the amounts paid or offset against the proceeds on the underlying investment transaction to determine the realized gain or loss. Entering into over-the-counter options also exposes a Fund to counterparty risk. Counterparty risk is the possibility that the counterparty to the agreements may default on its obligation to perform or disagree as to the meaning of the contractual terms in the agreements. |
See each Fund’s Schedule of Investments, if applicable, for outstanding purchased and written option contracts as of December 31, 2015. Transactions involving written option contracts during the year ended December 31, 2015, are summarized below:
Hartford Total Return Bond HLS Fund
Options Activity During the Year Ended December 31, 2015
| | | | | | | | |
Call Options Written During the Year | | Number of
Contracts | | | Premium
Amounts | |
Beginning of period | | | — | | | $ | — | |
Written | | | 1,007,528,000 | | | | 3,922,907 | |
Expired | | | (470,023,000 | ) | | | (1,328,282 | ) |
Closed | | | (24,100,000 | ) | | | (1,537,318) | |
Exercised | | | (443,710,000 | ) | | | (849,964 | ) |
| | | | | | | | |
End of Period | | | 69,695,000 | | | $ | 207,343 | |
| | | | | | | | |
| | |
Put Options Written During the Year | | Number of
Contracts | | | Premium
Amounts | |
Beginning of period | | | — | | | $ | — | |
Written | | | 1,001,723,000 | | | | 3,745,812 | |
Expired | | | (688,062,000 | ) | | | (1,574,967 | ) |
Closed | | | (18,300,000 | ) | | | (1,502,880) | |
Exercised | | | (225,671,000 | ) | | | (530,327 | ) |
| | | | | | | | |
End of Period | | | 69,690,000 | | | $ | 137,638 | |
| | | | | | | | |
| | d) | Swap Contracts – A Fund may invest in swap contracts. Swap contracts are agreements to exchange or swap investment cash flows, assets, foreign currencies or market-linked returns at specified, future intervals. Swap contracts are either privately negotiated in the over-the-counter market (“OTC swaps”) or cleared in a central clearing house (“centrally cleared swaps”). A Fund may enter into credit default, total return, cross-currency, interest rate, inflation and other forms of swap contracts to manage its exposure to credit, currency, interest rate, commodity and inflation risk. Swap contracts are also used to gain exposure to certain markets. In connection with these contracts, investments or cash may be identified as collateral or margin in accordance with the terms of the respective swap contracts and/or master netting arrangement to provide assets of value and recourse in the event of default or bankruptcy/insolvency. |
Swaps are valued based on custom valuations furnished by an independent pricing service. Swaps for which prices are not available from an independent pricing service are valued in accordance with procedures established by the respective Company’s Board of Directors. Changes in market value, if any, are reflected as a component of net changes in unrealized appreciation or depreciation on the Statements of Operations. Daily changes in valuation of centrally cleared swaps, if any, are recorded as a receivable or payable for the change in value (“variation margin”) on the Statements of Assets and Liabilities. Realized gains or losses on centrally cleared swaps are recorded upon the termination of the swap. OTC swap payments received or paid at the beginning of the measurement period are reflected as such on the Statements of Assets and Liabilities and represent premiums paid or received upon entering into the swap contract to compensate for differences between the stated terms of the swap contract and prevailing market conditions (credit spreads, currency exchange rates, interest rates and other relevant factors). These upfront premiums are recorded as realized gains or losses on the Statements of Operations upon termination or maturity of the swap. A liquidation payment received or made at
Notes to Financial Statements – (continued)
December 31, 2015
the termination or maturity of the swap is recorded as a realized gain or loss on the Statements of Operations. Net periodic payments received or paid by a Fund are included as part of realized gains or losses on the Statements of Operations.
Entering into these contracts involves, to varying degrees, elements of liquidation, counterparty, credit and market risk in excess of the amounts recognized on the Statements of Assets and Liabilities. Such risks involve the possibility that there will be no liquid market for these contracts, that the counterparty to the contracts may default on its obligation to perform or disagree as to the meaning of contractual terms in the contracts, and that there may be unfavorable changes in market conditions (credit spreads, currency exchange rates, interest rates and other relevant factors).
A Fund’s maximum risk of loss from counterparty risk for OTC swaps is the net value of the discounted cash flows to be received from the counterparty over the contract’s remaining life, and current market value, to the extent that amount is positive. The risk is mitigated by having a master netting arrangement between a Fund and the counterparty, which allows for the netting of payments made or received (although such amounts are presented on a gross basis within the Statements of Assets and Liabilities, as applicable) as well as the posting of collateral to a Fund to cover the Fund’s exposure to the counterparty. In a centrally cleared swap, while a Fund enters into an agreement with a clearing broker to execute contracts with a counterparty, the performance of the swap is guaranteed by the central clearinghouse, which reduces the Fund’s exposure to counterparty risk. The Fund is still exposed to the counterparty risk through the clearing broker and clearinghouse. The clearinghouse attempts to minimize this risk to its participants through the use of mandatory margin requirements, daily cash settlements and other procedures. Likewise, the clearing broker reduces its risk through margin requirements and required segregation of customer balances.
Credit Default Swap Contracts – The credit default swap market allows a Fund to manage its exposure to the market or certain sectors of the market, to reduce its risk exposure to defaults of corporate and sovereign issuers, or to create exposure to corporate or sovereign issuers to which it is not otherwise exposed. Certain credit default swaps involve the exchange of a fixed rate premium for protection against the loss in value of an underlying investment or index in the event of a credit event, such as payment default or bankruptcy.
Under a credit default swap contract, one party acts as guarantor by receiving the fixed periodic payment in exchange for the commitment to purchase the underlying investment at par if the defined credit event occurs. Upon the occurrence of a defined credit event, the difference between the value of the reference obligation and the swap’s notional amount is recorded as realized gain or loss on swap transactions in the Statements of Operations. A “buyer” of credit protection agrees to pay a counterparty to assume the credit risk of an issuer upon the occurrence of certain events. The “seller” of the protection receives periodic payments and agrees to assume the credit risk of an issuer upon the occurrence of certain events. Although specified events are contract specific, credit events are generally defined as bankruptcy, failure to pay, restructuring, obligation acceleration, obligation default or repudiation/moratorium. A “seller’s” exposure is limited to the total notional amount of the credit default swap contract. These potential amounts would be partially offset by any recovery values of the respective referenced obligations or upfront payments received upon entering into the contract.
Implied credit spreads, represented in absolute terms, utilized in determining the market value of credit default swap contracts on corporate issues, sovereign government issues or U.S. municipal issues as of year-end are disclosed in the notes to the Schedules of Investments, as applicable, and serve as an indicator of the current status of the payment/performance risk and represent the likelihood or risk of default for the credit derivative. The implied credit spread of a particular referenced entity reflects the cost of buying/selling protection and there may also be upfront payments required to be made to enter into the contract. Wider credit spreads represent a deterioration of the referenced entity’s credit soundness and a greater likelihood or risk of default or other credit event occurring as defined under the terms of the contract. For credit default swap contracts on credit indices, the quoted market prices and resulting values serve as the indicator of the current status of the payment/performance risk. Increasing market values, in absolute terms when compared to the notional amount of the swap, represent a deterioration of the referenced equity’s credit soundness and a greater likelihood or risk of default or other credit event occurring as defined under the terms of the contract. See each Fund’s Schedule of Investments, if applicable, for outstanding credit default swap contracts as of December 31, 2015.
Interest Rate Swap Contracts – Certain Funds are subject to interest rate risk exposure in the normal course of pursuing its investment objectives. The value of fixed rate bonds may decrease if interest rates rise. To hedge against this risk and to maintain its ability to generate income at prevailing market rates, a Fund may enter into interest rate swap contracts. In a typical interest rate swap, one party agrees to make regular payments equal to a floating interest rate, based on a specified interest rate or benchmark (e.g. London Interbank Offered Rate (“LIBOR”)), multiplied by a notional amount, in return for payments equal to a fixed rate multiplied by the same amount, for a specific period of time. The net interest received or paid on interest rate swap contracts is recorded as a
Notes to Financial Statements – (continued)
December 31, 2015
realized gain or loss. Interest rate swaps are marked to market daily and the change, if any, is recorded as an unrealized gain or loss in the Statements of Operations. When the interest rate swap contract is terminated early, a Fund records a realized gain or loss equal to the difference between the current market value and the upfront premium or cost.
If an interest rate swap contract provides for payments in different currencies, the parties might agree to exchange the notional amount as well. Interest rate swaps may also depend on other prices or rates, such as the value of an index. The risks of interest rate swaps include changes in market conditions which will affect the value of the contract or the cash flows and the possible inability of the counterparty to fulfill its obligations under the contract. A Fund’s maximum risk of loss from counterparty credit risk is the discounted net value of the cash flows to be received from the counterparty over the contract’s remaining life, to the extent that amount is positive. See each Fund’s Schedule of Investments, if applicable, for outstanding interest rate swap contracts as of December 31, 2015.
Spreadlock Swap Contracts – Certain Funds may invest in spreadlock swap contracts. These contracts involve commitments to pay or receive a settlement amount calculated as the spread difference between two interest rate curves and a fixed spread at a specific forward date determined at the beginning of the contract. Settlement amounts paid or received are recorded as a realized gain or loss on the Statements of Operations at the determination date. See each Fund’s Schedule of Investments, if applicable, for outstanding speadlock swap contracts as of December 31, 2015.
Cross Currency Swaps – Certain Funds may enter into cross currency swap agreements to gain or mitigate exposure to currency risk. A cross currency swap is an agreement to exchange cash flows on a notional amount of two or more currencies based on the relative value differential among them. Such swaps may involve initial and final exchanges that correspond to the agreed upon notional amount. Cross currency swaps usually involve the delivery of the entire principal value of one designated currency in exchange for the other designated currency. Therefore, the entire principal value of a cross currency swap is subject to the risk that the other party to the swap will default on its contractual delivery obligations. If there is a default by the counterparty, the Fund may have contractual remedies pursuant to the agreements related to the transaction. See each Fund’s Schedule of Investments, if applicable, for outstanding cross currency swap contracts as of December 31, 2015.
| | e) | Additional Derivative Instrument Information: |
Balanced HLS Fund
Fair Value of Derivative Instruments on the Statement of Assets and Liabilities as of December 31, 2015:
| | | | | | | | | | | | | | | | | | | | | | | | | | | | |
| | | Risk Exposure Category | |
| | | Interest Rate
Contracts | | | Foreign
Exchange
Contracts | | | Credit
Contracts | | | Equity
Contracts | | | Commodity
Contracts | | | Other
Contracts | | | Total | |
Assets: | | | | | | | | | | | | | | | | | | | | | | | | | | | | |
Liabilities: | | | | | | | | | | | | | | | | | | | | | | | | | | | | |
Unrealized depreciation on futures contracts(1) | | $ | 60,846 | | | $ | — | | | $ | — | | | $ | — | | | $ | — | | | $ | — | | | $ | 60,846 | |
| | | | | | | | | | | | | | | | | | | | | | | | | | | | |
Total | | $ | 60,846 | | | $ | — | | | $ | — | | | $ | — | | | $ | — | | | $ | — | | | $ | 60,846 | |
| | | | | | | | | | | | | | | | | | | | | | | | | | | | |
The Effect of Derivative Instruments on the Statement of Operations for the year ended December 31, 2015
| | | | | | | | | | | | | | | | | | | | | | | | | | | | |
| | | Risk Exposure Category | |
| | | Interest Rate
Contracts | | | Foreign
Exchange
Contracts | | | Credit
Contracts | | | Equity
Contracts | | | Commodity
Contracts | | | Other
Contracts | | | Total | |
Realized Gain (Loss) on Derivatives Recognized as a Result of Operations: | |
Net realized gain (loss) on futures contracts | | $ | (574,265 | ) | | $ | — | | | $ | — | | | $ | — | | | $ | — | | | $ | — | | | $ | (574,265 | ) |
| | | | | | | | | | | | | | | | | | | | | | | | | | | | |
Total | | $ | (574,265 | ) | | $ | — | | | $ | — | | | $ | — | | | $ | — | | | $ | — | | | $ | (574,265 | ) |
| | | | | | | | | | | | | | | | | | | | | | | | | | | | |
|
Net Change in Unrealized Appreciation (Depreciation) on Derivatives Recognized as a Result of Operations: | |
Net change in unrealized appreciation (depreciation) of futures contracts | | $ | (123,477 | ) | | $ | — | | | $ | — | | | $ | — | | | $ | — | | | $ | — | | | $ | (123,477 | ) |
| | | | | | | | | | | | | | | | | | | | | | | | | | | | |
Total | | $ | (123,477 | ) | | $ | — | | | $ | — | | | $ | — | | | $ | — | | | $ | — | | | $ | (123,477 | ) |
| | | | | | | | | | | | | | | | | | | | | | | | | | | | |
Notes to Financial Statements – (continued)
December 31, 2015
For the year ended December 31, 2015, the average amount or number per contract outstanding for each derivative type was as follows:
| | | | |
Derivative Description | | Average Notional
Par or Face Amount‡ | |
Futures contracts | | $ | 48,113,333 | |
| | ‡ | Averages are based on activity levels during 2015. |
Capital Appreciation HLS Fund
Fair Value of Derivative Instruments on the Statement of Assets and Liabilities as of December 31, 2015:
| | | | | | | | | | | | | | | | | | | | | | | | | | | | |
| | | Risk Exposure Category | |
| | | Interest Rate
Contracts | | | Foreign
Exchange
Contracts | | | Credit
Contracts | | | Equity
Contracts | | | Commodity
Contracts | | | Other
Contracts | | | Total | |
Assets: | | | | | | | | | | | | | | | | | | | | | | | | | | | | |
Unrealized appreciation on foreign currency contracts | | $ | — | | | $ | 783,025 | | | $ | — | | | $ | — | | | $ | — | | | $ | — | | | $ | 783,025 | |
| | | | | | | | | | | | | | | | | | | | | | | | | | | | |
Total | | $ | — | | | $ | 783,025 | | | $ | — | | | $ | — | | | $ | — | | | $ | — | | | $ | 783,025 | |
| | | | | | | | | | | | | | | | | | | | | | | | | | | | |
The volume of derivatives that is presented in the Schedules of Investments is consistent with the Fund’s derivatives activity during the year ended December 31, 2015.
The Effect of Derivative Instruments on the Statement of Operations for the year ended December 31, 2015
| | | | | | | | | | | | | | | | | | | | | | | | | | | | |
| | | Risk Exposure Category | |
| | | Interest Rate
Contracts | | | Foreign
Exchange
Contracts | | | Credit
Contracts | | | Equity
Contracts | | | Commodity
Contracts | | | Other
Contracts | | | Total | |
Realized Gain (Loss) on Derivatives Recognized as a Result of Operations: | |
Net realized gain (loss) on purchased options contracts | | $ | — | | | $ | — | | | $ | — | | | $ | (19,529 | ) | | $ | — | | | $ | — | | | $ | (19,529 | ) |
Net realized gain (loss) on foreign currency contracts | | | — | | | | 12,365,127 | | | | — | | | | — | | | | — | | | | — | | | | 12,365,127 | |
| | | | | | | | | | | | | | | | | | | | | | | | | | | | |
Total | | $ | — | | | $ | 12,365,127 | | | $ | — | | | $ | (19,529) | | | $ | — | | | $ | — | | | $ | 12,345,598 | |
| | | | | | | | | | | | | | | | | | | | | | | | | | | | |
|
Net Change in Unrealized Appreciation (Depreciation) on Derivatives Recognized as a Result of Operations: | |
Net change in unrealized appreciation (depreciation) of foreign currency contracts | | $ | — | | | $ | (3,308,109 | ) | | $ | — | | | $ | — | | | $ | — | | | $ | — | | | $ | (3,308,109 | ) |
| | | | | | | | | | | | | | | | | | | | | | | | | | | | |
Total | | $ | — | | | $ | (3,308,109 | ) | | $ | — | | | $ | — | | | $ | — | | | $ | — | | | $ | (3,308,109 | ) |
| | | | | | | | | | | | | | | | | | | | | | | | | | | | |
Disciplined Equity HLS Fund
Fair Value of Derivative Instruments on the Statement of Assets and Liabilities as of December 31, 2015:
| | | | | | | | | | | | | | | | | | | | | | | | | | | | |
| | | Risk Exposure Category | |
| | | Interest Rate
Contracts | | | Foreign
Exchange
Contracts | | | Credit
Contracts | | | Equity
Contracts | | | Commodity
Contracts | | | Other
Contracts | | | Total | |
Assets: | | | | | | | | | | | | | | | | | | | | | | | | | | | | |
Unrealized appreciation on futures contracts(1) | | $ | — | | | $ | — | | | $ | — | | | $ | 281,759 | | | $ | — | | | $ | — | | | $ | 281,759 | |
| | | | | | | | | | | | | | | | | | | | | | | | | | | | |
Total | | $ | — | | | $ | — | | | $ | — | | | $ | 281,759 | | | $ | — | | | $ | — | | | $ | 281,759 | |
| | | | | | | | | | | | | | | | | | | | | | | | | | | | |
The volume of derivatives that is presented in the Schedules of Investments is consistent with the Fund’s derivatives activity during the year ended December 31, 2015.
Notes to Financial Statements – (continued)
December 31, 2015
The Effect of Derivative Instruments on the Statement of Operations for the year ended December 31, 2015
| | | | | | | | | | | | | | | | | | | | | | | | | | | | |
| | | Risk Exposure Category | |
| | | Interest Rate
Contracts | | | Foreign
Exchange
Contracts | | | Credit
Contracts | | | Equity
Contracts | | | Commodity
Contracts | | | Other
Contracts | | | Total | |
Realized Gain (Loss) on Derivatives Recognized as a Result of Operations: | |
Net realized gain (loss) on futures contracts | | $ | — | | | $ | — | | | $ | — | | | $ | (259,876 | ) | | $ | — | | | $ | — | | | $ | (259,876 | ) |
| | | | | | | | | | | | | | | | | | | | | | | | | | | | |
Total | | $ | — | | | $ | — | | | $ | — | | | $ | (259,876) | | | $ | — | | | $ | — | | | $ | (259,876 | ) |
| | | | | | | | | | | | | | | | | | | | | | | | | | | | |
|
Net Change in Unrealized Appreciation (Depreciation) on Derivatives Recognized as a Result of Operations: | |
Net change in unrealized appreciation (depreciation) of futures contracts | | $ | — | | | $ | — | | | $ | — | | | $ | 281,759 | | | $ | — | | | $ | — | | | $ | 281,759 | |
| | | | | | | | | | | | | | | | | | | | | | | | | | | | |
Total | | $ | — | | | $ | — | | | $ | — | | | $ | 281,759 | | | $ | — | | | $ | — | | | $ | 281,759 | |
| | | | | | | | | | | | | | | | | | | | | | | | | | | | |
Growth Opportunities HLS Fund
The Effect of Derivative Instruments on the Statement of Operations for the year ended December 31, 2015
| | | | | | | | | | | | | | | | | | | | | | | | | | | | |
| | | Risk Exposure Category | |
| | | Interest Rate
Contracts | | | Foreign
Exchange
Contracts | | | Credit
Contracts | | | Equity
Contracts | | | Commodity
Contracts | | | Other
Contracts | | | Total | |
Net Change in Unrealized Appreciation (Depreciation) on Derivatives Recognized as a Result of Operations: | | | | | | | | | | | | | |
Net change in unrealized appreciation (depreciation) of foreign currency contracts | | $ | — | | | $ | (848 | ) | | $ | — | | | $ | — | | | $ | — | | | $ | — | | | $ | (848 | ) |
| | | | | | | | | | | | | | | | | | | | | | | | | | | | |
Total | | $ | — | | | $ | (848 | ) | | $ | — | | | $ | — | | | $ | — | | | $ | — | | | $ | (848 | ) |
| | | | | | | | | | | | | | | | | | | | | | | | | | | | |
The volume of derivatives that is presented in the Schedules of Investments is consistent with the Fund’s derivatives activity during the year ended December 31, 2015.
Healthcare HLS Fund
The Effect of Derivative Instruments on the Statement of Operations for the year ended December 31, 2015
| | | | | | | | | | | | | | | | | | | | | | | | | | | | |
| | | Risk Exposure Category | |
| | | Interest Rate
Contracts | | | Foreign
Exchange
Contracts | | | Credit
Contracts | | | Equity
Contracts | | | Commodity
Contracts | | | Other
Contracts | | | Total | |
Realized Gain (Loss) on Derivatives Recognized as a Result of Operations: | |
Net realized gain (loss) on foreign currency contracts | | $ | — | | | $ | (28,402 | ) | | $ | — | | | $ | — | | | $ | — | | | $ | — | | | $ | (28,402 | ) |
| | | | | | | | | | | | | | | | | | | | | | | | | | | | |
Total | | $ | — | | | $ | (28,402 | ) | | $ | — | | | $ | — | | | $ | — | | | $ | — | | | $ | (28,402 | ) |
| | | | | | | | | | | | | | | | | | | | | | | | | | | | |
|
Net Change in Unrealized Appreciation (Depreciation) on Derivatives Recognized as a Result of Operations: | |
Net change in unrealized appreciation (depreciation) of foreign currency contracts | | $ | — | | | $ | (3,944 | ) | | $ | — | | | $ | — | | | $ | — | | | $ | — | | | $ | (3,944 | ) |
| | | | | | | | | | | | | | | | | | | | | | | | | | | | |
Total | | $ | — | | | $ | (3,944 | ) | | $ | — | | | $ | — | | | $ | — | | | $ | — | | | $ | (3,944 | ) |
| | | | | | | | | | | | | | | | | | | | | | | | | | | | |
High Yield HLS Fund
Fair Value of Derivative Instruments on the Statement of Assets and Liabilities as of December 31, 2015:
| | | | | | | | | | | | | | | | | | | | | | | | | | | | |
| | | Risk Exposure Category | |
| | | Interest Rate
Contracts | | | Foreign
Exchange
Contracts | | | Credit
Contracts | | | Equity
Contracts | | | Commodity
Contracts | | | Other
Contracts | | | Total | |
Assets: | | | | | | | | | | | | | | | | | | | | | | | | | | | | |
Unrealized appreciation on foreign currency contracts | | $ | — | | | $ | 64,475 | | | $ | — | | | $ | — | | | $ | — | | | $ | — | | | $ | 64,475 | |
| | | | | | | | | | | | | | | | | | | | | | | | | | | | |
Total | | $ | — | | | $ | 64,475 | | | $ | — | | | $ | — | | | $ | — | | | $ | — | | | $ | 64,475 | |
| | | | | | | | | | | | | | | | | | | | | | | | | | | | |
| | | | | | | |
Liabilities: | | | | | | | | | | | | | | | | | | | | | | | | | | | | |
Unrealized depreciation on foreign currency contracts | | $ | — | | | $ | 645 | | | $ | — | | | $ | — | | | $ | — | | | $ | — | | | $ | 645 | |
Unrealized depreciation on swap contracts(2) | | | — | | | | — | | | | 68,256 | | | | — | | | | — | | | | — | | | | 68,256 | |
| | | | | | | | | | | | | | | | | | | | | | | | | | | | |
Total | | $ | — | | | $ | 645 | | | $ | 68,256 | | | $ | — | | | $ | — | | | $ | — | | | $ | 68,901 | |
| | | | | | | | | | | | | | | | | | | | | | | | | | | | |
Notes to Financial Statements – (continued)
December 31, 2015
The Effect of Derivative Instruments on the Statement of Operations for the year ended December 31, 2015
| | | | | | | | | | | | | | | | | | | | | | | | | | | | |
| | | Risk Exposure Category | |
| | | Interest Rate
Contracts | | | Foreign
Exchange
Contracts | | | Credit
Contracts | | | Equity
Contracts | | | Commodity
Contracts | | | Other
Contracts | | | Total | |
Realized Gain (Loss) on Derivatives Recognized as a Result of Operations: | | | | | |
Net realized gain (loss) on swap contracts | | $ | — | | | $ | — | | | $ | (51,895 | ) | | $ | — | | | $ | — | | | $ | — | | | $ | (51,895 | ) |
Net realized gain (loss) on foreign currency contracts | | | — | | | | 1,406,433 | | | | — | | | | — | | | | — | | | | — | | | | 1,406,433 | |
| | | | | | | | | | | | | | | | | | | | | | | | | | | | |
Total | | $ | — | | | $ | 1,406,433 | | | $ | (51,895 | ) | | $ | — | | | $ | — | | | $ | — | | | $ | 1,354,538 | |
| | | | | | | | | | | | | | | | | | | | | | | | | | | | |
| |
Net Change in Unrealized Appreciation (Depreciation) on Derivatives Recognized as a Result of Operations: | | | | | |
Net change in unrealized appreciation (depreciation) of swap contracts | | $ | — | | | $ | — | | | $ | (66,230 | ) | | $ | — | | | $ | — | | | $ | — | | | $ | (66,230 | ) |
Net change in unrealized appreciation (depreciation) of foreign currency contracts | | | — | | | | (218,266 | ) | | | — | | | | — | | | | — | | | | — | | | | (218,266 | ) |
| | | | | | | | | | | | | | | | | | | | | | | | | | | | |
Total | | $ | — | | | $ | (218,266 | ) | | $ | (66,230 | ) | | $ | — | | | $ | — | | | $ | — | | | $ | (284,496 | ) |
| | | | | | | | | | | | | | | | | | | | | | | | | | | | |
For the year ended December 31, 2015, the average amount or number per contract outstanding for each derivative type was as follows:
| | | | |
Derivative Description | | Average Notional
Par or Face Amount‡ | |
Foreign currency contracts | | $ | 8,756,668 | |
Swap contracts | | | 4,686,300 | |
| | ‡ | Averages are based on activity levels during 2015. |
International Opportunities HLS Fund
The Effect of Derivative Instruments on the Statement of Operations for the year ended December 31, 2015
| | | | | | | | | | | | | | | | | | | | | | | | | | | | |
| | | Risk Exposure Category | |
| | | Interest Rate
Contracts | | | Foreign
Exchange
Contracts | | | Credit
Contracts | | | Equity
Contracts | | | Commodity
Contracts | | | Other
Contracts | | | Total | |
Net Change in Unrealized Appreciation (Depreciation) on Derivatives Recognized as a Result of Operations: | | | | | |
Net change in unrealized appreciation (depreciation) of foreign currency contracts | | $ | — | | | $ | (13,288 | ) | | $ | — | | | $ | — | | | $ | — | | | $ | — | | | $ | (13,288 | ) |
| | | | | | | | | | | | | | | | | | | | | | | | | | | | |
Total | | $ | — | | | $ | (13,288 | ) | | $ | — | | | $ | — | | | $ | — | | | $ | — | | | $ | (13,288 | ) |
| | | | | | | | | | | | | | | | | | | | | | | | | | | | |
The volume of derivatives that is presented in the Schedules of Investments is consistent with the Fund’s derivatives activity during the year ended December 31, 2015.
MidCap Value HLS Fund
The Effect of Derivative Instruments on the Statement of Operations for the year ended December 31, 2015
| | | | | | | | | | | | | | | | | | | | | | | | | | | | |
| | | Risk Exposure Category | |
| | | Interest Rate
Contracts | | | Foreign
Exchange
Contracts | | | Credit
Contracts | | | Equity
Contracts | | | Commodity
Contracts | | | Other
Contracts | | | Total | |
Net Change in Unrealized Appreciation (Depreciation) on Derivatives Recognized as a Result of Operations: | |
Net change in unrealized appreciation (depreciation) of foreign currency contracts | | $ | — | | | $ | 538 | | | $ | — | | | $ | — | | | $ | — | | | $ | — | | | $ | 538 | |
| | | | | | | | | | | | | | | | | | | | | | | | | | | | |
Total | | $ | — | | | $ | 538 | | | $ | — | | | $ | — | | | $ | — | | | $ | — | | | $ | 538 | |
| | | | | | | | | | | | | | | | | | | | | | | | | | | | |
Notes to Financial Statements – (continued)
December 31, 2015
Additional Derivative Instrument Information:
Small Company HLS Fund
The Effect of Derivative Instruments on the Statement of Operations for the year ended December 31, 2015
| | | | | | | | | | | | | | | | | | | | | | | | | | | | |
| | | Risk Exposure Category | |
| | | Interest Rate
Contracts | | | Foreign
Exchange
Contracts | | | Credit
Contracts | | | Equity
Contracts | | | Commodity
Contracts | | | Other
Contracts | | | Total | |
Realized Gain (Loss) on Derivatives Recognized as a Result of Operations: | |
Net realized gain (loss) on foreign currency contracts | | $ | — | | | $ | 392 | | | $ | — | | | $ | — | | | $ | — | | | $ | — | | | $ | 392 | |
| | | | | | | | | | | | | | | | | | | | | | | | | | | | |
Total | | $ | — | | | $ | 392 | | | $ | — | | | $ | — | | | $ | — | | | $ | — | | | $ | 392 | |
| | | | | | | | | | | | | | | | | | | | | | | | | | | | |
Additional Derivative Instrument Information:
SmallCap Growth HLS Fund
The Effect of Derivative Instruments on the Statement of Operations for the year ended December 31, 2015
| | | | | | | | | | | | | | | | | | | | | | | | | | | | |
| | | Risk Exposure Category | |
| | | Interest Rate
Contracts | | | Foreign
Exchange
Contracts | | | Credit
Contracts | | | Equity
Contracts | | | Commodity
Contracts | | | Other
Contracts | | | Total | |
Realized Gain (Loss) on Derivatives Recognized as a Result of Operations: | |
Net realized gain (loss) on futures contracts | | $ | — | | | $ | — | | | $ | — | | | $ | 127,536 | | | $ | — | | | $ | — | | | $ | 127,536 | |
| | | | | | | | | | | | | | | | | | | | | | | | | | | | |
Total | | $ | — | | | $ | — | | | $ | — | | | $ | 127,536 | | | $ | — | | | $ | — | | | $ | 127,536 | |
| | | | | | | | | | | | | | | | | | | | | | | | | | | | |
Total Return Bond HLS Fund
Fair Value of Derivative Instruments on the Statement of Assets and Liabilities as of December 31, 2015:
| | | | | | | | | | | | | | | | | | | | | | | | | | | | |
| | | Risk Exposure Category | |
| | | Interest Rate
Contracts | | | Foreign
Exchange
Contracts | | | Credit
Contracts | | | Equity
Contracts | | | Commodity
Contracts | | | Other
Contracts | | | Total | |
Assets: | | | | | | | | | | | | | | | | | | | | | | | | | | | | |
Investments in securities, at value (purchased options), market value | | $ | — | | | $ | 18,238 | | | $ | — | | | $ | — | | | $ | — | | | $ | — | | | $ | 18,238 | |
Unrealized appreciation on futures contracts(1) | | | 1,906,538 | | | | — | | | | — | | | | — | | | | — | | | | — | | | | 1,906,538 | |
Unrealized appreciation on foreign currency contracts | | | — | | | | 1,407,819 | | | | — | | | | — | | | | — | | | | — | | | | 1,407,819 | |
Unrealized appreciation on swap contracts(2) | | | 158,902 | | | | 42,736 | | | | 3,409,459 | | | | — | | | | — | | | | — | | | | 3,611,097 | |
| | | | | | | | | | | | | | | | | | | | | | | | | | | | |
Total | | $ | 2,065,440 | | | $ | 1,468,793 | | | $ | 3,409,459 | | | $ | — | | | $ | — | | | $ | — | | | $ | 6,943,692 | |
| | | | | | | | | | | | | | | | | | | | | | | | | | | | |
Liabilities: | | | | | | | | | | | | | | | | | | | | | | | | | | | | |
Unrealized depreciation on futures contracts(1) | | $ | 2,108,003 | | | $ | — | | | $ | — | | | $ | — | | | $ | — | | | $ | — | | | $ | 2,108,003 | |
Unrealized depreciation on foreign currency contracts | | | — | | | | 960,387 | | | | — | | | | — | | | | — | | | | — | | | | 960,387 | |
Written options, market value | | | 351,953 | | | | — | | | | — | | | | — | | | | — | | | | — | | | | 351,953 | |
Unrealized depreciation on swap contracts(2) | | | — | | | | 128,601 | | | | 8,113,293 | | | | — | | | | — | | | | — | | | | 8,241,894 | |
| | | | | | | | | | | | | | | | | | | | | | | | | | | | |
Total | | $ | 2,459,956 | | | $ | 1,088,988 | | | $ | 8,113,293 | | | $ | — | | | $ | — | | | $ | — | | | $ | 11,662,237 | |
| | | | | | | | | | | | | | | | | | | | | | | | | | | | |
The Effect of Derivative Instruments on the Statement of Operations for the year ended December 31, 2015
| | | | | | | | | | | | | | | | | | | | | | | | | | | | |
| | | Risk Exposure Category | |
| | | Interest Rate
Contracts | | | Foreign
Exchange
Contracts | | | Credit
Contracts | | | Equity
Contracts | | | Commodity
Contracts | | | Other
Contracts | | | Total | |
Realized Gain (Loss) on Derivatives Recognized as a Result of Operations: | |
Net realized gain (loss) on purchased options contracts | | $ | (1,305,008) | | | $ | (976,892) | | | $ | — | | | $ | — | | | $ | — | | | $ | — | | | $ | (2,281,900 | ) |
Net realized gain (loss) on futures contracts | | | 2,496,231 | | | | — | | | | — | | | | — | | | | — | | | | — | | | | 2,496,231 | |
Net realized gain (loss) on written options contracts | | | 3,205,667 | | | | — | | | | — | | | | — | | | | — | | | | — | | | | 3,205,667 | |
Net realized gain (loss) on swap contracts | | | (307,081 | ) | | | (11,408 | ) | | | (11,674,343 | ) | | | — | | | | — | | | | — | | | | (11,992,832 | ) |
Net realized gain (loss) on foreign currency contracts | | | — | | | | 8,101,539 | | | | — | | | | — | | | | — | | | | — | | | | 8,101,539 | |
| | | | | | | | | | | | | | | | | | | | | | | | | | | | |
Total | | $ | 4,089,809 | | | $ | 7,113,239 | | | $ | (11,674,343) | | | $ | — | | | $ | — | | | $ | — | | | $ | (471,295 | ) |
| | | | | | | | | | | | | | | | | | | | | | | | | | | | |
Notes to Financial Statements – (continued)
December 31, 2015
| | | | | | | | | | | | | | | | | | | | | | | | | | | | |
| | | Risk Exposure Category | |
| | | Interest Rate
Contracts | | | Foreign
Exchange
Contracts | | | Credit
Contracts | | | Equity
Contracts | | | Commodity
Contracts | | | Other
Contracts | | | Total | |
Net Change in Unrealized Appreciation (Depreciation) on Derivatives Recognized as a Result of Operations: | |
Net change in unrealized appreciation (depreciation) of investments in purchased options contracts | | $ | 883,975 | | | $ | 441,931 | | | $ | — | | | $ | — | | | $ | — | | | $ | — | | | $ | 1,325,906 | |
Net change in unrealized appreciation (depreciation) of futures contracts | | | (461,264 | ) | | | — | | | | — | | | | — | | | | — | | | | — | | | | (461,264 | ) |
Net change in unrealized appreciation (depreciation) of written options contracts | | | (6,972 | ) | | | — | | | | — | | | | — | | | | — | | | | — | | | | (6,972 | ) |
Net change in unrealized appreciation (depreciation) of swap contracts | | | 160,849 | | | | (85,865 | ) | | | 1,323,655 | | | | — | | | | — | | | | — | | | | 1,398,639 | |
Net change in unrealized appreciation (depreciation) of foreign currency contracts | | | — | | | | (703,054 | ) | | | — | | | | — | | | | — | | | | — | | | | (703,054) | |
| | | | | | | | | | | | | | | | | | | | | | | | | | | | |
Total | | $ | 576,588 | | | $ | (346,988) | | | $ | 1,323,655 | | | $ | — | | | $ | — | | | $ | — | | | $ | 1,553,255 | |
| | | | | | | | | | | | | | | | | | | | | | | | | | | | |
For the year ended December 31, 2015, the average amount or number per contract outstanding for each derivative type was as follows:
| | | | |
Derivative Description | | Average Notional
Par or Face Amount‡ | |
Investments in securities, at value(a) | | $ | 71,124,435 | |
Foreign currency contracts | | | 242,101,338 | |
Futures contracts | | | 1,332,430,013 | |
Swap contracts | | | 858,269,723 | |
Written options | | | 249,506,375 | |
| | ‡ | Averages are based on activity levels during 2015. |
| | (a) | Represents purchased options which are part of net realized gain (loss) on investments and net change in unrealized appreciation (depreciation) on investments as shown in the Statement of Operations. |
U.S. Government Securities HLS Fund
Fair Value of Derivative Instruments on the Statement of Assets and Liabilities as of December 31, 2015:
| | | | | | | | | | | | | | | | | | | | | | | | | | | | |
| | | Risk Exposure Category | |
| | | Interest Rate
Contracts | | | Foreign
Exchange
Contracts | | | Credit
Contracts | | | Equity
Contracts | | | Commodity
Contracts | | | Other
Contracts | | | Total | |
Assets: | | | | | | | | | | | | | | | | | | | | | | | | | | | | |
Unrealized appreciation on futures contracts(1) | | $ | 1,398 | | | $ | — | | | $ | — | | | $ | — | | | $ | — | | | $ | — | | | $ | 1,398 | |
| | | | | | | | | | | | | | | | | | | | | | | | | | | | |
Total | | $ | 1,398 | | | $ | — | | | $ | — | | | $ | — | | | $ | — | | | $ | — | | | $ | 1,398 | |
| | | | | | | | | | | | | | | | | | | | | | | | | | | | |
| | | | | | | |
Liabilities: | | | | | | | | | | | | | | | | | | | | | | | | | | | | |
Unrealized depreciation on futures contracts(1) | | $ | 122,932 | | | $ | — | | | $ | — | | | $ | — | | | $ | — | | | $ | — | | | $ | 122,932 | |
| | | | | | | | | | | | | | | | | | | | | | | | | | | | |
Total | | $ | 122,932 | | | $ | — | | | $ | — | | | $ | — | | | $ | — | | | $ | — | | | $ | 122,932 | |
| | | | | | | | | | | | | | | | | | | | | | | | | | | | |
The Effect of Derivative Instruments on the Statement of Operations for the year ended December 31, 2015
| | | | | | | | | | | | | | | | | | | | | | | | | | | | |
| | | Risk Exposure Category | |
| | | Interest Rate
Contracts | | | Foreign
Exchange
Contracts | | | Credit
Contracts | | | Equity
Contracts | | | Commodity
Contracts | | | Other
Contracts | | | Total | |
Realized Gain (Loss) on Derivatives Recognized as a Result of Operations: | |
Net realized gain (loss) on futures contracts | | $ | (444,637 | ) | | $ | — | | | $ | — | | | $ | — | | | $ | — | | | $ | — | | | $ | (444,637 | ) |
| | | | | | | | | | | | | | | | | | | | | | | | | | | | |
Total | | $ | (444,637 | ) | | $ | — | | | $ | — | | | $ | — | | | $ | — | | | $ | — | | | $ | (444,637 | ) |
| | | | | | | | | | | | | | | | | | | | | | | | | | | | |
|
Net Change in Unrealized Appreciation (Depreciation) on Derivatives Recognized as a Result of Operations: | |
Net change in unrealized appreciation (depreciation) of futures contracts | | $ | (385,760 | ) | | $ | — | | | $ | — | | | $ | — | | | $ | — | | | $ | — | | | $ | (385,760 | ) |
| | | | | | | | | | | | | | | | | | | | | | | | | | | | |
Total | | $ | (385,760) | | | $ | — | | | $ | — | | | $ | — | | | $ | — | | | $ | — | | | $ | (385,760) | |
| | | | | | | | | | | | | | | | | | | | | | | | | | | | |
Notes to Financial Statements – (continued)
December 31, 2015
For the year ended December 31, 2015, the average amount or number per contract outstanding for each derivative type was as follows:
| | | | |
Derivative Description | | Average Notional
Par or Face Amount‡ | |
Futures contracts | | $ | 60,638,889 | |
| | ‡ | Averages are based on activity levels during 2015. |
| | (1) | Cumulative appreciation (depreciation) on futures contracts is disclosed within the Schedule of Investments under the open “Futures Contracts” section. Only current day’s variation margin, if any, are reported within the Statements of Assets and Liabilities. |
| | (2) | Statements of Assets and Liabilities location: Cumulative appreciation (depreciation) on centrally cleared swaps, if applicable, is disclosed within the Schedule of Investments. Only the current day’s variation margin, if any, are reported within the Statements of Assets and Liabilities. OTC swaps are reported within the Statement of Assets and Liabilities within Unrealized appreciation (depreciation) on OTC swap contracts, if applicable. |
| | f) | Balance Sheet Offsetting Information – Set forth below are tables which disclose both gross information and net information about instruments and transactions eligible for offset in the financial statements, and instruments and transactions that are subject to a master netting arrangement, as well as amounts related to margin, reflected as financial collateral (including cash collateral), held at clearing brokers, counterparties and a Fund’s custodian. The master netting arrangements allow the clearing brokers to net any collateral held in or on behalf of a Fund, or liabilities or payment obligations of the clearing brokers to the Fund, against any liabilities or payment obligations of the Fund to the clearing brokers. A Fund is required to deposit financial collateral (including cash collateral) at the Fund’s custodian on behalf of clearing brokers and counterparties to continually meet the original and maintenance requirements established by the clearing brokers and counterparties. Such requirements are specific to the respective clearing broker or counterparty. Certain master netting arrangements may not be enforceable in a bankruptcy. |
The following tables present the Funds’ derivative assets and liabilities, presented on a gross basis as no amounts are netted within the Statements of Assets and Liabilities, by counterparty net of amounts available for offset under a master netting agreement or similar agreement (“MNA”) and net of the related collateral received/pledged by the Funds as of December 31, 2015:
| | | | | | | | |
Balanced HLS Fund | |
Derivative Financial Instruments: | | Assets | | | Liabilities | |
Futures contracts | | $ | — | | | $ | (60,846 | ) |
| | | | | | | | |
Total gross amount of derivative assets and liabilities in the Statement of Assets and Liabilities | | | — | | | | (60,846 | ) |
| | | | | | | | |
Derivatives not subject to a MNA | | | — | | | | 60,846 | |
| | | | | | | | |
Total gross amount of assets and liabilities subject to MNA or similar agreements | | $ | — | | | $ | — | |
| | | | | | | | |
| | | | | | | | |
Capital Appreciation HLS Fund | |
Derivative Financial Instruments: | | Assets | | | Liabilities | |
Foreign currency contracts | | $ | 783,025 | | | $ | — | |
| | | | | | | | |
Total gross amount of derivative assets and liabilities in the Statement of Assets and Liabilities | | | 783,025 | | | | — | |
| | | | | | | | |
Derivatives not subject to a MNA | | | — | | | | — | |
| | | | | | | | |
Total gross amount of assets and liabilities subject to MNA or similar agreements | | $ | 783,025 | | | $ | — | |
| | | | | | | | |
| | | | | | | | | | | | | | | | | | | | |
Capital Appreciation HLS Fund | |
Counterparty | | Gross Amount of
Assets | | | Financial
Instruments
and
Derivatives
Available for
Offset | | | Non-cash
Collateral
Received* | | | Cash
Collateral
Received* | | | Net Amount
of
Assets | |
Citibank NA | | $ | 677,613 | | | $ | — | | | $ | — | | | $ | — | | | $ | 677,613 | |
Goldman Sachs & Co. | | | 99,930 | | | | — | | | | — | | | | — | | | | 99,930 | |
HSBC Bank USA | | | 5,482 | | | | — | | | | — | | | | — | | | | 5,482 | |
| | | | | | | | | | | | | | | | | | | | |
Total | | $ | 783,025 | | | $ | — | | | $ | — | | | $ | — | | | $ | 783,025 | |
| | | | | | | | | | | | | | | | | | | | |
| | * | In some instances, the actual collateral received and/or pledged may be more than the amount shown. |
Notes to Financial Statements – (continued)
December 31, 2015
| | | | | | | | |
High Yield HLS Fund | |
Derivative Financial Instruments: | | Assets | | | Liabilities | |
Foreign currency contracts | | $ | 64,475 | | | $ | (645 | ) |
Swap contracts | | | 102,730 | | | | — | |
| | | | | | | | |
Total gross amount of derivative assets and liabilities in the Statement of Assets and Liabilities | | | 167,205 | | | | (645 | ) |
| | | | | | | | |
Derivatives not subject to a MNA | | | (102,730 | ) | | | — | |
| | | | | | | | |
Total gross amount of assets and liabilities subject to MNA or similar agreements | | $ | 64,475 | | | $ | (645 | ) |
| | | | | | | | |
| | | | | | | | | | | | | | | | | | | | |
High Yield HLS Fund | |
Counterparty | | Gross Amount of
Assets | | | Financial
Instruments
and
Derivatives
Available for
Offset | | | Non-cash
Collateral
Received* | | | Cash
Collateral
Received* | | | Net Amount
of
Assets | |
Banc of America Securities LLC | | $ | 64,475 | | | $ | — | | | $ | — | | | $ | — | | | $ | 64,475 | |
| | | | | | | | | | | | | | | | | | | | |
| | | | | | | | | | | | | | | | | | | | |
Counterparty | | Gross Amount of
Liabilities | | | Financial
Instruments
and
Derivatives
Available for
Offset | | | Non-cash
Collateral
Pledged* | | | Cash
Collateral
Pledged* | | | Net Amount
of
Liabilities | |
BNP Paribas Securities Services | | $ | (645 | ) | | $ | — | | | $ | — | | | $ | — | | | $ | (645 | ) |
| | | | | | | | | | | | | | | | | | | | |
| | * | In some instances, the actual collateral received and/or pledged may be more than the amount shown. |
| | | | | | | | |
Total Return Bond HLS Fund | |
Derivative Financial Instruments: | | Assets | | | Liabilities | |
Foreign currency contracts | | $ | 1,407,819 | | | $ | (960,387 | ) |
Futures contracts | | | 1,906,538 | | | | (2,108,003 | ) |
Purchased options | | | 18,238 | | | | — | |
Swap contracts | | | 29,675,219 | | | | (23,666,897 | ) |
Written options | | | — | | | | (351,953 | ) |
| | | | | | | | |
Total gross amount of derivative assets and liabilities in the Statement of Assets and Liabilities | | | 33,007,814 | | | | (27,087,240 | ) |
| | | | | | | | |
Derivatives not subject to a MNA | | | (1,906,538 | ) | | | 7,825,932 | |
| | | | | | | | |
Total gross amount of assets and liabilities subject to MNA or similar agreements | | $ | 31,101,276 | | | $ | (19,261,308 | ) |
| | | | | | | | |
| | | | | | | | | | | | | | | | | | | | |
Total Return Bond HLS Fund | |
Counterparty | | Gross Amount of
Assets | | | Financial
Instruments
and
Derivatives
Available for
Offset | | | Non-cash
Collateral
Received* | | | Cash
Collateral
Received* | | | Net Amount
of
Assets | |
Banc of America Securities LLC | | $ | 3,948,982 | | | $ | (2,754,611 | ) | | $ | (1,194,371 | ) | | $ | — | | | $ | — | |
Barclays | | | 10,942,585 | | | | (2,090,712 | ) | | | — | | | | (8,670,000 | ) | | | 181,873 | |
Citibank NA | | | 3,162,569 | | | | (49,631 | ) | | | — | | | | (2,646,000 | ) | | | 466,938 | |
Credit Suisse First Boston Corp. | | | 1,310 | | | | — | | | | — | | | | — | | | | 1,310 | |
Credit Suisse International | | | 4,197,238 | | | | (4,059,396 | ) | | | — | | | | (137,842 | ) | | | — | |
Notes to Financial Statements – (continued)
December 31, 2015
| | | | | | | | | | | | | | | | | | | | |
Total Return Bond HLS Fund-(continued) | |
Counterparty | | Gross Amount of
Assets | | | Financial
Instruments
and
Derivatives
Available for
Offset | | | Non-cash
Collateral
Received* | | | Cash
Collateral
Received* | | | Net Amount
of
Assets | |
Deutsche Bank Securities, Inc. | | $ | 1,112,676 | | | $ | (363,178 | ) | | $ | — | | | $ | (700,000 | ) | | $ | 49,498 | |
Goldman Sachs & Co. | | | 3,055,456 | | | | (3,055,456 | ) | | | — | | | | — | | | | — | |
JP Morgan Chase & Co. | | | 782,465 | | | | (782,465 | ) | | | — | | | | — | | | | — | |
Merrill Lynch International | | | 405,862 | | | | (405,862 | ) | | | — | | | | — | | | | — | |
Morgan Stanley | | | 3,173,746 | | | | (1,601,479 | ) | | | — | | | | (1,572,267 | ) | | | — | |
RBC Dominion Securities, Inc. | | | 58,358 | | | | (560 | ) | | | — | | | | — | | | | 57,798 | |
Standard Chartered Bank | | | 229,885 | | | | (29,449 | ) | | | — | | | | — | | | | 200,436 | |
State Street Global Markets LLC | | | 30,144 | | | | (3,546 | ) | | | — | | | | — | | | | 26,598 | |
| | | | | | | | | | | | | | | | | | | | |
Total | | $ | 31,101,276 | | | $ | (15,196,345 | ) | | $ | (1,194,371 | ) | | $ | (13,726,109 | ) | | $ | 984,451 | |
| | | | | | | | | | | | | | | | | | | | |
| | | | | | | | | | | | | | | | | | | | |
| | | | | |
Counterparty | | Gross Amount of
Liabilities | | | Financial
Instruments
and
Derivatives
Available for
Offset | | | Non-cash
Collateral
Pledged* | | | Cash
Collateral
Pledged* | | | Net Amount
of
Liabilities | |
Banc of America Securities LLC | | $ | (2,754,611 | ) | | $ | 2,754,611 | | | $ | — | | | $ | — | | | $ | — | |
Barclays | | | (2,090,712 | ) | | | 2,090,712 | | | | — | | | | — | | | | — | |
BNP Paribas Securities Services | | | (2,663 | ) | | | — | | | | — | | | | — | | | | (2,663 | ) |
Citibank NA | | | (49,631 | ) | | | 49,631 | | | | — | | | | — | | | | — | |
Commonwealth Bank of Australia | | | (151,828 | ) | | | — | | | | — | | | | — | | | | (151,828 | ) |
Credit Suisse International | | | (4,059,396 | ) | | | 4,059,396 | | | | — | | | | — | | | | — | |
Deutsche Bank Securities, Inc. | | | (363,178 | ) | | | 363,178 | | | | — | | | | — | | | | — | |
Goldman Sachs & Co. | | | (3,562,543 | ) | | | 3,055,456 | | | | — | | | | 43,613 | | | | (463,474 | ) |
HSBC Bank USA | | | (83,097 | ) | | | — | | | | — | | | | — | | | | (83,097 | ) |
JP Morgan Chase & Co. | | | (931,328 | ) | | | 782,465 | | | | — | | | | — | | | | (148,863 | ) |
Merrill Lynch International | | | (2,958,868 | ) | | | 405,862 | | | | 2,503,686 | | | | — | | | | (49,320 | ) |
Morgan Stanley | | | (1,601,479 | ) | | | 1,601,479 | | | | — | | | | — | | | | — | |
RBC Dominion Securities, Inc. | | | (560 | ) | | | 560 | | | | — | | | | — | | | | — | |
Standard Chartered Bank | | | (29,449 | ) | | | 29,449 | | | | — | | | | — | | | | — | |
State Street Global Markets LLC | | | (3,546 | ) | | | 3,546 | | | | — | | | | — | | | | — | |
UBS AG | | | (618,419 | ) | | | — | | | | 500,776 | | | | — | | | | (117,643 | ) |
| | | | | | | | | | | | | | | | | | | | |
Total | | $ | (19,261,308 | ) | | $ | 15,196,345 | | | $ | 3,004,462 | | | $ | 43,613 | | | $ | (1,016,888 | ) |
| | | | | | | | | | | | | | | | | | | | |
| | * | In some instances, the actual collateral received and/or pledged may be more than the amount shown. |
| | | | | | | | |
U.S. Government Securities HLS Fund | |
Derivative Financial Instruments: | | Assets | | | Liabilities | |
Futures contracts | | $ | 1,398 | | | $ | (122,932 | ) |
| | | | | | | | |
Total gross amount of derivative assets and liabilities in the Statement of Assets and Liabilities | | | 1,398 | | | | (122,932 | ) |
| | | | | | | | |
Derivatives not subject to a MNA | | | (1,398 | ) | | | 122,932 | |
| | | | | | | | |
Total gross amount of assets and liabilities subject to MNA or similar agreements | | $ | — | | | $ | — | |
| | | | | | | | |
Notes to Financial Statements – (continued)
December 31, 2015
The market values of equity securities, such as common stocks and preferred stocks, or equity related investments, such as futures and options, may decline due to general market conditions which are not specifically related to a particular company, such as real or perceived adverse economic conditions, changes in the general outlook for corporate earnings, changes in interest or currency rates or adverse investor sentiment generally. The market value of equity securities may also decline due to factors which affect a particular industry or industries, such as labor shortages or increased production costs and competitive conditions within an industry. Equity securities and equity related investments generally have greater market price volatility than fixed income securities.
Credit risk depends largely on the perceived financial health of bond issuers. In general, the credit rating is inversely related to the credit risk of the issuer. Higher rated bonds generally are deemed to have less credit risk, while lower or unrated bonds are deemed to have higher risk of default. The share price, yield and total return of a fund that holds securities with higher credit risk may be more volatile than those of a fund that holds bonds with lower credit risk. Similar to credit risk, a Fund may be exposed to counterparty risk, or the risk that an institution or other entity with which a Fund has unsettled or open transactions will default.
Certain investments held by a Fund expose the Fund to various risks which may include, but are not limited to, interest rate, prepayment, extension and foreign currency risks. Interest rate risk is the risk that fixed income securities will decline in value because of changes in interest rates. As nominal interest rates rise, the values of certain fixed income securities held by a Fund are likely to decrease. A nominal interest rate can be described as the sum of a real interest rate and an expected inflation rate. Fixed income securities with longer durations tend to be more sensitive to changes in interest rates, usually making them more volatile than securities with shorter durations. Duration is useful primarily as a measure of the sensitivity of a fixed income security’s market price to interest rate (i.e., yield) movements. Senior floating rate interests and securities subject to prepayment and extension risk generally offer less potential for gains when interest rates decline. Rising interest rates may cause prepayments to occur at a slower than expected rate, thereby effectively lengthening the maturity of the security and making the security more sensitive to interest rate changes. Prepayment and extension risk are major risks of mortgage backed securities, senior floating rate interests and certain asset backed securities. For certain asset backed securities, the actual maturity may be less than the stated maturity shown in the Schedule of Investments, if applicable. As a result, the timing of income recognition relating to these securities may vary based upon the actual maturity.
If a Fund invests directly in foreign currencies or in securities that trade in, and receive revenues in, foreign currencies, or in derivatives that provide exposure to foreign currencies, it will be subject to the risk that those currencies will decline in value relative to the base currency (U.S. dollars) of the Fund, or, in the case of hedging positions, that the Fund’s base currency will decline in value relative to the currency being hedged. Currency rates in foreign countries may fluctuate significantly over short periods of time for a number of reasons, including changes in interest rates, intervention (or the failure to intervene) by U.S. or foreign governments, central banks or supranational entities, such as the International Monetary Fund, or by the imposition of currency controls or other political developments in the United States or abroad. As a result, a Fund’s investments in foreign currency denominated securities may reduce the returns, if applicable, of the Fund.
| | a) | Each Fund intends to continue to qualify as a Regulated Investment Company (“RIC”) under Subchapter M of the Internal Revenue Code (“IRC”) by distributing substantially all of its taxable net investment income and net realized capital gains to its shareholders. Each Fund has distributed substantially all of its income and capital gains in prior years, if applicable, and intends to distribute substantially all of its income and capital gains during the calendar year ending December 31, 2015. Accordingly, no provision for federal income or excise taxes has been made in the accompanying financial statements. Distributions from short-term capital gains are treated as ordinary income distributions for federal income tax purposes. |
| | b) | Net Investment Income (Loss), Net Realized Gains (Losses) and Distributions – Net investment income (loss) and net realized gains (losses) may differ for financial statement and tax purposes primarily because of losses deferred due to wash sale adjustments, foreign currency gains and losses, adjustments related to Passive Foreign Investment Companies (“PFICs”), Real Estate Investment Trusts (“REITs”), RICs, certain derivatives and partnerships. The character of distributions made during the year from net investment income or net realized gains may differ from their ultimate characterization for federal income tax purposes. Also, due to the timing of dividend distributions, the fiscal year in which amounts are distributed may differ from the year that the income or realized gains (losses) were recorded by the Funds. |
Notes to Financial Statements – (continued)
December 31, 2015
| | c) | Distributions and Components of Distributable Earnings – The tax character of distributions paid by each Fund for the years ended December 31, 2015 and December 31, 2014 are as follows (as adjusted for dividends payable, if applicable): |
| | | | | | | | | | | | | | | | |
| | | For the Year Ended December 31, 2015 | | | For the Year Ended December 31, 2014 | |
Fund | | Ordinary
Income | | | Long-Term
Capital Gains(1) | | | Ordinary
Income | | | Long-Term
Capital Gains | |
Balanced HLS Fund | | $ | 48,113,111 | | | $ | — | | | $ | 50,751,999 | | | $ | — | |
Capital Appreciation HLS Fund | | | 395,608,528 | | | | 941,479,163 | | | | 461,903,895 | | | | 656,128,494 | |
Disciplined Equity HLS Fund | | | 17,696,259 | | | | 226,565,250 | | | | 13,399,464 | | | | — | |
Dividend & Growth HLS Fund | | | 81,615,645 | | | | 497,141,842 | | | | 122,936,965 | | | | 449,915,369 | |
Global Growth HLS Fund | | | 2,330,348 | | | | 21,960,413 | | | | 2,048,503 | | | | — | |
Growth Opportunities HLS Fund | | | 75,794,685 | | | | 207,664,278 | | | | 79,075,442 | | | | 142,877,866 | |
Healthcare HLS Fund | | | 3,015,270 | | | | 46,392,436 | | | | 4,611,295 | | | | 22,145,365 | |
High Yield HLS Fund | | | 24,914,498 | | | | — | | | | 35,154,599 | | | | — | |
International Opportunities HLS Fund | | | 20,056,070 | | | | — | | | | 32,481,494 | | | | — | |
MidCap HLS Fund | | | 13,749,279 | | | | 197,614,796 | | | | 27,985,188 | | | | 174,255,206 | |
MidCap Value HLS Fund | | | 5,717,645 | | | | 55,282,288 | | | | 2,882,001 | | | | 60,291,875 | |
Small Company HLS Fund | | | 48,556,100 | | | | 208,942,541 | | | | 92,815,184 | | | | 157,551,966 | |
Small/Mid Cap Equity HLS Fund | | | 3,215,842 | | | | 15,912,525 | | | | 17,387,669 | | | | 8,210,898 | |
SmallCap Growth HLS Fund | | | 17,138,693 | | | | 81,861,568 | | | | 37,071,356 | | | | 90,138,781 | |
Stock HLS Fund | | | 27,684,514 | | | | — | | | | 30,998,186 | | | | — | |
Total Return Bond HLS Fund | | | 137,524,741 | | | | 23,735,354 | | | | 108,767,110 | | | | — | |
Ultrashort Bond HLS Fund | | | 2,122,089 | | | | 32,791 | | | | — | | | | — | |
U.S. Government Securities HLS Fund | | | 9,323,867 | | | | — | | | | 13,850,021 | | | | — | |
Value HLS Fund | | | 10,774,724 | | | | 15,734,487 | | | | 8,937,977 | | | | — | |
| | (1) | The Funds designate these distributions as long-term capital gain dividends pursuant to IRC Sec. 852(b)(3)(c). |
As of December 31, 2015, the components of distributable earnings (deficit) for each Fund on a tax basis are as follows:
| | | | | | | | | | | | | | | | | | | | | | | | |
Fund | | Undistributed
Ordinary
Income | | | Undistributed
Long-Term
Capital Gain | | | Accumulated
Capital and
Other Losses(1) | | | Unrealized
Appreciation
(Depreciation)
on Investments(2) | | | Other
Temporary
Differences | | | Total
Accumulated
Earnings
(Deficit) | |
Balanced HLS Fund | | $ | 28,777,300 | | | $ | — | | | $ | (199,060,323 | ) | | $ | 414,186,774 | | | $ | (919,328 | ) | | $ | 242,984,423 | |
Capital Appreciation HLS Fund | | | 60,409,332 | | | | 481,343,758 | | | | — | | | | 79,606,726 | | | | (19,529 | ) | | | 621,340,287 | |
Disciplined Equity HLS Fund | | | 979,743 | | | | 86,580,392 | | | | — | | | | 156,725,537 | | | | — | | | | 244,285,672 | |
Dividend & Growth HLS Fund | | | 6,152,049 | | | | 368,805,690 | | | | — | | | | 829,947,034 | | | | — | | | | 1,204,904,773 | |
Global Growth HLS Fund | | | 2,754,031 | | | | 46,629,661 | | | | — | | | | 70,383,604 | | | | — | | | | 119,767,296 | |
Growth Opportunities HLS Fund | | | 64,425,206 | | | | 135,652,389 | | | | — | | | | 113,989,953 | | | | — | | | | 314,067,548 | |
Healthcare HLS Fund | | | 17,363,950 | | | | 59,648,395 | | | | — | | | | 95,917,987 | | | | — | | | | 172,930,332 | |
High Yield HLS Fund | | | 20,169,985 | | | | — | | | | (21,720,835 | ) | | | (31,771,888 | ) | | | — | | | | (33,322,738 | ) |
International Opportunities HLS Fund | | | 19,934,876 | | | | — | | | | (381,710,673 | ) | | | 22,077,124 | | | | — | | | | (339,698,673 | ) |
MidCap HLS Fund | | | 777,579 | | | | 179,807,154 | | | | — | | | | 255,385,016 | | | | — | | | | 435,969,749 | |
MidCap Value HLS Fund | | | 3,923,496 | | | | 46,944,471 | | | | — | | | | 45,674,061 | | | | — | | | | 96,542,028 | |
Small Company HLS Fund | | | — | | | | 96,188,295 | | | | — | | | | (18,572,209 | ) | | | — | | | | 77,616,086 | |
Small/Mid Cap Equity HLS Fund | | | 1,264,380 | | | | 5,626,981 | | | | — | | | | 4,458,376 | | | | — | | | | 11,349,737 | |
SmallCap Growth HLS Fund | | | 3,672,027 | | | | 47,395,524 | | | | — | | | | 1,865,715 | | | | — | | | | 52,933,266 | |
Stock HLS Fund | | | 2,566,050 | | | | — | | | | (260,419,400 | ) | | | 289,222,448 | | | | — | | | | 31,369,098 | |
Total Return Bond HLS Fund | | | 65,465,697 | | | | 10,008,875 | | | | — | | | | (56,879,553 | ) | | | (51,434 | ) | | | 18,543,585 | |
Ultrashort Bond HLS Fund | | | 2,672,136 | | | | — | | | | (342,482 | ) | | | (2,062,285 | ) | | | — | | | | 267,369 | |
U.S. Government Securities HLS Fund | | | 9,029,448 | | | | — | | | | (113,784,908 | ) | | | 4,520,682 | | | | (35,947 | ) | | | (100,270,725 | ) |
Value HLS Fund | | | 2,363,777 | | | | 62,514,709 | | | | — | | | | 101,035,496 | | | | — | | | | 165,913,982 | |
| | (1) | The Fund has capital loss carryforwards that are identified in the Capital Loss Carryforward note that follows. |
| | (2) | Differences between book-basis and tax-basis unrealized appreciation (depreciation) may be attributable to the losses deferred due to wash sale adjustments, foreign currency gains and losses, adjustments related to PFICs, REITs, RICs, certain derivatives and partnerships. |
Notes to Financial Statements – (continued)
December 31, 2015
| | d) | Reclassification of Capital Accounts – The Funds may record reclassifications in their capital accounts. These reclassifications have no impact on the total net assets of the Funds. The reclassifications are a result of permanent differences between U.S. GAAP and tax accounting for such items as foreign currency, PFICs, expiration or utilization of capital loss carryforwards or net operating losses. Adjustments are made to reflect the impact these items have on current and future distributions to shareholders. Therefore, the source of the Funds’ distributions may be shown in the accompanying Statements of Changes in Net Assets as from undistributed net investment income, from accumulated net realized gains on investments or from capital depending on the type of book and tax differences that exist. For the year ended December 31, 2015, the Funds recorded reclassifications to increase (decrease) the accounts listed below: |
| | | | | | | | | | | | |
Fund | | Capital Stock and
Paid-in-Capital | | | Undistributed Net
Investment
Income (Loss) | | | Accumulated Net
Realized Gain
(Loss) | |
Balanced HLS Fund | | $ | (38,847 | ) | | $ | 14,329,249 | | | $ | (14,290,402 | ) |
Capital Appreciation HLS Fund | | | (1,471 | ) | | | (3,911,419 | ) | | | 3,912,890 | |
Disciplined Equity HLS Fund | | | — | | | | (52,837 | ) | | | 52,837 | |
Dividend & Growth HLS Fund | | | (612 | ) | | | (1,230,255 | ) | | | 1,230,867 | |
Global Growth HLS Fund | | | (54 | ) | | | (56,285 | ) | | | 56,339 | |
Growth Opportunities HLS Fund | | | (2,553 | ) | | | 4,936,891 | | | | (4,934,338 | ) |
Healthcare HLS Fund | | | — | | | | 12,347,386 | | | | (12,347,386 | ) |
High Yield HLS Fund | | | (63,809 | ) | | | (803,701 | ) | | | 867,510 | |
International Opportunities HLS Fund | | | (334 | ) | | | 2,047,088 | | | | (2,046,754 | ) |
MidCap HLS Fund | | | — | | | | (373,741 | ) | | | 373,741 | |
MidCap Value HLS Fund | | | (44 | ) | | | 8,615 | | | | (8,571 | ) |
Small Company HLS Fund | | | (3,170,364 | ) | | | 1,780,496 | | | | 1,389,868 | |
Small/Mid Cap Equity HLS Fund | | | 7 | | | | (445,056 | ) | | | 445,049 | |
SmallCap Growth HLS Fund | | | (15 | ) | | | (575,291 | ) | | | 575,306 | |
Stock HLS Fund | | | — | | | | (804,548 | ) | | | 804,548 | |
Total Return Bond HLS Fund | | | (658,096 | ) | | | (20,560,590 | ) | | | 21,218,686 | |
Ultrashort Bond HLS Fund | | | (31,418 | ) | | | 380,407 | | | | (348,989 | ) |
U.S. Government Securities HLS Fund | | | (8,107 | ) | | | 1,030,384 | | | | (1,022,277 | ) |
Value HLS Fund | | | — | | | | (431,509 | ) | | | 431,509 | |
| | e) | Capital Loss Carryforward – On December 22, 2010, the Regulated Investment Company Modernization Act of 2010 (the “Act”) was enacted, which made changes to the capital loss carryforward rules. The changes are effective for taxable years beginning after the date of enactment. Under the Act, funds are permitted to carry forward capital losses for an unlimited period. However, any losses incurred during those future taxable years will be required to be utilized prior to the losses incurred in pre-enactment taxable years, which carry an expiration date. As a result of this ordering rule, pre-enactment capital loss carryforwards may be more likely to expire unused. Additionally, post-enactment capital loss carryforwards retain their character as either short-term or long-term capital losses rather than being considered all short-term as permitted under prior regulation. |
At December 31, 2015 (tax year end), the capital loss carryforwards for U.S. federal income tax purposes were as follows:
| | | | | | | | | | | | | | | | | | | | |
| | | Year of Expiration | | | Unlimited
Short-Term
Capital Loss
Carryforward | | | Unlimited
Long-Term
Capital Loss
Carryforward | |
Fund | | 2016 | | | 2017 | | | 2018 | | | |
Balanced HLS Fund | | $ | — | | | $ | 199,060,323 | | | $ | — | | | $ | — | | | $ | — | |
High Yield HLS Fund | | | — | | | | 9,709,378 | | | | — | | | | 5,107,458 | | | | 6,903,999 | |
International Opportunities HLS Fund | | | 94,110,553 | | | | 287,600,120 | | | | — | | | | — | | | | — | |
Stock HLS Fund | | | — | | | | 260,419,400 | | | | — | | | | — | | | | — | |
Ultrashort Bond HLS Fund | | | — | | | | — | | | | — | | | | 102,506 | | | | 239,976 | |
U.S. Government Securities HLS Fund | | | — | | | | 25,163,377 | | | | 58,149,395 | | | | 42,739 | | | | 30,429,397 | |
Notes to Financial Statements – (continued)
December 31, 2015
During the year ended December 31, 2015, the Balanced HLS Fund, International Opportunities HLS Fund, Stock HLS Fund and U.S. Government Securities HLS Fund utilized $211,517,148, $38,493,972, $155,434,160 and $5,276,739 of prior year capital loss carryforwards, respectively.
| | f) | Accounting for Uncertainty in Income Taxes – Pursuant to provisions set forth by U.S. GAAP, Hartford Funds Management Company, LLC (“HFMC”) reviews each Fund’s tax positions for all open tax years. As of December 31, 2015, HFMC had reviewed the open tax years and concluded that there was no reason to record a liability for net unrecognized tax obligations relating to uncertain income tax positions. Each Fund files U.S. tax returns. Although the statute of limitations for examining a Fund’s U.S. tax returns remains open for 3 years, no examination is currently in progress. HFMC is not aware of any tax positions for which it is reasonably possible that the total amounts of unrecognized tax obligations will significantly change in the next twelve months. |
| | a) | Investment Management Agreement – HFMC serves as each Fund’s investment manager. Each Company, on behalf of its respective Funds, has entered into an Investment Management Agreement with HFMC. HFMC is an indirect subsidiary of The Hartford Financial Services Group, Inc. (“The Hartford”). HFMC has overall investment supervisory responsibility for each Fund. In addition, HFMC provides administrative personnel, services, equipment, facilities and office space for proper operation of each Fund. HFMC has contracted with Wellington Management Company LLP (“Wellington Management”) under a sub-advisory agreement for the provision of day-to-day investment management services to each Fund in accordance with each Fund’s investment objective and policies. Each Fund pays a fee to HFMC, a portion of which may be used to compensate Wellington Management. |
The schedule below reflects the rates of compensation paid to HFMC for investment management services rendered as of December 31, 2015; the rates are accrued daily and paid monthly based on each Fund’s average daily net assets, at the following annual rates:
| | |
Fund | | Management Fee Rates |
Balanced HLS Fund | | 0.6800% on first $250 million and; |
| | 0.6550% on next $250 million and; |
| | 0.6450% on next $500 million and; |
| | 0.5950% on next $4 billion and; |
| | 0.5925% on next $5 billion and; |
| | 0.5900% over $10 billion |
| |
Capital Appreciation HLS Fund | | 0.7750% on first $250 million and; |
| | 0.7250% on next $250 million and; |
| | 0.6750% on next $500 million and; |
| | 0.6250% on next $1.5 billion and; |
| | 0.6200% on next $2.5 billion and; |
| | 0.6150% on next $5 billion and; |
| | 0.6100% over $10 billion |
| |
Disciplined Equity HLS Fund | | 0.7750% on first $250 million and; |
| | 0.7250% on next $250 million and; |
| | 0.6750% on next $500 million and; |
| | 0.6250% on next $4 billion and; |
| | 0.6225% on next $5 billion and; |
| | 0.6200% over $10 billion |
| |
Dividend and Growth HLS Fund | | 0.7750% on first $250 million and; |
| | 0.7250% on next $250 million and; |
| | 0.6750% on next $500 million and; |
| | 0.6250% on next $1.5 billion and; |
| | 0.6200% on next $2.5 billion and; |
| | 0.6150% on next $5 billion and; |
| | 0.6100% over $10 billion |
Notes to Financial Statements – (continued)
December 31, 2015
| | |
Fund | | Management Fee Rates |
Global Growth HLS Fund | | 0.7750% on first $250 million and; |
| | 0.7250% on next $250 million and; |
| | 0.6750% on next $500 million and; |
| | 0.6250% on next $4 billion and; |
| | 0.6225% on next $5 billion and; |
| | 0.6200% over $10 billion |
| |
Growth Opportunities HLS Fund | | 0.7000% on first $100 million and; |
| | 0.6000% on next $4.9 billion and; |
| | 0.5975% on next $5 billion and; |
| | 0.5950% over $10 billion |
| |
Healthcare HLS Fund | | 0.8500% on first $250 million and; |
| | 0.8000% on next $250 million and; |
| | 0.7500% on next $4.5 billion and; |
| | 0.7475% on next $5 billion and; |
| | 0.7450% over $10 billion |
| |
High Yield HLS Fund | | 0.7000% on first $500 million and; |
| | 0.6750% on next $500 million and; |
| | 0.6250% on next $1.5 billion and; |
| | 0.6150% on next $2.5 billion and; |
| | 0.6050% on next $5 billion and; |
| | 0.5950% over $10 billion |
| |
International Opportunities HLS Fund | | 0.7750% on first $250 million and; |
| | 0.7250% on next $250 million and; |
| | 0.6750% on next $500 million and; |
| | 0.6250% on next $1.5 billion and; |
| | 0.6200% on next $2.5 billion and; |
| | 0.6150% on next $5 billion and; |
| | 0.6100% over $10 billion |
| |
MidCap HLS Fund | | 0.7750% on first $250 million and; |
| | 0.7250% on next $250 million and; |
| | 0.6750% on next $500 million and; |
| | 0.6250% on next $4 billion and; |
| | 0.6225% on next $5 billion and; |
| | 0.6200% over $10 billion |
| |
MidCap Value HLS Fund | | 0.8000% on first $500 million and; |
| | 0.7250% on next $500 million and; |
| | 0.6750% on next $1.5 billion and; |
| | 0.6700% on next $2.5 billion and; |
| | 0.6650% on next $5 billion and; |
| | 0.6600% over $10 billion |
| |
Small Company HLS Fund | | 0.7750% on first $250 million and; |
| | 0.7250% on next $250 million and; |
| | 0.6750% on next $500 million and; |
| | 0.6000% on next $500 million and; |
| | 0.5500% on next $3.5 billion and; |
| | 0.5300% on next $5 billion and; |
| | 0.5200% over $10 billion |
Notes to Financial Statements – (continued)
December 31, 2015
| | |
Fund | | Management Fee Rates |
Small/Mid Cap Equity HLS Fund | | 0.8000% on first $500 million and; |
| | 0.7500% on next $500 million and; |
| | 0.7000% on next $2 billion and; |
| | 0.6900% on next $2 billion and; |
| | 0.6800% on next $5 billion and; |
| | 0.6700% over $10 billion |
| |
SmallCap Growth HLS Fund | | 0.7000% on first $100 million and; |
| | 0.6000% on next $4.9 billion and; |
| | 0.5800% on next $5 billion and; |
| | 0.5700% over $10 billion |
| |
Stock HLS Fund | | 0.5250% on first $250 million and; |
| | 0.5000% on next $250 million and; |
| | 0.4750% on next $500 million and; |
| | 0.4500% on next $4 billion and; |
| | 0.4475% on next $5 billion and; |
| | 0.4450% over $10 billion |
| |
Total Return Bond HLS Fund | | 0.5250% on first $250 million and; |
| | 0.5000% on next $250 million and; |
| | 0.4750% on next $500 million and; |
| | 0.4500% on next $1.5 billion and; |
| | 0.4450% on next $2.5 billion and; |
| | 0.4300% on next $5 billion and; |
| | 0.4200% over $10 billion |
| |
Ultrashort Bond HLS Fund | | 0.4000% on first $5 billion and; |
| | 0.3800% on next $5 billion and; |
| | 0.3700% over $10 billion |
| |
U.S. Government Securities HLS Fund | | 0.4500% on first $500 million and; |
| | 0.4450% on next $500 million and; |
| | 0.4400% on next $1.5 billion and; |
| | 0.4350% on next $2.5 billion and; |
| | 0.4300% on next $5 billion and; |
| | 0.4200% over $10 billion |
| |
Value HLS Fund | | 0.7750% on first $250 million and; |
| | 0.7250% on next $250 million and; |
| | 0.6750% on next $500 million and; |
| | 0.6250% on next $1.5 billion and; |
| | 0.6200% on next $2.5 billion and; |
| | 0.6150% on next $5 billion and; |
| | 0.6100% over $10 billion |
HFMC contractually agreed to waive investment management fees of 0.02% of average daily net assets until December 31, 2016, for the Balanced HLS Fund.
Notes to Financial Statements – (continued)
December 31, 2015
| | b) | Accounting Services Agreement – Pursuant to the Fund Accounting Agreement between HFMC and each Company, on behalf of its respective Funds, HFMC provides accounting services to each Fund and receives monthly compensation based on each Fund’s average daily net assets at the rates set forth below. Each Fund’s accounting services fees are accrued daily and paid monthly. |
| | |
Fund | | Accounting Services Fee Rates |
Balanced HLS Fund | | 0.016% on first $5 billion and; |
| | 0.013% on next $5 billion and; |
| | 0.010% over $10 billion |
| |
Capital Appreciation HLS Fund | | 0.018% on first $5 billion and; |
| | 0.014% on next $5 billion and; |
| | 0.010% over $10 billion |
| |
Disciplined Equity HLS Fund | | 0.012% on first $5 billion and; |
| | 0.010% over $5 billion |
| |
Dividend and Growth HLS Fund | | 0.012% on first $5 billion and; |
| | 0.010% over $5 billion |
| |
Global Growth HLS Fund | | 0.014% on first $5 billion and; |
| | 0.012% on next $5 billion and; |
| | 0.010% over $10 billion |
| |
Growth Opportunities HLS Fund | | 0.010% on all assets |
| |
Healthcare HLS Fund | | 0.010% on all assets |
| |
High Yield HLS Fund | | 0.020% on first $5 billion and; |
| | 0.015% on next $5 billion and; |
| | 0.010% over $10 billion |
| |
International Opportunities HLS Fund | | 0.016% on first $5 billion and; |
| | 0.013% on next $5 billion and; |
| | 0.010% over $10 billion |
| |
MidCap HLS Fund | | 0.010% on all assets |
| |
MidCap Value HLS Fund | | 0.010% on all assets |
| |
Small Company HLS Fund | | 0.012% on first $5 billion and; |
| | 0.010% over $5 billion |
| |
Small/Mid Cap Equity HLS Fund | | 0.014% on first $5 billion and; |
| | 0.012% on next $5 billion and; |
| | 0.010% over $10 billion |
| |
SmallCap Growth HLS Fund | | 0.012% on first $5 billion and; |
| | 0.010% over $5 billion |
| |
Stock HLS Fund | | 0.010% on all assets |
| |
Total Return Bond HLS Fund | | 0.020% on first $5 billion and; |
| | 0.015% on next $5 billion and; |
| | 0.010% over $10 billion |
| |
Ultrashort Bond HLS Fund | | 0.010% on all assets |
| |
U.S. Government Securities HLS Fund | | 0.012% on first $5 billion and; |
| | 0.010% over $5 billion |
| |
Value HLS Fund | | 0.010% on all assets |
Notes to Financial Statements – (continued)
December 31, 2015
Effective January 1, 2015, HFMC has delegated certain accounting and administrative services functions to State Street Bank and Trust Company (“State Street”). The costs and expenses of such delegation are borne by HFMC, not by the Funds, and HFMC compensates State Street for its services out of its own resources.
| | c) | Operating Expenses – Allocable expenses incurred by each Company are allocated to each Fund, as applicable, and allocated to classes within each Fund in proportion to the average daily net assets of each Fund and each class, except where allocation of certain expenses is more fairly made directly to each Fund or to specific classes within a Fund. |
| | d) | Fees Paid Indirectly – Hartford HLS Series Fund II, Inc., on behalf of its series except U.S. Government Securities HLS Fund, and Hartford Series Fund, Inc., on behalf of its series except High Yield HLS Fund, Total Return Bond HLS Fund and Ultrashort Bond HLS Fund, have entered into agreements with State Street Global Markets, LLC and Russell Implementation Services, Inc. to partially recapture non-discounted trade commissions. Such rebates are used to pay a portion of the Funds’ expenses. In addition, the Funds’ custodian bank has agreed to reduce its fees when a Fund maintains cash on deposit in a non-interest-bearing custody account. For the year ended December 31, 2015, these amounts, if any, are included in the Statements of Operations. |
The ratio of expenses to average net assets in the accompanying financial highlights excludes the reduction in expenses related to fees paid indirectly. The annualized expense ratio after waivers reflecting the reduction for fees paid indirectly for the period is as follows:
| | | | | | | | | | | | |
Fund | | Class IA | | | Class IB | | | Class IC | |
Balanced HLS Fund | | | 0.63 | % | | | 0.88 | % | | | — | |
Capital Appreciation HLS Fund | | | 0.66 | % | | | 0.91 | % | | | 1.17 | % |
Disciplined Equity HLS Fund | | | 0.76 | % | | | 1.01 | % | | | — | |
Dividend & Growth HLS Fund | | | 0.67 | % | | | 0.92 | % | | | — | |
Global Growth HLS Fund | | | 0.81 | % | | | 1.06 | % | | | — | |
Growth Opportunities HLS Fund | | | 0.64 | % | | | 0.89 | % | | | 1.16 | % |
Healthcare HLS Fund | | | 0.86 | % | | | 1.11 | % | | | — | |
High Yield HLS Fund | | | 0.76 | % | | | 1.01 | % | | | — | |
International Opportunities HLS Fund | | | 0.74 | % | | | 0.99 | % | | | — | |
MidCap HLS Fund | | | 0.70 | % | | | 0.95 | % | | | — | |
MidCap Value HLS Fund | | | 0.84 | % | | | 1.09 | % | | | — | |
Small Company HLS Fund | | | 0.71 | % | | | 0.96 | % | | | — | |
Small/Mid Cap Equity HLS Fund | | | 0.88 | % | | | 1.13 | % | | | — | |
SmallCap Growth HLS Fund | | | 0.65 | % | | | 0.90 | % | | | — | |
Stock HLS Fund | | | 0.51 | % | | | 0.76 | % | | | — | |
Total Return Bond HLS Fund | | | 0.51 | % | | | 0.76 | % | | | — | |
Ultrashort Bond HLS Fund | | | 0.43 | % | | | 0.68 | % | | | — | |
U.S. Government Securities HLS Fund | | | 0.49 | % | | | 0.74 | % | | | — | |
Value HLS Fund | | | 0.78 | % | | | 1.03 | % | | | — | |
| | e) | Distribution Plans for Class IB and Class IC Shares – Hartford Funds Distributors, LLC (“HFD”), an indirect subsidiary of The Hartford, is the principal underwriter and distributor of each Fund. Each Company, on behalf of its respective Funds, has adopted a Distribution Plan pursuant to Rule 12b-1 of the 1940 Act for Class IB shares and each Company, on behalf of certain Funds, has adopted a Distribution Plan pursuant to Rule 12b-1 of the 1940 Act for Class IC shares. |
Pursuant to the Class IB Distribution Plans, a Fund may pay HFD a fee of up to 0.25% of the average daily net assets of the Fund attributable to its Class IB shares for distribution financing activities and shareholder account servicing activities. The entire amount of the fee may be used for shareholder servicing expenses and/or distribution expenses. Pursuant to the Class IC Distribution Plans, a Fund may pay HFD a fee of up to 0.25% of the average daily net assets of the Fund attributable to its Class IC shares for distribution financing activities.
Each Board has the authority to suspend or reduce these payments at any point in time. The distribution fees paid during the period can be found on the Statements of Operations. These fees are accrued daily and paid monthly or at such other intervals as each Company’s Board of Directors may determine.
Notes to Financial Statements – (continued)
December 31, 2015
| | f) | Administrative Services Fee for Class IC Shares – Certain Funds may pay an administrative services fee to third party insurance companies up to 0.25% of the average daily net assets of the Fund attributable to its Class IC shares for recordkeeping and/or other administrative services provided to such Class IC shares. The total administrative services fees paid during the period are shown on the Statements of Operations. These fees are accrued daily and paid monthly. |
| | g) | Other Related Party Transactions – Certain officers of each Company are directors and/or officers of HFMC and/or The Hartford or its subsidiaries. For the year ended December 31, 2015, a portion of each Company’s Chief Compliance Officer’s compensation was paid by all of the investment companies in the Hartford fund complex. The portion allocated to each Fund, as represented in other expenses on the Statement of Operations, is outlined in the table below. Hartford Administrative Services Company (“HASCO”), an indirect subsidiary of The Hartford, provides transfer agent services to each Fund. Pursuant to a sub-transfer agency agreement between HASCO and Boston Financial Data Services, Inc. (“BFDS”), HASCO has delegated certain transfer agent, dividend disbursing agent and shareholder servicing agent functions to BFDS. HASCO is compensated per fund fee annually, plus out of pocket expenses for providing such services, a portion of which may be used to compensate BFDS. The amount paid to HASCO can be found in the Statements of Operations. These fees are accrued daily and paid monthly. |
| | | | |
Fund | | CCO Compensation
Paid By Fund | |
Balanced HLS Fund | | $ | 5,434 | |
Capital Appreciation HLS Fund | | | 13,778 | |
Disciplined Equity HLS Fund | | | 1,608 | |
Dividend and Growth HLS Fund | | | 7,486 | |
Global Growth HLS Fund | | | 1,035 | |
Growth Opportunities HLS Fund | | | 2,974 | |
Healthcare HLS Fund | | | 906 | |
High Yield HLS Fund | | | 727 | |
International Opportunities HLS Fund | | | 2,860 | |
Midcap HLS Fund | | | 3,814 | |
MidCap Value HLS Fund | | | 838 | |
Small Company HLS Fund | | | 2,621 | |
Small/Mid Cap Equity HLS Fund | | | 211 | |
SmallCap Growth HLS Fund | | | 2,438 | |
Stock HLS Fund | | | 3,336 | |
Total Return Bond HLS Fund | | | 5,904 | |
Ultrashort Bond HLS Fund | | | 1,533 | |
U.S. Government Securities HLS Fund | | | 1,083 | |
Value HLS Fund | | | 1,130 | |
Notes to Financial Statements – (continued)
December 31, 2015
As of December 31, 2015, affiliates of The Hartford had ownership of shares in each Fund as follows:
Percentage of Class:
| | | | | | | | | | | | |
Fund | | Class IA | | | Class IB | | | Class IC | |
Balanced HLS Fund | | | — | | | | — | | | | — | |
Capital Appreciation HLS Fund | | | — | | | | — | | | | 1 | % |
Disciplined Equity HLS Fund | | | — | | | | — | | | | — | |
Dividend & Growth HLS Fund | | | — | | | | — | | | | — | |
Global Growth HLS Fund | | | — | | | | — | | | | — | |
Growth Opportunities HLS Fund | | | — | | | | — | | | | 1 | % |
Healthcare HLS Fund | | | — | | | | — | | | | — | |
High Yield HLS Fund | | | — | | | | — | | | | — | |
International Opportunities HLS Fund | | | — | | | | — | | | | — | |
MidCap HLS Fund | | | — | | | | — | | | | — | |
MidCap Value HLS Fund | | | — | | | | — | | | | — | |
Small Company HLS Fund | | | — | | | | — | | | | — | |
Small/Mid Cap Equity HLS Fund | | | — | | | | — | | | | — | |
SmallCap Growth HLS Fund | | | — | | | | — | | | | — | |
Stock HLS Fund | | | — | | | | — | | | | — | |
Total Return Bond HLS Fund | | | — | | | | — | | | | — | |
Ultrashort Bond HLS Fund | | | — | | | | — | | | | — | |
U.S. Government Securities HLS Fund | | | — | | | | — | | | | — | |
Value HLS Fund | | | — | | | | — | | | | — | |
Percentage of Fund:
| | | | | | | | | | | | |
Fund | | Class IA | | | Class IB | | | Class IC | |
Balanced HLS Fund | | | — | | | | — | | | | — | |
Capital Appreciation HLS Fund | | | — | | | | — | | | | — | %* |
Disciplined Equity HLS Fund | | | — | | | | — | | | | — | |
Dividend & Growth HLS Fund | | | — | | | | — | | | | — | |
Global Growth HLS Fund | | | — | | | | — | | | | — | |
Growth Opportunities HLS Fund | | | — | | | | — | | | | — | %* |
Healthcare HLS Fund | | | — | | | | — | | | | — | |
High Yield HLS Fund | | | — | | | | — | | | | — | |
International Opportunities HLS Fund | | | — | | | | — | | | | — | |
MidCap HLS Fund | | | — | | | | — | | | | — | |
MidCap Value HLS Fund | | | — | | | | — | | | | — | |
Small Company HLS Fund | | | — | | | | — | | | | — | |
Small/Mid Cap Equity HLS Fund | | | — | | | | — | | | | — | |
SmallCap Growth HLS Fund | | | — | | | | — | | | | — | |
Stock HLS Fund | | | — | | | | — | | | | — | |
Total Return Bond HLS Fund | | | — | | | | — | | | | — | |
Ultrashort Bond HLS Fund | | | — | | | | — | | | | — | |
U.S. Government Securities HLS Fund | | | — | | | | — | | | | — | |
Value HLS Fund | | | — | | | | — | | | | — | |
| | * | Percentage rounds to zero. |
Notes to Financial Statements – (continued)
December 31, 2015
| 9. | Investment Transactions: |
For the year ended December 31, 2015, the cost of purchases and proceeds from sales of investment securities (excluding short-term investments) were as follows:
| | | | | | | | |
Fund | | Cost of Purchases
Excluding U.S.
Government
Obligations | | | Sales Proceeds
Excluding U.S.
Government
Obligations | |
Balanced HLS Fund | | $ | 388,421,005 | | | $ | 573,738,746 | |
Capital Appreciation HLS Fund | | $ | 5,023,702,003 | | | $ | 5,995,120,798 | |
Disciplined Equity HLS Fund | | $ | 226,419,339 | | | $ | 388,575,607 | |
Dividend & Growth HLS Fund | | $ | 718,996,823 | | | $ | 1,189,333,527 | |
Global Growth HLS Fund | | $ | 322,830,433 | | | $ | 361,499,586 | |
Growth Opportunities HLS Fund | | $ | 1,504,897,682 | | | $ | 1,652,410,282 | |
Healthcare HLS Fund | | $ | 174,703,123 | | | $ | 150,360,494 | |
High Yield HLS Fund | | $ | 129,466,527 | | | $ | 183,679,251 | |
International Opportunities HLS Fund | | $ | 946,311,274 | | | $ | 1,091,343,330 | |
MidCap HLS Fund | | $ | 694,160,202 | | | $ | 647,111,871 | |
MidCap Value HLS Fund | | $ | 122,988,214 | | | $ | 189,857,839 | |
Small Company HLS Fund | | $ | 1,244,009,120 | | | $ | 1,338,008,307 | |
Small/Mid Cap Equity HLS Fund | | $ | 88,392,913 | | | $ | 107,376,273 | |
SmallCap Growth HLS Fund | | $ | 998,342,474 | | | $ | 517,282,149 | |
Stock HLS Fund | | $ | 373,048,153 | | | $ | 594,355,603 | |
Total Return Bond HLS Fund | | $ | 1,631,480,221 | | | $ | 1,515,520,091 | |
Ultrashort Bond HLS Fund | | $ | 144,840,751 | | | $ | 299,004,079 | |
U.S. Government Securities HLS Fund | | $ | 58,008,431 | | | $ | 64,505,699 | |
Value HLS Fund | | $ | 106,475,701 | | | $ | 174,851,673 | |
| | | | | | | | |
Fund | | Cost of Purchases
For U.S.
Government
Obligations | | | Sales Proceeds
For U.S.
Government
Obligations | |
Balanced HLS Fund | | $ | 92,693,901 | | | $ | 255,229,316 | |
Capital Appreciation HLS Fund | | $ | — | | | $ | — | |
Disciplined Equity HLS Fund | | $ | — | | | $ | — | |
Dividend & Growth HLS Fund | | $ | — | | | $ | — | |
Global Growth HLS Fund | | $ | — | | | $ | — | |
Growth Opportunities HLS Fund | | $ | — | | | $ | — | |
Healthcare HLS Fund | | $ | — | | | $ | — | |
High Yield HLS Fund | | $ | — | | | $ | — | |
International Opportunities HLS Fund | | $ | — | | | $ | — | |
MidCap HLS Fund | | $ | — | | | $ | — | |
MidCap Value HLS Fund | | $ | — | | | $ | — | |
Small Company HLS Fund | | $ | — | | | $ | — | |
Small/Mid Cap Equity HLS Fund | | $ | — | | | $ | — | |
SmallCap Growth HLS Fund | | $ | — | | | $ | — | |
Stock HLS Fund | | $ | — | | | $ | — | |
Total Return Bond HLS Fund | | $ | 878,127,739 | | | $ | 1,054,977,349 | |
Ultrashort Bond HLS Fund | | $ | 127,123,325 | | | $ | 142,683,907 | |
U.S. Government Securities HLS Fund | | $ | 185,509,119 | | | $ | 214,640,858 | |
Value HLS Fund | | $ | — | | | $ | — | |
Notes to Financial Statements – (continued)
December 31, 2015
| | | | | | | | |
Fund | | Total Cost of
Purchases | | | Total Sales
Proceeds | |
Balanced HLS Fund | | $ | 481,114,906 | | | $ | 828,968,062 | |
Capital Appreciation HLS Fund | | $ | 5,023,702,003 | | | $ | 5,995,120,798 | |
Disciplined Equity HLS Fund | | $ | 226,419,339 | | | $ | 388,575,607 | |
Dividend & Growth HLS Fund | | $ | 718,996,823 | | | $ | 1,189,333,527 | |
Global Growth HLS Fund | | $ | 322,830,433 | | | $ | 361,499,586 | |
Growth Opportunities HLS Fund | | $ | 1,504,897,682 | | | $ | 1,652,410,282 | |
Healthcare HLS Fund | | $ | 174,703,123 | | | $ | 150,360,494 | |
High Yield HLS Fund | | $ | 129,466,527 | | | $ | 183,679,251 | |
International Opportunities HLS Fund | | $ | 946,311,274 | | | $ | 1,091,343,330 | |
MidCap HLS Fund | | $ | 694,160,202 | | | $ | 647,111,871 | |
MidCap Value HLS Fund | | $ | 122,988,214 | | | $ | 189,857,839 | |
Small Company HLS Fund | | $ | 1,244,009,120 | | | $ | 1,338,008,307 | |
Small/Mid Cap Equity HLS Fund | | $ | 88,392,913 | | | $ | 107,376,273 | |
SmallCap Growth HLS Fund | | $ | 998,342,474 | | | $ | 517,282,149 | |
Stock HLS Fund | | $ | 373,048,153 | | | $ | 594,355,603 | |
Total Return Bond HLS Fund | | $ | 2,509,607,960 | | | $ | 2,570,497,440 | |
Ultrashort Bond HLS Fund | | $ | 271,964,076 | | | $ | 441,687,986 | |
U.S. Government Securities HLS Fund | | $ | 243,517,550 | | | $ | 279,146,557 | |
Value HLS Fund | | $ | 106,475,701 | | | $ | 174,851,673 | |
For the year ended December 31, 2015, MidCap HLS Fund engaged in security transactions with The Hartford MidCap Fund. These amounted to $75,098,511 in purchases of investments, which are included in the above.
| 10. | Capital Share Transactions: |
The following information is for the year ended December 31, 2015, and the year ended December 31, 2014:
| | | | | | | | | | | | | | | | |
Balanced HLS Fund | | | | | | | | | | | | | | | | |
| | | For the Year Ended
December 31, 2015 | | | For the Year Ended
December 31, 2014 | |
| | | Shares | | | Amount | | | Shares | | | Amount | |
Class IA | | | | | | | | | | | | | | | | |
Shares Sold | | | 469,371 | | | $ | 12,840,849 | | | | 1,016,227 | | | $ | 26,555,626 | |
Shares Issued for Reinvested Dividends | | | 1,613,469 | | | | 43,115,909 | | | | 1,665,575 | | | | 45,323,982 | |
Shares Redeemed | | | (13,603,501 | ) | | | (371,124,721 | ) | | | (18,917,889 | ) | | | (493,775,737 | ) |
| | | | | | | | | | | | | | | | |
Net Increase (Decrease) | | | (11,520,661 | ) | | | (315,167,963) | | | | (16,236,087 | ) | | | (421,896,129 | ) |
| | | | | | | | | | | | | | | | |
Class IB | | | | | | | | | | | | | | | | |
Shares Sold | | | 139,993 | | | $ | 3,867,458 | | | | 126,694 | | | $ | 3,392,605 | |
Shares Issued for Reinvested Dividends | | | 184,225 | | | | 4,997,202 | | | | 197,051 | | | | 5,428,017 | |
Shares Redeemed | | | (2,369,687 | ) | | | (65,344,297 | ) | | | (2,837,831 | ) | | | (74,968,148 | ) |
| | | | | | | | | | | | | | | | |
Net Increase (Decrease) | | | (2,045,469 | ) | | | (56,479,637 | ) | | | (2,514,086 | ) | | | (66,147,526 | ) |
| | | | | | | | | | | | | | | | |
Total Net Increase (Decrease) | | | (13,566,130 | ) | | $ | (371,647,600) | | | | (18,750,173 | ) | | $ | (488,043,655) | |
| | | | | | | | | | | | | | | | |
Notes to Financial Statements – (continued)
December 31, 2015
| | | | | | | | | | | | | | | | |
Capital Appreciation HLS Fund | | | | | | | | | | | | | | | | |
| | | For the Year Ended
December 31, 2015 | | | For the Year Ended
December 31, 2014 | |
| | | Shares | | | Amount | | | Shares | | | Amount | |
Class IA | | | | | | | | | | | | | | | | |
Shares Sold | | | 3,266,797 | | | $ | 165,572,633 | | | | 6,700,296 | | | $ | 401,262,093 | |
Shares Issued for Reinvested Dividends | | | 26,063,902 | | | | 1,196,703,908 | | | | 18,007,312 | | | | 997,893,277 | |
Shares Redeemed | | | (19,316,788 | ) | | | (1,015,737,819) | | | | (24,279,839 | ) | | | (1,433,686,002 | ) |
| | | | | | | | | | | | | | | | |
Net Increase (Decrease) | | | 10,013,911 | | | | 346,538,722 | | | | 427,767 | | | | (34,530,632 | ) |
| | | | | | | | | | | | | | | | |
Class IB | | | | | | | | | | | | | | | | |
Shares Sold | | | 172,518 | | | $ | 8,688,942 | | | | 188,821 | | | $ | 10,782,159 | |
Shares Issued for Reinvested Dividends | | | 3,043,632 | | | | 137,948,750 | | | | 2,189,104 | | | | 120,021,912 | |
Shares Redeemed | | | (2,715,739 | ) | | | (139,784,790 | ) | | | (4,656,944 | ) | | | (272,505,170 | ) |
| | | | | | | | | | | | | | | | |
Net Increase (Decrease) | | | 500,411 | | | | 6,852,902 | | | | (2,279,019 | ) | | | (141,701,099 | ) |
| | | | | | | | | | | | | | | | |
Class IC | | | | | | | | | | | | | | | | |
Shares Sold | | | 284,973 | | | $ | 14,624,663 | | | | 61,928 | | | $ | 3,444,399 | |
Shares Issued for Reinvested Dividends | | | 53,375 | | | | 2,435,033 | | | | 2,122 | | | | 117,200 | |
Shares Redeemed | | | (34,820 | ) | | | (1,661,177 | ) | | | (794 | ) | | | (43,794 | ) |
| | | | | | | | | | | | | | | | |
Net Increase (Decrease) | | | 303,528 | | | | 15,398,519 | | | | 63,256 | | | | 3,517,805 | |
| | | | | | | | | | | | | | | | |
Total Net Increase (Decrease) | | | 10,817,850 | | | $ | 368,790,143 | | | | (1,787,996 | ) | | $ | (172,713,926 | ) |
| | | | | | | | | | | | | | | | |
Disciplined Equity HLS Fund | | | | | | | | | | | | | | | | |
| | | For the Year Ended
December 31, 2015 | | | For the Year Ended
December 31, 2014 | |
| | | Shares | | | Amount | | | Shares | | | Amount | |
Class IA | | | | | | | | | | | | | | | | |
Shares Sold | | | 589,196 | | | $ | 10,439,373 | | | | 403,695 | | | $ | 8,011,289 | |
Shares Issued for Reinvested Dividends | | | 13,406,784 | | | | 213,986,540 | | | | 564,317 | | | | 11,917,305 | |
Shares Redeemed | | | (7,325,609 | ) | | | (141,925,976 | ) | | | (10,159,438 | ) | | | (196,512,486) | |
| | | | | | | | | | | | | | | | |
Net Increase (Decrease) | | | 6,670,371 | | | | 82,499,937 | | | | (9,191,426 | ) | | | (176,583,892 | ) |
| | | | | | | | | | | | | | | | |
Class IB | | | | | | | | | | | | | | | | |
Shares Sold | | | 168,976 | | | $ | 2,946,000 | | | | 178,285 | | | $ | 3,578,777 | |
Shares Issued for Reinvested Dividends | | | 1,914,322 | | | | 30,274,969 | | | | 70,541 | | | | 1,482,159 | |
Shares Redeemed | | | (1,292,932 | ) | | | (25,084,582 | ) | | | (1,587,375 | ) | | | (30,468,557 | ) |
| | | | | | | | | | | | | | | | |
Net Increase (Decrease) | | | 790,366 | | | | 8,136,387 | | | | (1,338,549 | ) | | | (25,407,621 | ) |
| | | | | | | | | | | | | | | | |
Total Net Increase (Decrease) | | | 7,460,737 | | | $ | 90,636,324 | | | | (10,529,975 | ) | | $ | (201,991,513 | ) |
| | | | | | | | | | | | | | | | |
Notes to Financial Statements – (continued)
December 31, 2015
| | | | | | | | | | | | | | | | |
Dividend & Growth HLS Fund | | | | | | | | | | | | | | | | |
| | | For the Year Ended
December 31, 2015 | | | For the Year Ended
December 31, 2014 | |
| | | Shares | | | Amount | | | Shares | | | Amount | |
Class IA | | | | | | | | | | | | | | | | |
Shares Sold | | | 2,257,878 | | | $ | 56,525,716 | | | | 2,824,776 | | | $ | 77,988,414 | |
Shares Issued for Reinvested Dividends | | | 21,995,067 | | | | 503,458,112 | | | | 18,649,934 | | | | 492,460,367 | |
Shares Redeemed | | | (21,218,821 | ) | | | (531,488,308 | ) | | | (28,061,477 | ) | | | (774,792,328 | ) |
| | | | | | | | | | | | | | | | |
Net Increase (Decrease) | | | 3,034,124 | | | | 28,495,520 | | | | (6,586,767 | ) | | | (204,343,547 | ) |
| | | | | | | | | | | | | | | | |
Class IB | | | | | | | | | | | | | | | | |
Shares Sold | | | 395,051 | | | $ | 9,477,984 | | | | 393,364 | | | $ | 10,839,363 | |
Shares Issued for Reinvested Dividends | | | 3,302,608 | | | | 75,299,375 | | | | 3,058,738 | | | | 80,391,967 | |
Shares Redeemed | | | (3,972,074 | ) | | | (99,357,475 | ) | | | (5,789,235 | ) | | | (156,635,532 | ) |
| | | | | | | | | | | | | | | | |
Net Increase (Decrease) | | | (274,415 | ) | | | (14,580,116 | ) | | | (2,337,133 | ) | | | (65,404,202 | ) |
| | | | | | | | | | | | | | | | |
Total Net Increase (Decrease) | | | 2,759,709 | | | $ | 13,915,404 | | | | (8,923,900 | ) | | $ | (269,747,749 | ) |
| | | | | | | | | | | | | | | | |
Global Growth HLS Fund | | | | | | | | | | | | | | | | |
| | | For the Year Ended
December 31, 2015 | | | For the Year Ended
December 31, 2014 | |
| | | Shares | | | Amount | | | Shares | | | Amount | |
Class IA | | | | | | | | | | | | | | | | |
Shares Sold | | | 935,076 | | | $ | 23,257,954 | | | | 647,760 | | | $ | 12,573,961 | |
Issued in Merger | | | — | | | | — | | | | 2,474,082 | | | | 60,232,275 | |
Shares Issued for Reinvested Dividends | | | 802,612 | | | | 19,872,670 | | | | 76,202 | | | | 1,805,993 | |
Shares Redeemed | | | (2,017,988 | ) | | | (49,833,729 | ) | | | (2,961,963 | ) | | | (67,948,275 | ) |
| | | | | | | | | | | | | | | | |
Net Increase (Decrease) | | | (280,300 | ) | | | (6,703,105 | ) | | | 236,081 | | | | 6,663,954 | |
| | | | | | | | | | | | | | | | |
Class IB | | | | | | | | | | | | | | | | |
Shares Sold | | | 272,638 | | | $ | 6,866,485 | | | | 178,451 | | | $ | 4,066,109 | |
Issued in Merger | | | — | | | | — | | | | 1,052,659 | | | | 24,367,487 | |
Shares Issued for Reinvested Dividends | | | 179,743 | | | | 4,418,091 | | | | 10,302 | | | | 242,510 | |
Shares Redeemed | | | (812,324 | ) | | | (19,908,755 | ) | | | (896,014 | ) | | | (20,396,513 | ) |
| | | | | | | | | | | | | | | | |
Net Increase (Decrease) | | | (359,943 | ) | | | (8,624,179 | ) | | | 345,398 | | | | 8,279,593 | |
| | | | | | | | | | | | | | | | |
Total Net Increase (Decrease) | | | (640,243 | ) | | $ | (15,327,284) | | | | 581,479 | | | $ | 14,943,547 | |
| | | | | | | | | | | | | | | | |
Notes to Financial Statements – (continued)
December 31, 2015
| | | | | | | | | | | | | | | | |
Growth Opportunities HLS Fund | | | | | | | | | | | | | | | | |
| | | For the Year Ended
December 31, 2015 | | | For the Year Ended
December 31, 2014 | |
| | | Shares | | | Amount | | | Shares | | | Amount | |
Class IA | | | | | | | | | | | | | | | | |
Shares Sold | | | 1,044,247 | | | $ | 39,449,289 | | | | 495,381 | | | $ | 18,295,216 | |
Issued in Merger | | | — | | | | — | | | | 3,721,842 | | | | 160,101,000 | |
Shares Issued for Reinvested Dividends | | | 7,007,351 | | | | 247,639,819 | | | | 5,256,708 | | | | 194,393,056 | |
Shares Redeemed | | | (4,659,838 | ) | | | (181,701,168) | | | | (5,564,784 | ) | | | (224,530,390) | |
| | | | | | | | | | | | | | | | |
Net Increase (Decrease) | | | 3,391,760 | | | | 105,387,940 | | | | 3,909,147 | | | | 148,258,882 | |
| | | | | | | | | | | | | | | | |
Class IB | | | | | | | | | | | | | | | | |
Shares Sold | | | 405,871 | | | $ | 15,372,728 | | | | 244,740 | | | $ | 11,340,021 | |
Issued in Merger | | | — | | | | — | | | | 1,470,452 | | | | 61,940,000 | |
Shares Issued for Reinvested Dividends | | | 979,058 | | | | 33,542,514 | | | | 761,955 | | | | 27,514,208 | |
Shares Redeemed | | | (914,513 | ) | | | (34,771,551 | ) | | | (1,053,911 | ) | | | (40,690,411 | ) |
| | | | | | | | | | | | | | | | |
Net Increase (Decrease) | | | 470,416 | | | | 14,143,691 | | | | 1,423,236 | | | | 60,103,818 | |
| | | | | | | | | | | | | | | | |
Class IC | | | | | | | | | | | | | | | | |
Shares Sold | | | 499,835 | | | $ | 18,859,811 | | | | 44,659 | | | $ | 1,714,981 | |
Shares Issued for Reinvested Dividends | | | 64,843 | | | | 2,276,630 | | | | 1,247 | | | | 46,044 | |
Shares Redeemed | | | (16,081 | ) | | | (608,691 | ) | | | (1,589 | ) | | | (61,812 | ) |
| | | | | | | | | | | | | | | | |
Net Increase (Decrease) | | | 548,597 | | | | 20,527,750 | | | | 44,317 | | | | 1,699,213 | |
| | | | | | | | | | | | | | | | |
Total Net Increase (Decrease) | | | 4,410,773 | | | $ | 140,059,381 | | | | 5,376,700 | | | $ | 210,061,913 | |
| | | | | | | | | | | | | | | | |
Healthcare HLS Fund | | | | | | | | | | | | | | | | |
| | | For the Year Ended
December 31, 2015 | | | For the Year Ended
December 31, 2014 | |
| | | Shares | | | Amount | | | Shares | | | Amount | |
Class IA | | | | | | | | | | | | | | | | |
Shares Sold | | | 3,399,145 | | | $ | 109,589,966 | | | | 3,202,296 | | | $ | 90,156,792 | |
Shares Issued for Reinvested Dividends | | | 1,330,488 | | | | 41,644,271 | | | | 809,581 | | | | 21,923,467 | |
Shares Redeemed | | | (2,879,751 | ) | | | (89,869,052 | ) | | | (3,456,814 | ) | | | (96,028,202 | ) |
| | | | | | | | | | | | | | | | |
Net Increase (Decrease) | | | 1,849,882 | | | | 61,365,185 | | | | 555,063 | | | | 16,052,057 | |
| | | | | | | | | | | | | | | | |
Class IB | | | | | | | | | | | | | | | | |
Shares Sold | | | 256,484 | | | $ | 7,997,496 | | | | 168,747 | | | $ | 4,602,943 | |
Shares Issued for Reinvested Dividends | | | 255,965 | | | | 7,763,435 | | | | 183,076 | | | | 4,833,193 | |
Shares Redeemed | | | (445,685 | ) | | | (13,476,919 | ) | | | (566,277 | ) | | | (15,305,987 | ) |
| | | | | | | | | | | | | | | | |
Net Increase (Decrease) | | | 66,764 | | | | 2,284,012 | | | | (214,454 | ) | | | (5,869,851 | ) |
| | | | | | | | | | | | | | | | |
Total Net Increase (Decrease) | | | 1,916,646 | | | $ | 63,649,197 | | | | 340,609 | | | $ | 10,182,206 | |
| | | | | | | | | | | | | | | | |
Notes to Financial Statements – (continued)
December 31, 2015
| | | | | | | | | | | | | | | | |
High Yield HLS Fund | | | | | | | | | | | | | | | | |
| | | For the Year Ended
December 31, 2015 | | | For the Year Ended
December 31, 2014 | |
| | | Shares | | | Amount | | | Shares | | | Amount | |
Class IA | | | | | | | | | | | | | | | | |
Shares Sold | | | 2,617,181 | | | $ | 21,697,811 | | | | 2,977,735 | | | $ | 26,543,410 | |
Shares Issued for Reinvested Dividends | | | 2,396,567 | | | | 18,980,813 | | | | 3,066,972 | | | | 26,651,985 | |
Shares Redeemed | | | (9,818,209 | ) | | | (81,320,965 | ) | | | (11,724,021 | ) | | | (104,813,899 | ) |
| | | | | | | | | | | | | | | | |
Net Increase (Decrease) | | | (4,804,461 | ) | | | (40,642,341 | ) | | | (5,679,314 | ) | | | (51,618,504 | ) |
| | | | | | | | | | | | | | | | |
Class IB | | | | | | | | | | | | | | | | |
Shares Sold | | | 607,578 | | | $ | 4,903,841 | | | | 611,335 | | | $ | 5,349,431 | |
Shares Issued for Reinvested Dividends | | | 760,729 | | | | 5,933,685 | | | | 993,296 | | | | 8,502,614 | |
Shares Redeemed | | | (3,703,573 | ) | | | (29,754,673 | ) | | | (3,248,414 | ) | | | (28,595,208 | ) |
| | | | | | | | | | | | | | | | |
Net Increase (Decrease) | | | (2,335,266 | ) | | | (18,917,147 | ) | | | (1,643,783 | ) | | | (14,743,163 | ) |
| | | | | | | | | | | | | | | | |
Total Net Increase (Decrease) | | | (7,139,727 | ) | | $ | (59,559,488) | | | | (7,323,097 | ) | | $ | (66,361,667) | |
| | | | | | | | | | | | | | | | |
International Opportunities HLS Fund | | | | | | | | | | | | | | | | |
| | | For the Year Ended
December 31, 2015 | | | For the Year Ended
December 31, 2014 | |
| | | Shares | | | Amount | | | Shares | | | Amount | |
Class IA | | | | | | | | | | | | | | | | |
Shares Sold | | | 4,351,758 | | | $ | 63,756,544 | | | | 11,515,523 | | | $ | 169,765,678 | |
Shares Issued for Reinvested Dividends | | | 1,200,778 | | | | 17,879,578 | | | | 1,907,208 | | | | 28,436,476 | |
Shares Redeemed | | | (12,532,632 | ) | | | (184,629,876 | ) | | | (22,388,196 | ) | | | (331,505,772 | ) |
| | | | | | | | | | | | | | | | |
Net Increase (Decrease) | | | (6,980,096 | ) | | | (102,993,754 | ) | | | (8,965,465 | ) | | | (133,303,618 | ) |
| | | | | | | | | | | | | | | | |
Class IB | | | | | | | | | | | | | | | | |
Shares Sold | | | 1,065,275 | | | $ | 16,100,444 | | | | 2,024,127 | | | $ | 31,232,954 | |
Shares Issued for Reinvested Dividends | | | 144,330 | | | | 2,176,492 | | | | 268,060 | | | | 4,045,018 | |
Shares Redeemed | | | (2,491,080 | ) | | | (37,270,704 | ) | | | (3,236,566 | ) | | | (48,501,079 | ) |
| | | | | | | | | | | | | | | | |
Net Increase (Decrease) | | | (1,281,475 | ) | | | (18,993,768 | ) | | | (944,379 | ) | | | (13,223,107 | ) |
| | | | | | | | | | | | | | | | |
Total Net Increase (Decrease) | | | (8,261,571 | ) | | $ | (121,987,522 | ) | | | (9,909,844 | ) | | $ | (146,526,725 | ) |
| | | | | | | | | | | | | | | | |
Notes to Financial Statements – (continued)
December 31, 2015
| | | | | | | | | | | | | | | | |
MidCap HLS Fund | | | | | | | | | | | | | | | | |
| | | For the Year Ended
December 31, 2015 | | | For the Year Ended
December 31, 2014 | |
| | | Shares | | | Amount | | | Shares | | | Amount | |
Class IA | | | | | | | | | | | | | | | | |
Shares Sold | | | 6,120,970 | | | $ | 232,038,567 | | | | 8,940,775 | | | $ | 344,106,456 | |
Shares Issued for Reinvested Dividends | | | 5,541,888 | | | | 198,571,970 | | | | 5,167,625 | | | | 192,240,024 | |
Shares Redeemed | | | (7,486,621 | ) | | | (279,695,610 | ) | | | (8,509,678 | ) | | | (329,178,774 | ) |
| | | | | | | | | | | | | | | | |
Net Increase (Decrease) | | | 4,176,237 | | | | 150,914,927 | | | | 5,598,722 | | | | 207,167,706 | |
| | | | | | | | | | | | | | | | |
Class IB | | | | | | | | | | | | | | | | |
Shares Sold | | | 1,472,929 | | | $ | 55,008,904 | | | | 157,530 | | | $ | 6,043,616 | |
Shares Issued for Reinvested Dividends | | | 362,679 | | | | 12,792,105 | | | | 271,843 | | | | 10,000,370 | |
Shares Redeemed | | | (951,307 | ) | | | (36,505,511 | ) | | | (359,225 | ) | | | (13,716,831 | ) |
| | | | | | | | | | | | | | | | |
Net Increase (Decrease) | | | 884,301 | | | | 31,295,498 | | | | 70,148 | | | | 2,327,155 | |
| | | | | | | | | | | | | | | | |
Total Net Increase (Decrease) | | | 5,060,538 | | | $ | 182,210,425 | | | | 5,668,870 | | | $ | 209,494,861 | |
| | | | | | | | | | | | | | | | |
MidCap Value HLS Fund | | | | | | | | | | | | | | | | |
| | | For the Year Ended
December 31, 2015 | | | For the Year Ended
December 31, 2014 | |
| | | Shares | | | Amount | | | Shares | | | Amount | |
Class IA | | | | | | | | | | | | | | | | |
Shares Sold | | | 449,172 | | | $ | 6,170,492 | | | | 730,211 | | | $ | 11,362,850 | |
Shares Issued for Reinvested Dividends | | | 3,572,628 | | | | 46,086,897 | | | | 3,278,942 | | | | 47,938,129 | |
Shares Redeemed | | | (4,047,882 | ) | | | (58,318,837 | ) | | | (4,694,976 | ) | | | (72,058,642 | ) |
| | | | | | | | | | | | | | | | |
Net Increase (Decrease) | | | (26,082 | ) | | | (6,061,448 | ) | | | (685,823 | ) | | | (12,757,663 | ) |
| | | | | | | | | | | | | | | | |
Class IB | | | | | | | | | | | | | | | | |
Shares Sold | | | 153,855 | | | $ | 2,252,753 | | | | 209,789 | | | $ | 3,313,647 | |
Shares Issued for Reinvested Dividends | | | 1,163,263 | | | | 14,913,036 | | | | 1,047,851 | | | | 15,235,747 | |
Shares Redeemed | | | (1,467,107 | ) | | | (20,389,208 | ) | | | (1,650,658 | ) | | | (25,363,125 | ) |
| | | | | | | | | | | | | | | | |
Net Increase (Decrease) | | | (149,989 | ) | | | (3,223,419 | ) | | | (393,018 | ) | | | (6,813,731 | ) |
| | | | | | | | | | | | | | | | |
Total Net Increase (Decrease) | | | (176,071 | ) | | $ | (9,284,867 | ) | | | (1,078,841 | ) | | $ | (19,571,394 | ) |
| | | | | | | | | | | | | | | | |
Notes to Financial Statements – (continued)
December 31, 2015
| | | | | | | | | | | | | | | | |
Small Company HLS Fund | | | | | | | | | | | | | | | | |
| | | For the Year Ended
December 31, 2015 | | | For the Year Ended
December 31, 2014 | |
| | | Shares | | | Amount | | | Shares | | | Amount | |
Class IA | | | | | | | | | | | | | | | | |
Shares Sold | | | 6,717,473 | | | $ | 150,841,613 | | | | 6,960,505 | | | $ | 174,344,804 | |
Shares Issued for Reinvested Dividends | | | 11,998,775 | | | | 235,415,969 | | | | 10,086,594 | | | | 226,746,631 | |
Shares Redeemed | | | (9,745,990 | ) | | | (209,512,224 | ) | | | (13,471,628 | ) | | | (335,078,168 | ) |
| | | | | | | | | | | | | | | | |
Net Increase (Decrease) | | | 8,970,258 | | | | 176,745,358 | | | | 3,575,471 | | | | 66,013,267 | |
| | | | | | | | | | | | | | | | |
Class IB | | | | | | | | | | | | | | | | |
Shares Sold | | | 737,248 | | | $ | 15,492,511 | | | | 673,404 | | | $ | 16,295,371 | |
Shares Issued for Reinvested Dividends | | | 1,196,244 | | | | 22,082,672 | | | | 1,101,190 | | | | 23,620,519 | |
Shares Redeemed | | | (1,518,245 | ) | | | (32,011,866 | ) | | | (1,776,759 | ) | | | (42,502,375 | ) |
| | | | | | | | | | | | | | | | |
Net Increase (Decrease) | | | 415,247 | | | | 5,563,317 | | | | (2,165 | ) | | | (2,586,485 | ) |
| | | | | | | | | | | | | | | | |
Total Net Increase (Decrease) | | | 9,385,505 | | | $ | 182,308,675 | | | | 3,573,306 | | | $ | 63,426,782 | |
| | | | | | | | | | | | | | | | |
Small/Mid Cap Equity HLS Fund | | | | | | | | | | | | | | | | |
| | | For the Year Ended
December 31, 2015 | | | For the Year Ended
December 31, 2014 | |
| | | Shares | | | Amount | | | Shares | | | Amount | |
Class IA | | | | | | | | | | | | | | | | |
Shares Sold | | | 398,575 | | | $ | 3,507,708 | | | | 397,984 | | | $ | 4,270,334 | |
Shares Issued for Reinvested Dividends | | | 1,968,095 | | | | 15,705,402 | | | | 2,261,931 | | | | 21,171,669 | |
Shares Redeemed | | | (2,061,224 | ) | | | (18,373,275 | ) | | | (2,707,830 | ) | | | (28,637,339 | ) |
| | | | | | | | | | | | | | | | |
Net Increase (Decrease) | | | 305,446 | | | | 839,835 | | | | (47,916 | ) | | | (3,195,336 | ) |
| | | | | | | | | | | | | | | | |
Class IB | | | | | | | | | | | | | | | | |
Shares Sold | | | 149,538 | | | $ | 1,423,572 | | | | 483,494 | | | $ | 4,653,030 | |
Shares Issued for Reinvested Dividends | | | 431,104 | | | | 3,422,965 | | | | 475,499 | | | | 4,426,898 | |
Shares Redeemed | | | (818,827 | ) | | | (7,315,334 | ) | | | (839,380 | ) | | | (8,908,741 | ) |
| | | | | | | | | | | | | | | | |
Net Increase (Decrease) | | | (238,185 | ) | | | (2,468,797 | ) | | | 119,613 | | | | 171,187 | |
| | | | | | | | | | | | | | | | |
Total Net Increase (Decrease) | | | 67,261 | | | $ | (1,628,962) | | | | 71,697 | | | $ | (3,024,149) | |
| | | | | | | | | | | | | | | | |
Notes to Financial Statements – (continued)
December 31, 2015
| | | | | | | | | | | | | | | | |
SmallCap Growth HLS Fund | | | | | | | | | | | | | | | | |
| | | For the Year Ended
December 31, 2015 | | | For the Year Ended
December 31, 2014 | |
| | | Shares | | | Amount | | | Shares | | | Amount | |
Class IA | | | | | | | | | | | | | | | | |
Shares Sold | | | 19,697,951 | | | $ | 535,691,497 | | | | 7,741,148 | | | $ | 234,726,639 | |
Shares Issued for Reinvested Dividends | | | 2,817,860 | | | | 75,293,233 | | | | 3,962,872 | | | | 104,738,700 | |
Shares Redeemed | | | (5,815,577 | ) | | | (162,067,889 | ) | | | (6,070,533 | ) | | | (177,423,983 | ) |
| | | | | | | | | | | | | | | | |
Net Increase (Decrease) | | | 16,700,234 | | | | 448,916,841 | | | | 5,633,487 | | | | 162,041,356 | |
| | | | | | | | | | | | | | | | |
Class IB | | | | | | | | | | | | | | | | |
Shares Sold | | | 4,994,251 | | | $ | 145,842,507 | | | | 795,616 | | | $ | 24,308,467 | |
Shares Issued for Reinvested Dividends | | | 906,232 | | | | 23,707,028 | | | | 865,284 | | | | 22,471,437 | |
Shares Redeemed | | | (1,488,312 | ) | | | (39,637,029 | ) | | | (1,315,429 | ) | | | (38,885,617 | ) |
| | | | | | | | | | | | | | | | |
Net Increase (Decrease) | | | 4,412,171 | | | | 129,912,506 | | | | 345,471 | | | | 7,894,287 | |
| | | | | | | | | | | | | | | | |
Total Net Increase (Decrease) | | | 21,112,405 | | | $ | 578,829,347 | | | | 5,978,958 | | | $ | 169,935,643 | |
| | | | | | | | | | | | | | | | |
Stock HLS Fund | | | | | | | | | | | | | | | | |
| | | For the Year Ended
December 31, 2015 | | | For the Year Ended
December 31, 2014 | |
| | | Shares | | | Amount | | | Shares | | | Amount | |
Class IA | | | | | | | | | | | | | | | | |
Shares Sold | | | 107,875 | | | $ | 6,926,566 | | | | 381,671 | | | $ | 22,943,602 | |
Shares Issued for Reinvested Dividends | | | 395,269 | | | | 25,254,549 | | | | 438,709 | | | | 28,166,569 | |
Shares Redeemed | | | (3,288,501 | ) | | | (210,453,182 | ) | | | (5,074,382 | ) | | | (304,217,724 | ) |
| | | | | | | | | | | | | | | | |
Net Increase (Decrease) | | | (2,785,357 | ) | | | (178,272,067 | ) | | | (4,254,002 | ) | | | (253,107,553 | ) |
| | | | | | | | | | | | | | | | |
Class IB | | | | | | | | | | | | | | | | |
Shares Sold | | | 38,756 | | | $ | 2,475,585 | | | | 23,110 | | | $ | 1,411,089 | |
Shares Issued for Reinvested Dividends | | | 38,043 | | | | 2,429,965 | | | | 44,140 | | | | 2,831,617 | |
Shares Redeemed | | | (514,770 | ) | | | (32,875,813 | ) | | | (719,520 | ) | | | (42,953,479 | ) |
| | | | | | | | | | | | | | | | |
Net Increase (Decrease) | | | (437,971 | ) | | | (27,970,263 | ) | | | (652,270 | ) | | | (38,710,773 | ) |
| | | | | | | | | | | | | | | | |
Total Net Increase (Decrease) | | | (3,223,328 | ) | | $ | (206,242,330) | | | | (4,906,272 | ) | | $ | (291,818,326) | |
| | | | | | | | | | | | | | | | |
Notes to Financial Statements – (continued)
December 31, 2015
| | | | | | | | | | | | | | | | |
Total Return Bond HLS Fund | | | | | | | | | | | | | | | | |
| | | For the Year Ended
December 31, 2015 | | | For the Year Ended
December 31, 2014 | |
| | | Shares | | | Amount | | | Shares | | | Amount | |
Class IA | | | | | | | | | | | | | | | | |
Shares Sold | | | 10,155,250 | | | $ | 116,189,984 | | | | 13,906,174 | | | $ | 161,254,744 | |
Shares Issued for Reinvested Dividends | | | 13,123,731 | | | | 144,492,281 | | | | 8,429,403 | | | | 97,443,902 | |
Shares Redeemed | | | (46,945,401 | ) | | | (535,205,814 | ) | | | (64,593,363 | ) | | | (753,674,817 | ) |
| | | | | | | | | | | | | | | | |
Net Increase (Decrease) | | | (23,666,420 | ) | | | (274,523,549 | ) | | | (42,257,786 | ) | | | (494,976,171 | ) |
| | | | | | | | | | | | | | | | |
Class IB | | | | | | | | | | | | | | | | |
Shares Sold | | | 691,074 | | | $ | 7,919,270 | | | | 1,037,597 | | | $ | 11,943,691 | |
Shares Issued for Reinvested Dividends | | | 1,529,910 | | | | 16,767,814 | | | | 984,627 | | | | 11,323,208 | |
Shares Redeemed | | | (6,225,863 | ) | | | (70,699,894 | ) | | | (7,667,399 | ) | | | (88,688,467 | ) |
| | | | | | | | | | | | | | | | |
Net Increase (Decrease) | | | (4,004,879 | ) | | | (46,012,810 | ) | | | (5,645,175 | ) | | | (65,421,568 | ) |
| | | | | | | | | | | | | | | | |
Total Net Increase (Decrease) | | | (27,671,299 | ) | | $ | (320,536,359 | ) | | | (47,902,961 | ) | | $ | (560,397,739 | ) |
| | | | | | | | | | | | | | | | |
Ultrashort Bond HLS Fund | | | | | | | | | | | | | | | | |
| | | For the Year Ended
December 31, 2015 | | | For the Year Ended
December 31, 2014 | |
| | | Shares | | | Amount | | | Shares | | | Amount | |
Class IA | | | | | | | | | | | | | | | | |
Shares Sold | | | 4,401,670 | | | $ | 44,094,704 | | | | 4,545,298 | | | $ | 45,540,750 | |
Shares Issued for Reinvested Dividends | | | 214,454 | | | | 2,144,538 | | | | — | | | | — | |
Shares Redeemed | | | (17,928,559 | ) | | | (179,615,432 | ) | | | (31,429,195 | ) | | | (314,815,438 | ) |
| | | | | | | | | | | | | | | | |
Net Increase (Decrease) | | | (13,312,435 | ) | | | (133,376,190 | ) | | | (26,883,897 | ) | | | (269,274,688 | ) |
| | | | | | | | | | | | | | | | |
Class IB | | | | | | | | | | | | | | | | |
Shares Sold | | | 1,221,274 | | | $ | 12,196,809 | | | | 1,239,006 | | | $ | 12,389,812 | |
Shares Issued for Reinvested Dividends | | | 1,036 | | | | 10,342 | | | | — | | | | — | |
Shares Redeemed | | | (3,633,565 | ) | | | (36,286,423 | ) | | | (5,421,181 | ) | | | (54,208,090 | ) |
| | | | | | | | | | | | | | | | |
Net Increase (Decrease) | | | (2,411,255 | ) | | | (24,079,272 | ) | | | (4,182,175 | ) | | | (41,818,278 | ) |
| | | | | | | | | | | | | | | | |
Total Net Increase (Decrease) | | | (15,723,690 | ) | | $ | (157,455,462 | ) | | | (31,066,072 | ) | | $ | (311,092,966 | ) |
| | | | | | | | | | | | | | | | |
Notes to Financial Statements – (continued)
December 31, 2015
| | | | | | | | | | | | | | | | |
U.S. Government Securities HLS Fund | | | | | | | | | | | | | | | | |
| | | For the Year Ended
December 31, 2015 | | | For the Year Ended
December 31, 2014 | |
| | | Shares | | | Amount | | | Shares | | | Amount | |
Class IA | | | | | | | | | | | | | | | | |
Shares Sold | | | 3,407,701 | | | $ | 35,624,811 | | | | 2,857,524 | | | $ | 29,752,648 | |
Shares Issued for Reinvested Dividends | | | 761,539 | | | | 7,889,540 | | | | 1,128,686 | | | | 11,648,041 | |
Shares Redeemed | | | (9,528,094 | ) | | | (99,648,491 | ) | | | (12,688,761 | ) | | | (132,029,460 | ) |
| | | | | | | | | | | | | | | | |
Net Increase (Decrease) | | | (5,358,854 | ) | | | (56,134,140 | ) | | | (8,702,551 | ) | | | (90,628,771 | ) |
| | | | | | | | | | | | | | | | |
Class IB | | | | | | | | | | | | | | | | |
Shares Sold | | | 624,520 | | | $ | 6,508,978 | | | | 591,060 | | | $ | 6,139,192 | |
Shares Issued for Reinvested Dividends | | | 138,582 | | | | 1,434,327 | | | | 213,784 | | | | 2,201,980 | |
Shares Redeemed | | | (1,914,362 | ) | | | (19,961,551 | ) | | | (2,974,164 | ) | | | (30,852,008 | ) |
| | | | | | | | | | | | | | | | |
Net Increase (Decrease) | | | (1,151,260 | ) | | | (12,018,246 | ) | | | (2,169,320 | ) | | | (22,510,836 | ) |
| | | | | | | | | | | | | | | | |
Total Net Increase (Decrease) | | | (6,510,114 | ) | | $ | (68,152,386 | ) | | | (10,871,871 | ) | | $ | (113,139,607 | ) |
| | | | | | | | | | | | | | | | |
Value HLS Fund | | | | | | | | | | | | | | | | |
| | | For the Year Ended
December 31, 2015 | | | For the Year Ended
December 31, 2014 | |
| | | Shares | | | Amount | | | Shares | | | Amount | |
Class IA | | | | | | | | | | | | | | | | |
Shares Sold | | | 2,523,744 | | | $ | 40,916,505 | | | | 2,123,997 | | | $ | 33,647,816 | |
Shares Issued for Reinvested Dividends | | | 1,406,416 | | | | 22,579,315 | | | | 454,297 | | | | 7,727,803 | |
Shares Redeemed | | | (5,677,276 | ) | | | (94,566,512 | ) | | | (7,403,103 | ) | | | (118,335,543 | ) |
| | | | | | | | | | | | | | | | |
Net Increase (Decrease) | | | (1,747,116 | ) | | | (31,070,692 | ) | | | (4,824,809 | ) | | | (76,959,924 | ) |
| | | | | | | | | | | | | | | | |
Class IB | | | | | | | | | | | | | | | | |
Shares Sold | | | 90,344 | | | $ | 1,476,259 | | | | 139,305 | | | $ | 2,240,846 | |
Shares Issued for Reinvested Dividends | | | 244,646 | | | | 3,929,896 | | | | 71,208 | | | | 1,210,174 | |
Shares Redeemed | | | (1,023,557 | ) | | | (17,008,309 | ) | | | (1,473,615 | ) | | | (23,487,470 | ) |
| | | | | | | | | | | | | | | | |
Net Increase (Decrease) | | | (688,567 | ) | | | (11,602,154 | ) | | | (1,263,102 | ) | | | (20,036,450 | ) |
| | | | | | | | | | | | | | | | |
Total Net Increase (Decrease) | | | (2,435,683 | ) | | $ | (42,672,846) | | | | (6,087,911 | ) | | $ | (96,996,374) | |
| | | | | | | | | | | | | | | | |
Each Fund, together with certain other Hartford Funds, participates in a $350 million committed revolving line of credit facility. The facility is to be used for temporary or emergency purposes. Under the arrangement, the funds are required to own securities having a market value in excess of 300% of the total bank borrowings. The interest rate on borrowings varies depending on the nature of the loan. The facility also requires a fee to be paid based on the amount of the commitment. This commitment fee is allocated to all the funds participating in the line of credit based on the average net assets of the funds. During the year ended December 31, 2015, none of the Funds had borrowings under this facility.
Reorganization of Hartford Global Research HLS Fund into Hartford Global Growth HLS Fund: At a meeting held on February 5, 2014, the Board of Directors of Hartford Series Fund, Inc. approved an Agreement and Plan of Reorganization providing for the acquisition of all the assets and liabilities of Hartford Global Research HLS Fund (“Target Fund”) by Hartford Global Growth HLS Fund (“Acquiring Fund”).
Notes to Financial Statements – (continued)
December 31, 2015
Under the terms of the Agreement and Plan of Reorganization, the assets and liabilities of the Target Fund were acquired by the Acquiring Fund immediately before the opening of business on June 23, 2014. The Acquiring Fund acquired the assets and liabilities of the Target Fund in exchange for shares in the Acquiring Fund, which were distributed pro rata by the Target Fund to shareholders, in complete liquidation of the Target Fund.
The Acquiring Fund did not acquire any capital loss carryforwards from the Target Fund.
This merger was accomplished by tax free exchange, as detailed below:
| | | | | | | | | | | | | | | | | | | | |
| | | Net assets of Target
Fund on June 20,
2014* | | | Net assets of
Acquiring Fund
immediately before
Merger | | | Net assets of
Acquiring Fund
immediately after
merger | | | Target Fund shares
exchanged | | | Acquiring Fund
shares issued to the
Target Fund’s
shareholders | |
Class IA | | $ | 60,232 | | | $ | 349,166 | | | $ | 409,398 | | | | 4,416 | | | | 2,474 | |
Class IB | | | 24,368 | | | | 75,419 | | | | 99,787 | | | | 1,789 | | | | 1,053 | |
| | | | | | | | | | | | | | | | | | | | |
Total | | $ | 84,600 | | | $ | 424,585 | | | $ | 509,185 | | | | 6,205 | | | | 3,527 | |
| | | | | | | | | | | | | | | | | | | | |
| * | Final day of operations immediately prior to the merger. |
The Target Fund had the following unrealized appreciation, accumulated net realized losses and capital stock as of June 20, 2014:
| | | | | | | | | | | | | | | | | | | | |
Fund | | Undistributed
Income | | | Unrealized
Appreciation
(Depreciation) | | | Accumulated
Net Realized
Gains (Losses) | | | Capital Stock | | | Total | |
Target Fund | | $ | | (42) | | $ | 13,775 | | | $ | | (482) | | $ | 71,349 | | | $ | 84,600 | |
Assuming the acquisition had been completed on January 1, 2014, the beginning of the annual reporting period of the Target Fund and the Acquiring Fund, the Acquiring Fund’s pro forma results of operations for the year ended December 31, 2014, were as follows:
| | | | | | | | | | | | |
Fund | | Net Investment Income | | | Net Gain on Investments | | | Net Increase in Net Assets
Resulting From Operations | |
Acquiring Fund | | $ | 2,932 | | | $ | 34,614 | | | $ | 37,546 | |
Because the combined investment portfolios have been managed as a single integrated portfolio since the acquisition was completed, it is not practical to separate the amounts of revenue and earnings of the Target Fund that have been included in the Acquiring Fund’s Statement of Operations since the merger date.
Reorganization of Hartford Growth HLS Fund into Hartford Growth Opportunities HLS Fund: At a meeting held on February 5, 2014, the Board of Directors of Hartford Series Fund, Inc. and Hartford Series Fund II, Inc. approved an Agreement and Plan of Reorganization providing for the acquisition of all the assets and liabilities of Hartford Growth HLS Fund (“Target Fund”) by Hartford Growth Opportunities HLS Fund (“Acquiring Fund”).
Under the terms of the Agreement and Plan of Reorganization, the assets and liabilities of the Target Fund were acquired by the Acquiring Fund immediately before the opening of business on June 23, 2014. The Acquiring Fund acquired the assets and liabilities of the Target Fund in exchange for shares in the Acquiring Fund, which were distributed pro rata by the Target Fund to shareholders, in complete liquidation of the Target Fund.
This merger was accomplished by tax free exchange as detailed below:
| | | | | | | | | | | | | | | | | | | | |
| | | Net assets of Target
Fund on June 20,
2014 | | | Net assets of
Acquiring Fund
immediately before
merger | | | Net assets of
Acquiring Fund
immediately after
merger | | | Target Fund shares
exchanged | | | Acquiring Fund
shares issued to the
Target Fund’s
shareholders | |
Class IA | | $ | 160,101 | | | $ | 1,089,960 | | | $ | 1,250,061 | | | | 12,545 | | | | 3,722 | |
Class IB | | | 61,940 | | | | 110,884 | | | | 172,824 | | | | 5,013 | | | | 1,470 | |
| | | | | | | | | | | | | | | | | | | | |
Total | | $ | 222,041 | | | $ | 1,200,844 | | | $ | 1,422,885 | | | | 17,558 | | | | 5,192 | |
| | | | | | | | | | | | | | | | | | | | |
Notes to Financial Statements – (continued)
December 31, 2015
The Target Fund had the following unrealized appreciation, accumulated net realized losses and capital stock as of June 20, 2014:
| | | | | | | | | | | | | | | | | | | | |
Fund | | Undistributed
Income | | | Unrealized
Appreciation
(Depreciation) | | | Accumulated
Net Realized
Gains (Losses) | | | Capital Stock | | | Total | |
Target Fund | | $ | — | | | $ | 55,228 | | | $ | | (142) | | $ | 166,955 | | | $ | 222,041 | |
Assuming the acquisition had been completed on January 1, 2014, the beginning of the annual reporting period of the Target Fund and the Acquiring Fund, the Acquiring Fund’s pro forma results of operations for the six-month period ended June 30, 2014, are as follows:
| | | | | | | | | | | | |
Fund | | Net Investment Income | | | Net Gain on Investments | | | Net Increase in Net Assets
Resulting From Operations | |
Acquiring Fund | | $ | 1,190 | | | $ | 87,282 | | | $ | 88,472 | |
Because the combined investment portfolios have been managed as a single integrated portfolio since the acquisition was completed, it is not practical to separate the amounts of revenue and earnings of the Target Fund that have been included in the Acquiring Fund’s Statement of Operations since the merger date.
| 13. | Pending Legal Proceedings: |
On February 25, 2011, Jennifer L. Kasilag, Louis Mellinger, Judith M. Menendez, Jacqueline M. Robinson, and Linda A. Russell filed a derivative lawsuit against Hartford Investment Financial Services, LLC (“HIFSCO”) (now known as Hartford Funds Distributors, LLC) on behalf of six Hartford retail mutual funds in the United States District Court for the District of New Jersey, alleging that HIFSCO received excessive advisory and distribution fees in violation of its statutory fiduciary duty under Section 36(b) of the 1940 Act when serving as investment manager and principal underwriter, respectively, to the Hartford retail mutual funds. Although this action was purportedly filed on behalf of certain of the Hartford Funds, none of the Hartford Funds is itself a defendant to the suit. HIFSCO moved to dismiss and, in September 2011, the motion was granted in part and denied in part, with leave to amend the complaint. In November 2011, plaintiffs filed an amended complaint on behalf of certain Hartford retail mutual funds, The Hartford Global Health Fund (now known as The Hartford Healthcare Fund), The Hartford Conservative Allocation Fund, The Hartford Growth Opportunities Fund, The Hartford Inflation Plus Fund, The Hartford Advisers Fund (now known as The Hartford Balanced Fund), and The Hartford Capital Appreciation Fund. Plaintiffs seek to rescind the investment management agreements and distribution plans between HIFSCO and these funds and to recover the total fees charged thereunder or, in the alternative, to recover any improper compensation HIFSCO received, in addition to lost earnings. HIFSCO filed a partial motion to dismiss the amended complaint and, in December 2012, the court dismissed without prejudice the claims regarding distribution fees and denied the motion with respect to the advisory fees claims. In March 2014, the plaintiffs filed a new complaint that added as new plaintiffs The Hartford Floating Rate Fund and The Hartford Small Company Fund and named as a defendant HFMC, which assumed the role as investment manager to the funds as of January 2013. In March 2015, the plaintiffs filed a new complaint that removed The Hartford Small Company Fund as a plaintiff. HFMC and HIFSCO dispute the allegations and have filed a motion for summary judgment. Plaintiff has filed a motion for partial summary judgment.
No accrual for litigation relating to this matter has been recorded in the financial statements of the Funds because the Funds are not party to the suit.
On October 21, 2013 for the Ultrashort Bond HLS Fund, a reverse stock split was declared for the Class IA and Class IB shares at a ten to one ratio. The effect of the reverse stock split was to divide the number of outstanding shares by the reverse split factor, with a corresponding increase in the net asset value per share. The split was executed at the closing rounded NAV as of the prior business day. This transaction did not change the net assets of the Fund and the total value of a shareholder’s investment in the Fund did not change as a result of the reverse stock split. Data presented in the Financial Highlights has been adjusted retroactively to account for the reverse stock split.
Notes to Financial Statements – (continued)
December 31, 2015
Under each Company’s organizational documents, the Company shall indemnify its officers and directors to the full extent required or permitted under Maryland General Corporation Law and federal securities laws. In addition, each Company, on behalf of its respective Funds, may enter into contracts that contain a variety of indemnifications. Each Company’s maximum exposure under these arrangements is unknown. However, as of the date of these financial statements, each Company has not had prior claims or losses pursuant to these contracts and expects the risk of loss to be remote.
In connection with the preparation of the financial statements of the Funds as of and for the fiscal year ended December 31, 2015, events and transactions subsequent to December 31, 2015, through the date the financial statements were issued have been evaluated by the Funds’ management for possible adjustment and/or disclosure. No subsequent events requiring financial statement adjustment or disclosure have been identified.
|
| Report of Independent Registered Public Accounting Firm |
The Board of Directors and Shareholders of
Hartford Series Fund, Inc. and Hartford HLS Series Fund II, Inc.
We have audited the accompanying statements of assets and liabilities, including the schedules of investments, of Hartford Series Fund, Inc. (comprising, respectively, Hartford Balanced HLS Fund, Hartford Capital Appreciation HLS Fund, Hartford Disciplined Equity HLS Fund, Hartford Dividend and Growth HLS Fund, Hartford Global Growth HLS Fund, Hartford Healthcare HLS Fund, Hartford High Yield HLS Fund, Hartford International Opportunities HLS Fund, Hartford MidCap HLS Fund, Hartford MidCap Value HLS Fund, Hartford Small Company HLS Fund, Hartford Stock HLS Fund, Hartford Total Return Bond HLS Fund, Hartford Ultrashort Bond HLS Fund, and Hartford Value HLS Fund) and Hartford HLS Series Fund II, Inc. (comprising, respectively, Hartford Growth Opportunities HLS Fund, Hartford Small/Mid Cap Equity HLS Fund, Hartford SmallCap Growth HLS Fund, and Hartford U.S. Government Securities HLS Fund) (collectively, together with Hartford Series Fund, Inc., the “Companies”), as of December 31, 2015, and the related statements of operations for the year then ended, the statements of changes in net assets for each of the two years in the period then ended, and the financial highlights for each of the periods indicated therein. These financial statements and financial highlights are the responsibility of the Companies’ management. Our responsibility is to express an opinion on these financial statements and financial highlights based on our audits.
We conducted our audits in accordance with the standards of the Public Company Accounting Oversight Board (United States). Those standards require that we plan and perform the audits to obtain reasonable assurance about whether the financial statements and financial highlights are free of material misstatement. We were not engaged to perform an audit of the Companies’ internal control over financial reporting. Our audits included consideration of internal control over financial reporting as a basis for designing audit procedures that are appropriate in the circumstances, but not for the purpose of expressing an opinion on the effectiveness of the Companies’ internal control over financial reporting. Accordingly, we express no such opinion. An audit also includes examining, on a test basis, evidence supporting the amounts and disclosures in the financial statements and financial highlights, assessing the accounting principles used and significant estimates made by management, and evaluating the overall financial statement presentation. Our procedures included confirmation of securities owned as of December 31, 2015, by correspondence with the custodian and others or by other appropriate auditing procedures where replies from others were not received. We believe that our audits provide a reasonable basis for our opinion.
In our opinion, the financial statements and financial highlights referred to above present fairly, in all material respects, the financial position of each of the respective series constituting Hartford Series Fund, Inc. and Hartford HLS Series Fund II, Inc. at December 31, 2015, the results of their operations for the year then ended, the changes in their net assets for each of the two years in the period then ended, and the financial highlights for each of the indicated periods, in conformity with U.S. generally accepted accounting principles.

New York, New York
February 19, 2016
Directors and Officers (Unaudited)
The Board of Directors of Hartford Series Fund, Inc. (“HSF”) and Hartford HLS Series Fund II, Inc. (“HSF2”) (each a “Company” and collectively, the “Companies”) appoints officers who are responsible for the day-to-day operations of each Fund and who execute policies formulated by the Board of Directors of the Companies (each a “Director” and collectively, the “Directors”). Each Director holds an indefinite term until the earlier of (i) the election and qualification of his or her successor or (ii) when the Director turns 75 years of age.
Each Director, with the exception of Mr. Davey, is an independent or disinterested person, which means he or she is not an “interested person” of the Companies, as defined in the Investment Company Act of 1940 (“1940 Act”). Such individuals are commonly referred to as “Independent Directors.” As of December 31, 2015, each Director serves as a director for HSF, HSF2, The Hartford Mutual Funds, Inc., and The Hartford Mutual Funds II, Inc., and as a trustee for The Hartford Alternative Strategies Fund, which, as of December 31, 2015, collectively, consist of 68 funds.1 Correspondence may be sent to Directors and officers c/o Hartford Funds, 5 Radnor Corporate Center, Suite 300, 100 Matsonford Road, Radnor, Pennsylvania 19087.
The table below sets forth, for each Director and officer, his or her name, year of birth, current position with each Company and date first elected or appointed to HSF and HSF2, principal occupation, and, for Directors, other directorships held. The Funds’ Statement of Additional Information contains further information on the Directors and is available free of charge by calling 1-888-843-7824 or writing to: Hartford HLS Funds, c/o Hartford Life Insurance Company/Hartford Life and Annuity Insurance Company, P.O. Box 14293, Lexington, KY 40512-4293 for variable annuity and variable life insurance separate accounts of Hartford Life Insurance Company and its affiliates; Hartford Funds, P.O. Box 55022, Boston, MA 02205-5022 for all shareholders except variable annuity and variable life insurance separate accounts of Hartford Life Insurance Company and its affiliates.
Information on the aggregate remuneration paid to the Directors of each Company can be found in the Statement of Operations herein.
Non-Interested Directors2
Hilary E. Ackermann (1956) Director since 2014
Ms. Ackermann served as Chief Risk Officer at Goldman Sachs Bank USA from October 2008 to November 2011 and serves as a Director of Dynegy, Inc., an independent power company, from October 2012 to present.
Lynn S. Birdsong (1946) Director since 2003, Chairman of the Investment Committee since 2014
Mr. Birdsong currently serves as a Director of Aberdeen Global and Aberdeen Global II (investment funds) (September 2014 to present) and as a Director of the Sovereign High Yield Investment Company (April 2010 to June 2014). Mr. Birdsong served as an Independent Director of Nomura Partners Funds, Inc. (formerly, The Japan Fund) (April 2003 to February 2015). From 2003 to March 2005, Mr. Birdsong was an Independent Director of the Atlantic Whitehall Funds. From 1979 to 2002, Mr. Birdsong was a Managing Director of Zurich Scudder Investments, an investment management firm. During his employment with Scudder, Mr. Birdsong was an Interested Director of The Japan Fund. From January 1981 through December 2013, Mr. Birdsong was a partner in Birdsong Company, an advertising specialty firm.
Duane E. Hill (1945) Director since 2001 (HSF) and 2002 (HSF2), Chairman of the Nominating Committee since 2003
Mr. Hill is a Partner of TSG Ventures L.P., a private equity investment company. Mr. Hill is a former partner of TSG Capital Group, a private equity investment firm that served as sponsor and lead investor in leveraged buyouts of middle market companies.
Sandra S. Jaffee (1941) Director since 2005, Chairwoman of the Compliance Committee since 2015
Ms. Jaffee is the founder and Chief Executive Officer of a private company, Homeworks Concierge, LLC, which provides residential property management services in Westchester County, New York (January 2012 to present). Ms. Jaffee served as Chairwoman (2008 to 2009) and Chief Executive Officer of Fortent (formerly Searchspace Group), a leading provider of compliance/regulatory technology to financial institutions from August 2005 to August 2009. From August 2004 to August 2005, Ms. Jaffee served as an Entrepreneur in Residence with Warburg Pincus, a private equity firm. Prior to joining Warburg Pincus, Ms. Jaffee served as Executive Vice President at Citigroup, from September 1995 to July 2004, where she was President and Chief Executive Officer of Citibank’s Global Securities Services (1995 to 2003). Ms. Jaffee served as a member of the Board of Directors of Broadridge Financial Solutions (November 2010 to November 2014). Ms. Jaffee currently serves as a member of the Board of Directors of Global Corps Africa (a non-profit organization) (January 2015 to present) as well as a Trustee of Muhlenberg College (September 2007 to present).
| 1 | Effective as of the opening of business on November 23, 2015, The Hartford Alternative Strategies Fund was liquidated. |
| 2 | Robert M. Gavin, Jr. resigned as a Director of HSF, HSF2, The Hartford Mutual Funds, Inc., and The Hartford Mutual Funds II, Inc., and as a Trustee of The Hartford Alternative Strategies Fund effective August 16, 2015. Mr. Gavin had been a Director of HSF since 2002 and HSF2 since 1986, and Chairman of the Board for each since 2004. |
Directors and Officers (Unaudited) – (continued)
William P. Johnston (1944) Director since 2005, Chairman of the Board since 2015, Chairman of the Contracts Committee since 2015
Mr. Johnston served as Chairman of the Compliance Committee from 2005 to 2015. In June 2006, he was appointed as Senior Advisor to The Carlyle Group, a global private equity and other alternative asset investment firm and currently serves as an Operating Executive. In July 2006, Mr. Johnston was elected to the Board of Directors of MultiPlan, Inc. and served as a Director (July 2006 to August 2010). In August 2007, Mr. Johnston was elected to the Board of Directors of LifeCare Holdings, Inc. and served as a Director (August 2007 to June 2013). In February 2008, Mr. Johnston was elected to the Board of Directors of HCR-ManorCare, Inc. In May 2006, Mr. Johnston was elected to the Supervisory Board of Fresenius Medical Care AG & Co. KGaA, after its acquisition of Renal Care Group, Inc. in March 2006. Mr. Johnston joined Renal Care Group in November 2002 as a member of the Board of Directors and served as Chairman of the Board from March 2003 through March 2006. From 2002 through 2013, Mr. Johnston served as a Board member of the Georgia O’Keefe Museum. From September 1987 to December 2002, Mr. Johnston was with Equitable Securities Corporation (and its successors, SunTrust Equitable Securities and SunTrust Robinson Humphrey) serving in various investment banking and managerial positions, including Managing Director and Head of Investment Banking, Chief Executive Officer and Vice Chairman.
Phillip O. Peterson (1944) Director since 2002 (HSF) and 2000 (HSF2), Chairman of the Audit Committee since 2002
Mr. Peterson is a mutual fund industry consultant. He was a partner of KPMG LLP (an accounting firm) until July 1999. Mr. Peterson joined William Blair Funds in February 2007 as a member of the Board of Trustees. From February 2012 to February 2014, Mr. Peterson served as a Trustee of Symetra Variable Mutual Funds. From January 2004 to April 2005, Mr. Peterson served as Independent President of the Strong Mutual Funds.
Lemma W. Senbet (1946) Director since 2005
Dr. Senbet is the William E. Mayer Chair Professor of Finance and Founding Director, Center for Financial Policy, at the University of Maryland, Robert H. Smith School of Business. He was chair of the Finance Department of the University of Maryland, Robert H. Smith School of Business from 1998 to 2006. Since June 2013, he has been on leave from the University to serve as Executive Director of African Economic Research Consortium which focuses on economic policy research and training. Previously, he was a chaired professor of finance at the University of Wisconsin-Madison. Also, he was a Director of the Fortis Funds from March 2000 to July 2002. Dr. Senbet served as Director of the American Finance Association and President of the Western Finance Association. In 2006, Dr. Senbet was inducted Fellow of Financial Management Association International for his career-long distinguished scholarship and professional service.
Interested Directors and Officers
James E. Davey (1964) Director since 2012, President and Chief Executive Officer since 2010
Mr. Davey serves as Executive Vice President of Hartford Life Insurance Company (“HLIC”) and The Hartford. Additionally, Mr. Davey serves as Chairman of the Board, Manager and Senior Managing Director of Hartford Funds Distributors, LLC (“HFD”). He also currently serves as Director, Chairman of the Board, President and Senior Managing Director of Hartford Administrative Services Company (“HASCO”). Mr. Davey also serves as Manager, Chairman of the Board and Senior Managing Director for Hartford Funds Management Company, LLC (“HFMC”) and Director, Chairman of the Board and Senior Managing Director for Hartford Funds Management Group, Inc. (“HFMG”). Mr. Davey has served in various positions within The Hartford and its subsidiaries in connection with the operation of the Hartford Funds. Mr. Davey joined The Hartford in 2002.
Other Officers
Andrew S. Decker (1963) AML Compliance Officer since 2015
Mr. Decker currently serves as Chief Compliance Officer and AML Compliance Officer of HASCO and as AML Officer of HFD. Prior to joining The Hartford, Mr. Decker served as Vice President and AML Officer at Janney Montgomery Scott (a broker dealer) from April 2011 to January 2015. Mr. Decker served as AML Compliance and Sanctions Enforcement Officer at SEI Investments from December 2007 to April 2011.
Michael Flook (1965) Vice President, Treasurer and Controller since 2015
Mr. Flook currently serves as an employee of HFMG. Mr. Flook served as Assistant Treasurer for each Company, The Hartford Alternative Strategies Fund, The Hartford Mutual Funds, Inc., and The Hartford Mutual Funds II, Inc. from February 2015 to March 2015. Mr. Flook joined The Hartford in 2014. Prior to joining The Hartford, Mr. Flook served as Director, Vice President and Assistant Treasurer at UBS Global Asset Management from May 2006 to November 2014.
Directors and Officers (Unaudited) – (continued)
Edward P. Macdonald (1967) Vice President, Secretary and Chief Legal Officer since 2005
Mr. Macdonald currently serves as Assistant Secretary, Executive Vice President and Deputy General Counsel of HFD, HASCO, HFMC and HFMG. He also serves as Vice President of HLIC. Mr. Macdonald has served in various positions within The Hartford and its subsidiaries in connection with the operation of the Hartford Funds. Mr. Macdonald joined The Hartford in 2005.
Joseph G. Melcher (1973) Vice President and Chief Compliance Officer since 2013
Mr. Melcher currently serves as Executive Vice President of HFD, HFMG and HASCO. Mr. Melcher also currently serves as Executive Vice President and Chief Compliance Officer of HFMC. Mr. Melcher has served in various positions within The Hartford and its subsidiaries in connection with the operation of the Hartford Funds since joining The Hartford in 2012. Prior to joining The Hartford, Mr. Melcher worked at Touchstone Investments, a member of the Western & Southern Financial Group, where he held the position of Vice President and Chief Compliance Officer from 2010 through 2012 and Assistant Vice President, Compliance from 2005 to 2010.
Vernon J. Meyer (1964) Vice President since 2006
Mr. Meyer currently serves as Senior Vice President of HLIC. He also currently serves as Managing Director and Chief Investment Officer of HFMC and Managing Director of HFMG. Mr. Meyer has served in various positions within The Hartford and its subsidiaries in connection with the operation of the Hartford Funds. Mr. Meyer joined The Hartford in 2004.
Laura S. Quade (1969) Vice President since 2012
Ms. Quade currently serves as Vice President of HASCO, HFD and HFMG. She is the Head of Operations of HASCO and formerly served as Director, Enterprise Operations of HLIC. Ms. Quade has served in various positions within The Hartford and its subsidiaries in connection with the operation of the Hartford Funds. Ms. Quade joined The Hartford in 2001.
HOW TO OBTAIN A COPY OF EACH FUND’S PROXY VOTING POLICIES AND VOTING RECORDS (UNAUDITED)
A description of the policies and procedures that each Fund uses to determine how to vote proxies relating to portfolio securities and information about how each Fund voted proxies relating to portfolio securities during the most recent twelve-month period ended June 30 are available (1) without charge, upon request, by calling 888-843-7824 and (2) on the SEC’s website at http://www.sec.gov.
QUARTERLY PORTFOLIO HOLDINGS INFORMATION (UNAUDITED)
Each Fund files a complete schedule of portfolio holdings with the SEC for the first and third quarters of each fiscal year on Form N-Q. Each Fund’s Forms N-Q are available (1) without charge, upon request, by calling 888-843-7824 and (2) on the SEC’s website at http://www.sec.gov. The Form N-Q may be reviewed and copied at the SEC’s Public Reference Room in Washington, DC. Information on the operation of the Public Reference Room may be obtained by calling 1-800-SEC-0330.
Federal Tax Information (Unaudited)
For the fiscal year ended December 31, 2015, there is no further federal tax information required for these Funds.
Approval of Investment Management and Investment Sub-Advisory Agreements (Unaudited)
Hartford Series Fund, Inc. and Hartford HLS Series Fund II, Inc.
Hartford Balanced HLS Fund
Hartford Capital Appreciation HLS Fund
Hartford Disciplined Equity HLS Fund
Hartford Dividend and Growth HLS Fund
Hartford Global Growth HLS Fund
Hartford Growth Opportunities HLS Fund
Hartford Healthcare HLS Fund
Hartford High Yield HLS Fund
Hartford International Opportunities HLS Fund
Hartford MidCap HLS Fund
Hartford MidCap Value HLS Fund
Hartford Small Company HLS Fund
Hartford Small/Mid Cap Equity HLS Fund
Hartford SmallCap Growth HLS Fund
Hartford Stock HLS Fund
Hartford Total Return Bond HLS Fund
Hartford Ultrashort Bond HLS Fund
Hartford U.S. Government Securities HLS Fund
Hartford Value HLS Fund
Section 15(c) of the Investment Company Act of 1940, as amended (the “1940 Act”), requires that each mutual fund’s board of directors, including a majority of those directors who are not “interested persons” of the mutual fund, as defined in the 1940 Act (the “Independent Directors”), annually review and consider the continuation of the mutual fund’s investment advisory and sub-advisory agreements. At its meeting held on August 4-5, 2015, the Boards of Directors (collectively, the “Board”) of Hartford Series Fund, Inc. (“HLS”) and Hartford HLS Series Fund II, Inc. (“HLS II”), including each of the Independent Directors, unanimously voted to approve the continuation of the investment management agreement (the “Management Agreements”) between each of HLS and HLS II, on behalf of each of their respective series covered by this Report (each a “Fund” and collectively, the “Funds”), and Hartford Funds Management Company, LLC (“HFMC”) and the continuation of the investment sub-advisory agreement between HFMC and each Fund’s sub-adviser, Wellington Management Company LLP (the “Sub-adviser,” and together with HFMC, the “Advisers”) (collectively, the “Agreements”).
In the months preceding the August 4-5, 2015 meeting, the Board requested and reviewed written responses from the Advisers to questions posed to them on behalf of the Independent Directors and supporting materials relating to those questions and responses. In addition, the Board considered such additional information as it deemed reasonably necessary to evaluate the Agreements applicable to each Fund, which included information furnished to the Board at its meetings throughout the year, as well as information specifically prepared in connection with the annual approval of the Agreements at the Board’s meetings held on June 16-17, 2015 and August 4-5, 2015. Information provided to the Board at its meetings throughout the year included, among other things, reports on Fund performance, legal and compliance matters, sales and marketing activity, shareholder services, and the other services provided to each Fund by the Advisers and their affiliates. The Board also received in-person presentations by Fund officers and representatives of HFMC at the Board’s meetings on June 16-17, 2015 and August 4-5, 2015 concerning the Agreements.
The Independent Directors, advised by independent legal counsel, engaged service providers to assist them with evaluating the Agreements with respect to each Fund. Lipper Inc. (“Lipper”), an independent provider of investment company data, was retained to provide the Board with reports on how each Fund’s contractual management fees, actual management fees, other non-management fees, overall expense ratios and investment performance compared to those of comparable mutual funds with similar investment objectives. The Independent Directors also engaged an independent financial services consultant (the “Consultant”) to assist them in evaluating the Funds’ respective management fees, sub-advisory fees, other non-management fees, overall expense ratios and investment performance. In addition, the Consultant reviewed the profitability calculations utilized by HFMC in connection with the continuation of the investment management agreement.
In determining whether to continue the Agreements for a Fund, the members of the Board reviewed and evaluated information and factors they believed to be relevant in light of the information that the Board deemed necessary and appropriate through the exercise of its reasonable business judgment. While individual members of the Board may have weighed certain factors differently, the Board’s determination to continue
Approval of Investment Management and Investment Sub-Advisory Agreements (Unaudited) – (continued)
the Agreements was based on a comprehensive consideration of all information provided to the Board throughout the year and specifically with respect to the continuation of the Agreements. A more detailed discussion of the factors the Board considered with respect to its approval of the Agreements is provided below.
Nature, Extent and Quality of Services Provided by the Advisers
The Board requested and considered information concerning the nature, extent and quality of the services provided to each Fund by the Advisers. The Board considered, among other things, the terms of the Agreements and the range of services provided by the Advisers. The Board considered the Advisers’ professional personnel who provide services to the Funds, including each Adviser’s ability and experience in attracting and retaining qualified personnel to service the Funds. The Board considered each Adviser’s reputation and overall financial strength, as well as its willingness to consider and implement organizational and operational changes designed to enhance services to the Hartford Funds. In addition, the Board considered the quality of each Adviser’s communications with the Board and responsiveness to Board inquiries and requests made from time to time with respect to the Funds and other Hartford Funds.
The Board requested and evaluated information concerning each Adviser’s regulatory and compliance environment. In this regard, the Board requested and reviewed information about each Adviser’s compliance policies and procedures, compliance history, and a report from the Funds’ Chief Compliance Officer on each Adviser’s compliance with applicable laws and regulations, including responses to regulatory developments and compliance issues raised by regulators. The Board also noted the Advisers’ support of the Funds’ compliance control structure, as applicable, and, in particular, the resources devoted by the Advisers in support of the Funds’ obligations pursuant to Rule 38a-1 under the 1940 Act.
With respect to HFMC, the Board noted that, under the Management Agreements, HFMC is responsible for the management of the Funds, including oversight of fund operations and service providers, as well as investment advisory services in connection with selecting, monitoring and supervising the Sub-adviser. The Board considered HFMC’s ongoing monitoring of people, process and performance, including its quarterly reviews of each of the Hartford Funds, semi-annual meetings with the leaders of each Fund’s portfolio management team, and oversight of the Funds’ approximately 39 portfolio managers. The Board recognized that HFMC has demonstrated a record of making changes to the management and/or strategies of the Hartford Funds when warranted. The Board considered HFMC’s oversight of the Sub-adviser’s investment approach and results, process for monitoring best execution of portfolio trades by the Sub-adviser, and approach to risk management with respect to the Funds and the service providers to the Funds. The Board also considered HFMC’s oversight of compliance with each Fund’s objective and policies as well as with applicable laws and regulations, noting that regulatory and other developments had over time led to an increase in the scope of HFMC’s services in this regard.
In addition, the Board considered HFMC’s ongoing commitment to review and rationalize the Hartford Funds product line-up and the expenses that HFMC had incurred in connection with fund combinations in recent years. The Board considered that HFMC or its affiliates are responsible for providing the Funds’ officers. The Board also noted that Hartford Life Insurance Company (“HLIC”) provides administrative services to the Funds. The Board considered its experiences with HFMC and HLIC with respect to each of these services.
With respect to the Sub-adviser, which provides certain day-to-day portfolio management services for the Funds, the Board considered the quality of each Fund’s portfolio manager(s), the Sub-adviser’s other investment personnel, its investment philosophy and process, investment research capabilities and resources, performance record, trade execution capabilities and experience. The Board considered the experience of each Fund’s portfolio manager(s), the number of accounts managed by the portfolio manager(s), and the Sub-adviser’s method for compensating the portfolio manager(s).
Based on these considerations, the Board concluded that it was satisfied with the nature, extent and quality of the services provided to each Fund by HFMC and the Sub-adviser.
Performance of each Fund and the Advisers
The Board considered the investment performance of each Fund. In this regard, the Board reviewed the performance of each Fund over different time periods presented in the materials and evaluated HFMC’s analysis of the Fund’s performance for these time periods. The Board considered information and materials provided to the Board by the Advisers concerning Fund performance, as well as information from Lipper comparing the investment performance of each Fund to an appropriate benchmark and universe of peer funds. For detail regarding each Fund’s performance, see the fund-by-fund synopsis below.
The Board considered the detailed investment analytics reports provided by HFMC’s Investment Advisory Group throughout the year. These reports include, among other things, information on each Fund’s gross and net returns, the Fund’s investment performance relative to an
Approval of Investment Management and Investment Sub-Advisory Agreements (Unaudited) – (continued)
appropriate benchmark and peer group, various statistics concerning the Fund’s portfolio, and a narrative summary of various factors affecting Fund performance. The Board considered the Advisers’ cooperation with the Investment Committee, which assists the Board in evaluating the performance of each Fund at periodic meetings throughout the year. The Board also considered the analysis provided by the Consultant relating to each Fund’s performance track record.
In light of all the considerations noted above, the Board concluded that it had continued confidence in HFMC’s and the Sub-adviser’s overall capabilities to manage the Funds.
Costs of the Services and Profitability of the Advisers
The Board reviewed information regarding HFMC’s cost to provide investment management and related services to each Fund and HFMC’s profitability, both overall and for each Fund, on a pre-tax basis without regard to distribution expenses. The Board also requested and reviewed information about the profitability to HFMC and its affiliates from all services provided to each Fund and all aspects of their relationship with the Fund. The Board also requested and received information relating to the operations and profitability of the Sub-adviser.
The Board considered the Consultant’s review of the profitability calculations used by HFMC in connection with the continuation of the investment management agreement, noting the Consultant’s view that HFMC’s process for calculating and reporting Fund profitability is reasonable. In this regard, the Board noted that the Consultant had previously performed a full review of this process and reported that such process is sound and well within common industry practice.
Based on these considerations, the Board concluded that the profits anticipated to be realized by the Advisers and their affiliates from their relationships with the Funds would not be excessive.
Comparison of Fees and Services Provided by the Advisers
The Board considered comparative information with respect to the management fees to be paid by each Fund to HFMC and the total expense ratios of the Fund. The Board also considered comparative information with respect to the sub-advisory fees to be paid by HFMC to the Sub-adviser with respect to each Fund. In this regard, the Board requested and reviewed information from HFMC and the Sub-adviser relating to the management and sub-advisory fees, including the sub-advisory fee schedule for each Fund, and total operating expenses for each Fund. The Board considered that the management fee for each Fund includes the fee paid to HLIC for providing certain administrative services to the Fund. With respect to each Fund’s sub-advisory fee schedule, the Board considered representations from HFMC and the Sub-adviser that the Sub-adviser’s fees were negotiated at arm’s length on a fund-by-fund basis. The Board also reviewed information from Lipper comparing each Fund’s contractual management fees, actual management fees and overall expense ratios relative to a group of funds selected by Lipper, in consultation with the Consultant, and a broader universe of funds selected by Lipper. For detail regarding each Fund’s expenses, see the fund-by-fund synopsis below.
While the Board recognized that comparisons between the Fund and peer funds may be imprecise, given the different service levels and characteristics of mutual funds and the different business models and cost structures of the Advisers, the comparative information provided by Lipper assisted the Board in evaluating the reasonableness of each Fund’s management and sub-advisory fees and total operating expenses. In addition, the Board considered the analysis and recommendations of the Consultant relating to each Fund’s management and sub-advisory fees and total operating expenses.
Based on these considerations, the Board concluded that each Fund’s fees and total operating expenses, taking into account the information about quality of services, profitability, economies of scale, and other matters discussed, were reasonable in light of the services provided.
Economies of Scale
The Board requested and considered information regarding the Advisers’ realization of economies of scale with respect to each Fund and whether the fee levels reflect these economies of scale for the benefit of the Fund’s shareholders. The Board reviewed the breakpoints in the management fee schedule for each Fund, if any, which reduce fee rates as the Fund’s assets grow over time. The Board recognized that a fund with assets beyond the highest breakpoint level will continue to benefit from economies of scale because additional assets are charged the lowest breakpoint fee resulting in lower overall effective management fee rates. The Board also recognized that a fee schedule that reaches a lower breakpoint quickly provides shareholders with the benefit of anticipated or potential economies of scale. The Board noted the effect of the run-off of the variable annuity business on the HLS Funds and also noted that the Hartford Small/Mid Cap Equity HLS Fund’s current low asset levels have kept the Fund from fully realizing the benefits of anticipated or potential economies of scale.
Approval of Investment Management and Investment Sub-Advisory Agreements (Unaudited) – (continued)
The Board reviewed and evaluated materials from Lipper and the Consultant showing how management fee schedules of peer funds reflect economies of scale for the benefit of shareholders as a peer fund’s assets hypothetically increase over time. Based on information provided by HFMC, Lipper, and the Consultant, the Board recognized that there is no uniform methodology for establishing breakpoints or uniform pattern in asset levels that trigger breakpoints or the amounts of breakpoints triggered.
After considering all of the information available to it, the Board concluded that it was satisfied with the extent to which economies of scale would be shared for the benefit of each Fund’s shareholders based on currently available information and the effective advisory fees and expense ratios for the Fund at its current and reasonably anticipated asset levels. The Board noted, however, that it would continue to monitor future growth in each Fund’s assets and the appropriateness of additional breakpoints.
Other Benefits
The Board considered other benefits to the Advisers and their affiliates from their relationships with the Funds, including the role of each Fund in supporting the variable life insurance and variable annuity products offered by The Hartford.
The Board noted that HLIC, an affiliate of HFMC, receives fees for providing certain administrative services to the Funds and that HFMC receives fees for fund accounting and related services from the Funds. The Board considered information on profits to HLIC and HFMC for such services. The Board also considered that Hartford Administrative Services Company (“HASCO”), the Funds’ transfer agent and an affiliate of HFMC, receives transfer agency compensation from the Funds, and the Board reviewed information about the profitability of the Funds’ transfer agency function to HASCO. The Board considered information provided by HASCO in support of HASCO’s assertion that the transfer agent fees charged by HASCO to the Funds were fair and reasonable based on publicly available information. The Board also noted that HFMC and HASCO had delegated certain fund accounting services and transfer agency services, respectively, to external service providers.
The Board also considered that Hartford Funds Distributors, LLC (“HFD”), an affiliate of HFMC, serves as principal underwriter of the Funds. As principal underwriter, HFD receives 12b-1 fees from the Funds. The Board also noted that HFD pays 12b-1 fees to affiliated insurance companies that include the Funds as investment options under their variable contracts.
The Board considered the benefits, if any, to the Sub-adviser from any use of a Fund’s brokerage commissions to obtain soft dollar research, and representations from HFMC and the Sub-adviser that the Sub-adviser will not make any revenue-sharing payments or any other type of distribution payments to HFMC or its affiliates.
The Board considered the benefits to shareholders of being part of the Hartford Funds family of funds. The Board considered HFMC’s efforts to provide investors in the fund family with a broad range of investment styles and asset classes.
Fund-by-Fund factors
Hartford Balanced HLS Fund
| • | | The Board noted that the Fund’s performance was in the 1st quintile of its performance universe for the 1-year period and the 2nd quintile for the 3- and 5-year periods. The Board also noted that the Fund’s performance was in line with its blended custom benchmark for the 1-year period and above its blended custom benchmark for the 3- and 5-year periods. |
| • | | The Board noted that the Fund’s contractual management fee, actual management fee and total expenses (less 12b-1 and shareholder service fees) were in the 4th quintile of its expense group. The Board also noted that the Fund has a temporary management fee waiver through December 31, 2015. |
Hartford Capital Appreciation HLS Fund
| • | | The Board noted that the Fund’s performance was in the 3rd quintile of its performance universe for the 1-year period, the 2nd quintile for the 3-year period and the 4th quintile for the 5-year period. The Board also noted that the Fund’s performance was below its benchmark for the 1- and 5-year periods, and above its benchmark for the 3-year period. |
| • | | The Board noted that the Fund’s contractual management fee, actual management fee and total expenses (less 12b-1 and shareholder service fees) were in the 3rd quintile of its expense group. |
Hartford Disciplined Equity HLS Fund
| • | | The Board noted that the Fund’s performance was in the 1st quintile of its performance universe for the 1-, 3- and 5-year periods. The Board also noted that the Fund’s performance was above its benchmark for the 1-, 3- and 5-year periods. |
Approval of Investment Management and Investment Sub-Advisory Agreements (Unaudited) – (continued)
| • | | The Board noted that the Fund’s contractual management fee and actual management fee were in the 4th quintile of its expense group, while its total expenses (less 12b-1 and shareholder service fees) were in the 3rd quintile. |
Hartford Dividend and Growth HLS Fund
| • | | The Board noted that the Fund’s performance was in the 1st quintile of its performance universe for the 1- and 3-year periods and the 2nd quintile for the 5-year period. The Board also noted that the Fund’s performance was below its benchmark for the 1- and 5-year periods, and in line with its benchmark for the 3-year period. |
| • | | The Board noted that the Fund’s contractual management fee, actual management fee and total expenses (less 12b-1 and shareholder service fees) were in the 2nd quintile of its expense group. |
Hartford Global Growth HLS Fund
| • | | The Board noted that the Fund’s performance was in the 1st quintile of its performance universe for the 1-, 3- and 5-year periods. The Board also noted that the Fund’s performance was above its benchmark for the 1-, 3- and 5-year periods. |
| • | | The Board noted that the Fund’s contractual management fee and actual management fee were in the 3rd quintile of its expense group, while its total expenses (less 12b-1 and shareholder service fees) were in the 2nd quintile. |
Hartford Growth Opportunities HLS Fund
| • | | The Board noted that the Fund’s performance was in the 1st quintile of its performance universe for the 1- and 3-year periods, and the 2nd quintile for the 5-year period. The Board also noted that the Fund’s performance was above its benchmark for the 1-, 3- and 5-year periods. |
| • | | The Board noted that the Fund’s contractual management fee, actual management fee and total expenses (less 12b-1 and shareholder service fees) were in the 2nd quintile of its expense group. |
Hartford Healthcare HLS Fund
| • | | The Board noted that the Fund’s performance was in the 4th quintile of its performance universe for the 1-year period and the 3rd quintile for the 3- and 5-year periods. The Board also noted that the Fund’s performance was above its benchmark for the 1-, 3- and 5-year periods. |
| • | | The Board noted that the Fund’s contractual management fee and actual management fee were in the 3rd quintile of its expense group, while its total expenses (less 12b- 1 and shareholder service fees) were in the 2nd quintile. |
Hartford High Yield HLS Fund
| • | | The Board noted that the Fund’s performance was in the 3rd quintile of its performance universe for the 1- and 3-year periods and the 2nd quintile for the 5-year period. The Board also noted that the Fund’s performance was in line with its benchmark for the 1-, 3- and 5-year periods. |
| • | | The Board noted that the Fund’s contractual management fee and actual management fee were in the 5th quintile of its expense group, while its total expenses (less 12b- 1 and shareholder service fees) were in the 4th quintile. |
Hartford International Opportunities HLS Fund
| • | | The Board noted that the Fund’s performance was in the 2nd quintile of its performance universe for the 1- and 3-year periods and the 3rd quintile for the 5-year period. The Board also noted that the Fund’s performance was above its benchmark for the 1-, 3- and 5-year periods. |
| • | | The Board noted that the Fund’s contractual management fee, actual management fee, and total expenses (less 12b-1 and shareholder service fees) were in the 1st quintile of its expense group. |
Hartford MidCap HLS Fund
| • | | The Board noted that the Fund’s performance was in the 1st quintile of its performance universe for the 1-, 3- and 5-year periods. The Board also noted that the Fund’s performance was above its benchmark for the 1-, 3- and 5-year periods. The Board and Management noted that the performance of the Fund was within expectations. |
Approval of Investment Management and Investment Sub-Advisory Agreements (Unaudited) – (continued)
| • | | The Board noted that the Fund’s contractual management fee, actual management fee and total expenses (less 12b-1 and shareholder service fees) were in the 1st quintile of its expense group. |
Hartford MidCap Value HLS Fund
| • | | The Board noted that the Fund’s performance was in the 4th quintile of its performance universe for the 1-year period, the 1st quintile for the 3-year period and the 3rd quintile for the 5-year period. The Board also noted that the Fund’s performance was above its benchmark for the 1-, 3- and 5-year periods. |
| • | | The Board noted that the Fund’s contractual management fee, actual management fee and total expenses (less 12b-1 and shareholder service fees) were in the 4th quintile of its expense group. |
Hartford Small Company HLS Fund
| • | | The Board noted that the Fund’s performance was in the 1st quintile of its performance universe for the 1-year period, the 2nd quintile for the 3-year period and the 3rd quintile for the 5-year period. The Board also noted that the Fund’s performance was above its benchmark for the 1-year period and in line with its benchmark for the 3- and 5-year periods. |
| • | | The Board noted that the Fund’s contractual management fee, actual management fee and total expenses (less 12b-1 and shareholder service fees) were in the 1st quintile of its expense group. |
Hartford Small/Mid Cap Equity HLS Fund
| • | | The Board noted that the Fund’s performance was in the 4th quintile of its performance universe for the 1-year period, the 3rd quintile for the 3-year period and the 2nd quintile for the 5-year period. The Board also noted that the Fund’s performance was in line with its benchmark for the 1- and 3-year periods and above its benchmark for the 5-year period. |
| • | | The Board noted that the Fund’s contractual management fee and total expenses (less 12b-1 and shareholder service fees) were in the 1st quintile of its expense group, while its actual management fee was in the 2nd quintile. |
Hartford SmallCap Growth HLS Fund
| • | | The Board noted that the Fund’s performance was in the 1st quintile of its performance universe for the 1-, 3- and 5-year periods. The Board also noted that the Fund’s performance was above its benchmark for the 1-, 3- and 5-year periods. |
| • | | The Board noted that the Fund’s contractual management fee, actual management fee and total expenses (less 12b-1 and shareholder service fees) were in the 1st quintile of its expense group. |
Hartford Stock HLS Fund
| • | | The Board noted that the Fund’s performance was in the 4th quintile of its performance universe for the 1- and 5-year periods and 5th quintile for the 3-year period. The Board also noted that the Fund’s performance was below its benchmark for the 1-, 3- and 5-year periods. The Board considered that, in response to questions raised concerning the Fund’s performance, HFMC stated that it has confidence in the Fund’s portfolio management team and investment strategy. |
| • | | The Board noted that the Fund’s contractual management fee, actual management fee and total expenses (less 12b-1 and shareholder service fees) were in the 1st quintile of its expense group. |
Hartford Total Return Bond HLS Fund
| • | | The Board noted that the Fund’s performance was in the 3rd quintile of its performance universe for the 1-year period and the 1st quintile for the 3- and 5-year periods. The Board also noted that the Fund’s performance was in line with its benchmark for the 1-year period and above its benchmark for the 3- and 5-year periods. |
| • | | The Board noted that the Fund’s contractual management fee and actual management fee were in the 2nd quintile of its expense group, while its total expenses (less 12b-1 and shareholder service fees) were in the 1st quintile. |
Hartford Ultrashort Bond HLS Fund
| • | | The Board noted that the Fund’s performance was in the 4th quintile of its performance universe for the 1-year period. The Board also noted that the Fund’s performance was in line with its benchmark for the 1-year period. |
Approval of Investment Management and Investment Sub-Advisory Agreements (Unaudited) – (continued)
| • | | The Board noted that the Fund’s contractual management fee, actual management fee and total expenses (less 12b-1 and shareholder service fees) were in the 1st quintile of its expense group. |
Hartford U.S. Government Securities HLS Fund
| • | | The Board noted that the Fund’s performance was in the 4th quintile of its performance universe for the 1-, 3- and 5-year periods. The Board also noted that the Fund’s performance was above its benchmark for the 1- and 3-year periods and in line with its benchmark for the 5-year period. |
| • | | The Board noted that the Fund’s contractual management fee and actual management fee were in the 2nd quintile of its expense group, while its total expenses (less 12b-1 and shareholder service fees) were in the 1st quintile. |
Hartford Value HLS Fund
| • | | The Board noted that the Fund’s performance was in the 1st quintile of its performance universe for the 1-year period and the 3rd quintile for the 3- and 5-year periods. The Board also noted that the Fund’s performance was above its benchmark for the 1-year period and in line with its benchmark for the 3- and 5-year periods. |
| • | | The Board noted that the Fund’s contractual management fee and total expenses (less 12b-1 and shareholder service fees) were in the 2nd quintile of its expense group, while its actual management fee was in the 4th quintile. |
* * * *
Based upon its review of these various factors, among others, the Board concluded that it is in the best interests of each Fund and its shareholders for the Board to approve the Agreements for an additional year. In reaching this decision, the Board did not assign relative weights to the factors discussed above or deem any one or group of them to be controlling in and of themselves. In connection with their deliberations, the Independent Directors met separately in executive session on several occasions, with independent legal counsel and the Consultant, to review the relevant materials and consider their responsibilities under relevant laws and regulations.
Main Risks (Unaudited)
The main risks of investing in each Fund are described below. Each Fund’s Prospectus contains further information on the risks applicable to that Fund.
Active Trading Risk: (Capital Appreciation HLS Fund, Disciplined Equity HLS Fund, Global Growth HLS Fund, Growth Opportunities HLS Fund, High Yield HLS Fund, International Opportunities HLS Fund, Small Company HLS Fund, Small/Mid Cap Equity HLS Fund, SmallCap Growth HLS Fund, Total Return Bond HLS Fund and U.S. Government Securities HLS Fund) Active trading could increase a Fund’s transaction costs.
Asset Allocation Strategy Risk: (Balanced HLS Fund and Capital Appreciation HLS Fund) The portfolio managers’ asset allocation strategy may not always work as intended.
Derivatives Risk: (High Yield HLS Fund, Total Return Bond HLS Fund, U.S. Government Securities HLS Fund and Ultrashort Bond HLS Fund) Derivatives may be riskier or more volatile than other types of investments because they are generally more sensitive to changes in market or economic conditions; risks include currency risk, leverage risk, liquidity risk, index risk, pricing risk, and counterparty risk.
Dividend Paying Security Risk: (Dividend and Growth HLS Fund) For dividend-paying stocks, dividends are not guaranteed and may increase or decrease without notice.
Fixed Income Risk: (Balanced HLS Fund, High Yield HLS Fund, Total Return Bond HLS Fund, U.S. Government Securities HLS Fund and Ultrashort Bond HLS Fund) Fixed-income securities are subject to credit risk, liquidity risk, call risk, and interest-rate risk. As interest rates rise, bond prices generally fall.
Foreign Investment Risk: (Disciplined Equity HLS Fund, Dividend and Growth HLS Fund, Growth Opportunities HLS Fund, High Yield HLS Fund, MidCap HLS Fund, MidCap Value HLS Fund, Small Company HLS Fund, Small/Mid Cap Equity HLS Fund, SmallCap Growth HLS Fund, Stock HLS Fund and Value HLS Fund) Foreign investments can be riskier than U.S. investments due to the adverse effects of currency exchange rates, differences in market structure and liquidity, as well as specific country, regional, and economic developments.
Foreign Investment and Emerging Markets Risk: (Capital Appreciation HLS Fund, Global Growth HLS Fund, Healthcare HLS Fund, International Opportunities HLS Fund and Total Return Bond HLS Fund) Foreign investments can be riskier than U.S. investments due to the adverse effects of currency exchange rates, differences in market structure and liquidity, as well as specific country, regional, and economic developments. These risks are generally greater for investments in emerging markets.
Growth Investing Risk: (Global Growth HLS Fund, Growth Opportunities HLS Fund, Small Company HLS Fund and SmallCap Growth HLS Fund) A Fund’s growth-investing style may become out of favor, which may result in periods of underperformance.
Health Sector Risk: (Healthcare HLS Fund) Risks of focusing investments on the health care sector include regulatory and legal developments, patent considerations, intense competitive pressures, rapid technological changes and potential product obsolescence, and liquidity risk.
Junk Bond Risk: (High Yield HLS Fund) Investments in high-yield (“junk”) bonds involve greater risk of price volatility, illiquidity, and default than higher rated debt securities.
Market, Selection and Strategy Risk: (All Funds) A Fund’s share price may fluctuate due to market risk and/or security selections that may underperform the market or relevant benchmarks. There is no guarantee a Fund will achieve its stated objective. With respect to the Capital Appreciation HLS Fund, Small Company HLS Fund, and SmallCap Growth HLS Fund, the investment styles employed by the portfolio managers may not be complementary, which could adversely affect the performance of the Fund.
Mid-Cap Stock Risk: (Global Growth HLS Fund, Growth Opportunities HLS Fund, International Opportunities HLS Fund, MidCap HLS Fund and MidCap Value HLS Fund) Mid-cap stocks can have greater risk and volatility than large-cap stocks.
Mortgage-Backed Securities Risk: (Balanced HLS Fund, Total Return Bond HLS Fund, U.S. Government Securities HLS Fund and Ultrashort Bond HLS Fund) Mortgage-backed securities are subject to credit risk, interest-rate risk, prepayment risk, and extension risk.
Quantitative Analysis Risk: (Disciplined Equity HLS Fund and Small/Mid Cap Equity HLS Fund) Securities selected by using quantitative analysis may perform differently from the broader stock market.
Reverse Repurchase Agreements and Dollar Rolls Risk: (Ultrashort Bond HLS Fund) The Fund may use dollar rolls and repurchase agreements, which can increase risk and volatility.
Main Risks (Unaudited) – (continued)
Small-Cap Stock Risk: (Small Company HLS Fund and SmallCap Growth HLS Fund) Small-cap stocks can have greater risk and volatility than large-cap stocks.
Small/Mid-Cap Stock Risk: (Capital Appreciation HLS Fund, Healthcare HLS Fund and Small/Mid Cap Equity HLS Fund) Small- and mid-cap stocks can have greater risk and volatility than large-cap stocks.
To Be Announced (TBA) Securities Risk: (Total Return Bond HLS Fund and U.S. Government Securities HLS Fund) A Fund may buy securities in the To-Be-Announced (TBA) market, which can subject the Fund to additional price and counterparty risk.
U.S. Government Securities Risk: (Balanced HLS Fund, Total Return Bond HLS Fund, U.S. Government Securities HLS Fund and Ultrashort Bond HLS Fund) Obligations of U.S. Government agencies and authorities are supported by varying degrees of credit but are generally not backed by the full faith and credit of the U.S. Government.
Value Investing Risk: (MidCap Value HLS Fund and Value HLS Fund) The value-investing style may become out of favor, which may result in periods of underperformance.
THIS PRIVACY POLICY IS NOT PART OF THIS REPORT
Privacy Policy and Practices of The Hartford Financial Services Group, Inc. and its Affiliates
(herein called “we, our and us”)
This Privacy Policy applies to our United States Operations
We value your trust. We are committed to the responsible:
a) management;
b) use; and
c) protection;
of Personal Information.
This notice describes how we collect, disclose, and protect Personal Information.
We collect Personal Information to:
a) service your Transactions with us; and
b) support our business functions.
We may obtain Personal Information from:
a) You;
b) your Transactions with us; and
c) third parties such as a consumer-reporting agency.
Based on the type of product or service You apply for or get from us, Personal Information such as:
a) your name;
b) your address;
c) your income;
d) your payment; or
e) your credit history;
may be gathered from sources such as applications, Transactions, and consumer reports.
To serve You and service our business, we may share certain Personal Information. We will share Personal Information, only as allowed by law, with affiliates such as:
a) our insurance companies;
b) our employee agents;
c) our brokerage firms; and
d) our administrators.
As allowed by law, we may share Personal Financial Information with our affiliates to:
a) market our products; or
b) market our services;
to You without providing You with an option to prevent these disclosures.
We may also share Personal Information, only as allowed by law, with unaffiliated third parties including:
a) independent agents;
b) brokerage firms;
c) insurance companies;
d) administrators; and
e) service providers;
who help us serve You and service our business.
When allowed by law, we may share certain Personal Financial Information with other unaffiliated third parties who assist us by performing services or functions such as:
a) taking surveys;
b) marketing our products or services; or
c) offering financial products or services under a joint agreement between us and one or more financial institutions.
We, and third parties we partner with, may track some of the pages You visit through the use of:
a) cookies;
b) pixel tagging; or
c) other technologies;
and currently do not process or comply with any web browser’s “do not track” signal or other similar mechanism that indicates a request to disable online tracking of individual users who visit our websites or use our services.
We will not sell or share your Personal Financial Information with anyone for purposes unrelated to our business functions without offering You the opportunity to:
a) “opt-out;” or
b) “opt-in;”
as required by law.
We only disclose Personal Health Information with:
a) your proper written authorization; or
b) as otherwise allowed or required by law.
Our employees have access to Personal Information in the course of doing their jobs, such as:
a) underwriting policies;
b) paying claims;
c) developing new products; or
d) advising customers of our products and services.
We use manual and electronic security procedures to maintain:
a) the confidentiality; and
b) the integrity of;
Personal Information that we have. We use these procedures to guard against unauthorized access.
Some techniques we use to protect Personal Information include:
a) secured files;
b) user authentication;
c) encryption;
d) firewall technology; and
e) the use of detection software.
We are responsible for and must:
a) identify information to be protected;
b) provide an adequate level of protection for that data;
c) grant access to protected data only to those people who must use it in the performance of their job-related duties.
Employees who violate our Privacy Policy will be subject to discipline, which may include ending their employment with us.
At the start of our business relationship, we will give You a copy of our current Privacy Policy.
We will also give You a copy of our current Privacy Policy once a year if You maintain a continuing business relationship with us.
We will continue to follow our Privacy Policy regarding Personal Information even when a business relationship no longer exists between us.
As used in this Privacy Notice:
Application means your request for our product or service.
Personal Financial Information means financial information such as:
a) credit history;
b) income;
c) financial benefits; or
d) policy or claim information.
Personal Health Information means health information such as:
a) your medical records; or
b) information about your illness, disability or injury.
Personal Information means information that identifies You personally and is not otherwise available to the public. It includes:
a) Personal Financial Information; and
b) Personal Health Information ..
Transaction means your business dealings with us, such as:
a) your Application;
b) your request for us to pay a claim; and
c) your request for us to take an action on your account.
You means an individual who has given us Personal Information in conjunction with:
a) asking about;
b) applying for; or
c) obtaining;
a financial product or service from us if the product or service is used mainly for personal, family, or household purposes.
This Privacy Policy is being provided on behalf of the following affiliates of The Hartford Financial Services Group, Inc.: 1stAGChoice, Inc.; Access CoverageCorp, Inc.; Access CoverageCorp Technologies, Inc.; American Maturity Life Insurance Company; Archway 60 R, LLC; Business Management Group, Inc.; DMS R, LLC; First State Insurance Company; Fountain Investors I LLC; Fountain Investors II LLC; Fountain Investors III LLC; Fountain Investors IV LLC; FTC Resolution Company LLC; Hart Re Group L.L.C.; Hartford Accident and Indemnity Company; Hartford Administrative Services Company; Hartford Casualty General Agency, Inc.; Hartford Casualty Insurance Company; Hartford Financial Services, LLC; Hartford Fire General Agency, Inc.; Hartford Fire Insurance Company; Hartford Funds Distributors, LLC; Hartford Funds Management Company, LLC; Hartford Funds Management Group, Inc.; Hartford Holdings, Inc.; Hartford HLS Series Fund II, Inc.; Hartford Insurance Company of Illinois; Hartford Insurance Company of the Midwest; Hartford Insurance Company of the Southeast; Hartford Integrated Technologies, Inc.; Hartford International Life Reassurance Corporation; Hartford Investment Management Company; Hartford Life and Accident Insurance Company; Hartford Life and Annuity Insurance Company; Hartford Life Insurance Company; Hartford Life, Inc.; Hartford Life International Holding Company; Hartford Life Private Placement, LLC; Hartford Lloyd’s Corporation; Hartford Lloyd’s Insurance Company; Hartford of Texas General Agency, Inc.; Hartford Residual Market, L.C.C.; Hartford Securities Distribution Company, Inc.; Hartford Series Fund, Inc.; Hartford Specialty Insurance Services of Texas, LLC; Hartford Strategic Investments, LLC; Hartford Underwriters General Agency, Inc.; Hartford Underwriters Insurance Company; Hartford-Comprehensive Employee Benefit Service Company; HDC R, LLC .; Heritage Holdings, Inc.; HIMCO Distribution Services Company; HIMCO Variable Insurance Trust; HLA LLC; HL Investment Advisors, LLC; Horizon Management Group, LLC; HRA Brokerage Services, Inc.; Lanidex Class B, LLC; New England Insurance Company; New England Reinsurance Corporation; Nutmeg Insurance Agency, Inc.; Nutmeg Insurance Company; Pacific Insurance Company, Limited; Planco, LLC; Property and Casualty Insurance Company of Hartford; Revere R, LLC; RVR R, LLC; Sentinel Insurance Company, Ltd.; Sunstone R, LLC; Symphony R, LLC; The Evergreen Group Incorporated; The Hartford Alternative Strategies Fund; The Hartford Mutual Funds, Inc.; The Hartford Mutual Funds II, Inc.; Trumbull Flood Management, L.L.C.; Trumbull Insurance Company; Twin City Fire Insurance Company.
HPP Revised February 2015
Series of Hartford Series Fund, Inc. and Hartford HLS Series Fund II, Inc. (each a “Hartford Fund” and collectively, the “Hartford Funds”) are not subsidiaries of The Hartford Financial Services Group, Inc. (“The Hartford”) but are underwritten, distributed by and advised by subsidiaries of The Hartford. Investments in the Hartford Funds are not guaranteed by The Hartford or any other entity.
This report is submitted for the general information of the shareholders of the Hartford Funds referenced in this report. It is not authorized for distribution to persons who are not shareholders of one or more Hartford Funds referenced in this report unless preceded or accompanied by a current prospectus for the relevant Hartford Fund. Nothing herein contained is to be considered an offer of sale or a solicitation of an offer to buy shares of any Hartford Fund listed in this report. Such offering is only made by prospectus, which includes details as to the offering price and other material information.
Investors should carefully consider the investment objectives, risks, charges, and expenses of Hartford Funds before investing. This and other information can be found in the prospectus and summary prospectus, which can be obtained by calling 888-843-7824 or 800-279-1541. Investors should read them carefully before they invest.
Hartford Funds are underwritten and distributed by Hartford Funds Distributors, LLC.
HLSAR15 2-16 115336-4 Printed in U.S.A.
| | | | |


| | hartfordfunds.com 888-843-7824 @hartfordfunds hartfordfunds.com/linkedin | |  |
Item 2. Code of Ethics.
| | (a) | The registrant, as of the end of the period covered by this report, has adopted a code of ethics that applies to the registrant’s principal executive officer, principal financial officer, principal accounting officer or controller, or persons performing similar functions, regardless of whether these individuals are employed by the registrant or a third party. A copy of the code of ethics is filed herewith. |
| | (c) | There have been no amendments, during the period covered by this report, to a provision of the code of ethics that applies to the registrant’s principal executive officer, principal financial officer, principal accounting officer or controller, or persons performing similar functions, regardless of whether these individuals are employed by the registrant or a third party, and that relates to any element of the code of ethics description. |
| | (d) | The registrant has not granted any waivers, including an implicit waiver, from a provision of the code of ethics that applies to the registrant’s principal executive officer, principal financial officer, principal accounting officer or controller, or persons performing similar functions, regardless of whether these individuals are employed by the registrant or a third party, that relates to one or more of the items set forth in paragraph (b) of this item’s instructions. |
Item 3. Audit Committee Financial Expert.
The Board of Directors of the Registrant has designated Phillip O. Peterson as an Audit Committee Financial Expert. Mr. Peterson is considered by the Board to be an independent director.
Item 4. Principal Accountant Fees and Services.
| | (a) | Audit Fees: The aggregate fees billed for each of the last two fiscal years for professional services rendered by the principal accountant for the audit of the registrant’s annual financial statements or services that are normally provided by the accountant in connection with statutory and regulatory filings or engagements for those fiscal years were: |
| | | $306,140 for the fiscal year ended December 31, 2014; $367,360 for the fiscal year ended December 31, 2015. |
| | (b) | Audit Related Fees: The aggregate fees billed in each of the last two fiscal years for assurance and related services by the principal accountant that are reasonably related to the performance of the audit of the registrant’s financial statements and are not reported under paragraph (a) of this Item were: |
| | | $9,148 for the fiscal year ended December 31, 2014; $25,634 for the fiscal year ended December 31, 2015. Audit-related services are principally in connection with Rule 17Ad-13 under the Securities and Exchange Act of 1934 and procedures performed over the transition of fund accounting administration. |
| | (c) | Tax Fees: The aggregate fees billed in each of the last two fiscal years for professional services rendered by the principal accountant for tax compliance, tax advice, and tax planning were: |
$77,244 for the fiscal year ended December 31, 2014; $88,114 for the fiscal year ended December 31, 2015. Tax-related services are principally in connection with, but not limited to, general tax services and Passive Foreign Investment Company (PFIC) analysis.
| | (d) | All Other Fees: The aggregate fees billed in each of the last two fiscal years for products and services provided by the principal accountant, other than the services reported in paragraphs (a) through (c) of this Item were: |
$0 for the fiscal year ended December 31, 2014; $0 for the fiscal year ended December 31, 2015.
| | (e) | (1) The Pre-Approval Policies and Procedures (the “Policy”) adopted by the Audit Committee of the Registrant (also, the “Fund”) sets forth the procedures pursuant to which services performed by the independent registered public accounting firm for the Registrant may be pre-approved. The following are some main provisions from the Policy. |
| | 1. | The Audit Committee must pre-approve all audit services and non-audit services that the independent registered public accounting firm provides to the Fund. |
| | 2. | The Audit Committee must pre-approve any engagement of the independent registered public accounting firm to provide non-audit services to any Service Affiliate (which is defined to include any entity controlling, controlled by, or under common control with the investment adviser that provides ongoing services to the Fund) during the period of the independent registered public accounting firm’s engagement to provide audit services to the Fund, if the non-audit services to the Service Affiliate directly impact the Fund’s operations and financial reporting. |
| | 3. | The Audit Committee shall pre-approve certain non-audit services to the Fund and its Service Affiliates pursuant to procedures set forth in the Policy. |
| | 4. | The Audit Committee, from time to time, may designate one or more of its members who are Independent Directors (each a “Designated Member”) to consider, on the Audit Committee’s behalf, any non-audit services, whether to the Fund or to any Service Affiliate, that have not been pre-approved by the Audit Committee. The Designated Member also shall review, on the Audit Committee’s behalf, any proposed material change in the nature or extent of any non-audit services previously approved. In considering any requested non-audit services or proposed material change in such services, the Designated Member shall not authorize services which would exceed $50,000 in fees for such services. |
| | 5. | The independent registered public accounting firm may not provide specified prohibited non-audit services set forth in the Policy to the Fund, the Fund’s investment adviser, the Service Affiliates or any other member of the investment company complex. |
| | (e) | (2) One hundred percent of the services described in items 4(b) through 4(d) were approved in accordance with the Audit Committee’s Pre-Approval Policy. As a result, none of such services was approved pursuant to paragraph (c) (7) (i) (c) of Rule 2-01 of Regulation S-X. |
| | (f) | Less than 50% of the hours expended on the principal accountant’s engagement to audit the registrant’s financial statements for the year ended December 31, 2015, were attributed to work performed by persons other than the principal accountant’s full-time, permanent employees. |
| | (g) | The aggregate non-audit fees billed by the registrant’s accountant for services rendered to the registrant, and rendered to the registrant’s investment adviser (not including any sub-adviser whose role is primarily portfolio management and is subcontracted with or overseen by another investment adviser), and any entity controlling, controlled by, or under common control with the adviser that provides ongoing services to the registrant for each of the last two fiscal years of the registrant were: |
$1,433,983 for the fiscal year ended December 31, 2014; $1,862,111 for the fiscal year ended December 31, 2015.
| | (h) | The registrant’s audit committee of the board of directors has considered whether the provision of non-audit services that were rendered to the registrant’s investment adviser (not including any sub-adviser whose role is primarily portfolio management and is subcontracted with or overseen by another investment adviser), and any entity controlling, controlled by, or under common control with the investment adviser that provides ongoing services to the registrant that were not pre-approved pursuant to paragraph (c)(7)(ii) of Rule 2-01 of Regulation S-X is compatible with maintaining the principal accountant’s independence. |
Item 5. Audit Committee of Listed Registrants.
Not applicable.
Item 6. Investments
| | (a) | The Schedule of Investments in securities of unaffiliated issuers as of the close of the reporting period is included as part of the annual report filed under Item 1 of this form. |
Item 7. Disclosure of Proxy Voting Policies and Procedures for Closed-End Management Investment Companies.
Not applicable.
Item 8. Portfolio Managers of Closed-End Management Investment Companies.
Not applicable.
Item 9. Purchases of Equity Securities by Closed-End Management Investment Company and Affiliated Purchasers.
Not applicable.
Item 10. Submission of Matters to a Vote of Security Holders.
There have been no material changes to the procedures by which shareholders may recommend nominees to the registrant’s board of directors since registrant last provided disclosure in response to this requirement.
Item 11. Controls and Procedures.
| | (a) | The registrant’s principal executive and principal financial officers, or persons performing similar functions, have concluded that the registrant’s disclosure controls and procedures (as defined in Rule 30a-3(c) under the Investment Company Act of 1940, as amended (the “1940 Act”) (17 CFR 270.30a-3(c))) are generally effective to provide reasonable assurance, as of a date within 90 days of the filing date of the report that includes the disclosure required by this paragraph, based on their evaluation of these controls and procedures required by Rule 30a-3(b) under the 1940 Act (17 CFR 270.30a-3(b)) and Rules 13a-15(b) or 15d-15(b) under the Securities Exchange Act of 1934, as amended (17 CFR 240.13a-15(b) or 240.15d-15(b)). |
| | (b) | There were no changes in the registrant’s internal control over financial reporting (as defined in Rule 30a-3(d) under the 1940 Act (17 CFR 270.30a-3(d)) that occurred during the registrant’s second fiscal quarter of the period covered by this report that have materially affected, or is reasonably likely to materially affect, the registrant’s internal control over financial reporting. |
Item 12. Exhibits.
(a)(1) Code of Ethics
(a)(2) Separate certifications for each principal executive officer and principal financial officer of the registrant as required by Rule 30a-2(a) under the 1940 Act (17 CFR 270.30a-2(a)) and Section 302 of the Sarbanes-Oxley Act of 2002 are attached hereto.
(a)(3) Not applicable
(b) Certifications pursuant to Rule 30a-2(b) under the 1940 Act and Section 906 of the Sarbanes-Oxley Act of 2002 are attached hereto.
SIGNATURES
Pursuant to the requirements of the Securities Exchange Act of 1934 and the Investment Company Act of 1940, the registrant has duly caused this report to be signed on its behalf by the undersigned, thereunto duly authorized.
| | | | |
| | HARTFORD SERIES FUND, INC. |
| | |
Date: February 29, 2016 | | By: | | /s/ James E. Davey |
| | | | James E. Davey, President and |
| | | | Chief Executive Officer |
Pursuant to the requirements of the Securities Exchange Act of 1934 and the Investment Company Act of 1940, this report has been signed below by the following persons on behalf of the registrant and in the capacities and on the dates indicated.
| | | | |
| Date: February 29, 2016 | | By: | | /s/ James E. Davey |
| | | | James E. Davey, President and |
| | | | Chief Executive Officer |
| | | | |
| Date: February 29, 2016 | | By: | | /s/ Michael Flook |
| | | | Michael Flook, Vice President, |
| | | | Treasurer and Controller |