UNITED STATES
SECURITIES AND EXCHANGE COMMISSION
Washington, D.C. 20549
FORM N-CSR
CERTIFIED SHAREHOLDER REPORT OF REGISTERED MANAGEMENT INVESTMENT COMPANIES
Investment Company Act file number: 811-08629
HARTFORD SERIES FUND, INC.
(Exact name of registrant as specified in charter)
P. O. Box 2999, Hartford, Connecticut 06104-2999
(Address of Principal Executive Offices)
Edward P. Macdonald, Esquire
Life Law Unit
The Hartford Financial Services Group, Inc.
200 Hopmeadow Street
Simsbury, Connecticut 06089
(Name and Address of Agent for Service)
Registrant’s telephone number, including area code: (860) 843-9934
Date of fiscal year end: December 31, 2011
Date of reporting period: January 1, 2011 – December 31, 2011
Form N-CSR is to be used by management investment companies to file reports with the Commission not later than 10 days after the transmission to stockholders of any report that is required to be transmitted to stockholder s under Rule 30e-1 under the Investment Company Act of 1940 (17 CFR 270.30e-1). The Commission may use the information provided on Form N-CSR in its regulatory, disclosure review, inspection, and policymaking roles.
A registrant is required to disclose the information specified by Form N-CSR, and the Commission will make this information public. A registrant is not required to respond to the collection of information contained in Form N-CSR unless the Form displays a currently valid Office of Management and Budget ("OMB") control number. Please direct comments concerning the accuracy of the information collection burden estimate and any suggestions for reducing the burden to Secretary, Securities and Exchange Commission, 450 Fifth Street, NW, Washington, DC 20549-0609. The OMB has reviewed this collection of information under the clearance requirements of 44 U.S.C. § 3507.
Item 1. Reports to Stockholders.


A MESSAGE FROM THE PRESIDENT
Dear Fellow Shareholders:
I want to take this opportunity to say thank you for investing in Hartford HLS Funds.
This has been a tumultuous year. In the beginning of 2011, we witnessed tension-fueled political uprisings in the already-volatile Middle East and North Africa region. We also watched as Japan dealt with a series of crises including a massive earthquake and subsequent tsunami. Yet, U.S. economic conditions continued to improve, with gains in consumer confidence and retail sales. During the first half of 2011, domestic, international, and world indices (as measured by the S&P 500, MSCI EAFE and MSCI World) were all up more than 5% through June, 30 2011.
The economic recovery, however, lost momentum in the second half of 2011. The employment and housing markets both remain extremely challenged. Investors continue to be concerned about the implications of the European sovereign debt crisis, as well as our own high levels of domestic debt. Fears that the European sovereign debt crisis could continue to drag down the global economy have weighed heavily on stocks.
Ongoing apprehension regarding the U.S. debt ceiling during the summer and the resulting downgrade of the U.S. sovereign credit rating by Standard & Poor’s also contributed to weaker investor confidence.
There are, however, some reasons to remain confident. Corporations have record levels of cash on their balance sheets—corporate cash has doubled in the past 10 years. In addition, U.S. gross domestic product expanded at a 2.5 percent annual rate in the third quarter according to the Commerce Department, as consumers and businesses set aside fears about the recovery and stepped up spending. Corporate earnings have also remained positive, with a majority of companies beating expectations each quarter this year. This momentum will hopefully continue into next year.
As we head into 2012, in light of the continued market volatility, now would be a good time to schedule a meeting with your financial advisor to examine your current investment strategy and determine whether you are on the right track.
| • | Does your fixed-income portfolio complement your equity portfolio? |
| • | Are you receiving diversified sources of income? |
| • | Is your portfolio still in line with your risk tolerance and investment time horizon? |
Talk to your advisor to see what changes you should make to address these concerns and opportunities.
Thank you again for investing with Hartford HLS Funds.

James Davey
President
Hartford HLS Funds
Hartford Advisers HLS Fund
Table of Contents
This report is prepared for the general information of contract owners and qualified retirement plan participants. It is not an offer of contracts or of qualified retirement plans. It should not be used in connection with any offer, except in conjunction with the appropriate product prospectus which contains all pertinent information including the applicable sales, administrative and other charges.
The views expressed in the Fund’s Manager Discussion under ‘‘Why did the Fund perform this way?’’ and ‘‘What is the outlook?’’ are views of the Fund’s sub-adviser and portfolio management team through the end of the period and are subject to change based on market and other conditions.
Hartford Advisers HLS Fund inception 03/31/1983
(sub-advised by Wellington Management Company, LLP)
| Investment objective – Seeks long-term total return. |
| |
Performance Overview 21/31/01 – 12/31/11
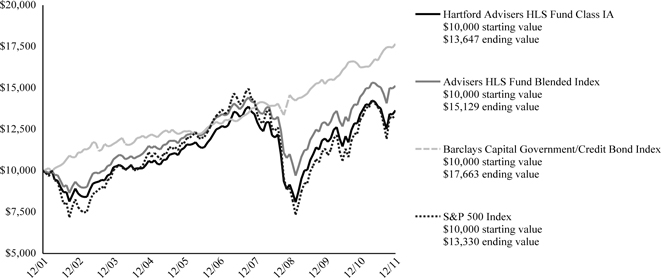
The chart above shows the growth of a $10,000 investment in Class IA. Growth results in classes other than Class IA will vary from what is seen above due to differences in the expenses charged to those share classes.
| Average Annual Total Returns (as of 12/31/11) |
| | 1 Year | 5 Year | 10 Year |
| Advisers IA | 1.86% | 1.64% | 3.16% |
| Advisers IB | 1.61% | 1.39% | 2.90% |
| Advisers HLS Fund Blended Index | 4.59% | 2.61% | 4.23% |
| Barclays Capital Government/Credit Bond Index | 8.74% | 6.55% | 5.85% |
| S&P 500 Index | 2.09% | -0.25% | 2.92% |
PAST PERFORMANCE IS NOT INDICATIVE OF FUTURE RESULTS.
Total returns presented above were calculated using the Fund's net asset value available to shareholders for sale or redemption of Fund shares on December 31, 2011, which may exclude investment transactions as of this date.
Advisers HLS Fund Blended Index is a blended index comprised of the following indices: S&P 500 (60%), Barclays Capital U.S. Government/Credit Bond (35%) and 90 day Treasury Bill (5%).
Barclays Capital Government/Credit Bond Index is an unmanaged, market-value-weighted index of all debt obligations of the U.S. Treasury and U.S. Government agencies (excluding mortgaged-backed securities) and of all publicly-issued fixed-rate, nonconvertible, investment grade domestic corporate debt.
S&P 500 Index is a market capitalization-weighted price index composed of 500 widely held common stocks.
You cannot invest directly in an index.
The chart represents a hypothetical investment in the Fund. Performance data represents past performance and current performance could be higher or lower.
Performance information may reflect historical or current expense waivers/reimbursements from the investment adviser, without which performance would have been lower. For information on current expense waivers/reimbursements, please see the prospectus.
The value of the Fund will fluctuate so that when redeemed, it may be worth more or less than the original investment. The chart and table do not reflect the deductions of taxes, sales charges or other fees which may be applied at the variable life insurance, variable annuity or qualified retirement plan product level. Any such additional sales charges or other fees or expenses would lower the contract’s or plan’s performance.
| Hartford Advisers HLS Fund |
| Manager Discussion (Unaudited) |
| December 31, 2011 |
| |
| Portfolio Managers | | |
| Steven T. Irons, CFA | John C. Keogh | Peter I. Higgins, CFA |
| Senior Vice President | Senior Vice President | Senior Vice President |
| | | |
How did the Fund perform?
The Class IA shares of the Hartford Advisers HLS Fund returned 1.86% for the twelve-month period ended December 31, 2011, underperforming its blended benchmark, (60% S&P 500 Index, 35% Barclays Capital Government/Credit Bond Index, and 5% Treasury Bills), which returned 4.59% for the same period. The Fund outperformed the -1.47% return of the average fund in the Lipper Mixed-Asset Target Allocation Growth VP-UF Funds peer group, a group of funds that hold between 60%-80% in equity securities, with the remainder invested in bonds, cash, and cash equivalents.
Why did the Fund perform this way?
The one-year period ending December 31, 2011 was yet another extremely volatile period for equity markets. The high degree of volatility was caused in part by the European sovereign debt crisis, U.S. political gridlock, falling consumer confidence, and concerns over sustained growth in emerging markets. Equity markets, as measured by the S&P 500 Index, returned 2.09% during the period. Utilities (+20%), Consumer Staples (+14%), and Health Care (+13%) posted the largest gains while Financials (-17%), Materials (-10%), and Industrials (-1%) were the only sectors to post negative absolute returns.
The bond market, as measured by the Barclays Capital Government/Credit Bond Index, returned 8.74% during the period. Most risk segments of the fixed income market underperformed duration-equivalent Treasuries for the period. Lower quality high yield and emerging markets debt in particular lagged duration-equivalent Treasuries in a risk-off environment.
The Fund has three primary levers to generate investment performance: equity investments, fixed income investments, and asset allocation among stocks, bonds, and cash. During the period, the equity portion of the Fund underperformed its benchmark, while the fixed income portion of the Fund outperformed its benchmark. Asset allocation detracted from benchmark-relative results as the Fund was generally overweight equities and underweight fixed income and cash relative to the benchmark.
Equity underperformance versus the benchmark was driven mainly by security selection, which was weakest in Industrials, Consumer Discretionary, and Energy. This was partially offset by stronger selection in Materials. Sector positioning, which is a result of bottom-up security selection, also detracted from relative performance due to underweights (i.e. the Fund’s sector position was less than the benchmark position) to the Consumer Staples and Utilities sectors.
Stocks that detracted the most from benchmark relative returns during the period were Hewlett-Packard (Information Technology), PACCAR (Industrials), and IBM (Information Technology). Hewlett-Packard, a global technology company, reduced guidance for 2012 due to macroeconomic headwinds and the impact of floods in Thailand on disk drive production. Shares of PACCAR, a manufacturer of light, medium, and heavy-duty trucks and after-market parts, fell due to concerns about the company’s exposure to the weak European economy. Global services and software provider IBM had positive quarterly results and not owning it detracted from our relative returns. Financial services companies Bank of America and Goldman Sachs also detracted from our absolute (i.e. total return) performance returns.
Top contributors to relative performance during the period included Google (Information Technology), Buck Holdings-Dollar General (Consumer Discretionary), and Amgen (Health Care). Shares of Google, a leading provider of online search, internet content services, and web-based software applications, performed strongly after reporting above-consensus third quarter earnings. Buck Holdings-Dollar General, a discount retailer, saw its shares rise in this trade-down economy. Shares of Biotech company Amgen rose as visibility into the company’s future sales growth improved, helping to drive the share price higher. The stock also benefited in the fourth quarter from the company’s announcement of a significant share repurchase and dividend increase. Exxon Mobil (Energy), Pfizer (Health Care), and Apple (Information Technology) also contributed positively to the Fund’s returns on an absolute basis.
The fixed income portion of the Fund outperformed its benchmark during the period. Security selection within the Investment Grade corporate bond sector was the primary driver of the outperformance. An out-of-benchmark allocation to agency mortgage-backed securities (MBS) was also additive, particularly our exposure to Government National Mortgage Association (GNMA) securities, which performed well during the period. Corporate bonds underperformed amid
| Hartford Advisers HLS Fund |
| Manager Discussion (Unaudited) – (continued) |
| December 31, 2011 |
| |
a challenging environment due to sovereign debt concerns and signs of slowing economic growth. Within the corporate bond sector, Financials lagged behind Industrials and Utilities as lower-beta, higher-quality and more defensive areas of the market outperformed. The Fund’s overweight to Financials hurt relative performance; however, this was partially offset by strong security selection among Industrial and Financial issuers. Security selection within taxable municipals was also additive to performance. Our duration and yield curve positioning was a modest contributor to relative performance.
What is the outlook?
We expect the modest U.S. economic expansion to continue; however, European sovereign debt risk poses a threat to global growth. We believe that the U.S. Federal Reserve will maintain its accommodative stance and short-term rates will remain low until the economy strengthens.
Within the equity portion of the Fund we continue to focus our efforts on stock-by-stock fundamental research to construct a diversified large-cap core portfolio. We screen for companies on specific valuation, return on capital, and earnings characteristics and we focus on understanding how returns on capital are being created, employing a disciplined valuation methodology for both purchases and sales. At the end of the period, our bottom-up investment approach resulted in the largest overweight exposures in Information Technology, Health Care, and Financials. The largest underweights of the equity portion of the Fund to the S&P 500 were in Consumer Staples, Utilities, and Telecommunication Services.
Overall within the fixed income sleeve, we are tactically managing the Fund’s duration around neutral. We continue to be positioned with an underweight to the government sector. We also maintained our overweight posture to the corporate sector at the end of the period as we believe that credit fundamentals remain strong. We believe valuations are attractive, especially for financial companies which have delevered significantly. We also maintained our overweight allocation to taxable municipal bonds due to the attractive valuations in this relatively high quality and diverse sector of the market. Lastly, at the end of the period we maintained our modest allocation to agency mortgage-backed securities.
The equity and fixed income managers will continue to work collaboratively to make decisions regarding portfolio weights in stocks, bonds, and cash. As of December 31, 2011, the Fund’s equity exposure was at 68% compared to 60% in its benchmark and at the upper end of the Fund’s 50-70% range.
Diversification by Security Type
as of December 31, 2011
| Category | | Percentage of
Net Assets | |
| Equity Securities | | | | |
| Common Stocks | | | 68.0 | % |
| Total | | | 68.0 | % |
| Fixed Income Securities | | | | |
| Asset & Commercial Mortgage Backed Securities | | | 0.0 | % |
| Corporate Bonds | | | 12.1 | |
| Municipal Bonds | | | 1.4 | |
| U.S. Government Agencies | | | 1.6 | |
| U.S. Government Securities | | | 15.2 | |
| Total | | | 30.3 | % |
| Short-Term Investments | | | 1.1 | % |
| Other Assets and Liabilities | | | 0.6 | |
| Total | | | 100.0 | % |
Diversification by Industry
as of December 31, 2011
| Industry (Sector) | | Percentage of
Net Assets | |
| Equity Securities | | | | |
| Automobiles & Components (Consumer Discretionary) | | | 1.7 | % |
| Banks (Financials) | | | 4.5 | |
| Capital Goods (Industrials) | | | 4.2 | |
| Consumer Services (Consumer Discretionary) | | | 0.6 | |
| Diversified Financials (Financials) | | | 5.0 | |
| Energy (Energy) | | | 7.3 | |
| Food & Staples Retailing (Consumer Staples) | | | 1.1 | |
| Food, Beverage & Tobacco (Consumer Staples) | | | 4.0 | |
| Health Care Equipment & Services (Health Care) | | | 2.2 | |
| Household & Personal Products (Consumer Staples) | | | 0.8 | |
| Insurance (Financials) | | | 0.7 | |
| Materials (Materials) | | | 1.2 | |
| Media (Consumer Discretionary) | | | 1.9 | |
| Pharmaceuticals, Biotechnology & Life Sciences (Health Care) | | | 8.8 | |
| Real Estate (Financials) | | | 0.4 | |
| Retailing (Consumer Discretionary) | | | 4.0 | |
| Semiconductors & Semiconductor Equipment (Information Technology) | | | 1.8 | |
| Software & Services (Information Technology) | | | 6.7 | |
| Technology Hardware & Equipment (Information Technology) | | | 7.5 | |
| Telecommunication Services (Services) | | | 0.8 | |
| Transportation (Industrials) | | | 1.8 | |
| Utilities (Utilities) | | | 1.0 | |
| Total | | | 68.0 | % |
Diversification by Industry
as of December 31, 2011
| Industry (Sector) - (continued) | | Percentage of
Net Assets | |
| Fixed Income Securities | | | | |
| Air Transportation (Transportation) | | | 0.3 | % |
| Arts, Entertainment and Recreation (Services) | | | 0.7 | |
| Beverage and Tobacco Product Manufacturing (Consumer Staples) | | | 0.3 | |
| Chemical Manufacturing (Basic Materials) | | | 0.0 | |
| Computer and Electronic Product Manufacturing (Technology) | | | 0.1 | |
| Electrical Equipment and Appliance Manufacturing (Technology) | | | 0.2 | |
| Finance and Insurance (Finance) | | | 6.4 | |
| Food Manufacturing (Consumer Staples) | | | 0.4 | |
| General Obligations (General Obligations) | | | 0.3 | |
| Health Care and Social Assistance (Health Care) | | | 0.5 | |
| Health Care/Services (Health Care/Services) | | | 0.1 | |
| Higher Education (Univ., Dorms, etc.) (Higher Education (Univ., Dorms, etc.)) | | | 0.1 | |
| Information (Technology) | | | 0.5 | |
| Machinery Manufacturing (Capital Goods) | | | 0.2 | |
| Miscellaneous (Miscellaneous) | | | 0.3 | |
| Motor Vehicle and Parts Manufacturing (Consumer Cyclical) | | | 0.1 | |
| Petroleum and Coal Products Manufacturing (Energy) | | | 0.5 | |
| Pipeline Transportation (Utilities) | | | 0.2 | |
| Real Estate, Rental and Leasing (Finance) | | | 0.4 | |
| Refunded (Refunded) | | | 0.1 | |
| Retail Trade (Consumer Cyclical) | | | 0.2 | |
| Soap, Cleaning Compound and Toilet Manufacturing (Consumer Staples) | | | 0.4 | |
| Tax Allocation (Tax Allocation) | | | 0.1 | |
| Transportation (Transportation) | | | 0.4 | |
| Utilities (Utilities) | | | 0.7 | |
| Total | | | 13.5 | % |
| U.S. Government Agencies | | | 1.6 | |
| U.S. Government Securities | | | 15.2 | |
| Short-Term Investments | | | 1.1 | |
| Other Assets and Liabilities | | | 0.6 | |
| Total | | | 100.0 | % |
Distribution by Credit Quality
as of December 31, 2011
| Credit Rating * | | Percentage of
Net Assets | |
| Aaa / AAA | | | 0.1 | |
| Aa / AA | | | 2.5 | |
| A | | | 4.6 | |
| Baa / BBB | | | 5.6 | |
| Ba / BB | | | 0.1 | |
| Unrated | | | 0.6 | |
| U.S. Government Agencies and Securities | | | 16.8 | |
| Non Debt Securities and Other Short-Term Instruments | | | 69.1 | |
| Other Assets & Liabilities | | | 0.6 | |
| Total | | | 100.0 | % |
| * | Does not apply to the Fund itself. Based upon Moody’s and S&P long-term credit ratings for the Fund’s holdings as of the date noted. If Moody's and S&P assign different ratings to a holding, the lower rating is used. "Unrated" includes fixed-income securities (other than cash-like short-term instruments and U.S. Government securities) for which Moody’s and S&P have not issued long-term credit ratings. |
| Hartford Advisers HLS Fund |
| Schedule of Investments |
| December 31, 2011 |
| (000’s Omitted) |
| Shares or Principal Amount | | Market Value ╪ | |
| COMMON STOCKS - 68.0% | | | | |
| | | | | Automobiles & Components - 1.7% | | | | |
| | 2,060 | | | Ford Motor Co. w/ Rights ● | | $ | 22,160 | |
| | 917 | | | Harley-Davidson, Inc. | | | 35,636 | |
| | | | | | | | 57,796 | |
| | | | | Banks - 4.5% | | | | |
| | 1,033 | | | BB&T Corp. | | | 25,996 | |
| | 4,206 | | | Mitsubishi UFJ Financial Group, Inc. | | | 17,808 | |
| | 332 | | | PNC Financial Services Group, Inc. | | | 19,169 | |
| | 1,368 | | | US Bancorp | | | 37,013 | |
| | 1,944 | | | Wells Fargo & Co. | | | 53,575 | |
| | | | | | | | 153,561 | |
| | | | | Capital Goods - 4.2% | | | | |
| | 427 | | | 3M Co. | | | 34,907 | |
| | 347 | | | Boeing Co. | | | 25,416 | |
| | 652 | | | Ingersoll-Rand plc | | | 19,876 | |
| | 880 | | | PACCAR, Inc. | | | 32,955 | |
| | 265 | | | Rockwell Collins, Inc. | | | 14,684 | |
| | 256 | | | Stanley Black & Decker, Inc. | | | 17,285 | |
| | | | | | | | 145,123 | |
| | | | | Consumer Services - 0.6% | | | | |
| | 533 | | | DeVry, Inc. | | | 20,499 | |
| | | | | | | | | |
| | | | | Diversified Financials - 5.0% | | | | |
| | 101 | | | BlackRock, Inc. | | | 18,020 | |
| | 857 | | | Citigroup, Inc. | | | 22,548 | |
| | 198 | | | Goldman Sachs Group, Inc. | | | 17,941 | |
| | 1,283 | | | Invesco Ltd. | | | 25,783 | |
| | 1,616 | | | JP Morgan Chase & Co. | | | 53,719 | |
| | 318 | | | SEI Investments Co. | | | 5,514 | |
| | 508 | | | T. Rowe Price Group, Inc. | | | 28,902 | |
| | | | | | | | 172,427 | |
| | | | | Energy - 7.3% | | | | |
| | 390 | | | Anadarko Petroleum Corp. | | | 29,746 | |
| | 871 | | | Chesapeake Energy Corp. | | | 19,421 | |
| | 1,335 | | | Exxon Mobil Corp. | | | 113,146 | |
| | 316 | | | Occidental Petroleum Corp. | | | 29,581 | |
| | 396 | | | Petroleo Brasileiro S.A. ADR | | | 9,828 | |
| | 1,574 | | | Petroleum Geo-Services ● | | | 17,156 | |
| | 462 | | | Statoilhydro ASA ADR | | | 11,832 | |
| | 425 | | | Suncor Energy, Inc. | | | 12,260 | |
| | 274 | | | Ultra Petroleum Corp. ● | | | 8,125 | |
| | | | | | | | 251,095 | |
| | | | | Food & Staples Retailing - 1.1% | | | | |
| | 668 | | | CVS Caremark Corp. | | | 27,233 | |
| | 330 | | | Sysco Corp. | | | 9,691 | |
| | | | | | | | 36,924 | |
| | | | | Food, Beverage & Tobacco - 4.0% | | | | |
| | 820 | | | General Mills, Inc. | | | 33,124 | |
| | 849 | | | Kraft Foods, Inc. | | | 31,715 | |
| | 854 | | | PepsiCo, Inc. | | | 56,630 | |
| | 482 | | | Unilever N.V. NY Shares ADR | | | 16,559 | |
| | | | | | | | 138,028 | |
| | | | | Health Care Equipment & Services - 2.2% | | | | |
| | 183 | | | Edwards Lifesciences Corp. ● | | | 12,931 | |
| | 849 | | | Medtronic, Inc. | | | 32,490 | |
| | 558 | | | UnitedHealth Group, Inc. | | | 28,274 | |
| | | | | | | | 73,695 | |
| | | | | Household & Personal Products - 0.8% | | | | |
| | 390 | | | Procter & Gamble Co. | | | 26,024 | |
| | | | | | | | | |
| | | | | Insurance - 0.7% | | | | |
| | 308 | | | Marsh & McLennan Cos., Inc. | | | 9,745 | |
| | 612 | | | Unum Group | | | 12,891 | |
| | | | | | | | 22,636 | |
| | | | | Materials - 1.2% | | | | |
| | 372 | | | Dow Chemical Co. | | | 10,704 | |
| | 240 | | | Monsanto Co. | | | 16,817 | |
| | 356 | | | Nucor Corp. | | | 14,067 | |
| | | | | | | | 41,588 | |
| | | | | Media - 1.9% | | | | |
| | 1,266 | | | Comcast Corp. Class A | | | 30,024 | |
| | 893 | | | Walt Disney Co. | | | 33,472 | |
| | | | | | | | 63,496 | |
| | | | | Pharmaceuticals, Biotechnology & Life Sciences - 8.8% | | | | |
| | 534 | | | Agilent Technologies, Inc. ● | | | 18,653 | |
| | 755 | | | Amgen, Inc. | | | 48,492 | |
| | 595 | | | Celgene Corp. ● | | | 40,242 | |
| | 1,320 | | | Daiichi Sankyo Co., Ltd. | | | 26,137 | |
| | 142 | | | Gilead Sciences, Inc. ● | | | 5,816 | |
| | 1,421 | | | Merck & Co., Inc. | | | 53,560 | |
| | 2,438 | | | Pfizer, Inc. | | | 52,756 | |
| | 88 | | | Roche Holding AG | | | 14,921 | |
| | 1,090 | | | Shionogi & Co., Ltd. | | | 13,987 | |
| | 650 | | | UCB S.A. | | | 27,277 | |
| | | | | | | | 301,841 | |
| | | | | Real Estate - 0.4% | | | | |
| | 777 | | | Weyerhaeuser Co. | | | 14,499 | |
| | | | | | | | | |
| | | | | Retailing - 4.0% | | | | |
| | 11,702 | | | Allstar Co. ⌂† | | | 12,119 | |
| | 85 | | | Amazon.com, Inc. ● | | | 14,627 | |
| | 11,241 | | | Buck Holdings L.P. ⌂●† | | | 25,157 | |
| | 335 | | | Kohl's Corp. | | | 16,547 | |
| | 1,862 | | | Lowe's Co., Inc. | | | 47,265 | |
| | 410 | | | Nordstrom, Inc. | | | 20,361 | |
| | | | | | | | 136,076 | |
| | | | | Semiconductors & Semiconductor Equipment - 1.8% | | | | |
| | 1,008 | | | Maxim Integrated Products, Inc. | | | 26,251 | |
| | 441 | | | Taiwan Semiconductor Manufacturing Co., Ltd. ADR | | | 5,693 | |
| | 398 | | | Texas Instruments, Inc. | | | 11,589 | |
| | 532 | | | Xilinx, Inc. | | | 17,049 | |
| | | | | | | | 60,582 | |
| | | | | Software & Services - 6.7% | | | | |
| | 392 | | | Accenture plc | | | 20,887 | |
| | 505 | | | Automatic Data Processing, Inc. | | | 27,248 | |
| | 768 | | | eBay, Inc. ● | | | 23,290 | |
| | 119 | | | Google, Inc. ● | | | 76,798 | |
| | 457 | | | Lender Processing Services | | | 6,881 | |
| | 1,081 | | | Microsoft Corp. | | | 28,063 | |
| | 2,493 | | | Western Union Co. | | | 45,513 | |
| | | | | | | | 228,680 | |
| | | | | Technology Hardware & Equipment - 7.5% | | | | |
| | 188 | | | Apple, Inc. ● | | | 75,938 | |
| | 3,050 | | | Cisco Systems, Inc. | | | 55,149 | |
| | 1,162 | | | EMC Corp. ● | | | 25,036 | |
| | 1,241 | | | Hewlett-Packard Co. | | | 31,979 | |
| | 918 | | | Juniper Networks, Inc. ● | | | 18,726 | |
| | 229 | | | NetApp, Inc. ● | | | 8,309 | |
The accompanying notes are an integral part of these financial statements.
| Shares or Principal Amount | | Market Value ╪ | |
| COMMON STOCKS - 68.0% - (continued) | | | | |
| | | | | Technology Hardware & Equipment - 7.5% - (continued) | | | | |
| | 742 | | | Qualcomm, Inc. | | $ | 40,604 | |
| | | | | | | | 255,741 | |
| | | | | Telecommunication Services - 0.8% | | | | |
| | 1,012 | | | Vodafone Group plc ADR | | | 28,366 | |
| | | | | | | | | |
| | | | | Transportation - 1.8% | | | | |
| | 233 | | | Con-way, Inc. | | | 6,794 | |
| | 227 | | | FedEx Corp. | | | 18,959 | |
| | 190 | | | Kansas City Southern ● | | | 12,931 | |
| | 297 | | | United Parcel Service, Inc. Class B | | | 21,730 | |
| | | | | | | | 60,414 | |
| | | | | Utilities - 1.0% | | | | |
| | 560 | | | NextEra Energy, Inc. | | | 34,087 | |
| | | | | | | | | |
| | | | | Total common stocks | | | | |
| | | | | (cost $2,139,724) | | $ | 2,323,178 | |
| | | | | | | | | |
| ASSET & COMMERCIAL MORTGAGE BACKED SECURITIES - 0.0% |
| | | | | Finance and Insurance - 0.0% | | | | |
| | | | | CS First Boston Mortgage Securities Corp. | | | | |
| $ | 450 | | | 3.94%, 05/15/2038 | | $ | 460 | |
| | | | | Goldman Sachs Mortgage Securities Corp. II | | | | |
| | 110 | | | 3.02%, 03/06/2020 ■Δ | | | 106 | |
| | | | | Marriott Vacation Club Owner Trust | | | | |
| | 425 | | | 5.36%, 10/20/2028 ■ | | | 429 | |
| | | | | New Century Home Equity Loan Trust | | | | |
| | 8 | | | 0.58%, 03/25/2035 Δ | | | 7 | |
| | | | | Prudential Commercial Mortgage Trust | | | | |
| | 570 | | | 4.49%, 02/11/2036 | | | 585 | |
| | | | | | | | 1,587 | |
| | | | | | | | | |
| | | | | Total asset & commercial mortgage backed securities | | | | |
| | | | | (cost $1,554) | | $ | 1,587 | |
| | | | | | | | | |
| CORPORATE BONDS - 12.1% | | | | |
| | | | | Air Transportation - 0.3% | | | | |
| | | | | Continental Airlines, Inc. | | | | |
| $ | 3,848 | | | 5.98%, 04/19/2022 | | $ | 4,006 | |
| | | | | Southwest Airlines Co. | | | | |
| | 2,700 | | | 5.75%, 12/15/2016 | | | 2,995 | |
| | 2,969 | | | 6.15%, 08/01/2022 | | | 3,192 | |
| | | | | | | | 10,193 | |
| | | | | Arts, Entertainment and Recreation - 0.7% | | | | |
| | | | | CBS Corp. | | | | |
| | 575 | | | 5.75%, 04/15/2020 | | | 646 | |
| | | | | Comcast Corp. | | | | |
| | 8,000 | | | 5.90%, 03/15/2016 | | | 9,157 | |
| | | | | DirecTV Holdings LLC | | | | |
| | 3,310 | | | 6.38%, 03/01/2041 | | | 3,817 | |
| | | | | News America, Inc. | | | | |
| | 1,275 | | | 4.50%, 02/15/2021 | | | 1,337 | |
| | | | | Time Warner Cable, Inc. | | | | |
| | 4,870 | | | 5.85%, 05/01/2017 | | | 5,546 | |
| | | | | Viacom, Inc. | | | | |
| | 835 | | | 3.88%, 12/15/2021 | | | 852 | |
| | | | | Virgin Media Secured Finance plc | | | | |
| 1,255 | | | 5.25%, 01/15/2021 | | | 1,330 | |
| | | | | | | | 22,685 | |
| | | | | Beverage and Tobacco Product Manufacturing - 0.3% | | | | |
| | | | | Altria Group, Inc. | | | | |
| | 2,445 | | | 4.75%, 05/05/2021 | | | 2,692 | |
| | | | | Anheuser-Busch InBev N.V. | | | | |
| | 4,200 | | | 7.75%, 01/15/2019 | | | 5,440 | |
| | | | | Coca-Cola Co. | | | | |
| | 500 | | | 3.30%, 09/01/2021 | | | 527 | |
| | | | | Diageo Capital plc | | | | |
| | 430 | | | 5.20%, 01/30/2013 | | | 450 | |
| | | | | Philip Morris International, Inc. | | | | |
| | 270 | | | 5.65%, 05/16/2018 | | | 319 | |
| | | | | | | | 9,428 | |
| | | | | Chemical Manufacturing - 0.0% | | | | |
| | | | | Agrium, Inc. | | | | |
| | 660 | | | 6.13%, 01/15/2041 | | | 819 | |
| | | | | | | | | |
| | | | | Computer and Electronic Product Manufacturing - 0.1% | | | | |
| | | | | Dell, Inc. | | | | |
| | 2,735 | | | 5.88%, 06/15/2019 | | | 3,212 | |
| | | | | Thermo Fisher Scientific, Inc. | | | | |
| | 845 | | | 3.20%, 05/01/2015 | | | 893 | |
| | | | | | | | 4,105 | |
| | | | | Electrical Equipment and Appliance Manufacturing - 0.2% | | | | |
| | | | | General Electric Co. | | | | |
| | 6,925 | | | 5.00%, 02/01/2013 | | | 7,217 | |
| | | | | | | | | |
| | | | | Finance and Insurance - 6.4% | | | | |
| | | | | Ace INA Holdings, Inc. | | | | |
| | 700 | | | 5.88%, 06/15/2014 | | | 772 | |
| | | | | American Express Centurion Bank | | | | |
| | 6,350 | | | 6.00%, 09/13/2017 | | | 7,181 | |
| | | | | ANZ National Ltd. | | | | |
| | 1,205 | | | 2.38%, 12/21/2012 ■ | | | 1,226 | |
| | | | | Bank of America Corp. | | | | |
| | 200 | | | 7.38%, 05/15/2014 | | | 207 | |
| | | | | Barclays Bank plc | | | | |
| | 2,150 | | | 2.38%, 01/13/2014 | | | 2,104 | |
| | | | | BP Capital Markets plc | | | | |
| | 2,850 | | | 4.75%, 03/10/2019 | | | 3,166 | |
| | | | | Brandywine Operating Partnership | | | | |
| | 2,010 | | | 6.00%, 04/01/2016 | | | 2,100 | |
| | | | | CDP Financial, Inc. | | | | |
| | 3,475 | | | 4.40%, 11/25/2019 ■ | | | 3,771 | |
| | | | | Citigroup, Inc. | | | | |
| | 8,800 | | | 6.00%, 10/31/2033 | | | 7,539 | |
| | 2,700 | | | 6.13%, 05/15/2018 | | | 2,874 | |
| | 1,700 | | | 6.88%, 03/05/2038 | | | 1,867 | |
| | 520 | | | 8.13%, 07/15/2039 | | | 637 | |
| | | | | Credit Agricole | | | | |
| | 3,950 | | | 3.50%, 04/13/2015 ■ | | | 3,628 | |
| | | | | Discover Financial Services, Inc. | | | | |
| | 3,620 | | | 6.45%, 06/12/2017 | | | 3,782 | |
| | | | | Eaton Vance Corp. | | | | |
| | 3,305 | | | 6.50%, 10/02/2017 | | | 3,709 | |
| | | | | Everest Reinsurance Holdings, Inc. | | | | |
| | 4,525 | | | 5.40%, 10/15/2014 | | | 4,786 | |
The accompanying notes are an integral part of these financial statements.
| Hartford Advisers HLS Fund |
| Schedule of Investments – (continued) |
| December 31, 2011 |
| (000’s Omitted) |
| Shares or Principal Amount | | Market Value ╪ | |
| CORPORATE BONDS - 12.1% - (continued) | | | | |
| | | | | Finance and Insurance - 6.4% - (continued) | | | | |
| | | | | General Electric Capital Corp. | | | | |
| $ | 4,300 | | | 4.38%, 09/16/2020 | | $ | 4,394 | |
| | 5,000 | | | 5.88%, 01/14/2038 | | | 5,298 | |
| | | | | Goldman Sachs Group, Inc. | | | | |
| | 6,000 | | | 5.63%, 01/15/2017 | | | 5,884 | |
| | 2,750 | | | 6.00%, 05/01/2014 | | | 2,854 | |
| | 1,700 | | | 6.15%, 04/01/2018 | | | 1,755 | |
| | 2,590 | | | 6.25%, 02/01/2041 | | | 2,541 | |
| | | | | Health Care Properties | | | | |
| | 2,030 | | | 6.00%, 01/30/2017 | | | 2,196 | |
| | | | | HSBC Holdings plc | | | | |
| | 4,000 | | | 6.10%, 01/14/2042 | | | 4,534 | |
| | | | | Jackson National Life Insurance Co. | | | | |
| | 6,250 | | | 8.15%, 03/15/2027 ■ | | | 7,602 | |
| | | | | JP Morgan Chase & Co. | | | | |
| | 2,400 | | | 3.70%, 01/20/2015 | | | 2,488 | |
| | 2,000 | | | 4.95%, 03/25/2020 | | | 2,126 | |
| | 10,375 | | | 5.13%, 09/15/2014 | | | 10,939 | |
| | 1,080 | | | 5.40%, 01/06/2042 | | | 1,127 | |
| | | | | Liberty Mutual Group, Inc. | | | | |
| | 6,050 | | | 5.75%, 03/15/2014 ■ | | | 6,309 | |
| | | | | Merrill Lynch & Co., Inc. | | | | |
| | 11,000 | | | 5.00%, 02/03/2014 | | | 10,943 | |
| | 1,000 | | | 6.40%, 08/28/2017 | | | 968 | |
| | 6,000 | | | 6.88%, 04/25/2018 | | | 5,916 | |
| | | | | Morgan Stanley | | | | |
| | 13,000 | | | 5.38%, 10/15/2015 | | | 12,703 | |
| | 250 | | | 5.63%, 09/23/2019 | | | 231 | |
| | | | | National City Corp. | | | | |
| | 4,250 | | | 6.88%, 05/15/2019 | | | 4,776 | |
| | | | | New England Mutual Life Insurance Co. | | | | |
| | 6,000 | | | 7.88%, 02/15/2024 ■ | | | 7,513 | |
| | | | | Nordea Bank AB | | | | |
| | 1,790 | | | 3.70%, 11/13/2014 ■ | | | 1,819 | |
| | | | | Postal Square L.P. | | | | |
| | 14,101 | | | 8.95%, 06/15/2022 | | | 19,344 | |
| | | | | Prudential Financial, Inc. | | | | |
| | 8,000 | | | 5.50%, 03/15/2016 | | | 8,672 | |
| | | | | Rabobank Nederland N.V. NY | | | | |
| | 3,900 | | | 3.20%, 03/11/2015 ■ | | | 3,972 | |
| | | | | Republic New York Capital I | | | | |
| | 500 | | | 7.75%, 11/15/2026 | | | 501 | |
| | | | | Royal Bank of Scotland plc | | | | |
| | 2,600 | | | 4.88%, 03/16/2015 | | | 2,486 | |
| | | | | Southern Capital Corp. | | | | |
| | 54 | | | 5.70%, 06/30/2022 ■ | | | 56 | |
| | | | | Sovereign Bancorp, Inc. | | | | |
| | 4,795 | | | 8.75%, 05/30/2018 | | | 5,346 | |
| | | | | Sovereign Capital Trust IV | | | | |
| | 7,250 | | | 7.91%, 06/13/2036 | | | 6,815 | |
| | | | | Svenska Handelsbanken Ab | | | | |
| | 2,900 | | | 4.88%, 06/10/2014 ■ | | | 3,018 | |
| | | | | UBS AG Stamford | | | | |
| | 235 | | | 5.88%, 12/20/2017 | | | 245 | |
| | | | | Wachovia Corp. | | | | |
| | 10,000 | | | 5.25%, 08/01/2014 | | | 10,548 | |
| | 2,000 | | | 5.75%, 06/15/2017 | | | 2,259 | |
| | | | | WEA Finance LLC | | | | |
| | 1,450 | | | 7.13%, 04/15/2018 ■ | | | 1,621 | |
| | | | | | | | 219,148 | |
| | | | | Food Manufacturing - 0.4% | | | | |
| | | | | Kellogg Co. | | | | |
| 3,900 | | | 4.00%, 12/15/2020 | | | 4,128 | |
| | | | | Kraft Foods, Inc. | | | | |
| | 3,800 | | | 4.13%, 02/09/2016 | | | 4,125 | |
| | 285 | | | 5.38%, 02/10/2020 | | | 329 | |
| | | | | Wrigley Jr., William Co. | | | | |
| | 3,900 | | | 3.70%, 06/30/2014 ■ | | | 4,021 | |
| | | | | | | | 12,603 | |
| | | | | Health Care and Social Assistance - 0.5% | | | | |
| | | | | Amgen, Inc. | | | | |
| | 3,300 | | | 5.15%, 11/15/2041 | | | 3,421 | |
| | | | | CVS Caremark Corp. | | | | |
| | 7,725 | | | 6.13%, 08/15/2016 | | | 8,997 | |
| | | | | Express Scripts, Inc. | | | | |
| | 1,020 | | | 6.25%, 06/15/2014 | | | 1,112 | |
| | | | | McKesson Corp | | | | |
| | 475 | | | 3.25%, 03/01/2016 | | | 503 | |
| | | | | Merck & Co., Inc. | | | | |
| | 2,100 | | | 4.00%, 06/30/2015 | | | 2,312 | |
| | | | | | | | 16,345 | |
| | | | | Information - 0.5% | | | | |
| | | | | AT&T, Inc. | | | | |
| | 2,300 | | | 2.50%, 08/15/2015 | | | 2,382 | |
| | 2,510 | | | 6.80%, 05/15/2036 | | | 3,178 | |
| | | | | BellSouth Telecommunications | | | | |
| | 650 | | | 7.00%, 12/01/2095 | | | 816 | |
| | | | | Cellco Partnership - Verizon Wireless Capital | | | | |
| | 395 | | | 5.55%, 02/01/2014 | | | 429 | |
| | | | | France Telecom S.A. | | | | |
| | 1,300 | | | 4.38%, 07/08/2014 | | | 1,373 | |
| | | | | SBA Tower Trust | | | | |
| | 2,035 | | | 4.25%, 04/15/2015 ■ | | | 2,092 | |
| | | | | Telecom Italia Capital | | | | |
| | 2,900 | | | 7.00%, 06/04/2018 | | | 2,711 | |
| | | | | Verizon Communications, Inc. | | | | |
| | 2,415 | | | 3.50%, 11/01/2021 | | | 2,514 | |
| | 240 | | | 4.35%, 02/15/2013 | | | 249 | |
| | 715 | | | 4.75%, 11/01/2041 | | | 770 | |
| | | | | | | | 16,514 | |
| | | | | Machinery Manufacturing - 0.2% | | | | |
| | | | | Xerox Corp. | | | | |
| | 6,000 | | | 8.25%, 05/15/2014 | | | 6,770 | |
| | | | | | | | | |
| | | | | Motor Vehicle and Parts Manufacturing - 0.1% | | | | |
| | | | | Daimler Finance NA LLC | | | | |
| | 5,600 | | | 2.63%, 09/15/2016 ■ | | | 5,567 | |
| | | | | | | | | |
| | | | | Petroleum and Coal Products Manufacturing - 0.5% | | | | |
| | | | | Atmos Energy Corp. | | | | |
| | 5,875 | | | 6.35%, 06/15/2017 | | | 6,961 | |
| | | | | EnCana Corp. | | | | |
| | 305 | | | 5.90%, 12/01/2017 | | | 346 | |
| | | | | Motiva Enterprises LLC | | | | |
| | 420 | | | 5.75%, 01/15/2020 ■ | | | 488 | |
| | | | | Ras Laffan Liquefied Natural Gas Co., Ltd. | | | | |
| | 1,200 | | | 5.50%, 09/30/2014 ■ | | | 1,284 | |
| | | | | Shell International Finance B.V. | | | | |
| | 6,400 | | | 4.38%, 03/25/2020 | | | 7,472 | |
| | | | | | | | 16,551 | |
The accompanying notes are an integral part of these financial statements.
| Shares or Principal Amount | | Market Value ╪ | |
| CORPORATE BONDS - 12.1% - (continued) |
| | | | | Pipeline Transportation - 0.2% | | | | |
| | | | | Kinder Morgan Energy Partners L.P. | | | | |
| $ | 5,000 | | | 6.95%, 01/15/2038 | | $ | 5,647 | |
| | | | | | | | | |
| | | | | Real Estate, Rental and Leasing - 0.4% | | | | |
| | | | | COX Communications, Inc. | | | | |
| | 440 | | | 4.63%, 06/01/2013 | | | 464 | |
| | 9,000 | | | 5.45%, 12/15/2014 | | | 9,990 | |
| | | | | ERAC USA Finance Co. | | | | |
| | 1,121 | | | 2.25%, 01/10/2014 ■ | | | 1,117 | |
| | 1,800 | | | 4.50%, 08/16/2021 ■ | | | 1,846 | |
| | | | | | | | 13,417 | |
| | | | | Retail Trade - 0.2% | | | | |
| | | | | Lowe's Co., Inc. | | | | |
| | 3,400 | | | 4.63%, 04/15/2020 | | | 3,796 | |
| | | | | Staples, Inc. | | | | |
| | 2,525 | | | 9.75%, 01/15/2014 | | | 2,888 | |
| | | | | | | | 6,684 | |
| | | | | Soap, Cleaning Compound and Toilet Manufacturing - 0.4% | | | | |
| | | | | Procter & Gamble Co. | | | | |
| | 10,022 | | | 9.36%, 01/01/2021 | | | 13,488 | |
| | | | | | | | | |
| | | | | Utilities - 0.7% | | | | |
| | | | | Consolidated Edison Co. of NY | | | | |
| | 4,605 | | | 5.30%, 12/01/2016 | | | 5,374 | |
| | | | | Enel Finance International S.A. | | | | |
| | 300 | | | 3.88%, 10/07/2014 ■ | | | 292 | |
| | | | | Indianapolis Power and Light | | | | |
| | 8,000 | | | 6.60%, 06/01/2037 ■ | | | 10,291 | |
| | | | | Niagara Mohawk Power Corp. | | | | |
| | 2,510 | | | 3.55%, 10/01/2014 ■ | | | 2,637 | |
| | | | | Southern California Edison Co. | | | | |
| | 4,000 | | | 5.55%, 01/15/2037 | | | 4,928 | |
| | | | | Wisconsin Electric Power Co. | | | | |
| | 1,960 | | | 4.25%, 12/15/2019 | | | 2,187 | |
| | | | | | | | 25,709 | |
| | | | | Total corporate bonds | | | | |
| | | | | (cost $380,852) | | $ | 412,890 | |
| | | | | | | | | |
| MUNICIPAL BONDS - 1.4% |
| | | | | General Obligations - 0.3% | | | | |
| | | | | California State GO, Taxable, | | | | |
| $ | 2,785 | | | 7.55%, 04/01/2039 | | $ | 3,405 | |
| | | | | Chicago Metropolitan Water Reclamation Dist, | | | | |
| | 685 | | | 5.72%, 12/01/2038 | | | 839 | |
| | | | | Illinois State GO, | | | | |
| | 60 | | | 5.37%, 03/01/2017 | | | 63 | |
| | 1,075 | | | 5.67%, 03/01/2018 | | | 1,144 | |
| | 860 | | | 5.88%, 03/01/2019 | | | 926 | |
| | | | | Los Angeles USD, | | | | |
| | 4,300 | | | 5.75%, 07/01/2034 | | | 4,747 | |
| | | | | | | | 11,124 | |
| | | | | Health Care/Services - 0.1% | | | | |
| | | | | University of California, Regents MedCenter Pooled Rev, | | | | |
| | 1,935 | | | 6.58%, 05/15/2049 | | | 2,323 | |
| | | | | | | | | |
| | | | | Higher Education (Univ., Dorms, etc.) - 0.1% | | | | |
| | | | | University of California, Build America Bonds Rev, | | | | |
| 1,960 | | | 5.77%, 05/15/2043 | | | 2,219 | |
| | | | | | | | | |
| | | | | Miscellaneous - 0.3% | | | | |
| | | | | Oregon School Boards Association, Taxable Pension, | | | | |
| | 10,000 | | | 4.76%, 06/30/2028 | | | 10,836 | |
| | | | | | | | | |
| | | | | Refunded - 0.1% | | | | |
| | | | | Irvine Ranch, CA, Water Dist, | | | | |
| | 2,870 | | | 2.61%, 03/15/2014 | | | 2,982 | |
| | | | | | | | | |
| | | | | Tax Allocation - 0.1% | | | | |
| | | | | Dallas, TX, Area Rapid Transit Taxable Sales Tax Rev, | | | | |
| | 2,200 | | | 6.00%, 12/01/2044 | | | 2,798 | |
| | | | | | | | | |
| | | | | Transportation - 0.4% | | | | |
| | | | | Bay Area Toll Auth, CA, Toll Bridge Rev, | | | | |
| | 3,100 | | | 6.26%, 04/01/2049 | | | 4,045 | |
| | | | | Illinois State Toll Highway Auth, Taxable Rev, | | | | |
| | 1,875 | | | 6.18%, 01/01/2034 | | | 2,158 | |
| | | | | Maryland State Transit Auth, | | | | |
| | 1,350 | | | 5.89%, 07/01/2043 | | | 1,696 | |
| | | | | New York and New Jersey PA, Taxable Rev, | | | | |
| | 975 | | | 5.86%, 12/01/2024 | | | 1,163 | |
| | 570 | | | 6.04%, 12/01/2029 | | | 691 | |
| | | | | North Texas Tollway Auth Rev, | | | | |
| | 3,400 | | | 6.72%, 01/01/2049 | | | 4,100 | |
| | | | | | | | 13,853 | |
| | | | | Total municipal bonds | | | | |
| | | | | (cost $40,634) | | $ | 46,135 | |
| | | | | | | | | |
| U.S. GOVERNMENT AGENCIES - 1.6% |
| | | | | Federal Home Loan Mortgage Corporation - 1.1% | | | | |
| $ | 167 | | | 2.34%, 04/01/2029 Δ | | $ | 172 | |
| | 34,498 | | | 4.00%, 12/01/2040 - 09/01/2041 | | | 36,239 | |
| | | | | | | | 36,411 | |
| | | | | Federal National Mortgage Association - 0.1% | | | | |
| | 876 | | | 4.78%, 02/01/2014 | | | 918 | |
| | 1,409 | | | 4.98%, 12/01/2013 | | | 1,486 | |
| | 274 | | | 5.00%, 02/01/2019 - 04/01/2019 | | | 297 | |
| | 18 | | | 6.50%, 11/01/2013 | | | 18 | |
| | 3 | | | 7.00%, 02/01/2029 | | | 4 | |
| | | | | | | | 2,723 | |
| | | | | Government National Mortgage Association - 0.4% | | | | |
| | 4,330 | | | 6.00%, 06/15/2024 - 06/15/2035 | | | 4,937 | |
| | 1,369 | | | 6.50%, 03/15/2026 - 02/15/2035 | | | 1,589 | |
| | 5,635 | | | 7.00%, 11/15/2031 - 11/15/2033 | | | 6,571 | |
| | 264 | | | 7.50%, 09/16/2035 | | | 303 | |
| | 1,003 | | | 8.00%, 09/15/2026 - 02/15/2031 | | | 1,139 | |
| | 69 | | | 9.00%, 06/20/2016 - 06/15/2022 | | | 73 | |
| | | | | | | | 14,612 | |
| | | | | Total U.S. government agencies | | | | |
| | | | | (cost $49,697) | | $ | 53,746 | |
The accompanying notes are an integral part of these financial statements.
| Hartford Advisers HLS Fund |
| Schedule of Investments – (continued) |
| December 31, 2011 |
| (000’s Omitted) |
| Shares or Principal Amount | | | | Market Value ╪ | |
| U.S. GOVERNMENT SECURITIES - 15.2% |
| Other Direct Federal Obligations - 2.8% |
| | | | | Federal Financing Corporation - 0.5% | | | | | | |
| $ | 17,617 | | | 4.40%, 12/06/2013 - 12/27/2013 ○ | | | | $ | 17,364 | |
| | | | | | | | | | | |
| | | | | Tennessee Valley Authority - 2.3% | | | | | | |
| | 22,300 | | | 4.38%, 06/15/2015 | | | | | 25,028 | |
| | 50,000 | | | 6.00%, 03/15/2013 | | | | | 53,432 | |
| | | | | | | | | | 78,460 | |
| | | | | | | | | | 95,824 | |
| U.S. Treasury Securities - 12.4% |
| | | | | U.S. Treasury Bonds - 3.8% | | | | | | |
| | 49,553 | | | 4.38%, 02/15/2038 - 05/15/2040 | | | | | 64,216 | |
| | 18,000 | | | 6.00%, 02/15/2026 | | | | | 25,943 | |
| | 25,650 | | | 6.25%, 08/15/2023 | | | | | 36,712 | |
| | | | | | | | | | 126,871 | |
| | | | | U.S. Treasury Notes - 8.6% | | | | | | |
| | 22,600 | | | 0.63%, 12/31/2012 | | | | | 22,706 | |
| | 4,800 | | | 1.00%, 09/30/2016 | | | | | 4,849 | |
| | 106,000 | | | 1.25%, 10/31/2015 | | | | | 108,716 | |
| | 10,900 | | | 1.38%, 01/15/2013 | | | | | 11,035 | |
| | 28,700 | | | 1.50%, 06/30/2016 | | | | | 29,680 | |
| | 23,000 | | | 2.75%, 02/15/2019 | | | | | 25,190 | |
| | 35,990 | | | 3.50%, 05/15/2020 | | | | | 41,403 | |
| | 25,000 | | | 3.88%, 05/15/2018 | | | | | 29,160 | |
| | 13,000 | | | 4.25%, 08/15/2013 | | | | | 13,840 | |
| | 9,950 | | | 4.75%, 05/31/2012 | | | | | 10,140 | |
| | | | | | | | | | 296,719 | |
| | | | | | | | | | 423,590 | |
| | | | | Total U.S. government securities | | | | | | |
| | | | | (cost $468,336) | | | | $ | 519,414 | |
| | | | | | | | | | | |
| | | | | Total long-term investments
| | | | $ | 3,356,950 | |
| | | | | (cost $3,080,797) | | | | | | |
| | | | | | | | | | | |
| SHORT-TERM INVESTMENTS - 1.1% |
| Repurchase Agreements - 1.1% |
| | | | | Bank of America Merrill Lynch TriParty | | | | | | |
| | | | | Joint Repurchase Agreement (maturing on | | | | | | |
| | | | | 01/03/2012 in the amount of $13,841, | | | | | | |
| | | | | collateralized by GNMA 4.50%, 2041, | | | | | | |
| | | | | value of $14,118) | | | | | | |
| $ | 13,841 | | | 0.04%, 12/30/2011 | | | | $ | 13,841 | |
| | | | | Barclays Capital TriParty Joint Repurchase
| | | | | | |
| | | | | Agreement (maturing on 01/03/2012 in the | | | | | | |
| | | | | amount of $1,150, collateralized by U.S. | | | | | | |
| | | | | Treasury Bond 5.38%, 2031, value of | | | | | | |
| | | | | $1,173) | | | | | | |
| | 1,150 | | | 0.01%, 12/30/2011 | | | | | 1,150 | |
| | | | | Deutsche Bank Securities TriParty Joint
| | | | | | |
| | | | | Repurchase Agreement (maturing on | | | | | | |
| | | | | 01/03/2012 in the amount of $15,353, | | | | | | |
| | | | | collateralized by GNMA 3.50% - 7.00%, | | | | | | |
| | | | | 2035 - 2046, value of $15,660) | | | | | | |
| | 15,353 | | | 0.06%, 12/30/2011 | | | | | 15,353 | |
| | | | | UBS Securities, Inc. Joint Repurchase
| | | | | | |
| | | | | Agreement (maturing on 01/03/2012 in the | | | | | | |
| | | | | amount of $117, collateralized by U.S. | | | | | | |
| | | | | Treasury Note 2.75%, 2016, value of | | | | | | |
| | | | | $119) | | | | | | |
| | 117 | | | 0.01%, 12/30/2011 | | | | | 117 | |
| | | | | UBS Securities, Inc. TriParty Joint
| | | | | | |
| | | | | Repurchase Agreement (maturing on | | | | | | |
| | | | | 01/03/2012 in the amount of $5,941, | | | | | | |
| | | | | collateralized by FNMA 3.00% - 6.50%, | | | | | | |
| | | | | 2021 - 2041, value of $6,060) | | | | | | |
|
| $ | 5,941 | | | 0.04%, 12/30/2011 | | | | $ | 5,941 | |
| | | | | | | | | | 36,402 | |
| | | | | Total short-term investments | | | | | | |
| | | | | (cost $36,402) | | | | $ | 36,402 | |
| | | | | | | | | | | |
| | | | | Total investments | | | | | | |
| | | | | (cost $3,117,199) ▲ | 99.4 | % | | $ | 3,393,352 | |
| | | | | Other assets and liabilities | 0.6 | % | | | 21,606 | |
| | | | | Total net assets | 100.0 | % | | $ | 3,414,958 | |
The accompanying notes are an integral part of these financial statements.
| Hartford Advisers HLS Fund |
| Schedule of Investments – (continued) |
| December 31, 2011 |
| (000’s Omitted) |
| Note: | Percentage of investments as shown is the ratio of the total market value to total net assets. Market value of long-term investments in foreign securities represents 7.3% of total net assets at December 31, 2011. |
Prices of foreign equities that are principally traded on certain foreign markets may be adjusted daily pursuant to a fair value pricing service approved by the Board of Directors in order to reflect an adjustment for factors occurring after the close of certain foreign markets but before the close of the New York Stock Exchange.
| ▲ | At December 31, 2011, the cost of securities for federal income tax purposes was $3,148,302 and the aggregate gross unrealized appreciation and depreciation based on that cost were: |
| Unrealized Appreciation | | $ | 413,345 | |
| Unrealized Depreciation | | | (168,295 | ) |
| Net Unrealized Appreciation | | $ | 245,050 | |
| † | These securities were valued in good faith at fair value as determined under policies and procedures established by and under the supervision of the Company's Board of Directors. At December 31, 2011, the aggregate value of these securities was $37,276, which represents 1.1% of total net assets. This amount excludes securities that are principally traded in certain foreign markets and whose prices are adjusted pursuant to a third party pricing service methodology approved by the Board of Directors. |
| Δ | Variable rate securities; the rate reported is the coupon rate in effect at December 31, 2011. |
| ○ | The interest rate disclosed for these securities represents the effective yield on the date of the acquisition. |
| ■ | Securities issued within terms of a private placement memorandum, exempt from registration under Rule 144A under the Securities Act of 1933, as amended, and may be sold only to qualified institutional buyers. Unless otherwise indicated, these issues are determined to be liquid. At December 31, 2011, the aggregate value of these securities was $70,705, which represents 2.1% of total net assets. |
| ⌂ | The following securities are considered illiquid. Illiquid securities are often purchased in private placement transactions, are often not registered under the Securities Act of 1933 and may have contractual restrictions on resale. A security may also be considered illiquid if the security lacks a readily available market or if its valuation has not changed for a certain period of time. |
| Period Acquired | | Shares/ Par | | Security | | Cost Basis | |
| 08/2011 | | | 11,702 | | | Allstar Co. | | $ | 11,913 | |
| 06/2007 | | | 11,241 | | | Buck Holdings L.P. | | | 6,634 | |
At December 31, 2011, the aggregate value of these securities was $37,276, which represents 1.1% of total net assets.
| | GO | — | General Obligations |
| | PA | — | Port Authority |
| | USD | — | United School District |
Foreign Currency Contracts Outstanding at December 31, 2011
| Description | | Counterparty | | | Buy / Sell | | | Market Value ╪ | | | Contract
Amount | | | Delivery Date | | | Unrealized
Appreciation/
(Depreciation) | |
| Japanese Yen | | | Goldman Sachs | | | | Sell | | | $ | 37,819 | | | $ | 37,966 | | | | 01/23/2012 | | | $ | 147 | |
| ╪ | See Significant Accounting Policies of accompanying Notes to Financial Statements regarding valuation of securities. |
The accompanying notes are an integral part of these financial statements.
| Hartford Advisers HLS Fund |
| Investment Valuation Hierarchy Level Summary |
| December 31, 2011 |
| (000’s Omitted) |
| | | Total | | | Level 1 ♦ | | | Level 2 ♦ | | | Level 3 | |
| Assets: | | | | | | | | | | | | | | | | |
| Asset & Commercial Mortgage Backed Securities | | $ | 1,587 | | | $ | — | | | $ | 1,580 | | | $ | 7 | |
| Common Stocks ‡ | | | 2,323,178 | | | | 2,168,616 | | | | 117,286 | | | | 37,276 | |
| Corporate Bonds | | | 412,890 | | | | — | | | | 405,636 | | | | 7,254 | |
| Municipal Bonds | | | 46,135 | | | | — | | | | 46,135 | | | | — | |
| U.S. Government Agencies | | | 53,746 | | | | — | | | | 53,746 | | | | — | |
| U.S. Government Securities | | | 519,414 | | | | — | | | | 519,414 | | | | — | |
| Short-Term Investments | | | 36,402 | | | | — | | | | 36,402 | | | | — | |
| Total | | $ | 3,393,352 | | | $ | 2,168,616 | | | $ | 1,180,199 | | | $ | 44,537 | |
| Foreign Currency Contracts * | | | 147 | | | | — | | | | 147 | | | | — | |
| Total | | $ | 147 | | | $ | — | | | $ | 147 | | | $ | — | |
| ♦ | For the year ended December 31, 2011, there were no significant transfers between Level 1 and Level 2. |
| ‡ | The Fund has all or primarily all of the equity securities categorized in a particular level. Refer to the Schedule of Investments for further industry breakout. |
| * | Derivative instruments not reflected in the Schedule of Investments are valued at the unrealized appreciation/depreciation on the investments.
|
Following is a reconciliation of Level 3 assets for which significant unobservable inputs were used to determine fair value:
| | | Balance as
of
December
31, 2010 | | | Realized
Gain
(Loss) | | | Change in
Unrealized
Appreciation
(Depreciation) | | | Net
Amortization | | | Purchases | | | Sales | | | Transfers
Into
Level 3 | | | Transfers
Out of
Level 3 | | | Balance as of
December
31, 2011 | |
| Assets: | | | | | | | | | | | | | | | | | | | | | | | | | | | | | | | | | | | | |
| Asset & Commercial Mortgage Backed Securities | | $ | 7 | | | $ | — | | | $ | — | * | | $ | — | | | $ | — | | | $ | — | | | $ | — | | | $ | — | | | $ | 7 | |
| Common Stocks | | | 25,248 | | | | 6,178 | | | | 2,098 | † | | | — | | | | 11,913 | | | | (8,161 | ) | | | — | | | | — | | | | 37,276 | |
| Corporate Bonds | | | 7,681 | | | | — | | | | (141 | )‡ | | | — | | | | — | | | | (286 | ) | | | — | | | | — | | | | 7,254 | |
| Total | | $ | 32,936 | | | $ | 6,178 | | | $ | 1,957 | | | $ | — | | | $ | 11,913 | | | $ | (8,447 | ) | | $ | — | | | $ | — | | | $ | 44,537 | |
| * | Change in unrealized appreciation (depreciation) in the current period relating to assets still held at December 31, 2011 rounds to zero. |
| † | Change in unrealized appreciation (depreciation) in the current period relating to assets still held at December 31, 2011 was $2,098. |
| ‡ | Change in unrealized appreciation (depreciation) in the current period relating to assets still held at December 31, 2011 was $(141). |
The accompanying notes are an integral part of these financial statements.
| Hartford Advisers HLS Fund |
| Statement of Assets and Liabilities |
| December 31, 2011 |
| (000’s Omitted) |
| Assets: | | | | |
| Investments in securities, at market value (cost $3,117,199) | | $ | 3,393,352 | |
| Cash | | | 287 | |
| Unrealized appreciation on foreign currency contracts | | | 147 | |
| Receivables: | | | | |
| Investment securities sold | | | 9,357 | |
| Fund shares sold | | | 215 | |
| Dividends and interest | | | 14,703 | |
| Total assets | | | 3,418,061 | |
| Liabilities: | | | | |
| Payables: | | | | |
| Fund shares redeemed | | | 2,453 | |
| Investment management fees | | | 459 | |
| Distribution fees | | | 25 | |
| Accrued expenses | | | 166 | |
| Total liabilities | | | 3,103 | |
| Net assets | | $ | 3,414,958 | |
| Summary of Net Assets: | | | | |
| Capital stock and paid-in-capital | | $ | 4,222,562 | |
| Undistributed net investment income | | | 28,105 | |
| Accumulated net realized loss | | | (1,112,025 | ) |
| Unrealized appreciation of investments and the translations of assets and liabilities denominated in foreign currency | | | 276,316 | |
| Net assets | | $ | 3,414,958 | |
| Shares authorized | | | 9,500,000 | |
| Par value | | $ | 0.001 | |
| Class IA: Net asset value per share | | $ | 19.34 | |
| Shares outstanding | | | 153,004 | |
| Net assets | | $ | 2,959,019 | |
| Class IB: Net asset value per share | | $ | 19.58 | |
| Shares outstanding | | | 23,286 | |
| Net assets | | $ | 455,939 | |
The accompanying notes are an integral part of these financial statements.
| Hartford Advisers HLS Fund |
| Statement of Operations |
| For the Year Ended December 31, 2011 |
| (000’s Omitted) |
| Investment Income: | | | | |
| Dividends | | $ | 49,237 | |
| Interest | | | 45,171 | |
| Less: Foreign tax withheld | | | (889 | ) |
| Total investment income, net | | | 93,519 | |
| | | | | |
| Expenses: | | | | |
| Investment management fees | | | 22,991 | |
| Distribution fees - Class IB | | | 1,267 | |
| Custodian fees | | | 14 | |
| Accounting services fees | | | 602 | |
| Board of Directors' fees | | | 88 | |
| Audit fees | | | 25 | |
| Other expenses | | | 467 | |
| Total expenses (before fees paid indirectly) | | | 25,454 | |
| Commission recapture | | | (27 | ) |
| Custodian fee offset | | | — | |
| Total fees paid indirectly | | | (27 | ) |
| Total expenses, net | | | 25,427 | |
| Net investment income | | | 68,092 | |
| | | | | |
| Net Realized Gain on Investments, Other Financial Instruments and Foreign Currency Transactions: | | | | |
| Net realized gain on investments | | | 184,053 | |
| Net realized loss on futures | | | (1,979 | ) |
| Net realized loss on foreign currency contracts | | | (2,445 | ) |
| Net realized gain on other foreign currency transactions | | | 241 | |
| Net Realized Gain on Investments, Other Financial Instruments and Foreign Currency Transactions | | | 179,870 | |
| | | | | |
| Net Changes in Unrealized Depreciation of Investments, Other Financial Instruments and Foreign Currency Transactions: | | | | |
| Net unrealized depreciation of investments | | | (176,704 | ) |
| Net unrealized depreciation of futures | | | (636 | ) |
| Net unrealized depreciation of foreign currency contracts | | | (372 | ) |
| Net unrealized depreciation on translation of other assets and liabilities in foreign currencies | | | (6 | ) |
| Net Changes in Unrealized Depreciation of Investments, Other Financial Instruments and Foreign Currency Transactions | | | (177,718 | ) |
| Net Gain on Investments, Other Financial Instruments and Foreign Currency Transactions | | | 2,152 | |
| Net Increase in Net Assets Resulting from Operations | | $ | 70,244 | |
The accompanying notes are an integral part of these financial statements.
| Hartford Advisers HLS Fund |
| Statement of Changes in Net Assets |
| |
| (000’s Omitted) |
| | | For the
Year Ended
December 31,
2011 | | | For the
Year Ended
December 31,
2010 | |
| Operations: | | | | | | | | |
| Net investment income | | $ | 68,092 | | | $ | 67,724 | |
| Net realized gain on investments, other financial instruments and foreign currency transactions | | | 179,870 | | | | 291,769 | |
| Net unrealized appreciation (depreciation) of investments, other financial instruments and foreign currency transactions | | | (177,718 | ) | | | 97,470 | |
| Net Increase In Net Assets Resulting From Operations | | | 70,244 | | | | 456,963 | |
| Distributions to Shareholders: | | | | | | | | |
| From net investment income | | | | | | | | |
| Class IA | | | (51,277 | ) | | | (48,804 | ) |
| Class IB | | | (6,578 | ) | | | (6,196 | ) |
| Total distributions | | | (57,855 | ) | | | (55,000 | ) |
| Capital Share Transactions: | | | | | | | | |
| Class IA | | | | | | | | |
| Sold | | | 50,601 | | | | 57,957 | |
| Issued in merger | | | — | | | | 188,305 | |
| Issued on reinvestment of distributions | | | 51,277 | | | | 48,804 | |
| Redeemed | | | (693,355 | ) | | | (710,101 | ) |
| Total capital share transactions | | | (591,477 | ) | | | (415,035 | ) |
| Class IB | | | | | | | | |
| Sold | | | 23,096 | | | | 28,941 | |
| Issued in merger | | | — | | | | 36,319 | |
| Issued on reinvestment of distributions | | | 6,578 | | | | 6,196 | |
| Redeemed | | | (131,780 | ) | | | (148,646 | ) |
| Total capital share transactions | | | (102,106 | ) | | | (77,190 | ) |
| Net decrease from capital share transactions | | | (693,583 | ) | | | (492,225 | ) |
| Proceeds from regulatory settlements | | | — | | | | 147 | |
| Net Decrease In Net Assets | | | (681,194 | ) | | | (90,115 | ) |
| Net Assets: | | | | | | | | |
| Beginning of period | | | 4,096,152 | | | | 4,186,267 | |
| End of period | | $ | 3,414,958 | | | $ | 4,096,152 | |
| Undistributed (distribution in excess of) | | | | | | | | |
| net investment income | | $ | 28,105 | | | $ | 17,505 | |
| Shares: | | | | | | | | |
| Class IA | | | | | | | | |
| Sold | | | 2,583 | | | | 3,219 | |
| Issued in merger | | | — | | | | 10,373 | |
| Issued on reinvestment of distributions | | | 2,706 | | | | 2,575 | |
| Redeemed | | | (35,495 | ) | | | (39,434 | ) |
| Total share activity | | | (30,206 | ) | | | (23,267 | ) |
| Class IB | | | | | | | | |
| Sold | | | 1,160 | | | | 1,579 | |
| Issued in merger | | | — | | | | 1,979 | |
| Issued on reinvestment of distributions | | | 344 | | | | 324 | |
| Redeemed | | | (6,663 | ) | | | (8,152 | ) |
| Total share activity | | | (5,159 | ) | | | (4,270 | ) |
The accompanying notes are an integral part of these financial statements.
| Hartford Advisers HLS Fund |
| Notes to Financial Statements |
| December 31, 2011 |
| (000’s Omitted) |
1. Organization:
Hartford Advisers HLS Fund (the “Fund”) serves as an underlying investment option for certain variable annuity and variable life insurance separate accounts of Hartford Life Insurance Company (“HLIC”) and its affiliates and certain qualified retirement plans. The Fund may also serve as an underlying investment option for certain variable annuity and variable life separate accounts of other insurance companies. Owners of variable annuity contracts and policyholders of variable life insurance contracts may choose the funds permitted in the variable insurance contract prospectus. In addition, participants in certain qualified retirement plans may choose the Fund if permitted by their plans.
Hartford Series Fund, Inc. (the “Company”) is an open-end registered management investment company comprised of thirty portfolios. Financial Statements for the Fund, a series of the Company, are included in this report.
The Company is organized under the laws of the State of Maryland and is registered with the Securities and Exchange Commission (“SEC”) under the Investment Company Act of 1940, as amended (“1940 Act”). The Fund is a diversified open-end management investment company.
The Fund is divided into Class IA and Class IB shares. Each class is offered at the per share net asset value (“NAV”) without a sales charge and is subject to the same expenses, except that the Class IB shares are subject to distribution and service fees charged pursuant to a Distribution Plan adopted in accordance with Rule 12b-1 under the 1940 Act.
2. Significant Accounting Policies:
The following is a summary of significant accounting policies of the Fund in the preparation of its financial statements, which are in accordance with the United States Generally Accepted Accounting Principles (“U.S. GAAP”). The preparation of financial statements in accordance with U.S. GAAP may require management to make estimates and assumptions that affect the reported amounts of assets and liabilities and disclosure of contingent assets and liabilities at the date of the financial statements and the reported amounts of increases and decreases in net assets from operations during the reporting period. Actual results could differ from those estimates.
| a) | Determination of Net Asset Value – The NAV of each class of the Fund’s shares is determined as of the close of regular trading (normally 4:00 p.m. Eastern Time) (the “NYSE Close”) on each day that the New York Stock Exchange (the “Exchange”) is open (“Valuation Date”). Information that becomes known to the Fund after the NAV has been calculated on a particular day will not generally be used to retroactively adjust the NAV determined earlier that day. |
| b) | Investment Valuation and Fair Value Measurements – For purposes of calculating the NAV, portfolio securities and other assets held by the Fund's portfolio for which market quotes are readily available are valued at market value. Market value is generally determined on the basis of last reported sales prices or official close price. If no sales are reported, market value is based on quotes obtained from a quotation reporting system, established market makers, or independent pricing services. If market prices are not readily available or are deemed unreliable, the Fund will use the fair value of the security as determined in good faith under policies and procedures established by and under the supervision of the Company’s Board of Directors. Market quotes are considered not readily available where there is an absence of current or reliable market-based data (e.g., trade information or broker quotes), including where events occur after the close of the relevant market, but prior to the NYSE Close that materially affect the values of the Fund’s portfolio securities or assets. In addition, market quotes are considered not readily available when, due to extraordinary circumstances, the exchanges or markets on which the securities trade do not open for trading for the entire day and no other market prices are available. In addition, prices of foreign equities that are principally traded on certain foreign markets are adjusted daily pursuant to a fair value pricing service approved by the Board of Directors in order to reflect an adjustment for the factors occurring after the close of certain foreign markets but before the NYSE Close. Securities that are primarily traded on foreign markets may trade on days that are not business days of the Fund. The value of the foreign securities in |
| | which the Fund invests may change on days when a shareholder will not be able to purchase or redeem shares of the Fund. Fair value pricing is subjective in nature and the use of fair value pricing by the Fund may cause the NAV of its shares to differ significantly from the NAV that would have been calculated using market prices at the close of the exchange on which a portfolio security is primarily traded. There can be no assurance that the Fund could obtain the fair market value assigned to a security if the Fund were to sell the security at approximately the time at which the Fund determines its NAV. |
Fixed income securities (other than short term obligations) and non-exchange traded derivatives held by the Fund are normally valued on the basis of quotes obtained from brokers and dealers or independent pricing services in accordance with procedures established by the Company’s Board of Directors. Prices obtained from independent pricing services use information provided by market makers or estimates of market values obtained from yield data relating to investments or securities with similar characteristics. Generally, the Fund may use fair valuation in regard to fixed income securities when the Fund holds defaulted or distressed securities or securities in a company in which a reorganization is pending. Short-term investments maturing in 60 days or less are generally valued at amortized cost, if their original term to maturity was 60 days or less, or by amortizing their value on the 61st day prior to maturity, if the original term to maturity exceeded 60 days.
Exchange traded options, futures and options on futures are valued at the settlement price determined by the relevant exchange as of the NYSE Close. If such instruments do not trade on an exchange, values may be supplied by an independent pricing service using a formula or other objective method that may take into consideration the style, direction, expiration, strike price, notional value and volatility or other adjustments.
Investments valued in currencies other than U.S. dollars are converted to U.S. dollars using exchange rates obtained from independent pricing services for calculation of the NAV. As a result, the NAV of the Fund’s shares may be affected by changes in the value of currencies in relation to the U.S. dollar. The value of securities traded in markets outside the United States or denominated in currencies other than the U.S. dollar may be affected significantly on a day that the NYSE is closed and the market value may change on days when an investor is not able to purchase, redeem or exchange shares of the Fund.
Foreign currency contracts represent agreements to exchange currencies on specific future dates at predetermined rates. Foreign currency contracts are valued using foreign currency exchange rates and forward rates as provided by an independent pricing service on the Valuation Date.
Financial instruments for which prices are not available from an independent pricing service may be valued using market quotations obtained from one or more dealers that make markets in the respective financial instrument in accordance with procedures established by the Company’s Board of Directors.
U.S. GAAP defines fair value as the price that the Fund would receive to sell an asset or pay to transfer a liability in an orderly transaction between market participants. The U.S. GAAP fair value measurement standards require disclosure of a fair value hierarchy for each major category of assets and liabilities. Various inputs are used in determining the fair value of the Fund’s investments. These inputs are summarized into three broad hierarchy levels. This hierarchy is based on whether the valuation inputs are observable or unobservable. These levels are:
| · | Level 1 – Quoted prices in active markets for identical securities. Level 1 may include exchange traded instruments such as domestic equities, some foreign equities, options, futures, mutual funds, exchange traded funds, rights and warrants. |
| · | Level 2 – Observable inputs other than Level 1 prices, such as quoted prices for similar securities; quoted prices in markets that are not active; or other inputs that are observable or can be corroborated by observable market data. Level 2 may include debt securities that are traded less frequently than exchange traded instruments and which are valued using independent pricing services; foreign equities, that are principally traded on certain |
| Hartford Advisers HLS Fund |
| Notes to Financial Statements – (continued) |
| December 31, 2011 |
| (000’s Omitted) |
| | foreign markets and are adjusted daily pursuant to a fair value pricing service in order to reflect an adjustment for the factors occurring after the close of certain foreign markets but before the NYSE Close; and short-term securities, which are valued at amortized cost. |
| · | Level 3 – Significant unobservable inputs that are supported by limited or no market activity. Level 3 may include financial instruments whose values are determined using broker quotes or require significant management judgment or estimation. These unobservable valuation inputs may include estimates for current yields, maturity/duration, prepayment speed, and broker quotes for comparable securities along with other assumptions relating to credit quality, collateral value, complexity of the security structure, general market conditions and liquidity. This category may include securities where trading has been halted or there are certain restrictions on trading. While these securities are priced using unobservable inputs, the valuation of these securities reflects the best available data and management believes the prices are a reasonable representation of exit price. |
Valuation levels are not necessarily indicative of the risk associated with investing in such securities. Individual securities within any of the above mentioned asset classes may be assigned a different hierarchical level than those presented above, as individual circumstances dictate.
For additional information, refer to the Investment Valuation Hierarchy Level Summary and the Level 3 roll-forward reconciliation which follow the Schedule of Investments.
For purposes of reporting transfers between different hierarchy levels, both transfers in and out of each level, as applicable, are shown as if they occurred at the beginning of the period.
| c) | Security Transactions and Investment Income – Security transactions are recorded as of the trade date (the date the order to buy or sell is executed) for financial reporting purposes. Securities purchased or sold on a when-issued or delayed-delivery basis may be settled a month or more after the trade date. Realized gains and losses are determined on the basis of identified cost. |
Dividend income is recorded on the ex-dividend date, except certain dividends from foreign securities where the ex-dividend date may have passed are recorded as soon as the Fund is informed of the dividend. Interest income, including amortization of premium and accretion of discounts, is accrued on a daily basis. Paydown gains and losses on mortgage-related and other asset-backed securities are included in interest income in the Statement of Operations.
| d) | Foreign Currency Transactions – Assets and liabilities denominated in currencies other than U.S. dollars are translated into U.S. dollars at the exchange rates in effect on the valuation date. Purchases and sales of investment securities, income, and expenses are translated into U.S. dollars at the exchange rates on the dates of such transactions. |
The Fund does not isolate that portion of portfolio security valuation resulting from fluctuations in the foreign currency exchange rates from the fluctuations arising from changes in the market prices of securities held. Exchange rate fluctuations are included with the net realized and unrealized gain or loss on investments in the accompanying financial statements.
Net realized foreign exchange gains or losses arise from sales of foreign currencies and the difference between asset and liability amounts initially stated in foreign currencies and the U.S. dollar value of the amounts actually received or paid. Net unrealized foreign exchange gains or losses arise from changes in the value of other assets and liabilities at the end of the reporting period, resulting from changes in the exchange rates.
| e) | Joint Trading Account – The Fund may invest cash balances into a joint trading account that may be invested in one or more repurchase agreements. |
| f) | Fund Share Valuation and Dividend Distributions to Shareholders – Orders for the Fund’s shares are executed in accordance with the investment instructions of the contract holders and plan participants. The NAV of the Fund’s shares is determined as of the close of business on each business day of the Exchange. The NAV is determined separately for each class of shares of the Fund by dividing the Fund’s net assets attributable to that class by the number of shares of the class outstanding. Each class of shares offered by the Fund has equal rights as to assets and voting privileges (except that shareholders of a class have exclusive voting rights regarding any matter relating solely to that class of shares). Income and non-class specific expenses are allocated daily to each class on the basis of the relative net assets of the class. Realized and unrealized capital gains and losses are allocated daily based on the relative net assets of each class of shares of the Fund. |
Orders for the purchase of the Fund’s shares received prior to the close of the Exchange on any day the Exchange is open for business are priced at the NAV determined as of the close of the Exchange. Orders received after the close of the Exchange, or on a day on which the Exchange and/or the Fund is not open for business, are priced at the next determined NAV.
Dividends are declared pursuant to a policy adopted by the Company’s Board of Directors based upon the investment performance of the Fund. The policy of the Fund is to pay dividends from net investment income and realized capital gains, if any, at least once a year.
Distributions from net investment income, net realized capital gains and capital are determined in accordance with federal income tax regulations, which may differ from U.S. GAAP with respect to character and timing. These differences may include but are not limited to losses deferred due to wash sale adjustments, foreign currency gains and losses, adjustments related to Passive Foreign Investment Companies (“PFICs”), Real Estate Investment Trusts (“REITs”), Regulated Investment Companies (“RICs”), certain derivatives and partnerships. Permanent book and federal income tax basis differences relating to shareholder distributions will result in reclassifications to certain of the Fund’s capital accounts (see Federal Income Taxes: Reclassification of Capital Accounts note).
| 3. | Securities and Other Investments: |
| a) | Repurchase Agreements – A repurchase agreement is an agreement by which a counterparty agrees to sell a security and agrees to repurchase the security sold at a mutually agreed upon time and price. At the time the Fund enters into a repurchase agreement, the value of the underlying collateral security(ies), including accrued interest, will be equal to or exceed the value of the repurchase agreement. Repurchase agreements expose the Fund to counterparty risk. To minimize counterparty risk, the securities that serve to collateralize the repurchase agreement are held by the Fund's custodian in book entry or physical form in the custodial account of the Fund or in a third party custodial account. Repurchase agreements are valued at cost plus accrued interest. The Fund, as shown on the Schedule of Investments, had outstanding repurchase agreements as of December 31, 2011. |
| b) | Illiquid and Restricted Securities – The Fund is permitted to invest up to 15% of its net assets in illiquid securities. Illiquid securities are those that may not be sold or disposed of in the ordinary course of business within seven days, at approximately the price used to determine the Fund’s NAV. The Fund may not be able to sell illiquid securities or other investments when its sub-adviser considers it desirable to do so or may have to sell such securities or investments at a price that is lower than the price that could be obtained if the securities or investments were more liquid. A sale of illiquid securities or other investments may require more time and may result in higher dealer discounts and other selling expenses than does the sale of those that are liquid. Illiquid securities and investments also may be more difficult to value due to the unavailability of reliable market quotations for such securities or investments, and an investment in them may have an adverse impact on the Fund’s NAV. The Fund may also purchase certain restricted securities that can only be resold to certain qualified investors and may be determined to be liquid pursuant to policies and guidelines established by the Company’s Board of Directors. The Fund, as shown on the Schedule of Investments, had illiquid and/or restricted securities as of December 31, 2011. |
| Hartford Advisers HLS Fund |
| Notes to Financial Statements – (continued) |
| December 31, 2011 |
| (000’s Omitted) |
| c) | Securities Purchased on a When-Issued or Delayed-Delivery Basis – Delivery and payment for securities that have been purchased by the Fund on a forward commitment, or when-issued or delayed-delivery basis, take place beyond the customary settlement period. A fund may dispose of or renegotiate a delayed-delivery transaction after it is entered into, and may sell delayed-delivery securities before they are delivered, which may result in a realized gain or loss. During this period, such securities are subject to market fluctuations, and the Fund identifies securities segregated in its records with value at least equal to the amount of the commitment. As of December 31, 2011, the Fund had no outstanding when-issued or delayed delivery securities. |
| d) | Mortgage Related and Other Asset Backed Securities – The Fund may invest in mortgage related and other asset backed securities. These securities include mortgage pass-through securities, collateralized mortgage obligations, commercial mortgage backed securities, stripped mortgage backed securities, asset backed securities, collateralized debt obligations and other securities that directly or indirectly represent a participation in, or are secured by and payable from, mortgage loans on real property. Mortgage related securities are created from pools of residential or commercial mortgage loans, including mortgage loans made by savings and loan institutions, mortgage bankers, commercial banks and others. Asset backed securities are created from many types of assets, including auto loans, credit card receivables, home equity loans, and student loans. These securities provide a monthly payment which consists of both interest and principal payments. Interest payments may be determined by fixed or adjustable rates. The rate of pre-payments on underlying mortgages will affect the price and volatility of a mortgage related security, and may have the effect of shortening or extending the effective duration of the security relative to what was anticipated at the time of purchase. The timely payment of principal and interest of certain mortgage related securities is guaranteed by the full faith and credit of the United States Government. Pools created and guaranteed by non-governmental issuers, including government-sponsored corporations, may be supported by various forms of insurance or guarantees, but there can be no assurance that the private insurers or guarantors can meet their obligations under the insurance policies or guarantee arrangements. The Fund, as shown on the Schedule of Investments, had mortgage related and other asset backed securities as of December 31, 2011. |
| 4. | Financial Derivative Instruments: |
The following disclosures contain information on how and why the Fund uses derivative instruments, the credit-risk-related contingent features in certain derivative instruments, and how derivative instruments affect the Fund’s financial position and results of operations. The location and fair value amounts of these instruments on the Statement of Assets and Liabilities and the realized gains and losses and changes in unrealized gains and losses on the Statement of Operations, each categorized by type of derivative contract, are included in the following Additional Derivative Instrument Information footnote. The derivative instruments outstanding as of period-end are disclosed in the notes to the Schedule of Investments and the amounts of realized gains and losses and changes in unrealized gains and losses on derivative instruments during the period are disclosed in the Statement of Operations.
| a) | Foreign Currency Contracts – The Fund may enter into foreign currency contracts that obligate the Fund to purchase or sell currencies at specified future dates. Foreign currency contracts are used to hedge the currency exposure associated with some or all of the Fund's securities and/or as part of an investment strategy. Foreign currency contracts are marked to market daily and the change in value is recorded by the Fund as an unrealized gain or loss. Realized gains or losses equal to the difference between the value of the contract at the time it was opened and the value at the time it was closed are recorded upon delivery or receipt of the currency. |
Foreign currency contracts involve elements of market risk in excess of the amounts reflected in the Statement of Assets and Liabilities. In addition, risks may arise upon entering into these contracts from the potential inability of the counterparties to meet the terms of the contracts and from unanticipated movements in the value of the foreign currencies relative to the U.S. dollar. The Fund had outstanding foreign currency contracts as shown on the Schedule of Investments as of December 31, 2011.
| b) | Futures Contracts – The Fund may enter into futures contracts. A futures contract is an agreement between two parties to buy or sell an asset at a set price on a future date. The Fund uses futures contracts to manage or obtain exposure to the securities markets, commodities, or movements in interest rates and currency values. The primary risks associated with the use of futures contracts are the imperfect correlation between the change in market value of the securities held by the Fund and the prices of futures contracts and the possibility of an illiquid market. Upon entering into a futures contract, the Fund is required to deposit with a futures commission merchant (“FCM”) an amount of cash or U.S. Government or Agency Obligations in accordance with the initial margin requirements of the broker or exchange. Futures contracts are marked to market daily at the most recent settlement price reported by an exchange on which, over time, they are traded most extensively, and an appropriate payable or receivable for the change in value (“variation margin”) is recorded by the Fund. Gains or losses are recognized but not considered realized until the contracts expire or are closed. Futures contracts involve, to varying degrees, risk of loss in excess of the variation margin disclosed on the Statement of Assets and Liabilities; however, this risk is reduced through the use of an FCM. As of December 31, 2011, the Fund had no outstanding futures contracts. |
| c) | Additional Derivative Instrument Information: |
Fair Values of Derivative Instruments on the Statement of Assets and Liabilities as of December 31, 2011:
| | | Risk Exposure Category | |
| | | Interest Rate
Contracts | | | Foreign
Exchange
Contracts | | | Credit
Contracts | | | Equity
Contracts | | | Commodity
Contracts | | | Other
Contracts | | | Total | |
| Assets: | | | | | | | | | | | | | | | | | | | | | | | | | | | | |
| Unrealized appreciation on foreign currency contracts | | $ | — | | | $ | 147 | | | $ | — | | | $ | — | | | $ | — | | | $ | — | | | $ | 147 | |
| Total | | $ | — | | | $ | 147 | | | $ | — | | | $ | — | | | $ | — | | | $ | — | | | $ | 147 | |
The volume of derivatives that is presented in the Schedule of Investments is consistent with the derivative activity during the year ended December 31, 2011.
The Effect of Derivative Instruments on the Statement of Operations for the year ended December 31, 2011:
| | | Risk Exposure Category | |
| | | Interest Rate
Contracts | | | Foreign
Exchange
Contracts | | | Credit
Contracts | | | Equity
Contracts | | | Commodity
Contracts | | | Other
Contracts | | | Total | |
| Realized Gain (Loss) on Derivatives Recognized as a Result of Operations: |
| Net realized loss on futures | | $ | (1,979 | ) | | $ | — | | | $ | — | | | $ | — | | | $ | — | | | $ | — | | | $ | (1,979 | ) |
| Net realized loss on foreign currency contracts | | | — | | | | (2,445 | ) | | | — | | | | — | | | | — | | | | — | | | | (2,445 | ) |
| Total | | $ | (1,979 | ) | | $ | (2,445 | ) | | $ | — | | | $ | — | | | $ | — | | | $ | — | | | $ | (4,424 | ) |
| | | | | | | | | | | | | | | | | | | | | | | | | | | | | |
| Net Change in Unrealized Appreciation (Depreciation) on Derivatives Recognized as a Result of Operations: |
| Net change in unrealized depreciation of futures | | $ | (636 | ) | | $ | — | | | $ | — | | | $ | — | | | $ | — | | | $ | — | | | $ | (636 | ) |
| Net change in unrealized depreciation of foreign currency contracts | | | — | | | | (372 | ) | | | — | | | | — | | | | — | | | | — | | | | (372 | ) |
| Total | | $ | (636 | ) | | $ | (372 | ) | | $ | — | | | $ | — | | | $ | — | | | $ | — | | | $ | (1,008 | ) |
| Hartford Advisers HLS Fund |
| Notes to Financial Statements – (continued) |
| December 31, 2011 |
| (000’s Omitted) |
| a) | Credit and Counterparty Risks – Credit risk depends largely on the perceived financial health of bond issuers. In general, the credit rating is inversely related to the credit risk of the issuer. Higher rated bonds generally are deemed to have less credit risk, while lower or unrated bonds are deemed to have higher risk of default. The share price, yield and total return of a fund that holds securities with higher credit risk may be more volatile than those of a fund that holds bonds with lower credit risk. Similar to credit risk, the Fund may be exposed to counterparty risk, or the risk that an institution or other entity with which the Fund has unsettled or open transactions will default. |
| b) | Market Risks – The Fund’s investments in derivatives and other financial instruments expose the Fund to various risks including, but not limited to, interest rate, prepayment, extension, foreign currency, and equity risks. Interest rate risk is the risk that fixed income securities will decline in value because of changes in interest rates. As nominal interest rates rise, the values of certain fixed income securities held by the Fund are likely to decrease. A nominal interest rate can be described as the sum of a real interest rate and an expected inflation rate. Fixed income securities with longer durations tend to be more sensitive to changes in interest rates, usually making them more volatile than securities with shorter durations. Duration is useful primarily as a measure of the sensitivity of a fixed income security’s market price to interest rate (i.e., yield) movements. In addition, securities are subject to extension risk. Rising interest rates may cause prepayments to occur at a slower than expected rate, thereby effectively lengthening the maturity of the security and making the security more sensitive to interest rate changes. Prepayment and extension risk are major risks of mortgage-backed securities and certain asset-backed securities. For certain asset-backed securities, the actual maturity may be less than the stated maturity shown in the Schedule of Investments, if applicable. As a result, the timing of income recognition relating to these securities may vary based upon the actual maturity. If the Fund invests directly in foreign currencies or in securities that trade in, and receive revenues in, foreign currencies, or in derivatives that provide exposure to foreign currencies, it will be subject to the risk that those currencies will decline in value relative to the base currency of the Fund, or, in the case of hedging positions, that the Fund’s base currency will decline in value relative to the currency being hedged. Currency rates in foreign countries may fluctuate significantly over short periods of time for a number of reasons, including changes in interest rates, intervention (or the failure to intervene) by U.S. or foreign governments, central banks or supranational entities, such as the International Monetary Fund, or by the imposition of currency controls or other political developments in the United States or abroad. As a result, the Fund’s investments in foreign currency denominated securities may reduce the returns of the Fund. The market values of equity securities, such as common stocks and preferred stocks, or equity related investments, such as futures and options, may decline due to general market conditions which are not specifically related to a particular company, such as real or perceived adverse economic conditions, changes in the general outlook for corporate earnings, changes in interest or currency rates or adverse investor sentiment generally. The market value of equity securities may also decline due to factors which affect a particular industry or industries, such as labor shortages or increased production costs and competitive conditions within an industry. Equity securities and equity related investments generally have greater market price volatility than fixed income securities. |
| a) | Federal Income Taxes – For federal income tax purposes, the Fund intends to continue to qualify as a RIC under Subchapter M of the Internal Revenue Code (“IRC”) by distributing substantially all of its taxable net investment income and net realized capital gains to its shareholders and otherwise complying with the requirements of RICs. The Fund has distributed substantially all of its income and capital gains in prior years, if applicable, and intends to distribute substantially all of its income and capital gains prior to the next fiscal year-end. Accordingly, no provision for federal income or excise taxes has been made in the accompanying financial statements. Distributions from short-term capital gains are treated as ordinary income distributions for federal income tax purposes. |
| b) | Net Investment Income (Loss), Net Realized Gains (Losses) – Net investment income (loss) and net realized gains (losses) may differ for financial statement and tax purposes primarily because of losses deferred due to wash sale |
adjustments, foreign currency gains and losses, adjustments related to PFICs, REITs, RICs, certain derivatives and partnerships. The character of distributions made during the year from net investment income or net realized gains may differ from their ultimate characterization for federal income tax purposes. Also, due to the timing of dividend distributions, the fiscal year in which amounts are distributed may differ from the year that the income or realized gains (losses) were recorded by the Fund.
| c) | Distributions and Components of Distributable Earnings – The tax character of distributions paid by the Fund for the periods indicated is as follows (as adjusted for dividends payable): |
| | | For the Year Ended
December 31, 2011 | | | For the Year Ended
December 31, 2010 | |
| Ordinary Income | | $ | 57,855 | | | $ | 55,000 | |
As of December 31, 2011, the Fund’s components of distributable earnings (deficit) on a tax basis were as follows:
| | | Amount | |
| Undistributed Ordinary Income | | $ | 28,105 | |
| Accumulated Capital and Other Losses* | | | (1,080,774 | ) |
| Unrealized Appreciation† | | | 245,065 | |
| Total Accumulated Deficit | | $ | (807,604 | ) |
| * | The Fund has capital loss carryforwards that are identified in the Capital Loss Carryforward note that follows. |
| † | The differences between book-basis and tax-basis unrealized appreciation (depreciation) may be attributable to the losses deferred due to wash sale adjustments, foreign currency gains and losses, adjustments related to PFICs, REITs, RICs, certain derivatives and partnerships. |
| d) | Reclassification of Capital Accounts – The Fund may record reclassifications in its capital accounts. These reclassifications have no impact on the total net assets of the Fund. The reclassifications are a result of permanent differences between U.S. GAAP and tax accounting for such items as foreign currency, PFICs, expiration or utilization of capital loss carryforwards or net operating losses. Adjustments are made to reflect the impact these items have on current and future distributions to shareholders. Therefore, the source of the Fund’s distributions may be shown in the accompanying Statement of Changes in Net Assets as from undistributed net investment income, from accumulated net realized gains on investments or from capital depending on the type of book and tax differences that exist. For the year ended December 31, 2011, the Fund recorded reclassifications to increase (decrease) the accounts listed below: |
| | | Amount | |
| Undistributed Net Investment Income | | $ | 363 | |
| Accumulated Net Realized Gain (Loss) | | | (363 | ) |
| e) | Capital Loss Carryforward – On December 22, 2010, the Regulated Investment Company Modernization Act of 2010 (the “Act”) was enacted, which made changes to the capital loss carryforward rules. The changes are effective for taxable years beginning after the date of enactment. Under the Act, funds are permitted to carry forward capital losses for an unlimited period. However, any losses incurred during those future taxable years will be required to be utilized prior to the losses incurred in pre-enactment taxable years, which carry an expiration date. As a result of this ordering rule, pre-enactment capital loss carryforwards may be more likely to expire unused. Additionally, post-enactment capital loss carryforwards will retain their character as either short-term or long-term capital losses rather than being considered all short-term as permitted under prior regulation. |
| Hartford Advisers HLS Fund |
| Notes to Financial Statements – (continued) |
| December 31, 2011 |
| (000’s Omitted) |
At December 31, 2011 (tax-year-end), the Fund had capital loss carryforwards for U.S. federal income tax purposes as follows:
| Year of Expiration | | Amount | |
| 2016 | | $ | 123,119 | |
| 2017 | | | 957,655 | |
| Total | | $ | 1,080,774 | |
As of December 31, 2011, the Fund utilized $161,012 of prior year capital loss carryforwards.
| f) | Accounting for Uncertainty in Income Taxes – The Fund has adopted financial reporting rules that require the Fund to analyze all open tax years, as defined by the statute of limitations, for all major jurisdictions. Generally, tax authorities can examine all tax returns filed for the last three years. The Fund does not have an examination in progress. |
The Fund has reviewed all open tax years and major jurisdictions and concluded that these financial reporting rules had no effect on the Fund’s financial position or results of operations. There is no tax liability resulting from unrecognized tax benefits relating to uncertain income tax positions taken or expected to be taken on the tax return for the fiscal year ended December 31, 2011. The Fund is also not aware of any tax positions for which it is reasonably possible that the total amounts of unrecognized tax benefits will significantly change in the next twelve months.
| a) | Investment Management Agreement – HL Investment Advisors, LLC (“HL Advisors”), an indirect wholly owned subsidiary of The Hartford Financial Services Group, Inc. (“The Hartford”), serves as investment manager to the Fund pursuant to an Investment Management Agreement with the Company. As investment manager, HL Advisors has overall investment supervisory responsibility for the Fund. In addition, HL Advisors provides administrative personnel, services, equipment, facilities and office space for proper operation of the Fund. HL Advisors has contracted with Wellington Management Company, LLP (“Wellington Management”) under a sub-advisory agreement for the provision of day-to-day investment management services to the Fund in accordance with the Fund’s investment objective and policies. The Fund pays a fee to HL Advisors, a portion of which may be used to compensate Wellington Management. |
The schedule below reflects the rates of compensation paid to HL Advisors for investment management services rendered as of December 31, 2011; the rates are accrued daily and paid monthly.
| Average Daily Net Assets | Annual Fee |
| On first $250 million | 0.6800% |
| On next $250 million | 0.6550% |
| On next $500 million | 0.6450% |
| On next $4 billion | 0.5950% |
| On next $5 billion | 0.5925% |
| Over $10 billion | 0.5900% |
| b) | Accounting Services Agreement – Pursuant to the Fund Accounting Agreement between HLIC and the Company, on behalf of the Fund, HLIC provides accounting services to the Fund and receives monthly compensation based on the Fund’s average daily net assets at the rates set forth below. The Fund’s accounting services fees are accrued daily and paid monthly. |
| Average Daily Net Assets | Annual Fee |
| On first $5 billion | 0.016% |
| On next $5 billion | 0.014% |
| Over $10 billion | 0.012% |
| c) | Operating Expenses – Allocable expenses incurred by the Company are allocated to each Fund and allocated to classes within a Fund in proportion to the average daily net assets of the Fund and each class, except where allocation of certain expenses is more fairly made directly to the Fund or to specific classes within a Fund. |
| d) | Fees Paid Indirectly – The Company, on behalf of the Fund, has entered into agreements with State Street Global Markets, LLC and Russell Implementation Services, Inc. to partially recapture non-discounted trade commissions. Such rebates are used to pay a portion of the Fund’s expenses. In addition, the Fund’s custodian bank has also agreed to reduce its fees when the Fund maintains cash on deposit in a non-interest-bearing custody account. For the year ended December 31, 2011, these amounts, if any, are included in the Statement of Operations. |
The ratio of expenses to average net assets in the accompanying financial highlights excludes the reduction in expenses related to fees paid indirectly. The annualized expense ratio for the period listed below reflecting the reduction for fees paid indirectly is as follows:
| | | Year Ended
December 31, 2011 | |
| Class IA | | | 0.64 | % |
| Class IB | | | 0.89 | |
| e) | Distribution Plan for Class IB shares – The Company, on behalf of the Fund, has adopted a Distribution Plan pursuant to Rule 12b-1 of the 1940 Act to compensate the Distributor, Hartford Securities Distribution Company, Inc. (a wholly owned, ultimate subsidiary of The Hartford), from assets attributable to the Class IB shares for services rendered and expenses borne in connection with activities primarily intended to result in the sale of the Class IB shares, subject to the review and approval of the Company’s Board of Directors. |
The Distribution Plan provides that the Fund may pay annually up to 0.25% of the average daily net assets of the Fund attributable to its Class IB shares for activities primarily intended to result in the sale of Class IB shares. The Board has the authority to suspend or reduce these payments at any point in time. Under the terms of the Distribution Plan and the principal underwriting agreement, the Fund is authorized to make payments monthly to the Distributor that may be used to pay or compensate entities providing distribution and shareholder servicing with respect to the Class IB shares for such entities’ fees or expenses incurred or paid in that regard. These fees are accrued daily and paid monthly.
| f) | Other Related Party Transactions – Certain officers of the Fund are directors and/or officers of HL Advisors and/or The Hartford or its subsidiaries. For the year ended December 31, 2011, a portion of the Fund’s chief compliance officer’s salary was paid by all the investment companies in the Hartford fund complex. The portion allocated to the Fund was in the amount of $5. These fees are accrued daily and paid monthly. |
| Hartford Advisers HLS Fund |
| Notes to Financial Statements – (continued) |
| December 31, 2011 |
| (000’s Omitted) |
| 8. | Investment Transactions: |
For the year ended December 31, 2011, the Fund's aggregate purchases and sales of investment securities (excluding short-term investments) were as follows:
| | | Amount | |
| Cost of Purchases Excluding U.S. Government Obligations | | $ | 1,246,094 | |
| Sales Proceeds Excluding U.S. Government Obligations | | | 1,814,897 | |
| Cost of Purchases for U.S. Government Obligations | | | 98,957 | |
| Sales Proceeds for U.S. Government Obligations | | | 162,687 | |
| 9. | Proceeds from Regulatory Settlement: |
During the year ended December 31, 2010, as a result of a settlement of an administrative proceeding brought by the SEC against an unaffiliated third party relating to market timing and/or late trading of mutual funds, the Fund received $147, which represented the Fund’s portion of the proceeds from the settlement (the Fund was not a party to the proceeding). The proceeds received by the Fund were recorded as an increase to additional paid-in-capital. The payment did not have a material impact on the Fund’s NAV.
The Fund is one of several Hartford funds that participate in a $500 million committed revolving line of credit facility. The facility is to be used for temporary or emergency purposes. Under the arrangement, the funds are required to own securities having a market value in excess of 300% of the total bank borrowings. The interest rate on borrowings varies depending on the nature of the loan. The facility also requires a fee to be paid based on the amount of the commitment. This commitment fee is allocated to all of the funds participating in the line of credit based on the average net assets of the funds. During the year ended December 31, 2011, the Fund did not have any borrowings under this facility.
Reorganization of Hartford Global Advisers HLS Fund into Hartford Advisers HLS Fund: At a meeting held on August 5, 2009, the Board of Directors of the Company approved a Form of Agreement and Plan of Reorganization (“Reorganization Agreement”) that provided for the reorganization of a series of the Company, Hartford Global Advisers HLS Fund (“Target Fund”), into another series of the Company, Hartford Advisers Fund (“Acquiring Fund”) (the “Reorganization”). The reorganization did not require shareholder approval by the shareholders of the Target Fund or Acquring Fund.
Pursuant to the Reorganization Agreement, on March 19, 2010 (merger date), each holder of Class IA and Class IB shares of the Target Fund became the owner of full and fractional shares of the corresponding class in the Acquring Fund having an equal aggregate value.
The merger was accomplished by tax free exchange as detailed below:
| | | Net assets of Target
Fund on Merger
Date | | | Net assets of
Acquiring Fund
immediately before
merger | | | Net assets of
Acquiring
Fund
immediately
after merger | | | Target Fund shares
exchanged | | | Acquiring Fund
shares issued to the
Target Fund's
shareholders | |
| | | | | | | | | | | | | | | | |
| Class IA | | $ | 188,305 | | | $ | 3,614,641 | | | $ | 3,802,946 | | | | 17,995 | | | | 10,373 | |
| Class IB | | | 36,319 | | | | 575,481 | | | | 611,800 | | | | 3,489 | | | | 1,979 | |
| Total | | $ | 224,624 | | | $ | 4,190,122 | | | $ | 4,414,746 | | | | 21,484 | | | | 12,352 | |
| 12. | Industry Classifications: |
Other than the industry classifications “Other Investment Pools and Funds” and “Exchange Traded Funds,” equity industry classifications used in this report are the Global Industry Classification Standard, which was developed by and is the exclusive property and service mark of MSCI, Inc. and Standard & Poor’s.
Under the Company’s organizational documents, the Company shall indemnify its officers and directors to the full extent required or permitted under Maryland General Corporation Law and the federal securities laws. In addition, the Company, on behalf of the Fund, may enter into contracts that contain a variety of indemnifications. The Company’s maximum exposure under these arrangements is unknown. However, as of the date of these financial statements, the Company has not had prior claims or losses pursuant to these contracts and expects the risk of loss to be remote.
| Hartford Advisers HLS Fund |
| Financial Highlights |
| – Selected Per-Share Data – (A) |
| Class | | Net Asset
Value at
Beginning of
Period | | | Net Investment
Income (Loss) | | | Payments from
(to) Affiliate | | | Net Realized
and Unrealized
Gain (Loss) on
Investments | | | Total from
Investment
Operations | | | Dividends from
Net Investment
Income | | | Distributions
from Realized
Capital Gains | | | Distributions
from Capital | | | Total
Distributions | | | Net Increase
(Decrease) in
Net Asset
Value | | | Net Asset
Value at End of
Period | |
| | | | | | | | | | | | | | | | | | | | | | | | | | | | | | | | | | |
| For the Year Ended December 31, 2011 |
| IA | | $ | 19.32 | | | $ | 0.41 | | | $ | — | | | $ | (0.06 | ) | | $ | 0.35 | | | $ | (0.33 | ) | | $ | — | | | $ | — | | | $ | (0.33 | ) | | $ | 0.02 | | | $ | 19.34 | |
| IB | | | 19.55 | | | | 0.36 | | | | — | | | | (0.05 | ) | | | 0.31 | | | | (0.28 | ) | | | — | | | | — | | | | (0.28 | ) | | | 0.03 | | | | 19.58 | |
| | | | | | | | | | | | | | | | | | | | | | | | | | | | | | | | | | | | | | | | | | | | | |
| For the Year Ended December 31, 2010(E) |
| IA | | | 17.47 | | | | 0.30 | | | | — | | | | 1.82 | | | | 2.12 | | | | (0.27 | ) | | | — | | | | — | | | | (0.27 | ) | | | 1.85 | | | | 19.32 | |
| IB | | | 17.68 | | | | 0.26 | | | | — | | | | 1.83 | | | | 2.09 | | | | (0.22 | ) | | | — | | | | — | | | | (0.22 | ) | | | 1.87 | | | | 19.55 | |
| | | | | | | | | | | | | | | | | | | | | | | | | | | | | | | | | | | | | | | | | | | | | |
| For the Year Ended December 31, 2009 |
| IA | | | 13.69 | | | | 0.36 | | | | — | | | | 3.78 | | | | 4.14 | | | | (0.36 | ) | | | — | | | | — | | | | (0.36 | ) | | | 3.78 | | | | 17.47 | |
| IB | | | 13.85 | | | | 0.32 | | | | — | | | | 3.83 | | | | 4.15 | | | | (0.32 | ) | | | — | | | | — | | | | (0.32 | ) | | | 3.83 | | | | 17.68 | |
| | | | | | | | | | | | | | | | | | | | | | | | | | | | | | | | | | | | | | | | | | | | | |
| For the Year Ended December 31, 2008 |
| IA | | | 20.97 | | | | 0.50 | | | | — | | | | (7.09 | ) | | | (6.59 | ) | | | (0.58 | ) | | | (0.11 | ) | | | — | | | | (0.69 | ) | | | (7.28 | ) | | | 13.69 | |
| IB | | | 21.18 | | | | 0.47 | | | | — | | | | (7.17 | ) | | | (6.70 | ) | | | (0.52 | ) | | | (0.11 | ) | | | — | | | | (0.63 | ) | | | (7.33 | ) | | | 13.85 | |
| | | | | | | | | | | | | | | | | | | | | | | | | | | | | | | | | | | | | | | | | | | | | |
| For the Year Ended December 31, 2007 |
| IA | | | 22.60 | | | | 0.55 | | | | — | | | | 0.90 | | | | 1.45 | | | | (0.53 | ) | | | (2.55 | ) | | | — | | | | (3.08 | ) | | | (1.63 | ) | | | 20.97 | |
| IB | | | 22.78 | | | | 0.49 | | | | — | | | | 0.92 | | | | 1.41 | | | | (0.46 | ) | | | (2.55 | ) | | | — | | | | (3.01 | ) | | | (1.60 | ) | | | 21.18 | |
| (A) | Information presented relates to a share outstanding throughout the indicated period. |
| (B) | The figures do not include sales charges or other fees which may be applied at the variable life insurance, variable annuity or qualified retirement plan product level. Any such additional sales charges or other fees would lower the Fund's performance. |
| (C) | Ratios do not reflect reductions for fees paid indirectly. Please see Fees Paid Indirectly in the Notes to Financial Statements. |
| (D) | Portfolio turnover rate is calculated on the basis of the Fund as a whole without distinguishing between the classes of shares issued. |
| (E) | Per share amounts have been calculated using the average shares method. |
| (F) | During the year ended December 31, 2010, the Fund incurred $204.5 million in purchases associated with the transition of assets from Hartford Global Advisers HLS Fund, which merged into the Fund on March 19, 2010. These purchases were excluded from the portfolio turnover calculation. |
| – Ratios and Supplemental Data – |
| | | | | | | Ratio of Expenses to Average Net | | | Ratio of Expenses to Average Net | | | Ratio of Net Investment Income | | | Portfolio Turnover | |
| Total Return(B) | | | Net Assets at End of Period | | | Assets Before Waivers(C) | | | Assets After Waivers(C) | | | (Loss) to Average Net Assets | | | Rate(D) | |
| | | | | | | | | | | | | | | | | | | | | | |
| | | | | | | | | | | | | | | | | | | | | | |
| 1.86 | % | | $ | 2,959,019 | | | | 0.64 | % | | | 0.64 | % | | | 1.84 | % | | | 34 | % |
| 1.61 | | | | 455,939 | | | | 0.89 | | | | 0.89 | | | | 1.59 | | | | — | |
| | | | | | | | | | | | | | | | | | | | | | |
| | | | | | | | | | | | | | | | | | | | | | |
| 12.14 | | | | 3,539,983 | | | | 0.65 | | | | 0.65 | | | | 1.68 | | | | 65 | (F) |
| 11.86 | | | | 556,169 | | | | 0.90 | | | | 0.90 | | | | 1.43 | | | | — | |
| | | | | | | | | | | | | | | | | | | | | | |
| | | | | | | | | | | | | | | | | | | | | | |
| 30.29 | | | | 3,607,929 | | | | 0.65 | | | | 0.65 | | | | 2.15 | | | | 73 | |
| 29.96 | | | | 578,338 | | | | 0.90 | | | | 0.90 | | | | 1.90 | | | | — | |
| | | | | | | | | | | | | | | | | | | | | | |
| | | | | | | | | | | | | | | | | | | | | | |
| (31.64 | ) | | | 3,404,626 | | | | 0.63 | | | | 0.63 | | | | 2.43 | | | | 76 | |
| (31.81 | ) | | | 548,899 | | | | 0.88 | | | | 0.88 | | | | 2.18 | | | | — | |
| | | | | | | | | | | | | | | | | | | | | | |
| | | | | | | | | | | | | | | | | | | | | | |
| 6.64 | | | | 6,291,220 | | | | 0.63 | | | | 0.63 | | | | 2.13 | | | | 47 | |
| 6.37 | | | | 1,080,254 | | | | 0.88 | | | | 0.88 | | | | 1.88 | | | | — | |
| Report of Independent Registered Public Accounting Firm |
| The Board of Directors and Shareholders of |
| Hartford Series Fund, Inc. |
We have audited the accompanying statement of assets and liabilities, including the schedule of investments, of Hartford Advisers HLS Fund (one of the portfolios constituting Hartford Series Fund, Inc. (the Funds)) as of December 31, 2011, and the related statement of operations for the year then ended, the statements of changes in net assets for each of the two years in the period then ended, and the financial highlights for each of the five years in the period then ended. These financial statements and financial highlights are the responsibility of the Funds’ management. Our responsibility is to express an opinion on these financial statements and financial highlights based on our audits.
We conducted our audits in accordance with the standards of the Public Company Accounting Oversight Board (United States). Those standards require that we plan and perform the audit to obtain reasonable assurance about whether the financial statements and financial highlights are free of material misstatement. We were not engaged to perform an audit of the Funds’ internal control over financial reporting. Our audits included consideration of internal control over financial reporting as a basis for designing audit procedures that are appropriate in the circumstances, but not for the purpose of expressing an opinion on the effectiveness of the Funds’ internal control over financial reporting. Accordingly, we express no such opinion. An audit also includes examining, on a test basis, evidence supporting the amounts and disclosures in the financial statements and financial highlights, assessing the accounting principles used and significant estimates made by management, and evaluating the overall financial statement presentation. Our procedures included confirmation of securities owned as of December 31, 2011, by correspondence with the custodian and brokers or by other appropriate auditing procedures where replies from brokers were not received. We believe that our audits provide a reasonable basis for our opinion.
In our opinion, the financial statements and financial highlights referred to above present fairly, in all material respects, the financial position of Hartford Advisers HLS Fund of Hartford Series Fund, Inc. at December 31, 2011, the results of its operations for the year then ended, the changes in its net assets for each of the two years in the period then ended, and the financial highlights for each of the five years in the period then ended, in conformity with U.S. generally accepted accounting principles.

Minneapolis, MN
February 13, 2012
| Hartford Advisers HLS Fund |
| Directors and Officers (Unaudited) |
The Board of Directors of the Company appoints officers who are responsible for the day-to-day operations of the Fund and who execute policies formulated by the Directors. Each director serves until his or her death, resignation, or retirement or until the next annual meeting of shareholders is held or until his or her successor is elected and qualifies.
Directors and officers who are employed by or who have a financial interest in The Hartford are considered “interested” persons of the Fund pursuant to the 1940 Act. Each officer and two of the Company’s directors, as noted in the chart below, are “interested” persons of the Fund. Each director serves as a director for The Hartford Mutual Funds, Inc., The Hartford Mutual Funds II, Inc., Hartford Series Fund, Inc., Hartford HLS Series Fund II, Inc., and as a trustee for The Hartford Alternative Strategies Fund, which, as of December 31, 2011, collectively consist of 91 funds. Correspondence may be sent to directors and officers c/o Hartford Mutual Funds, P.O. Box 2999, Hartford, Connecticut 06104-2999, except that correspondence to Ms. Fagely may be sent to 500 Bielenberg Drive, Woodbury, Minnesota 55125.
The table below sets forth, for each director and officer, his or her name, year of birth, current position with the Company and date first elected or appointed to Hartford Series Fund, Inc. (“HSF”), and Hartford HLS Series Fund II, Inc. (“HSF2”), principal occupation, and, for directors, other directorships held. The Fund’s statement of additional information contains further information on the directors and is available free of charge by calling 1-800-862-6668 or writing to Hartford HLS Funds, c/o Individual Annuity Services, P.O. Box 5085, Hartford, CT 06102-5085.
Information on the aggregate remuneration paid to the directors of the Company can be found in the Statement of Operations herein. The Fund pays to The Hartford a portion of the chief compliance officer’s compensation, but does not pay salaries or compensation to any of their other officers or directors who are employed by The Hartford.
Non-Interested Directors
Lynn S. Birdsong (1946) Director since 2003, Co-Chairman of the Investment Committee
Mr. Birdsong is a private investor. Mr. Birdsong currently serves as a Director of the Sovereign High Yield Investment Company (April 2010 to current). Mr. Birdsong currently serves as an Independent Director of Nomura Partners Funds, Inc. (formerly, The Japan Fund) (March 2003 to current). From 2003 to March 2005, Mr. Birdsong was an independent director of the Atlantic Whitehall Funds. From 1979 to 2002, Mr. Birdsong was a managing director of Zurich Scudder Investments, an investment management firm. During his employment with Scudder, Mr. Birdsong was an Interested Director of The Japan Fund. Since 1981, Mr. Birdsong has been a partner in Birdsong Company, an advertising specialty firm.
Robert M. Gavin, Jr. (1940) Director since 2002 (HSF) and 1986 (HSF2), Chairman of the Board since 2004
Dr. Gavin is an educational consultant. Prior to September 1, 2001, he was President of Cranbrook Education Community and prior to July 1996, he was President of Macalester College, St. Paul, Minnesota.
Duane E. Hill (1945) Director since 2001 (HSF) and 2002 (HSF2), Chairman of the Nominating Committee
Mr. Hill is Partner of TSG Ventures L.P., a private equity investment company. Mr. Hill is a former partner of TSG Capital Group, a private equity investment firm that served as sponsor and lead investor in leveraged buyouts of middle market companies.
Sandra S. Jaffee (1941) Director since 2005
Ms. Jaffee served as Chairman (2008 to 2009) and Chief Executive Officer of Fortent (formerly Searchspace Group), a leading provider of compliance/regulatory technology to financial institutions from August 2005 to August 2009. From August 2004 to August 2005, Ms. Jaffee served as an Entrepreneur in Residence with Warburg Pincus, a private equity firm. From September 1995 to July 2004, Ms. Jaffee served as Executive Vice President at Citigroup, where she was President and Chief Executive Officer of Citibank’s Global Securities Services (1995 to 2003). Ms. Jaffe currently serves as a member of the Board of Directors of Broadridge Financial Solutions as well as a Trustee of Muhlenberg College.
William P. Johnston (1944) Director since 2005, Chairman of the Compliance Committee
In June 2006, Mr. Johnston was appointed as Senior Advisor to The Carlyle Group, a global private equity investment firm. In August 2007, Mr. Johnston was elected to the Board of Directors of LifeCare Holdings, Inc. In February 2008, Mr. Johnston was elected to the Board of Directors of HCR-ManorCare, Inc. In May 2006, Mr. Johnston was elected to the Supervisory Board of Fresenius Medical Care AG & Co. KGaA, after its acquisition of Renal Care Group, Inc. in March 2006. Mr. Johnston joined Renal Care Group in November 2002 as a member of the Board of Directors and served as Chairman of the Board from March 2003 through March 2006. Mr. Johnston served as a Director of MultiPlan, Inc. from July 2006 through August 2010. From September 1987 to December 2002, Mr. Johnston was with Equitable Securities Corporation (and its successors, SunTrust Equitable Securities and SunTrust Robinson Humphrey) serving in various investment banking and managerial positions, including Managing Director and Head of Investment Banking, Chief Executive Officer and Vice Chairman.
| Hartford Advisers HLS Fund |
| Directors and Officers (Unaudited) – (continued) |
Phillip O. Peterson (1944) Director since 2002 (HSF) and 2000 (HSF2), Chairman of the Audit Committee
Mr. Peterson is a mutual fund industry consultant. He was a partner of KPMG LLP (an accounting firm) until July 1999. Mr. Peterson joined William Blair Funds in February 2007 as a member of the Board of Trustees. From January 2004 to April 2005, Mr. Peterson served as Independent President of the Strong Mutual Funds.
Lemma W. Senbet (1946) Director since 2005
Dr. Senbet is the William E. Mayer Chair Professor of Finance and Director, Center for Financial Policy, at the University of Maryland, Robert H. Smith School of Business. He was chair of the Finance Department from 1998 to 2006. Previously he was a chaired professor of finance at the University of Wisconsin-Madison. Also, he was director of the Fortis Funds from March 2000 to July 2002. Dr. Senbet served the finance profession in various capacities, including as director of the American Finance Association and President of the Western Finance Association. In 2006, Dr. Senbet was inducted Fellow of Financial Management Association International for his career-long distinguished scholarship and professional service.
Interested Directors and Officers
David N. Levenson (1966) Director since 2010
Mr. Levenson currently serves as President of The Hartford’s Wealth Management business. He was appointed to this role in July 2010. Previously, Mr. Levenson served as Executive Vice President of Legacy Holdings for The Hartford from June 2009 to July 2010. From 2006 to 2009, Mr. Levenson was with Hartford Life Insurance K.K. where he served as President and Chief Executive Officer from 2007 to 2009. He served as Managing Director of Hartford Investment Management Company from 2005 to 2006. Additionally, Mr. Levenson serves as Executive Vice President of The Hartford and as President, Director and Chief Executive Officer of Hartford Life Insurance Company (“HLIC”) and Hartford Life, Inc. (“HL Inc.”).
Lowndes A. Smith (1939) Director since 1996 (HSF) and 2002 (HSF2), Co-Chairman of the Investment Committee
Mr. Smith served as Vice Chairman of The Hartford from February 1997 to January 2002, as President and Chief Executive Officer of HL Inc. from February 1997 to January 2002, and as President and Chief Operating Officer of The Hartford Life Insurance Companies from January 1989 to January 2002. Mr. Smith serves as a Director of White Mountains Insurance Group, Ltd., One Beacon Insurance and Symetra Financial and as a Managing Director of Whittington Gray Associates.
Other Officers
James E. Davey (1964) President and Chief Executive Officer since 2010
Mr. Davey serves as Executive Vice President of HLIC. Additionally, Mr. Davey serves as President, Chief Executive Officer and Manager of Hartford Investment Financial Services, Inc. (“HIFSCO”) and President, Chief Executive Officer and Manager of HL Advisors. Mr. Davey joined The Hartford in 2002.
Michael R. Dressen (1963) AML Compliance Officer since 2011
Mr. Dressen currently serves as Assistant Vice President of HLIC. He also serves as Chief Compliance Officer and AML Compliance Officer of Hartford Administrative Services Company (“HASCO”) and as Assistant Secretary and Compliance Officer of HIFSCO. Mr Dressen joined The Hartford in 2005 from State Farm Insurance Companies where he held various positions related to mutual funds, variable products, and property casualty insurance.
Tamara L. Fagely (1958) Vice President, Treasurer and Controller since 2002 (HSF) and 1993 (HSF2)
Ms. Fagely has been a Vice President of HASCO since 1998 and Chief Financial Officer since 2006. Currently Ms. Fagely is a Vice President of HLIC. She served as Assistant Vice President of HLIC from December 2001 through March 2005. In addition, Ms. Fagely is Controller and Chief Financial Officer of HIFSCO.
Dr. Robert J. Froehlich (1953) Senior Managing Director since 2009
Dr. Froehlich joined The Hartford as Senior Managing Director in September 2009. Prior to joining The Hartford, Dr. Froehlich served as Vice Chairman of Deutsche Asset Management from 1997-2009.
Edward P. Macdonald (1967) Vice President, Secretary and Chief Legal Officer since 2005
Mr. Macdonald serves as Vice President of HLIC and Chief Legal Officer of Mutual Funds and Vice President of HIFSCO. He also serves as Vice President and Secretary of HASCO, and Chief Legal Officer, Secretary and Vice President of HL Advisors. Mr. Macdonald joined The Hartford in 2005.
Vernon J. Meyer (1964) Vice President since 2006
Mr. Meyer serves as Senior Vice President of HLIC. He also serves as Senior Vice President of HIFSCO and HL Advisors. Mr. Meyer joined The Hartford in 2004.
Colleen B. Pernerewski (1969) Vice President and Chief Compliance Officer since 2010
Ms. Pernerewski serves as Vice President and Chief Investment Advisor Compliance Officer of HIFSCO and as Vice President and Chief Compliance Officer of HL Advisors. Ms. Pernerewski joined The Hartford in 2005 from Travelers Life and Annuity where she served as Counsel (2004-2005). Prior to Travelers Life and Annuity, Ms. Pernerewski held the position of Counsel at The Hartford (1998-2004).
Elizabeth L. Schroeder (1966) Vice President since 2010
Ms. Schroeder currently serves as Assistant Vice President of HLIC. Ms. Schroeder joined HLIC in 1991. She is also an Assistant Vice President of HASCO, HIFSCO and HL Advisors.
Martin Swanson (1962) Vice President since 2010
Mr. Swanson is a Vice President of HLIC. Mr. Swanson also serves as Vice President/Marketing for HIFSCO. Prior to joining HLIC in 1998, Mr. Swanson was a Vice President at PaineWebber, Inc.
Jane Wolak (1961) Vice President since 2009
Ms. Wolak currently serves as Senior Vice President of HLIC. Ms. Wolak joined HLIC as Vice President, Retail Product Services in May 2007. She is also Vice President of HASCO. Previously, Ms. Wolak was with Sun Life Financial where she held the position of Vice President, Service Center Operations from 2001-2007.
HOW TO OBTAIN A COPY OF THE FUND’S PROXY VOTING POLICIES AND VOTING RECORDS (UNAUDITED)
A description of the policies and procedures that the Fund uses to determine how to vote proxies relating to portfolio securities and a record of how the Fund voted any proxies for the twelve-month period ended June 30, 2011 are available (1) without charge, upon request, by calling 800-862-6668 and (2) on the SEC’s website at http://www.sec.gov.
QUARTERLY PORTFOLIO HOLDINGS INFORMATION (UNAUDITED)
The Fund files a complete schedule of portfolio holdings with the SEC for the first and third quarters of each fiscal year on Form N-Q. The Fund’s Forms are available (1) without charge, upon request, by calling 800-862-6668 and (2) on the SEC’s website at http://www.sec.gov. The Form N-Q may be reviewed and copied at the SEC’s Public Reference Room in Washington, DC. Information on the operation of the Public Reference Room may be obtained by calling 1-800-SEC-0330.
| Hartford Advisers HLS Fund |
| Expense Example (Unaudited) |
Your Fund's Expenses
As a shareholder of the Fund, you incur two types of costs: (1) transaction costs and (2) ongoing costs including investment management fees, distribution fees, and other fund expenses. This example is intended to help you understand your ongoing costs (in dollars) of investing in the Fund and to compare these costs with the ongoing costs of investing in other mutual funds. The example is based on an investment of $1,000 invested at the beginning of the period and held for the period of June 30, 2011 through December 31, 2011.
Actual Expenses
The first set of columns of the table below provides information about actual account values and actual expenses. You may use the information in this column, together with the amount you invested, to estimate the expenses that you paid over the period. Simply divide your account value by $1,000 (for example, an $8,600 account value divided by $1,000 = 8.6), then multiply the result by the number in the line under the heading entitled “Expenses Paid During Period” to estimate the expenses you paid on your account during this period.
Hypothetical Example for Comparison Purposes
The second set of columns of the table below provides information about hypothetical account values and hypothetical expenses based on the Fund’s actual expense ratio and an assumed rate of return of 5% per year before expenses, which is not the Fund’s actual return. The hypothetical account values and expenses may not be used to estimate the actual ending account balance or expenses you paid for the period. You may use this information to compare the ongoing costs of investing in the Fund and other funds. To do so, compare this 5% hypothetical example with the 5% hypothetical examples that appear in the shareholder reports of the other funds.
Please note that the expenses shown in the table are meant to highlight your ongoing costs only and do not reflect any transactional costs, such as sales charges (loads) and CDSC. Therefore, the second set of columns of the table is useful in comparing ongoing costs only, and will not help you determine the relative total costs of owning different funds. In addition, if these transactional costs were included, your costs would be higher. Expenses are equal to the Fund's annualized expense ratios multiplied by average account value over the period, multiplied by 184/365 (to reflect the one-half year period).
| | | Actual return | | | Hypothetical (5% return before expenses) | | | | | | |
| | | | | | | Expenses paid | | | | | | | Expenses paid | | | | Days in | | |
| | | | | Ending | | during the period | | | | | Ending | | during the period | | | | the | | Days |
| | | Beginning | | Account Value | | June 30, 2011 | | | Beginning | | Account Value | | June 30, 2011 | | Annualized | | current | | in the |
| | | Account Value | | December 31, | | through | | | Account Value | | December 31, | | through | | expense | | 1/2 | | full |
| | | June 30, 2011 | | 2011 | | December 31, 2011 | | | June 30, 2011 | | 2011 | | December 31, 2011 | | ratio | | year | | year |
| Class IA | | $1,000.00 | | $982.08 | | $3.20 | | | $1,000.00 | | $1,021.98 | | $3.26 | | 0.64% | | 184 | | 365 |
| Class IB | | $1,000.00 | | $980.88 | | $4.44 | | | $1,000.00 | | $1,020.72 | | $4.53 | | 0.89% | | 184 | | 365 |
| Hartford Advisers HLS Fund |
| Approval of Investment Management and Investment Sub-Advisory Agreements (Unaudited) |
Section 15(c) of the Investment Company Act of 1940, as amended (the “1940 Act”), requires that each mutual fund’s board of directors, including a majority of those directors who are not “interested persons” of the mutual fund, as defined in the 1940 Act (the “Independent Directors”), annually review and consider the continuation of the mutual fund’s investment advisory and sub-advisory agreements. At its meeting held on August 2-3, 2011, the Board of Directors (the “Board”) of Hartford Series Fund, Inc., including each of the Independent Directors, unanimously voted to approve the continuation of the investment management agreement for Hartford Advisers HLS Fund (the “Fund”) with HL Investment Advisors, LLC (“HL Advisors”) and the continuation of the investment sub-advisory agreement between HL Advisors and the Fund’s sub-adviser, Wellington Management Company, LLP (the “Sub-adviser,” and together with HL Advisors, the “Advisers”) (collectively, the “Agreements”).
In the months preceding the August 2-3, 2011 meeting, the Board requested, received, and reviewed written responses from the Advisers to questions posed to them on behalf of the Independent Directors and supporting materials relating to those questions and responses. The Board considered information furnished to the Board at its meetings throughout the year, as well as information specifically prepared in connection with the annual approval of the Agreements at the Board’s meetings held on June 21-22, 2011 and August 2-3, 2011. Information provided to the Board at its meetings throughout the year included, among other things, reports on Fund performance, legal and compliance matters, sales and marketing activity, shareholder services, and the other services provided to the Fund by the Advisers and their affiliates. In addition, the Board received in-person presentations by Fund officers and representatives of HL Advisors at the Board’s meetings on June 21-22, 2011 and August 2-3, 2011 concerning the Agreements.
The Independent Directors, advised by independent legal counsel, engaged two service providers to assist them with evaluating the Agreements with respect to the Fund. Lipper Inc. (“Lipper”), an independent provider of investment company data, was retained to provide the Board with reports on how the Fund’s contractual management fees, actual management fees, other non-management fees, overall expense ratios and investment performance compared to those of mutual funds with similar investment objectives. The Independent Directors also engaged an independent financial services consulting firm (the “Consultant”) to assist them in evaluating the Fund’s management fees, sub-advisory fees, other non-management fees, overall expense ratios and investment performance. In addition, the Consultant reviewed the profitability calculations utilized by HL Advisors in connection with the continuation of the investment management agreement.
In determining to continue the Agreements for the Fund, the members of the Board reviewed and evaluated information and factors they believed to be relevant and appropriate in light of the information that the Board deemed necessary and appropriate through the exercise of their reasonable business judgment. While individual members of the Board may have weighed certain factors differently, the Board’s determination to continue the Agreements was based on a comprehensive consideration of all information provided to the Board throughout the year and specifically with respect to the continuation of the Agreements. A more detailed discussion of the factors the Board considered with respect to its approval of the Agreements is provided below.
Nature, Extent, And Quality Of Services Provided by the Advisers
The Board requested and considered information concerning the nature, extent, and quality of the services provided to the Fund by the Advisers. The Board considered, among other things, the terms of the Agreements and the range of services provided by the Advisers. The Board considered the Advisers’ professional personnel who provide services to the Fund, including each Adviser’s ability and experience in attracting and retaining qualified personnel to service the Fund. The Board considered each Adviser’s reputation and overall financial strength, as well as its willingness to consider and implement organizational and operational changes designed to improve services to the Fund. In addition, the Board considered the quality of each Adviser’s communications with the Board and responsiveness to Board inquiries.
The Board also requested and evaluated information concerning each Adviser’s regulatory and compliance environment. In this regard, the Board requested and reviewed information on each Adviser’s compliance policies and procedures, compliance history, and a report from the Fund’s Chief Compliance Officer on each Adviser’s compliance with applicable laws and regulations, including responses to regulatory developments and compliance issues raised by regulators. The Board also noted the Advisers’ support of the Fund’s compliance control structure, particularly the resources devoted by the Advisers in support of the Fund’s obligations pursuant to Rule 38a-1 under the 1940 Act.
| Hartford Advisers HLS Fund |
| Approval of Investment Management and Investment Sub-Advisory Agreements (Unaudited) – (continued) |
With respect to HL Advisors, the Board noted that under the Agreements, HL Advisors is responsible for the management of the Fund, including overseeing fund operations and service providers, as well as investment advisory services in connection with selecting, monitoring and supervising the Sub-adviser. The Board considered HL Advisors’ ongoing monitoring of people, process and performance, including its quarterly reviews of each of the Hartford HLS Funds, semi-annual meetings with the leaders of each Fund’s portfolio management team, and oversight of the Funds’ 49 portfolio managers. The Board recognized that HL Advisors has demonstrated a record of making changes to the management and/or strategies of the Funds when warranted. The Board considered HL Advisors’ oversight of the Sub-adviser’s investment approach and results, process for monitoring best execution of portfolio trades by the Sub-adviser, and approach to risk management with respect to the Fund and the service providers to the Fund. The Board also considered HL Advisors’ oversight of compliance with the Fund’s objective and policies as well as with applicable laws and regulations, noting that regulatory and other developments had over time led to an increase in the scope of HL Advisors’ services in this regard. In addition, the Board considered HL Advisors’ ongoing commitment to review and rationalize the Hartford fund family’s product line-up and the expenses that HL Advisors had incurred in connection with fund combinations in recent years. The Board considered that HL Advisors or its affiliates are responsible for providing the Fund’s officers. The Board also noted that Hartford Life Insurance Company (“HLIC”) provides administrative services to the Fund. The Board considered its experiences with HL Advisors and HLIC with respect to each of these services.
With respect to the Sub-adviser, who provides day-to-day portfolio management services, the Board considered the quality of the Fund’s portfolio managers, the Sub-adviser’s other investment personnel, its investment philosophy and process, investment research capabilities and resources, performance record, trade execution capabilities and experience. The Board considered the experience of the Fund’s portfolio managers, the number of accounts managed by the portfolio managers, and the Sub-adviser’s method for compensating the portfolio managers.
Based on these considerations, the Board concluded that it was satisfied with the nature, extent and quality of the services provided to the Fund by HL Advisors and the Sub-adviser.
Performance of the Fund and the Advisers
The Board considered the investment performance of the Fund. In this regard, the Board reviewed the performance of the Fund over different time periods presented in the materials and evaluated HL Advisors’ analysis of the Fund’s performance for these time periods. The Board considered information and materials provided to the Board by the Advisers concerning Fund performance, as well as information from Lipper comparing the investment performance of the Fund to an appropriate benchmark and universe of peer funds. The Board noted that the performance of the Fund was within expectations, although its one year performance had declined on a relative basis. The Board also noted that the Fund’s performance would continue to be monitored by HL Advisors.
The Board considered the detailed investment analytics reports provided by The Hartford’s Investment Advisory Group throughout the year. These reports include, among other things, information on the Fund’s gross and net returns, the Fund’s investment performance relative to an appropriate benchmark and peer group, various statistics concerning the Fund’s portfolio, and a narrative summary of various factors affecting Fund performance. The Board considered the Advisers’ cooperation with the Investment Committee, which assists the Board in evaluating the performance of the Fund at periodic meetings throughout the year. The Board also considered the analysis provided by the Consultant relating to the Fund’s performance track record.
In light of all the considerations noted above, the Board concluded that it had continued confidence in HL Advisors’ and the Sub-adviser’s overall capabilities to manage the Fund.
Costs of the Services and Profitability of the Advisers
The Board reviewed information regarding HL Advisors’ cost to provide investment management and related services to the Fund and HL Advisors’ profitability, both overall and for the Fund, on a pre-tax basis without regard to distribution expenses. The Board also requested and reviewed information about the profitability to HL Advisors and its affiliates from all services provided to the Fund and all aspects of their relationship with the Fund. The Board also requested and received information relating to the operations and profitability of the Sub-adviser.
The Board considered the Consultant’s review of the profitability calculations utilized by HL Advisors in connection with the continuation of the investment management agreement. In this regard, the Consultant reported that The Hartford’s process for calculating and reporting Fund profitability is reasonable, sound and well within common industry practice.
Based on these considerations, the Board concluded that the profits anticipated to be realized by the Advisers and their affiliates from their relationships with the Fund would not be excessive.
Comparison of Fees and Services Provided by the Advisers
The Board considered comparative information with respect to the management fees to be paid by the Fund to HL Advisors and the total expense ratios of the Fund. The Board also considered comparative information with respect to the sub-advisory fees to be paid by HL Advisors to the Sub-adviser, to the extent applicable. In this regard, the Board requested and reviewed information from HL Advisors and the Sub-adviser relating to the management and sub-advisory fees, including the sub-advisory fee schedule for the Fund, and total operating expenses for the Fund. The Board considered that the management fee for the Fund includes the fee paid to HLIC for providing certain administrative services to the Fund. The Board also reviewed information from Lipper comparing the Fund’s contractual management fees, actual management fees and overall expense ratios relative to a group of funds selected by Lipper, in consultation with the Consultant, and a broader universe of funds selected by Lipper.
While the Board recognized that comparisons between the Fund and peer funds are imprecise, given the differing service levels and characteristics of mutual funds and the different business models and cost structures of the Advisers, the comparative information provided by Lipper assisted the Board in evaluating the reasonableness of the Fund’s management and sub-advisory fees and total operating expenses. In addition, the Board considered the analysis and recommendations of the Consultant relating to the Fund’s management and sub-advisory fees and total operating expenses.
Based on these considerations, the Board concluded that the Fund’s fees and total operating expenses, in conjunction with the information about quality of services, profitability, economies of scale, and other matters discussed, were reasonable in light of the services provided.
Economies of Scale
The Board requested and considered information regarding the Advisers’ realization of economies of scale with respect to the Fund and whether the fee levels reflect these economies of scale for the benefit of the Fund’s investors. With respect to HL Advisors, the Board considered representations from HL Advisors that it is difficult to anticipate whether and to what extent economies may be realized by HL Advisors as assets grow over time. The Board reviewed the breakpoints in the management fee schedule for the Fund, which reduces fee rates as Fund assets grow over time. The Board recognized that a fund with assets beyond the last breakpoint level will continue to benefit from economies of scale because additional assets are charged the lowest breakpoint fee resulting in lower overall effective management fee rates. The Board also recognized that a fee schedule that reaches a lower breakpoint quickly provides shareholders with the benefit of anticipated or potential economies of scale.
The Board reviewed and evaluated materials from Lipper showing how management fee schedules of peer funds reflect economies of scale for the benefit of investors as a peer fund’s assets hypothetically increase over time. Based on information provided by HL Advisors, Lipper, and the Consultant, the Board recognized that there is no uniform methodology for establishing breakpoints or uniform pattern in asset levels that trigger breakpoints or the amounts of breakpoints triggered.
After considering all of the information available to it, the Board concluded that it was satisfied with the extent to which economies of scale would be shared for the benefit of the Fund’s shareholders based on currently available information and the effective advisory fees and expense ratios for the Fund at its current and reasonably anticipated asset levels. The Board noted, however, that it would continue to monitor future growth in Fund assets and the appropriateness of additional breakpoints.
| Hartford Advisers HLS Fund |
| Approval of Investment Management and Investment Sub-Advisory Agreements (Unaudited) – (continued) |
Other Benefits
The Board considered other benefits to the Advisers and their affiliates from their relationships with the Fund, including the role of the Fund in supporting the variable life insurance and variable annuity products offered by The Hartford. The Board reviewed information noting that HLIC, an affiliate of HL Advisors, receives fees for providing certain administrative services to the Fund, and that HLIC also receives fees for fund accounting and related services from the Fund, and the Board considered information on expected profits to HLIC or its affiliates for such services. The Board also considered that Hartford Administrative Services Company (“HASCO”), the Fund’s transfer agent and an affiliate of HL Advisors, receives transfer agency compensation from the Fund, and the Board reviewed information on the expected profitability of the Fund’s transfer agency function to HASCO. The Board considered information provided by HASCO indicating that the transfer agent fees charged by HASCO to the Fund were fair and reasonable based on publicly available information.
The Board also considered that Hartford Securities Distribution Company, Inc., as principal underwriter of the Fund, receives 12b-1 fees from the Fund. The Board also noted that certain affiliates of HL Advisors distribute shares of the Fund and receive compensation in that connection.
The Board considered benefits to the Sub-adviser from its use of the Fund’s brokerage commissions to obtain soft dollar research, and representations from HL Advisors and the Sub-adviser that the Sub-adviser would not make any revenue-sharing payments or any other type of distribution payments to HL Advisors or its affiliates.
The Board considered the benefits to shareholders of being part of the Hartford family of funds. The Board considered HL Advisors’ efforts to provide investors in the family with a broad range of investment styles and asset classes.
* * * *
Based upon its review of these various factors, among others, the Board concluded that it is in the best interests of the Fund and its shareholders for the Board to approve the Agreements for an additional year. In reaching this decision, the Board did not assign relative weights to the factors discussed above or deem any one or group of them to be controlling in and of themselves. In connection with their deliberations, the Independent Directors met separately in executive session on several occasions, with independent legal counsel, to review the relevant materials and consider their responsibilities under relevant laws and regulations.
The Hartford
P.O. Box 5085
Hartford, CT 06102-5085
Hartford Series Fund, Inc. is underwritten and distributed by Hartford Securities Distribution Company, Inc.
"The Hartford" is The Hartford Financial Services Group, Inc. and its subsidiaries.
Hartford Series Fund, Inc. inception dates range from 1977 to date. Hartford Series Fund, Inc. is not a subsidiary of The Hartford but is underwritten, distributed by and advised by subsidiaries of The Hartford. Investments in Hartford Series Fund, Inc. are not guaranteed by The Hartford or any other entity.
You should carefully consider investment objectives, risks, and charges and expenses of Hartford HLS Funds before investing. This and other information can be found in the Fund’s prospectus or summary prospectus, which can be obtained by calling 800-862-6668. Please read them carefully before you invest or send money.
HLSAR-AD11 2-12 109078 Printed in U.S.A ©2011 The Hartford, Hartford, CT 06115 |  |

A MESSAGE FROM THE PRESIDENT
Dear Fellow Shareholders:
I want to take this opportunity to say thank you for investing in Hartford HLS Funds.
This has been a tumultuous year. In the beginning of 2011, we witnessed tension-fueled political uprisings in the already-volatile Middle East and North Africa region. We also watched as Japan dealt with a series of crises including a massive earthquake and subsequent tsunami. Yet, U.S. economic conditions continued to improve, with gains in consumer confidence and retail sales. During the first half of 2011, domestic, international, and world indices (as measured by the S&P 500, MSCI EAFE and MSCI World) were all up more than 5% through June, 30 2011.
The economic recovery, however, lost momentum in the second half of 2011. The employment and housing markets both remain extremely challenged. Investors continue to be concerned about the implications of the European sovereign debt crisis, as well as our own high levels of domestic debt. Fears that the European sovereign debt crisis could continue to drag down the global economy have weighed heavily on stocks.
Ongoing apprehension regarding the U.S. debt ceiling during the summer and the resulting downgrade of the U.S. sovereign credit rating by Standard & Poor’s also contributed to weaker investor confidence.
There are, however, some reasons to remain confident. Corporations have record levels of cash on their balance sheets—corporate cash has doubled in the past 10 years. In addition, U.S. gross domestic product expanded at a 2.5 percent annual rate in the third quarter according to the Commerce Department, as consumers and businesses set aside fears about the recovery and stepped up spending. Corporate earnings have also remained positive, with a majority of companies beating expectations each quarter this year. This momentum will hopefully continue into next year.
As we head into 2012, in light of the continued market volatility, now would be a good time to schedule a meeting with your financial advisor to examine your current investment strategy and determine whether you are on the right track.
| • | Does your fixed-income portfolio complement your equity portfolio? |
| • | Are you receiving diversified sources of income? |
| • | Is your portfolio still in line with your risk tolerance and investment time horizon? |
Talk to your advisor to see what changes you should make to address these concerns and opportunities.
Thank you again for investing with Hartford HLS Funds.
James Davey
President
Hartford HLS Funds
Hartford Series Fund, Inc.
Table of Contents
This report is prepared for the general information of contract owners and is not an offer of contracts. It should not be used in connection with any offer, except in conjunction with the appropriate product prospectus which contains all pertinent product information including the applicable sales, administrative and other charges.
American Funds Asset Allocation HLS Fund inception 4/30/2008
(advised by HL Investment Advisors, LLC)
| Investment Goal: Seeks high total return (including income and capital gains) consistent with preservation of capital over the long term. |
| |
Performance Overview 4/30/08 - 12/31/11
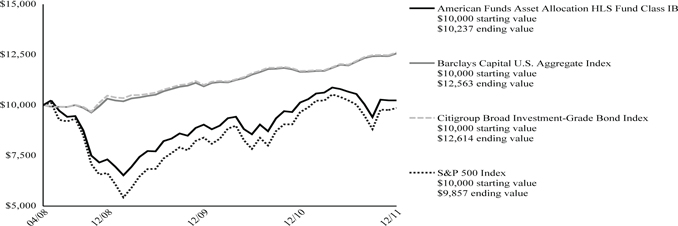
Average Annual Total Returns (as of 12/31/11)
| | 1 Year | Since
Inception |
| American Funds Asset Allocation HLS Fund IB | 1.02% | 0.64% |
| Barclays Capital U.S. Aggregate Index | 7.84% | 6.41% |
| Citigroup Broad Investment-Grade Bond Index | 7.85% | 6.53% |
| S&P 500 Index | 2.09% | -0.39% |
PAST PERFORMANCE IS NOT INDICATIVE OF FUTURE RESULTS.
Total returns presented above were calculated using the Fund's net asset value available to shareholders for sale or redemption of Fund shares on December 31, 2011, which may exclude investment transactions as of this date.
Barclays Capital U.S. Aggregate Index represents the U.S. investment-grade fixed-rate bond market. This index is unmanaged, and its results include reinvested dividends and/or distributions, but do not reflect the effect of sales charges, commissions, expenses or taxes.
Citigroup Broad Investment-Grade Bond Index is a market capitalization-weighted index that includes fixed-rate U.S. Treasury, government-sponsored, mortgage, asset-backed and investment-grade corporates with a maturity of one year or longer. This index is unmanaged, and its results include reinvested dividends and/or distributions, but do not reflect the effect of sales charges, commissions, expenses or taxes.
S&P 500 Index is a market capitalization-weighted price index composed of 500 widely held common stocks.
You cannot invest directly in an index.
The chart represents a hypothetical investment in the Fund. Performance data represents past performance and current performance could be higher or lower.
Performance information may reflect historical or current expense waivers/reimbursements from the investment adviser, without which performance would have been lower. For information on current expense waivers/reimbursements, please see the prospectus.
The value of the Fund will fluctuate so that when redeemed, it may be worth more or less than the original investment. The chart and table do not reflect the deductions of taxes, sales charges or other fees which may be applied at the variable life insurance, variable annuity or qualified retirement plan product level. Any such additional sales charges or other fees or expenses would lower the contract’s or plan’s performance.
How did the Fund perform?
The Class IB Shares of the American Funds Asset Allocation HLS Fund returned 1.02% for the twelve-month period ended December 31, 2011 versus the returns of 2.09% for the S&P 500 Index, 7.85% for the Citigroup Broad Investment-Grade Bond Index and 7.84% for the Barclays Capital U.S. Aggregate Index. The Fund outperformed the -1.47% average return of the Lipper Mixed Asset Target Allocation Growth Funds VP-UF peer group, a group of funds with investment strategies similar to those of the Fund.
The performance of the American Funds Asset Allocation HLS Fund is directly related to the performance of the American Funds Insurance Series – Asset Allocation Fund Class 1, in which the Fund invests. The financial statements of the American Funds Insurance Series – Asset Allocation Fund Class 1, including the Schedule of Investments, are provided in the accompanying report and should be read in conjunction with the American Funds Asset Allocation HLS Fund’s financial statements.
American Funds Blue Chip Income and Growth HLS Fund inception 4/30/2008
(advised by HL Investment Advisors, LLC)
| Investment Goal: Seeks to produce income exceeding the average yield on U.S. stocks generally and to provide an opportunity for growth of principal consistent with sound common stock investing. |
| |
Performance Overview 4/30/08 - 12/31/11

Average Annual Total Returns (as of 12/31/11)
| | 1 Year | Since Inception |
| American Funds Blue Chip Income and Growth HLS Fund IB | -1.19% | -1.39% |
| S&P 500 Index | 2.09% | -0.39% |
PAST PERFORMANCE IS NOT INDICATIVE OF FUTURE RESULTS.
Total returns presented above were calculated using the Fund's net asset value available to shareholders for sale or redemption of Fund shares on December 31, 2011, which excludes investment transactions as of this date.
S&P 500 Index is a market capitalization-weighted price index composed of 500 widely held common stocks.
You cannot invest directly in an index.
The chart represents a hypothetical investment in the Fund. Performance data represents past performance and current performance could be higher or lower.
Performance information may reflect historical or current expense waivers/reimbursements from the investment adviser, without which performance would have been lower. For information on current expense waivers/reimbursements, please see the prospectus.
The value of the Fund will fluctuate so that when redeemed, it may be worth more or less than the original investment. The chart and table do not reflect the deductions of taxes, sales charges or other fees which may be applied at the variable life insurance, variable annuity or qualified retirement plan product level. Any such additional sales charges or other fees or expenses would lower the contract’s or plan’s performance.
How did the Fund perform?
The Class IB Shares of the American Funds Blue Chip Income and Growth HLS Fund returned -1.19% for the twelve-month period ended December 31, 2011, versus the return of 2.09% for the S&P 500 Index. The Fund underperformed the -1.01% average return of the Lipper Large Cap Core Funds VP-UF peer group, a group of funds with investment strategies similar to those of the Fund.
The performance of the American Funds Blue Chip Income and Growth HLS Fund is directly related to the performance of the American Funds Insurance Series – Blue Chip Income and Growth Fund Class 1, in which the Fund invests. The financial statements of the American Funds Insurance Series – Blue Chip Income and Growth Fund Class 1, including the Schedule of Investments, are provided in the accompanying report and should be read in conjunction with the American Funds Blue Chip Income and Growth HLS Fund’s financial statements.
American Funds Bond HLS Fund inception 4/30/2008
(advised by HL Investment Advisors, LLC)
| Investment Goal: Seeks to maximize current income and preservation of capital. |
| |
Performance Overview 4/30/08 - 12/31/11

Average Annual Total Returns (as of 12/31/11)
| | 1 Year | Since Inception |
| American Funds Bond HLS Fund IB | 5.84% | 3.44% |
| Barclays Capital U.S. Aggregate Index | 7.84% | 6.41% |
PAST PERFORMANCE IS NOT INDICATIVE OF FUTURE RESULTS.
Total returns presented above were calculated using the Fund's net asset value available to shareholders for sale or redemption of Fund shares on December 31, 2011, which excludes investment transactions as of this date.
Barclays Capital U.S. Aggregate Index represents the U.S. investment-grade fixed-rate bond market. This index is unmanaged, and its results include reinvested dividends and/or distributions, but do not reflect the effect of sales charges, commissions, expenses or taxes.
You cannot invest directly in an index.
The chart represents a hypothetical investment in the Fund. Performance data represents past performance and current performance could be higher or lower.
Performance information may reflect historical or current expense waivers/reimbursements from the investment adviser, without which performance would have been lower. For information on current expense waivers/reimbursements, please see the prospectus.
The value of the Fund will fluctuate so that when redeemed, it may be worth more or less than the original investment. The chart and table do not reflect the deductions of taxes, sales charges or other fees which may be applied at the variable life insurance, variable annuity or qualified retirement plan product level. Any such additional sales charges or other fees or expenses would lower the contract’s or plan’s performance.
How did the Fund perform?
The Class IB Shares of the American Funds Bond HLS Fund returned 5.84% for the twelve-month period ended December 31, 2011, versus the return of 7.84% for the Barclays Capital U.S. Aggregate Index. The Fund underperformed the 6.80% average return of the Lipper Corporate Debt Funds BBB-Rated VP-UF peer group, a group of funds with investment strategies similar to those of the Fund.
The performance of the American Funds Bond HLS Fund is directly related to the performance of the American Funds Insurance Series – Bond Fund Class 1, in which the Fund invests. The financial statements of the American Funds Insurance Series – Bond Fund Class 1, including the Schedule of Investments, are provided in the accompanying report and should be read in conjunction with the American Funds Bond HLS Fund’s financial statements.
American Funds Global Bond HLS Fund inception 4/30/2008
(advised by HL Investment Advisors, LLC)
| Investment Goal: Seeks a high level of total return over the long term. |
| |
Performance Overview 4/30/08 - 12/31/11

Average Annual Total Returns (as of 12/31/11)
| | 1 Year | Since Inception |
| American Funds Global Bond HLS Fund IB | 4.28% | 4.57% |
| Barclays Capital Global Aggregate Index | 5.64% | 4.96% |
PAST PERFORMANCE IS NOT INDICATIVE OF FUTURE RESULTS.
Total returns presented above were calculated using the Fund's net asset value available to shareholders for sale or redemption of Fund shares on December 31, 2011, which excludes investment transactions as of this date.
Barclays Capital Global Aggregate Index represents the global investment-grade fixed-income markets. This index is unmanaged and its results include reinvested dividends and/or distributions, but do not reflect the effect of sales charges, commissions, expenses or taxes.
You cannot invest directly in an index.
The chart represents a hypothetical investment in the Fund. Performance data represents past performance and current performance could be higher or lower.
Performance information may reflect historical or current expense waivers/reimbursements from the investment adviser, without which performance would have been lower. For information on current expense waivers/reimbursements, please see the prospectus.
The value of the Fund will fluctuate so that when redeemed, it may be worth more or less than the original investment. The chart and table do not reflect the deductions of taxes, sales charges or other fees which may be applied at the variable life insurance, variable annuity or qualified retirement plan product level. Any such additional sales charges or other fees or expenses would lower the contract’s or plan’s performance.
How did the Fund perform?
The Class IB Shares of the American Funds Global Bond HLS Fund returned 4.28% for the twelve-month period ended December 31, 2011, versus the return of 5.64% for the Barclays Capital Global Aggregate Index. The Fund outperformed the 3.94% average return of the Lipper Global Income Funds VP-UF peer group, a group of funds with investment strategies similar to those of the Fund.
The performance of the American Funds Global Bond HLS Fund is directly related to the performance of the American Funds Insurance Series – Global Bond Fund Class 1, in which the Fund invests. The financial statements of the American Funds Insurance Series – Global Bond Fund Class 1, including the Schedule of Investments, are provided in the accompanying report and should be read in conjunction with the American Funds Global Bond HLS Fund’s financial statements.
American Funds Global Growth and Income HLS Fund inception 4/30/2008
(advised by HL Investment Advisors, LLC)
| Investment Goal: Seeks growth of capital over time and current income. |
| |
Performance Overview 4/30/08 - 12/31/11

Average Annual Total Returns (as of 12/31/11)
| | 1 Year | Since Inception |
| American Funds Global Growth and Income HLS Fund IB | -5.19% | -3.08% |
| MSCI World Index | -5.02% | -3.78% |
PAST PERFORMANCE IS NOT INDICATIVE OF FUTURE RESULTS.
Total returns presented above were calculated using the Fund's net asset value available to shareholders for sale or redemption of Fund shares on December 31, 2011, which excludes investment transactions as of this date.
MSCI World Index is a free float-adjusted market capitalization index that is designed to measure global-developed market equity performance. The index consists of 23 developed-market country indices, including the United States. This index is unmanaged, and its results include reinvested dividends and/or distributions, but do not reflect the effect of sales charges, commissions, expenses or taxes.
You cannot invest directly in an index.
The chart represents a hypothetical investment in the Fund. Performance data represents past performance and current performance could be higher or lower.
Performance information may reflect historical or current expense waivers/reimbursements from the investment adviser, without which performance would have been lower. For information on current expense waivers/reimbursements, please see the prospectus.
The value of the Fund will fluctuate so that when redeemed, it may be worth more or less than the original investment. The chart and table do not reflect the deductions of taxes, sales charges or other fees which may be applied at the variable life insurance, variable annuity or qualified retirement plan product level. Any such additional sales charges or other fees or expenses would lower the contract’s or plan’s performance.
How did the Fund perform?
The Class IB Shares of the American Funds Global Growth and Income HLS Fund returned -5.19% for the twelve-month period ended December 31, 2011, versus the return of -5.02% for the MSCI World Index. The Fund outperformed the -8.05% average return of the Lipper Global Core Funds VP-UF peer group, a group of funds with investment strategies similar to those of the Fund.
The performance of the American Funds Global Growth and Income HLS Fund is directly related to the performance of the American Funds Insurance Series – Global Growth and Income Fund Class 1, in which the Fund invests. The financial statements of the American Funds Insurance Series – Global Growth and Income Fund Class 1, including the Schedule of Investments, are provided in the accompanying report and should be read in conjunction with the American Funds Global Growth and Income HLS Fund’s financial statements.
American Funds Global Growth HLS Fund inception 4/30/2008
(advised by HL Investment Advisors, LLC)
| Investment Goal: Seeks long-term growth of capital. |
| |
Performance Overview 4/30/08 - 12/31/11
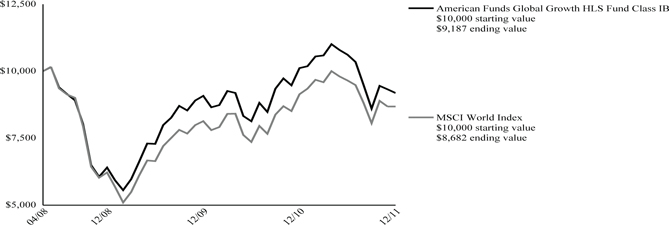
Average Annual Total Returns (as of 12/31/11)
| | 1 Year | Since Inception |
| American Funds Global Growth HLS Fund IB | -9.18% | -2.28% |
| MSCI World Index | -5.02% | -3.78% |
PAST PERFORMANCE IS NOT INDICATIVE OF FUTURE RESULTS.
Total returns presented above were calculated using the Fund's net asset value available to shareholders for sale or redemption of Fund shares on December 31, 2011, which excludes investment transactions as of this date.
MSCI World Index is a free float-adjusted market capitalization index that is designed to measure global-developed market equity performance. The index consists of 23 developed-market country indices, including the United States. This index is unmanaged, and its results include reinvested dividends and/or distributions, but do not reflect the effect of sales charges, commissions, expenses or taxes.
You cannot invest directly in an index.
The chart represents a hypothetical investment in the Fund. Performance data represents past performance and current performance could be higher or lower.
Performance information may reflect historical or current expense waivers/reimbursements from the investment adviser, without which performance would have been lower. For information on current expense waivers/reimbursements, please see the prospectus.
The value of the Fund will fluctuate so that when redeemed, it may be worth more or less than the original investment. The chart and table do not reflect the deductions of taxes, sales charges or other fees which may be applied at the variable life insurance, variable annuity or qualified retirement plan product level. Any such additional sales charges or other fees or expenses would lower the contract’s or plan’s performance.
How did the Fund perform?
The Class IB Shares of the American Funds Global Growth HLS Fund returned -9.18% for the twelve-month period ended December 31, 2011, versus the return of -5.02% for the MSCI World Index. The Fund outperformed the -9.54% average return of the Lipper Global Growth Funds VP-UF peer group, a group of funds with investment strategies similar to those of the Fund.
The performance of the American Funds Global Growth HLS Fund is directly related to the performance of the American Funds Insurance Series – Global Growth Fund Class 1, in which the Fund invests. The financial statements of the American Funds Insurance Series – Global Growth Fund Class 1, including the Schedule of Investments, are provided in the accompanying report and should be read in conjunction with the American Funds Global Growth HLS Fund’s financial statements.
American Funds Global Small Capitalization HLS Fund inception 4/30/2008
(advised by HL Investment Advisors, LLC)
| Investment Goal: Seeks growth of capital over time. |
| |
Performance Overview 4/30/08 - 12/31/11
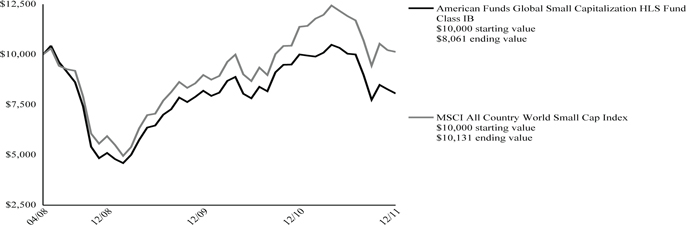
Average Annual Total Returns (as of 12/31/11)
| | 1 Year | Since Inception |
| American Funds Global Small Capitalization HLS Fund IB | -19.40% | -5.70% |
| MSCI All Country World Small Cap Index | -10.96% | 0.35% |
PAST PERFORMANCE IS NOT INDICATIVE OF FUTURE RESULTS.
Total returns presented above were calculated using the Fund's net asset value available to shareholders for sale or redemption of Fund shares on December 31, 2011, which excludes investment transactions as of this date.
MSCI All Country World Small Cap Index is a free float-adjusted market capitalization-weighted index that is designed to measure equity market performance of smaller capitalization companies in both developed and emerging markets. This index is unmanaged and its results include reinvested dividends and/or distributions, but do not reflect the effect of sales charges, commissions, expenses or taxes.
You cannot invest directly in an index.
The chart represents a hypothetical investment in the Fund. Performance data represents past performance and current performance could be higher or lower.
Performance information may reflect historical or current expense waivers/reimbursements from the investment adviser, without which performance would have been lower. For information on current expense waivers/reimbursements, please see the prospectus.
The value of the Fund will fluctuate so that when redeemed, it may be worth more or less than the original investment. The chart and table do not reflect the deductions of taxes, sales charges or other fees which may be applied at the variable life insurance, variable annuity or qualified retirement plan product level. Any such additional sales charges or other fees or expenses would lower the contract’s or plan’s performance.
How did the Fund perform?
The Class IB Shares of the American Funds Global Small Capitalization HLS Fund returned -19.40% for the twelve-month period ended December 31, 2011, versus the return of -10.96% for the MSCI All Country World Small Cap Index. The Fund underperformed the -9.54% average return of the Lipper Global Growth Funds VP-UF peer group, a group of funds with investment strategies similar to those of the Fund.
The performance of the American Funds Global Small Capitalization HLS Fund is directly related to the performance of the American Funds Insurance Series – Global Small Capitalization Fund Class 1, in which the Fund invests. The financial statements of the American Funds Insurance Series – Global Small Capitalization Fund Class 1, including the Schedule of Investments, are provided in the accompanying report and should be read in conjunction with the American Funds Global Small Capitalization HLS Fund’s financial statements.
American Funds Growth HLS Fund inception 4/30/2008
(advised by HL Investment Advisors, LLC)
| Investment Goal: Seeks growth of capital. |
| |
Performance Overview 4/30/08 - 12/31/11
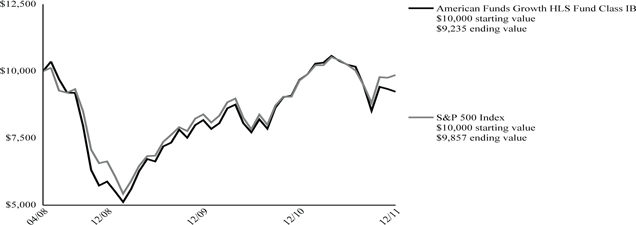
Average Annual Total Returns (as of 12/31/11)
| | 1 Year | Since Inception |
| American Funds Growth HLS Fund IB | -4.57% | -2.14% |
| S&P 500 Index | 2.09% | -0.39% |
PAST PERFORMANCE IS NOT INDICATIVE OF FUTURE RESULTS.
Total returns presented above were calculated using the Fund's net asset value available to shareholders for sale or redemption of Fund shares on December 31, 2011, which excludes investment transactions as of this date.
S&P 500 Index is a market capitalization-weighted price index composed of 500 widely held common stocks.
You cannot invest directly in an index.
The chart represents a hypothetical investment in the Fund. Performance data represents past performance and current performance could be higher or lower.
Performance information may reflect historical or current expense waivers/reimbursements from the investment adviser, without which performance would have been lower. For information on current expense waivers/reimbursements, please see the prospectus.
The value of the Fund will fluctuate so that when redeemed, it may be worth more or less than the original investment. The chart and table do not reflect the deductions of taxes, sales charges or other fees which may be applied at the variable life insurance, variable annuity or qualified retirement plan product level. Any such additional sales charges or other fees or expenses would lower the contract’s or plan’s performance.
How did the Fund perform?
The Class IB Shares of the American Funds Growth HLS Fund returned -4.57% for the twelve-month period ended December 31, 2011, versus the return of 2.09% for the S&P 500 Index. The Fund underperformed the -2.38% average return of the Lipper Large Cap Growth Funds VP-UF peer group, a group of funds with investment strategies similar to those of the Fund.
The performance of the American Funds Growth HLS Fund is directly related to the performance of the American Funds Insurance Series – Growth Fund Class 1, in which the Fund invests. The financial statements of the American Funds Insurance Series – Growth Fund Class 1, including the Schedule of Investments, are provided in the accompanying report and should be read in conjunction with the American Funds Growth HLS Fund’s financial statements.
American Funds Growth-Income HLS Fund inception 4/30/2008
(advised by HL Investment Advisors, LLC)
| Investment Goal: Seeks long-term growth of capital and income over time. |
| |
Performance Overview 4/30/08 - 12/31/11

Average Annual Total Returns (as of 12/31/11)
| | 1 Year | Since Inception |
| American Funds Growth-Income HLS Fund IB | -2.12% | -2.09% |
| S&P 500 Index | 2.09% | -0.39% |
PAST PERFORMANCE IS NOT INDICATIVE OF FUTURE RESULTS.
Total returns presented above were calculated using the Fund's net asset value available to shareholders for sale or redemption of Fund shares on December 31, 2011, which excludes investment transactions as of this date.
S&P 500 Index is a market capitalization-weighted price index composed of 500 widely held common stocks.
You cannot invest directly in an index.
The chart represents a hypothetical investment in the Fund. Performance data represents past performance and current performance could be higher or lower.
Performance information may reflect historical or current expense waivers/reimbursements from the investment adviser, without which performance would have been lower. For information on current expense waivers/reimbursements, please see the prospectus.
The value of the Fund will fluctuate so that when redeemed, it may be worth more or less than the original investment. The chart and table do not reflect the deductions of taxes, sales charges or other fees which may be applied at the variable life insurance, variable annuity or qualified retirement plan product level. Any such additional sales charges or other fees or expenses would lower the contract’s or plan’s performance.
How did the Fund perform?
The Class IB Shares of the American Funds Growth-Income HLS Fund returned -2.12% for the twelve-month period ended December 31, 2011, versus the return of 2.09% for the S&P 500 Index. The Fund underperformed the -1.01% average return of the Lipper Large Cap Core Funds VP-UF peer group, a group of funds with investment strategies similar to those of the Fund.
The performance of the American Funds Growth-Income HLS Fund is directly related to the performance of the American Funds Insurance Series – Growth-Income Fund Class 1, in which the Fund invests. The financial statements of the American Funds Insurance Series – Growth-Income Fund Class 1, including the Schedule of Investments, are provided in the accompanying report and should be read in conjunction with the American Funds Growth-Income HLS Fund’s financial statements.
American Funds International HLS Fund inception 4/30/2008
(advised by HL Investment Advisors, LLC)
| Investment Goal: Seeks long-term growth of capital over time. |
| |
Performance Overview 4/30/08 - 12/31/11
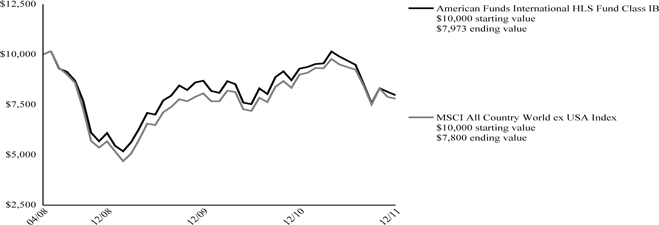
Average Annual Total Returns (as of 12/31/11)
| | 1 Year | Since Inception |
| American Funds International HLS Fund IB | -14.23% | -5.99% |
| MSCI All Country World ex USA Index | -13.33% | -6.55% |
PAST PERFORMANCE IS NOT INDICATIVE OF FUTURE RESULTS.
Total returns presented above were calculated using the Fund's net asset value available to shareholders for sale or redemption of Fund shares on December 31, 2011, which excludes investment transactions as of this date.
MSCI All Country World ex USA Index is a broad-based, unmanaged, market capitalization weighted, total return index that measures the performance of both developed and emerging stock markets, excluding the U.S. The index is calculated to exclude companies and share classes which cannot be freely purchased by foreigners.
You cannot invest directly in an index.
The chart represents a hypothetical investment in the Fund. Performance data represents past performance and current performance could be higher or lower.
Performance information may reflect historical or current expense waivers/reimbursements from the investment adviser, without which performance would have been lower. For information on current expense waivers/reimbursements, please see the prospectus.
The value of the Fund will fluctuate so that when redeemed, it may be worth more or less than the original investment. The chart and table do not reflect the deductions of taxes, sales charges or other fees which may be applied at the variable life insurance, variable annuity or qualified retirement plan product level. Any such additional sales charges or other fees or expenses would lower the contract’s or plan’s performance.
How did the Fund perform?
The Class IB Shares of the American Funds International HLS Fund returned -14.23% for the twelve-month period ended December 31, 2011, versus the return of -13.33% for the MSCI All Country World ex USA Index. The Fund underperformed the -13.08% average return of the Lipper International Core Funds VP-UF peer group, a group of funds with investment strategies similar to those of the Fund.
The performance of the American Funds International HLS Fund is directly related to the performance of the American Funds Insurance Series – International Fund Class 1, in which the Fund invests. The financial statements of the American Funds Insurance Series – International Fund Class 1, including the Schedule of Investments, are provided in the accompanying report and should be read in conjunction with the American Funds International HLS Fund’s financial statements.
American Funds New World HLS Fund inception 4/30/2008
(advised by HL Investment Advisors, LLC)
| Investment Goal: Seeks long-term capital appreciation. |
| |
Performance Overview 4/30/08 - 12/31/11
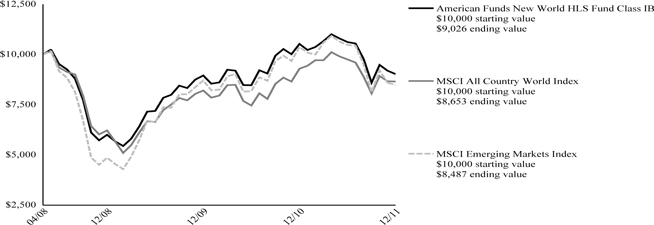
Average Annual Total Returns (as of 12/31/11)
| | 1 Year | Since Inception |
| American Funds New World HLS Fund IB | -14.23% | -2.75% |
| MSCI All Country World Index | -6.86% | -3.86% |
| MSCI Emerging Markets Index | -18.17% | -4.37% |
PAST PERFORMANCE IS NOT INDICATIVE OF FUTURE RESULTS.
Total returns presented above were calculated using the Fund's net asset value available to shareholders for sale or redemption of Fund shares on December 31, 2011, which excludes investment transactions as of this date.
MSCI All Country World Index is a free float-adjusted market capitalization index that measures equity market performance in the global developed and emerging markets, consisting of 45 developed and emerging market country indices. This index is unmanaged, and its results include reinvested dividends and/or distributions, but do not reflect the effect of sales charges, commissions, expenses or taxes.
MSCI Emerging Markets Index is a free float-adjusted market capitalization-weighted index that is designed to measure equity market performance in the global emerging markets, consisting of 24 emerging market country indices. This index is unmanaged and its results include reinvested dividends and/or distributions, but do not reflect the effect of sales charges, commissions, expenses or taxes.
You cannot invest directly in an index.
The chart represents a hypothetical investment in the Fund. Performance data represents past performance and current performance could be higher or lower.
Performance information may reflect historical or current expense waivers/reimbursements from the investment adviser, without which performance would have been lower. For information on current expense waivers/reimbursements, please see the prospectus.
The value of the Fund will fluctuate so that when redeemed, it may be worth more or less than the original investment. The chart and table do not reflect the deductions of taxes, sales charges or other fees which may be applied at the variable life insurance, variable annuity or qualified retirement plan product level. Any such additional sales charges or other fees or expenses would lower the contract’s or plan’s performance.
How did the Fund perform?
The Class IB Shares of the American Funds New World HLS Fund returned -14.23% for the twelve-month period ended December 31, 2011, versus the returns of -6.86% for the MSCI All Country World Index and -18.17% for the MSCI Emerging Markets Index. The Fund outperformed the -19.43% average return of the Lipper Emerging Markets Funds VP-UF peer group, a group of funds with investment strategies similar to those of the Fund.
The performance of the American Funds New World HLS Fund is directly related to the performance of the American Funds Insurance Series – New World Fund Class 1, in which the Fund invests. The financial statements of the American Funds Insurance Series – New World Fund Class 1, including the Schedule of Investments, are provided in the accompanying report and should be read in conjunction with the American Funds New World HLS Fund’s financial statements.
| American Funds Asset Allocation HLS Fund |
| Schedule of Investments |
| December 31, 2011 |
| (000’s Omitted) |
| Shares | | | | | | Market Value ╪ | |
| INVESTMENT COMPANIES - 100.0% | | | | | | | | |
| | 3,981 | | | American Funds Insurance Series - Asset Allocation Fund Class 1 | | | | | | $ | 64,374 | |
| | | | | | | | | | | | | |
| | | | | Total investment companies | | | | | | | | |
| | | | | (cost $55,632) | | | | | | $ | 64,374 | |
| | | | | | | | | | | | | |
| | | | | Total investments | | | | | | | | |
| | | | | (cost $55,632) ▲ | | | 100.0 | % | | $ | 64,374 | |
| | | | | Other assets and liabilities | | | — | % | | | (18 | ) |
| | | | | Total net assets | | | 100.0 | % | | $ | 64,356 | |
| Note: | Percentage of investments as shown is the ratio of the total market value to total net assets. |
| ▲ | At December 31, 2011, the cost of securities for federal income tax purposes was $57,463 and the aggregate gross unrealized appreciation and depreciation based on that cost were: |
| Unrealized Appreciation | | $ | 6,911 | |
| Unrealized Depreciation | | | — | |
| Net Unrealized Appreciation | | $ | 6,911 | |
| ╪ | See Significant Accounting Policies of accompanying Notes to Financial Statements regarding valuation of securities. |
At December 31, 2011, the investment valuation hierarchy levels were:
| Assets: | | | | |
| Investment in Securities - Level 1 | | $ | 64,374 | |
| Total | | $ | 64,374 | |
| American Funds Blue Chip Income and Growth HLS Fund |
| Schedule of Investments |
| December 31, 2011 |
| (000’s Omitted) |
| Shares | | | | | | Market Value ╪ | |
| INVESTMENT COMPANIES - 100.0% | | | | | | | | |
| | 3,604 | | | American Funds Insurance Series - Blue Chip Income and Growth Fund Class 1 | | | | | | $ | 32,439 | |
| | | | | | | | | | | | | |
| | | | | Total investment companies | | | | | | | | |
| | | | | (cost $26,345) | | | | | | $ | 32,439 | |
| | | | | | | | | | | | | |
| | | | | Total investments | | | | | | | | |
| | | | | (cost $26,345) ▲ | | | 100.0 | % | | $ | 32,439 | |
| | | | | Other assets and liabilities | | | — | % | | | (14 | ) |
| | | | | Total net assets | | | 100.0 | % | | $ | 32,425 | |
| Note: | Percentage of investments as shown is the ratio of the total market value to total net assets. |
| ▲ | At December 31, 2011, the cost of securities for federal income tax purposes was $27,352 and the aggregate gross unrealized appreciation and depreciation based on that cost were: |
| Unrealized Appreciation | | $ | 5,087 | |
| Unrealized Depreciation | | | — | |
| Net Unrealized Appreciation | | $ | 5,087 | |
| ╪ | See Significant Accounting Policies of accompanying Notes to Financial Statements regarding valuation of securities. |
At December 31, 2011, the investment valuation hierarchy levels were:
| Assets: | | | | |
| Investment in Securities - Level 1 | | $ | 32,439 | |
| Total | | $ | 32,439 | |
The accompanying notes are an integral part of these financial statements.
| American Funds Bond HLS Fund |
| Schedule of Investments |
| December 31, 2011 |
| (000’s Omitted) |
| Shares | | | | | | Market Value ╪ | |
| INVESTMENT COMPANIES - 100.0% | | | | | | | | |
| | 18,038 | | | American Funds Insurance Series - Bond Fund Class 1 | | | | | | $ | 198,237 | |
| | | | | | | | | | | | | |
| | | | | Total investment companies | | | | | | | | |
| | | | | (cost $185,750) | | | | | | $ | 198,237 | |
| | | | | | | | | | | | | |
| | | | | Total investments | | | | | | | | |
| | | | | (cost $185,750) ▲ | | | 100.0 | % | | $ | 198,237 | |
| | | | | Other assets and liabilities | | | — | % | | | (34 | ) |
| | | | | Total net assets | | | 100.0 | % | | $ | 198,203 | |
| Note: | Percentage of investments as shown is the ratio of the total market value to total net assets. |
| ▲ | At December 31, 2011, the cost of securities for federal income tax purposes was $186,677 and the aggregate gross unrealized appreciation and depreciation based on that cost were: |
| Unrealized Appreciation | | $ | 11,560 | |
| Unrealized Depreciation | | | — | |
| Net Unrealized Appreciation | | $ | 11,560 | |
| ╪ | See Significant Accounting Policies of accompanying Notes to Financial Statements regarding valuation of securities. |
At December 31, 2011, the investment valuation hierarchy levels were:
| Assets: | | | | |
| Investment in Securities - Level 1 | | $ | 198,237 | |
| Total | | $ | 198,237 | |
| American Funds Global Bond HLS Fund |
| Schedule of Investments |
| December 31, 2011 |
| (000’s Omitted) |
| Shares | | | | | | Market Value ╪ | |
| INVESTMENT COMPANIES - 100.0% | | | | | | | | |
| | 3,710 | | | American Funds Insurance Series - Global Bond Fund Class 1 | | | | | | $ | 44,367 | |
| | | | | | | | | | | | | |
| | | | | Total investment companies | | | | | | | | |
| | | | | (cost $41,981) | | | | | | $ | 44,367 | |
| | | | | | | | | | | | | |
| | | | | Total investments | | | | | | | | |
| | | | | (cost $41,981) ▲ | | | 100.0 | % | | $ | 44,367 | |
| | | | | Other assets and liabilities | | | — | % | | | (15 | ) |
| | | | | Total net assets | | | 100.0 | % | | $ | 44,352 | |
| Note: | Percentage of investments as shown is the ratio of the total market value to total net assets. |
| ▲ | At December 31, 2011, the cost of securities for federal income tax purposes was $42,131 and the aggregate gross unrealized appreciation and depreciation based on that cost were: |
| Unrealized Appreciation | | $ | 2,236 | |
| Unrealized Depreciation | | | — | |
| Net Unrealized Appreciation | | $ | 2,236 | |
| ╪ | See Significant Accounting Policies of accompanying Notes to Financial Statements regarding valuation of securities. |
At December 31, 2011, the investment valuation hierarchy levels were:
| Assets: | | | | |
| Investment in Securities - Level 1 | | $ | 44,367 | |
| Total | | $ | 44,367 | |
The accompanying notes are an integral part of these financial statements.
| American Funds Global Growth and Income HLS Fund |
| Schedule of Investments |
| December 31, 2011 |
| (000’s Omitted) |
| Shares | | | | | | Market Value ╪ | |
| INVESTMENT COMPANIES - 100.0% | | | | | | | | |
| | 8,550 | | | American Funds Insurance Series - Global Growth and Income Fund Class 1 | | | | | | $ | 78,658 | |
| | | | | | | | | | | | | |
| | | | | Total investment companies | | | | | | | | |
| | | | | (cost $64,606) | | | | | | $ | 78,658 | |
| | | | | | | | | | | | | |
| | | | | Total investments | | | | | | | | |
| | | | | (cost $64,606) ▲ | | | 100.0 | % | | $ | 78,658 | |
| | | | | Other assets and liabilities | | | — | % | | | (19 | ) |
| | | | | Total net assets | | | 100.0 | % | | $ | 78,639 | |
| Note: | Percentage of investments as shown is the ratio of the total market value to total net assets. |
| ▲ | At December 31, 2011, the cost of securities for federal income tax purposes was $66,491 and the aggregate gross unrealized appreciation and depreciation based on that cost were: |
| Unrealized Appreciation | | $ | 12,167 | |
| Unrealized Depreciation | | | — | |
| Net Unrealized Appreciation | | $ | 12,167 | |
| ╪ | See Significant Accounting Policies of accompanying Notes to Financial Statements regarding valuation of securities. |
At December 31, 2011, the investment valuation hierarchy levels were:
| Assets: | | | | |
| Investment in Securities - Level 1 | | $ | 78,658 | |
| Total | | $ | 78,658 | |
| American Funds Global Growth HLS Fund |
| Schedule of Investments |
| December 31, 2011 |
| (000’s Omitted) |
| Shares | | | | | | Market Value ╪ | |
| INVESTMENT COMPANIES - 100.0% | | | | | | | | |
| | 1,512 | | | American Funds Insurance Series - Global Growth Fund Class 1 | | | | | | $ | 29,332 | |
| | | | | | | | | | | | | |
| | | | | Total investment companies | | | | | | | | |
| | | | | (cost $25,408) | | | | | | $ | 29,332 | |
| | | | | | | | | | | | | |
| | | | | Total investments | | | | | | | | |
| | | | | (cost $25,408) ▲ | | | 100.0 | % | | $ | 29,332 | |
| | | | | Other assets and liabilities | | | — | % | | | (13 | ) |
| | | | | Total net assets | | | 100.0 | % | | $ | 29,319 | |
| Note: | Percentage of investments as shown is the ratio of the total market value to total net assets. |
| ▲ | At December 31, 2011, the cost of securities for federal income tax purposes was $27,001 and the aggregate gross unrealized appreciation and depreciation based on that cost were: |
| Unrealized Appreciation | | $ | 2,331 | |
| Unrealized Depreciation | | | — | |
| Net Unrealized Appreciation | | $ | 2,331 | |
| ╪ | See Significant Accounting Policies of accompanying Notes to Financial Statements regarding valuation of securities. |
At December 31, 2011, the investment valuation hierarchy levels were:
| Assets: | | | | |
| Investment in Securities - Level 1 | | $ | 29,332 | |
| Total | | $ | 29,332 | |
The accompanying notes are an integral part of these financial statements.
| American Funds Global Small Capitalization HLS Fund |
| Schedule of Investments |
| December 31, 2011 |
| (000’s Omitted) |
| Shares | | | | | | Market Value ╪ | |
| INVESTMENT COMPANIES - 100.0% | | | | | | | | |
| | 3,220 | | | American Funds Insurance Series - Global Small Capitalization Fund Class 1 | | | | | | $ | 55,676 | |
| | | | | | | | | | | | | |
| | | | | Total investment companies | | | | | | | | |
| | | | | (cost $48,391) | | | | | | $ | 55,676 | |
| | | | | | | | | | | | | |
| | | | | Total investments | | | | | | | | |
| | | | | (cost $48,391) ▲ | | | 100.0 | % | | $ | 55,676 | |
| | | | | Other assets and liabilities | | | — | % | | | (18 | ) |
| | | | | Total net assets | | | 100.0 | % | | $ | 55,658 | |
| Note: | Percentage of investments as shown is the ratio of the total market value to total net assets. |
| ▲ | At December 31, 2011, the cost of securities for federal income tax purposes was $50,804 and the aggregate gross unrealized appreciation and depreciation based on that cost were: |
| Unrealized Appreciation | | $ | 4,872 | |
| Unrealized Depreciation | | | — | |
| Net Unrealized Appreciation | | $ | 4,872 | |
| ╪ | See Significant Accounting Policies of accompanying Notes to Financial Statements regarding valuation of securities. |
At December 31, 2011, the investment valuation hierarchy levels were:
| Assets: | | | | |
| Investment in Securities - Level 1 | | $ | 55,676 | |
| Total | | $ | 55,676 | |
| American Funds Growth HLS Fund |
| Schedule of Investments |
| December 31, 2011 |
| (000’s Omitted) |
| Shares | | | | | | Market Value ╪ | |
| INVESTMENT COMPANIES - 100.0% | | | | | | | | |
| | 6,107 | | | American Funds Insurance Series - Growth Fund Class 1 | | | | | | $ | 318,017 | |
| | | | | | | | | | | | | |
| | | | | Total investment companies | | | | | | | | |
| | | | | (cost $239,197) | | | | | | $ | 318,017 | |
| | | | | | | | | | | | | |
| | | | | Total investments | | | | | | | | |
| | | | | (cost $239,197) ▲ | | | 100.0 | % | | $ | 318,017 | |
| | | | | Other assets and liabilities | | | — | % | | | (49 | ) |
| | | | | Total net assets | | | 100.0 | % | | $ | 317,968 | |
| Note: | Percentage of investments as shown is the ratio of the total market value to total net assets. |
| ▲ | At December 31, 2011, the cost of securities for federal income tax purposes was $248,340 and the aggregate gross unrealized appreciation and depreciation based on that cost were: |
| Unrealized Appreciation | | $ | 69,677 | |
| Unrealized Depreciation | | | — | |
| Net Unrealized Appreciation | | $ | 69,677 | |
| ╪ | See Significant Accounting Policies of accompanying Notes to Financial Statements regarding valuation of securities. |
At December 31, 2011, the investment valuation hierarchy levels were:
| Assets: | | | | |
| Investment in Securities - Level 1 | | $ | 318,017 | |
| Total | | $ | 318,017 | |
The accompanying notes are an integral part of these financial statements.
| American Funds Growth-Income HLS Fund |
| Schedule of Investments |
| December 31, 2011 |
| (000’s Omitted) |
| Shares | | | | | | | | Market Value ╪ | |
| INVESTMENT COMPANIES - 100.0% |
| | 5,112 | | | American Funds Insurance Series - Growth-Income Fund Class 1 | | | | | | $ | 170,089 | |
| | | | | | | | | | | | | |
| | | | | Total investment companies | | | | | | | | |
| | | | | (cost $139,488) | | | | | | $ | 170,089 | |
| | | | | | | | | | | | | |
| | | | | Total investments | | | | | | | | |
| | | | | (cost $139,488) ▲ | | | 100.0 | % | | $ | 170,089 | |
| | | | | Other assets and liabilities | | | — | % | | | (30 | ) |
| | | | | Total net assets | | | 100.0 | % | | $ | 170,059 | |
| Note: | Percentage of investments as shown is the ratio of the total market value to total net assets. |
| ▲ | At December 31, 2011, the cost of securities for federal income tax purposes was $143,238 and the aggregate gross unrealized appreciation and depreciation based on that cost were: |
| Unrealized Appreciation | | $ | 26,851 | |
| Unrealized Depreciation | | | — | |
| Net Unrealized Appreciation | | $ | 26,851 | |
| ╪ | See Significant Accounting Policies of accompanying Notes to Financial Statements regarding valuation of securities. |
| At December 31, 2011, the investment valuation hierarchy levels were: |
| Assets: | | | | |
| Investment in Securities - Level 1 | | $ | 170,089 | |
| Total | | $ | 170,089 | |
| American Funds International HLS Fund |
| Schedule of Investments |
| December 31, 2011 |
| (000’s Omitted) |
| Shares | | | | | | | | Market Value ╪ | |
| INVESTMENT COMPANIES - 100.0% |
| | 13,704 | | | American Funds Insurance Series - International Fund Class 1 | | | | | | $ | 208,435 | |
| | | | | | | | | | | | | |
| | | | | Total investment companies | | | | | | | | |
| | | | | (cost $198,006) | | | | | | $ | 208,435 | |
| | | | | | | | | | | | | |
| | | | | Total investments | | | | | | | | |
| | | | | (cost $198,006) ▲ | | | 100.0 | % | | $ | 208,435 | |
| | | | | Other assets and liabilities | | | — | % | | | (36 | ) |
| | | | | Total net assets | | | 100.0 | % | | $ | 208,399 | |
| Note: | Percentage of investments as shown is the ratio of the total market value to total net assets. |
| ▲ | At December 31, 2011, the cost of securities for federal income tax purposes was $203,685 and the aggregate gross unrealized appreciation and depreciation based on that cost were: |
| Unrealized Appreciation | | $ | 4,750 | |
| Unrealized Depreciation | | | — | |
| Net Unrealized Appreciation | | $ | 4,750 | |
| ╪ | See Significant Accounting Policies of accompanying Notes to Financial Statements regarding valuation of securities. |
| At December 31, 2011, the investment valuation hierarchy levels were: |
| Assets: | | | | |
| Investment in Securities - Level 1 | | $ | 208,435 | |
| Total | | $ | 208,435 | |
The accompanying notes are an integral part of these financial statements.
| American Funds New World HLS Fund |
| Schedule of Investments |
| December 31, 2011 |
| (000’s Omitted) |
| Shares | | | | | | | | Market Value ╪ | |
| INVESTMENT COMPANIES - 100.0% |
| | 2,676 | | | American Funds Insurance Series - New World Fund Class 1 | | | | | | $ | 52,586 | |
| | | | | | | | | | | | | |
| | | | | Total investment companies | | | | | | | | |
| | | | | (cost $46,287) | | | | | | $ | 52,586 | |
| | | | | | | | | | | | | |
| | | | | Total investments | | | | | | | | |
| | | | | (cost $46,287) ▲ | | | 100.0 | % | | $ | 52,586 | |
| | | | | Other assets and liabilities | | | — | % | | | (17 | ) |
| | | | | Total net assets | | | 100.0 | % | | $ | 52,569 | |
| Note: | Percentage of investments as shown is the ratio of the total market value to total net assets. |
| ▲ | At December 31, 2011, the cost of securities for federal income tax purposes was $48,350 and the aggregate gross unrealized appreciation and depreciation based on that cost were: |
| Unrealized Appreciation | | $ | 4,236 | |
| Unrealized Depreciation | | | — | |
| Net Unrealized Appreciation | | $ | 4,236 | |
| ╪ | See Significant Accounting Policies of accompanying Notes to Financial Statements regarding valuation of securities. |
| At December 31, 2011, the investment valuation hierarchy levels were: |
| Assets: | | | | |
| Investment in Securities - Level 1 | | $ | 52,586 | |
| Total | | $ | 52,586 | |
The accompanying notes are an integral part of these financial statements.
[This page is intentionally left blank]
| Hartford Series Fund, Inc. |
| Statements of Assets and Liabilities |
| December 31, 2011 |
| (000’s Omitted) |
| | | | | | American Funds | | | | |
| | | | | | Blue Chip | | | | |
| | | American Funds | | | Income and | | | American Funds | |
| | | Asset Allocation | | | Growth | | | Bond | |
| | | HLS Fund | | | HLS Fund | | | HLS Fund | |
| Assets: | | | | | | | | | | | | |
| Investments in underlying funds, at market value @ | | $ | 64,374 | | | $ | 32,439 | | | $ | 198,237 | |
| Receivables: | | | | | | | | | | | | |
| Investment securities sold | | | 42 | | | | — | | | | 218 | |
| Fund shares sold | | | 1 | | | | 23 | | | | 184 | |
| Other assets | | | 6 | | | | 3 | | | | 11 | |
| Total assets | | | 64,423 | | | | 32,465 | | | | 198,650 | |
| Liabilities: | | | | | | | | | | | | |
| Payables: | | | | | | | | | | | | |
| Investment securities purchased | | | — | | | | 6 | | | | — | |
| Fund shares redeemed | | | 42 | | | | 16 | | | | 398 | |
| Investment management fees | | | 9 | | | | 5 | | | | 22 | |
| Distribution fees | | | 4 | | | | 2 | | | | 11 | |
| Accrued expenses | | | 12 | | | | 11 | | | | 16 | |
| Total liabilities | | | 67 | | | | 40 | | | | 447 | |
| Net assets | | $ | 64,356 | | | $ | 32,425 | | | $ | 198,203 | |
| Summary of Net Assets: | | | | | | | | | | | | |
| Capital stock and paid-in-capital | | $ | 56,279 | | | $ | 26,604 | | | $ | 176,884 | |
| Undistributed net investment income | | | 1,026 | | | | 467 | | | | 5,360 | |
| Accumulated net realized gain (loss) | | | (1,691 | ) | | | (740 | ) | | | 3,472 | |
| Unrealized appreciation of investments | | | 8,742 | | | | 6,094 | | | | 12,487 | |
| Net assets | | $ | 64,356 | | | $ | 32,425 | | | $ | 198,203 | |
| Shares authorized | | | 200,000 | | | | 200,000 | | | | 200,000 | |
| Par value | | $ | 0.001 | | | $ | 0.001 | | | $ | 0.001 | |
| Class IB: Net asset value per share | | $ | 9.70 | | | $ | 9.07 | | | $ | 10.52 | |
| Shares outstanding | | | 6,634 | | | | 3,576 | | | | 18,835 | |
| Net assets | | $ | 64,356 | | | $ | 32,425 | | | $ | 198,203 | |
| @ Cost of underlying funds | | $ | 55,632 | | | $ | 26,345 | | | $ | 185,750 | |
The accompanying notes are an integral part of these financial statements.
| | | | American Funds | | | | | | American Funds | | | | | | | | | | | | | |
| American Funds | | | Global Growth | | | American Funds | | | Global Small | | | American Funds | | | American Funds | | | American Funds | | | American Funds | |
| Global Bond | | | and Income | | | Global Growth | | | Capitalization | | | Growth | | | Growth-Income | | | International | | | New World | |
| HLS Fund | | | HLS Fund | | | HLS Fund | | | HLS Fund | | | HLS Fund | | | HLS Fund | | | HLS Fund | | | HLS Fund | |
| | | | | | | | | | | | | | | | | | | | | | | |
| $ | 44,367 | | | $ | 78,658 | | | $ | 29,332 | | | $ | 55,676 | | | $ | 318,017 | | | $ | 170,089 | | | $ | 208,435 | | | $ | 52,586 | |
| | | | | | | | | | | | | | | | | | | | | | | | | | | | | | | |
| | 46 | | | | 72 | | | | 4 | | | | 2 | | | | — | | | | — | | | | 46 | | | | 197 | |
| | 3 | | | | 6 | | | | 2 | | | | 6 | | | | 184 | | | | 159 | | | | 86 | | | | 23 | |
| | 5 | | | | 9 | | | | 5 | | | | 7 | | | | 35 | | | | 17 | | | | 27 | | | | 10 | |
| | 44,421 | | | | 78,745 | | | | 29,343 | | | | 55,691 | | | | 318,236 | | | | 170,265 | | | | 208,594 | | | | 52,816 | |
| | | | | | | | | | | | | | | | | | | | | | | | | | | | | | | |
| | | | | | | | | | | | | | | | | | | | | | | | | | | | | | | |
| | — | | | | — | | | | — | | | | — | | | | 141 | | | | 109 | | | | — | | | | — | |
| | 48 | | | | 76 | | | | 5 | | | | 7 | | | | 38 | | | | 48 | | | | 128 | | | | 219 | |
| | 7 | | | | 14 | | | | 6 | | | | 10 | | | | 52 | | | | 26 | | | | 39 | | | | 13 | |
| | 3 | | | | 4 | | | | 2 | | | | 3 | | | | 18 | | | | 9 | | | | 11 | | | | 3 | |
| | 11 | | | | 12 | | | | 11 | | | | 13 | | | | 19 | | | | 14 | | | | 17 | | | | 12 | |
| | 69 | | | | 106 | | | | 24 | | | | 33 | | | | 268 | | | | 206 | | | | 195 | | | | 247 | |
| $ | 44,352 | | | $ | 78,639 | | | $ | 29,319 | | | $ | 55,658 | | | $ | 317,968 | | | $ | 170,059 | | | $ | 208,399 | | | $ | 52,569 | |
| | | | | | | | | | | | | | | | | | | | | | | | | | | | | | | |
| $ | 40,200 | | | $ | 66,302 | | | $ | 26,351 | | | $ | 45,182 | | | $ | 246,202 | | | $ | 141,797 | | | $ | 200,601 | | | $ | 44,703 | |
| | 1,091 | | | | 1,975 | | | | 313 | | | | 648 | | | | 1,116 | | | | 2,243 | | | | 3,474 | | | | 835 | |
| | 675 | | | | (3,690 | ) | | | (1,269 | ) | | | 2,543 | | | | (8,170 | ) | | | (4,582 | ) | | | (6,105 | ) | | | 732 | |
| | 2,386 | | | | 14,052 | | | | 3,924 | | | | 7,285 | | | | 78,820 | | | | 30,601 | | | | 10,429 | | | | 6,299 | |
| $ | 44,352 | | | $ | 78,639 | | | $ | 29,319 | | | $ | 55,658 | | | $ | 317,968 | | | $ | 170,059 | | | $ | 208,399 | | | $ | 52,569 | |
| | 200,000 | | | | 200,000 | | | | 200,000 | | | | 200,000 | | | | 200,000 | | | | 200,000 | | | | 200,000 | | | | 200,000 | |
| $ | 0.001 | | | $ | 0.001 | | | $ | 0.001 | | | $ | 0.001 | | | $ | 0.001 | | | $ | 0.001 | | | $ | 0.001 | | | $ | 0.001 | |
| $ | 11.02 | | | $ | 8.38 | | | $ | 8.74 | | | $ | 7.83 | | | $ | 8.95 | | | $ | 8.81 | | | $ | 7.54 | | | $ | 8.66 | |
| | 4,026 | | | | 9,385 | | | | 3,356 | | | | 7,110 | | | | 35,535 | | | | 19,298 | | | | 27,623 | | | | 6,073 | |
| $ | 44,352 | | | $ | 78,639 | | | $ | 29,319 | | | $ | 55,658 | | | $ | 317,968 | | | $ | 170,059 | | | $ | 208,399 | | | $ | 52,569 | |
| $ | 41,981 | | | $ | 64,606 | | | $ | 25,408 | | | $ | 48,391 | | | $ | 239,197 | | | $ | 139,488 | | | $ | 198,006 | | | $ | 46,287 | |
The accompanying notes are an integral part of these financial statements.
| Hartford Series Fund, Inc. |
| Statements of Operations |
| For the Year Ended December 31, 2011 |
| (000’s Omitted) |
| | | | | | American Funds | | | | |
| | | | | | Blue Chip | | | | |
| | | American Funds | | | Income and | | | American Funds | |
| | | Asset Allocation | | | Growth | | | Bond | |
| | | HLS Fund | | | HLS Fund | | | HLS Fund | |
| Investment Income: | | | | | | | | | | | | |
| Dividends from underlying funds | | $ | 1,377 | | | $ | 653 | | | $ | 6,479 | |
| Total investment income | | | 1,377 | | | | 653 | | | | 6,479 | |
| | | | | | | | | | | | | |
| Expenses: | | | | | | | | | | | | |
| Investment management fees | | | 415 | | | | 244 | | | | 1,044 | |
| Distribution fees - Class IB | | | 159 | | | | 82 | | | | 522 | |
| Custodian fees | | | 1 | | | | 1 | | | | 1 | |
| Accounting services fees | | | 6 | | | | 3 | | | | 21 | |
| Board of Directors' fees | | | 2 | | | | 1 | | | | 5 | |
| Audit fees | | | 10 | | | | 10 | | | | 11 | |
| Other expenses | | | 12 | | | | 8 | | | | 37 | |
| Total expenses (before waivers) | | | 605 | | | | 349 | | | | 1,641 | |
| Expense waivers | | | (255 | ) | | | (163 | ) | | | (522 | ) |
| Total waivers | | | (255 | ) | | | (163 | ) | | | (522 | ) |
| Total expenses, net | | | 350 | | | | 186 | | | | 1,119 | |
| Net investment income | | | 1,027 | | | | 467 | | | | 5,360 | |
| | | | | | | | | | | | | |
| Net Realized Gain (Loss) on Investments: | | | | | | | | | | | | |
| Capital gain distribution received from underlying funds | | | — | | | | — | | | | — | |
| Net realized gain (loss) on investments in underlying funds | | | 68 | | | | 322 | | | | 4,436 | |
| Net Realized Gain (Loss) on Investments | | | 68 | | | | 322 | | | | 4,436 | |
| | | | | | | | | | | | | |
| Net Changes in Unrealized Appreciation of Investments: | | | | | | | | | | | | |
| Net unrealized appreciation (depreciation) of investments in underlying funds | | | (605 | ) | | | (1,140 | ) | | | 2,021 | |
| Net Gain (Loss) on Investments | | | (537 | ) | | | (818 | ) | | | 6,457 | |
| Net Increase (Decrease) in Net Assets Resulting from Operations | | $ | 490 | | | $ | (351 | ) | | $ | 11,817 | |
The accompanying notes are an integral part of these financial statements.
| | | | American Funds | | | | | | American Funds | | | | | | | | | | | | | |
| American Funds | | | Global Growth | | | American Funds | | | Global Small | | | American Funds | | | American Funds | | | American Funds | | | American Funds | |
| Global Bond | | | and Income | | | Global Growth | | | Capitalization | | | Growth | | | Growth-Income | | | International | | | New World | |
| HLS Fund | | | HLS Fund | | | HLS Fund | | | HLS Fund | | | HLS Fund | | | HLS Fund | | | HLS Fund | | | HLS Fund | |
| | | | | | | | | | | | | | | | | | | | | | | |
| $ | 1,312 | | | $ | 2,443 | | | $ | 503 | | | $ | 1,019 | | | $ | 2,947 | | | $ | 3,196 | | | $ | 4,710 | | | $ | 1,187 | |
| | 1,312 | | | | 2,443 | | | | 503 | | | | 1,019 | | | | 2,947 | | | | 3,196 | | | | 4,710 | | | | 1,187 | |
| | | | | | | | | | | | | | | | | | | | | | | | | | | | | | | |
| | | | | | | | | | | | | | | | | | | | | | | | | | | | | | | |
| | 315 | | | | 688 | | | | 330 | | | | 528 | | | | 2,551 | | | | 1,248 | | | | 1,938 | | | | 694 | |
| | 105 | | | | 215 | | | | 83 | | | | 165 | | | | 850 | | | | 446 | | | | 570 | | | | 158 | |
| | 1 | | | | 1 | | | | 1 | | | | 1 | | | | 1 | | | | 1 | | | | 1 | | | | 1 | |
| | 4 | | | | 9 | | | | 3 | | | | 6 | | | | 34 | | | | 18 | | | | 23 | | | | 6 | |
| | 1 | | | | 2 | | | | 1 | | | | 2 | | | | 8 | | | | 4 | | | | 5 | | | | 2 | |
| | 10 | | | | 10 | | | | 10 | | | | 11 | | | | 13 | | | | 10 | | | | 12 | | | | 10 | |
| | 11 | | | | 16 | | | | 9 | | | | 20 | | | | 75 | | | | 28 | | | | 55 | | | | 16 | |
| | 447 | | | | 941 | | | | 437 | | | | 733 | | | | 3,532 | | | | 1,755 | | | | 2,604 | | | | 887 | |
| | (210 | ) | | | (473 | ) | | | (247 | ) | | | (363 | ) | | | (1,701 | ) | | | (802 | ) | | | (1,368 | ) | | | (536 | ) |
| | (210 | ) | | | (473 | ) | | | (247 | ) | | | (363 | ) | | | (1,701 | ) | | | (802 | ) | | | (1,368 | ) | | | (536 | ) |
| | 237 | | | | 468 | | | | 190 | | | | 370 | | | | 1,831 | | | | 953 | | | | 1,236 | | | | 351 | |
| | 1,075 | | | | 1,975 | | | | 313 | | | | 649 | | | | 1,116 | | | | 2,243 | | | | 3,474 | | | | 836 | |
| | | | | | | | | | | | | | | | | | | | | | | | | | | | | | | |
| | | | | | | | | | | | | | | | | | | | | | | | | | | | | | | |
| | 213 | | | | — | | | | — | | | | — | | | | — | | | | — | | | | — | | | | — | |
| | 838 | | | | (365 | ) | | | 309 | | | | 4,956 | | | | 1,657 | | | | (381 | ) | | | (625 | ) | | | 3,019 | |
| | 1,051 | | | | (365 | ) | | | 309 | | | | 4,956 | | | | 1,657 | | | | (381 | ) | | | (625 | ) | | | 3,019 | |
| | | | | | | | | | | | | | | | | | | | | | | | | | | | | | | |
| | | | | | | | | | | | | | | | | | | | | | | | | | | | | | | |
| | (542 | ) | | | (6,146 | ) | | | (3,627 | ) | | | (18,721 | ) | | | (16,989 | ) | | | (5,655 | ) | | | (35,372 | ) | | | (13,070 | ) |
| | 509 | | | | (6,511 | ) | | | (3,318 | ) | | | (13,765 | ) | | | (15,332 | ) | | | (6,036 | ) | | | (35,997 | ) | | | (10,051 | ) |
| $ | 1,584 | | | $ | (4,536 | ) | | $ | (3,005 | ) | | $ | (13,116 | ) | | $ | (14,216 | ) | | $ | (3,793 | ) | | $ | (32,523 | ) | | $ | (9,215 | ) |
The accompanying notes are an integral part of these financial statements.
| Hartford Series Fund, Inc. |
| Statements of Changes in Net Assets |
| |
| (000’s Omitted) |
| | | American Funds | | | American Funds | |
| | | Asset Allocation | | | Blue Chip Income and Growth | |
| | | HLS Fund | | | HLS Fund | |
| | | For the | | | For the | | | For the | | | For the | |
| | | Year Ended | | | Year Ended | | | Year Ended | | | Year Ended | |
| | | December 31, | | | December 31, | | | December 31, | | | December 31, | |
| | | 2011 | | | 2010 | | | 2011 | | | 2010 | |
| Operations: | | | | | | | | | | | | | | | | |
| Net investment income | | $ | 1,027 | | | $ | 863 | | | $ | 467 | | | $ | 438 | |
| Net realized gain (loss) on investments | | | 68 | | | | (546 | ) | | | 322 | | | | (323 | ) |
| Net unrealized appreciation (depreciation) of investments | | | (605 | ) | | | 5,634 | | | | (1,140 | ) | | | 3,422 | |
| Net increase (decrease) in net assets resulting from operations | | | 490 | | | | 5,951 | | | | (351 | ) | | | 3,537 | |
| Distributions to Shareholders: | | | | | | | | | | | | | | | | |
| From net investment income | | | | | | | | | | | | | | | | |
| Class IB | | | (863 | ) | | | (881 | ) | | | (8 | ) | | | (871 | ) |
| From net realized gain on investments | | | | | | | | | | | | | | | | |
| Class IB | | | (5 | ) | | | — | | | | — | | | | — | |
| Total distributions | | | (868 | ) | | | (881 | ) | | | (8 | ) | | | (871 | ) |
| Capital Share Transactions: | | | | | | | | | | | | | | | | |
| Class IB | | | | | | | | | | | | | | | | |
| Sold | | | 13,867 | | | | 11,541 | | | | 5,896 | | | | 6,415 | |
| Issued on reinvestment of distributions | | | 868 | | | | 881 | | | | 8 | | | | 871 | |
| Redeemed | | | (8,327 | ) | | | (7,734 | ) | | | (7,150 | ) | | | (4,952 | ) |
| Net increase (decrease) from capital share transactions | | | 6,408 | | | | 4,688 | | | | (1,246 | ) | | | 2,334 | |
| Net increase (decrease) in net assets | | | 6,030 | | | | 9,758 | | | | (1,605 | ) | | | 5,000 | |
| Net Assets: | | | | | | | | | | | | | | | | |
| Beginning of period | | | 58,326 | | | | 48,568 | | | | 34,030 | | | | 29,030 | |
| End of period | | $ | 64,356 | | | $ | 58,326 | | | $ | 32,425 | | | $ | 34,030 | |
| Undistributed (distribution in excess of) | | | | | | | | | | | | | | | | |
| net investment income | | $ | 1,026 | | | $ | 862 | | | $ | 467 | | | $ | 8 | |
| Shares: | | | | | | | | | | | | | | | | |
| Class IB | | | | | | | | | | | | | | | | |
| Sold | | | 1,409 | | | | 1,262 | | | | 650 | | | | 747 | |
| Issued on reinvestment of distributions | | | 94 | | | | 105 | | | | 1 | | | | 104 | |
| Redeemed | | | (857 | ) | | | (866 | ) | | | (782 | ) | | | (585 | ) |
| Total share activity | | | 646 | | | | 501 | | | | (131 | ) | | | 266 | |
The accompanying notes are an integral part of these financial statements.
| American Funds | | | American Funds | | | American Funds | | | American Funds | |
| Bond | | | Global Bond | | | Global Growth and Income | | | Global Growth | |
| HLS Fund | | | HLS Fund | | | HLS Fund | | | HLS Fund | |
| For the | | | For the | | | For the | | | For the | | | For the | | | For the | | | For the | | | For the | |
| Year Ended | | | Year Ended | | | Year Ended | | | Year Ended | | | Year Ended | | | Year Ended | | | Year Ended | | | Year Ended | |
| December 31, | | | December 31, | | | December 31, | | | December 31, | | | December 31, | | | December 31, | | | December 31, | | | December 31, | |
| 2011 | | | 2010 | | | 2011 | | | 2010 | | | 2011 | | | 2010 | | | 2011 | | | 2010 | |
| | | | | | | | | | | | | | | | | | | | | | | | | | | | | | | |
| $ | 5,360 | | | $ | 5,573 | | | $ | 1,075 | | | $ | 964 | | | $ | 1,975 | | | $ | 1,927 | | | $ | 313 | | | $ | 364 | |
| | 4,436 | | | | (327 | ) | | | 1,051 | | | | 393 | | | | (365 | ) | | | (2,373 | ) | | | 309 | | | | (429 | ) |
| | 2,021 | | | | 6,464 | | | | (542 | ) | | | 408 | | | | (6,146 | ) | | | 9,401 | | | | (3,627 | ) | | | 3,570 | |
| | 11,817 | | | | 11,710 | | | | 1,584 | | | | 1,765 | | | | (4,536 | ) | | | 8,955 | | | | (3,005 | ) | | | 3,505 | |
| | | | | | | | | | | | | | | | | | | | | | | | | | | | | | | |
| | | | | | | | | | | | | | | | | | | | | | | | | | | | | | | |
| | (5,572 | ) | | | (4,625 | ) | | | (962 | ) | | | (405 | ) | | | (1,921 | ) | | | (1,600 | ) | | | (363 | ) | | | (286 | ) |
| | | | | | | | | | | | | | | | | | | | | | | | | | | | | | | |
| | (62 | ) | | | — | | | | (316 | ) | | | (31 | ) | | | — | | | | — | | | | — | | | | — | |
| | (5,634 | ) | | | (4,625 | ) | | | (1,278 | ) | | | (436 | ) | | | (1,921 | ) | | | (1,600 | ) | | | (363 | ) | | | (286 | ) |
| | | | | | | | | | | | | | | | | | | | | | | | | | | | | | | |
| | | | | | | | | | | | | | | | | | | | | | | | | | | | | | | |
| | 34,811 | | | | 50,638 | | | | 13,479 | | | | 8,267 | | | | 4,913 | | | | 8,826 | | | | 4,927 | | | | 5,363 | |
| | 5,634 | | | | 4,625 | | | | 1,278 | | | | 436 | | | | 1,921 | | | | 1,600 | | | | 363 | | | | 286 | |
| | (54,785 | ) | | | (37,538 | ) | | | (9,365 | ) | | | (9,911 | ) | | | (12,992 | ) | | | (15,289 | ) | | | (6,848 | ) | | | (5,080 | ) |
| | (14,340 | ) | | | 17,725 | | | | 5,392 | | | | (1,208 | ) | | | (6,158 | ) | | | (4,863 | ) | | | (1,558 | ) | | | 569 | |
| | (8,157 | ) | | | 24,810 | | | | 5,698 | | | | 121 | | | | (12,615 | ) | | | 2,492 | | | | (4,926 | ) | | | 3,788 | |
| | | | | | | | | | | | | | | | | | | | | | | | | | | | | | | |
| | 206,360 | | | | 181,550 | | | | 38,654 | | | | 38,533 | | | | 91,254 | | | | 88,762 | | | | 34,245 | | | | 30,457 | |
| $ | 198,203 | | | $ | 206,360 | | | $ | 44,352 | | | $ | 38,654 | | | $ | 78,639 | | | $ | 91,254 | | | $ | 29,319 | | | $ | 34,245 | |
| | | | | | | | | | | | | | | | | | | | | | | | | | | | | | | |
| $ | 5,360 | | | $ | 5,572 | | | $ | 1,091 | | | $ | 962 | | | $ | 1,975 | | | $ | 1,921 | | | $ | 313 | | | $ | 363 | |
| | | | | | | | | | | | | | | | | | | | | | | | | | | | | | | |
| | | | | | | | | | | | | | | | | | | | | | | | | | | | | | | |
| | 3,348 | | | | 4,984 | | | | 1,191 | | | | 774 | | | | 547 | | | | 1,056 | | | | 508 | | | | 614 | |
| | 541 | | | | 449 | | | | 113 | | | | 41 | | | | 234 | | | | 209 | | | | 42 | | | | 35 | |
| | (5,267 | ) | | | (3,670 | ) | | | (839 | ) | | | (934 | ) | | | (1,473 | ) | | | (1,885 | ) | | | (710 | ) | | | (583 | ) |
| | (1,378 | ) | | | 1,763 | | | | 465 | | | | (119 | ) | | | (692 | ) | | | (620 | ) | | | (160 | ) | | | 66 | |
The accompanying notes are an integral part of these financial statements.
| Hartford Series Fund, Inc. |
| Statements of Changes in Net Assets – (continued) |
| |
| (000’s Omitted) |
| | | American Funds | | | American Funds | |
| | | Global Small Capitalization | | | Growth | |
| | | HLS Fund | | | HLS Fund | |
| | | For the | | | For the | | | For the | | | For the | |
| | | Year Ended | | | Year Ended | | | Year Ended | | | Year Ended | |
| | | December 31, | | | December 31, | | | December 31, | | | December 31, | |
| | | 2011 | | | 2010 | | | 2011 | | | 2010 | |
| Operations: | | | | | | | | | | | | | | | | |
| Net investment income | | $ | 649 | | | $ | 866 | | | $ | 1,116 | | | $ | 1,351 | |
| Net realized gain (loss) on investments | | | 4,956 | | | | 17 | | | | 1,657 | | | | (6,158 | ) |
| Net unrealized appreciation (depreciation) of investments | | | (18,721 | ) | | | 12,561 | | | | (16,989 | ) | | | 60,757 | |
| Net increase (decrease) in net assets resulting from operations | | | (13,116 | ) | | | 13,444 | | | | (14,216 | ) | | | 55,950 | |
| Distributions to Shareholders: | | | | | | | | | | | | | | | | |
| From net investment income | | | | | | | | | | | | | | | | |
| Class IB | | | (866 | ) | | | (10 | ) | | | (10 | ) | | | (1,529 | ) |
| From net realized gain on investments | | | | | | | | | | | | | | | | |
| Class IB | | | (360 | ) | | | — | | | | — | | | | — | |
| Total distributions | | | (1,226 | ) | | | (10 | ) | | | (10 | ) | | | (1,529 | ) |
| Capital Share Transactions: | | | | | | | | | | | | | | | | |
| Class IB | | | | | | | | | | | | | | | | |
| Sold | | | 9,505 | | | | 15,106 | | | | 32,641 | | | | 40,109 | |
| Issued on reinvestment of distributions | | | 1,226 | | | | 10 | | | | 10 | | | | 1,529 | |
| Redeemed | | | (15,730 | ) | | | (15,070 | ) | | | (56,619 | ) | | | (36,556 | ) |
| Net increase (decrease) from capital share transactions | | | (4,999 | ) | | | 46 | | | | (23,968 | ) | | | 5,082 | |
| Net increase (decrease) in net assets | | | (19,341 | ) | | | 13,480 | | | | (38,194 | ) | | | 59,503 | |
| Net Assets: | | | | | | | | | | | | | | | | |
| Beginning of period | | | 74,999 | | | | 61,519 | | | | 356,162 | | | | 296,659 | |
| End of period | | $ | 55,658 | | | $ | 74,999 | | | $ | 317,968 | | | $ | 356,162 | |
| Undistributed (distribution in excess of) | | | | | | | | | | | | | | | | |
| net investment income | | $ | 648 | | | $ | 865 | | | $ | 1,116 | | | $ | 10 | |
| Shares: | | | | | | | | | | | | | | | | |
| Class IB | | | | | | | | | | | | | | | | |
| Sold | | | 1,071 | | | | 1,752 | | | | 3,537 | | | | 4,951 | |
| Issued on reinvestment of distributions | | | 147 | | | | 1 | | | | 1 | | | | 169 | |
| Redeemed | | | (1,667 | ) | | | (1,761 | ) | | | (5,986 | ) | | | (4,417 | ) |
| Total share activity | | | (449 | ) | | | (8 | ) | | | (2,448 | ) | | | 703 | |
The accompanying notes are an integral part of these financial statements.
| American Funds | | | American Funds | | | American Funds | |
| Growth-Income | | | International | | | New World | |
| HLS Fund | | | HLS Fund | | | HLS Fund | |
| For the | | | For the | | | For the | | | For the | | | For the | | | For the | |
| Year Ended | | | Year Ended | | | Year Ended | | | Year Ended | | | Year Ended | | | Year Ended | |
| December 31, | | | December 31, | | | December 31, | | | December 31, | | | December 31, | | | December 31, | |
| 2011 | | | 2010 | | | 2011 | | | 2010 | | | 2011 | | | 2010 | |
| | | | | | | | | | | | | | | | | | | | | | | |
| $ | 2,243 | | | $ | 2,033 | | | $ | 3,474 | | | $ | 3,795 | | | $ | 836 | | | $ | 798 | |
| | (381 | ) | | | (3,498 | ) | | | (625 | ) | | | (1,534 | ) | | | 3,019 | | | | (531 | ) |
| | (5,655 | ) | | | 20,125 | | | | (35,372 | ) | | | 14,307 | | | | (13,070 | ) | | | 9,905 | |
| | (3,793 | ) | | | 18,660 | | | | (32,523 | ) | | | 16,568 | | | | (9,215 | ) | | | 10,172 | |
| | | | | | | | | | | | | | | | | | | | | | | |
| | | | | | | | | | | | | | | | | | | | | | | |
| | (2 | ) | | | (2,183 | ) | | | (3,792 | ) | | | (2,100 | ) | | | (797 | ) | | | (584 | ) |
| | | | | | | | | | | | | | | | | | | | | | | |
| | — | | | | — | | | | — | | | | (715 | ) | | | — | | | | — | |
| | (2 | ) | | | (2,183 | ) | | | (3,792 | ) | | | (2,815 | ) | | | (797 | ) | | | (584 | ) |
| | | | | | | | | | | | | | | | | | | | | | | |
| | | | | | | | | | | | | | | | | | | | | | | |
| | 15,378 | | | | 20,249 | | | | 35,399 | | | | 45,834 | | | | 9,630 | | | | 15,738 | |
| | 2 | | | | 2,183 | | | | 3,792 | | | | 2,815 | | | | 797 | | | | 584 | |
| | (27,362 | ) | | | (21,763 | ) | | | (30,179 | ) | | | (23,958 | ) | | | (20,103 | ) | | | (12,231 | ) |
| | (11,982 | ) | | | 669 | | | | 9,012 | | | | 24,691 | | | | (9,676 | ) | | | 4,091 | |
| | (15,777 | ) | | | 17,146 | | | | (27,303 | ) | | | 38,444 | | | | (19,688 | ) | | | 13,679 | |
| | | | | | | | | | | | | | | | | | | | | | | |
| | 185,836 | | | | 168,690 | | | | 235,702 | | | | 197,258 | | | | 72,257 | | | | 58,578 | |
| $ | 170,059 | | | $ | 185,836 | | | $ | 208,399 | | | $ | 235,702 | | | $ | 52,569 | | | $ | 72,257 | |
| | | | | | | | | | | | | | | | | | | | | | | |
| $ | 2,243 | | | $ | 2 | | | $ | 3,474 | | | $ | 3,792 | | | $ | 835 | | | $ | 796 | |
| | | | | | | | | | | | | | | | | | | | | | | |
| | | | | | | | | | | | | | | | | | | | | | | |
| | 1,719 | | | | 2,472 | | | | 4,305 | | | | 5,579 | | | | 982 | | | | 1,707 | |
| | — | | | | 248 | | | | 488 | | | | 366 | | | | 88 | | | | 67 | |
| | (3,063 | ) | | | (2,648 | ) | | | (3,471 | ) | | | (2,863 | ) | | | (2,055 | ) | | | (1,374 | ) |
| | (1,344 | ) | | | 72 | | | | 1,322 | | | | 3,082 | | | | (985 | ) | | | 400 | |
The accompanying notes are an integral part of these financial statements.
| Hartford Series Fund, Inc. |
| Notes to Financial Statements |
| December 31, 2011 |
| (000’s Omitted) |
The Hartford HLS Funds serve as underlying investment options for certain variable annuity and variable life insurance separate accounts of Hartford Life Insurance Company (“HLIC”) and its affiliates and certain qualified retirement plans. Certain Hartford HLS Funds may also serve as underlying investment options for certain variable annuity and variable life separate accounts of other insurance companies. Owners of variable annuity contracts and policyholders of variable life insurance contracts may choose the funds permitted in the variable insurance contract prospectus. In addition, participants in certain qualified retirement plans may choose the funds if permitted by their plans.
Hartford Series Fund, Inc. (the “Company”) is an open-end management investment company comprised of thirty portfolios, eleven portfolios of which are included in these financial statements (each a “Fund” or together the “Funds”). These eleven portfolios of the Company are American Funds Asset Allocation HLS Fund, American Funds Blue Chip Income and Growth HLS Fund, American Funds Bond HLS Fund, American Funds Global Bond HLS Fund, American Funds Global Growth and Income HLS Fund, American Funds Global Growth HLS Fund, American Funds Global Small Capitalization HLS Fund, American Funds Growth HLS Fund, American Funds Growth-Income HLS Fund, American Funds International HLS Fund and American Funds New World HLS Fund.
The Company is organized under the laws of the State of Maryland and is registered with the Securities and Exchange Commission (“SEC”) under the Investment Company Act of 1940, as amended (“1940 Act”). Each Fund is organized as a diversified open-end management investment company, except for American Funds Global Bond HLS Fund, which is non-diversified.
Each Fund operates in the manner of a fund of funds, investing in shares of underlying mutual funds (the “Underlying Funds”). Each Underlying Fund is offered by American Funds Insurance Series, and is a registered open-end investment company. The Funds and their related Underlying Funds are listed below:
| Fund | | Underlying Fund |
| American Funds Asset Allocation HLS Fund | | Asset Allocation Fund Class 1 |
| American Funds Blue Chip Income and Growth HLS Fund | | Blue Chip Income and Growth Fund Class 1 |
| American Funds Bond HLS Fund | | Bond Fund Class 1 |
| American Funds Global Bond HLS Fund | | Global Bond Fund Class 1 |
| American Funds Global Growth and Income HLS Fund | | Global Growth and Income Fund Class 1 |
| American Funds Global Growth HLS Fund | | Global Growth Fund Class 1 |
| American Funds Global Small Capitalization HLS Fund | | Global Small Capitalization Fund Class 1 |
| American Funds Growth HLS Fund | | Growth Fund Class 1 |
| American Funds Growth-Income HLS Fund | | Growth-Income Fund Class 1 |
| American Funds International HLS Fund | | International Fund Class 1 |
| American Funds New World HLS Fund | | New World Fund Class 1 |
The Underlying Funds’ accounting policies are outlined in the Underlying Funds’ shareholder report, which accompanies this report.
Class IB shares of the Funds are offered at the per share net asset value (“NAV”) without a sales charge and are subject to distribution fees charged pursuant to a Distribution and Service Plan. The Distribution and Service Plan has been adopted in accordance with Rule 12b-1 under the 1940 Act.
| 2. | Significant Accounting Policies: |
The following is a summary of significant accounting policies of the Funds in the preparation of their financial statements, which are in accordance with the United States Generally Accepted Accounting Principles (“U.S. GAAP”). The preparation of financial statements in accordance with U.S. GAAP may require management to make estimates and assumptions that affect the reported amounts of assets and liabilities and disclosure of contingent assets and liabilities at the date of the financial statements and the reported amounts of increases and decreases in net assets from operations during the reporting period. Actual results could differ from those estimates.
| a) | Determination of Net Asset Value – The NAV of each class of the Funds’ shares is determined as of the close of regular trading (normally 4:00 p.m. Eastern Time) (the “NYSE Close”) on each day that the New York Stock Exchange (the “Exchange”) is open (“Valuation Date”). Information that becomes known to the Funds after the NAV has been calculated on a particular day will not generally be used to retroactively adjust the NAV determined earlier that day. |
| b) | Investment Valuation – Investments in the Underlying Funds are valued at the respective NAV of each Underlying Fund as determined as of the NYSE Close on Valuation Date. Valuation of securities held by the Underlying Funds is discussed in Notes to Financial Statements of the Underlying Funds, which are included in the Underlying Funds’ shareholder report, accompanying this report. |
U.S. GAAP defines fair value as the price that the Fund would receive to sell an asset or pay to transfer a liability in an orderly transaction between market participants. The U.S. GAAP fair value measurement standards require disclosure of a fair value hierarchy for each major category of assets and liabilities. Various inputs are used in determining the fair value of each Fund’s investments. These inputs are summarized into three broad hierarchy levels. This hierarchy is based on whether the valuation inputs are observable or unobservable. These levels are:
| · | Level 1 – Quoted prices in active markets for identical securities. |
| · | Level 2 – Observable inputs other than Level 1 prices, such as quoted prices for similar securities; quoted prices in markets that are not active; or other inputs that are observable or can be corroborated by observable market data. |
| · | Level 3 – Significant unobservable inputs that are supported by limited or no market activity. Level 3 may include financial instruments whose values are determined using broker quotes or require significant management judgment or estimation. |
Valuation levels are not necessarily indicative of the risk associated with investing in such securities. Individual securities within any of the above mentioned asset classes may be assigned a different hierarchical level than those presented above, as individual circumstances dictate.
During the year ended December 31, 2011, the Funds held no Level 3 securities, therefore no reconciliations of Level 3 securities are presented.
For additional information, refer to the investment valuation hierarchy level summary which follows the Schedule of Investments for each Fund.
For purposes of reporting transfers between different hierarchy levels, both transfers in and out of each level, as applicable, are shown as if they occurred at the beginning of the period.
| c) | Security Transactions and Investment Income – Security transactions are recorded as of the trade date (the date the order to buy or sell is executed) for financial reporting purposes. Realized gains and losses are determined on the basis of identified cost. |
| Hartford Series Fund, Inc. |
| Notes to Financial Statements – (continued) |
| December 31, 2011 |
| (000’s Omitted) |
Income and capital gain distributions from Underlying Funds are recorded on the ex-dividend date.
| d) | Fund Share Valuation and Dividend Distributions to Shareholders – Orders for the Funds’ shares are executed in accordance with the investment instructions of the contract holders. The NAV of each Fund’s shares is determined as of the close of each business day of the Exchange. The NAV is determined for each Fund by dividing the Fund’s net assets by the number of shares outstanding. Orders for the purchase of a Fund’s shares received by an insurance company prior to the close of the Exchange on any day on which the Exchange is open for business are priced at the NAV determined as of the close of the Exchange. Orders received by an insurance company after the close of the Exchange, or on a day on which the Exchange and/or the Fund is not open for business, are priced at the next determined NAV. |
Dividends are declared pursuant to a policy adopted by the Company’s Board of Directors based upon the investment performance of the Funds. The policy of the all Funds is to pay dividends from net investment income and realized capital gains, if any, at least once a year.
Distributions from net investment income, realized capital gains and capital are determined in accordance with federal income tax regulations, which may differ from U.S. GAAP with respect to character and timing. These differences may include but are not limited to losses deferred due to wash sale adjustments and short-term capital gain adjustments. Permanent book and federal income tax basis differences relating to shareholder distributions will result in reclassifications to certain of the Funds’ capital accounts (see Federal Income Taxes: Reclassification of Capital Accounts note).
| a) | Market Risks – The Fund’s are exposed to the risks of the Underlying Funds in direct proportion to the amount of assets each Fund allocates to each Underlying Fund. The market values of the Underlying Funds may decline due to general market conditions which are not specifically related to a particular fund, such as real or perceived adverse economic conditions or adverse investor sentiment generally. |
| a) | Federal Income Taxes – For federal income tax purposes, the Funds intend to continue to qualify as Regulated Investment Companies (“RIC”) under Subchapter M of the Internal Revenue Code (“IRC”) by distributing substantially all of their taxable net investment income and net realized capital gains to their shareholders and otherwise complying with the requirements of RIC. The Funds have distributed substantially all of their income and capital gains in the prior year and each Fund intends to distribute substantially all of its income and gains prior to the next fiscal year end. Accordingly, no provision for federal income or excise taxes has been made in the accompanying financial statements. Distributions from short-term capital gains are treated as ordinary income distributions for federal income tax purposes. |
| b) | Net Investment Income (Loss), Net Realized Gains (Losses) – Net investment income (loss) and net realized gains (losses) may differ for financial statement and tax purposes primarily because of losses deferred due to wash sale adjustments and short-term capital gain adjustments. The character of distributions made during the year from net investment income or net realized gains may differ from their ultimate characterization for federal income tax purposes. Also, due to the timing of dividend distributions, the fiscal year in which amounts are distributed may differ from the year that the net investment income (loss) or net realized gains (losses) were recorded by a Fund. |
| c) | Distributions and Components of Distributable Earnings – The tax character of distributions paid by the Funds for the periods indicated is as follows (as adjusted for dividends payable): |
| | | For the Year Ended | | | For the Year Ended | |
| | | December 31, 2011 | | | December 31, 2010 | |
| | | Ordinary
Income | | | Long-
Term
Capital
Gains(a) | | | Tax
return
of
capital | | | Ordinary
Income | | | Long-
Term
Capital
Gains(a) | | | Tax
return
of
capital | |
| American Funds Asset Allocation HLS Fund | | $ | 863 | | | $ | 5 | | | $ | — | | | $ | 881 | | | $ | — | | | $ | — | |
| American Funds Blue Chip Income and Growth HLS Fund | | | 8 | | | | — | | | | — | | | | 871 | | | | — | | | | — | |
| American Funds Bond HLS Fund | | | 5,572 | | | | 62 | | | | — | | | | 4,625 | | | | — | | | | — | |
| American Funds Global Bond HLS Fund | | | 962 | | | | 316 | | | | — | | | | 405 | | | | 31 | | | | — | |
| American Funds Global Growth and Income HLS Fund | | | 1,921 | | | | — | | | | — | | | | 1,600 | | | | — | | | | — | |
| American Funds Global Growth HLS Fund | | | 363 | | | | — | | | | — | | | | 286 | | | | — | | | | — | |
| American Funds Global Small Capitalization HLS Fund | | | 866 | | | | 360 | | | | — | | | | 10 | | | | — | | | | — | |
| American Funds Growth HLS Fund | | | 10 | | | | — | | | | — | | | | 1,529 | | | | — | | | | — | |
| American Funds Growth-Income HLS Fund | | | 2 | | | | — | | | | — | | | | 2,183 | | | | — | | | | — | |
| American Funds International HLS Fund | | | 3,792 | | | | — | | | | — | | | | 2,100 | | | | 715 | | | | — | |
| American Funds New World HLS Fund | | | 797 | | | | — | | | | — | | | | 584 | | | | — | | | | — | |
(a) The Funds designate these distributions as long-term capital dividends per IRC code Sec. 852(b) (3) (C).
As of December 31, 2011, the components of distributable earnings (deficit) on a tax basis were as follows:
| | | | | | | | | | | | | | | Total | |
| | | Undistributed | | | Undistributed | | | Accumulated | | | Unrealized | | | Accumulated | |
| | | Ordinary | | | Long-Term | | | Capital and Other | | | Appreciation | | | Earnings | |
| | | Income | | | Capital Gain | | | Losses | | | (Depreciation)@ | | | (Deficit) | |
| American Funds Asset Allocation HLS Fund | | $ | 1,026 | | | $ | 140 | | | $ | — | | | $ | 6,911 | | | $ | 8,077 | |
| American Funds Blue Chip Income and Growth HLS Fund | | | 467 | | | | 267 | | | | — | | | | 5,087 | | | | 5,821 | |
| American Funds Bond HLS Fund | | | 5,360 | | | | 4,399 | | | | — | | | | 11,560 | | | | 21,319 | |
| American Funds Global Bond HLS Fund | | | 1,091 | | | | 825 | | | | — | | | | 2,236 | | | | 4,152 | |
| American Funds Global Growth and Income HLS Fund | | | 1,975 | | | | — | | | | (1,805 | ) | | | 12,167 | | | | 12,337 | |
| American Funds Global Growth HLS Fund | | | 313 | | | | 324 | | | | — | | | | 2,331 | | | | 2,968 | |
| American Funds Global Small Capitalization HLS Fund | | | 648 | | | | 4,956 | | | | — | | | | 4,872 | | | | 10,476 | |
| American Funds Growth HLS Fund | | | 1,116 | | | | 973 | | | | — | | | | 69,677 | | | | 71,766 | |
| American Funds Growth-Income HLS Fund | | | 2,243 | | | | — | | | | (832 | ) | | | 26,851 | | | | 28,262 | |
| American Funds International HLS Fund | | | 3,474 | | | | — | | | | (426 | ) | | | 4,750 | | | | 7,798 | |
| American Funds New World HLS Fund | | | 835 | | | | 2,795 | | | | — | | | | 4,236 | | | | 7,866 | |
| @ | The difference between book-basis and tax-basis unrealized appreciation (depreciation) is attributable primarily to the tax deferral of wash sale losses. |
| d) | Reclassification of Capital Accounts – The Funds may record reclassifications in their capital accounts. These reclassifications have no impact on the total net assets of the Funds. The reclassifications are a result of permanent differences between U.S. GAAP and tax accounting for such items as net operating losses that reduce distribution requirements. Adjustments are made to reflect the impact these items have on current and future distributions to shareholders. Therefore, the source of a Fund’s distributable income may be shown in the accompanying Statement of |
| Hartford Series Fund, Inc. |
| Notes to Financial Statements – (continued) |
| December 31, 2011 |
| (000’s Omitted) |
Assets and Liabilities as from net investment income, from net realized gains on investments or from capital depending on the type of book and tax differences that exist. For the year ended December 31, 2011, the Funds recorded the following reclassifications to increase (decrease) the accounts listed below.
| | | Net Investment
Income | | | Net Realized
Gain (Loss) | | | Paid-in-
Capital | |
| American Funds Global Bond HLS Fund | | $ | 16 | | | $ | (16 | ) | | $ | — | |
| e) | Capital Loss Carryforward – On December 22, 2010, the Regulated Investment Company Modernization Act of 2010 (the “Act”) was enacted, which made changes to the capital loss carryforward rules. The changes are effective for taxable years beginning after the date of enactment. Under the Act, funds are permitted to carry forward capital losses for an unlimited period. However, any losses incurred during those future taxable years will be required to be utilized prior to the losses incurred in pre-enactment taxable years, which carry an expiration date. As a result of this ordering rule, pre-enactment capital loss carryforwards may be more likely to expire unused. Additionally, post-enactment capital loss carryforwards will retain their character as either short-term or long-term capital losses rather than being considered all short-term as permitted under prior regulation. |
At December 31, 2011 (tax-year-end), the Funds had capital loss carryforwards for U.S. federal income tax purposes as follows:
Capital loss carryforwards with expiration:
| | | 2012 | | | 2013 | | | 2014 | | | 2015 | | | 2016 | | | 2017 | | | 2018 | | | Total | |
| American Funds Global Growth and Income HLS Fund | | $ | — | | | $ | — | | | $ | — | | | $ | — | | | $ | — | | | $ | — | | | $ | 1,457 | | | $ | 1,457 | |
| American Funds Growth-Income HLS Fund | | | — | | | | — | | | | — | | | | — | | | | — | | | | — | | | | 701 | | | | 701 | |
| American Funds International HLS Fund | | | — | | | | — | | | | — | | | | — | | | | — | | | | — | | | | 332 | | | | 332 | |
| Capital loss carryforwards without expiration: |
| | | | |
| | | Short-Term
Capital Loss
Carryforwards | | | Long-Term
Capital Loss
Carryfowards | | | Total | |
| American Funds Global Growth and Income HLS Fund | | $ | — | | | $ | 348 | | | $ | 348 | |
| American Funds Growth-Income HLS Fund | | | — | | | | 131 | | | | 131 | |
| American Funds International HLS Fund | | | — | | | | 94 | | | | 94 | |
As of December 31, 2011, the following Funds utilized prior year capital loss carryforwards:
| | | Amount | |
| American Funds Blue Chip Income and Growth HLS Fund | | $ | 45 | |
| American Funds Global Growth HLS Fund | | | 20 | |
| American Funds Growth HLS Fund | | | 848 | |
| American Funds New World HLS Fund | | | 209 | |
| f) | Accounting for Uncertainty in Income Taxes – The Funds have adopted financial reporting rules that require the Funds to analyze all open tax years, as defined by the Statute of Limitations, for all major jurisdictions. Generally, tax authorities can examine all tax returns filed for the last three years. The Funds do not have an examination in progress. |
The Funds have reviewed all open tax years and major jurisdictions and concluded that these financial reporting rules have no effect on the Funds’ financial positions or results of operations. There is no tax liability resulting from unrecognized tax benefits relating to uncertain income tax positions taken or expected to be taken on the tax returns for the fiscal year-end December 31, 2011. The Funds are also not aware of any tax positions for which it is reasonably possible that the total amounts of unrecognized tax benefits will significantly change in the next twelve months.
| a) | Investment Management Agreement – HL Investment Advisors, LLC (“HL Advisors”), an indirect wholly owned subsidiary of The Hartford Financial Services Group, Inc. (“The Hartford”), serves as investment manager to the Funds pursuant to an Investment Management Agreement with the Company. As investment manager, HL Advisors has overall investment supervisory responsibility for each Fund. In addition, HL Advisors provides administrative personnel, services, equipment, facilities and office space for proper operation of the Funds. |
The schedule below reflects the rates of compensation as a percentage of each Fund’s average daily net assets paid to HL Advisors for investment management services rendered during the year ended December 31, 2011. The rates are accrued daily and paid monthly:
| Fund | Annual Rate* |
| American Funds Asset Allocation HLS Fund | 0.65% |
| American Funds Blue Chip Income and Growth HLS Fund | 0.75% |
| American Funds Bond HLS Fund | 0.50% |
| American Funds Global Bond HLS Fund | 0.75% |
| American Funds Global Growth and Income HLS Fund | 0.80% |
| American Funds Global Growth HLS Fund | 1.00% |
| American Funds Global Small Capitalization HLS Fund | 0.80% |
| American Funds Growth HLS Fund | 0.75% |
| American Funds Growth-Income HLS Fund | 0.70% |
| American Funds International HLS Fund | 0.85% |
| American Funds New World HLS Fund | 1.10% |
| * | HL Advisors has entered into an agreement under which it will waive a portion of its investment management fee with respect to each Fund for as long as that Fund is invested in its corresponding Underlying Fund. The net investment management fee under the agreement with HL Advisors, after giving effect to the waiver, is 0.25% of the average daily net assets for each Fund. |
| b) | Accounting Services Agreement – Pursuant to the Fund Accounting Agreement between HLIC and the Company, on behalf of the Funds, HLIC provides accounting services to the Funds and receives monthly compensation of 0.01% of each Fund’s average daily net assets. These fees are accrued daily and paid monthly. |
| c) | Other Related Party Transactions – Certain officers of the Funds are directors and/or officers of HL Advisors and/or The Hartford or its subsidiaries. For the year ended December 31, 2011, a portion of the Funds’ chief compliance officer’s salary was paid by all the investment companies in the Hartford fund complex. The portion allocated to the Funds was in the amount of $2. These fees are accrued daily and paid monthly. |
| d) | Operating Expenses – Allocable expenses incurred by the Company are allocated to each Fund in proportion to the average daily net assets of each Fund, except where allocation of certain expenses is more fairly made directly to the Fund. |
| e) | Distribution Plan for Class IB shares – The Company, on behalf of the Funds, has adopted a Distribution Plan pursuant to Rule 12b-1 of the 1940 Act to compensate the Distributor, Hartford Securities Distribution Company, Inc. (a wholly |
| Hartford Series Fund, Inc. |
| Notes to Financial Statements – (continued) |
| December 31, 2011 |
| (000’s Omitted) |
owned, ultimate subsidiary of The Hartford), from assets attributable to the Class IB shares for services rendered and expenses borne in connection with activities primarily intended to result in the sale of the Class IB shares, subject to the review and approval of the Company’s Board of Directors.
The Distribution Plan provides that the Fund may pay annually up to 0.25% of the average daily net assets of the Fund attributable to its Class IB shares for activities primarily intended to result in the sale of Class IB shares. The Board has the authority to suspend or reduce these payments at any point in time. Under the terms of the Distribution Plan and the principal underwriting agreement, each Fund is authorized to make payments monthly to the Distributor that may be used to pay or compensate entities providing distribution and shareholder servicing with respect to the Class IB shares for such entities’ fees or expenses incurred or paid in that regard. These fees are accrued daily and paid monthly.
| 6. | Investment Transactions: |
For the year ended December 31, 2011, aggregate purchases and sales of investments in underlying funds (excluding short-term investments) were as follows:
| | | Cost of Purchases | | | Sales Proceeds | |
| | | Excluding U.S. | | | Excluding U.S. | |
| | | Government | | | Government | |
| | | Obligations | | | Obligations | |
| American Funds Asset Allocation HLS Fund | | $ | 12,512 | | | $ | 5,941 | |
| American Funds Blue Chip Income and Growth HLS Fund | | | 4,643 | | | | 5,426 | |
| American Funds Bond HLS Fund | | | 31,287 | | | | 45,907 | |
| American Funds Global Bond HLS Fund | | | 12,304 | | | | 6,899 | |
| American Funds Global Growth and Income HLS Fund | | | 4,404 | | | | 10,509 | |
| American Funds Global Growth HLS Fund | | | 3,716 | | | | 5,322 | |
| American Funds Global Small Capitalization HLS Fund | | | 7,282 | | | | 12,857 | |
| American Funds Growth HLS Fund | | | 18,081 | | | | 40,956 | |
| American Funds Growth-Income HLS Fund | | | 9,566 | | | | 19,314 | |
| American Funds International HLS Fund | | | 30,276 | | | | 21,589 | |
| American Funds New World HLS Fund | | | 6,044 | | | | 15,681 | |
The Funds, along with several other Hartford funds, participate in a $500 million committed revolving line of credit facility. The facility is to be used for temporary or emergency purposes. Under the arrangement, a fund is required to own securities having a market value in excess of 300% of the total bank borrowings. The interest rate on borrowings varies depending on the nature of the loan. The facility also requires a fee to be paid based on the amount of the commitment. This commitment fee is allocated to all the funds participating in the line of credit based on the average net assets of the funds. During the year ended December 31, 2011, the Funds did not have any borrowings under this facility.
Under the Company’s organizational documents, the Company shall indemnify its officers and directors to the full extent required or permitted under Maryland General Corporation Law and the federal securities laws. In addition, the Company, on behalf of the Fund, may enter into contracts that contain a variety of indemnifications. The Company’s maximum exposure under these arrangements is unknown. However, as of the date of these financial statements, the Company has not had prior claims or losses pursuant to these contracts and expects the risk of loss to be remote.
[This page intentionally left blank]
| Hartford Series Fund, Inc. |
| Financial Highlights |
| | | ─ Selected Per-Share Data(A) ─ | | | ─ Ratios and Supplemental Data ─ | |
| | | | | | | | | Net | | | | | | | | | | | | | | | | | | | | | | | | | | | | | | | | | | | | | |
| | | | | | | | | Realized | | | | | | | | | | | | | | | | | | | | | | | | | | | | | | | | | | | | | |
| | | | | | | | | and Un- | | | | | | | | | Distrib- | | | | | | Net | | | | | | | | | | | | Ratio of | | | Ratio of | | | | | | | |
| | | | | | Net | | | realized | | | | | | Dividends | | | utions | | | | | | Increase | | | | | | | | | | | | Expenses to | | | Expenses to | | | Ratio of Net | | | | |
| | | Net Asset | | | Invest- | | | Gain | | | | | | from Net | | | from | | | | | | (Decrease) | | | Net Asset | | | | | | | | | Average | | | Average | | | Investment | | | | |
| | | Value at | | | ment | | | (Loss) on | | | Total from | | | Invest- | | | Realized | | | Total | | | in Net | | | Value at | | | | | | Net Assets | | | Net Assets | | | Net Assets | | | Income to | | | Portfolio | |
| | | Beginning | | | Income | | | Invest- | | | Investment | | | ment | | | Capital | | | Distri- | | | Asset | | | End of | | | Total | | | at End of | | | Before | | | After | | | Average Net | | | Turnover | |
| Class | | of Period | | | (Loss) | | | ments | | | Operations | | | Income | | | Gains | | | butions | | | Value | | | Period | | | Return(B) | | | Period | | | Waivers(C) | | | Waivers(C) | | | Assets | | | Rate | |
| American Funds Asset Allocation HLS Fund |
| For the Year Ended December 31, 2011 |
| IB | | $ | 9.74 | | | $ | 0.14 | | | $ | (0.05 | ) | | $ | 0.09 | | | $ | (0.13 | ) | | $ | – | | | $ | (0.13 | ) | | $ | (0.04 | ) | | $ | 9.70 | | | | 1.02 | % | | $ | 64,356 | | | | 0.95 | % | | | 0.55 | % | | | 1.61 | % | | | 9 | % |
| For the Year Ended December 31, 2010 |
| IB | | | 8.85 | | | | 0.14 | | | | 0.91 | | | | 1.05 | | | | (0.16 | ) | | | — | | | | (0.16 | ) | | | 0.89 | | | | 9.74 | | | | 12.13 | | | | 58,326 | | | | 0.95 | | | | 0.55 | | | | 1.73 | | | | 11 | |
| For the Year Ended December 31, 2009(D) |
| IB | | | 7.31 | | | | 0.18 | | | | 1.53 | | | | 1.71 | | | | (0.14 | ) | | | (0.03 | ) | | | (0.17 | ) | | | 1.54 | | | | 8.85 | | | | 23.59 | | | | 48,568 | | | | 0.95 | | | | 0.55 | | | | 2.33 | | | | 8 | |
| From (commencement of operations) April 30, 2008 through December 31, 2008 |
| IB | | | 10.00 | | | | 0.19 | | | | (2.88 | ) | | | (2.69 | ) | | | — | | | | — | | | | — | | | | (2.69 | ) | | | 7.31 | | | | (26.88) | (E) | | | 26,312 | | | | 0.99 | (F) | | | 0.59 | (F) | | | 8.02 | (F) | | | — | |
| American Funds Blue Chip Income and Growth HLS Fund |
| For the Year Ended December 31, 2011 |
| IB | | | 9.18 | | | | 0.13 | | | | (0.24 | ) | | | (0.11 | ) | | | — | | | | — | | | | — | | | | (0.11 | ) | | | 9.07 | | | | (1.19 | ) | | | 32,425 | | | | 1.07 | | | | 0.57 | | | | 1.44 | | | | 14 | |
| For the Year Ended December 31, 2010 |
| IB | | | 8.44 | | | | 0.12 | | | | 0.86 | | | | 0.98 | | | | (0.24 | ) | | | — | | | | (0.24 | ) | | | 0.74 | | | | 9.18 | | | | 11.98 | | | | 34,030 | | | | 1.07 | | | | 0.57 | | | | 1.48 | | | | 11 | |
| For the Year Ended December 31, 2009(D) |
| IB | | | 6.74 | | | | 0.15 | | | | 1.68 | | | | 1.83 | | | | (0.09 | ) | | | (0.04 | ) | | | (0.13 | ) | | | 1.70 | | | | 8.44 | | | | 27.46 | | | | 29,030 | | | | 1.07 | | | | 0.57 | | | | 2.06 | | | | 6 | |
| From (commencement of operations) April 30, 2008 through December 31, 2008 |
| IB | | | 10.00 | | | | 0.14 | | | | (3.40 | ) | | | (3.26 | ) | | | — | | | | — | | | | — | | | | (3.26 | ) | | | 6.74 | | | | (32.64 | )(E) | | | 13,182 | | | | 1.17 | (F) | | | 0.67 | (F) | | | 6.79 | (F) | | | 3 | |
| American Funds Bond HLS Fund |
| For the Year Ended December 31, 2011 |
| IB | | | 10.21 | | | | 0.29 | | | | 0.30 | | | | 0.59 | | | | (0.28 | ) | | | — | | | | (0.28 | ) | | | 0.31 | | | | 10.52 | | | | 5.84 | | | | 198,203 | | | | 0.79 | | | | 0.54 | | | | 2.57 | | | | 15 | |
| For the Year Ended December 31, 2010 |
| IB | | | 9.84 | | | | 0.26 | | | | 0.35 | | | | 0.61 | | | | (0.24 | ) | | | — | | | | (0.24 | ) | | | 0.37 | | | | 10.21 | | | | 6.15 | | | | 206,360 | | | | 0.80 | | | | 0.55 | | | | 2.75 | | | | 13 | |
| For the Year Ended December 31, 2009(D) |
| IB | | | 8.98 | | | | 0.35 | | | | 0.74 | | | | 1.09 | | | | (0.23 | ) | | | — | | | | (0.23 | ) | | | 0.86 | | | | 9.84 | | | | 12.23 | | | | 181,550 | | | | 0.78 | | | | 0.53 | | | | 3.75 | | | | 2 | |
| From (commencement of operations) April 30, 2008 through December 31, 2008 |
| IB | | | 10.00 | | | | 0.44 | | | | (1.46 | ) | | | (1.02 | ) | | | — | | | | — | | | | — | | | | (1.02 | ) | | | 8.98 | | | | (10.21 | )(E) | | | 67,597 | | | | 0.80 | (F) | | | 0.55 | (F) | | | 16.32 | (F) | | | 5 | |
| American Funds Global Bond HLS Fund |
| For the Year Ended December 31, 2011 |
| IB | | | 10.86 | | | | 0.23 | | | | 0.24 | | | | 0.47 | | | | (0.23 | ) | | | (0.08 | ) | | | (0.31 | ) | | | 0.16 | | | | 11.02 | | | | 4.28 | | | | 44,352 | | | | 1.06 | | | | 0.56 | | | | 2.56 | | | | 16 | |
| For the Year Ended December 31, 2010 |
| IB | | | 10.47 | | | | 0.27 | | | | 0.24 | | | | 0.51 | | | | (0.11 | ) | | | (0.01 | ) | | | (0.12 | ) | | | 0.39 | | | | 10.86 | | | | 4.85 | | | | 38,654 | | | | 1.07 | | | | 0.57 | | | | 2.49 | | | | 17 | |
| For the Year Ended December 31, 2009(D) |
| IB | | | 9.85 | | | | 0.13 | | | | 0.79 | | | | 0.92 | | | | (0.30 | ) | | | — | | | | (0.30 | ) | | | 0.62 | | | | 10.47 | | | | 9.43 | | | | 38,533 | | | | 1.06 | | | | 0.56 | | | | 1.29 | | | | 5 | |
| From (commencement of operations) April 30, 2008 through December 31, 2008 |
| IB | | | 10.00 | | | | 0.42 | | | | (0.57 | ) | | | (0.15 | ) | | | — | | | | — | | | | — | | | | (0.15 | ) | | | 9.85 | | | | (1.51 | )(E) | | | 22,386 | | | | 1.10 | (F) | | | 0.60 | (F) | | | 13.11 | (F) | | | 42 | |
| American Funds Global Growth and Income HLS Fund |
| For the Year Ended December 31, 2011 |
| IB | | | 9.06 | | | | 0.22 | | | | (0.70 | ) | | | (0.48 | ) | | | (0.20 | ) | | | — | | | | (0.20 | ) | | | (0.68 | ) | | | 8.38 | | | | (5.19 | ) | | | 78,639 | | | | 1.09 | | | | 0.54 | | | | 2.30 | | | | 5 | |
| For the Year Ended December 31, 2010 |
| IB | | | 8.30 | | | | 0.20 | | | | 0.72 | | | | 0.92 | | | | (0.16 | ) | | | — | | | | (0.16 | ) | | | 0.76 | | | | 9.06 | | | | 11.41 | | | | 91,254 | | | | 1.10 | | | | 0.55 | | | | 2.25 | | | | 8 | |
| For the Year Ended December 31, 2009(D) |
| IB | | | 6.06 | | | | 0.16 | | | | 2.21 | | | | 2.37 | | | | (0.13 | ) | | | — | | | | (0.13 | ) | | | 2.24 | | | | 8.30 | | | | 39.37 | | | | 88,762 | | | | 1.09 | | | | 0.54 | | | | 2.39 | | | | 3 | |
| From (commencement of operations) April 30, 2008 through December 31, 2008 |
| IB | | | 10.00 | | | | 0.17 | | | | (4.11 | ) | | | (3.94 | ) | | | — | | | | — | | | | — | | | | (3.94 | ) | | | 6.06 | | | | (39.43 | )(E) | | | 44,065 | | | | 1.11 | (F) | | | 0.56 | (F) | | | 8.24 | (F) | | | — | |
| | | ─ Selected Per-Share Data(A) ─ | | | ─ Ratios and Supplemental Data ─ | |
| | | | | | | | | Net | | | | | | | | | | | | | | | | | | | | | | | | | | | | | | | | | | | | | |
| | | | | | | | | Realized | | | | | | | | | | | | | | | | | | | | | | | | | | | | | | | | | | | | | |
| | | | | | | | | and Un- | | | | | | | | | Distrib- | | | | | | Net | | | | | | | | | | | | Ratio of | | | Ratio of | | | | | | | |
| | | | | | Net | | | realized | | | | | | Dividends | | | utions | | | | | | Increase | | | | | | | | | | | | Expenses to | | | Expenses to | | | Ratio of Net | | | | |
| | | Net Asset | | | Invest- | | | Gain | | | | | | from Net | | | from | | | | | | (Decrease) | | | Net Asset | | | | | | | | | Average | | | Average | | | Investment | | | | |
| | | Value at | | | ment | | | (Loss) on | | | Total from | | | Invest- | | | Realized | | | Total | | | in Net | | | Value at | | | | | | Net Assets | | | Net Assets | | | Net Assets | | | Income to | | | Portfolio | |
| | | Beginning | | | Income | | | Invest- | | | Investment | | | ment | | | Capital | | | Distri- | | | Asset | | | End of | | | Total | | | at End of | | | Before | | | After | | | Average Net | | | Turnover | |
| Class | | of Period | | | (Loss) | | | ments | | | Operations | | | Income | | | Gains | | | butions | | | Value | | | Period | | | Return(B) | | | Period | | | Waivers(C) | | | Waivers(C) | | | Assets | | | Rate | |
| American Funds Global Growth HLS Fund |
| For the Year Ended December 31, 2011 |
| IB | | $ | 9.74 | | | $ | 0.10 | | | $ | (0.99 | ) | | $ | (0.89 | ) | | $ | (0.11 | ) | | $ | – | | | $ | (0.11 | ) | | $ | (1.00 | ) | | $ | 8.74 | | | | (9.18 | )% | | $ | 29,319 | | | | 1.32 | % | | | 0.57 | % | | | 0.95 | % | | | 11 | % |
| For the Year Ended December 31, 2010 |
| IB | | | 8.83 | | | | 0.10 | | | | 0.89 | | | | 0.99 | | | | (0.08 | ) | | | — | | | | (0.08 | ) | | | 0.91 | | | | 9.74 | | | | 11.41 | | | | 34,245 | | | | 1.32 | | | | 0.57 | | | | 1.17 | | | | 11 | |
| For the Year Ended December 31, 2009(D) |
| IB | | | 6.40 | | | | 0.09 | | | | 2.57 | | | | 2.66 | | | | (0.12 | ) | | | (0.11 | ) | | | (0.23 | ) | | | 2.43 | | | | 8.83 | | | | 41.78 | | | | 30,457 | | | | 1.32 | | | | 0.57 | | | | 1.24 | | | | 12 | |
| From (commencement of operations) April 30, 2008 through December 31, 2008 |
| IB | | | 10.00 | | | | 0.15 | | | | (3.75 | ) | | | (3.60 | ) | | | — | | | | — | | | | — | | | | (3.60 | ) | | | 6.40 | | | | (35.95 | )(E) | | | 15,490 | | | | 1.37 | (F) | | | 0.62 | (F) | | | 5.68 | (F) | | | — | |
| American Funds Global Small Capitalization HLS Fund |
| For the Year Ended December 31, 2011 |
| IB | | | 9.92 | | | | 0.10 | | | | (2.01 | ) | | | (1.91 | ) | | | (0.13 | ) | | | (0.05 | ) | | | (0.18 | ) | | | (2.09 | ) | | | 7.83 | | | | (19.40 | ) | | | 55,658 | | | | 1.11 | | | | 0.56 | | | | 0.98 | | | | 11 | |
| For the Year Ended December 31, 2010 |
| IB | | | 8.13 | | | | 0.11 | | | | 1.68 | | | | 1.79 | | | | — | | | | — | | | | — | | | | 1.79 | | | | 9.92 | | | | 22.06 | | | | 74,999 | | | | 1.12 | | | | 0.57 | | | | 1.35 | | | | 16 | |
| For the Year Ended December 31, 2009(D) |
| IB | | | 5.10 | | | | — | | | | 3.08 | | | | 3.08 | | | | — | | | | (0.05 | ) | | | (0.05 | ) | | | 3.03 | | | | 8.13 | | | | 60.77 | | | | 61,519 | | | | 1.10 | | | | 0.55 | | | | 0.02 | | | | 10 | |
| From (commencement of operations) April 30, 2008 through December 31, 2008 |
| IB | | | 10.00 | | | | (0.01 | ) | | | (4.89 | ) | | | (4.90 | ) | | | — | | | | — | | | | — | | | | (4.90 | ) | | | 5.10 | | | | (49.04 | )(E) | | | 19,807 | | | | 1.16 | (F) | | | 0.61 | (F) | | | (0.62 | )(F) | | | — | |
| American Funds Growth HLS Fund |
| For the Year Ended December 31, 2011 |
| IB | | | 9.38 | | | | 0.03 | | | | (0.46 | ) | | | (0.43 | ) | | | — | | | | — | | | | — | | | | (0.43 | ) | | | 8.95 | | | | (4.57 | ) | | | 317,968 | | | | 1.04 | | | | 0.54 | | | | 0.33 | | | | 5 | |
| For the Year Ended December 31, 2010 |
| IB | | | 7.96 | | | | 0.04 | | | | 1.42 | | | | 1.46 | | | | (0.04 | ) | | | — | | | | (0.04 | ) | | | 1.42 | | | | 9.38 | | | | 18.36 | | | | 356,162 | | | | 1.05 | | | | 0.55 | | | | 0.43 | | | | 7 | |
| For the Year Ended December 31, 2009(D) |
| IB | | | 5.81 | | | | 0.03 | | | | 2.22 | | | | 2.25 | | | | (0.03 | ) | | | (0.07 | ) | | | (0.10 | ) | | | 2.15 | | | | 7.96 | | | | 39.02 | | | | 296,659 | | | | 1.03 | | | | 0.53 | | | | 0.47 | | | | 3 | |
| From (commencement of operations) April 30, 2008 through December 31, 2008 |
| IB | | | 10.00 | | | | 0.07 | | | | (4.18 | ) | | | (4.11 | ) | | | (0.08 | ) | | | — | | | | (0.08 | ) | | | (4.19 | ) | | | 5.81 | | | | (41.18 | )(E) | | | 122,888 | | | | 1.03 | (F) | | | 0.53 | (F) | | | 3.39 | (F) | | | — | |
| American Funds Growth-Income HLS Fund |
| For the Year Ended December 31, 2011 |
| IB | | | 9.00 | | | | 0.12 | | | | (0.31 | ) | | | (0.19 | ) | | | — | | | | — | | | | — | | | | (0.19 | ) | | | 8.81 | | | | (2.12 | ) | | | 170,059 | | | | 0.98 | | | | 0.53 | | | | 1.26 | | | | 5 | |
| For the Year Ended December 31, 2010 |
| IB | | | 8.20 | | | | 0.10 | | | | 0.81 | | | | 0.91 | | | | (0.11 | ) | | | — | | | | (0.11 | ) | | | 0.80 | | | | 9.00 | | | | 11.11 | | | | 185,836 | | | | 0.99 | | | | 0.54 | | | | 1.19 | | | | 8 | |
| For the Year Ended December 31, 2009(D) |
| IB | | | 6.39 | | | | 0.11 | | | | 1.86 | | | | 1.97 | | | | (0.11 | ) | | | (0.05 | ) | | | (0.16 | ) | | | 1.81 | | | | 8.20 | | | | 30.85 | | | | 168,690 | | | | 0.98 | | | | 0.53 | | | | 1.56 | | | | 1 | |
| From (commencement of operations) April 30, 2008 through December 31, 2008 |
| IB | | | 10.00 | | | | 0.13 | | | | (3.63 | ) | | | (3.50 | ) | | | (0.11 | ) | | | — | | | | (0.11 | ) | | | (3.61 | ) | | | 6.39 | | | | (34.98 | )(E) | | | 74,039 | | | | 0.99 | (F) | | | 0.54 | (F) | | | 5.87 | (F) | | | — | |
| American Funds International HLS Fund |
| For the Year Ended December 31, 2011 |
| IB | | | 8.96 | | | | 0.13 | | | | (1.40 | ) | | | (1.27 | ) | | | (0.15 | ) | | | — | | | | (0.15 | ) | | | (1.42 | ) | | | 7.54 | | | | (14.23 | ) | | | 208,399 | | | | 1.14 | | | | 0.54 | | | | 1.52 | | | | 9 | |
| For the Year Ended December 31, 2010 |
| IB | | | 8.50 | | | | 0.13 | | | | 0.44 | | | | 0.57 | | | | (0.08 | ) | | | (0.03 | ) | | | (0.11 | ) | | | 0.46 | | | | 8.96 | | | | 6.92 | | | | 235,702 | | | | 1.16 | | | | 0.56 | | | | 1.78 | | | | 7 | |
| For the Year Ended December 31, 2009(D) |
| IB | | | 6.09 | | | | 0.11 | | | | 2.48 | | | | 2.59 | | | | (0.11 | ) | | | (0.07 | ) | | | (0.18 | ) | | | 2.41 | | | | 8.50 | | | | 42.75 | | | | 197,258 | | | | 1.13 | | | | 0.53 | | | | 1.53 | | | | 7 | |
| From (commencement of operations) April 30, 2008 through December 31, 2008 |
| IB | | | 10.00 | | | | 0.16 | | | | (4.07 | ) | | | (3.91 | ) | | | — | | | | — | | | | — | | | | (3.91 | ) | | | 6.09 | | | | (39.10 | )(E) | | | 78,825 | | | | 1.14 | (F) | | | 0.54 | (F) | | | 8.05 | (F) | | | — | |
| Hartford Series Fund, Inc. |
| Financial Highlights – (continued) |
| | | ─ Selected Per-Share Data(A) ─ | | | ─ Ratios and Supplemental Data ─ | |
| | | | | | | | | Net | | | | | | | | | | | | | | | | | | | | | | | | | | | | | | | | | | | | | |
| | | | | | | | | Realized | | | | | | | | | | | | | | | | | | | | | | | | | | | | | | | | | | | | | |
| | | | | | | | | and Un- | | | | | | | | | Distrib- | | | | | | Net | | | | | | | | | | | | Ratio of | | | Ratio of | | | | | | | |
| | | | | | Net | | | realized | | | | | | Dividends | | | utions | | | | | | Increase | | | | | | | | | | | | Expenses to | | | Expenses to | | | Ratio of Net | | | | |
| | | Net Asset | | | Invest- | | | Gain | | | | | | from Net | | | from | | | | | | (Decrease) | | | Net Asset | | | | | | | | | Average | | | Average | | | Investment | | | | |
| | | Value at | | | ment | | | (Loss) on | | | Total from | | | Invest- | | | Realized | | | Total | | | in Net | | | Value at | | | | | | Net Assets | | | Net Assets | | | Net Assets | | | Income to | | | Portfolio | |
| | | Beginning | | | Income | | | Invest- | | | Investment | | | ment | | | Capital | | | Distri- | | | Asset | | | End of | | | Total | | | at End of | | | Before | | | After | | | Average Net | | | Turnover | |
| Class | | of Period | | | (Loss) | | | ments | | | Operations | | | Income | | | Gains | | | butions | | | Value | | | Period | | | Return(B) | | | Period | | | Waivers(C) | | | Waivers(C) | | | Assets | | | Rate | |
| American Funds New World HLS Fund |
| For the Year Ended December 31, 2011 |
| IB | | $ | 10.24 | | | $ | 0.15 | | | $ | (1.60 | ) | | $ | (1.45 | ) | | $ | (0.13 | ) | | $ | — | | | $ | (0.13 | ) | | $ | (1.58 | ) | | $ | 8.66 | | | | (14.23 | )% | | $ | 52,569 | | | | 1.41 | % | | | 0.56 | % | | | 1.33 | % | | | 9 | % |
| For the Year Ended December 31, 2010 |
| IB | | | 8.80 | | | | 0.11 | | | | 1.42 | | | | 1.53 | | | | (0.09 | ) | | | — | | | | (0.09 | ) | | | 1.44 | | | | 10.24 | | | | 17.54 | | | | 72,257 | | | | 1.42 | | | | 0.57 | | | | 1.30 | | | | 12 | |
| For the Year Ended December 31, 2009(D) |
| IB | | | 6.00 | | | | 0.10 | | | | 2.84 | | | | 2.94 | | | | (0.08 | ) | | | (0.06 | ) | | | (0.14 | ) | | | 2.80 | | | | 8.80 | | | | 49.14 | | | | 58,578 | | | | 1.40 | | | | 0.55 | | | | 1.44 | | | | 8 | |
| From (commencement of operations) April 30, 2008 through December 31, 2008 |
| IB | | | 10.00 | | | | 0.11 | | | | (4.11 | ) | | | (4.00 | ) | | | — | | | | — | | | | — | | | | (4.00 | ) | | | 6.00 | | | | (39.97 | )(E) | | | 23,933 | | | | 1.44 | (F) | | | 0.59 | (F) | | | 5.06 | (F) | | | 1 | |
| (A) | Information presented relates to a share outstanding throughout the indicated period. |
| (B) | The figures do not include sales charges or other fees which may be applied at the variable life insurance, variable annuity or qualified retirement plan product level. Any such additional sales charges or other fees would lower the Fund's performance. |
| (C) | Expense ratios do not include expenses of the underlying funds. |
| (D) | Per share amounts have been calculated using average shares method. |
| Report of Independent Registered Public Accounting Firm |
| The Board of Directors and Shareholders of |
| Hartford Series Fund, Inc. |
We have audited the accompanying statements of assets and liabilities, including the schedule of investments, of American Funds Asset Allocation HLS Fund, American Funds Blue Chip Income and Growth HLS Fund, American Funds Bond HLS Fund, American Funds Global Bond HLS Fund, American Funds Global Growth and Income HLS Fund, American Funds Global Growth HLS Fund, American Funds Global Small Capitalization HLS Fund, American Funds Growth HLS Fund, American Funds Growth-Income HLS Fund, American Funds International HLS Fund and American Funds New World HLS Fund (eleven of the thirty portfolios constituting Hartford Series Fund, Inc. (the Funds)) as of December 31, 2011, and the related statements of operations for the year then ended, the statements of changes in net assets for each of the two years in the period then ended, and the financial highlights for each of the periods indicated therein. These financial statements and financial highlights are the responsibility of the Funds' management. Our responsibility is to express an opinion on these financial statements and financial highlights based on our audits.
We conducted our audits in accordance with the standards of the Public Company Accounting Oversight Board (United States). Those standards require that we plan and perform the audit to obtain reasonable assurance about whether the financial statements and financial highlights are free of material misstatement. We were not engaged to perform an audit of the Funds’ internal control over financial reporting. Our audits included consideration of internal control over financial reporting as a basis for designing audit procedures that are appropriate in the circumstances, but not for the purpose of expressing an opinion on the effectiveness of the Company's internal control over financial reporting. Accordingly, we express no such opinion. An audit also includes examining, on a test basis, evidence supporting the amounts and disclosures in the financial statements and financial highlights, assessing the accounting principles used and significant estimates made by management, and evaluating the overall financial statement presentation. Our procedures included confirmation of securities owned as of December 31, 2011, by correspondence with the transfer agent of the underlying funds. We believe that our audits provide a reasonable basis for our opinion.
In our opinion, the financial statements and financial highlights referred to above present fairly, in all material respects, the financial position of each of the respective portfolios constituting the Hartford Series Fund, Inc. at December 31, 2011, the results of their operations for the year then ended, the changes in their net assets for each of the two years in the period then ended, and the financial highlights for each of the periods indicated therein, in conformity with U.S. generally accepted accounting principles.
|
| |
| Minneapolis, MN |
| February 13, 2012 |
| Hartford Series Fund, Inc. |
| Directors and Officers (Unaudited) |
The Board of Directors of the Company appoints officers who are responsible for the day-to-day operations of the Funds and who execute policies formulated by the Directors. Each director serves until his or her death, resignation, or retirement or until the next annual meeting of shareholders is held or until his or her successor is elected and qualifies.
Directors and officers who are employed by or who have a financial interest in The Hartford are considered “interested” persons of the Funds pursuant to the 1940 Act. Each officer and two of the Company’s directors, as noted in the chart below, are “interested” persons of the Funds. Each director serves as a director for The Hartford Mutual Funds, Inc., The Hartford Mutual Funds II, Inc., Hartford Series Fund, Inc., Hartford HLS Series Fund II, Inc., and as a trustee for The Hartford Alternative Strategies Fund, which, as of December 31, 2011, collectively consist of 91 funds. Correspondence may be sent to directors and officers c/o Hartford Mutual Funds, P.O. Box 2999, Hartford, Connecticut 06104-2999, except that correspondence to Ms. Fagely may be sent to 500 Bielenberg Drive, Woodbury, Minnesota 55125.
The table below sets forth, for each director and officer, his or her name, year of birth, current position with the Company and date first elected or appointed to Hartford Series Fund, Inc. (“HSF”), and Hartford HLS Series Fund II, Inc. (“HSF2”), principal occupation, and, for directors, other directorships held. The Funds’ statement of additional information contains further information on the directors and is available free of charge by calling 1-800-862-6668 or writing to Hartford HLS Funds, c/o Individual Annuity Services, P.O. Box 5085, Hartford, CT 06102-5085.
Information on the aggregate remuneration paid to the directors of the Company can be found in the Statement of Operations herein. The Funds pay to The Hartford a portion of the chief compliance officer’s compensation, but do not pay salaries or compensation to any of their other officers or directors who are employed by The Hartford.
Non-Interested Directors
Lynn S. Birdsong (1946) Director since 2003, Co-Chairman of the Investment Committee
Mr. Birdsong is a private investor. Mr. Birdsong currently serves as a Director of the Sovereign High Yield Investment Company (April 2010 to current). Mr. Birdsong currently serves as an Independent Director of Nomura Partners Funds, Inc. (formerly, The Japan Fund) (March 2003 to current). From 2003 to March 2005, Mr. Birdsong was an independent director of the Atlantic Whitehall Funds. From 1979 to 2002, Mr. Birdsong was a managing director of Zurich Scudder Investments, an investment management firm. During his employment with Scudder, Mr. Birdsong was an Interested Director of The Japan Fund. Since 1981, Mr. Birdsong has been a partner in Birdsong Company, an advertising specialty firm.
Robert M. Gavin, Jr. (1940) Director since 2002 (HSF) and 1986 (HSF2), Chairman of the Board since 2004
Dr. Gavin is an educational consultant. Prior to September 1, 2001, he was President of Cranbrook Education Community and prior to July 1996, he was President of Macalester College, St. Paul, Minnesota.
Duane E. Hill (1945) Director since 2001 (HSF) and 2002 (HSF2), Chairman of the Nominating Committee
Mr. Hill is Partner of TSG Ventures L.P., a private equity investment company. Mr. Hill is a former partner of TSG Capital Group, a private equity investment firm that served as sponsor and lead investor in leveraged buyouts of middle market companies.
Sandra S. Jaffee (1941) Director since 2005
Ms. Jaffee served as Chairman (2008 to 2009) and Chief Executive Officer of Fortent (formerly Searchspace Group), a leading provider of compliance/regulatory technology to financial institutions from August 2005 to August 2009. From August 2004 to August 2005, Ms. Jaffee served as an Entrepreneur in Residence with Warburg Pincus, a private equity firm. From September 1995 to July 2004, Ms. Jaffee served as Executive Vice President at Citigroup, where she was President and Chief Executive Officer of Citibank’s Global Securities Services (1995 to 2003). Ms. Jaffe currently serves as a member of the Board of Directors of Broadridge Financial Solutions as well as a Trustee of Muhlenberg College.
William P. Johnston (1944) Director since 2005, Chairman of the Compliance Committee
In June 2006, Mr. Johnston was appointed as Senior Advisor to The Carlyle Group, a global private equity investment firm. In August 2007, Mr. Johnston was elected to the Board of Directors of LifeCare Holdings, Inc. In February 2008, Mr. Johnston was elected to the Board of Directors of HCR-ManorCare, Inc. In May 2006, Mr. Johnston was elected to the Supervisory Board of Fresenius Medical Care AG & Co. KGaA, after its acquisition of Renal Care Group, Inc. in March 2006. Mr. Johnston joined Renal Care Group in November 2002 as a member of the Board of Directors and served as Chairman of the Board from March 2003 through March 2006. Mr. Johnston served as a Director of MultiPlan, Inc. from July 2006 through August 2010. From September 1987 to December 2002, Mr. Johnston was with Equitable Securities Corporation (and its successors, SunTrust Equitable Securities and SunTrust Robinson Humphrey) serving in various investment banking and managerial positions, including Managing Director and Head of Investment Banking, Chief Executive Officer and Vice Chairman.
Phillip O. Peterson (1944) Director since 2002 (HSF) and 2000 (HSF2), Chairman of the Audit Committee
Mr. Peterson is a mutual fund industry consultant. He was a partner of KPMG LLP (an accounting firm) until July 1999. Mr. Peterson joined William Blair Funds in February 2007 as a member of the Board of Trustees. From January 2004 to April 2005, Mr. Peterson served as Independent President of the Strong Mutual Funds.
Lemma W. Senbet (1946) Director since 2005
Dr. Senbet is the William E. Mayer Chair Professor of Finance and Director, Center for Financial Policy, at the University of Maryland, Robert H. Smith School of Business. He was chair of the Finance Department from 1998 to 2006. Previously he was a chaired professor of finance at the University of Wisconsin-Madison. Also, he was director of the Fortis Funds from March 2000 to July 2002. Dr. Senbet served the finance profession in various capacities, including as director of the American Finance Association and President of the Western Finance Association. In 2006, Dr. Senbet was inducted Fellow of Financial Management Association International for his career-long distinguished scholarship and professional service.
Interested Directors and Officers
David N. Levenson (1966) Director since 2010
Mr. Levenson currently serves as President of The Hartford’s Wealth Management business. He was appointed to this role in July 2010. Previously, Mr. Levenson served as Executive Vice President of Legacy Holdings for The Hartford from June 2009 to July 2010. From 2006 to 2009, Mr. Levenson was with Hartford Life Insurance K.K. where he served as President and Chief Executive Officer from 2007 to 2009. He served as Managing Director of Hartford Investment Management Company from 2005 to 2006. Additionally, Mr. Levenson serves as Executive Vice President of The Hartford and as President, Director and Chief Executive Officer of Hartford Life Insurance Company (“HLIC”) and Hartford Life, Inc. (“HL Inc.”).
Lowndes A. Smith (1939) Director since 1996 (HSF) and 2002 (HSF2), Co-Chairman of the Investment Committee
Mr. Smith served as Vice Chairman of The Hartford from February 1997 to January 2002, as President and Chief Executive Officer of HL Inc. from February 1997 to January 2002, and as President and Chief Operating Officer of The Hartford Life Insurance Companies from January 1989 to January 2002. Mr. Smith serves as a Director of White Mountains Insurance Group, Ltd., One Beacon Insurance and Symetra Financial and as a Managing Director of Whittington Gray Associates.
Other Officers
James E. Davey (1964) President and Chief Executive Officer since 2010
Mr. Davey serves as Executive Vice President of HLIC. Additionally, Mr. Davey serves as President, Chief Executive Officer and Manager of Hartford Investment Financial Services, Inc. (“HIFSCO”) and President, Chief Executive Officer and Manager of HL Advisors. Mr. Davey joined The Hartford in 2002.
Michael R. Dressen (1963) AML Compliance Officer since 2011
Mr. Dressen currently serves as Assistant Vice President of HLIC. He also serves as Chief Compliance Officer and AML Compliance Officer of Hartford Administrative Services Company (“HASCO”) and as Assistant Secretary and Compliance Officer of HIFSCO. Mr Dressen joined The Hartford in 2005 from State Farm Insurance Companies where he held various positions related to mutual funds, variable products, and property casualty insurance.
Tamara L. Fagely (1958) Vice President, Treasurer and Controller since 2002 (HSF) and 1993 (HSF2)
Ms. Fagely has been a Vice President of HASCO since 1998 and Chief Financial Officer since 2006. Currently Ms. Fagely is a Vice President of HLIC. She served as Assistant Vice President of HLIC from December 2001 through March 2005. In addition, Ms. Fagely is Controller and Chief Financial Officer of HIFSCO.
Dr. Robert J. Froehlich (1953) Senior Managing Director since 2009
Dr. Froehlich joined The Hartford as Senior Managing Director in September 2009. Prior to joining The Hartford, Dr. Froehlich served as Vice Chairman of Deutsche Asset Management from 1997-2009.
Edward P. Macdonald (1967) Vice President, Secretary and Chief Legal Officer since 2005
Mr. Macdonald serves as Vice President of HLIC and Chief Legal Officer of Mutual Funds and Vice President of HIFSCO. He also serves as Vice President and Secretary of HASCO, and Chief Legal Officer, Secretary and Vice President of HL Advisors. Mr. Macdonald joined The Hartford in 2005.
| Hartford Series Fund, Inc. |
| Directors and Officers (Unaudited) – (continued) |
Vernon J. Meyer (1964) Vice President since 2006
Mr. Meyer serves as Senior Vice President of HLIC. He also serves as Senior Vice President of HIFSCO and HL Advisors. Mr. Meyer joined The Hartford in 2004.
Colleen B. Pernerewski (1969) Vice President and Chief Compliance Officer since 2010
Ms. Pernerewski serves as Vice President and Chief Investment Advisor Compliance Officer of HIFSCO and as Vice President and Chief Compliance Officer of HL Advisors. Ms. Pernerewski joined The Hartford in 2005 from Travelers Life and Annuity where she served as Counsel (2004-2005). Prior to Travelers Life and Annuity, Ms. Pernerewski held the position of Counsel at The Hartford (1998-2004).
Elizabeth L. Schroeder (1966) Vice President since 2010
Ms. Schroeder currently serves as Assistant Vice President of HLIC. Ms. Schroeder joined HLIC in 1991. She is also an Assistant Vice President of HASCO, HIFSCO and HL Advisors.
Martin Swanson (1962) Vice President since 2010
Mr. Swanson is a Vice President of HLIC. Mr. Swanson also serves as Vice President/Marketing for HIFSCO. Prior to joining HLIC in 1998, Mr. Swanson was a Vice President at PaineWebber, Inc.
Jane Wolak (1961) Vice President since 2009
Ms. Wolak currently serves as Senior Vice President of HLIC. Ms. Wolak joined HLIC as Vice President, Retail Product Services in May 2007. She is also Vice President of HASCO. Previously, Ms. Wolak was with Sun Life Financial where she held the position of Vice President, Service Center Operations from 2001-2007.
HOW TO OBTAIN A COPY OF THE FUND’S PROXY VOTING POLICIES AND VOTING RECORDS (UNAUDITED)
A description of the policies and procedures that the Funds use to determine how to vote proxies relating to portfolio securities and a record of how the Funds voted any proxies for the twelve-month period ended June 30, 2011 are available (1) without charge, upon request, by calling 800-862-6668 and (2) on the SEC’s website at http://www.sec.gov.
QUARTERLY PORTFOLIO HOLDINGS INFORMATION (UNAUDITED)
The Funds file a complete schedule of portfolio holdings with the SEC for the first and third quarters of each fiscal year on Form N-Qs. The Funds’ Forms are available (1) without charge, upon request, by calling 800-862-6668 and (2) on the SEC’s website at http://www.sec.gov. The Form N-Q may be reviewed and copied at the SEC’s Public Reference Room in Washington, DC. Information on the operation of the Public Reference Room may be obtained by calling 1-800-SEC-0330.
| Hartford Series Fund, Inc. |
| Expense Example (Unaudited) |
Your Fund's Expenses
As a shareholder of a Fund, you incur two types of costs: (1) transaction costs and (2) ongoing costs including investment management fees, distribution fees, and other fund expenses. This example is intended to help you understand your ongoing costs (in dollars) of investing in a Fund and to compare these costs with the ongoing costs of investing in other mutual funds. The example is based on an investment of $1,000 invested at the beginning of the period and held for the period of June 30, 2011 through December 31, 2011.
Actual Expenses
The first set of columns of the table below provides information about actual account values and actual expenses. You may use the information in this column, together with the amount you invested, to estimate the expenses that you paid over the period. Simply divide your account value by $1,000 (for example, an $8,600 account value divided by $1,000 = 8.6), then multiply the result by the number in the line under the heading entitled “Expenses Paid During Period” to estimate the expenses you paid on your account during this period.
Hypothetical Example for Comparison Purposes
The second set of columns of the table below provides information about hypothetical account values and hypothetical expenses based on a Fund’s actual expense ratio and an assumed rate of return of 5% per year before expenses, which is not the Fund’s actual return. The hypothetical account values and expenses may not be used to estimate the actual ending account balance or expenses you paid for the period. You may use this information to compare the ongoing costs of investing in a Fund and other funds. To do so, compare this 5% hypothetical example with the 5% hypothetical examples that appear in the shareholder reports of the other funds.
Please note that the expenses shown in the table are meant to highlight your ongoing costs only and do not reflect any transactional costs, such as sales charges (loads) and CDSC. Therefore, the second set of columns of the table is useful in comparing ongoing costs only, and will not help you determine the relative total costs of owning different funds. In addition, if these transactional costs were included, your costs would be higher. Expenses are equal to the Fund's annualized expense ratios multiplied by average account value over the period, multiplied by 184/365 (to reflect the one-half year period).
| | | | | | | Expenses paid | | | | | | | Expenses paid | | | | Days in | | | |
| | | | | Ending | | during the period | | | | | Ending | | during the period | | | | the | | Days | |
| | | Beginning | | Account Value | | June 30, 2011 | | | Beginning Account | | Account Value | | June 30, | | Annualized | | current | | in the | |
| | | Account Value | | December 31, | | through | | | Value June 30, | | December 31, | | 2011 through | | expense | | 1/2 | | full | |
| | | June 30, 2011 | | 2011 | | December 31, 2011 | | | 2011 | | 2011 | | December 31, 2011 | | ratio | | year | | year | |
| American Funds Asset Allocation HLS Fund | | | | | | | | | | | | | | |
| Class IB | | $1,000.00 | | $959.70 | | $2.77 | | | $1,000.00 | | $1,022.38 | | $2.85 | | 0.56% | | 184 | | 365 | |
| American Funds Blue Chip Income and Growth HLS Fund | | | | | | | | | | | | | | |
| Class IB | | $1,000.00 | | $954.48 | | $2.91 | | | $1,000.00 | | $1,022.23 | | $3.01 | | 0.59% | | 184 | | 365 | |
| American Funds Bond HLS Fund | | | | | | | | | | | | | | |
| Class IB | | $1,000.00 | | $1,033.73 | | $2.77 | | | $1,000.00 | | $1,022.48 | | $2.75 | | 0.54% | | 184 | | 365 | |
| American Funds Global Bond HLS Fund | | | | | | | | | | | | | | |
| Class IB | | $1,000.00 | | $1,000.97 | | $2.93 | | | $1,000.00 | | $1,022.28 | | $2.96 | | 0.58% | | 184 | | 365 | |
| American Funds Global Growth and Income HLS Fund | | | | | | | | | | | | | | |
| Class IB | | $1,000.00 | | $920.61 | | $2.71 | | | $1,000.00 | | $1,022.38 | | $2.85 | | 0.56% | | 184 | | 365 | |
| American Funds Global Growth HLS Fund | | | | | | | | | | | | | | |
| Class IB | | $1,000.00 | | $865.41 | | $2.82 | | | $1,000.00 | | $1,022.18 | | $3.06 | | 0.60% | | 184 | | 365 | |
| American Funds Global Small Capitalization HLS Fund | | | | | | | | | | | | | | |
| Class IB | | $1,000.00 | | $802.87 | | $2.64 | | | $1,000.00 | | $1,022.28 | | $2.96 | | 0.58% | | 184 | | 365 | |
| American Funds Growth HLS Fund | | | | | | | | | | | | | | |
| Class IB | | $1,000.00 | | $901.70 | | $2.64 | | | $1,000.00 | | $1,022.43 | | $2.80 | | 0.55% | | 184 | | 365 | |
| American Funds Growth-Income HLS Fund | | | | | | | | | | | | | | |
| Class IB | | $1,000.00 | | $938.12 | | $2.64 | | | $1,000.00 | | $1,022.48 | | $2.75 | | 0.54% | | 184 | | 365 | |
| American Funds International HLS Fund | | | | | | | | | | | | | | |
| Class IB | | $1,000.00 | | $822.64 | | $2.53 | | | $1,000.00 | | $1,022.43 | | $2.80 | | 0.55% | | 184 | | 365 | |
| American Funds New World HLS Fund | | | | | | | | | | | | | | |
| Class IB | | $1,000.00 | | $849.98 | | $2.70 | | | $1,000.00 | | $1,022.28 | | $2.96 | | 0.58% | | 184 | | 365 | |
| Hartford Series Fund, Inc. |
| Approval of Investment Management Agreement (Unaudited) |
Section 15(c) of the Investment Company Act of 1940, as amended (the “1940 Act”), requires that each mutual fund’s board of directors, including a majority of those directors who are not “interested persons” of the mutual fund, as defined in the 1940 Act (the “Independent Directors”), annually review and consider the continuation of the mutual fund’s investment advisory agreement. At its meeting held on August 2-3, 2011, the Board of Directors (the “Board”) of Hartford Series Fund, Inc., including each of the Independent Directors, unanimously voted to approve the continuation of the investment management agreement for the Funds with HL Investment Advisors, LLC (“HL Advisors”) (the “Agreement”). Each Fund invests all of its assets directly in a corresponding portfolio of the American Funds Insurance Series (each a “Master Fund,” and collectively, the “Master Funds”) that is advised by Capital Research and Management Company (“CRMC”).
In the months preceding the August 2-3, 2011 meeting, the Board requested, received, and reviewed written responses from HL Advisors to questions posed to it on behalf of the Independent Directors and supporting materials relating to those questions and responses. The Board considered information furnished to the Board at its meetings throughout the year, as well as information specifically prepared in connection with the annual approval of the Agreement at the Board’s meetings held on June 21-22, 2011 and August 2-3, 2011. Information provided to the Board at its meetings throughout the year included, among other things, reports on Fund performance, legal and compliance matters, sales and marketing activity, shareholder services, and the other services provided to the Funds by HL Advisors and its affiliates. In addition, the Board received in-person presentations by Fund officers and representatives of HL Advisors at the Board’s meetings on June 21-22, 2011 and August 2-3, 2011 concerning the Agreement.
The Independent Directors, advised by independent legal counsel, engaged two service providers to assist them with evaluating the Agreement with respect to each Fund. Lipper Inc. (“Lipper”), an independent provider of investment company data, was retained to provide the Board with reports on how the Funds’ contractual management fees, actual management fees, other non-management fees, overall expense ratios and investment performance compared to those of mutual funds with similar investment objectives. The Independent Directors also engaged an independent financial services consulting firm (the “Consultant”) to assist them in evaluating the Funds’ management fees, other non-management fees, overall expense ratios and investment performance. In addition, the Consultant reviewed the profitability calculations utilized by HL Advisors in connection with the continuation of the Agreement.
In determining to continue the Agreement for the Funds, the members of the Board reviewed and evaluated information and factors they believed to be relevant and appropriate in light of the information that the Board deemed necessary and appropriate through the exercise of their reasonable business judgment. While individual members of the Board may have weighed certain factors differently, the Board’s determination to continue the Agreement was based on a comprehensive consideration of all information provided to the Board throughout the year and specifically with respect to the continuation of the Agreement. A more detailed discussion of the factors the Board considered with respect to its approval of the Agreement is provided below.
Nature, Extent, And Quality Of Services Provided by HL Advisors
The Board requested and considered information concerning the nature, extent, and quality of the services provided to the Funds by HL Advisors. The Board considered, among other things, the terms of the Agreement and the range of services provided by HL Advisors. In this regard, the Board considered that because of the master-feeder structure, the portfolio management services provided by HL Advisors to each Fund are limited to selecting one of the Master Funds, investing a Fund’s assets in that Master Fund, and monitoring the Master Fund’s performance as an investment for the Fund. The Board also considered that certain administrative services, such as oversight of service providers, production of Fund registration statements and shareholder reports, and provision of information to the Board, are also provided by HL Advisors under the Agreement. The Board considered HL Advisors’ reputation and overall financial strength, as well as its willingness to consider and implement organizational and operational changes designed to improve services to each Fund. In addition, the Board considered the quality of HL Advisors’ communications with the Board and responsiveness to Board inquiries.
The Board also requested and evaluated information concerning HL Advisors’ regulatory and compliance environment. In this regard, the Board requested and reviewed information on HL Advisors’ compliance policies and procedures, compliance history, and a report from the Funds’ Chief Compliance Officer on HL Advisors’ compliance with applicable laws and regulations, including responses to regulatory developments and compliance issues raised by regulators. The Board also noted HL Advisors’ support of the Funds’ compliance control structure, particularly the resources devoted by HL Advisors in support of the Funds’
obligations pursuant to Rule 38a-1 under the 1940 Act. The Board considered that HL Advisors or its affiliates are responsible for providing the Funds’ officers. In addition, the Board considered the nature and quality of the services provided to the Funds and their shareholders by HL Advisors’ affiliates. Further, the Board considered the possibility that at some point in the future, HL Advisors may recommend the withdrawal of one or more of the Funds from the master-feeder structure and the management of the Funds’ assets directly or through a sub-adviser.
Based on these considerations, the Board concluded that it was satisfied with the nature, extent and quality of the services provided to the Funds by HL Advisors.
Performance of the Funds
The Board considered the investment performance of the Funds. In this regard, the Board reviewed the performance of each Fund over different time periods presented in the materials and evaluated HL Advisors’ analysis of each Fund’s performance for these time periods. The Board considered information and materials provided to the Board by HL Advisors concerning Fund performance, as well as information from Lipper comparing the investment performance of each Fund to an appropriate benchmark and universe of peer funds. The Board noted that the performance of each Fund was within expectations in light of each Fund’s objective of providing access to the corresponding Master Fund.
The Board noted that the performance of each Fund is based on the performance of the Fund’s corresponding Master Fund. The Board noted that CRMC uses a system of multiple portfolio counselors in managing the Master Funds’ assets. Under this approach, the portfolio of a Master Fund is divided into segments managed by individual portfolio counselors who decide how their respective segment will be invested within the limits provided by a Master Fund’s investment objective, policies and restrictions and subject to the oversight of CRMC’s investment committee.
In light of all the considerations noted above, the Board concluded that while there could be no guarantee of future results, the overall performance of the Funds and their corresponding Master Funds was satisfactory.
Costs of the Services and Profitability of HL Advisors
The Board reviewed information regarding HL Advisors’ costs to provide administrative services and certain advisory services to the Funds and the profitability to it and its affiliates from managing the Funds. The Board considered that HL Advisors offers a contractual management fee waiver on each of the Funds for as long as each Fund remains invested in a Master Fund. Under the waiver, HL Advisors retains a net contractual management fee of 0.25% of each Fund’s average daily net assets in order to compensate it for the administrative services and certain advisory services that HL Advisors provides each Fund under the Agreement. The Board noted that the future profitability of each Fund to HL Advisors would depend on the growth of assets under management. In evaluating HL Advisors’ profitability, the Board considered HL Advisors’ representation that the level of profitability was fair and appropriate based on the nature and quality of the services to be provided to the Funds’ shareholders. The Board considered the Consultant’s review of the profitability calculations utilized by HL Advisors in connection with the continuation of the Agreement. In this regard, the Consultant reported that The Hartford’s process for calculating and reporting Fund profitability is reasonable, sound and well within common industry practice.
Based on these considerations, the Board concluded that the profits anticipated to be realized by HL Advisors and its affiliates from their relationships with the Funds would not be excessive.
Comparison of Fees and Expenses
The Board considered comparative information with respect to the management fees to be paid by each Fund to HL Advisors and the total expense ratios of each Fund. The Board noted that each Fund and its shareholders bears the fees and expenses of the Fund and the Master Fund in which it invests, with the result that each Fund’s expenses are generally higher than those of other mutual funds that invest directly in securities. The Board also considered that each Master Fund may have other shareholders, each of whom will pay their proportionate share of the Master Fund’s expenses.
The Board reviewed written materials from Lipper providing comparative information about each Fund’s management fees and overall expense ratios relative to those of peer groups. While the Board recognized that comparisons between the Funds and peer
| Hartford Series Fund, Inc. |
| Approval of Investment Management Agreement (Unaudited) – (continued) |
funds are imprecise, given the differing service levels and characteristics of mutual funds and the different business models and cost structures of HL Advisors, the comparative information provided by Lipper assisted the Board in evaluating the reasonableness of each Fund’s management fees and total operating expenses. In addition, the Board considered the analysis and recommendations of the Consultant relating to each Fund’s management fees and total operating expenses.
Based on these considerations, the Board concluded that each Fund’s fees and total operating expenses, in conjunction with the information about quality of services, profitability, economies of scale, and other matters discussed, were reasonable in light of the services provided.
Economies of Scale
The Board requested and considered information regarding HL Advisors’ realization of economies of scale with respect to the Funds and whether the fee levels reflect these economies of scale for the benefit of the Funds’ investors. In this regard, the Board took note that the management fee schedule for each Master Fund includes breakpoints that are designed to reduce the management fee rates as the Master Fund’s average daily net assets increase. Therefore, shareholders of the Funds are expected to receive an indirect benefit from economies of scale at the Master Fund level since the amount of the advisory fee a Fund pays CRMC should decrease as the corresponding Master Fund’s average daily net assets increase. The Board also took note that even if the amount of the advisory fee paid by a Fund decreases as a result of economies of scale at the Master Fund level, the amount of the Fund’s advisory fee retained by HL Advisors will not increase. Therefore, HL Advisors will not benefit from any economies of scale realized at the Master Fund level. Instead, any economies of scale at the Master Fund level will be passed on to the shareholders of the relevant Fund. Based on these considerations, the Board concluded that it was satisfied with the extent to which economies of scale would be shared for the benefit of each Fund’s investors.
After considering all of the information available to it, the Board concluded that it was satisfied with the extent to which economies of scale would be shared for the benefit of the Funds’ shareholders.
Other Benefits
The Board considered other benefits to HL Advisors and their affiliates from their relationships with the Funds, including the role of the Funds in supporting the variable life insurance and variable annuity products offered by The Hartford. The Board reviewed information noting that Hartford Life Insurance Company (“HLIC”), an affiliate of HL Advisors, receives fees from the Funds for providing fund accounting services, and the Board considered information on expected profits to HLIC or its affiliates for such services. The Board also considered that Hartford Administrative Services Company (“HASCO”), the Funds’ transfer agent and an affiliate of HL Advisors, receives transfer agency compensation from the Funds and the Board reviewed information on the expected profitability of the Funds’ transfer agency function to HASCO. The Board considered information provided by HASCO indicating that the transfer agent fees charged by HASCO to the Funds were fair and reasonable based on publicly available information.
The Board also considered that Hartford Securities Distribution Company, Inc., as principal underwriter of the Funds, receives 12b-1 fees from the Funds. The Board also noted that certain affiliates of HL Advisors distribute shares of the Funds and receive compensation in that connection.
The Board considered the benefits to shareholders of being part of the Hartford family of funds. The Board considered HL Advisors’ efforts to provide investors in the family with a broad range of investment styles and asset classes.
* * * *
Based upon its review of these various factors, among others, the Board concluded that it is in the best interests of each Fund and its shareholders for the Board to approve the Agreement for an additional year. In reaching this decision, the Board did not assign relative weights to the factors discussed above or deem any one or group of them to be controlling in and of themselves. In connection with their deliberations, the Independent Directors met separately in executive session on several occasions, with independent legal counsel, to review the relevant materials and consider their responsibilities under relevant laws and regulations.
The Hartford
P.O. Box 5085
Hartford, CT 06102-5085
Hartford Series Fund, Inc. is underwritten and distributed by Hartford Securities Distribution Company, Inc.
"The Hartford" is The Hartford Financial Services Group, Inc. and its subsidiaries.
Hartford Series Fund, Inc. inception dates range from 1977 to date. Hartford Series Fund, Inc. is not a subsidiary of The Hartford but is underwritten, distributed by and advised by subsidiaries of The Hartford. Investments in Hartford Series Fund, Inc. are not guaranteed by The Hartford or any other entity.
You should carefully consider investment objectives, risks, and charges and expenses of Hartford HLS Funds before investing. This and other information can be found in the Fund’s prospectus or summary prospectus, which can be obtained by calling 800-862-6668. Please read them carefully before you invest or send money.
AFHLSAR-11 2-12 109078 Printed in U.S.A ©2011 The Hartford, Hartford, CT 06115 | |

A MESSAGE FROM THE PRESIDENT
Dear Fellow Shareholders:
I want to take this opportunity to say thank you for investing in Hartford HLS Funds.
This has been a tumultuous year. In the beginning of 2011, we witnessed tension-fueled political uprisings in the already-volatile Middle East and North Africa region. We also watched as Japan dealt with a series of crises including a massive earthquake and subsequent tsunami. Yet, U.S. economic conditions continued to improve, with gains in consumer confidence and retail sales. During the first half of 2011, domestic, international, and world indices (as measured by the S&P 500, MSCI EAFE and MSCI World) were all up more than 5% through June, 30 2011.
The economic recovery, however, lost momentum in the second half of 2011. The employment and housing markets both remain extremely challenged. Investors continue to be concerned about the implications of the European sovereign debt crisis, as well as our own high levels of domestic debt. Fears that the European sovereign debt crisis could continue to drag down the global economy have weighed heavily on stocks.
Ongoing apprehension regarding the U.S. debt ceiling during the summer and the resulting downgrade of the U.S. sovereign credit rating by Standard & Poor’s also contributed to weaker investor confidence.
There are, however, some reasons to remain confident. Corporations have record levels of cash on their balance sheets—corporate cash has doubled in the past 10 years. In addition, U.S. gross domestic product expanded at a 2.5 percent annual rate in the third quarter according to the Commerce Department, as consumers and businesses set aside fears about the recovery and stepped up spending. Corporate earnings have also remained positive, with a majority of companies beating expectations each quarter this year. This momentum will hopefully continue into next year.
As we head into 2012, in light of the continued market volatility, now would be a good time to schedule a meeting with your financial advisor to examine your current investment strategy and determine whether you are on the right track.
| • | Does your fixed-income portfolio complement your equity portfolio? |
| • | Are you receiving diversified sources of income? |
| • | Is your portfolio still in line with your risk tolerance and investment time horizon? |
Talk to your advisor to see what changes you should make to address these concerns and opportunities.
Thank you again for investing with Hartford HLS Funds.
James Davey
President
Hartford HLS Funds
Hartford Capital Appreciation HLS Fund
Table of Contents
This report is prepared for the general information of contract owners and qualified retirement plan participants. It is not an offer of contracts or of qualified retirement plans. It should not be used in connection with any offer, except in conjunction with the appropriate product prospectus which contains all pertinent information including the applicable sales, administrative and other charges.
The views expressed in the Fund’s Manager Discussion under “Why did the Fund perform this way?” and “What is the outlook?” are views of the Fund’s sub-adviser and portfolio management team through the end of the period and are subject to change based on market and other conditions.
| Hartford Capital Appreciation HLS Fund inception 04/02/1984 |
| (sub-advised by Wellington Management Company, LLP) |
| |
| Investment objective – Seeks growth of capital. |
| |
Performance Overview 12/31/01 – 12/31/11
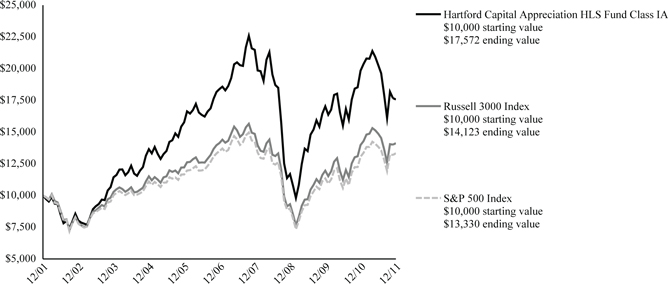
The chart above shows the growth of a $10,000 investment in Class IA. Growth results in classes other than Class IA will vary from what is seen above due to differences in the expenses charged to those share classes.
Average Annual Total Returns (as of 12/31/11)
| | 1 Year | 5 Year | 10 Year |
| Capital Appreciation IA | -11.41% | -0.90% | 5.80% |
| Capital Appreciation IB | -11.62% | -1.15% | 5.54% |
| Russell 3000 Index | 1.03% | -0.01% | 3.51% |
| S&P 500 Index | 2.09% | -0.25% | 2.92% |
PAST PERFORMANCE IS NOT INDICATIVE OF FUTURE RESULTS.
Total returns presented above were calculated using the Fund's net asset value available to shareholders for sale or redemption of Fund shares on December 31, 2011, which may exclude investment transactions as of this date.
Russell 3000 Index is an unmanaged index that measures the performance of the 3,000 largest U.S. companies based on total market capitalization.
S&P 500 Index is a market capitalization-weighted price index composed of 500 widely held common stocks.
You cannot invest directly in an index.
The chart represents a hypothetical investment in the Fund. Performance data represents past performance and current performance could be higher or lower.
Performance information may reflect historical or current expense waivers/reimbursements from the investment adviser, without which performance would have been lower. For information on current expense waivers/reimbursements, please see the prospectus.
The value of the Fund will fluctuate so that when redeemed, it may be worth more or less than the original investment. The chart and table do not reflect the deductions of taxes, sales charges or other fees which may be applied at the variable life insurance, variable annuity or qualified retirement plan product level. Any such additional sales charges or other fees or expenses would lower the contract’s or plan’s performance.
| Hartford Capital Appreciation HLS Fund |
| Manager Discussion (Unaudited) |
| December 31, 2011 |
| |
| Portfolio Managers | | |
| Saul J. Pannell, CFA | Kent M. Stahl, CFA | Peter I. Higgins, CFA |
| Senior Vice President | Senior Vice President and | Senior Vice President |
| | Director of Investments and Risk Management | |
| Paul E. Marrkand, CFA | Nicolas M. Choumenkovitch | Donald J. Kilbride |
| Senior Vice President | Senior Vice President | Senior Vice President |
| Stephen Mortimer | David W. Palmer, CFA | Francis J. Boggan, CFA* |
| Senior Vice President | Senior Vice President | Senior Vice President |
| | | |
How did the Fund perform?
The Class IA shares of the Hartford Capital Appreciation HLS Fund returned -11.41% for the twelve-month period ended December 31, 2011, underperforming its benchmark, the Russell 3000 Index, which returned 1.03% and the S&P 500 Index which returned 2.09% for the same period. The Fund also underperformed the -1.01% return of the average fund in the Lipper Large-Cap Core VP-UF Funds peer group, a group of funds with investment strategies similar to those of the Fund.
Why did the Fund perform this way?
For the twelve-month period ended December 31, 2011, U.S. equities moved higher despite a high degree of volatility caused by the European sovereign debt crisis, U.S. political gridlock, falling consumer confidence, and concerns over sustained growth in emerging markets.
Equity markets as measured by the Russell 3000 Index returned (+1%) during the period, with seven of ten sectors within the index posting positive returns. Utilities (+19%), Consumer Staples (+14%), and Health Care (+10%) rose the most. Financials (-14%), Materials (-9%), and Industrials (-2%) posted negative returns for the year.
The Fund underperformed its benchmark due to weak stock selection, mainly in the Energy, Consumer Discretionary, and Information Technology sectors. Underweights (i.e. the Fund’s sector position was less than the benchmark position) to the strong performing Utilities and Consumer Staples sectors also detracted from relative returns. An overweight to Information Technology was slightly additive.
Top detractors from benchmark relative performance were Ford Motor (Consumer Discretionary), Chesapeake Energy (Energy), and Goldman Sachs (Financials). Shares of automobile and truck manufacturer Ford Motor came under pressure during the period due to results that fell short of expectations as replenishment of the US inventory channel, which boosted prior results, came to an end, and Europe remained weak. Chesapeake Energy underperformed on concerns that increased spending on leaseholds and capital expenditures would not result in higher production guidance. The company is a major leaseholder in the Utica Shale, for which positive results were released. This opportunity should add several billion dollars of incremental value to the company, increase the company's production growth rate, and offer the potential for strong increases in cash flow and earnings. Goldman Sachs underperformed due to unfavorable credit and equity markets which translated into third quarter losses. JPMorgan Chase was among the largest detractors from absolute (i.e. total return) performance returns.
UnitedHealth Group (Health Care), TJX Companies (Consumer Discretionary) and Hewlett Packard (Information Technology) were among the top contributors to relative returns. UnitedHealth Group reported strong earnings, beating analysts' estimates, driven in part by reduced use of services by its members. We believe the company's breadth of products and services, as well as its competencies in medical cost management and coordination of care are unmatched by its peers. Not owning benchmark staple Hewlett-Packard was additive as the company reduced guidance for 2012 due to a number of issues, including macroeconomic headwinds and the impact of floods in Thailand on disk drive production. Additionally, the stock experienced weakness this year following a number of concerning decisions by the recently departed CEO. Shares of TJX, an off-price apparel and home fashions retailer, rose as the company posted strong numbers throughout the period. IBM was also among the largest contributors to absolute performance.
What is the outlook?
We expect the modest U.S. economic expansion to continue; however, we believe European sovereign debt risk poses a threat to global growth. We believe that the U.S. Federal Reserve will maintain its accommodative stance and short-term rates will remain low until the economy strengthens. We generally do not devote much time or energy to forecasting the market's direction from a top-down perspective. Instead, we
| Hartford Capital Appreciation HLS Fund |
| Manager Discussion (Unaudited) – (continued) |
| December 31, 2011 |
| |
focus our efforts on identifying what we consider attractive stocks from a bottom-up perspective, using fundamental analysis.
At the end of the period the Fund was most overweight the Consumer Discretionary, Materials, and Industrials sectors and most underweight Consumer Staples, Utilities, and Telecommunication Services sectors relative to its benchmark. The Fund’s largest absolute sector weights were in the Information Technology, Consumer Discretionary, and Financials sectors.
* Effective July 15, 2011, Francis J. Boggan replaced Jeffrey L. Kripke as a member of the portfolio management and securities analysis team of the Hartford Capital Appreciation HLS Fund.
Diversification by Industry
as of December 31, 2011
| Industry (Sector) | | Percentage of
Net Assets | |
| Equity Securities | | | | |
| Automobiles & Components (Consumer Discretionary) | | | 4.8 | % |
| Banks (Financials) | | | 3.7 | |
| Capital Goods (Industrials) | | | 7.9 | |
| Commercial & Professional Services (Industrials) | | | 0.2 | |
| Consumer Durables & Apparel (Consumer Discretionary) | | | 1.8 | |
| Consumer Services (Consumer Discretionary) | | | 1.3 | |
| Diversified Financials (Financials) | | | 7.0 | |
| Energy (Energy) | | | 10.8 | |
| Food & Staples Retailing (Consumer Staples) | | | 0.8 | |
| Food, Beverage & Tobacco (Consumer Staples) | | | 3.3 | |
| Health Care Equipment & Services (Health Care) | | | 4.0 | |
| Household & Personal Products (Consumer Staples) | | | 0.2 | |
| Insurance (Financials) | | | 3.3 | |
| Materials (Materials) | | | 6.1 | |
| Media (Consumer Discretionary) | | | 2.4 | |
| Pharmaceuticals, Biotechnology & Life Sciences (Health Care) | | | 7.9 | |
| Real Estate (Financials) | | | 0.3 | |
| Retailing (Consumer Discretionary) | | | 5.1 | |
| Semiconductors & Semiconductor Equipment (Information Technology) | | | 3.3 | |
| Software & Services (Information Technology) | | | 10.6 | |
| Technology Hardware & Equipment (Information Technology) | | | 5.8 | |
| Telecommunication Services (Services) | | | 0.5 | |
| Transportation (Industrials) | | | 4.9 | |
| Utilities (Utilities) | | | 0.7 | |
| Total | | | 96.7 | % |
| Fixed Income Securities | | | | |
| Finance and Insurance (Finance) | | | 0.3 | % |
| Total | | | 0.3 | % |
| Short-Term Investments | | | 3.3 | |
| Other Assets and Liabilities | | | (0.3 | ) |
| Total | | | 100.0 | % |
| Hartford Capital Appreciation HLS Fund |
| Schedule of Investments |
| December 31, 2011 |
| (000’s Omitted) |
| Shares or Principal Amount | | Market Value ╪ | |
| COMMON STOCKS - 96.7% | | | | |
| | | | | Automobiles & Components - 4.8% | | | | |
| | 142 | | | Continental AG | | $ | 8,833 | |
| | 223 | | | Daimler AG | | | 9,763 | |
| | 855 | | | Dana Holding Corp. ● | | | 10,393 | |
| | 3,452 | | | Dongfeng Motor Group Co., Ltd. | | | 5,894 | |
| | 21,946 | | | Ford Motor Co. w/ Rights ● | | | 236,134 | |
| | 539 | | | General Motors Co. ● | | | 10,922 | |
| | 191 | | | Gentex Corp. | | | 5,655 | |
| | 4,681 | | | Goodyear Tire & Rubber Co. ● | | | 66,325 | |
| | 223 | | | Johnson Controls, Inc. | | | 6,961 | |
| | 1,567 | | | Modine Manufacturing Co. ● | | | 14,821 | |
| | 1,365 | | | Stoneridge, Inc. ● | | | 11,505 | |
| | 92 | | | Tenneco Automotive, Inc. ● | | | 2,740 | |
| | 1,609 | | | TRW Automotive Holdings Corp. ● | | | 52,466 | |
| | | | | | | | 442,412 | |
| | | | | Banks - 3.7% | | | | |
| | 2,246 | | | Banco Santander Brasil S.A. | | | 18,284 | |
| | 1,674 | | | Barclays Bank plc ADR | | | 4,585 | |
| | 889 | | | BB&T Corp. | | | 22,388 | |
| | 118 | | | Credicorp Ltd. | | | 12,970 | |
| | 535 | | | Fifth Third Bancorp | | | 6,808 | |
| | 20,895 | | | Mitsubishi UFJ Financial Group, Inc. | | | 88,460 | |
| | 241 | | | PNC Financial Services Group, Inc. | | | 13,910 | |
| | 969 | | | Radian Group, Inc. | | | 2,267 | |
| | 1,538 | | | Standard Chartered plc | | | 33,629 | |
| | 361 | | | State Bank of India | | | 10,997 | |
| | 4,608 | | | Wells Fargo & Co. | | | 127,008 | |
| | | | | | | | 341,306 | |
| | | | | Capital Goods - 7.9% | | | | |
| | 271 | | | Assa Abloy Ab | | | 6,785 | |
| | 224 | | | BE Aerospace, Inc. ● | | | 8,663 | |
| | 257 | | | Belden, Inc. | | | 8,560 | |
| | 123 | | | Caterpillar, Inc. | | | 11,125 | |
| | 3,966 | | | Changsha Zoomlion Heavy Industry Science and Technology Co., Ltd. | | | 4,241 | |
| | 87 | | | Dover Corp. | | | 5,047 | |
| | 111 | | | Flowserve Corp. | | | 11,034 | |
| | 529 | | | General Dynamics Corp. | | | 35,146 | |
| | 7,853 | | | General Electric Co. | | | 140,649 | |
| | 884 | | | Honeywell International, Inc. | | | 48,054 | |
| | 420 | �� | | Ingersoll-Rand plc | | | 12,789 | |
| | 12,705 | | | Itochu Corp. | | | 128,826 | |
| | 178 | | | Joy Global, Inc. | | | 13,314 | |
| | 316 | | | JS Group Corp. | | | 6,051 | |
| | 149 | | | L-3 Communications Holdings, Inc. | | | 9,934 | |
| | 347 | | | Lockheed Martin Corp. | | | 28,053 | |
| | 615 | | | Meritor, Inc. ● | | | 3,272 | |
| | 1,097 | | | Navistar International Corp. ● | | | 41,555 | |
| | 424 | | | Northrop Grumman Corp. | | | 24,771 | |
| | 144 | | | PACCAR, Inc. | | | 5,410 | |
| | 100 | | | Parker-Hannifin Corp. | | | 7,636 | |
| | 159 | | | Pentair, Inc. | | | 5,299 | |
| | 1,388 | | | Rolls-Royce Holdings plc | | | 16,066 | |
| | 2,106 | | | Safran S.A. | | | 62,974 | |
| | 466 | | | Sandvik Ab | | | 5,701 | |
| | 279 | | | Schneider Electric S.A. | | | 14,584 | |
| | 366 | | | Skf Ab B Shares | | | 7,721 | |
| | 457 | | | Vallourec | | | 29,521 | |
| | 150 | | | Vinci S.A. | | | 6,521 | |
| | 151 | | | Wabco Holdings, Inc. ● | | | 6,537 | |
| | 254 | | | WESCO International, Inc. ● | | | 13,443 | |
| | 56 | | | Zodiac Aerospace | | | 4,744 | |
| | | | | | | | 734,026 | |
| | | | | Commercial & Professional Services - 0.2% | | | | |
| | 222 | | | Edenred | | | 5,442 | |
| | 346 | | | Manpower, Inc. | | | 12,377 | |
| | | | | | | | 17,819 | |
| | | | | Consumer Durables & Apparel - 1.8% | | | | |
| | 814 | | | Brunswick Corp. | | | 14,708 | |
| | 220 | | | Burberry Group plc | | | 4,038 | |
| | 102 | | | CIE Financiere Richemont S.A. | | | 5,121 | |
| | 211 | | | Coach, Inc. | | | 12,853 | |
| | 88 | | | Deckers Outdoor Corp. ● | | | 6,643 | |
| | 527 | | | De'Longhi S.p.A. | | | 4,640 | |
| | 2,604 | | | Furniture Brands International, Inc. ● | | | 3,203 | |
| | 81 | | | Gildan Activewear, Inc. | | | 1,525 | |
| | 475 | | | Hanesbrands, Inc. ● | | | 10,394 | |
| | 255 | | | Hasbro, Inc. | | | 8,141 | |
| | 213 | | | Jarden Corp. | | | 6,358 | |
| | 1,237 | | | Liz Claiborne, Inc. ● | | | 10,678 | |
| | 33 | | | Lululemon Athletica, Inc. ● | | | 1,532 | |
| | 25 | | | LVMH Moet Hennessy Louis Vuitton S.A. | | | 3,586 | |
| | 753 | | | Mattel, Inc. | | | 20,898 | |
| | 75 | | | Pandora A/S | | | 701 | |
| | 4,315 | | | Pulte Group, Inc. ● | | | 27,231 | |
| | 2,833 | | | Samsonite International S.A. ● | | | 4,433 | |
| | 478 | | | Sega Sammy Holdings, Inc. | | | 10,320 | |
| | 367 | | | Sony Corp. ADR | | | 6,624 | |
| | 126 | | | Tempur-Pedic International, Inc. ● | | | 6,601 | |
| | | | | | | | 170,228 | |
| | | | | Consumer Services - 1.3% | | | | |
| | 15 | | | Buffalo Wild Wings, Inc. ● | | | 986 | |
| | 486 | | | Compass Group plc | | | 4,610 | |
| | 102 | | | Cracker Barrel Old Country Store, Inc. | | | 5,137 | |
| | 267 | | | DeVry, Inc. | | | 10,253 | |
| | 7,108 | | | Genting Berhad | | | 24,641 | |
| | 366 | | | ITT Educational Services, Inc. ● | | | 20,812 | |
| | 106 | | | Las Vegas Sands Corp. ● | | | 4,525 | |
| | 239 | | | Marriott International, Inc. Class A | | | 6,975 | |
| | 37 | | | New Oriental Education & Technology Group, Inc. ADR ● | | | 888 | |
| | 363 | | | Starbucks Corp. | | | 16,710 | |
| | 74 | | | Weight Watchers International, Inc. | | | 4,090 | |
| | 851 | | | Wynn Macau Ltd. | | | 2,125 | |
| | 299 | | | Yum! Brands, Inc. | | | 17,644 | |
| | | | | | | | 119,396 | |
| | | | | Diversified Financials - 7.0% | | | | |
| | 481 | | | Ameriprise Financial, Inc. | | | 23,870 | |
| | 5,205 | | | Bank of America Corp. | | | 28,941 | |
| | 183 | | | BlackRock, Inc. | | | 32,557 | |
| | 1,932 | | | CITIC Securities Co., Ltd. ● | | | 3,178 | |
| | 3,777 | | | Citigroup, Inc. | | | 99,381 | |
| | 330 | | | Credit Suisse Group AG | | | 7,731 | |
| | 1,368 | | | GAM Holding Ltd. | | | 14,810 | |
| | 1,031 | | | Goldman Sachs Group, Inc. | | | 93,218 | |
| | 7,883 | | | ING Groep N.V. ● | | | 56,377 | |
| | 328 | | | Invesco Ltd. | | | 6,593 | |
| | 7,370 | | | JP Morgan Chase & Co. | | | 245,065 | |
| | 342 | | | Justice Holdings Ltd. ● | | | 4,565 | |
The accompanying notes are an integral part of these financial statements.
| Hartford Capital Appreciation HLS Fund |
| Schedule of Investments – (continued) |
| December 31, 2011 |
| (000’s Omitted) |
| Shares or Principal Amount | | Market Value ╪ | |
| COMMON STOCKS - 96.7% - (continued) | | | | |
| | | | | Diversified Financials - 7.0% - (continued) | | | | |
| | 233 | | | Nasdaq OMX Group, Inc. ● | | $ | 5,701 | |
| | 171 | | | NYSE Euronext | | | 4,473 | |
| | 119 | | | Oaktree Capital ■● | | | 5,364 | |
| | 75 | | | Solar Cayman Ltd. ⌂■●† | | | 7 | |
| | 348 | | | UBS AG | | | 4,132 | |
| | 381 | | | Waddell and Reed Financial, Inc. Class A w/ Rights | | | 9,430 | |
| | | | | | | | 645,393 | |
| | | | | Energy - 10.8% | | | | |
| | 734 | | | Alpha Natural Resources, Inc. ● | | | 14,993 | |
| | 581 | | | Anadarko Petroleum Corp. | | | 44,344 | |
| | 203 | | | Apache Corp. | | | 18,371 | |
| | 238 | | | Atwood Oceanics, Inc. ● | | | 9,478 | |
| | 130 | | | Baker Hughes, Inc. | | | 6,318 | |
| | 1,342 | | | BG Group plc | | | 28,666 | |
| | 1,866 | | | BP plc | | | 13,292 | |
| | 72 | | | BP plc ADR | | | 3,092 | |
| | 196 | | | Bumi plc ● | | | 2,673 | |
| | 350 | | | Cameron International Corp. ● | | | 17,200 | |
| | 384 | | | Canadian Natural Resources Ltd. ADR | | | 14,356 | |
| | 5,099 | | | Chesapeake Energy Corp. | | | 113,648 | |
| | 1,618 | | | Cobalt International Energy ● | | | 25,108 | |
| | 344 | | | Consol Energy, Inc. | | | 12,640 | |
| | 105 | | | Diamond Offshore Drilling, Inc. | | | 5,806 | |
| | 1,633 | | | ENSCO International plc | | | 76,609 | |
| | 228 | | | EOG Resources, Inc. | | | 22,452 | |
| | 455 | | | Exxon Mobil Corp. | | | 38,549 | |
| | 214 | | | Genel Energy plc ● | | | 2,571 | |
| | 103 | | | Hornbeck Offshore Services, Inc. ● | | | 3,190 | |
| | 1,478 | | | Imperial Oil Ltd. | | | 65,750 | |
| | 2 | | | Inpex Corp. | | | 9,904 | |
| | 4,219 | | | JX Holdings, Inc. | | | 25,460 | |
| | 1,915 | | | Karoon Gas Australia Ltd. ● | | | 8,819 | |
| | 182 | | | Kior, Inc. ● | | | 1,856 | |
| | 606 | | | Lone Pine Resources, Inc. ● | | | 4,249 | |
| | 331 | | | Newfield Exploration Co. ● | | | 12,472 | |
| | 281 | | | Noble Corp. | | | 8,495 | |
| | 612 | | | Occidental Petroleum Corp. | | | 57,348 | |
| | 137 | | | Overseas Shipholding Group, Inc. | | | 1,502 | |
| | 1,389 | | | Pacific Rubiales Energy Corp. | | | 25,544 | |
| | 106 | | | Peabody Energy Corp. | | | 3,500 | |
| | 7,396 | | | PetroChina Co., Ltd. | | | 9,185 | |
| | 3,948 | | | Petroleo Brasileiro S.A. ADR | | | 98,098 | |
| | 3,404 | | | Petroleum Geo-Services ● | | | 37,097 | |
| | 367 | | | Pioneer Natural Resources Co. | | | 32,845 | |
| | 177 | | | Royal Dutch Shell plc ADR | | | 12,918 | |
| | 557 | | | Southwestern Energy Co. ● | | | 17,781 | |
| | 392 | | | Statoil ASA | | | 10,045 | |
| | 350 | | | Statoilhydro ASA ADR | | | 8,958 | |
| | 1,236 | | | Suncor Energy, Inc. | | | 35,625 | |
| | 813 | | | Talisman Energy, Inc. | | | 10,355 | |
| | 288 | | | TGS Nopec Geophysical Co. ASA | | | 6,352 | |
| | 535 | | | Tsakos Energy Navigation Ltd. | | | 2,559 | |
| | 208 | | | Ultra Petroleum Corp. ● | | | 6,166 | |
| | 177 | | | Valero Energy Corp. | | | 3,736 | |
| | 295 | | | Whiting Petroleum Corp. ● | | | 13,790 | |
| | | | | | | | 1,003,765 | |
| | | | | Food & Staples Retailing - 0.8% | | | | |
| | 643 | | | CVS Caremark Corp. | | | 26,206 | |
| | 7,015 | | | Olam International Ltd. | | | 11,499 | |
| | 780 | | | Sysco Corp. | | | 22,872 | |
| | 1,205 | | | Tesco plc | | | 7,542 | |
| | 293 | | | Walgreen Co. | | | 9,683 | |
| | | | | | | | 77,802 | |
| | | | | Food, Beverage & Tobacco - 3.3% | | | | |
| | 559 | | | Anheuser-Busch InBev N.V. | | | 34,135 | |
| | 519 | | | Archer Daniels Midland Co. | | | 14,850 | |
| | 8,199 | | | China Agri-Industries Holdings | | | 6,220 | |
| | 88 | | | Coca-Cola Co. | | | 6,150 | |
| | 623 | | | Cott Corp. ● | | | 3,901 | |
| | 306 | | | Diamond Foods, Inc. | | | 9,886 | |
| | 599 | | | Green Mountain Coffee Roasters, Inc. ● | | | 26,885 | |
| | 183 | | | Groupe Danone | | | 11,486 | |
| | 834 | | | Grupo Modelo S.A.B. | | | 5,259 | |
| | 1,646 | | | Kraft Foods, Inc. | | | 61,512 | |
| | 63 | | | Lorillard, Inc. | | | 7,185 | |
| | 835 | | | Maple Leaf Foods, Inc. w/ Rights | | | 8,876 | |
| | 460 | | | Molson Coors Brewing Co. | | | 20,045 | |
| | 531 | | | PepsiCo, Inc. | | | 35,231 | |
| | 135 | | | Philip Morris International, Inc. | | | 10,591 | |
| | 1,280 | | | Smithfield Foods, Inc. ● | | | 31,086 | |
| | 439 | | | Tyson Foods, Inc. Class A | | | 9,060 | |
| | | | | | | | 302,358 | |
| | | | | Health Care Equipment & Services - 4.0% | | | | |
| | 148 | | | Aetna, Inc. | | | 6,240 | |
| | 130 | | | Amerisource Bergen Corp. | | | 4,842 | |
| | 247 | | | Cardinal Health, Inc. | | | 10,041 | |
| | 6,844 | | | CareView Communications, Inc. ● | | | 10,814 | |
| | 93 | | | Cie Generale d'Optique Essilor International S.A. | | | 6,552 | |
| | 700 | | | Covidien plc | | | 31,507 | |
| | 156 | | | Edwards Lifesciences Corp. ● | | | 11,040 | |
| | 172 | | | Gen-Probe, Inc. ● | | | 10,157 | |
| | 1,058 | | | HCA Holdings, Inc. ● | | | 23,299 | |
| | 732 | | | Hologic, Inc. ● | | | 12,814 | |
| | 90 | | | Humana, Inc. | | | 7,911 | |
| | 40 | | | Intuitive Surgical, Inc. ● | | | 18,469 | |
| | 1,332 | | | Medtronic, Inc. | | | 50,932 | |
| | 268 | | | St. Jude Medical, Inc. | | | 9,175 | |
| | 182 | | | SXC Health Solutions Corp. ● | | | 10,275 | |
| | 2,357 | | | UnitedHealth Group, Inc. | | | 119,449 | |
| | 657 | | | Universal Health Services, Inc. Class B | | | 25,515 | |
| | | | | | | | 369,032 | |
| | | | | Household & Personal Products - 0.2% | | | | |
| | 100 | | | Beiersdorf AG | | | 5,677 | |
| | 526 | | | Hengan International Group Co., Ltd. | | | 4,904 | |
| | 215 | | | Reckitt Benckiser Group plc | | | 10,599 | |
| | | | | | | | 21,180 | |
| | | | | Insurance - 3.3% | | | | |
| | 156 | | | ACE Ltd. | | | 10,952 | |
| | 1,840 | | | Aflac, Inc. | | | 79,604 | |
| | 2,187 | | | Ageas | | | 3,379 | |
| | 5,741 | | | AIA Group Ltd. | | | 17,872 | |
| | 2,132 | | | American International Group, Inc. ● | | | 49,460 | |
| | 500 | | | AON Corp. | | | 23,407 | |
| | 866 | | | Assured Guaranty Ltd. | | | 11,384 | |
| | 123 | | | Everest Re Group Ltd. | | | 10,312 | |
| | 580 | | | Genworth Financial, Inc. ● | | | 3,797 | |
The accompanying notes are an integral part of these financial statements.
| Shares or Principal Amount | | Market Value ╪ | |
| COMMON STOCKS - 96.7% - (continued) | | | | |
| | | | | Insurance - 3.3% - (continued) | | | | |
| | 213 | | | Platinum Underwriters Holdings Ltd. | | $ | 7,278 | |
| | 294 | | | Principal Financial Group, Inc. | | | 7,243 | |
| | 690 | | | Prudential plc | | | 6,825 | |
| | 637 | | | QBE Insurance Group Ltd. | | | 8,430 | |
| | 263 | | | Reinsurance Group of America, Inc. | | | 13,750 | |
| | 121 | | | StanCorp Financial Group, Inc. | | | 4,431 | |
| | 335 | | | Swiss Re Ltd. | | | 17,051 | |
| | 825 | | | Unum Group | | | 17,374 | |
| | 41 | | | Zurich Financial Services AG | | | 9,241 | |
| | | | | | | | 301,790 | |
| | | | | Materials - 6.1% | | | | |
| | 76 | | | Agrium U.S., Inc. | | | 5,120 | |
| | 137 | | | Akzo Nobel N.V. | | | 6,595 | |
| | 114 | | | Allegheny Technologies, Inc. | | | 5,468 | |
| | 1,072 | | | AngloGold Ltd. ADR | | | 45,498 | |
| | 251 | | | Antofagasta | | | 4,755 | |
| | 980 | | | Aquarius Platinum Ltd. | | | 2,382 | |
| | 430 | | | ArcelorMittal ADR | | | 7,824 | |
| | 764 | | | Barrick Gold Corp. | | | 34,566 | |
| | 109 | | | BASF SE | | | 7,568 | |
| | 364 | | | Cabot Corp. | | | 11,689 | |
| | 175 | | | Celanese Corp. | | | 7,756 | |
| | 48 | | | Cliff's Natural Resources, Inc. | | | 3,008 | |
| | 799 | | | CRH plc | | | 15,864 | |
| | 130 | | | Detour Gold Corp. ● | | | 3,211 | |
| | 5,178 | | | Dow Chemical Co. | | | 148,930 | |
| | 840 | | | Fortescue Metals Group Ltd. | | | 3,676 | |
| | 354 | | | Freeport-McMoRan Copper & Gold, Inc. | | | 13,040 | |
| | 8 | | | Givaudan | | | 7,427 | |
| | 7,000 | | | Glencore International plc | | | 42,741 | |
| | 11,203 | | | Huabao International Holdings Ltd. | | | 5,708 | |
| | 345 | | | JSR Corp. | | | 6,368 | |
| | 1,105 | | | Louisiana-Pacific Corp. ● | | | 8,914 | |
| | 652 | | | Lundin Mining Corp. ● | | | 2,476 | |
| | 756 | | | Methanex Corp. ADR | | | 17,262 | |
| | 335 | | | Molycorp, Inc. ● | | | 8,043 | |
| | 1,098 | | | Mosaic Co. | | | 55,361 | |
| | 690 | | | Norbord, Inc. ● | | | 5,487 | |
| | 402 | | | Owens-Illinois, Inc. ● | | | 7,793 | |
| | 1,638 | | | Petronas Chemicals Group Bhd. | | | 3,199 | |
| | 132 | | | Praxair, Inc. | | | 14,160 | |
| | 12,231 | | | PTT Chemical Public Co., Ltd. ● | | | 23,648 | |
| | 206 | | | Rio Tinto plc ADR | | | 10,059 | |
| | 1,970 | | | Sino Forest Corp. Class A ⌂●† | | | 677 | |
| | 104 | | | Teck Cominco Ltd. Class B | | | 3,643 | |
| | 2,711 | | | TSRC Corp. | | | 6,643 | |
| | 189 | | | Umicore | | | 7,757 | |
| | 34 | | | Walter Energy, Inc. | | | 2,074 | |
| | 129 | | | Yamato Kogyo Co. | | | 3,699 | |
| | | | | | | | 570,089 | |
| | | | | Media - 2.4% | | | | |
| | 111 | | | CBS Corp. Class B | | | 3,015 | |
| | 1,334 | | | Comcast Corp. Class A | | | 31,637 | |
| | 397 | | | Comcast Corp. Special Class A | | | 9,365 | |
| | 725 | | | DirecTV Class A ● | | | 31,000 | |
| | 30 | | | Harvey Weinstein Co. Holdings Class A-1 ⌂●†∞ | | | — | |
| | 819 | | | Omnicom Group, Inc. | | | 36,490 | |
| | 154 | | | Publicis Groupe | | | 7,078 | |
| | 23,437 | | | Sirius XM Radio, Inc. w/ Rights ● | | | 42,655 | |
| | 951 | | | Viacom, Inc. Class B | | | 43,173 | |
| | 598 | | | Walt Disney Co. | | | 22,438 | |
| | | | | | | | 226,851 | |
| | | | | Pharmaceuticals, Biotechnology & Life Sciences - 7.9% | | | | |
| | 1,710 | | | Agilent Technologies, Inc. ● | | | 59,716 | |
| | 151 | | | Alkermes plc ● | | | 2,626 | |
| | 751 | | | Almirall S.A. | | | 5,142 | |
| | 415 | | | Amgen, Inc. | | | 26,677 | |
| | 132 | | | Amylin Pharmaceuticals, Inc. ● | | | 1,496 | |
| | 329 | | | AstraZeneca plc | | | 15,219 | |
| | 74 | | | AstraZeneca plc ADR | | | 3,420 | |
| | 179 | | | Auxilium Pharmaceuticals, Inc. ● | | | 3,559 | |
| | 1,645 | | | Avanir Pharmaceuticals ● | | | 3,373 | |
| | 329 | | | Biogen Idec, Inc. ● | | | 36,165 | |
| | 385 | | | Bristol-Myers Squibb Co. | | | 13,567 | |
| | 290 | | | Bruker Corp. ● | | | 3,600 | |
| | 95 | | | Celgene Corp. ● | | | 6,449 | |
| | 88 | | | Cubist Pharmaceuticals, Inc. ● | | | 3,483 | |
| | 3,038 | | | Daiichi Sankyo Co., Ltd. | | | 60,162 | |
| | 677 | | | Elan Corp. plc ADR ● | | | 9,303 | |
| | 353 | | | Eli Lilly & Co. | | | 14,683 | |
| | 2,120 | | | Gilead Sciences, Inc. ● | | | 86,753 | |
| | 158 | | | Map Pharmaceuticals, Inc. ● | | | 2,075 | |
| | 1,146 | | | Merck & Co., Inc. | | | 43,216 | |
| | 427 | | | Mylan, Inc. ● | | | 9,163 | |
| | 4,625 | | | Novavax, Inc. ● | | | 5,828 | |
| | 146 | | | Regeneron Pharmaceuticals, Inc. ● | | | 8,071 | |
| | 368 | | | Roche Holding AG | | | 62,162 | |
| | 75 | | | Salix Pharmaceuticals Ltd. ● | | | 3,608 | |
| | 243 | | | Seattle Genetics, Inc. ● | | | 4,067 | |
| | 1,754 | | | Shionogi & Co., Ltd. | | | 22,499 | |
| | 3,817 | | | Teva Pharmaceutical Industries Ltd. ADR | | | 154,060 | |
| | 2,170 | | | TherapeuticsMD, Inc. ● | | | 3,473 | |
| | 651 | | | UCB S.A. | | | 27,312 | |
| | 269 | | | Waters Corp. ● | | | 19,949 | |
| | 690 | | | WuXi PharmaTech Cayman, Inc. ● | | | 7,621 | |
| | | | | | | | 728,497 | |
| | | | | Real Estate - 0.3% | | | | |
| | 219 | | | American Tower Corp. Class A | | | 13,166 | |
| | 45 | | | Unibail-Rodamco SE | | | 7,980 | |
| | 267 | | | Weyerhaeuser Co. | | | 4,980 | |
| | | | | | | | 26,126 | |
| | | | | Retailing - 5.1% | | | | |
| | 149 | | | Advance Automotive Parts, Inc. | | | 10,403 | |
| | 8,452 | | | Allstar Co. ⌂† | | | 8,753 | |
| | 234 | | | Amazon.com, Inc. ● | | | 40,519 | |
| | 255 | | | Ann, Inc. ● | | | 6,307 | |
| | 29,055 | | | Buck Holdings L.P. ⌂●† | | | 65,024 | |
| | 312 | | | Buckle (The), Inc. | | | 12,753 | |
| | 289 | | | CarMax, Inc. ● | | | 8,794 | |
| | 187 | | | Chico's FAS, Inc. | | | 2,083 | |
| | 82 | | | Children's Place Retail Stores, Inc. ● | | | 4,340 | |
| | 58 | | | Cia. Hering | | | 1,015 | |
| | 362 | | | Express, Inc. ● | | | 7,224 | |
| | 47 | | | Fast Retailing Co., Ltd. | | | 8,459 | |
| | 187 | | | GameStop Corp. Class A ● | | | 4,512 | |
| | 260 | | | GNC Holdings, Inc. ● | | | 7,527 | |
| | 274 | | | Guess?, Inc. | | | 8,177 | |
| | 536 | | | Kohl's Corp. | | | 26,448 | |
| | 3,593 | | | Lowe's Co., Inc. | | | 91,192 | |
The accompanying notes are an integral part of these financial statements.
| Hartford Capital Appreciation HLS Fund |
| Schedule of Investments – (continued) |
| December 31, 2011 |
| (000’s Omitted) |
| Shares or Principal Amount | | Market Value ╪ | |
| COMMON STOCKS - 96.7% - (continued) | | | | |
| | | | | Retailing - 5.1% - (continued) | | | | |
| | 134 | | | Nordstrom, Inc. | | $ | 6,651 | |
| | 29 | | | Priceline.com, Inc. ● | | | 13,387 | |
| | 198 | | | Rent-A-Center, Inc. | | | 7,344 | |
| | 265 | | | Ross Stores, Inc. | | | 12,599 | |
| | 185 | | | Shutterfly, Inc. ● | | | 4,203 | |
| | 213 | | | Start Today Co., Ltd. | | | 4,996 | |
| | 649 | | | Target Corp. | | | 33,235 | |
| | 1,184 | | | TJX Cos., Inc. | | | 76,413 | |
| | 100 | | | Urban Outfitters, Inc. ● | | | 2,766 | |
| | | | | | | | 475,124 | |
| | | | | Semiconductors & Semiconductor Equipment - 3.3% | | | | |
| | 1,373 | | | Altera Corp. | | | 50,938 | |
| | 435 | | | Analog Devices, Inc. | | | 15,549 | |
| | 2,177 | | | Avago Technologies Ltd. | | | 62,823 | |
| | 259 | | | Cavium, Inc. ● | | | 7,365 | |
| | 330 | | | Cypress Semiconductor Corp. | | | 5,573 | |
| | 198 | | | Freescale Semiconductor Holdings Ltd. ● | | | 2,502 | |
| | 1,174 | | | Infineon Technologies AG | | | 8,814 | |
| | 450 | | | Intersil Corp. | | | 4,697 | |
| | 430 | | | Maxim Integrated Products, Inc. | | | 11,192 | |
| | 431 | | | ON Semiconductor Corp. ● | | | 3,330 | |
| | 641 | | | RF Micro Devices, Inc. ● | | | 3,463 | |
| | 48 | | | Samsung Electronics Co., Ltd. | | | 44,442 | |
| | 675 | | | Skyworks Solutions, Inc. ● | | | 10,948 | |
| | 76 | | | Spreadtrum Communications, Inc. | | | 1,597 | |
| | 3,795 | | | Taiwan Semiconductor Manufacturing Co., Ltd. | | | 9,482 | |
| | 1,760 | | | Texas Instruments, Inc. | | | 51,240 | |
| | 528 | | | Xilinx, Inc. | | | 16,919 | |
| | | | | | | | 310,874 | |
| | | | | Software & Services - 10.6% | | | | |
| | 4,154 | | | Activision Blizzard, Inc. | | | 51,182 | |
| | 456 | | | Automatic Data Processing, Inc. | | | 24,604 | |
| | 26 | | | Baidu, Inc. ADR ● | | | 3,074 | |
| | 228 | | | BMC Software, Inc. ● | | | 7,467 | |
| | 661 | | | Booz Allen Hamilton Holding Corp. ● | | | 11,410 | |
| | 910 | | | Cadence Design Systems, Inc. ● | | | 9,462 | |
| | 119 | | | Check Point Software Technologies Ltd. ADR ● | | | 6,230 | |
| | 133 | | | Cognizant Technology Solutions Corp. ● | | | 8,574 | |
| | 155 | | | Concur Technologies, Inc. ● | | | 7,893 | |
| | 78 | | | DeNa Co., Ltd. | | | 2,342 | |
| | 4,047 | | | eBay, Inc. ● | | | 122,731 | |
| | 198 | | | Fiserv, Inc. ● | | | 11,601 | |
| | 235 | | | Global Payments, Inc. | | | 11,139 | |
| | 279 | | | Google, Inc. ● | | | 180,277 | |
| | 219 | | | IAC/Interactive Corp. | | | 9,321 | |
| | 359 | | | IBM Corp. | | | 66,092 | |
| | 520 | | | iGate Corp. | | | 8,180 | |
| | 254 | | | JDA Software Group, Inc. ● | | | 8,229 | |
| | 63 | | | Kakaku.com, Inc. | | | 2,298 | |
| | 1,962 | | | Kit Digital, Inc. ● | | | 16,582 | |
| | 110 | | | LinkedIn Corp. ● | | | 6,907 | |
| | 18 | | | Mastercard, Inc. | | | 6,562 | |
| | 75 | | | Micros Systems ● | | | 3,475 | |
| | 4,406 | | | Microsoft Corp. | | | 114,373 | |
| | 113 | | | MicroStrategy, Inc. ● | | | 12,224 | |
| | 26 | | | Netease.com, Inc. ● | | | 1,186 | |
| | 5,218 | | | Oracle Corp. | | | 133,836 | |
| | 235 | | | Paychex, Inc. | | | 7,071 | |
| | 143 | | | Red Hat, Inc. ● | | | 5,901 | |
| | 511 | | | Rovi Corp. ● | | | 12,573 | |
| | 78 | | | S.p.A. ADR | | | 4,119 | |
| | 90 | | | Salesforce.com, Inc. ● | | | 9,132 | |
| | 142 | | | Sohu.com, Inc. ● | | | 7,122 | |
| | 113 | | | Teradata Corp. ● | | | 5,472 | |
| | 344 | | | Tibco Software, Inc. ● | | | 8,227 | |
| | 838 | | | TiVo, Inc. ● | | | 7,521 | |
| | 3,719 | | | Western Union Co. | | | 67,905 | |
| | | | | | | | 982,294 | |
| | | | | Technology Hardware & Equipment - 5.8% | | | | |
| | 349 | | | Acme Packet, Inc. ● | | | 10,776 | |
| | 441 | | | Apple, Inc. ● | | | 178,608 | |
| | 292 | | | Arrow Electronics, Inc. ● | | | 10,931 | |
| | 157 | | | Aruba Networks, Inc. ● | | | 2,913 | |
| | 5,956 | | | Cisco Systems, Inc. | | | 107,679 | |
| | 303 | | | Corning, Inc. | | | 3,937 | |
| | 355 | | | Dell, Inc. ● | | | 5,199 | |
| | 2,180 | | | EMC Corp. ● | | | 46,947 | |
| | 462 | | | Emulex Corp. ● | | | 3,172 | |
| | 69 | | | F5 Networks, Inc. ● | | | 7,358 | |
| | 1,892 | | | Flextronics International Ltd. ● | | | 10,710 | |
| | 568 | | | Fujitsu Ltd. | | | 2,947 | |
| | 348 | | | Harris Corp. | | | 12,559 | |
| | 177 | | | Hewlett-Packard Co. | | | 4,567 | |
| | 3,310 | | | Hon Hai Precision Industry Co., Ltd. | | | 9,051 | |
| | 47 | | | Hon Hai Precision Industry Co., Ltd. GDR § | | | 260 | |
| | 676 | | | Jabil Circuit, Inc. | | | 13,295 | |
| | 1,467 | | | JDS Uniphase Corp. ● | | | 15,318 | |
| | 1,260 | | | Juniper Networks, Inc. ● | | | 25,712 | |
| | 7,550 | | | Legend Holdings Ltd. | | | 5,022 | |
| | 1,226 | | | NetApp, Inc. ● | | | 44,464 | |
| | 527 | | | QLogic Corp. ● | | | 7,911 | |
| | 138 | | | Riverbed Technology, Inc. ● | | | 3,235 | |
| | 56 | | | SanDisk Corp. ● | | | 2,748 | |
| | 77 | | | Universal Display Corp. ● | | | 2,830 | |
| | | | | | | | 538,149 | |
| | | | | Telecommunication Services - 0.5% | | | | |
| | 381 | | | Softbank Corp. | | | 11,197 | |
| | 553 | | | Tele2 Ab B Shares | | | 10,721 | |
| | 702 | | | Telenor ASA | | | 11,491 | |
| | 391 | | | Vodafone Group plc ADR | | | 10,967 | |
| | | | | | | | 44,376 | |
| | | | | Transportation - 4.9% | | | | |
| | 23,989 | | | AirAsia Berhad | | | 28,502 | |
| | 8,336 | | | Delta Air Lines, Inc. ● | | | 67,438 | |
| | 1,083 | | | FedEx Corp. | | | 90,475 | |
| | 5,606 | | | Hertz Global Holdings, Inc. ● | | | 65,698 | |
| | 2,368 | | | JetBlue Airways Corp. ● | | | 12,312 | |
| | 661 | | | JSL S.A. | | | 3,311 | |
| | 663 | | | Knight Transportation, Inc. | | | 10,365 | |
| | 45 | | | Kuehne & Nagel International AG | | | 4,984 | |
| | 423 | | | Localiza Rent a Car S.A. | | | 5,800 | |
| | 1,338 | | | Toll Holdings Ltd. | | | 5,759 | |
| | 6,145 | | | United Continental Holdings, Inc. ● | | | 115,961 | |
| | 585 | | | United Parcel Service, Inc. Class B | | | 42,782 | |
| | | | | | | | 453,387 | |
The accompanying notes are an integral part of these financial statements.
| Shares or Principal Amount | | | | | | Market Value ╪ | |
| COMMON STOCKS - 96.7% - (continued) | | | | | | | | |
| | | | | Utilities - 0.7% | | | | | | | | |
| | 720 | | | Companhia Energetica de Minas Gerais ADR | | | | | | $ | 12,809 | |
| | 195 | | | Entergy Corp. | | | | | | | 14,253 | |
| | 243 | | | N.V. Energy, Inc. | | | | | | | 3,968 | |
| | 313 | | | NextEra Energy, Inc. | | | | | | | 19,080 | |
| | 169 | | | PG&E Corp. | | | | | | | 6,954 | |
| | 217 | | | UGI Corp. | | | | | | | 6,369 | |
| | | | | | | | | | | | 63,433 | |
| | | | | Total common stocks | | | | | | | | |
| | | | | (cost $9,343,361) | | | | | | $ | 8,965,707 | |
| | | | | | | | | | | | | |
| WARRANTS - 0.0% | | | | | | | | |
| | | | | Pharmaceuticals, Biotechnology & Life Sciences - 0.0% | | | | | | | | |
| | 510 | | | Novavax, Inc. ⌂● | | | | | | $ | — | |
| | | | | | | | | | | | | |
| | | | | Total warrants | | | | | | | | |
| | | | | (cost $–) | | | | | | $ | — | |
| | | | | | | | | | | | | |
| CORPORATE BONDS - 0.3% | | | | | | | | |
| | | | | Finance and Insurance - 0.3% | | | | | | | | |
| | | | | MBIA Insurance Co. | | | | | | | | |
| $ | 53,500 | | | 14.00%, 01/15/2033 ■Δ | | | | | | $ | 29,960 | |
| | | | | | | | | | | | | |
| | | | | Total corporate bonds | | | | | | | | |
| | | | | (cost $53,139) | | | | | | $ | 29,960 | |
| | | | | | | | | | | | | |
| | | | | Total long-term investments | | | | | | | | |
| | | | | (cost $9,396,500) | | | | | | $ | 8,995,667 | |
| | | | | | | | | | | | | |
| SHORT-TERM INVESTMENTS - 3.3% | | | | | | | | |
| Repurchase Agreements - 3.3% |
| | | | | Bank of America Merrill Lynch TriParty | | | | | | | | |
| | | | | Joint Repurchase Agreement (maturing on | | | | | | | | |
| | | | | 01/03/2012 in the amount of $115,212, | | | | | | | | |
| | | | | collateralized by GNMA 4.50%, 2041, | | | | | | | | |
| | | | | value of $117,515) | | | | | | | | |
| $ | 115,211 | | | 0.04%, 12/30/2011 | | | | | | $ | 115,211 | |
| | | | | Barclays Capital TriParty Joint Repurchase | | | | | | | | |
| | | | | Agreement (maturing on 01/03/2012 in the | | | | | | | | |
| | | | | amount of $9,571, collateralized by U.S. | | | | | | | | |
| | | | | Treasury Bond 5.38%, 2031, value of | | | | | | | | |
| | | | | $9,763) | | | | | | | | |
| | 9,571 | | | 0.01%, 12/30/2011 | | | | | | | 9,571 | |
| | | | | Deutsche Bank Securities TriParty Joint | | | | | | | | |
| | | | | Repurchase Agreement (maturing on | | | | | | | | |
| | | | | 01/03/2012 in the amount of $127,796, | | | | | | | | |
| | | | | collateralized by GNMA 3.50% - 7.00%, | | | | | | | | |
| | | | | 2035 - 2046, value of $130,351) | | | | | | | | |
| | 127,796 | | | 0.06%, 12/30/2011 | | | | | | | 127,796 | |
| | | | | UBS Securities, Inc. Joint Repurchase | | | | | | | | |
| | | | | Agreement (maturing on 01/03/2012 in the | | | | | | | | |
| | | | | amount of $969, collateralized by U.S. | | | | | | | | |
| | | | | Treasury Note 2.75%, 2016, value of | | | | | | | | |
| | | | | $992) | | | | | | | | |
| | 969 | | | 0.01%, 12/30/2011 | | | | | | | 969 | |
| | | | | UBS Securities, Inc. TriParty Joint | | | | | | | | |
| | | | | Repurchase Agreement (maturing on | | | | | | | | |
| | | | | 01/03/2012 in the amount of $49,452, | | | | | | | | |
| | | | | collateralized by FNMA 3.00% - 6.50%, | | | | | | | | |
| | | | | 2021 - 2041, value of $50,441) | | | | | | | | |
| $ | 49,452 | | | 0.04%, 12/30/2011 | | | | | | $ | 49,452 | |
| | | | | | | | | | | | 302,999 | |
| | | | | Total short-term investments | | | | | | | | |
| | | | | (cost $302,999) | | | | | | $ | 302,999 | |
| | | | | | | | | | | | | |
| | | | | Total investments | | | | | | | | |
| | | | | (cost $9,699,499) ▲ | | | 100.3 | % | | $ | 9,298,666 | |
| | | | | Other assets and liabilities | | | (0.3 | )% | | | (27,434 | ) |
| | | | | Total net assets | | | 100.0 | % | | $ | 9,271,232 | |
The accompanying notes are an integral part of these financial statements.
| Hartford Capital Appreciation HLS Fund |
| Schedule of Investments – (continued) |
| December 31, 2011 |
| (000’s Omitted) |
| Note: | Percentage of investments as shown is the ratio of the total market value to total net assets. Market value of long-term investments in foreign securities represents 24.0% of total net assets at December 31, 2011. |
Prices of foreign equities that are principally traded on certain foreign markets may be adjusted daily pursuant to a fair value pricing service approved by the Board of Directors in order to reflect an adjustment for factors occurring after the close of certain foreign markets but before the close of the New York Stock Exchange.
| ▲ | At December 31, 2011, the cost of securities for federal income tax purposes was $9,971,310 and the aggregate gross unrealized appreciation and depreciation based on that cost were: |
| Unrealized Appreciation | | $ | 508,233 | |
| Unrealized Depreciation | | | (1,180,877 | ) |
| Net Unrealized Depreciation | | $ | (672,644 | ) |
| † | These securities were valued in good faith at fair value as determined under policies and procedures established by and under the supervision of the Company's Board of Directors. At December 31, 2011, the aggregate value of these securities was $74,461, which represents 0.8% of total net assets. This amount excludes securities that are principally traded in certain foreign markets and whose prices are adjusted pursuant to a third party pricing service methodology approved by the Board of Directors. |
| Δ | Variable rate securities; the rate reported is the coupon rate in effect at December 31, 2011. |
| ■ | Securities issued within terms of a private placement memorandum, exempt from registration under Rule 144A under the Securities Act of 1933, as amended, and may be sold only to qualified institutional buyers. Unless otherwise indicated, these issues are determined to be liquid. At December 31, 2011, the aggregate value of these securities was $35,331, which represents 0.4% of total net assets. |
| § | These securities were sold to the Fund under Regulation S, rules governing offers and sales made outside the United States without registration under the Securities Act of 1933. The Fund may only be able to resell these securities in the United States if an exemption from registration under the federal and state securities laws is available, or the Fund may only be able to sell these securities outside of the United States (such as on a foreign exchange) to a non-U.S. person. Unless otherwise indicated, these holdings are determined to be liquid. At December 31, 2011, the aggregate value of these securities was $260, which rounds to zero percent of total net assets. |
| ∞ | Securities exempt from registration under Regulation D of the Securities Act of 1933. The Fund may only be able to resell these securities if they are subsequently registered or if an exemption from registration under the federal and state securities laws is available. Unless otherwise indicated, these holdings are determined to be liquid. At December 31, 2011, the aggregate value and percentage of net assets of these securities rounds to zero. |
| ⌂ | The following securities are considered illiquid. Illiquid securities are often purchased in private placement transactions, are often not registered under the Securities Act of 1933 and may have contractual restrictions on resale. A security may also be considered illiquid if the security lacks a readily available market or if its valuation has not changed for a certain period of time. |
| Period Acquired | | Shares/ Par | | Security | | Cost Basis | |
| 08/2011 | | | 8,452 | | Allstar Co. | | $ | 8,604 | |
| 06/2007 | | | 29,055 | | Buck Holdings L.P. | | | 17,135 | |
| 10/2005 | | | 30 | | Harvey Weinstein Co. Holdings Class A-1 - Reg D | | | 27,951 | |
| 07/2008 | | | 510 | | Novavax, Inc. Warrants | | | — | |
| 01/2010 - 07/2011 | | | 1,970 | | Sino Forest Corp. Class A | | | 33,397 | |
| 03/2007 | | | 75 | | Solar Cayman Ltd. - 144A | | | 22 | |
At December 31, 2011, the aggregate value of these securities was $74,461, which represents 0.8% of total net assets.
The accompanying notes are an integral part of these financial statements.
| |
| Foreign Currency Contracts Outstanding at December 31, 2011 |
| Description | | Counterparty | | Buy / Sell | | Market Value ╪ | | | Contract
Amount | | | Delivery Date | | | Unrealized
Appreciation/
(Depreciation) | |
| Australian Dollar | | Goldman Sachs | | Buy | | $ | 88 | | | $ | 86 | | | 01/04/2012 | | | $ | 2 | |
| Australian Dollar | | JP Morgan Securities | | Buy | | | 95 | | | | 95 | | | 01/03/2012 | | | | — | |
| Canadian Dollar | | Banc of America Securities | | Buy | | | 28 | | | | 28 | | | 01/05/2012 | | | | — | |
| Euro | | JP Morgan Securities | | Sell | | | 1,179 | | | | 1,178 | | | 01/03/2012 | | | | (1 | ) |
| Hong Kong Dollar | | CS First Boston | | Sell | | | 1,314 | | | | 1,313 | | | 01/03/2012 | | | | (1 | ) |
| Japanese Yen | | Deutsche Bank Securities | | Sell | | | 64,400 | | | | 60,374 | | | 03/02/2012 | | | | (4,026 | ) |
| Japanese Yen | | Goldman Sachs | | Sell | | | 40,746 | | | | 40,907 | | | 03/02/2012 | | | | 161 | |
| Japanese Yen | | Morgan Stanley | | Sell | | | 64,401 | | | | 60,408 | | | 03/02/2012 | | | | (3,993 | ) |
| Japanese Yen | | UBS AG | | Sell | | | 64,304 | | | | 60,302 | | | 03/02/2012 | | | | (4,002 | ) |
| | | | | | | | | | | | | | | | | | | $ | (11,860 | ) |
| ╪ | See Significant Accounting Policies of accompanying Notes to Financial Statements regarding valuation of securities. |
The accompanying notes are an integral part of these financial statements.
| Hartford Capital Appreciation HLS Fund |
| Investment Valuation Hierarchy Level Summary |
| December 31, 2011 |
| (000’s Omitted) |
| | | Total | | | Level 1 ♦ | | | Level 2 ♦ | | | Level 3 | |
| Assets: | | | | | | | | | | | | | | | | |
| Common Stocks | | | | | | | | | | | | | | | | |
| Automobiles & Components | | $ | 442,412 | | | $ | 417,922 | | | $ | 24,490 | | | $ | — | |
| Banks | | | 341,306 | | | | 203,635 | | | | 137,671 | | | | — | |
| Capital Goods | | | 734,026 | | | | 440,291 | | | | 293,735 | | | | — | |
| Commercial & Professional Services | | | 17,819 | | | | 12,377 | | | | 5,442 | | | | — | |
| Consumer Durables & Apparel | | | 170,228 | | | | 137,389 | | | | 32,839 | | | | — | |
| Consumer Services | | | 119,396 | | | | 88,020 | | | | 31,376 | | | | — | |
| Diversified Financials | | | 645,393 | | | | 556,972 | | | | 83,050 | | | | 5,371 | |
| Energy | | | 1,003,765 | | | | 854,945 | | | | 148,820 | | | | — | |
| Food & Staples Retailing | | | 77,802 | | | | 58,761 | | | | 19,041 | | | | — | |
| Food, Beverage & Tobacco | | | 302,358 | | | | 250,517 | | | | 51,841 | | | | — | |
| Health Care Equipment & Services | | | 369,032 | | | | 362,480 | | | | 6,552 | | | | — | |
| Household & Personal Products | | | 21,180 | | | | — | | | | 21,180 | | | | — | |
| Insurance | | | 301,790 | | | | 238,992 | | | | 62,798 | | | | — | |
| Materials | | | 570,089 | | | | 445,030 | | | | 124,382 | | | | 677 | |
| Media | | | 226,851 | | | | 219,773 | | | | 7,078 | | | | — | |
| Pharmaceuticals, Biotechnology & Life Sciences | | | 728,497 | | | | 536,001 | | | | 192,496 | | | | — | |
| Real Estate | | | 26,126 | | | | 18,146 | | | | 7,980 | | | | — | |
| Retailing | | | 475,124 | | | | 387,892 | | | | 13,455 | | | | 73,777 | |
| Semiconductors & Semiconductor Equipment | | | 310,874 | | | | 248,136 | | | | 62,738 | | | | — | |
| Software & Services | | | 982,294 | | | | 977,654 | | | | 4,640 | | | | — | |
| Technology Hardware & Equipment | | | 538,149 | | | | 521,129 | | | | 17,020 | | | | — | |
| Telecommunication Services | | | 44,376 | | | | 10,967 | | | | 33,409 | | | | — | |
| Transportation | | | 453,387 | | | | 414,142 | | | | 39,245 | | | | — | |
| Utilities | | | 63,433 | | | | 63,433 | | | | — | | | | — | |
| Total | | | 8,965,707 | | | | 7,464,604 | | | | 1,421,278 | | | | 79,825 | |
| Corporate Bonds | | | 29,960 | | | | — | | | | 29,960 | | | | — | |
| Warrants | | | — | | | | — | | | | — | | | | — | |
| Short-Term Investments | | | 302,999 | | | | — | | | | 302,999 | | | | — | |
| Total | | $ | 9,298,666 | | | $ | 7,464,604 | | | $ | 1,754,237 | | | $ | 79,825 | |
| Foreign Currency Contracts* | | | 163 | | | | — | | | | 163 | | | | — | |
| Total | | $ | 163 | | | $ | — | | | $ | 163 | | | $ | — | |
| Liabilities: | | | | | | | | | | | | | | | | |
| Foreign Currency Contracts* | | | 12,023 | | | | — | | | | 12,023 | | | | — | |
| Total | | $ | 12,023 | | | $ | — | | | $ | 12,023 | | | $ | — | |
♦ For the year ended December 31, 2011, there were no significant transfers between Level 1 and Level 2.
* Derivative instruments not reflected in the Schedule of Investments are valued at the unrealized appreciation/depreciation on the investments.
Following is a reconciliation of Level 3 assets for which significant unobservable inputs were used to determine fair value:
| | | Balance as
of
December
31, 2010 | | | Realized
Gain
(Loss) | | | Change in
Unrealized
Appreciation
(Depreciation) | | | Net
Amortization | | | Purchases | | | Sales | | | Transfers
Into
Level 3 * | | | Transfers
Out of
Level 3 * | | | Balance as
of
December
31, 2011 | |
| Assets: | | | | | | | | | | | | | | | | | | | | | | | | | | | | | | | | | | | | |
| Common Stocks | | $ | 81,336 | | | $ | 26,054 | | | $ | (40,997 | )† | | $ | — | | | $ | 13,360 | | | $ | (63,983 | ) | | $ | 64,055 | | | $ | — | | | $ | 79,825 | |
| Total | | $ | 81,336 | | | $ | 26,054 | | | $ | (40,997 | ) | | $ | — | | | $ | 13,360 | | | $ | (63,983 | ) | | $ | 64,055 | | | $ | — | | | $ | 79,825 | |
| * | Securities are transferred into and out of Level 3 for a variety of reasons including, but not limited to: |
1) Securities where trading has been halted (transfer into Level 3) or securities where trading has resumed (transfer out of Level 3).
2) Broker quoted securities (transfer into Level 3) or quoted prices in active markets (transfer out of Level 3).
3) Securities that have certain restrictions on trading (transfer into Level 3) or securities where trading restrictions have expired (transfer out of Level 3).
| | † | Change in unrealized appreciation (depreciation) in the current period relating to assets still held at December 31, 2011 was $(39,860). |
The accompanying notes are an integral part of these financial statements.
| Hartford Capital Appreciation HLS Fund |
| Statement of Assets and Liabilities |
| December 31, 2011 |
| (000’s Omitted) |
| Assets: | | | | |
| Investments in securities, at market value (cost $9,699,499) | | $ | 9,298,666 | |
| Foreign currency on deposit with custodian (cost $156) | | | 169 | |
| Unrealized appreciation on foreign currency contracts | | | 163 | |
| Receivables: | | | | |
| Investment securities sold | | | 16,619 | |
| Fund shares sold | | | 1,043 | |
| Dividends and interest | | | 13,868 | |
| Other assets | | | — | |
| Total assets | | | 9,330,528 | |
| Liabilities: | | | | |
| Unrealized depreciation on foreign currency contracts | | | 12,023 | |
| Bank overdraft | | | 92 | |
| Payables: | | | | |
| Investment securities purchased | | | 39,921 | |
| Fund shares redeemed | | | 5,568 | |
| Investment management fees | | | 1,293 | |
| Distribution fees | | | 61 | |
| Accrued expenses | | | 338 | |
| Total liabilities | | | 59,296 | |
| Net assets | | $ | 9,271,232 | |
| Summary of Net Assets: | | | | |
| Capital stock and paid-in-capital | | $ | 10,809,289 | |
| Undistributed net investment income | | | 5,962 | |
| Accumulated net realized loss | | | (1,131,476 | ) |
| Unrealized depreciation of investments and the translations of assets and liabilities denominated in foreign currency | | | (412,543 | ) |
| Net assets | | $ | 9,271,232 | |
| Shares authorized | | | 5,000,000 | |
| Par value | | $ | 0.001 | |
| Class IA: Net asset value per share | | $ | 37.20 | |
| Shares outstanding | | | 219,620 | |
| Net assets | | $ | 8,169,178 | |
| Class IB: Net asset value per share | | $ | 36.90 | |
| Shares outstanding | | | 29,864 | |
| Net assets | | $ | 1,102,054 | |
The accompanying notes are an integral part of these financial statements.
| Hartford Capital Appreciation HLS Fund |
| Statement of Operations |
| For the Year Ended December 31, 2011 |
| (000’s Omitted) |
| Investment Income: | | | | |
| Dividends | | $ | 158,987 | |
| Interest | | | 7,448 | |
| Less: Foreign tax withheld | | | (7,183 | ) |
| Total investment income, net | | | 159,252 | |
| | | | | |
| Expenses: | | | | |
| Investment management fees | | | 62,204 | |
| Transfer agent fees | | | 6 | |
| Distribution fees - Class IB | | | 3,351 | |
| Custodian fees | | | 259 | |
| Accounting services fees | | | 1,669 | |
| Board of Directors' fees | | | 217 | |
| Audit fees | | | 87 | |
| Other expenses | | | 1,221 | |
| Total expenses (before fees paid indirectly) | | | 69,014 | |
| Commission recapture | | | (280 | ) |
| Custodian fee offset | | | — | |
| Total fees paid indirectly | | | (280 | ) |
| Total expenses, net | | | 68,734 | |
| Net investment income | | | 90,518 | |
| | | | | |
| Net Realized Gain on Investments and Foreign Currency Transactions: | | | | |
| Net realized gain on investments | | | 754,483 | |
| Net realized loss on foreign currency contracts | | | (8,734 | ) |
| Net realized gain on other foreign currency transactions | | | 5,228 | |
| Net Realized Gain on Investments and Foreign Currency Transactions | | | 750,977 | |
| | | | | |
| Net Changes in Unrealized Depreciation of Investments and Foreign Currency Transactions: | | | | |
| Net unrealized depreciation of investments | | | (1,928,207 | ) |
| Net unrealized depreciation of foreign currency contracts | | | (11,576 | ) |
| Net unrealized appreciation on translation of other assets and liabilities in foreign currencies | | | 14 | |
| Net Changes in Unrealized Depreciation of Investments and Foreign Currency Transactions | | | (1,939,769 | ) |
| Net Loss on Investments and Foreign Currency Transactions | | | (1,188,792 | ) |
| Net Decrease in Net Assets Resulting from Operations | | $ | (1,098,274 | ) |
The accompanying notes are an integral part of these financial statements.
| Hartford Capital Appreciation HLS Fund |
| Statement of Changes in Net Assets |
| |
| (000’s Omitted) |
| | | For the
Year Ended
December 31,
2011 | | | For the
Year Ended
December 31,
2010 | |
| Operations: | | | | | | | | |
| Net investment income | | $ | 90,518 | | | $ | 71,356 | |
| Net realized gain on investments and foreign currency transactions | | | 750,977 | | | | 971,618 | |
| Net unrealized appreciation (depreciation) of investments and foreign currency transactions | | | (1,939,769 | ) | | | 448,187 | |
| Net Increase (Decrease) In Net Assets Resulting From Operations | | | (1,098,274 | ) | | | 1,491,161 | |
| Distributions to Shareholders: | | | | | | | | |
| From net investment income | | | | | | | | |
| Class IA | | | (71,587 | ) | | | (55,594 | ) |
| Class IB | | | (6,414 | ) | | | (5,968 | ) |
| Total from net investment income | | | (78,001 | ) | | | (61,562 | ) |
| From tax-return of capital | | | | | | | | |
| Class IA | | | — | | | | (6,340 | ) |
| Class IB | | | — | | | | (1,098 | ) |
| Total from tax-return of capital | | | — | | | | (7,438 | ) |
| Total distributions | | | (78,001 | ) | | | (69,000 | ) |
| Capital Share Transactions: | | | | | | | | |
| Class IA | | | | | | | | |
| Sold | | | 1,967,235 | | | | 552,196 | |
| Issued on reinvestment of distributions | | | 71,587 | | | | 61,934 | |
| Redeemed | | | (1,742,622 | ) | | | (1,348,500 | ) |
| Total capital share transactions | | | 296,200 | | | | (734,370 | ) |
| Class IB | | | | | | | | |
| Sold | | | 100,885 | | | | 111,815 | |
| Issued on reinvestment of distributions | | | 6,414 | | | | 7,066 | |
| Redeemed | | | (368,116 | ) | | | (400,674 | ) |
| Total capital share transactions | | | (260,817 | ) | | | (281,793 | ) |
| Net increase (decrease) from capital share transactions | | | 35,383 | | | | (1,016,163 | ) |
| Net Increase (Decrease) In Net Assets | | | (1,140,892 | ) | | | 405,998 | |
| Net Assets: | | | | | | | | |
| Beginning of period | | | 10,412,124 | | | | 10,006,126 | |
| End of period | | $ | 9,271,232 | | | $ | 10,412,124 | |
| Undistributed (distribution in excess of) net investment income | | $ | 5,962 | | | $ | (4,122 | ) |
| Shares: | | | | | | | | |
| Class IA | | | | | | | | |
| Sold | | | 50,481 | | | | 14,803 | |
| Issued on reinvestment of distributions | | | 1,944 | | | | 1,534 | |
| Redeemed | | | (42,673 | ) | | | (36,097 | ) |
| Total share activity | | | 9,752 | | | | (19,760 | ) |
| Class IB | | | | | | | | |
| Sold | | | 2,434 | | | | 2,990 | |
| Issued on reinvestment of distributions | | | 176 | | | | 181 | |
| Redeemed | | | (8,988 | ) | | | (10,870 | ) |
| Total share activity | | | (6,378 | ) | | | (7,699 | ) |
The accompanying notes are an integral part of these financial statements.
| Hartford Capital Appreciation HLS Fund |
| Notes to Financial Statements |
| December 31, 2011 |
| (000’s Omitted) |
Hartford Capital Appreciation HLS Fund (the “Fund”) serves as an underlying investment option for certain variable annuity and variable life insurance separate accounts of Hartford Life Insurance Company (“HLIC”) and its affiliates and certain qualified retirement plans. The Fund may also serve as an underlying investment option for certain variable annuity and variable life separate accounts of other insurance companies. Owners of variable annuity contracts and policyholders of variable life insurance contracts may choose the funds permitted in the variable insurance contract prospectus. In addition, participants in certain qualified retirement plans may choose the Fund if permitted by their plans.
Hartford Series Fund, Inc. (the “Company”) is an open-end registered management investment company comprised of thirty portfolios. Financial Statements for the Fund, a series of the Company, are included in this report.
The Company is organized under the laws of the State of Maryland and is registered with the Securities and Exchange Commission (“SEC”) under the Investment Company Act of 1940, as amended (“1940 Act”). The Fund is a diversified open-end management investment company.
The Fund is divided into Class IA and Class IB shares. Each class is offered at the per share net asset value (“NAV”) without a sales charge and is subject to the same expenses, except that the Class IB shares are subject to distribution and service fees charged pursuant to a Distribution Plan adopted in accordance with Rule 12b-1 under the 1940 Act.
| 2. | Significant Accounting Policies: |
The following is a summary of significant accounting policies of the Fund in the preparation of its financial statements, which are in accordance with the United States Generally Accepted Accounting Principles (“U.S. GAAP”). The preparation of financial statements in accordance with U.S. GAAP may require management to make estimates and assumptions that affect the reported amounts of assets and liabilities and disclosure of contingent assets and liabilities at the date of the financial statements and the reported amounts of increases and decreases in net assets from operations during the reporting period. Actual results could differ from those estimates.
| a) | Determination of Net Asset Value – The NAV of each class of the Fund’s shares is determined as of the close of regular trading (normally 4:00 p.m. Eastern Time) (the “NYSE Close”) on each day that the New York Stock Exchange (the “Exchange”) is open (“Valuation Date”). Information that becomes known to the Fund after the NAV has been calculated on a particular day will not generally be used to retroactively adjust the NAV determined earlier that day. |
| b) | Investment Valuation and Fair Value Measurements – For purposes of calculating the NAV, portfolio securities and other assets held by the Fund's portfolio for which market quotes are readily available are valued at market value. Market value is generally determined on the basis of last reported sales prices or official close price. If no sales are reported, market value is based on quotes obtained from a quotation reporting system, established market makers, or independent pricing services. If market prices are not readily available or are deemed unreliable, the Fund will use the fair value of the security as determined in good faith under policies and procedures established by and under the supervision of the Company’s Board of Directors. Market quotes are considered not readily available where there is an absence of current or reliable market-based data (e.g., trade information or broker quotes), including where events occur after the close of the relevant market, but prior to the NYSE Close that materially affect the values of the Fund’s portfolio securities or assets. In addition, market quotes are considered not readily available when, due to extraordinary circumstances, the exchanges or markets on which the securities trade do not open for trading for the entire day and no other market prices are available. In addition, prices of foreign equities that are principally traded on certain foreign markets are adjusted daily pursuant to a fair value pricing service approved by the Board of Directors in order to reflect an adjustment for the factors occurring after the close of certain foreign markets but before the NYSE Close. Securities that are primarily traded on foreign markets may trade on days that are not business days of the Fund. The value of the foreign securities in which the Fund invests may change on days when a shareholder will not be able to purchase or redeem shares of the Fund. Fair value pricing is subjective in nature and the use of fair value pricing by the Fund may |
cause the NAV of its shares to differ significantly from the NAV that would have been calculated using market prices at the close of the exchange on which a portfolio security is primarily traded. There can be no assurance that the Fund could obtain the fair market value assigned to a security if the Fund were to sell the security at approximately the time at which the Fund determines its NAV.
Fixed income securities (other than short term obligations) and non-exchange traded derivatives held by the Fund are normally valued on the basis of quotes obtained from brokers and dealers or independent pricing services in accordance with procedures established by the Company’s Board of Directors. Prices obtained from independent pricing services use information provided by market makers or estimates of market values obtained from yield data relating to investments or securities with similar characteristics. Generally, the Fund may use fair valuation in regard to fixed income securities when the Fund holds defaulted or distressed securities or securities in a company in which a reorganization is pending. Short-term investments maturing in 60 days or less are generally valued at amortized cost, if their original term to maturity was 60 days or less, or by amortizing their value on the 61st day prior to maturity, if the original term to maturity exceeded 60 days.
Exchange traded options, futures and options on futures are valued at the settlement price determined by the relevant exchange as of the NYSE Close. If such instruments do not trade on an exchange, values may be supplied by an independent pricing service using a formula or other objective method that may take into consideration the style, direction, expiration, strike price, notional value and volatility or other adjustments.
Investments valued in currencies other than U.S. dollars are converted to U.S. dollars using exchange rates obtained from independent pricing services for calculation of the NAV. As a result, the NAV of the Fund’s shares may be affected by changes in the value of currencies in relation to the U.S. dollar. The value of securities traded in markets outside the United States or denominated in currencies other than the U.S. dollar may be affected significantly on a day that the NYSE is closed and the market value may change on days when an investor is not able to purchase, redeem or exchange shares of the Fund.
Foreign currency contracts represent agreements to exchange currencies on specific future dates at predetermined rates. Foreign currency contracts are valued using foreign currency exchange rates and forward rates as provided by an independent pricing service on the Valuation Date.
Investments in open-end mutual funds are valued at the respective NAV of each open-end mutual fund on the Valuation Date.
Financial instruments for which prices are not available from an independent pricing service may be valued using market quotations obtained from one or more dealers that make markets in the respective financial instrument in accordance with procedures established by the Company’s Board of Directors.
U.S. GAAP defines fair value as the price that the Fund would receive to sell an asset or pay to transfer a liability in an orderly transaction between market participants. The U.S. GAAP fair value measurement standards require disclosure of a fair value hierarchy for each major category of assets and liabilities. Various inputs are used in determining the fair value of the Fund’s investments. These inputs are summarized into three broad hierarchy levels. This hierarchy is based on whether the valuation inputs are observable or unobservable. These levels are:
| · | Level 1 – Quoted prices in active markets for identical securities. Level 1 may include exchange traded instruments such as domestic equities, some foreign equities, options, futures, mutual funds, exchange traded funds, rights and warrants. |
| · | Level 2 – Observable inputs other than Level 1 prices, such as quoted prices for similar securities; quoted prices in markets that are not active; or other inputs that are observable or can be corroborated by observable market data. Level 2 may include debt securities that are traded less frequently than exchange traded instruments and which are valued using independent pricing services; foreign equities, that are principally traded on certain foreign markets and are adjusted daily pursuant to a fair value pricing service in order to |
| Hartford Capital Appreciation HLS Fund |
| Notes to Financial Statements – (continued) |
| December 31, 2011 |
| (000’s Omitted) |
reflect an adjustment for the factors occurring after the close of certain foreign markets but before the NYSE Close; and short-term securities, which are valued at amortized cost.
| · | Level 3 – Significant unobservable inputs that are supported by limited or no market activity. Level 3 may include financial instruments whose values are determined using broker quotes or require significant management judgment or estimation. These unobservable valuation inputs may include estimates for current yields, maturity/duration, prepayment speed, and broker quotes for comparable securities along with other assumptions relating to credit quality, collateral value, complexity of the security structure, general market conditions and liquidity. This category may include securities where trading has been halted or there are certain restrictions on trading. While these securities are priced using unobservable inputs, the valuation of these securities reflects the best available data and management believes the prices are a reasonable representation of exit price. |
Valuation levels are not necessarily indicative of the risk associated with investing in such securities. Individual securities within any of the above mentioned asset classes may be assigned a different hierarchical level than those presented above, as individual circumstances dictate.
For additional information, refer to the Investment Valuation Hierarchy Level Summary and the Level 3 roll-forward reconciliation which follow the Schedule of Investments.
For purposes of reporting transfers between different hierarchy levels, both transfers in and out of each level, as applicable, are shown as if they occurred at the beginning of the period.
| c) | Security Transactions and Investment Income – Security transactions are recorded as of the trade date (the date the order to buy or sell is executed) for financial reporting purposes. Securities purchased or sold on a when-issued or delayed-delivery basis may be settled a month or more after the trade date. Realized gains and losses are determined on the basis of identified cost. |
Dividend income is accrued as of the ex-dividend date, except certain dividends from foreign securities where the ex-dividend date may have passed are recorded as soon as the Fund is informed of the dividend. Interest income, including amortization of premium and accretion of discounts, is accrued on a daily basis.
| d) | Foreign Currency Transactions – Assets and liabilities denominated in currencies other than U.S. dollars are translated into U.S. dollars at the exchange rates in effect on the valuation date. Purchases and sales of investment securities, income, and expenses are translated into U.S. dollars at the exchange rates on the dates of such transactions. |
The Fund does not isolate that portion of portfolio security valuation resulting from fluctuations in the foreign currency exchange rates from the fluctuations arising from changes in the market prices of securities held. Exchange rate fluctuations are included with the net realized and unrealized gain or loss on investments in the accompanying financial statements.
Net realized foreign exchange gains or losses arise from sales of foreign currencies and the difference between asset and liability amounts initially stated in foreign currencies and the U.S. dollar value of the amounts actually received or paid. Net unrealized foreign exchange gains or losses arise from changes in the value of other assets and liabilities at the end of the reporting period, resulting from changes in the exchange rates.
| e) | Joint Trading Account – The Fund may invest cash balances into a joint trading account that may be invested in one or more repurchase agreements. |
| f) | Fund Share Valuation and Dividend Distributions to Shareholders – Orders for the Fund’s shares are executed in accordance with the investment instructions of the contract holders and plan participants. The NAV of the Fund’s shares is determined as of the close of business on each business day of the Exchange. The NAV is determined separately for each class of shares of the Fund by dividing the Fund’s net assets attributable to that class by the number of shares of |
the class outstanding. Each class of shares offered by the Fund has equal rights as to assets and voting privileges (except that shareholders of a class have exclusive voting rights regarding any matter relating solely to that class of shares). Income and non-class specific expenses are allocated daily to each class on the basis of the relative net assets of the class. Realized and unrealized capital gains and losses are allocated daily based on the relative net assets of each class of shares of the Fund.
Orders for the purchase of the Fund’s shares received prior to the close of the Exchange on any day the Exchange is open for business are priced at the NAV determined as of the close of the Exchange. Orders received after the close of the Exchange, or on a day on which the Exchange and/or the Fund is not open for business, are priced at the next determined NAV.
Dividends are declared pursuant to a policy adopted by the Company’s Board of Directors based upon the investment performance of the Fund. The policy of the Fund is to pay dividends from net investment income and realized capital gains, if any, at least once a year.
Distributions from net investment income, net realized capital gains and capital are determined in accordance with federal income tax regulations, which may differ from U.S. GAAP with respect to character and timing. These differences may include but are not limited to losses deferred due to wash sale adjustments, foreign currency gains and losses, adjustments related to Passive Foreign Investment Companies (“PFICs”), Real Estate Investment Trusts (“REITs”), Regulated Investment Companies (“RICs”), certain derivatives and partnerships. Permanent book and federal income tax basis differences relating to shareholder distributions will result in reclassifications to certain of the Fund’s capital accounts (see Federal Income Taxes: Reclassification of Capital Accounts note).
| 3. | Securities and Other Investments: |
| a) | Repurchase Agreements – A repurchase agreement is an agreement by which a counterparty agrees to sell a security and agrees to repurchase the security sold at a mutually agreed upon time and price. At the time the Fund enters into a repurchase agreement, the value of the underlying collateral security(ies), including accrued interest, will be equal to or exceed the value of the repurchase agreement. Repurchase agreements expose the Fund to counterparty risk. To minimize counterparty risk, the securities that serve to collateralize the repurchase agreement are held by the Fund's custodian in book entry or physical form in the custodial account of the Fund or in a third party custodial account. Repurchase agreements are valued at cost plus accrued interest. The Fund, as shown on the Schedule of Investments, had outstanding repurchase agreements as of December 31, 2011. |
| b) | Illiquid and Restricted Securities – The Fund is permitted to invest up to 15% of its net assets in illiquid securities. Illiquid securities are those that may not be sold or disposed of in the ordinary course of business within seven days, at approximately the price used to determine the Fund’s NAV. The Fund may not be able to sell illiquid securities or other investments when its sub-adviser considers it desirable to do so or may have to sell such securities or investments at a price that is lower than the price that could be obtained if the securities or investments were more liquid. A sale of illiquid securities or other investments may require more time and may result in higher dealer discounts and other selling expenses than does the sale of those that are liquid. Illiquid securities and investments also may be more difficult to value due to the unavailability of reliable market quotations for such securities or investments, and an investment in them may have an adverse impact on the Fund’s NAV. The Fund may also purchase certain restricted securities that can only be resold to certain qualified investors and may be determined to be liquid pursuant to policies and guidelines established by the Company’s Board of Directors. The Fund, as shown on the Schedule of Investments, had illiquid and/or restricted securities as of December 31, 2011. |
| c) | Securities Purchased on a When-Issued or Delayed-Delivery Basis – Delivery and payment for securities that have been purchased by the Fund on a forward commitment, or when-issued or delayed-delivery basis, take place beyond the customary settlement period. A fund may dispose of or renegotiate a delayed-delivery transaction after it is entered into, and may sell delayed-delivery securities before they are delivered, which may result in a realized gain or loss. During this period, such securities are subject to market fluctuations, and the Fund identifies securities segregated in its records |
| Hartford Capital Appreciation HLS Fund |
| Notes to Financial Statements – (continued) |
| December 31, 2011 |
| (000’s Omitted) |
with value at least equal to the amount of the commitment. As of December 31, 2011, the Fund had no outstanding when-issued or delayed delivery securities.
| 4. | Financial Derivative Instruments: |
The following disclosures contain information on how and why the Fund uses derivative instruments, the credit-risk-related contingent features in certain derivative instruments, and how derivative instruments affect the Fund’s financial position and results of operations. The location and fair value amounts of these instruments on the Statement of Assets and Liabilities and the realized gains and losses and changes in unrealized gains and losses on the Statement of Operations, each categorized by type of derivative contract, are included in the following Additional Derivative Instrument Information footnote. The derivative instruments outstanding as of period-end are disclosed in the notes to the Schedule of Investments and the amounts of realized gains and losses and changes in unrealized gains and losses on derivative instruments during the period are disclosed in the Statement of Operations.
| a) | Foreign Currency Contracts – The Fund may enter into foreign currency contracts that obligate the Fund to purchase or sell currencies at specified future dates. Foreign currency contracts are used to hedge the currency exposure associated with some or all of the Fund's securities and/or as part of an investment strategy. Foreign currency contracts are marked to market daily and the change in value is recorded by the Fund as an unrealized gain or loss. The Fund will record a realized gain or loss when the foreign currency contract is settled. |
Foreign currency contracts involve elements of market risk in excess of the amounts reflected in the Statement of Assets and Liabilities. In addition, risks may arise upon entering into these contracts from the potential inability of the counterparties to meet the terms of the contracts and from unanticipated movements in the value of the foreign currencies relative to the U.S. dollar. The Fund had outstanding foreign currency contracts as shown on the Schedule of Investments as of December 31, 2011.
| b) | Options Contracts – An option contract is a contract sold by one party to another party that offers the buyer the right, but not the obligation, to buy (call) or sell (put) a security or other financial asset at an agreed-upon price during a specific period of time or on a specific date. The Fund may write (sell) covered call and put options on futures, swaps (“swaptions”), securities, commodities or currencies. “Covered” means that so long as the Fund is obligated as the writer of an option, it will own either the underlying securities or currency or an option to purchase the same underlying securities or currency having an expiration date of the covered option and an exercise price equal to or less than the exercise price of the covered option, or will pledge cash or other liquid securities having a value equal to or greater than the fluctuating market value of the option security or currency. Writing put options increases the Fund’s exposure to the underlying instrument. Writing call options decreases the Fund’s exposure to the underlying instrument. Premiums received from writing options that expire are treated as realized gains. Premiums received from writing options that are exercised or closed are added to the proceeds or offset against amounts paid on the underlying futures, swap, security or currency transaction to determine the realized gain or loss. The Fund as a writer of an option has no control over whether the underlying instrument may be sold (call) or purchased (put) and as a result bears the market risk of an unfavorable change in the price of the instrument underlying the written option. There is the risk the Fund may not be able to enter into a closing transaction because of an illiquid market. The Fund may also purchase put and call options. Purchasing call options increases the Fund’s exposure to the underlying instrument. Purchasing put options decreases the Fund’s exposure to the underlying instrument. The Fund pays a premium, which is included on the Fund’s Statement of Assets and Liabilities as an investment and is subsequently marked to market to reflect the current value of the option. Premiums paid for purchasing options that expire are treated as realized losses. Certain options may be purchased with premiums to be determined on a future date. The premiums for these options are based upon implied volatility parameters at specified terms. The risk associated with purchasing put and call options is generally limited to the premium paid. Premiums paid for purchasing options that are exercised or closed are added to the amounts paid or offset against the proceeds on the underlying investment transaction to determine the realized gain or loss. Entering into over-the-counter options also exposes the Fund to counterparty risk. Counterparty risk is the possibility that the counterparty to the agreements may default on its obligation to perform or disagree as to the meaning of the contractual terms in the agreements. As of December 31, 2011, there were no outstanding options contracts. |
| c) | Additional Derivative Instrument Information: |
Fair Values of Derivative Instruments on the Statement of Assets and Liabilities as of December 31, 2011:
| | | Risk Exposure Category | |
| | | | | | Foreign | | | | | | | | | | | | | | | | |
| | | Interest Rate | | | Exchange | | | Credit | | | Equity | | | Commodity | | | Other | | | | |
| | | Contracts | | | Contracts | | | Contracts | | | Contracts | | | Contracts | | | Contracts | | | Total | |
| Assets: | | | | | | | | | | | | | | | | | | | | | | | | | | | | |
| Unrealized appreciation on foreign currency contracts | | $ | — | | | $ | 163 | | | $ | — | | | $ | — | | | $ | — | | | $ | — | | | $ | 163 | |
| Total | | $ | — | | | $ | 163 | | | $ | — | | | $ | — | | | $ | — | | | $ | — | | | $ | 163 | |
| | | | | | | | | | | | | | | | | | | | | | | | | | | | | |
| Liabilities: | | | | | | | | | | | | | | | | | | | | | | | | | | | | |
| Unrealized depreciation on foreign currency contracts | | $ | — | | | $ | 12,023 | | | $ | — | | | $ | — | | | $ | — | | | $ | — | | | $ | 12,023 | |
| Total | | $ | — | | | $ | 12,023 | | | $ | — | | | $ | — | | | $ | — | | | $ | — | | | $ | 12,023 | |
The volume of derivatives that is presented in the Schedule of Investments is consistent with the derivative activity during the year ended December 31, 2011.
The Effect of Derivative Instruments on the Statement of Operations for the year ended December 31, 2011:
| | | Risk Exposure Category | |
| | | | | | Foreign | | | | | | | | | | | | | | | | |
| | | Interest Rate | | | Exchange | | | Credit | | | Equity | | | Commodity | | | Other | | | | |
| | | Contracts | | | Contracts | | | Contracts | | | Contracts | | | Contracts | | | Contracts | | | Total | |
| Realized Gain (Loss) on Derivatives Recognized as a Result of Operations: |
| Net realized gain on investments in purchased options | | $ | — | | | $ | — | | | $ | — | | | $ | 90 | | | $ | — | | | $ | — | | | $ | 90 | |
| Net realized loss on foreign currency contracts | | | — | | | | (8,734 | ) | | | — | | | | — | | | | — | | | | — | | | | (8,734 | ) |
| Total | | $ | — | | | $ | (8,734 | ) | | $ | — | | | $ | 90 | | | $ | — | | | $ | — | | | $ | (8,644 | ) |
| | | | | | | | | | | | | | | | | | | | | | | | | | | | | |
| Net Change in Unrealized Appreciation (Depreciation) on Derivatives Recognized as a Result of Operations: |
| Net change in unrealized depreciation of foreign currency contracts | | $ | — | | | $ | (11,576 | ) | | $ | — | | | $ | — | | | $ | — | | | $ | — | | | $ | (11,576 | ) |
| Total | | $ | — | | | $ | (11,576 | ) | | $ | — | | | $ | — | | | $ | — | | | $ | — | | | $ | (11,576 | ) |
| a) | Credit and Counterparty Risks – Credit risk depends largely on the perceived financial health of bond issuers. In general, the credit rating is inversely related to the credit risk of the issuer. Higher rated bonds generally are deemed to have less credit risk, while lower or unrated bonds are deemed to have higher risk of default. The share price, yield and total return of a fund that holds securities with higher credit risk may be more volatile than those of a fund that holds bonds with lower credit risk. Similar to credit risk, the Fund may be exposed to counterparty risk, or the risk that an institution or other entity with which the Fund has unsettled or open transactions will default. |
| b) | Market Risks – The Fund’s investments in derivatives and other financial instruments expose the Fund to various risks including, but not limited to, interest rate, prepayment, extension, foreign currency, and equity risks. Interest rate risk is the risk that fixed income securities will decline in value because of changes in interest rates. As nominal interest rates rise, the values of certain fixed income securities held by the Fund are likely to decrease. A nominal interest rate can be described as the sum of a real interest rate and an expected inflation rate. Fixed income securities with longer durations tend to be more sensitive to changes in interest rates, usually making them more volatile than securities with shorter durations. Duration is useful primarily as a measure of the sensitivity of a fixed income security’s market price to interest rate (i.e., yield) movements. In addition, securities are subject to extension risk. Rising interest rates may cause prepayments to occur at a slower than expected rate, thereby effectively lengthening the maturity of the security and |
| Hartford Capital Appreciation HLS Fund |
| Notes to Financial Statements – (continued) |
| December 31, 2011 |
| (000’s Omitted) |
making the security more sensitive to interest rate changes. Prepayment and extension risk are major risks of mortgage-backed securities and certain asset-backed securities. For certain asset-backed securities, the actual maturity may be less than the stated maturity shown in the Schedule of Investments, if applicable. As a result, the timing of income recognition relating to these securities may vary based upon the actual maturity. If the Fund invests directly in foreign currencies or in securities that trade in, and receive revenues in, foreign currencies, or in derivatives that provide exposure to foreign currencies, it will be subject to the risk that those currencies will decline in value relative to the base currency of the Fund, or, in the case of hedging positions, that the Fund’s base currency will decline in value relative to the currency being hedged. Currency rates in foreign countries may fluctuate significantly over short periods of time for a number of reasons, including changes in interest rates, intervention (or the failure to intervene) by U.S. or foreign governments, central banks or supranational entities, such as the International Monetary Fund, or by the imposition of currency controls or other political developments in the United States or abroad. As a result, the Fund’s investments in foreign currency denominated securities may reduce the returns of the Fund. The market values of equity securities, such as common stocks and preferred stocks, or equity related investments, such as futures and options, may decline due to general market conditions which are not specifically related to a particular company, such as real or perceived adverse economic conditions, changes in the general outlook for corporate earnings, changes in interest or currency rates or adverse investor sentiment generally. The market value of equity securities may also decline due to factors which affect a particular industry or industries, such as labor shortages or increased production costs and competitive conditions within an industry. Equity securities and equity related investments generally have greater market price volatility than fixed income securities.
| a) | Federal Income Taxes – For federal income tax purposes, the Fund intends to continue to qualify as a RIC under Subchapter M of the Internal Revenue Code (“IRC”) by distributing substantially all of its taxable net investment income and net realized capital gains to its shareholders and otherwise complying with the requirements of RICs. The Fund has distributed substantially all of its income and capital gains in prior years, if applicable, and intends to distribute substantially all of its income and capital gains prior to the next fiscal year-end. Accordingly, no provision for federal income or excise taxes has been made in the accompanying financial statements. Distributions from short-term capital gains are treated as ordinary income distributions for federal income tax purposes. |
| b) | Net Investment Income (Loss), Net Realized Gains (Losses) – Net investment income (loss) and net realized gains (losses) may differ for financial statement and tax purposes primarily because of losses deferred due to wash sale adjustments, foreign currency gains and losses, adjustments related to PFICs, REITs, RICs, certain derivatives and partnerships. The character of distributions made during the year from net investment income or net realized gains may differ from their ultimate characterization for federal income tax purposes. Also, due to the timing of dividend distributions, the fiscal year in which amounts are distributed may differ from the year that the income or realized gains (losses) were recorded by the Fund. |
| c) | Distributions and Components of Distributable Earnings – The tax character of distributions paid by the Fund for the periods indicated is as follows (as adjusted for dividends payable): |
| | | For the Year Ended | | | For the Year Ended | |
| | | December 31, 2011 | | | December 31, 2010 | |
| Ordinary Income | | $ | 78,001 | | | $ | 61,562 | |
| Tax Return of Capital | | | — | | | | 7,438 | |
As of December 31, 2011, the Fund’s components of distributable earnings (deficit) on a tax basis were as follows:
| | | Amount | |
| Undistributed Ordinary Income | | $ | 6,056 | |
| Accumulated Capital and Other Losses* | | | (871,619 | ) |
| Unrealized Depreciation† | | | (672,494 | ) |
| Total Accumulated Deficit | | $ | (1,538,057 | ) |
| * | The Fund has capital loss carryforwards that are identified in the Capital Loss Carryforward note that follows. |
| † | The difference between book-basis and tax-basis unrealized appreciation (depreciation) may be attributable to the losses deferred due to wash sale adjustments, foreign currency gains and losses, adjustments related to PFICs, REITs, RICs, certain derivatives and partnerships. |
| d) | Reclassification of Capital Accounts – The Fund may record reclassifications in its capital accounts. These reclassifications have no impact on the total net assets of the Fund. The reclassifications are a result of permanent differences between U.S. GAAP and tax accounting for such items as foreign currency, PFICs, expiration or utilization of capital loss carryforwards or net operating losses. Adjustments are made to reflect the impact these items have on current and future distributions to shareholders. Therefore, the source of the Fund’s distributions may be shown in the accompanying Statement of Changes in Net Assets as from undistributed net investment income, from accumulated net realized gains on investments or from capital depending on the type of book and tax differences that exist. For the year ended December 31, 2011, the Fund recorded reclassifications to increase (decrease) the accounts listed below: |
| | | Amount | |
| Undistributed Net Investment Income | | $ | (2,433 | ) |
| Accumulated Net Realized Gain (Loss) | | | (3,314 | ) |
| Capital Stock and Paid-in-Capital | | | 5,747 | |
| e) | Capital Loss Carryforward – On December 22, 2010, the Regulated Investment Company Modernization Act of 2010 (the “Act”) was enacted, which made changes to the capital loss carryforward rules. The changes are effective for taxable years beginning after the date of enactment. Under the Act, funds are permitted to carry forward capital losses for an unlimited period. However, any losses incurred during those future taxable years will be required to be utilized prior to the losses incurred in pre-enactment taxable years, which carry an expiration date. As a result of this ordering rule, pre-enactment capital loss carryforwards may be more likely to expire unused. Additionally, post-enactment capital loss carryforwards will retain their character as either short-term or long-term capital losses rather than being considered all short-term as permitted under prior regulation. |
At December 31, 2011 (tax-year-end), the Fund had capital loss carryforwards for U.S. federal income tax purposes as follows:
| Year of Expiration | | Amount | |
| 2017 | | $ | 871,619 | |
| Total | | $ | 871,619 | |
As of December 31, 2011, the Fund utilized $791,337 of prior year capital loss carryforwards.
| f) | Accounting for Uncertainty in Income Taxes – The Fund has adopted financial reporting rules that require the Fund to analyze all open tax years, as defined by the statute of limitations, for all major jurisdictions. Generally, tax authorities can examine all tax returns filed for the last three years. The Fund does not have an examination in progress. |
| Hartford Capital Appreciation HLS Fund |
| Notes to Financial Statements – (continued) |
| December 31, 2011 |
| (000’s Omitted) |
The Fund has reviewed all open tax years and major jurisdictions and concluded that these financial reporting rules had no effect on the Fund’s financial position or results of operations. There is no tax liability resulting from unrecognized tax benefits relating to uncertain income tax positions taken or expected to be taken on the tax return for the fiscal year ended December 31, 2011. The Fund is also not aware of any tax positions for which it is reasonably possible that the total amounts of unrecognized tax benefits will significantly change in the next twelve months.
| a) | Investment Management Agreement – HL Investment Advisors, LLC (“HL Advisors”), an indirect wholly owned subsidiary of The Hartford Financial Services Group, Inc. (“The Hartford”), serves as investment manager to the Fund pursuant to an Investment Management Agreement with the Company. As investment manager, HL Advisors has overall investment supervisory responsibility for the Fund. In addition, HL Advisors provides administrative personnel, services, equipment, facilities and office space for proper operation of the Fund. HL Advisors has contracted with Wellington Management Company, LLP (“Wellington Management”) under a sub-advisory agreement for the provision of day-to-day investment management services to the Fund in accordance with the Fund’s investment objective and policies. The Fund pays a fee to HL Advisors, a portion of which may be used to compensate Wellington Management. |
The schedule below reflects the rates of compensation paid to HL Advisors for investment management services rendered as of December 31, 2011; the rates are accrued daily and paid monthly.
| Average Daily Net Assets | Annual Fee |
| On first $250 million | 0.7750% |
| On next $250 million | 0.7250% |
| On next $500 million | 0.6750% |
| On next $4 billion | 0.6250% |
| On next $5 billion | 0.6225% |
| Over $10 billion | 0.6200% |
Effective March 1, 2012, HL Advisors will be paid compensation for investment management services according to the following schedule:
| Average Daily Net Assets | Annual Fee |
| On first $250 million | 0.7750% |
| On next $250 million | 0.7250% |
| On next $500 million | 0.6750% |
| On next $1.5 billion | 0.6250% |
| On next $2.5 billion | 0.6200% |
| On next $5 billion | 0.6150% |
| Over $10 billion | 0.6100% |
| b) | Accounting Services Agreement – Pursuant to the Fund Accounting Agreement between HLIC and the Company, on behalf of the Fund, HLIC provides accounting services to the Fund and receives monthly compensation based on the Fund’s average daily net assets at the rates set forth below. The Fund’s accounting services fees are accrued daily and paid monthly. |
| Average Daily Net Assets | Annual Fee |
| On first $5 billion | 0.018% |
| On next $5 billion | 0.016% |
| Over $10 billion | 0.014% |
| | | |
| c) | Operating Expenses – Allocable expenses incurred by the Company are allocated to each Fund and allocated to classes within a Fund in proportion to the average daily net assets of the Fund and each class, except where allocation of certain expenses is more fairly made directly to the Fund or to specific classes within a Fund. |
| d) | Fees Paid Indirectly – The Company, on behalf of the Fund, has entered into agreements with State Street Global Markets, LLC and Russell Implementation Services, Inc. to partially recapture non-discounted trade commissions. Such rebates are used to pay a portion of the Fund’s expenses. In addition, the Fund’s custodian bank has also agreed to reduce its fees when the Fund maintains cash on deposit in a non-interest-bearing custody account. For the year ended December 31, 2011, these amounts, if any, are included in the Statement of Operations. |
The ratio of expenses to average net assets in the accompanying financial highlights excludes the reduction in expenses related to fees paid indirectly. The annualized expense ratio for the period listed below reflecting the reduction for fees paid indirectly is as follows:
| | | Year Ended | |
| | | December 31, 2011 | |
| Class IA | | | 0.67 | % |
| Class IB | | | 0.92 | |
| e) | Distribution Plan for Class IB shares – The Company, on behalf of the Fund, has adopted a Distribution Plan pursuant to Rule 12b-1 of the 1940 Act to compensate the Distributor, Hartford Securities Distribution Company, Inc. (a wholly owned, ultimate subsidiary of The Hartford), from assets attributable to the Class IB shares for services rendered and expenses borne in connection with activities primarily intended to result in the sale of the Class IB shares, subject to the review and approval of the Company’s Board of Directors. |
The Distribution Plan provides that the Fund may pay annually up to 0.25% of the average daily net assets of the Fund attributable to its Class IB shares for activities primarily intended to result in the sale of Class IB shares. The Board has the authority to suspend or reduce these payments at any point in time. Under the terms of the Distribution Plan and the principal underwriting agreement, the Fund is authorized to make payments monthly to the Distributor that may be used to pay or compensate entities providing distribution and shareholder servicing with respect to the Class IB shares for such entities’ fees or expenses incurred or paid in that regard. These fees are accrued daily and paid monthly.
| f) | Other Related Party Transactions – Certain officers of the Fund are directors and/or officers of HL Advisors and/or The Hartford or its subsidiaries. For the year ended December 31, 2011, a portion of the Fund’s chief compliance officer’s salary was paid by all the investment companies in the Hartford fund complex. The portion allocated to the Fund was in the amount of $12. Hartford Administrative Services Company (“HASCO”), an indirect wholly owned subsidiary of The Hartford, provides transfer agent services to the Fund. HASCO was compensated on a per account basis for providing such services. The amount paid to HASCO can be found in the Statement of Operations. These fees are accrued daily and paid monthly. |
| g) | Payment from Affiliate – In July of 2007, The Hartford entered into a settlement with the Attorneys General of the states of New York, Connecticut and Illinois relating to market timing and the company's individual variable annuity contracts in which certain payments would be made directly to the variable annuity contract holders. The distribution plan provided that unclaimed money from the settlement would be distributed to certain HLS Funds that are investment options through a Hartford individual variable annuity contract. The unclaimed money was distributed to the Fund on September 18, 2009. |
| Hartford Capital Appreciation HLS Fund |
| Notes to Financial Statements – (continued) |
| December 31, 2011 |
| (000’s Omitted) |
The total return in the accompanying financial highlights includes a payment from an affiliate. Had the payment from the affiliate been excluded, the impact and total return for the period listed below would have been as follows:
| | | For the Year Ended December 31, 2009 | |
| | | Class IA | | | Class IB | |
| Impact from Payment from Affiliate for Attorneys General Settlement | | | —% | | | | —% | |
| Total Return Excluding Payment from Affiliate | | | 45.66 | | | | 45.30 | |
8. Investment Transactions:
For the year ended December 31, 2011, the Fund's aggregate purchases and sales of investment securities (excluding short-term investments) were as follows:
| | | Amount | |
| Cost of Purchases Excluding U.S. Government Obligations | | $ | 10,866,216 | |
| Sales Proceeds Excluding U.S. Government Obligations | | | 11,015,954 | |
9. Line of Credit:
The Fund is one of several Hartford funds that participate in a $500 million committed revolving line of credit facility. The facility is to be used for temporary or emergency purposes. Under the arrangement, the funds are required to own securities having a market value in excess of 300% of the total bank borrowings. The interest rate on borrowings varies depending on the nature of the loan. The facility also requires a fee to be paid based on the amount of the commitment. This commitment fee is allocated to all of the funds participating in the line of credit based on the average net assets of the funds. During the year ended December 31, 2011, the Fund did not have any borrowings under this facility.
10. Industry Classifications:
Other than the industry classifications “Other Investment Pools and Funds” and “Exchange Traded Funds,” equity industry classifications used in this report are the Global Industry Classification Standard, which was developed by and is the exclusive property and service mark of MSCI, Inc. and Standard & Poor’s.
11. Indemnifications:
Under the Company’s organizational documents, the Company shall indemnify its officers and directors to the full extent required or permitted under Maryland General Corporation Law and the federal securities laws. In addition, the Company, on behalf of the Fund, may enter into contracts that contain a variety of indemnifications. The Company’s maximum exposure under these arrangements is unknown. However, as of the date of these financial statements, the Company has not had prior claims or losses pursuant to these contracts and expects the risk of loss to be remote.
[This page is intentionally left blank]
| Hartford Capital Appreciation HLS Fund |
| Financial Highlights |
| – Selected Per-Share Data (A) – |
| | | Net Asset | | | | | | | | | Net Realized | | | | | | | | | | | | | | | | | | Net Increase | | | | |
| | | Value at | | | | | | | | | and Unrealized | | | Total from | | | Dividends from | | | Distributions | | | | | | | | | (Decrease) in | | | Net Asset | |
| | | Beginning of | | | Net Investment | | | Payments from | | | Gain (Loss) on | | | Investment | | | Net Investment | | | from Realized | | | Distributions | | | Total | | | Net Asset | | | Value at End of | |
| Class(A) | | Period | | | Income (Loss) | | | (to) Affiliate | | | Investments | | | Operations | | | Income | | | Capital Gains | | | from Capital | | | Distributions | | | Value | | | Period | |
| | | | | | | | | | | | | | | | | | | | | | | | | | | | | | | | | | |
| For the Year Ended December 31, 2011 |
| IA | | $ | 42.36 | | | $ | 0.37 | | | $ | — | | | $ | (5.20 | ) | | $ | (4.83 | ) | | $ | (0.33 | ) | | $ | — | | | $ | — | | | $ | (0.33 | ) | | $ | (5.16 | ) | | $ | 37.20 | |
| IB | | | 42.00 | | | | 0.32 | | | | — | | | | (5.20 | ) | | | (4.88 | ) | | | (0.22 | ) | | | — | | | | — | | | | (0.22 | ) | | | (5.10 | ) | | | 36.90 | |
| | | | | | | | | | | | | | | | | | | | | | | | | | | | | | | | | | | | | | | | | | | | | |
| For the Year Ended December 31, 2010 |
| IA | | | 36.63 | | | | 0.30 | | | | — | | | | 5.72 | | | | 6.02 | | | | (0.26 | ) | | | — | | | | (0.03 | ) | | | (0.29 | ) | | | 5.73 | | | | 42.36 | |
| IB | | | 36.32 | | | | 0.21 | | | | — | | | | 5.66 | | | | 5.87 | | | | (0.16 | ) | | | — | | | | (0.03 | ) | | | (0.19 | ) | | | 5.68 | | | | 42.00 | |
| | | | | | | | | | | | | | | | | | | | | | | | | | | | | | | | | | | | | | | | | | | | | |
| For the Year Ended December 31, 2009 |
| IA | | | 25.34 | | | | 0.31 | | | | — | | | | 11.27 | | | | 11.58 | | | | (0.29 | ) | | | — | | | | — | | | | (0.29 | ) | | | 11.29 | | | | 36.63 | |
| IB | | | 25.14 | | | | 0.25 | | | | — | | | | 11.14 | | | | 11.39 | | | | (0.21 | ) | | | — | | | | — | | | | (0.21 | ) | | | 11.18 | | | | 36.32 | |
| | | | | | | | | | | | | | | | | | | | | | | | | | | | | | | | | | | | | | | | | | | | | |
| For the Year Ended December 31, 2008 |
| IA | | | 52.46 | | | | 0.46 | | | | — | | | | (22.58 | ) | | | (22.12 | ) | | | (0.50 | )(F) | | | (4.28 | ) | | | (0.22 | )(F) | | | (5.00 | ) | | | (27.12 | ) | | | 25.34 | |
| IB | | | 52.01 | | | | 0.39 | | | | — | | | | (22.37 | ) | | | (21.98 | ) | | | (0.39 | )(F) | | | (4.28 | ) | | | (0.22 | )(F) | | | (4.89 | ) | | | (26.87 | ) | | | 25.14 | |
| | | | | | | | | | | | | | | | | | | | | | | | | | | | | | | | | | | | | | | | | | | | | |
| For the Year Ended December 31, 2007 |
| IA | | | 53.49 | | | | 0.35 | | | | — | | | | 8.36 | | | | 8.71 | | | | (0.07 | ) | | | (9.67 | ) | | | — | | | | (9.74 | ) | | | (1.03 | ) | | | 52.46 | |
| IB | | | 53.21 | | | | 0.22 | | | | — | | | | 8.28 | | | | 8.50 | | | | (0.03 | ) | | | (9.67 | ) | | | — | | | | (9.70 | ) | | | (1.20 | ) | | | 52.01 | |
| (A) | Information presented relates to a share outstanding throughout the indicated period. |
| (B) | The figures do not include sales charges or other fees which may be applied at the variable life insurance, variable annuity or qualified retirement plan product level. Any such additional sales charges or other fees would lower the Fund's performance. |
| (C) | Ratios do not reflect reductions for fees paid indirectly. Please see Fees Paid Indirectly in the Notes to Financial Statements. |
| (D) | Portfolio turnover rate is calculated on the basis of the Fund as a whole without distinguishing between the classes of shares issued. |
| (E) | Total return without the inclusion of the Payment from (to) Affiliate can be found in Expenses in the accompanying Notes to Financial Statements. |
| (F) | In 2009, the Fund amended its 2008 federal tax return in order to change an election relating to the recognition and classification of certain net realized losses and ordinary income items. As a result, a portion of the distributions that were made by the Fund during 2008 were reclassified as return of capital. This reclassification had no impact on the total net assets or net asset value of the Fund. |
| - Ratios and Supplemental Data - |
| | | | | | | Ratio of Expenses to Average Net | | | Ratio of Expenses to Average Net | | | Ratio of Net Investment Income | | | Portfolio Turnover | |
| Total Return(B) | | | Net Assets at End of Period | | | Assets Before Waivers(C) | | | Assets After Waivers(C) | | | (Loss) to Average Net Assets | | | Rate(D) | |
| | | | | | | | | | | | | | | | | |
| | | | | | | | | | | | | | | | | |
| (11.41 | )% | | $ | 8,169,178 | | | | 0.67 | % | | | 0.67 | % | | | 0.95 | % | | | 113 | % |
| (11.62 | ) | | | 1,102,054 | | | | 0.92 | | | | 0.92 | | | | 0.71 | | | | — | |
| | | | | | | | | | | | | | | | | | | | | | |
| | | | | | | | | | | | | | | | | | | | | | |
| 16.50 | | | | 8,889,906 | | | | 0.67 | | | | 0.67 | | | | 0.77 | | | | 95 | |
| 16.21 | | | | 1,522,218 | | | | 0.92 | | | | 0.92 | | | | 0.52 | | | | — | |
| | | | | | | | | | | | | | | | | | | | | | |
| | | | | | | | | | | | | | | | | | | | | | |
| 45.67 | (E) | | | 8,410,214 | | | | 0.68 | | | | 0.68 | | | | 1.03 | | | | 128 | |
| 45.30 | (E) | | | 1,595,912 | | | | 0.93 | | | | 0.93 | | | | 0.79 | | | | — | |
| | | | | | | | | | | | | | | | | | | | | | |
| | | | | | | | | | | | | | | | | | | | | | |
| (45.59 | ) | | | 6,017,984 | | | | 0.67 | | | | 0.67 | | | | 1.12 | | | | 131 | |
| (45.73 | ) | | | 1,295,065 | | | | 0.92 | | | | 0.92 | | | | 0.87 | | | | — | |
| | | | | | | | | | | | | | | | | | | | | | |
| | | | | | | | | | | | | | | | | | | | | | |
| 16.83 | | | | 12,123,834 | | | | 0.67 | | | | 0.67 | | | | 0.68 | | | | 101 | |
| 16.53 | | | | 2,933,905 | | | | 0.92 | | | | 0.92 | | | | 0.42 | | | | — | |
| Report of Independent Registered Public Accounting Firm |
| The Board of Directors and Shareholders of |
| Hartford Series Fund, Inc. |
We have audited the accompanying statement of assets and liabilities, including the schedule of investments, of Hartford Capital Appreciation HLS Fund (one of the portfolios constituting Hartford Series Fund, Inc. (the Funds)) as of December 31, 2011, and the related statement of operations for the year then ended, the statements of changes in net assets for each of the two years in the period then ended, and the financial highlights for each of the five years in the period then ended. These financial statements and financial highlights are the responsibility of the Funds’ management. Our responsibility is to express an opinion on these financial statements and financial highlights based on our audits.
We conducted our audits in accordance with the standards of the Public Company Accounting Oversight Board (United States). Those standards require that we plan and perform the audit to obtain reasonable assurance about whether the financial statements and financial highlights are free of material misstatement. We were not engaged to perform an audit of the Funds’ internal control over financial reporting. Our audits included consideration of internal control over financial reporting as a basis for designing audit procedures that are appropriate in the circumstances, but not for the purpose of expressing an opinion on the effectiveness of the Funds’ internal control over financial reporting. Accordingly, we express no such opinion. An audit also includes examining, on a test basis, evidence supporting the amounts and disclosures in the financial statements and financial highlights, assessing the accounting principles used and significant estimates made by management, and evaluating the overall financial statement presentation. Our procedures included confirmation of securities owned as of December 31, 2011, by correspondence with the custodian and brokers or by other appropriate auditing procedures where replies from brokers were not received. We believe that our audits provide a reasonable basis for our opinion.
In our opinion, the financial statements and financial highlights referred to above present fairly, in all material respects, the financial position of Hartford Capital Appreciation HLS Fund of Hartford Series Fund, Inc. at December 31, 2011, the results of its operations for the year then ended, the changes in its net assets for each of the two years in the period then ended, and the financial highlights for each of the five years in the period then ended, in conformity with U.S. generally accepted accounting principles.
Minneapolis, MN
February 13, 2012
| Hartford Capital Appreciation HLS Fund |
| Directors and Officers (Unaudited) |
The Board of Directors of the Company appoints officers who are responsible for the day-to-day operations of the Fund and who execute policies formulated by the Directors. Each director serves until his or her death, resignation, or retirement or until the next annual meeting of shareholders is held or until his or her successor is elected and qualifies.
Directors and officers who are employed by or who have a financial interest in The Hartford are considered “interested” persons of the Fund pursuant to the 1940 Act. Each officer and two of the Company’s directors, as noted in the chart below, are “interested” persons of the Fund. Each director serves as a director for The Hartford Mutual Funds, Inc., The Hartford Mutual Funds II, Inc., Hartford Series Fund, Inc., Hartford HLS Series Fund II, Inc., and as a trustee for The Hartford Alternative Strategies Fund, which, as of December 31, 2011, collectively consist of 91 funds. Correspondence may be sent to directors and officers c/o Hartford Mutual Funds, P.O. Box 2999, Hartford, Connecticut 06104-2999, except that correspondence to Ms. Fagely may be sent to 500 Bielenberg Drive, Woodbury, Minnesota 55125.
The table below sets forth, for each director and officer, his or her name, year of birth, current position with the Company and date first elected or appointed to Hartford Series Fund, Inc. (“HSF”), and Hartford HLS Series Fund II, Inc. (“HSF2”), principal occupation, and, for directors, other directorships held. The Fund’s statement of additional information contains further information on the directors and is available free of charge by calling 1-800-862-6668 or writing to Hartford HLS Funds, c/o Individual Annuity Services, P.O. Box 5085, Hartford, CT 06102-5085.
Information on the aggregate remuneration paid to the directors of the Company can be found in the Statement of Operations herein. The Fund pays to The Hartford a portion of the chief compliance officer’s compensation, but does not pay salaries or compensation to any of their other officers or directors who are employed by The Hartford.
Non-Interested Directors
Lynn S. Birdsong (1946) Director since 2003, Co-Chairman of the Investment Committee
Mr. Birdsong is a private investor. Mr. Birdsong currently serves as a Director of the Sovereign High Yield Investment Company (April 2010 to current). Mr. Birdsong currently serves as an Independent Director of Nomura Partners Funds, Inc. (formerly, The Japan Fund) (March 2003 to current). From 2003 to March 2005, Mr. Birdsong was an independent director of the Atlantic Whitehall Funds. From 1979 to 2002, Mr. Birdsong was a managing director of Zurich Scudder Investments, an investment management firm. During his employment with Scudder, Mr. Birdsong was an Interested Director of The Japan Fund. Since 1981, Mr. Birdsong has been a partner in Birdsong Company, an advertising specialty firm.
Robert M. Gavin, Jr. (1940) Director since 2002 (HSF) and 1986 (HSF2), Chairman of the Board since 2004
Dr. Gavin is an educational consultant. Prior to September 1, 2001, he was President of Cranbrook Education Community and prior to July 1996, he was President of Macalester College, St. Paul, Minnesota.
Duane E. Hill (1945) Director since 2001 (HSF) and 2002 (HSF2), Chairman of the Nominating Committee
Mr. Hill is Partner of TSG Ventures L.P., a private equity investment company. Mr. Hill is a former partner of TSG Capital Group, a private equity investment firm that served as sponsor and lead investor in leveraged buyouts of middle market companies.
Sandra S. Jaffee (1941) Director since 2005
Ms. Jaffee served as Chairman (2008 to 2009) and Chief Executive Officer of Fortent (formerly Searchspace Group), a leading provider of compliance/regulatory technology to financial institutions from August 2005 to August 2009. From August 2004 to August 2005, Ms. Jaffee served as an Entrepreneur in Residence with Warburg Pincus, a private equity firm. From September 1995 to July 2004, Ms. Jaffee served as Executive Vice President at Citigroup, where she was President and Chief Executive Officer of Citibank’s Global Securities Services (1995 to 2003). Ms. Jaffe currently serves as a member of the Board of Directors of Broadridge Financial Solutions as well as a Trustee of Muhlenberg College.
William P. Johnston (1944) Director since 2005, Chairman of the Compliance Committee
In June 2006, Mr. Johnston was appointed as Senior Advisor to The Carlyle Group, a global private equity investment firm. In August 2007, Mr. Johnston was elected to the Board of Directors of LifeCare Holdings, Inc. In February 2008, Mr. Johnston was elected to the Board of Directors of HCR-ManorCare, Inc. In May 2006, Mr. Johnston was elected to the Supervisory Board of Fresenius Medical Care AG & Co. KGaA, after its acquisition of Renal Care Group, Inc. in March 2006. Mr. Johnston joined Renal Care Group in November 2002 as a member of the Board of Directors and served as Chairman of the Board from March 2003 through March 2006. Mr. Johnston served as a Director of MultiPlan, Inc. from July 2006 through August 2010. From September 1987 to December 2002, Mr. Johnston was with Equitable Securities Corporation (and its successors, SunTrust Equitable Securities and SunTrust Robinson Humphrey) serving in various investment banking and managerial positions, including Managing Director and Head of Investment Banking, Chief Executive Officer and Vice Chairman.
| Hartford Capital Appreciation HLS Fund |
| Directors and Officers (Unaudited) – (continued) |
Phillip O. Peterson (1944) Director since 2002 (HSF) and 2000 (HSF2), Chairman of the Audit Committee
Mr. Peterson is a mutual fund industry consultant. He was a partner of KPMG LLP (an accounting firm) until July 1999. Mr. Peterson joined William Blair Funds in February 2007 as a member of the Board of Trustees. From January 2004 to April 2005, Mr. Peterson served as Independent President of the Strong Mutual Funds.
Lemma W. Senbet (1946) Director since 2005
Dr. Senbet is the William E. Mayer Chair Professor of Finance and Director, Center for Financial Policy, at the University of Maryland, Robert H. Smith School of Business. He was chair of the Finance Department from 1998 to 2006. Previously he was a chaired professor of finance at the University of Wisconsin-Madison. Also, he was director of the Fortis Funds from March 2000 to July 2002. Dr. Senbet served the finance profession in various capacities, including as director of the American Finance Association and President of the Western Finance Association. In 2006, Dr. Senbet was inducted Fellow of Financial Management Association International for his career-long distinguished scholarship and professional service.
Interested Directors and Officers
David N. Levenson (1966) Director since 2010
Mr. Levenson currently serves as President of The Hartford’s Wealth Management business. He was appointed to this role in July 2010. Previously, Mr. Levenson served as Executive Vice President of Legacy Holdings for The Hartford from June 2009 to July 2010. From 2006 to 2009, Mr. Levenson was with Hartford Life Insurance K.K. where he served as President and Chief Executive Officer from 2007 to 2009. He served as Managing Director of Hartford Investment Management Company from 2005 to 2006. Additionally, Mr. Levenson serves as Executive Vice President of The Hartford and as President, Director and Chief Executive Officer of Hartford Life Insurance Company (“HLIC”) and Hartford Life, Inc. (“HL Inc.”).
Lowndes A. Smith (1939) Director since 1996 (HSF) and 2002 (HSF2), Co-Chairman of the Investment Committee
Mr. Smith served as Vice Chairman of The Hartford from February 1997 to January 2002, as President and Chief Executive Officer of HL Inc. from February 1997 to January 2002, and as President and Chief Operating Officer of The Hartford Life Insurance Companies from January 1989 to January 2002. Mr. Smith serves as a Director of White Mountains Insurance Group, Ltd., One Beacon Insurance and Symetra Financial and as a Managing Director of Whittington Gray Associates.
Other Officers
James E. Davey (1964) President and Chief Executive Officer since 2010
Mr. Davey serves as Executive Vice President of HLIC. Additionally, Mr. Davey serves as President, Chief Executive Officer and Manager of Hartford Investment Financial Services, Inc. (“HIFSCO”) and President, Chief Executive Officer and Manager of HL Advisors. Mr. Davey joined The Hartford in 2002.
Michael R. Dressen (1963) AML Compliance Officer since 2011
Mr. Dressen currently serves as Assistant Vice President of HLIC. He also serves as Chief Compliance Officer and AML Compliance Officer of Hartford Administrative Services Company (“HASCO”) and as Assistant Secretary and Compliance Officer of HIFSCO. Mr Dressen joined The Hartford in 2005 from State Farm Insurance Companies where he held various positions related to mutual funds, variable products, and property casualty insurance.
Tamara L. Fagely (1958) Vice President, Treasurer and Controller since 2002 (HSF) and 1993 (HSF2)
Ms. Fagely has been a Vice President of HASCO since 1998 and Chief Financial Officer since 2006. Currently Ms. Fagely is a Vice President of HLIC. She served as Assistant Vice President of HLIC from December 2001 through March 2005. In addition, Ms. Fagely is Controller and Chief Financial Officer of HIFSCO.
Dr. Robert J. Froehlich (1953) Senior Managing Director since 2009
Dr. Froehlich joined The Hartford as Senior Managing Director in September 2009. Prior to joining The Hartford, Dr. Froehlich served as Vice Chairman of Deutsche Asset Management from 1997-2009.
Edward P. Macdonald (1967) Vice President, Secretary and Chief Legal Officer since 2005
Mr. Macdonald serves as Vice President of HLIC and Chief Legal Officer of Mutual Funds and Vice President of HIFSCO. He also serves as Vice President and Secretary of HASCO, and Chief Legal Officer, Secretary and Vice President of HL Advisors. Mr. Macdonald joined The Hartford in 2005.
Vernon J. Meyer (1964) Vice President since 2006
Mr. Meyer serves as Senior Vice President of HLIC. He also serves as Senior Vice President of HIFSCO and HL Advisors. Mr. Meyer joined The Hartford in 2004.
Colleen B. Pernerewski (1969) Vice President and Chief Compliance Officer since 2010
Ms. Pernerewski serves as Vice President and Chief Investment Advisor Compliance Officer of HIFSCO and as Vice President and Chief Compliance Officer of HL Advisors. Ms. Pernerewski joined The Hartford in 2005 from Travelers Life and Annuity where she served as Counsel (2004-2005). Prior to Travelers Life and Annuity, Ms. Pernerewski held the position of Counsel at The Hartford (1998-2004).
Elizabeth L. Schroeder (1966) Vice President since 2010
Ms. Schroeder currently serves as Assistant Vice President of HLIC. Ms. Schroeder joined HLIC in 1991. She is also an Assistant Vice President of HASCO, HIFSCO and HL Advisors.
Martin Swanson (1962) Vice President since 2010
Mr. Swanson is a Vice President of HLIC. Mr. Swanson also serves as Vice President/Marketing for HIFSCO. Prior to joining HLIC in 1998, Mr. Swanson was a Vice President at PaineWebber, Inc.
Jane Wolak (1961) Vice President since 2009
Ms. Wolak currently serves as Senior Vice President of HLIC. Ms. Wolak joined HLIC as Vice President, Retail Product Services in May 2007. She is also Vice President of HASCO. Previously, Ms. Wolak was with Sun Life Financial where she held the position of Vice President, Service Center Operations from 2001-2007.
HOW TO OBTAIN A COPY OF THE FUND’S PROXY VOTING POLICIES AND VOTING RECORDS (UNAUDITED)
A description of the policies and procedures that the Fund uses to determine how to vote proxies relating to portfolio securities and a record of how the Fund voted any proxies for the twelve-month period ended June 30, 2011 are available (1) without charge, upon request, by calling 800-862-6668 and (2) on the SEC’s website at http://www.sec.gov.
QUARTERLY PORTFOLIO HOLDINGS INFORMATION (UNAUDITED)
The Fund files a complete schedule of portfolio holdings with the SEC for the first and third quarters of each fiscal year on Form N-Q. The Fund’s Forms are available (1) without charge, upon request, by calling 800-862-6668 and (2) on the SEC’s website at http://www.sec.gov. The Form N-Q may be reviewed and copied at the SEC’s Public Reference Room in Washington, DC. Information on the operation of the Public Reference Room may be obtained by calling 1-800-SEC-0330.
| Hartford Capital Appreciation HLS Fund |
| Expense Example (Unaudited) |
Your Fund's Expenses
As a shareholder of the Fund, you incur two types of costs: (1) transaction costs and (2) ongoing costs including investment management fees, distribution fees, and other fund expenses. This example is intended to help you understand your ongoing costs (in dollars) of investing in the Fund and to compare these costs with the ongoing costs of investing in other mutual funds. The example is based on an investment of $1,000 invested at the beginning of the period and held for the period of June 30, 2011 through December 31, 2011.
Actual Expenses
The first set of columns of the table below provides information about actual account values and actual expenses. You may use the information in this column, together with the amount you invested, to estimate the expenses that you paid over the period. Simply divide your account value by $1,000 (for example, an $8,600 account value divided by $1,000 = 8.6), then multiply the result by the number in the line under the heading entitled “Expenses Paid During Period” to estimate the expenses you paid on your account during this period.
Hypothetical Example for Comparison Purposes
The second set of columns of the table below provides information about hypothetical account values and hypothetical expenses based on the Fund’s actual expense ratio and an assumed rate of return of 5% per year before expenses, which is not the Fund’s actual return. The hypothetical account values and expenses may not be used to estimate the actual ending account balance or expenses you paid for the period. You may use this information to compare the ongoing costs of investing in the Fund and other funds. To do so, compare this 5% hypothetical example with the 5% hypothetical examples that appear in the shareholder reports of the other funds.
Please note that the expenses shown in the table are meant to highlight your ongoing costs only and do not reflect any transactional costs, such as sales charges (loads) and CDSC. Therefore, the second set of columns of the table is useful in comparing ongoing costs only, and will not help you determine the relative total costs of owning different funds. In addition, if these transactional costs were included, your costs would be higher. Expenses are equal to the Fund's annualized expense ratios multiplied by average account value over the period, multiplied by 184/365 (to reflect the one-half year period).
| | | Actual return | | | Hypothetical (5% return before expenses) | | | | | | |
| | | | | | | Expenses paid | | | | | | | Expenses paid | | | | Days in | | |
| | | | | Ending | | during the period | | | | | Ending | | during the period | | | | the | | Days |
| | | Beginning | | Account Value | | June 30, 2011 | | | Beginning | | Account Value | | June 30, 2011 | | Annualized | | current | | in the |
| | | Account Value | | December 31, | | through | | | Account Value | | December 31, | | through | | expense | | 1/2 | | full |
| | | June 30, 2011 | | 2011 | | December 31, 2011 | | | June 30, 2011 | | 2011 | | December 31, 2011 | | ratio | | year | | year |
| Class IA | | $1,000.00 | | $866.47 | | $3.15 | | | $1,000.00 | | $1,021.83 | | $3.41 | | 0.67% | | 184 | | 365 |
| Class IB | | $1,000.00 | | $865.41 | | $4.33 | | | $1,000.00 | | $1,020.57 | | $4.69 | | 0.92% | | 184 | | 365 |
| Hartford Capital Appreciation HLS Fund |
| Approval of Investment Management and Investment Sub-Advisory Agreements (Unaudited) |
Section 15(c) of the Investment Company Act of 1940, as amended (the “1940 Act”), requires that each mutual fund’s board of directors, including a majority of those directors who are not “interested persons” of the mutual fund, as defined in the 1940 Act (the “Independent Directors”), annually review and consider the continuation of the mutual fund’s investment advisory and sub-advisory agreements. At its meeting held on August 2-3, 2011, the Board of Directors (the “Board”) of Hartford Series Fund, Inc., including each of the Independent Directors, unanimously voted to approve the continuation of the investment management agreement for Hartford Capital Appreciation HLS Fund (the “Fund”) with HL Investment Advisors, LLC (“HL Advisors”) and the continuation of the investment sub-advisory agreement between HL Advisors and the Fund’s sub-adviser, Wellington Management Company, LLP (the “Sub-adviser,” and together with HL Advisors, the “Advisers”) (collectively, the “Agreements”).
In the months preceding the August 2-3, 2011 meeting, the Board requested, received, and reviewed written responses from the Advisers to questions posed to them on behalf of the Independent Directors and supporting materials relating to those questions and responses. The Board considered information furnished to the Board at its meetings throughout the year, as well as information specifically prepared in connection with the annual approval of the Agreements at the Board’s meetings held on June 21-22, 2011 and August 2-3, 2011. Information provided to the Board at its meetings throughout the year included, among other things, reports on Fund performance, legal and compliance matters, sales and marketing activity, shareholder services, and the other services provided to the Fund by the Advisers and their affiliates. In addition, the Board received in-person presentations by Fund officers and representatives of HL Advisors at the Board’s meetings on June 21-22, 2011 and August 2-3, 2011 concerning the Agreements.
The Independent Directors, advised by independent legal counsel, engaged two service providers to assist them with evaluating the Agreements with respect to the Fund. Lipper Inc. (“Lipper”), an independent provider of investment company data, was retained to provide the Board with reports on how the Fund’s contractual management fees, actual management fees, other non-management fees, overall expense ratios and investment performance compared to those of mutual funds with similar investment objectives. The Independent Directors also engaged an independent financial services consulting firm (the “Consultant”) to assist them in evaluating the Fund’s management fees, sub-advisory fees, other non-management fees, overall expense ratios and investment performance. In addition, the Consultant reviewed the profitability calculations utilized by HL Advisors in connection with the continuation of the investment management agreement.
In determining to continue the Agreements for the Fund, the members of the Board reviewed and evaluated information and factors they believed to be relevant and appropriate in light of the information that the Board deemed necessary and appropriate through the exercise of their reasonable business judgment. While individual members of the Board may have weighed certain factors differently, the Board’s determination to continue the Agreements was based on a comprehensive consideration of all information provided to the Board throughout the year and specifically with respect to the continuation of the Agreements. A more detailed discussion of the factors the Board considered with respect to its approval of the Agreements is provided below.
Nature, Extent, And Quality Of Services Provided by the Advisers
The Board requested and considered information concerning the nature, extent, and quality of the services provided to the Fund by the Advisers. The Board considered, among other things, the terms of the Agreements and the range of services provided by the Advisers. The Board considered the Advisers’ professional personnel who provide services to the Fund, including each Adviser’s ability and experience in attracting and retaining qualified personnel to service the Fund. The Board considered each Adviser’s reputation and overall financial strength, as well as its willingness to consider and implement organizational and operational changes designed to improve services to the Fund. In addition, the Board considered the quality of each Adviser’s communications with the Board and responsiveness to Board inquiries.
The Board also requested and evaluated information concerning each Adviser’s regulatory and compliance environment. In this regard, the Board requested and reviewed information on each Adviser’s compliance policies and procedures, compliance history, and a report from the Fund’s Chief Compliance Officer on each Adviser’s compliance with applicable laws and regulations, including responses to regulatory developments and compliance issues raised by regulators. The Board also noted the Advisers’ support of the Fund’s compliance control structure, particularly the resources devoted by the Advisers in support of the Fund’s obligations pursuant to Rule 38a-1 under the 1940 Act.
| Hartford Capital Appreciation HLS Fund |
| Approval of Investment Management and Investment Sub-Advisory Agreements (Unaudited) – (continued) |
With respect to HL Advisors, the Board noted that under the Agreements, HL Advisors is responsible for the management of the Fund, including overseeing fund operations and service providers, as well as investment advisory services in connection with selecting, monitoring and supervising the Sub-adviser. The Board considered HL Advisors’ ongoing monitoring of people, process and performance, including its quarterly reviews of each of the Hartford HLS Funds, semi-annual meetings with the leaders of each Fund’s portfolio management team, and oversight of the Funds’ 49 portfolio managers. The Board recognized that HL Advisors has demonstrated a record of making changes to the management and/or strategies of the Funds when warranted. The Board considered HL Advisors’ oversight of the Sub-adviser’s investment approach and results, process for monitoring best execution of portfolio trades by the Sub-adviser, and approach to risk management with respect to the Fund and the service providers to the Fund. The Board also considered HL Advisors’ oversight of compliance with the Fund’s objective and policies as well as with applicable laws and regulations, noting that regulatory and other developments had over time led to an increase in the scope of HL Advisors’ services in this regard. In addition, the Board considered HL Advisors’ ongoing commitment to review and rationalize the Hartford fund family’s product line-up and the expenses that HL Advisors had incurred in connection with fund combinations in recent years. The Board considered that HL Advisors or its affiliates are responsible for providing the Fund’s officers. The Board also noted that Hartford Life Insurance Company (“HLIC”) provides administrative services to the Fund. The Board considered its experiences with HL Advisors and HLIC with respect to each of these services.
With respect to the Sub-adviser, who provides day-to-day portfolio management services, the Board considered the quality of the Fund’s portfolio managers, the Sub-adviser’s other investment personnel, its investment philosophy and process, investment research capabilities and resources, performance record, trade execution capabilities and experience. The Board considered the experience of the Fund’s portfolio managers, the number of accounts managed by the portfolio managers, and the Sub-adviser’s method for compensating the portfolio managers.
Based on these considerations, the Board concluded that it was satisfied with the nature, extent and quality of the services provided to the Fund by HL Advisors and the Sub-adviser.
Performance of the Fund and the Advisers
The Board considered the investment performance of the Fund. In this regard, the Board reviewed the performance of the Fund over different time periods presented in the materials and evaluated HL Advisors’ analysis of the Fund’s performance for these time periods. The Board considered information and materials provided to the Board by the Advisers concerning Fund performance, as well as information from Lipper comparing the investment performance of the Fund to an appropriate benchmark and universe of peer funds. The Board noted that the performance of the Fund was within expectations.
The Board considered the detailed investment analytics reports provided by The Hartford’s Investment Advisory Group throughout the year. These reports include, among other things, information on the Fund’s gross and net returns, the Fund’s investment performance relative to an appropriate benchmark and peer group, various statistics concerning the Fund’s portfolio, and a narrative summary of various factors affecting Fund performance. The Board considered the Advisers’ cooperation with the Investment Committee, which assists the Board in evaluating the performance of the Fund at periodic meetings throughout the year. The Board also considered the analysis provided by the Consultant relating to the Fund’s performance track record.
In light of all the considerations noted above, the Board concluded that it had continued confidence in HL Advisors’ and the Sub-adviser’s overall capabilities to manage the Fund.
Costs of the Services and Profitability of the Advisers
The Board reviewed information regarding HL Advisors’ cost to provide investment management and related services to the Fund and HL Advisors’ profitability, both overall and for the Fund, on a pre-tax basis without regard to distribution expenses. The Board also requested and reviewed information about the profitability to HL Advisors and its affiliates from all services provided to the Fund and all aspects of their relationship with the Fund. The Board also requested and received information relating to the operations and profitability of the Sub-adviser.
The Board considered the Consultant’s review of the profitability calculations utilized by HL Advisors in connection with the continuation of the investment management agreement. In this regard, the Consultant reported that The Hartford’s process for calculating and reporting Fund profitability is reasonable, sound and well within common industry practice.
Based on these considerations, the Board concluded that the profits anticipated to be realized by the Advisers and their affiliates from their relationships with the Fund would not be excessive.
Comparison of Fees and Services Provided by the Advisers
The Board considered comparative information with respect to the management fees to be paid by the Fund to HL Advisors and the total expense ratios of the Fund. The Board also considered comparative information with respect to the sub-advisory fees to be paid by HL Advisors to the Sub-adviser, to the extent applicable. In this regard, the Board requested and reviewed information from HL Advisors and the Sub-adviser relating to the management and sub-advisory fees, including the sub-advisory fee schedule for the Fund, and total operating expenses for the Fund. The Board considered that the management fee for the Fund includes the fee paid to HLIC for providing certain administrative services to the Fund. The Board also reviewed information from Lipper comparing the Fund’s contractual management fees, actual management fees and overall expense ratios relative to a group of funds selected by Lipper, in consultation with the Consultant, and a broader universe of funds selected by Lipper.
While the Board recognized that comparisons between the Fund and peer funds are imprecise, given the differing service levels and characteristics of mutual funds and the different business models and cost structures of the Advisers, the comparative information provided by Lipper assisted the Board in evaluating the reasonableness of the Fund’s management and sub-advisory fees and total operating expenses. In addition, the Board considered the analysis and recommendations of the Consultant relating to the Fund’s management and sub-advisory fees and total operating expenses.
Based on these considerations, the Board concluded that the Fund’s fees and total operating expenses, in conjunction with the information about quality of services, profitability, economies of scale, and other matters discussed, were reasonable in light of the services provided.
Economies of Scale
The Board requested and considered information regarding the Advisers’ realization of economies of scale with respect to the Fund and whether the fee levels reflect these economies of scale for the benefit of the Fund’s investors. With respect to HL Advisors, the Board considered representations from HL Advisors that it is difficult to anticipate whether and to what extent economies may be realized by HL Advisors as assets grow over time. The Board reviewed the breakpoints in the management fee schedule for the Fund, which reduces fee rates as Fund assets grow over time. The Board recognized that a fund with assets beyond the last breakpoint level will continue to benefit from economies of scale because additional assets are charged the lowest breakpoint fee resulting in lower overall effective management fee rates. The Board also recognized that a fee schedule that reaches a lower breakpoint quickly provides shareholders with the benefit of anticipated or potential economies of scale.
The Board reviewed and evaluated materials from Lipper showing how management fee schedules of peer funds reflect economies of scale for the benefit of investors as a peer fund’s assets hypothetically increase over time. Based on information provided by HL Advisors, Lipper, and the Consultant, the Board recognized that there is no uniform methodology for establishing breakpoints or uniform pattern in asset levels that trigger breakpoints or the amounts of breakpoints triggered.
After considering all of the information available to it, the Board concluded that it was satisfied with the extent to which economies of scale would be shared for the benefit of the Fund’s shareholders based on currently available information and the effective advisory fees and expense ratios for the Fund at its current and reasonably anticipated asset levels. The Board noted, however, that it would continue to monitor future growth in Fund assets and the appropriateness of additional breakpoints.
| Hartford Capital Appreciation HLS Fund |
| Approval of Investment Management and Investment Sub-Advisory Agreements (Unaudited) – (continued) |
Other Benefits
The Board considered other benefits to the Advisers and their affiliates from their relationships with the Fund, including the role of the Fund in supporting the variable life insurance and variable annuity products offered by The Hartford. The Board reviewed information noting that HLIC, an affiliate of HL Advisors, receives fees for providing certain administrative services to the Fund, and that HLIC also receives fees for fund accounting and related services from the Fund, and the Board considered information on expected profits to HLIC or its affiliates for such services. The Board also considered that Hartford Administrative Services Company (“HASCO”), the Fund’s transfer agent and an affiliate of HL Advisors, receives transfer agency compensation from the Fund, and the Board reviewed information on the expected profitability of the Fund’s transfer agency function to HASCO. The Board considered information provided by HASCO indicating that the transfer agent fees charged by HASCO to the Fund were fair and reasonable based on publicly available information.
The Board also considered that Hartford Securities Distribution Company, Inc., as principal underwriter of the Fund, receives 12b-1 fees from the Fund. The Board also noted that certain affiliates of HL Advisors distribute shares of the Fund and receive compensation in that connection.
The Board considered benefits to the Sub-adviser from its use of the Fund’s brokerage commissions to obtain soft dollar research, and representations from HL Advisors and the Sub-adviser that the Sub-adviser would not make any revenue-sharing payments or any other type of distribution payments to HL Advisors or its affiliates.
The Board considered the benefits to shareholders of being part of the Hartford family of funds. The Board considered HL Advisors’ efforts to provide investors in the family with a broad range of investment styles and asset classes.
* * * *
Based upon its review of these various factors, among others, the Board concluded that it is in the best interests of the Fund and its shareholders for the Board to approve the Agreements for an additional year. In reaching this decision, the Board did not assign relative weights to the factors discussed above or deem any one or group of them to be controlling in and of themselves. In connection with their deliberations, the Independent Directors met separately in executive session on several occasions, with independent legal counsel, to review the relevant materials and consider their responsibilities under relevant laws and regulations.
The Hartford
P.O. Box 5085
Hartford, CT 06102-5085
Hartford Series Fund, Inc. is underwritten and distributed by Hartford Securities Distribution Company, Inc.
"The Hartford" is The Hartford Financial Services Group, Inc. and its subsidiaries.
Hartford Series Fund, Inc. inception dates range from 1977 to date. Hartford Series Fund, Inc. is not a subsidiary of The Hartford but is underwritten, distributed by and advised by subsidiaries of The Hartford. Investments in Hartford Series Fund, Inc. are not guaranteed by The Hartford or any other entity.
You should carefully consider investment objectives, risks, and charges and expenses of Hartford HLS Funds before investing. This and other information can be found in the Fund’s prospectus or summary prospectus, which can be obtained by calling 800-862-6668. Please read them carefully before you invest or send money.
HLSAR-AD11 2-12 109078 Printed in U.S.A ©2011 The Hartford, Hartford, CT 06115 | |
A MESSAGE FROM THE PRESIDENT
Dear Fellow Shareholders:
I want to take this opportunity to say thank you for investing in Hartford HLS Funds.
This has been a tumultuous year. In the beginning of 2011, we witnessed tension-fueled political uprisings in the already-volatile Middle East and North Africa region. We also watched as Japan dealt with a series of crises including a massive earthquake and subsequent tsunami. Yet, U.S. economic conditions continued to improve, with gains in consumer confidence and retail sales. During the first half of 2011, domestic, international, and world indices (as measured by the S&P 500, MSCI EAFE and MSCI World) were all up more than 5% through June, 30 2011.
The economic recovery, however, lost momentum in the second half of 2011. The employment and housing markets both remain extremely challenged. Investors continue to be concerned about the implications of the European sovereign debt crisis, as well as our own high levels of domestic debt. Fears that the European sovereign debt crisis could continue to drag down the global economy have weighed heavily on stocks.
Ongoing apprehension regarding the U.S. debt ceiling during the summer and the resulting downgrade of the U.S. sovereign credit rating by Standard & Poor’s also contributed to weaker investor confidence.
There are, however, some reasons to remain confident. Corporations have record levels of cash on their balance sheets—corporate cash has doubled in the past 10 years. In addition, U.S. gross domestic product expanded at a 2.5 percent annual rate in the third quarter according to the Commerce Department, as consumers and businesses set aside fears about the recovery and stepped up spending. Corporate earnings have also remained positive, with a majority of companies beating expectations each quarter this year. This momentum will hopefully continue into next year.
As we head into 2012, in light of the continued market volatility, now would be a good time to schedule a meeting with your financial advisor to examine your current investment strategy and determine whether you are on the right track.
| • | Does your fixed-income portfolio complement your equity portfolio? |
| • | Are you receiving diversified sources of income? |
| • | Is your portfolio still in line with your risk tolerance and investment time horizon? |
Talk to your advisor to see what changes you should make to address these concerns and opportunities.
Thank you again for investing with Hartford HLS Funds.
James Davey
President
Hartford HLS Funds
Hartford Disciplined Equity HLS Fund
Table of Contents
This report is prepared for the general information of contract owners and qualified retirement plan participants. It is not an offer of contracts or of qualified retirement plans. It should not be used in connection with any offer, except in conjunction with the appropriate product prospectus which contains all pertinent information including the applicable sales, administrative and other charges.
The views expressed in the Fund’s Manager Discussion under “Why did the Fund perform this way?” and “What is the outlook?” are views of the Fund’s sub-adviser and portfolio management team through the end of the period and are subject to change based on market and other conditions.
Hartford Disciplined Equity HLS Fund inception 05/29/1998
(sub-advised by Wellington Management Company, LLP) Investment objective – Seeks growth of capital.
Performance Overview 12/31/01 - 12/31/11

The chart above shows the growth of a $10,000 investment in Class IA. Growth results in classes other than Class IA will vary from what is seen above due to differences in the expenses charged to those share classes.
Average Annual Total Returns (as of 12/31/11)
| | 1 Year | 5 Year | 10 Year |
| Disciplined Equity IA | 1.15% | -0.30% | 2.19% |
| Disciplined Equity IB | 0.90% | -0.55% | 1.94% |
| S&P 500 Index | 2.09% | -0.25% | 2.92% |
PAST PERFORMANCE IS NOT INDICATIVE OF FUTURE RESULTS.
Total returns presented above were calculated using the Fund's net asset value available to shareholders for sale or redemption of Fund shares on December 31, 2011, which may exclude investment transactions as of this date.
S&P 500 Index is a market capitalization-weighted price index composed of 500 widely held common stocks.
You cannot invest directly in an index.
The chart represents a hypothetical investment in the Fund. Performance data represents past performance and current performance could be higher or lower.
Performance information may reflect historical or current expense waivers/reimbursements from the investment adviser, without which performance would have been lower. For information on current expense waivers/reimbursements, please see the prospectus.
The value of the Fund will fluctuate so that when redeemed, it may be worth more or less than the original investment. The chart and table do not reflect the deductions of taxes, sales charges or other fees which may be applied at the variable life insurance, variable annuity or qualified retirement plan product level. Any such additional sales charges or other fees or expenses would lower the contract’s or plan’s performance.
| Hartford Disciplined Equity HLS Fund |
| Manager Discussion (Unaudited) |
| December 31, 2011 |
| | | |
| Portfolio Manager | | |
| Mammen Chally, CFA | | |
| Vice President | | |
| | | |
How did the Fund perform?
The Class IA shares of the Hartford Disciplined Equity HLS Fund returned 1.15% for the twelve-month period ended December 31, 2011, underperforming its benchmark, the S&P 500 Index, which returned 2.09% for the same period. The Fund outperformed the -1.01% return of the average fund in the Lipper Large-Cap Core VP-UF Funds peer group, a group of funds with investment strategies similar to those of the Fund.
Why did the Fund perform this way?
The one-year period ending December 31, 2011 was yet another extremely volatile period for equity markets. Global equities started the year on a strong note and continued to march higher in the first quarter of 2011, driven by investors’ enthusiasm for additional government debt purchases by the U.S. Federal Reserve, the extension of tax cuts in the U.S., strong earnings growth, and generally improving economic data. This enthusiasm reversed later in the period, however, as concerns surfaced that the global economy could slip back into recession, resulting in a rapid decline in equity markets. Fears about sovereign debt and solvency in the eurozone, slowing economic expansion in China and the U.S., and uncertainty about the sustainability of corporate earnings growth combined to produce an extremely volatile stock market, and return correlations among stocks spiked as investors shed risk and fled to safety. Markets ended the year on a positive note in the final month of the period with encouraging employment and manufacturing data in the U.S.
Overall equity market performance was mixed for the period across all market capitalizations: large cap equities (+2%) outperformed mid cap (-2%) and small cap stocks (-4%), as represented by the S&P 500, S&P MidCap 400, and Russell 2000 Indices, respectively. During the twelve-month period seven of ten sectors within the S&P 500 Index posted positive returns, led by Utilities (+20%), Consumer Staples (+14%), and Health Care (+13), while Financials (-17%) and Materials (-10%) lagged on a relative basis.
The Fund underperformed the benchmark due to weak stock selection, particularly within the Utilities, Financials, and Materials sectors. This more than offset positive returns within Industrials, Consumer Staples, and Health Care. Sector positioning, a fallout of our bottom-up stock selection process (i.e. stock by stock fundamental research) was modestly additive to relative results. In particular, an overweight (i.e. the Fund’s sector position was greater than the benchmark position) to Health Care and an underweight to Financials benefitted the Fund.
The largest detractors from performance relative to the benchmark were Bank of America (Financials), Goldman Sachs (Financials), and Ultra Petroleum (Energy). U.S.-based multinational financial services company Bank of America’s shares declined amid negative headlines regarding litigation uncertainty related to its ownership of Countrywide Financial and fears that the company may need to raise additional equity. Shares of Goldman Sachs, a global leader in investment banking and brokerage services, declined over the course of the year, tracing lower earnings per share (EPS) results, as a number of factors including SEC litigation, regulation, lower trading revenues, a ratings downgrade and intense competitive pressures weighed on the already attractively valued stock. Shares of Ultra Petroleum, an independent energy company engaged in the exploration and production of oil and natural gas, underperformed after the company raised capital expenditures spending guidance with no offsetting increase in 2011 production guidance. Other detractors from absolute (i.e. total return) performance included Freeport-McMoRan Copper & Gold (Materials).
The largest contributors to relative performance were Philip Morris International (Consumer Staples), Citigroup (Financials), and TJX Companies (Consumer Discretionary). Tobacco company Philip Morris International’s stock outperformed after the company reported better-than-expected quarterly earnings with strong results across all divisions. Not owning Citigroup for a majority of the period was beneficial as the stock price declined due to poor earnings results. Near the end of the period, we initiated a position in the stock based on its attractive valuations and the strength of the balance sheet. Shares of off-price apparel and home fashions retailer TJX Companies outperformed many expectations due to the current trade-down economy and availability of name-brand apparel at half the price of regular retailers. Our position in Apple (Information Technology) also contributed to absolute performance during the period.
| Hartford Disciplined Equity HLS Fund |
| Manager Discussion (Unaudited) – (continued) |
| December 31, 2011 |
| |
What is the outlook?
Economic data in the United States improved in the fourth quarter. The U.S. unemployment rate fell to 8.6% in November, its lowest level since March 2009. Retail sales, housing, and consumer confidence data also have trended positive in recent months. While we believe economic growth is likely to remain tepid in 2012, this is discounted in valuations, in our view. The biggest risk to U.S. markets remains a cataclysmic liquidity event in Europe that severely impacts global economic growth and confidence. We view this as a low probability event. However, U.S. markets were focused on Europe during the fourth quarter – we expect this will remain a point of emphasis into 2012.
The Fund focuses on stock selection as the key driver of returns and uses proprietary fundamental and quantitative research in a disciplined framework to build a portfolio of the most attractive stocks. Sector exposures are residuals from this bottom-up stock selection process and are not explicit management decisions. Based on individual stock decisions, the Fund ended the period most overweight the Health Care, Consumer Staples, and Information Technology sectors and most underweight Telecommunication Services, Materials, and Financials relative to the S&P 500 Index, the Fund’s benchmark.
Diversification by Industry
as of December 31, 2011
| | | Percentage of | |
| Industry (Sector) | | Net Assets | |
| Automobiles & Components (Consumer Discretionary) | | | 0.9 | % |
| Banks (Financials) | | | 4.4 | |
| Capital Goods (Industrials) | | | 10.2 | |
| Commercial & Professional Services (Industrials) | | | 0.8 | |
| Consumer Durables & Apparel (Consumer Discretionary) | | | 1.8 | |
| Consumer Services (Consumer Discretionary) | | | 1.6 | |
| Diversified Financials (Financials) | | | 5.7 | |
| Energy (Energy) | | | 11.2 | |
| Food & Staples Retailing (Consumer Staples) | | | 2.4 | |
| Food, Beverage & Tobacco (Consumer Staples) | | | 8.5 | |
| Health Care Equipment & Services (Health Care) | | | 3.8 | |
| Household & Personal Products (Consumer Staples) | | | 2.1 | |
| Insurance (Financials) | | | 2.0 | |
| Materials (Materials) | | | 1.8 | |
| Pharmaceuticals, Biotechnology & Life Sciences (Health Care) | | | 10.7 | |
| Retailing (Consumer Discretionary) | | | 5.5 | |
| Semiconductors & Semiconductor Equipment (Information Technology) | | | 1.0 | |
| Software & Services (Information Technology) | | | 12.4 | |
| Technology Hardware & Equipment (Information Technology) | | | 6.9 | |
| Telecommunication Services (Services) | | | 0.6 | |
| Utilities (Utilities) | | | 3.7 | |
| Other Assets and Liabilities | | | 2.0 | |
| Total | | | 100.0 | % |
| Hartford Disciplined Equity HLS Fund |
| Schedule of Investments |
| December 31, 2011 |
| (000’s Omitted) |
| Shares or Principal Amount | | Market Value ╪ | |
| COMMON STOCKS - 98.0% | | | | |
| | | | | Automobiles & Components - 0.9% | | | | |
| | 807 | | | Ford Motor Co. w/ Rights ● | | $ | 8,686 | |
| | | | | | | | | |
| | | | | Banks - 4.4% | | | | |
| | 340 | | | BB&T Corp. Θ | | | 8,547 | |
| | 256 | | | PNC Financial Services Group, Inc. | | | 14,742 | |
| | 733 | | | Wells Fargo & Co. | | | 20,210 | |
| | | | | | | | 43,499 | |
| | | | | Capital Goods - 10.2% | | | | |
| | 178 | | | AMETEK, Inc. | | | 7,493 | |
| | 77 | | | Boeing Co. | | | 5,652 | |
| | 63 | | | Caterpillar, Inc. | | | 5,684 | |
| | 110 | | | Cooper Industries plc Class A | | | 5,931 | |
| | 138 | | | Dover Corp. | | | 8,006 | |
| | 627 | | | General Electric Co. | | | 11,226 | |
| | 146 | | | Illinois Tool Works, Inc. | | | 6,810 | |
| | 194 | | | Northrop Grumman Corp. | | | 11,370 | |
| | 63 | | | Parker-Hannifin Corp. | | | 4,824 | |
| | 99 | | | TransDigm Group, Inc. ● | | | 9,461 | |
| | 201 | | | United Technologies Corp. | | | 14,680 | |
| | 48 | | | W.W. Grainger, Inc. | | | 8,985 | |
| | | | | | | | 100,122 | |
| | | | | Commercial & Professional Services - 0.8% | | | | |
| | 138 | | | Towers Watson & Co. | | | 8,294 | |
| | | | | | | | | |
| | | | | Consumer Durables & Apparel - 1.8% | | | | |
| | 98 | | | Deckers Outdoor Corp. ● | | | 7,414 | |
| | 142 | | | PVH Corp. | | | 10,004 | |
| | | | | | | | 17,418 | |
| | | | | Consumer Services - 1.6% | | | | |
| | 152 | | | McDonald's Corp. | | | 15,204 | |
| | | | | | | | | |
| | | | | Diversified Financials - 5.7% | | | | |
| | 152 | | | Ameriprise Financial, Inc. | | | 7,546 | |
| | 1,423 | | | Bank of America Corp. | | | 7,911 | |
| | 33 | | | BlackRock, Inc. Θ | | | 5,846 | |
| | 331 | | | Citigroup, Inc. | | | 8,712 | |
| | 98 | | | Goldman Sachs Group, Inc. | | | 8,860 | |
| | 352 | | | JP Morgan Chase & Co. | | | 11,690 | |
| | 434 | | | SLM Corp. | | | 5,814 | |
| | | | | | | | 56,379 | |
| | | | | Energy - 11.2% | | | | |
| | 150 | | | Anadarko Petroleum Corp. | | | 11,435 | |
| | 289 | | | Chesapeake Energy Corp. | | | 6,437 | |
| | 109 | | | Chevron Corp. | | | 11,552 | |
| | 210 | | | ConocoPhillips Holding Co. | | | 15,319 | |
| | 293 | | | Exxon Mobil Corp. | | | 24,871 | |
| | 211 | | | Marathon Oil Corp. | | | 6,168 | |
| | 138 | | | National Oilwell Varco, Inc. | | | 9,409 | |
| | 195 | | | Occidental Petroleum Corp. | | | 18,256 | |
| | 225 | | | Ultra Petroleum Corp. ● | | | 6,670 | |
| | | | | | | | 110,117 | |
| | | | | Food & Staples Retailing - 2.4% | | | | |
| | 327 | | | CVS Caremark Corp. | | | 13,314 | |
| | 324 | | | Walgreen Co. | | | 10,699 | |
| | | | | | | | 24,013 | |
| | | | | Food, Beverage & Tobacco - 8.5% | | | | |
| | 374 | | | Altria Group, Inc. | | | 11,086 | |
| | 285 | | | Constellation Brands, Inc. Class A ● | | | 5,885 | |
| | 141 | | | Dr. Pepper Snapple Group | | | 5,580 | |
| | 65 | | | Hansen Natural Corp. ● | | | 5,960 | |
| | 96 | | | Lorillard, Inc. | | | 10,913 | |
| | 203 | | | PepsiCo, Inc. | | | 13,466 | |
| | 383 | | | Philip Morris International, Inc. | | | 30,073 | |
| | | | | | | | 82,963 | |
| | | | | Health Care Equipment & Services - 3.8% | | | | |
| | 177 | | | Covidien plc | | | 7,948 | |
| | 117 | | | McKesson Corp. | | | 9,139 | |
| | 132 | | | St. Jude Medical, Inc. | | | 4,512 | |
| | 304 | | | UnitedHealth Group, Inc. | | | 15,408 | |
| | | | | | | | 37,007 | |
| | | | | Household & Personal Products - 2.1% | | | | |
| | 146 | | | Energizer Holdings, Inc. ● | | | 11,289 | |
| | 130 | | | Kimberly-Clark Corp. | | | 9,566 | |
| | | | | | | | 20,855 | |
| | | | | Insurance - 2.0% | | | | |
| | 194 | | | Allied World Assurance Holdings Ltd. | | | 12,232 | |
| | 231 | | | MetLife, Inc. | | | 7,190 | |
| | | | | | | | 19,422 | |
| | | | | Materials - 1.8% | | | | |
| | 343 | | | Dow Chemical Co. | | | 9,868 | |
| | 123 | | | Newmont Mining Corp. | | | 7,362 | |
| | | | | | | | 17,230 | |
| | | | | Pharmaceuticals, Biotechnology & Life Sciences - 10.7% | | | | |
| | 156 | | | Agilent Technologies, Inc. ● | | | 5,451 | |
| | 158 | | | Amgen, Inc. | | | 10,133 | |
| | 51 | | | Biogen Idec, Inc. ● | | | 5,580 | |
| | 160 | | | Celgene Corp. ● | | | 10,840 | |
| | 306 | | | Eli Lilly & Co. | | | 12,733 | |
| | 257 | | | Forest Laboratories, Inc. ● | | | 7,791 | |
| | 233 | | | Gilead Sciences, Inc. ● | | | 9,543 | |
| | 450 | | | Merck & Co., Inc. | | | 16,967 | |
| | 101 | | | Regeneron Pharmaceuticals, Inc. ● | | | 5,594 | |
| | 153 | | | Salix Pharmaceuticals Ltd. ● | | | 7,339 | |
| | 115 | | | Thermo Fisher Scientific, Inc. ● | | | 5,154 | |
| | 137 | | | Watson Pharmaceuticals, Inc. ● | | | 8,288 | |
| | | | | | | | 105,413 | |
| | | | | Retailing - 5.5% | | | | |
| | 128 | | | Abercrombie & Fitch Co. Class A Θ | | | 6,265 | |
| | 63 | | | Amazon.com, Inc. ● | | | 10,952 | |
| | 391 | | | Lowe's Co., Inc. | | | 9,935 | |
| | 235 | | | Ross Stores, Inc. | | | 11,167 | |
| | 243 | | | TJX Cos., Inc. | | | 15,699 | |
| | | | | | | | 54,018 | |
| | | | | Semiconductors & Semiconductor Equipment - 1.0% | | | | |
| | 237 | | | Avago Technologies Ltd. | | | 6,830 | |
| | 186 | | | Skyworks Solutions, Inc. ● | | | 3,023 | |
| | | | | | | | 9,853 | |
| | | | | Software & Services - 12.4% | | | | |
| | 232 | | | Accenture plc | | | 12,367 | |
| | 644 | | | Activision Blizzard, Inc. | | | 7,933 | |
| | 354 | | | eBay, Inc. ●Θ | | | 10,731 | |
| | 94 | | | Factset Research Systems, Inc. | | | 8,218 | |
| | 23 | | | Google, Inc. ● | | | 14,920 | |
| | 111 | | | IBM Corp. | | | 20,483 | |
| | 18 | | | Mastercard, Inc. | | | 6,681 | |
| | 574 | | | Oracle Corp. | | | 14,734 | |
| | 119 | | | Teradata Corp. ● | | | 5,789 | |
| | | | | | | | | | | |
The accompanying notes are an integral part of these financial statements.
| Hartford Disciplined Equity HLS Fund |
| Schedule of Investments – (continued) |
| December 31, 2011 |
| (000’s Omitted) |
| Shares or Principal Amount | | Market Value ╪ | |
| COMMON STOCKS - 98.0% - (continued) | | | | |
| | | | | Software & Services - 12.4% - (continued) | | | | |
| | 270 | | | VeriSign, Inc. Θ | | $ | 9,657 | |
| | 533 | | | Western Union Co. | | | 9,726 | |
| | | | | | | | 121,239 | |
| | | | | Technology Hardware & Equipment - 6.9% | | | | |
| | 78 | | | Apple, Inc. ● | | | 31,693 | |
| | 906 | | | Cisco Systems, Inc. | | | 16,376 | |
| | 495 | | | EMC Corp. ● | | | 10,664 | |
| | 160 | | | Qualcomm, Inc. | | | 8,747 | |
| | | | | | | | 67,480 | |
| | | | | Telecommunication Services - 0.6% | | | | |
| | 209 | | | AT&T, Inc. | | | 6,328 | |
| | | | | | | | | |
| | | | | Utilities - 3.7% | | | | |
| | 238 | | | American Electric Power Co., Inc. | | | 9,820 | |
| | 120 | | | NextEra Energy, Inc. | | | 7,275 | |
| | 112 | | | PG&E Corp. | | | 4,604 | |
| | 533 | | | Xcel Energy, Inc. | | | 14,730 | |
| | | | | | | | 36,429 | |
| | | | | Total common stocks | | | | |
| | | | | (cost $827,801) | | $ | 961,969 | |
| | | | | | | | | |
| | | | | Total long-term investments | | | | |
| | | | | (cost $827,801) | | $ | 961,969 | |
| | | | | | | | | |
| | | | | Total investments | | | | |
| | | | | (cost $827,801) ▲ | 98.0 | % | | $ | 961,969 | |
| | | | | Other assets and liabilities | 2.0 | % | | | 19,759 | |
| | | | | Total net assets | 100.0 | % | | $ | 981,728 | |
The accompanying notes are an integral part of these financial statements.
| Note: | Percentage of investments as shown is the ratio of the total market value to total net assets. |
| ▲ | At December 31, 2011, the cost of securities for federal income tax purposes was $828,423 and the aggregate gross unrealized appreciation and depreciation based on that cost were: |
| | Unrealized Appreciation | | $ | 173,166 | |
| | Unrealized Depreciation | | | (39,620 | ) |
| | Net Unrealized Appreciation | | $ | 133,546 | |
| Θ | At December 31, 2011, this security, or a portion of this security, is designated to cover written call options in the table below: |
| | Description | | Option Type | | | Exercise
Price/ Rate | | | Expiration
Date | | | Number of
Contracts* | | | Market
Value ╪ | | | Premiums
Received | | | Unrealized
Appreciation
(Depreciation) | |
| | Abercrombie & Fitch Co. | | | Equity | | | $ | 52.50 | | | | 12/23/2012 | | | | 205 | | | $ | 11 | | | $ | 11 | | | $ | — | |
| | BB&T Corp. | | | Equity | | | $ | 26.00 | | | | 01/23/2012 | | | | 401 | | | | 16 | | | | 10 | | | | (6 | ) |
| | Blackrock, Inc. | | | Equity | | | $ | 180.00 | | | | 01/23/2012 | | | | 61 | | | | 26 | | | | 32 | | | | 6 | |
| | eBay, Inc. | | | Equity | | | $ | 32.00 | | | | 01/23/2012 | | | | 322 | | | | 13 | | | | 15 | | | | 2 | |
| | VeriSign, Inc. | | | Equity | | | $ | 36.00 | | | | 01/23/2012 | | | | 279 | | | | 23 | | | | 12 | | | | (11 | ) |
| | | | | | | | | | | | | | | | | | | | $ | 89 | | | $ | 80 | | | $ | (9 | ) |
* The number of contracts does not omit 000's.
Written Put Option Contracts Outstanding at December 31, 2011
| Description | | Option
Type | | | Exercise
Price/ Rate | | | Expiration
Date | | | Number of
Contracts* | | | Market
Value ╪ | | | Premiums
Received | | | Unrealized
Appreciation
(Depreciation) | |
| J.P. Morgan Chase & Co. | | | Equity | | | $ | 26.00 | | | | 01/23/2012 | | | | 298 | | | $ | 2 | | | $ | 8 | | | $ | 6 | |
| National Oilwell Varco, Inc. | | | Equity | | | $ | 55.00 | | | | 01/23/2012 | | | | 148 | | | | 1 | | | | 15 | | | | 14 | |
| Oracle Corp. | | | Equity | | | $ | 26.00 | | | | 01/23/2012 | | | | 328 | | | | 29 | | | | 13 | | | | (16 | ) |
| | | | | | | | | | | | | | | | | | | $ | 32 | | | $ | 36 | | | $ | 4 | |
* The number of contracts does not omit 000's.
Cash of $1,318 was pledged as collateral for open written put option contracts at December 31, 2011.
Futures Contracts Outstanding at December 31, 2011
| Description | | Number of
Contracts* | | | Position | | | Expiration
Date | | | Market Value ╪ | | | Notional
Amount | | | Unrealized
Appreciation/
(Depreciation) | |
| S&P 500 E-Mini | | | 155 | | | | Long | | | | 03/16/2012 | | | $ | 9,708 | | | $ | 9,746 | | | $ | (38 | ) |
* The number of contracts does not omit 000's.
Cash of $620 was pledged as initial margin deposit and collateral for open futures contracts at December 31, 2011.
| ╪ | See Significant Accounting Policies of accompanying Notes to Financial Statements regarding valuation of securities. |
The accompanying notes are an integral part of these financial statements.
| Hartford Disciplined Equity HLS Fund |
| Investment Valuation Hierarchy Level Summary |
| December 31, 2011 |
| (000’s Omitted) |
| | | Total | | | Level 1 ♦ | | | Level 2 ♦ | | | Level 3 | |
| Assets: | | | | | | | | | | | | | | | | |
| Common Stocks ‡ | | $ | 961,969 | | | $ | 961,969 | | | $ | — | | | $ | — | |
| Total | | $ | 961,969 | | | $ | 961,969 | | | $ | — | | | $ | — | |
| Written Options * | | | 28 | | | | 28 | | | | — | | | | — | |
| Total | | $ | 28 | | | $ | 28 | | | $ | — | | | $ | — | |
| Liabilities: | | | | | | | | | | | | | | | | |
| Futures * | | | 38 | | | | 38 | | | | — | | | | — | |
| Written Options * | | | 33 | | | | 33 | | | | — | | | | — | |
| Total | | $ | 71 | | | $ | 71 | | | $ | — | | | $ | — | |
| ♦ | For the year ended December 31, 2011, there were no significant transfers between Level 1 and Level 2. |
| ‡ | The Fund has all or primarily all of the equity securities categorized in a particular level. Refer to the Schedule of Investments for further industry breakout. |
| * | Derivative instruments not reflected in the Schedule of Investments are valued at the unrealized appreciation/depreciation on the investments. |
The accompanying notes are an integral part of these financial statements.
| Hartford Disciplined Equity HLS Fund |
| Statement of Assets and Liabilities |
| December 31, 2011 |
| (000’s Omitted) |
| Assets: | | | | |
| Investments in securities, at market value (cost $827,801) | | $ | 961,969 | |
| Cash | | | 1,938 | *,† |
| Receivables: | | | | |
| Investment securities sold | | | 18,071 | |
| Fund shares sold | | | 148 | |
| Dividends and interest | | | 1,578 | |
| Other assets | | | — | |
| Total assets | | | 983,704 | |
| Liabilities: | | | | |
| Bank overdraft | | | 995 | |
| Payables: | | | | |
| Fund shares redeemed | | | 594 | |
| Variation margin | | | 37 | |
| Investment management fees | | | 155 | |
| Distribution fees | | | 7 | |
| Accrued expenses | | | 67 | |
| Written options (proceeds $116) | | | 121 | |
| Total liabilities | | | 1,976 | |
| Net assets | | $ | 981,728 | |
| Summary of Net Assets: | | | | |
| Capital stock and paid-in-capital | | $ | 1,084,884 | |
| Undistributed net investment income | | | 683 | |
| Accumulated net realized loss | | | (237,964 | ) |
| Unrealized appreciation of investments | | | 134,125 | |
| Net assets | | $ | 981,728 | |
| Shares authorized | | | 3,500,000 | |
| Par value | | $ | 0.001 | |
| Class IA: Net asset value per share | | $ | 11.78 | |
| Shares outstanding | | | 72,328 | |
| Net assets | | $ | 852,312 | |
| Class IB: Net asset value per share | | $ | 11.73 | |
| Shares outstanding | | | 11,036 | |
| Net assets | | $ | 129,416 | |
* Cash of $1,318 was designated to cover open put options written at December 31, 2011.
† Cash of $620 was pledged as initial margin deposit and collateral for open futures contracts at December 31, 2011.
The accompanying notes are an integral part of these financial statements.
| Hartford Disciplined Equity HLS Fund |
| Statement of Operations |
| For the Year Ended December 31, 2011 |
| (000’s Omitted) |
| Investment Income: | | | | |
| Dividends | | $ | 19,447 | |
| Interest | | | 8 | |
| Less: Foreign tax withheld | | | (11 | ) |
| Total investment income, net | | | 19,444 | |
| | | | | |
| Expenses: | | | | |
| Investment management fees | | | 7,627 | |
| Distribution fees - Class IB | | | 362 | |
| Custodian fees | | | 5 | |
| Accounting services fees | | | 130 | |
| Board of Directors' fees | | | 26 | |
| Audit fees | | | 16 | |
| Other expenses | | | 195 | |
| Total expenses (before fees paid indirectly) | | | 8,361 | |
| Commission recapture | | | (13 | ) |
| Custodian fee offset | | | — | |
| Total fees paid indirectly | | | (13 | ) |
| Total expenses, net | | | 8,348 | |
| Net investment income | | | 11,096 | |
| | | | | |
| Net Realized Gain on Investments and Other Financial Instruments: | | | | |
| Net realized gain on investments | | | 73,379 | |
| Net realized gain on futures | | | 1,890 | |
| Net realized gain on written options | | | 1,277 | |
| Net Realized Gain on Investments and Other Financial Instruments | | | 76,546 | |
| | | | | |
| Net Changes in Unrealized Depreciation of Investments and Other Financial Instruments: | | | | |
| Net unrealized depreciation of investments | | | (69,544 | ) |
| Net unrealized depreciation of futures | | | (1 | ) |
| Net unrealized depreciation of written options | | | (43 | ) |
| Net Changes in Unrealized Depreciation of Investments and Other Financial Instruments | | | (69,588 | ) |
| Net Gain on Investments and Other Financial Instruments | | | 6,958 | |
| Net Increase in Net Assets Resulting from Operations | | $ | 18,054 | |
The accompanying notes are an integral part of these financial statements.
| Hartford Disciplined Equity HLS Fund |
| Statement of Changes in Net Assets |
| |
| (000’s Omitted) |
| | | For the
Year Ended
December 31,
2011 | | | For the
Year Ended
December 31,
2010 | |
| Operations: | | | | | | | | |
| Net investment income | | $ | 11,096 | | | $ | 14,763 | |
| Net realized gain on investments and other financial instruments | | | 76,546 | | | | 19,613 | |
| Net unrealized appreciation (depreciation) of investments and other financial instruments | | | (69,588 | ) | | | 116,681 | |
| Net Increase In Net Assets Resulting From Operations | | | 18,054 | | | | 151,057 | |
| Distributions to Shareholders: | | | | | | | | |
| From net investment income | | | | | | | | |
| Class IA | | | (10,406 | ) | | | (12,627 | ) |
| Class IB | | | (1,233 | ) | | | (1,603 | ) |
| Total distributions | | | (11,639 | ) | | | (14,230 | ) |
| Capital Share Transactions: | | | | | | | | |
| Class IA | | | | | | | | |
| Sold | | | 40,647 | | | | 62,386 | |
| Issued on reinvestment of distributions | | | 10,406 | | | | 12,627 | |
| Redeemed | | | (226,529 | ) | | | (179,815 | ) |
| Total capital share transactions | | | (175,476 | ) | | | (104,802 | ) |
| Class IB | | | | | | | | |
| Sold | | | 12,903 | | | | 13,283 | |
| Issued on reinvestment of distributions | | | 1,233 | | | | 1,603 | |
| Redeemed | | | (45,566 | ) | | | (46,630 | ) |
| Total capital share transactions | | | (31,430 | ) | | | (31,744 | ) |
| Net decrease from capital share transactions | | | (206,906 | ) | | | (136,546 | ) |
| Net Increase (Decrease) In Net Assets | | | (200,491 | ) | | | 281 | |
| Net Assets: | | | | | | | | |
| Beginning of period | | | 1,182,219 | | | | 1,181,938 | |
| End of period | | $ | 981,728 | | | $ | 1,182,219 | |
| Undistributed (distribution in excess of) net investment income | | $ | 683 | | | $ | 2,103 | |
| Shares: | | | | | | | | |
| Class IA | | | | | | | | |
| Sold | | | 3,390 | | | | 6,035 | |
| Issued on reinvestment of distributions | | | 891 | | | | 1,107 | |
| Redeemed | | | (18,634 | ) | | | (16,783 | ) |
| Total share activity | | | (14,353 | ) | | | (9,641 | ) |
| Class IB | | | | | | | | |
| Sold | | | 1,078 | | | | 1,267 | |
| Issued on reinvestment of distributions | | | 106 | | | | 142 | |
| Redeemed | | | (3,775 | ) | | | (4,389 | ) |
| Total share activity | | | (2,591 | ) | | | (2,980 | ) |
The accompanying notes are an integral part of these financial statements.
| Hartford Disciplined Equity HLS Fund |
| Notes to Financial Statements |
| December 31, 2011 |
| (000’s Omitted) |
Hartford Disciplined Equity HLS Fund (the “Fund”) serves as an underlying investment option for certain variable annuity and variable life insurance separate accounts of Hartford Life Insurance Company (“HLIC”) and its affiliates and certain qualified retirement plans. The Fund may also serve as an underlying investment option for certain variable annuity and variable life separate accounts of other insurance companies. Owners of variable annuity contracts and policyholders of variable life insurance contracts may choose the funds permitted in the variable insurance contract prospectus. In addition, participants in certain qualified retirement plans may choose the Fund if permitted by their plans.
Hartford Series Fund, Inc. (the “Company”) is an open-end registered management investment company comprised of thirty portfolios. Financial Statements for the Fund, a series of the Company, are included in this report.
The Company is organized under the laws of the State of Maryland and is registered with the Securities and Exchange Commission (“SEC”) under the Investment Company Act of 1940, as amended (“1940 Act”). The Fund is a diversified open-end management investment company.
The Fund is divided into Class IA and Class IB shares. Each class is offered at the per share net asset value (“NAV”) without a sales charge and is subject to the same expenses, except that the Class IB shares are subject to distribution and service fees charged pursuant to a Distribution Plan adopted in accordance with Rule 12b-1 under the 1940 Act.
| 2. | Significant Accounting Policies: |
The following is a summary of significant accounting policies of the Fund in the preparation of its financial statements, which are in accordance with the United States Generally Accepted Accounting Principles (“U.S. GAAP”). The preparation of financial statements in accordance with U.S. GAAP may require management to make estimates and assumptions that affect the reported amounts of assets and liabilities and disclosure of contingent assets and liabilities at the date of the financial statements and the reported amounts of increases and decreases in net assets from operations during the reporting period. Actual results could differ from those estimates.
| a) | Determination of Net Asset Value – The NAV of each class of the Fund’s shares is determined as of the close of regular trading (normally 4:00 p.m. Eastern Time) (the “NYSE Close”) on each day that the New York Stock Exchange (the “Exchange”) is open (“Valuation Date”). Information that becomes known to the Fund after the NAV has been calculated on a particular day will not generally be used to retroactively adjust the NAV determined earlier that day. |
| b) | Investment Valuation and Fair Value Measurements – For purposes of calculating the NAV, portfolio securities and other assets held by the Fund's portfolio for which market quotes are readily available are valued at market value. Market value is generally determined on the basis of last reported sales prices or official close price. If no sales are reported, market value is based on quotes obtained from a quotation reporting system, established market makers, or independent pricing services. If market prices are not readily available or are deemed unreliable, the Fund will use the fair value of the security as determined in good faith under policies and procedures established by and under the supervision of the Company’s Board of Directors. Market quotes are considered not readily available where there is an absence of current or reliable market-based data (e.g., trade information or broker quotes), including where events occur after the close of the relevant market, but prior to the NYSE Close that materially affect the values of the Fund’s portfolio securities or assets. In addition, market quotes are considered not readily available when, due to extraordinary circumstances, the exchanges or markets on which the securities trade do not open for trading for the entire day and no other market prices are available. In addition, prices of foreign equities that are principally traded on certain foreign markets are adjusted daily pursuant to a fair value pricing service approved by the Board of Directors in order to reflect an adjustment for the factors occurring after the close of certain foreign markets but before the NYSE Close. Securities that are primarily traded on foreign markets may trade on days that are not business days of the Fund. The value of the foreign securities in which the Fund invests may change on days when a shareholder will not be able to purchase or redeem shares of the |
| | | |
Fund. Fair value pricing is subjective in nature and the use of fair value pricing by the Fund may cause the NAV of its shares to differ significantly from the NAV that would have been calculated using market prices at the close of the exchange on which a portfolio security is primarily traded. There can be no assurance that the Fund could obtain the fair market value assigned to a security if the Fund were to sell the security at approximately the time at which the Fund determines its NAV.
Exchange traded options, futures and options on futures are valued at the settlement price determined by the relevant exchange as of the NYSE Close. If such instruments do not trade on an exchange, values may be supplied by an independent pricing service using a formula or other objective method that may take into consideration the style, direction, expiration, strike price, notional value and volatility or other adjustments.
Financial instruments for which prices are not available from an independent pricing service may be valued using market quotations obtained from one or more dealers that make markets in the respective financial instrument in accordance with procedures established by the Company’s Board of Directors.
U.S. GAAP defines fair value as the price that the Fund would receive to sell an asset or pay to transfer a liability in an orderly transaction between market participants. The U.S. GAAP fair value measurement standards require disclosure of a fair value hierarchy for each major category of assets and liabilities. Various inputs are used in determining the fair value of the Fund’s investments. These inputs are summarized into three broad hierarchy levels. This hierarchy is based on whether the valuation inputs are observable or unobservable. These levels are:
| · | Level 1 – Quoted prices in active markets for identical securities. Level 1 may include exchange traded instruments, such as domestic equities, some foreign equities, options, futures, mutual funds, exchange traded funds, rights and warrants. |
| · | Level 2 – Observable inputs other than Level 1 prices, such as quoted prices for similar securities; quoted prices in markets that are not active; or other inputs that are observable or can be corroborated by observable market data. Level 2 may include debt securities that are traded less frequently than exchange traded instruments and which are valued using independent pricing services; foreign equities, that are principally traded on certain foreign markets and are adjusted daily pursuant to a fair value pricing service in order to reflect an adjustment for the factors occurring after the close of certain foreign markets but before the NYSE Close; and short-term securities, which are valued at amortized cost. |
| · | Level 3 – Significant unobservable inputs that are supported by limited or no market activity. Level 3 may include financial instruments whose values are determined using broker quotes or require significant management judgment or estimation. These unobservable valuation inputs may include estimates for current yields, maturity/duration, prepayment speed, and broker quotes for comparable securities along with other assumptions relating to credit quality, collateral value, complexity of the security structure, general market conditions and liquidity. This category may include securities where trading has been halted or there are certain restrictions on trading. While these securities are priced using unobservable inputs, the valuation of these securities reflects the best available data and management believes the prices are a reasonable representation of exit price. |
Valuation levels are not necessarily indicative of the risk associated with investing in such securities. Individual securities within any of the above mentioned asset classes may be assigned a different hierarchical level than those presented above, as individual circumstances dictate.
During the year ended December 31, 2011, the Fund held no Level 3 securities; therefore, no reconciliation of Level 3 securities is presented.
For additional information, refer to the Investment Valuation Hierarchy Level Summary which follows the Schedule of Investments.
| Hartford Disciplined Equity HLS Fund |
| Notes to Financial Statements – (continued) |
| December 31, 2011 |
| (000’s Omitted) |
For purposes of reporting transfers between different hierarchy levels, both transfers in and out of each level, as applicable, are shown as if they occurred at the beginning of the period.
| c) | Security Transactions and Investment Income – Security transactions are recorded as of the trade date (the date the order to buy or sell is executed) for financial reporting purposes. Securities purchased or sold on a when-issued or delayed-delivery basis may be settled a month or more after the trade date. Realized gains and losses are determined on the basis of identified cost. |
Dividend income is accrued as of the ex-dividend date, except certain dividends from foreign securities where the ex-dividend date may have passed are recorded as soon as the Fund is informed of the dividend. Interest income, including amortization of premium and accretion of discounts, is accrued on a daily basis.
| d) | Joint Trading Account – The Fund may invest cash balances into a joint trading account that may be invested in one or more repurchase agreements. |
| e) | Fund Share Valuation and Dividend Distributions to Shareholders – Orders for the Fund’s shares are executed in accordance with the investment instructions of the contract holders and plan participants. The NAV of the Fund’s shares is determined as of the close of business on each business day of the Exchange. The NAV is determined separately for each class of shares of the Fund by dividing the Fund’s net assets attributable to that class by the number of shares of the class outstanding. Each class of shares offered by the Fund has equal rights as to assets and voting privileges (except that shareholders of a class have exclusive voting rights regarding any matter relating solely to that class of shares). Income and non-class specific expenses are allocated daily to each class on the basis of the relative net assets of the class. Realized and unrealized capital gains and losses are allocated daily based on the relative net assets of each class of shares of the Fund. |
Orders for the purchase of the Fund’s shares received prior to the close of the Exchange on any day the Exchange is open for business are priced at the NAV determined as of the close of the Exchange. Orders received after the close of the Exchange, or on a day on which the Exchange and/or the Fund is not open for business, are priced at the next determined NAV.
Dividends are declared pursuant to a policy adopted by the Company’s Board of Directors based upon the investment performance of the Fund. The policy of the Fund is to pay dividends from net investment income and realized capital gains, if any, at least once a year.
Distributions from net investment income, net realized capital gains and capital are determined in accordance with federal income tax regulations, which may differ from U.S. GAAP with respect to character and timing. These differences may include but are not limited to losses deferred due to wash sale adjustments, foreign currency gains and losses, adjustments related to Passive Foreign Investment Companies (“PFICs”), Real Estate Investment Trusts (“REITs”), Regulated Investment Companies (“RICs”), certain derivatives and partnerships. Permanent book and federal income tax basis differences relating to shareholder distributions will result in reclassifications to certain of the Fund’s capital accounts (see Federal Income Taxes: Reclassification of Capital Accounts note).
| 3. | Securities and Other Investments: |
| a) | Repurchase Agreements – A repurchase agreement is an agreement by which a counterparty agrees to sell a security and agrees to repurchase the security sold at a mutually agreed upon time and price. At the time the Fund enters into a repurchase agreement, the value of the underlying collateral security(ies), including accrued interest, will be equal to or exceed the value of the repurchase agreement. Repurchase agreements expose the Fund to counterparty risk. To |
minimize counterparty risk, the securities that serve to collateralize the repurchase agreement are held by the Fund's custodian in book entry or physical form in the custodial account of the Fund or in a third party custodial account. Repurchase agreements are valued at cost plus accrued interest. The Fund had no outstanding repurchase agreements as of December 31, 2011.
| 4. | Financial Derivative Instruments: |
The following disclosures contain information on how and why the Fund uses derivative instruments, the credit-risk-related contingent features in certain derivative instruments, and how derivative instruments affect the Fund’s financial position and results of operations. The location and fair value amounts of these instruments on the Statement of Assets and Liabilities and the realized gains and losses and changes in unrealized gains and losses on the Statement of Operations, each categorized by type of derivative contract, are included in the following Additional Derivative Instrument Information footnote. The derivative instruments outstanding as of period-end are disclosed in the notes to the Schedule of Investments and the amounts of realized gains and losses and changes in unrealized gains and losses on derivative instruments during the period are disclosed in the Statement of Operations.
| a) | Futures Contracts – The Fund may enter into futures contracts. A futures contract is an agreement between two parties to buy or sell an asset at a set price on a future date. The Fund uses futures contracts to manage or obtain exposure to the securities markets, commodities, or movements in interest rates and currency values. The primary risks associated with the use of futures contracts are the imperfect correlation between the change in market value of the securities held by the Fund and the prices of futures contracts and the possibility of an illiquid market. Upon entering into a futures contract, the Fund is required to deposit with a futures commission merchant (“FCM”) an amount of cash or U.S. Government or Agency Obligations in accordance with the initial margin requirements of the broker or exchange. Futures contracts are marked to market daily at the most recent settlement price reported by an exchange on which, over time, they are traded most extensively, and an appropriate payable or receivable for the change in value (“variation margin”) is recorded by the Fund. Gains or losses are recognized but not considered realized until the contracts expire or are closed. Futures contracts involve, to varying degrees, risk of loss in excess of the variation margin disclosed on the Statement of Assets and Liabilities; however, this risk is reduced through the use of an FCM. The Fund, as shown on the Schedule of Investments, had outstanding futures contracts as of December 31, 2011. |
| b) | Options Contracts – An option contract is a contract sold by one party to another party that offers the buyer the right, but not the obligation, to buy (call) or sell (put) a security or other financial asset at an agreed-upon price during a specific period of time or on a specific date. The Fund may write (sell) covered call and put options on futures, swaps (“swaptions”), securities, commodities or currencies. “Covered” means that so long as the Fund is obligated as the writer of an option, it will own either the underlying securities or currency or an option to purchase the same underlying securities or currency having an expiration date of the covered option and an exercise price equal to or less than the exercise price of the covered option, or will pledge cash or other liquid securities having a value equal to or greater than the fluctuating market value of the option security or currency. Writing put options increases the Fund’s exposure to the underlying instrument. Writing call options decreases the Fund’s exposure to the underlying instrument. Premiums received from writing options that expire are treated as realized gains. Premiums received from writing options that are exercised or closed are added to the proceeds or offset against amounts paid on the underlying futures, swap, security or currency transaction to determine the realized gain or loss. The Fund as a writer of an option has no control over whether the underlying instrument may be sold (call) or purchased (put) and as a result bears the market risk of an unfavorable change in the price of the instrument underlying the written option. There is the risk the Fund may not be able to enter into a closing transaction because of an illiquid market. The Fund may also purchase put and call options. Purchasing call options increases the Fund’s exposure to the underlying instrument. Purchasing put options decreases the Fund’s exposure to the underlying instrument. The Fund pays a premium, which is included on the Fund’s Statement of Assets and Liabilities as an investment and is subsequently marked to market to reflect the current value of the option. Premiums paid for purchasing options that expire are treated as realized losses. Certain options may be purchased with premiums to be determined on a future date. The premiums for these options are based upon implied volatility |
| Hartford Disciplined Equity HLS Fund |
| Notes to Financial Statements – (continued) |
| December 31, 2011 |
| (000’s Omitted) |
parameters at specified terms. The risk associated with purchasing put and call options is generally limited to the premium paid. Premiums paid for purchasing options that are exercised or closed are added to the amounts paid or offset against the proceeds on the underlying investment transaction to determine the realized gain or loss. Entering into over-the-counter options also exposes the Fund to counterparty risk. Counterparty risk is the possibility that the counterparty to the agreements may default on its obligation to perform or disagree as to the meaning of the contractual terms in the agreements. The Fund had no outstanding purchased options contracts as of December 31, 2011. Transactions involving written options contracts for the Fund during the year ended December 31, 2011, are summarized below:
| | | Options Contract Activity During the | |
| | | Year Ended December 31, 2011 | |
| Call Options Written During the Year | | Number of Contracts* | | | Premium Amounts | |
| Beginning of the year | | | 568 | | | $ | 122 | |
| Written | | | 15,207 | | | | 1,091 | |
| Expired | | | (13,401 | ) | | | (888 | ) |
| Closed | | | (529 | ) | | | (161 | ) |
| Exercised | | | (577 | ) | | | (84 | ) |
| End of year | | | 1,268 | | | $ | 80 | |
| | | | | | | | | |
| Put Options Written During the Year | | | Number of Contracts* | | | | Premium Amounts | |
| Beginning of the year | | | 559 | | | $ | 52 | |
| Written | | | 18,589 | | | | 1,057 | |
| Expired | | | (12,981 | ) | | | (650 | ) |
| Closed | | | (3,817 | ) | | | (298 | ) |
| Exercised | | | (1,576 | ) | | | (125 | ) |
| End of year | | | 774 | | | $ | 36 | |
* The number of contracts does not omit 000's.
| c) | Additional Derivative Instrument Information: |
Fair Values of Derivative Instruments on the Statement of Assets and Liabilities as of December 31, 2011:
| | | Risk Exposure Category | |
| | | | | | Foreign | | | | | | | | | | | | | | | | |
| | | Interest Rate | | | Exchange | | | Credit | | | Equity | | | Commodity | | | Other | | | | |
| | | Contracts | | | Contracts | | | Contracts | | | Contracts | | | Contracts | | | Contracts | | | Total | |
| | | | | | | | | | | | | | | | | | | | | | |
| Liabilities: | | | | | | | | | | | | | | | | | | | | | | | | | | | | |
| Variation margin payable * | | $ | — | | | $ | — | | | $ | — | | | $ | 37 | | | $ | — | | | $ | — | | | $ | 37 | |
| Written options, market value | | | — | | | | — | | | | — | | | | 121 | | | | — | | | | — | | | | 121 | |
| Total | | $ | — | | | $ | — | | | $ | — | | | $ | 158 | | | $ | — | | | $ | — | | | $ | 158 | |
| * | Only current day's variation margin is reported within the Statement of Assets and Liabilities. The variation margin is included in the open futures cumulative appreciation (depreciation) of $(38) as reported in the Schedule of Investments. |
The volume of derivatives that is presented in the Schedule of Investments is consistent with the derivative activity during the year ended December 31, 2011.
The Effect of Derivative Instruments on the Statement of Operations for the year ended December 31, 2011:
| | | Risk Exposure Category | |
| | | | | | Foreign | | | | | | | | | | | | | | | | |
| | | Interest Rate | | | Exchange | | | Credit | | | Equity | | | Commodity | | | Other | | | | |
| | | Contracts | | | Contracts | | | Contracts | | | Contracts | | | Contracts | | | Contracts | | | Total | |
| Realized Gain (Loss) on Derivatives Recognized as a Result of Operations: |
| Net realized gain on futures | | $ | — | | | $ | — | | | $ | — | | | $ | 1,890 | | | $ | — | | | $ | — | | | $ | 1,890 | |
| Net realized gain on written options | | | — | | | | — | | | | — | | | | 1,277 | | | | — | | | | — | | | | 1,277 | |
| Total | | $ | — | | | $ | — | | | $ | — | | | $ | 3,167 | | | $ | — | | | $ | — | | | $ | 3,167 | |
| | | | | | | | | | | | | | | | | | | | | | | | | | | | | |
| Net Change in Unrealized Appreciation (Depreciation) on Derivatives Recognized as a Result of Operations: | | | | | | | | | | | | | |
| Net change in unrealized depreciation of futures | | $ | — | | | $ | — | | | $ | — | | | $ | (1 | ) | | $ | — | | | $ | — | | | $ | (1 | ) |
| Net change in unrealized depreciation of written options | | | — | | | | — | | | | — | | | | (43 | ) | | | — | | | | — | | | | (43 | ) |
| Total | | $ | — | | | $ | — | | | $ | — | | | $ | (44 | ) | | $ | — | | | $ | — | | | $ | (44 | ) |
| a) | Counterparty Risk – The Fund may be exposed to counterparty risk, or the risk that an institution or other entity with which the Fund has unsettled or open transactions will default. |
| b) | Market Risks – The market values of equity securities, such as common stocks and preferred stocks, or equity related investments, such as futures and options, may decline due to general market conditions which are not specifically related to a particular company, such as real or perceived adverse economic conditions, changes in the general outlook for corporate earnings, changes in interest or currency rates or adverse investor sentiment generally. The market value of equity securities may also decline due to factors which affect a particular industry or industries, such as labor shortages or increased production costs and competitive conditions within an industry. Equity securities and equity related investments generally have greater market price volatility than fixed income securities. |
| a) | Federal Income Taxes – For federal income tax purposes, the Fund intends to continue to qualify as a RIC under Subchapter M of the Internal Revenue Code (“IRC”) by distributing substantially all of its taxable net investment income and net realized capital gains to its shareholders and otherwise complying with the requirements of RICs. The Fund has distributed substantially all of its income and capital gains in prior years, if applicable, and intends to distribute substantially all of its income and capital gains prior to the next fiscal year-end. Accordingly, no provision for federal income or excise taxes has been made in the accompanying financial statements. Distributions from short-term capital gains are treated as ordinary income distributions for federal income tax purposes. |
| b) | Net Investment Income (Loss), Net Realized Gains (Losses) – Net investment income (loss) and net realized gains (losses) may differ for financial statement and tax purposes primarily because of losses deferred due to wash sale adjustments, foreign currency gains and losses, adjustments related to PFICs, REITs, RICs, certain derivatives and partnerships. The character of distributions made during the year from net investment income or net realized gains may differ from their ultimate characterization for federal income tax purposes. Also, due to the timing of dividend distributions, the fiscal year in which amounts are distributed may differ from the year that the income or realized gains (losses) were recorded by the Fund. |
| Hartford Disciplined Equity HLS Fund |
| Notes to Financial Statements – (continued) |
| December 31, 2011 |
| (000’s Omitted) |
| c) | Distributions and Components of Distributable Earnings – The tax character of distributions paid by the Fund for the periods indicated is as follows (as adjusted for dividends payable): |
| | | For the Year Ended | | | For the Year Ended | |
| | | December 31, 2011 | | | December 31, 2010 | |
| Ordinary Income | | $ | 11,639 | | | $ | 14,230 | |
As of December 31, 2011, the Fund’s components of distributable earnings (deficit) on a tax basis were as follows:
| | | Amount | |
| Undistributed Ordinary Income | | $ | 682 | |
| Accumulated Capital and Other Losses* | | | (237,381 | ) |
| Unrealized Appreciation† | | | 133,543 | |
| Total Accumulated Deficit | | $ | (103,156 | ) |
| * | The Fund has capital loss carryforwards that are identified in the Capital Loss Carryforward note that follows. |
| † | The difference between book-basis and tax-basis unrealized appreciation (depreciation) may be attributable to the losses deferred due to wash sale adjustments, foreign currency gains and losses, adjustments related to PFICs, REITs, RICs, certain derivatives and partnerships. |
| d) | Reclassification of Capital Accounts – The Fund may record reclassifications in its capital accounts. These reclassifications have no impact on the total net assets of the Fund. The reclassifications are a result of permanent differences between U.S. GAAP and tax accounting for such items as foreign currency, PFICs, expiration or utilization of capital loss carryforwards or net operating losses. Adjustments are made to reflect the impact these items have on current and future distributions to shareholders. Therefore, the source of the Fund’s distributions may be shown in the accompanying Statement of Changes in Net Assets as from undistributed net investment income, from accumulated net realized gains on investments or from capital depending on the type of book and tax differences that exist. For the year ended December 31, 2011, the Fund recorded reclassifications to increase (decrease) the accounts listed below: |
| | | Amount | |
| Undistributed Net Investment Income | | $ | (877 | ) |
| Accumulated Net Realized Gain (Loss) | | | 877 | |
| e) | Capital Loss Carryforward – On December 22, 2010, the Regulated Investment Company Modernization Act of 2010 (the “Act”) was enacted, which made changes to the capital loss carryforward rules. The changes are effective for taxable years beginning after the date of enactment. Under the Act, funds are permitted to carry forward capital losses for an unlimited period. However, any losses incurred during those future taxable years will be required to be utilized prior to the losses incurred in pre-enactment taxable years, which carry an expiration date. As a result of this ordering rule, pre-enactment capital loss carryforwards may be more likely to expire unused. Additionally, post-enactment capital loss carryforwards will retain their character as either short-term or long-term capital losses rather than being considered all short-term as permitted under prior regulation. |
At December 31, 2011 (tax-year-end), the Fund had capital loss carryforwards for U.S. federal income tax purposes of approximately:
| Year of Expiration | | Amount | |
| 2016 | | $ | 50,480 | |
| 2017 | | | 186,901 | |
| Total | | $ | 237,381 | |
As of December 31, 2011, the Fund utilized $77,777 of prior year capital loss carryforwards.
| f) | Accounting for Uncertainty in Income Taxes – The Fund has adopted financial reporting rules that require the Fund to analyze all open tax years, as defined by the statute of limitations, for all major jurisdictions. Generally, tax authorities can examine all tax returns filed for the last three years. The Fund does not have an examination in progress. |
The Fund has reviewed all open tax years and major jurisdictions and concluded that these financial reporting rules had no effect on the Fund’s financial position or results of operations. There is no tax liability resulting from unrecognized tax benefits relating to uncertain income tax positions taken or expected to be taken on the tax return for the fiscal year ended December 31, 2011. The Fund is also not aware of any tax positions for which it is reasonably possible that the total amounts of unrecognized tax benefits will significantly change in the next twelve months.
| a) | Investment Management Agreement – HL Investment Advisors, LLC (“HL Advisors”), an indirect wholly owned subsidiary of The Hartford Financial Services Group, Inc. (“The Hartford”), serves as investment manager to the Fund pursuant to an Investment Management Agreement with the Company. As investment manager, HL Advisors has overall investment supervisory responsibility for the Fund. In addition, HL Advisors provides administrative personnel, services, equipment, facilities and office space for proper operation of the Fund. HL Advisors has contracted with Wellington Management Company, LLP (“Wellington Management”) under a sub-advisory agreement for the provision of day-to-day investment management services to the Fund in accordance with the Fund’s investment objective and policies. The Fund pays a fee to HL Advisors, a portion of which may be used to compensate Wellington Management. |
The schedule below reflects the rates of compensation paid to HL Advisors for investment management services rendered as of December 31, 2011; the rates are accrued daily and paid monthly.
| Average Daily Net Assets | | Annual Fee |
| On first $250 million | | 0.7750% | |
| On next $250 million | | 0.7250% | |
| On next $500 million | | 0.6750% | |
| On next $4 billion | | 0.6250% | |
| On next $5 billion | | 0.6225% | |
| Over $10 billion | | 0.6200% | |
| b) | Accounting Services Agreement – Pursuant to the Fund Accounting Agreement between HLIC and the Company, on behalf of the Fund, HLIC provides accounting services to the Fund and receives monthly compensation based on the Fund’s average daily net assets at the rates set forth below. The Fund’s accounting services fees are accrued daily and paid monthly. |
| Average Daily Net Assets | | Annual Fee |
| On first $5 billion | | 0.012% | |
| Over $5 billion | | 0.010% | |
| Hartford Disciplined Equity HLS Fund |
| Notes to Financial Statements – (continued) |
| December 31, 2011 |
| (000’s Omitted) |
| c) | Operating Expenses – Allocable expenses incurred by the Company are allocated to each Fund and allocated to classes within a Fund in proportion to the average daily net assets of the Fund and each class, except where allocation of certain expenses is more fairly made directly to the Fund or to specific classes within a Fund. |
| d) | Fees Paid Indirectly – The Company, on behalf of the Fund, has entered into agreements with State Street Global Markets, LLC and Russell Implementation Services, Inc. to partially recapture non-discounted trade commissions. Such rebates are used to pay a portion of the Fund’s expenses. In addition, the Fund’s custodian bank has also agreed to reduce its fees when the Fund maintains cash on deposit in a non-interest-bearing custody account. For the year ended December 31, 2011, these amounts, if any, are included in the Statement of Operations. |
The ratio of expenses to average net assets in the accompanying financial highlights excludes the reduction in expenses related to fees paid indirectly. The annualized expense ratio for the period listed below reflecting the reduction for fees paid indirectly is as follows:
| | | Year Ended | |
| | | December 31, 2011 | |
| Class IA | | | 0.74 | % |
| Class IB | | | 0.99 | |
| e) | Distribution Plan for Class IB shares – The Company, on behalf of the Fund, has adopted a Distribution Plan pursuant to Rule 12b-1 of the 1940 Act to compensate the Distributor, Hartford Securities Distribution Company, Inc. (a wholly owned, ultimate subsidiary of The Hartford), from assets attributable to the Class IB shares for services rendered and expenses borne in connection with activities primarily intended to result in the sale of the Class IB shares, subject to the review and approval of the Company’s Board of Directors. |
The Distribution Plan provides that the Fund may pay annually up to 0.25% of the average daily net assets of the Fund attributable to its Class IB shares for activities primarily intended to result in the sale of Class IB shares. The Board has the authority to suspend or reduce these payments at any point in time. Under the terms of the Distribution Plan and the principal underwriting agreement, the Fund is authorized to make payments monthly to the Distributor that may be used to pay or compensate entities providing distribution and shareholder servicing with respect to the Class IB shares for such entities’ fees or expenses incurred or paid in that regard. These fees are accrued daily and paid monthly.
| f) | Other Related Party Transactions – Certain officers of the Fund are directors and/or officers of HL Advisors and/or The Hartford or its subsidiaries. For the year ended December 31, 2011, a portion of the Fund’s chief compliance officer’s salary was paid by all the investment companies in the Hartford fund complex. The portion allocated to the Fund was in the amount of $1. These fees are accrued daily and paid monthly. |
| g) | Payment from Affiliate – In July of 2007, The Hartford entered into a settlement with the Attorneys General of the states of New York, Connecticut and Illinois relating to market timing and the company's individual variable annuity contracts in which certain payments would be made directly to the variable annuity contract holders. The distribution plan provided that unclaimed money from the settlement would be distributed to certain HLS Funds that are investment options through a Hartford individual variable annuity contract. The unclaimed money was distributed to the Fund on September 18, 2009. |
The total return in the accompanying financial highlights includes a payment from an affiliate. Had the payment from the affiliate been excluded, the impact and total return for the period listed below would have been as follows:
| | | For the Year Ended December 31, 2009 | |
| | | Class IA | | | Class IB | |
| Impact from Payment from Affiliate for Attorneys General Settlement | | | 0.01 | % | | | 0.01 | % |
| Total Return Excluding Payment from Affiliate | | | 25.64 | | | | 25.32 | |
| 8. | Investment Transactions: |
For the year ended December 31, 2011, the Fund's aggregate purchases and sales of investment securities (excluding short-term investments) were as follows:
| | | Amount | |
| Cost of Purchases Excluding U.S. Government Obligations | | $ | 471,950 | |
| Sales Proceeds Excluding U.S. Government Obligations | | | 652,086 | |
The Fund is one of several Hartford funds that participate in a $500 million committed revolving line of credit facility. The facility is to be used for temporary or emergency purposes. Under the arrangement, the funds are required to own securities having a market value in excess of 300% of the total bank borrowings. The interest rate on borrowings varies depending on the nature of the loan. The facility also requires a fee to be paid based on the amount of the commitment. This commitment fee is allocated to all of the funds participating in the line of credit based on the average net assets of the funds. During the year ended December 31, 2011, the Fund did not have any borrowings under this facility.
| 10. | Industry Classifications: |
Other than the industry classifications “Other Investment Pools and Funds” and “Exchange Traded Funds,” equity industry classifications used in this report are the Global Industry Classification Standard, which was developed by and is the exclusive property and service mark of MSCI, Inc. and Standard & Poor’s.
Under the Company’s organizational documents, the Company shall indemnify its officers and directors to the full extent required or permitted under Maryland General Corporation Law and the federal securities laws. In addition, the Company, on behalf of the Fund, may enter into contracts that contain a variety of indemnifications. The Company’s maximum exposure under these arrangements is unknown. However, as of the date of these financial statements, the Company has not had prior claims or losses pursuant to these contracts and expects the risk of loss to be remote.
| Hartford Disciplined Equity HLS Fund |
| Financial Highlights |
| - Selected Per-Share Data (A) - |
| | | Net Asset | | | | | | | | | Net Realized | | | | | | | | | | | | | | | | | | Net Increase | | | | |
| | | Value at | | | | | | | | | and Unrealized | | | Total from | | | Dividends from | | | Distributions | | | | | | | | | (Decrease) in | | | Net Asset | |
| | | Beginning of | | | Net Investment | | | Payments from | | | Gain (Loss) on | | | Investment | | | Net Investment | | | from Realized | | | Distributions | | | Total | | | Net Asset | | | Value at End of | |
| Class | | Period | | | Income (Loss) | | | (to) Affiliate | | | Investments | | | Operations | | | Income | | | Capital Gains | | | from Capital | | | Distributions | | | Value | | | Period | |
| | | | | | | | | | | | | | | | | | | | | | | | |
| For the Year Ended December 31, 2011 | | | | | | | | | | | | | | | | | | | | | | | |
| IA | | $ | 11.79 | | | $ | 0.14 | | | $ | — | | | $ | (0.01 | ) | | $ | 0.13 | | | $ | (0.14 | ) | | $ | — | | | $ | — | | | $ | (0.14 | ) | | $ | (0.01 | ) | | $ | 11.78 | |
| IB | | | 11.73 | | | | 0.11 | | | | — | | | | — | | | | 0.11 | | | | (0.11 | ) | | | — | | | | — | | | | (0.11 | ) | | | — | | | | 11.73 | |
| | | | | | | | | | | | | | | | | | | | | | | | | |
| For the Year Ended December 31, 2010 | | | | | | | | | | | | | | | | | | | | | | | | |
| IA | | | 10.47 | | | | 0.15 | | | | — | | | | 1.32 | | | | 1.47 | | | | (0.15 | ) | | | — | | | | — | | | | (0.15 | ) | | | 1.32 | | | | 11.79 | |
| IB | | | 10.42 | | | | 0.13 | | | | — | | | | 1.30 | | | | 1.43 | | | | (0.12 | ) | | | — | | | | — | | | | (0.12 | ) | | | 1.31 | | | | 11.73 | |
| | | | | | | | | | | | | | | | | | | | | | | | | |
| For the Year Ended December 31, 2009 | | | | | | | | | | | | | | | | | | | | | | | | |
| IA | | | 8.46 | | | | 0.15 | | | | — | | | | 2.01 | | | | 2.16 | | | | (0.15 | ) | | | — | | | | — | | | | (0.15 | ) | | | 2.01 | | | | 10.47 | |
| IB | | | 8.41 | | | | 0.13 | | | | — | | | | 2.00 | | | | 2.13 | | | | (0.12 | ) | | | — | | | | — | | | | (0.12 | ) | | | 2.01 | | | | 10.42 | |
| | | | | | | | | | | | | | | | | | | | | | | | | |
| For the Year Ended December 31, 2008 | | | | | | | | | | | | | | | | | | | | | | | | |
| IA | | | 15.05 | | | | 0.14 | | | | — | | | | (5.37 | ) | | | (5.23 | ) | | | (0.14 | ) | | | (1.22 | ) | | | — | | | | (1.36 | ) | | | (6.59 | ) | | | 8.46 | |
| IB | | | 14.97 | | | | 0.12 | | | | — | | | | (5.35 | ) | | | (5.23 | ) | | | (0.11 | ) | | | (1.22 | ) | | | — | | | | (1.33 | ) | | | (6.56 | ) | | | 8.41 | |
| | | | | | | | | | | | | | | | | | | | | | | | | |
| For the Year Ended December 31, 2007 | | | | | | | | | | | | | | | | | | | | | | | | |
| IA | | | 14.08 | | | | 0.16 | | | | — | | | | 1.01 | | | | 1.17 | | | | (0.15 | ) | | | (0.05 | ) | | | — | | | | (0.20 | ) | | | 0.97 | | | | 15.05 | |
| IB | | | 14.01 | | | | 0.13 | | | | — | | | | 1.00 | | | | 1.13 | | | | (0.12 | ) | | | (0.05 | ) | | | — | | | | (0.17 | ) | | | 0.96 | | | | 14.97 | |
| (A) | Information presented relates to a share outstanding throughout the indicated period. |
| (B) | The figures do not include sales charges or other fees which may be applied at the variable life insurance, variable annuity or qualified retirement plan product level. Any such additional sales charges or other fees would lower the Fund's performance. |
| (C) | Ratios do not reflect reductions for fees paid indirectly. Please see Fees Paid Indirectly in the Notes to Financial Statements. |
| (D) | Portfolio turnover rate is calculated on the basis of the Fund as a whole without distinguishing between the classes of shares issued. |
| (E) | Total return without the inclusion of the Payment from (to) Affiliate can be found in Expenses in the accompanying Notes to Financial Statements. |
| - Ratios and Supplemental Data - |
| | | | | | | Ratio of Expenses to Average Net | | | Ratio of Expenses to Average Net | | | Ratio of Net Investment Income | | | Portfolio Turnover | |
| Total Return(B) | | | Net Assets at End of Period | | | Assets Before Waivers(C) | | | Assets After Waivers(C) | | | (Loss) to Average Net Assets | | | Rate(D) | |
| | | | | | | | | | | | | | | | | | | | | | | |
| | | | | | | | | | | | | | | | | | | | | | | |
| | 1.15 | % | | $ | 852,312 | | | | 0.74 | % | | | 0.74 | % | | | 1.06 | % | | | 44 | % |
| | 0.90 | | | | 129,416 | | | | 0.99 | | | | 0.99 | | | | 0.81 | | | | — | |
| | | | | | | | | | | | | | | | | | | | | | | |
| | | | | | | | | | | | | | | | | | | | | | | |
| | 14.04 | | | | 1,022,321 | | | | 0.75 | | | | 0.75 | | | | 1.35 | | | | 44 | |
| | 13.76 | | | | 159,898 | | | | 1.00 | | | | 1.00 | | | | 1.10 | | | | — | |
| | | | | | | | | | | | | | | | | | | | | | | |
| | | | | | | | | | | | | | | | | | | | | | | |
| | 25.65 | (E) | | | 1,008,875 | | | | 0.75 | | | | 0.75 | | | | 1.56 | | | | 59 | |
| | 25.33 | (E) | | | 173,063 | | | | 1.00 | | | | 1.00 | | | | 1.31 | | | | — | |
| | | | | | | | | | | | | | | | | | | | | | | |
| | | | | | | | | | | | | | | | | | | | | | | |
| | (37.27 | ) | | | 868,799 | | | | 0.71 | | | | 0.71 | | | | 1.14 | | | | 73 | |
| | (37.43 | ) | | | 165,848 | | | | 0.96 | | | | 0.96 | | | | 0.89 | | | | — | |
| | | | | | | | | | | | | | | | | | | | | | | |
| | | | | | | | | | | | | | | | | | | | | | | |
| | 8.34 | | | | 1,566,652 | | | | 0.70 | | | | 0.70 | | | | 1.04 | | | | 75 | |
| | 8.07 | | | | 339,877 | | | | 0.95 | | | | 0.95 | | | | 0.79 | | | | — | |
| Report of Independent Registered Public Accounting Firm |
| The Board of Directors and Shareholders of |
| Hartford Series Fund, Inc. |
We have audited the accompanying statement of assets and liabilities, including the schedule of investments, of Hartford Disciplined Equity HLS Fund (one of the portfolios constituting Hartford Series Fund, Inc. (the Funds)) as of December 31, 2011, and the related statement of operations for the year then ended, the statements of changes in net assets for each of the two years in the period then ended, and the financial highlights for each of the five years in the period then ended. These financial statements and financial highlights are the responsibility of the Funds’ management. Our responsibility is to express an opinion on these financial statements and financial highlights based on our audits.
We conducted our audits in accordance with the standards of the Public Company Accounting Oversight Board (United States). Those standards require that we plan and perform the audit to obtain reasonable assurance about whether the financial statements and financial highlights are free of material misstatement. We were not engaged to perform an audit of the Funds’ internal control over financial reporting. Our audits included consideration of internal control over financial reporting as a basis for designing audit procedures that are appropriate in the circumstances, but not for the purpose of expressing an opinion on the effectiveness of the Funds’ internal control over financial reporting. Accordingly, we express no such opinion. An audit also includes examining, on a test basis, evidence supporting the amounts and disclosures in the financial statements and financial highlights, assessing the accounting principles used and significant estimates made by management, and evaluating the overall financial statement presentation. Our procedures included confirmation of securities owned as of December 31, 2011, by correspondence with the custodian and brokers or by other appropriate auditing procedures where replies from brokers were not received. We believe that our audits provide a reasonable basis for our opinion.
In our opinion, the financial statements and financial highlights referred to above present fairly, in all material respects, the financial position of Hartford Disciplined Equity HLS Fund of Hartford Series Fund, Inc. at December 31, 2011, the results of its operations for the year then ended, the changes in its net assets for each of the two years in the period then ended, and the financial highlights for each of the five years in the period then ended, in conformity with U.S. generally accepted accounting principles.
| | |
| | |
| Minneapolis, MN | |
| February 13, 2012 | |
| Hartford Disciplined Equity HLS Fund |
| Directors and Officers (Unaudited) |
The Board of Directors of the Company appoints officers who are responsible for the day-to-day operations of the Fund and who execute policies formulated by the Directors. Each director serves until his or her death, resignation, or retirement or until the next annual meeting of shareholders is held or until his or her successor is elected and qualifies.
Directors and officers who are employed by or who have a financial interest in The Hartford are considered “interested” persons of the Fund pursuant to the 1940 Act. Each officer and two of the Company’s directors, as noted in the chart below, are “interested” persons of the Fund. Each director serves as a director for The Hartford Mutual Funds, Inc., The Hartford Mutual Funds II, Inc., Hartford Series Fund, Inc., Hartford HLS Series Fund II, Inc., and as a trustee for The Hartford Alternative Strategies Fund, which, as of December 31, 2011, collectively consist of 91 funds. Correspondence may be sent to directors and officers c/o Hartford Mutual Funds, P.O. Box 2999, Hartford, Connecticut 06104-2999, except that correspondence to Ms. Fagely may be sent to 500 Bielenberg Drive, Woodbury, Minnesota 55125.
The table below sets forth, for each director and officer, his or her name, year of birth, current position with the Company and date first elected or appointed to Hartford Series Fund, Inc. (“HSF”), and Hartford HLS Series Fund II, Inc. (“HSF2”), principal occupation, and, for directors, other directorships held. The Fund’s statement of additional information contains further information on the directors and is available free of charge by calling 1-800-862-6668 or writing to Hartford HLS Funds, c/o Individual Annuity Services, P.O. Box 5085, Hartford, CT 06102-5085.
Information on the aggregate remuneration paid to the directors of the Company can be found in the Statement of Operations herein. The Fund pays to The Hartford a portion of the chief compliance officer’s compensation, but does not pay salaries or compensation to any of their other officers or directors who are employed by The Hartford.
Non-Interested Directors
Lynn S. Birdsong (1946) Director since 2003, Co-Chairman of the Investment Committee
Mr. Birdsong is a private investor. Mr. Birdsong currently serves as a Director of the Sovereign High Yield Investment Company (April 2010 to current). Mr. Birdsong currently serves as an Independent Director of Nomura Partners Funds, Inc. (formerly, The Japan Fund) (March 2003 to current). From 2003 to March 2005, Mr. Birdsong was an independent director of the Atlantic Whitehall Funds. From 1979 to 2002, Mr. Birdsong was a managing director of Zurich Scudder Investments, an investment management firm. During his employment with Scudder, Mr. Birdsong was an Interested Director of The Japan Fund. Since 1981, Mr. Birdsong has been a partner in Birdsong Company, an advertising specialty firm.
Robert M. Gavin, Jr. (1940) Director since 2002 (HSF) and 1986 (HSF2), Chairman of the Board since 2004
Dr. Gavin is an educational consultant. Prior to September 1, 2001, he was President of Cranbrook Education Community and prior to July 1996, he was President of Macalester College, St. Paul, Minnesota.
Duane E. Hill (1945) Director since 2001 (HSF) and 2002 (HSF2), Chairman of the Nominating Committee
Mr. Hill is Partner of TSG Ventures L.P., a private equity investment company. Mr. Hill is a former partner of TSG Capital Group, a private equity investment firm that served as sponsor and lead investor in leveraged buyouts of middle market companies.
Sandra S. Jaffee (1941) Director since 2005
Ms. Jaffee served as Chairman (2008 to 2009) and Chief Executive Officer of Fortent (formerly Searchspace Group), a leading provider of compliance/regulatory technology to financial institutions from August 2005 to August 2009. From August 2004 to August 2005, Ms. Jaffee served as an Entrepreneur in Residence with Warburg Pincus, a private equity firm. From September 1995 to July 2004, Ms. Jaffee served as Executive Vice President at Citigroup, where she was President and Chief Executive Officer of Citibank’s Global Securities Services (1995 to 2003). Ms. Jaffe currently serves as a member of the Board of Directors of Broadridge Financial Solutions as well as a Trustee of Muhlenberg College.
William P. Johnston (1944) Director since 2005, Chairman of the Compliance Committee
In June 2006, Mr. Johnston was appointed as Senior Advisor to The Carlyle Group, a global private equity investment firm. In August 2007, Mr. Johnston was elected to the Board of Directors of LifeCare Holdings, Inc. In February 2008, Mr. Johnston was elected to the Board of Directors of HCR-ManorCare, Inc. In May 2006, Mr. Johnston was elected to the Supervisory Board of Fresenius Medical Care AG & Co. KGaA, after its acquisition of Renal Care Group, Inc. in March 2006. Mr. Johnston joined Renal Care Group in November 2002 as a member of the Board of Directors and served as Chairman of the Board from March 2003 through March 2006. Mr. Johnston served as a Director of MultiPlan, Inc. from July 2006 through August 2010. From September 1987 to December 2002, Mr. Johnston was with Equitable Securities Corporation (and its successors, SunTrust Equitable Securities and SunTrust Robinson Humphrey) serving in various investment banking and managerial positions, including Managing Director and Head of Investment Banking, Chief Executive Officer and Vice Chairman.
| Hartford Disciplined Equity HLS Fund |
| Directors and Officers (Unaudited) – (continued) |
Phillip O. Peterson (1944) Director since 2002 (HSF) and 2000 (HSF2), Chairman of the Audit Committee
Mr. Peterson is a mutual fund industry consultant. He was a partner of KPMG LLP (an accounting firm) until July 1999. Mr. Peterson joined William Blair Funds in February 2007 as a member of the Board of Trustees. From January 2004 to April 2005, Mr. Peterson served as Independent President of the Strong Mutual Funds.
Lemma W. Senbet (1946) Director since 2005
Dr. Senbet is the William E. Mayer Chair Professor of Finance and Director, Center for Financial Policy, at the University of Maryland, Robert H. Smith School of Business. He was chair of the Finance Department from 1998 to 2006. Previously he was a chaired professor of finance at the University of Wisconsin-Madison. Also, he was director of the Fortis Funds from March 2000 to July 2002. Dr. Senbet served the finance profession in various capacities, including as director of the American Finance Association and President of the Western Finance Association. In 2006, Dr. Senbet was inducted Fellow of Financial Management Association International for his career-long distinguished scholarship and professional service.
Interested Directors and Officers
David N. Levenson (1966) Director since 2010
Mr. Levenson currently serves as President of The Hartford’s Wealth Management business. He was appointed to this role in July 2010. Previously, Mr. Levenson served as Executive Vice President of Legacy Holdings for The Hartford from June 2009 to July 2010. From 2006 to 2009, Mr. Levenson was with Hartford Life Insurance K.K. where he served as President and Chief Executive Officer from 2007 to 2009. He served as Managing Director of Hartford Investment Management Company from 2005 to 2006. Additionally, Mr. Levenson serves as Executive Vice President of The Hartford and as President, Director and Chief Executive Officer of Hartford Life Insurance Company (“HLIC”) and Hartford Life, Inc. (“HL Inc.”).
Lowndes A. Smith (1939) Director since 1996 (HSF) and 2002 (HSF2), Co-Chairman of the Investment Committee
Mr. Smith served as Vice Chairman of The Hartford from February 1997 to January 2002, as President and Chief Executive Officer of HL Inc. from February 1997 to January 2002, and as President and Chief Operating Officer of The Hartford Life Insurance Companies from January 1989 to January 2002. Mr. Smith serves as a Director of White Mountains Insurance Group, Ltd., One Beacon Insurance and Symetra Financial and as a Managing Director of Whittington Gray Associates.
Other Officers
James E. Davey (1964) President and Chief Executive Officer since 2010
Mr. Davey serves as Executive Vice President of HLIC. Additionally, Mr. Davey serves as President, Chief Executive Officer and Manager of Hartford Investment Financial Services, Inc. (“HIFSCO”) and President, Chief Executive Officer and Manager of HL Advisors. Mr. Davey joined The Hartford in 2002.
Michael R. Dressen (1963) AML Compliance Officer since 2011
Mr. Dressen currently serves as Assistant Vice President of HLIC. He also serves as Chief Compliance Officer and AML Compliance Officer of Hartford Administrative Services Company (“HASCO”) and as Assistant Secretary and Compliance Officer of HIFSCO. Mr Dressen joined The Hartford in 2005 from State Farm Insurance Companies where he held various positions related to mutual funds, variable products, and property casualty insurance.
Tamara L. Fagely (1958) Vice President, Treasurer and Controller since 2002 (HSF) and 1993 (HSF2)
Ms. Fagely has been a Vice President of HASCO since 1998 and Chief Financial Officer since 2006. Currently Ms. Fagely is a Vice President of HLIC. She served as Assistant Vice President of HLIC from December 2001 through March 2005. In addition, Ms. Fagely is Controller and Chief Financial Officer of HIFSCO.
Dr. Robert J. Froehlich (1953) Senior Managing Director since 2009
Dr. Froehlich joined The Hartford as Senior Managing Director in September 2009. Prior to joining The Hartford, Dr. Froehlich served as Vice Chairman of Deutsche Asset Management from 1997-2009.
Edward P. Macdonald (1967) Vice President, Secretary and Chief Legal Officer since 2005
Mr. Macdonald serves as Vice President of HLIC and Chief Legal Officer of Mutual Funds and Vice President of HIFSCO. He also serves as Vice President and Secretary of HASCO, and Chief Legal Officer, Secretary and Vice President of HL Advisors. Mr. Macdonald joined The Hartford in 2005.
Vernon J. Meyer (1964) Vice President since 2006
Mr. Meyer serves as Senior Vice President of HLIC. He also serves as Senior Vice President of HIFSCO and HL Advisors. Mr. Meyer joined The Hartford in 2004.
Colleen B. Pernerewski (1969) Vice President and Chief Compliance Officer since 2010
Ms. Pernerewski serves as Vice President and Chief Investment Advisor Compliance Officer of HIFSCO and as Vice President and Chief Compliance Officer of HL Advisors. Ms. Pernerewski joined The Hartford in 2005 from Travelers Life and Annuity where she served as Counsel (2004-2005). Prior to Travelers Life and Annuity, Ms. Pernerewski held the position of Counsel at The Hartford (1998-2004).
Elizabeth L. Schroeder (1966) Vice President since 2010
Ms. Schroeder currently serves as Assistant Vice President of HLIC. Ms. Schroeder joined HLIC in 1991. She is also an Assistant Vice President of HASCO, HIFSCO and HL Advisors.
Martin Swanson (1962) Vice President since 2010
Mr. Swanson is a Vice President of HLIC. Mr. Swanson also serves as Vice President/Marketing for HIFSCO. Prior to joining HLIC in 1998, Mr. Swanson was a Vice President at PaineWebber, Inc.
Jane Wolak (1961) Vice President since 2009
Ms. Wolak currently serves as Senior Vice President of HLIC. Ms. Wolak joined HLIC as Vice President, Retail Product Services in May 2007. She is also Vice President of HASCO. Previously, Ms. Wolak was with Sun Life Financial where she held the position of Vice President, Service Center Operations from 2001-2007.
HOW TO OBTAIN A COPY OF THE FUND’S PROXY VOTING POLICIES AND VOTING RECORDS (UNAUDITED)
A description of the policies and procedures that the Fund uses to determine how to vote proxies relating to portfolio securities and a record of how the Fund voted any proxies for the twelve-month period ended June 30, 2011 are available (1) without charge, upon request, by calling 800-862-6668 and (2) on the SEC’s website at http://www.sec.gov.
QUARTERLY PORTFOLIO HOLDINGS INFORMATION (UNAUDITED)
The Fund files a complete schedule of portfolio holdings with the SEC for the first and third quarters of each fiscal year on Form N-Q. The Fund’s Forms are available (1) without charge, upon request, by calling 800-862-6668 and (2) on the SEC’s website at http://www.sec.gov. The Form N-Q may be reviewed and copied at the SEC’s Public Reference Room in Washington, DC. Information on the operation of the Public Reference Room may be obtained by calling 1-800-SEC-0330.
| Hartford Disciplined Equity HLS Fund |
| Expense Example (Unaudited) |
Your Fund's Expenses
As a shareholder of the Fund, you incur two types of costs: (1) transaction costs and (2) ongoing costs including investment management fees, distribution fees, and other fund expenses. This example is intended to help you understand your ongoing costs (in dollars) of investing in the Fund and to compare these costs with the ongoing costs of investing in other mutual funds. The example is based on an investment of $1,000 invested at the beginning of the period and held for the period of June 30, 2011 through December 31, 2011.
Actual Expenses
The first set of columns of the table below provides information about actual account values and actual expenses. You may use the information in this column, together with the amount you invested, to estimate the expenses that you paid over the period. Simply divide your account value by $1,000 (for example, an $8,600 account value divided by $1,000 = 8.6), then multiply the result by the number in the line under the heading entitled “Expenses Paid During Period” to estimate the expenses you paid on your account during this period.
Hypothetical Example for Comparison Purposes
The second set of columns of the table below provides information about hypothetical account values and hypothetical expenses based on the Fund’s actual expense ratio and an assumed rate of return of 5% per year before expenses, which is not the Fund’s actual return. The hypothetical account values and expenses may not be used to estimate the actual ending account balance or expenses you paid for the period. You may use this information to compare the ongoing costs of investing in the Fund and other funds. To do so, compare this 5% hypothetical example with the 5% hypothetical examples that appear in the shareholder reports of the other funds.
Please note that the expenses shown in the table are meant to highlight your ongoing costs only and do not reflect any transactional costs, such as sales charges (loads) and CDSC. Therefore, the second set of columns of the table is useful in comparing ongoing costs only, and will not help you determine the relative total costs of owning different funds. In addition, if these transactional costs were included, your costs would be higher. Expenses are equal to the Fund's annualized expense ratios multiplied by average account value over the period, multiplied by 184/365 (to reflect the one-half year period).
| | | Actual return | | | Hypothetical (5% return before expenses) | | | | | | | |
| | | Beginning
Account Value
June 30, 2011 | | Ending
Account Value
December 31, 2011 | | Expenses paid
during the period
June 30, 2011
through
December 31, 2011 | | | Beginning
Account Value
June 30, 2011 | | Ending
Account Value
December 31,
2011 | | Expenses paid
during the period
June 30, 2011
through
December 31, 2011 | | Annualized
expense
ratio | | Days in
the
current
1/2
year | | Days
in the
full
year | |
| Class IA | | $1,000.00 | | $938.62 | | $3.62 | | | $1,000.00 | | $1,021.48 | | $3.77 | | 0.74% | | 184 | | 365 | |
| Class IB | | $1,000.00 | | $937.44 | | $4.83 | | | $1,000.00 | | $1,020.21 | | $5.04 | | 0.99% | | 184 | | 365 | |
| Hartford Disciplined Equity HLS Fund |
| Approval of Investment Management and Investment Sub-Advisory Agreements (Unaudited) |
Section 15(c) of the Investment Company Act of 1940, as amended (the “1940 Act”), requires that each mutual fund’s board of directors, including a majority of those directors who are not “interested persons” of the mutual fund, as defined in the 1940 Act (the “Independent Directors”), annually review and consider the continuation of the mutual fund’s investment advisory and sub-advisory agreements. At its meeting held on August 2-3, 2011, the Board of Directors (the “Board”) of Hartford Series Fund, Inc., including each of the Independent Directors, unanimously voted to approve the continuation of the investment management agreement for Hartford Disciplined Equity HLS Fund (the “Fund”) with HL Investment Advisors, LLC (“HL Advisors”) and the continuation of the investment sub-advisory agreement between HL Advisors and the Fund’s sub-adviser, Wellington Management Company, LLP (the “Sub-adviser,” and together with HL Advisors, the “Advisers”) (collectively, the “Agreements”).
In the months preceding the August 2-3, 2011 meeting, the Board requested, received, and reviewed written responses from the Advisers to questions posed to them on behalf of the Independent Directors and supporting materials relating to those questions and responses. The Board considered information furnished to the Board at its meetings throughout the year, as well as information specifically prepared in connection with the annual approval of the Agreements at the Board’s meetings held on June 21-22, 2011 and August 2-3, 2011. Information provided to the Board at its meetings throughout the year included, among other things, reports on Fund performance, legal and compliance matters, sales and marketing activity, shareholder services, and the other services provided to the Fund by the Advisers and their affiliates. In addition, the Board received in-person presentations by Fund officers and representatives of HL Advisors at the Board’s meetings on June 21-22, 2011 and August 2-3, 2011 concerning the Agreements.
The Independent Directors, advised by independent legal counsel, engaged two service providers to assist them with evaluating the Agreements with respect to the Fund. Lipper Inc. (“Lipper”), an independent provider of investment company data, was retained to provide the Board with reports on how the Fund’s contractual management fees, actual management fees, other non-management fees, overall expense ratios and investment performance compared to those of mutual funds with similar investment objectives. The Independent Directors also engaged an independent financial services consulting firm (the “Consultant”) to assist them in evaluating the Fund’s management fees, sub-advisory fees, other non-management fees, overall expense ratios and investment performance. In addition, the Consultant reviewed the profitability calculations utilized by HL Advisors in connection with the continuation of the investment management agreement.
In determining to continue the Agreements for the Fund, the members of the Board reviewed and evaluated information and factors they believed to be relevant and appropriate in light of the information that the Board deemed necessary and appropriate through the exercise of their reasonable business judgment. While individual members of the Board may have weighed certain factors differently, the Board’s determination to continue the Agreements was based on a comprehensive consideration of all information provided to the Board throughout the year and specifically with respect to the continuation of the Agreements. A more detailed discussion of the factors the Board considered with respect to its approval of the Agreements is provided below.
Nature, Extent, And Quality Of Services Provided by the Advisers
The Board requested and considered information concerning the nature, extent, and quality of the services provided to the Fund by the Advisers. The Board considered, among other things, the terms of the Agreements and the range of services provided by the Advisers. The Board considered the Advisers’ professional personnel who provide services to the Fund, including each Adviser’s ability and experience in attracting and retaining qualified personnel to service the Fund. The Board considered each Adviser’s reputation and overall financial strength, as well as its willingness to consider and implement organizational and operational changes designed to improve services to the Fund. In addition, the Board considered the quality of each Adviser’s communications with the Board and responsiveness to Board inquiries.
The Board also requested and evaluated information concerning each Adviser’s regulatory and compliance environment. In this regard, the Board requested and reviewed information on each Adviser’s compliance policies and procedures, compliance history, and a report from the Fund’s Chief Compliance Officer on each Adviser’s compliance with applicable laws and regulations, including responses to regulatory developments and compliance issues raised by regulators. The Board also noted the Advisers’ support of the Fund’s compliance control structure, particularly the resources devoted by the Advisers in support of the Fund’s obligations pursuant to Rule 38a-1 under the 1940 Act.
| Hartford Disciplined Equity HLS Fund |
| Approval of Investment Management and Investment Sub-Advisory Agreements (Unaudited) – (continued) |
With respect to HL Advisors, the Board noted that under the Agreements, HL Advisors is responsible for the management of the Fund, including overseeing fund operations and service providers, as well as investment advisory services in connection with selecting, monitoring and supervising the Sub-adviser. The Board considered HL Advisors’ ongoing monitoring of people, process and performance, including its quarterly reviews of each of the Hartford HLS Funds, semi-annual meetings with the leaders of each Fund’s portfolio management team, and oversight of the Funds’ 49 portfolio managers. The Board recognized that HL Advisors has demonstrated a record of making changes to the management and/or strategies of the Funds when warranted. The Board considered HL Advisors’ oversight of the Sub-adviser’s investment approach and results, process for monitoring best execution of portfolio trades by the Sub-adviser, and approach to risk management with respect to the Fund and the service providers to the Fund. The Board also considered HL Advisors’ oversight of compliance with the Fund’s objective and policies as well as with applicable laws and regulations, noting that regulatory and other developments had over time led to an increase in the scope of HL Advisors’ services in this regard. In addition, the Board considered HL Advisors’ ongoing commitment to review and rationalize the Hartford fund family’s product line-up and the expenses that HL Advisors had incurred in connection with fund combinations in recent years. The Board considered that HL Advisors or its affiliates are responsible for providing the Fund’s officers. The Board also noted that Hartford Life Insurance Company (“HLIC”) provides administrative services to the Fund. The Board considered its experiences with HL Advisors and HLIC with respect to each of these services.
With respect to the Sub-adviser, who provides day-to-day portfolio management services, the Board considered the quality of the Fund’s portfolio manager, the Sub-adviser’s other investment personnel, its investment philosophy and process, investment research capabilities and resources, performance record, trade execution capabilities and experience. The Board considered the experience of the Fund’s portfolio manager, the number of accounts managed by the portfolio manager, and the Sub-adviser’s method for compensating the portfolio manager.
Based on these considerations, the Board concluded that it was satisfied with the nature, extent and quality of the services provided to the Fund by HL Advisors and the Sub-adviser.
Performance of the Fund and the Advisers
The Board considered the investment performance of the Fund. In this regard, the Board reviewed the performance of the Fund over different time periods presented in the materials and evaluated HL Advisors’ analysis of the Fund’s performance for these time periods. The Board considered information and materials provided to the Board by the Advisers concerning Fund performance, as well as information from Lipper comparing the investment performance of the Fund to an appropriate benchmark and universe of peer funds. The Board noted that the performance of the Fund was within expectations.
The Board considered the detailed investment analytics reports provided by The Hartford’s Investment Advisory Group throughout the year. These reports include, among other things, information on the Fund’s gross and net returns, the Fund’s investment performance relative to an appropriate benchmark and peer group, various statistics concerning the Fund’s portfolio, and a narrative summary of various factors affecting Fund performance. The Board considered the Advisers’ cooperation with the Investment Committee, which assists the Board in evaluating the performance of the Fund at periodic meetings throughout the year. The Board also considered the analysis provided by the Consultant relating to the Fund’s performance track record.
In light of all the considerations noted above, the Board concluded that it had continued confidence in HL Advisors’ and the Sub-adviser’s overall capabilities to manage the Fund.
Costs of the Services and Profitability of the Advisers
The Board reviewed information regarding HL Advisors’ cost to provide investment management and related services to the Fund and HL Advisors’ profitability, both overall and for the Fund, on a pre-tax basis without regard to distribution expenses. The Board also requested and reviewed information about the profitability to HL Advisors and its affiliates from all services provided to the Fund and all aspects of their relationship with the Fund. The Board also requested and received information relating to the operations and profitability of the Sub-adviser.
The Board considered the Consultant’s review of the profitability calculations utilized by HL Advisors in connection with the continuation of the investment management agreement. In this regard, the Consultant reported that The Hartford’s process for calculating and reporting Fund profitability is reasonable, sound and well within common industry practice.
Based on these considerations, the Board concluded that the profits anticipated to be realized by the Advisers and their affiliates from their relationships with the Fund would not be excessive.
Comparison of Fees and Services Provided by the Advisers
The Board considered comparative information with respect to the management fees to be paid by the Fund to HL Advisors and the total expense ratios of the Fund. The Board also considered comparative information with respect to the sub-advisory fees to be paid by HL Advisors to the Sub-adviser, to the extent applicable. In this regard, the Board requested and reviewed information from HL Advisors and the Sub-adviser relating to the management and sub-advisory fees, including the sub-advisory fee schedule for the Fund, and total operating expenses for the Fund. The Board considered that the management fee for the Fund includes the fee paid to HLIC for providing certain administrative services to the Fund. The Board also reviewed information from Lipper comparing the Fund’s contractual management fees, actual management fees and overall expense ratios relative to a group of funds selected by Lipper, in consultation with the Consultant, and a broader universe of funds selected by Lipper.
While the Board recognized that comparisons between the Fund and peer funds are imprecise, given the differing service levels and characteristics of mutual funds and the different business models and cost structures of the Advisers, the comparative information provided by Lipper assisted the Board in evaluating the reasonableness of the Fund’s management and sub-advisory fees and total operating expenses. In addition, the Board considered the analysis and recommendations of the Consultant relating to the Fund’s management and sub-advisory fees and total operating expenses.
Based on these considerations, the Board concluded that the Fund’s fees and total operating expenses, in conjunction with the information about quality of services, profitability, economies of scale, and other matters discussed, were reasonable in light of the services provided.
Economies of Scale
The Board requested and considered information regarding the Advisers’ realization of economies of scale with respect to the Fund and whether the fee levels reflect these economies of scale for the benefit of the Fund’s investors. With respect to HL Advisors, the Board considered representations from HL Advisors that it is difficult to anticipate whether and to what extent economies may be realized by HL Advisors as assets grow over time. The Board reviewed the breakpoints in the management fee schedule for the Fund, which reduces fee rates as Fund assets grow over time. The Board recognized that a fund with assets beyond the last breakpoint level will continue to benefit from economies of scale because additional assets are charged the lowest breakpoint fee resulting in lower overall effective management fee rates. The Board also recognized that a fee schedule that reaches a lower breakpoint quickly provides shareholders with the benefit of anticipated or potential economies of scale.
The Board reviewed and evaluated materials from Lipper showing how management fee schedules of peer funds reflect economies of scale for the benefit of investors as a peer fund’s assets hypothetically increase over time. Based on information provided by HL Advisors, Lipper, and the Consultant, the Board recognized that there is no uniform methodology for establishing breakpoints or uniform pattern in asset levels that trigger breakpoints or the amounts of breakpoints triggered.
After considering all of the information available to it, the Board concluded that it was satisfied with the extent to which economies of scale would be shared for the benefit of the Fund’s shareholders based on currently available information and the effective advisory fees and expense ratios for the Fund at its current and reasonably anticipated asset levels. The Board noted, however, that it would continue to monitor future growth in Fund assets and the appropriateness of additional breakpoints.
| Hartford Disciplined Equity HLS Fund |
| Approval of Investment Management and Investment Sub-Advisory Agreements (Unaudited) – (continued) |
Other Benefits
The Board considered other benefits to the Advisers and their affiliates from their relationships with the Fund, including the role of the Fund in supporting the variable life insurance and variable annuity products offered by The Hartford. The Board reviewed information noting that HLIC, an affiliate of HL Advisors, receives fees for providing certain administrative services to the Fund, and that HLIC also receives fees for fund accounting and related services from the Fund, and the Board considered information on expected profits to HLIC or its affiliates for such services. The Board also considered that Hartford Administrative Services Company (“HASCO”), the Fund’s transfer agent and an affiliate of HL Advisors, receives transfer agency compensation from the Fund, and the Board reviewed information on the expected profitability of the Fund’s transfer agency function to HASCO. The Board considered information provided by HASCO indicating that the transfer agent fees charged by HASCO to the Fund were fair and reasonable based on publicly available information.
The Board also considered that Hartford Securities Distribution Company, Inc., as principal underwriter of the Fund, receives 12b-1 fees from the Fund. The Board also noted that certain affiliates of HL Advisors distribute shares of the Fund and receive compensation in that connection.
The Board considered benefits to the Sub-adviser from its use of the Fund’s brokerage commissions to obtain soft dollar research, and representations from HL Advisors and the Sub-adviser that the Sub-adviser would not make any revenue-sharing payments or any other type of distribution payments to HL Advisors or its affiliates.
The Board considered the benefits to shareholders of being part of the Hartford family of funds. The Board considered HL Advisors’ efforts to provide investors in the family with a broad range of investment styles and asset classes.
* * * *
Based upon its review of these various factors, among others, the Board concluded that it is in the best interests of the Fund and its shareholders for the Board to approve the Agreements for an additional year. In reaching this decision, the Board did not assign relative weights to the factors discussed above or deem any one or group of them to be controlling in and of themselves. In connection with their deliberations, the Independent Directors met separately in executive session on several occasions, with independent legal counsel, to review the relevant materials and consider their responsibilities under relevant laws and regulations.
The Hartford
P.O. Box 5085
Hartford, CT 06102-5085
Hartford Series Fund, Inc. is underwritten and distributed by Hartford Securities Distribution Company, Inc.
"The Hartford" is The Hartford Financial Services Group, Inc. and its subsidiaries.
Hartford Series Fund, Inc. inception dates range from 1977 to date. Hartford Series Fund, Inc. is not a subsidiary of The Hartford but is underwritten, distributed by and advised by subsidiaries of The Hartford. Investments in Hartford Series Fund, Inc. are not guaranteed by The Hartford or any other entity.
You should carefully consider investment objectives, risks, and charges and expenses of Hartford HLS Funds before investing. This and other information can be found in the Fund’s prospectus or summary prospectus, which can be obtained by calling 800-862-6668. Please read them carefully before you invest or send money.
HLSAR-DE11 2-12 109078 Printed in U.S.A ©2011 The Hartford, Hartford, CT 06115 | |
A MESSAGE FROM THE PRESIDENT
Dear Fellow Shareholders:
I want to take this opportunity to say thank you for investing in Hartford HLS Funds.
This has been a tumultuous year. In the beginning of 2011, we witnessed tension-fueled political uprisings in the already-volatile Middle East and North Africa region. We also watched as Japan dealt with a series of crises including a massive earthquake and subsequent tsunami. Yet, U.S. economic conditions continued to improve, with gains in consumer confidence and retail sales. During the first half of 2011, domestic, international, and world indices (as measured by the S&P 500, MSCI EAFE and MSCI World) were all up more than 5% through June, 30 2011.
The economic recovery, however, lost momentum in the second half of 2011. The employment and housing markets both remain extremely challenged. Investors continue to be concerned about the implications of the European sovereign debt crisis, as well as our own high levels of domestic debt. Fears that the European sovereign debt crisis could continue to drag down the global economy have weighed heavily on stocks.
Ongoing apprehension regarding the U.S. debt ceiling during the summer and the resulting downgrade of the U.S. sovereign credit rating by Standard & Poor’s also contributed to weaker investor confidence.
There are, however, some reasons to remain confident. Corporations have record levels of cash on their balance sheets—corporate cash has doubled in the past 10 years. In addition, U.S. gross domestic product expanded at a 2.5 percent annual rate in the third quarter according to the Commerce Department, as consumers and businesses set aside fears about the recovery and stepped up spending. Corporate earnings have also remained positive, with a majority of companies beating expectations each quarter this year. This momentum will hopefully continue into next year.
As we head into 2012, in light of the continued market volatility, now would be a good time to schedule a meeting with your financial advisor to examine your current investment strategy and determine whether you are on the right track.
| • | Does your fixed-income portfolio complement your equity portfolio? |
| • | Are you receiving diversified sources of income? |
| • | Is your portfolio still in line with your risk tolerance and investment time horizon? |
Talk to your advisor to see what changes you should make to address these concerns and opportunities.
Thank you again for investing with Hartford HLS Funds.
James Davey
President
Hartford HLS Funds
Hartford Dividend and Growth HLS Fund
Table of Contents
This report is prepared for the general information of contract owners and qualified retirement plan participants. It is not an offer of contracts or of qualified retirement plans. It should not be used in connection with any offer, except in conjunction with the appropriate product prospectus which contains all pertinent information including the applicable sales, administrative and other charges.
The views expressed in the Fund’s Manager Discussion under “Why did the Fund perform this way?” and “What is the outlook?” are views of the Fund’s sub-adviser and portfolio management team through the end of the period and are subject to change based on market and other conditions.
Hartford Dividend and Growth HLS Fund inception 03/09/1994
(sub-advised by Wellington Management Company, LLP)
| Investment objective – Seeks a high level of current income consistent with growth of capital. |
| |
Performance Overview 12/31/01 – 12/31/11
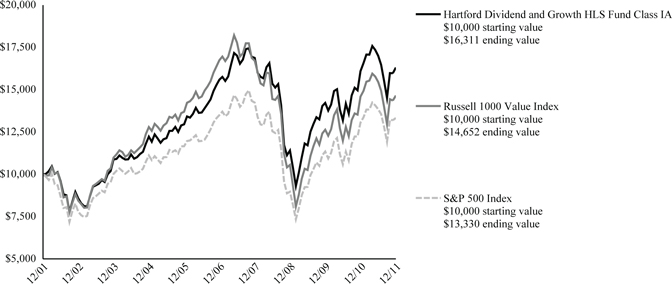
The chart above shows the growth of a $10,000 investment in Class IA. Growth results in classes other than Class IA will vary from what is seen above due to differences in the expenses charged to those share classes.
| Average Annual Total Returns (as of 12/31/11) |
| | 1 Year | 5 Year | 10 Year |
| Dividend and Growth IA | 1.32% | 0.90% | 5.01% |
| Dividend and Growth IB | 1.06% | 0.65% | 4.76% |
| Russell 1000 Value Index | 0.39% | -2.64% | 3.89% |
| S&P 500 Index | 2.09% | -0.25% | 2.92% |
PAST PERFORMANCE IS NOT INDICATIVE OF FUTURE RESULTS.
Total returns presented above were calculated using the Fund's net asset value available to shareholders for sale or redemption of Fund shares on December 31, 2011, which may exclude investment transactions as of this date.
Russell 1000 Value Index is an unmanaged index measuring the performance of those Russell 1000 Index companies with lower price-to-book ratios and lower forecasted growth values. (The Russell 1000 Index is an unmanaged index that measures the performance of the 1,000 largest companies in the Russell 3000 Index, which measures the performance of the 3,000 largest U.S. companies, based on total market capitalizations.)
S&P 500 Index is a market capitalization-weighted price index composed of 500 widely held common stocks.
You cannot invest directly in an index.
The chart represents a hypothetical investment in the Fund. Performance data represents past performance and current performance could be higher or lower.
Performance information may reflect historical or current expense waivers/reimbursements from the investment adviser, without which performance would have been lower. For information on current expense waivers/reimbursements, please see the prospectus.
The value of the Fund will fluctuate so that when redeemed, it may be worth more or less than the original investment. The chart and table do not reflect the deductions of taxes, sales charges or other fees which may be applied at the variable life insurance, variable annuity or qualified retirement plan product level. Any such additional sales charges or other fees or expenses would lower the contract’s or plan’s performance.
| Hartford Dividend and Growth HLS Fund |
| Manager Discussion (Unaudited) |
| December 31, 2011 |
| |
| Portfolio Managers | | |
| Edward P. Bousa, CFA | Donald J. Kilbride | Matthew G. Baker |
| Senior Vice President | Senior Vice President | Vice President |
| | | |
How did the Fund perform?
The Class IA shares of the Hartford Dividend and Growth HLS Fund returned 1.32% for the twelve-month period ended December 31, 2011, underperforming its benchmark, the S&P 500 Index, which returned 2.09% and outperforming the Russell 1000 Value Index which returned 0.39% for the same period. The Fund outperformed the 1.23% return of the average fund in the Lipper Equity Income VP-UF Funds peer group, a group of funds with investment strategies similar to those of the Fund.
Why did the Fund perform this way?
The one-year period ended December 31, 2011 was yet another extremely volatile period for equity markets. Global equities started the year on a strong note and continued to march higher in the first quarter of 2011, driven by investors’ enthusiasm for additional government debt purchases by the U.S. Federal Reserve, the extension of tax cuts in the U.S., strong earnings growth, and generally improving economic data. This enthusiasm reversed later in the period, however, as concerns surfaced that the global economy could slip back into a recession, resulting in a rapid decline in equity markets. Fears about sovereign debt and solvency in the eurozone, slowing economic expansion in China and the U.S., and uncertainty about the sustainability of corporate earnings growth combined to produce an extremely volatile stock market, and return correlations among stocks spiked as investors shed risk and fled to safety. Markets ended the year on a positive note in the final month of the period with encouraging employment and manufacturing data in the U.S.
Mid cap stocks (-2%) and small cap stocks (-4%) underperformed large cap stocks (+2%) during the period as measured by the S&P MidCap 400, Russell 2000, and S&P 500 Indices, respectively. During the twelve-month period seven out of ten sectors within the S&P 500 Index rose, led by Utilities (+20%), Consumer Staples (+14%), and Health Care (+13%). Financials (-17%) and Materials (-10%) lagged the most on a relative basis.
The Fund’s underperformance relative to the S&P 500 (i.e. performance of the Fund as measured against the benchmark) was due to weak stock selection within Consumer Discretionary, Materials, and Industrials. Overall sector allocation, a residual of bottom-up stock selection (i.e. stock by stock fundamental research), was modestly positive driven primarily by overweights (i.e. the Fund’s sector position was greater than the benchmark position) to Health Care and Utilities.
The Fund’s top three detractors from benchmark-relative returns were Apple (Information Technology), Ultra Petroleum (Energy), and MetLife (Financials). Apple, the manufacturer, designer, and marketer of personal computers and related items, had a stable uptrend this year. Not owning Apple detracted from our relative results. Ultra Petroleum is a leading independent energy company actively engaged in the exploration and production of oil and natural gas. The stock underperformed after the company raised capital expenditures spending guidance with no offsetting increase in 2011 production guidance. Shares of life insurance and financial services company MetLife declined due to fears that the Operation Twist launched by the Federal Reserve will depress long term interest rates indefinitely. Financial services companies Bank of America and JPMorgan Chase detracted from absolute (i.e. total return) performance returns.
The Fund’s top contributors to benchmark-relative performance during the period were Citigroup (Financials), Eli Lilly (Health Care), and Pfizer (Health Care). Global financial services company Citigroup saw weak growth continue in securities, banking, and domestic consumer banking. Not owning Citigroup contributed to performance. US-based global pharmaceutical company Eli Lilly has a track record of returning cash to shareholders, and the company has 10 new products that are currently in phase III trials. Shares of another U.S.-based pharmaceutical company Pfizer rose following the acceptance of the filings for Eliquis, a new drug for prevention of stroke in patients with atrial fibrillation. IBM and Exxon Mobil contributed to absolute performance.
What is the outlook?
The stock market rallied sharply during the fourth quarter as conditions in the European debt market stabilized somewhat. Meanwhile, the U.S. economy held up better than feared, supporting stock valuations.
Our investment discipline is focused on investing in areas of strong demand and avoiding areas of oversupply. At the end of the period, our largest overweights relative to the benchmark were to the Financials, Health Care, and Utilities sectors,
| Hartford Dividend and Growth HLS Fund |
| Manager Discussion (Unaudited) – (continued) |
| December 31, 2011 |
| |
while we remained underweight the Information Technology, Consumer Staples, and Consumer Discretionary sectors.
Diversification by Industry
as of December 31, 2011
| Industry (Sector) | | Percentage of
Net Assets | |
| Automobiles & Components (Consumer Discretionary) | | | 1.6 | % |
| Banks (Financials) | | | 6.0 | |
| Capital Goods (Industrials) | | | 7.2 | |
| Commercial & Professional Services (Industrials) | | | 1.0 | |
| Diversified Financials (Financials) | | | 5.9 | |
| Energy (Energy) | | | 13.4 | |
| Food & Staples Retailing (Consumer Staples) | | | 1.0 | |
| Food, Beverage & Tobacco (Consumer Staples) | | | 5.0 | |
| Health Care Equipment & Services (Health Care) | | | 3.1 | |
| Household & Personal Products (Consumer Staples) | | | 1.7 | |
| Insurance (Financials) | | | 5.1 | |
| Materials (Materials) | | | 2.7 | |
| Media (Consumer Discretionary) | | | 4.4 | |
| Pharmaceuticals, Biotechnology & Life Sciences (Health Care) | | | 12.0 | |
| Retailing (Consumer Discretionary) | | | 3.2 | |
| Semiconductors & Semiconductor Equipment (Information Technology) | | | 3.0 | |
| Software & Services (Information Technology) | | | 7.9 | |
| Technology Hardware & Equipment (Information Technology) | | | 2.8 | |
| Telecommunication Services (Services) | | | 3.8 | |
| Transportation (Industrials) | | | 2.4 | |
| Utilities (Utilities) | | | 5.1 | |
| Short-Term Investments | | | 1.5 | |
| Other Assets and Liabilities | | | 0.2 | |
| Total | | | 100.0 | % |
| Hartford Dividend and Growth HLS Fund |
| Schedule of Investments |
| December 31, 2011 |
| (000’s Omitted) |
| Shares or Principal Amount | | Market Value ╪ | |
| COMMON STOCKS - 98.3% | |
| | | | | Automobiles & Components - 1.6% | | | | |
| | 2,931 | | | Ford Motor Co. w/ Rights ● | | $ | 31,532 | |
| | 1,350 | | | Johnson Controls, Inc. | | | 42,201 | |
| | | | | | | | 73,733 | |
| | | | | Banks - 6.0% | | | | |
| | 1,179 | | | PNC Financial Services Group, Inc. | | | 67,993 | |
| | 1,514 | | | US Bancorp | | | 40,945 | |
| | 5,859 | | | Wells Fargo & Co. | | | 161,477 | |
| | | | | | | | 270,415 | |
| | | | | Capital Goods - 7.2% | | | | |
| | 865 | | | Cooper Industries plc Class A | | | 46,823 | |
| | 619 | | | Deere & Co. | | | 47,856 | |
| | 558 | | | General Dynamics Corp. | | | 37,077 | |
| | 3,499 | | | General Electric Co. | | | 62,676 | |
| | 915 | | | Honeywell International, Inc. | | | 49,709 | |
| | 253 | | | Northrop Grumman Corp. | | | 14,772 | |
| | 679 | | | Raytheon Co. | | | 32,855 | |
| | 368 | | | Siemens AG ADR | | | 35,137 | |
| | | | | | | | 326,905 | |
| | | | | Commercial & Professional Services - 1.0% | | | | |
| | 1,368 | | | Waste Management, Inc. | | | 44,760 | |
| | | | | | | | | |
| | | | | Diversified Financials - 5.9% | | | | |
| | 726 | | | Ameriprise Financial, Inc. | | | 36,044 | |
| | 3,275 | | | Bank of America Corp. | | | 18,211 | |
| | 228 | | | BlackRock, Inc. | | | 40,603 | |
| | 72 | | | CME Group, Inc. | | | 17,642 | |
| | 349 | | | Goldman Sachs Group, Inc. | | | 31,542 | |
| | 2,966 | | | JP Morgan Chase & Co. | | | 98,613 | |
| | 117 | | | State Street Corp. | | | 4,728 | |
| | 1,444 | | | UBS AG ADR ● | | | 17,082 | |
| | | | | | | | 264,465 | |
| | | | | Energy - 13.4% | | | | |
| | 915 | | | Anadarko Petroleum Corp. | | | 69,865 | |
| | 840 | | | Baker Hughes, Inc. | | | 40,857 | |
| | 303 | | | Cenovus Energy, Inc. | | | 10,048 | |
| | 624 | | | Chesapeake Energy Corp. | | | 13,907 | |
| | 1,293 | | | Chevron Corp. | | | 137,618 | |
| | 1,990 | | | EnCana Corp. ADR | | | 36,880 | |
| | 2,074 | | | Exxon Mobil Corp. | | | 175,761 | |
| | 538 | | | Occidental Petroleum Corp. | | | 50,373 | |
| | 797 | | | Total S.A. ADR | | | 40,755 | |
| | 960 | | | Ultra Petroleum Corp. ● | | | 28,457 | |
| | | | | | | | 604,521 | |
| | | | | Food & Staples Retailing - 1.0% | | | | |
| | 1,094 | | | CVS Caremark Corp. | | | 44,609 | |
| | | | | | | | | |
| | | | | Food, Beverage & Tobacco - 5.0% | | | | |
| | 452 | | | Anheuser-Busch InBev N.V. | | | 27,543 | |
| | 1,276 | | | PepsiCo, Inc. | | | 84,629 | |
| | 923 | | | Philip Morris International, Inc. | | | 72,404 | |
| | 1,191 | | | Unilever N.V. Class NY ADR | | | 40,918 | |
| | | | | | | | 225,494 | |
| | | | | Health Care Equipment & Services - 3.1% | | | | |
| | 1,186 | | | Cardinal Health, Inc. | | | 48,143 | |
| | 1,863 | | | Medtronic, Inc. | | | 71,245 | |
| | 458 | | | UnitedHealth Group, Inc. | | | 23,196 | |
| | | | | | | | 142,584 | |
| | | | | Household & Personal Products - 1.7% | | | | |
| | 1,150 | | | Procter & Gamble Co. | | | 76,730 | |
| | | | | | | | | |
| | | | | Insurance - 5.1% | | | | |
| | 899 | | | ACE Ltd. | | | 63,038 | |
| | 541 | | | Chubb Corp. | | | 37,434 | |
| | 303 | | | Marsh & McLennan Cos., Inc. | | | 9,584 | |
| | 1,582 | | | MetLife, Inc. | | | 49,318 | |
| | 1,103 | | | Principal Financial Group, Inc. | | | 27,134 | |
| | 852 | | | Prudential Financial, Inc. | | | 42,722 | |
| | | | | | | | 229,230 | |
| | | | | Materials - 2.7% | | | | |
| | 324 | | | Agrium U.S., Inc. | | | 21,737 | |
| | 864 | | | Barrick Gold Corp. | | | 39,105 | |
| | 2,063 | | | Dow Chemical Co. | | | 59,341 | |
| | | | | | | | 120,183 | |
| | | | | Media - 4.4% | | | | |
| | 3,669 | | | Comcast Corp. Class A | | | 87,003 | |
| | 466 | | | Omnicom Group, Inc. | | | 20,779 | |
| | 1,112 | | | Time Warner, Inc. | | | 40,190 | |
| | 1,352 | | | Walt Disney Co. | | | 50,704 | |
| | | | | | | | 198,676 | |
| | | | | Pharmaceuticals, Biotechnology & Life Sciences - 12.0% | | | | |
| | 303 | | | Amgen, Inc. | | | 19,468 | |
| | 864 | | | AstraZeneca plc ADR | | | 39,981 | |
| | 949 | | | Bristol-Myers Squibb Co. | | | 33,436 | |
| | 2,303 | | | Eli Lilly & Co. | | | 95,717 | |
| | 1,384 | | | Johnson & Johnson | | | 90,789 | |
| | 2,941 | | | Merck & Co., Inc. | | | 110,861 | |
| | 5,635 | | | Pfizer, Inc. | | | 121,932 | |
| | 701 | | | Teva Pharmaceutical Industries Ltd. ADR | | | 28,308 | |
| | | | | | | | 540,492 | |
| | | | | Retailing - 3.2% | | | | |
| | 491 | | | J.C. Penney Co., Inc. | | | 17,255 | |
| | 2,352 | | | Lowe's Co., Inc. | | | 59,681 | |
| | 1,361 | | | Staples, Inc. | | | 18,910 | |
| | 935 | | | Target Corp. | | | 47,886 | |
| | | | | | | | 143,732 | |
| | | | | Semiconductors & Semiconductor Equipment - 3.0% | | | | |
| | 479 | | | Analog Devices, Inc. | | | 17,154 | |
| | 2,107 | | | Intel Corp. | | | 51,087 | |
| | 1,352 | | | Taiwan Semiconductor Manufacturing Co., Ltd. ADR | | | 17,455 | |
| | 1,735 | | | Texas Instruments, Inc. | | | 50,512 | |
| | | | | | | | 136,208 | |
| | | | | Software & Services - 7.9% | | | | |
| | 701 | | | Accenture plc | | | 37,294 | |
| | 869 | | | Automatic Data Processing, Inc. | | | 46,924 | |
| | 1,424 | | | eBay, Inc. ● | | | 43,193 | |
| | 605 | | | IBM Corp. | | | 111,266 | |
| | 4,145 | | | Microsoft Corp. | | | 107,609 | |
| | 354 | | | Oracle Corp. | | | 9,071 | |
| | | | | | | | 355,357 | |
| | | | | Technology Hardware & Equipment - 2.8% | | | | |
| | 886 | | | Avnet, Inc. ● | | | 27,530 | |
| | 2,893 | | | Cisco Systems, Inc. | | | 52,307 | |
| | 832 | | | Qualcomm, Inc. | | | 45,489 | |
| | | | | | | | 125,326 | |
The accompanying notes are an integral part of these financial statements.
| Hartford Dividend and Growth HLS Fund |
| Schedule of Investments — (continued) |
| December 31, 2011 |
| (000’s Omitted) |
| Shares or Principal Amount | | Market Value ╪ | |
| COMMON STOCKS - 98.3% - (continued) | |
| | | | | Telecommunication Services - 3.8% | | | | |
| | 5,654 | | | AT&T, Inc. | | $ | 170,976 | |
| | | | | | | | | |
| | | | | Transportation - 2.4% | | | | |
| | 546 | | | FedEx Corp. | | | 45,588 | |
| | 872 | | | United Parcel Service, Inc. Class B | | | 63,851 | |
| | | | | | | | 109,439 | |
| | | | | Utilities - 5.1% | | | | |
| | 1,026 | | | Dominion Resources, Inc. | | | 54,465 | |
| | 993 | | | Exelon Corp. | | | 43,085 | |
| | 884 | | | NextEra Energy, Inc. | | | 53,824 | |
| | 1,103 | | | PG&E Corp. | | | 45,453 | |
| | 1,265 | | | Xcel Energy, Inc. | | | 34,954 | |
| | | | | | | | 231,781 | |
| | | | | Total common stocks | | | | |
| | | | | (cost $3,895,296) | | $ | 4,435,616 | |
| | | | | | | | | |
| | | | | Total long-term investments | | | | |
| | | | | (cost $3,895,296) | | $ | 4,435,616 | |
| |
| SHORT-TERM INVESTMENTS - 1.5% |
| Repurchase Agreements - 1.5% |
| | | | | Bank of America Merrill Lynch TriParty | | | | | | | | |
| | | | | Joint Repurchase Agreement (maturing on | | | | | | | | |
| | | | | 01/03/2012 in the amount of $25,627, | | | | | | | | |
| | | | | collateralized by GNMA 4.50%, 2041, | | | | | | | | |
| | | | | value of $26,139) | | | | | | | | |
| $ | 25,627 | | | 0.04%, 12/30/2011 | | | | | | $ | 25,627 | |
| | | | | Barclays Capital TriParty Joint Repurchase | | | | | | | | |
| | | | | Agreement (maturing on 01/03/2012 in the | | | | | | | | |
| | | | | amount of $2,129, collateralized by U.S. | | | | | | | | |
| | | | | Treasury Bond 5.38%, 2031, value of | | | | | | | | |
| | | | | $2,172) | | | | | | | | |
| | 2,129 | | | 0.01%, 12/30/2011 | | | | | | | 2,129 | |
| | | | | Deutsche Bank Securities TriParty Joint | | | | | | | | |
| | | | | Repurchase Agreement (maturing on | | | | | | | | |
| | | | | 01/03/2012 in the amount of $28,426, | | | | | | | | |
| | | | | collateralized by GNMA 3.50% - 7.00%, | | | | | | | | |
| | | | | 2035 - 2046, value of $28,994) | | | | | | | | |
| | 28,426 | | | 0.06%, 12/30/2011 | | | | | | | 28,426 | |
| | | | | UBS Securities, Inc. Joint Repurchase | | | | | | | | |
| | | | | Agreement (maturing on 01/03/2012 in the | | | | | | | | |
| | | | | amount of $216, collateralized by U.S. | | | | | | | | |
| | | | | Treasury Note 2.75%, 2016, value of $221) | | | | | | | | |
| | 215 | | | 0.01%, 12/30/2011 | | | | | | | 215 | |
| | | | | UBS Securities, Inc. TriParty Joint | | | | | | | | |
| | | | | Repurchase Agreement (maturing on | | | | | | | | |
| | | | | 01/03/2012 in the amount of $11,000, | | | | | | | | |
| | | | | collateralized by FNMA 3.00% - 6.50%, | | | | | | | | |
| | | | | 2021 - 2041, value of $11,220) | | | | | | | | |
| | 11,000 | | | 0.04%, 12/30/2011 | | | | | | | 11,000 | |
| | | | | | | | | | | | 67,397 | |
| | | | | Total short-term investments | | | | | | | | |
| | | | | (cost $67,397) | | | | | | $ | 67,397 | |
| | | | | | | | | | | | | |
| | | | | Total investments | | | | | | | | |
| | | | | (cost $3,962,693) ▲ | | | 99.8 | % | | $ | 4,503,013 | |
| | | | | Other assets and liabilities | | | 0.2 | % | | | 7,063 | |
| | | | | Total net assets | | | 100.0 | % | | $ | 4,510,076 | |
The accompanying notes are an integral part of these financial statements.
| Note: | Percentage of investments as shown is the ratio of the total market value to total net assets. Market value of long-term investments in foreign securities represents 7.8% of total net assets at December 31, 2011. |
| | |
| | Prices of foreign equities that are principally traded on certain foreign markets may be adjusted daily pursuant to a fair value pricing service approved by the Board of Directors in order to reflect an adjustment for factors occurring after the close of certain foreign markets but before the close of the New York Stock Exchange. |
| | |
| ▲ | At December 31, 2011, the cost of securities for federal income tax purposes was $3,974,340 and the aggregate gross unrealized appreciation and depreciation based on that cost were: |
| | Unrealized Appreciation | | $ | 713,694 | |
| | Unrealized Depreciation | | | (185,021 | ) |
| | Net Unrealized Appreciation | | $ | 528,673 | |
| ● | Non-income producing. |
| | |
| ╪ | See Significant Accounting Policies of accompanying Notes to Financial Statements regarding valuation of securities. |
The accompanying notes are an integral part of these financial statements.
| Hartford Dividend and Growth HLS Fund |
| Investment Valuation Hierarchy Level Summary |
| December 31, 2011 |
| (000’s Omitted) |
| | | Total | | | Level 1 ♦ | | | Level 2 ♦ | | | Level 3 | |
| Assets: | | | | | | | | | | | | | | | | |
| Common Stocks ‡ | | $ | 4,435,616 | | | $ | 4,435,616 | | | $ | – | | | $ | – | |
| Short-Term Investments | | | 67,397 | | | | – | | | | 67,397 | | | | – | |
| Total | | $ | 4,503,013 | | | $ | 4,435,616 | | | $ | 67,397 | | | $ | – | |
| ♦ | For the year ended December 31, 2011, there were no significant transfers between Level 1 and Level 2. |
| ‡ | The Fund has all or primarily all of the equity securities categorized in a particular level. Refer to the Schedule of Investments for further industry breakout. |
The accompanying notes are an integral part of these financial statements.
| Hartford Dividend and Growth HLS Fund |
| Statement of Assets and Liabilities |
| December 31, 2011 |
| (000’s Omitted) |
| Assets: | | | | |
| Investments in securities, at market value (cost $3,962,693) | | $ | 4,503,013 | |
| Receivables: | | | | |
| Investment securities sold | | | 6,227 | |
| Fund shares sold | | | 3,709 | |
| Dividends and interest | | | 9,169 | |
| Total assets | | | 4,522,118 | |
| Liabilities: | | | | |
| Bank overdraft | | | 1 | |
| Payables: | | | | |
| Investment securities purchased | | | 9,013 | |
| Fund shares redeemed | | | 2,165 | |
| Investment management fees | | | 638 | |
| Distribution fees | | | 37 | |
| Accrued expenses | | | 188 | |
| Total liabilities | | | 12,042 | |
| Net assets | | $ | 4,510,076 | |
| Summary of Net Assets: | | | | |
| Capital stock and paid-in-capital | | $ | 4,117,907 | |
| Undistributed net investment income | | | 4,050 | |
| Accumulated net realized loss | | | (152,201 | ) |
| Unrealized appreciation of investments | | | 540,320 | |
| Net assets | | $ | 4,510,076 | |
| Shares authorized | | | 4,000,000 | |
| Par value | | $ | 0.001 | |
| Class IA: Net asset value per share | | $ | 19.34 | |
| Shares outstanding | | | 199,193 | |
| Net assets | | $ | 3,851,657 | |
| Class IB: Net asset value per share | | $ | 19.30 | |
| Shares outstanding | | | 34,122 | |
| Net assets | | $ | 658,419 | |
The accompanying notes are an integral part of these financial statements.
| Hartford Dividend and Growth HLS Fund |
| Statement of Operations |
| For the Year Ended December 31, 2011 |
| (000’s Omitted) |
| Investment Income: | | | | |
| Dividends | | $ | 129,893 | |
| Interest | | | 66 | |
| Less: Foreign tax withheld | | | (1,581 | ) |
| Total investment income, net | | | 128,378 | |
| | | | | |
| Expenses: | | | | |
| Investment management fees | | | 31,190 | |
| Transfer agent fees | | | 4 | |
| Distribution fees - Class IB | | | 1,766 | |
| Custodian fees | | | 6 | |
| Accounting services fees | | | 677 | |
| Board of Directors' fees | | | 115 | |
| Audit fees | | | 39 | |
| Other expenses | | | 540 | |
| Total expenses (before fees paid indirectly) | | | 34,337 | |
| Commission recapture | | | (56 | ) |
| Total fees paid indirectly | | | (56 | ) |
| Total expenses, net | | | 34,281 | |
| Net investment income | | | 94,097 | |
| | | | | |
| Net Realized Gain on Investments and Foreign Currency Transactions: | | | | |
| Net realized gain on investments | | | 294,693 | |
| Net realized loss on foreign currency contracts | | | (2 | ) |
| Net realized gain on other foreign currency transactions | | | 11 | |
| Net Realized Gain on Investments and Foreign Currency Transactions | | | 294,702 | |
| | | | | |
| Net Changes in Unrealized Depreciation of Investments and Foreign Currency Transactions: | | | | |
| Net unrealized depreciation of investments | | | (319,890 | ) |
| Net unrealized appreciation on translation of other assets and liabilities in foreign currencies | | | — | |
| Net Changes in Unrealized Depreciation of Investments and Foreign Currency Transactions | | | (319,890 | ) |
| Net Loss on Investments and Foreign Currency Transactions | | | (25,188 | ) |
| Net Increase in Net Assets Resulting from Operations | | $ | 68,909 | |
The accompanying notes are an integral part of these financial statements.
| Hartford Dividend and Growth HLS Fund |
| Statement of Changes in Net Assets |
| |
| (000’s Omitted) |
| | | For the
Year Ended
December 31,
2011 | | | For the
Year Ended
December 31,
2010 | |
| Operations: | | | | | | |
| Net investment income | | $ | 94,097 | | | $ | 90,685 | |
| Net realized gain on investments and foreign currency transactions | | | 294,702 | | | | 249,163 | |
| Net unrealized appreciation (depreciation) of investments | | | (319,890 | ) | | | 273,658 | |
| Net Increase In Net Assets Resulting From Operations | | | 68,909 | | | | 613,506 | |
| Distributions to Shareholders: | | | | | | | | |
| From net investment income | | | | | | | | |
| Class IA | | | (81,230 | ) | | | (80,337 | ) |
| Class IB | | | (12,208 | ) | | | (12,013 | ) |
| Total distributions | | | (93,438 | ) | | | (92,350 | ) |
| Capital Share Transactions: | | | | | | | | |
| Class IA | | | | | | | | |
| Sold | | | 192,919 | | | | 305,845 | |
| Issued on reinvestment of distributions | | | 81,230 | | | | 80,337 | |
| Redeemed | | | (811,468 | ) | | | (667,069 | ) |
| Total capital share transactions | | | (537,319 | ) | | | (280,887 | ) |
| Class IB | | | | | | | | |
| Sold | | | 91,132 | | | | 64,250 | |
| Issued on reinvestment of distributions | | | 12,208 | | | | 12,013 | |
| Redeemed | | | (197,204 | ) | | | (213,527 | ) |
| Total capital share transactions | | | (93,864 | ) | | | (137,264 | ) |
| Net decrease from capital share transactions | | | (631,183 | ) | | | (418,151 | ) |
| Net Increase (Decrease) In Net Assets | | | (655,712 | ) | | | 103,005 | |
| Net Assets: | | | | | | | | |
| Beginning of period | | | 5,165,788 | | | | 5,062,783 | |
| End of period | | $ | 4,510,076 | | | $ | 5,165,788 | |
| Undistributed (distribution in excess of) net investment income | | $ | 4,050 | | | $ | 3,438 | |
| Shares: | | | | | | | | |
| Class IA | | | | | | | | |
| Sold | | | 9,736 | | | | 17,167 | |
| Issued on reinvestment of distributions | | | 4,240 | | | | 4,216 | |
| Redeemed | | | (40,935 | ) | | | (37,226 | ) |
| Total share activity | | | (26,959 | ) | | | (15,843 | ) |
| Class IB | | | | | | | | |
| Sold | | | 4,600 | | | | 3,574 | |
| Issued on reinvestment of distributions | | | 639 | | | | 632 | |
| Redeemed | | | (9,974 | ) | | | (11,938 | ) |
| Total share activity | | | (4,735 | ) | | | (7,732 | ) |
The accompanying notes are an integral part of these financial statements.
| Hartford Dividend and Growth HLS Fund |
| Notes to Financial Statements |
| December 31, 2011 |
| (000’s Omitted) |
| 1. | Organization: |
| | |
| | Hartford Dividend and Growth HLS Fund (the “Fund”) serves as an underlying investment option for certain variable annuity and variable life insurance separate accounts of Hartford Life Insurance Company (“HLIC”) and its affiliates and certain qualified retirement plans. The Fund may also serve as an underlying investment option for certain variable annuity and variable life separate accounts of other insurance companies. Owners of variable annuity contracts and policyholders of variable life insurance contracts may choose the funds permitted in the variable insurance contract prospectus. In addition, participants in certain qualified retirement plans may choose the Fund if permitted by their plans. |
| | |
| | Hartford Series Fund, Inc. (the “Company”) is an open-end registered management investment company comprised of thirty portfolios. Financial Statements for the Fund, a series of the Company, are included in this report. |
| | |
| | The Company is organized under the laws of the State of Maryland and is registered with the Securities and Exchange Commission (“SEC”) under the Investment Company Act of 1940, as amended (“1940 Act”). The Fund is a diversified open-end management investment company. |
| | |
| | The Fund is divided into Class IA and Class IB shares. Each class is offered at the per share net asset value (“NAV”) without a sales charge and is subject to the same expenses, except that the Class IB shares are subject to distribution and service fees charged pursuant to a Distribution Plan adopted in accordance with Rule 12b-1 under the 1940 Act. |
| | |
| 2. | Significant Accounting Policies: |
| | |
| | The following is a summary of significant accounting policies of the Fund in the preparation of its financial statements, which are in accordance with the United States Generally Accepted Accounting Principles (“U.S. GAAP”). The preparation of financial statements in accordance with U.S. GAAP may require management to make estimates and assumptions that affect the reported amounts of assets and liabilities and disclosure of contingent assets and liabilities at the date of the financial statements and the reported amounts of increases and decreases in net assets from operations during the reporting period. Actual results could differ from those estimates. |
| | | |
| | a) | Determination of Net Asset Value – The NAV of each class of the Fund’s shares is determined as of the close of regular trading (normally 4:00 p.m. Eastern Time) (the “NYSE Close”) on each day that the New York Stock Exchange (the “Exchange”) is open (“Valuation Date”). Information that becomes known to the Fund after the NAV has been calculated on a particular day will not generally be used to retroactively adjust the NAV determined earlier that day. |
| | | |
| | b) | Investment Valuation and Fair Value Measurements – For purposes of calculating the NAV, portfolio securities and other assets held by the Fund's portfolio for which market quotes are readily available are valued at market value. Market value is generally determined on the basis of last reported sales prices or official close price. If no sales are reported, market value is based on quotes obtained from a quotation reporting system, established market makers, or independent pricing services. If market prices are not readily available or are deemed unreliable, the Fund will use the fair value of the security as determined in good faith under policies and procedures established by and under the supervision of the Company’s Board of Directors. Market quotes are considered not readily available where there is an absence of current or reliable market-based data (e.g., trade information or broker quotes), including where events occur after the close of the relevant market, but prior to the NYSE Close that materially affect the values of the Fund’s portfolio securities or assets. In addition, market quotes are considered not readily available when, due to extraordinary circumstances, the exchanges or markets on which the securities trade do not open for trading for the entire day and no other market prices are available. In addition, prices of foreign equities that are principally traded on certain foreign markets are adjusted daily pursuant to a fair value pricing service approved by the Board of Directors in order to reflect an adjustment for the factors occurring after the close of certain foreign markets but before the NYSE Close. Securities |
| | | that are primarily traded on foreign markets may trade on days that are not business days of the Fund. The value of the foreign securities in which the Fund invests may change on days when a shareholder will not be able to purchase or redeem shares of the Fund. Fair value pricing is subjective in nature and the use of fair value pricing by the Fund may cause the NAV of its shares to differ significantly from the NAV that would have been calculated using market prices at the close of the exchange on which a portfolio security is primarily traded. There can be no assurance that the Fund could obtain the fair market value assigned to a security if the Fund were to sell the security at approximately the time at which the Fund determines its NAV. |
| | | |
| | | Investments valued in currencies other than U.S. dollars are converted to U.S. dollars using exchange rates obtained from independent pricing services for calculation of the NAV. As a result, the NAV of the Fund’s shares may be affected by changes in the value of currencies in relation to the U.S. dollar. The value of securities traded in markets outside the United States or denominated in currencies other than the U.S. dollar may be affected significantly on a day that the NYSE is closed and the market value may change on days when an investor is not able to purchase, redeem or exchange shares of the Fund. |
| | | |
| | | Foreign currency contracts represent agreements to exchange currencies on specific future dates at predetermined rates. Foreign currency contracts are valued using foreign currency exchange rates and forward rates as provided by an independent pricing service on the Valuation Date. |
| | | |
| | | Financial instruments for which prices are not available from an independent pricing service may be valued using market quotations obtained from one or more dealers that make markets in the respective financial instrument in accordance with procedures established by the Company’s Board of Directors. |
| | | |
| | | U.S. GAAP defines fair value as the price that the Fund would receive to sell an asset or pay to transfer a liability in an orderly transaction between market participants. The U.S. GAAP fair value measurement standards require disclosure of a fair value hierarchy for each major category of assets and liabilities. Various inputs are used in determining the fair value of the Fund’s investments. These inputs are summarized into three broad hierarchy levels. This hierarchy is based on whether the valuation inputs are observable or unobservable. These levels are: |
| | • | Level 1 – Quoted prices in active markets for identical securities. Level 1 may include exchange traded instruments, such as domestic equities, some foreign equities, options, futures, mutual funds, exchange traded funds, rights and warrants. |
| | • | Level 2 – Observable inputs other than Level 1 prices, such as quoted prices for similar securities; quoted prices in markets that are not active; or other inputs that are observable or can be corroborated by observable market data. Level 2 may include debt securities that are traded less frequently than exchange traded instruments and which are valued using independent pricing services; foreign equities, that are principally traded on certain foreign markets and are adjusted daily pursuant to a fair value pricing service in order to reflect an adjustment for the factors occurring after the close of certain foreign markets but before the NYSE Close; and short-term securities, which are valued at amortized cost. |
| | • | Level 3 – Significant unobservable inputs that are supported by limited or no market activity. Level 3 may include financial instruments whose values are determined using broker quotes or require significant management judgment or estimation. These unobservable valuation inputs may include estimates for current yields, maturity/duration, prepayment speed, and broker quotes for comparable securities along with other assumptions relating to credit quality, collateral value, complexity of the security structure, general market conditions and liquidity. This category may include securities where trading has been halted or there are certain restrictions on trading. While these securities are priced using unobservable inputs, the valuation of these securities reflects the best available data and management believes the prices are a reasonable representation of exit price. |
| Hartford Dividend and Growth HLS Fund |
| Notes to Financial Statements – (continued) |
| December 31, 2011 |
| (000’s Omitted) |
| | | Valuation levels are not necessarily indicative of the risk associated with investing in such securities. Individual securities within any of the above mentioned asset classes may be assigned a different hierarchical level than those presented above, as individual circumstances dictate. |
| | | |
| | | During the year ended December 31, 2011, the Fund held no Level 3 securities; therefore, no reconciliation of Level 3 securities is presented. |
| | | |
| | | For additional information, refer to the Investment Valuation Hierarchy Level Summary which follows the Schedule of Investments. |
| | | |
| | | For purposes of reporting transfers between different hierarchy levels, both transfers in and out of each level, as applicable, are shown as if they occurred at the beginning of the period. |
| | | |
| | c) | Security Transactions and Investment Income – Security transactions are recorded as of the trade date (the date the order to buy or sell is executed) for financial reporting purposes. Securities purchased or sold on a when-issued or delayed-delivery basis may be settled a month or more after the trade date. Realized gains and losses are determined on the basis of identified cost. |
| | | |
| | | Dividend income is accrued as of the ex-dividend date, except certain dividends from foreign securities where the ex-dividend date may have passed are recorded as soon as the Fund is informed of the dividend. Interest income, including amortization of premium and accretion of discounts, is accrued on a daily basis. |
| | | |
| | d) | Foreign Currency Transactions – Assets and liabilities denominated in currencies other than U.S. dollars are translated into U.S. dollars at the exchange rates in effect on the valuation date. Purchases and sales of investment securities, income, and expenses are translated into U.S. dollars at the exchange rates on the dates of such transactions. |
| | | |
| | | The Fund does not isolate that portion of portfolio security valuation resulting from fluctuations in the foreign currency exchange rates from the fluctuations arising from changes in the market prices of securities held. Exchange rate fluctuations are included with the net realized and unrealized gain or loss on investments in the accompanying financial statements. |
| | | |
| | | Net realized foreign exchange gains or losses arise from sales of foreign currencies and the difference between asset and liability amounts initially stated in foreign currencies and the U.S. dollar value of the amounts actually received or paid. Net unrealized foreign exchange gains or losses arise from changes in the value of other assets and liabilities at the end of the reporting period, resulting from changes in the exchange rates. |
| | | |
| | e) | Joint Trading Account – The Fund may invest cash balances into a joint trading account that may be invested in one or more repurchase agreements. |
| | | |
| | f) | Fund Share Valuation and Dividend Distributions to Shareholders – Orders for the Fund’s shares are executed in accordance with the investment instructions of the contract holders and plan participants. The NAV of the Fund’s shares is determined as of the close of business on each business day of the Exchange. The NAV is determined separately for each class of shares of the Fund by dividing the Fund’s net assets attributable to that class by the number of shares of the class outstanding. Each class of shares offered by the Fund has equal rights as to assets and voting privileges (except that shareholders of a class have exclusive voting rights regarding any matter relating solely to that class of shares). Income and non-class specific expenses are allocated daily to each class on the basis of the relative net assets of the class. Realized and unrealized capital gains and losses are allocated daily based on the relative net assets of each class of shares of the Fund. |
| | | Orders for the purchase of the Fund’s shares received prior to the close of the Exchange on any day the Exchange is open for business are priced at the NAV determined as of the close of the Exchange. Orders received after the close of the Exchange, or on a day on which the Exchange and/or the Fund is not open for business, are priced at the next determined NAV. |
| | | |
| | | Dividends are declared pursuant to a policy adopted by the Company’s Board of Directors based upon the investment performance of the Fund. The policy of the Fund is to pay dividends from net investment income and realized capital gains, if any, at least once a year. |
| | | |
| | | Distributions from net investment income, net realized capital gains and capital are determined in accordance with federal income tax regulations, which may differ from U.S. GAAP with respect to character and timing. These differences may include but are not limited to losses deferred due to wash sale adjustments, foreign currency gains and losses, adjustments related to Passive Foreign Investment Companies (“PFICs”), Real Estate Investment Trusts (“REITs”), Regulated Investment Companies (“RICs”), certain derivatives and partnerships. Permanent book and federal income tax basis differences relating to shareholder distributions will result in reclassifications to certain of the Fund’s capital accounts (see Federal Income Taxes: Reclassification of Capital Accounts note). |
| | | |
| 3. | Securities and Other Investments: |
| | | |
| | a) | Repurchase Agreements – A repurchase agreement is an agreement by which a counterparty agrees to sell a security and agrees to repurchase the security sold at a mutually agreed upon time and price. At the time the Fund enters into a repurchase agreement, the value of the underlying collateral security(ies), including accrued interest, will be equal to or exceed the value of the repurchase agreement. Repurchase agreements expose the Fund to counterparty risk. To minimize counterparty risk, the securities that serve to collateralize the repurchase agreement are held by the Fund's custodian in book entry or physical form in the custodial account of the Fund or in a third party custodial account. Repurchase agreements are valued at cost plus accrued interest. The Fund, as shown on the Schedule of Investments, had outstanding repurchase agreements as of December 31, 2011. |
| | | |
| 4. | Financial Derivative Instruments: |
| | | |
| | | The following disclosures contain information on how and why the Fund uses derivative instruments, the credit-risk-related contingent features in certain derivative instruments, and how derivative instruments affect the Fund’s financial position and results of operations. The location and fair value amounts of these instruments on the Statement of Assets and Liabilities and the realized gains and losses and changes in unrealized gains and losses on the Statement of Operations, each categorized by type of derivative contract, are included in the following Additional Derivative Instrument Information footnote. The derivative instruments outstanding as of period-end are disclosed in the notes to the Schedule of Investments and the amounts of realized gains and losses and changes in unrealized gains and losses on derivative instruments during the period are disclosed in the Statement of Operations. |
| | | |
| | a) | Foreign Currency Contracts – The Fund may enter into foreign currency contracts that obligate the Fund to purchase or sell currencies at specified future dates. Foreign currency contracts are used to hedge the currency exposure associated with some or all of the Fund's securities and/or as part of an investment strategy. Foreign currency contracts are marked to market daily and the change in value is recorded by the Fund as an unrealized gain or loss. The Fund will record a realized gain or loss when the foreign currency contract is settled. |
| | | |
| | | Foreign currency contracts involve elements of market risk in excess of the amounts reflected in the Statement of Assets and Liabilities. In addition, risks may arise upon entering into these contracts from the potential inability of the counterparties to meet the terms of the contracts and from unanticipated movements in the value of the foreign currencies relative to the U.S. dollar. The Fund had no outstanding foreign currency contracts as of December 31, 2011. |
| Hartford Dividend and Growth HLS Fund |
| Notes to Financial Statements – (continued) |
| December 31, 2011 |
| (000’s Omitted) |
| b) | Additional Derivative Instrument Information: |
The volume of derivative activity was minimal during the year ended December 31, 2011.
The Effect of Derivative Instruments on the Statement of Operations for the year ended December 31, 2011:
| | | Risk Exposure Category | |
| | | Interest Rate Contracts | | | Foreign Exchange Contracts | | | Credit
Contracts | | | Equity
Contracts | | | Commodity Contracts | | | Other
Contracts | | | Total | |
| Realized Gain (Loss) on Derivatives Recognized as a Result of Operations: | | | | | | | | | | | | | |
| Net realized loss on foreign currency contracts | | $ | — | | | $ | (2 | ) | | $ | — | | | $ | — | | | $ | — | | | $ | — | | | $ | (2 | ) |
| Total | | $ | — | | | $ | (2 | ) | | $ | — | | | $ | — | | | $ | — | | | $ | — | | | $ | (2 | ) |
| a) | Counterparty Risk – The Fund may be exposed to counterparty risk, or the risk that an institution or other entity with which the Fund has unsettled or open transactions will default. |
| b) | Market Risks – If the Fund invests directly in foreign currencies or in securities that trade in, and receive revenues in, foreign currencies, or in derivatives that provide exposure to foreign currencies, it will be subject to the risk that those currencies will decline in value relative to the base currency of the Fund, or, in the case of hedging positions, that the Fund’s base currency will decline in value relative to the currency being hedged. Currency rates in foreign countries may fluctuate significantly over short periods of time for a number of reasons, including changes in interest rates, intervention (or the failure to intervene) by U.S. or foreign governments, central banks or supranational entities, such as the International Monetary Fund, or by the imposition of currency controls or other political developments in the United States or abroad. As a result, the Fund’s investments in foreign currency denominated securities may reduce the returns of the Fund. The market values of equity securities, such as common stocks and preferred stocks, or equity related investments, such as futures and options, may decline due to general market conditions which are not specifically related to a particular company, such as real or perceived adverse economic conditions, changes in the general outlook for corporate earnings, changes in interest or currency rates or adverse investor sentiment generally. The market value of equity securities may also decline due to factors which affect a particular industry or industries, such as labor shortages or increased production costs and competitive conditions within an industry. Equity securities and equity related investments generally have greater market price volatility than fixed income securities. |
| a) | Federal Income Taxes – For federal income tax purposes, the Fund intends to continue to qualify as a RIC under Subchapter M of the Internal Revenue Code (“IRC”) by distributing substantially all of its taxable net investment income and net realized capital gains to its shareholders and otherwise complying with the requirements of RICs. The Fund has distributed substantially all of its income and capital gains in prior years, if applicable, and intends to distribute substantially all of its income and capital gains prior to the next fiscal year-end. Accordingly, no provision for federal income or excise taxes has been made in the accompanying financial statements. Distributions from short-term capital gains are treated as ordinary income distributions for federal income tax purposes. |
| b) | Net Investment Income (Loss), Net Realized Gains (Losses) – Net investment income (loss) and net realized gains (losses) may differ for financial statement and tax purposes primarily because of losses deferred due to wash sale adjustments, foreign currency gains and losses, adjustments related to PFICs, REITs, RICs, certain derivatives and partnerships. The character of distributions made during the year from net investment income or net realized gains may differ from their ultimate characterization for federal income tax purposes. Also, due to the timing of dividend |
distributions, the fiscal year in which amounts are distributed may differ from the year that the income or realized gains (losses) were recorded by the Fund.
| c) | Distributions and Components of Distributable Earnings – The tax character of distributions paid by the Fund for the periods indicated is as follows (as adjusted for dividends payable): |
| | | | For the Year Ended
December 31, 2011 | | | | For the Year Ended
December 31, 2010 | |
| Ordinary Income | | $ | 93,438 | | | $ | 92,350 | |
As of December 31, 2011, the Fund’s components of distributable earnings (deficit) on a tax basis were as follows:
| | | Amount | |
| Undistributed Ordinary Income | | $ | 4,050 | |
| Accumulated Capital and Other Losses* | | | (140,554 | ) |
| Unrealized Appreciation† | | | 528,673 | |
| Total Accumulated Earnings | | $ | 392,169 | |
| | * | The Fund has capital loss carryforwards that are identified in the Capital Loss Carryforward note that follows. |
| | † | The difference between book-basis and tax-basis unrealized appreciation (depreciation) may be attributable to the losses deferred due to wash sale adjustments, foreign currency gains and losses, adjustments related to PFICs, REITs, RICs, certain derivatives and partnerships. |
| d) | Reclassification of Capital Accounts – The Fund may record reclassifications in its capital accounts. These reclassifications have no impact on the total net assets of the Fund. The reclassifications are a result of permanent differences between U.S. GAAP and tax accounting for such items as foreign currency, PFICs, expiration or utilization of capital loss carryforwards or net operating losses. Adjustments are made to reflect the impact these items have on current and future distributions to shareholders. Therefore, the source of the Fund’s distributions may be shown in the accompanying Statement of Changes in Net Assets as from undistributed net investment income, from accumulated net realized gains on investments or from capital depending on the type of book and tax differences that exist. For the year ended December 31, 2011, the Fund recorded reclassifications to increase (decrease) the accounts listed below: |
| | | Amount | |
| Undistributed Net Investment Income | | $ | (47 | ) |
| Accumulated Net Realized Gain (Loss) | | | 47 | |
| e) | Capital Loss Carryforward – On December 22, 2010, the Regulated Investment Company Modernization Act of 2010 (the “Act”) was enacted, which made changes to the capital loss carryforward rules. The changes are effective for taxable years beginning after the date of enactment. Under the Act, funds are permitted to carry forward capital losses for an unlimited period. However, any losses incurred during those future taxable years will be required to be utilized prior to the losses incurred in pre-enactment taxable years, which carry an expiration date. As a result of this ordering rule, pre-enactment capital loss carryforwards may be more likely to expire unused. Additionally, post-enactment capital loss carryforwards will retain their character as either short-term or long-term capital losses rather than being considered all short-term as permitted under prior regulation. |
| Hartford Dividend and Growth HLS Fund |
| Notes to Financial Statements – (continued) |
| December 31, 2011 |
| (000’s Omitted) |
At December 31, 2011 (tax-year-end), the Fund had capital loss carryforwards for U.S. federal income tax purposes of approximately:
| Year of Expiration | | Amount | |
| 2017 | | $ | 140,554 | |
| Total | | $ | 140,554 | |
As of December 31, 2011, the Fund utilized $294,671 of prior year capital loss carryforwards.
| f) | Accounting for Uncertainty in Income Taxes – The Fund has adopted financial reporting rules that require the Fund to analyze all open tax years, as defined by the statute of limitations, for all major jurisdictions. Generally, tax authorities can examine all tax returns filed for the last three years. The Fund does not have an examination in progress. |
The Fund has reviewed all open tax years and major jurisdictions and concluded that these financial reporting rules had no effect on the Fund’s financial position or results of operations. There is no tax liability resulting from unrecognized tax benefits relating to uncertain income tax positions taken or expected to be taken on the tax return for the fiscal year ended December 31, 2011. The Fund is also not aware of any tax positions for which it is reasonably possible that the total amounts of unrecognized tax benefits will significantly change in the next twelve months.
| a) | Investment Management Agreement – HL Investment Advisors, LLC (“HL Advisors”), an indirect wholly owned subsidiary of The Hartford Financial Services Group, Inc. (“The Hartford”), serves as investment manager to the Fund pursuant to an Investment Management Agreement with the Company. As investment manager, HL Advisors has overall investment supervisory responsibility for the Fund. In addition, HL Advisors provides administrative personnel, services, equipment, facilities and office space for proper operation of the Fund. HL Advisors has contracted with Wellington Management Company, LLP (“Wellington Management”) under a sub-advisory agreement for the provision of day-to-day investment management services to the Fund in accordance with the Fund’s investment objective and policies. The Fund pays a fee to HL Advisors, a portion of which may be used to compensate Wellington Management. |
The schedule below reflects the rates of compensation paid to HL Advisors for investment management services rendered as of December 31, 2011; the rates are accrued daily and paid monthly.
| Average Daily Net Assets | | Annual Fee | |
| On first $250 million | | | 0.7750% | |
| On next $250 million | | | 0.7250% | |
| On next $500 million | | | 0.6750% | |
| On next $4 billion | | | 0.6250% | |
| On next $5 billion | | | 0.6225% | |
| Over $10 billion | | | 0.6200% | |
Effective March 1, 2012, HL Advisors will be paid compensation for investment management services according to the following schedule:
| Average Daily Net Assets | | Annual Fee | |
| On first $250 million | | | 0.7750% | |
| On next $250 million | | | 0.7250% | |
| On next $500 million | | | 0.6750% | |
| On next $1.5 billion | | | 0.6250% | |
| On next $2.5 billion | | | 0.6200% | |
| On next $5 billion | | | 0.6150% | |
| Over $10 billion | | | 0.6100% | |
| b) | Accounting Services Agreement – Pursuant to the Fund Accounting Agreement between HLIC and the Company, on behalf of the Fund, HLIC provides accounting services to the Fund and receives monthly compensation based on the Fund’s average daily net assets at the rates set forth below. The Fund’s accounting services fees are accrued daily and paid monthly. |
| Average Daily Net Assets | | Annual Fee | |
| On first $5 billion | | | 0.014% | |
| On next $5 billion | | | 0.012% | |
| Over $10 billion | | | 0.010% | |
Effective January 1, 2012, the accounting services fees based on the Fund’s average daily net assets were decreased. The new accounting services fees schedule is as follows:
| Average Daily Net Assets | | Annual Fee | |
| On first $5 billion | | | 0.012% | |
| Over $10 billion | | | 0.010% | |
| c) | Operating Expenses – Allocable expenses incurred by the Company are allocated to each Fund and allocated to classes within a Fund in proportion to the average daily net assets of the Fund and each class, except where allocation of certain expenses is more fairly made directly to the Fund or to specific classes within a Fund. |
| d) | Fees Paid Indirectly – The Company, on behalf of the Fund, has entered into agreements with State Street Global Markets, LLC and Russell Implementation Services, Inc. to partially recapture non-discounted trade commissions. Such rebates are used to pay a portion of the Fund’s expenses. In addition, the Fund’s custodian bank has also agreed to reduce its fees when the Fund maintains cash on deposit in a non-interest-bearing custody account. For the year ended December 31, 2011, these amounts, if any, are included in the Statement of Operations. |
The ratio of expenses to average net assets in the accompanying financial highlights excludes the reduction in expenses related to fees paid indirectly. The annualized expense ratio for the period listed below reflecting the reduction for fees paid indirectly is as follows:
| | | Year Ended
December 31, 2011 | |
| Class IA | | | 0.67 | % |
| Class IB | | | 0.92 | |
| Hartford Dividend and Growth HLS Fund |
| Notes to Financial Statements – (continued) |
| December 31, 2011 |
| (000’s Omitted) |
| e) | Distribution Plan for Class IB shares – The Company, on behalf of the Fund, has adopted a Distribution Plan pursuant to Rule 12b-1 of the 1940 Act to compensate the Distributor, Hartford Securities Distribution Company, Inc. (a wholly owned, ultimate subsidiary of The Hartford), from assets attributable to the Class IB shares for services rendered and expenses borne in connection with activities primarily intended to result in the sale of the Class IB shares, subject to the review and approval of the Company’s Board of Directors. |
The Distribution Plan provides that the Fund may pay annually up to 0.25% of the average daily net assets of the Fund attributable to its Class IB shares for activities primarily intended to result in the sale of Class IB shares. The Board has the authority to suspend or reduce these payments at any point in time. Under the terms of the Distribution Plan and the principal underwriting agreement, the Fund is authorized to make payments monthly to the Distributor that may be used to pay or compensate entities providing distribution and shareholder servicing with respect to the Class IB shares for such entities’ fees or expenses incurred or paid in that regard. These fees are accrued daily and paid monthly.
| f) | Other Related Party Transactions – Certain officers of the Fund are directors and/or officers of HL Advisors and/or The Hartford or its subsidiaries. For the year ended December 31, 2011, a portion of the Fund’s chief compliance officer’s salary was paid by all the investment companies in the Hartford fund complex. The portion allocated to the Fund was in the amount of $6. Hartford Administrative Services Company (“HASCO”), an indirect wholly owned subsidiary of The Hartford, provides transfer agent services to the Fund. HASCO was compensated on a per account basis for providing such services. The amount paid to HASCO can be found in the Statement of Operations. These fees are accrued daily and paid monthly. |
| g) | Payments from Affiliates – In July of 2007, The Hartford entered into a settlement with the Attorneys General of the states of New York, Connecticut and Illinois relating to market timing and the company's individual variable annuity contracts in which certain payments would be made directly to the variable annuity contract holders. The distribution plan provided that unclaimed money from the settlement would be distributed to certain HLS Funds that are investment options through a Hartford individual variable annuity contract. The unclaimed money was distributed to the Fund on September 18, 2009. |
The total return in the accompanying financial highlights includes a payment from an affiliate. Had the payment from the affiliate been excluded, the impact and total return for the period listed below would have been as follows:
| | | For the Year Ended December 31, 2009 | |
| | | Class IA | | | Class IB | |
| Impact from Payment from Affiliate for Attorneys General Settlement | | | —% | | | | —% | |
| Total Return Excluding Payment from Affiliate | | | 24.67 | | | | 24.36 | |
| 8. | Investment Transactions: |
For the year ended December 31, 2011, the Fund's aggregate purchases and sales of investment securities (excluding short-term investments) were as follows:
| | | Amount | |
| Cost of Purchases Excluding U.S. Government Obligations | | $ | 1,153,399 | |
| Sales Proceeds Excluding U.S. Government Obligations | | | 1,781,239 | |
The Fund is one of several Hartford funds that participate in a $500 million committed revolving line of credit facility. The facility is to be used for temporary or emergency purposes. Under the arrangement, the funds are required to own securities having a market value in excess of 300% of the total bank borrowings. The interest rate on borrowings varies depending on the nature of the loan. The facility also requires a fee to be paid based on the amount of the commitment. This commitment fee is allocated to all of the funds participating in the line of credit based on the average net assets of the funds. During the year ended December 31, 2011, the Fund did not have any borrowings under this facility.
| 10. | Industry Classifications: |
Other than the industry classifications “Other Investment Pools and Funds” and “Exchange Traded Funds,” equity industry classifications used in this report are the Global Industry Classification Standard, which was developed by and is the exclusive property and service mark of MSCI, Inc. and Standard & Poor’s.
Under the Company’s organizational documents, the Company shall indemnify its officers and directors to the full extent required or permitted under Maryland General Corporation Law and the federal securities laws. In addition, the Company, on behalf of the Fund, may enter into contracts that contain a variety of indemnifications. The Company’s maximum exposure under these arrangements is unknown. However, as of the date of these financial statements, the Company has not had prior claims or losses pursuant to these contracts and expects the risk of loss to be remote.
| Hartford Dividend and Growth HLS Fund |
Financial Highlights
| – Selected Per-Share Data (A) – |
| Class | | | Net Asset
Value at
Beginning of
Period | | | | Net Investment
Income (Loss) | | | | Payments from
(to) Affiliate | | | | Net Realized
and Unrealized
Gain (Loss) on
Investments | | | | Total from
Investment
Operations | | | | Dividends from
Net Investment
Income | | | | Distributions
from Realized
Capital Gains | | | | Distributions
from Capital | | | | Total
Distributions | | | | Net Increase
(Decrease) in
Net Asset
Value | | | | Net Asset
Value at End of
Period | |
| | | | | | | | | | | |
| For the Year Ended December 31, 2011 | | | | | | | | | | |
| IA | | $ | 19.50 | | | $ | 0.42 | | | $ | — | | | $ | (0.16) | | | $ | 0.26 | | | $ | (0.42) | | | $ | — | | | $ | — | | | $ | (0.42) | | | $ | (0.16) | | | $ | 19.34 | |
| IB | | | 19.46 | | | | 0.36 | | | | — | | | | (0.16) | | | | 0.20 | | | | (0.36) | | | | — | | | | — | | | | (0.36) | | | | (0.16) | | | | 19.30 | |
| | | | | | | | | | | | | | | |
| For the Year Ended December 31, 2010 | | | | | | | | | | | | | | |
| IA | | | 17.55 | | | | 0.35 | | | | — | | | | 1.96 | | | | 2.31 | | | | (0.36) | | | | — | | | | — | | | | (0.36) | | | | 1.95 | | | | 19.50 | |
| IB | | | 17.51 | | | | 0.32 | | | | — | | | | 1.94 | | | | 2.26 | | | | (0.31) | | | | — | | | | — | | | | (0.31) | | | | 1.95 | | | | 19.46 | |
| | | | | | | | | | | | | | | |
| For the Year Ended December 31, 2009 | | | | | | | | | | | | | | |
| IA | | | 14.37 | | | | 0.35 | | | | — | | | | 3.19 | | | | 3.54 | | | | (0.36) | | | | — | | | | — | | | | (0.36) | | | | 3.18 | | | | 17.55 | |
| IB | | | 14.34 | | | | 0.33 | | | | — | | | | 3.16 | | | | 3.49 | | | | (0.32) | | | | — | | | | — | | | | (0.32) | | | | 3.17 | | | | 17.51 | |
| | | | | | | | | | | | | | | |
| For the Year Ended December 31, 2008 | | | | | | | | | | | | | | |
| IA | | | 22.35 | | | | 0.44 | | | | — | | | | (7.57) | | | | (7.13) | | | | (0.44) | | | | (0.41) | | | | — | | | | (0.85) | | | | (7.98) | | | | 14.37 | |
| IB | | | 22.28 | | | | 0.42 | | | | — | | | | (7.56) | | | | (7.14) | | | | (0.39) | | | | (0.41) | | | | — | | | | (0.80) | | | | (7.94) | | | | 14.34 | |
| | | | | | | | | | | |
| For the Year Ended December 31, 2007 | | | | | | | | | | |
| IA | | | 22.79 | | | | 0.42 | | | | — | | | | 1.44 | | | | 1.86 | | | | (0.41) | | | | (1.89) | | | | — | | | | (2.30) | | | | (0.44) | | | | 22.35 | |
| IB | | | 22.72 | | | | 0.37 | | | | — | | | | 1.42 | | | | 1.79 | | | | (0.34) | | | | (1.89) | | | | — | | | | (2.23) | | | | (0.44) | | | | 22.28 | |
| (A) | Information presented relates to a share outstanding throughout the indicated period. |
| (B) | The figures do not include sales charges or other fees which may be applied at the variable life insurance, variable annuity or qualified retirement plan product level. Any such additional sales charges or other fees would lower the Fund's performance. |
| (C) | Ratios do not reflect reductions for fees paid indirectly. Please see Fees Paid Indirectly in the Notes to Financial Statements. |
| (D) | Portfolio turnover rate is calculated on the basis of the Fund as a whole without distinguishing between the classes of shares issued. |
| (E) | Total return without the inclusion of the Payment from (to) Affiliate can be found in Expenses in the accompanying Notes to Financial Statements. |
| – Ratios and Supplemental Data – |
| Total Return(B) | | | Net Assets at End of Period | | | Ratio of Expenses to Average Net
Assets Before Waivers(C) | | | Ratio of Expenses to Average Net
Assets After Waivers(C) | | | Ratio of Net Investment Income
(Loss) to Average Net Assets | | | Portfolio Turnover
Rate(D) | |
| | | | | | | | | | | | | | | | | | | | | | | |
| | | | | | | | | | | | | | | | | | | | | | | |
| | 1.32 | % | | $ | 3,851,657 | | | | 0.67 | % | | | 0.67 | % | | | 1.98 | % | | | 24 | % |
| | 1.06 | | | | 658,419 | | | | 0.92 | | | | 0.92 | | | | 1.73 | | | | — | |
| | | | | | | | | | | | | | | | | | | | | | | |
| | | | | | | | | | | | | | | | | | | | | | | |
| | 13.21 | | | | 4,409,787 | | | | 0.68 | | | | 0.68 | | | | 1.87 | | | | 32 | |
| | 12.93 | | | | 756,001 | | | | 0.93 | | | | 0.93 | | | | 1.62 | | | | — | |
| | | | | | | | | | | | | | | | | | | | | | | |
| | | | | | | | | | | | | | | | | | | | | | | |
| | 24.68 | (E) | | | 4,247,031 | | | | 0.69 | | | | 0.69 | | | | 2.24 | | | | 34 | |
| | 24.36 | (E) | | | 815,752 | | | | 0.94 | | | | 0.94 | | | | 2.00 | | | | — | |
| | | | | | | | | | | | | | | | | | | | | | | |
| | | | | | | | | | | | | | | | | | | | | | | |
| | (32.43 | ) | | | 3,628,793 | | | | 0.67 | | | | 0.67 | | | | 2.20 | | | | 41 | |
| | (32.60 | ) | | | 776,959 | | | | 0.92 | | | | 0.92 | | | | 1.95 | | | | — | |
| | | | | | | | | | | | | | | | | | | | | | | |
| | | | | | | | | | | | | | | | | | | | | | | |
| | 8.26 | | | | 5,842,788 | | | | 0.67 | | | | 0.67 | | | | 1.70 | | | | 27 | |
| | 7.98 | | | | 1,501,363 | | | | 0.92 | | | | 0.92 | | | | 1.45 | | | | — | |
| Report of Independent Registered Public Accounting Firm |
| The Board of Directors and Shareholders of |
| Hartford Series Fund, Inc. |
We have audited the accompanying statement of assets and liabilities, including the schedule of investments, of Hartford Dividend and Growth HLS Fund (one of the portfolios constituting Hartford Series Fund, Inc. (the Funds)) as of December 31, 2011, and the related statement of operations for the year then ended, the statements of changes in net assets for each of the two years in the period then ended, and the financial highlights for each of the five years in the period then ended. These financial statements and financial highlights are the responsibility of the Funds’ management. Our responsibility is to express an opinion on these financial statements and financial highlights based on our audits.
We conducted our audits in accordance with the standards of the Public Company Accounting Oversight Board (United States). Those standards require that we plan and perform the audit to obtain reasonable assurance about whether the financial statements and financial highlights are free of material misstatement. We were not engaged to perform an audit of the Funds’ internal control over financial reporting. Our audits included consideration of internal control over financial reporting as a basis for designing audit procedures that are appropriate in the circumstances, but not for the purpose of expressing an opinion on the effectiveness of the Funds’ internal control over financial reporting. Accordingly, we express no such opinion. An audit also includes examining, on a test basis, evidence supporting the amounts and disclosures in the financial statements and financial highlights, assessing the accounting principles used and significant estimates made by management, and evaluating the overall financial statement presentation. Our procedures included confirmation of securities owned as of December 31, 2011, by correspondence with the custodian and brokers or by other appropriate auditing procedures where replies from brokers were not received. We believe that our audits provide a reasonable basis for our opinion.
In our opinion, the financial statements and financial highlights referred to above present fairly, in all material respects, the financial position of Hartford Dividend and Growth HLS Fund of Hartford Series Fund, Inc. at December 31, 2011, the results of its operations for the year then ended, the changes in its net assets for each of the two years in the period then ended, and the financial highlights for each of the five years in the period then ended, in conformity with U.S. generally accepted accounting principles.
Minneapolis, MN
February 13, 2012
| Hartford Dividend and Growth HLS Fund |
| Directors and Officers (Unaudited) |
The Board of Directors of the Company appoints officers who are responsible for the day-to-day operations of the Fund and who execute policies formulated by the Directors. Each director serves until his or her death, resignation, or retirement or until the next annual meeting of shareholders is held or until his or her successor is elected and qualifies.
Directors and officers who are employed by or who have a financial interest in The Hartford are considered “interested” persons of the Fund pursuant to the 1940 Act. Each officer and two of the Company’s directors, as noted in the chart below, are “interested” persons of the Fund. Each director serves as a director for The Hartford Mutual Funds, Inc., The Hartford Mutual Funds II, Inc., Hartford Series Fund, Inc., Hartford HLS Series Fund II, Inc., and as a trustee for The Hartford Alternative Strategies Fund, which, as of December 31, 2011, collectively consist of 91 funds. Correspondence may be sent to directors and officers c/o Hartford Mutual Funds, P.O. Box 2999, Hartford, Connecticut 06104-2999, except that correspondence to Ms. Fagely may be sent to 500 Bielenberg Drive, Woodbury, Minnesota 55125.
The table below sets forth, for each director and officer, his or her name, year of birth, current position with the Company and date first elected or appointed to Hartford Series Fund, Inc. (“HSF”), and Hartford HLS Series Fund II, Inc. (“HSF2”), principal occupation, and, for directors, other directorships held. The Fund’s statement of additional information contains further information on the directors and is available free of charge by calling 1-800-862-6668 or writing to Hartford HLS Funds, c/o Individual Annuity Services, P.O. Box 5085, Hartford, CT 06102-5085.
Information on the aggregate remuneration paid to the directors of the Company can be found in the Statement of Operations herein. The Fund pays to The Hartford a portion of the chief compliance officer’s compensation, but does not pay salaries or compensation to any of their other officers or directors who are employed by The Hartford.
Non-Interested Directors
Lynn S. Birdsong (1946) Director since 2003, Co-Chairman of the Investment Committee
Mr. Birdsong is a private investor. Mr. Birdsong currently serves as a Director of the Sovereign High Yield Investment Company (April 2010 to current). Mr. Birdsong currently serves as an Independent Director of Nomura Partners Funds, Inc. (formerly, The Japan Fund) (March 2003 to current). From 2003 to March 2005, Mr. Birdsong was an independent director of the Atlantic Whitehall Funds. From 1979 to 2002, Mr. Birdsong was a managing director of Zurich Scudder Investments, an investment management firm. During his employment with Scudder, Mr. Birdsong was an Interested Director of The Japan Fund. Since 1981, Mr. Birdsong has been a partner in Birdsong Company, an advertising specialty firm.
Robert M. Gavin, Jr. (1940) Director since 2002 (HSF) and 1986 (HSF2), Chairman of the Board since 2004
Dr. Gavin is an educational consultant. Prior to September 1, 2001, he was President of Cranbrook Education Community and prior to July 1996, he was President of Macalester College, St. Paul, Minnesota.
Duane E. Hill (1945) Director since 2001 (HSF) and 2002 (HSF2), Chairman of the Nominating Committee
Mr. Hill is Partner of TSG Ventures L.P., a private equity investment company. Mr. Hill is a former partner of TSG Capital Group, a private equity investment firm that served as sponsor and lead investor in leveraged buyouts of middle market companies.
Sandra S. Jaffee (1941) Director since 2005
Ms. Jaffee served as Chairman (2008 to 2009) and Chief Executive Officer of Fortent (formerly Searchspace Group), a leading provider of compliance/regulatory technology to financial institutions from August 2005 to August 2009. From August 2004 to August 2005, Ms. Jaffee served as an Entrepreneur in Residence with Warburg Pincus, a private equity firm. From September 1995 to July 2004, Ms. Jaffee served as Executive Vice President at Citigroup, where she was President and Chief Executive Officer of Citibank’s Global Securities Services (1995 to 2003). Ms. Jaffe currently serves as a member of the Board of Directors of Broadridge Financial Solutions as well as a Trustee of Muhlenberg College.
William P. Johnston (1944) Director since 2005, Chairman of the Compliance Committee
In June 2006, Mr. Johnston was appointed as Senior Advisor to The Carlyle Group, a global private equity investment firm. In August 2007, Mr. Johnston was elected to the Board of Directors of LifeCare Holdings, Inc. In February 2008, Mr. Johnston was elected to the Board of Directors of HCR-ManorCare, Inc. In May 2006, Mr. Johnston was elected to the Supervisory Board of Fresenius Medical Care AG & Co. KGaA, after its acquisition of Renal Care Group, Inc. in March 2006. Mr. Johnston joined Renal Care Group in November 2002 as a member of the Board of Directors and served as Chairman of the Board from March 2003 through March 2006. Mr. Johnston served as a Director of MultiPlan, Inc. from July 2006 through August 2010. From September 1987 to December 2002, Mr. Johnston was with Equitable Securities Corporation (and its successors, SunTrust Equitable Securities and SunTrust Robinson Humphrey) serving in various investment banking and managerial positions, including Managing Director and Head of Investment Banking, Chief Executive Officer and Vice Chairman.
| Hartford Dividend and Growth HLS Fund |
| Directors and Officers (Unaudited) – (continued) |
Phillip O. Peterson (1944) Director since 2002 (HSF) and 2000 (HSF2), Chairman of the Audit Committee
Mr. Peterson is a mutual fund industry consultant. He was a partner of KPMG LLP (an accounting firm) until July 1999. Mr. Peterson joined William Blair Funds in February 2007 as a member of the Board of Trustees. From January 2004 to April 2005, Mr. Peterson served as Independent President of the Strong Mutual Funds.
Lemma W. Senbet (1946) Director since 2005
Dr. Senbet is the William E. Mayer Chair Professor of Finance and Director, Center for Financial Policy, at the University of Maryland, Robert H. Smith School of Business. He was chair of the Finance Department from 1998 to 2006. Previously he was a chaired professor of finance at the University of Wisconsin-Madison. Also, he was director of the Fortis Funds from March 2000 to July 2002. Dr. Senbet served the finance profession in various capacities, including as director of the American Finance Association and President of the Western Finance Association. In 2006, Dr. Senbet was inducted Fellow of Financial Management Association International for his career-long distinguished scholarship and professional service.
Interested Directors and Officers
David N. Levenson (1966) Director since 2010
Mr. Levenson currently serves as President of The Hartford’s Wealth Management business. He was appointed to this role in July 2010. Previously, Mr. Levenson served as Executive Vice President of Legacy Holdings for The Hartford from June 2009 to July 2010. From 2006 to 2009, Mr. Levenson was with Hartford Life Insurance K.K. where he served as President and Chief Executive Officer from 2007 to 2009. He served as Managing Director of Hartford Investment Management Company from 2005 to 2006. Additionally, Mr. Levenson serves as Executive Vice President of The Hartford and as President, Director and Chief Executive Officer of Hartford Life Insurance Company (“HLIC”) and Hartford Life, Inc. (“HL Inc.”).
Lowndes A. Smith (1939) Director since 1996 (HSF) and 2002 (HSF2), Co-Chairman of the Investment Committee
Mr. Smith served as Vice Chairman of The Hartford from February 1997 to January 2002, as President and Chief Executive Officer of HL Inc. from February 1997 to January 2002, and as President and Chief Operating Officer of The Hartford Life Insurance Companies from January 1989 to January 2002. Mr. Smith serves as a Director of White Mountains Insurance Group, Ltd., One Beacon Insurance and Symetra Financial and as a Managing Director of Whittington Gray Associates.
Other Officers
James E. Davey (1964) President and Chief Executive Officer since 2010
Mr. Davey serves as Executive Vice President of HLIC. Additionally, Mr. Davey serves as President, Chief Executive Officer and Manager of Hartford Investment Financial Services, Inc. (“HIFSCO”) and President, Chief Executive Officer and Manager of HL Advisors. Mr. Davey joined The Hartford in 2002.
Michael R. Dressen (1963) AML Compliance Officer since 2011
Mr. Dressen currently serves as Assistant Vice President of HLIC. He also serves as Chief Compliance Officer and AML Compliance Officer of Hartford Administrative Services Company (“HASCO”) and as Assistant Secretary and Compliance Officer of HIFSCO. Mr Dressen joined The Hartford in 2005 from State Farm Insurance Companies where he held various positions related to mutual funds, variable products, and property casualty insurance.
Tamara L. Fagely (1958) Vice President, Treasurer and Controller since 2002 (HSF) and 1993 (HSF2)
Ms. Fagely has been a Vice President of HASCO since 1998 and Chief Financial Officer since 2006. Currently Ms. Fagely is a Vice President of HLIC. She served as Assistant Vice President of HLIC from December 2001 through March 2005. In addition, Ms. Fagely is Controller and Chief Financial Officer of HIFSCO.
Dr. Robert J. Froehlich (1953) Senior Managing Director since 2009
Dr. Froehlich joined The Hartford as Senior Managing Director in September 2009. Prior to joining The Hartford, Dr. Froehlich served as Vice Chairman of Deutsche Asset Management from 1997-2009.
Edward P. Macdonald (1967) Vice President, Secretary and Chief Legal Officer since 2005
Mr. Macdonald serves as Vice President of HLIC and Chief Legal Officer of Mutual Funds and Vice President of HIFSCO. He also serves as Vice President and Secretary of HASCO, and Chief Legal Officer, Secretary and Vice President of HL Advisors. Mr. Macdonald joined The Hartford in 2005.
Vernon J. Meyer (1964) Vice President since 2006
Mr. Meyer serves as Senior Vice President of HLIC. He also serves as Senior Vice President of HIFSCO and HL Advisors. Mr. Meyer joined The Hartford in 2004.
Colleen B. Pernerewski (1969) Vice President and Chief Compliance Officer since 2010
Ms. Pernerewski serves as Vice President and Chief Investment Advisor Compliance Officer of HIFSCO and as Vice President and Chief Compliance Officer of HL Advisors. Ms. Pernerewski joined The Hartford in 2005 from Travelers Life and Annuity where she served as Counsel (2004-2005). Prior to Travelers Life and Annuity, Ms. Pernerewski held the position of Counsel at The Hartford (1998-2004).
Elizabeth L. Schroeder (1966) Vice President since 2010
Ms. Schroeder currently serves as Assistant Vice President of HLIC. Ms. Schroeder joined HLIC in 1991. She is also an Assistant Vice President of HASCO, HIFSCO and HL Advisors.
Martin Swanson (1962) Vice President since 2010
Mr. Swanson is a Vice President of HLIC. Mr. Swanson also serves as Vice President/Marketing for HIFSCO. Prior to joining HLIC in 1998, Mr. Swanson was a Vice President at PaineWebber, Inc.
Jane Wolak (1961) Vice President since 2009
Ms. Wolak currently serves as Senior Vice President of HLIC. Ms. Wolak joined HLIC as Vice President, Retail Product Services in May 2007. She is also Vice President of HASCO. Previously, Ms. Wolak was with Sun Life Financial where she held the position of Vice President, Service Center Operations from 2001-2007.
HOW TO OBTAIN A COPY OF THE FUND’S PROXY VOTING POLICIES AND VOTING RECORDS (UNAUDITED)
A description of the policies and procedures that the Fund uses to determine how to vote proxies relating to portfolio securities and a record of how the Fund voted any proxies for the twelve-month period ended June 30, 2011 are available (1) without charge, upon request, by calling 888-843-7824 and (2) on the SEC’s website at http://www.sec.gov.
QUARTERLY PORTFOLIO HOLDINGS INFORMATION (UNAUDITED)
The Fund files a complete schedule of portfolio holdings with the SEC for the first and third quarters of each fiscal year on Form N-Q. The Fund’s Forms are available (1) without charge, upon request, by calling 888-843-7824 and (2) on the SEC’s website at http://www.sec.gov. The Form N-Q may be reviewed and copied at the SEC’s Public Reference Room in Washington, DC. Information on the operation of the Public Reference Room may be obtained by calling 1-800-SEC-0330.
| Hartford Dividend and Growth HLS Fund |
| Expense Example (Unaudited) |
Your Fund's Expenses
As a shareholder of the Fund, you incur two types of costs: (1) transaction costs and (2) ongoing costs including investment management fees, distribution fees, and other fund expenses. This example is intended to help you understand your ongoing costs (in dollars) of investing in the Fund and to compare these costs with the ongoing costs of investing in other mutual funds. The example is based on an investment of $1,000 invested at the beginning of the period and held for the period of June 30, 2011 through December 31, 2011.
Actual Expenses
The first set of columns of the table below provides information about actual account values and actual expenses. You may use the information in this column, together with the amount you invested, to estimate the expenses that you paid over the period. Simply divide your account value by $1,000 (for example, an $8,600 account value divided by $1,000 = 8.6), then multiply the result by the number in the line under the heading entitled “Expenses Paid During Period” to estimate the expenses you paid on your account during this period.
Hypothetical Example for Comparison Purposes
The second set of columns of the table below provides information about hypothetical account values and hypothetical expenses based on the Fund’s actual expense ratio and an assumed rate of return of 5% per year before expenses, which is not the Fund’s actual return. The hypothetical account values and expenses may not be used to estimate the actual ending account balance or expenses you paid for the period. You may use this information to compare the ongoing costs of investing in the Fund and other funds. To do so, compare this 5% hypothetical example with the 5% hypothetical examples that appear in the shareholder reports of the other funds.
Please note that the expenses shown in the table are meant to highlight your ongoing costs only and do not reflect any transactional costs, such as sales charges (loads) and CDSC. Therefore, the second set of columns of the table is useful in comparing ongoing costs only, and will not help you determine the relative total costs of owning different funds. In addition, if these transactional costs were included, your costs would be higher. Expenses are equal to the Fund's annualized expense ratios multiplied by average account value over the period, multiplied by 184/365 (to reflect the one-half year period).
| | | Actual return | | | Hypothetical (5% return before expenses) | | | | | | | |
| | | Beginning
Account Value
June 30, 2011 | | Ending
Account Value
December 31,
2011 | | Expenses paid
during the period
June 30, 2011
through
December 31, 2011 | | | Beginning
Account Value
June 30, 2011 | | Ending
Account Value
December 31,
2011 | | Expenses paid
during the period
June 30, 2011
through
December 31, 2011 | | Annualized
expense
ratio | | Days in
the
current
1/2
year | | Days
in the
full
year | |
| Class IA | | $1,000.00 | | $959.00 | | $3.31 | | | $1,000.00 | | $1,021.83 | | $3.41 | | 0.67% | | 184 | | 365 | |
| Class IB | | $1,000.00 | | $957.79 | | $4.54 | | | $1,000.00 | | $1,020.57 | | $4.69 | | 0.92% | | 184 | | 365 | |
| Hartford Dividend and Growth HLS Fund |
| Approval of Investment Management and Investment Sub-Advisory Agreements (Unaudited) |
Section 15(c) of the Investment Company Act of 1940, as amended (the “1940 Act”), requires that each mutual fund’s board of directors, including a majority of those directors who are not “interested persons” of the mutual fund, as defined in the 1940 Act (the “Independent Directors”), annually review and consider the continuation of the mutual fund’s investment advisory and sub-advisory agreements. At its meeting held on August 2-3, 2011, the Board of Directors (the “Board”) of Hartford Series Fund, Inc., including each of the Independent Directors, unanimously voted to approve the continuation of the investment management agreement for Hartford Dividend and Growth HLS Fund (the “Fund”) with HL Investment Advisors, LLC (“HL Advisors”) and the continuation of the investment sub-advisory agreement between HL Advisors and the Fund’s sub-adviser, Wellington Management Company, LLP (the “Sub-adviser,” and together with HL Advisors, the “Advisers”) (collectively, the “Agreements”).
In the months preceding the August 2-3, 2011 meeting, the Board requested, received, and reviewed written responses from the Advisers to questions posed to them on behalf of the Independent Directors and supporting materials relating to those questions and responses. The Board considered information furnished to the Board at its meetings throughout the year, as well as information specifically prepared in connection with the annual approval of the Agreements at the Board’s meetings held on June 21-22, 2011 and August 2-3, 2011. Information provided to the Board at its meetings throughout the year included, among other things, reports on Fund performance, legal and compliance matters, sales and marketing activity, shareholder services, and the other services provided to the Fund by the Advisers and their affiliates. In addition, the Board received in-person presentations by Fund officers and representatives of HL Advisors at the Board’s meetings on June 21-22, 2011 and August 2-3, 2011 concerning the Agreements.
The Independent Directors, advised by independent legal counsel, engaged two service providers to assist them with evaluating the Agreements with respect to the Fund. Lipper Inc. (“Lipper”), an independent provider of investment company data, was retained to provide the Board with reports on how the Fund’s contractual management fees, actual management fees, other non-management fees, overall expense ratios and investment performance compared to those of mutual funds with similar investment objectives. The Independent Directors also engaged an independent financial services consulting firm (the “Consultant”) to assist them in evaluating the Fund’s management fees, sub-advisory fees, other non-management fees, overall expense ratios and investment performance. In addition, the Consultant reviewed the profitability calculations utilized by HL Advisors in connection with the continuation of the investment management agreement.
In determining to continue the Agreements for the Fund, the members of the Board reviewed and evaluated information and factors they believed to be relevant and appropriate in light of the information that the Board deemed necessary and appropriate through the exercise of their reasonable business judgment. While individual members of the Board may have weighed certain factors differently, the Board’s determination to continue the Agreements was based on a comprehensive consideration of all information provided to the Board throughout the year and specifically with respect to the continuation of the Agreements. A more detailed discussion of the factors the Board considered with respect to its approval of the Agreements is provided below.
Nature, Extent, And Quality Of Services Provided by the Advisers
The Board requested and considered information concerning the nature, extent, and quality of the services provided to the Fund by the Advisers. The Board considered, among other things, the terms of the Agreements and the range of services provided by the Advisers. The Board considered the Advisers’ professional personnel who provide services to the Fund, including each Adviser’s ability and experience in attracting and retaining qualified personnel to service the Fund. The Board considered each Adviser’s reputation and overall financial strength, as well as its willingness to consider and implement organizational and operational changes designed to improve services to the Fund. In addition, the Board considered the quality of each Adviser’s communications with the Board and responsiveness to Board inquiries.
The Board also requested and evaluated information concerning each Adviser’s regulatory and compliance environment. In this regard, the Board requested and reviewed information on each Adviser’s compliance policies and procedures, compliance history, and a report from the Fund’s Chief Compliance Officer on each Adviser’s compliance with applicable laws and regulations, including responses to regulatory developments and compliance issues raised by regulators. The Board also noted the Advisers’ support of the Fund’s compliance control structure, particularly the resources devoted by the Advisers in support of the Fund’s obligations pursuant to Rule 38a-1 under the 1940 Act.
| Hartford Dividend and Growth HLS Fund |
| Approval of Investment Management and Investment Sub-Advisory Agreements – (continued) |
With respect to HL Advisors, the Board noted that under the Agreements, HL Advisors is responsible for the management of the Fund, including overseeing fund operations and service providers, as well as investment advisory services in connection with selecting, monitoring and supervising the Sub-adviser. The Board considered HL Advisors’ ongoing monitoring of people, process and performance, including its quarterly reviews of each of the Hartford HLS Funds, semi-annual meetings with the leaders of each Fund’s portfolio management team, and oversight of the Funds’ 49 portfolio managers. The Board recognized that HL Advisors has demonstrated a record of making changes to the management and/or strategies of the Funds when warranted. The Board considered HL Advisors’ oversight of the Sub-adviser’s investment approach and results, process for monitoring best execution of portfolio trades by the Sub-adviser, and approach to risk management with respect to the Fund and the service providers to the Fund. The Board also considered HL Advisors’ oversight of compliance with the Fund’s objective and policies as well as with applicable laws and regulations, noting that regulatory and other developments had over time led to an increase in the scope of HL Advisors’ services in this regard. In addition, the Board considered HL Advisors’ ongoing commitment to review and rationalize the Hartford fund family’s product line-up and the expenses that HL Advisors had incurred in connection with fund combinations in recent years. The Board considered that HL Advisors or its affiliates are responsible for providing the Fund’s officers. The Board also noted that Hartford Life Insurance Company (“HLIC”) provides administrative services to the Fund. The Board considered its experiences with HL Advisors and HLIC with respect to each of these services.
With respect to the Sub-adviser, who provides day-to-day portfolio management services, the Board considered the quality of the Fund’s portfolio managers, the Sub-adviser’s other investment personnel, its investment philosophy and process, investment research capabilities and resources, performance record, trade execution capabilities and experience. The Board considered the experience of the Fund’s portfolio managers, the number of accounts managed by the portfolio managers, and the Sub-adviser’s method for compensating the portfolio managers.
Based on these considerations, the Board concluded that it was satisfied with the nature, extent and quality of the services provided to the Fund by HL Advisors and the Sub-adviser.
Performance of the Fund and the Advisers
The Board considered the investment performance of the Fund. In this regard, the Board reviewed the performance of the Fund over different time periods presented in the materials and evaluated HL Advisors’ analysis of the Fund’s performance for these time periods. The Board considered information and materials provided to the Board by the Advisers concerning Fund performance, as well as information from Lipper comparing the investment performance of the Fund to an appropriate benchmark and universe of peer funds. The Board noted that the performance of the Fund was within expectations.
The Board considered the detailed investment analytics reports provided by The Hartford’s Investment Advisory Group throughout the year. These reports include, among other things, information on the Fund’s gross and net returns, the Fund’s investment performance relative to an appropriate benchmark and peer group, various statistics concerning the Fund’s portfolio, and a narrative summary of various factors affecting Fund performance. The Board considered the Advisers’ cooperation with the Investment Committee, which assists the Board in evaluating the performance of the Fund at periodic meetings throughout the year. The Board also considered the analysis provided by the Consultant relating to the Fund’s performance track record.
In light of all the considerations noted above, the Board concluded that it had continued confidence in HL Advisors’ and the Sub-adviser’s overall capabilities to manage the Fund.
Costs of the Services and Profitability of the Advisers
The Board reviewed information regarding HL Advisors’ cost to provide investment management and related services to the Fund and HL Advisors’ profitability, both overall and for the Fund, on a pre-tax basis without regard to distribution expenses. The Board also requested and reviewed information about the profitability to HL Advisors and its affiliates from all services provided to the Fund and all aspects of their relationship with the Fund. The Board also requested and received information relating to the operations and profitability of the Sub-adviser.
The Board considered the Consultant’s review of the profitability calculations utilized by HL Advisors in connection with the continuation of the investment management agreement. In this regard, the Consultant reported that The Hartford’s process for calculating and reporting Fund profitability is reasonable, sound and well within common industry practice.
Based on these considerations, the Board concluded that the profits anticipated to be realized by the Advisers and their affiliates from their relationships with the Fund would not be excessive.
Comparison of Fees and Services Provided by the Advisers
The Board considered comparative information with respect to the management fees to be paid by the Fund to HL Advisors and the total expense ratios of the Fund. The Board also considered comparative information with respect to the sub-advisory fees to be paid by HL Advisors to the Sub-adviser, to the extent applicable. In this regard, the Board requested and reviewed information from HL Advisors and the Sub-adviser relating to the management and sub-advisory fees, including the sub-advisory fee schedule for the Fund, and total operating expenses for the Fund. The Board considered that the management fee for the Fund includes the fee paid to HLIC for providing certain administrative services to the Fund. The Board also reviewed information from Lipper comparing the Fund’s contractual management fees, actual management fees and overall expense ratios relative to a group of funds selected by Lipper, in consultation with the Consultant, and a broader universe of funds selected by Lipper.
While the Board recognized that comparisons between the Fund and peer funds are imprecise, given the differing service levels and characteristics of mutual funds and the different business models and cost structures of the Advisers, the comparative information provided by Lipper assisted the Board in evaluating the reasonableness of the Fund’s management and sub-advisory fees and total operating expenses. In addition, the Board considered the analysis and recommendations of the Consultant relating to the Fund’s management and sub-advisory fees and total operating expenses.
Based on these considerations, the Board concluded that the Fund’s fees and total operating expenses, in conjunction with the information about quality of services, profitability, economies of scale, and other matters discussed, were reasonable in light of the services provided.
Economies of Scale
The Board requested and considered information regarding the Advisers’ realization of economies of scale with respect to the Fund and whether the fee levels reflect these economies of scale for the benefit of the Fund’s investors. With respect to HL Advisors, the Board considered representations from HL Advisors that it is difficult to anticipate whether and to what extent economies may be realized by HL Advisors as assets grow over time. The Board reviewed the breakpoints in the management fee schedule for the Fund, which reduces fee rates as Fund assets grow over time. The Board recognized that a fund with assets beyond the last breakpoint level will continue to benefit from economies of scale because additional assets are charged the lowest breakpoint fee resulting in lower overall effective management fee rates. The Board also recognized that a fee schedule that reaches a lower breakpoint quickly provides shareholders with the benefit of anticipated or potential economies of scale.
The Board reviewed and evaluated materials from Lipper showing how management fee schedules of peer funds reflect economies of scale for the benefit of investors as a peer fund’s assets hypothetically increase over time. Based on information provided by HL Advisors, Lipper, and the Consultant, the Board recognized that there is no uniform methodology for establishing breakpoints or uniform pattern in asset levels that trigger breakpoints or the amounts of breakpoints triggered.
After considering all of the information available to it, the Board concluded that it was satisfied with the extent to which economies of scale would be shared for the benefit of the Fund’s shareholders based on currently available information and the effective advisory fees and expense ratios for the Fund at its current and reasonably anticipated asset levels. The Board noted, however, that it would continue to monitor future growth in Fund assets and the appropriateness of additional breakpoints.
| Hartford Dividend and Growth HLS Fund |
| Approval of Investment Management and Investment Sub-Advisory Agreements – (continued) |
Other Benefits
The Board considered other benefits to the Advisers and their affiliates from their relationships with the Fund, including the role of the Fund in supporting the variable life insurance and variable annuity products offered by The Hartford. The Board reviewed information noting that HLIC, an affiliate of HL Advisors, receives fees for providing certain administrative services to the Fund, and that HLIC also receives fees for fund accounting and related services from the Fund, and the Board considered information on expected profits to HLIC or its affiliates for such services. The Board also considered that Hartford Administrative Services Company (“HASCO”), the Fund’s transfer agent and an affiliate of HL Advisors, receives transfer agency compensation from the Fund, and the Board reviewed information on the expected profitability of the Fund’s transfer agency function to HASCO. The Board considered information provided by HASCO indicating that the transfer agent fees charged by HASCO to the Fund were fair and reasonable based on publicly available information.
The Board also considered that Hartford Securities Distribution Company, Inc., as principal underwriter of the Fund, receives 12b-1 fees from the Fund. The Board also noted that certain affiliates of HL Advisors distribute shares of the Fund and receive compensation in that connection.
The Board considered benefits to the Sub-adviser from its use of the Fund’s brokerage commissions to obtain soft dollar research, and representations from HL Advisors and the Sub-adviser that the Sub-adviser would not make any revenue-sharing payments or any other type of distribution payments to HL Advisors or its affiliates.
The Board considered the benefits to shareholders of being part of the Hartford family of funds. The Board considered HL Advisors’ efforts to provide investors in the family with a broad range of investment styles and asset classes.
* * * *
Based upon its review of these various factors, among others, the Board concluded that it is in the best interests of the Fund and its shareholders for the Board to approve the Agreements for an additional year. In reaching this decision, the Board did not assign relative weights to the factors discussed above or deem any one or group of them to be controlling in and of themselves. In connection with their deliberations, the Independent Directors met separately in executive session on several occasions, with independent legal counsel, to review the relevant materials and consider their responsibilities under relevant laws and regulations.
The Hartford
P.O. Box 5085
Hartford, CT 06102-5085
Hartford Series Fund, Inc. is underwritten and distributed by Hartford Securities Distribution Company, Inc.
"The Hartford" is The Hartford Financial Services Group, Inc. and its subsidiaries.
Hartford Series Fund, Inc. inception dates range from 1977 to date. Hartford Series Fund, Inc. is not a subsidiary of The Hartford but is underwritten, distributed by and advised by subsidiaries of The Hartford. Investments in Hartford Series Fund, Inc. are not guaranteed by The Hartford or any other entity.
You should carefully consider investment objectives, risks, and charges and expenses of Hartford HLS Funds before investing. This and other information can be found in the Fund’s prospectus or summary prospectus, which can be obtained by calling 800-862-6668. Please read them carefully before you invest or send money.
HLSAR-DG11 2-12 109078 Printed in U.S.A ©2011 The Hartford, Hartford, CT 06115 | |

A MESSAGE FROM THE PRESIDENT
Dear Fellow Shareholders:
I want to take this opportunity to say thank you for investing in Hartford HLS Funds.
This has been a tumultuous year. In the beginning of 2011, we witnessed tension-fueled political uprisings in the already-volatile Middle East and North Africa region. We also watched as Japan dealt with a series of crises including a massive earthquake and subsequent tsunami. Yet, U.S. economic conditions continued to improve, with gains in consumer confidence and retail sales. During the first half of 2011, domestic, international, and world indices (as measured by the S&P 500, MSCI EAFE and MSCI World) were all up more than 5% through June, 30 2011.
The economic recovery, however, lost momentum in the second half of 2011. The employment and housing markets both remain extremely challenged. Investors continue to be concerned about the implications of the European sovereign debt crisis, as well as our own high levels of domestic debt. Fears that the European sovereign debt crisis could continue to drag down the global economy have weighed heavily on stocks.
Ongoing apprehension regarding the U.S. debt ceiling during the summer and the resulting downgrade of the U.S. sovereign credit rating by Standard & Poor’s also contributed to weaker investor confidence.
There are, however, some reasons to remain confident. Corporations have record levels of cash on their balance sheets—corporate cash has doubled in the past 10 years. In addition, U.S. gross domestic product expanded at a 2.5 percent annual rate in the third quarter according to the Commerce Department, as consumers and businesses set aside fears about the recovery and stepped up spending. Corporate earnings have also remained positive, with a majority of companies beating expectations each quarter this year. This momentum will hopefully continue into next year.
As we head into 2012, in light of the continued market volatility, now would be a good time to schedule a meeting with your financial advisor to examine your current investment strategy and determine whether you are on the right track.
| • | Does your fixed-income portfolio complement your equity portfolio? |
| • | Are you receiving diversified sources of income? |
| • | Is your portfolio still in line with your risk tolerance and investment time horizon? |
Talk to your advisor to see what changes you should make to address these concerns and opportunities.
Thank you again for investing with Hartford HLS Funds.
James Davey
President
Hartford HLS Funds
Hartford Global Growth HLS Fund
Table of Contents
This report is prepared for the general information of contract owners and qualified retirement plan participants. It is not an offer of contracts or of qualified retirement plans. It should not be used in connection with any offer, except in conjunction with the appropriate product prospectus which contains all pertinent information including the applicable sales, administrative and other charges.
The views expressed in the Fund’s Manager Discussion under ‘‘Why did the Fund perform this way?’’ and ‘‘What is the outlook?’’ are views of the Fund’s sub-adviser and portfolio management team through the end of the period and are subject to change based on market and other conditions.
Hartford Global Growth HLS Fund inception 09/30/1998
(sub-advised by Wellington Management Company, LLP)
| Investment objective – Seeks growth of capital. |
| |
Performance Overview 12/31/01 - 12/31/11
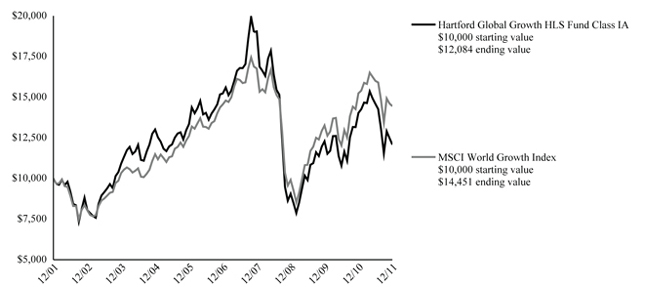
The chart above shows the growth of a $10,000 investment in Class IA. Growth results in classes other than Class IA will vary from what is seen above due to differences in the expenses charged to those share classes.
Average Annual Total Returns (as of 12/31/11)
| | 1 Year | 5 Year | 10 Year |
| Global Growth IA | -13.89% | -4.52% | 1.91% |
| Global Growth IB | -14.10% | -4.76% | 1.66% |
| MSCI World Growth Index | -5.14% | -0.15% | 3.75% |
PAST PERFORMANCE IS NOT INDICATIVE OF FUTURE RESULTS.
Total returns presented above were calculated using the Fund's net asset value available to shareholders for sale or redemption of Fund shares on December 31, 2011, which may exclude investment transactions as of this date.
MSCI World Growth Index is a broad-based unmanaged market capitalization-weighted total return index which measures the performance of growth securities in 23 developed-country global equity markets including the United States, Canada, Europe, Australia, New Zealand and the Far East.
You cannot invest directly in an index.
The chart represents a hypothetical investment in the Fund. Performance data represents past performance and current performance could be higher or lower.
Performance information may reflect historical or current expense waivers/reimbursements from the investment adviser, without which performance would have been lower. For information on current expense waivers/reimbursements, please see the prospectus.
The value of the Fund will fluctuate so that when redeemed, it may be worth more or less than the original investment. The chart and table do not reflect the deductions of taxes, sales charges or other fees which may be applied at the variable life insurance, variable annuity or qualified retirement plan product level. Any such additional sales charges or other fees or expenses would lower the contract’s or plan’s performance.
| Hartford Global Growth HLS Fund |
| Manager Discussion (Unaudited) |
| December 31, 2011 |
| Portfolio Manager | | |
| Matthew D. Hudson, CFA | | |
| Vice President | | |
| | | |
How did the Fund perform?
The Class IA shares of the Hartford Global Growth HLS Fund returned -13.89% for the twelve-month period ended December 31, 2011, underperforming its benchmark, the MSCI World Growth Index, which returned -5.14% for the same period. The Fund also underperformed the -9.54% return of the average fund in the Lipper Global Growth VP-UF Funds peer group, a group of funds with investment strategies similar to those of the Fund.
Why did the Fund perform this way?
The one-year period ended December 31, 2011 was yet another volatile period for equity markets. Global equities started the year on a strong note and continued to march higher in the first quarter of 2011, driven by investors’ enthusiasm for additional government debt purchases by the U.S. Federal Reserve, the extension of tax cuts in the U.S., strong earnings growth, and generally improving economic data. This enthusiasm reversed later in the period, however, as concerns surfaced that the global economy could slip back into a recession, resulting in a rapid decline in equity markets. Fears about sovereign debt and solvency in the eurozone, slowing economic expansion in China and the U.S., and uncertainty about the sustainability of corporate earnings growth combined to produce an extremely volatile stock market, and return correlations among stocks spiked as investors shed risk and fled to safety. Markets ended the year on a positive note in the final month of the period with encouraging employment and manufacturing data in the U.S.
For the period, Growth stocks (-5.1%) modestly underperformed Value stocks (-4.9%) as measured by the MSCI World Growth Index and the MSCI World Value Index, respectively. Within the MSCI World Growth Index, eight out of ten sectors posted negative returns. Materials (-21%), Financials (-20%), and Energy (-10%) lagged the most, while Consumer Staples (+9%) and Health Care (+4%) posted positive returns.
The Fund’s underperformance versus its benchmark was primarily due to weak security selection within Information Technology, Industrials, and Consumer Discretionary, as well as our underweight positions in the strong performing Consumer Staples and Health Care sectors. This was partially offset by strong stock selection in Health Care and Energy. Additionally, our underweight (i.e. the Fund’s sector position was less than the benchmark position) to Materials and overweight to Information Technology aided relative performance.
The top detractors from the Fund’s relative performance (i.e. performance of the Fund as measured against the benchmark) were Sprint Nextel (Telecommunication Services), Netflix (Consumer Discretionary), and Motorola Mobility (Information Technology). Shares of Sprint Nextel, a communications company offering a range of wireless and wireline communications products and services, fell after the company reported second quarter earnings below consensus expectations due to lower post-paid subscriber additions and higher costs from increased data usage. Shares of the internet-based movie and television subscription service Netflix declined as a pricing change angered members. The firm reversed their decision but significant brand damage had already occurred. Motorola Mobility, a provider of mobile devices, wireless accessories, set-top boxes and video distribution systems, and other related products, saw its shares underperform early in the period. Sentiment for the company became negative during the first quarter as two headline products, the Motorola Xoom and Motorola Atrix, showed signs of weak demand. Top absolute (i.e. total return) detractors for the period also included HTC and Xstrata.
Aetna (Health Care), Sands China (Consumer Discretionary), and Starbucks (Consumer Discretionary) were top contributors to benchmark-relative performance. Shares of Aetna, a diversified health care benefits company, moved sharply higher after the company issued better-than-expected second quarter revenue and earnings and gave bullish earnings guidance for the third quarter as the company continues to gain market share. Shares of Sands China, a developer, owner, and operator of integrated resorts and casinos in Macau, moved higher after the company reported solid quarterly earnings results due to better-than-expected margins. Shares of Starbucks, a roaster and retailer of specialty coffees and drinks, rose as the firm’s sales exceeded expectations driven by higher transactions and broad-based strength across products. The company has also seen increased business across different parts of the day. Apple (Information Technology) was a top contributor to absolute results.
| Hartford Global Growth HLS Fund |
| Manager Discussion (Unaudited) – (continued) |
| December 31, 2011 |
What is the outlook?
In 2011, macroeconomic fears and investors’ desire for safety dominated the equity markets. Not surprisingly, some of the best performing sectors were the traditionally defensive Utilities, Consumer Staples, and Health Care sectors. In this environment, investors craved low volatility, safety stocks and the fundamentals of many solid companies were largely ignored. In 2012, we believe we could see greater differentiation among stocks as investors refocus on fundamentals. Barring a catastrophic liquidity event in Europe, we could see some reversion to the mean as the “safety trade” unwinds and investors find bargains in higher growth and higher volatility stocks trading at historic valuations relative to low growth safety stocks. We continue to remain true to our process, focusing on growth companies with improving fundamentals that we believe can exceed consensus earnings expectations.
Portfolio construction is a bottom-up process based on intensive company research. Allocations among sectors are the result of individual stock decisions. At the end of the period, our stock-by-stock investment process resulted in greater-than-benchmark weights in the Information Technology, Financials, and Consumer Discretionary sectors. The Fund held below-benchmark weights in the Consumer Staples, Materials and Health Care sectors.
Diversification by Industry
as of December 31, 2011
| | | Percentage of | |
| Industry (Sector) | | Net Assets | |
| Automobiles & Components (Consumer Discretionary) | | | 2.7 | % |
| Banks (Financials) | | | 2.9 | |
| Capital Goods (Industrials) | | | 9.4 | |
| Consumer Durables & Apparel (Consumer Discretionary) | | | 2.2 | |
| Consumer Services (Consumer Discretionary) | | | 4.8 | |
| Diversified Financials (Financials) | | | 6.5 | |
| Energy (Energy) | | | 10.9 | |
| Food, Beverage & Tobacco (Consumer Staples) | | | 2.6 | |
| Health Care Equipment & Services (Health Care) | | | 2.7 | |
| Insurance (Financials) | | | 0.8 | |
| Materials (Materials) | | | 6.6 | |
| Media (Consumer Discretionary) | | | 3.8 | |
| Pharmaceuticals, Biotechnology & Life Sciences (Health Care) | | | 4.8 | |
| Retailing (Consumer Discretionary) | | | 4.3 | |
| Semiconductors & Semiconductor Equipment (Information Technology) | | | 5.9 | |
| Software & Services (Information Technology) | | | 11.7 | |
| Technology Hardware & Equipment (Information Technology) | | | 10.3 | |
| Telecommunication Services (Services) | | | 1.2 | |
| Transportation (Industrials) | | | 3.4 | |
| Short-Term Investments | | | 2.5 | |
| Other Assets and Liabilities | | | 0.0 | |
| Total | | | 100.0 | % |
Diversification by Country
as of December 31, 2011
| | | Percentage of | |
| Country | | Net Assets | |
| Brazil | | | 2.4 | % |
| Canada | | | 2.4 | |
| China | | | 2.4 | |
| France | | | 4.5 | |
| Germany | | | 1.3 | |
| Hong Kong | | | 2.7 | |
| Ireland | | | 1.0 | |
| Italy | | | 1.1 | |
| Japan | | | 3.6 | |
| Jersey | | | 1.2 | |
| Netherlands | | | 1.4 | |
| Singapore | | | 1.0 | |
| South Korea | | | 1.4 | |
| Sweden | | | 1.4 | |
| Switzerland | | | 2.9 | |
| United Kingdom | | | 6.0 | |
| United States | | | 60.8 | |
| Short-Term Investments | | | 2.5 | |
| Other Assets and Liabilities | | | 0.0 | |
| Total | | | 100.0 | % |
| Hartford Global Growth HLS Fund |
| Schedule of Investments |
| December 31, 2011 |
| (000’s Omitted) |
| Shares or Principal Amount | | Market Value ╪ | |
| COMMON STOCKS - 97.5% |
| | | | | Automobiles & Components - 2.7% | | | | |
| | 224 | | | Johnson Controls, Inc. | | $ | 7,017 | |
| | 544 | | | Nissan Motor Co., Ltd. | | | 4,868 | |
| | | | | | | | 11,885 | |
| | | | | Banks - 2.9% | | | | |
| | 299 | | | Itau Unibanco Banco Multiplo S.A. ADR | | | 5,557 | |
| | 322 | | | Standard Chartered plc | | | 7,050 | |
| | | | | | | | 12,607 | |
| | | | | Capital Goods - 9.4% | | | | |
| | 72 | | | Boeing Co. | | | 5,267 | |
| | 111 | | | Honeywell International, Inc. | | | 6,049 | |
| | 237 | | | Safran S.A. | | | 7,076 | |
| | 482 | | | Sandvik Ab | | | 5,890 | |
| | 110 | | | Schneider Electric S.A. | | | 5,739 | |
| | 60 | | | Siemens AG | | | 5,695 | |
| | 33 | | | SMC Corp. | | | 5,385 | |
| | | | | | | | 41,101 | |
| | | | | Consumer Durables & Apparel - 2.2% | | | | |
| | 95 | | | Lululemon Athletica, Inc. ● | | | 4,450 | |
| | 1,110 | | | Prada S.p.A. ● | | | 4,996 | |
| | | | | | | | 9,446 | |
| | | | | Consumer Services - 4.8% | | | | |
| | 3,751 | | | Genting Singapore plc ● | | | 4,364 | |
| | 461 | | | MGM Resorts International ● | | | 4,804 | |
| | 2,595 | | | Sands China Ltd. ●§ | | | 7,280 | |
| | 96 | | | Starbucks Corp. | | | 4,426 | |
| | | | | | | | 20,874 | |
| | | | | Diversified Financials - 6.5% | | | | |
| | 116 | | | American Express Co. | | | 5,459 | |
| | 38 | | | BlackRock, Inc. | | | 6,751 | |
| | 49 | | | Goldman Sachs Group, Inc. | | | 4,458 | |
| | 270 | | | Hong Kong Exchanges & Clearing Ltd. | | | 4,296 | |
| | 220 | | | JP Morgan Chase & Co. | | | 7,310 | |
| | | | | | | | 28,274 | |
| | | | | Energy - 10.9% | | | | |
| | 86 | | | Anadarko Petroleum Corp. | | | 6,547 | |
| | 237 | | | BG Group plc | | | 5,066 | |
| | 227 | | | Chesapeake Energy Corp. | | | 5,054 | |
| | 148 | | | ENSCO International plc | | | 6,965 | |
| | 60 | | | EOG Resources, Inc. | | | 5,956 | |
| | 99 | | | National Oilwell Varco, Inc. | | | 6,746 | |
| | 202 | | | Petroleo Brasileiro S.A. ADR | | | 5,015 | |
| | 87 | | | Schlumberger Ltd. | | | 5,929 | |
| | | | | | | | 47,278 | |
| | | | | Food, Beverage & Tobacco - 2.6% | | | | |
| | 104 | | | Green Mountain Coffee Roasters, Inc. ● | | | 4,680 | |
| | 107 | | | Groupe Danone | | | 6,709 | |
| | | | | | | | 11,389 | |
| | | | | Health Care Equipment & Services - 2.7% | | | | |
| | 151 | | | Aetna, Inc. | | | 6,379 | |
| | 74 | | | Edwards Lifesciences Corp. ● | | | 5,260 | |
| | | | | | | | 11,639 | |
| | | | | Insurance - 0.8% | | | | |
| | 541 | | | Ping An Insurance (Group) Co. | | | 3,548 | |
| | | | | | | | | |
| | | | | Materials - 6.6% | | | | |
| | 188 | | | Anglo American plc | | | 6,961 | |
| | 135 | | | Barrick Gold Corp. | | | 6,114 | |
| | 877 | | | Glencore International plc | | | 5,355 | |
| | 85 | | | Mosaic Co. | | | 4,306 | |
| | 20 | | | Syngenta AG | | | 5,932 | |
| | | | | | | | 28,668 | |
| | | | | Media - 3.8% | | | | |
| | 394 | | | News Corp. Class A | | | 7,036 | |
| | 2,821 | | | Sirius XM Radio, Inc. w/ Rights ● | | | 5,135 | |
| | 435 | | | WPP plc | | | 4,559 | |
| | | | | | | | 16,730 | |
| | | | | Pharmaceuticals, Biotechnology & Life Sciences - 4.8% | | | | |
| | 105 | | | Celgene Corp. ● | | | 7,099 | |
| | 124 | | | Regeneron Pharmaceuticals, Inc. ● | | | 6,853 | |
| | 13 | | | Roche Holding AG | | | 2,196 | |
| | 139 | | | Vertex Pharmaceuticals, Inc. ● | | | 4,618 | |
| | | | | | | | 20,766 | |
| | | | | Retailing - 4.3% | | | | |
| | 38 | | | Amazon.com, Inc. ● | | | 6,591 | |
| | 206 | | | Lowe's Co., Inc. | | | 5,226 | |
| | 14 | | | Priceline.com, Inc. ● | | | 6,732 | |
| | | | | | | | 18,549 | |
| | | | | Semiconductors & Semiconductor Equipment - 5.9% | | | | |
| | 167 | | | Altera Corp. | | | 6,205 | |
| | 143 | | | ASML Holding N.V. | | | 5,963 | |
| | 302 | | | NVIDIA Corp. ● | | | 4,180 | |
| | 6 | | | Samsung Electronics Co., Ltd. | | | 5,920 | |
| | 218 | | | Skyworks Solutions, Inc. ● | | | 3,543 | |
| | | | | | | | 25,811 | |
| | | | | Software & Services - 11.7% | | | | |
| | 407 | | | Activision Blizzard, Inc. | | | 5,008 | |
| | 60 | | | Baidu, Inc. ADR ● | | | 6,949 | |
| | 81 | | | Citrix Systems, Inc. ● | | | 4,901 | |
| | 285 | | | eBay, Inc. ● | | | 8,643 | |
| | 13 | | | Google, Inc. ● | | | 8,209 | |
| | 461 | | | Oracle Corp. | | | 11,833 | |
| | 55 | | | Salesforce.com, Inc. ● | | | 5,619 | |
| | | | | | | | 51,162 | |
| | | | | Technology Hardware & Equipment - 10.3% | | | | |
| | 45 | | | Apple, Inc. ● | | | 18,091 | |
| | 462 | | | EMC Corp. ● | | | 9,944 | |
| | 1,015 | | | Hitachi Ltd. | | | 5,280 | |
| | 261 | | | Juniper Networks, Inc. ● | | | 5,335 | |
| | 110 | | | Qualcomm, Inc. | | | 5,996 | |
| | | | | | | | 44,646 | |
| | | | | Telecommunication Services - 1.2% | | | | |
| | 2,214 | | | Sprint Nextel Corp. ● | | | 5,180 | |
| | | | | | | | | |
| | | | | Transportation - 3.4% | | | | |
| | 541 | | | Delta Air Lines, Inc. ● | | | 4,378 | |
| | 71 | | | FedEx Corp. | | | 5,947 | |
| | 40 | | | Kuehne & Nagel International AG | | | 4,431 | |
| | | | | | | | 14,756 | |
| | | | | Total common stocks | | | | |
| | | | | (cost $397,870) | | $ | 424,309 | |
| | | | | | | | | |
| | | | | Total long-term investments | | | | |
| | | | | (cost $397,870) | | $ | 424,309 | |
The accompanying notes are an integral part of these financial statements.
| Hartford Global Growth HLS Fund |
| Schedule of Investments – (continued) |
| December 31, 2011 |
| (000’s Omitted) |
| Shares or Principal Amount | | | | | | Market Value ╪ | |
| SHORT-TERM INVESTMENTS - 2.5% |
| Repurchase Agreements - 2.5% |
| | | | | Bank of America Merrill Lynch TriParty Joint | | | | | | | | |
| | | | | Repurchase Agreement (maturing on | | | | | | | | |
| | | | | 01/03/2012 in the amount of $4,124, | | | | | | | | |
| | | | | collateralized by GNMA 4.50%, 2041, | | | | | | | | |
| | | | | value of $4,207) | | | | | | | | |
| $ | 4,124 | | | 0.04%, 12/30/2011 | | | | | | $ | 4,124 | |
| | | | | Barclays Capital TriParty Joint Repurchase | | | | | | | | |
| | | | | Agreement (maturing on 01/03/2012 in the | | | | | | | | |
| | | | | amount of $343, collateralized by U.S. | | | | | | | | |
| | | | | Treasury Bond 5.38%, 2031, value of $349) | | | | | | | | |
| | 343 | | | 0.01%, 12/30/2011 | | | | | | | 343 | |
| | | | | Deutsche Bank Securities TriParty Joint | | | | | | | | |
| | | | | Repurchase Agreement (maturing on | | | | | | | | |
| | | | | 01/03/2012 in the amount of $4,575, | | | | | | | | |
| | | | | collateralized by GNMA 3.50% - 7.00%, | | | | | | | | |
| | | | | 2035 - 2046, value of $4,666) | | | | | | | | |
| | 4,574 | | | 0.06%, 12/30/2011 | | | | | | | 4,574 | |
| | | | | UBS Securities, Inc. Joint Repurchase | | | | | | | | |
| | | | | Agreement (maturing on 01/03/2012 in the | | | | | | | | |
| | | | | amount of $35, collateralized by U.S. | | | | | | | | |
| | | | | Treasury Note 2.75%, 2016, value of $35) | | | | | | | | |
| | 35 | | | 0.01%, 12/30/2011 | | | | | | | 35 | |
| | | | | UBS Securities, Inc. TriParty Joint Repurchase | | | | | | | | |
| | | | | Agreement (maturing on 01/03/2012 in the | | | | | | | | |
| | | | | amount of $1,770, collateralized by FNMA | | | | | | | | |
| | | | | 3.00% - 6.50%, 2021 - 2041, value of | | | | | | | | |
| | | | | $1,806) | | | | | | | | |
| | 1,770 | | | 0.04%, 12/30/2011 | | | | | | | 1,770 | |
| | | | | | | | | | | | 10,846 | |
| | | | | Total short-term investments | | | | | | | | |
| | | | | (cost $10,846) | | | | | | $ | 10,846 | |
| | | | | | | | | | | | | |
| | | | | Total investments | | | | | | | | |
| | | | | (cost $408,716) ▲ | | | 100.0 | % | | $ | 435,155 | |
| | | | | Other assets and liabilities | | | — | % | | | (4) |
| | | | | Total net assets | | | 100.0 | % | | $ | 435,151 |
| Note: | Percentage of investments as shown is the ratio of the total market value to total net assets. Market value of long-term investments in foreign securities represents 36.7% of total net assets at December 31, 2011. |
Prices of foreign equities that are principally traded on certain foreign markets may be adjusted daily pursuant to a fair value pricing service approved by the Board of Directors in order to reflect an adjustment for factors occurring after the close of certain foreign markets but before the close of the New York Stock Exchange.
| ▲ | At December 31, 2011, the cost of securities for federal income tax purposes was $409,585 and the aggregate gross unrealized appreciation and depreciation based on that cost were: |
| Unrealized Appreciation | | $ | 56,399 | |
| Unrealized Depreciation | | | (30,829 | ) |
| Net Unrealized Appreciation | | $ | 25,570 | |
The accompanying notes are an integral part of these financial statements.
| § | These securities were sold to the Fund under Regulation S, rules governing offers and sales made outside the United States without registration under the Securities Act of 1933. The Fund may only be able to resell these securities in the United States if an exemption from registration under the federal and state securities laws is available, or the Fund may only be able to sell these securities outside of the United States (such as on a foreign exchange) to a non-U.S. person. Unless otherwise indicated, these holdings are determined to be liquid. At December 31, 2011, the aggregate value of these securities was $7,280, which represents 1.7% of total net assets. |
| ╪ | See Significant Accounting Policies of accompanying Notes to Financial Statements regarding valuation of securities. |
The accompanying notes are an integral part of these financial statements.
| Hartford Global Growth HLS Fund |
| Investment Valuation Hierarchy Level Summary |
| December 31, 2011 |
| (000’s Omitted) |
| | | Total | | | Level 1 ® | | | Level 2 ® | | | Level 3 | |
| Assets: | | | | | | | | | | | | | | | | |
| Common Stocks | | | | | | | | | | | | | | | | |
| Automobiles & Components | | $ | 11,885 | | | $ | 7,017 | | | $ | 4,868 | | | $ | — | |
| Banks | | | 12,607 | | | | 5,557 | | | | 7,050 | | | | — | |
| Capital Goods | | | 41,101 | | | | 11,316 | | | | 29,785 | | | | — | |
| Consumer Durables & Apparel | | | 9,446 | | | | 4,450 | | | | 4,996 | | | | — | |
| Consumer Services | | | 20,874 | | | | 9,230 | | | | 11,644 | | | | — | |
| Diversified Financials | | | 28,274 | | | | 23,978 | | | | 4,296 | | | | — | |
| Energy | | | 47,278 | | | | 42,212 | | | | 5,066 | | | | — | |
| Food, Beverage & Tobacco | | | 11,389 | | | | 4,680 | | | | 6,709 | | | | — | |
| Health Care Equipment & Services | | | 11,639 | | | | 11,639 | | | | — | | | | — | |
| Insurance | | | 3,548 | | | | — | | | | 3,548 | | | | — | |
| Materials | | | 28,668 | | | | 10,420 | | | | 18,248 | | | | — | |
| Media | | | 16,730 | | | | 12,171 | | | | 4,559 | | | | — | |
| Pharmaceuticals, Biotechnology & Life Sciences | | | 20,766 | | | | 18,570 | | | | 2,196 | | | | — | |
| Retailing | | | 18,549 | | | | 18,549 | | | | — | | | | — | |
| Semiconductors & Semiconductor Equipment | | | 25,811 | | | | 13,928 | | | | 11,883 | | | | — | |
| Software & Services | | | 51,162 | | | | 51,162 | | | | — | | | | — | |
| Technology Hardware & Equipment | | | 44,646 | | | | 39,366 | | | | 5,280 | | | | — | |
| Telecommunication Services | | | 5,180 | | | | 5,180 | | | | — | | | | — | |
| Transportation | | | 14,756 | | | | 10,325 | | | | 4,431 | | | | — | |
| Total | | | 424,309 | | | | 299,750 | | | | 124,559 | | | | — | |
| Short-Term Investments | | | 10,846 | | | | — | | | | 10,846 | | | | — | |
| Total | | $ | 435,155 | | | $ | 299,750 | | | $ | 135,405 | | | $ | — | |
| ♦ | For the year ended December 31, 2011, there were no significant transfers between Level 1 and Level 2. |
The accompanying notes are an integral part of these financial statements.
| Hartford Global Growth HLS Fund |
| Statement of Assets and Liabilities |
| December 31, 2011 |
| (000’s Omitted) |
| Assets: | | | | |
| Investments in securities, at market value (cost $408,716) | | $ | 435,155 | |
| Cash | | | 1 | |
| Receivables: | | | | |
| Fund shares sold | | | 289 | |
| Dividends and interest | | | 262 | |
| Total assets | | | 435,707 | |
| Liabilities: | | | | |
| Bank overdraft - foreign cash | | | — | |
| Payables: | | | | |
| Fund shares redeemed | | | 424 | |
| Investment management fees | | | 72 | |
| Distribution fees | | | 5 | |
| Accrued expenses | | | 55 | |
| Total liabilities | | | 556 | |
| Net assets | | $ | 435,151 | |
| Summary of Net Assets: | | | | |
| Capital stock and paid-in-capital | | $ | 584,304 | |
| Undistributed net investment income | | | 2,274 | |
| Accumulated net realized loss | | | (177,875 | ) |
| Unrealized appreciation of investments and the translations of assets and liabilities denominated in foreign currency | | | 26,448 | |
| Net assets | | $ | 435,151 | |
| Shares authorized | | | 3,400,000 | |
| Par value | | | $ 0.001 | |
| Class IA: Net asset value per share | | $ | 13.45 | |
| Shares outstanding | | | 26,247 | |
| Net assets | | $ | 352,947 | |
| Class IB: Net asset value per share | | $ | 13.34 | |
| Shares outstanding | | | 6,162 | |
| Net assets | | $ | 82,204 | |
The accompanying notes are an integral part of these financial statements.
| Hartford Global Growth HLS Fund |
| Statement of Operations |
| For the Year Ended December 31, 2011 |
| (000’s Omitted) |
| Investment Income: | | | | |
| Dividends | | $ | 7,339 | |
| Interest | | | 7 | |
| Less: Foreign tax withheld | | | (574 | ) |
| Total investment income, net | | | 6,772 | |
| | | | | |
| Expenses: | | | | |
| Investment management fees | | | 3,986 | |
| Transfer agent fees | | | 2 | |
| Distribution fees - Class IB | | | 257 | |
| Custodian fees | | | 31 | |
| Accounting services fees | | | 75 | |
| Board of Directors' fees | | | 13 | |
| Audit fees | | | 14 | |
| Other expenses | | | 168 | |
| Total expenses (before fees paid indirectly) | | | 4,546 | |
| Commission recapture | | | (10 | ) |
| Total fees paid indirectly | | | (10 | ) |
| Total expenses, net | | | 4,536 | |
| Net investment income | | | 2,236 | |
| | | | | |
| Net Realized Gain on Investments and Foreign Currency Transactions: | | | | |
| Net realized gain on investments | | | 52,169 | |
| Net realized gain on foreign currency contracts | | | 33 | |
| Net realized gain on other foreign currency transactions | | | 15 | |
| Net Realized Gain on Investments and Foreign Currency Transactions | | | 52,217 | |
| | | | | |
| Net Changes in Unrealized Depreciation of Investments and Foreign Currency Transactions: | | | | |
| Net unrealized depreciation of investments | | | (126,296 | ) |
| Net unrealized appreciation of foreign currency contracts | | | 6 | |
| Net unrealized depreciation on translation of other assets and liabilities in foreign currencies | | | (10 | ) |
| Net Changes in Unrealized Depreciation of Investments and Foreign Currency Transactions | | | (126,300 | ) |
| Net Loss on Investments and Foreign Currency Transactions | | | (74,083 | ) |
| Net Decrease in Net Assets Resulting from Operations | | $ | (71,847 | ) |
The accompanying notes are an integral part of these financial statements.
| Hartford Global Growth HLS Fund |
| Statement of Changes in Net Assets |
|
| |
| (000’s Omitted) |
| | | For the | | | For the | |
| | | Year Ended | | | Year Ended | |
| | | December 31, | | | December 31, | |
| | | 2011 | | | 2010 | |
| Operations: | | | | | | |
| Net investment income | | $ | 2,236 | | | $ | 1,273 | |
| Net realized gain on investments and foreign currency transactions | | | 52,217 | | | | 30,096 | |
| Net unrealized appreciation (depreciation) of investments and foreign currency transactions | | | (126,300 | ) | | | 43,323 | |
| Net Increase (Decrease) In Net Assets Resulting From Operations | | | (71,847 | ) | | | 74,692 | |
| Distributions to Shareholders: | | | | | | | | |
| From net investment income | | | | | | | | |
| Class IA | | | (149 | ) | | | (1,190 | ) |
| Class IB | | | — | | | | (60 | ) |
| Total distributions | | | (149 | ) | | | (1,250 | ) |
| Capital Share Transactions: | | | | | | | | |
| Class IA | | | | | | | | |
| Sold | | | 25,684 | | | | 28,002 | |
| Issued on reinvestment of distributions | | | 149 | | | | 1,190 | |
| Redeemed | | | (99,236 | ) | | | (92,308 | ) |
| Total capital share transactions | | | (73,403 | ) | | | (63,116 | ) |
| Class IB | | | | | | | | |
| Sold | | | 12,370 | | | | 13,416 | |
| Issued on reinvestment of distributions | | | — | | | | 60 | |
| Redeemed | | | (35,398 | ) | | | (35,503 | ) |
| Total capital share transactions | | | (23,028 | ) | | | (22,027 | ) |
| Net decrease from capital share transactions | | | (96,431 | ) | | | (85,143 | ) |
| Proceeds from regulatory settlements | | | — | | | | 239 | |
| Net Decrease In Net Assets | | | (168,427 | ) | | | (11,462 | ) |
| Net Assets: | | | | | | | | |
| Beginning of period | | | 603,578 | | | | 615,040 | |
| End of period | | $ | 435,151 | | | $ | 603,578 | |
| Undistributed (distribution in excess of) net investment income | | $ | 2,274 | | | $ | 247 | |
| Shares: | | | | | | | | |
| Class IA | | | | | | | | |
| Sold | | | 1,683 | | | | 2,031 | |
| Issued on reinvestment of distributions | | | 11 | | | | 81 | |
| Redeemed | | | (6,477 | ) | | | (6,732 | ) |
| Total share activity | | | (4,783 | ) | | | (4,620 | ) |
| Class IB | | | | | | | | |
| Sold | | | 819 | | | | 985 | |
| Issued on reinvestment of distributions | | | — | | | | 5 | |
| Redeemed | | | (2,308 | ) | | | (2,603 | ) |
| Total share activity | | | (1,489 | ) | | | (1,613 | ) |
The accompanying notes are an integral part of these financial statements.
| Hartford Global Growth HLS Fund |
| Notes to Financial Statements |
| December 31, 2011 |
| (000’s Omitted) |
Hartford Global Growth HLS Fund (the “Fund”) serves as an underlying investment option for certain variable annuity and variable life insurance separate accounts of Hartford Life Insurance Company (“HLIC”) and its affiliates and certain qualified retirement plans. The Fund may also serve as an underlying investment option for certain variable annuity and variable life separate accounts of other insurance companies. Owners of variable annuity contracts and policyholders of variable life insurance contracts may choose the funds permitted in the variable insurance contract prospectus. In addition, participants in certain qualified retirement plans may choose the Fund if permitted by their plans.
Hartford Series Fund, Inc. (the “Company”) is an open-end registered management investment company comprised of thirty portfolios. Financial Statements for the Fund, a series of the Company, are included in this report.
The Company is organized under the laws of the State of Maryland and is registered with the Securities and Exchange Commission (“SEC”) under the Investment Company Act of 1940, as amended (“1940 Act”). The Fund is a diversified open-end management investment company.
The Fund is divided into Class IA and Class IB shares. Each class is offered at the per share net asset value (“NAV”) without a sales charge and is subject to the same expenses, except that the Class IB shares are subject to distribution and service fees charged pursuant to a Distribution Plan adopted in accordance with Rule 12b-1 under the 1940 Act.
| 2. | Significant Accounting Policies: |
The following is a summary of significant accounting policies of the Fund in the preparation of its financial statements, which are in accordance with the United States Generally Accepted Accounting Principles (“U.S. GAAP”). The preparation of financial statements in accordance with U.S. GAAP may require management to make estimates and assumptions that affect the reported amounts of assets and liabilities and disclosure of contingent assets and liabilities at the date of the financial statements and the reported amounts of increases and decreases in net assets from operations during the reporting period. Actual results could differ from those estimates.
| a) | Determination of Net Asset Value – The NAV of each class of the Fund’s shares is determined as of the close of regular trading (normally 4:00 p.m. Eastern Time) (the “NYSE Close”) on each day that the New York Stock Exchange (the “Exchange”) is open (“Valuation Date”). Information that becomes known to the Fund after the NAV has been calculated on a particular day will not generally be used to retroactively adjust the NAV determined earlier that day. |
| b) | Investment Valuation and Fair Value Measurements – For purposes of calculating the NAV, portfolio securities and other assets held by the Fund's portfolio for which market quotes are readily available are valued at market value. Market value is generally determined on the basis of last reported sales prices or official close price. If no sales are reported, market value is based on quotes obtained from a quotation reporting system, established market makers, or independent pricing services. If market prices are not readily available or are deemed unreliable, the Fund will use the fair value of the security as determined in good faith under policies and procedures established by and under the supervision of the Company’s Board of Directors. Market quotes are considered not readily available where there is an absence of current or reliable market-based data (e.g., trade information or broker quotes), including where events occur after the close of the relevant market, but prior to the NYSE Close that materially affect the values of the Fund’s portfolio securities or assets. In addition, market quotes are considered not readily available when, due to extraordinary circumstances, the exchanges or markets on which the securities trade do not open for trading for the entire day and no other market prices are available. In addition, prices of foreign equities that are principally traded on certain foreign markets are adjusted daily pursuant to a fair value pricing service approved by the Board of Directors in order to reflect an adjustment for the factors occurring after the close of certain foreign markets but before the NYSE Close. Securities that are primarily traded on foreign markets may trade on days that are not business days of the Fund. The value of the foreign securities in which the Fund invests may change on days when a shareholder will not be able to purchase or redeem shares of the |
Fund. Fair value pricing is subjective in nature and the use of fair value pricing by the Fund may cause the NAV of its shares to differ significantly from the NAV that would have been calculated using market prices at the close of the exchange on which a portfolio security is primarily traded. There can be no assurance that the Fund could obtain the fair market value assigned to a security if the Fund were to sell the security at approximately the time at which the Fund determines its NAV.
Investments valued in currencies other than U.S. dollars are converted to U.S. dollars using exchange rates obtained from independent pricing services for calculation of the NAV. As a result, the NAV of the Fund’s shares may be affected by changes in the value of currencies in relation to the U.S. dollar. The value of securities traded in markets outside the United States or denominated in currencies other than the U.S. dollar may be affected significantly on a day that the NYSE is closed and the market value may change on days when an investor is not able to purchase, redeem or exchange shares of the Fund.
Foreign currency contracts represent agreements to exchange currencies on specific future dates at predetermined rates. Foreign currency contracts are valued using foreign currency exchange rates and forward rates as provided by an independent pricing service on the Valuation Date.
Financial instruments for which prices are not available from an independent pricing service may be valued using market quotations obtained from one or more dealers that make markets in the respective financial instrument in accordance with procedures established by the Company’s Board of Directors.
U.S. GAAP defines fair value as the price that the Fund would receive to sell an asset or pay to transfer a liability in an orderly transaction between market participants. The U.S. GAAP fair value measurement standards require disclosure of a fair value hierarchy for each major category of assets and liabilities. Various inputs are used in determining the fair value of the Fund’s investments. These inputs are summarized into three broad hierarchy levels. This hierarchy is based on whether the valuation inputs are observable or unobservable. These levels are:
| · | Level 1 – Quoted prices in active markets for identical securities. Level 1 may include exchange traded instruments, such as domestic equities, some foreign equities, options, futures, mutual funds, exchange traded funds, rights and warrants. |
| · | Level 2 – Observable inputs other than Level 1 prices, such as quoted prices for similar securities; quoted prices in markets that are not active; or other inputs that are observable or can be corroborated by observable market data. Level 2 may include debt securities that are traded less frequently than exchange traded instruments and which are valued using independent pricing services; foreign equities, that are principally traded on certain foreign markets and are adjusted daily pursuant to a fair value pricing service in order to reflect an adjustment for the factors occurring after the close of certain foreign markets but before the NYSE Close; and short-term securities, which are valued at amortized cost. |
| · | Level 3 – Significant unobservable inputs that are supported by limited or no market activity. Level 3 may include financial instruments whose values are determined using broker quotes or require significant management judgment or estimation. These unobservable valuation inputs may include estimates for current yields, maturity/duration, prepayment speed, and broker quotes for comparable securities along with other assumptions relating to credit quality, collateral value, complexity of the security structure, general market conditions and liquidity. This category may include securities where trading has been halted or there are certain restrictions on trading. While these securities are priced using unobservable inputs, the valuation of these securities reflects the best available data and management believes the prices are a reasonable representation of exit price. |
Valuation levels are not necessarily indicative of the risk associated with investing in such securities. Individual securities within any of the above mentioned asset classes may be assigned a different hierarchical level than those presented above, as individual circumstances dictate.
| Hartford Global Growth HLS Fund |
| Notes to Financial Statements – (continued) |
| December 31, 2011 |
| (000’s Omitted) |
During the year ended December 31, 2011, the Fund held no Level 3 securities; therefore, no reconciliation of Level 3 securities is presented.
For additional information, refer to the Investment Valuation Hierarchy Level Summary which follows the Schedule of Investments.
For purposes of reporting transfers between different hierarchy levels, both transfers in and out of each level, as applicable, are shown as if they occurred at the beginning of the period.
| c) | Security Transactions and Investment Income – Security transactions are recorded as of the trade date (the date the order to buy or sell is executed) for financial reporting purposes. Securities purchased or sold on a when-issued or delayed-delivery basis may be settled a month or more after the trade date. Realized gains and losses are determined on the basis of identified cost. |
Dividend income is accrued as of the ex-dividend date, except certain dividends from foreign securities where the ex-dividend date may have passed are recorded as soon as the Fund is informed of the dividend. Interest income, including amortization of premium and accretion of discounts, is accrued on a daily basis.
| d) | Foreign Currency Transactions – Assets and liabilities denominated in currencies other than U.S. dollars are translated into U.S. dollars at the exchange rates in effect on the valuation date. Purchases and sales of investment securities, income, and expenses are translated into U.S. dollars at the exchange rates on the dates of such transactions. |
The Fund does not isolate that portion of portfolio security valuation resulting from fluctuations in the foreign currency exchange rates from the fluctuations arising from changes in the market prices of securities held. Exchange rate fluctuations are included with the net realized and unrealized gain or loss on investments in the accompanying financial statements.
Net realized foreign exchange gains or losses arise from sales of foreign currencies and the difference between asset and liability amounts initially stated in foreign currencies and the U.S. dollar value of the amounts actually received or paid. Net unrealized foreign exchange gains or losses arise from changes in the value of other assets and liabilities at the end of the reporting period, resulting from changes in the exchange rates.
| e) | Joint Trading Account – The Fund may invest cash balances into a joint trading account that may be invested in one or more repurchase agreements. |
| f) | Fund Share Valuation and Dividend Distributions to Shareholders – Orders for the Fund’s shares are executed in accordance with the investment instructions of the contract holders and plan participants. The NAV of the Fund’s shares is determined as of the close of business on each business day of the Exchange. The NAV is determined separately for each class of shares of the Fund by dividing the Fund’s net assets attributable to that class by the number of shares of the class outstanding. Each class of shares offered by the Fund has equal rights as to assets and voting privileges (except that shareholders of a class have exclusive voting rights regarding any matter relating solely to that class of shares). Income and non-class specific expenses are allocated daily to each class on the basis of the relative net assets of the class. Realized and unrealized capital gains and losses are allocated daily based on the relative net assets of each class of shares of the Fund. |
Orders for the purchase of the Fund’s shares received prior to the close of the Exchange on any day the Exchange is open for business are priced at the NAV determined as of the close of the Exchange. Orders received after the close of the Exchange, or on a day on which the Exchange and/or the Fund is not open for business, are priced at the next determined NAV.
Dividends are declared pursuant to a policy adopted by the Company’s Board of Directors based upon the investment performance of the Fund. The policy of the Fund is to pay dividends from net investment income and realized capital gains, if any, at least once a year.
Distributions from net investment income, net realized capital gains and capital are determined in accordance with federal income tax regulations, which may differ from U.S. GAAP with respect to character and timing. These differences may include but are not limited to losses deferred due to wash sale adjustments, foreign currency gains and losses, adjustments related to Passive Foreign Investment Companies (“PFICs”), Real Estate Investment Trusts (“REITs”), Regulated Investment Companies (“RICs”), certain derivatives and partnerships. Permanent book and federal income tax basis differences relating to shareholder distributions will result in reclassifications to certain of the Fund’s capital accounts (see Federal Income Taxes: Reclassification of Capital Accounts note).
| 3. | Securities and Other Investments: |
| a) | Repurchase Agreements – A repurchase agreement is an agreement by which a counterparty agrees to sell a security and agrees to repurchase the security sold at a mutually agreed upon time and price. At the time the Fund enters into a repurchase agreement, the value of the underlying collateral security(ies), including accrued interest, will be equal to or exceed the value of the repurchase agreement. Repurchase agreements expose the Fund to counterparty risk. To minimize counterparty risk, the securities that serve to collateralize the repurchase agreement are held by the Fund's custodian in book entry or physical form in the custodial account of the Fund or in a third party custodial account. Repurchase agreements are valued at cost plus accrued interest. The Fund, as shown on the Schedule of Investments, had outstanding repurchase agreements as of December 31, 2011. |
| b) | Illiquid and Restricted Securities – The Fund is permitted to invest up to 15% of its net assets in illiquid securities. Illiquid securities are those that may not be sold or disposed of in the ordinary course of business within seven days, at approximately the price used to determine the Fund’s NAV. The Fund may not be able to sell illiquid securities or other investments when its sub-adviser considers it desirable to do so or may have to sell such securities or investments at a price that is lower than the price that could be obtained if the securities or investments were more liquid. A sale of illiquid securities or other investments may require more time and may result in higher dealer discounts and other selling expenses than does the sale of those that are liquid. Illiquid securities and investments also may be more difficult to value due to the unavailability of reliable market quotations for such securities or investments, and an investment in them may have an adverse impact on the Fund’s NAV. The Fund may also purchase certain restricted securities that can only be resold to certain qualified investors and may be determined to be liquid pursuant to policies and guidelines established by the Company’s Board of Directors. The Fund, as shown on the Schedule of Investments, had illiquid and/or restricted securities as of December 31, 2011. |
| c) | Securities Purchased on a When-Issued or Delayed-Delivery Basis – Delivery and payment for securities that have been purchased by the Fund on a forward commitment, or when-issued or delayed-delivery basis, take place beyond the customary settlement period. A fund may dispose of or renegotiate a delayed-delivery transaction after it is entered into, and may sell delayed-delivery securities before they are delivered, which may result in a realized gain or loss. During this period, such securities are subject to market fluctuations, and the Fund identifies securities segregated in its records with value at least equal to the amount of the commitment. As of December 31, 2011, the Fund had no outstanding when-issued or delayed delivery securities. |
| 4. | Financial Derivative Instruments: |
The following disclosures contain information on how and why the Fund uses derivative instruments, the credit-risk-related contingent features in certain derivative instruments, and how derivative instruments affect the Fund’s financial position and results of operations. The location and fair value amounts of these instruments on the Statement of Assets
| Hartford Global Growth HLS Fund |
| Notes to Financial Statements – (continued) |
| December 31, 2011 |
| (000’s Omitted) |
and Liabilities and the realized gains and losses and changes in unrealized gains and losses on the Statement of Operations, each categorized by type of derivative contract, are included in the following Additional Derivative Instrument Information footnote. The derivative instruments outstanding as of period-end are disclosed in the notes to the Schedule of Investments and the amounts of realized gains and losses and changes in unrealized gains and losses on derivative instruments during the period are disclosed in the Statement of Operations.
| a) | Foreign Currency Contracts – The Fund may enter into foreign currency contracts that obligate the Fund to purchase or sell currencies at specified future dates. Foreign currency contracts are used to hedge the currency exposure associated with some or all of the Fund's securities and/or as part of an investment strategy. Foreign currency contracts are marked to market daily and the change in value is recorded by the Fund as an unrealized gain or loss. The Fund will record a realized gain or loss when the foreign currency contract is settled. |
Foreign currency contracts involve elements of market risk in excess of the amounts reflected in the Statement of Assets and Liabilities. In addition, risks may arise upon entering into these contracts from the potential inability of the counterparties to meet the terms of the contracts and from unanticipated movements in the value of the foreign currencies relative to the U.S. dollar. The Fund had no outstanding foreign currency contracts as of December 31, 2011.
| b) | Additional Derivative Instrument Information: |
The volume of derivative activity was minimal during the year ended December 31, 2011.
The Effect of Derivative Instruments on the Statement of Operations for the year ended December 31, 2011:
| | | Risk Exposure Category | |
| | | | | | Foreign | | | | | | | | | | | | | | | | |
| | | Interest Rate | | | Exchange | | | Credit | | | Equity | | | Commodity | | | Other | | | | |
| | | Contracts | | | Contracts | | | Contracts | | | Contracts | | | Contracts | | | Contracts | | | Total | |
| Realized Gain (Loss) on Derivatives Recognized as a Result of Operations: |
| Net realized gain on foreign currency contracts | | $ | — | | | $ | 33 | | | $ | — | | | $ | — | | | $ | — | | | $ | — | | | $ | 33 | |
| Total | | $ | — | | | $ | 33 | | | $ | — | | | $ | — | | | $ | — | | | $ | — | | | $ | 33 | |
| | | | | | | | | | | | | | | | | | | | | | | | | | | | | |
| Net Change in Unrealized Appreciation (Depreciation) on Derivatives Recognized as a Result of Operations: |
| Net change in unrealized appreciation of foreign currency contracts | | $ | — | | | $ | 6 | | | $ | — | | | $ | — | | | $ | — | | | $ | — | | | $ | 6 | |
| Total | | $ | — | | | $ | 6 | | | $ | — | | | $ | — | | | $ | — | | | $ | — | | | $ | 6 | |
| a) | Counterparty Risk – The Fund may be exposed to counterparty risk, or the risk that an institution or other entity with which the Fund has unsettled or open transactions will default. |
| b) | Market Risks – If the Fund invests directly in foreign currencies or in securities that trade in, and receive revenues in, foreign currencies, or in derivatives that provide exposure to foreign currencies, it will be subject to the risk that those currencies will decline in value relative to the base currency of the Fund, or, in the case of hedging positions, that the Fund’s base currency will decline in value relative to the currency being hedged. Currency rates in foreign countries may fluctuate significantly over short periods of time for a number of reasons, including changes in interest rates, intervention (or the failure to intervene) by U.S. or foreign governments, central banks or supranational entities, such as the International Monetary Fund, or by the imposition of currency controls or other political developments in the United States or abroad. As a result, the Fund’s investments in foreign currency denominated securities may reduce the returns of the Fund. The market values of equity securities, such as common stocks and preferred stocks, or equity related investments, such as futures and options, may decline due to general market conditions which are not specifically related |
to a particular company, such as real or perceived adverse economic conditions, changes in the general outlook for corporate earnings, changes in interest or currency rates or adverse investor sentiment generally. The market value of equity securities may also decline due to factors which affect a particular industry or industries, such as labor shortages or increased production costs and competitive conditions within an industry. Equity securities and equity related investments generally have greater market price volatility than fixed income securities.
| a) | Federal Income Taxes – For federal income tax purposes, the Fund intends to continue to qualify as a RIC under Subchapter M of the Internal Revenue Code (“IRC”) by distributing substantially all of its taxable net investment income and net realized capital gains to its shareholders and otherwise complying with the requirements of RICs. The Fund has distributed substantially all of its income and capital gains in prior years, if applicable, and intends to distribute substantially all of its income and capital gains prior to the next fiscal year-end. Accordingly, no provision for federal income or excise taxes has been made in the accompanying financial statements. Distributions from short-term capital gains are treated as ordinary income distributions for federal income tax purposes. |
| b) | Net Investment Income (Loss), Net Realized Gains (Losses) – Net investment income (loss) and net realized gains (losses) may differ for financial statement and tax purposes primarily because of losses deferred due to wash sale adjustments, foreign currency gains and losses, adjustments related to PFICs, REITs, RICs, certain derivatives and partnerships. The character of distributions made during the year from net investment income or net realized gains may differ from their ultimate characterization for federal income tax purposes. Also, due to the timing of dividend distributions, the fiscal year in which amounts are distributed may differ from the year that the income or realized gains (losses) were recorded by the Fund. |
| c) | Distributions and Components of Distributable Earnings – The tax character of distributions paid by the Fund for the periods indicated is as follows (as adjusted for dividends payable): |
| | | For the Year Ended | | | For the Year Ended | |
| | | December 31, 2011 | | | December 31, 2010 | |
| Ordinary Income | | $ | 149 | | | $ | 1,250 | |
As of December 31, 2011, the Fund’s components of distributable earnings (deficit) on a tax basis were as follows:
| | | Amount | |
| Undistributed Ordinary Income | | $ | 2,274 | |
| Accumulated Capital and Other Losses* | | | (177,006 | ) |
| Unrealized Appreciation† | | | 25,579 | |
| Total Accumulated Deficit | | $ | (149,153 | ) |
| * | The Fund has capital loss carryforwards that are identified in the Capital Loss Carryforward note that follows. |
| † | The difference between book-basis and tax-basis unrealized appreciation (depreciation) may be attributable to the losses deferred due to wash sale adjustments, foreign currency gains and losses, adjustments related to PFICs, REITs, RICs, certain derivatives and partnerships. |
| Hartford Global Growth HLS Fund |
| Notes to Financial Statements – (continued) |
| December 31, 2011 |
| (000’s Omitted) |
| d) | Reclassification of Capital Accounts – The Fund may record reclassifications in its capital accounts. These reclassifications have no impact on the total net assets of the Fund. The reclassifications are a result of permanent differences between U.S. GAAP and tax accounting for such items as foreign currency, PFICs, expiration or utilization of capital loss carryforwards or net operating losses. Adjustments are made to reflect the impact these items have on current and future distributions to shareholders. Therefore, the source of the Fund’s distributions may be shown in the accompanying Statement of Changes in Net Assets as from undistributed net investment income, from accumulated net realized gains on investments or from capital depending on the type of book and tax differences that exist. For the year ended December 31, 2011, the Fund recorded reclassifications to increase (decrease) the accounts listed below: |
| | | Amount | |
| Undistributed Net Investment Income | | $ | (60 | ) |
| Accumulated Net Realized Gain (Loss) | | | 60 | |
| e) | Capital Loss Carryforward – On December 22, 2010, the Regulated Investment Company Modernization Act of 2010 (the “Act”) was enacted, which made changes to the capital loss carryforward rules. The changes are effective for taxable years beginning after the date of enactment. Under the Act, funds are permitted to carry forward capital losses for an unlimited period. However, any losses incurred during those future taxable years will be required to be utilized prior to the losses incurred in pre-enactment taxable years, which carry an expiration date. As a result of this ordering rule, pre-enactment capital loss carryforwards may be more likely to expire unused. Additionally, post-enactment capital loss carryforwards will retain their character as either short-term or long-term capital losses rather than being considered all short-term as permitted under prior regulation. |
At December 31, 2011 (tax-year-end), the Fund had capital loss carryforwards for U.S. federal income tax purposes of approximately:
| Year of Expiration | | Amount | |
| 2016 | | $ | 14,541 | |
| 2017 | | | 162,465 | |
| Total | | $ | 177,006 | |
As of December 31, 2011, the Fund utilized $52,908 of prior year capital loss carryforwards.
| f) | Accounting for Uncertainty in Income Taxes – The Fund has adopted financial reporting rules that require the Fund to analyze all open tax years, as defined by the statute of limitations, for all major jurisdictions. Generally, tax authorities can examine all tax returns filed for the last three years. The Fund does not have an examination in progress. |
The Fund has reviewed all open tax years and major jurisdictions and concluded that these financial reporting rules had no effect on the Fund’s financial position or results of operations. There is no tax liability resulting from unrecognized tax benefits relating to uncertain income tax positions taken or expected to be taken on the tax return for the fiscal year ended December 31, 2011. The Fund is also not aware of any tax positions for which it is reasonably possible that the total amounts of unrecognized tax benefits will significantly change in the next twelve months.
| a) | Investment Management Agreement – HL Investment Advisors, LLC (“HL Advisors”), an indirect wholly owned subsidiary of The Hartford Financial Services Group, Inc. (“The Hartford”), serves as investment manager to the Fund pursuant to an Investment Management Agreement with the Company. As investment manager, HL Advisors has overall investment supervisory responsibility for the Fund. In addition, HL Advisors provides administrative personnel, services, equipment, facilities and office space for proper operation of the Fund. HL Advisors has contracted with Wellington Management Company, LLP (“Wellington Management”) under a sub-advisory agreement for the provision of day-to- |
day investment management services to the Fund in accordance with the Fund’s investment objective and policies. The Fund pays a fee to HL Advisors, a portion of which may be used to compensate Wellington Management.
The schedule below reflects the rates of compensation paid to HL Advisors for investment management services rendered as of December 31, 2011; the rates are accrued daily and paid monthly.
| Average Daily Net Assets | Annual Fee |
| On first $250 million | 0.7750% |
| On next $250 million | 0.7250% |
| On next $500 million | 0.6750% |
| On next $4 billion | 0.6250% |
| On next $5 billion | 0.6225% |
| Over $10 billion | 0.6200% |
| b) | Accounting Services Agreement – Pursuant to the Fund Accounting Agreement between HLIC and the Company, on behalf of the Fund, HLIC provides accounting services to the Fund and receives monthly compensation based on the Fund’s average daily net assets at the rates set forth below. The Fund’s accounting services fees are accrued daily and paid monthly. |
| Average Daily Net Assets | Annual Fee |
| On first $5 billion | 0.014% |
| On next $5 billion | 0.012% |
| Over $10 billion | 0.010% |
| | c) | Operating Expenses – Allocable expenses incurred by the Company are allocated to each Fund and allocated to classes within a Fund in proportion to the average daily net assets of the Fund and each class, except where allocation of certain expenses is more fairly made directly to the Fund or to specific classes within a Fund. |
| d) | Fees Paid Indirectly – The Company, on behalf of the Fund, has entered into agreements with State Street Global Markets, LLC and Russell Implementation Services, Inc. to partially recapture non-discounted trade commissions. Such rebates are used to pay a portion of the Fund’s expenses. In addition, the Fund’s custodian bank has also agreed to reduce its fees when the Fund maintains cash on deposit in a non-interest-bearing custody account. For the year ended December 31, 2011, these amounts, if any, are included in the Statement of Operations. |
The ratio of expenses to average net assets in the accompanying financial highlights excludes the reduction in expenses related to fees paid indirectly. The annualized expense ratio for the period listed below reflecting the reduction for fees paid indirectly is as follows:
| | | Year Ended | |
| | | December 31, 2011 | |
| Class IA | | | 0.80 | % |
| Class IB | | | 1.05 | |
| e) | Distribution Plan for Class IB shares – The Company, on behalf of the Fund, has adopted a Distribution Plan pursuant to Rule 12b-1 of the 1940 Act to compensate the Distributor, Hartford Securities Distribution Company, Inc. (a wholly owned, ultimate subsidiary of The Hartford), from assets attributable to the Class IB shares for services rendered and expenses borne in connection with activities primarily intended to result in the sale of the Class IB shares, subject to the review and approval of the Company’s Board of Directors. |
| Hartford Global Growth HLS Fund |
| Notes to Financial Statements – (continued) |
| December 31, 2011 |
| (000’s Omitted) |
The Distribution Plan provides that the Fund may pay annually up to 0.25% of the average daily net assets of the Fund attributable to its Class IB shares for activities primarily intended to result in the sale of Class IB shares. The Board has the authority to suspend or reduce these payments at any point in time. Under the terms of the Distribution Plan and the principal underwriting agreement, the Fund is authorized to make payments monthly to the Distributor that may be used to pay or compensate entities providing distribution and shareholder servicing with respect to the Class IB shares for such entities’ fees or expenses incurred or paid in that regard. These fees are accrued daily and paid monthly.
| f) | Other Related Party Transactions – Certain officers of the Fund are directors and/or officers of HL Advisors and/or The Hartford or its subsidiaries. For the year ended December 31, 2011, a portion of the Fund’s chief compliance officer’s salary was paid by all the investment companies in the Hartford fund complex. The portion allocated to the Fund was in the amount of $1. Hartford Administrative Services Company (“HASCO”), an indirect wholly owned subsidiary of The Hartford, provides transfer agent services to the Fund. HASCO was compensated on a per account basis for providing such services. The amount paid to HASCO can be found in the Statement of Operations. These fees are accrued daily and paid monthly. |
| g) | Payment from Affiliate – In July of 2007, The Hartford entered into a settlement with the Attorneys General of the states of New York, Connecticut and Illinois relating to market timing and the company's individual variable annuity contracts in which certain payments would be made directly to the variable annuity contract holders. The distribution plan provided that unclaimed money from the settlement would be distributed to certain HLS Funds that are investment options through a Hartford individual variable annuity contract. The unclaimed money was distributed to the Fund on September 18, 2009. |
The total return in the accompanying financial highlights includes a payment from an affiliate. Had the payment from the affiliate been excluded, the impact and total return for the period listed below would have been as follows:
| | For the Year Ended December 31, 2009 |
| | Class IA | | Class IB |
| Impact from Payment from Affiliate for Attorneys General Settlement | 0.04 % | | 0.04 % |
| Total Return Excluding Payment from Affiliate | 35.59 | | 35.26 |
| 8. | Investment Transactions: |
For the year ended December 31, 2011, the Fund's aggregate purchases and sales of investment securities (excluding short-term investments) were as follows:
| | | Amount | |
| Cost of Purchases Excluding U.S. Government Obligations | | $ | 303,882 | |
| Sales Proceeds Excluding U.S. Government Obligations | | | 399,237 | |
| 9. | Proceeds from Regulatory Settlement: |
During the year ended December 31, 2010, as a result of a settlement of an administrative proceeding brought by the SEC against an unaffiliated third party relating to market timing and/or late trading of mutual funds, the Fund received $239, which represented the Fund’s portion of the proceeds from the settlement (the Fund was not a party to the proceeding). The proceeds received by the Fund were recorded as an increase to additional paid-in-capital. The payment did not have a material impact on the Fund’s NAV.
The Fund is one of several Hartford funds that participate in a $500 million committed revolving line of credit facility. The facility is to be used for temporary or emergency purposes. Under the arrangement, the funds are required to own securities having a market value in excess of 300% of the total bank borrowings. The interest rate on borrowings varies depending on the nature of the loan. The facility also requires a fee to be paid based on the amount of the commitment. This commitment fee is allocated to all of the funds participating in the line of credit based on the average net assets of the funds. During the year ended December 31, 2011, the Fund did not have any borrowings under this facility.
| 11. | Industry Classifications: |
Other than the industry classifications “Other Investment Pools and Funds” and “Exchange Traded Funds,” equity industry classifications used in this report are the Global Industry Classification Standard, which was developed by and is the exclusive property and service mark of MSCI, Inc. and Standard & Poor’s.
Under the Company’s organizational documents, the Company shall indemnify its officers and directors to the full extent required or permitted under Maryland General Corporation Law and the federal securities laws. In addition, the Company, on behalf of the Fund, may enter into contracts that contain a variety of indemnifications. The Company’s maximum exposure under these arrangements is unknown. However, as of the date of these financial statements, the Company has not had prior claims or losses pursuant to these contracts and expects the risk of loss to be remote.
| Hartford Global Growth HLS Fund |
| Finanacial Highlights |
| - Selected Per-Share Data (A) - |
| | | Net Asset | | | | | | | | | Net Realized | | | | | | | | | | | | | | | | | | Net Increase | | | | |
| | | Value at | | | | | | | | | and Unrealized | | | Total from | | | Dividends from | | | Distributions | | | | | | | | | (Decrease) in | | | Net Asset | |
| | | Beginning of | | | Net Investment | | | Payments from | | | Gain (Loss) on | | | Investment | | | Net Investment | | | from Realized | | | Distributions | | | Total | | | Net Asset | | | Value at End of | |
| Class | | Period | | | Income (Loss) | | | (to) Affiliate | | | Investments | | | Operations | | | Income | | | Capital Gains | | | from Capital | | | Distributions | | | Value | | | Period | |
| | | | | | | | | | | | | | | | | | | | | | | | | | | | | | | | | | |
| For the Year Ended December 31, 2011 |
| IA | | $ | 15.62 | | | $ | 0.08 | | | $ | — | | | $ | (2.24 | ) | | $ | (2.16 | ) | | $ | (0.01 | ) | | $ | — | | | $ | — | | | $ | (0.01 | ) | | $ | (2.17 | ) | | $ | 13.45 | |
| IB | | | 15.53 | | | | 0.04 | | | | — | | | | (2.23 | ) | | | (2.19 | ) | | | — | | | | — | | | | — | | | | — | | | | (2.19 | ) | | | 13.34 | |
| | | | | | | | | | | | | | | | | | | | | | | | | | | | | | | | | | | | | | | | | | | | | |
| For the Year Ended December 31, 2010 |
| IA | | | 13.71 | | | | 0.04 | | | | — | | | | 1.91 | | | | 1.95 | | | | (0.04 | ) | | | — | | | | — | | | | (0.04 | ) | | | 1.91 | | | | 15.62 | |
| IB | | | 13.64 | | | | — | | | | — | | | | 1.90 | | | | 1.90 | | | | (0.01 | ) | | | — | | | | — | | | | (0.01 | ) | | | 1.89 | | | | 15.53 | |
| | | | | | | | | | | | | | | | | | | | | | | | | | | | | | | | | | | | | | | | | | | | | |
| For the Year Ended December 31, 2009 |
| IA | | | 10.17 | | | | 0.08 | | | | — | | | | 3.55 | | | | 3.63 | | | | (0.09 | ) | | | — | | | | — | | | | (0.09 | ) | | | 3.54 | | | | 13.71 | |
| IB | | | 10.12 | | | | 0.05 | | | | — | | | | 3.53 | | | | 3.58 | | | | (0.06 | ) | | | — | | | | — | | | | (0.06 | ) | | | 3.52 | | | | 13.64 | |
| | | | | | | | | | | | | | | | | | | | | | | | | | | | | | | | | | | | | | | | | | | | | |
| For the Year Ended December 31, 2008 |
| IA | | | 22.42 | | | | 0.12 | | | | — | | | | (11.56 | ) | | | (11.44 | ) | | | (0.12 | ) | | | (0.69 | ) | | | — | | | | (0.81 | ) | | | (12.25 | ) | | | 10.17 | |
| IB | | | 22.27 | | | | 0.08 | | | | — | | | | (11.47 | ) | | | (11.39 | ) | | | (0.07 | ) | | | (0.69 | ) | | | — | | | | (0.76 | ) | | | (12.15 | ) | | | 10.12 | |
| | | | | | | | | | | | | | | | | | | | | | | | | | | | | | | | | | | | | | | | | | | | | |
| For the Year Ended December 31, 2007 |
| IA | | | 20.09 | | | | 0.03 | | | | — | | | | 4.84 | | | | 4.87 | | | | (0.01 | ) | | | (2.53 | ) | | | — | | | | (2.54 | ) | | | 2.33 | | | | 22.42 | |
| IB | | | 20.02 | | | | (0.02 | ) | | | — | | | | 4.81 | | | | 4.79 | | | | (0.01 | ) | | | (2.53 | ) | | | — | | | | (2.54 | ) | | | 2.25 | | | | 22.27 | |
| (A) | Information presented relates to a share outstanding throughout the indicated period. |
| (B) | The figures do not include sales charges or other fees which may be applied at the variable life insurance, variable annuity or qualified retirement plan product level. Any such additional sales charges or other fees would lower the Fund's performance. |
| (C) | Ratios do not reflect reductions for fees paid indirectly. Please see Fees Paid Indirectly in the Notes to Financial Statements. |
| (D) | Portfolio turnover rate is calculated on the basis of the Fund as a whole without distinguishing between the classes of shares issued. |
| (E) | Total return without the inclusion of the Payment from (to) Affiliate can be found in Expenses in the accompanying Notes to Financial Statements. |
| - Ratios and Supplemental Data - |
| | | | | | | Ratio of Expenses to Average Net | | | Ratio of Expenses to Average Net | | | Ratio of Net Investment Income | | | Portfolio Turnover | |
| Total Return(B) | | | Net Assets at End of Period | | | Assets Before Waivers(C) | | | Assets After Waivers(C) | | | (Loss) to Average Net Assets | | | Rate(D) | |
| | | | | | | | | | | | | | | | | |
| | | | | | | | | | | | | | | | | | | | | | |
| (13.89 | )% | | $ | 352,947 | | | | 0.80 | % | | | 0.80 | % | | | 0.46 | % | | | 57 | % |
| (14.10 | ) | | | 82,204 | | | | 1.05 | | | | 1.05 | | | | 0.22 | | | | — | |
| | | | | | | | | | | | | | | | | | | | | | |
| | | | | | | | | | | | | | | | | | | | | | |
| 14.25 | | | | 484,754 | | | | 0.81 | | | | 0.81 | | | | 0.28 | | | | 62 | |
| 13.96 | | | | 118,824 | | | | 1.06 | | | | 1.06 | | | | 0.03 | | | | — | |
| | | | | | | | | | | | | | | | | | | | | | |
| | | | | | | | | | | | | | | | | | | | | | |
| 35.64 | (E) | | | 488,720 | | | | 0.81 | | | | 0.81 | | | | 0.67 | | | | 70 | |
| 35.31 | (E) | | | 126,320 | | | | 1.06 | | | | 1.06 | | | | 0.42 | | | | — | |
| | | | | | | | | | | | | | | | | | | | | | |
| | | | | | | | | | | | | | | | | | | | | | |
| (52.46 | ) | | | 419,183 | | | | 0.75 | | | | 0.75 | | | | 0.67 | | | | 76 | |
| (52.58 | ) | | | 112,226 | | | | 1.00 | | | | 1.00 | | | | 0.42 | | | | — | |
| | | | | | | | | | | | | | | | | | | | | | |
| | | | | | | | | | | | | | | | | | | | | | |
| 25.05 | | | | 1,028,843 | | | | 0.73 | | | | 0.73 | | | | 0.13 | | | | 75 | |
| 24.74 | | | | 299,788 | | | | 0.98 | | | | 0.98 | | | | (0.11 | ) | | | — | |
| Report of Independent Registered Public Accounting Firm |
| The Board of Directors and Shareholders of |
| Hartford Series Fund, Inc. |
We have audited the accompanying statement of assets and liabilities, including the schedule of investments, of Hartford Global Growth HLS Fund (one of the portfolios constituting Hartford Series Fund, Inc. (the Funds)) as of December 31, 2011, and the related statement of operations for the year then ended, the statements of changes in net assets for each of the two years in the period then ended, and the financial highlights for each of the five years in the period then ended. These financial statements and financial highlights are the responsibility of the Funds’ management. Our responsibility is to express an opinion on these financial statements and financial highlights based on our audits.
We conducted our audits in accordance with the standards of the Public Company Accounting Oversight Board (United States). Those standards require that we plan and perform the audit to obtain reasonable assurance about whether the financial statements and financial highlights are free of material misstatement. We were not engaged to perform an audit of the Funds’ internal control over financial reporting. Our audits included consideration of internal control over financial reporting as a basis for designing audit procedures that are appropriate in the circumstances, but not for the purpose of expressing an opinion on the effectiveness of the Funds’ internal control over financial reporting. Accordingly, we express no such opinion. An audit also includes examining, on a test basis, evidence supporting the amounts and disclosures in the financial statements and financial highlights, assessing the accounting principles used and significant estimates made by management, and evaluating the overall financial statement presentation. Our procedures included confirmation of securities owned as of December 31, 2011, by correspondence with the custodian and brokers or by other appropriate auditing procedures where replies from brokers were not received. We believe that our audits provide a reasonable basis for our opinion.
In our opinion, the financial statements and financial highlights referred to above present fairly, in all material respects, the financial position of Hartford Global Growth HLS Fund of Hartford Series Fund, Inc. at December 31, 2011, the results of its operations for the year then ended, the changes in its net assets for each of the two years in the period then ended, and the financial highlights for each of the five years in the period then ended, in conformity with U.S. generally accepted accounting principles.
| |  |
| | |
| Minneapolis, MN | |
| February 13, 2012 | |
| Hartford Global Growth HLS Fund |
| Directors and Officers (Unaudited) |
The Board of Directors of the Company appoints officers who are responsible for the day-to-day operations of the Fund and who execute policies formulated by the Directors. Each director serves until his or her death, resignation, or retirement or until the next annual meeting of shareholders is held or until his or her successor is elected and qualifies.
Directors and officers who are employed by or who have a financial interest in The Hartford are considered “interested” persons of the Fund pursuant to the 1940 Act. Each officer and two of the Company’s directors, as noted in the chart below, are “interested” persons of the Fund. Each director serves as a director for The Hartford Mutual Funds, Inc., The Hartford Mutual Funds II, Inc., Hartford Series Fund, Inc., Hartford HLS Series Fund II, Inc., and as a trustee for The Hartford Alternative Strategies Fund, which, as of December 31, 2011, collectively consist of 91 funds. Correspondence may be sent to directors and officers c/o Hartford Mutual Funds, P.O. Box 2999, Hartford, Connecticut 06104-2999, except that correspondence to Ms. Fagely may be sent to 500 Bielenberg Drive, Woodbury, Minnesota 55125.
The table below sets forth, for each director and officer, his or her name, year of birth, current position with the Company and date first elected or appointed to Hartford Series Fund, Inc. (“HSF”), and Hartford HLS Series Fund II, Inc. (“HSF2”), principal occupation, and, for directors, other directorships held. The Fund’s statement of additional information contains further information on the directors and is available free of charge by calling 1-800-862-6668 or writing to Hartford HLS Funds, c/o Individual Annuity Services, P.O. Box 5085, Hartford, CT 06102-5085.
Information on the aggregate remuneration paid to the directors of the Company can be found in the Statement of Operations herein. The Fund pays to The Hartford a portion of the chief compliance officer’s compensation, but does not pay salaries or compensation to any of their other officers or directors who are employed by The Hartford.
Non-Interested Directors
Lynn S. Birdsong (1946) Director since 2003, Co-Chairman of the Investment Committee
Mr. Birdsong is a private investor. Mr. Birdsong currently serves as a Director of the Sovereign High Yield Investment Company (April 2010 to current). Mr. Birdsong currently serves as an Independent Director of Nomura Partners Funds, Inc. (formerly, The Japan Fund) (March 2003 to current). From 2003 to March 2005, Mr. Birdsong was an independent director of the Atlantic Whitehall Funds. From 1979 to 2002, Mr. Birdsong was a managing director of Zurich Scudder Investments, an investment management firm. During his employment with Scudder, Mr. Birdsong was an Interested Director of The Japan Fund. Since 1981, Mr. Birdsong has been a partner in Birdsong Company, an advertising specialty firm.
Robert M. Gavin, Jr. (1940) Director since 2002 (HSF) and 1986 (HSF2), Chairman of the Board since 2004
Dr. Gavin is an educational consultant. Prior to September 1, 2001, he was President of Cranbrook Education Community and prior to July 1996, he was President of Macalester College, St. Paul, Minnesota.
Duane E. Hill (1945) Director since 2001 (HSF) and 2002 (HSF2), Chairman of the Nominating Committee
Mr. Hill is Partner of TSG Ventures L.P., a private equity investment company. Mr. Hill is a former partner of TSG Capital Group, a private equity investment firm that served as sponsor and lead investor in leveraged buyouts of middle market companies.
Sandra S. Jaffee (1941) Director since 2005
Ms. Jaffee served as Chairman (2008 to 2009) and Chief Executive Officer of Fortent (formerly Searchspace Group), a leading provider of compliance/regulatory technology to financial institutions from August 2005 to August 2009. From August 2004 to August 2005, Ms. Jaffee served as an Entrepreneur in Residence with Warburg Pincus, a private equity firm. From September 1995 to July 2004, Ms. Jaffee served as Executive Vice President at Citigroup, where she was President and Chief Executive Officer of Citibank’s Global Securities Services (1995 to 2003). Ms. Jaffe currently serves as a member of the Board of Directors of Broadridge Financial Solutions as well as a Trustee of Muhlenberg College.
William P. Johnston (1944) Director since 2005, Chairman of the Compliance Committee
In June 2006, Mr. Johnston was appointed as Senior Advisor to The Carlyle Group, a global private equity investment firm. In August 2007, Mr. Johnston was elected to the Board of Directors of LifeCare Holdings, Inc. In February 2008, Mr. Johnston was elected to the Board of Directors of HCR-ManorCare, Inc. In May 2006, Mr. Johnston was elected to the Supervisory Board of Fresenius Medical Care AG & Co. KGaA, after its acquisition of Renal Care Group, Inc. in March 2006. Mr. Johnston joined Renal Care Group in November 2002 as a member of the Board of Directors and served as Chairman of the Board from March 2003 through March 2006. Mr. Johnston served as a Director of MultiPlan, Inc. from July 2006 through August 2010. From September 1987 to December 2002, Mr. Johnston was with Equitable Securities Corporation (and its successors, SunTrust Equitable Securities and SunTrust Robinson Humphrey) serving in various investment banking and managerial positions, including Managing Director and Head of Investment Banking, Chief Executive Officer and Vice Chairman.
| Hartford Global Growth HLS Fund |
| Directors and Officers (Unaudited) – (continued) |
Phillip O. Peterson (1944) Director since 2002 (HSF) and 2000 (HSF2), Chairman of the Audit Committee
Mr. Peterson is a mutual fund industry consultant. He was a partner of KPMG LLP (an accounting firm) until July 1999. Mr. Peterson joined William Blair Funds in February 2007 as a member of the Board of Trustees. From January 2004 to April 2005, Mr. Peterson served as Independent President of the Strong Mutual Funds.
Lemma W. Senbet (1946) Director since 2005
Dr. Senbet is the William E. Mayer Chair Professor of Finance and Director, Center for Financial Policy, at the University of Maryland, Robert H. Smith School of Business. He was chair of the Finance Department from 1998 to 2006. Previously he was a chaired professor of finance at the University of Wisconsin-Madison. Also, he was director of the Fortis Funds from March 2000 to July 2002. Dr. Senbet served the finance profession in various capacities, including as director of the American Finance Association and President of the Western Finance Association. In 2006, Dr. Senbet was inducted Fellow of Financial Management Association International for his career-long distinguished scholarship and professional service.
Interested Directors and Officers
David N. Levenson (1966) Director since 2010
Mr. Levenson currently serves as President of The Hartford’s Wealth Management business. He was appointed to this role in July 2010. Previously, Mr. Levenson served as Executive Vice President of Legacy Holdings for The Hartford from June 2009 to July 2010. From 2006 to 2009, Mr. Levenson was with Hartford Life Insurance K.K. where he served as President and Chief Executive Officer from 2007 to 2009. He served as Managing Director of Hartford Investment Management Company from 2005 to 2006. Additionally, Mr. Levenson serves as Executive Vice President of The Hartford and as President, Director and Chief Executive Officer of Hartford Life Insurance Company (“HLIC”) and Hartford Life, Inc. (“HL Inc.”).
Lowndes A. Smith (1939) Director since 1996 (HSF) and 2002 (HSF2), Co-Chairman of the Investment Committee
Mr. Smith served as Vice Chairman of The Hartford from February 1997 to January 2002, as President and Chief Executive Officer of HL Inc. from February 1997 to January 2002, and as President and Chief Operating Officer of The Hartford Life Insurance Companies from January 1989 to January 2002. Mr. Smith serves as a Director of White Mountains Insurance Group, Ltd., One Beacon Insurance and Symetra Financial and as a Managing Director of Whittington Gray Associates.
Other Officers
James E. Davey (1964) President and Chief Executive Officer since 2010
Mr. Davey serves as Executive Vice President of HLIC. Additionally, Mr. Davey serves as President, Chief Executive Officer and Manager of Hartford Investment Financial Services, Inc. (“HIFSCO”) and President, Chief Executive Officer and Manager of HL Advisors. Mr. Davey joined The Hartford in 2002.
Michael R. Dressen (1963) AML Compliance Officer since 2011
Mr. Dressen currently serves as Assistant Vice President of HLIC. He also serves as Chief Compliance Officer and AML Compliance Officer of Hartford Administrative Services Company (“HASCO”) and as Assistant Secretary and Compliance Officer of HIFSCO. Mr Dressen joined The Hartford in 2005 from State Farm Insurance Companies where he held various positions related to mutual funds, variable products, and property casualty insurance.
Tamara L. Fagely (1958) Vice President, Treasurer and Controller since 2002 (HSF) and 1993 (HSF2)
Ms. Fagely has been a Vice President of HASCO since 1998 and Chief Financial Officer since 2006. Currently Ms. Fagely is a Vice President of HLIC. She served as Assistant Vice President of HLIC from December 2001 through March 2005. In addition, Ms. Fagely is Controller and Chief Financial Officer of HIFSCO.
Dr. Robert J. Froehlich (1953) Senior Managing Director since 2009
Dr. Froehlich joined The Hartford as Senior Managing Director in September 2009. Prior to joining The Hartford, Dr. Froehlich served as Vice Chairman of Deutsche Asset Management from 1997-2009.
Edward P. Macdonald (1967) Vice President, Secretary and Chief Legal Officer since 2005
Mr. Macdonald serves as Vice President of HLIC and Chief Legal Officer of Mutual Funds and Vice President of HIFSCO. He also serves as Vice President and Secretary of HASCO, and Chief Legal Officer, Secretary and Vice President of HL Advisors. Mr. Macdonald joined The Hartford in 2005.
Vernon J. Meyer (1964) Vice President since 2006
Mr. Meyer serves as Senior Vice President of HLIC. He also serves as Senior Vice President of HIFSCO and HL Advisors. Mr. Meyer joined The Hartford in 2004.
Colleen B. Pernerewski (1969) Vice President and Chief Compliance Officer since 2010
Ms. Pernerewski serves as Vice President and Chief Investment Advisor Compliance Officer of HIFSCO and as Vice President and Chief Compliance Officer of HL Advisors. Ms. Pernerewski joined The Hartford in 2005 from Travelers Life and Annuity where she served as Counsel (2004-2005). Prior to Travelers Life and Annuity, Ms. Pernerewski held the position of Counsel at The Hartford (1998-2004).
Elizabeth L. Schroeder (1966) Vice President since 2010
Ms. Schroeder currently serves as Assistant Vice President of HLIC. Ms. Schroeder joined HLIC in 1991. She is also an Assistant Vice President of HASCO, HIFSCO and HL Advisors.
Martin Swanson (1962) Vice President since 2010
Mr. Swanson is a Vice President of HLIC. Mr. Swanson also serves as Vice President/Marketing for HIFSCO. Prior to joining HLIC in 1998, Mr. Swanson was a Vice President at PaineWebber, Inc.
Jane Wolak (1961) Vice President since 2009
Ms. Wolak currently serves as Senior Vice President of HLIC. Ms. Wolak joined HLIC as Vice President, Retail Product Services in May 2007. She is also Vice President of HASCO. Previously, Ms. Wolak was with Sun Life Financial where she held the position of Vice President, Service Center Operations from 2001-2007.
HOW TO OBTAIN A COPY OF THE FUND’S PROXY VOTING POLICIES AND VOTING RECORDS (UNAUDITED)
A description of the policies and procedures that the Fund uses to determine how to vote proxies relating to portfolio securities and a record of how the Fund voted any proxies for the twelve-month period ended June 30, 2011 are available (1) without charge, upon request, by calling 800-862-6668 and (2) on the SEC’s website at http://www.sec.gov.
QUARTERLY PORTFOLIO HOLDINGS INFORMATION (UNAUDITED)
The Fund files a complete schedule of portfolio holdings with the SEC for the first and third quarters of each fiscal year on Form N-Q. The Fund’s Forms are available (1) without charge, upon request, by calling 800-862-6668 and (2) on the SEC’s website at http://www.sec.gov. The Form N-Q may be reviewed and copied at the SEC’s Public Reference Room in Washington, DC. Information on the operation of the Public Reference Room may be obtained by calling 1-800-SEC-0330.
| Hartford Global Growth HLS Fund |
| Expense Example (Unaudited) |
Your Fund's Expenses
As a shareholder of the Fund, you incur two types of costs: (1) transaction costs and (2) ongoing costs including investment management fees, distribution fees, and other fund expenses. This example is intended to help you understand your ongoing costs (in dollars) of investing in the Fund and to compare these costs with the ongoing costs of investing in other mutual funds. The example is based on an investment of $1,000 invested at the beginning of the period and held for the period of June 30, 2011 through December 31, 2011.
Actual Expenses
The first set of columns of the table below provides information about actual account values and actual expenses. You may use the information in this column, together with the amount you invested, to estimate the expenses that you paid over the period. Simply divide your account value by $1,000 (for example, an $8,600 account value divided by $1,000 = 8.6), then multiply the result by the number in the line under the heading entitled “Expenses Paid During Period” to estimate the expenses you paid on your account during this period.
Hypothetical Example for Comparison Purposes
The second set of columns of the table below provides information about hypothetical account values and hypothetical expenses based on the Fund’s actual expense ratio and an assumed rate of return of 5% per year before expenses, which is not the Fund’s actual return. The hypothetical account values and expenses may not be used to estimate the actual ending account balance or expenses you paid for the period. You may use this information to compare the ongoing costs of investing in the Fund and other funds. To do so, compare this 5% hypothetical example with the 5% hypothetical examples that appear in the shareholder reports of the other funds.
Please note that the expenses shown in the table are meant to highlight your ongoing costs only and do not reflect any transactional costs, such as sales charges (loads) and CDSC. Therefore, the second set of columns of the table is useful in comparing ongoing costs only, and will not help you determine the relative total costs of owning different funds. In addition, if these transactional costs were included, your costs would be higher. Expenses are equal to the Fund's annualized expense ratios multiplied by average account value over the period, multiplied by 184/365 (to reflect the one-half year period).
| | | Actual return | | | Hypothetical (5% return before expenses) | | | | | | |
| | | | | | | Expenses paid | | | | | | | Expenses paid | | | | Days in | | |
| | | | | Ending | | during the period | | | | | Ending | | during the period | | | | the | | Days |
| | | Beginning | | Account Value | | June 30, 2011 | | | Beginning | | Account Value | | June 30, 2011 | | Annualized | | current | | in the |
| | | Account Value | | December 31, | | through | | | Account Value | | December 31, | | through | | expense | | 1/2 | | full |
| | | June 30, 2011 | | 2011 | | December 31, 2011 | | | June 30, 2011 | | 2011 | | December 31, 2011 | | ratio | | year | | year |
| Class IA | | $1,000.00 | | $828.38 | | $3.73 | | | $1,000.00 | | $1,021.12 | | $4.13 | | 0.81% | | 184 | | 365 |
| Class IB | | $1,000.00 | | $827.34 | | $4.88 | | | $1,000.00 | | $1,019.86 | | $5.40 | | 1.06% | | 184 | | 365 |
| Hartford Global Growth HLS Fund |
| Approval of Investment Management and Investment Sub-Advisory Agreements (Unaudited) |
Section 15(c) of the Investment Company Act of 1940, as amended (the “1940 Act”), requires that each mutual fund’s board of directors, including a majority of those directors who are not “interested persons” of the mutual fund, as defined in the 1940 Act (the “Independent Directors”), annually review and consider the continuation of the mutual fund’s investment advisory and sub-advisory agreements. At its meeting held on August 2-3, 2011, the Board of Directors (the “Board”) of Hartford Series Fund, Inc., including each of the Independent Directors, unanimously voted to approve the continuation of the investment management agreement for Hartford Global Growth HLS Fund (the “Fund”) with HL Investment Advisors, LLC (“HL Advisors”) and the continuation of the investment sub-advisory agreement between HL Advisors and the Fund’s sub-adviser, Wellington Management Company, LLP (the “Sub-adviser,” and together with HL Advisors, the “Advisers”) (collectively, the “Agreements”).
In the months preceding the August 2-3, 2011 meeting, the Board requested, received, and reviewed written responses from the Advisers to questions posed to them on behalf of the Independent Directors and supporting materials relating to those questions and responses. The Board considered information furnished to the Board at its meetings throughout the year, as well as information specifically prepared in connection with the annual approval of the Agreements at the Board’s meetings held on June 21-22, 2011 and August 2-3, 2011. Information provided to the Board at its meetings throughout the year included, among other things, reports on Fund performance, legal and compliance matters, sales and marketing activity, shareholder services, and the other services provided to the Fund by the Advisers and their affiliates. In addition, the Board received in-person presentations by Fund officers and representatives of HL Advisors at the Board’s meetings on June 21-22, 2011 and August 2-3, 2011 concerning the Agreements.
The Independent Directors, advised by independent legal counsel, engaged two service providers to assist them with evaluating the Agreements with respect to the Fund. Lipper Inc. (“Lipper”), an independent provider of investment company data, was retained to provide the Board with reports on how the Fund’s contractual management fees, actual management fees, other non-management fees, overall expense ratios and investment performance compared to those of mutual funds with similar investment objectives. The Independent Directors also engaged an independent financial services consulting firm (the “Consultant”) to assist them in evaluating the Fund’s management fees, sub-advisory fees, other non-management fees, overall expense ratios and investment performance. In addition, the Consultant reviewed the profitability calculations utilized by HL Advisors in connection with the continuation of the investment management agreement.
In determining to continue the Agreements for the Fund, the members of the Board reviewed and evaluated information and factors they believed to be relevant and appropriate in light of the information that the Board deemed necessary and appropriate through the exercise of their reasonable business judgment. While individual members of the Board may have weighed certain factors differently, the Board’s determination to continue the Agreements was based on a comprehensive consideration of all information provided to the Board throughout the year and specifically with respect to the continuation of the Agreements. A more detailed discussion of the factors the Board considered with respect to its approval of the Agreements is provided below.
Nature, Extent, And Quality Of Services Provided by the Advisers
The Board requested and considered information concerning the nature, extent, and quality of the services provided to the Fund by the Advisers. The Board considered, among other things, the terms of the Agreements and the range of services provided by the Advisers. The Board considered the Advisers’ professional personnel who provide services to the Fund, including each Adviser’s ability and experience in attracting and retaining qualified personnel to service the Fund. The Board considered each Adviser’s reputation and overall financial strength, as well as its willingness to consider and implement organizational and operational changes designed to improve services to the Fund. In addition, the Board considered the quality of each Adviser’s communications with the Board and responsiveness to Board inquiries.
The Board also requested and evaluated information concerning each Adviser’s regulatory and compliance environment. In this regard, the Board requested and reviewed information on each Adviser’s compliance policies and procedures, compliance history, and a report from the Fund’s Chief Compliance Officer on each Adviser’s compliance with applicable laws and regulations, including responses to regulatory developments and compliance issues raised by regulators. The Board also noted the Advisers’ support of the Fund’s compliance control structure, particularly the resources devoted by the Advisers in support of the Fund’s obligations pursuant to Rule 38a-1 under the 1940 Act.
| Hartford Global Growth HLS Fund |
| Approval of Investment Management and Investment Sub-Advisory Agreements (Unaudited) – (continued) |
With respect to HL Advisors, the Board noted that under the Agreements, HL Advisors is responsible for the management of the Fund, including overseeing fund operations and service providers, as well as investment advisory services in connection with selecting, monitoring and supervising the Sub-adviser. The Board considered HL Advisors’ ongoing monitoring of people, process and performance, including its quarterly reviews of each of the Hartford HLS Funds, semi-annual meetings with the leaders of each Fund’s portfolio management team, and oversight of the Funds’ 49 portfolio managers. The Board recognized that HL Advisors has demonstrated a record of making changes to the management and/or strategies of the Funds when warranted. The Board considered HL Advisors’ oversight of the Sub-adviser’s investment approach and results, process for monitoring best execution of portfolio trades by the Sub-adviser, and approach to risk management with respect to the Fund and the service providers to the Fund. The Board also considered HL Advisors’ oversight of compliance with the Fund’s objective and policies as well as with applicable laws and regulations, noting that regulatory and other developments had over time led to an increase in the scope of HL Advisors’ services in this regard. In addition, the Board considered HL Advisors’ ongoing commitment to review and rationalize the Hartford fund family’s product line-up and the expenses that HL Advisors had incurred in connection with fund combinations in recent years. The Board considered that HL Advisors or its affiliates are responsible for providing the Fund’s officers. The Board also noted that Hartford Life Insurance Company (“HLIC”) provides administrative services to the Fund. The Board considered its experiences with HL Advisors and HLIC with respect to each of these services.
With respect to the Sub-adviser, who provides day-to-day portfolio management services, the Board considered the quality of the Fund’s portfolio manager, the Sub-adviser’s other investment personnel, its investment philosophy and process, investment research capabilities and resources, performance record, trade execution capabilities and experience. The Board considered the experience of the Fund’s portfolio manager, the number of accounts managed by the portfolio manager, and the Sub-adviser’s method for compensating the portfolio manager.
Based on these considerations, the Board concluded that it was satisfied with the nature, extent and quality of the services provided to the Fund by HL Advisors and the Sub-adviser.
Performance of the Fund and the Advisers
The Board considered the investment performance of the Fund. In this regard, the Board reviewed the performance of the Fund over different time periods presented in the materials and evaluated HL Advisors’ analysis of the Fund’s performance for these time periods. The Board considered information and materials provided to the Board by the Advisers concerning Fund performance, as well as information from Lipper comparing the investment performance of the Fund to an appropriate benchmark and universe of peer funds. The Board noted the Fund’s relative underperformance over multiple periods as compared to its peer group and benchmark. The Board also noted that the Fund’s performance would continue to be monitored by HL Advisors.
The Board considered the detailed investment analytics reports provided by The Hartford’s Investment Advisory Group throughout the year. These reports include, among other things, information on the Fund’s gross and net returns, the Fund’s investment performance relative to an appropriate benchmark and peer group, various statistics concerning the Fund’s portfolio, and a narrative summary of various factors affecting Fund performance. The Board considered the Advisers’ cooperation with the Investment Committee, which assists the Board in evaluating the performance of the Fund at periodic meetings throughout the year. The Board also considered the analysis provided by the Consultant relating to the Fund’s performance track record.
In light of all the considerations noted above, the Board concluded that it had continued confidence in HL Advisors’ and the Sub-adviser’s overall capabilities to manage the Fund.
Costs of the Services and Profitability of the Advisers
The Board reviewed information regarding HL Advisors’ cost to provide investment management and related services to the Fund and HL Advisors’ profitability, both overall and for the Fund, on a pre-tax basis without regard to distribution expenses. The Board also requested and reviewed information about the profitability to HL Advisors and its affiliates from all services provided to the Fund and all aspects of their relationship with the Fund. The Board also requested and received information relating to the operations and profitability of the Sub-adviser.
The Board considered the Consultant’s review of the profitability calculations utilized by HL Advisors in connection with the continuation of the investment management agreement. In this regard, the Consultant reported that The Hartford’s process for calculating and reporting Fund profitability is reasonable, sound and well within common industry practice.
Based on these considerations, the Board concluded that the profits anticipated to be realized by the Advisers and their affiliates from their relationships with the Fund would not be excessive.
Comparison of Fees and Services Provided by the Advisers
The Board considered comparative information with respect to the management fees to be paid by the Fund to HL Advisors and the total expense ratios of the Fund. The Board also considered comparative information with respect to the sub-advisory fees to be paid by HL Advisors to the Sub-adviser, to the extent applicable. In this regard, the Board requested and reviewed information from HL Advisors and the Sub-adviser relating to the management and sub-advisory fees, including the sub-advisory fee schedule for the Fund, and total operating expenses for the Fund. The Board considered that the management fee for the Fund includes the fee paid to HLIC for providing certain administrative services to the Fund. The Board also reviewed information from Lipper comparing the Fund’s contractual management fees, actual management fees and overall expense ratios relative to a group of funds selected by Lipper, in consultation with the Consultant, and a broader universe of funds selected by Lipper.
While the Board recognized that comparisons between the Fund and peer funds are imprecise, given the differing service levels and characteristics of mutual funds and the different business models and cost structures of the Advisers, the comparative information provided by Lipper assisted the Board in evaluating the reasonableness of the Fund’s management and sub-advisory fees and total operating expenses. In addition, the Board considered the analysis and recommendations of the Consultant relating to the Fund’s management and sub-advisory fees and total operating expenses.
Based on these considerations, the Board concluded that the Fund’s fees and total operating expenses, in conjunction with the information about quality of services, profitability, economies of scale, and other matters discussed, were reasonable in light of the services provided.
Economies of Scale
The Board requested and considered information regarding the Advisers’ realization of economies of scale with respect to the Fund and whether the fee levels reflect these economies of scale for the benefit of the Fund’s investors. With respect to HL Advisors, the Board considered representations from HL Advisors that it is difficult to anticipate whether and to what extent economies may be realized by HL Advisors as assets grow over time. The Board reviewed the breakpoints in the management fee schedule for the Fund, which reduces fee rates as Fund assets grow over time. The Board recognized that a fund with assets beyond the last breakpoint level will continue to benefit from economies of scale because additional assets are charged the lowest breakpoint fee resulting in lower overall effective management fee rates. The Board also recognized that a fee schedule that reaches a lower breakpoint quickly provides shareholders with the benefit of anticipated or potential economies of scale.
The Board reviewed and evaluated materials from Lipper showing how management fee schedules of peer funds reflect economies of scale for the benefit of investors as a peer fund’s assets hypothetically increase over time. Based on information provided by HL Advisors, Lipper, and the Consultant, the Board recognized that there is no uniform methodology for establishing breakpoints or uniform pattern in asset levels that trigger breakpoints or the amounts of breakpoints triggered.
After considering all of the information available to it, the Board concluded that it was satisfied with the extent to which economies of scale would be shared for the benefit of the Fund’s shareholders based on currently available information and the effective advisory fees and expense ratios for the Fund at its current and reasonably anticipated asset levels. The Board noted, however, that it would continue to monitor future growth in Fund assets and the appropriateness of additional breakpoints.
| Hartford Global Growth HLS Fund |
| Approval of Investment Management and Investment Sub-Advisory Agreements (Unaudited) – (continued) |
Other Benefits
The Board considered other benefits to the Advisers and their affiliates from their relationships with the Fund, including the role of the Fund in supporting the variable life insurance and variable annuity products offered by The Hartford. The Board reviewed information noting that HLIC, an affiliate of HL Advisors, receives fees for providing certain administrative services to the Fund, and that HLIC also receives fees for fund accounting and related services from the Fund, and the Board considered information on expected profits to HLIC or its affiliates for such services. The Board also considered that Hartford Administrative Services Company (“HASCO”), the Fund’s transfer agent and an affiliate of HL Advisors, receives transfer agency compensation from the Fund, and the Board reviewed information on the expected profitability of the Fund’s transfer agency function to HASCO. The Board considered information provided by HASCO indicating that the transfer agent fees charged by HASCO to the Fund were fair and reasonable based on publicly available information.
The Board also considered that Hartford Securities Distribution Company, Inc., as principal underwriter of the Fund, receives 12b-1 fees from the Fund. The Board also noted that certain affiliates of HL Advisors distribute shares of the Fund and receive compensation in that connection.
The Board considered benefits to the Sub-adviser from its use of the Fund’s brokerage commissions to obtain soft dollar research, and representations from HL Advisors and the Sub-adviser that the Sub-adviser would not make any revenue-sharing payments or any other type of distribution payments to HL Advisors or its affiliates.
The Board considered the benefits to shareholders of being part of the Hartford family of funds. The Board considered HL Advisors’ efforts to provide investors in the family with a broad range of investment styles and asset classes.
* * * *
Based upon its review of these various factors, among others, the Board concluded that it is in the best interests of the Fund and its shareholders for the Board to approve the Agreements for an additional year. In reaching this decision, the Board did not assign relative weights to the factors discussed above or deem any one or group of them to be controlling in and of themselves. In connection with their deliberations, the Independent Directors met separately in executive session on several occasions, with independent legal counsel, to review the relevant materials and consider their responsibilities under relevant laws and regulations.
The Hartford
P.O. Box 5085
Hartford, CT 06102-5085
Hartford Series Fund, Inc. is underwritten and distributed by Hartford Securities Distribution Company, Inc.
"The Hartford" is The Hartford Financial Services Group, Inc. and its subsidiaries.
Hartford Series Fund, Inc. inception dates range from 1977 to date. Hartford Series Fund, Inc. is not a subsidiary of The Hartford but is underwritten, distributed by and advised by subsidiaries of The Hartford. Investments in Hartford Series Fund, Inc. are not guaranteed by The Hartford or any other entity.
You should carefully consider investment objectives, risks, and charges and expenses of Hartford HLS Funds before investing. This and other information can be found in the Fund’s prospectus or summary prospectus, which can be obtained by calling 800-862-6668. Please read them carefully before you invest or send money.
HLSAR-GG11 2-12 109078 Printed in U.S.A ©2011 The Hartford, Hartford, CT 06115 | |
A MESSAGE FROM THE PRESIDENT
Dear Fellow Shareholders:
I want to take this opportunity to say thank you for investing in Hartford HLS Funds.
This has been a tumultuous year. In the beginning of 2011, we witnessed tension-fueled political uprisings in the already-volatile Middle East and North Africa region. We also watched as Japan dealt with a series of crises including a massive earthquake and subsequent tsunami. Yet, U.S. economic conditions continued to improve, with gains in consumer confidence and retail sales. During the first half of 2011, domestic, international, and world indices (as measured by the S&P 500, MSCI EAFE and MSCI World) were all up more than 5% through June, 30 2011.
The economic recovery, however, lost momentum in the second half of 2011. The employment and housing markets both remain extremely challenged. Investors continue to be concerned about the implications of the European sovereign debt crisis, as well as our own high levels of domestic debt. Fears that the European sovereign debt crisis could continue to drag down the global economy have weighed heavily on stocks.
Ongoing apprehension regarding the U.S. debt ceiling during the summer and the resulting downgrade of the U.S. sovereign credit rating by Standard & Poor’s also contributed to weaker investor confidence.
There are, however, some reasons to remain confident. Corporations have record levels of cash on their balance sheets—corporate cash has doubled in the past 10 years. In addition, U.S. gross domestic product expanded at a 2.5 percent annual rate in the third quarter according to the Commerce Department, as consumers and businesses set aside fears about the recovery and stepped up spending. Corporate earnings have also remained positive, with a majority of companies beating expectations each quarter this year. This momentum will hopefully continue into next year.
As we head into 2012, in light of the continued market volatility, now would be a good time to schedule a meeting with your financial advisor to examine your current investment strategy and determine whether you are on the right track.
| • | Does your fixed-income portfolio complement your equity portfolio? |
| • | Are you receiving diversified sources of income? |
| • | Is your portfolio still in line with your risk tolerance and investment time horizon? |
Talk to your advisor to see what changes you should make to address these concerns and opportunities.
Thank you again for investing with Hartford HLS Funds.
James Davey
President
Hartford HLS Funds
Hartford Global Research HLS Fund
Table of Contents
This report is prepared for the general information of contract owners and qualified retirement plan participants. It is not an offer of contracts or of qualified retirement plans. It should not be used in connection with any offer, except in conjunction with the appropriate product prospectus which contains all pertinent information including the applicable sales, administrative and other charges.
The views expressed in the Fund’s Manager Discussion under “Why did the Fund perform this way?” and “What is the outlook?” are views of the Fund’s sub-adviser and portfolio management team through the end of the period and are subject to change based on market and other conditions.
| Hartford Global Research HLS Fund inception 01/31/2008 |
| (sub-advised by Wellington Management Company, LLP) |
| |
| Investment objective – Seeks long-term capital appreciation. |
| |
Performance Overview 1/31/08 - 12/31/11
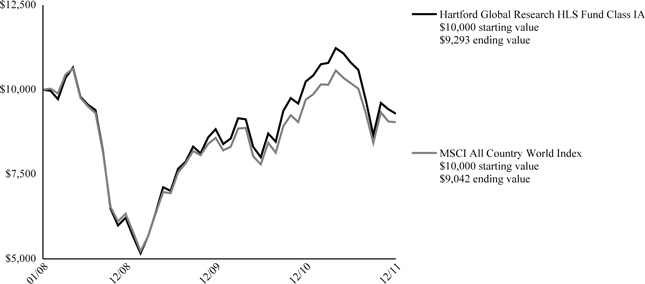
The chart above shows the growth of a $10,000 investment in Class IA. Growth results in classes other than Class IA will vary from what is seen above due to differences in the expenses charged to those share classes.
Average Annual Total Returns (as of 12/31/11)
| | 1 Year | Since Inception |
| Global Research IA | -9.28% | -1.85% |
| Global Research IB | -9.51% | -2.09% |
| MSCI All Country World Index | -6.86% | -2.54% |
PAST PERFORMANCE IS NOT INDICATIVE OF FUTURE RESULTS.
Total returns presented above were calculated using the Fund's net asset value available to shareholders for sale or redemption of Fund shares on December 31, 2011, which may exclude investment transactions as of this date.
MSCI All Country World Index is a free float-adjusted market capitalization index that measures equity market performance in the global developed and emerging markets, consisting of 45 developed and emerging market country indices. This index is unmanaged, and its results include reinvested dividends and/or distributions, but do not reflect the effect of sales charges, commissions, expenses or taxes.
You cannot invest directly in an index.
The chart represents a hypothetical investment in the Fund. Performance data represents past performance and current performance could be higher or lower.
Performance information may reflect historical or current expense waivers/reimbursements from the investment adviser, without which performance would have been lower. For information on current expense waivers/reimbursements, please see the prospectus.
The value of the Fund will fluctuate so that when redeemed, it may be worth more or less than the original investment. The chart and table do not reflect the deductions of taxes, sales charges or other fees which may be applied at the variable life insurance, variable annuity or qualified retirement plan product level. Any such additional sales charges or other fees or expenses would lower the contract’s or plan’s performance.
|
| Hartford Global Research HLS Fund |
| Manager Discussion (Unaudited) |
| December 31, 2011 |
| |
| Portfolio Managers | |
| Cheryl M. Duckworth, CFA | Mark D. Mandel, CFA* |
| Senior Vice President and Associate Director of Global Industry Research | Director and Director of Global Industry Research |
| | |
How did the Fund perform?
The Class IA shares of the Hartford Global Research HLS Fund returned -9.28% for the twelve-month period ended December 31, 2011, underperforming its benchmark, the MSCI All Country World Index, which returned -6.86% for the same period. The Fund also underperformed the -8.05% return of the average fund in the Lipper Global Core VP-UF Funds peer group, a group of funds with investment strategies similar to those of the Fund.
Why did the Fund perform this way?
The one-year period ending December 31, 2011 was yet another extremely volatile period for equity markets. Global equities started the year on a strong note and continued to march higher in the first quarter of 2011, driven by investors’ enthusiasm for additional government debt purchases by the U.S. Federal Reserve, the extension of tax cuts in the U.S., strong earnings growth, and generally improving economic data. This enthusiasm reversed later in the period, however, as concerns surfaced that the global economy could slip back into a recession, resulting in a rapid decline in equity markets. Fears about sovereign debt and solvency in the eurozone, slowing economic expansion in China, and uncertainty about the sustainability of corporate earnings growth combined to produce an extremely volatile stock market, and return correlations among stocks spiked as investors shed risk and fled to safety. Markets ended the year on a positive note in the final month of the period with encouraging employment and manufacturing data in the U.S.
In this environment, seven of ten sectors within the MSCI All Country World Index posted negative returns during the period. Materials (-21%), Financials (-19%), and Industrials (-10%) lagged the most while returns in Health Care (+10%) and Consumer Staples (+8%) rose.
The Fund underperformed its benchmark primarily due to weak security selection. Weak selection within the Materials, Energy, and Consumer Staples sectors more than offset stronger selection in the Industrials, Information Technology, and Financials sectors. Sector allocation, a result of our bottom-up stock selection process (i.e. stock by stock fundamental research), was modestly additive to relative returns due to an overweight (i.e. the Fund’s sector position was greater than the benchmark position) to Health Care and an underweight to Industrials.
The largest detractors from benchmark relative returns were Sino-Forest (Materials), Huabao International Holding (Materials), and Central European Distribution (Consumer Staples). Shares of Sino-Forest, a Chinese commercial forest plantation operator, fell as credit rating agencies Moody’s and Standard & Poor’s slashed their ratings on the debt of the firm just after the CEO stepped down. Huabao International Holding, a Chinese company specializing in the production and distribution of tobacco flavorings, saw its shares underperform following a negative pattern of insider selling. Shares of Central European Distribution, a U.S. based producer of vodka and other liquors, fell due to the company’s high debt level and tough competitive environments in Poland and Russia. Bank of America (Financials) was also among the top detractors from absolute (i.e. total return) performance.
Top contributors to benchmark relative performance during the period included Elan (Health Care), Lorillard (Consumer Staples), and UnitedHealth Group (Health Care). Shares of biotechnology company Elan rose as investors remained optimistic over continued revenue growth from Tysabri, a drug for the treatment of multiple sclerosis and Crohn’s disease. The company also benefited from excitement over data that is due out in the near future of bapineuzumab, a treatment for Alzheimer’s disease. Shares of Lorillard, a U.S. based tobacco company, rose as the company in early 2011 reported strong fiscal year 2010 earnings due to strong revenue growth in its core tobacco flavors business and meaningful growth in the firm’s operating profits. Additionally, a report published by TPSAC (Tabacco Products Scientific Advisory Committee) stated that more research would need to be done before recommending a ban on menthol cigarettes; this news positively impacted Lorillard. Shares of UnitedHealth Group, a diversified health and well-being company, rose after the company outperformed expectations. Apple (Information Technology) was a top contributor to absolute performance.
What is the outlook?
Uncertainty in Europe last year led to high levels of risk aversion, record high stock correlations, and a general flight to safety. We believe that barring a catastrophic liquidity event in Europe, we should eventually return to a normalized market environment. We continue to look for stabilization in the European debt markets albeit with a weak macro economy and we expect continued recovery and modest economic
| Hartford Global Research HLS Fund |
| Manager Discussion (Unaudited) – (continued) |
| December 31, 2011 |
| |
expansion in the U.S. China may face near-term headwinds but we anticipate a return to stronger growth in the latter part of 2012 and into 2013.
The Fund ended the period most overweight the Information Technology, Health Care, and Materials sectors and most underweight the Industrials, Consumer Discretionary, and Telecommunication Services sectors. The Fund’s largest absolute weightings were in the Financials, Information Technology, and Energy sectors.
* Mr. Mandel supervises a team of global industry analysts that manage the Fund. Mr. Mandel is not involved in day-to-day management of the Fund.
Diversification by Industry
as of December 31, 2011
| Industry (Sector) | | Percentage of
Net Assets | |
| Equity Securities | | | | |
| Automobiles & Components (Consumer Discretionary) | | | 2.1 | % |
| Banks (Financials) | | | 9.0 | |
| Capital Goods (Industrials) | | | 5.8 | |
| Commercial & Professional Services (Industrials) | | | 0.2 | |
| Consumer Durables & Apparel (Consumer Discretionary) | | | 1.0 | |
| Consumer Services (Consumer Discretionary) | | | 0.2 | |
| Diversified Financials (Financials) | | | 4.3 | |
| Energy (Energy) | | | 11.6 | |
| Food & Staples Retailing (Consumer Staples) | | | 2.3 | |
| Food, Beverage & Tobacco (Consumer Staples) | | | 8.2 | |
| Health Care Equipment & Services (Health Care) | | | 3.0 | |
| Insurance (Financials) | | | 3.1 | |
| Materials (Materials) | | | 8.8 | |
| Media (Consumer Discretionary) | | | 2.2 | |
| Other Investment Pools and Funds (Financials) | | | 0.3 | |
| Pharmaceuticals, Biotechnology & Life Sciences (Health Care) | | | 7.2 | |
| Real Estate (Financials) | | | 2.6 | |
| Retailing (Consumer Discretionary) | | | 2.8 | |
| Semiconductors & Semiconductor Equipment (Information Technology) | | | 1.7 | |
| Software & Services (Information Technology) | | | 7.5 | |
| Technology Hardware & Equipment (Information Technology) | | | 4.5 | |
| Telecommunication Services (Services) | | | 4.2 | |
| Transportation (Industrials) | | | 2.6 | |
| Utilities (Utilities) | | | 3.9 | |
| Total | | | 99.1 | % |
| Fixed Income Securities | | | | |
| Petroleum and Coal Products Manufacturing (Energy) | | | 0.0 | % |
| Total | | | 0.0 | % |
| Short-Term Investments | | | 0.9 | |
| Other Assets and Liabilities | | | 0.0 | |
| Total | | | 100.0 | % |
|
Diversification by Country
as of December 31, 2011
| | | Percentage of | |
| Country | | Net Assets | |
| Argentina | | | 0.1 | % |
| Australia | | | 1.3 | |
| Belgium | | | 1.0 | |
| Bermuda | | | 0.2 | |
| Brazil | | | 2.8 | |
| Canada | | | 4.4 | |
| China | | | 0.6 | |
| Denmark | | | 0.3 | |
| Egypt | | | 0.1 | |
| Finland | | | 0.0 | |
| France | | | 3.7 | |
| Germany | | | 1.4 | |
| Hong Kong | | | 3.2 | |
| India | | | 0.9 | |
| Indonesia | | | 0.2 | |
| Ireland | | | 1.0 | |
| Israel | | | 0.7 | |
| Italy | | | 0.3 | |
| Japan | | | 5.6 | |
| Luxembourg | | | 0.4 | |
| Malaysia | | | 0.5 | |
| Mexico | | | 0.5 | |
| Netherlands | | | 1.3 | |
| Norway | | | 1.6 | |
| Papua New Guinea | | | 0.1 | |
| Philippines | | | 0.5 | |
| Poland | | | 0.0 | |
| Portugal | | | 0.1 | |
| Russia | | | 0.1 | |
| Singapore | | | 0.6 | |
| South Africa | | | 0.6 | |
| South Korea | | | 0.6 | |
| Spain | | | 0.4 | |
| Sweden | | | 0.2 | |
| Switzerland | | | 1.9 | |
| Taiwan | | | 0.6 | |
| Thailand | | | 0.0 | |
| Turkey | | | 0.2 | |
| United Kingdom | | | 8.6 | |
| United States | | | 52.5 | |
| Short-Term Investments | | | 0.9 | |
| Other Assets and Liabilities | | | 0.0 | |
| Total | | | 100.0 | % |
|
| Hartford Global Research HLS Fund |
| Schedule of Investments |
| December 31, 2011 |
| (000’s Omitted) |
| Shares or Principal Amount | | Market Value ╪ | |
| COMMON STOCKS - 98.6% | | | | |
| | | | | Automobiles & Components - 2.1% | | | | |
| | 2 | | | Michelin (C.G.D.E.) Class B | | $ | 135 | |
| | 22 | | | Peugeot S.A. | | | 343 | |
| | 8 | | | Renault S.A. | | | 284 | |
| | 11 | | | Stanley Electric Co., Ltd. | | | 161 | |
| | 12 | | | Tokai Rika Co., Ltd. | | | 176 | |
| | 9 | | | Toyoda Gosei Co., Ltd. | | | 146 | |
| | 4 | | | Toyota Boshoku Corp. | | | 40 | |
| | 11 | | | Toyota Motor Corp. | | | 354 | |
| | | | | | | | 1,639 | |
| | | | | Banks - 8.8% | | | | |
| | 35 | | | Banco Santander Brasil S.A. | | | 286 | |
| | 4 | | | Bank Nordik P/F | | | 52 | |
| | — | | | Banque Cantonale Vaudoise | | | 235 | |
| | 131 | | | Barclays Bank plc ADR | | | 359 | |
| | 23 | | | BB&T Corp. | | | 589 | |
| | 3 | | | BNP Paribas | | | 119 | |
| | 134 | | | China Construction Bank | | | 93 | |
| | 3 | | | Citizens & Northern Corp. | | | 61 | |
| | 5 | | | Citizens Republic Bancorp, Inc. ● | | | 54 | |
| | 27 | | | DnB ASA | | | 263 | |
| | 1 | | | Gronlandsbanken | | | 72 | |
| | 5 | | | Hana Financial Holdings | | | 165 | |
| | 26 | | | HSBC Holdings plc | | | 199 | |
| | 20 | | | Itau Unibanco Banco Multiplo S.A. ADR | | | 363 | |
| | 53 | | | Karnataka Bank Ltd. | | | 65 | |
| | 194 | | | Metropolitan Bank and Trust | | | 302 | |
| | 141 | | | Mitsubishi UFJ Financial Group, Inc. | | | 598 | |
| | 7 | | | National Bank of Canada | | | 489 | |
| | 26 | | | Oversea-Chinese Banking Corp., Ltd. | | | 156 | |
| | 2 | | | PNC Financial Services Group, Inc. | | | 119 | |
| | 63 | | | Regions Financial Corp. | | | 271 | |
| | 28 | | | Standard Chartered plc | | | 617 | |
| | 14 | | | Susquehanna Bancshares, Inc. | | | 119 | |
| | 6 | | | Toronto-Dominion Bank | | | 479 | |
| | 93 | | | Turkiye Sinai Kalkinma Bankasi A.S. | | | 90 | |
| | 25 | | | Wells Fargo & Co. | | | 691 | |
| | | | | | | | 6,906 | |
| | | | | Capital Goods - 5.8% | | | | |
| | 3 | | | AMETEK, Inc. | | | 122 | |
| | 31 | | | Beijing Enterprises Holdings Ltd. | | | 183 | |
| | 4 | | | Boeing Co. | | | 280 | |
| | 1 | | | Brenntag AG | | | 73 | |
| | 1 | | | Carlisle Cos., Inc. | | | 32 | |
| | 4 | | | Cooper Industries plc Class A | | | 200 | |
| | 4 | | | Danaher Corp. | | | 194 | |
| | 1 | | | Dover Corp. | | | 43 | |
| | 3 | | | Emerson Electric Co. | | | 118 | |
| | 1 | | | Esterline Technologies Corp. ● | | | 29 | |
| | 1 | | | European Aeronautic Defence and Space Co. N.V. | | | 31 | |
| | — | | | Fanuc Corp. | | | 61 | |
| | 3 | | | General Dynamics Corp. | | | 183 | |
| | 22 | | | General Electric Co. | | | 393 | |
| | 4 | | | Honeywell International, Inc. | | | 240 | |
| | 3 | | | IDEX Corp. | | | 94 | |
| | 4 | | | Illinois Tool Works, Inc. | | | 189 | |
| | 5 | | | Ingersoll-Rand plc | | | 142 | |
| | 1 | | | JS Group Corp. | | | 12 | |
| | 3 | | | Komatsu Ltd. | | | 62 | |
| | — | | | Lockheed Martin Corp. | | | 32 | |
| | 6 | | | Mitsui & Co., Ltd. | | | 89 | |
| | — | | | Moog, Inc. Class A ● | | | 15 | |
| | 4 | | | Pentair, Inc. | | | 120 | |
| | — | | | Precision Castparts Corp. | | | 50 | |
| | 3 | | | Raytheon Co. | | | 163 | |
| | 13 | | | Rolls-Royce Holdings plc | | | 155 | |
| | 3 | | | Safran S.A. | | | 105 | |
| | 4 | | | Siemens AG | | | 367 | |
| | — | | | SMC Corp. | | | 45 | |
| | 1 | | | Stanley Black & Decker, Inc. | | | 47 | |
| | 4 | | | United Technologies Corp. | �� | | 261 | |
| | 2 | | | Vallourec | | | 132 | |
| | 3 | | | Vinci S.A. | | | 122 | |
| | 8 | | | Wabash National Corp. ● | | | 66 | |
| | 1 | | | WESCO International, Inc. ● | | | 61 | |
| | — | | | Zodiac Aerospace | | | 33 | |
| | | | | | | | 4,544 | |
| | | | | Commercial & Professional Services - 0.2% | | | | |
| | 2 | | | Huron Consulting Group, Inc. ● | | | 84 | |
| | — | | | Towers Watson & Co. | | | 12 | |
| | 13 | | | Transfield Services Ltd. | | | 29 | |
| | | | | | | | 125 | |
| | | | | Consumer Durables & Apparel - 1.0% | | | | |
| | 1 | | | Adidas-Salomon AG | | | 52 | |
| | 1 | | | Coach, Inc. | | | 74 | |
| | 2 | | | LVMH Moet Hennessy Louis Vuitton S.A. | | | 257 | |
| | 2 | | | Michael Kors Holdings Ltd. ● | | | 57 | |
| | 2 | | | NIKE, Inc. Class B | | | 180 | |
| | 4 | | | Salvatore Ferragamo Italia S.p.A. ● | | | 49 | |
| | 60 | | | Samsonite International S.A. ● | | | 94 | |
| | 21 | | | Stella International | | | 46 | |
| | 20 | | | Trinity Ltd. | | | 15 | |
| | | | | | | | 824 | |
| | | | | Consumer Services - 0.2% | | | | |
| | 5 | | | Compass Group plc | | | 50 | |
| | 1 | | | Las Vegas Sands Corp. ● | | | 21 | |
| | 1 | | | Marriott International, Inc. Class A | | | 15 | |
| | 228 | | | Rexlot Holdings Ltd. | | | 15 | |
| | 42 | | | Shangri-La Asia Ltd. | | | 73 | |
| | 1 | | | Wyndham Worldwide Corp. | | | 21 | |
| | | | | | | | 195 | |
| | | | | Diversified Financials - 4.3% | | | | |
| | 30 | | | Aberdeen Asset Management plc | | | 97 | |
| | 5 | | | Ameriprise Financial, Inc. | | | 262 | |
| | 63 | | | Bank of America Corp. | | | 352 | |
| | — | | | BlackRock, Inc. | | | 78 | |
| | 5 | | | Cetip S.A. - Balcao Organizado | | | 73 | |
| | 46 | | | CITIC Securities Co., Ltd. ● | | | 75 | |
| | 19 | | | Citigroup, Inc. | | | 488 | |
| | 18 | | | GAM Holding Ltd. | | | 198 | |
| | 3 | | | Goldman Sachs Group, Inc. | | | 303 | |
| | 4 | | | IBJ Leasing Co., Ltd. | | | 86 | |
| | 68 | | | Infrastructure Development Finance Co., Ltd. | | | 117 | |
| | 23 | | | ING Groep N.V. ● | | | 167 | |
| | 4 | | | Invesco Ltd. | | | 90 | |
| | 8 | | | Julius Baer Group Ltd. | | | 317 | |
| | — | | | LPL Investment Holdings, Inc. ● | | | 12 | |
| | 109 | | | Man Group plc | | | 213 | |
The accompanying notes are an integral part of these financial statements.
| Hartford Global Research HLS Fund |
| Schedule of Investments – (continued) |
| December 31, 2011 |
| (000’s Omitted) |
| Shares or Principal Amount | | Market Value ╪ | |
| COMMON STOCKS - 98.6% - (continued) |
| | | | | Diversified Financials - 4.3% - (continued) | | | | |
| | 3 | | | Matsui Securities Co., Ltd. | | $ | 15 | |
| | 2 | | | Nasdaq OMX Group, Inc. ● | | | 44 | |
| | 2 | | | SEI Investments Co. | | | 35 | |
| | 28 | | | UBS AG | | | 333 | |
| | 1 | | | Warsaw Stock Exchange | | | 14 | |
| | | | | | | | 3,369 | |
| | | | | Energy - 11.6% | | | | |
| | 6 | | | Aban Offshore Ltd. | | | 40 | |
| | 3 | | | Alpha Natural Resources, Inc. ● | | | 63 | |
| | 2 | | | Anadarko Petroleum Corp. | | | 162 | |
| | 7 | | | Baker Hughes, Inc. | | | 323 | |
| | 26 | | | BG Group plc | | | 559 | |
| | 29 | | | BioFuel Energy Corp. ● | | | 20 | |
| | 40 | | | BP plc | | | 285 | |
| | 1 | | | BP plc ADR | | | 47 | |
| | 21 | | | Cairn Energy plc ��� | | | 88 | |
| | 7 | | | Canadian Natural Resources Ltd. ADR | | | 277 | |
| | 15 | | | Chesapeake Energy Corp. | | | 331 | |
| | 1 | | | Chevron Corp. | | | 104 | |
| | 14 | | | Cobalt International Energy ● | | | 210 | |
| | 5 | | | Consol Energy, Inc. | | | 200 | |
| | 46 | | | Cove Energy plc ● | | | 83 | |
| | 3 | | | Denbury Resources, Inc. ● | | | 51 | |
| | 1 | | | Dril-Quip, Inc. w/ Rights ● | | | 52 | |
| | 8 | | | El Paso Corp. | | | 202 | |
| | 3 | | | EnCana Corp. ADR | | | 50 | |
| | 9 | | | ENSCO International plc | | | 436 | |
| | 1 | | | EOG Resources, Inc. | | | 141 | |
| | 2 | | | Exxon Mobil Corp. | | | 128 | |
| | 53 | | | Ezra Holdings Ltd. ● | | | 34 | |
| | 20 | | | Frontline Ltd. | | | 86 | |
| | 2 | | | Fugro N.V. - CVA | | | 91 | |
| | 5 | | | GALP Energia SGPS | | | 69 | |
| | 17 | | | Green Plains Renewable Energy ● | | | 167 | |
| | 3 | | | Gulfmark Offshore, Inc. ● | | | 143 | |
| | 2 | | | Husky Energy, Inc. | | | 43 | |
| | 8 | | | Imperial Oil Ltd. | | | 368 | |
| | 10 | | | Indo Tambangraya Megah PT | | | 43 | |
| | — | | | Inpex Corp. | | | 82 | |
| | — | | | Interoil Corp. ● | | | 20 | |
| | 39 | | | Karoon Gas Australia Ltd. ● | | | 179 | |
| | 2 | | | Marathon Petroleum Corp. | | | 70 | |
| | 4 | | | National Oilwell Varco, Inc. | | | 279 | |
| | 2 | | | Newfield Exploration Co. ● | | | 64 | |
| | 3 | | | Nexen, Inc. | | | 46 | |
| | 6 | | | Occidental Petroleum Corp. | | | 520 | |
| | 16 | | | Oil Search Ltd. | | | 100 | |
| | 1 | | | Pacific Rubiales Energy Corp. | | | 17 | |
| | 2 | | | Peabody Energy Corp. | | | 76 | |
| | 13 | | | Petroleo Brasileiro S.A. ADR | | | 330 | |
| | 20 | | | Petroleum Geo-Services ● | | | 223 | |
| | 1 | | | Petrominerales Ltd. | | | 19 | |
| | 5 | | | Pioneer Natural Resources Co. | | | 447 | |
| | 5 | | | Reliance Industries Ltd. | | | 70 | |
| | 3 | | | Reliance Industries Ltd. GDR ■ | | | 72 | |
| | 2 | | | Saipem S.p.A. | | | 100 | |
| | 4 | | | Sasol Ltd. ADR | | | 187 | |
| | 1 | | | Schlumberger Ltd. | | | 74 | |
| | 2 | | | Southwestern Energy Co. ● | | | 63 | |
| | 7 | | | Statoil ASA | | | 192 | |
| | 5 | | | Suncor Energy, Inc. | | | 142 | |
| | 2 | | | Tenaris S.A. | | | 44 | |
| | 2 | | | Tenaris S.A. ADR | | | 78 | |
| | 4 | | | Tesoro Corp. ● | | | 88 | |
| | 9 | | | Tonengeneral Sekiyu Kk | | | 98 | |
| | 2 | | | Tupras-Turkiye Petrol Rafinerileri A.S. | | | 45 | |
| | 2 | | | Ultra Petroleum Corp. ● | | | 48 | |
| | 43 | | | Vantage Drilling Co. ● | | | 49 | |
| | 4 | | | Western Refining, Inc. ● | | | 54 | |
| | 2 | | | Whiting Petroleum Corp. ● | | | 103 | |
| | 6 | | | Williams Cos., Inc. | | | 200 | |
| | 1 | | | YPF Sociedad Anonima ADR | | | 47 | |
| | | | | | | | 9,122 | |
| | | | | Food & Staples Retailing - 2.3% | | | | |
| | 1 | | | Costco Wholesale Corp. | | | 100 | |
| | 13 | | | CVS Caremark Corp. | | | 513 | |
| | 2 | | | Lawson, Inc. | | | 124 | |
| | 11 | | | Olam International Ltd. | | | 18 | |
| | 24 | | | Sun Art Retail Group Ltd. ● | | | 30 | |
| | 61 | | | Tesco plc | | | 380 | |
| | 22 | | | Wal-Mart de Mexico SAB de CV | | | 60 | |
| | 6 | | | Wal-Mart Stores, Inc. | | | 385 | |
| | 7 | | | Woolworths Ltd. | | | 191 | |
| | | | | | | | 1,801 | |
| | | | | Food, Beverage & Tobacco - 8.2% | | | | |
| | 9 | | | Anheuser-Busch InBev N.V. | | | 542 | |
| | 90 | | | Asian Citrus Holdings Ltd. | | | 47 | |
| | 10 | | | Bajaj Hindusthan Ltd. | | | 4 | |
| | 10 | | | British American Tobacco plc | | | 470 | |
| | 5 | | | Britvic plc | | | 27 | |
| | 333 | | | China Minzhong Food Corp., Ltd. ● | | | 209 | |
| | 39 | | | China Yurun Food Group Ltd. | | | 51 | |
| | 20 | | | Cott Corp. ● | | | 124 | |
| | 81 | | | Deoleo S.A. | | | 45 | |
| | 4 | | | Diamond Foods, Inc. | | | 145 | |
| | 12 | | | General Mills, Inc. | | | 466 | |
| | 2 | | | GLG Life Technology Corp. ● | | | 2 | |
| | 6 | | | Green Mountain Coffee Roasters, Inc. ● | | | 251 | |
| | 11 | | | Groupe Danone | | | 720 | |
| | 27 | | | Grupo Modelo S.A.B. | | | 172 | |
| | 5 | | | Imperial Tobacco Group plc | | | 170 | |
| | 16 | | | Kraft Foods, Inc. | | | 595 | |
| | 9 | | | Lorillard, Inc. | | | 1,058 | |
| | 1 | | | Molson Coors Brewing Co. | | | 36 | |
| | 3 | | | Omega Protein Corp. ● | | | 21 | |
| | 10 | | | Philip Morris International, Inc. | | | 774 | |
| | 6 | | | Pilgrim's Pride Corp. ● | | | 37 | |
| | 268 | | | PT Bisi International TBK | | | 27 | |
| | 17 | | | Smithfield Foods, Inc. ● | | | 414 | |
| | 1 | | | Swedish Match Ab | | | 38 | |
| | 3 | | | Zhongpin, Inc. ● | | | 28 | |
| | | | | | | | 6,473 | |
| | | | | Health Care Equipment & Services - 3.0% | | | | |
| | 2 | | | Aetna, Inc. | | | 83 | |
| | 1 | | | Amerisource Bergen Corp. | | | 39 | |
| | 9 | | | Boston Scientific Corp. ● | | | 46 | |
| | 1 | | | Brookdale Senior Living, Inc. ● | | | 15 | |
| | 2 | | | Cardinal Health, Inc. | | | 72 | |
The accompanying notes are an integral part of these financial statements.
| Shares or Principal Amount | | Market Value ╪ | |
| COMMON STOCKS - 98.6% - (continued) |
| | | | | Health Care Equipment & Services - 3.0% - (continued) | | | | |
| | 1 | | | CIGNA Corp. | | $ | 57 | |
| | 8 | | | Covidien plc | | | 358 | |
| | 1 | | | HCA Holdings, Inc. ● | | | 18 | |
| | — | | | M3, Inc. ☼ | | | 104 | |
| | 4 | | | McKesson Corp. | | | 345 | |
| | 5 | | | Medtronic, Inc. | | | 207 | |
| | 3 | | | St. Jude Medical, Inc. | | | 86 | |
| | 1 | | | Stryker Corp. | | | 56 | |
| | 12 | | | UnitedHealth Group, Inc. | | | 610 | |
| | 3 | | | Vanguard Health Systems, Inc. ● | | | 29 | |
| | 1 | | | Wellcare Health Plans, Inc. ● | | | 42 | |
| | — | | | Wellpoint, Inc. | | | 25 | |
| | 3 | | | Zimmer Holdings, Inc. ● | | | 166 | |
| | | | | | | | 2,358 | |
| | | | | Insurance - 3.1% | | | | |
| | 90 | | | Ageas | | | 140 | |
| | 3 | | | AON Corp. | | | 136 | |
| | 15 | | | AXA S.A. | | | 194 | |
| | 11 | | | Brasil Insurance Participacoes e Administracao S.A | | | 104 | |
| | 29 | | | China Pacific Insurance | | | 82 | |
| | 31 | | | Discovery Holdings Ltd. | | | 164 | |
| | 14 | | | FBD Holdings | | | 118 | |
| | 5 | | | Marsh & McLennan Cos., Inc. | | | 142 | |
| | 8 | | | National Financial Partners Corp. ● | | | 101 | |
| | 37 | | | New China Life Insurance Co., Ltd. ● | | | 122 | |
| | 4 | | | Principal Financial Group, Inc. | | | 88 | |
| | 10 | | | Progressive Corp. | | | 188 | |
| | 13 | | | Prudential plc | | | 131 | |
| | 24 | | | Storebrand ASA | | | 127 | |
| | 5 | | | Swiss Re Ltd. | | | 274 | |
| | 14 | | | Unum Group | | | 303 | |
| | | | | | | | 2,414 | |
| | | | | Materials - 8.8% | | | | |
| | 28 | | | African Minerals Ltd. ● | | | 190 | |
| | 2 | | | Air Products and Chemicals, Inc. | | | 169 | |
| | 3 | | | Akzo Nobel N.V. | | | 144 | |
| | 155 | | | AMVIG Holdings Ltd. | | | 82 | |
| | 18 | | | Anglo American plc | | | 668 | |
| | 4 | | | Antofagasta | | | 78 | |
| | 7 | | | Aquarius Platinum Ltd. | | | 17 | |
| | 8 | | | Asahi Kasei Corp. | | | 49 | |
| | 30 | | | Aston Resources Ltd. ● | | | 283 | |
| | 4 | | | Ball Corp. | | | 145 | |
| | 7 | | | Barrick Gold Corp. | | | 313 | |
| | 4 | | | BASF SE | | | 253 | |
| | 5 | | | BHP Billiton plc | | | 132 | |
| | 1 | | | Cabot Corp. | | | 38 | |
| | 1 | | | Celanese Corp. | | | 33 | |
| | — | | | CF Industries Holdings, Inc. | | | 67 | |
| | — | | | Cliff's Natural Resources, Inc. | | | 12 | |
| | 1 | | | CRH plc | | | 12 | |
| | 2 | | | Croda International plc | | | 55 | |
| | 2 | | | Detour Gold Corp. ● | | | 39 | |
| | 6 | | | Dow Chemical Co. | | | 169 | |
| | 1 | | | Eastman Chemical Co. | | | 53 | |
| | 7 | | | EcoSynthetix, Inc. ● | | | 32 | |
| | 10 | | | First Quantum Minerals Ltd. | | | 188 | |
| | 1 | | | FMC Corp. | | | 46 | |
| | 15 | | | Fortescue Metals Group Ltd. | | | 66 | |
| | 2 | | | Fortress Paper Ltd. ● | | | 42 | |
| | 1 | | | Freeport-McMoRan Copper & Gold, Inc. | | | 18 | |
| | 3 | | | Goldcorp, Inc. | | | 133 | |
| | 12 | | | Graphic Packaging Holding Co. ● | | | 49 | |
| | 980 | | | Greenheart Group Ltd. ● | | | 83 | |
| | 2 | | | HeidelbergCement AG w/ Rights | | | 100 | |
| | 929 | | | Huabao International Holdings Ltd. | | | 474 | |
| | — | | | Iluka Resources Ltd. | | | 8 | |
| | 1 | | | Ivanhoe Mines Ltd. ● | | | 12 | |
| | 1 | | | JSR Corp. | | | 22 | |
| | 22 | | | Kinross Gold Corp. | | | 253 | |
| | 1 | | | Koninklijke DSM N.V. | | | 38 | |
| | 4 | | | LyondellBasell Industries Class A | | | 123 | |
| | 2 | | | MeadWestvaco Corp. | | | 50 | |
| | 9 | | | Methanex Corp. | | | 198 | |
| | 3 | | | Methanex Corp. ADR | | | 67 | |
| | 5 | | | Mitsubishi Chemical Holdings | | | 25 | |
| | 3 | | | Molycorp, Inc. ● | | | 66 | |
| | 65 | | | Mongolian Mining Corp. ● | | | 48 | |
| | 11 | | | Mosaic Co. | | | 555 | |
| | 87 | | | Nine Dragons Paper Holdings | | | 55 | |
| | 1 | | | Olin Corp. | | | 21 | |
| | 7 | | | Owens-Illinois, Inc. ● | | | 137 | |
| | 1 | | | Praxair, Inc. | | | 99 | |
| | 13 | | | PTT Chemical Public Co., Ltd. ● | | | 25 | |
| | — | | | Reliance Steel & Aluminum | | | 5 | |
| | 6 | | | Rexam plc | | | 34 | |
| | 5 | | | Rio Tinto plc | | | 222 | |
| | 3 | | | Shin-Etsu Chemical Co., Ltd. | | | 152 | |
| | 116 | | | Sino Forest Corp. Class A ⌂●† | | | 40 | |
| | 14 | | | Smurfit Kappa Group plc ● | | | 85 | |
| | 2 | | | Teck Cominco Ltd. Class B | | | 58 | |
| | 2 | | | Tikkurila Oy | | | 30 | |
| | 9 | | | Ube Industries Ltd. | | | 25 | |
| | 2 | | | Westlake Chemical Corp. | | | 69 | |
| | 4 | | | Worthington Industries, Inc. | | | 61 | |
| | 21 | | | Xingda International Holdings | | | 10 | |
| | 4 | | | Xstrata plc | | | 54 | |
| | | | | | | | 6,879 | |
| | | | | Media - 2.2% | | | | |
| | 1 | | | AMC Networks, Inc. ● | | | 22 | |
| | 13 | | | Comcast Corp. Class A | | | 314 | |
| | 6 | | | Comcast Corp. Special Class A | | | 140 | |
| | 1 | | | DirecTV Class A ● | | | 30 | |
| | 2 | | | DreamWorks Animation SKG, Inc. ● | | | 26 | |
| | 2 | | | Elsevier N.V. | | | 23 | |
| | — | | | Fuji Media Holdings, Inc. | | | 42 | |
| | 4 | | | Liberty Global, Inc. ● | | | 169 | |
| | 3 | | | News Corp. Class A | | | 57 | |
| | 1 | | | Omnicom Group, Inc. | | | 47 | |
| | 2 | | | Publicis Groupe | | | 108 | |
| | 4 | | | Reed Elsevier Capital, Inc. | | | 34 | |
| | 1 | | | SES Global S.A. | | | 34 | |
| | 20 | | | Sirius XM Radio, Inc. w/ Rights ● | | | 37 | |
| | 1 | | | Time Warner, Inc. | | | 39 | |
| | 3 | | | Viacom, Inc. Class B | | | 159 | |
| | 1 | | | Virgin Media, Inc. | | | 31 | |
| | 10 | | | Walt Disney Co. | | | 359 | |
| | — | | | Washington Post Co. Class B | | | 10 | |
The accompanying notes are an integral part of these financial statements.
| Hartford Global Research HLS Fund |
| Schedule of Investments – (continued) |
| December 31, 2011 |
| (000’s Omitted) |
| Shares or Principal Amount | | Market Value ╪ | |
| COMMON STOCKS - 98.6% - (continued) | | | | |
| | | | | Media - 2.2% - (continued) | | | | |
| | 3 | | | Wolters Kluwer N.V. | | $ | 44 | |
| | | | | | | | 1,725 | |
| | | | | Pharmaceuticals, Biotechnology & Life Sciences - 7.2% | | | | |
| | 1 | | | Acorda Therapeutics, Inc. ● | | | 21 | |
| | 2 | | | Agilent Technologies, Inc. ● | | | 59 | |
| | 1 | | | Algeta ASA ● | | | 34 | |
| | — | | | Alk-Abello A/S | | | 17 | |
| | 9 | | | Alkermes plc ● | | | 161 | |
| | 3 | | | Almirall S.A. | | | 19 | |
| | 14 | | | Amylin Pharmaceuticals, Inc. ● | | | 158 | |
| | 1 | | | Astellas Pharma, Inc. | | | 41 | |
| | 3 | | | AstraZeneca plc | | | 136 | |
| | 3 | | | AstraZeneca plc ADR | | | 127 | |
| | 2 | | | Auxilium Pharmaceuticals, Inc. ● | | | 30 | |
| | 1 | | | Biogen Idec, Inc. ● | | | 100 | |
| | 9 | | | Bristol-Myers Squibb Co. | | | 322 | |
| | 2 | | | Cadence Pharmaceuticals, Inc. ● | | | 8 | |
| | 1 | | | Celgene Corp. ● | | | 83 | |
| | 13 | | | Daiichi Sankyo Co., Ltd. | | | 250 | |
| | 8 | | | Eisai Co., Ltd. | | | 322 | |
| | 29 | | | Elan Corp. plc ADR ● | | | 397 | |
| | 8 | | | Eli Lilly & Co. | | | 343 | |
| | 5 | | | Exelixis, Inc. ● | | | 21 | |
| | 9 | | | Forest Laboratories, Inc. ● | | | 286 | |
| | 1 | | | Gilead Sciences, Inc. ● | | | 38 | |
| | 1 | | | H. Lundbeck A/S | | | 18 | |
| | — | | | Hospira, Inc. ● | | | 9 | |
| | 2 | | | Immunogen, Inc. ● | | | 20 | |
| | 2 | | | Incyte Corp. ● | | | 36 | |
| | 2 | | | Ironwood Pharmaceuticals, Inc. ● | | | 23 | |
| | — | | | Life Technologies Corp. ● | | | 11 | |
| | 3 | | | Medicines Co. ● | | | 54 | |
| | 13 | | | Merck & Co., Inc. | | | 479 | |
| | 3 | | | Mylan, Inc. ● | | | 66 | |
| | 2 | | | NPS Pharmaceuticals, Inc. ● | | | 11 | |
| | — | | | Ono Pharmaceutical Co., Ltd. | | | 20 | |
| | 1 | | | Onyx Pharmaceuticals, Inc. ● | | | 46 | |
| | 1 | | | Pacira Pharmaceuticals, Inc. ● | | | 5 | |
| | 14 | | | Pfizer, Inc. | | | 308 | |
| | 1 | | | Pharmasset, Inc. ● | | | 127 | |
| | 3 | | | Regeneron Pharmaceuticals, Inc. ● | | | 192 | |
| | 3 | | | Rigel Pharmaceuticals, Inc. ● | | | 23 | |
| | 1 | | | Roche Holding AG | | | 104 | |
| | 2 | | | Salix Pharmaceuticals Ltd. ● | | | 72 | |
| | 2 | | | Seattle Genetics, Inc. ● | | | 40 | |
| | 13 | | | Shionogi & Co., Ltd. | | | 166 | |
| | 1 | | | Targacept, Inc. ● | | | 3 | |
| | 13 | | | Teva Pharmaceutical Industries Ltd. ADR | | | 521 | |
| | 2 | | | Thermo Fisher Scientific, Inc. ● | | | 101 | |
| | 3 | | | UCB S.A. | | | 136 | |
| | 1 | | | Vertex Pharmaceuticals, Inc. ● | | | 37 | |
| | — | | | Waters Corp. ● | | | 30 | |
| | — | | | Watson Pharmaceuticals, Inc. ● | | | 30 | |
| | | | | | | | 5,661 | |
| | | | | Real Estate - 2.6% | | | | |
| | — | | | Alexandria Real Estate Equities, Inc. | | | 15 | |
| | 1 | | | Aliansce Shopping | | | 7 | |
| | 1 | | | Alstria Office REIT AG | | | 11 | |
| | 3 | | | American Assets Trust, Inc. | | | 68 | |
| | — | | | American Campus Communities, Inc. | | | 15 | |
| | 2 | | | American Tower Corp. Class A | | | 112 | |
| | — | | | Avalonbay Communities, Inc. | | | 11 | |
| | 22 | | | Ayala Land, Inc. | | | 8 | |
| | — | | | Boston Properties, Inc. | | | 40 | |
| | 10 | | | BR Malls Participacoes S.A. | | | 93 | |
| | 1 | | | BR Properties S.A. | | | 8 | |
| | — | | | BRE Properties | | | 23 | |
| | 12 | | | British Land Co. plc | | | 84 | |
| | — | | | Brookfield Asset Management, Inc. | | | 10 | |
| | 1 | | | Canadian Apartment Properties | | | 16 | |
| | 1 | | | Castellum AB | | | 12 | |
| | 45 | | | China Overseas Grand Oceans Group Ltd. | | | 39 | |
| | 7 | | | China Overseas Land & Investment Ltd. | | | 11 | |
| | 14 | | | Commonwealth Property Office Fund | | | 14 | |
| | 1 | | | Coresite Realty Corp. | | | 12 | |
| | 1 | | | Cyrela Commercial Properties S.A. Empreendimentose Particicpacoes | | | 6 | |
| | 1 | | | Daito Trust Construction Co., Ltd. | | | 116 | |
| | 1 | | | DDR Corp. | | | 10 | |
| | 1 | | | Derwent London plc | | | 18 | |
| | 26 | | | Dexus Property Group | | | 22 | |
| | — | | | Digital Realty Trust, Inc. | | | 21 | |
| | 1 | | | Douglas Emmett, Inc. | | | 19 | |
| | 1 | | | Education Realty Trust, Inc. | | | 7 | |
| | — | | | Equity Lifestyle Properties, Inc. | | | 15 | |
| | 9 | | | Forest City Enterprises, Inc. Class A ● | | | 105 | |
| | 2 | | | Glimcher Realty Trust | | | 16 | |
| | 8 | | | GPT Group | | | 24 | |
| | 1 | | | GSW Immobilien AG ● | | | 25 | |
| | 1 | | | HCP, Inc. | | | 44 | |
| | — | | | Health Care, Inc. | | | 16 | |
| | — | | | Icade | | | 6 | |
| | 1 | | | Kilroy Realty Corp. | | | 19 | |
| | 1 | | | LaSalle Hotel Properties | | | 16 | |
| | 6 | | | Link REIT | | | 24 | |
| | 108 | | | Mapletree Industries NPV | | | 89 | |
| | — | | | Mercialys | | | 5 | |
| | 2 | | | Mitsubishi Estate Co., Ltd. | | | 34 | |
| | 2 | | | Mitsui Fudosan Co., Ltd. | | | 32 | |
| | — | | | Northern Property Real Estate Investment Trust | | | 6 | |
| | — | | | PSP Swiss Property | | | 16 | |
| | — | | | Public Storage | | | 61 | |
| | 2 | | | Rayonier, Inc. | | | 73 | |
| | 1 | | | RioCan Real Estate Investment Trust | | | 25 | |
| | — | | | RLJ Lodging Trust | | | 8 | |
| | — | | | Saul Centers, Inc. | | | 9 | |
| | 3 | | | Shaftesbury plc | | | 19 | |
| | 2 | | | Simon Property Group, Inc. | | | 238 | |
| | 10 | | | Sun Hung Kai Properties Ltd. | | | 121 | |
| | — | | | Swiss Prime Site AG | | | 14 | |
| | — | | | Taubman Centers, Inc. | | | 24 | |
| | 1 | | | UDR, Inc. | | | 24 | |
| | — | | | Unibail-Rodamco SE | | | 45 | |
| | — | | | Vornado Realty Trust | | | 18 | |
| | 3 | | | Westfield Group | | | 26 | |
| | 3 | | | Westfield Retail Trust | | | 8 | |
| | | | | | | | 2,033 | |
The accompanying notes are an integral part of these financial statements.
| Shares or Principal Amount | | Market Value ╪ | |
| COMMON STOCKS - 98.6% - (continued) | | | | |
| | | | | Retailing - 2.8% | | | | |
| | 2 | | | Amazon.com, Inc. ● | | $ | 331 | |
| | 14 | | | Belle International Holdings Ltd. § | | | 24 | |
| | — | | | Fast Retailing Co., Ltd. | | | 39 | |
| | 5 | | | Gap, Inc. | | | 85 | |
| | 5 | | | Home Depot, Inc. | | | 194 | |
| | 1 | | | Industria de Diseno Textil S.A. | | | 119 | |
| | 78 | | | Intime Department Store | | | 79 | |
| | 1 | | | J.C. Penney Co., Inc. | | | 32 | |
| | 2 | | | Kohl's Corp. | | | 85 | |
| | 20 | | | Lifestyle International | | | 45 | |
| | 17 | | | Lowe's Co., Inc. | | | 438 | |
| | 5 | | | Macy's, Inc. | | | 158 | |
| | 26 | | | Myer Holdings Ltd. | | | 52 | |
| | 1 | | | Nordstrom, Inc. | | | 30 | |
| | 1 | | | Pinault-Printemps-Redoute S.A. | | | 89 | |
| | — | | | Priceline.com, Inc. ● | | | 176 | |
| | — | | | Rakuten, Inc. | | | 78 | |
| | 34 | | | Sa Sa International Holdings Ltd. | | | 19 | |
| | 3 | | | Target Corp. | | | 153 | |
| | | | | | | | 2,226 | |
| | | | | Semiconductors & Semiconductor Equipment - 1.7% | | | | |
| | 9 | | | Applied Micro Circuits Corp. ● | | | 58 | |
| | 9 | | | ASM Pacific Technology | | | 102 | |
| | 4 | | | ASML Holding N.V. | | | 159 | |
| | 3 | | | ASML Holding N.V. ADR | | | 138 | |
| | 1 | | | Linear Technology Corp. | | | 44 | |
| | 2 | | | Maxim Integrated Products, Inc. | | | 49 | |
| | 2 | | | NVIDIA Corp. ● | | | 24 | |
| | 6 | | | RF Micro Devices, Inc. ● | | | 32 | |
| | — | | | Samsung Electronics Co., Ltd. | | | 220 | |
| | 4 | | | Spreadtrum Communications, Inc. | | | 84 | |
| | 82 | | | Taiwan Semiconductor Manufacturing Co., Ltd. | | | 205 | |
| | 6 | | | Texas Instruments, Inc. | | | 183 | |
| | | | | | | | 1,298 | |
| | | | | Software & Services - 7.5% | | | | |
| | 7 | | | Accenture plc | | | 362 | |
| | 3 | | | Activision Blizzard, Inc. | | | 38 | |
| | 2 | | | Alliance Data Systems Corp. ● | | | 176 | |
| | 11 | | | Automatic Data Processing, Inc. ‡ | | | 580 | |
| | — | | | Check Point Software Technologies Ltd. ADR ● | | | 15 | |
| | 3 | | | Cia Brasileira de Meios de Pagamentos | | | 78 | |
| | 2 | | | Citrix Systems, Inc. ● | | | 123 | |
| | 17 | | | eBay, Inc. ● | | | 515 | |
| | — | | | Equinix, Inc. ● | | | 35 | |
| | 6 | | | Euronet Worldwide, Inc. ● | | | 109 | |
| | 1 | | | Exlservice Holdings, Inc. ● | | | 32 | |
| | 2 | | | Genpact Ltd. ● | | | 35 | |
| | 1 | | | Google, Inc. ● | | | 758 | |
| | 1 | | | Gree, Inc. | | | 48 | |
| | 3 | | | Hisoft Technology International Ltd. ● | | | 28 | |
| | 1 | | | IBM Corp. | | | 183 | |
| | 1 | | | Intuit, Inc. | | | 64 | |
| | 4 | | | Kakaku.com, Inc. | | | 135 | |
| | 16 | | | Lender Processing Services | | | 248 | |
| | 17 | | | Microsoft Corp. | | | 438 | |
| | 18 | | | Oracle Corp. | | | 472 | |
| | 2 | | | Red Hat, Inc. ● | | | 78 | |
| | 6 | | | Redecard S.A. | | | 100 | |
| | 1 | | | Salesforce.com, Inc. ● | | | 112 | |
| | 11 | | | Sapient Corp. | | | 142 | |
| | 1 | | | Sohu.com, Inc. ● | | | 25 | |
| | 2 | | | Teradata Corp. ● | | | 104 | |
| | 2 | | | Tibco Software, Inc. ● | | | 49 | |
| | 2 | | | VeriSign, Inc. | | | 85 | |
| | 2 | | | Visa, Inc. | | | 210 | |
| | 1 | | | VMware, Inc. ● | | | 80 | |
| | 24 | | | Western Union Co. | | | 446 | |
| | | | | | | | 5,903 | |
| | | | | Technology Hardware & Equipment - 4.5% | | | | |
| | 55 | | | AAC Technologies Holdings, Inc. | | | 122 | |
| | 17 | | | Advantech Co., Ltd. | | | 48 | |
| | 4 | | | Apple, Inc. ● | | | 1,438 | |
| | 1 | | | Aruba Networks, Inc. ● | | | 26 | |
| | 4 | | | Calix, Inc. ● | | | 23 | |
| | 13 | | | Chroma Ate, Inc. | | | 26 | |
| | 31 | | | Cisco Systems, Inc. | | | 552 | |
| | 14 | | | EMC Corp. ● | | | 312 | |
| | — | | | F5 Networks, Inc. ● | | | 39 | |
| | 2 | | | Finisar Corp. ● | | | 32 | |
| | 2 | | | Hamamatsu Photonics KK | | | 77 | |
| | 4 | | | Hewlett-Packard Co. | | | 108 | |
| | 19 | | | Hitachi Ltd. | | | 101 | |
| | 37 | | | Hon Hai Precision Industry Co., Ltd. | | | 100 | |
| | — | | | Juniper Networks, Inc. ● | | | 6 | |
| | 7 | | | Qualcomm, Inc. | | | 357 | |
| | 51 | | | Synnex Technology International Corp. | | | 124 | |
| | — | | | Universal Display Corp. ● | | | 2 | |
| | 4 | | | Yokogawa Electric Corp. | | | 40 | |
| | | | | | | | 3,533 | |
| | | | | Telecommunication Services - 4.2% | | | | |
| | 6 | | | America Movil S.A. de C.V. ADR | | | 139 | |
| | 66 | | | Axiata Group Berhad | | | 108 | |
| | 45 | | | Bharti Televentures | | | 291 | |
| | 155 | | | China Unicom Ltd. | | | 326 | |
| | 2 | | | Crown Castle International Corp. ● | | | 112 | |
| | 28 | | | Frontier Communications Corp. | | | 145 | |
| | 3 | | | KT Corp. ADR | | | 39 | |
| | 34 | | | Leap Wireless International, Inc. w/ Rights ● | | | 320 | |
| | 11 | | | MetroPCS Communications, Inc. ● | | | 94 | |
| | 1 | | | Millicom International Cellular SDR | | | 144 | |
| | 5 | | | Mobile Telesystems OJSC ADR | | | 77 | |
| | 6 | | | MTN Group Ltd. | | | 103 | |
| | 4 | | | NII Holdings, Inc. Class B ● | | | 81 | |
| | 22 | | | Orascom Telecom Holding SAE GDR ● | | | 64 | |
| | 3 | | | P.T. Telekomunikasi Indonesia ADR | | | 100 | |
| | 1 | | | Philippine Long Distance Telephone Co. ADR | | | 55 | |
| | 1 | | | SBA Communications Corp. ● | | | 52 | |
| | 2 | | | SK Telecom Co., Ltd. ADR | | | 26 | |
| | 73 | | | Sprint Nextel Corp. ● | | | 170 | |
| | 5 | | | Tele2 Ab B Shares | | | 98 | |
| | 19 | | | Telenor ASA | | | 309 | |
| | 3 | | | Tim Participacoes S.A. ADR | | | 72 | |
| | 5 | | | TW Telecom, Inc. ● | | | 96 | |
| | 5 | | | VimpelCom Ltd. ADR | | | 44 | |
| | 71 | | | Vodafone Group plc | | | 198 | |
| | | | | | | | 3,263 | |
The accompanying notes are an integral part of these financial statements.
| Hartford Global Research HLS Fund |
| Schedule of Investments – (continued) |
| December 31, 2011 |
| (000’s Omitted) |
| Shares or Principal Amount | | Market Value ╪ | |
| COMMON STOCKS - 98.6% - (continued) | | | | |
| | | | | Transportation - 2.6% | | | | |
| | 3 | | | Abertis Infraestructuras S.A. | | $ | 42 | |
| | 252 | | | AirAsia Berhad | | | 299 | |
| | 10 | | | BBA Aviation plc | | | 28 | |
| | 2 | | | Deutsche Post AG | | | 30 | |
| | 4 | | | DSV A/S | | | 78 | |
| | — | | | East Japan Railway Co. | | | 13 | |
| | 5 | | | FedEx Corp. | | | 378 | |
| | 1 | | | Genesee & Wyoming, Inc. Class A ● | | | 85 | |
| | 2 | | | Hitachi Transport System Ltd. | | | 26 | |
| | 97 | | | Hutchinson Port Holdings Trust | | | 60 | |
| | 8 | | | J.B. Hunt Transport Services, Inc. | | | 348 | |
| | 24 | | | JetBlue Airways Corp. ● | | | 126 | |
| | 3 | | | Kansas City Southern ● | | | 205 | |
| | 8 | | | Localiza Rent a Car S.A. | | | 108 | |
| | 13 | | | Pacer International, Inc. ● | | | 67 | |
| | 4 | | | Quality Distribution, Inc. ● | | | 41 | |
| | 16 | | | Transurban Group | | | 90 | |
| | 5 | | | Vitran Corp., Inc. ● | | | 26 | |
| | 46 | | | Zhejiang Expressway Co., Ltd. | | | 30 | |
| | | | | | | | 2,080 | |
| | | | | Utilities - 3.9% | | | | |
| | 6 | | | Calpine Corp. ● | | | 90 | |
| | 4 | | | Cheung Kong Infrastructure | | | 25 | |
| | 3 | | | Chubu Electric Power Co., Inc. | | | 58 | |
| | 16 | | | Companhia Energetica de Minas Gerais ADR | | | 292 | |
| | 9 | | | E.On AG | | | 185 | |
| | 2 | | | Edison International | | | 86 | |
| | 1 | | | Electricite de France | | | 33 | |
| | 20 | | | Enel S.p.A. | | | 80 | |
| | 16 | | | ENN Energy Holdings Ltd. | | | 52 | |
| | 8 | | | Gaz de France | | | 217 | |
| | 202 | | | Guangdong Investment Ltd. | | | 122 | |
| | 6 | | | International Power plc | | | 30 | |
| | 1 | | | ITC Holdings Corp. | | | 49 | |
| | 33 | | | National Grid plc | | | 322 | |
| | 8 | | | NextEra Energy, Inc. | | | 485 | |
| | 3 | | | Northeast Utilities | | | 99 | |
| | 24 | | | Osaka Gas Co., Ltd. | | | 95 | |
| | 5 | | | PG&E Corp. | | | 188 | |
| | 1 | | | Pinnacle West Capital Corp. | | | 54 | |
| | 17 | | | Power Grid Corp. of India Ltd. | | | 32 | |
| | 4 | | | Severn Trent plc | | | 83 | |
| | 11 | | | Snam S.p.A. | | | 47 | |
| | 35 | | | Tokyo Gas Co., Ltd. | | | 160 | |
| | 4 | | | Tractebel Energia S.A. | | | 68 | |
| | 3 | | | Xcel Energy, Inc. | | | 83 | |
| | | | | | | | 3,035 | |
| | | | | Total common stocks | | | | |
| | | | | (cost $79,144) | | $ | 77,406 | |
| | | | | | | | | |
| PREFERRED STOCKS - 0.2% | | | | |
| | | | | Banks - 0.2% | | | | |
| | 10 | | | Banco Itau Holding | | $ | 190 | |
| | | | | | | | | |
| | | | | Total preferred stocks | | | | |
| | | | | (cost $114) | | $ | 190 | |
| | | | | | | | | |
| WARRANTS - 0.0% | | | | |
| | | | | Food, Beverage & Tobacco - 0.0% | | | | |
| | 1 | | | GLG Life Technology Corp. ⌂ | | $ | — | |
| | | | | | | | | |
| | | | | Total warrants | | | | |
| | | | | (cost $–) | | $ | — | |
| | | | | | | | | |
| EXCHANGE TRADED FUNDS - 0.3% | | | | |
| | | | | Other Investment Pools and Funds - 0.3% | | | | |
| | 5 | | | Industrial Select Sector SPDR Fund | | $ | 177 | |
| | 1 | | | SPDR S&P Retail ETF | | | 41 | |
| | | | | | | | | |
| | | | | Total exchange traded funds | | | | |
| | | | | (cost $215) | | $ | 218 | |
| | | | | | | | | |
| CORPORATE BONDS - 0.0% | | | | |
| | | | | Petroleum and Coal Products Manufacturing - 0.0% | | | | |
| | | | | Green Plains Renewable Energy | | | | |
| $ | 13 | | | 5.75%, 11/01/2015 ۞■ | | $ | 12 | |
| | | | | | | | | |
| | | | | Total corporate bonds | | | | |
| | | | | (cost $12) | | $ | 12 | |
| | | | | | | | | |
| | | | | Total long-term investments | | | | |
| | | | | (cost $79,485) | | $ | 77,826 | |
| | | | | | | | | |
| SHORT-TERM INVESTMENTS - 0.9% | | | | |
| Repurchase Agreements - 0.9% |
| | | | | Bank of America Merrill Lynch TriParty Joint | | | | |
| | | | | Repurchase Agreement (maturing on | | | | |
| | | | | 01/03/2012 in the amount of $262, | | | | |
| | | | | collateralized by GNMA 4.50%, 2041, | | | | |
| | | | | value of $267) | | | | |
| $ | 262 | | | 0.04%, 12/30/2011 | | $ | 262 | |
| | | | | Barclays Capital TriParty Joint Repurchase | | | | |
| | | | | Agreement (maturing on 01/03/2012 in the | | | | |
| | | | | amount of $22, collateralized by U.S. | | | | |
| | | | | Treasury Bond 5.38%, 2031, value of $22) | | | | |
| | 22 | | | 0.01%, 12/30/2011 | | | 22 | |
| | | | | Deutsche Bank Securities TriParty Joint | | | | |
| | | | | Repurchase Agreement (maturing on | | | | |
| | | | | 01/03/2012 in the amount of $291, | | | | |
| | | | | collateralized by GNMA 3.50% - 7.00%, | | | | |
| | | | | 2035 - 2046, value of $296) | | | | |
| | 291 | | | 0.06%, 12/30/2011 | | | 291 | |
| | | | | UBS Securities, Inc. Joint Repurchase | | | | |
| | | | | Agreement (maturing on 01/03/2012 in the | | | | |
| | | | | amount of $2, collateralized by U.S. | | | | |
| | | | | Treasury Note 2.75%, 2016, value of $2) | | | | |
| | 2 | | | 0.01%, 12/30/2011 | | | 2 | |
The accompanying notes are an integral part of these financial statements.
| Shares or Principal Amount | | | | | Market Value ╪ | |
| SHORT-TERM INVESTMENTS - 0.9% - (continued) |
| Repurchase Agreements - 0.9% - (continued) |
| | | | | UBS Securities, Inc. TriParty Joint Repurchase | | | | | | | | |
| | | | | Agreement (maturing on 01/03/2012 in the | | | | | | | | |
| | | | | amount of $112, collateralized by FNMA | | | | | | | | |
| | | | | 3.00% - 6.50%, 2021 - 2041, value of | | | | | | | | |
| | | | | $115) | | | | | | | | |
| $ | 112 | | | 0.04%, 12/30/2011 | | | | | | $ | 112 | |
| | | | | | | | | | | | 689 | |
| | | | | Total short-term investments | | | | | | | | |
| | | | | (cost $689) | | | | | | $ | 689 | |
| | | | | | | | | | | | | |
| | | | | Total investments | | | | | | | | |
| | | | | (cost $80,174) ▲ | | | 100.0 | % | | $ | 78,515 | |
| | | | | Other assets and liabilities | | | — | % | | | — | |
| | | | | Total net assets | | | 100.0 | % | | $ | 78,515 | |
| Note: | Percentage of investments as shown is the ratio of the total market value to total net assets. Market value of long-term investments in foreign securities represents 46.6% of total net assets at December 31, 2011. |
Prices of foreign equities that are principally traded on certain foreign markets may be adjusted daily pursuant to a fair value pricing service approved by the Board of Directors in order to reflect an adjustment for factors occurring after the close of certain foreign markets but before the close of the New York Stock Exchange.
| ▲ | At December 31, 2011, the cost of securities for federal income tax purposes was $81,706 and the aggregate gross unrealized appreciation and depreciation based on that cost were: |
| Unrealized Appreciation | | $ | 6,811 | |
| Unrealized Depreciation | | | (10,002 | ) |
| Net Unrealized Depreciation | | $ | (3,191 | ) |
| † | These securities were valued in good faith at fair value as determined under policies and procedures established by and under the supervision of the Company's Board of Directors. At December 31, 2011, the aggregate value of these securities was $40, which represents 0.1% of total net assets. This amount excludes securities that are principally traded in certain foreign markets and whose prices are adjusted pursuant to a third party pricing service methodology approved by the Board of Directors. |
| ■ | Securities issued within terms of a private placement memorandum, exempt from registration under Rule 144A under the Securities Act of 1933, as amended, and may be sold only to qualified institutional buyers. Unless otherwise indicated, these issues are determined to be liquid. At December 31, 2011, the aggregate value of these securities was $84, which represents 0.1% of total net assets. |
| § | These securities were sold to the Fund under Regulation S, rules governing offers and sales made outside the United States without registration under the Securities Act of 1933. The Fund may only be able to resell these securities in the United States if an exemption from registration under the federal and state securities laws is available, or the Fund may only be able to sell these securities outside of the United States (such as on a foreign exchange) to a non-U.S. person. Unless otherwise indicated, these holdings are determined to be liquid. At December 31, 2011, the aggregate value of these securities was $24, which rounds to zero percent of total net assets. |
| ⌂ | The following securities are considered illiquid. Illiquid securities are often purchased in private placement transactions, are often not registered under the Securities Act of 1933 and may have contractual restrictions on resale. A security may also be considered illiquid if the security lacks a readily available market or if its valuation has not changed for a certain period of time. |
| Period Acquired | | Shares/ Par | | | Security | | | Cost Basis | |
| 02/2011 | | 1 | | | GLG Life Technology Corp. Warrants | | | $ | — | |
| 06/2011 - 07/2011 | | 116 | | | Sino Forest Corp. Class A | | | | 485 | |
At December 31, 2011, the aggregate value of these securities was $40, which represents 0.1% of total net assets.
The accompanying notes are an integral part of these financial statements.
| Hartford Global Research HLS Fund |
| Schedule of Investments – (continued) |
| December 31, 2011 |
| (000’s Omitted) |
| ☼ | This security, or a portion of this security, was purchased on a when-issued, delayed delivery or delayed draw basis. The cost of these securities was $17 at December 31, 2011. |
| ‡ | This security, or a portion of this security, has been segregated to cover funding requirements on investment transactions settling in the future. |
Foreign Currency Contracts Outstanding at December 31, 2011
| Description | | Counterparty | | Buy / Sell | | Market Value ╪ | | | Contract
Amount | | | Delivery Date | | | Unrealized
Appreciation/
(Depreciation) | |
| British Pound | | JP Morgan Securities | | Sell | | $ | 10 | | | $ | 10 | | | 01/03/2012 | | | $ | — | |
| Euro | | Deutsche Bank Securities | | Buy | | | 45 | | | | 45 | | | 01/04/2012 | | | | — | |
| Euro | | Deutsche Bank Securities | | Sell | | | 32 | | | | 32 | | | 01/04/2012 | | | | — | |
| Japanese Yen | | BNP Paribas Securities | | Buy | | | 51 | | | | 49 | | | 03/15/2012 | | | | 2 | |
| Japanese Yen | | JP Morgan Securities | | Buy | | | 27 | | | | 27 | | | 02/02/2012 | | | | — | |
| Japanese Yen | | JP Morgan Securities | | Sell | | | 605 | | | | 604 | | | 02/02/2012 | | | | (1 | ) |
| Japanese Yen | | JP Morgan Securities | | Buy | | | 17 | | | | 17 | | | 01/04/2012 | | | | — | |
| Japanese Yen | | Standard Chartered Bank | | Buy | | | 68 | | | | 68 | | | 02/02/2012 | | | | — | |
| Japanese Yen | | Standard Chartered Bank | | Buy | | | 157 | | | | 157 | | | 03/15/2012 | | | | — | |
| Japanese Yen | | Westpac International | | Buy | | | 330 | | | | 332 | | | 03/15/2012 | | | | (2 | ) |
| Japanese Yen | | Westpac International | | Sell | | | 538 | | | | 519 | | | 03/15/2012 | | | | (19 | ) |
| Norwegian Krone | | State Street Global Markets LLC | | Sell | | | 1 | | | | 1 | | | 01/04/2012 | | | | — | |
| Swiss Franc | | Goldman Sachs | | Buy | | | 39 | | | | 45 | | | 02/09/2012 | | | | (6 | ) |
| Swiss Franc | | Goldman Sachs | | Sell | | | 39 | | | | 51 | | | 02/09/2012 | | | | 12 | |
| | | | | | | | | | | | | | | | | | $ | (14 | ) |
| ╪ | See Significant Accounting Policies of accompanying Notes to Financial Statements regarding valuation of securities. |
The accompanying notes are an integral part of these financial statements.
| Hartford Global Research HLS Fund |
| Investment Valuation Hierarchy Level Summary |
| December 31, 2011 |
| (000’s Omitted) |
| | Total | | | Level 1 ♦ | | | Level 2 ♦ | | | Level 3 | |
| Assets: | | | | | | | | | | | | | | | | |
| Common Stocks | | | | | | | | | | | | | | | | |
| Automobiles & Components | | $ | 1,639 | | | $ | — | | | $ | 1,639 | | | $ | — | |
| Banks | | | 6,906 | | | | 3,573 | | | | 3,333 | | | | — | |
| Capital Goods | | | 4,544 | | | | 3,074 | | | | 1,470 | | | | — | |
| Commercial & Professional Services | | | 125 | | | | 96 | | | | 29 | | | | — | |
| Consumer Durables & Apparel | | | 824 | | | | 311 | | | | 513 | | | | — | |
| Consumer Services | | | 195 | | | | 57 | | | | 138 | | | | — | |
| Diversified Financials | | | 3,369 | | | | 1,812 | | | | 1,557 | | | | — | |
| Energy | | | 9,122 | | | | 6,611 | | | | 2,511 | | | | — | |
| Food & Staples Retailing | | | 1,801 | | | | 1,058 | | | | 743 | | | | — | |
| Food, Beverage & Tobacco | | | 6,473 | | | | 4,123 | | | | 2,350 | | | | — | |
| Health Care Equipment & Services | | | 2,358 | | | | 2,254 | | | | 104 | | | | — | |
| Insurance | | | 2,414 | | | | 1,302 | | | | 1,112 | | | | — | |
| Materials | | | 6,879 | | | | 3,345 | | | | 3,494 | | | | 40 | |
| Media | | | 1,725 | | | | 1,440 | | | | 285 | | | | — | |
| Pharmaceuticals, Biotechnology & Life Sciences | | | 5,661 | | | | 4,398 | | | | 1,263 | | | | — | |
| Real Estate | | | 2,033 | | | | 1,210 | | | | 823 | | | | — | |
| Retailing | | | 2,226 | | | | 1,682 | | | | 544 | | | | — | |
| Semiconductors & Semiconductor Equipment | | | 1,298 | | | | 612 | | | | 686 | | | | — | |
| Software & Services | | | 5,903 | | | | 5,720 | | | | 183 | | | | — | |
| Technology Hardware & Equipment | | | 3,533 | | | | 2,895 | | | | 638 | | | | — | |
| Telecommunication Services | | | 3,263 | | | | 1,686 | | | | 1,577 | | | | — | |
| Transportation | | | 2,080 | | | | 1,444 | | | | 636 | | | | — | |
| Utilities | | | 3,035 | | | | 1,494 | | | | 1,541 | | | | — | |
| Total | | | 77,406 | | | | 50,197 | | | | 27,169 | | | | 40 | |
| Corporate Bonds | | | 12 | | | | — | | | | 12 | | | | — | |
| Exchange Traded Funds | | | 218 | | | | 218 | | | | — | | | | — | |
| Preferred Stocks | | | 190 | | | | 190 | | | | — | | | | — | |
| Warrants | | | — | | | | — | | | | — | | | | — | |
| Short-Term Investments | | | 689 | | | | — | | | | 689 | | | | — | |
| Total | | $ | 78,515 | | | $ | 50,605 | | | $ | 27,870 | | | $ | 40 | |
| Foreign Currency Contracts* | | | 14 | | | | — | | | | 14 | | | | — | |
| Total | | $ | 14 | | | $ | — | | | $ | 14 | | | $ | — | |
| Liabilities: | | | | | | | | | | | | | | | | |
| Foreign Currency Contracts* | | | 28 | | | | — | | | | 28 | | | | — | |
| Total | | $ | 28 | | | $ | — | | | $ | 28 | | | $ | — | |
| ♦ | For the year ended December 31, 2011, there were no significant transfers between Level 1 and Level 2. |
| * | Derivative instruments not reflected in the Schedule of Investments are valued at the unrealized appreciation/depreciation on the investments. |
Following is a reconciliation of Level 3 assets for which significant unobservable inputs were used to determine fair value:
| | Balance as
of
December
31, 2010 | | | Realized
Gain
(Loss) | | | Change in
Unrealized
Appreciation
(Depreciation) | | | Net
Amortization | | | Purchases | | | Sales | | | Transfers
Into
Level 3 * | | | Transfers
Out of
Level 3 * | | | Balance as
of
December
31, 2011 | |
| Assets: | | | | | | | | | | | | | | | | | | | | | | | | | | | | | | | | | | | | |
| Common Stocks | | $ | — | | | $ | (139 | ) | | $ | (522 | )† | | $ | — | | | $ | 616 | | | $ | (203 | ) | | $ | 288 | | | $ | — | | | $ | 40 | |
| Total | | $ | — | | | $ | (139 | ) | | $ | (522 | ) | | $ | — | | | $ | 616 | | | $ | (203 | ) | | $ | 288 | | | $ | — | | | $ | 40 | |
| * | Securities are transferred into and out of Level 3 for a variety of reasons including, but not limited to: |
| 1) | Securities where trading has been halted (transfer into Level 3) or securities where trading has resumed (transfer out of Level 3). |
| 2) | Broker quoted securities (transfer into Level 3) or quoted prices in active markets (transfer out of Level 3). |
| 3) | Securities that have certain restrictions on trading (transfer into Level 3) or securities where trading restrictions have expired (transfer out of Level 3). |
| † | Change in unrealized appreciation (depreciation) in the current period relating to assets still held at December 31, 2011 was $(522). |
The accompanying notes are an integral part of these financial statements.
| Hartford Global Research HLS Fund |
| Statement of Assets and Liabilities |
| December 31, 2011 |
| (000’s Omitted) |
| Assets: | | | | |
| Investments in securities, at market value (cost $80,174) | | $ | 78,515 | |
| Cash | | | 2 | |
| Foreign currency on deposit with custodian (cost $5) | | | 5 | |
| Unrealized appreciation on foreign currency contracts | | | 14 | |
| Receivables: | | | | |
| Investment securities sold | | | 158 | |
| Fund shares sold | | | 48 | |
| Dividends and interest | | | 129 | |
| Total assets | | | 78,871 | |
| Liabilities: | | | | |
| Unrealized depreciation on foreign currency contracts | | | 28 | |
| Payables: | | | | |
| Investment securities purchased | | | 197 | |
| Fund shares redeemed | | | 86 | |
| Investment management fees | | | 16 | |
| Distribution fees | | | 1 | |
| Accrued expenses | | | 28 | |
| Total liabilities | | | 356 | |
| Net assets | | $ | 78,515 | |
| Summary of Net Assets: | | | | |
| Capital stock and paid-in-capital | | $ | 97,834 | |
| Undistributed net investment income | | | 828 | |
| Accumulated net realized loss | | | (18,472 | ) |
| Unrealized depreciation of investments and the translations of assets and liabilities denominated in foreign currency | | | (1,675 | ) |
| Net assets | | $ | 78,515 | |
| Shares authorized | | | 800,000 | |
| Par value | | $ | 0.001 | |
| Class IA: Net asset value per share | | $ | 9.02 | |
| Shares outstanding | | | 5,851 | |
| Net assets | | $ | 52,768 | |
| Class IB: Net asset value per share | | $ | 8.98 | |
| Shares outstanding | | | 2,867 | |
| Net assets | | $ | 25,747 | |
The accompanying notes are an integral part of these financial statements.
| Hartford Global Research HLS Fund |
| Statement of Operations |
| For the Year Ended December 31, 2011 |
| (000’s Omitted) |
| Investment Income: | | | | |
| Dividends | | $ | 2,120 | |
| Interest | | | 1 | |
| Less: Foreign tax withheld | | | (184 | ) |
| Total investment income, net | | | 1,937 | |
| | | | | |
| Expenses: | | | | |
| Investment management fees | | | 856 | |
| Distribution fees - Class IB | | | 79 | |
| Custodian fees | | | 60 | |
| Accounting services fees | | | 15 | |
| Board of Directors' fees | | | 3 | |
| Audit fees | | | 18 | |
| Other expenses | | | 26 | |
| Total expenses (before fees paid indirectly) | | | 1,057 | |
| Commission recapture | | | (2 | ) |
| Total fees paid indirectly | | | (2 | ) |
| Total expenses, net | | | 1,055 | |
| Net investment income | | | 882 | |
| | | | | |
| Net Realized Gain on Investments, Other Financial Instruments and Foreign Currency Transactions: | | | | |
| Net realized gain on investments | | | 8,255 | |
| Net realized gain on futures | | | 4 | |
| Net realized loss on foreign currency contracts | | | (171 | ) |
| Net realized gain on other foreign currency transactions | | | 38 | |
| Net Realized Gain on Investments, Other Financial Instruments and Foreign Currency Transactions | | | 8,126 | |
| | | | | |
| Net Changes in Unrealized Depreciation of Investments, Other Financial Instruments and Foreign Currency Transactions: | | | | |
| Net unrealized depreciation of investments | | | (17,780 | ) |
| Net unrealized depreciation of futures | | | (2 | ) |
| Net unrealized appreciation of foreign currency contracts | | | 74 | |
| Net unrealized depreciation on translation of other assets and liabilities in foreign currencies | | | (2 | ) |
| Net Changes in Unrealized Depreciation of Investments, Other Financial Instruments and Foreign Currency Transactions | | | (17,710 | ) |
| Net Loss on Investments, Other Financial Instruments and Foreign Currency Transactions | | | (9,584 | ) |
| Net Decrease in Net Assets Resulting from Operations | | $ | (8,702 | ) |
The accompanying notes are an integral part of these financial statements.
| Hartford Global Research HLS Fund |
| Statement of Changes in Net Assets |
| |
| (000’s Omitted) |
| | | For the
Year Ended
December 31,
2011 | | | For the
Year Ended
December 31,
2010 | |
| Operations: | | | | | | | | |
| Net investment income | | $ | 882 | | | $ | 937 | |
| Net realized gain on investments, other financial instruments and foreign currency transactions | | | 8,126 | | | | 10,117 | |
| Net unrealized appreciation (depreciation) of investments, other financial instruments and foreign currency transactions | | | (17,710 | ) | | | 3,166 | |
| Net Increase (Decrease) In Net Assets Resulting From Operations | | | (8,702 | ) | | | 14,220 | |
| Distributions to Shareholders: | | | | | | | | |
| From net investment income | | | | | | | | |
| Class IA | | | (9 | ) | | | (780 | ) |
| Class IB | | | (4 | ) | | | (320 | ) |
| Total distributions | | | (13 | ) | | | (1,100 | ) |
| Capital Share Transactions: | | | | | | | | |
| Class IA | | | | | | | | |
| Sold | | | 15,571 | | | | 18,546 | |
| Issued on reinvestment of distributions | | | 9 | | | | 780 | |
| Redeemed | | | (26,693 | ) | | | (25,084 | ) |
| Total capital share transactions | | | (11,113 | ) | | | (5,758 | ) |
| Class IB | | | | | | | | |
| Sold | | | 6,048 | | | | 8,413 | |
| Issued on reinvestment of distributions | | | 4 | | | | 320 | |
| Redeemed | | | (13,223 | ) | | | (15,288 | ) |
| Total capital share transactions | | | (7,171 | ) | | | (6,555 | ) |
| Net decrease from capital share transactions | | | (18,284 | ) | | | (12,313 | ) |
| Net Increase (Decrease) In Net Assets | | | (26,999 | ) | | | 807 | |
| Net Assets: | | | | | | | | |
| Beginning of period | | | 105,514 | | | | 104,707 | |
| End of period | | $ | 78,515 | | | $ | 105,514 | |
| Undistributed (distribution in excess of) net investment income | | $ | 828 | | | $ | 47 | |
| Shares: | | | | | | | | |
| Class IA | | | | | | | | |
| Sold | | | 1,546 | | | | 2,074 | |
| Issued on reinvestment of distributions | | | 1 | | | | 82 | |
| Redeemed | | | (2,710 | ) | | | (2,869 | ) |
| Total share activity | | | (1,163 | ) | | | (713 | ) |
| Class IB | | | | | | | | |
| Sold | | | 600 | | | | 954 | |
| Issued on reinvestment of distributions | | | 1 | | | | 34 | |
| Redeemed | | | (1,338 | ) | | | (1,738 | ) |
| Total share activity | | | (737 | ) | | | (750 | ) |
The accompanying notes are an integral part of these financial statements.
| Hartford Global Research HLS Fund |
| Notes to Financial Statements |
| December 31, 2011 |
| (000’s Omitted) |
Hartford Global Research HLS Fund (the “Fund”) serves as an underlying investment option for certain variable annuity and variable life insurance separate accounts of Hartford Life Insurance Company (“HLIC”) and its affiliates and certain qualified retirement plans. The Fund may also serve as an underlying investment option for certain variable annuity and variable life separate accounts of other insurance companies. Owners of variable annuity contracts and policyholders of variable life insurance contracts may choose the funds permitted in the variable insurance contract prospectus. In addition, participants in certain qualified retirement plans may choose the Fund if permitted by their plans.
Hartford Series Fund, Inc. (the “Company”) is an open-end registered management investment company comprised of thirty portfolios. Financial Statements for the Fund, a series of the Company, are included in this report.
The Company is organized under the laws of the State of Maryland and is registered with the Securities and Exchange Commission (“SEC”) under the Investment Company Act of 1940, as amended (“1940 Act”). The Fund is a diversified open-end management investment company.
The Fund is divided into Class IA and Class IB shares. Each class is offered at the per share net asset value (“NAV”) without a sales charge and is subject to the same expenses, except that the Class IB shares are subject to distribution and service fees charged pursuant to a Distribution Plan adopted in accordance with Rule 12b-1 under the 1940 Act.
| 2. | Significant Accounting Policies: |
The following is a summary of significant accounting policies of the Fund in the preparation of its financial statements, which are in accordance with the United States Generally Accepted Accounting Principles (“U.S. GAAP”). The preparation of financial statements in accordance with U.S. GAAP may require management to make estimates and assumptions that affect the reported amounts of assets and liabilities and disclosure of contingent assets and liabilities at the date of the financial statements and the reported amounts of increases and decreases in net assets from operations during the reporting period. Actual results could differ from those estimates.
| a) | Determination of Net Asset Value – The NAV of each class of the Fund’s shares is determined as of the close of regular trading (normally 4:00 p.m. Eastern Time) (the “NYSE Close”) on each day that the New York Stock Exchange (the “Exchange”) is open (“Valuation Date”). Information that becomes known to the Fund after the NAV has been calculated on a particular day will not generally be used to retroactively adjust the NAV determined earlier that day. |
| b) | Investment Valuation and Fair Value Measurements – For purposes of calculating the NAV, portfolio securities and other assets held by the Fund's portfolio for which market quotes are readily available are valued at market value. Market value is generally determined on the basis of last reported sales prices or official close price. If no sales are reported, market value is based on quotes obtained from a quotation reporting system, established market makers, or independent pricing services. If market prices are not readily available or are deemed unreliable, the Fund will use the fair value of the security as determined in good faith under policies and procedures established by and under the supervision of the Company’s Board of Directors. Market quotes are considered not readily available where there is an absence of current or reliable market-based data (e.g., trade information or broker quotes), including where events occur after the close of the relevant market, but prior to the NYSE Close that materially affect the values of the Fund’s portfolio securities or assets. In addition, market quotes are considered not readily available when, due to extraordinary circumstances, the exchanges or markets on which the securities trade do not open for trading for the entire day and no other market prices are available. In addition, prices of foreign equities that are principally traded on certain foreign markets are adjusted daily pursuant to a fair value pricing service approved by the Board of Directors in order to reflect an adjustment for the factors occurring after the close of certain foreign markets but before the NYSE Close. Securities that are primarily |
| Hartford Global Research HLS Fund |
| Notes to Financial Statements – (continued) |
| December 31, 2011 |
| (000’s Omitted) |
traded on foreign markets may trade on days that are not business days of the Fund. The value of the foreign securities in which the Fund invests may change on days when a shareholder will not be able to purchase or redeem shares of the Fund. Fair value pricing is subjective in nature and the use of fair value pricing by the Fund may cause the NAV of its shares to differ significantly from the NAV that would have been calculated using market prices at the close of the exchange on which a portfolio security is primarily traded. There can be no assurance that the Fund could obtain the fair market value assigned to a security if the Fund were to sell the security at approximately the time at which the Fund determines its NAV.
Exchange traded options, futures and options on futures are valued at the settlement price determined by the relevant exchange as of the NYSE Close. If such instruments do not trade on an exchange, values may be supplied by an independent pricing service using a formula or other objective method that may take into consideration the style, direction, expiration, strike price, notional value and volatility or other adjustments.
Investments valued in currencies other than U.S. dollars are converted to U.S. dollars using exchange rates obtained from independent pricing services for calculation of the NAV. As a result, the NAV of the Fund’s shares may be affected by changes in the value of currencies in relation to the U.S. dollar. The value of securities traded in markets outside the United States or denominated in currencies other than the U.S. dollar may be affected significantly on a day that the NYSE is closed and the market value may change on days when an investor is not able to purchase, redeem or exchange shares of the Fund.
Foreign currency contracts represent agreements to exchange currencies on specific future dates at predetermined rates. Foreign currency contracts are valued using foreign currency exchange rates and forward rates as provided by an independent pricing service on the Valuation Date.
Investments in open-end mutual funds are valued at the respective NAV of each open-end mutual fund on the Valuation Date.
Financial instruments for which prices are not available from an independent pricing service may be valued using market quotations obtained from one or more dealers that make markets in the respective financial instrument in accordance with procedures established by the Company’s Board of Directors.
U.S. GAAP defines fair value as the price that the Fund would receive to sell an asset or pay to transfer a liability in an orderly transaction between market participants. The U.S. GAAP fair value measurement standards require disclosure of a fair value hierarchy for each major category of assets and liabilities. Various inputs are used in determining the fair value of the Fund’s investments. These inputs are summarized into three broad hierarchy levels. This hierarchy is based on whether the valuation inputs are observable or unobservable. These levels are:
| · | Level 1 – Quoted prices in active markets for identical securities. Level 1 may include exchange traded instruments such as domestic equities, some foreign equities, options, futures, mutual funds, exchange traded funds, rights and warrants. |
| · | Level 2 – Observable inputs other than Level 1 prices, such as quoted prices for similar securities; quoted prices in markets that are not active; or other inputs that are observable or can be corroborated by observable market data. Level 2 may include debt securities that are traded less frequently than exchange traded instruments and which are valued using independent pricing services; foreign equities, that are principally traded on certain foreign markets and are adjusted daily pursuant to a fair value pricing service in order to reflect an adjustment for the factors occurring after the close of certain foreign markets but before the NYSE Close; and short-term securities, which are valued at amortized cost. |
| · | Level 3 – Significant unobservable inputs that are supported by limited or no market activity. Level 3 may include financial instruments whose values are determined using broker quotes or require significant management judgment or estimation. These unobservable valuation inputs may include estimates for current |
yields, maturity/duration, prepayment speed, and broker quotes for comparable securities along with other assumptions relating to credit quality, collateral value, complexity of the security structure, general market conditions and liquidity. This category may include securities where trading has been halted or there are certain restrictions on trading. While these securities are priced using unobservable inputs, the valuation of these securities reflects the best available data and management believes the prices are a reasonable representation of exit price.
Valuation levels are not necessarily indicative of the risk associated with investing in such securities. Individual securities within any of the above mentioned asset classes may be assigned a different hierarchical level than those presented above, as individual circumstances dictate.
For additional information, refer to the Investment Valuation Hierarchy Level Summary and the Level 3 roll-forward reconciliation which follow the Schedule of Investments.
For purposes of reporting transfers between different hierarchy levels, both transfers in and out of each level, as applicable, are shown as if they occurred at the beginning of the period.
| c) | Security Transactions and Investment Income – Security transactions are recorded as of the trade date (the date the order to buy or sell is executed) for financial reporting purposes. Securities purchased or sold on a when-issued or delayed-delivery basis may be settled a month or more after the trade date. Realized gains and losses are determined on the basis of identified cost. |
Dividend income is accrued as of the ex-dividend date, except certain dividends from foreign securities where the ex-dividend date may have passed are recorded as soon as the Fund is informed of the dividend. Interest income, including amortization of premium and accretion of discounts, is accrued on a daily basis.
| d) | Foreign Currency Transactions – Assets and liabilities denominated in currencies other than U.S. dollars are translated into U.S. dollars at the exchange rates in effect on the valuation date. Purchases and sales of investment securities, income, and expenses are translated into U.S. dollars at the exchange rates on the dates of such transactions. |
The Fund does not isolate that portion of portfolio security valuation resulting from fluctuations in the foreign currency exchange rates from the fluctuations arising from changes in the market prices of securities held. Exchange rate fluctuations are included with the net realized and unrealized gain or loss on investments in the accompanying financial statements.
Net realized foreign exchange gains or losses arise from sales of foreign currencies and the difference between asset and liability amounts initially stated in foreign currencies and the U.S. dollar value of the amounts actually received or paid. Net unrealized foreign exchange gains or losses arise from changes in the value of other assets and liabilities at the end of the reporting period, resulting from changes in the exchange rates.
| e) | Joint Trading Account – The Fund may invest cash balances into a joint trading account that may be invested in one or more repurchase agreements. |
| f) | Fund Share Valuation and Dividend Distributions to Shareholders – Orders for the Fund’s shares are executed in accordance with the investment instructions of the contract holders and plan participants. The NAV of the Fund’s shares is determined as of the close of business on each business day of the Exchange. The NAV is determined separately for each class of shares of the Fund by dividing the Fund’s net assets attributable to that class by the number of shares of the class outstanding. Each class of shares offered by the Fund has equal rights as to assets and voting privileges (except that shareholders of a class have exclusive voting rights regarding any matter relating solely to that class of shares). Income and non-class specific expenses are allocated daily to each class on the basis of the relative net assets of the class. |
| Hartford Global Research HLS Fund |
| Notes to Financial Statements – (continued) |
| December 31, 2011 |
| (000’s Omitted) |
Realized and unrealized capital gains and losses are allocated daily based on the relative net assets of each class of shares of the Fund.
Orders for the purchase of the Fund’s shares received prior to the close of the Exchange on any day the Exchange is open for business are priced at the NAV determined as of the close of the Exchange. Orders received after the close of the Exchange, or on a day on which the Exchange and/or the Fund is not open for business, are priced at the next determined NAV.
Dividends are declared pursuant to a policy adopted by the Company’s Board of Directors based upon the investment performance of the Fund. The policy of the Fund is to pay dividends from net investment income and realized capital gains, if any, at least once a year.
Distributions from net investment income, net realized capital gains and capital are determined in accordance with federal income tax regulations, which may differ from U.S. GAAP with respect to character and timing. These differences may include but are not limited to losses deferred due to wash sale adjustments, foreign currency gains and losses, adjustments related to Passive Foreign Investment Companies (“PFICs”), Real Estate Investment Trusts (“REITs”), Regulated Investment Companies (“RICs”), certain derivatives and partnerships. Permanent book and federal income tax basis differences relating to shareholder distributions will result in reclassifications to certain of the Fund’s capital accounts (see Federal Income Taxes: Reclassification of Capital Accounts note).
| 3. | Securities and Other Investments: |
| a) | Repurchase Agreements – A repurchase agreement is an agreement by which a counterparty agrees to sell a security and agrees to repurchase the security sold at a mutually agreed upon time and price. At the time the Fund enters into a repurchase agreement, the value of the underlying collateral security(ies), including accrued interest, will be equal to or exceed the value of the repurchase agreement. Repurchase agreements expose the Fund to counterparty risk. To minimize counterparty risk, the securities that serve to collateralize the repurchase agreement are held by the Fund's custodian in book entry or physical form in the custodial account of the Fund or in a third party custodial account. Repurchase agreements are valued at cost plus accrued interest. The Fund, as shown on the Schedule of Investments, had outstanding repurchase agreements as of December 31, 2011. |
| b) | Illiquid and Restricted Securities – The Fund is permitted to invest up to 15% of its net assets in illiquid securities. Illiquid securities are those that may not be sold or disposed of in the ordinary course of business within seven days, at approximately the price used to determine the Fund’s NAV. The Fund may not be able to sell illiquid securities or other investments when its sub-adviser considers it desirable to do so or may have to sell such securities or investments at a price that is lower than the price that could be obtained if the securities or investments were more liquid. A sale of illiquid securities or other investments may require more time and may result in higher dealer discounts and other selling expenses than does the sale of those that are liquid. Illiquid securities and investments also may be more difficult to value due to the unavailability of reliable market quotations for such securities or investments, and an investment in them may have an adverse impact on the Fund’s NAV. The Fund may also purchase certain restricted securities that can only be resold to certain qualified investors and may be determined to be liquid pursuant to policies and guidelines established by the Company’s Board of Directors. The Fund, as shown on the Schedule of Investments, had illiquid and/or restricted securities as of December 31, 2011. |
| c) | Securities Purchased on a When-Issued or Delayed-Delivery Basis – Delivery and payment for securities that have been purchased by the Fund on a forward commitment, or when-issued or delayed-delivery basis, take place beyond the customary settlement period. A fund may dispose of or renegotiate a delayed-delivery transaction after it is entered into, and may sell delayed-delivery securities before they are delivered, which may result in a realized gain or loss. During this period, such securities are subject to market fluctuations, and the Fund identifies securities segregated in its records |
with value at least equal to the amount of the commitment. The Fund, as shown on the Schedule of Investments, had when-issued or delayed delivery securities as of December 31, 2011.
| 4. | Financial Derivative Instruments: |
The following disclosures contain information on how and why the Fund uses derivative instruments, the credit-risk-related contingent features in certain derivative instruments, and how derivative instruments affect the Fund’s financial position and results of operations. The location and fair value amounts of these instruments on the Statement of Assets and Liabilities and the realized gains and losses and changes in unrealized gains and losses on the Statement of Operations, each categorized by type of derivative contract, are included in the following Additional Derivative Instrument Information footnote. The derivative instruments outstanding as of period-end are disclosed in the notes to the Schedule of Investments and the amounts of realized gains and losses and changes in unrealized gains and losses on derivative instruments during the period are disclosed in the Statement of Operations.
| a) | Foreign Currency Contracts – The Fund may enter into foreign currency contracts that obligate the Fund to purchase or sell currencies at specified future dates. Foreign currency contracts are used to hedge the currency exposure associated with some or all of the Fund's securities and/or as part of an investment strategy. Foreign currency contracts are marked to market daily and the change in value is recorded by the Fund as an unrealized gain or loss. The Fund will record a realized gain or loss when the foreign currency contract is settled. |
Foreign currency contracts involve elements of market risk in excess of the amounts reflected in the Statement of Assets and Liabilities. In addition, risks may arise upon entering into these contracts from the potential inability of the counterparties to meet the terms of the contracts and from unanticipated movements in the value of the foreign currencies relative to the U.S. dollar. The Fund had outstanding foreign currency contracts as shown on the Schedule of Investments as of December 31, 2011.
| b) | Futures Contracts – The Fund may enter into futures contracts. A futures contract is an agreement between two parties to buy or sell an asset at a set price on a future date. The Fund uses futures contracts to manage or obtain exposure to the securities markets, commodities, or movements in interest rates and currency values. The primary risks associated with the use of futures contracts are the imperfect correlation between the change in market value of the securities held by the Fund and the prices of futures contracts and the possibility of an illiquid market. Upon entering into a futures contract, the Fund is required to deposit with a futures commission merchant (“FCM”) an amount of cash or U.S. Government or Agency Obligations in accordance with the initial margin requirements of the broker or exchange. Futures contracts are marked to market daily at the most recent settlement price reported by an exchange on which, over time, they are traded most extensively, and an appropriate payable or receivable for the change in value (“variation margin”) is recorded by the Fund. Gains or losses are recognized but not considered realized until the contracts expire or are closed. Futures contracts involve, to varying degrees, risk of loss in excess of the variation margin disclosed on the Statement of Assets and Liabilities; however, this risk is reduced through the use of an FCM. As of December 31, 2011, the Fund had no outstanding futures contracts. |
| Hartford Global Research HLS Fund |
| Notes to Financial Statements – (continued) |
| December 31, 2011 |
| (000’s Omitted) |
| c) | Additional Derivative Instrument Information: |
Fair Values of Derivative Instruments on the Statement of Assets and Liabilities as of December 31, 2011:
| | | Risk Exposure Category | |
| | | Interest Rate
Contracts | | | Foreign
Exchange
Contracts | | | Credit
Contracts | | | Equity
Contracts | | | Commodity
Contracts | | | Other
Contracts | | | Total | |
| Assets: | | | | | | | | | | | | | | | | | | | | | | | | | | | | |
| Unrealized appreciation on foreign currency contracts | | $ | — | | | $ | 14 | | | $ | — | | | $ | — | | | $ | — | | | $ | — | | | $ | 14 | |
| Total | | $ | — | | | $ | 14 | | | $ | — | | | $ | — | | | $ | — | | | $ | — | | | $ | 14 | |
| | | | | | | | | | | | | | | | | | | | | | | | | | | | | |
| Liabilities: | | | | | | | | | | | | | | | | | | | | | | | | | | | | |
| Unrealized depreciation on foreign currency contracts | | $ | — | | | $ | 28 | | | $ | — | | | $ | — | | | $ | — | | | $ | — | | | $ | 28 | |
| Total | | $ | — | | | $ | 28 | | | $ | — | | | $ | — | | | $ | — | | | $ | — | | | $ | 28 | |
The volume of derivatives that is presented in the Schedule of Investments is consistent with the derivative activity during the year ended December 31, 2011.
The Effect of Derivative Instruments on the Statement of Operations for the year ended December 31, 2011:
| | | Risk Exposure Category | |
| | | Interest Rate
Contracts | | | Foreign
Exchange
Contracts | | | Credit
Contracts | | | Equity
Contracts | | | Commodity
Contracts | | | Other
Contracts | | | Total | |
| Realized Gain (Loss) on Derivatives Recognized as a Result of Operations: |
| Net realized gain on futures | | $ | — | | | $ | — | | | $ | — | | | $ | 4 | | | $ | — | | | $ | — | | | $ | 4 | |
| Net realized loss on foreign currency contracts | | | — | | | | (171 | ) | | | — | | | | — | | | | — | | | | — | | | | (171 | ) |
| Total | | $ | — | | | $ | (171 | ) | | $ | — | | | $ | 4 | | | $ | — | | | $ | — | | | $ | (167 | ) |
| | | | | | | | | | | | | | | | | | | | | | | | | | | | | |
| Net Change in Unrealized Appreciation (Depreciation) on Derivatives Recognized as a Result of Operations: |
| Net change in unrealized depreciation of futures | | $ | — | | | $ | — | | | $ | — | | | $ | (2 | ) | | $ | — | | | $ | — | | | $ | (2 | ) |
| Net change in unrealized appreciation of foreign currency contracts | | | — | | | | 74 | | | | — | | | | — | | | | — | | | | — | | | | 74 | |
| Total | | $ | — | | | $ | 74 | | | $ | — | | | $ | (2 | ) | | $ | — | | | $ | — | | | $ | 72 | |
| a) | Counterparty Risk – The Fund may be exposed to counterparty risk, or the risk that an institution or other entity with which the Fund has unsettled or open transactions will default. |
| b) | Market Risks – If the Fund invests directly in foreign currencies or in securities that trade in, and receive revenues in, foreign currencies, or in derivatives that provide exposure to foreign currencies, it will be subject to the risk that those currencies will decline in value relative to the base currency of the Fund, or, in the case of hedging positions, that the Fund’s base currency will decline in value relative to the currency being hedged. Currency rates in foreign countries may fluctuate significantly over short periods of time for a number of reasons, including changes in interest rates, intervention (or the failure to intervene) by U.S. or foreign governments, central banks or supranational entities, such as the International Monetary Fund, or by the imposition of currency controls or other political developments in the United States or abroad. As a result, the Fund’s investments in foreign currency denominated securities may reduce the returns of the Fund. The market values of equity securities, such as common stocks and preferred stocks, or equity related investments, such as futures and options, may decline due to general market conditions which are not specifically related to a particular company, such as real or perceived adverse economic conditions, changes in the general outlook for |
corporate earnings, changes in interest or currency rates or adverse investor sentiment generally. The market value of equity securities may also decline due to factors which affect a particular industry or industries, such as labor shortages or increased production costs and competitive conditions within an industry. Equity securities and equity related investments generally have greater market price volatility than fixed income securities.
| a) | Federal Income Taxes – For federal income tax purposes, the Fund intends to continue to qualify as a RIC under Subchapter M of the Internal Revenue Code (“IRC”) by distributing substantially all of its taxable net investment income and net realized capital gains to its shareholders and otherwise complying with the requirements of RICs. The Fund has distributed substantially all of its income and capital gains in prior years, if applicable, and intends to distribute substantially all of its income and capital gains prior to the next fiscal year-end. Accordingly, no provision for federal income or excise taxes has been made in the accompanying financial statements. Distributions from short-term capital gains are treated as ordinary income distributions for federal income tax purposes. |
| b) | Net Investment Income (Loss), Net Realized Gains (Losses) – Net investment income (loss) and net realized gains (losses) may differ for financial statement and tax purposes primarily because of losses deferred due to wash sale adjustments, foreign currency gains and losses, adjustments related to PFICs, REITs, RICs, certain derivatives and partnerships. The character of distributions made during the year from net investment income or net realized gains may differ from their ultimate characterization for federal income tax purposes. Also, due to the timing of dividend distributions, the fiscal year in which amounts are distributed may differ from the year that the income or realized gains (losses) were recorded by the Fund. |
| c) | Distributions and Components of Distributable Earnings – The tax character of distributions paid by the Fund for the periods indicated is as follows (as adjusted for dividends payable): |
| | | For the Year Ended
December 31, 2011 | | | For the Year Ended
December 31, 2010 | |
| Ordinary Income | | $ | 13 | | | $ | 1,100 | |
As of December 31, 2011, the Fund’s components of distributable earnings (deficit) on a tax basis were as follows:
| | | Amount | |
| Undistributed Ordinary Income | | $ | 831 | |
| Accumulated Capital and Other Losses* | | | (16,957 | ) |
| Unrealized Depreciation† | | | (3,193 | ) |
| Total Accumulated Deficit | | $ | (19,319 | ) |
* The Fund has capital loss carryforwards that are identified in the Capital Loss Carryforward note that follows.
† The difference between book-basis and tax-basis unrealized appreciation (depreciation) may be attributable to the losses deferred due to wash sale adjustments, foreign currency gains and losses, adjustments related to PFICs, REITs, RICs, certain derivatives and partnerships.
| d) | Reclassification of Capital Accounts – The Fund may record reclassifications in its capital accounts. These reclassifications have no impact on the total net assets of the Fund. The reclassifications are a result of permanent differences between U.S. GAAP and tax accounting for such items as foreign currency, PFICs, expiration or utilization of capital loss carryforwards or net operating losses. Adjustments are made to reflect the impact these items have on current and future distributions to shareholders. Therefore, the source of the Fund’s distributions may be shown in the accompanying Statement of Changes in Net Assets as from undistributed net investment income, from accumulated net |
| Hartford Global Research HLS Fund |
| Notes to Financial Statements – (continued) |
| December 31, 2011 |
| (000’s Omitted) |
realized gains on investments or from capital depending on the type of book and tax differences that exist. For the year ended December 31, 2011, the Fund recorded reclassifications to increase (decrease) the accounts listed below:
| | | Amount | |
| Undistributed Net Investment Income | | $ | (88 | ) |
| Accumulated Net Realized Gain (Loss) | | | 88 | |
| e) | Capital Loss Carryforward – On December 22, 2010, the Regulated Investment Company Modernization Act of 2010 (the “Act”) was enacted, which made changes to the capital loss carryforward rules. The changes are effective for taxable years beginning after the date of enactment. Under the Act, funds are permitted to carry forward capital losses for an unlimited period. However, any losses incurred during those future taxable years will be required to be utilized prior to the losses incurred in pre-enactment taxable years, which carry an expiration date. As a result of this ordering rule, pre-enactment capital loss carryforwards may be more likely to expire unused. Additionally, post-enactment capital loss carryforwards will retain their character as either short-term or long-term capital losses rather than being considered all short-term as permitted under prior regulation. |
At December 31, 2011 (tax-year-end), the Fund had capital loss carryforwards for U.S. federal income tax purposes of approximately:
| Year of Expiration | | Amount | |
| 2017 | | $ | 16,957 | |
| Total | | $ | 16,957 | |
As of December 31, 2011, the Fund utilized $7,201 of prior year capital loss carryforwards.
| f) | Accounting for Uncertainty in Income Taxes – The Fund has adopted financial reporting rules that require the Fund to analyze all open tax years, as defined by the statute of limitations, for all major jurisdictions. Generally, tax authorities can examine all tax returns filed for the last three years. The Fund does not have an examination in progress. |
The Fund has reviewed all open tax years and major jurisdictions and concluded that these financial reporting rules had no effect on the Fund’s financial position or results of operations. There is no tax liability resulting from unrecognized tax benefits relating to uncertain income tax positions taken or expected to be taken on the tax return for the fiscal year ended December 31, 2011. The Fund is also not aware of any tax positions for which it is reasonably possible that the total amounts of unrecognized tax benefits will significantly change in the next twelve months.
| a) | Investment Management Agreement – HL Investment Advisors, LLC (“HL Advisors”), an indirect wholly owned subsidiary of The Hartford Financial Services Group, Inc. (“The Hartford”), serves as investment manager to the Fund pursuant to an Investment Management Agreement with the Company. As investment manager, HL Advisors has overall investment supervisory responsibility for the Fund. In addition, HL Advisors provides administrative personnel, services, equipment, facilities and office space for proper operation of the Fund. HL Advisors has contracted with Wellington Management Company, LLP (“Wellington Management”) under a sub-advisory agreement for the provision of day-to-day investment management services to the Fund in accordance with the Fund’s investment objective and policies. The Fund pays a fee to HL Advisors, a portion of which may be used to compensate Wellington Management. |
The schedule below reflects the rates of compensation paid to HL Advisors for investment management services rendered as of December 31, 2011; the rates are accrued daily and paid monthly.
| Average Daily Net Assets | | Annual Fee | |
| On first $500 million | | | 0.9000% | |
| On next $500 million | | | 0.8750% | |
| On next $4 billion | | | 0.8500% | |
| On next $5 billion | | | 0.8475% | |
| Over $10 billion | | | 0.8450% | |
| b) | Accounting Services Agreement – Pursuant to the Fund Accounting Agreement between HLIC and the Company, on behalf of the Fund, HLIC provides accounting services to the Fund and receives monthly compensation based on the Fund’s average daily net assets at the rates set forth below. The Fund’s accounting services fees are accrued daily and paid monthly. |
| Average Daily Net Assets | | Annual Fee | |
| On first $5 billion | | | 0.016% | |
| On next $5 billion | | | 0.014% | |
| Over $10 billion | | | 0.012% | |
Effective January 1, 2012, the accounting services fees based on the Fund’s average daily net assets were increased. The new accounting services fees schedule is as follows:
| Average Daily Net Assets | | Annual Fee | |
| On first $5 billion | | | 0.018% | |
| On next $5 billion | | | 0.016% | |
| Over $10 billion | | | 0.014% | |
| c) | Operating Expenses – Allocable expenses incurred by the Company are allocated to each Fund and allocated to classes within a Fund in proportion to the average daily net assets of the Fund and each class, except where allocation of certain expenses is more fairly made directly to the Fund or to specific classes within a Fund. |
| d) | Fees Paid Indirectly – The Company, on behalf of the Fund, has entered into agreements with State Street Global Markets, LLC and Russell Implementation Services, Inc. to partially recapture non-discounted trade commissions. Such rebates are used to pay a portion of the Fund’s expenses. In addition, the Fund’s custodian bank has also agreed to reduce its fees when the Fund maintains cash on deposit in a non-interest-bearing custody account. For the year ended December 31, 2011, these amounts, if any, are included in the Statement of Operations. |
The ratio of expenses to average net assets in the accompanying financial highlights excludes the reduction in expenses related to fees paid indirectly. The annualized expense ratio for the period listed below reflecting the reduction for fees paid indirectly is as follows:
| | | Year Ended
December 31, 2011 | |
| Class IA | | | 1.03 | % |
| Class IB | | | 1.28 | |
| Hartford Global Research HLS Fund |
| Notes to Financial Statements – (continued) |
| December 31, 2011 |
| (000’s Omitted) |
| e) | Distribution Plan for Class IB shares – The Company, on behalf of the Fund, has adopted a Distribution Plan pursuant to Rule 12b-1 of the 1940 Act to compensate the Distributor, Hartford Securities Distribution Company, Inc. (a wholly owned, ultimate subsidiary of The Hartford), from assets attributable to the Class IB shares for services rendered and expenses borne in connection with activities primarily intended to result in the sale of the Class IB shares, subject to the review and approval of the Company’s Board of Directors. |
The Distribution Plan provides that the Fund may pay annually up to 0.25% of the average daily net assets of the Fund attributable to its Class IB shares for activities primarily intended to result in the sale of Class IB shares. The Board has the authority to suspend or reduce these payments at any point in time. Under the terms of the Distribution Plan and the principal underwriting agreement, the Fund is authorized to make payments monthly to the Distributor that may be used to pay or compensate entities providing distribution and shareholder servicing with respect to the Class IB shares for such entities’ fees or expenses incurred or paid in that regard. These fees are accrued daily and paid monthly.
| f) | Other Related Party Transactions – Certain officers of the Fund are directors and/or officers of HL Advisors and/or The Hartford or its subsidiaries. For the year ended December 31, 2011, a portion of the Fund’s chief compliance officer’s salary was paid by all the investment companies in the Hartford fund complex. The portion allocated to the Fund rounds to zero. These fees are accrued daily and paid monthly. |
| g) | Payment from Affiliate – In July of 2007, The Hartford entered into a settlement with the Attorneys General of the states of New York, Connecticut and Illinois relating to market timing and the company's individual variable annuity contracts in which certain payments would be made directly to the variable annuity contract holders. The distribution plan provided that unclaimed money from the settlement would be distributed to certain HLS Funds that are investment options through a Hartford individual variable annuity contract. The unclaimed money was distributed to the Fund on September 18, 2009. |
The total return in the accompanying financial highlights includes a payment from an affiliate. Had the payment from the affiliate been excluded, the impact and total return for the period listed below would have been as follows:
| | | For the Year Ended December 31, 2009 | |
| | | Class IA | | | Class IB | |
| Impact from Payment from Affiliate for Attorneys General Settlement | | | 0.02% | | | | 0.02% | |
| Total Return Excluding Payment from Affiliate | | | 42.10 | | | | 41.76 | |
| 8. | Investment Transactions: |
For the year ended December 31, 2011, the Fund's aggregate purchases and sales of investment securities (excluding short-term investments) were as follows:
| | | Amount | |
| Cost of Purchases Excluding U.S. Government Obligations | | $ | 81,230 | |
| Sales Proceeds Excluding U.S. Government Obligations | | | 97,884 | |
The Fund is one of several Hartford funds that participate in a $500 million committed revolving line of credit facility. The facility is to be used for temporary or emergency purposes. Under the arrangement, the funds are required to own securities having a market value in excess of 300% of the total bank borrowings. The interest rate on borrowings varies depending on the nature of the loan. The facility also requires a fee to be paid based on the amount of the commitment. This commitment fee is allocated to all of the funds participating in the line of credit based on the average net assets of the funds. During the year ended December 31, 2011, the Fund did not have any borrowings under this facility.
| 10. | Industry Classifications: |
Other than the industry classifications “Other Investment Pools and Funds” and “Exchange Traded Funds,” equity industry classifications used in this report are the Global Industry Classification Standard, which was developed by and is the exclusive property and service mark of MSCI, Inc. and Standard & Poor’s.
Under the Company’s organizational documents, the Company shall indemnify its officers and directors to the full extent required or permitted under Maryland General Corporation Law and the federal securities laws. In addition, the Company, on behalf of the Fund, may enter into contracts that contain a variety of indemnifications. The Company’s maximum exposure under these arrangements is unknown. However, as of the date of these financial statements, the Company has not had prior claims or losses pursuant to these contracts and expects the risk of loss to be remote.
| Hartford Global Research HLS Fund |
| Financial Highlights |
| - Selected Per-Share Data (A) - |
| Class | | Net Asset
Value at
Beginning of
Period | | | Net Investment
Income (Loss) | | | Payments from
(to) Affiliate | | | Net Realized
and Unrealized
Gain (Loss) on
Investments | | | Total from
Investment
Operations | | | Dividends from
Net Investment
Income | | | Distributions
from Realized
Capital Gains | | | Distributions
from Capital | | | Total
Distributions | | | Net Increase
(Decrease) in
Net Asset
Value | | | Net Asset
Value at End of
Period | |
| |
| For the Year Ended December 31, 2011 |
| IA | | $ | 9.94 | | | $ | 0.11 | | | $ | — | | | $ | (1.03 | ) | | $ | (0.92 | ) | | $ | — | | | $ | — | | | $ | — | | | $ | — | | | $ | (0.92 | ) | | $ | 9.02 | |
| IB | | | 9.93 | | | | 0.09 | | | | — | | | | (1.04 | ) | | | (0.95 | ) | | | — | | | | — | | | | — | | | | — | | | | (0.95 | ) | | | 8.98 | |
| | | | | | | | | | | | | | | | | | | | | | | | | | | | | | | | | | | | | | | | | | | | | |
| For the Year Ended December 31, 2010 |
| IA | | | 8.67 | | | | 0.10 | | | | — | | | | 1.28 | | | | 1.38 | | | | (0.11 | ) | | | — | | | | — | | | | (0.11 | ) | | | 1.27 | | | | 9.94 | |
| IB | | | 8.66 | | | | 0.08 | | | | — | | | | 1.28 | | | | 1.36 | | | | (0.09 | ) | | | — | | | | — | | | | (0.09 | ) | | | 1.27 | | | | 9.93 | |
| | | | | | | | | | | | | | | | | | | | | | | | | | | | | | | | | | | | | | | | | | | | | |
| For the Year Ended December 31, 2009 |
| IA | | | 6.16 | | | | 0.08 | | | | — | | | | 2.51 | | | | 2.59 | | | | (0.08 | ) | | | — | | | | — | | | | (0.08 | ) | | | 2.51 | | | | 8.67 | |
| IB | | | 6.15 | | | | 0.07 | | | | — | | | | 2.50 | | | | 2.57 | | | | (0.06 | ) | | | — | | | | — | | | | (0.06 | ) | | | 2.51 | | | | 8.66 | |
| | | | | | | | | | | | | | | | | | | | | | | | | | | | | | | | | | | | | | | | | | | | | |
| From January 31, 2008 (commencement of operations) through December 31, 2008 |
| IA(F) | | | 10.00 | | | | — | | | | — | | | | (3.78 | ) | | | (3.78 | ) | | | (0.05 | ) | | | — | | | | (0.01 | ) | | | (0.06 | ) | | | (3.84 | ) | | | 6.16 | |
| IB(F) | | | 10.00 | | | | (0.08 | ) | | | — | | | | (3.72 | ) | | | (3.80 | ) | | | (0.04 | ) | | | — | | | | (0.01 | ) | | | (0.05 | ) | | | (3.85 | ) | | | 6.15 | |
| (A) | Information presented relates to a share outstanding throughout the indicated period. |
| (B) | The figures do not include sales charges or other fees which may be applied at the variable life insurance, variable annuity or qualified retirement plan product level. Any such additional sales charges or other fees would lower the Fund's performance. |
| (C) | Ratios do not reflect reductions for fees paid indirectly. Please see Fees Paid Indirectly in the Notes to Financial Statements. |
| (D) | Portfolio turnover rate is calculated on the basis of the Fund as a whole without distinguishing between the classes of shares issued. |
| (E) | Total return without the inclusion of the Payment from (to) Affiliate can be found in Expenses in the accompanying Notes to Financial Statements. |
| (F) | Commenced operations on January 31, 2008. |
| (I) | During the year ended December 31, 2008, the Fund incurred $95.4 million in sales associated with the transition of assets from Hartford Global Communications HLS Fund, Hartford Global Financial Services HLS Fund and Hartford Global Technology HLS Fund, which merged into the Fund on August 22, 2008. These sales were excluded from the portfolio turnover rate calculation. |
| - Ratios and Supplemental Data - |
| Total Return(B) | | | Net Assets at End of Period | | | Ratio of Expenses to Average Net
Assets Before Waivers(C) | | | Ratio of Expenses to Average Net
Assets After Waivers(C) | | | Ratio of Net Investment Income
(Loss) to Average Net Assets | | | Portfolio Turnover
Rate(D) | |
| | |
| | |
| | (9.28 | )% | | $ | 52,768 | | | | 1.03 | % | | | 1.03 | % | | | 1.01 | % | | | 86 | % |
| | (9.51 | ) | | | 25,747 | | | | 1.28 | | | | 1.28 | | | | 0.76 | | | | — | |
| | | | | | | | | | | | | | | | | | | | | | | |
| | | | | | | | | | | | | | | | | | | | | | | |
| | 16.01 | | | | 69,740 | | | | 1.01 | | | | 0.98 | | | | 1.03 | | | | 92 | |
| | 15.72 | | | | 35,774 | | | | 1.26 | | | | 1.23 | | | | 0.78 | | | | — | |
| | | | | | | | | | | | | | | | | | | | | | | |
| | | | | | | | | | | | | | | | | | | | | | | |
| | 42.13 | (E) | | | 67,012 | | | | 1.16 | | | | 1.06 | | | | 1.17 | | | | 124 | |
| | 41.79 | (E) | | | 37,695 | | | | 1.41 | | | | 1.31 | | | | 0.93 | | | | — | |
| | | | | | | | | | | | | | | | | | | | | | | |
| | | | | | | | | | | | | | | | | | | | | | | |
| | (37.87 | )(G) | | | 48,627 | | | | 1.02 | (H) | | | 0.94 | (H) | | | 1.29 | (H) | | | 335 | (I) |
| | (38.01 | )(G) | | | 31,008 | | | | 1.27 | (H) | | | 1.19 | (H) | | | 0.99 | (H) | | | — | |
| Report of Independent Registered Public Accounting Firm |
| The Board of Directors and Shareholders of |
| Hartford Series Fund, Inc. |
We have audited the accompanying statement of assets and liabilities, including the schedule of investments, of Harford Global Research HLS Fund (one of the portfolios constituting Hartford Series Fund, Inc. (the Funds)) as of December 31, 2011, and the related statement of operations for the year then ended, the statements of changes in net assets for each of the two years in the period then ended, and the financial highlights for the periods indicated therein. These financial statements and financial highlights are the responsibility of the Funds’ management. Our responsibility is to express an opinion on these financial statements and financial highlights based on our audits.
We conducted our audits in accordance with the standards of the Public Company Accounting Oversight Board (United States). Those standards require that we plan and perform the audit to obtain reasonable assurance about whether the financial statements and financial highlights are free of material misstatement. We were not engaged to perform an audit of the Funds’ internal control over financial reporting. Our audits included consideration of internal control over financial reporting as a basis for designing audit procedures that are appropriate in the circumstances, but not for the purpose of expressing an opinion on the effectiveness of the Funds’ internal control over financial reporting. Accordingly, we express no such opinion. An audit also includes examining, on a test basis, evidence supporting the amounts and disclosures in the financial statements and financial highlights, assessing the accounting principles used and significant estimates made by management, and evaluating the overall financial statement presentation. Our procedures included confirmation of securities owned as of December 31, 2011, by correspondence with the custodian and brokers or by other appropriate auditing procedures where replies from brokers were not received. We believe that our audits provide a reasonable basis for our opinion.
In our opinion, the financial statements and financial highlights referred to above present fairly, in all material respects, the financial position of Hartford Global Research HLS Fund of Hartford Series Fund, Inc. at December 31, 2011, the results of its operations for the year then ended, the changes in its net assets for each of the two years in the period then ended, and the financial highlights for the periods indicated therein, in conformity with U.S. generally accepted accounting principles.
| | |
| | |
| | |
| Minneapolis, MN | |
| February 13, 2012 | |
| Hartford Global Research HLS Fund |
| Directors and Officers (Unaudited) |
The Board of Directors of the Company appoints officers who are responsible for the day-to-day operations of the Fund and who execute policies formulated by the Directors. Each director serves until his or her death, resignation, or retirement or until the next annual meeting of shareholders is held or until his or her successor is elected and qualifies.
Directors and officers who are employed by or who have a financial interest in The Hartford are considered “interested” persons of the Fund pursuant to the 1940 Act. Each officer and two of the Company’s directors, as noted in the chart below, are “interested” persons of the Fund. Each director serves as a director for The Hartford Mutual Funds, Inc., The Hartford Mutual Funds II, Inc., Hartford Series Fund, Inc., Hartford HLS Series Fund II, Inc., and as a trustee for The Hartford Alternative Strategies Fund, which, as of December 31, 2011, collectively consist of 91 funds. Correspondence may be sent to directors and officers c/o Hartford Mutual Funds, P.O. Box 2999, Hartford, Connecticut 06104-2999, except that correspondence to Ms. Fagely may be sent to 500 Bielenberg Drive, Woodbury, Minnesota 55125.
The table below sets forth, for each director and officer, his or her name, year of birth, current position with the Company and date first elected or appointed to Hartford Series Fund, Inc. (“HSF”), and Hartford HLS Series Fund II, Inc. (“HSF2”), principal occupation, and, for directors, other directorships held. The Fund’s statement of additional information contains further information on the directors and is available free of charge by calling 1-800-862-6668 or writing to Hartford HLS Funds, c/o Individual Annuity Services, P.O. Box 5085, Hartford, CT 06102-5085.
Information on the aggregate remuneration paid to the directors of the Company can be found in the Statement of Operations herein. The Fund pays to The Hartford a portion of the chief compliance officer’s compensation, but does not pay salaries or compensation to any of their other officers or directors who are employed by The Hartford.
Non-Interested Directors
Lynn S. Birdsong (1946) Director since 2003, Co-Chairman of the Investment Committee
Mr. Birdsong is a private investor. Mr. Birdsong currently serves as a Director of the Sovereign High Yield Investment Company (April 2010 to current). Mr. Birdsong currently serves as an Independent Director of Nomura Partners Funds, Inc. (formerly, The Japan Fund) (March 2003 to current). From 2003 to March 2005, Mr. Birdsong was an independent director of the Atlantic Whitehall Funds. From 1979 to 2002, Mr. Birdsong was a managing director of Zurich Scudder Investments, an investment management firm. During his employment with Scudder, Mr. Birdsong was an Interested Director of The Japan Fund. Since 1981, Mr. Birdsong has been a partner in Birdsong Company, an advertising specialty firm.
Robert M. Gavin, Jr. (1940) Director since 2002 (HSF) and 1986 (HSF2), Chairman of the Board since 2004
Dr. Gavin is an educational consultant. Prior to September 1, 2001, he was President of Cranbrook Education Community and prior to July 1996, he was President of Macalester College, St. Paul, Minnesota.
Duane E. Hill (1945) Director since 2001 (HSF) and 2002 (HSF2), Chairman of the Nominating Committee
Mr. Hill is Partner of TSG Ventures L.P., a private equity investment company. Mr. Hill is a former partner of TSG Capital Group, a private equity investment firm that served as sponsor and lead investor in leveraged buyouts of middle market companies.
Sandra S. Jaffee (1941) Director since 2005
Ms. Jaffee served as Chairman (2008 to 2009) and Chief Executive Officer of Fortent (formerly Searchspace Group), a leading provider of compliance/regulatory technology to financial institutions from August 2005 to August 2009. From August 2004 to August 2005, Ms. Jaffee served as an Entrepreneur in Residence with Warburg Pincus, a private equity firm. From September 1995 to July 2004, Ms. Jaffee served as Executive Vice President at Citigroup, where she was President and Chief Executive Officer of Citibank’s Global Securities Services (1995 to 2003). Ms. Jaffe currently serves as a member of the Board of Directors of Broadridge Financial Solutions as well as a Trustee of Muhlenberg College.
William P. Johnston (1944) Director since 2005, Chairman of the Compliance Committee
In June 2006, Mr. Johnston was appointed as Senior Advisor to The Carlyle Group, a global private equity investment firm. In August 2007, Mr. Johnston was elected to the Board of Directors of LifeCare Holdings, Inc. In February 2008, Mr. Johnston was elected to the Board of Directors of HCR-ManorCare, Inc. In May 2006, Mr. Johnston was elected to the Supervisory Board of Fresenius Medical Care AG & Co. KGaA, after its acquisition of Renal Care Group, Inc. in March 2006. Mr. Johnston joined Renal Care Group in November 2002 as a member of the Board of Directors and served as Chairman of the Board from March 2003 through March 2006. Mr. Johnston served as a Director of MultiPlan, Inc. from July 2006 through August 2010. From September 1987 to December 2002, Mr. Johnston was with Equitable Securities Corporation (and its successors, SunTrust Equitable Securities and SunTrust Robinson Humphrey) serving in various investment banking and managerial positions, including Managing Director and Head of Investment Banking, Chief Executive Officer and Vice Chairman.
| Hartford Global Research HLS Fund |
| Directors and Officers (Unaudited) – (continued) |
Phillip O. Peterson (1944) Director since 2002 (HSF) and 2000 (HSF2), Chairman of the Audit Committee
Mr. Peterson is a mutual fund industry consultant. He was a partner of KPMG LLP (an accounting firm) until July 1999. Mr. Peterson joined William Blair Funds in February 2007 as a member of the Board of Trustees. From January 2004 to April 2005, Mr. Peterson served as Independent President of the Strong Mutual Funds.
Lemma W. Senbet (1946) Director since 2005
Dr. Senbet is the William E. Mayer Chair Professor of Finance and Director, Center for Financial Policy, at the University of Maryland, Robert H. Smith School of Business. He was chair of the Finance Department from 1998 to 2006. Previously he was a chaired professor of finance at the University of Wisconsin-Madison. Also, he was director of the Fortis Funds from March 2000 to July 2002. Dr. Senbet served the finance profession in various capacities, including as director of the American Finance Association and President of the Western Finance Association. In 2006, Dr. Senbet was inducted Fellow of Financial Management Association International for his career-long distinguished scholarship and professional service.
Interested Directors and Officers
David N. Levenson (1966) Director since 2010
Mr. Levenson currently serves as President of The Hartford’s Wealth Management business. He was appointed to this role in July 2010. Previously, Mr. Levenson served as Executive Vice President of Legacy Holdings for The Hartford from June 2009 to July 2010. From 2006 to 2009, Mr. Levenson was with Hartford Life Insurance K.K. where he served as President and Chief Executive Officer from 2007 to 2009. He served as Managing Director of Hartford Investment Management Company from 2005 to 2006. Additionally, Mr. Levenson serves as Executive Vice President of The Hartford and as President, Director and Chief Executive Officer of Hartford Life Insurance Company (“HLIC”) and Hartford Life, Inc. (“HL Inc.”).
Lowndes A. Smith (1939) Director since 1996 (HSF) and 2002 (HSF2), Co-Chairman of the Investment Committee
Mr. Smith served as Vice Chairman of The Hartford from February 1997 to January 2002, as President and Chief Executive Officer of HL Inc. from February 1997 to January 2002, and as President and Chief Operating Officer of The Hartford Life Insurance Companies from January 1989 to January 2002. Mr. Smith serves as a Director of White Mountains Insurance Group, Ltd., One Beacon Insurance and Symetra Financial and as a Managing Director of Whittington Gray Associates.
Other Officers
James E. Davey (1964) President and Chief Executive Officer since 2010
Mr. Davey serves as Executive Vice President of HLIC. Additionally, Mr. Davey serves as President, Chief Executive Officer and Manager of Hartford Investment Financial Services, Inc. (“HIFSCO”) and President, Chief Executive Officer and Manager of HL Advisors. Mr. Davey joined The Hartford in 2002.
Michael R. Dressen (1963) AML Compliance Officer since 2011
Mr. Dressen currently serves as Assistant Vice President of HLIC. He also serves as Chief Compliance Officer and AML Compliance Officer of Hartford Administrative Services Company (“HASCO”) and as Assistant Secretary and Compliance Officer of HIFSCO. Mr Dressen joined The Hartford in 2005 from State Farm Insurance Companies where he held various positions related to mutual funds, variable products, and property casualty insurance.
Tamara L. Fagely (1958) Vice President, Treasurer and Controller since 2002 (HSF) and 1993 (HSF2)
Ms. Fagely has been a Vice President of HASCO since 1998 and Chief Financial Officer since 2006. Currently Ms. Fagely is a Vice President of HLIC. She served as Assistant Vice President of HLIC from December 2001 through March 2005. In addition, Ms. Fagely is Controller and Chief Financial Officer of HIFSCO.
Dr. Robert J. Froehlich (1953) Senior Managing Director since 2009
Dr. Froehlich joined The Hartford as Senior Managing Director in September 2009. Prior to joining The Hartford, Dr. Froehlich served as Vice Chairman of Deutsche Asset Management from 1997-2009.
Edward P. Macdonald (1967) Vice President, Secretary and Chief Legal Officer since 2005
Mr. Macdonald serves as Vice President of HLIC and Chief Legal Officer of Mutual Funds and Vice President of HIFSCO. He also serves as Vice President and Secretary of HASCO, and Chief Legal Officer, Secretary and Vice President of HL Advisors. Mr. Macdonald joined The Hartford in 2005.
Vernon J. Meyer (1964) Vice President since 2006
Mr. Meyer serves as Senior Vice President of HLIC. He also serves as Senior Vice President of HIFSCO and HL Advisors. Mr. Meyer joined The Hartford in 2004.
Colleen B. Pernerewski (1969) Vice President and Chief Compliance Officer since 2010
Ms. Pernerewski serves as Vice President and Chief Investment Advisor Compliance Officer of HIFSCO and as Vice President and Chief Compliance Officer of HL Advisors. Ms. Pernerewski joined The Hartford in 2005 from Travelers Life and Annuity where she served as Counsel (2004-2005). Prior to Travelers Life and Annuity, Ms. Pernerewski held the position of Counsel at The Hartford (1998-2004).
Elizabeth L. Schroeder (1966) Vice President since 2010
Ms. Schroeder currently serves as Assistant Vice President of HLIC. Ms. Schroeder joined HLIC in 1991. She is also an Assistant Vice President of HASCO, HIFSCO and HL Advisors.
Martin Swanson (1962) Vice President since 2010
Mr. Swanson is a Vice President of HLIC. Mr. Swanson also serves as Vice President/Marketing for HIFSCO. Prior to joining HLIC in 1998, Mr. Swanson was a Vice President at PaineWebber, Inc.
Jane Wolak (1961) Vice President since 2009
Ms. Wolak currently serves as Senior Vice President of HLIC. Ms. Wolak joined HLIC as Vice President, Retail Product Services in May 2007. She is also Vice President of HASCO. Previously, Ms. Wolak was with Sun Life Financial where she held the position of Vice President, Service Center Operations from 2001-2007.
HOW TO OBTAIN A COPY OF THE FUND’S PROXY VOTING POLICIES AND VOTING RECORDS (UNAUDITED)
A description of the policies and procedures that the Fund uses to determine how to vote proxies relating to portfolio securities and a record of how the Fund voted any proxies for the twelve-month period ended June 30, 2011 are available (1) without charge, upon request, by calling 800-862-6668 and (2) on the SEC’s website at http://www.sec.gov.
QUARTERLY PORTFOLIO HOLDINGS INFORMATION (UNAUDITED)
The Fund files a complete schedule of portfolio holdings with the SEC for the first and third quarters of each fiscal year on Form N-Q. The Fund’s Forms are available (1) without charge, upon request, by calling 800-862-6668 and (2) on the SEC’s website at http://www.sec.gov. The Form N-Q may be reviewed and copied at the SEC’s Public Reference Room in Washington, DC. Information on the operation of the Public Reference Room may be obtained by calling 1-800-SEC-0330.
| Hartford Global Research HLS Fund |
| Expense Example (Unaudited) |
Your Fund's Expenses
As a shareholder of the Fund, you incur two types of costs: (1) transaction costs and (2) ongoing costs including investment management fees, distribution fees, and other fund expenses. This example is intended to help you understand your ongoing costs (in dollars) of investing in the Fund and to compare these costs with the ongoing costs of investing in other mutual funds. The example is based on an investment of $1,000 invested at the beginning of the period and held for the period of June 30, 2011 through December 31, 2011.
Actual Expenses
The first set of columns of the table below provides information about actual account values and actual expenses. You may use the information in this column, together with the amount you invested, to estimate the expenses that you paid over the period. Simply divide your account value by $1,000 (for example, an $8,600 account value divided by $1,000 = 8.6), then multiply the result by the number in the line under the heading entitled “Expenses Paid During Period” to estimate the expenses you paid on your account during this period.
Hypothetical Example for Comparison Purposes
The second set of columns of the table below provides information about hypothetical account values and hypothetical expenses based on the Fund’s actual expense ratio and an assumed rate of return of 5% per year before expenses, which is not the Fund’s actual return. The hypothetical account values and expenses may not be used to estimate the actual ending account balance or expenses you paid for the period. You may use this information to compare the ongoing costs of investing in the Fund and other funds. To do so, compare this 5% hypothetical example with the 5% hypothetical examples that appear in the shareholder reports of the other funds.
Please note that the expenses shown in the table are meant to highlight your ongoing costs only and do not reflect any transactional costs, such as sales charges (loads) and CDSC. Therefore, the second set of columns of the table is useful in comparing ongoing costs only, and will not help you determine the relative total costs of owning different funds. In addition, if these transactional costs were included, your costs would be higher. Expenses are equal to the Fund's annualized expense ratios multiplied by average account value over the period, multiplied by 184/365 (to reflect the one-half year period).
| | | Actual return | | | Hypothetical (5% return before expenses) | | | | | | | |
| | | Beginning
Account Value
June 30, 2011 | | Ending
Account Value
December 31,
2011 | | Expenses paid
during the period
June 30, 2011
through
December 31, 2011 | | | Beginning
Account Value
June 30, 2011 | | Ending
Account Value
December 31,
2011 | | Expenses paid
during the period
June 30, 2011
through
December 31, 2011 | | Annualized
expense
ratio | | Days in
the
current
1/2
year | | Days
in the
full
year | |
| Class IA | | $1,000.00 | | $860.52 | | $4.92 | | | $1,000.00 | | $1,019.91 | | $5.35 | | 1.05% | | 184 | | 365 | |
| Class IB | | $1,000.00 | | $859.43 | | $6.09 | | | $1,000.00 | | $1,018.65 | | $6.61 | | 1.30% | | 184 | | 365 | |
| Hartford Global Research HLS Fund |
| Approval of Investment Management and Investment Sub-Advisory Agreements (Unaudited) |
Section 15(c) of the Investment Company Act of 1940, as amended (the “1940 Act”), requires that each mutual fund’s board of directors, including a majority of those directors who are not “interested persons” of the mutual fund, as defined in the 1940 Act (the “Independent Directors”), annually review and consider the continuation of the mutual fund’s investment advisory and sub-advisory agreements. At its meeting held on August 2-3, 2011, the Board of Directors (the “Board”) of Hartford Series Fund, Inc., including each of the Independent Directors, unanimously voted to approve the continuation of the investment management agreement for Hartford Global Research HLS Fund (the “Fund”) with HL Investment Advisors, LLC (“HL Advisors”) and the continuation of the investment sub-advisory agreement between HL Advisors and the Fund’s sub-adviser, Wellington Management Company, LLP (the “Sub-adviser,” and together with HL Advisors, the “Advisers”) (collectively, the “Agreements”).
In the months preceding the August 2-3, 2011 meeting, the Board requested, received, and reviewed written responses from the Advisers to questions posed to them on behalf of the Independent Directors and supporting materials relating to those questions and responses. The Board considered information furnished to the Board at its meetings throughout the year, as well as information specifically prepared in connection with the annual approval of the Agreements at the Board’s meetings held on June 21-22, 2011 and August 2-3, 2011. Information provided to the Board at its meetings throughout the year included, among other things, reports on Fund performance, legal and compliance matters, sales and marketing activity, shareholder services, and the other services provided to the Fund by the Advisers and their affiliates. In addition, the Board received in-person presentations by Fund officers and representatives of HL Advisors at the Board’s meetings on June 21-22, 2011 and August 2-3, 2011 concerning the Agreements.
The Independent Directors, advised by independent legal counsel, engaged two service providers to assist them with evaluating the Agreements with respect to the Fund. Lipper Inc. (“Lipper”), an independent provider of investment company data, was retained to provide the Board with reports on how the Fund’s contractual management fees, actual management fees, other non-management fees, overall expense ratios and investment performance compared to those of mutual funds with similar investment objectives. The Independent Directors also engaged an independent financial services consulting firm (the “Consultant”) to assist them in evaluating the Fund’s management fees, sub-advisory fees, other non-management fees, overall expense ratios and investment performance. In addition, the Consultant reviewed the profitability calculations utilized by HL Advisors in connection with the continuation of the investment management agreement.
In determining to continue the Agreements for the Fund, the members of the Board reviewed and evaluated information and factors they believed to be relevant and appropriate in light of the information that the Board deemed necessary and appropriate through the exercise of their reasonable business judgment. While individual members of the Board may have weighed certain factors differently, the Board’s determination to continue the Agreements was based on a comprehensive consideration of all information provided to the Board throughout the year and specifically with respect to the continuation of the Agreements. A more detailed discussion of the factors the Board considered with respect to its approval of the Agreements is provided below.
Nature, Extent, And Quality Of Services Provided by the Advisers
The Board requested and considered information concerning the nature, extent, and quality of the services provided to the Fund by the Advisers. The Board considered, among other things, the terms of the Agreements and the range of services provided by the Advisers. The Board considered the Advisers’ professional personnel who provide services to the Fund, including each Adviser’s ability and experience in attracting and retaining qualified personnel to service the Fund. The Board considered each Adviser’s reputation and overall financial strength, as well as its willingness to consider and implement organizational and operational changes designed to improve services to the Fund. In addition, the Board considered the quality of each Adviser’s communications with the Board and responsiveness to Board inquiries.
The Board also requested and evaluated information concerning each Adviser’s regulatory and compliance environment. In this regard, the Board requested and reviewed information on each Adviser’s compliance policies and procedures, compliance history, and a report from the Fund’s Chief Compliance Officer on each Adviser’s compliance with applicable laws and regulations, including responses to regulatory developments and compliance issues raised by regulators. The Board also noted the Advisers’ support of the Fund’s compliance control structure, particularly the resources devoted by the Advisers in support of the Fund’s obligations pursuant to Rule 38a-1 under the 1940 Act.
| Hartford Global Research HLS Fund |
| Approval of Investment Management and Investment Sub-Advisory Agreements (Unaudited) – (continued) |
With respect to HL Advisors, the Board noted that under the Agreements, HL Advisors is responsible for the management of the Fund, including overseeing fund operations and service providers, as well as investment advisory services in connection with selecting, monitoring and supervising the Sub-adviser. The Board considered HL Advisors’ ongoing monitoring of people, process and performance, including its quarterly reviews of each of the Hartford HLS Funds, semi-annual meetings with the leaders of each Fund’s portfolio management team, and oversight of the Funds’ 49 portfolio managers. The Board recognized that HL Advisors has demonstrated a record of making changes to the management and/or strategies of the Funds when warranted. The Board considered HL Advisors’ oversight of the Sub-adviser’s investment approach and results, process for monitoring best execution of portfolio trades by the Sub-adviser, and approach to risk management with respect to the Fund and the service providers to the Fund. The Board also considered HL Advisors’ oversight of compliance with the Fund’s objective and policies as well as with applicable laws and regulations, noting that regulatory and other developments had over time led to an increase in the scope of HL Advisors’ services in this regard. In addition, the Board considered HL Advisors’ ongoing commitment to review and rationalize the Hartford fund family’s product line-up and the expenses that HL Advisors had incurred in connection with fund combinations in recent years. The Board considered that HL Advisors or its affiliates are responsible for providing the Fund’s officers. The Board also noted that Hartford Life Insurance Company (“HLIC”) provides administrative services to the Fund. The Board considered its experiences with HL Advisors and HLIC with respect to each of these services.
With respect to the Sub-adviser, who provides day-to-day portfolio management services, the Board considered the quality of the Fund’s portfolio managers, the Sub-adviser’s other investment personnel, its investment philosophy and process, investment research capabilities and resources, performance record, trade execution capabilities and experience. The Board considered the experience of the Fund’s portfolio managers, the number of accounts managed by the portfolio managers, and the Sub-adviser’s method for compensating the portfolio managers.
Based on these considerations, the Board concluded that it was satisfied with the nature, extent and quality of the services provided to the Fund by HL Advisors and the Sub-adviser.
Performance of the Fund and the Advisers
The Board considered the investment performance of the Fund. In this regard, the Board reviewed the performance of the Fund over different time periods presented in the materials and evaluated HL Advisors’ analysis of the Fund’s performance for these time periods. The Board considered information and materials provided to the Board by the Advisers concerning Fund performance, as well as information from Lipper comparing the investment performance of the Fund to an appropriate benchmark and universe of peer funds. The Board noted that the performance of the Fund was within expectations.
The Board considered the detailed investment analytics reports provided by The Hartford’s Investment Advisory Group throughout the year. These reports include, among other things, information on the Fund’s gross and net returns, the Fund’s investment performance relative to an appropriate benchmark and peer group, various statistics concerning the Fund’s portfolio, and a narrative summary of various factors affecting Fund performance. The Board considered the Advisers’ cooperation with the Investment Committee, which assists the Board in evaluating the performance of the Fund at periodic meetings throughout the year. The Board also considered the analysis provided by the Consultant relating to the Fund’s performance track record.
In light of all the considerations noted above, the Board concluded that it had continued confidence in HL Advisors’ and the Sub-adviser’s overall capabilities to manage the Fund.
Costs of the Services and Profitability of the Advisers
The Board reviewed information regarding HL Advisors’ cost to provide investment management and related services to the Fund and HL Advisors’ profitability, both overall and for the Fund, on a pre-tax basis without regard to distribution expenses. The Board also requested and reviewed information about the profitability to HL Advisors and its affiliates from all services provided to the Fund and all aspects of their relationship with the Fund. The Board also requested and received information relating to the operations and profitability of the Sub-adviser.
The Board considered the Consultant’s review of the profitability calculations utilized by HL Advisors in connection with the continuation of the investment management agreement. In this regard, the Consultant reported that The Hartford’s process for calculating and reporting Fund profitability is reasonable, sound and well within common industry practice.
Based on these considerations, the Board concluded that the profits anticipated to be realized by the Advisers and their affiliates from their relationships with the Fund would not be excessive.
Comparison of Fees and Services Provided by the Advisers
The Board considered comparative information with respect to the management fees to be paid by the Fund to HL Advisors and the total expense ratios of the Fund. The Board also considered comparative information with respect to the sub-advisory fees to be paid by HL Advisors to the Sub-adviser, to the extent applicable. In this regard, the Board requested and reviewed information from HL Advisors and the Sub-adviser relating to the management and sub-advisory fees, including the sub-advisory fee schedule for the Fund, and total operating expenses for the Fund. The Board considered that the management fee for the Fund includes the fee paid to HLIC for providing certain administrative services to the Fund. The Board also reviewed information from Lipper comparing the Fund’s contractual management fees, actual management fees and overall expense ratios relative to a group of funds selected by Lipper, in consultation with the Consultant, and a broader universe of funds selected by Lipper.
While the Board recognized that comparisons between the Fund and peer funds are imprecise, given the differing service levels and characteristics of mutual funds and the different business models and cost structures of the Advisers, the comparative information provided by Lipper assisted the Board in evaluating the reasonableness of the Fund’s management and sub-advisory fees and total operating expenses. In addition, the Board considered the analysis and recommendations of the Consultant relating to the Fund’s management and sub-advisory fees and total operating expenses.
Based on these considerations, the Board concluded that the Fund’s fees and total operating expenses, in conjunction with the information about quality of services, profitability, economies of scale, and other matters discussed, were reasonable in light of the services provided.
Economies of Scale
The Board requested and considered information regarding the Advisers’ realization of economies of scale with respect to the Fund and whether the fee levels reflect these economies of scale for the benefit of the Fund’s investors. With respect to HL Advisors, the Board considered representations from HL Advisors that it is difficult to anticipate whether and to what extent economies may be realized by HL Advisors as assets grow over time. The Board reviewed the breakpoints in the management fee schedule for the Fund, which reduces fee rates as Fund assets grow over time. The Board recognized that a fund with assets beyond the last breakpoint level will continue to benefit from economies of scale because additional assets are charged the lowest breakpoint fee resulting in lower overall effective management fee rates. The Board also recognized that a fee schedule that reaches a lower breakpoint quickly provides shareholders with the benefit of anticipated or potential economies of scale.
The Board reviewed and evaluated materials from Lipper showing how management fee schedules of peer funds reflect economies of scale for the benefit of investors as a peer fund’s assets hypothetically increase over time. Based on information provided by HL Advisors, Lipper, and the Consultant, the Board recognized that there is no uniform methodology for establishing breakpoints or uniform pattern in asset levels that trigger breakpoints or the amounts of breakpoints triggered.
After considering all of the information available to it, the Board concluded that it was satisfied with the extent to which economies of scale would be shared for the benefit of the Fund’s shareholders based on currently available information and the effective advisory fees and expense ratios for the Fund at its current and reasonably anticipated asset levels. The Board noted, however, that it would continue to monitor future growth in Fund assets and the appropriateness of additional breakpoints.
Other Benefits
The Board considered other benefits to the Advisers and their affiliates from their relationships with the Fund, including the role of the Fund in supporting the variable life insurance and variable annuity products offered by The Hartford. The Board reviewed information noting that HLIC, an affiliate of HL Advisors, receives fees for providing certain administrative services to the Fund, and that HLIC also receives fees for fund accounting and related services from the Fund, and the Board considered information on expected profits to HLIC or its affiliates for such services. The Board also considered that Hartford Administrative Services Company (“HASCO”), the Fund’s transfer agent and an affiliate of HL Advisors, receives transfer agency compensation from the
| Hartford Global Research HLS Fund |
| Approval of Investment Management and Investment Sub-Advisory Agreements (Unaudited) – (continued) |
Fund, and the Board reviewed information on the expected profitability of the Fund’s transfer agency function to HASCO. The Board considered information provided by HASCO indicating that the transfer agent fees charged by HASCO to the Fund were fair and reasonable based on publicly available information.
The Board also considered that Hartford Securities Distribution Company, Inc., as principal underwriter of the Fund, receives 12b-1 fees from the Fund. The Board also noted that certain affiliates of HL Advisors distribute shares of the Fund and receive compensation in that connection.
The Board considered benefits to the Sub-adviser from its use of the Fund’s brokerage commissions to obtain soft dollar research, and representations from HL Advisors and the Sub-adviser that the Sub-adviser would not make any revenue-sharing payments or any other type of distribution payments to HL Advisors or its affiliates.
The Board considered the benefits to shareholders of being part of the Hartford family of funds. The Board considered HL Advisors’ efforts to provide investors in the family with a broad range of investment styles and asset classes.
* * * *
Based upon its review of these various factors, among others, the Board concluded that it is in the best interests of the Fund and its shareholders for the Board to approve the Agreements for an additional year. In reaching this decision, the Board did not assign relative weights to the factors discussed above or deem any one or group of them to be controlling in and of themselves. In connection with their deliberations, the Independent Directors met separately in executive session on several occasions, with independent legal counsel, to review the relevant materials and consider their responsibilities under relevant laws and regulations.
The Hartford
P.O. Box 5085
Hartford, CT 06102-5085
Hartford Series Fund, Inc. is underwritten and distributed by Hartford Securities Distribution Company, Inc.
"The Hartford" is The Hartford Financial Services Group, Inc. and its subsidiaries.
Hartford Series Fund, Inc. inception dates range from 1977 to date. Hartford Series Fund, Inc. is not a subsidiary of The Hartford but is underwritten, distributed by and advised by subsidiaries of The Hartford. Investments in Hartford Series Fund, Inc. are not guaranteed by The Hartford or any other entity.
You should carefully consider investment objectives, risks, and charges and expenses of Hartford HLS Funds before investing. This and other information can be found in the Fund’s prospectus or summary prospectus, which can be obtained by calling 800-862-6668. Please read them carefully before you invest or send money.
HLSAR-GR11 2-12 109078 Printed in U.S.A ©2011 The Hartford, Hartford, CT 06115 | |

A MESSAGE FROM THE PRESIDENT
Dear Fellow Shareholders:
I want to take this opportunity to say thank you for investing in Hartford HLS Funds.
This has been a tumultuous year. In the beginning of 2011, we witnessed tension-fueled political uprisings in the already-volatile Middle East and North Africa region. We also watched as Japan dealt with a series of crises including a massive earthquake and subsequent tsunami. Yet, U.S. economic conditions continued to improve, with gains in consumer confidence and retail sales. During the first half of 2011, domestic, international, and world indices (as measured by the S&P 500, MSCI EAFE and MSCI World) were all up more than 5% through June, 30 2011.
The economic recovery, however, lost momentum in the second half of 2011. The employment and housing markets both remain extremely challenged. Investors continue to be concerned about the implications of the European sovereign debt crisis, as well as our own high levels of domestic debt. Fears that the European sovereign debt crisis could continue to drag down the global economy have weighed heavily on stocks.
Ongoing apprehension regarding the U.S. debt ceiling during the summer and the resulting downgrade of the U.S. sovereign credit rating by Standard & Poor’s also contributed to weaker investor confidence.
There are, however, some reasons to remain confident. Corporations have record levels of cash on their balance sheets—corporate cash has doubled in the past 10 years. In addition, U.S. gross domestic product expanded at a 2.5 percent annual rate in the third quarter according to the Commerce Department, as consumers and businesses set aside fears about the recovery and stepped up spending. Corporate earnings have also remained positive, with a majority of companies beating expectations each quarter this year. This momentum will hopefully continue into next year.
As we head into 2012, in light of the continued market volatility, now would be a good time to schedule a meeting with your financial advisor to examine your current investment strategy and determine whether you are on the right track.
| • | Does your fixed-income portfolio complement your equity portfolio? |
| • | Are you receiving diversified sources of income? |
| • | Is your portfolio still in line with your risk tolerance and investment time horizon? |
Talk to your advisor to see what changes you should make to address these concerns and opportunities.
Thank you again for investing with Hartford HLS Funds.
James Davey
President
Hartford HLS Funds
Hartford Growth HLS Fund
Table of Contents
This report is prepared for the general information of contract owners and qualified retirement plan participants. It is not an offer of contracts or of qualified retirement plans. It should not be used in connection with any offer, except in conjunction with the appropriate product prospectus which contains all pertinent information including the applicable sales, administrative and other charges.
The views expressed in the Fund’s Manager Discussion under ‘‘Why did the Fund perform this way?’’ and ‘‘What is the outlook?’’ are views of the Fund’s sub-adviser and portfolio management team through the end of the period and are subject to change based on market and other conditions.
Hartford Growth HLS Fund inception 04/30/2002
(sub-advised by Wellington Management Company, LLP)
| Investment objective – Seeks long-term capital appreciation. |
| |
Performance Overview 4/30/02 – 12/31/11
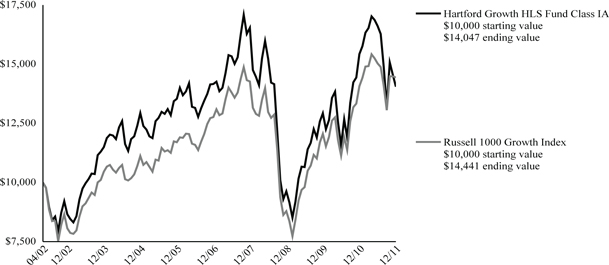
The chart above shows the growth of a $10,000 investment in Class IA. Growth results in classes other than Class IA will vary from what is seen above due to differences in the expenses charged to those share classes.
| Average Annual Total Returns (as of 12/31/11) |
| | 1 Year | 5 Year | Since Inception |
| Growth IA | -8.95% | -0.16% | 3.57% |
| Growth IB | -9.18% | -0.42% | 3.32% |
| Russell 1000 Growth Index | 2.64% | 2.50% | 3.87% |
PAST PERFORMANCE IS NOT INDICATIVE OF FUTURE RESULTS.
Total returns presented above were calculated using the Fund's net asset value available to shareholders for sale or redemption of Fund shares on December 31, 2011, which may exclude investment transactions as of this date.
Russell 1000 Growth Index is an unmanaged index which measures the performance of those Russell 1000 Index companies with higher price-to-book ratios and higher forecasted growth values. (The Russell 1000 Index is an unmanaged index that measures the performance of the 1,000 largest companies in the Russell 3000 Index, which measures the performance of the 3,000 largest U.S. companies based on total market capitalization.)
You cannot invest directly in an index.
The chart represents a hypothetical investment in the Fund. Performance data represents past performance and current performance could be higher or lower.
Performance information may reflect historical or current expense waivers/reimbursements from the investment adviser, without which performance would have been lower. For information on current expense waivers/reimbursements, please see the prospectus.
The value of the Fund will fluctuate so that when redeemed, it may be worth more or less than the original investment. The chart and table do not reflect the deductions of taxes, sales charges or other fees which may be applied at the variable life insurance, variable annuity or qualified retirement plan product level. Any such additional sales charges or other fees or expenses would lower the contract’s or plan’s performance.
| Hartford Growth HLS Fund |
| Manager Discussion (Unaudited) |
| December 31, 2011 |
| |
| Portfolio Manager |
| Andrew J. Shilling, CFA |
| Senior Vice President |
| |
How did the Fund perform?
The Class IA shares of the Hartford Growth HLS Fund returned -8.95% for the twelve-month period ended December 31, 2011, underperforming its benchmark, the Russell 1000 Growth Index, which returned 2.64% for the same period. The Fund also underperformed the -2.38% return of the average fund in the Lipper Large-Cap Growth VP-UF Funds peer group, a group of funds with investment strategies similar to those of the Fund.
Why did the Fund perform this way?
The one-year period ending December 31, 2011 was yet another volatile period for equity markets. Global equities started the year on a strong note and continued to march higher in the first quarter of 2011, driven by investors’ enthusiasm for additional government debt purchases by the U.S. Federal Reserve, the extension of tax cuts in the U.S., strong earnings growth, and generally improving economic data. This enthusiasm reversed later in the period, however, as concerns surfaced that the global economy could slip back into recession, resulting in a rapid decline in equity markets. Fears about sovereign debt and solvency in the eurozone, slowing economic expansion in China, and uncertainty about the sustainability of corporate earnings growth combined to produce an extremely volatile stock market, and return correlations among stocks spiked as investors shed risk and fled to safety. Markets ended the year on a positive note in the final month of the period with encouraging employment and manufacturing data in the U.S.
Overall equity market performance was mixed for the period across market capitalizations: large cap equities (+2%) did better than mid caps (-2%) and small caps (-4%), as represented by the S&P 500, S&P MidCap 400, and Russell 2000 indices, respectively. During the twelve-month period seven of ten sectors rose within the Russell 1000 Growth Index, led by Utilities (+20%), Consumer Staples (+15%), and Consumer Discretionary (+5%). Materials (-10%), Industrials (-3%), and Financials (-1%) lagged.
Security selection in Information Technology, Consumer Discretionary, and Materials detracted from the Fund’s relative returns. Sector allocation, a residual of bottom-up stock selection, also modestly detracted from relative performance primarily due to an underweight (i.e. the Fund’s sector position was less than the benchmark position) in Consumer Staples.
Juniper Networks (Information Technology), Acme Packet (Information Technology), and Exxon Mobil (Energy) were the top detractors from benchmark relative performance during the period. Shares of Juniper Networks, a leading provider of routing and security solutions, fell after the company lowered its revenue guidance due to delayed orders from some of its large telecom services customers. Shares of Acme Packet, a leading provider of session delivery network solutions that enable the delivery of interactive communications, underperformed. The company posted slightly disappointing quarterly earnings due to higher-than-expected operating expenditures. Exxon Mobil, a global integrated energy company, exhibited solid earnings along with an increased focus on organic growth; as a result its stock performed well during the year. Not owning Exxon Mobil detracted from relative returns. Rovi (Information Technology) was also among the top detractors from absolute (i.e. total return) performance returns.
Top contributors to benchmark-relative returns were Green Mountain Coffee (Consumer Staples), Polo Ralph Lauren (Consumer Discretionary), and Alliance Data Systems (Information Technology). Shares of Green Mountain Coffee, the leading provider of single-cup brewers and portion packs for coffee and other beverages, outperformed early in the period. Collaborations with traditional coffee retailers, including Dunkin Donuts and Starbucks, were greeted positively by the market and are expected to expand the market. Shares of Polo Ralph Lauren, a producer of apparel, accessories, fragrances, and home furnishings, rose reflecting the company’s superior brand strength and growth opportunities in Asia. Shares of marketing and customer-loyalty solutions provider Alliance Data Systems outperformed after the company posted solid quarterly earnings and raised its earnings guidance. Apple (Information Technology) and News Corp (Consumer Discretionary) were among the top contributors to absolute returns.
What is the outlook?
In 2011, macroeconomic fears and investors’ desire for safety dominated the equity markets. Not surprisingly, the best performing sectors were the traditionally defensive Utilities, Consumer Staples, and Health Care sectors. In this environment, investors craved low volatility, safety stocks, and the fundamentals of many solid companies were largely ignored. In 2012, we believe we could see greater differentiation among stocks as investors refocus on
| Hartford Growth HLS Fund |
| Manager Discussion (Unaudited) – (continued) |
| December 31, 2011 |
| |
fundamentals. Barring a catastrophic liquidity event in Europe, we could see some reversion to the mean as the “safety trade” unwinds and investors find bargains in high quality stocks that were painted with the “risk” brush in 2011.
In this environment we continue to focus our efforts on stock-by-stock fundamental research, picking one stock at a time based upon the attractiveness of each company’s fundamentals and valuation. In particular, we are focusing on finding what we consider proven companies with attractive valuations, solid fundamentals, and sustainable growth business models. As a result of this bottom up stock selection, at the end of the period our largest overweight positions versus the benchmark were Information Technology and Consumer Discretionary. Consumer Staples and Health Care were the Fund’s largest underweight positions at the end of the period.
Diversification by Industry
as of December 31, 2011
| Industry (Sector) | | Percentage of
Net Assets | |
| Automobiles & Components (Consumer Discretionary) | | | 3.5 | % |
| Capital Goods (Industrials) | | | 8.5 | |
| Consumer Durables & Apparel (Consumer Discretionary) | | | 2.9 | |
| Consumer Services (Consumer Discretionary) | | | 2.8 | |
| Diversified Financials (Financials) | | | 3.9 | |
| Energy (Energy) | | | 9.4 | |
| Food, Beverage & Tobacco (Consumer Staples) | | | 2.8 | |
| Health Care Equipment & Services (Health Care) | | | 4.3 | |
| Materials (Materials) | | | 4.0 | |
| Media (Consumer Discretionary) | | | 4.5 | |
| Pharmaceuticals, Biotechnology & Life Sciences (Health Care) | | | 2.9 | |
| Retailing (Consumer Discretionary) | | | 5.2 | |
| Semiconductors & Semiconductor Equipment (Information Technology) | | | 8.0 | |
| Software & Services (Information Technology) | | | 16.6 | |
| Technology Hardware & Equipment (Information Technology) | | | 18.1 | |
| Transportation (Industrials) | | | 1.4 | |
| Short-Term Investments | | | 1.3 | |
| Other Assets and Liabilities | | | (0.1 | ) |
| Total | | | 100.0 | % |
| Hartford Growth HLS Fund |
| Schedule of Investments |
| December 31, 2011 |
| (000’s Omitted) |
| Shares or Principal Amount | | Market Value ╪ | |
| COMMON STOCKS - 98.8% | | | |
| | | | | Automobiles & Components - 3.5% | | | | |
| | 126 | | | Harley-Davidson, Inc. | | $ | 4,905 | |
| | 198 | | | Johnson Controls, Inc. | | | 6,197 | |
| | | | | | | | 11,102 | |
| | | | | Capital Goods - 8.5% | | | | |
| | 92 | | | AMETEK, Inc. | | | 3,866 | |
| | 54 | | | Boeing Co. | | | 3,959 | |
| | 23 | | | Caterpillar, Inc. | | | 2,083 | |
| | 60 | | | Cummins, Inc. | | | 5,306 | |
| | 74 | | | Eaton Corp. | | | 3,240 | |
| | 66 | | | Illinois Tool Works, Inc. | | | 3,066 | |
| | 53 | | | Joy Global, Inc. | | | 3,998 | |
| | 16 | | | PACCAR, Inc. | | | 597 | |
| | 7 | | | Precision Castparts Corp. | | | 1,184 | |
| | | | | | | | 27,299 | |
| | | | | Consumer Durables & Apparel - 2.9% | | | | |
| | 78 | | | Coach, Inc. | | | 4,749 | |
| | 41 | | | Fossil, Inc. ● | | | 3,291 | |
| | 10 | | | Michael Kors Holdings Ltd. ● | | | 267 | |
| | 6 | | | Ralph Lauren Corp. | | | 810 | |
| | | | | | | | 9,117 | |
| | | | | Consumer Services - 2.8% | | | | |
| | 75 | | | Las Vegas Sands Corp. ● | | | 3,220 | |
| | 207 | | | MGM Resorts International ● | | | 2,158 | |
| | 79 | | | Starbucks Corp. | | | 3,648 | |
| | | | | | | | 9,026 | |
| | | | | Diversified Financials - 3.9% | | | | |
| | 39 | | | American Express Co. | | | 1,858 | |
| | 95 | | | Ameriprise Financial, Inc. | | | 4,725 | |
| | 32 | | | BlackRock, Inc. | | | 5,736 | |
| | | | | | | | 12,319 | |
| | | | | Energy - 9.4% | | | | |
| | 76 | | | Anadarko Petroleum Corp. | | | 5,815 | |
| | 89 | | | Consol Energy, Inc. | | | 3,277 | |
| | 89 | | | ENSCO International plc | | | 4,193 | |
| | 34 | | | EOG Resources, Inc. | | | 3,312 | |
| | 87 | | | National Oilwell Varco, Inc. | | | 5,931 | |
| | 19 | | | Occidental Petroleum Corp. | | | 1,740 | |
| | 87 | | | Schlumberger Ltd. | | | 5,942 | |
| | | | | | | | 30,210 | |
| | | | | Food, Beverage & Tobacco - 2.8% | | | | |
| | 202 | | | Green Mountain Coffee Roasters, Inc. ● | | | 9,070 | |
| | | | | | | | | |
| | | | | Health Care Equipment & Services - 4.3% | | | | |
| | 64 | | | Covidien plc | | | 2,866 | |
| | 54 | | | Edwards Lifesciences Corp. ● | | | 3,790 | |
| | 182 | | | Hologic, Inc. ● | | | 3,191 | |
| | 75 | | | UnitedHealth Group, Inc. | | | 3,799 | |
| | | | | | | | 13,646 | |
| | | | | Materials - 4.0% | | | | |
| | 53 | | | Freeport-McMoRan Copper & Gold, Inc. | | | 1,960 | |
| | 82 | | | Monsanto Co. | | | 5,734 | |
| | 42 | | | Mosaic Co. | | | 2,107 | |
| | 33 | | | Rio Tinto plc ADR | | | 1,623 | |
| | 25 | | | Walter Energy, Inc. | | | 1,526 | |
| | | | | | | | 12,950 | |
| | | | | Media - 4.5% | | | | |
| | 371 | | | News Corp. Class A | | | 6,624 | |
| | 1,839 | | | Sirius XM Radio, Inc. w/ Rights ● | | | 3,347 | |
| | 118 | | | Walt Disney Co. | | | 4,441 | |
| | | | | | | | 14,412 | |
| | | | | Pharmaceuticals, Biotechnology & Life Sciences - 2.9% | | | | |
| | 169 | | | Agilent Technologies, Inc. ● | | | 5,889 | |
| | 83 | | | Gilead Sciences, Inc. ● | | | 3,415 | |
| | | | | | | | 9,304 | |
| | | | | Retailing - 5.2% | | | | |
| | 77 | | | Abercrombie & Fitch Co. Class A | | | 3,784 | |
| | 27 | | | Amazon.com, Inc. ● | | | 4,658 | |
| | 126 | | | Lowe's Co., Inc. | | | 3,200 | |
| | 10 | | | Priceline.com, Inc. ● | | | 4,878 | |
| | | | | | | | 16,520 | |
| | | | | Semiconductors & Semiconductor Equipment - 8.0% | | | | |
| | 349 | | | Altera Corp. | | | 12,964 | |
| | 149 | | | Analog Devices, Inc. | | | 5,340 | |
| | 164 | | | Broadcom Corp. Class A | | | 4,807 | |
| | 131 | | | Skyworks Solutions, Inc. ● | | | 2,117 | |
| | 13 | | | Texas Instruments, Inc. | | | 386 | |
| | | | | | | | 25,614 | |
| | | | | Software & Services - 16.6% | | | | |
| | 37 | | | Alliance Data Systems Corp. ● | | | 3,875 | |
| | 90 | | | BMC Software, Inc. ● | | | 2,941 | |
| | 133 | | | Citrix Systems, Inc. ● | | | 8,085 | |
| | 53 | | | Cognizant Technology Solutions Corp. ● | | | 3,420 | |
| | 421 | | | eBay, Inc. ● | | | 12,767 | |
| | 3 | | | Google, Inc. ● | | | 2,125 | |
| | 380 | | | Oracle Corp. | | | 9,752 | |
| | 65 | | | Rovi Corp. ● | | | 1,598 | |
| | 14 | | | Salesforce.com, Inc. ● | | | 1,387 | |
| | 98 | | | Tibco Software, Inc. ● | | | 2,345 | |
| | 92 | | | VeriSign, Inc. | | | 3,287 | |
| | 20 | | | VMware, Inc. ● | | | 1,678 | |
| | | | | | | | 53,260 | |
| | | | | Technology Hardware & Equipment - 18.1% | | | | |
| | 98 | | | Acme Packet, Inc. ● | | | 3,038 | |
| | 61 | | | Apple, Inc. ● | | | 24,577 | |
| | 387 | | | EMC Corp. ● | | | 8,334 | |
| | 39 | | | F5 Networks, Inc. ● | | | 4,086 | |
| | 248 | | | Juniper Networks, Inc. ● | | | 5,052 | |
| | 141 | | | NetApp, Inc. ● | | | 5,126 | |
| | 140 | | | Qualcomm, Inc. | | | 7,631 | |
| | | | | | | | 57,844 | |
| | | | | Transportation - 1.4% | | | | |
| | 21 | | | C.H. Robinson Worldwide, Inc. | | | 1,479 | |
| | 67 | | | J.B. Hunt Transport Services, Inc. | | | 3,004 | |
| | | | | | | | 4,483 | |
| | | | | Total common stocks | | | | |
| | | | | (cost $290,940) | | $ | 316,176 | |
| | | | | | | | | |
| | | | | Total long-term investments | | | | |
| | | | | (cost $290,940) | | $ | 316,176 | |
The accompanying notes are an integral part of these financial statements.
| Hartford Growth HLS Fund |
| Schedule of Investments – (continued) |
| December 31, 2011 |
| (000’s Omitted) |
| Shares or Principal Amount | | | | Market Value ╪ | |
| SHORT-TERM INVESTMENTS - 1.3% |
| Repurchase Agreements - 1.3% |
| | | | | Bank of America Merrill Lynch TriParty Joint | | | | | | |
| | | | | Repurchase Agreement (maturing on | | | | | | |
| | | | | 01/03/2012 in the amount of $1,608, | | | | | | |
| | | | | collateralized by GNMA 4.50%, 2041, | | | | | | |
| | | | | value of $1,641) | | | | | | |
| $ | 1,608 | | | 0.04%, 12/30/2011 | | | | $ | 1,608 | |
| | | | | Barclays Capital TriParty Joint Repurchase | | | | | | |
| | | | | Agreement (maturing on 01/03/2012 in the | | | | | | |
| | | | | amount of $134, collateralized by U.S. | | | | | | |
| | | | | Treasury Bond 5.38%, 2031, value of $136) | | | | | | |
| | 134 | | | 0.01%, 12/30/2011 | | | | | 134 | |
| | | | | Deutsche Bank Securities TriParty Joint | | | | | | |
| | | | | Repurchase Agreement (maturing on | | | | | | |
| | | | | 01/03/2012 in the amount of $1,784, | | | | | | |
| | | | | collateralized by GNMA 3.50% - 7.00%, | | | | | | |
| | | | | 2035 - 2046, value of $1,820) | | | | | | |
| | 1,784 | | | 0.06%, 12/30/2011 | | | | | 1,784 | |
| | | | | UBS Securities, Inc. Joint Repurchase | | | | | | |
| | | | | Agreement (maturing on 01/03/2012 in the | | | | | | |
| | | | | amount of $14, collateralized by U.S. | | | | | | |
| | | | | Treasury Note 2.75%, 2016, value of $14) | | | | | | |
| | 14 | | | 0.01%, 12/30/2011 | | | | | 14 | |
| | | | | UBS Securities, Inc. TriParty Joint Repurchase | | | | | | |
| | | | | Agreement (maturing on 01/03/2012 in the | | | | | | |
| | | | | amount of $690, collateralized by FNMA | | | | | | |
| | | | | 3.00% - 6.50%, 2021 - 2041, value of $704) | | | | | | |
| | 690 | | | 0.04%, 12/30/2011 | | | | | 690 | |
| | | | | | | | | 4,230 | |
| | | | | Total short-term investments | | | | | | |
| | | | | (cost $4,230) | | | | $ | 4,230 | |
| | | | | | | | | | | |
| | | | | Total investments | | | | | | |
| | | | | (cost $295,170) ▲ | 100.1 | % | | $ | 320,406 | |
| | | | | Other assets and liabilities | (0.1 | )% | | | (450 | ) |
| | | | | Total net assets | 100.0 | % | | $ | 319,956 | |
|
| Note: | Percentage of investments as shown is the ratio of the total market value to total net assets. Market value of long-term investments in foreign securities represents 1.8% of total net assets at December 31, 2011. |
| | |
| | Prices of foreign equities that are principally traded on certain foreign markets may be adjusted daily pursuant to a fair value pricing service approved by the Board of Directors in order to reflect an adjustment for factors occurring after the close of certain foreign markets but before the close of the New York Stock Exchange. |
| ▲ | At December 31, 2011, the cost of securities for federal income tax purposes was $296,263 and the aggregate gross unrealized appreciation and depreciation based on that cost were: |
| | Unrealized Appreciation | | $ | 47,016 | |
| | Unrealized Depreciation | | | (22,873 | ) |
| | Net Unrealized Appreciation | | $ | 24,143 | |
| ╪ | See Significant Accounting Policies of accompanying Notes to Financial Statements regarding valuation of securities. |
The accompanying notes are an integral part of these financial statements.
| Hartford Growth HLS Fund |
| Investment Valuation Hierarchy Level Summary |
| December 31, 2011 |
| (000’s Omitted) |
| | | Total | | | Level 1 ♦ | | | Level 2 ♦ | | | Level 3 | |
| Assets: | | | | | | | | | | | | | | | | |
| Common Stocks ‡ | | $ | 316,176 | | | $ | 316,176 | | | $ | — | | | $ | — | |
| Short-Term Investments | | | 4,230 | | | | — | | | | 4,230 | | | | — | |
| Total | | $ | 320,406 | | | $ | 316,176 | | | $ | 4,230 | | | $ | — | |
| ♦ | For the year ended December 31, 2011, there were no significant transfers between Level 1 and Level 2. |
| ‡ | The Fund has all or primarily all of the equity securities categorized in a particular level. Refer to the Schedule of Investments for further industry breakout. |
The accompanying notes are an integral part of these financial statements.
| Hartford Growth HLS Fund |
| Statement of Assets and Liabilities |
| December 31, 2011 |
| (000’s Omitted) |
| Assets: | | | | |
| Investments in securities, at market value (cost $295,170) | | $ | 320,406 | |
| Cash | | | 1 | |
| Receivables: | | | | |
| Fund shares sold | | | 167 | |
| Dividends and interest | | | 199 | |
| Total assets | | | 320,773 | |
| Liabilities: | | | | |
| Payables: | | | | |
| Fund shares redeemed | | | 728 | |
| Investment management fees | | | 56 | |
| Distribution fees | | | 4 | |
| Accrued expenses | | | 29 | |
| Total liabilities | | | 817 | |
| Net assets | | $ | 319,956 | |
| Summary of Net Assets: | | | | |
| Capital stock and paid-in-capital | | $ | 348,684 | |
| Undistributed net investment income | | | — | |
| Accumulated net realized loss | | | (53,964 | ) |
| Unrealized appreciation of investments | | | 25,236 | |
| Net assets | | $ | 319,956 | |
| Shares authorized | | | 800,000 | |
| Par value | | $ | 0.001 | |
| Class IA: Net asset value per share | | $ | 10.92 | |
| Shares outstanding | | | 22,296 | |
| Net assets | | $ | 243,509 | |
| Class IB: Net asset value per share | | $ | 10.73 | |
| Shares outstanding | | | 7,128 | |
| Net assets | | $ | 76,447 | |
The accompanying notes are an integral part of these financial statements.
| Hartford Growth HLS Fund |
| Statement of Operations |
| For the Year Ended December 31, 2011 |
| (000’s Omitted) |
| Investment Income: | | | | |
| Dividends | | $ | 3,454 | |
| Interest | | | 3 | |
| Less: Foreign tax withheld | | | (17 | ) |
| Total investment income, net | | | 3,440 | |
| | | | | |
| Expenses: | | | | |
| Investment management fees | | | 3,051 | |
| Transfer agent fees | | | 5 | |
| Distribution fees - Class IB | | | 240 | |
| Custodian fees | | | 8 | |
| Accounting services fees | | | 39 | |
| Board of Directors' fees | | | 10 | |
| Audit fees | | | 14 | |
| Other expenses | | | 89 | |
| Total expenses (before fees paid indirectly) | | | 3,456 | |
| Commission recapture | | | (6 | ) |
| Total fees paid indirectly | | | (6 | ) |
| Total expenses, net | | | 3,450 | |
| Net investment loss | | | (10 | ) |
| | | | | |
| Net Realized Gain on Investments: | | | | |
| Net realized gain on investments | | | 37,324 | |
| Net Realized Gain on Investments | | | 37,324 | |
| | | | | |
| Net Changes in Unrealized Depreciation of Investments: | | | | ) |
| Net unrealized depreciation of investments | | | (68,361 | ) |
| Net Changes in Unrealized Depreciation of Investments | | | (68,361 | ) |
| Net Loss on Investments | | | (31,037 | ) |
| Net Decrease in Net Assets Resulting from Operations | | $ | (31,047 | ) |
The accompanying notes are an integral part of these financial statements.
| Hartford Growth HLS Fund |
| Statement of Changes in Net Assets |
| (000’s Omitted) |
| | | For the
Year Ended
December 31,
2011 | | | For the
Year Ended
December 31,
2010 | |
| Operations: | | | | | | | | |
| Net investment income (loss) | | $ | (10 | ) | | $ | 539 | |
| Net realized gain on investments | | | 37,324 | | | | 30,396 | |
| Net unrealized appreciation (depreciation) of investments | | | (68,361 | ) | | | 32,180 | |
| Net Increase (Decrease) In Net Assets Resulting From Operations | | | (31,047 | ) | | | 63,115 | |
| Distributions to Shareholders: | | | | | | | | |
| From net investment income | | | | | | | | |
| Class IA | | | (460 | ) | | | (74 | ) |
| Class IB | | | — | | | | (26 | ) |
| Total distributions | | | (460 | ) | | | (100 | ) |
| Capital Share Transactions: | | | | | | | | |
| Class IA | | | | | | | | |
| Sold | | | 50,505 | | | | 43,139 | |
| Issued in merger | | | — | | | | 54,822 | |
| Issued on reinvestment of distributions | | | 460 | | | | 74 | |
| Redeemed | | | (100,832 | ) | | | (70,148 | ) |
| Total capital share transactions | | | (49,867 | ) | | | 27,887 | |
| Class IB | | | | | | | | |
| Sold | | | 13,615 | | | | 14,660 | |
| Issued in merger | | | — | | | | 23,402 | |
| Issued on reinvestment of distributions | | | — | | | | 26 | |
| Redeemed | | | (38,523 | ) | | | (31,714 | ) |
| Total capital share transactions | | | (24,908 | ) | | | 6,374 | |
| Net increase (decrease) from capital share transactions | | | (74,775 | ) | | | 34,261 | |
| Net Increase (Decrease) In Net Assets | | | (106,282 | ) | | | 97,276 | |
| Net Assets: | | | | | | | | |
| Beginning of period | | | 426,238 | | | | 328,962 | |
| End of period | | $ | 319,956 | | | $ | 426,238 | |
| Undistributed (distribution in excess of) | | | | | | | | |
| net investment income | | $ | — | | | $ | 520 | |
| Shares: | | | | | | | | |
| Class IA | | | | | | | | |
| Sold | | | 4,162 | | | | 4,106 | |
| Issued in merger | | | — | | | | 5,038 | |
| Issued on reinvestment of distributions | | | 41 | | | | 8 | |
| Redeemed | | | (8,326 | ) | | | (6,806 | ) |
| Total share activity | | | (4,123 | ) | | | 2,346 | |
| Class IB | | | | | | | | |
| Sold | | | 1,144 | | | | 1,394 | |
| Issued in merger | | | — | | | | 2,184 | |
| Issued on reinvestment of distributions | | | — | | | | 3 | |
| Redeemed | | | (3,227 | ) | | | (3,095 | ) |
| Total share activity | | | (2,083 | ) | | | 486 | |
The accompanying notes are an integral part of these financial statements.
| Hartford Growth HLS Fund |
| Notes to Financial Statements |
| December 31, 2011 |
| (000’s Omitted) |
1. Organization:
Hartford Growth HLS Fund (the “Fund”) serves as an underlying investment option for certain variable annuity and variable life insurance separate accounts of Hartford Life Insurance Company (“HLIC”) and its affiliates and certain qualified retirement plans. The Fund may also serve as an underlying investment option for certain variable annuity and variable life separate accounts of other insurance companies. Owners of variable annuity contracts and policyholders of variable life insurance contracts may choose the funds permitted in the variable insurance contract prospectus. In addition, participants in certain qualified retirement plans may choose the Fund if permitted by their plans.
Hartford Series Fund, Inc. (the “Company”) is an open-end registered management investment company comprised of thirty portfolios. Financial Statements for the Fund, a series of the Company, are included in this report.
The Company is organized under the laws of the State of Maryland and is registered with the Securities and Exchange Commission (“SEC”) under the Investment Company Act of 1940, as amended (“1940 Act”). The Fund is a diversified open-end management investment company.
The Fund is divided into Class IA and Class IB shares. Each class is offered at the per share net asset value (“NAV”) without a sales charge and is subject to the same expenses, except that the Class IB shares are subject to distribution and service fees charged pursuant to a Distribution Plan adopted in accordance with Rule 12b-1 under the 1940 Act.
2. Significant Accounting Policies:
The following is a summary of significant accounting policies of the Fund in the preparation of its financial statements, which are in accordance with the United States Generally Accepted Accounting Principles (“U.S. GAAP”). The preparation of financial statements in accordance with U.S. GAAP may require management to make estimates and assumptions that affect the reported amounts of assets and liabilities and disclosure of contingent assets and liabilities at the date of the financial statements and the reported amounts of increases and decreases in net assets from operations during the reporting period. Actual results could differ from those estimates.
| a) | Determination of Net Asset Value – The NAV of each class of the Fund’s shares is determined as of the close of regular trading (normally 4:00 p.m. Eastern Time) (the “NYSE Close”) on each day that the New York Stock Exchange (the “Exchange”) is open (“Valuation Date”). Information that becomes known to the Fund after the NAV has been calculated on a particular day will not generally be used to retroactively adjust the NAV determined earlier that day. |
| b) | Investment Valuation and Fair Value Measurements – For purposes of calculating the NAV, portfolio securities and other assets held by the Fund's portfolio for which market quotes are readily available are valued at market value. Market value is generally determined on the basis of last reported sales prices or official close price. If no sales are reported, market value is based on quotes obtained from a quotation reporting system, established market makers, or independent pricing services. If market prices are not readily available or are deemed unreliable, the Fund will use the fair value of the security as determined in good faith under policies and procedures established by and under the supervision of the Company’s Board of Directors. Market quotes are considered not readily available where there is an absence of current or reliable market-based data (e.g., trade information or broker quotes), including where events occur after the close of the relevant market, but prior to the NYSE Close that materially affect the values of the Fund’s portfolio securities or assets. In addition, market quotes are considered not readily available when, due to extraordinary circumstances, the exchanges or markets on which the securities trade do not open for trading for the entire day and no other market prices are available. In addition, prices of foreign equities that are principally traded on certain foreign markets are adjusted daily pursuant to a fair value pricing service approved by the Board of Directors in order to reflect an adjustment for the |
| Hartford Growth HLS Fund |
| Notes to Financial Statements – (continued) |
| December 31, 2011 |
| (000’s Omitted) |
factors occurring after the close of certain foreign markets but before the NYSE Close. Securities that are primarily traded on foreign markets may trade on days that are not business days of the Fund. The value of the foreign securities in which the Fund invests may change on days when a shareholder will not be able to purchase or redeem shares of the Fund. Fair value pricing is subjective in nature and the use of fair value pricing by the Fund may cause the NAV of its shares to differ significantly from the NAV that would have been calculated using market prices at the close of the exchange on which a portfolio security is primarily traded. There can be no assurance that the Fund could obtain the fair market value assigned to a security if the Fund were to sell the security at approximately the time at which the Fund determines its NAV.
Investments valued in currencies other than U.S. dollars are converted to U.S. dollars using exchange rates obtained from independent pricing services for calculation of the NAV. As a result, the NAV of the Fund’s shares may be affected by changes in the value of currencies in relation to the U.S. dollar. The value of securities traded in markets outside the United States or denominated in currencies other than the U.S. dollar may be affected significantly on a day that the NYSE is closed and the market value may change on days when an investor is not able to purchase, redeem or exchange shares of the Fund.
Financial instruments for which prices are not available from an independent pricing service may be valued using market quotations obtained from one or more dealers that make markets in the respective financial instrument in accordance with procedures established by the Company’s Board of Directors.
U.S. GAAP defines fair value as the price that the Fund would receive to sell an asset or pay to transfer a liability in an orderly transaction between market participants. The U.S. GAAP fair value measurement standards require disclosure of a fair value hierarchy for each major category of assets and liabilities. Various inputs are used in determining the fair value of the Fund’s investments. These inputs are summarized into three broad hierarchy levels. This hierarchy is based on whether the valuation inputs are observable or unobservable. These levels are:
| · | Level 1 – Quoted prices in active markets for identical securities. Level 1 may include exchange traded instruments, such as domestic equities, some foreign equities, options, futures, mutual funds, exchange traded funds, rights and warrants. |
| · | Level 2 – Observable inputs other than Level 1 prices, such as quoted prices for similar securities; quoted prices in markets that are not active; or other inputs that are observable or can be corroborated by observable market data. Level 2 may include debt securities that are traded less frequently than exchange traded instruments and which are valued using independent pricing services; foreign equities, that are principally traded on certain foreign markets and are adjusted daily pursuant to a fair value pricing service in order to reflect an adjustment for the factors occurring after the close of certain foreign markets but before the NYSE Close; and short-term securities, which are valued at amortized cost. |
| · | Level 3 – Significant unobservable inputs that are supported by limited or no market activity. Level 3 may include financial instruments whose values are determined using broker quotes or require significant management judgment or estimation. These unobservable valuation inputs may include estimates for current yields, maturity/duration, prepayment speed, and broker quotes for comparable securities along with other assumptions relating to credit quality, collateral value, complexity of the security structure, general market conditions and liquidity. This category may include securities where trading has been halted or there are certain restrictions on trading. While these securities are priced using unobservable inputs, the valuation of these securities reflects the best available data and management believes the prices are a reasonable representation of exit price. |
Valuation levels are not necessarily indicative of the risk associated with investing in such securities. Individual securities within any of the above mentioned asset classes may be assigned a different hierarchical level than those presented above, as individual circumstances dictate.
During the year ended December 31, 2011, the Fund held no Level 3 securities; therefore, no reconciliation of Level 3 securities is presented.
For additional information, refer to the Investment Valuation Hierarchy Level Summary which follows the Schedule of Investments.
For purposes of reporting transfers between different hierarchy levels, both transfers in and out of each level, as applicable, are shown as if they occurred at the beginning of the period.
| c) | Security Transactions and Investment Income – Security transactions are recorded as of the trade date (the date the order to buy or sell is executed) for financial reporting purposes. Securities purchased or sold on a when-issued or delayed-delivery basis may be settled a month or more after the trade date. Realized gains and losses are determined on the basis of identified cost. |
Dividend income is accrued as of the ex-dividend date, except certain dividends from foreign securities where the ex-dividend date may have passed are recorded as soon as the Fund is informed of the dividend. Interest income, including amortization of premium and accretion of discounts, is accrued on a daily basis.
| d) | Foreign Currency Transactions – Assets and liabilities denominated in currencies other than U.S. dollars are translated into U.S. dollars at the exchange rates in effect on the valuation date. Purchases and sales of investment securities, income, and expenses are translated into U.S. dollars at the exchange rates on the dates of such transactions. |
The Fund does not isolate that portion of portfolio security valuation resulting from fluctuations in the foreign currency exchange rates from the fluctuations arising from changes in the market prices of securities held. Exchange rate fluctuations are included with the net realized and unrealized gain or loss on investments in the accompanying financial statements.
Net realized foreign exchange gains or losses arise from sales of foreign currencies and the difference between asset and liability amounts initially stated in foreign currencies and the U.S. dollar value of the amounts actually received or paid. Net unrealized foreign exchange gains or losses arise from changes in the value of other assets and liabilities at the end of the reporting period, resulting from changes in the exchange rates.
| e) | Joint Trading Account – The Fund may invest cash balances into a joint trading account that may be invested in one or more repurchase agreements. |
| f) | Fund Share Valuation and Dividend Distributions to Shareholders – Orders for the Fund’s shares are executed in accordance with the investment instructions of the contract holders and plan participants. The NAV of the Fund’s shares is determined as of the close of business on each business day of the Exchange. The NAV is determined separately for each class of shares of the Fund by dividing the Fund’s net assets attributable to that class by the number of shares of the class outstanding. Each class of shares offered by the Fund has equal rights as to assets and voting privileges (except that shareholders of a class have exclusive voting rights regarding any matter relating solely to that class of shares). Income and non-class specific expenses are allocated daily to each class on the basis of the relative net assets of the class. Realized and unrealized capital gains and losses are allocated daily based on the relative net assets of each class of shares of the Fund. |
Orders for the purchase of the Fund’s shares received prior to the close of the Exchange on any day the Exchange is open for business are priced at the NAV determined as of the close of the Exchange. Orders received after the close of the
| Hartford Growth HLS Fund |
| Notes to Financial Statements – (continued) |
| December 31, 2011 |
| (000’s Omitted) |
Exchange, or on a day on which the Exchange and/or the Fund is not open for business, are priced at the next determined NAV.
Dividends are declared pursuant to a policy adopted by the Company’s Board of Directors based upon the investment performance of the Fund. The policy of the Fund is to pay dividends from net investment income and realized capital gains, if any, at least once a year.
Distributions from net investment income, net realized capital gains and capital are determined in accordance with federal income tax regulations, which may differ from U.S. GAAP with respect to character and timing. These differences may include but are not limited to losses deferred due to wash sale adjustments, foreign currency gains and losses, adjustments related to Passive Foreign Investment Companies (“PFICs”), Real Estate Investment Trusts (“REITs”), Regulated Investment Companies (“RICs”), certain derivatives and partnerships. Permanent book and federal income tax basis differences relating to shareholder distributions will result in reclassifications to certain of the Fund’s capital accounts (see Federal Income Taxes: Reclassification of Capital Accounts note).
3. Securities and Other Investments:
| a) | Repurchase Agreements – A repurchase agreement is an agreement by which a counterparty agrees to sell a security and agrees to repurchase the security sold at a mutually agreed upon time and price. At the time the Fund enters into a repurchase agreement, the value of the underlying collateral security(ies), including accrued interest, will be equal to or exceed the value of the repurchase agreement. Repurchase agreements expose the Fund to counterparty risk. To minimize counterparty risk, the securities that serve to collateralize the repurchase agreement are held by the Fund's custodian in book entry or physical form in the custodial account of the Fund or in a third party custodial account. Repurchase agreements are valued at cost plus accrued interest. The Fund, as shown on the Schedule of Investments, had outstanding repurchase agreements as of December 31, 2011. |
4. Principal Risks:
| a) | Counterparty Risk – The Fund may be exposed to counterparty risk, or the risk that an institution or other entity with which the Fund has unsettled or open transactions will default. |
| b) | Market Risks – If the Fund invests directly in foreign currencies or in securities that trade in, and receive revenues in, foreign currencies, or in derivatives that provide exposure to foreign currencies, it will be subject to the risk that those currencies will decline in value relative to the base currency of the Fund, or, in the case of hedging positions, that the Fund’s base currency will decline in value relative to the currency being hedged. Currency rates in foreign countries may fluctuate significantly over short periods of time for a number of reasons, including changes in interest rates, intervention (or the failure to intervene) by U.S. or foreign governments, central banks or supranational entities, such as the International Monetary Fund, or by the imposition of currency controls or other political developments in the United States or abroad. As a result, the Fund’s investments in foreign currency denominated securities may reduce the returns of the Fund. The market values of equity securities, such as common stocks and preferred stocks, or equity related investments, such as futures and options, may decline due to general market conditions which are not specifically related to a particular company, such as real or perceived adverse economic conditions, changes in the general outlook for corporate earnings, changes in interest or currency rates or adverse investor sentiment generally. The market value of equity securities may also decline due to factors which affect a particular industry or industries, such as labor shortages or increased production costs and competitive conditions within an industry. Equity securities and equity related investments generally have greater market price volatility than fixed income securities. |
5. Federal Income Taxes:
| a) | Federal Income Taxes – For federal income tax purposes, the Fund intends to continue to qualify as a RIC under Subchapter M of the Internal Revenue Code (“IRC”) by distributing substantially all of its taxable net investment income and net realized capital gains to its shareholders and otherwise complying with the requirements of RICs. The Fund has distributed substantially all of its income and capital gains in prior years, if applicable, and intends to distribute substantially all of its income and capital gains prior to the next fiscal year-end. Accordingly, no provision for federal income or excise taxes has been made in the accompanying financial statements. Distributions from short-term capital gains are treated as ordinary income distributions for federal income tax purposes. |
| b) | Net Investment Income (Loss), Net Realized Gains (Losses) – Net investment income (loss) and net realized gains (losses) may differ for financial statement and tax purposes primarily because of losses deferred due to wash sale adjustments, foreign currency gains and losses, adjustments related to PFICs, REITs, RICs, certain derivatives and partnerships. The character of distributions made during the year from net investment income or net realized gains may differ from their ultimate characterization for federal income tax purposes. Also, due to the timing of dividend distributions, the fiscal year in which amounts are distributed may differ from the year that the income or realized gains (losses) were recorded by the Fund. |
| c) | Distributions and Components of Distributable Earnings – The tax character of distributions paid by the Fund for the periods indicated is as follows (as adjusted for dividends payable): |
| | | For the Year Ended
December 31, 2011 | | | For the Year Ended
December 31, 2010 | |
| Ordinary Income | | $ | 460 | | | $ | 100 | |
As of December 31, 2011, the Fund’s components of distributable earnings (deficit) on a tax basis were as follows:
| | | Amount | |
| Accumulated Capital and Other Losses* | | $ | (52,871 | ) |
| Unrealized Appreciation† | | | 24,143 | |
| Total Accumulated Deficit | | $ | (28,728 | ) |
| | * | The Fund has capital loss carryforwards that are identified in the Capital Loss Carryforward note that follows. |
| | † | The difference between book-basis and tax-basis unrealized appreciation (depreciation) may be attributable to the losses deferred due to wash sale adjustments, foreign currency gains and losses, adjustments related to PFICs, REITs, RICs, certain derivatives and partnerships. |
| Hartford Growth HLS Fund |
| Notes to Financial Statements – (continued) |
| December 31, 2011 |
| (000’s Omitted) |
| d) | Reclassification of Capital Accounts – The Fund may record reclassifications in its capital accounts. These reclassifications have no impact on the total net assets of the Fund. The reclassifications are a result of permanent differences between U.S. GAAP and tax accounting for such items as expiration or utilization of capital loss carryforwards or net operating losses. Adjustments are made to reflect the impact these items have on current and future distributions to shareholders. Therefore, the source of the Fund’s distributions may be shown in the accompanying Statement of Changes in Net Assets as from undistributed net investment income, from accumulated net realized gains on investments or from capital depending on the type of book and tax differences that exist. For the year ended December 31, 2011, the Fund recorded reclassifications to increase (decrease) the accounts listed below: |
| | | Amount | |
| Undistributed Net Investment Income | | $ | (50 | ) |
| Accumulated Net Realized Gain (Loss) | | | 67 | |
| Capital Stock and Paid-in-Capital | | | (17 | ) |
| e) | Capital Loss Carryforward – On December 22, 2010, the Regulated Investment Company Modernization Act of 2010 (the “Act”) was enacted, which made changes to the capital loss carryforward rules. The changes are effective for taxable years beginning after the date of enactment. Under the Act, funds are permitted to carry forward capital losses for an unlimited period. However, any losses incurred during those future taxable years will be required to be utilized prior to the losses incurred in pre-enactment taxable years, which carry an expiration date. As a result of this ordering rule, pre-enactment capital loss carryforwards may be more likely to expire unused. Additionally, post-enactment capital loss carryforwards will retain their character as either short-term or long-term capital losses rather than being considered all short-term as permitted under prior regulation. |
At December 31, 2011 (tax-year-end), the Fund had capital loss carryforwards for U.S. federal income tax purposes as follows:
| Year of Expiration | | Amount | |
| 2017 | | $ | 52,871 | |
| Total | | $ | 52,871 | |
As of December 31, 2011, the Fund utilized $35,277 of prior year capital loss carryforwards.
| f) | Accounting for Uncertainty in Income Taxes – The Fund has adopted financial reporting rules that require the Fund to analyze all open tax years, as defined by the statute of limitations, for all major jurisdictions. Generally, tax authorities can examine all tax returns filed for the last three years. The Fund does not have an examination in progress. |
The Fund has reviewed all open tax years and major jurisdictions and concluded that these financial reporting rules had no effect on the Fund’s financial position or results of operations. There is no tax liability resulting from unrecognized tax benefits relating to uncertain income tax positions taken or expected to be taken on the tax return for the fiscal year ended December 31, 2011. The Fund is also not aware of any tax positions for which it is reasonably possible that the total amounts of unrecognized tax benefits will significantly change in the next twelve months.
6. Expenses:
| a) | Investment Management Agreement – HL Investment Advisors, LLC (“HL Advisors”), an indirect wholly owned subsidiary of The Hartford Financial Services Group, Inc. (“The Hartford”), serves as investment manager to the Fund pursuant to an Investment Management Agreement with the Company. As investment manager, HL Advisors has overall investment supervisory responsibility for the Fund. In addition, HL Advisors provides administrative personnel, services, equipment, facilities and office space for proper operation of the Fund. HL Advisors has contracted with Wellington |
Management Company, LLP (“Wellington Management”) under a sub-advisory agreement for the provision of day-to-day investment management services to the Fund in accordance with the Fund’s investment objective and policies. The Fund pays a fee to HL Advisors, a portion of which may be used to compensate Wellington Management.
The schedule below reflects the rates of compensation paid to HL Advisors for investment management services rendered as of December 31, 2011; the rates are accrued daily and paid monthly.
| Average Daily Net Assets | | Annual Fee | |
| On first $250 million | | | 0.8000% | |
| On next $250 million | | | 0.7500% | |
| On next $500 million | | | 0.7000% | |
| On next $4 billion | | | 0.6750% | |
| On next $5 billion | | | 0.6725% | |
| Over $10 billion | | | 0.6700% | |
| b) | Accounting Services Agreement – Pursuant to the Fund Accounting Agreement between HLIC and the Company, on behalf of the Fund, HLIC provides accounting services to the Fund and receives monthly compensation based on the Fund’s average daily net assets at the rates set forth below. The Fund’s accounting services fees are accrued daily and paid monthly. |
| Average Daily Net Assets | | Annual Fee | |
| All Assets | | | 0.010% | |
| c) | Operating Expenses – Allocable expenses incurred by the Company are allocated to each Fund and allocated to classes within a Fund in proportion to the average daily net assets of the Fund and each class, except where allocation of certain expenses is more fairly made directly to the Fund or to specific classes within a Fund. |
| d) | Fees Paid Indirectly – The Company, on behalf of the Fund, has entered into agreements with State Street Global Markets, LLC and Russell Implementation Services, Inc. to partially recapture non-discounted trade commissions. Such rebates are used to pay a portion of the Fund’s expenses. In addition, the Fund’s custodian bank has also agreed to reduce its fees when the Fund maintains cash on deposit in a non-interest-bearing custody account. For the year ended December 31, 2011, these amounts, if any, are included in the Statement of Operations. |
The ratio of expenses to average net assets in the accompanying financial highlights excludes the reduction in expenses related to fees paid indirectly. The annualized expense ratio for the period listed below reflecting the reduction for fees paid indirectly is as follows:
| | | Year Ended
December 31, 2011 | |
| Class IA | | | 0.82 | % |
| Class IB | | | 1.07 | |
| e) | Distribution Plan for Class IB shares – The Company, on behalf of the Fund, has adopted a Distribution Plan pursuant to Rule 12b-1 of the 1940 Act to compensate the Distributor, Hartford Securities Distribution Company, Inc. (a wholly owned, ultimate subsidiary of The Hartford), from assets attributable to the Class IB shares for services rendered and expenses borne in connection with activities primarily intended to result in the sale of the Class IB shares, subject to the review and approval of the Company’s Board of Directors. |
The Distribution Plan provides that the Fund may pay annually up to 0.25% of the average daily net assets of the Fund attributable to its Class IB shares for activities primarily intended to result in the sale of Class IB shares. The Board has the authority to suspend or reduce these payments at any point in time. Under the terms of the Distribution Plan and the
| Hartford Growth HLS Fund |
| Notes to Financial Statements – (continued) |
| December 31, 2011 |
| (000’s Omitted) |
principal underwriting agreement, the Fund is authorized to make payments monthly to the Distributor that may be used to pay or compensate entities providing distribution and shareholder servicing with respect to the Class IB shares for such entities’ fees or expenses incurred or paid in that regard. These fees are accrued daily and paid monthly.
| f) | Other Related Party Transactions – Certain officers of the Fund are directors and/or officers of HL Advisors and/or The Hartford or its subsidiaries. For the year ended December 31, 2011, a portion of the Fund’s chief compliance officer’s salary was paid by all the investment companies in the Hartford fund complex. The portion allocated to the Fund rounds to zero. Hartford Administrative Services Company (“HASCO”), an indirect wholly owned subsidiary of The Hartford, provides transfer agent services to the Fund. HASCO was compensated on a per account basis for providing such services. The amount paid to HASCO can be found in the Statement of Operations. These fees are accrued daily and paid monthly. |
7. Investment Transactions:
For the year ended December 31, 2011, the Fund's aggregate purchases and sales of investment securities (excluding short-term investments) were as follows:
| | | Amount | |
| Cost of Purchases Excluding U.S. Government Obligations | | $ | 143,879 | |
| Sales Proceeds Excluding U.S. Government Obligations | | | 222,061 | |
8. Line of Credit:
The Fund is one of several Hartford funds that participate in a $500 million committed revolving line of credit facility. The facility is to be used for temporary or emergency purposes. Under the arrangement, the funds are required to own securities having a market value in excess of 300% of the total bank borrowings. The interest rate on borrowings varies depending on the nature of the loan. The facility also requires a fee to be paid based on the amount of the commitment. This commitment fee is allocated to all of the funds participating in the line of credit based on the average net assets of the funds. During the year ended December 31, 2011, the Fund did not have any borrowings under this facility.
9. Fund Merger:
Reorganization of Hartford Fundamental Growth HLS Fund into Hartford Growth HLS Fund: At a meeting held on August 5, 2009, the Board of Directors of the Company approved a Form of Agreement and Plan of Reorganization (“Reorganization Agreement”) that provided for the reorganization of a series of the Company, Hartford Fundamental Growth HLS Fund (“Target Fund”), into another series of the Company, Hartford Growth HLS Fund (“Acquiring Fund”) (the
“Reorganization”). The Reorganization did not require shareholder approval by the shareholders of the Target Fund or the Acquiring Fund.
Pursuant to the Reorganization Agreement, on April 16, 2010, each holder of Class IA and Class IB shares of the Target Fund became the owner of full and fractional shares of the corresponding class in the Aquiring Fund having an equal aggregate value.
The merger was accomplished by tax free exchange as detailed below:
| | | Net assets of Target
Fund on Merger
Date | | | Net assets of
Acquiring Fund
immediately before
merger | | | Net assets of
Acquiring
Fund
immediately
after merger | | | Target Fund shares
exchanged | | | Acquiring Fund
shares issued to the
Target Fund's
shareholders | |
| | | | | | | | | | | | | | | | |
| Class IA | | $ | 54,822 | | | $ | 254,913 | | | $ | 309,735 | | | | 6,125 | | | | 5,038 | |
| Class IB | | | 23,402 | | | | 90,981 | | | | 114,383 | | | | 2,627 | | | | 2,184 | |
| Total | | $ | 78,224 | | | $ | 345,894 | | | $ | 424,118 | | | | 8,752 | | | | 7,222 | |
10. Industry Classifications:
Other than the industry classifications “Other Investment Pools and Funds” and “Exchange Traded Funds,” equity industry classifications used in this report are the Global Industry Classification Standard, which was developed by and is the exclusive property and service mark of MSCI, Inc. and Standard & Poor’s.
11. Indemnifications:
Under the Company’s organizational documents, the Company shall indemnify its officers and directors to the full extent required or permitted under Maryland General Corporation Law and the federal securities laws. In addition, the Company, on behalf of the Fund, may enter into contracts that contain a variety of indemnifications. The Company’s maximum exposure under these arrangements is unknown. However, as of the date of these financial statements, the Company has not had prior claims or losses pursuant to these contracts and expects the risk of loss to be remote.
| Hartford Growth HLS Fund |
| Financial Highlights |
| - Selected Per-Share Data (A) - |
| | | Net Asset | | | | | | | | | Net Realized | | | | | | | | | | | | | | | | | | Net Increase | | | | |
| | | Value at | | | | | | | | | and Unrealized | | | Total from | | | Dividends from | | | Distributions | | | | | | | | | (Decrease) in | | | Net Asset | |
| | | Beginning of | | | Net Investment | | | Payments fom | | | Gain (Loss) on | | | Investment | | | Net Investment | | | from Realized | | | Distributions | | | Total | | | Net Asset | | | Value at End of | |
| Class | | Period | | | Income (Loss) | | | (to) Afiliate | | | Investments | | | Operations | | | Income | | | Capital Gains | | | from Capital | | | Distributions | | | Value | | | Period | |
| | | | | | | | | | | | | | | | | | | | | | | | | | | | | | | | | | |
| For the Year Ended December 31, 2011 |
| IA | | $ | 12.02 | | | $ | 0.01 | | | $ | — | | | $ | (1.09 | ) | | $ | (1.08 | ) | | $ | (0.02 | ) | | $ | — | | | $ | — | | | $ | (0.02 | ) | | $ | (1.10 | ) | | $ | 10.92 | |
| IB | | | 11.81 | | | | (0.03 | ) | | | — | | | | (1.05 | ) | | | (1.08 | ) | | | — | | | | — | | | | — | | | | — | | | | (1.08 | ) | | | 10.73 | |
| | | | | | | | | | | | | | | | | | | | | | | | | | | | | | | | | | | | | | | | | | | | | |
| For the Year Ended December 31, 2010(E) |
| IA | | | 10.07 | | | | 0.02 | | | | — | | | | 1.93 | | | | 1.95 | | | | — | | | | — | | | | — | | | | — | | | | 1.95 | | | | 12.02 | |
| IB | | | 9.92 | | | | — | | | | — | | | | 1.89 | | | | 1.89 | | | | — | | | | — | | | | — | | | | — | | | | 1.89 | | | | 11.81 | |
| | | | | | | | | | | | | | | | | | | | | | | | | | | | | | | | | | | | | | | | | | | | | |
| For the Year Ended December 31, 2009 |
| IA | | | 7.53 | | | | 0.04 | | | | — | | | | 2.54 | | | | 2.58 | | | | (0.04 | ) | | | — | | | | — | | | | (0.04 | ) | | | 2.54 | | | | 10.07 | |
| IB | | | 7.42 | | | | 0.02 | | | | — | | | | 2.49 | | | | 2.51 | | | | (0.01 | ) | | | — | | | | — | | | | (0.01 | ) | | | 2.50 | | | | 9.92 | |
| | | | | | | | | | | | | | | | | | | | | | | | | | | | | | | | | | | | | | | | | | | | | |
| For the Year Ended December 31, 2008 |
| IA | | | 13.39 | | | | 0.03 | | | | — | | | | (5.47 | ) | | | (5.44 | ) | | | (0.03 | ) | | | (0.39 | ) | | | — | | | | (0.42 | ) | | | (5.86 | ) | | | 7.53 | |
| IB | | | 13.18 | | | | — | | | | — | | | | (5.37 | ) | | | (5.37 | ) | | | — | | | | (0.39 | ) | | | — | | | | (0.39 | ) | | | (5.76 | ) | | | 7.42 | |
| | | | | | | | | | | | | | | | | | | | | | | | | | | | | | | | | | | | | | | | | | | | | |
| For the Year Ended December 31, 2007 |
| IA | | | 12.32 | | | | 0.01 | | | | — | | | | 2.01 | | | | 2.02 | | | | — | | | | (0.95 | ) | | | — | | | | (0.95 | ) | | | 1.07 | | | | 13.39 | |
| IB | | | 12.17 | | | | (0.02 | ) | | | — | | | | 1.98 | | | | 1.96 | | | | — | | | | (0.95 | ) | | | — | | | | (0.95 | ) | | | 1.01 | | | | 13.18 | |
| (A) | Information presented relates to a share outstanding throughout the indicated period. |
| (B) | The figures do not include sales charges or other fees which may be applied at the variable life insurance, variable annuity or qualified retirement plan product level. Any such additional sales charges or other fees would lower the Fund's performance. |
| (C) | Ratios do not reflect reductions for fees paid indirectly. Please see Fees Paid Indirectly in the Notes to Financial Statements. |
| (D) | Portfolio turnover rate is calculated on the basis of the Fund as a whole without distinguishing between the classes of shares issued. |
| (E) | Per share amounts have been calculated using the average shares method. |
| (F) | During the year ended December 31, 2010, the Fund incurred $49.9 million in sales associated with the transition of assets from Hartford Fundamental Growth HLS Fund, which merged into the Fund on April 16, 2010. These sales were excluded from the portfolio turnover calculation. |
| |
| - Ratios and Supplemental Data - |
| | | | | | | Ratio of Expenses to Average Net | | | Ratio of Expenses to Average Net | | | Ratio of Net Investment Income | | | Portfolio Turnover | |
| Total Return(B) | | | Net Assets at End of Period | | | Assets Before Waivers(C) | | | Assets After Waivers(C) | | | (Loss) to Average Net Assets | | | Rate(D) | |
| | | | | | | | | | | | | | | | | | | | | | | |
| | | | | | | | | | | | | | | | | | | | | | | |
| | (8.95 | )% | | $ | 243,509 | | | | 0.82 | % | | | 0.82 | % | | | 0.06 | % | | | 37 | % |
| | (9.18 | ) | | | 76,447 | | | | 1.07 | | | | 1.07 | | | | (0.19 | ) | | | — | |
| | | | | | | | | | | | | | | | | | | | | | | |
| | | | | | | | | | | | | | | | | | | | | | | |
| | 19.37 | | | | 317,464 | | | | 0.84 | | | | 0.84 | | | | 0.21 | | | | 74 | (F) |
| | 19.07 | | | | 108,774 | | | | 1.09 | | | | 1.09 | | | | (0.04 | ) | | | — | |
| | | | | | | | | | | | | | | | | | | | | | | |
| | | | | | | | | | | | | | | | | | | | | | | |
| | 34.24 | | | | 242,406 | | | | 0.88 | | | | 0.88 | | | | 0.44 | | | | 85 | |
| | 33.90 | | | | 86,556 | | | | 1.13 | | | | 1.13 | | | | 0.20 | | | | — | |
| | | | | | | | | | | | | | | | | | | | | | | |
| | | | | | | | | | | | | | | | | | | | | | | |
| | (41.79 | ) | | | 203,993 | | | | 0.84 | | | | 0.84 | | | | 0.27 | | | | 93 | |
| | (41.93 | ) | | | 81,720 | | | | 1.09 | | | | 1.09 | | | | 0.02 | | | | — | |
| | | | | | | | | | | | | | | | | | | | | | | |
| | | | | | | | | | | | | | | | | | | | | | | |
| | 16.78 | | | | 388,985 | | | | 0.83 | | | | 0.83 | | | | 0.11 | | | | 101 | |
| | 16.49 | | | | 189,987 | | | | 1.08 | | | | 1.08 | | | | (0.14 | ) | | | — | |
| Report of Independent Registered Public Accounting Firm |
| The Board of Directors and Shareholders of |
| Hartford Series Fund, Inc. |
We have audited the accompanying statement of assets and liabilities, including the schedule of investments, of Hartford Growth HLS Fund (one of the portfolios constituting Hartford Series Fund, Inc. (the Funds)) as of December 31, 2011, and the related statement of operations for the year then ended, the statements of changes in net assets for each of the two years in the period then ended, and the financial highlights for each of the five years in the period then ended. These financial statements and financial highlights are the responsibility of the Funds’ management. Our responsibility is to express an opinion on these financial statements and financial highlights based on our audits.
We conducted our audits in accordance with the standards of the Public Company Accounting Oversight Board (United States). Those standards require that we plan and perform the audit to obtain reasonable assurance about whether the financial statements and financial highlights are free of material misstatement. We were not engaged to perform an audit of the Funds’ internal control over financial reporting. Our audits included consideration of internal control over financial reporting as a basis for designing audit procedures that are appropriate in the circumstances, but not for the purpose of expressing an opinion on the effectiveness of the Funds’ internal control over financial reporting. Accordingly, we express no such opinion. An audit also includes examining, on a test basis, evidence supporting the amounts and disclosures in the financial statements and financial highlights, assessing the accounting principles used and significant estimates made by management, and evaluating the overall financial statement presentation. Our procedures included confirmation of securities owned as of December 31, 2011, by correspondence with the custodian and brokers or by other appropriate auditing procedures where replies from brokers were not received. We believe that our audits provide a reasonable basis for our opinion.
In our opinion, the financial statements and financial highlights referred to above present fairly, in all material respects, the financial position of Hartford Growth HLS Fund of Hartford Series Fund, Inc. at December 31, 2011, the results of its operations for the year then ended, the changes in its net assets for each of the two years in the period then ended, and the financial highlights for each of the five years in the period then ended, in conformity with U.S. generally accepted accounting principles.
|
| |
Minneapolis, MN February 13, 2012 |
| Hartford Growth HLS Fund |
| Directors and Officers (Unaudited) |
The Board of Directors of the Company appoints officers who are responsible for the day-to-day operations of the Fund and who execute policies formulated by the Directors. Each director serves until his or her death, resignation, or retirement or until the next annual meeting of shareholders is held or until his or her successor is elected and qualifies.
Directors and officers who are employed by or who have a financial interest in The Hartford are considered “interested” persons of the Fund pursuant to the 1940 Act. Each officer and two of the Company’s directors, as noted in the chart below, are “interested” persons of the Fund. Each director serves as a director for The Hartford Mutual Funds, Inc., The Hartford Mutual Funds II, Inc., Hartford Series Fund, Inc., Hartford HLS Series Fund II, Inc., and as a trustee for The Hartford Alternative Strategies Fund, which, as of December 31, 2011, collectively consist of 91 funds. Correspondence may be sent to directors and officers c/o Hartford Mutual Funds, P.O. Box 2999, Hartford, Connecticut 06104-2999, except that correspondence to Ms. Fagely may be sent to 500 Bielenberg Drive, Woodbury, Minnesota 55125.
The table below sets forth, for each director and officer, his or her name, year of birth, current position with the Company and date first elected or appointed to Hartford Series Fund, Inc. (“HSF”), and Hartford HLS Series Fund II, Inc. (“HSF2”), principal occupation, and, for directors, other directorships held. The Fund’s statement of additional information contains further information on the directors and is available free of charge by calling 1-800-862-6668 or writing to Hartford HLS Funds, c/o Individual Annuity Services, P.O. Box 5085, Hartford, CT 06102-5085.
Information on the aggregate remuneration paid to the directors of the Company can be found in the Statement of Operations herein. The Fund pays to The Hartford a portion of the chief compliance officer’s compensation, but does not pay salaries or compensation to any of their other officers or directors who are employed by The Hartford.
Non-Interested Directors
Lynn S. Birdsong (1946) Director since 2003, Co-Chairman of the Investment Committee
Mr. Birdsong is a private investor. Mr. Birdsong currently serves as a Director of the Sovereign High Yield Investment Company (April 2010 to current). Mr. Birdsong currently serves as an Independent Director of Nomura Partners Funds, Inc. (formerly, The Japan Fund) (March 2003 to current). From 2003 to March 2005, Mr. Birdsong was an independent director of the Atlantic Whitehall Funds. From 1979 to 2002, Mr. Birdsong was a managing director of Zurich Scudder Investments, an investment management firm. During his employment with Scudder, Mr. Birdsong was an Interested Director of The Japan Fund. Since 1981, Mr. Birdsong has been a partner in Birdsong Company, an advertising specialty firm.
Robert M. Gavin, Jr. (1940) Director since 2002 (HSF) and 1986 (HSF2), Chairman of the Board since 2004
Dr. Gavin is an educational consultant. Prior to September 1, 2001, he was President of Cranbrook Education Community and prior to July 1996, he was President of Macalester College, St. Paul, Minnesota.
Duane E. Hill (1945) Director since 2001 (HSF) and 2002 (HSF2), Chairman of the Nominating Committee
Mr. Hill is Partner of TSG Ventures L.P., a private equity investment company. Mr. Hill is a former partner of TSG Capital Group, a private equity investment firm that served as sponsor and lead investor in leveraged buyouts of middle market companies.
Sandra S. Jaffee (1941) Director since 2005
Ms. Jaffee served as Chairman (2008 to 2009) and Chief Executive Officer of Fortent (formerly Searchspace Group), a leading provider of compliance/regulatory technology to financial institutions from August 2005 to August 2009. From August 2004 to August 2005, Ms. Jaffee served as an Entrepreneur in Residence with Warburg Pincus, a private equity firm. From September 1995 to July 2004, Ms. Jaffee served as Executive Vice President at Citigroup, where she was President and Chief Executive Officer of Citibank’s Global Securities Services (1995 to 2003). Ms. Jaffe currently serves as a member of the Board of Directors of Broadridge Financial Solutions as well as a Trustee of Muhlenberg College.
William P. Johnston (1944) Director since 2005, Chairman of the Compliance Committee
In June 2006, Mr. Johnston was appointed as Senior Advisor to The Carlyle Group, a global private equity investment firm. In August 2007, Mr. Johnston was elected to the Board of Directors of LifeCare Holdings, Inc. In February 2008, Mr. Johnston was elected to the Board of Directors of HCR-ManorCare, Inc. In May 2006, Mr. Johnston was elected to the Supervisory Board of Fresenius Medical Care AG & Co. KGaA, after its acquisition of Renal Care Group, Inc. in March 2006. Mr. Johnston joined Renal Care Group in November 2002 as a member of the Board of Directors and served as Chairman of the Board from March 2003 through March 2006. Mr. Johnston served as a Director of MultiPlan, Inc. from July 2006 through August 2010. From September 1987 to December 2002, Mr. Johnston was with Equitable Securities Corporation (and its successors, SunTrust Equitable Securities and SunTrust Robinson Humphrey) serving in various investment banking and managerial positions, including Managing Director and Head of Investment Banking, Chief Executive Officer and Vice Chairman.
| Hartford Growth HLS Fund |
| Directors and Officers (Unaudited) – (continued) |
Phillip O. Peterson (1944) Director since 2002 (HSF) and 2000 (HSF2), Chairman of the Audit Committee
Mr. Peterson is a mutual fund industry consultant. He was a partner of KPMG LLP (an accounting firm) until July 1999. Mr. Peterson joined William Blair Funds in February 2007 as a member of the Board of Trustees. From January 2004 to April 2005, Mr. Peterson served as Independent President of the Strong Mutual Funds.
Lemma W. Senbet (1946) Director since 2005
Dr. Senbet is the William E. Mayer Chair Professor of Finance and Director, Center for Financial Policy, at the University of Maryland, Robert H. Smith School of Business. He was chair of the Finance Department from 1998 to 2006. Previously he was a chaired professor of finance at the University of Wisconsin-Madison. Also, he was director of the Fortis Funds from March 2000 to July 2002. Dr. Senbet served the finance profession in various capacities, including as director of the American Finance Association and President of the Western Finance Association. In 2006, Dr. Senbet was inducted Fellow of Financial Management Association International for his career-long distinguished scholarship and professional service.
Interested Directors and Officers
David N. Levenson (1966) Director since 2010
Mr. Levenson currently serves as President of The Hartford’s Wealth Management business. He was appointed to this role in July 2010. Previously, Mr. Levenson served as Executive Vice President of Legacy Holdings for The Hartford from June 2009 to July 2010. From 2006 to 2009, Mr. Levenson was with Hartford Life Insurance K.K. where he served as President and Chief Executive Officer from 2007 to 2009. He served as Managing Director of Hartford Investment Management Company from 2005 to 2006. Additionally, Mr. Levenson serves as Executive Vice President of The Hartford and as President, Director and Chief Executive Officer of Hartford Life Insurance Company (“HLIC”) and Hartford Life, Inc. (“HL Inc.”).
Lowndes A. Smith (1939) Director since 1996 (HSF) and 2002 (HSF2), Co-Chairman of the Investment Committee
Mr. Smith served as Vice Chairman of The Hartford from February 1997 to January 2002, as President and Chief Executive Officer of HL Inc. from February 1997 to January 2002, and as President and Chief Operating Officer of The Hartford Life Insurance Companies from January 1989 to January 2002. Mr. Smith serves as a Director of White Mountains Insurance Group, Ltd., One Beacon Insurance and Symetra Financial and as a Managing Director of Whittington Gray Associates.
Other Officers
James E. Davey (1964) President and Chief Executive Officer since 2010
Mr. Davey serves as Executive Vice President of HLIC. Additionally, Mr. Davey serves as President, Chief Executive Officer and Manager of Hartford Investment Financial Services, Inc. (“HIFSCO”) and President, Chief Executive Officer and Manager of HL Advisors. Mr. Davey joined The Hartford in 2002.
Michael R. Dressen (1963) AML Compliance Officer since 2011
Mr. Dressen currently serves as Assistant Vice President of HLIC. He also serves as Chief Compliance Officer and AML Compliance Officer of Hartford Administrative Services Company (“HASCO”) and as Assistant Secretary and Compliance Officer of HIFSCO. Mr Dressen joined The Hartford in 2005 from State Farm Insurance Companies where he held various positions related to mutual funds, variable products, and property casualty insurance.
Tamara L. Fagely (1958) Vice President, Treasurer and Controller since 2002 (HSF) and 1993 (HSF2)
Ms. Fagely has been a Vice President of HASCO since 1998 and Chief Financial Officer since 2006. Currently Ms. Fagely is a Vice President of HLIC. She served as Assistant Vice President of HLIC from December 2001 through March 2005. In addition, Ms. Fagely is Controller and Chief Financial Officer of HIFSCO.
Dr. Robert J. Froehlich (1953) Senior Managing Director since 2009
Dr. Froehlich joined The Hartford as Senior Managing Director in September 2009. Prior to joining The Hartford, Dr. Froehlich served as Vice Chairman of Deutsche Asset Management from 1997-2009.
Edward P. Macdonald (1967) Vice President, Secretary and Chief Legal Officer since 2005
Mr. Macdonald serves as Vice President of HLIC and Chief Legal Officer of Mutual Funds and Vice President of HIFSCO. He also serves as Vice President and Secretary of HASCO, and Chief Legal Officer, Secretary and Vice President of HL Advisors. Mr. Macdonald joined The Hartford in 2005.
Vernon J. Meyer (1964) Vice President since 2006
Mr. Meyer serves as Senior Vice President of HLIC. He also serves as Senior Vice President of HIFSCO and HL Advisors. Mr. Meyer joined The Hartford in 2004.
Colleen B. Pernerewski (1969) Vice President and Chief Compliance Officer since 2010
Ms. Pernerewski serves as Vice President and Chief Investment Advisor Compliance Officer of HIFSCO and as Vice President and Chief Compliance Officer of HL Advisors. Ms. Pernerewski joined The Hartford in 2005 from Travelers Life and Annuity where she served as Counsel (2004-2005). Prior to Travelers Life and Annuity, Ms. Pernerewski held the position of Counsel at The Hartford (1998-2004).
Elizabeth L. Schroeder (1966) Vice President since 2010
Ms. Schroeder currently serves as Assistant Vice President of HLIC. Ms. Schroeder joined HLIC in 1991. She is also an Assistant Vice President of HASCO, HIFSCO and HL Advisors.
Martin Swanson (1962) Vice President since 2010
Mr. Swanson is a Vice President of HLIC. Mr. Swanson also serves as Vice President/Marketing for HIFSCO. Prior to joining HLIC in 1998, Mr. Swanson was a Vice President at PaineWebber, Inc.
Jane Wolak (1961) Vice President since 2009
Ms. Wolak currently serves as Senior Vice President of HLIC. Ms. Wolak joined HLIC as Vice President, Retail Product Services in May 2007. She is also Vice President of HASCO. Previously, Ms. Wolak was with Sun Life Financial where she held the position of Vice President, Service Center Operations from 2001-2007.
HOW TO OBTAIN A COPY OF THE FUND’S PROXY VOTING POLICIES AND VOTING RECORDS (UNAUDITED)
A description of the policies and procedures that the Fund uses to determine how to vote proxies relating to portfolio securities and a record of how the Fund voted any proxies for the twelve-month period ended June 30, 2011 are available (1) without charge, upon request, by calling 800-862-6668 and (2) on the SEC’s website at http://www.sec.gov.
QUARTERLY PORTFOLIO HOLDINGS INFORMATION (UNAUDITED)
The Fund files a complete schedule of portfolio holdings with the SEC for the first and third quarters of each fiscal year on Form N-Q. The Fund’s Forms are available (1) without charge, upon request, by calling 800-862-6668 and (2) on the SEC’s website at http://www.sec.gov. The Form N-Q may be reviewed and copied at the SEC’s Public Reference Room in Washington, DC. Information on the operation of the Public Reference Room may be obtained by calling 1-800-SEC-0330.
| Hartford Growth HLS Fund |
| Expense Example (Unaudited) |
Your Fund's Expenses
As a shareholder of the Fund, you incur two types of costs: (1) transaction costs and (2) ongoing costs including investment management fees, distribution fees, and other fund expenses. This example is intended to help you understand your ongoing costs (in dollars) of investing in the Fund and to compare these costs with the ongoing costs of investing in other mutual funds. The example is based on an investment of $1,000 invested at the beginning of the period and held for the period of June 30, 2011 through December 31, 2011.
Actual Expenses
The first set of columns of the table below provides information about actual account values and actual expenses. You may use the information in this column, together with the amount you invested, to estimate the expenses that you paid over the period. Simply divide your account value by $1,000 (for example, an $8,600 account value divided by $1,000 = 8.6), then multiply the result by the number in the line under the heading entitled “Expenses Paid During Period” to estimate the expenses you paid on your account during this period.
Hypothetical Example for Comparison Purposes
The second set of columns of the table below provides information about hypothetical account values and hypothetical expenses based on the Fund’s actual expense ratio and an assumed rate of return of 5% per year before expenses, which is not the Fund’s actual return. The hypothetical account values and expenses may not be used to estimate the actual ending account balance or expenses you paid for the period. You may use this information to compare the ongoing costs of investing in the Fund and other funds. To do so, compare this 5% hypothetical example with the 5% hypothetical examples that appear in the shareholder reports of the other funds.
Please note that the expenses shown in the table are meant to highlight your ongoing costs only and do not reflect any transactional costs, such as sales charges (loads) and CDSC. Therefore, the second set of columns of the table is useful in comparing ongoing costs only, and will not help you determine the relative total costs of owning different funds. In addition, if these transactional costs were included, your costs would be higher. Expenses are equal to the Fund's annualized expense ratios multiplied by average account value over the period, multiplied by 184/365 (to reflect the one-half year period).
| | | Actual return | | | Hypothetical (5% return before expenses) | | | | | | |
| | | | | | | Expenses paid | | | | | | | Expenses paid | | | | Days in | | |
| | | | | Ending | | during the period | | | | | Ending | | during the period | | | | the | | Days |
| | | Beginning | | Account Value | | June 30, 2011 | | | Beginning | | Account Value | | June 30, 2011 | | Annualized | | current | | in the |
| | | Account Value | | December 31, | | through | | | Account Value | | December 31, | | through | | expense | | 1/2 | | full |
| | | June 30, 2011 | | 2011 | | December 31, 2011 | | | June 30, 2011 | | 2011 | | December 31, 2011 | | ratio | | year | | year |
| Class IA | | $1,000.00 | | $845.56 | | $3.81 | | | $1,000.00 | | $1,021.07 | | $4.18 | | 0.82% | | 184 | | 365 |
| Class IB | | $1,000.00 | | $844.47 | | $4.97 | | | $1,000.00 | | $1,019.81 | | $5.45 | | 1.07% | | 184 | | 365 |
| Hartford Growth HLS Fund |
| Approval of Investment Management and Investment Sub-Advisory Agreements (Unaudited) |
Section 15(c) of the Investment Company Act of 1940, as amended (the “1940 Act”), requires that each mutual fund’s board of directors, including a majority of those directors who are not “interested persons” of the mutual fund, as defined in the 1940 Act (the “Independent Directors”), annually review and consider the continuation of the mutual fund’s investment advisory and sub-advisory agreements. At its meeting held on August 2-3, 2011, the Board of Directors (the “Board”) of Hartford Series Fund, Inc., including each of the Independent Directors, unanimously voted to approve the continuation of the investment management agreement for Hartford Growth HLS Fund (the “Fund”) with HL Investment Advisors, LLC (“HL Advisors”) and the continuation of the investment sub-advisory agreement between HL Advisors and the Fund’s sub-adviser, Wellington Management Company, LLP (the “Sub-adviser,” and together with HL Advisors, the “Advisers”) (collectively, the “Agreements”).
In the months preceding the August 2-3, 2011 meeting, the Board requested, received, and reviewed written responses from the Advisers to questions posed to them on behalf of the Independent Directors and supporting materials relating to those questions and responses. The Board considered information furnished to the Board at its meetings throughout the year, as well as information specifically prepared in connection with the annual approval of the Agreements at the Board’s meetings held on June 21-22, 2011 and August 2-3, 2011. Information provided to the Board at its meetings throughout the year included, among other things, reports on Fund performance, legal and compliance matters, sales and marketing activity, shareholder services, and the other services provided to the Fund by the Advisers and their affiliates. In addition, the Board received in-person presentations by Fund officers and representatives of HL Advisors at the Board’s meetings on June 21-22, 2011 and August 2-3, 2011 concerning the Agreements.
The Independent Directors, advised by independent legal counsel, engaged two service providers to assist them with evaluating the Agreements with respect to the Fund. Lipper Inc. (“Lipper”), an independent provider of investment company data, was retained to provide the Board with reports on how the Fund’s contractual management fees, actual management fees, other non-management fees, overall expense ratios and investment performance compared to those of mutual funds with similar investment objectives. The Independent Directors also engaged an independent financial services consulting firm (the “Consultant”) to assist them in evaluating the Fund’s management fees, sub-advisory fees, other non-management fees, overall expense ratios and investment performance. In addition, the Consultant reviewed the profitability calculations utilized by HL Advisors in connection with the continuation of the investment management agreement.
In determining to continue the Agreements for the Fund, the members of the Board reviewed and evaluated information and factors they believed to be relevant and appropriate in light of the information that the Board deemed necessary and appropriate through the exercise of their reasonable business judgment. While individual members of the Board may have weighed certain factors differently, the Board’s determination to continue the Agreements was based on a comprehensive consideration of all information provided to the Board throughout the year and specifically with respect to the continuation of the Agreements. A more detailed discussion of the factors the Board considered with respect to its approval of the Agreements is provided below.
Nature, Extent, And Quality Of Services Provided by the Advisers
The Board requested and considered information concerning the nature, extent, and quality of the services provided to the Fund by the Advisers. The Board considered, among other things, the terms of the Agreements and the range of services provided by the Advisers. The Board considered the Advisers’ professional personnel who provide services to the Fund, including each Adviser’s ability and experience in attracting and retaining qualified personnel to service the Fund. The Board considered each Adviser’s reputation and overall financial strength, as well as its willingness to consider and implement organizational and operational changes designed to improve services to the Fund. In addition, the Board considered the quality of each Adviser’s communications with the Board and responsiveness to Board inquiries.
The Board also requested and evaluated information concerning each Adviser’s regulatory and compliance environment. In this regard, the Board requested and reviewed information on each Adviser’s compliance policies and procedures, compliance history, and a report from the Fund’s Chief Compliance Officer on each Adviser’s compliance with applicable laws and regulations, including responses to regulatory developments and compliance issues raised by regulators. The Board also noted the Advisers’ support of the Fund’s compliance control structure, particularly the resources devoted by the Advisers in support of the Fund’s obligations pursuant to Rule 38a-1 under the 1940 Act.
| Hartford Growth HLS Fund |
| Approval of Investment Management and Investment Sub-Advisory Agreements (Unaudited) – (continued) |
With respect to HL Advisors, the Board noted that under the Agreements, HL Advisors is responsible for the management of the Fund, including overseeing fund operations and service providers, as well as investment advisory services in connection with selecting, monitoring and supervising the Sub-adviser. The Board considered HL Advisors’ ongoing monitoring of people, process and performance, including its quarterly reviews of each of the Hartford HLS Funds, semi-annual meetings with the leaders of each Fund’s portfolio management team, and oversight of the Funds’ 49 portfolio managers. The Board recognized that HL Advisors has demonstrated a record of making changes to the management and/or strategies of the Funds when warranted. The Board considered HL Advisors’ oversight of the Sub-adviser’s investment approach and results, process for monitoring best execution of portfolio trades by the Sub-adviser, and approach to risk management with respect to the Fund and the service providers to the Fund. The Board also considered HL Advisors’ oversight of compliance with the Fund’s objective and policies as well as with applicable laws and regulations, noting that regulatory and other developments had over time led to an increase in the scope of HL Advisors’ services in this regard. In addition, the Board considered HL Advisors’ ongoing commitment to review and rationalize the Hartford fund family’s product line-up and the expenses that HL Advisors had incurred in connection with fund combinations in recent years. The Board considered that HL Advisors or its affiliates are responsible for providing the Fund’s officers. The Board also noted that Hartford Life Insurance Company (“HLIC”) provides administrative services to the Fund. The Board considered its experiences with HL Advisors and HLIC with respect to each of these services.
With respect to the Sub-adviser, who provides day-to-day portfolio management services, the Board considered the quality of the Fund’s portfolio manager, the Sub-adviser’s other investment personnel, its investment philosophy and process, investment research capabilities and resources, performance record, trade execution capabilities and experience. The Board considered the experience of the Fund’s portfolio manager, the number of accounts managed by the portfolio manager, and the Sub-adviser’s method for compensating the portfolio manager.
Based on these considerations, the Board concluded that it was satisfied with the nature, extent and quality of the services provided to the Fund by HL Advisors and the Sub-adviser.
Performance of the Fund and the Advisers
The Board considered the investment performance of the Fund. In this regard, the Board reviewed the performance of the Fund over different time periods presented in the materials and evaluated HL Advisors’ analysis of the Fund’s performance for these time periods. The Board considered information and materials provided to the Board by the Advisers concerning Fund performance, as well as information from Lipper comparing the investment performance of the Fund to an appropriate benchmark and universe of peer funds. The Board noted that the performance of the Fund was within expectations.
The Board considered the detailed investment analytics reports provided by The Hartford’s Investment Advisory Group throughout the year. These reports include, among other things, information on the Fund’s gross and net returns, the Fund’s investment performance relative to an appropriate benchmark and peer group, various statistics concerning the Fund’s portfolio, and a narrative summary of various factors affecting Fund performance. The Board considered the Advisers’ cooperation with the Investment Committee, which assists the Board in evaluating the performance of the Fund at periodic meetings throughout the year. The Board also considered the analysis provided by the Consultant relating to the Fund’s performance track record.
In light of all the considerations noted above, the Board concluded that it had continued confidence in HL Advisors’ and the Sub-adviser’s overall capabilities to manage the Fund.
Costs of the Services and Profitability of the Advisers
The Board reviewed information regarding HL Advisors’ cost to provide investment management and related services to the Fund and HL Advisors’ profitability, both overall and for the Fund, on a pre-tax basis without regard to distribution expenses. The Board also requested and reviewed information about the profitability to HL Advisors and its affiliates from all services provided to the Fund and all aspects of their relationship with the Fund. The Board also requested and received information relating to the operations and profitability of the Sub-adviser.
The Board considered the Consultant’s review of the profitability calculations utilized by HL Advisors in connection with the continuation of the investment management agreement. In this regard, the Consultant reported that The Hartford’s process for calculating and reporting Fund profitability is reasonable, sound and well within common industry practice.
Based on these considerations, the Board concluded that the profits anticipated to be realized by the Advisers and their affiliates from their relationships with the Fund would not be excessive.
Comparison of Fees and Services Provided by the Advisers
The Board considered comparative information with respect to the management fees to be paid by the Fund to HL Advisors and the total expense ratios of the Fund. The Board also considered comparative information with respect to the sub-advisory fees to be paid by HL Advisors to the Sub-adviser, to the extent applicable. In this regard, the Board requested and reviewed information from HL Advisors and the Sub-adviser relating to the management and sub-advisory fees, including the sub-advisory fee schedule for the Fund, and total operating expenses for the Fund. The Board considered that the management fee for the Fund includes the fee paid to HLIC for providing certain administrative services to the Fund. The Board also reviewed information from Lipper comparing the Fund’s contractual management fees, actual management fees and overall expense ratios relative to a group of funds selected by Lipper, in consultation with the Consultant, and a broader universe of funds selected by Lipper.
While the Board recognized that comparisons between the Fund and peer funds are imprecise, given the differing service levels and characteristics of mutual funds and the different business models and cost structures of the Advisers, the comparative information provided by Lipper assisted the Board in evaluating the reasonableness of the Fund’s management and sub-advisory fees and total operating expenses. In addition, the Board considered the analysis and recommendations of the Consultant relating to the Fund’s management and sub-advisory fees and total operating expenses.
Based on these considerations, the Board concluded that the Fund’s fees and total operating expenses, in conjunction with the information about quality of services, profitability, economies of scale, and other matters discussed, were reasonable in light of the services provided.
Economies of Scale
The Board requested and considered information regarding the Advisers’ realization of economies of scale with respect to the Fund and whether the fee levels reflect these economies of scale for the benefit of the Fund’s investors. With respect to HL Advisors, the Board considered representations from HL Advisors that it is difficult to anticipate whether and to what extent economies may be realized by HL Advisors as assets grow over time. The Board reviewed the breakpoints in the management fee schedule for the Fund, which reduces fee rates as Fund assets grow over time. The Board recognized that a fund with assets beyond the last breakpoint level will continue to benefit from economies of scale because additional assets are charged the lowest breakpoint fee resulting in lower overall effective management fee rates. The Board also recognized that a fee schedule that reaches a lower breakpoint quickly provides shareholders with the benefit of anticipated or potential economies of scale.
The Board reviewed and evaluated materials from Lipper showing how management fee schedules of peer funds reflect economies of scale for the benefit of investors as a peer fund’s assets hypothetically increase over time. Based on information provided by HL Advisors, Lipper, and the Consultant, the Board recognized that there is no uniform methodology for establishing breakpoints or uniform pattern in asset levels that trigger breakpoints or the amounts of breakpoints triggered.
After considering all of the information available to it, the Board concluded that it was satisfied with the extent to which economies of scale would be shared for the benefit of the Fund’s shareholders based on currently available information and the effective advisory fees and expense ratios for the Fund at its current and reasonably anticipated asset levels. The Board noted, however, that it would continue to monitor future growth in Fund assets and the appropriateness of additional breakpoints.
| Hartford Growth HLS Fund |
| Approval of Investment Management and Investment Sub-Advisory Agreements (Unaudited) – (continued) |
Other Benefits
The Board considered other benefits to the Advisers and their affiliates from their relationships with the Fund, including the role of the Fund in supporting the variable life insurance and variable annuity products offered by The Hartford. The Board reviewed information noting that HLIC, an affiliate of HL Advisors, receives fees for providing certain administrative services to the Fund, and that HLIC also receives fees for fund accounting and related services from the Fund, and the Board considered information on expected profits to HLIC or its affiliates for such services. The Board also considered that Hartford Administrative Services Company (“HASCO”), the Fund’s transfer agent and an affiliate of HL Advisors, receives transfer agency compensation from the Fund, and the Board reviewed information on the expected profitability of the Fund’s transfer agency function to HASCO. The Board considered information provided by HASCO indicating that the transfer agent fees charged by HASCO to the Fund were fair and reasonable based on publicly available information.
The Board also considered that Hartford Securities Distribution Company, Inc., as principal underwriter of the Fund, receives 12b-1 fees from the Fund. The Board also noted that certain affiliates of HL Advisors distribute shares of the Fund and receive compensation in that connection.
The Board considered benefits to the Sub-adviser from its use of the Fund’s brokerage commissions to obtain soft dollar research, and representations from HL Advisors and the Sub-adviser that the Sub-adviser would not make any revenue-sharing payments or any other type of distribution payments to HL Advisors or its affiliates.
The Board considered the benefits to shareholders of being part of the Hartford family of funds. The Board considered HL Advisors’ efforts to provide investors in the family with a broad range of investment styles and asset classes.
* * * *
Based upon its review of these various factors, among others, the Board concluded that it is in the best interests of the Fund and its shareholders for the Board to approve the Agreements for an additional year. In reaching this decision, the Board did not assign relative weights to the factors discussed above or deem any one or group of them to be controlling in and of themselves. In connection with their deliberations, the Independent Directors met separately in executive session on several occasions, with independent legal counsel, to review the relevant materials and consider their responsibilities under relevant laws and regulations.
The Hartford
P.O. Box 5085
Hartford, CT 06102-5085
Hartford Series Fund, Inc. is underwritten and distributed by Hartford Securities Distribution Company, Inc.
"The Hartford" is The Hartford Financial Services Group, Inc. and its subsidiaries.
Hartford Series Fund, Inc. inception dates range from 1977 to date. Hartford Series Fund, Inc. is not a subsidiary of The Hartford but is underwritten, distributed by and advised by subsidiaries of The Hartford. Investments in Hartford Series Fund, Inc. are not guaranteed by The Hartford or any other entity.
You should carefully consider investment objectives, risks, and charges and expenses of Hartford HLS Funds before investing. This and other information can be found in the Fund’s prospectus or summary prospectus, which can be obtained by calling 800-862-6668. Please read them carefully before you invest or send money.
HLSAR-G11 2-12 109078 Printed in U.S.A ©2011 The Hartford, Hartford, CT 06115 | |
A MESSAGE FROM THE PRESIDENT
Dear Fellow Shareholders:
I want to take this opportunity to say thank you for investing in Hartford HLS Funds.
This has been a tumultuous year. In the beginning of 2011, we witnessed tension-fueled political uprisings in the already-volatile Middle East and North Africa region. We also watched as Japan dealt with a series of crises including a massive earthquake and subsequent tsunami. Yet, U.S. economic conditions continued to improve, with gains in consumer confidence and retail sales. During the first half of 2011, domestic, international, and world indices (as measured by the S&P 500, MSCI EAFE and MSCI World) were all up more than 5% through June, 30 2011.
The economic recovery, however, lost momentum in the second half of 2011. The employment and housing markets both remain extremely challenged. Investors continue to be concerned about the implications of the European sovereign debt crisis, as well as our own high levels of domestic debt. Fears that the European sovereign debt crisis could continue to drag down the global economy have weighed heavily on stocks.
Ongoing apprehension regarding the U.S. debt ceiling during the summer and the resulting downgrade of the U.S. sovereign credit rating by Standard & Poor’s also contributed to weaker investor confidence.
There are, however, some reasons to remain confident. Corporations have record levels of cash on their balance sheets—corporate cash has doubled in the past 10 years. In addition, U.S. gross domestic product expanded at a 2.5 percent annual rate in the third quarter according to the Commerce Department, as consumers and businesses set aside fears about the recovery and stepped up spending. Corporate earnings have also remained positive, with a majority of companies beating expectations each quarter this year. This momentum will hopefully continue into next year.
As we head into 2012, in light of the continued market volatility, now would be a good time to schedule a meeting with your financial advisor to examine your current investment strategy and determine whether you are on the right track.
| • | Does your fixed-income portfolio complement your equity portfolio? |
| • | Are you receiving diversified sources of income? |
| • | Is your portfolio still in line with your risk tolerance and investment time horizon? |
Talk to your advisor to see what changes you should make to address these concerns and opportunities.
Thank you again for investing with Hartford HLS Funds.
James Davey
President
Hartford HLS Funds
Hartford Healthcare HLS Fund
(formerly Hartford Global Health HLS Fund)
Table of Contents
This report is prepared for the general information of contract owners and qualified retirement plan participants. It is not an offer of contracts or of qualified retirement plans. It should not be used in connection with any offer, except in conjunction with the appropriate product prospectus which contains all pertinent information including the applicable sales, administrative and other charges.
The views expressed in the Fund’s Manager Discussion under ‘‘Why did the Fund perform this way?’’ and ‘‘What is the outlook?’’ are views of the Fund’s sub-adviser and portfolio management team through the end of the period and are subject to change based on market and other conditions.
| Hartford Healthcare HLS Fund inception 05/01/2000 |
| (formerly Hartford Global Health HLS Fund) |
| (sub-advised by Wellington Management Company, LLP) |
| |
| Investment objective – Seeks long-term capital appreciation. |
| |
Performance Overview 12/31/01 - 12/31/11

The chart above shows the growth of a $10,000 investment in Class IA. Growth results in classes other than Class IA will vary from what is seen above due to differences in the expenses charged to those share classes.
| Average Annual Total Returns (as of 12/31/11) |
| | 1 Year | 5 Year | 10 Year |
| Healthcare IA | 8.54% | 2.42% | 5.73% |
| Healthcare IB | 8.27% | 2.16% | 5.47% |
| S&P 500 Index | 2.09% | -0.25% | 2.92% |
| S&P North American Health Care Sector Index | 11.62% | 3.71% | 3.90% |
PAST PERFORMANCE IS NOT INDICATIVE OF FUTURE RESULTS.
Total returns presented above were calculated using the Fund's net asset value available to shareholders for sale or redemption of Fund shares on December 31, 2011, which may exclude investment transactions as of this date.
S&P 500 Index is a market capitalization-weighted price index composed of 500 widely held common stocks.
S&P North American Health Care Sector Index is a modified capitalization-weighted index based on United States headquartered health care companies. Stocks in the index are weighted such that each stock is no more than 7.5% of the market capitalization as of the most recent reconstitution date. The companies included in the index must be common stocks and be traded on the American Stock Exchange, Nasdaq or the New York Stock Exchange and meet certain established market capitalization levels.
You cannot invest directly in an index.
The chart represents a hypothetical investment in the Fund. Performance data represents past performance and current performance could be higher or lower.
Performance information may reflect historical or current expense waivers/reimbursements from the investment adviser, without which performance would have been lower. For information on current expense waivers/reimbursements, please see the prospectus.
The value of the Fund will fluctuate so that when redeemed, it may be worth more or less than the original investment. The chart and table do not reflect the deductions of taxes, sales charges or other fees which may be applied at the variable life insurance, variable annuity or qualified retirement plan product level. Any such additional sales charges or other fees or expenses would lower the contract’s or plan’s performance.
| Hartford Healthcare HLS Fund (formerly Hartford Global Health HLS Fund) |
| Manager Discussion (Unaudited) |
| December 31, 2011 |
| |
| Portfolio Managers | | | |
| Ann C. Gallo | Jean M. Hynes, CFA | Robert L. Deresiewicz | Kirk J. Mayer, CFA |
Senior Vice President and Global Industry Analyst | Senior Vice President and Global Industry Analyst
| Senior Vice President and Global Industry Analyst
| Senior Vice President and Global Industry Analyst |
| | | | |
How did the Fund perform?
The Class IA shares of the Hartford Healthcare HLS Fund returned 8.54% for the twelve-month period ended December 31, 2011, underperforming its benchmark, the S&P North American Health Care Sector Index, which returned 11.62% and outperforming the S&P 500 Index, which returned 2.09% for the same period. The Fund outperformed the 7.48% return of the average fund in the Lipper Health and Biotechnology VP-UF Funds peer group, a group of funds with investment strategies similar to those of the Fund.
Why did the Fund perform this way?
Health Care stocks (+12%) outperformed both the broader U.S. market (+2%) and the world market (-5%), as measured by the S&P North American Health Care Sector Index, S&P 500, and MSCI World Indexes respectively. Within the S&P North American Health Care Index, three sub-sectors posted positive returns - Major Pharmaceuticals (+19%), Specialty Pharmaceuticals/Biotechnology (+17%), and Health Services (+12%). Returns within Medical Technology (0%) were flat for the quarter.
During the period stock selection, particularly in Medical Technology and Major Pharmaceuticals, detracted from relative results. Sector allocation, a fallout of our bottom-up (i.e. stock by stock fundamental research) investment process, modestly detracted from relative performance, mainly due to our underweight position (i.e. the Fund’s sector position was less than the benchmark position) in Pharmaceuticals and overweight position in Health Services.
Shionogi, Teva Pharmaceuticals, and Exelixis were the largest detractors from both relative and absolute performance. Japan-based pharmaceutical company Shionogi saw its shares drop as the company again announced a downward revision in earnings for its US subsidiary. Investors also seemed to be worried about the potentially negative impact to margins as the company has to invest in product development to replace lost Crestor sales due to the availability of a generic Lipitor. Global pharmaceutical company Teva Pharmaceuticals’ share price fell due to disappointing results from phase III trials for a new multiple sclerosis candidate, Bravo. Shares of Exelixis, a biotechnology company committed to developing small molecule therapies for cancer treatment, were pressured down after it was reported that six deaths occurred during trials of the company’s cancer treatment, Cabozantinib, raising concerns about the drug’s efficacy.
Elan, Pharmasset, and Abiomed were the top contributors to benchmark-relative performance during the period. Elan, a biotechnology company specializing in neuroscience, saw its stock rise as investors remain optimistic over continued revenue growth from Tysabri, a drug for the treatment of multiple sclerosis and Crohn’s disease. Shares of Pharmasset, which focuses on the discovery, development, and commercialization of novel drugs to treat viral infections, rose after it was acquired by Gilead Sciences in November. Also aiding Pharmasset was the potential of its Hepatitis C medicines. Shares of Abiomed, a provider of medical devices in circulatory support, rose following the announcement that the early usage of their drug Impella 2.5 improves survival in shock patients. Insurance company UnitedHealth Group was among the top absolute (i.e. total return) contributors during the period.
What is the outlook?
While Health Care stocks finished the year ahead of the broader market, the sector did give back some gains during the fourth quarter due to concerns over the U.S. federal deficit reduction plan. The U.S. Health Care industry is expected to be subject to a 2% across the board reduction in Medicare reimbursement with the inability of the Congressional super committee to reach a compromise in November. Medicaid and commercial reimbursement will not be affected. Given the magnitude of the Health Care cost problem in the U.S., combined with our view that the Patient Protection and Affordable Care Act (PPACA) does very little to address the issue, we have long believed that Health Care stocks will be subject to escalating reimbursement pressure in the years to come. That said, despite this pressure, we also believe that there will always be demand for, and reimbursement of, truly innovative Health Care products and services. In other words, while the bar has been raised we believe returns will accrue to companies able to offer clinical evidence attesting to the superiority of their products and services. This is one of the key tenets upon which we have structured our Fund.
The U.S. Supreme Court will rule on the constitutionality of the Health Care reform legislation in 2012. Thus far, six courts have ruled on the constitutionality of the individual mandate, with three ruling in favor of it and three against it. While uncertainty will remain over the final design of the legislation,
| Hartford Healthcare HLS Fund (formerly Hartford Global Health HLS Fund) |
| Manager Discussion (Unaudited) – (continued) |
| December 31, 2011 |
we expect the Obama administration to continue to enact the legislation in a generally industry-friendly manner.
We expect the roll-out of health care reform in the U.S. to be an evolutionary process. While we are confident with our Fund positioning, we will continue to closely monitor industry developments and make adjustments to the portfolio as needed. Against this backdrop, the Fund ended the period most overweight the Specialty Pharmaceuticals/Biotechnology sub-sector and most underweight the Major Pharmaceuticals sub-sector relative to the benchmark.
| Diversification by Industry |
| as of December 31, 2011 |
| Industry | | Percentage of
Net Assets | |
| Biotechnology | | | 19.6 | % |
| Drug Retail | | | 3.4 | |
| Health Care Distributors | | | 7.3 | |
| Health Care Equipment | | | 16.0 | |
| Health Care Facilities | | | 1.0 | |
| Health Care Technology | | | 0.3 | |
| Life Sciences Tools & Services | | | 5.2 | |
| Managed Health Care | | | 14.3 | |
| Pharmaceuticals | | | 32.9 | |
| Short-Term Investments | | | 0.0 | |
| Other Assets and Liabilities | | | 0.0 | |
| Total | | | 100.0 | % |
| Hartford Healthcare HLS Fund (formerly Hartford Global Health HLS Fund) |
| Schedule of Investments |
| December 31, 2011 |
| (000’s Omitted) |
| Shares or Principal Amount | | Market Value ╪ | |
COMMON STOCKS - 100.0% | |
| | | | | Biotechnology - 19.6% | | | | |
| | 89 | | | 3SBio, Inc. ADR ● | | $ | 913 | |
| | 98 | | | Achillion Pharmaceuticals, Inc. ● | | | 749 | |
| | 35 | | | Acorda Therapeutics, Inc. ● | | | 842 | |
| | 164 | | | Alkermes plc ● | | | 2,853 | |
| | 201 | | | Amylin Pharmaceuticals, Inc. ● | | | 2,292 | |
| | 87 | | | Ardea Biosciences, Inc. ● | | | 1,464 | |
| | 91 | | | Arena Pharmaceuticals, Inc. ● | | | 170 | |
| | 38 | | | Biogen Idec, Inc. ● | | | 4,193 | |
| | 47 | | | Celgene Corp. ● | | | 3,164 | |
| | 215 | | | Exelixis, Inc. ● | | | 1,016 | |
| | 120 | | | Immunogen, Inc. ● | | | 1,391 | |
| | 102 | | | Incyte Corp. ● | | | 1,538 | |
| | 60 | | | Ironwood Pharmaceuticals, Inc. ● | | | 719 | |
| | 56 | | | Momenta Pharmaceuticals, Inc. ● | | | 977 | |
| | 72 | | | NPS Pharmaceuticals, Inc. ● | | | 476 | |
| | 41 | | | Onyx Pharmaceuticals, Inc. ● | | | 1,802 | |
| | 41 | | | Pharmasset, Inc. ● | | | 5,192 | |
| | 81 | | | Progenics Pharmaceuticals, Inc. ● | | | 691 | |
| | 52 | | | Regeneron Pharmaceuticals, Inc. ● | | | 2,893 | |
| | 83 | | | Rigel Pharmaceuticals, Inc. ● | | | 654 | |
| | 141 | | | Seattle Genetics, Inc. ● | | | 2,357 | |
| | 15 | | | Targacept, Inc. ● | | | 82 | |
| | | | | | | | 36,428 | |
| | | | | Drug Retail - 3.4% | | | | |
| | 153 | | | CVS Caremark Corp. | | | 6,246 | |
| | | | | | | | | |
| | | | | Health Care Distributors - 7.3% | | | | |
| | 128 | | | Cardinal Health, Inc. | | | 5,207 | |
| | 108 | | | McKesson Corp. | | | 8,383 | |
| | | | | | | | 13,590 | |
| | | | | Health Care Equipment - 16.0% | | | | |
| | 175 | | | Abiomed, Inc. ● | | | 3,229 | |
| | 131 | | | China Medical Technologies, Inc. ADR ● | | | 373 | |
| | 108 | | | Covidien plc | | | 4,857 | |
| | 35 | | | Dexcom, Inc. ● | | | 330 | |
| | 20 | | | DiaSorin S.p.A. | | | 504 | |
| | 39 | | | Heartware International, Inc. ● | | | 2,663 | |
| | 71 | | | Hologic, Inc. ● | | | 1,250 | |
| | 164 | | | Medtronic, Inc. | | | 6,262 | |
| | 93 | | | St. Jude Medical, Inc. | | | 3,180 | |
| | 128 | | | Stereotaxis, Inc. ● | | | 105 | |
| | 29 | | | Stryker Corp. | | | 1,456 | |
| | 58 | | | Tornier N.V. ● | | | 1,040 | |
| | 2,557 | | | Trauson Holdings Co., Ltd. | | | 578 | |
| | 79 | | | Volcano Corp. ● | | | 1,882 | |
| | 40 | | | Zimmer Holdings, Inc. ● | | | 2,126 | |
| | | | | | | | 29,835 | |
| | | | | Health Care Facilities - 1.0% | | | | |
| | 33 | | | HCA Holdings, Inc. ● | | | 727 | |
| | 106 | | | Vanguard Health Systems, Inc. ● | | | 1,083 | |
| | | | | | | | 1,810 | |
| | | | | Health Care Technology - 0.3% | | | | |
| | 32 | | | Allscripts Healthcare Solutions, Inc. ● | | | 602 | |
| | | | | | | | | |
| | | | | Life Sciences Tools & Services - 5.2% | | | | |
| | 92 | | | Agilent Technologies, Inc. ● | | | 3,203 | |
| | 21 | | | Life Technologies Corp. ● | | | 817 | |
| | 84 | | | PAREXEL International Corp. ● | | | 1,734 | |
| | 74 | | | Thermo Fisher Scientific, Inc. ● | | | 3,341 | |
| | 7 | | | Waters Corp. ● | | | 548 | |
| | | | | | | | 9,643 | |
| | | | | Managed Health Care - 14.3% | | | | |
| | 133 | | | Aetna, Inc. | | | 5,599 | |
| | 84 | | | CIGNA Corp. | | | 3,545 | |
| | 246 | | | UnitedHealth Group, Inc. | | | 12,442 | |
| | 44 | | | Wellcare Health Plans, Inc. ● | | | 2,300 | |
| | 41 | | | Wellpoint, Inc. | | | 2,684 | |
| | | | | | | | 26,570 | |
| | | | | Pharmaceuticals - 32.9% | | | | |
| | 10 | | | Alk-Abello A/S | | | 572 | |
| | 61 | | | Almirall S.A. | | | 416 | |
| | 27 | | | AstraZeneca plc ADR | | | 1,245 | |
| | 40 | | | Auxilium Pharmaceuticals, Inc. ● | | | 801 | |
| | 115 | | | Bristol-Myers Squibb Co. | | | 4,056 | |
| | 81 | | | Cadence Pharmaceuticals, Inc. ● | | | 321 | |
| | 176 | | | Daiichi Sankyo Co., Ltd. | | | 3,492 | |
| | 27 | | | Dr. Reddy's Laboratories Ltd. ADR | | | 780 | |
| | 93 | | | Eisai Co., Ltd. | | | 3,838 | |
| | 476 | | | Elan Corp. plc ADR ● | | | 6,542 | |
| | 33 | | | Eli Lilly & Co. | | | 1,359 | |
| | 170 | | | Forest Laboratories, Inc. ● | | | 5,141 | |
| | 13 | | | Hospira, Inc. ● | | | 380 | |
| | 141 | | | Medicines Co. ● | | | 2,636 | |
| | 168 | | | Merck & Co., Inc. | | | 6,322 | |
| | 108 | | | Mylan, Inc. ● | | | 2,322 | |
| | 10 | | | Ono Pharmaceutical Co., Ltd. | | | 555 | |
| | 72 | | | Optimer Pharmaceuticals, Inc. ● | | | 875 | |
| | 27 | | | Pacira Pharmaceuticals, Inc. ● | | | 233 | |
| | 195 | | | Pfizer, Inc. | | | 4,215 | |
| | 8 | | | Roche Holding AG | | | 1,371 | |
| | 6 | | | Salix Pharmaceuticals Ltd. ● | | | 286 | |
| | 264 | | | Shionogi & Co., Ltd. | | | 3,389 | |
| | 27 | | | Simcere Pharmaceutical Group ● | | | 252 | |
| | 118 | | | Teva Pharmaceutical Industries Ltd. ADR | | | 4,762 | |
| | 45 | | | UCB S.A. | | | 1,883 | |
| | 47 | | | Watson Pharmaceuticals, Inc. ● | | | 2,818 | |
| | 73 | | | Xenoport, Inc. ● | | | 280 | |
| | | | | | | | 61,142 | |
| | | | | Total common stocks | | | | |
| | | | | (cost $174,652) | | $ | 185,866 | |
| | | | | | | | | |
| | | | | Total long-term investments | | | | |
| | | | | (cost $174,652) | | $ | 185,866 | |
| | | | | | | | | |
| SHORT-TERM INVESTMENTS - 0.0% | | | | |
| | | | | Repurchase Agreements - 0.0% | | | | |
| | | | | Bank of America Merrill Lynch TriParty Joint | | | | |
| | | | | Repurchase Agreement (maturing on | | | | |
| | | | | 01/03/2012 in the amount of $32, | | | | |
| | | | | collateralized by GNMA 4.50%, 2041, | | | | |
| | | | | value of $33) | | | | |
| $ | 32 | | | 0.04%, 12/30/2011 | | $ | 32 | |
The accompanying notes are an integral part of these financial statements.
| Hartford Healthcare HLS Fund (formerly Hartford Global Health HLS Fund) |
| Schedule of Investments – (continued) |
| December 31, 2011 |
| (000’s Omitted) |
| Shares or Principal Amount | | | | Market Value ╪ | |
| SHORT-TERM INVESTMENTS - 0.0% - (continued) |
| | | | | Repurchase Agreements - 0.0% - (continued) | | | | | | |
| | | | | Barclays Capital TriParty Joint Repurchase | | | | | | |
| | | | | Agreement (maturing on 01/03/2012 in the | | | | | | |
| | | | | amount of $3, collateralized by U.S. | | | | | | |
| | | | | Treasury Bond 5.38%, 2031, value of $3) | | | | | | |
| $ | 3 | | | 0.01%, 12/30/2011 | | | | $ | 3 | |
| | | | | Deutsche Bank Securities TriParty Joint | | | | | | |
| | | | | Repurchase Agreement (maturing on | | | | | | |
| | | | | 01/03/2012 in the amount of $36, | | | | | | |
| | | | | collateralized by GNMA 3.50% - 7.00%, | | | | | | |
| | | | | 2035 - 2046, value of $37) | | | | | | |
| | 36 | | | 0.06%, 12/30/2011 | | | | | 36 | |
| | | | | UBS Securities, Inc. Joint Repurchase | | | | | | |
| | | | | Agreement (maturing on 01/03/2012 in the | | | | | | |
| | | | | amount of $-, collateralized by U.S. | | | | | | |
| | | | | Treasury Note 2.75%, 2016, value of $-) | | | | | | |
| | — | | | 0.01%, 12/30/2011 | | | | | — | |
| | | | | UBS Securities, Inc. TriParty Joint Repurchase | | | | | | |
| | | | | Agreement (maturing on 01/03/2012 in the | | | | | | |
| | | | | amount of $14, collateralized by FNMA | | | | | | |
| | | | | 3.00% - 6.50%, 2021 - 2041, value of $14) | | | | | | |
| | 14 | | | 0.04%, 12/30/2011 | | | | | 14 | |
| | | | | | | | | | 85 | |
| | | | | Total short-term investments | | | | | | |
| | | | | (cost $85) | | | | $ | 85 | |
| | | | | | | | | | | |
| | | | | Total investments | | | | | | |
| | | | | (cost $174,737) ▲ | 100.0 | % | | $ | 185,951 | |
| | | | | Other assets and liabilities | – | % | | | 70 | |
| | | | | Total net assets | 100.0 | % | | $ | 186,021 | |
| Note: | Percentage of investments as shown is the ratio of the total market value to total net assets. Market value of long-term investments in foreign securities represents 19.0% of total net assets at December 31, 2011. |
| | |
| | Prices of foreign equities that are principally traded on certain foreign markets may be adjusted daily pursuant to a fair value pricing service approved by the Board of Directors in order to reflect an adjustment for factors occurring after the close of certain foreign markets but before the close of the New York Stock Exchange. |
| ▲ | At December 31, 2011, the cost of securities for federal income tax purposes was $176,127 and the aggregate gross unrealized appreciation and depreciation based on that cost were: |
| Unrealized Appreciation | | $ | 28,226 | |
| Unrealized Depreciation | | | (18,402 | ) |
| Net Unrealized Appreciation | | $ | 9,824 | |
| Foreign Currency Contracts Outstanding at December 31, 2011 |
| | Description | | Counterparty | | | Buy / Sell | | | Market Value ╪ | | | Contract
Amount | | | Delivery Date | | | Unrealized
Appreciation/
(Depreciation) | |
| | Japanese Yen | | | JP Morgan Securities | | | | Sell | | | $ | 6,368 | | | $ | 6,352 | | | | 02/02/2012 | | | $ | (16 | ) |
╪ | See Significant Accounting Policies of accompanying Notes to Financial Statements regarding valuation of securities. |
The accompanying notes are an integral part of these financial statements.
| Hartford Healthcare HLS Fund (formerly Hartford Global Health HLS Fund) |
| Investment Valuation Hierarchy Level Summary |
| December 31, 2011 |
| (000’s Omitted) |
| | | Total | | | Level 1 ♦ | | | Level 2 ♦ | | | Level 3 | |
| Assets: | | | | | | | | | | | | | | | | |
| Common Stocks ‡ | | $ | 185,866 | | | $ | 169,268 | | | $ | 16,598 | | | $ | — | |
| Short-Term Investments | | | 85 | | | | — | | | | 85 | | | | — | |
| Total | | $ | 185,951 | | | $ | 169,268 | | | $ | 16,683 | | | $ | — | |
| Liabilities: | | | | | | | | | | | | | | | | |
| Foreign Currency Contracts * | | | 16 | | | | — | | | | 16 | | | | — | |
| Total | | $ | 16 | | | $ | — | | | $ | 16 | | | $ | — | |
| ♦ | For the year ended December 31, 2011, there were no significant transfers between Level 1 and Level 2. |
| ‡ | The Fund has all or primarily all of the equity securities categorized in a particular level. Refer to the Schedule of Investments for further industry breakout. |
| * | Derivative instruments not reflected in the Schedule of Investments are valued at the unrealized appreciation/depreciation on the investments. |
The accompanying notes are an integral part of these financial statements.
| Hartford Healthcare HLS Fund (formerly Hartford Global Health HLS Fund) |
| Statement of Assets and Liabilities |
| December 31, 2011 |
| (000’s Omitted) |
| Assets: | | | | |
| Investments in securities, at market value (cost $174,737) | | $ | 185,951 | |
| Cash | | | — | |
| Receivables: | | | | |
| Investment securities sold | | | 574 | |
| Fund shares sold | | | 72 | |
| Dividends and interest | | | 161 | |
| Total assets | | | 186,758 | |
| Liabilities: | | | | |
| Unrealized depreciation on foreign currency contracts | | | 16 | |
| Payables: | | | | |
| Investment securities purchased | | | 341 | |
| Fund shares redeemed | | | 321 | |
| Investment management fees | | | 35 | |
| Distribution fees | | | 3 | |
| Accrued expenses | | | 21 | |
| Total liabilities | | | 737 | |
| Net assets | | $ | 186,021 | |
| Summary of Net Assets: | | | | |
| Capital stock and paid-in-capital | | $ | 182,669 | |
| Undistributed net investment income | | | 578 | |
| Accumulated net realized loss | | | (8,426 | ) |
| Unrealized appreciation of investments and the translations of assets and liabilities denominated in foreign currency | | | 11,200 | |
| Net assets | | $ | 186,021 | |
| Shares authorized | | | 800,000 | |
| Par value | | $ | 0.001 | |
| Class IA: Net asset value per share | | $ | 15.07 | |
| Shares outstanding | | | 9,097 | |
| Net assets | | $ | 137,088 | |
| Class IB: Net asset value per share | | $ | 14.74 | |
| Shares outstanding | | | 3,320 | |
| Net assets | | $ | 48,933 | |
The accompanying notes are an integral part of these financial statements.
| Hartford Healthcare HLS Fund (formerly Hartford Global Health HLS Fund) |
| Statement of Operations |
| For the Year Ended December 31, 2011 |
| (000’s Omitted) |
| Investment Income: | | | | |
| Dividends | | $ | 2,506 | |
| Interest | | | 1 | |
| Less: Foreign tax withheld | | | (65 | ) |
| Total investment income, net | | | 2,442 | |
| | | | | |
| Expenses: | | | | |
| Investment management fees | | | 1,677 | |
| Transfer agent fees | | | 5 | |
| Distribution fees - Class IB | | | 136 | |
| Custodian fees | | | 9 | |
| Accounting services fees | | | 20 | |
| Board of Directors' fees | | | 4 | |
| Audit fees | | | 10 | |
| Other expenses | | | 68 | |
| Total expenses (before fees paid indirectly) | | | 1,929 | |
| Commission recapture | | | (3 | ) |
| Total fees paid indirectly | | | (3 | ) |
| Total expenses, net | | | 1,926 | |
| Net investment income | | | 516 | |
| | | | | |
| Net Realized Gain on Investments and Foreign Currency Transactions: | | | | |
| Net realized gain on investments | | | 21,172 | |
| Net realized loss on foreign currency contracts | | | (927 | ) |
| Net realized gain on other foreign currency transactions | | | 11 | |
| Net Realized Gain on Investments and Foreign Currency Transactions | | | 20,256 | |
| | | | | |
| Net Changes in Unrealized Depreciation of Investments and Foreign Currency Transactions: | | | | |
| Net unrealized depreciation of investments | | | (6,290 | ) |
| Net unrealized appreciation of foreign currency contracts | | | 654 | |
| Net unrealized appreciation on translation of other assets and liabilities in foreign currencies | | | — | |
| Net Changes in Unrealized Depreciation of Investments and Foreign Currency Transactions | | | (5,636 | ) |
| Net Gain on Investments and Foreign Currency Transactions | | | 14,620 | |
| Net Increase in Net Assets Resulting from Operations | | $ | 15,136 | |
The accompanying notes are an integral part of these financial statements.
| Hartford Healthcare HLS Fund (formerly Hartford Global Health HLS Fund) |
| Statement of Changes in Net Assets |
| |
| (000’s Omitted) |
| | | For the
Year Ended
December 31,
2011 | | | For the
Year Ended
December 31,
2010 | |
| Operations: | | | | | | | | |
| Net investment income | | $ | 516 | | | $ | 958 | |
| Net realized gain on investments and foreign currency transactions | | | 20,256 | | | | 6,222 | |
| Net unrealized appreciation (depreciation) of investments | | | (5,636 | ) | | | 5,944 | |
| Net Increase In Net Assets Resulting From Operations | | | 15,136 | | | | 13,124 | |
| Distributions to Shareholders: | | | | | | | | |
| From net investment income | | | | | | | | |
| Class IA | | | (68 | ) | | | (235 | ) |
| Class IB | | | — | | | | (15 | ) |
| Total distributions | | | (68 | ) | | | (250 | ) |
| Capital Share Transactions: | | | | | | | | |
| Class IA | | | | | | | | |
| Sold | | | 30,285 | | | | 15,131 | |
| Issued on reinvestment of distributions | | | 68 | | | | 235 | |
| Redeemed | | | (41,445 | ) | | | (41,364 | ) |
| Total capital share transactions | | | (11,092 | ) | | | (25,998 | ) |
| Class IB | | | | | | | | |
| Sold | | | 11,253 | | | | 7,720 | |
| Issued on reinvestment of distributions | | | — | | | | 15 | |
| Redeemed | | | (21,415 | ) | | | (19,685 | ) |
| Total capital share transactions | | | (10,162 | ) | | | (11,950 | ) |
| Net decrease from capital share transactions | | | (21,254 | ) | | | (37,948 | ) |
| Net Decrease In Net Assets | | | (6,186 | ) | | | (25,074 | ) |
| Net Assets: | | | | | | | | |
| Beginning of period | | | 192,207 | | | | 217,281 | |
| End of period | | $ | 186,021 | | | $ | 192,207 | |
| Undistributed (distribution in excess of) net investment income | | $ | 578 | | | $ | 737 | |
| Shares: | | | | | | | | |
| Class IA | | | | | | | | |
| Sold | | | 1,950 | | | | 1,133 | |
| Issued on reinvestment of distributions | | | 5 | | | | 17 | |
| Redeemed | | | (2,753 | ) | | | (3,124 | ) |
| Total share activity | | | (798 | ) | | | (1,974 | ) |
| Class IB | | | | | | | | |
| Sold | | | 747 | | | | 593 | |
| Issued on reinvestment of distributions | | | — | | | | 1 | |
| Redeemed | | | (1,449 | ) | | | (1,520 | ) |
| Total share activity | | | (702 | ) | | | (926 | ) |
The accompanying notes are an integral part of these financial statements.
| Hartford Healthcare HLS Fund (formerly Hartford Global Health HLS Fund) |
| Notes to Financial Statements |
| December 31, 2011 |
| (000’s Omitted) |
Hartford Healthcare HLS Fund (the “Fund”) serves as an underlying investment option for certain variable annuity and variable life insurance separate accounts of Hartford Life Insurance Company (“HLIC”) and its affiliates and certain qualified retirement plans. The Fund may also serve as an underlying investment option for certain variable annuity and variable life separate accounts of other insurance companies. Owners of variable annuity contracts and policyholders of variable life insurance contracts may choose the funds permitted in the variable insurance contract prospectus. In addition, participants in certain qualified retirement plans may choose the Fund if permitted by their plans.
Hartford Series Fund, Inc. (the “Company”) is an open-end registered management investment company comprised of thirty portfolios. Financial Statements for the Fund, a series of the Company, are included in this report.
The Company is organized under the laws of the State of Maryland and is registered with the Securities and Exchange Commission (“SEC”) under the Investment Company Act of 1940, as amended (“1940 Act”). The Fund is a diversified open-end management investment company.
The Fund is divided into Class IA and Class IB shares. Each class is offered at the per share net asset value (“NAV”) without a sales charge and is subject to the same expenses, except that the Class IB shares are subject to distribution and service fees charged pursuant to a Distribution Plan adopted in accordance with Rule 12b-1 under the 1940 Act.
| 2. | Significant Accounting Policies: |
The following is a summary of significant accounting policies of the Fund in the preparation of its financial statements, which are in accordance with the United States Generally Accepted Accounting Principles (“U.S. GAAP”). The preparation of financial statements in accordance with U.S. GAAP may require management to make estimates and assumptions that affect the reported amounts of assets and liabilities and disclosure of contingent assets and liabilities at the date of the financial statements and the reported amounts of increases and decreases in net assets from operations during the reporting period. Actual results could differ from those estimates.
| a) | Determination of Net Asset Value – The NAV of each class of the Fund’s shares is determined as of the close of regular trading (normally 4:00 p.m. Eastern Time) (the “NYSE Close”) on each day that the New York Stock Exchange (the “Exchange”) is open (“Valuation Date”). Information that becomes known to the Fund after the NAV has been calculated on a particular day will not generally be used to retroactively adjust the NAV determined earlier that day. |
| b) | Investment Valuation and Fair Value Measurements – For purposes of calculating the NAV, portfolio securities and other assets held by the Fund's portfolio for which market quotes are readily available are valued at market value. Market value is generally determined on the basis of last reported sales prices or official close price. If no sales are reported, market value is based on quotes obtained from a quotation reporting system, established market makers, or independent pricing services. If market prices are not readily available or are deemed unreliable, the Fund will use the fair value of the security as determined in good faith under policies and procedures established by and under the supervision of the Company’s Board of Directors. Market quotes are considered not readily available where there is an absence of current or reliable market-based data (e.g., trade information or broker quotes), including where events occur after the close of the relevant market, but prior to the NYSE Close that materially affect the values of the Fund’s portfolio securities or assets. In addition, market quotes are considered not readily available when, due to extraordinary circumstances, the exchanges or markets on which the securities trade do not open for trading for the entire day and no other market prices are available. In addition, prices of foreign equities that are principally traded on certain foreign markets are adjusted daily pursuant to a fair value pricing service approved by the Board of Directors in order to reflect an adjustment for the factors occurring after the close of certain foreign markets but before the NYSE Close. Securities that are primarily traded on foreign markets may trade on days that are not business days of the Fund. The value of the foreign securities in which the Fund invests may change on days when a shareholder will not be able to purchase or redeem shares of the Fund. Fair value pricing is subjective in nature and the use of fair value pricing by the Fund may cause the NAV of its |
| Hartford Healthcare HLS Fund (formerly Hartford Global Health HLS Fund) |
| Notes to Financial Statements – (continued) |
| December 31, 2011 |
| (000’s Omitted) |
shares to differ significantly from the NAV that would have been calculated using market prices at the close of the exchange on which a portfolio security is primarily traded. There can be no assurance that the Fund could obtain the fair market value assigned to a security if the Fund were to sell the security at approximately the time at which the Fund determines its NAV.
Investments valued in currencies other than U.S. dollars are converted to U.S. dollars using exchange rates obtained from independent pricing services for calculation of the NAV. As a result, the NAV of the Fund’s shares may be affected by changes in the value of currencies in relation to the U.S. dollar. The value of securities traded in markets outside the United States or denominated in currencies other than the U.S. dollar may be affected significantly on a day that the NYSE is closed and the market value may change on days when an investor is not able to purchase, redeem or exchange shares of the Fund.
Foreign currency contracts represent agreements to exchange currencies on specific future dates at predetermined rates. Foreign currency contracts are valued using foreign currency exchange rates and forward rates as provided by an independent pricing service on the Valuation Date.
Financial instruments for which prices are not available from an independent pricing service may be valued using market quotations obtained from one or more dealers that make markets in the respective financial instrument in accordance with procedures established by the Company’s Board of Directors.
U.S. GAAP defines fair value as the price that the Fund would receive to sell an asset or pay to transfer a liability in an orderly transaction between market participants. The U.S. GAAP fair value measurement standards require disclosure of a fair value hierarchy for each major category of assets and liabilities. Various inputs are used in determining the fair value of the Fund’s investments. These inputs are summarized into three broad hierarchy levels. This hierarchy is based on whether the valuation inputs are observable or unobservable. These levels are:
| · | Level 1 – Quoted prices in active markets for identical securities. Level 1 may include exchange traded instruments, such as domestic equities, some foreign equities, options, futures, mutual funds, exchange traded funds, rights and warrants. |
| · | Level 2 – Observable inputs other than Level 1 prices, such as quoted prices for similar securities; quoted prices in markets that are not active; or other inputs that are observable or can be corroborated by observable market data. Level 2 may include debt securities that are traded less frequently than exchange traded instruments and which are valued using independent pricing services; foreign equities, that are principally traded on certain foreign markets and are adjusted daily pursuant to a fair value pricing service in order to reflect an adjustment for the factors occurring after the close of certain foreign markets but before the NYSE Close; and short-term securities, which are valued at amortized cost. |
| · | Level 3 – Significant unobservable inputs that are supported by limited or no market activity. Level 3 may include financial instruments whose values are determined using broker quotes or require significant management judgment or estimation. These unobservable valuation inputs may include estimates for current yields, maturity/duration, prepayment speed, and broker quotes for comparable securities along with other assumptions relating to credit quality, collateral value, complexity of the security structure, general market conditions and liquidity. This category may include securities where trading has been halted or there are certain restrictions on trading. While these securities are priced using unobservable inputs, the valuation of these securities reflects the best available data and management believes the prices are a reasonable representation of exit price. |
Valuation levels are not necessarily indicative of the risk associated with investing in such securities. Individual securities within any of the above mentioned asset classes may be assigned a different hierarchical level than those presented above, as individual circumstances dictate.
During the year ended December 31, 2011, the Fund held no Level 3 securities; therefore, no reconciliation of Level 3 securities is presented.
For additional information, refer to the Investment Valuation Hierarchy Level Summary which follows the Schedule of Investments.
For purposes of reporting transfers between different hierarchy levels, both transfers in and out of each level, as applicable, are shown as if they occurred at the beginning of the period.
| c) | Security Transactions and Investment Income – Security transactions are recorded as of the trade date (the date the order to buy or sell is executed) for financial reporting purposes. Securities purchased or sold on a when-issued or delayed-delivery basis may be settled a month or more after the trade date. Realized gains and losses are determined on the basis of identified cost. |
Dividend income is accrued as of the ex-dividend date, except certain dividends from foreign securities where the ex-dividend date may have passed are recorded as soon as the Fund is informed of the dividend. Interest income, including amortization of premium and accretion of discounts, is accrued on a daily basis.
| d) | Foreign Currency Transactions – Assets and liabilities denominated in currencies other than U.S. dollars are translated into U.S. dollars at the exchange rates in effect on the valuation date. Purchases and sales of investment securities, income, and expenses are translated into U.S. dollars at the exchange rates on the dates of such transactions. |
The Fund does not isolate that portion of portfolio security valuation resulting from fluctuations in the foreign currency exchange rates from the fluctuations arising from changes in the market prices of securities held. Exchange rate fluctuations are included with the net realized and unrealized gain or loss on investments in the accompanying financial statements.
Net realized foreign exchange gains or losses arise from sales of foreign currencies and the difference between asset and liability amounts initially stated in foreign currencies and the U.S. dollar value of the amounts actually received or paid. Net unrealized foreign exchange gains or losses arise from changes in the value of other assets and liabilities at the end of the reporting period, resulting from changes in the exchange rates.
| e) | Joint Trading Account – The Fund may invest cash balances into a joint trading account that may be invested in one or more repurchase agreements. |
| f) | Fund Share Valuation and Dividend Distributions to Shareholders – Orders for the Fund’s shares are executed in accordance with the investment instructions of the contract holders and plan participants. The NAV of the Fund’s shares is determined as of the close of business on each business day of the Exchange. The NAV is determined separately for each class of shares of the Fund by dividing the Fund’s net assets attributable to that class by the number of shares of the class outstanding. Each class of shares offered by the Fund has equal rights as to assets and voting privileges (except that shareholders of a class have exclusive voting rights regarding any matter relating solely to that class of shares). Income and non-class specific expenses are allocated daily to each class on the basis of the relative net assets of the class. Realized and unrealized capital gains and losses are allocated daily based on the relative net assets of each class of shares of the Fund. |
Orders for the purchase of the Fund’s shares received prior to the close of the Exchange on any day the Exchange is open for business are priced at the NAV determined as of the close of the Exchange. Orders received after the close of the Exchange, or on a day on which the Exchange and/or the Fund is not open for business, are priced at the next determined NAV.
| Hartford Healthcare HLS Fund (formerly Hartford Global Health HLS Fund) |
| Notes to Financial Statements – (continued) |
| December 31, 2011 |
| (000’s Omitted) |
Dividends are declared pursuant to a policy adopted by the Company’s Board of Directors based upon the investment performance of the Fund. The policy of the Fund is to pay dividends from net investment income and realized capital gains, if any, at least once a year.
Distributions from net investment income, net realized capital gains and capital are determined in accordance with federal income tax regulations, which may differ from U.S. GAAP with respect to character and timing. These differences may include but are not limited to losses deferred due to wash sale adjustments, foreign currency gains and losses, adjustments related to Passive Foreign Investment Companies (“PFICs”), Real Estate Investment Trusts (“REITs”), Regulated Investment Companies (“RICs”), certain derivatives and partnerships. Permanent book and federal income tax basis differences relating to shareholder distributions will result in reclassifications to certain of the Fund’s capital accounts (see Federal Income Taxes: Reclassification of Capital Accounts note).
| 3. | Securities and Other Investments: |
| a) | Repurchase Agreements – A repurchase agreement is an agreement by which a counterparty agrees to sell a security and agrees to repurchase the security sold at a mutually agreed upon time and price. At the time the Fund enters into a repurchase agreement, the value of the underlying collateral security(ies), including accrued interest, will be equal to or exceed the value of the repurchase agreement. Repurchase agreements expose the Fund to counterparty risk. To minimize counterparty risk, the securities that serve to collateralize the repurchase agreement are held by the Fund's custodian in book entry or physical form in the custodial account of the Fund or in a third party custodial account. Repurchase agreements are valued at cost plus accrued interest. The Fund, as shown on the Schedule of Investments, had outstanding repurchase agreements as of December 31, 2011. |
| b) | Illiquid and Restricted Securities – The Fund is permitted to invest up to 15% of its net assets in illiquid securities. Illiquid securities are those that may not be sold or disposed of in the ordinary course of business within seven days, at approximately the price used to determine the Fund’s NAV. The Fund may not be able to sell illiquid securities or other investments when its sub-adviser considers it desirable to do so or may have to sell such securities or investments at a price that is lower than the price that could be obtained if the securities or investments were more liquid. A sale of illiquid securities or other investments may require more time and may result in higher dealer discounts and other selling expenses than does the sale of those that are liquid. Illiquid securities and investments also may be more difficult to value due to the unavailability of reliable market quotations for such securities or investments, and an investment in them may have an adverse impact on the Fund’s NAV. The Fund may also purchase certain restricted securities that can only be resold to certain qualified investors and may be determined to be liquid pursuant to policies and guidelines established by the Company’s Board of Directors. The Fund had no illiquid or restricted securities as of December 31, 2011. |
| c) | Securities Purchased on a When-Issued or Delayed-Delivery Basis – Delivery and payment for securities that have been purchased by the Fund on a forward commitment, or when-issued or delayed-delivery basis, take place beyond the customary settlement period. A fund may dispose of or renegotiate a delayed-delivery transaction after it is entered into, and may sell delayed-delivery securities before they are delivered, which may result in a realized gain or loss. During this period, such securities are subject to market fluctuations, and the Fund identifies securities segregated in its records with value at least equal to the amount of the commitment. As of December 31, 2011, the Fund had no outstanding when-issued or delayed delivery securities. |
| 4. | Financial Derivative Instruments: |
The following disclosures contain information on how and why the Fund uses derivative instruments, the credit-risk-related contingent features in certain derivative instruments, and how derivative instruments affect the Fund’s financial position and results of operations. The location and fair value amounts of these instruments on the Statement of Assets and Liabilities and the realized gains and losses and changes in unrealized gains and losses on the Statement of Operations, each categorized by type of derivative contract, are included in the following Additional Derivative Instrument Information footnote. The derivative instruments outstanding as of period-end are disclosed in the notes to
the Schedule of Investments and the amounts of realized gains and losses and changes in unrealized gains and losses on derivative instruments during the period are disclosed in the Statement of Operations.
| a) | Foreign Currency Contracts – The Fund may enter into foreign currency contracts that obligate the Fund to purchase or sell currencies at specified future dates. Foreign currency contracts are used to hedge the currency exposure associated with some or all of the Fund's securities and/or as part of an investment strategy. Foreign currency contracts are marked to market daily and the change in value is recorded by the Fund as an unrealized gain or loss. The Fund will record a realized gain or loss when the foreign currency contract is settled. |
Foreign currency contracts involve elements of market risk in excess of the amounts reflected in the Statement of Assets and Liabilities. In addition, risks may arise upon entering into these contracts from the potential inability of the counterparties to meet the terms of the contracts and from unanticipated movements in the value of the foreign currencies relative to the U.S. dollar. The Fund had outstanding foreign currency contracts as shown on the Schedule of Investments as of December 31, 2011.
| b) | Additional Derivative Instrument Information: |
Fair Values of Derivative Instruments on the Statement of Assets and Liabilities as of December 31, 2011:
| | | Risk Exposure Category | |
| | | Interest Rate
Contracts | | | Foreign
Exchange
Contracts | | | Credit
Contracts | | | Equity
Contracts | | | Commodity
Contracts | | | Other
Contracts | | | Total | |
| | | | | | | | | | | | | | | | | | | | | | |
| Liabilities: | | | | | | | | | | | | | | | | | | | | | | | | | | | | |
| Unrealized depreciation on foreign currency contracts | | $ | — | | | $ | 16 | | | $ | — | | | $ | — | | | $ | — | | | $ | — | | | $ | 16 | |
| Total | | $ | — | | | $ | 16 | | | $ | — | | | $ | — | | | $ | — | | | $ | — | | | $ | 16 | |
The volume of derivatives that is presented in the Schedule of Investments is consistent with the derivative activity during the year ended December 31, 2011.
The Effect of Derivative Instruments on the Statement of Operations for the year ended December 31, 2011:
| | | Risk Exposure Category | |
| | | Interest Rate
Contracts | | | Foreign
Exchange
Contracts | | | Credit
Contracts | | | Equity
Contracts | | | Commodity
Contracts | | | Other
Contracts | | | Total | |
| Realized Gain (Loss) on Derivatives Recognized as a Result of Operations: |
| Net realized loss on foreign currency contracts | | $ | — | | | $ | (927 | ) | | $ | — | | | $ | — | | | $ | — | | | $ | — | | | $ | (927 | ) |
| Total | | $ | — | | | $ | (927 | ) | | $ | — | | | $ | — | | | $ | — | | | $ | — | | | $ | (927 | ) |
| | | | | | | | | | | | | | | | | | | | | | | | | | | | | |
| Net Change in Unrealized Appreciation (Depreciation) on Derivatives Recognized as a Result of Operations: |
| Net change in unrealized appreciation of foreign currency contracts | | $ | — | | | $ | 654 | | | $ | — | | | $ | — | | | $ | — | | | $ | — | | | $ | 654 | |
| Total | | $ | — | | | $ | 654 | | | $ | — | | | $ | — | | | $ | — | | | $ | — | | | $ | 654 | |
| a) | Counterparty Risk – The Fund may be exposed to counterparty risk, or the risk that an institution or other entity with which the Fund has unsettled or open transactions will default. |
| Hartford Healthcare HLS Fund (formerly Hartford Global Health HLS Fund) |
| Notes to Financial Statements – (continued) |
| December 31, 2011 |
| (000’s Omitted) |
| b) | Market Risks – If the Fund invests directly in foreign currencies or in securities that trade in, and receive revenues in, foreign currencies, or in derivatives that provide exposure to foreign currencies, it will be subject to the risk that those currencies will decline in value relative to the base currency of the Fund, or, in the case of hedging positions, that the Fund’s base currency will decline in value relative to the currency being hedged. Currency rates in foreign countries may fluctuate significantly over short periods of time for a number of reasons, including changes in interest rates, intervention (or the failure to intervene) by U.S. or foreign governments, central banks or supranational entities, such as the International Monetary Fund, or by the imposition of currency controls or other political developments in the United States or abroad. As a result, the Fund’s investments in foreign currency denominated securities may reduce the returns of the Fund. The market values of equity securities, such as common stocks and preferred stocks, or equity related investments, such as futures and options, may decline due to general market conditions which are not specifically related to a particular company, such as real or perceived adverse economic conditions, changes in the general outlook for corporate earnings, changes in interest or currency rates or adverse investor sentiment generally. The market value of equity securities may also decline due to factors which affect a particular industry or industries, such as labor shortages or increased production costs and competitive conditions within an industry. Equity securities and equity related investments generally have greater market price volatility than fixed income securities. |
| a) | Federal Income Taxes – For federal income tax purposes, the Fund intends to continue to qualify as a RIC under Subchapter M of the Internal Revenue Code (“IRC”) by distributing substantially all of its taxable net investment income and net realized capital gains to its shareholders and otherwise complying with the requirements of RICs. The Fund has distributed substantially all of its income and capital gains in prior years, if applicable, and intends to distribute substantially all of its income and capital gains prior to the next fiscal year-end. Accordingly, no provision for federal income or excise taxes has been made in the accompanying financial statements. Distributions from short-term capital gains are treated as ordinary income distributions for federal income tax purposes. |
| b) | Net Investment Income (Loss), Net Realized Gains (Losses) – Net investment income (loss) and net realized gains (losses) may differ for financial statement and tax purposes primarily because of losses deferred due to wash sale adjustments, foreign currency gains and losses, adjustments related to PFICs, REITs, RICs, certain derivatives and partnerships. The character of distributions made during the year from net investment income or net realized gains may differ from their ultimate characterization for federal income tax purposes. Also, due to the timing of dividend distributions, the fiscal year in which amounts are distributed may differ from the year that the income or realized gains (losses) were recorded by the Fund. |
| c) | Distributions and Components of Distributable Earnings – The tax character of distributions paid by the Fund for the periods indicated is as follows (as adjusted for dividends payable): |
| | | For the Year Ended
December 31, 2011 | | | For the Year Ended
December 31, 2010 | |
| Ordinary Income | | $ | 68 | | | $ | 250 | |
As of December 31, 2011, the Fund’s components of distributable earnings (deficit) on a tax basis were as follows:
| | | Amount | |
| Undistributed Ordinary Income | | $ | 650 | |
| Accumulated Capital and Other Losses* | | | (7,124 | ) |
| Unrealized Appreciation† | | | 9,826 | |
| Total Accumulated Earnings | | $ | 3,352 | |
| | * | The Fund has capital loss carryforwards that are identified in the Capital Loss Carryforward note that follows. |
| | † | The difference between book-basis and tax-basis unrealized appreciation (depreciation) may be attributable to the losses deferred due to wash sale adjustments, foreign currency gains and losses, adjustments related to PFICs, REITs, RICs, certain derivatives and partnerships. |
| d) | Reclassification of Capital Accounts – The Fund may record reclassifications in its capital accounts. These reclassifications have no impact on the total net assets of the Fund. The reclassifications are a result of permanent differences between U.S. GAAP and tax accounting for such items as foreign currency, PFICs, expiration or utilization of capital loss carryforwards or net operating losses. Adjustments are made to reflect the impact these items have on current and future distributions to shareholders. Therefore, the source of the Fund’s distributions may be shown in the accompanying Statement of Changes in Net Assets as from undistributed net investment income, from accumulated net realized gains on investments or from capital depending on the type of book and tax differences that exist. For the year ended December 31, 2011, the Fund recorded reclassifications to increase (decrease) the accounts listed below: |
| | | Amount | |
| Undistributed Net Investment Income | | $ | (607 | ) |
| Accumulated Net Realized Gain (Loss) | | | 607 | |
| e) | Capital Loss Carryforward – On December 22, 2010, the Regulated Investment Company Modernization Act of 2010 (the “Act”) was enacted, which made changes to the capital loss carryforward rules. The changes are effective for taxable years beginning after the date of enactment. Under the Act, funds are permitted to carry forward capital losses for an unlimited period. However, any losses incurred during those future taxable years will be required to be utilized prior to the losses incurred in pre-enactment taxable years, which carry an expiration date. As a result of this ordering rule, pre-enactment capital loss carryforwards may be more likely to expire unused. Additionally, post-enactment capital loss carryforwards will retain their character as either short-term or long-term capital losses rather than being considered all short-term as permitted under prior regulation. |
At December 31, 2011 (tax-year-end), the Fund had capital loss carryforwards for U.S. federal income tax purposes of approximately:
| Year of Expiration | | Amount | |
| 2017 | | $ | 7,124 | |
| Total | | $ | 7,124 | |
As of December 31, 2011, the Fund utilized $17,252 of prior year capital loss carryforwards.
| f) | Accounting for Uncertainty in Income Taxes – The Fund has adopted financial reporting rules that require the Fund to analyze all open tax years, as defined by the statute of limitations, for all major jurisdictions. Generally, tax authorities can examine all tax returns filed for the last three years. The Fund does not have an examination in progress. |
| Hartford Healthcare HLS Fund (formerly Hartford Global Health HLS Fund) |
| Notes to Financial Statements – (continued) |
| December 31, 2011 |
| (000’s Omitted) |
The Fund has reviewed all open tax years and major jurisdictions and concluded that these financial reporting rules had no effect on the Fund’s financial position or results of operations. There is no tax liability resulting from unrecognized tax benefits relating to uncertain income tax positions taken or expected to be taken on the tax return for the fiscal year ended December 31, 2011. The Fund is also not aware of any tax positions for which it is reasonably possible that the total amounts of unrecognized tax benefits will significantly change in the next twelve months.
| a) | Investment Management Agreement – HL Investment Advisors, LLC (“HL Advisors”), an indirect wholly owned subsidiary of The Hartford Financial Services Group, Inc. (“The Hartford”), serves as investment manager to the Fund pursuant to an Investment Management Agreement with the Company. As investment manager, HL Advisors has overall investment supervisory responsibility for the Fund. In addition, HL Advisors provides administrative personnel, services, equipment, facilities and office space for proper operation of the Fund. HL Advisors has contracted with Wellington Management Company, LLP (“Wellington Management”) under a sub-advisory agreement for the provision of day-to-day investment management services to the Fund in accordance with the Fund’s investment objective and policies. The Fund pays a fee to HL Advisors, a portion of which may be used to compensate Wellington Management. |
The schedule below reflects the rates of compensation paid to HL Advisors for investment management services rendered as of December 31, 2011; the rates are accrued daily and paid monthly.
| Average Daily Net Assets | Annual Fee |
| On first $250 million | 0.8500% |
| On next $250 million | 0.8000% |
| On next $4.5 billion | 0.7500% |
| On next $5 billion | 0.7475% |
| Over $10 billion | 0.7450% |
| b) | Accounting Services Agreement – Pursuant to the Fund Accounting Agreement between HLIC and the Company, on behalf of the Fund, HLIC provides accounting services to the Fund and receives monthly compensation based on the Fund’s average daily net assets at the rates set forth below. The Fund’s accounting services fees are accrued daily and paid monthly. |
| Average Daily Net Assets | Annual Fee |
| All Assets | 0.010% |
| c) | Operating Expenses – Allocable expenses incurred by the Company are allocated to each Fund and allocated to classes within a Fund in proportion to the average daily net assets of the Fund and each class, except where allocation of certain expenses is more fairly made directly to the Fund or to specific classes within a Fund. |
| d) | Fees Paid Indirectly – The Company, on behalf of the Fund, has entered into agreements with State Street Global Markets, LLC and Russell Implementation Services, Inc. to partially recapture non-discounted trade commissions. Such rebates are used to pay a portion of the Fund’s expenses. In addition, the Fund’s custodian bank has also agreed to reduce its fees when the Fund maintains cash on deposit in a non-interest-bearing custody account. For the year ended December 31, 2011, these amounts, if any, are included in the Statement of Operations. |
The ratio of expenses to average net assets in the accompanying financial highlights excludes the reduction in expenses related to fees paid indirectly. The annualized expense ratio for the period listed below reflecting the reduction for fees paid indirectly is as follows:
| | | Year Ended
December 31, 2011 | |
| Class IA | | | 0.91 | % |
| Class IB | | | 1.16 | |
| e) | Distribution Plan for Class IB shares – The Company, on behalf of the Fund, has adopted a Distribution Plan pursuant to Rule 12b-1 of the 1940 Act to compensate the Distributor, Hartford Securities Distribution Company, Inc. (a wholly owned, ultimate subsidiary of The Hartford), from assets attributable to the Class IB shares for services rendered and expenses borne in connection with activities primarily intended to result in the sale of the Class IB shares, subject to the review and approval of the Company’s Board of Directors. |
The Distribution Plan provides that the Fund may pay annually up to 0.25% of the average daily net assets of the Fund attributable to its Class IB shares for activities primarily intended to result in the sale of Class IB shares. The Board has the authority to suspend or reduce these payments at any point in time. Under the terms of the Distribution Plan and the principal underwriting agreement, the Fund is authorized to make payments monthly to the Distributor that may be used to pay or compensate entities providing distribution and shareholder servicing with respect to the Class IB shares for such entities’ fees or expenses incurred or paid in that regard. These fees are accrued daily and paid monthly.
| f) | Other Related Party Transactions – Certain officers of the Fund are directors and/or officers of HL Advisors and/or The Hartford or its subsidiaries. For the year ended December 31, 2011, a portion of the Fund’s chief compliance officer’s salary was paid by all the investment companies in the Hartford fund complex. The portion allocated to the Fund rounds to zero. Hartford Administrative Services Company (“HASCO”), an indirect wholly owned subsidiary of The Hartford, provides transfer agent services to the Fund. HASCO was compensated on a per account basis for providing such services. The amount paid to HASCO can be found in the Statement of Operations. These fees are accrued daily and paid monthly. |
| g) | Payment from Affiliate – In July of 2007, The Hartford entered into a settlement with the Attorneys General of the states of New York, Connecticut and Illinois relating to market timing and the company's individual variable annuity contracts in which certain payments would be made directly to the variable annuity contract holders. The distribution plan provided that unclaimed money from the settlement would be distributed to certain HLS Funds that are investment options through a Hartford individual variable annuity contract. The unclaimed money was distributed to the Fund on September 18, 2009. |
The total return in the accompanying financial highlights includes a payment from an affiliate. Had the payment from the affiliate been excluded, the impact and total return for the period listed below would have been as follows:
| | | For the Year Ended December 31, 2009 |
| | | Class IA | | Class IB |
| Impact from Payment from Affiliate for Attorneys General Settlement | | | 0.01% | | | | 0.01% | |
| Total Return Excluding Payment from Affiliate | | | 22.70 | | | | 22.39 | |
| Hartford Healthcare HLS Fund (formerly Hartford Global Health HLS Fund) |
| Notes to Financial Statements – (continued) |
| December 31, 2011 |
| (000’s Omitted) |
| 8. | Investment Transactions: |
For the year ended December 31, 2011, the Fund's aggregate purchases and sales of investment securities (excluding short-term investments) were as follows:
| | | Amount | |
| Cost of Purchases Excluding U.S. Government Obligations | | $ | 88,770 | |
| Sales Proceeds Excluding U.S. Government Obligations | | | 110,660 | |
The Fund is one of several Hartford funds that participate in a $500 million committed revolving line of credit facility. The facility is to be used for temporary or emergency purposes. Under the arrangement, the funds are required to own securities having a market value in excess of 300% of the total bank borrowings. The interest rate on borrowings varies depending on the nature of the loan. The facility also requires a fee to be paid based on the amount of the commitment. This commitment fee is allocated to all of the funds participating in the line of credit based on the average net assets of the funds. During the year ended December 31, 2011, the Fund did not have any borrowings under this facility.
| 10. | Industry Classifications: |
Other than the industry classifications “Other Investment Pools and Funds” and “Exchange Traded Funds,” equity industry classifications used in this report are the Global Industry Classification Standard, which was developed by and is the exclusive property and service mark of MSCI, Inc. and Standard & Poor’s.
Under the Company’s organizational documents, the Company shall indemnify its officers and directors to the full extent required or permitted under Maryland General Corporation Law and the federal securities laws. In addition, the Company, on behalf of the Fund, may enter into contracts that contain a variety of indemnifications. The Company’s maximum exposure under these arrangements is unknown. However, as of the date of these financial statements, the Company has not had prior claims or losses pursuant to these contracts and expects the risk of loss to be remote.
[This page is intentionally left blank]
| Hartford Healthcare HLS Fund (formerly Hartford Global Health HLS Fund) |
| Financial Highlights |
| – Selected Per-Share Data – (A) |
| | | Net Asset | | | | | | | | | Net Realized | | | | | | | | | | | | | | | | | | Net Increase | | | | |
| | | Value at | | | | | | | | | and Unrealized | | | Total from | | | Dividends from | | | Distributions | | | | | | | | | (Decrease) in | | | Net Asset | |
| | | Beginning of | | | Net Investment | | | Payments from | | | Gain (Loss) on | | | Investment | | | Net Investment | | | from Realized | | | Distributions | | | Total | | | Net Asset | | | Value at End of | |
| Class | | Period | | | Income (Loss) | | | (to) Affiliate | | | Investments | | | Operations | | | Income | | | Capital Gains | | | from Capital | | | Distributions | | | Value | | | Period | |
| | | | | | | | | | | | | | | | | | | | | | | | | | | | | | | | | | |
| For the Year Ended December 31, 2011 |
| IA | | $ | 13.89 | | | $ | 0.06 | | | $ | — | | | $ | 1.13 | | | $ | 1.19 | | | $ | (0.01 | ) | | $ | — | | | $ | — | | | $ | (0.01 | ) | | $ | 1.18 | | | $ | 15.07 | |
| IB | | | 13.61 | | | | 0.02 | | | | — | | | | 1.11 | | | | 1.13 | | | | — | | | | — | | | | — | | | | — | | | | 1.13 | | | | 14.74 | |
| | | | | | | | | | | | | | | | | | | | | | | | | | | | | | | | | | | | | | | | | | | | | |
| For the Year Ended December 31, 2010 |
| IA | | | 12.99 | | | | 0.08 | | | | — | | | | 0.84 | | | | 0.92 | | | | (0.02 | ) | | | — | | | | — | | | | (0.02 | ) | | | 0.90 | | | | 13.89 | |
| IB | | | 12.74 | | | | 0.04 | | | | — | | | | 0.83 | | | | 0.87 | | | | — | | | | — | | | | — | | | | — | | | | 0.87 | | | | 13.61 | |
| | | | | | | | | | | | | | | | | | | | | | | | | | | | | | | | | | | | | | | | | | | | | |
| For the Year Ended December 31, 2009 |
| IA | | | 10.66 | | | | 0.07 | | | | — | | | | 2.35 | | | | 2.42 | | | | (0.07 | ) | | | (0.02 | ) | | | — | | | | (0.09 | ) | | | 2.33 | | | | 12.99 | |
| IB | | | 10.46 | | | | 0.03 | | | | — | | | | 2.31 | | | | 2.34 | | | | (0.04 | ) | | | (0.02 | ) | | | — | | | | (0.06 | ) | | | 2.28 | | | | 12.74 | |
| | | | | | | | | | | | | | | | | | | | | | | | | | | | | | | | | | | | | | | | | | | | | |
| For the Year Ended December 31, 2008 |
| IA | | | 15.39 | | | | 0.06 | | | | — | | | | (3.99 | ) | | | (3.93 | ) | | | (0.06 | ) | | | (0.74 | ) | | | — | | | | (0.80 | ) | | | (4.73 | ) | | | 10.66 | |
| IB | | | 15.11 | | | | 0.02 | | | | — | | | | (3.91 | ) | | | (3.89 | ) | | | (0.02 | ) | | | (0.74 | ) | | | — | | | | (0.76 | ) | | | (4.65 | ) | | | 10.46 | |
| | | | | | | | | | | | | | | | | | | | | | | | | | | | | | | | | | | | | | | | | | | | | |
| For the Year Ended December 31, 2007 |
| IA | | | 16.84 | | | | 0.03 | | | | — | | | | 0.99 | | | | 1.02 | | | | (0.02 | ) | | | (2.45 | ) | | | — | | | | (2.47 | ) | | | (1.45 | ) | | | 15.39 | |
| IB | | | 16.59 | | | | (0.02 | ) | | | — | | | | 0.99 | | | | 0.97 | | | | — | | | | (2.45 | ) | | | — | | | | (2.45 | ) | | | (1.48 | ) | | | 15.11 | |
| (A) | Information presented relates to a share outstanding throughout the indicated period. |
| (B) | The figures do not include sales charges or other fees which may be applied at the variable life insurance, variable annuity or qualified retirement plan product level. Any such additional sales charges or other fees would lower the Fund's performance. |
| (C) | Ratios do not reflect reductions for fees paid indirectly. Please see Fees Paid Indirectly in the Notes to Financial Statements. |
| (D) | Portfolio turnover rate is calculated on the basis of the Fund as a whole without distinguishing between the classes of shares issued. |
| (E) | Total return without the inclusion of the Payment from (to) Affiliate can be found in Expenses in the accompanying Notes to Financial Statements. |
| – Ratios and Supplemental Data – |
| | | | | | | Ratio of Expenses to Average Net | | | Ratio of Expenses to Average Net | | | Ratio of Net Investment Income | | | Portfolio Turnover | |
| Total Return(B) | | | Net Assets at End of Period | | | Assets Before Waivers(C) | | | Assets After Waivers(C) | | | (Loss) to Average Net Assets | | | Rate(D) | |
| | | | | | | | | | | | | | | | | |
| | | | | | | | | | | | | | | | | |
| 8.54 | % | | $ | 137,088 | | | | 0.91 | % | | | 0.91 | % | | | 0.33 | % | | | 45 | % |
| 8.27 | | | | 48,933 | | | | 1.16 | | | | 1.16 | | | | 0.08 | | | | – | |
| | | | | | | | | | | | | | | | | | | | | | |
| | | | | | | | | | | | | | | | | | | | | | |
| 7.10 | | | | 137,454 | | | | 0.90 | | | | 0.90 | | | | 0.55 | | | | 32 | |
| 6.84 | | | | 54,753 | | | | 1.15 | | | | 1.15 | | | | 0.30 | | | | – | |
| | | | | | | | | | | | | | | | | | | | | | |
| | | | | | | | | | | | | | | | | | | | | | |
| 22.72 | (E) | | | 154,216 | | | | 0.91 | | | | 0.91 | | | | 0.51 | | | | 73 | |
| 22.41 | (E) | | | 63,065 | | | | 1.16 | | | | 1.16 | | | | 0.26 | | | | – | |
| | | | | | | | | | | | | | | | | | | | | | |
| | | | | | | | | | | | | | | | | | | | | | |
| (25.56 | ) | | | 179,087 | | | | 0.88 | | | | 0.88 | | | | 0.42 | | | | 57 | |
| (25.75 | ) | | | 62,080 | | | | 1.13 | | | | 1.13 | | | | 0.17 | | | | – | |
| | | | | | | | | | | | | | | | | | | | | | |
| | | | | | | | | | | | | | | | | | | | | | |
| 6.12 | | | | 289,561 | | | | 0.87 | | | | 0.87 | | | | 0.16 | | | | 39 | |
| 5.86 | | | | 105,898 | | | | 1.12 | | | | 1.12 | | | | (0.09 | ) | | | – | |
| Report of Independent Registered Public Accounting Firm |
| The Board of Directors and Shareholders of |
| Hartford Series Fund, Inc. |
We have audited the accompanying statement of assets and liabilities, including the schedule of investments, of Hartford Healthcare HLS Fund (one of the portfolios constituting Hartford Series Fund, Inc. (the Funds)) as of December 31, 2011, and the related statement of operations for the year then ended, the statements of changes in net assets for each of the two years in the period then ended, and the financial highlights for each of the five years in the period then ended. These financial statements and financial highlights are the responsibility of the Funds’ management. Our responsibility is to express an opinion on these financial statements and financial highlights based on our audits.
We conducted our audits in accordance with the standards of the Public Company Accounting Oversight Board (United States). Those standards require that we plan and perform the audit to obtain reasonable assurance about whether the financial statements and financial highlights are free of material misstatement. We were not engaged to perform an audit of the Funds’ internal control over financial reporting. Our audits included consideration of internal control over financial reporting as a basis for designing audit procedures that are appropriate in the circumstances, but not for the purpose of expressing an opinion on the effectiveness of the Funds’ internal control over financial reporting. Accordingly, we express no such opinion. An audit also includes examining, on a test basis, evidence supporting the amounts and disclosures in the financial statements and financial highlights, assessing the accounting principles used and significant estimates made by management, and evaluating the overall financial statement presentation. Our procedures included confirmation of securities owned as of December 31, 2011, by correspondence with the custodian and brokers or by other appropriate auditing procedures where replies from brokers were not received. We believe that our audits provide a reasonable basis for our opinion.
In our opinion, the financial statements and financial highlights referred to above present fairly, in all material respects, the financial position of Hartford Healthcare HLS Fund of Hartford Series Fund, Inc. at December 31, 2011, the results of its operations for the year then ended, the changes in its net assets for each of the two years in the period then ended, and the financial highlights for each of the five years in the period then ended, in conformity with U.S. generally accepted accounting principles.
Minneapolis, MN
February 13, 2012
| Hartford Healthcare HLS Fund (formerly Hartford Global Health HLS Fund) |
| Directors and Officers (Unaudited) |
The Board of Directors of the Company appoints officers who are responsible for the day-to-day operations of the Fund and who execute policies formulated by the Directors. Each director serves until his or her death, resignation, or retirement or until the next annual meeting of shareholders is held or until his or her successor is elected and qualifies.
Directors and officers who are employed by or who have a financial interest in The Hartford are considered “interested” persons of the Fund pursuant to the 1940 Act. Each officer and two of the Company’s directors, as noted in the chart below, are “interested” persons of the Fund. Each director serves as a director for The Hartford Mutual Funds, Inc., The Hartford Mutual Funds II, Inc., Hartford Series Fund, Inc., Hartford HLS Series Fund II, Inc., and as a trustee for The Hartford Alternative Strategies Fund, which, as of December 31, 2011, collectively consist of 91 funds. Correspondence may be sent to directors and officers c/o Hartford Mutual Funds, P.O. Box 2999, Hartford, Connecticut 06104-2999, except that correspondence to Ms. Fagely may be sent to 500 Bielenberg Drive, Woodbury, Minnesota 55125.
The table below sets forth, for each director and officer, his or her name, year of birth, current position with the Company and date first elected or appointed to Hartford Series Fund, Inc. (“HSF”), and Hartford HLS Series Fund II, Inc. (“HSF2”), principal occupation, and, for directors, other directorships held. The Fund’s statement of additional information contains further information on the directors and is available free of charge by calling 1-800-862-6668 or writing to Hartford HLS Funds, c/o Individual Annuity Services, P.O. Box 5085, Hartford, CT 06102-5085.
Information on the aggregate remuneration paid to the directors of the Company can be found in the Statement of Operations herein. The Fund pays to The Hartford a portion of the chief compliance officer’s compensation, but does not pay salaries or compensation to any of their other officers or directors who are employed by The Hartford.
Non-Interested Directors
Lynn S. Birdsong (1946) Director since 2003, Co-Chairman of the Investment Committee
Mr. Birdsong is a private investor. Mr. Birdsong currently serves as a Director of the Sovereign High Yield Investment Company (April 2010 to current). Mr. Birdsong currently serves as an Independent Director of Nomura Partners Funds, Inc. (formerly, The Japan Fund) (March 2003 to current). From 2003 to March 2005, Mr. Birdsong was an independent director of the Atlantic Whitehall Funds. From 1979 to 2002, Mr. Birdsong was a managing director of Zurich Scudder Investments, an investment management firm. During his employment with Scudder, Mr. Birdsong was an Interested Director of The Japan Fund. Since 1981, Mr. Birdsong has been a partner in Birdsong Company, an advertising specialty firm.
Robert M. Gavin, Jr. (1940) Director since 2002 (HSF) and 1986 (HSF2), Chairman of the Board since 2004
Dr. Gavin is an educational consultant. Prior to September 1, 2001, he was President of Cranbrook Education Community and prior to July 1996, he was President of Macalester College, St. Paul, Minnesota.
Duane E. Hill (1945) Director since 2001 (HSF) and 2002 (HSF2), Chairman of the Nominating Committee
Mr. Hill is Partner of TSG Ventures L.P., a private equity investment company. Mr. Hill is a former partner of TSG Capital Group, a private equity investment firm that served as sponsor and lead investor in leveraged buyouts of middle market companies.
Sandra S. Jaffee (1941) Director since 2005
Ms. Jaffee served as Chairman (2008 to 2009) and Chief Executive Officer of Fortent (formerly Searchspace Group), a leading provider of compliance/regulatory technology to financial institutions from August 2005 to August 2009. From August 2004 to August 2005, Ms. Jaffee served as an Entrepreneur in Residence with Warburg Pincus, a private equity firm. From September 1995 to July 2004, Ms. Jaffee served as Executive Vice President at Citigroup, where she was President and Chief Executive Officer of Citibank’s Global Securities Services (1995 to 2003). Ms. Jaffe currently serves as a member of the Board of Directors of Broadridge Financial Solutions as well as a Trustee of Muhlenberg College.
William P. Johnston (1944) Director since 2005, Chairman of the Compliance Committee
In June 2006, Mr. Johnston was appointed as Senior Advisor to The Carlyle Group, a global private equity investment firm. In August 2007, Mr. Johnston was elected to the Board of Directors of LifeCare Holdings, Inc. In February 2008, Mr. Johnston was elected to the Board of Directors of HCR-ManorCare, Inc. In May 2006, Mr. Johnston was elected to the Supervisory Board of Fresenius Medical Care AG & Co. KGaA, after its acquisition of Renal Care Group, Inc. in March 2006. Mr. Johnston joined Renal Care Group in November 2002 as a member of the Board of Directors and served as Chairman of the Board from March 2003 through March 2006. Mr. Johnston served as a Director of MultiPlan, Inc. from July 2006 through August 2010. From September 1987 to December 2002, Mr. Johnston was with Equitable Securities Corporation (and its successors, SunTrust Equitable Securities and SunTrust Robinson Humphrey) serving in various investment banking and managerial positions, including Managing Director and Head of Investment Banking, Chief Executive Officer and Vice Chairman.
| Hartford Healthcare HLS Fund (formerly Hartford Global Health HLS Fund) |
| Directors and Officers (Unaudited) – (continued) |
Phillip O. Peterson (1944) Director since 2002 (HSF) and 2000 (HSF2), Chairman of the Audit Committee
Mr. Peterson is a mutual fund industry consultant. He was a partner of KPMG LLP (an accounting firm) until July 1999. Mr. Peterson joined William Blair Funds in February 2007 as a member of the Board of Trustees. From January 2004 to April 2005, Mr. Peterson served as Independent President of the Strong Mutual Funds.
Lemma W. Senbet (1946) Director since 2005
Dr. Senbet is the William E. Mayer Chair Professor of Finance and Director, Center for Financial Policy, at the University of Maryland, Robert H. Smith School of Business. He was chair of the Finance Department from 1998 to 2006. Previously he was a chaired professor of finance at the University of Wisconsin-Madison. Also, he was director of the Fortis Funds from March 2000 to July 2002. Dr. Senbet served the finance profession in various capacities, including as director of the American Finance Association and President of the Western Finance Association. In 2006, Dr. Senbet was inducted Fellow of Financial Management Association International for his career-long distinguished scholarship and professional service.
Interested Directors and Officers
David N. Levenson (1966) Director since 2010
Mr. Levenson currently serves as President of The Hartford’s Wealth Management business. He was appointed to this role in July 2010. Previously, Mr. Levenson served as Executive Vice President of Legacy Holdings for The Hartford from June 2009 to July 2010. From 2006 to 2009, Mr. Levenson was with Hartford Life Insurance K.K. where he served as President and Chief Executive Officer from 2007 to 2009. He served as Managing Director of Hartford Investment Management Company from 2005 to 2006. Additionally, Mr. Levenson serves as Executive Vice President of The Hartford and as President, Director and Chief Executive Officer of Hartford Life Insurance Company (“HLIC”) and Hartford Life, Inc. (“HL Inc.”).
Lowndes A. Smith (1939) Director since 1996 (HSF) and 2002 (HSF2), Co-Chairman of the Investment Committee
Mr. Smith served as Vice Chairman of The Hartford from February 1997 to January 2002, as President and Chief Executive Officer of HL Inc. from February 1997 to January 2002, and as President and Chief Operating Officer of The Hartford Life Insurance Companies from January 1989 to January 2002. Mr. Smith serves as a Director of White Mountains Insurance Group, Ltd., One Beacon Insurance and Symetra Financial and as a Managing Director of Whittington Gray Associates.
Other Officers
James E. Davey (1964) President and Chief Executive Officer since 2010
Mr. Davey serves as Executive Vice President of HLIC. Additionally, Mr. Davey serves as President, Chief Executive Officer and Manager of Hartford Investment Financial Services, Inc. (“HIFSCO”) and President, Chief Executive Officer and Manager of HL Advisors. Mr. Davey joined The Hartford in 2002.
Michael R. Dressen (1963) AML Compliance Officer since 2011
Mr. Dressen currently serves as Assistant Vice President of HLIC. He also serves as Chief Compliance Officer and AML Compliance Officer of Hartford Administrative Services Company (“HASCO”) and as Assistant Secretary and Compliance Officer of HIFSCO. Mr Dressen joined The Hartford in 2005 from State Farm Insurance Companies where he held various positions related to mutual funds, variable products, and property casualty insurance.
Tamara L. Fagely (1958) Vice President, Treasurer and Controller since 2002 (HSF) and 1993 (HSF2)
Ms. Fagely has been a Vice President of HASCO since 1998 and Chief Financial Officer since 2006. Currently Ms. Fagely is a Vice President of HLIC. She served as Assistant Vice President of HLIC from December 2001 through March 2005. In addition, Ms. Fagely is Controller and Chief Financial Officer of HIFSCO.
Dr. Robert J. Froehlich (1953) Senior Managing Director since 2009
Dr. Froehlich joined The Hartford as Senior Managing Director in September 2009. Prior to joining The Hartford, Dr. Froehlich served as Vice Chairman of Deutsche Asset Management from 1997-2009.
Edward P. Macdonald (1967) Vice President, Secretary and Chief Legal Officer since 2005
Mr. Macdonald serves as Vice President of HLIC and Chief Legal Officer of Mutual Funds and Vice President of HIFSCO. He also serves as Vice President and Secretary of HASCO, and Chief Legal Officer, Secretary and Vice President of HL Advisors. Mr. Macdonald joined The Hartford in 2005.
Vernon J. Meyer (1964) Vice President since 2006
Mr. Meyer serves as Senior Vice President of HLIC. He also serves as Senior Vice President of HIFSCO and HL Advisors. Mr. Meyer joined The Hartford in 2004.
Colleen B. Pernerewski (1969) Vice President and Chief Compliance Officer since 2010
Ms. Pernerewski serves as Vice President and Chief Investment Advisor Compliance Officer of HIFSCO and as Vice President and Chief Compliance Officer of HL Advisors. Ms. Pernerewski joined The Hartford in 2005 from Travelers Life and Annuity where she served as Counsel (2004-2005). Prior to Travelers Life and Annuity, Ms. Pernerewski held the position of Counsel at The Hartford (1998-2004).
Elizabeth L. Schroeder (1966) Vice President since 2010
Ms. Schroeder currently serves as Assistant Vice President of HLIC. Ms. Schroeder joined HLIC in 1991. She is also an Assistant Vice President of HASCO, HIFSCO and HL Advisors.
Martin Swanson (1962) Vice President since 2010
Mr. Swanson is a Vice President of HLIC. Mr. Swanson also serves as Vice President/Marketing for HIFSCO. Prior to joining HLIC in 1998, Mr. Swanson was a Vice President at PaineWebber, Inc.
Jane Wolak (1961) Vice President since 2009
Ms. Wolak currently serves as Senior Vice President of HLIC. Ms. Wolak joined HLIC as Vice President, Retail Product Services in May 2007. She is also Vice President of HASCO. Previously, Ms. Wolak was with Sun Life Financial where she held the position of Vice President, Service Center Operations from 2001-2007.
HOW TO OBTAIN A COPY OF THE FUND’S PROXY VOTING POLICIES AND VOTING RECORDS (UNAUDITED)
A description of the policies and procedures that the Fund uses to determine how to vote proxies relating to portfolio securities and a record of how the Fund voted any proxies for the twelve-month period ended June 30, 2011 are available (1) without charge, upon request, by calling 800-862-6668 and (2) on the SEC’s website at http://www.sec.gov.
QUARTERLY PORTFOLIO HOLDINGS INFORMATION (UNAUDITED)
The Fund files a complete schedule of portfolio holdings with the SEC for the first and third quarters of each fiscal year on Form N-Q. The Fund’s Forms are available (1) without charge, upon request, by calling 800-862-6668 and (2) on the SEC’s website at http://www.sec.gov. The Form N-Q may be reviewed and copied at the SEC’s Public Reference Room in Washington, DC. Information on the operation of the Public Reference Room may be obtained by calling 1-800-SEC-0330.
| Hartford Healthcare HLS Fund (formerly Hartford Global Health HLS Fund) |
| Expense Example (Unaudited) |
Your Fund's Expenses
As a shareholder of the Fund, you incur two types of costs: (1) transaction costs and (2) ongoing costs including investment management fees, distribution fees, and other fund expenses. This example is intended to help you understand your ongoing costs (in dollars) of investing in the Fund and to compare these costs with the ongoing costs of investing in other mutual funds. The example is based on an investment of $1,000 invested at the beginning of the period and held for the period of June 30, 2011 through December 31, 2011.
Actual Expenses
The first set of columns of the table below provides information about actual account values and actual expenses. You may use the information in this column, together with the amount you invested, to estimate the expenses that you paid over the period. Simply divide your account value by $1,000 (for example, an $8,600 account value divided by $1,000 = 8.6), then multiply the result by the number in the line under the heading entitled “Expenses Paid During Period” to estimate the expenses you paid on your account during this period.
Hypothetical Example for Comparison Purposes
The second set of columns of the table below provides information about hypothetical account values and hypothetical expenses based on the Fund’s actual expense ratio and an assumed rate of return of 5% per year before expenses, which is not the Fund’s actual return. The hypothetical account values and expenses may not be used to estimate the actual ending account balance or expenses you paid for the period. You may use this information to compare the ongoing costs of investing in the Fund and other funds. To do so, compare this 5% hypothetical example with the 5% hypothetical examples that appear in the shareholder reports of the other funds.
Please note that the expenses shown in the table are meant to highlight your ongoing costs only and do not reflect any transactional costs, such as sales charges (loads) and CDSC. Therefore, the second set of columns of the table is useful in comparing ongoing costs only, and will not help you determine the relative total costs of owning different funds. In addition, if these transactional costs were included, your costs would be higher. Expenses are equal to the Fund's annualized expense ratios multiplied by average account value over the period, multiplied by 184/365 (to reflect the one-half year period).
| | | Actual return | | | Hypothetical (5% return before expenses) | | | | | | |
| | | | | | | Expenses paid | | | | | | | Expenses paid | | | | Days in | | |
| | | | | Ending | | during the period | | | | | Ending | | during the period | | | | the | | Days |
| | | Beginning | | Account Value | | June 30, 2011 | | | Beginning | | Account Value | | June 30, 2011 | | Annualized | | current | | in the |
| | | Account Value | | December 31, | | through | | | Account Value | | December 31, | | through | | expense | | 1/2 | | full |
| | | June 30, 2011 | | 2011 | | December 31, 2011 | | | June 30, 2011 | | 2011 | | December 31, 2011 | | ratio | | year | | year |
| Class IA | | $1,000.00 | | $916.77 | | $4.40 | | | $1,000.00 | | $1,020.62 | | $4.63 | | 0.91% | | 184 | | 365 |
| Class IB | | $1,000.00 | | $915.61 | | $5.60 | | | $1,000.00 | | $1,019.36 | | $5.90 | | 1.16% | | 184 | | 365 |
| Hartford Healthcare HLS Fund (formerly Hartford Global Health HLS Fund) |
| Approval of Investment Management and Investment Sub-Advisory Agreements (Unaudited) |
Section 15(c) of the Investment Company Act of 1940, as amended (the “1940 Act”), requires that each mutual fund’s board of directors, including a majority of those directors who are not “interested persons” of the mutual fund, as defined in the 1940 Act (the “Independent Directors”), annually review and consider the continuation of the mutual fund’s investment advisory and sub-advisory agreements. At its meeting held on August 2-3, 2011, the Board of Directors (the “Board”) of Hartford Series Fund, Inc., including each of the Independent Directors, unanimously voted to approve the continuation of the investment management agreement for Hartford Healthcare HLS Fund (the “Fund”) with HL Investment Advisors, LLC (“HL Advisors”) and the continuation of the investment sub-advisory agreement between HL Advisors and the Fund’s sub-adviser, Wellington Management Company, LLP (the “Sub-adviser,” and together with HL Advisors, the “Advisers”) (collectively, the “Agreements”).
In the months preceding the August 2-3, 2011 meeting, the Board requested, received, and reviewed written responses from the Advisers to questions posed to them on behalf of the Independent Directors and supporting materials relating to those questions and responses. The Board considered information furnished to the Board at its meetings throughout the year, as well as information specifically prepared in connection with the annual approval of the Agreements at the Board’s meetings held on June 21-22, 2011 and August 2-3, 2011. Information provided to the Board at its meetings throughout the year included, among other things, reports on Fund performance, legal and compliance matters, sales and marketing activity, shareholder services, and the other services provided to the Fund by the Advisers and their affiliates. In addition, the Board received in-person presentations by Fund officers and representatives of HL Advisors at the Board’s meetings on June 21-22, 2011 and August 2-3, 2011 concerning the Agreements.
The Independent Directors, advised by independent legal counsel, engaged two service providers to assist them with evaluating the Agreements with respect to the Fund. Lipper Inc. (“Lipper”), an independent provider of investment company data, was retained to provide the Board with reports on how the Fund’s contractual management fees, actual management fees, other non-management fees, overall expense ratios and investment performance compared to those of mutual funds with similar investment objectives. The Independent Directors also engaged an independent financial services consulting firm (the “Consultant”) to assist them in evaluating the Fund’s management fees, sub-advisory fees, other non-management fees, overall expense ratios and investment performance. In addition, the Consultant reviewed the profitability calculations utilized by HL Advisors in connection with the continuation of the investment management agreement.
In determining to continue the Agreements for the Fund, the members of the Board reviewed and evaluated information and factors they believed to be relevant and appropriate in light of the information that the Board deemed necessary and appropriate through the exercise of their reasonable business judgment. While individual members of the Board may have weighed certain factors differently, the Board’s determination to continue the Agreements was based on a comprehensive consideration of all information provided to the Board throughout the year and specifically with respect to the continuation of the Agreements. A more detailed discussion of the factors the Board considered with respect to its approval of the Agreements is provided below.
Nature, Extent, And Quality Of Services Provided by the Advisers
The Board requested and considered information concerning the nature, extent, and quality of the services provided to the Fund by the Advisers. The Board considered, among other things, the terms of the Agreements and the range of services provided by the Advisers. The Board considered the Advisers’ professional personnel who provide services to the Fund, including each Adviser’s ability and experience in attracting and retaining qualified personnel to service the Fund. The Board considered each Adviser’s reputation and overall financial strength, as well as its willingness to consider and implement organizational and operational changes designed to improve services to the Fund. In addition, the Board considered the quality of each Adviser’s communications with the Board and responsiveness to Board inquiries.
The Board also requested and evaluated information concerning each Adviser’s regulatory and compliance environment. In this regard, the Board requested and reviewed information on each Adviser’s compliance policies and procedures, compliance history, and a report from the Fund’s Chief Compliance Officer on each Adviser’s compliance with applicable laws and regulations, including responses to regulatory developments and compliance issues raised by regulators. The Board also noted the Advisers’ support of the Fund’s compliance control structure, particularly the resources devoted by the Advisers in support of the Fund’s obligations pursuant to Rule 38a-1 under the 1940 Act.
| Hartford Healthcare HLS Fund (formerly Hartford Global Health HLS Fund) |
| Approval of Investment Management and Investment Sub-Advisory Agreements (Unaudited) – (continued) |
With respect to HL Advisors, the Board noted that under the Agreements, HL Advisors is responsible for the management of the Fund, including overseeing fund operations and service providers, as well as investment advisory services in connection with selecting, monitoring and supervising the Sub-adviser. The Board considered HL Advisors’ ongoing monitoring of people, process and performance, including its quarterly reviews of each of the Hartford HLS Funds, semi-annual meetings with the leaders of each Fund’s portfolio management team, and oversight of the Funds’ 49 portfolio managers. The Board recognized that HL Advisors has demonstrated a record of making changes to the management and/or strategies of the Funds when warranted. The Board considered HL Advisors’ oversight of the Sub-adviser’s investment approach and results, process for monitoring best execution of portfolio trades by the Sub-adviser, and approach to risk management with respect to the Fund and the service providers to the Fund. The Board also considered HL Advisors’ oversight of compliance with the Fund’s objective and policies as well as with applicable laws and regulations, noting that regulatory and other developments had over time led to an increase in the scope of HL Advisors’ services in this regard. In addition, the Board considered HL Advisors’ ongoing commitment to review and rationalize the Hartford fund family’s product line-up and the expenses that HL Advisors had incurred in connection with fund combinations in recent years. The Board considered that HL Advisors or its affiliates are responsible for providing the Fund’s officers. The Board also noted that Hartford Life Insurance Company (“HLIC”) provides administrative services to the Fund. The Board considered its experiences with HL Advisors and HLIC with respect to each of these services.
With respect to the Sub-adviser, who provides day-to-day portfolio management services, the Board considered the quality of the Fund’s portfolio managers, the Sub-adviser’s other investment personnel, its investment philosophy and process, investment research capabilities and resources, performance record, trade execution capabilities and experience. The Board considered the experience of the Fund’s portfolio managers, the number of accounts managed by the portfolio managers, and the Sub-adviser’s method for compensating the portfolio managers.
Based on these considerations, the Board concluded that it was satisfied with the nature, extent and quality of the services provided to the Fund by HL Advisors and the Sub-adviser.
Performance of the Fund and the Advisers
The Board considered the investment performance of the Fund. In this regard, the Board reviewed the performance of the Fund over different time periods presented in the materials and evaluated HL Advisors’ analysis of the Fund’s performance for these time periods. The Board considered information and materials provided to the Board by the Advisers concerning Fund performance, as well as information from Lipper comparing the investment performance of the Fund to an appropriate benchmark and universe of peer funds. The Board noted that the performance of the Fund was within expectations.
The Board considered the detailed investment analytics reports provided by The Hartford’s Investment Advisory Group throughout the year. These reports include, among other things, information on the Fund’s gross and net returns, the Fund’s investment performance relative to an appropriate benchmark and peer group, various statistics concerning the Fund’s portfolio, and a narrative summary of various factors affecting Fund performance. The Board considered the Advisers’ cooperation with the Investment Committee, which assists the Board in evaluating the performance of the Fund at periodic meetings throughout the year. The Board also considered the analysis provided by the Consultant relating to the Fund’s performance track record.
In light of all the considerations noted above, the Board concluded that it had continued confidence in HL Advisors’ and the Sub-adviser’s overall capabilities to manage the Fund.
Costs of the Services and Profitability of the Advisers
The Board reviewed information regarding HL Advisors’ cost to provide investment management and related services to the Fund and HL Advisors’ profitability, both overall and for the Fund, on a pre-tax basis without regard to distribution expenses. The Board also requested and reviewed information about the profitability to HL Advisors and its affiliates from all services provided to the Fund and all aspects of their relationship with the Fund. The Board also requested and received information relating to the operations and profitability of the Sub-adviser.
The Board considered the Consultant’s review of the profitability calculations utilized by HL Advisors in connection with the continuation of the investment management agreement. In this regard, the Consultant reported that The Hartford’s process for calculating and reporting Fund profitability is reasonable, sound and well within common industry practice.
Based on these considerations, the Board concluded that the profits anticipated to be realized by the Advisers and their affiliates from their relationships with the Fund would not be excessive.
Comparison of Fees and Services Provided by the Advisers
The Board considered comparative information with respect to the management fees to be paid by the Fund to HL Advisors and the total expense ratios of the Fund. The Board also considered comparative information with respect to the sub-advisory fees to be paid by HL Advisors to the Sub-adviser, to the extent applicable. In this regard, the Board requested and reviewed information from HL Advisors and the Sub-adviser relating to the management and sub-advisory fees, including the sub-advisory fee schedule for the Fund, and total operating expenses for the Fund. The Board considered that the management fee for the Fund includes the fee paid to HLIC for providing certain administrative services to the Fund. The Board also reviewed information from Lipper comparing the Fund’s contractual management fees, actual management fees and overall expense ratios relative to a group of funds selected by Lipper, in consultation with the Consultant, and a broader universe of funds selected by Lipper.
While the Board recognized that comparisons between the Fund and peer funds are imprecise, given the differing service levels and characteristics of mutual funds and the different business models and cost structures of the Advisers, the comparative information provided by Lipper assisted the Board in evaluating the reasonableness of the Fund’s management and sub-advisory fees and total operating expenses. In addition, the Board considered the analysis and recommendations of the Consultant relating to the Fund’s management and sub-advisory fees and total operating expenses.
Based on these considerations, the Board concluded that the Fund’s fees and total operating expenses, in conjunction with the information about quality of services, profitability, economies of scale, and other matters discussed, were reasonable in light of the services provided.
Economies of Scale
The Board requested and considered information regarding the Advisers’ realization of economies of scale with respect to the Fund and whether the fee levels reflect these economies of scale for the benefit of the Fund’s investors. With respect to HL Advisors, the Board considered representations from HL Advisors that it is difficult to anticipate whether and to what extent economies may be realized by HL Advisors as assets grow over time. The Board reviewed the breakpoints in the management fee schedule for the Fund, which reduces fee rates as Fund assets grow over time. The Board recognized that a fund with assets beyond the last breakpoint level will continue to benefit from economies of scale because additional assets are charged the lowest breakpoint fee resulting in lower overall effective management fee rates. The Board also recognized that a fee schedule that reaches a lower breakpoint quickly provides shareholders with the benefit of anticipated or potential economies of scale.
The Board reviewed and evaluated materials from Lipper showing how management fee schedules of peer funds reflect economies of scale for the benefit of investors as a peer fund’s assets hypothetically increase over time. Based on information provided by HL Advisors, Lipper, and the Consultant, the Board recognized that there is no uniform methodology for establishing breakpoints or uniform pattern in asset levels that trigger breakpoints or the amounts of breakpoints triggered.
After considering all of the information available to it, the Board concluded that it was satisfied with the extent to which economies of scale would be shared for the benefit of the Fund’s shareholders based on currently available information and the effective advisory fees and expense ratios for the Fund at its current and reasonably anticipated asset levels. The Board noted, however, that it would continue to monitor future growth in Fund assets and the appropriateness of additional breakpoints.
| Hartford Healthcare HLS Fund (formerly Hartford Global Health HLS Fund) |
| Approval of Investment Management and Investment Sub-Advisory Agreements (Unaudited) – (continued) |
Other Benefits
The Board considered other benefits to the Advisers and their affiliates from their relationships with the Fund, including the role of the Fund in supporting the variable life insurance and variable annuity products offered by The Hartford. The Board reviewed information noting that HLIC, an affiliate of HL Advisors, receives fees for providing certain administrative services to the Fund, and that HLIC also receives fees for fund accounting and related services from the Fund, and the Board considered information on expected profits to HLIC or its affiliates for such services. The Board also considered that Hartford Administrative Services Company (“HASCO”), the Fund’s transfer agent and an affiliate of HL Advisors, receives transfer agency compensation from the Fund, and the Board reviewed information on the expected profitability of the Fund’s transfer agency function to HASCO. The Board considered information provided by HASCO indicating that the transfer agent fees charged by HASCO to the Fund were fair and reasonable based on publicly available information.
The Board also considered that Hartford Securities Distribution Company, Inc., as principal underwriter of the Fund, receives 12b-1 fees from the Fund. The Board also noted that certain affiliates of HL Advisors distribute shares of the Fund and receive compensation in that connection.
The Board considered benefits to the Sub-adviser from its use of the Fund’s brokerage commissions to obtain soft dollar research, and representations from HL Advisors and the Sub-adviser that the Sub-adviser would not make any revenue-sharing payments or any other type of distribution payments to HL Advisors or its affiliates.
The Board considered the benefits to shareholders of being part of the Hartford family of funds. The Board considered HL Advisors’ efforts to provide investors in the family with a broad range of investment styles and asset classes.
* * * *
Based upon its review of these various factors, among others, the Board concluded that it is in the best interests of the Fund and its shareholders for the Board to approve the Agreements for an additional year. In reaching this decision, the Board did not assign relative weights to the factors discussed above or deem any one or group of them to be controlling in and of themselves. In connection with their deliberations, the Independent Directors met separately in executive session on several occasions, with independent legal counsel, to review the relevant materials and consider their responsibilities under relevant laws and regulations.
The Hartford
P.O. Box 5085
Hartford, CT 06102-5085
Hartford Series Fund, Inc. is underwritten and distributed by Hartford Securities Distribution Company, Inc.
"The Hartford" is The Hartford Financial Services Group, Inc. and its subsidiaries.
Hartford Series Fund, Inc. inception dates range from 1977 to date. Hartford Series Fund, Inc. is not a subsidiary of The Hartford but is underwritten, distributed by and advised by subsidiaries of The Hartford. Investments in Hartford Series Fund, Inc. are not guaranteed by The Hartford or any other entity.
You should carefully consider investment objectives, risks, and charges and expenses of Hartford HLS Funds before investing. This and other information can be found in the Fund’s prospectus or summary prospectus, which can be obtained by calling 800-862-6668. Please read them carefully before you invest or send money.
HLSAR-HC11 2-12 109078 Printed in U.S.A ©2011 The Hartford, Hartford, CT 06115 | |
A MESSAGE FROM THE PRESIDENT
Dear Fellow Shareholders:
I want to take this opportunity to say thank you for investing in Hartford HLS Funds.
This has been a tumultuous year. In the beginning of 2011, we witnessed tension-fueled political uprisings in the already-volatile Middle East and North Africa region. We also watched as Japan dealt with a series of crises including a massive earthquake and subsequent tsunami. Yet, U.S. economic conditions continued to improve, with gains in consumer confidence and retail sales. During the first half of 2011, domestic, international, and world indices (as measured by the S&P 500, MSCI EAFE and MSCI World) were all up more than 5% through June, 30 2011.
The economic recovery, however, lost momentum in the second half of 2011. The employment and housing markets both remain extremely challenged. Investors continue to be concerned about the implications of the European sovereign debt crisis, as well as our own high levels of domestic debt. Fears that the European sovereign debt crisis could continue to drag down the global economy have weighed heavily on stocks.
Ongoing apprehension regarding the U.S. debt ceiling during the summer and the resulting downgrade of the U.S. sovereign credit rating by Standard & Poor’s also contributed to weaker investor confidence.
There are, however, some reasons to remain confident. Corporations have record levels of cash on their balance sheets—corporate cash has doubled in the past 10 years. In addition, U.S. gross domestic product expanded at a 2.5 percent annual rate in the third quarter according to the Commerce Department, as consumers and businesses set aside fears about the recovery and stepped up spending. Corporate earnings have also remained positive, with a majority of companies beating expectations each quarter this year. This momentum will hopefully continue into next year.
As we head into 2012, in light of the continued market volatility, now would be a good time to schedule a meeting with your financial advisor to examine your current investment strategy and determine whether you are on the right track.
| • | Does your fixed-income portfolio complement your equity portfolio? |
| • | Are you receiving diversified sources of income? |
| • | Is your portfolio still in line with your risk tolerance and investment time horizon? |
Talk to your advisor to see what changes you should make to address these concerns and opportunities.
Thank you again for investing with Hartford HLS Funds.
James Davey
President
Hartford HLS Funds
Hartford High Yield HLS Fund
Table of Contents
This report is prepared for the general information of contract owners and qualified retirement plan participants. It is not an offer of contracts or of qualified retirement plans. It should not be used in connection with any offer, except in conjunction with the appropriate product prospectus which contains all pertinent information including the applicable sales, administrative and other charges.
The views expressed in the Fund’s Manager Discussion under “Why did the Fund perform this way?” and “What is the outlook?” are views of the Fund’s sub-adviser and portfolio management team through the end of the period and are subject to change based on market and other conditions.
Hartford High Yield HLS Fund inception 09/30/1998
(sub-advised by Hartford Investment Management Company)
| Investment objective – Seeks to provide high current income, and long-term total return. |
| |
Performance Overview 12/31/01 - 12/31/11

The chart above shows the growth of a $10,000 investment in Class IA. Growth results in classes other than Class IA will vary from what is seen above due to differences in the expenses charged to those share classes.
Average Annual Total Returns (as of 12/31/11)
| | 1 Year | 5 Year | 10 Year |
| High Yield IA | 4.69% | 7.05% | 7.00% |
| High Yield IB | 4.44% | 6.79% | 6.73% |
| Barclays Capital U.S. Corporate High-Yield Index | 4.98% | 7.54% | 8.85% |
PAST PERFORMANCE IS NOT INDICATIVE OF FUTURE RESULTS.
Total returns presented above were calculated using the Fund's net asset value available to shareholders for sale or redemption of Fund shares on December 31, 2011, which may exclude investment transactions as of this date.
Barclays Capital U.S. Corporate High-Yield Index is an unmanaged broad-based market-value-weighted index that tracks the total return performance of non-investment grade, fixed-rate, publicly placed, dollar denominated and nonconvertible debt registered with the Securities and Exchange Commission.
You cannot invest directly in an index.
The chart represents a hypothetical investment in the Fund. Performance data represents past performance and current performance could be higher or lower.
Performance information may reflect historical or current expense waivers/reimbursements from the investment adviser, without which performance would have been lower. For information on current expense waivers/reimbursements, please see the prospectus.
The value of the Fund will fluctuate so that when redeemed, it may be worth more or less than the original investment. The chart and table do not reflect the deductions of taxes, sales charges or other fees which may be applied at the variable life insurance, variable annuity or qualified retirement plan product level. Any such additional sales charges or other fees or expenses would lower the contract’s or plan’s performance.
| Hartford High Yield HLS Fund |
Manager Discussion (Unaudited)
December 31, 2011
| | | |
| Portfolio Managers | | |
| Carlos Feged, CFA | James Serhant, CFA | |
| Senior Vice President | Senior Vice President | |
| | | |
How did the Fund perform?
The Class IA Shares of the Hartford High Yield HLS Fund returned 4.69% for the twelve-month period ended December 31, 2011, underperforming its benchmark the Barclays Capital U.S. High Yield Index returned 4.98%, and outperforming the Lipper High Current Yield VP-UF Funds category, a group of funds with investment strategies similar to those of the Fund, which returned 3.35%.
Why did the Fund perform this way?
While the performance of the High Yield market was close to our 6-7% expectation for 2011, the volatility experienced in achieving this return was much higher than we expected. With one eye on Global Macro issues, including the European debt crisis, the United States debt ceiling debate and the global growth outlook, and another on the more traditional drivers of High Yield performance, including corporate earnings and balance sheets, the market has been whipsawed in unusual fashion over the last 12 months. Indeed, the monthly volatility of the High Yield market over the period was 40% higher than normal, with a monthly volatility of 2.8% compared to a historical average of 2% for the market and 2.3% in years with a similar return profile.
The Fund had mixed security selection across the major industry sectors. Information Technology and Telecommunication Services saw the best security selection with the Fund’s holdings outpacing the index holdings based on the strength of strong security choices and weightings within the Level 3 Communications and First Data issuer complexes. Other strong issuer contributors were MGM Resorts, benefitting from an economic rebound on the Las Vegas strip; SpringLeaf Finance Corporation (fka American General Finance) whose volatility provided meaningful trading opportunities; and a large position in a unique Term Loan of Easton Bell Sports.
In 2011, we had poor security selection within the Consumer Staples sector which was hurt by a late-year sell-off in one of our long-term core holdings, American Seafood Group LLC. While 2011 was a disappointing year for the company due to a confluence of the Japanese tsunami reducing demand as well as cyclical dynamics in the seafood industry, we believe these to be one-off events and expect results to improve in 2012. The biggest overall drags on performance at the issuer level came from our positioning on convertible bonds in the auto sector, which included General Motors, TRW Automotive and Dana Corporation. Entering the year our view was that healthy balance sheets in the Automotive sector were likely to be deployed in shareholder friendly actions. We believed equities stood to gain disproportionately from these actions as Automotive bonds presented paltry yields and re-leveraging risk. As a result, we felt that there was better value in convertible bonds. We were wrong. Automotive bonds outperformed the High Yield market as strong balance sheets were kept intact and shielded fixed income investors from a deteriorating macroeconomic environment that led to significant equity market declines. We are not yet giving up on this theme and look to earnings announcements and capital returns to shareholders to be likely catalysts for improved performance in 2012.
What is the outlook?
The market rallied into year-end, posting a 2.66% return for December, recovering November’s decline and a little more. The dollar price of 97.92 is up more than seven points from the early October low and back to well above the historical average and median dollar price of 90.65 and 93.02, respectively. At these levels, the market is pricing in a 7% default rate for 2012, up from a 4.5% default rate expectation a year ago. So, despite the fact that actual defaults came in at only 1.7%, materially lower than what was priced in a year ago (and even lower than our 2% forecast), spreads widened in anticipation of higher default rates beyond 2011. We anticipate defaults could tick-up to the 3-4% area, primarily due to the risk of a very large default in the space, but expect it will remain well below what is priced in.
We expect market volatility will likely remain somewhat more elevated than normal. While Europe has not solved its long-term problems by any stretch, they seem to have bought enough time and continue to iterate toward a longer-term solution. Indeed, the Europeans do seem to have begun to successfully navigate the all important first half of 2012 refunding hurdle by using the European Central Bank’s new liquidity programs, which has helped to spur successful Spanish and Italian bond auctions. This is positive and the markets have begun to respond favorably. And while we believe a recession in Europe is underway, companies seem to be weathering the storm better than most expect as suggested by recent comments from the CEO of Avis and the operational update from Ineos Chemical Holdings. Economic data in the U.S. has continued to steadily improve, and while still weak for a recovery, suggests that growth will likely be in the 2-3% range for 2012. In this environment, spreads may continue to tighten meaningfully by year-end,
| Hartford High Yield HLS Fund |
Manager Discussion (Unaudited) – (continued)
December 31, 2011
driven by improved clarity on both the European and domestic political fronts. As these become clearer, we believe the High Yield market will come to accept that the default peak will be meaningfully below that of the last cycle, and expect spreads to potentially tighten into the 600bps area. If this happens, we expect that the High Yield market would likely deliver high single digit returns for 2012.
Distribution by Credit Quality
as of December 31, 2011
| Credit Rating * | | Percentage of
Net Assets | |
| Baa / BBB | | | 2.6 | |
| Ba / BB | | | 17.6 | |
| B | | | 46.7 | |
| Caa / CCC or Lower | | | 23.4 | |
| Unrated | | | 3.1 | |
| U.S. Government Agencies and Securities | | | 5.4 | |
| Non Debt Securities and Other Short-Term Instruments | | | 1.0 | |
| Other Assets & Liabilities | | | 0.2 | |
| Total | | | 100.0 | % |
| * | Does not apply to the Fund itself. Based upon Moody’s and S&P long-term credit ratings for the Fund’s holdings as of the date noted. If Moody's and S&P assign different ratings to a holding, the lower rating is used. "Unrated" includes fixed-income securities (other than cash-like short-term instruments and U.S. Government securities) for which Moody’s and S&P have not issued long-term credit ratings. |
Diversification by Security Type
as of December 31, 2011
| | | Percentage of | |
| Category | | Net Assets | |
| Asset & Commercial Mortgage Backed Securities | | | 0.5 | % |
| Common Stocks | | | 0.3 | |
| Corporate Bonds | | | 85.1 | |
| Preferred Stocks | | | 0.7 | |
| Senior Floating Rate Interests | | | 7.8 | |
| U.S. Government Securities | | | 5.3 | |
| Warrants | | | 0.0 | |
| Short-Term Investments | | | 0.1 | |
| Other Assets and Liabilities | | | 0.2 | |
| Total | | | 100.0 | % |
Diversification by Industry
as of December 31, 2011
| | | Percentage of | |
| Industry | | Net Assets | |
| Fixed Income Securities | | | | |
| Accommodation and Food Services | | | 3.5 | % |
| Administrative Waste Management and Remediation | | | 1.2 | |
| Agriculture, Forestry, Fishing and Hunting | | | 0.7 | |
| Air Transportation | | | 1.0 | |
| Apparel Manufacturing | | | 0.5 | |
| Arts, Entertainment and Recreation | | | 9.4 | |
| Chemical Manufacturing | | | 1.7 | |
| Computer and Electronic Product Manufacturing | | | 2.3 | |
| Construction | | | 1.1 | |
| Educational Services | | | 0.3 | |
| Fabricated Metal Product Manufacturing | | | 0.3 | |
| Finance and Insurance | | | 12.1 | |
| Food Manufacturing | | | 0.4 | |
| Food Services | | | 0.6 | |
| Health Care and Social Assistance | | | 5.7 | |
| Information | | | 10.7 | |
| Machinery Manufacturing | | | 0.6 | |
| Mining | | | 1.9 | |
| Miscellaneous Manufacturing | | | 1.2 | |
| Motor Vehicle & Parts Manufacturing | | | 4.4 | |
| Paper Manufacturing | | | 1.2 | |
| Petroleum and Coal Products Manufacturing | | | 7.5 | |
| Pipeline Transportation | | | 2.5 | |
| Plastics and Rubber Products Manufacturing | | | 0.9 | |
| Primary Metal Manufacturing | | | 0.8 | |
| Printing and Related Support Activities | | | 0.9 | |
| Professional, Scientific and Technical Services | | | 2.6 | |
| Rail Transportation | | | 0.5 | |
| Real Estate and Rental and Leasing | | | 2.5 | |
| Retail Trade | | | 6.6 | |
| Soap, Cleaning Compound, and Toilet Manufacturing | | | 0.5 | |
| Textile Product Mills | | | 0.4 | |
| Transit and Ground Passenger Transportation | | | 0.4 | |
| Truck Transportation | | | 0.9 | |
| Utilities | | | 3.9 | |
| Water Transportation | | | 0.8 | |
| Wholesale Trade | | | 0.9 | |
| Total | | | 93.4 | % |
| Equity Securities | | | | |
| Automobiles & Components | | | 0.7 | |
| Energy | | | 0.3 | |
| Food, Beverage & Tobacco | | | 0.0 | |
| Software & Services | | | 0.0 | |
| Total | | | 1.0 | % |
| U.S. Government Securities | | | 5.3 | |
| Short-Term Investments | | | 0.1 | |
| Other Assets and Liabilities | | | 0.2 | |
| Total | | | 100.0 | % |
| Hartford High Yield HLS Fund |
| Schedule of Investments |
| December 31, 2011 |
| (000’s Omitted) |
| Shares or Principal Amount | | Market Value ╪ | |
| ASSET & COMMERCIAL MORTGAGE BACKED SECURITIES - 0.5% | | | | |
| | | | | Finance and Insurance - 0.5% | | | | |
| | | | | Banc of America Large Loan | | | | |
| $ | 3,905 | | | 2.03%, 11/15/2015 ■Δ | | $ | 3,529 | |
| | | | | Soundview NIM Trust | | | | |
| | 2,490 | | | 0.00%, 12/25/2036 ⌂■● | | | — | |
| | | | | | | | 3,529 | |
| | | | | | | | | |
| | | | | Total asset & commercial mortgage backed securities | | | | |
| | | | | (cost $6,296) | | $ | 3,529 | |
| | | | | | | | | |
| CORPORATE BONDS - 85.1% | | | | |
| | | | | Accommodation and Food Services - 3.5% | | | | |
| | | | | Marina District Finance Co., Inc. | | | | |
| $ | 2,653 | | | 9.50%, 10/15/2015 | | $ | 2,480 | |
| | | | | MGM Mirage, Inc. | | | | |
| | 11,546 | | | 11.13%, 11/15/2017 | | | 13,162 | |
| | | | | MGM Resorts International | | | | |
| | 6,168 | | | 11.38%, 03/01/2018 | | | 6,785 | |
| | | | | Wynn Las Vegas LLC | | | | |
| | 2,424 | | | 7.75%, 08/15/2020 | | | 2,691 | |
| | | | | | | | 25,118 | |
| | | | | Administrative Waste Management and Remediation - 1.2% | | | | |
| | | | | Energy Solutions, Inc. LLC | | | | |
| | 3,021 | | | 10.75%, 08/15/2018 | | | 2,828 | |
| | | | | Iron Mountain, Inc. | | | | |
| | 2,641 | | | 7.75%, 10/01/2019 | | | 2,790 | |
| | | | | TransUnion LLC | | | | |
| | 2,440 | | | 11.38%, 06/15/2018 | | | 2,788 | |
| | | | | | | | 8,406 | |
| | | | | Agriculture, Forestry, Fishing and Hunting - 0.7% | | | | |
| | | | | American Seafood Group LLC | | | | |
| | 3,577 | | | 10.75%, 05/15/2016 ■ | | | 3,184 | |
| | 2,171 | | | 15.00%, 05/15/2017 ■Þ | | | 1,619 | |
| | | | | | | | 4,803 | |
| | | | | Air Transportation - 0.5% | | | | |
| | | | | United Air Lines, Inc. | | | | |
| | 3,502 | | | 9.88%, 08/01/2013 ■ | | | 3,581 | |
| | | | | | | | | |
| | | | | Apparel Manufacturing - 0.5% | | | | |
| | | | | Quiksilver, Inc. | | | | |
| | 3,502 | | | 6.88%, 04/15/2015 | | | 3,252 | |
| | | | | | | | | |
| | | | | Arts, Entertainment and Recreation - 8.0% | | | | |
| | | | | CCO Holdings LLC | | | | |
| | 777 | | | 7.38%, 06/01/2020 | | | 820 | |
| | | | | Cenveo, Inc. | | | | |
| | 3,163 | | | 8.88%, 02/01/2018 | | | 2,760 | |
| | | | | Cequel Communication LLC | | | | |
| | 2,431 | | | 8.63%, 11/15/2017 ■ | | | 2,577 | |
| | | | | Clubcorp Club Operations, Inc. | | | | |
| | 3,676 | | | 10.00%, 12/01/2018 | | | 3,529 | |
| | | | | Downstream Development Authority | | | | |
| | 2,668 | | | 10.50%, 07/01/2019 ■ | | | 2,521 | |
| | | | | FireKeepers Development Authority | | | | |
| | 6,779 | | | 13.88%, 05/01/2015 ■ | | | 7,694 | |
| | | | | First Data Corp. | | | | |
| | 5,189 | | | 10.55%, 09/24/2015 Þ | | | 4,949 | |
| | | | | Knight Ridder, Inc. | | | | |
| | 10,621 | | | 6.88%, 03/15/2029 | | | 5,311 | |
| | | | | McClatchy Co. | | | | |
| | 4,252 | | | 11.50%, 02/15/2017 | | | 4,114 | |
| | | | | NAI Entertainment Holdings LLC | | | | |
| | 1,494 | | | 8.25%, 12/15/2017 ■ | | | 1,580 | |
| | | | | TL Acquisitions, Inc. | | | | |
| | 6,725 | | | 10.50%, 01/15/2015 ■ | | | 4,825 | |
| | | | | UPC Germany GMBH | | | | |
| | 2,555 | | | 8.13%, 12/01/2017 ■ | | | 2,699 | |
| | | | | Virgin Media Finance plc | | | | |
| | 2,330 | | | 9.50%, 08/15/2016 | | | 2,615 | |
| | | | | XM Satellite Radio, Inc. | | | | |
| | 3,724 | | | 7.63%, 11/01/2018 ■ | | | 3,910 | |
| | 6,045 | | | 13.00%, 08/01/2013 ■ | | | 6,861 | |
| | | | | | | | 56,765 | |
| | | | | Chemical Manufacturing - 1.7% | | | | |
| | | | | Ferro Corp. | | | | |
| | 3,968 | | | 7.88%, 08/15/2018 | | | 3,988 | |
| | | | | Hexion Specialty Chemicals | | | | |
| | 3,690 | | | 8.88%, 02/01/2018 | | | 3,459 | |
| | | | | Ineos Group Holdings plc | | | | |
| | 5,536 | | | 8.50%, 02/15/2016 ■ | | | 4,401 | |
| | | | | | | | 11,848 | |
| | | | | Computer and Electronic Product Manufacturing - 2.3% | | | | |
| | | | | Advanced Micro Devices, Inc. | | | | |
| | 2,734 | | | 8.13%, 12/15/2017 ‡ | | | 2,837 | |
| | | | | Magnachip Semiconductor | | | | |
| | 2,493 | | | 10.50%, 04/15/2018 | | | 2,593 | |
| | | | | Nextel Communications, Inc. | | | | |
| | 3,024 | | | 7.38%, 08/01/2015 | | | 2,767 | |
| | | | | Seagate HDD Cayman | | | | |
| | 2,630 | | | 7.75%, 12/15/2018 ■ | | | 2,798 | |
| | | | | Sorenson Communications | | | | |
| | 2,005 | | | 10.50%, 02/01/2015 ■ | | | 1,383 | |
| | | | | Stratus Technologies, Inc. | | | | |
| | 1,605 | | | 12.00%, 03/29/2015 | | | 1,452 | |
| | | | | Viasystems, Inc. | | | | |
| | 2,410 | | | 12.00%, 01/15/2015 ■ | | | 2,582 | |
| | | | | | | | 16,412 | |
| | | | | Construction - 1.1% | | | | |
| | | | | D.R. Horton, Inc. | | | | |
| | 2,520 | | | 6.50%, 04/15/2016 | | | 2,611 | |
| | | | | Pulte Homes, Inc. | | | | |
| | 2,446 | | | 7.88%, 06/15/2032 | | | 1,969 | |
| | | | | Shea Homes L.P. | | | | |
| | 3,133 | | | 8.63%, 05/15/2019 ■ | | | 2,930 | |
| | | | | | | | 7,510 | |
| | | | | Educational Services - 0.3% | | | | |
| | | | | Laureate Education, Inc. | | | | |
| | 2,422 | | | 10.00%, 08/15/2015 ■ | | | 2,470 | |
| | | | | | | | | |
| | | | | Fabricated Metal Product Manufacturing - 0.3% | | | | |
| | | | | BWAY Holding Co. | | | | |
| | 2,282 | | | 10.00%, 06/15/2018 | | | 2,430 | |
| | | | | | | | | |
The accompanying notes are an integral part of these financial statements
| Hartford High Yield HLS Fund |
| Schedule of Investments – (continued) |
| December 31, 2011 |
| (000’s Omitted) |
| Shares or Principal Amount | | Market Value ╪ | |
| CORPORATE BONDS - 85.1% - (continued) | | | | |
| | | | | Finance and Insurance - 10.4% | | | | |
| | | | | Ally Financial, Inc. | | | | |
| $ | 3,500 | | | 7.50%, 09/15/2020 ‡ | | $ | 3,535 | |
| | 2,723 | | | 8.30%, 02/12/2015 | | | 2,873 | |
| | | | | CIT Group, Inc. | | | | |
| | 3,440 | | | 6.63%, 04/01/2018 ■ | | | 3,560 | |
| | 13,968 | | | 7.00%, 05/01/2017 | | | 13,968 | |
| | | | | CNL Lifestyle Properties | | | | |
| | 4,044 | | | 7.25%, 04/15/2019 | | | 3,741 | |
| | | | | Ford Motor Credit Co. | | | | |
| | 3,150 | | | 12.00%, 05/15/2015 | | | 3,859 | |
| | | | | GMAC LLC | | | | |
| | 2,040 | | | 8.00%, 11/01/2031 | | | 1,969 | |
| | | | | Hub International Holdings, Inc. | | | | |
| | 2,792 | | | 10.25%, 06/15/2015 ■ | | | 2,771 | |
| | | | | Ineos Finance plc | | | | |
| | 4,200 | | | 9.00%, 05/15/2015 ■ | | | 4,263 | |
| | | | | Liberty Mutual Group, Inc. | | | | |
| | 3,641 | | | 10.75%, 06/15/2058 ■ | | | 4,569 | |
| | | | | Offshore Group Investments Ltd. | | | | |
| | 2,408 | | | 11.50%, 08/01/2015 | | | 2,604 | |
| | | | | Penson Worldwide, Inc. | | | | |
| | 3,495 | | | 12.50%, 05/15/2017 ■ | | | 2,097 | |
| | | | | Provident Funding Associates L.P. | | | | |
| | 2,763 | | | 10.13%, 02/15/2019 ■ | | | 2,127 | |
| | 5,422 | | | 10.25%, 04/15/2017 ■ | | | 5,056 | |
| | | | | Springleaf Finance Corp. | | | | |
| | 15,536 | | | 6.90%, 12/15/2017 | | | 11,186 | |
| | | | | Tomkins, Inc. LLC | | | | |
| | 2,596 | | | 9.00%, 10/01/2018 | | | 2,878 | |
| | | | | UPCB Finance III Ltd. | | | | |
| | 2,868 | | | 6.63%, 07/01/2020 ■ | | | 2,825 | |
| | | | | | | | 73,881 | |
| | | | | Food Manufacturing - 0.4% | | | | |
| | | | | JBS USA LLC | | | | |
| | 3,091 | | | 7.25%, 06/01/2021 ■ | | | 2,882 | |
| | | | | | | | | |
| | | | | Food Services - 0.6% | | | | |
| | | | | Landry's Acquisition Co. | | | | |
| | 126 | | | 11.63%, 12/01/2015 ■ | | | 133 | |
| | | | | Landry's Restaurants, Inc. | | | | |
| | 4,190 | | | 11.63%, 12/01/2015 | | | 4,410 | |
| | | | | | | | 4,543 | |
| | | | | Health Care and Social Assistance - 5.7% | | | | |
| | | | | Alere, Inc. | | | | |
| | 2,469 | | | 7.88%, 02/01/2016 | | | 2,475 | |
| | | | | Amerigroup Corp. | | | | |
| | 2,489 | | | 7.50%, 11/15/2019 | | | 2,564 | |
| | | | | Aurora Diagnostic Holdings | | | | |
| | 2,765 | | | 10.75%, 01/15/2018 | | | 2,751 | |
| | | | | Biomet, Inc. | | | | |
| | 3,254 | | | 10.38%, 10/15/2017 Þ | | | 3,522 | |
| | | | | Examworks Group, Inc. | | | | |
| | 2,650 | | | 9.00%, 07/15/2019 ■ | | | 2,398 | |
| | | | | HCA, Inc. | | | | |
| | 12,289 | | | 7.50%, 11/15/2095 | | | 9,463 | |
| | 2,596 | | | 8.50%, 04/15/2019 | | | 2,843 | |
| | | | | Health Management Associates, Inc. | | | | |
| | 2,160 | | | 7.38%, 01/15/2020 ■ | | | 2,246 | |
| | | | | LifePoint Hospitals, Inc. | | | | |
| | 3,021 | | | 6.63%, 10/01/2020 | | | 3,130 | |
| | | | | Rite Aid Corp. | | | | |
| 2,342 | | | 10.25%, 10/15/2019 | | | 2,582 | |
| | | | | Tenet Healthcare Corp. | | | | |
| | 2,831 | | | 6.25%, 11/01/2018 ■ | | | 2,881 | |
| | | | | Valeant Pharmaceuticals International | | | | |
| | 3,605 | | | 7.25%, 07/15/2022 ■ | | | 3,497 | |
| | | | | | | | 40,352 | |
| | | | | Information - 9.9% | | | | |
| | | | | Charter Communications Holdings II LLC | | | | |
| | 1,958 | | | 13.50%, 11/30/2016 | | | 2,261 | |
| | | | | Clearwire Corp. | | | | |
| | 5,666 | | | 12.00%, 12/01/2015 ■ | | | 5,425 | |
| | | | | CSC Holdings LLC | | | | |
| | 2,739 | | | 6.75%, 11/15/2021 ■ | | | 2,883 | |
| | | | | DISH DBS Corp. | | | | |
| | 5,066 | | | 7.88%, 09/01/2019 | | | 5,725 | |
| | | | | Evertec, Inc. | | | | |
| | 2,743 | | | 11.00%, 10/01/2018 | | | 2,798 | |
| | | | | Frontier Communications Corp. | | | | |
| | 2,984 | | | 7.88%, 01/15/2027 | | | 2,536 | |
| | | | | GXS Worldwide, Inc. | | | | |
| | 2,778 | | | 9.75%, 06/15/2015 | | | 2,570 | |
| | | | | iGate Corp. | | | | |
| | 2,845 | | | 9.00%, 05/01/2016 ■ | | | 2,937 | |
| | | | | Intelsat Bermuda Ltd. | | | | |
| | 3,007 | | | 11.50%, 02/04/2017 Þ | | | 2,901 | |
| | | | | Intelsat Jackson Holdings Ltd. | | | | |
| | 7,610 | | | 8.50%, 11/01/2019 | | | 8,067 | |
| | | | | Kabel Baden Wurttemberg GMBH & Co. | | | | |
| | 2,646 | | | 7.50%, 03/15/2019 ■ | | | 2,778 | |
| | | | | Level 3 Financing, Inc. | | | | |
| | 6,596 | | | 10.00%, 02/01/2018 | | | 6,992 | |
| | | | | Paetec Holding Corp. | | | | |
| | 2,127 | | | 9.88%, 12/01/2018 | | | 2,340 | |
| | | | | Qwest Corp. | | | | |
| | 2,877 | | | 7.25%, 10/15/2035 | | | 2,869 | |
| | | | | Sprint Nextel Corp. | | | | |
| | 3,267 | | | 9.00%, 11/15/2018 ■ | | | 3,430 | |
| | 4,395 | | | 11.50%, 11/15/2021 ■ | | | 4,351 | |
| | | | | Trilogy International Partners LLC | | | | |
| | 3,533 | | | 10.25%, 08/15/2016 ■ | | | 3,233 | |
| | | | | Videotron Ltee | | | | |
| | 2,565 | | | 9.13%, 04/15/2018 | | | 2,825 | |
| | | | | Windstream Corp. | | | | |
| | 3,400 | | | 7.50%, 04/01/2023 | | | 3,357 | |
| | | | | | | | 70,278 | |
| | | | | Machinery Manufacturing - 0.6% | | | | |
| | | | | Case New Holland, Inc. | | | | |
| | 3,816 | | | 7.88%, 12/01/2017 | | | 4,312 | |
| | | | | | | | | |
| | | | | Mining - 1.9% | | | | |
| | | | | Arch Coal, Inc. | | | | |
| | 2,516 | | | 7.25%, 06/15/2021 ■ | | | 2,585 | |
| | | | | FMG Resources Pty Ltd. | | | | |
| | 3,662 | | | 7.00%, 11/01/2015 ■ | | | 3,699 | |
| | 1,434 | | | 8.25%, 11/01/2019 ■ | | | 1,459 | |
| | | | | Peabody Energy Corp. | | | | |
| | 3,520 | | | 6.00%, 11/15/2018 ■ | | | 3,590 | |
The accompanying notes are an integral part of these financial statements
| Shares or Principal Amount | | Market Value ╪ | |
| CORPORATE BONDS - 85.1% - (continued) | | | | |
| | | | | Mining - 1.9% - (continued) | | | | |
| | | | | Taseko Mines Ltd. | | | | |
| $ | 2,414 | | | 7.75%, 04/15/2019 | | $ | 2,179 | |
| | | | | | | | 13,512 | |
| | | | | Miscellaneous Manufacturing - 1.2% | | | | |
| | | | | BE Aerospace, Inc. | | | | |
| | 2,408 | | | 6.88%, 10/01/2020 | | | 2,624 | |
| | | | | Reynolds Group Issuer, Inc. | | | | |
| | 1,995 | | | 7.88%, 08/15/2019 ■ | | | 2,085 | |
| | 3,900 | | | 9.00%, 04/15/2019 ■ | | | 3,705 | |
| | | | | | | | 8,414 | |
| | | | | Motor Vehicle & Parts Manufacturing - 2.2% | | | | |
| | | | | Chrysler Group | | | | |
| | 3,930 | | | 8.25%, 06/15/2021 ■ | | | 3,576 | |
| | | | | Ford Motor Co. | | | | |
| | 2,405 | | | 7.50%, 08/01/2026 | | | 2,556 | |
| | 4,251 | | | 9.22%, 09/15/2021 | | | 5,016 | |
| | | | | TRW Automotive, Inc. | | | | |
| | 3,333 | | | 3.50%, 12/01/2015 | | | 4,491 | |
| | | | | | | | 15,639 | |
| | | | | Paper Manufacturing - 1.2% | | | | |
| | | | | Mercer International, Inc. | | | | |
| | 3,014 | | | 9.50%, 12/01/2017 | | | 3,082 | |
| | | | | Sappi Papier Holding, Inc. | | | | |
| | 1,566 | | | 6.63%, 04/15/2021 ■ | | | 1,343 | |
| | | | | Westvaco Corp. | | | | |
| | 3,287 | | | 8.20%, 01/15/2030 | | | 3,737 | |
| | | | | | | | 8,162 | |
| | | | | Petroleum and Coal Products Manufacturing - 7.2% | | | | |
| | | | | Alon Refinancing Krotz Springs, Inc. | | | | |
| | 3,038 | | | 13.50%, 10/15/2014 ‡ | | | 3,160 | |
| | | | | Alpha Natural Resources, Inc. | | | | |
| | 2,355 | | | 6.00%, 06/01/2019 | | | 2,284 | |
| | | | | Bill Barrett Corp. | | | | |
| | 1,050 | | | 7.63%, 10/01/2019 | | | 1,097 | |
| | 1,810 | | | 9.88%, 07/15/2016 | | | 1,991 | |
| | | | | Chaparral Energy, Inc. | | | | |
| | 2,563 | | | 9.88%, 10/01/2020 | | | 2,768 | |
| | | | | Chesapeake Energy Corp. | | | | |
| | 2,940 | | | 6.88%, 08/15/2018 | | | 3,146 | |
| | | | | Concho Resources, Inc. | | | | |
| | 2,504 | | | 7.00%, 01/15/2021 | | | 2,689 | |
| | | | | Denbury Resources, Inc. | | | | |
| | 2,192 | | | 9.75%, 03/01/2016 | | | 2,417 | |
| | | | | EV Energy Partners Finance | | | | |
| | 1,916 | | | 8.00%, 04/15/2019 | | | 1,950 | |
| | | | | Headwaters, Inc. | | | | |
| | 2,423 | | | 7.63%, 04/01/2019 | | | 2,144 | |
| | | | | Key Energy Services, Inc. | | | | |
| | 3,471 | | | 6.75%, 03/01/2021 | | | 3,471 | |
| | | | | Newfield Exploration Co. | | | | |
| | 1,546 | | | 5.75%, 01/30/2022 | | | 1,670 | |
| | | | | Plains Exploration & Production Co. | | | | |
| | 1,203 | | | 6.75%, 02/01/2022 | | | 1,260 | |
| | | | | Regency Energy Partners L.P. | | | | |
| | 2,619 | | | 9.38%, 06/01/2016 | | | 2,881 | |
| | | | | Rosetta Resources, Inc. | | | | |
| | 2,578 | | | 9.50%, 04/15/2018 | | | 2,784 | |
| | | | | Sandridge Energy, Inc. | | | | |
| | 2,610 | | | 8.75%, 01/15/2020 | | | 2,695 | |
| | | | | Targa Resources Partners | | | | |
| 2,596 | | | 11.25%, 07/15/2017 | | | 2,920 | |
| | | | | Venoco, Inc. | | | | |
| | 2,729 | | | 8.88%, 02/15/2019 | | | 2,456 | |
| | | | | Western Refining, Inc. | | | | |
| | 2,867 | | | 11.25%, 06/15/2017 ■ | | | 3,261 | |
| | | | | WPX Energy, Inc. | | | | |
| | 3,835 | | | 6.00%, 01/15/2022 ■ | | | 3,926 | |
| | | | | | | | 50,970 | |
| | | | | Pipeline Transportation - 2.5% | | | | |
| | | | | Chesapeake Midstream Partners | | | | |
| | 2,888 | | | 5.88%, 04/15/2021 ■ | | | 2,888 | |
| | | | | Dynegy Holdings, Inc. | | | | |
| | 8,558 | | | 0.00%, 06/01/2019 Ω | | | 5,606 | |
| | | | | Eagle Rock Energy Partners L.P. | | | | |
| | 2,720 | | | 8.38%, 06/01/2019 ■ | | | 2,720 | |
| | | | | El Paso Corp. | | | | |
| | 3,345 | | | 7.80%, 08/01/2031 | | | 3,855 | |
| | | | | Energy Transfer Equity L.P. | | | | |
| | 2,643 | | | 7.50%, 10/15/2020 | | | 2,887 | |
| | | | | | | | 17,956 | |
| | | | | Plastics and Rubber Products Manufacturing - 0.9% | | | | |
| | | | | Plastipak Holdings, Inc. | | | | |
| | 2,421 | | | 10.63%, 08/15/2019 ■ | | | 2,675 | |
| | | | | Sealed Air Corp. | | | | |
| | 537 | | | 8.13%, 09/15/2019 ■ | | | 588 | |
| | 963 | | | 8.38%, 09/15/2021 ■ | | | 1,064 | |
| | | | | Titan International, Inc. | | | | |
| | 2,197 | | | 7.88%, 10/01/2017 | | | 2,285 | |
| | | | | | | | 6,612 | |
| | | | | Primary Metal Manufacturing - 0.8% | | | | |
| | | | | Aleris International, Inc. | | | | |
| | 2,845 | | | 7.63%, 02/15/2018 | | | 2,774 | |
| | | | | Novelis, Inc. | | | | |
| | 2,513 | | | 8.38%, 12/15/2017 | | | 2,670 | |
| | | | | | | | 5,444 | |
| | | | | Printing and Related Support Activities - 0.9% | | | | |
| | | | | Harland Clarke Holdings Corp. | | | | |
| | 4,685 | | | 9.50%, 05/15/2015 | | | 3,420 | |
| | | | | Sheridan (The) Group, Inc. | | | | |
| | 3,607 | | | 12.50%, 04/15/2014 | | | 3,247 | |
| | | | | | | | 6,667 | |
| | | | | Professional, Scientific and Technical Services - 2.6% | | | | |
| | | | | Affinion Group, Inc. | | | | |
| | 11,835 | | | 11.50%, 10/15/2015 | | | 10,326 | |
| | 6,910 | | | 11.63%, 11/15/2015 ‡ | | | 5,735 | |
| | | | | Global Geophysical Services, Inc. | | | | |
| | 2,845 | | | 10.50%, 05/01/2017 | | | 2,675 | |
| | | | | | | | 18,736 | |
| | | | | Rail Transportation - 0.5% | | | | |
| | | | | RailAmerica, Inc. | | | | |
| | 3,078 | | | 9.25%, 07/01/2017 | | | 3,363 | |
| | | | | | | | | |
| | | | | Real Estate and Rental and Leasing - 2.5% | | | | |
| | | | | Ashtead Capital, Inc. | | | | |
| | 2,720 | | | 9.00%, 08/15/2016 ■ | | | 2,836 | |
| | | | | Avis Budget Car Rental LLC | | | | |
| | 3,632 | | | 9.63%, 03/15/2018 ‡ | | | 3,759 | |
The accompanying notes are an integral part of these financial statements
| Hartford High Yield HLS Fund |
| Schedule of Investments – (continued) |
| December 31, 2011 |
| (000’s Omitted) |
| Shares or Principal Amount | | Market Value ╪ | |
| CORPORATE BONDS - 85.1% - (continued) | | | | |
| | | | | Real Estate and Rental and Leasing - 2.5% - (continued) | | | | |
| | | | | International Lease Finance Corp. | | | | |
| $ | 3,500 | | | 8.88%, 09/01/2017 | | $ | 3,623 | |
| | | | | Maxim Crane Works L.P. | | | | |
| | 2,889 | | | 12.25%, 04/15/2015 ■ | | | 2,600 | |
| | | | | Realogy Corp. | | | | |
| | 2,328 | | | 11.75%, 04/15/2014 Þ | | | 2,049 | |
| | | | | United Rentals North America, Inc. | | | | |
| | 2,823 | | | 8.38%, 09/15/2020 | | | 2,752 | |
| | | | | | | | 17,619 | |
| | | | | Retail Trade - 5.2% | | | | |
| | | | | Amerigas Partners L.P. | | | | |
| | 3,516 | | | 6.25%, 08/20/2019 | | | 3,498 | |
| | | | | Building Materials Corp. | | | | |
| | 3,013 | | | 7.50%, 03/15/2020 ■ | | | 3,254 | |
| | | | | Dollar General Corp. | | | | |
| | 3,418 | | | 11.88%, 07/15/2017 Þ | | | 3,777 | |
| | | | | Hillman Group, Inc. | | | | |
| | 3,257 | | | 10.88%, 06/01/2018 | | | 3,224 | |
| | | | | J.C. Penney Co., Inc. | | | | |
| | 3,196 | | | 7.63%, 03/01/2097 | | | 2,860 | |
| | | | | Jaguar Land Rover plc | | | | |
| | 3,683 | | | 8.13%, 05/15/2021 ■ | | | 3,462 | |
| | | | | Liz Claiborne, Inc. | | | | |
| | 2,950 | | | 10.50%, 04/15/2019 ■ | | | 3,157 | |
| | | | | Masonite International Co. | | | | |
| | 2,868 | | | 8.25%, 04/15/2021 ■ | | | 2,811 | |
| | | | | Nebraska Book Co. | | | | |
| | 2,883 | | | 10.00%, 04/15/2012 Ψ | | | 2,033 | |
| | | | | Sears Holdings Corp. | | | | |
| | 2,878 | | | 6.63%, 10/15/2018 | | | 2,187 | |
| | | | | Supervalu, Inc. | | | | |
| | 3,422 | | | 8.00%, 05/01/2016 | | | 3,533 | |
| | | | | Toys R Us, Inc. | | | | |
| | 2,779 | | | 7.38%, 09/01/2016 ■ | | | 2,786 | |
| | | | | | | | 36,582 | |
| | | | | Soap, Cleaning Compound, and Toilet Manufacturing - 0.5% | | | | |
| | | | | Yankee Candle Co. | | | | |
| | 3,828 | | | 10.25%, 02/15/2016 | | | 3,349 | |
| | | | | | | | | |
| | | | | Textile Product Mills - 0.4% | | | | |
| | | | | Interface, Inc. | | | | |
| | 2,592 | | | 7.63%, 12/01/2018 | | | 2,741 | |
| | | | | | | | | |
| | | | | Transit and Ground Passenger Transportation - 0.4% | | | | |
| | | | | Emergency Medical Services Corp. | | | | |
| | 2,768 | | | 8.13%, 06/01/2019 | | | 2,761 | |
| | | | | | | | | |
| | | | | Truck Transportation - 0.9% | | | | |
| | | | | Swift Transportation Co., Inc. | | | | |
| | 5,626 | | | 12.50%, 05/15/2017 ■ | | | 6,062 | |
| | | | | | | | | |
| | | | | Utilities - 3.9% | | | | |
| | | | | AES Corp. | | | | |
| | 2,524 | | | 9.75%, 04/15/2016 ‡ | | | 2,890 | |
| | | | | Calpine Corp. | | | | |
| | 6,710 | | | 7.88%, 01/15/2023 ■ | | | 7,213 | |
| | | | | Edison Mission Energy | | | | |
| | 8,609 | | | 7.00%, 05/15/2017 | | | 5,596 | |
| | | | | Energy Future Intermediate Holding Co. LLC | | | | |
| 4,266 | | | 10.00%, 12/01/2020 | | | 4,501 | |
| | | | | NRG Energy, Inc. | | | | |
| | 5,158 | | | 8.50%, 06/15/2019 | | | 5,235 | |
| | | | | Reliant Energy, Inc. | | | | |
| | 1,959 | | | 9.24%, 07/02/2017 | | | 1,920 | |
| | | | | | | | 27,355 | |
| | | | | Water Transportation - 0.8% | | | | |
| | | | | Seven Seas Cruises | | | | |
| | 2,732 | | | 9.13%, 05/15/2019 ■ | | | 2,794 | |
| | | | | Ship Finance International Ltd. | | | | |
| | 3,027 | | | 8.50%, 12/15/2013 | | | 2,845 | |
| | | | | | | | 5,639 | |
| | | | | Wholesale Trade - 0.9% | | | | |
| | | | | Spectrum Brands, Inc. | | | | |
| | 3,565 | | | 12.00%, 08/28/2019 Þ | | | 3,878 | |
| | | | | U.S. Foodservice, Inc. | | | | |
| | 2,853 | | | 8.50%, 06/30/2019 ■ | | | 2,760 | |
| | | | | | | | 6,638 | |
| | | | | Total corporate bonds | | | | |
| | | | | (cost $602,406) | | $ | 603,064 | |
| | | | | | | | | |
| SENIOR FLOATING RATE INTERESTS ♦ - 7.8% | | | | |
| | | | | Air Transportation - 0.5% | | | | |
| | | | | Macquarie Aircraft Leasing Finance S.A., Second Lien Term Loan | | | | |
| $ | 3,513 | | | 4.30%, 11/29/2013 ±⌂ | | $ | 3,303 | |
| | | | | | | | | |
| | | | | Arts, Entertainment and Recreation - 1.4% | | | | |
| | | | | AMC Entertainment Holdings, Inc. | | | | |
| | 6,467 | | | 5.00%, 06/13/2012 ±Þ | | | 6,268 | |
| | | | | Chester Downs and Marina LLC | | | | |
| | 1,358 | | | 12.38%, 07/31/2016 ± | | | 1,360 | |
| | | | | Revel Entertainment Group LLC | | | | |
| | 2,687 | | | 9.00%, 02/17/2017 ±☼ | | | 2,448 | |
| | | | | | | | 10,076 | |
| | | | | Finance and Insurance - 1.2% | | | | |
| | | | | Asurion Corp., Second Lien Term Loan | | | | |
| | 2,371 | | | 9.00%, 05/24/2019 ± | | | 2,330 | |
| | | | | BNY Convergex Group LLC, 2nd Lien Eze Borrower Term Loan Committment | | | | |
| | 407 | | | 8.75%, 12/17/2017 ± | | | 387 | |
| | | | | BNY Convergex Group LLC, 2nd Lien Top Borrower Term Loan Committment | | | | |
| | 971 | | | 8.75%, 12/17/2017 ± | | | 922 | |
| | | | | Nuveen Investments, Inc., Second Lien Term Loan | | | | |
| | 5,152 | | | 12.50%, 07/31/2015 ± | | | 5,318 | |
| | | | | | | | 8,957 | |
| | | | | Information - 0.8% | | | | |
| | | | | WideOpenWest Finance LLC, Second Lien Term Loan | | | | |
| | 6,277 | | | 6.54%, 06/29/2015 ±Þ | | | 5,579 | |
| | | | | | | | | |
| | | | | Motor Vehicle & Parts Manufacturing - 2.2% | | | | |
| | | | | General Motors Co. | | | | |
| | 17,705 | | | 0.38%, 10/27/2015 ◊☼ | | | 15,394 | |
The accompanying notes are an integral part of these financial statements
| Shares or Principal Amount | | | | | Market Value ╪ | |
| SENIOR FLOATING RATE INTERESTS ♦ - 7.8% - (continued) |
| | | | | Petroleum and Coal Products Manufacturing - 0.3% | | | | | | | | |
| | | | | Dynegy Power LLC | | | | | | | | |
| $ | 1,920 | | | 9.25%, 08/05/2016 ± | | | | | | $ | 1,941 | |
| | | | | | | | | | | | | |
| | | | | Retail Trade - 1.4% | | | | | | | | |
| | | | | Easton-Bell Sports, Inc. | | | | | | | | |
| | 10,379 | | | 11.50%, 12/31/2015 ±⌂Þ | | | | | | | 10,068 | |
| | | | | | | | | | | | | |
| | | | | Total senior floating rate interests | | | | | | | | |
| | | | | (cost $58,104) | | | | | | $ | 55,318 | |
| | | | | | | | | | | | | |
| U.S. GOVERNMENT SECURITIES - 5.3% |
| U.S. Treasury Securities - 5.3% |
| | | | | U.S. Treasury Notes - 5.3% | | | | | | | | |
| $ | 37,236 | | | 1.88%, 06/15/2012 | | | | | | $ | 37,540 | |
| | | | | | | | | | | | | |
| | | | | Total U.S. government securities | | | | | | | | |
| | | | | (cost $37,539) | | | | | | $ | 37,540 | |
| | | | | | | | | | | | | |
| COMMON STOCKS - 0.3% |
| | | | | Energy - 0.3% | | | | | | | | |
| | 207,275 | | | KCA Deutag ⌂●† | | | | | | $ | 1,720 | |
| | | | | | | | | | | | | |
| | | | | Software & Services - 0.0% | | | | | | | | |
| | 38 | | | Stratus Technologies, Inc. ⌂●† | | | | | | | — | |
| | | | | | | | | | | | | |
| | | | | Total common stocks | | | | | | | | |
| | | | | (cost $2,796) | | | | | | $ | 1,720 | |
| | | | | | | | | | | | | |
| PREFERRED STOCKS - 0.7% |
| | | | | Automobiles & Components - 0.7% | | | | | | | | |
| | 143 | | | General Motors Co., 4.75% ۞ | | | | | | $ | 4,893 | |
| | | | | | | | | | | | | |
| | | | | Software & Services - 0.0% | | | | | | | | |
| | 9 | | | Stratus Technologies, Inc. ⌂† | | | | | | | — | |
| | | | | | | | | | | | | |
| | | | | Total preferred stocks | | | | | | | | |
| | | | | (cost $6,507) | | | | | | $ | 4,893 | |
| | | | | | | | | | | | | |
| WARRANTS - 0.0% |
| | | | | Food, Beverage & Tobacco - 0.0% | | | | | | | | |
| | 2 | | | ASG Consolidated LLC ⌂■ | | | | | | $ | 140 | |
| | | | | | | | | | | | | |
| | | | | Total warrants | | | | | | | | |
| | | | | (cost $34) | | | | | | $ | 140 | |
| | | | | | | | | | | | | |
| | | | | Total long-term investments | | | | | | | | |
| | | | | (cost $713,682) | | | | | | $ | 706,204 | |
| | | | | | | | | | | | | |
| SHORT-TERM INVESTMENTS - 0.1% |
| | | | | Investment Pools and Funds - 0.0% | | | | | | | | |
| | 10 | | | JP Morgan U.S. Government Money Market Fund | | | | | | $ | 11 | |
| | — | | | Wells Fargo Advantage Government Money Market Fund | | | | | | | — | |
| | | | | | | | | | | | 11 | |
| | | | | U.S. Treasury Bills - 0.1% | | | | | | | | |
| $ | 900 | | | 0.01%, 2/2/2012 ○ | | | | | | | 900 | |
| | | | | | | | | | | | | |
| | | | | Total short-term investments | | | | | | | | |
| | | | | (cost $911) | | | | | | $ | 911 | |
| | | | | | | | | | | | | |
| | | | | Total investments | | | | | | | | |
| | | | | (cost $714,593) ▲ | | | 99.8 | % | | $ | 707,115 | |
| | | | | Other assets and liabilities | | | 0.2 | % | | | 1,553 | |
| | | | | Total net assets | | | 100.0 | % | | $ | 708,668 | |
| Note: | Percentage of investments as shown is the ratio of the total market value to total net assets. Market value of long-term investments in foreign securities represents 7.1% of total net assets at December 31, 2011. |
The accompanying notes are an integral part of these financial statements
| Hartford High Yield HLS Fund |
| Schedule of Investments – (continued) |
| December 31, 2011 |
| (000’s Omitted) |
| ▲ | At December 31, 2011, the cost of securities for federal income tax purposes was $716,902 and the aggregate gross unrealized appreciation and depreciation based on that cost were: |
| Unrealized Appreciation | | $ | 18,897 | |
| Unrealized Depreciation | | | (28,684 | ) |
| Net Unrealized Depreciation | | $ | (9,787 | ) |
| † | These securities are valued in good faith at fair value as determined under policies and procedures established by and under the supervision of the Company's Board of Directors. At December 31, 2011, the aggregate value of these securities was $1,720, which represents 0.2% of total net assets. |
| ● | Non-income producing. For long-term debt securities, items identified are in default as to payment of interest and/or principal. |
| Ψ | The company is in bankruptcy. The investment held by the fund is current with respect to interest payments. |
| Ω | Debt security in default due to bankruptcy. |
| Δ | Variable rate securities; the rate reported is the coupon rate in effect at December 31, 2011. |
| ○ | The interest rate disclosed for these securities represents the effective yield on the date of the acquisition. |
| ± | The interest rate disclosed for these securities represents the average coupon as of December 31, 2011. |
| ◊ | The interest rate disclosed for these securities represents an estimated average coupon as of December 31, 2011. |
| ♦ | Senior floating rate interests generally pay interest rates which are periodically adjusted by reference to a base short-term, floating lending rate plus a premium. These base lending rates are generally (i) the lending rate offered by one or more major European banks, such as the London Inter-Bank Offered Rate (LIBOR), (ii) the prime rate offered by one or more major United States Banks, or (iii) the bank's certificate of deposit rate. Senior floating rate interests often require prepayments from excess cash flows or permit the borrower to repay at its election. The rate at which the borrower repays cannot be predicted with accuracy. As a result, the actual remaining maturity may be substantially less than the stated maturities shown. |
| ■ | Securities issued within terms of a private placement memorandum, exempt from registration under Rule 144A under the Securities Act of 1933, as amended, and may be sold only to qualified institutional buyers. Unless otherwise indicated, these holdings are determined to be liquid. At December 31, 2011, the aggregate value of these securities was $206,525, which represents 29.1% of total net assets. |
| ⌂ | The following securities are considered illiquid. Illiquid securities are often purchased in private placement transactions, are often not registered under the Securities Act of 1933 and may have contractual restrictions on resale. A security may also be considered illiquid if the security lacks a readily available market or if its valuation has not changed for a certain period of time. |
| Period Acquired | | | Shares/ Par | | | Security | | Cost Basis | |
| 04/2010 - 07/2010 | | | | 2 | | | ASG Consolidated LLC Warrants - 144A | | $ | 34 | |
| 09/2010 - 11/2011 | | | $ | 10,379 | | | Easton-Bell Sports, Inc., 11.50%, 12/31/2015 | | | 10,283 | |
| 03/2011 | | | | 207,275 | | | KCA Deutag | | | 2,796 | |
| 01/2011 - 08/2011 | | | $ | 3,513 | | | Macquarie Aircraft Leasing Finance S.A., Second Lien Term Loan, 4.30%, 11/29/2013 | | | 3,230 | |
| 02/2007 | | | $ | 2,490 | | | Soundview NIM Trust, 0.00%, 12/25/2036 - 144A | | | 2,479 | |
| 03/2010 - 04/2010 | | | | 9 | | | Stratus Technologies, Inc. Preferred | | | — | |
| 03/2010 - 04/2010 | | | | 38 | | | Stratus Technologies, Inc. | | | — | |
At December 31, 2011, the aggregate value of these securities was $15,231, which represents 2.1% of total net assets.
| ☼ | This security, or a portion of this security, was purchased on a when-issued, delayed delivery or delayed draw basis. The cost of these securities was $18,646 at December 31, 2011. |
| ‡ | This security, or a portion of this security, has been segregated to cover funding requirements on investment transactions settling in the future. |
| Þ | This security may pay interest in additional principal instead of cash. |
| ╪ | See Significant Accounting Policies of accompanying Notes to Financial Statements regarding valuation of securities. |
The accompanying notes are an integral part of these financial statements.
| Hartford High Yield HLS Fund |
| Investment Valuation Hierarchy Level Summary |
| December 31, 2011 |
| (000’s Omitted) |
| | | Total | | | Level 1 ♦ | | | Level 2 ♦ | | | Level 3 | |
| Assets: | | | | | | | | | | | | | | | | |
| Asset & Commercial Mortgage Backed Securities | | $ | 3,529 | | | $ | — | | | $ | 3,529 | | | $ | — | |
| Common Stocks ‡ | | | 1,720 | | | | — | | | | — | | | | 1,720 | |
| Corporate Bonds | | | 603,064 | | | | — | | | | 597,897 | | | | 5,167 | |
| Preferred Stocks | | | 4,893 | | | | 4,893 | | | | — | | | | — | |
| Senior Floating Rate Interests | | | 55,318 | | | | — | | | | 55,318 | | | | — | |
| U.S. Government Securities | | | 37,540 | | | | — | | | | 37,540 | | | | — | |
| Warrants | | | 140 | | | | 140 | | | | — | | | | — | |
| Short-Term Investments | | | 911 | | | | 11 | | | | 900 | | | | — | |
| Total | | $ | 707,115 | | | $ | 5,044 | | | $ | 695,184 | | | $ | 6,887 | |
| ♦ | For the year ended December 31, 2011, there were no significant transfers between Level 1 and Level 2. |
| ‡ | The Fund has all or primarily all of the equity securities categorized in a particular level. Refer to the Schedule of Investments for further industry breakout. |
Following is a reconciliation of Level 3 assets for which significant unobservable inputs were used to determine fair value:
| | | Balance as | | | | | | Change in | | | | | | | | | | | | | | | | | | Balance as | |
| | | of | | | Realized | | | Unrealized | | | | | | | | | | | | Transfers | | | Transfers | | | of | |
| | | December | | | Gain | | | Appreciation | | | Net | | | | | | | | | Into | | | Out of | | | December | |
| | | 31, 2010 | | | (Loss) | | | (Depreciation) | | | Amortization | | | Purchases | | | Sales | | | Level 3 * | | | Level 3 * | | | 31, 2011 | |
| Assets: | | | | | | | | | | | | | | | | | | | | | | | | | | | | | | | | | | | | |
| Asset & Commercial Mortgage Backed Securities | | $ | — | | | $ | — | | | $ | — | † | | $ | — | | | $ | — | | | $ | — | | | $ | — | | | $ | — | | | $ | — | |
| Common Stocks | | | — | | | | — | | | | (1,075 | )‡ | | | — | | | | 2,795 | | | | — | | | | — | | | | — | | | | 1,720 | |
| Corporate Bonds | | | 5,606 | | | | (1,291 | ) | | | 217 | § | | | 63 | | | | 3,493 | | | | (4,743 | ) | | | 1,822 | | | | — | | | | 5,167 | |
| Preferred Stocks | | | — | | | | — | | | | — | † | | | — | | | | — | | | | — | | | | — | | | | — | | | | — | |
| Total | | $ | 5,606 | | | $ | (1,291 | ) | | $ | (858 | ) | | $ | 63 | | | $ | 6,288 | | | $ | (4,743 | ) | | $ | 1,822 | | | $ | — | | | $ | 6,887 | |
| * | Securities are transferred into and out of Level 3 for a variety of reasons including, but not limited to: |
| 1) | Securities where trading has been halted (transfer into Level 3) or securities where trading has resumed (transfer out of Level 3). |
| 2) | Broker quoted securities (transfer into Level 3) or quoted prices in active markets (transfer out of Level 3). |
| 3) | Securities that have certain restrictions on trading (transfer into Level 3) or securities where trading restrictions have expired (transfer out of Level 3). |
| † | Change in unrealized appreciation (depreciation) in the current period relating to assets still held at December 31, 2011 was zero. |
| ‡ | Change in unrealized appreciation (depreciation) in the current period relating to assets still held at December 31, 2011 was $(1,075). |
| § | Change in unrealized appreciation (depreciation) in the current period relating to assets still held at December 31, 2011 was $(219). |
The accompanying notes are an integral part of these financial statements.
| Hartford High Yield HLS Fund |
| Statement of Assets and Liabilities |
| December 31, 2011 |
| (000’s Omitted) |
| Assets: | | | | |
| Investments in securities, at market value (cost $714,593) | | $ | 707,115 | |
| Cash | | | 1,629 | |
| Foreign currency on deposit with custodian (cost $—) | | | — | |
| Receivables: | | | | |
| Fund shares sold | | | 5,249 | |
| Dividends and interest | | | 13,761 | |
| Total assets | | | 727,754 | |
| Liabilities: | | | | |
| Payables: | | | | |
| Investment securities purchased | | | 18,646 | |
| Fund shares redeemed | | | 271 | |
| Investment management fees | | | 107 | |
| Distribution fees | | | 9 | |
| Accrued expenses | | | 53 | |
| Total liabilities | | | 19,086 | |
| Net assets | | $ | 708,668 | |
| Summary of Net Assets: | | | | |
| Capital stock and paid-in-capital | | $ | 705,466 | |
| Undistributed net investment income | | | 57,146 | |
| Accumulated net realized loss | | | (46,466 | ) |
| Unrealized depreciation of investments and the translations of assets and liabilities denominated in foreign currency | | | (7,478 | ) |
| Net assets | | $ | 708,668 | |
| Shares authorized | | | 2,800,000 | |
| Par value | | $ | 0.001 | |
| Class IA: Net asset value per share | | $ | 8.70 | |
| Shares outstanding | | | 63,037 | |
| Net assets | | $ | 548,608 | |
| Class IB: Net asset value per share | | $ | 8.59 | |
| Shares outstanding | | | 18,638 | |
| Net assets | | $ | 160,060 | |
The accompanying notes are an integral part of these financial statements.
| Hartford High Yield HLS Fund |
| Statement of Operations |
| For the Year Ended December 31, 2011 |
| (000’s Omitted) |
| Investment Income: | | | | |
| Dividends | | $ | 448 | |
| Interest | | | 62,802 | |
| Total investment income, net | | | 63,250 | |
| | | | | |
| Expenses: | | | | |
| Investment management fees | | | 5,207 | |
| Transfer agent fees | | | 2 | |
| Distribution fees - Class IB | | | 435 | |
| Custodian fees | | | 8 | |
| Accounting services fees | | | 136 | |
| Board of Directors' fees | | | 18 | |
| Audit fees | | | 15 | |
| Other expenses | | | 150 | |
| Total expenses (before fees paid indirectly) | | | 5,971 | |
| Custodian fee offset | | | (1 | ) |
| Total fees paid indirectly | | | (1 | ) |
| Total expenses, net | | | 5,970 | |
| Net investment income | | | 57,280 | |
| | | | | |
| Net Realized Gain on Investments, Other Financial Instruments and Foreign Currency Transactions: | | | | |
| Net realized gain on investments | | | 20,924 | |
| Net realized gain on written options | | | 1,325 | |
| Net realized gain on swap contracts | | | 94 | |
| Net realized loss on foreign currency contracts | | | (245 | ) |
| Net Realized Gain on Investments, Other Financial Instruments and Foreign Currency Transactions | | | 22,098 | |
| | | | | |
| Net Changes in Unrealized Depreciation of Investments, Other Financial Instruments and Foreign Currency Transactions: | | | | |
| Net unrealized depreciation of investments | | | (44,734 | ) |
| Net unrealized appreciation of swap contracts | | | 66 | |
| Net unrealized appreciation of foreign currency contracts | | | 245 | |
| Net unrealized appreciation on translation of other assets and liabilities in foreign currencies | | | — | |
| Net Changes in Unrealized Depreciation of Investments, Other Financial Instruments and Foreign Currency Transactions | | | (44,423 | ) |
| Net Loss on Investments, Other Financial Instruments and Foreign Currency Transactions | | | (22,325 | ) |
| Net Increase in Net Assets Resulting from Operations | | $ | 34,955 | |
The accompanying notes are an integral part of these financial statements.
| Hartford High Yield HLS Fund |
| Statement of Changes in Net Assets |
| |
| (000’s Omitted) |
| | | For the
Year Ended
December 31,
2011 | | | For the
Year Ended
December 31,
2010 | |
| Operations: | | | | | | | | |
| Net investment income | | $ | 57,280 | | | $ | 64,815 | |
| Net realized gain on investments and other financial instruments | | | 22,098 | | | | 63,363 | |
| Net unrealized depreciation of investments and other financial instruments | | | (44,423 | ) | | | (17,997 | ) |
| Net Increase In Net Assets Resulting From Operations | | | 34,955 | | | | 110,181 | |
| Distributions to Shareholders: | | | | | | | | |
| From net investment income | | | | | | | | |
| Class IA | | | (49,277 | ) | | | (3,774 | ) |
| Class IB | | | (14,302 | ) | | | (1,226 | ) |
| Total distributions | | | (63,579 | ) | | | (5,000 | ) |
| Capital Share Transactions: | | | | | | | | |
| Class IA | | | | | | | | |
| Sold | | | 148,789 | | | | 190,974 | |
| Issued on reinvestment of distributions | | | 49,277 | | | | 3,774 | |
| Redeemed | | | (229,731 | ) | | | (198,912 | ) |
| Total capital share transactions | | | (31,665 | ) | | | (4,164 | ) |
| Class IB | | | | | | | | |
| Sold | | | 42,743 | | | | 46,511 | |
| Issued on reinvestment of distributions | | | 14,302 | | | | 1,226 | |
| Redeemed | | | (76,938 | ) | | | (75,736 | ) |
| Total capital share transactions | | | (19,893 | ) | | | (27,999 | ) |
| Net decrease from capital share transactions | | | (51,558 | ) | | | (32,163 | ) |
| Net Increase (Decrease) In Net Assets | | | (80,182 | ) | | | 73,018 | |
| Net Assets: | | | | | | | | |
| Beginning of period | | | 788,850 | | | | 715,832 | |
| End of period | | $ | 708,668 | | | $ | 788,850 | |
| Undistributed (distribution in excess of) | | | | | | | | |
| net investment income | | $ | 57,146 | | | $ | 63,788 | |
| Shares: | | | | | | | | |
| Class IA | | | | | | | | |
| Sold | | | 16,247 | | | | 22,498 | |
| Issued on reinvestment of distributions | | | 5,892 | | | | 443 | |
| Redeemed | | | (24,914 | ) | | | (23,540 | ) |
| Total share activity | | | (2,775 | ) | | | (599 | ) |
| Class IB | | | | | | | | |
| Sold | | | 4,716 | | | | 5,523 | |
| Issued on reinvestment of distributions | | | 1,731 | | | | 145 | |
| Redeemed | | | (8,423 | ) | | | (9,090 | ) |
| Total share activity | | | (1,976 | ) | | | (3,422 | ) |
The accompanying notes are an integral part of these financial statements.
| Hartford High Yield HLS Fund |
| Notes to Financial Statements |
| December 31, 2011 |
| (000’s Omitted) |
Hartford High Yield HLS Fund (the “Fund”) serves as an underlying investment option for certain variable annuity and variable life insurance separate accounts of Hartford Life Insurance Company (“HLIC”) and its affiliates and certain qualified retirement plans. The Fund may also serve as an underlying investment option for certain variable annuity and variable life separate accounts of other insurance companies. Owners of variable annuity contracts and policyholders of variable life insurance contracts may choose the funds permitted in the variable insurance contract prospectus. In addition, participants in certain qualified retirement plans may choose the Fund if permitted by their plans.
Hartford Series Fund, Inc. (the “Company”) is an open-end registered management investment company comprised of thirty portfolios. Financial Statements for the Fund, a series of the Company, are included in this report.
The Company is organized under the laws of the State of Maryland and is registered with the Securities and Exchange Commission (“SEC”) under the Investment Company Act of 1940, as amended (“1940 Act”). The Fund is a diversified open-end management investment company.
The Fund is divided into Class IA and Class IB shares. Each class is offered at the per share net asset value (“NAV”) without a sales charge and is subject to the same expenses, except that the Class IB shares are subject to distribution and service fees charged pursuant to a Distribution Plan adopted in accordance with Rule 12b-1 under the 1940 Act.
| 2. | Significant Accounting Policies: |
The following is a summary of significant accounting policies of the Fund in the preparation of its financial statements, which are in accordance with the United States Generally Accepted Accounting Principles (“U.S. GAAP”). The preparation of financial statements in accordance with U.S. GAAP may require management to make estimates and assumptions that affect the reported amounts of assets and liabilities and disclosure of contingent assets and liabilities at the date of the financial statements and the reported amounts of increases and decreases in net assets from operations during the reporting period. Actual results could differ from those estimates.
| a) | Determination of Net Asset Value – The NAV of each class of the Fund’s shares is determined as of the close of regular trading (normally 4:00 p.m. Eastern Time) (the “NYSE Close”) on each day that the New York Stock Exchange (the “Exchange”) is open (“Valuation Date”). Information that becomes known to the Fund after the NAV has been calculated on a particular day will not generally be used to retroactively adjust the NAV determined earlier that day. |
| b) | Investment Valuation and Fair Value Measurements – For purposes of calculating the NAV, portfolio securities and other assets held by the Fund's portfolio for which market quotes are readily available are valued at market value. Market value is generally determined on the basis of last reported sales prices or official close price. If no sales are reported, market value is based on quotes obtained from a quotation reporting system, established market makers, or independent pricing services. If market prices are not readily available or are deemed unreliable, the Fund will use the fair value of the security as determined in good faith under policies and procedures established by and under the supervision of the Company’s Board of Directors. Market quotes are considered not readily available where there is an absence of current or reliable market-based data (e.g., trade information or broker quotes), including where events occur after the close of the relevant market, but prior to the NYSE Close that materially affect the values of the Fund’s portfolio securities or assets. In addition, market quotes are considered not readily available when, due to extraordinary circumstances, the exchanges or markets on which the securities trade do not open for trading for the entire day and no other market prices are available. In addition, prices of foreign equities that are principally traded on certain foreign markets are adjusted daily pursuant to a fair value pricing service approved by the Board of Directors in order to reflect an adjustment for the factors occurring after the close of certain foreign markets but before the NYSE Close. Securities that are primarily traded on foreign markets may trade on days that are not business days of the Fund. The value of the foreign securities in |
| Hartford High Yield HLS Fund |
| Notes to Financial Statements – (continued) |
| December 31, 2011 |
| (000’s Omitted) |
which the Fund invests may change on days when a shareholder will not be able to purchase or redeem shares of the Fund. Fair value pricing is subjective in nature and the use of fair value pricing by the Fund may cause the NAV of its shares to differ significantly from the NAV that would have been calculated using market prices at the close of the exchange on which a portfolio security is primarily traded. There can be no assurance that the Fund could obtain the fair market value assigned to a security if the Fund were to sell the security at approximately the time at which the Fund determines its NAV.
Fixed income securities (other than short term obligations) and non-exchange traded derivatives held by the Fund are normally valued on the basis of quotes obtained from brokers and dealers or independent pricing services in accordance with procedures established by the Company’s Board of Directors. Prices obtained from independent pricing services use information provided by market makers or estimates of market values obtained from yield data relating to investments or securities with similar characteristics. Generally, the Fund may use fair valuation in regard to fixed income securities when the Fund holds defaulted or distressed securities or securities in a company in which a reorganization is pending. Short-term investments maturing in 60 days or less are generally valued at amortized cost, if their original term to maturity was 60 days or less, or by amortizing their value on the 61st day prior to maturity, if the original term to maturity exceeded 60 days.
Exchange traded options, futures and options on futures are valued at the settlement price determined by the relevant exchange as of the NYSE Close. If such instruments do not trade on an exchange, values may be supplied by an independent pricing service using a formula or other objective method that may take into consideration the style, direction, expiration, strike price, notional value and volatility or other adjustments.
Investments valued in currencies other than U.S. dollars are converted to U.S. dollars using exchange rates obtained from independent pricing services for calculation of the NAV. As a result, the NAV of the Fund’s shares may be affected by changes in the value of currencies in relation to the U.S. dollar. The value of securities traded in markets outside the United States or denominated in currencies other than the U.S. dollar may be affected significantly on a day that the NYSE is closed and the market value may change on days when an investor is not able to purchase, redeem or exchange shares of the Fund.
Foreign currency contracts represent agreements to exchange currencies on specific future dates at predetermined rates. Foreign currency contracts are valued using foreign currency exchange rates and forward rates as provided by an independent pricing service on the Valuation Date.
Investments in open-end mutual funds are valued at the respective NAV of each open-end mutual fund on the Valuation Date.
Financial instruments for which prices are not available from an independent pricing service may be valued using market quotations obtained from one or more dealers that make markets in the respective financial instrument in accordance with procedures established by the Company’s Board of Directors.
U.S. GAAP defines fair value as the price that the Fund would receive to sell an asset or pay to transfer a liability in an orderly transaction between market participants. The U.S. GAAP fair value measurement standards require disclosure of a fair value hierarchy for each major category of assets and liabilities. Various inputs are used in determining the fair value of the Fund’s investments. These inputs are summarized into three broad hierarchy levels. This hierarchy is based on whether the valuation inputs are observable or unobservable. These levels are:
| · | Level 1 – Quoted prices in active markets for identical securities. Level 1 may include exchange traded instruments such as domestic equities, some foreign equities, options, futures, mutual funds, exchange traded funds, rights and warrants. |
| · | Level 2 – Observable inputs other than Level 1 prices, such as quoted prices for similar securities; quoted prices in markets that are not active; or other inputs that are observable or can be corroborated by observable market data. Level 2 may include debt securities that are traded less frequently than exchange traded instruments and which are valued using independent pricing services; foreign equities, that are principally traded on certain foreign markets and are adjusted daily pursuant to a fair value pricing service in order to reflect an adjustment for the factors occurring after the close of certain foreign markets but before the NYSE Close; and short-term securities, which are valued at amortized cost. |
| · | Level 3 – Significant unobservable inputs that are supported by limited or no market activity. Level 3 may include financial instruments whose values are determined using broker quotes or require significant management judgment or estimation. These unobservable valuation inputs may include estimates for current yields, maturity/duration, prepayment speed, and broker quotes for comparable securities along with other assumptions relating to credit quality, collateral value, complexity of the security structure, general market conditions and liquidity. This category may include securities where trading has been halted or there are certain restrictions on trading. While these securities are priced using unobservable inputs, the valuation of these securities reflects the best available data and management believes the prices are a reasonable representation of exit price. |
Valuation levels are not necessarily indicative of the risk associated with investing in such securities. Individual securities within any of the above mentioned asset classes may be assigned a different hierarchical level than those presented above, as individual circumstances dictate.
For additional information, refer to the Investment Valuation Hierarchy Level Summary and the Level 3 roll-forward reconciliation which follow the Schedule of Investments.
For purposes of reporting transfers between different hierarchy levels, both transfers in and out of each level, as applicable, are shown as if they occurred at the beginning of the period.
| c) | Security Transactions and Investment Income – Security transactions are recorded as of the trade date (the date the order to buy or sell is executed) for financial reporting purposes. Securities purchased or sold on a when-issued or delayed-delivery basis may be settled a month or more after the trade date. Realized gains and losses are determined on the basis of identified cost. |
Trade date for senior floating rate interests purchased in the primary loan market is considered the date on which the loan allocations are determined. Trade date for senior floating rate interests purchased in the secondary loan market is the date on which the transaction is entered into.
Dividend income is recorded on the ex-dividend date, except certain dividends from foreign securities where the ex-dividend date may have passed are recorded as soon as the Fund is informed of the dividend. Interest income, including amortization of premium and accretion of discounts, is accrued on a daily basis. Paydown gains and losses on mortgage-related and other asset-backed securities are included in interest income in the Statement of Operations.
| d) | Foreign Currency Transactions – Assets and liabilities denominated in currencies other than U.S. dollars are translated into U.S. dollars at the exchange rates in effect on the valuation date. Purchases and sales of investment securities, income, and expenses are translated into U.S. dollars at the exchange rates on the dates of such transactions. |
The Fund does not isolate that portion of portfolio security valuation resulting from fluctuations in the foreign currency exchange rates from the fluctuations arising from changes in the market prices of securities held. Exchange rate fluctuations are included with the net realized and unrealized gain or loss on investments in the accompanying financial statements.
| Hartford High Yield HLS Fund |
| Notes to Financial Statements – (continued) |
| December 31, 2011 |
| (000’s Omitted) |
Net realized foreign exchange gains or losses arise from sales of foreign currencies and the difference between asset and liability amounts initially stated in foreign currencies and the U.S. dollar value of the amounts actually received or paid. Net unrealized foreign exchange gains or losses arise from changes in the value of other assets and liabilities at the end of the reporting period, resulting from changes in the exchange rates.
| e) | Joint Trading Account – The Fund may invest cash balances into a joint trading account that may be invested in one or more repurchase agreements. |
| f) | Fund Share Valuation and Dividend Distributions to Shareholders – Orders for the Fund’s shares are executed in accordance with the investment instructions of the contract holders and plan participants. The NAV of the Fund’s shares is determined as of the close of business on each business day of the Exchange. The NAV is determined separately for each class of shares of the Fund by dividing the Fund’s net assets attributable to that class by the number of shares of the class outstanding. Each class of shares offered by the Fund has equal rights as to assets and voting privileges (except that shareholders of a class have exclusive voting rights regarding any matter relating solely to that class of shares). Income and non-class specific expenses are allocated daily to each class on the basis of the relative net assets of the class. Realized and unrealized capital gains and losses are allocated daily based on the relative net assets of each class of shares of the Fund. |
Orders for the purchase of the Fund’s shares received prior to the close of the Exchange on any day the Exchange is open for business are priced at the NAV determined as of the close of the Exchange. Orders received after the close of the Exchange, or on a day on which the Exchange and/or the Fund is not open for business, are priced at the next determined NAV.
Dividends are declared pursuant to a policy adopted by the Company’s Board of Directors based upon the investment performance of the Fund. The policy of the Fund is to pay dividends from net investment income and realized capital gains, if any, at least once a year.
Distributions from net investment income, net realized capital gains and capital are determined in accordance with federal income tax regulations, which may differ from U.S. GAAP with respect to character and timing. These differences may include but are not limited to losses deferred due to wash sale adjustments, foreign currency gains and losses, adjustments related to Passive Foreign Investment Companies (“PFICs”), Real Estate Investment Trusts (“REITs”), Regulated Investment Companies (“RICs”), certain derivatives and partnerships. Permanent book and federal income tax basis differences relating to shareholder distributions will result in reclassifications to certain of the Fund’s capital accounts (see Federal Income Taxes: Reclassification of Capital Accounts note).
| 3. | Securities and Other Investments: |
| a) | Illiquid and Restricted Securities – The Fund is permitted to invest up to 15% of its net assets in illiquid securities. Illiquid securities are those that may not be sold or disposed of in the ordinary course of business within seven days, at approximately the price used to determine the Fund’s NAV. The Fund may not be able to sell illiquid securities or other investments when its sub-adviser considers it desirable to do so or may have to sell such securities or investments at a price that is lower than the price that could be obtained if the securities or investments were more liquid. A sale of illiquid securities or other investments may require more time and may result in higher dealer discounts and other selling expenses than does the sale of those that are liquid. Illiquid securities and investments also may be more difficult to value due to the unavailability of reliable market quotations for such securities or investments, and an investment in them may have an adverse impact on the Fund’s NAV. The Fund may also purchase certain restricted securities that can only be resold to certain qualified investors and may be determined to be liquid pursuant to policies and guidelines established by the Company’s Board of Directors. The Fund, as shown on the Schedule of Investments, had illiquid and/or restricted securities as of December 31, 2011. |
| b) | Securities Purchased on a When-Issued or Delayed-Delivery Basis – Delivery and payment for securities that have been purchased by the Fund on a forward commitment, or when-issued or delayed-delivery basis, take place beyond the customary settlement period. A fund may dispose of or renegotiate a delayed-delivery transaction after it is entered into, and may sell delayed-delivery securities before they are delivered, which may result in a realized gain or loss. During this period, such securities are subject to market fluctuations, and the Fund identifies securities segregated in its records with value at least equal to the amount of the commitment. The Fund, as shown on the Schedule of Investments, had when-issued or delayed delivery securities as of December 31, 2011. |
| c) | Senior Floating Rate Interests – The Fund, as shown on the Schedule of Investments, invests in senior floating rate interests. Senior floating rate interests hold the most senior position in the capital structure of a business entity (the “Borrower”), are typically secured by specific collateral and have a claim on the assets and/or stock of the Borrower that is senior to that held by subordinated debtholders and stockholders of the Borrower. Senior floating rate interests are typically structured and administered by a financial institution that acts as the agent of the lenders participating in the senior floating rate interest. The Fund may invest in multiple series or tranches of a senior floating rate interest, which may have varying terms and carry different associated risks. The Fund may also enter into unfunded loan commitments, which are contractual obligations for future funding. Unfunded loan commitments may include revolving credit facilities, which may obligate the Fund to supply additional cash to the borrower on demand. Unfunded loan commitments represent a future obligation in full. The Fund may receive a commitment fee based on the undrawn portion of the underlying line of credit portion of a senior floating rate interest. In certain circumstances, the Fund may receive various fees upon the restructure of a senior floating rate interest by a borrower. Fees earned/paid may be recorded as a component of income or realized gain/loss in the Statement of Operations. |
Senior floating rate interests are typically rated below-investment-grade, which suggests they are more likely to default and generally pay higher interest rates than investment-grade loans. A default could lead to non-payment of income, which would result in a reduction of income to the Fund, and there can be no assurance that the liquidation of any collateral would satisfy the Borrower’s obligation in the event of non-payment of scheduled interest or principal payments, or that such collateral could be readily liquidated.
| d) | Mortgage Related and Other Asset Backed Securities – The Fund may invest in mortgage related and other asset backed securities. These securities include mortgage pass-through securities, collateralized mortgage obligations, commercial mortgage backed securities, stripped mortgage backed securities, asset backed securities, collateralized debt obligations and other securities that directly or indirectly represent a participation in, or are secured by and payable from, mortgage loans on real property. Mortgage related securities are created from pools of residential or commercial mortgage loans, including mortgage loans made by savings and loan institutions, mortgage bankers, commercial banks and others. Asset backed securities are created from many types of assets, including auto loans, credit card receivables, home equity loans, and student loans. These securities provide a monthly payment which consists of both interest and principal payments. Interest payments may be determined by fixed or adjustable rates. The rate of pre-payments on underlying mortgages will affect the price and volatility of a mortgage related security, and may have the effect of shortening or extending the effective duration of the security relative to what was anticipated at the time of purchase. The timely payment of principal and interest of certain mortgage related securities is guaranteed by the full faith and credit of the United States Government. Pools created and guaranteed by non-governmental issuers, including government-sponsored corporations, may be supported by various forms of insurance or guarantees, but there can be no assurance that the private insurers or guarantors can meet their obligations under the insurance policies or guarantee arrangements. The Fund, as shown on the Schedule of Investments, had mortgage related and other asset backed securities as of December 31, 2011. |
| 4. | Financial Derivative Instruments: |
The following disclosures contain information on how and why the Fund uses derivative instruments, the credit-risk-related contingent features in certain derivative instruments, and how derivative instruments affect the Fund’s financial position and results of operations. The location and fair value amounts of these instruments on the Statement of Assets and Liabilities and the realized gains and losses and changes in unrealized gains and losses on the Statement of
| Hartford High Yield HLS Fund |
| Notes to Financial Statements – (continued) |
| December 31, 2011 |
| (000’s Omitted) |
Operations, each categorized by type of derivative contract, are included in the following Additional Derivative Instrument Information footnote. The derivative instruments outstanding as of period-end are disclosed in the notes to the Schedule of Investments and the amounts of realized gains and losses and changes in unrealized gains and losses on derivative instruments during the period are disclosed in the Statement of Operations.
| a) | Foreign Currency Contracts – The Fund may enter into foreign currency contracts that obligate the Fund to purchase or sell currencies at specified future dates. Foreign currency contracts are used to hedge the currency exposure associated with some or all of the Fund's securities and/or as part of an investment strategy. Foreign currency contracts are marked to market daily and the change in value is recorded by the Fund as an unrealized gain or loss. The Fund will record a realized gain or loss when the foreign currency contract is settled. |
Foreign currency contracts involve elements of market risk in excess of the amounts reflected in the Statement of Assets and Liabilities. In addition, risks may arise upon entering into these contracts from the potential inability of the counterparties to meet the terms of the contracts and from unanticipated movements in the value of the foreign currencies relative to the U.S. dollar. The Fund had no outstanding foreign currency contracts as of December 31, 2011.
| b) | Options Contracts – An option contract is a contract sold by one party to another party that offers the buyer the right, but not the obligation, to buy (call) or sell (put) a security or other financial asset at an agreed-upon price during a specific period of time or on a specific date. The Fund may write (sell) covered call and put options on futures, swaps (“swaptions”), securities, commodities or currencies. “Covered” means that so long as the Fund is obligated as the writer of an option, it will own either the underlying securities or currency or an option to purchase the same underlying securities or currency having an expiration date of the covered option and an exercise price equal to or less than the exercise price of the covered option, or will pledge cash or other liquid securities having a value equal to or greater than the fluctuating market value of the option security or currency. Writing put options increases the Fund’s exposure to the underlying instrument. Writing call options decreases the Fund’s exposure to the underlying instrument. Premiums received from writing options that expire are treated as realized gains. Premiums received from writing options that are exercised or closed are added to the proceeds or offset against amounts paid on the underlying futures, swap, security or currency transaction to determine the realized gain or loss. The Fund as a writer of an option has no control over whether the underlying instrument may be sold (call) or purchased (put) and as a result bears the market risk of an unfavorable change in the price of the instrument underlying the written option. There is the risk the Fund may not be able to enter into a closing transaction because of an illiquid market. The Fund may also purchase put and call options. Purchasing call options increases the Fund’s exposure to the underlying instrument. Purchasing put options decreases the Fund’s exposure to the underlying instrument. The Fund pays a premium, which is included on the Fund’s Statement of Assets and Liabilities as an investment and is subsequently marked to market to reflect the current value of the option. Premiums paid for purchasing options that expire are treated as realized losses. Certain options may be purchased with premiums to be determined on a future date. The premiums for these options are based upon implied volatility parameters at specified terms. The risk associated with purchasing put and call options is generally limited to the premium paid. Premiums paid for purchasing options that are exercised or closed are added to the amounts paid or offset against the proceeds on the underlying investment transaction to determine the realized gain or loss. Entering into over-the-counter options also exposes the Fund to counterparty risk. Counterparty risk is the possibility that the counterparty to the agreements may default on its obligation to perform or disagree as to the meaning of the contractual terms in the agreements. The Fund had no outstanding purchased options contracts as of December 31, 2011. Transactions involving written options contracts for the Fund during the year ended December 31, 2011, are summarized below: |
| | | | Options Contract Activity During the
Year Ended December 31, 2011 | |
| | Call Options Written During the Year | | | Number of Contracts* | | | | Premium Amounts | |
| | Beginning of the year | | | — | | | $ | — | |
| | Written | | | 43,110,000 | | | | 670 | |
| | Expired | | | (43,110,000 | ) | | | (670 | ) |
| | Closed | | | — | | | | — | |
| | Exercised | | | — | | | | — | |
| | End of year | | | — | | | $ | — | |
| | | | | | | | | | |
| | Put Options Written During the Year | | | Number of Contracts* | | | | Premium Amounts | |
| | Beginning of the year | | | — | | | $ | — | |
| | Written | | | 27,060,000 | | | | 655 | |
| | Expired | | | (27,060,000 | ) | | | (655 | ) |
| | Closed | | | — | | | | — | |
| | Exercised | | | — | | | | — | |
| | End of year | | | — | | | $ | — | |
| * | The number of contracts does not omit 000's. |
| c) | Swap Agreements – The Fund may invest in swap agreements. Swap agreements are privately negotiated agreements between the Fund and a counterparty to exchange or swap investment cash flows, assets, foreign currencies or market-linked returns at specified future intervals. The Fund enters into credit default, total return, cross-currency, interest rate, inflation and other forms of swap agreements to manage its exposure to credit, currency, interest rate, commodity and inflation risk. Swap agreements are also used to gain exposure to certain markets. In connection with these agreements, securities or cash may be identified as collateral in accordance with the terms of the respective swap agreements to provide assets of value and recourse in the event of default or bankruptcy/insolvency. Swaps are valued based on custom valuations furnished by an independent pricing service. Swaps for which prices are not available from an independent pricing service are valued in accordance with procedures established by the Company’s Board of Directors, and the change in value, if any, is recorded as an unrealized gain or loss on the Statement of Assets and Liabilities. Payments received or made at the beginning of the measurement period are reflected as such on the Statement of Assets and Liabilities and represent payments made or received upon entering into the swap agreement to compensate for differences between the stated terms of the swap agreement and prevailing market conditions (credit spreads, currency exchange rates, interest rates, and other relevant factors). These upfront payments are recorded as realized gains or losses on the Statement of Operations upon termination or maturity of the swap. A liquidation payment received or made at the termination of the swap and some net periodic payments received or paid by the Fund are recorded as realized gains or losses on the Statement of Operations. Net periodic payments and some upfront payments received or paid by the Fund with regard to interest rate swaps are recorded as increases or decreases to income on the Statement of Operations. Entering into these agreements involves, to varying degrees, elements of credit, market and documentation risk in excess of the amounts recognized on the Statement of Assets and Liabilities. Such risks involve the possibility that there will be no liquid market for these agreements, that the counterparty to the agreements may default on its obligation to perform or disagree as to the meaning of contractual terms in the agreements, and that there may be unfavorable changes in interest rates. The Fund’s maximum risk of loss from counterparty credit risk is the discounted net value of the cash flows to be received from the counterparty over the contract’s remaining life, to the extent that amount is positive. The risk is mitigated by having a master netting arrangement between the Fund and the counterparty, which allows for the netting of payments made or received (although such amounts are presented on a gross basis within the Statement of Assets and Liabilities, as applicable) as well as the posting of collateral to the Fund to cover the Fund’s exposure to the counterparty. |
Credit Default Swap Agreements – The credit default swap market allows the Fund to manage its exposure to the market or certain sectors of the market, to reduce its risk exposure to defaults of corporate and sovereign issuers, or to create exposure to corporate or sovereign issuers to which it is not otherwise exposed. Certain credit default swaps involve the exchange of a fixed rate premium for protection against the loss in value of an underlying security in the event of a credit event, such as payment default or bankruptcy.
| Hartford High Yield HLS Fund |
| Notes to Financial Statements – (continued) |
| December 31, 2011 |
| (000’s Omitted) |
Under a credit default swap contract, one party acts as guarantor by receiving the fixed periodic payment in exchange for the commitment to purchase the underlying security at par if the defined credit event occurs. Upon the occurrence of a defined credit event, the difference between the value of the reference obligation and the swap’s notional amount is recorded as realized gain or loss on swap transactions in the Statement of Operations. A “buyer” of credit protection agrees to pay a counterparty to assume the credit risk of an issuer upon the occurrence of certain events. The “seller” of the protection receives periodic payments and agrees to assume the credit risk of an issuer upon the occurrence of certain events. Although specified events are contract specific, credit events are generally defined as bankruptcy, failure to pay, restructuring, obligation acceleration, obligation default, or repudiation/moratorium. A “seller’s” exposure is limited to the total notional amount of the credit default swap contract. These potential amounts would be partially offset by any recovery values of the respective referenced obligations or upfront payments received upon entering into the contract. The Fund will generally not buy protection on issuers that are not currently held by the Fund.
Implied credit spreads, represented in absolute terms, utilized in determining the market value of credit default swap contracts on corporate issues, sovereign issues of an emerging country or U.S. municipal issues as of period end are disclosed in the notes to the Schedule of Investments, as applicable, and serve as an indicator of the current status of the payment/performance risk and represent the likelihood or risk of default for the credit derivative. The implied credit spread of a particular referenced entity reflects the cost of buying/selling protection and may include upfront payments required to be made to enter into the contract. Wider credit spreads represent a deterioration of the referenced entity’s soundness and a greater likelihood or risk of default or other credit event occurring as defined under the terms of the contract. For credit default swap contracts on asset-backed securities and credit indices, the quoted market prices and resulting values serve as the indicator of the current status of the payment/performance risk. Increasing market values, in absolute terms when compared to the notional amount of the swap, represent a deterioration of the referenced equity’s credit soundness and a greater likelihood or risk of default or other credit event occurring as defined under the terms of the contract. The Fund had no outstanding credit default swaps as of December 31, 2011.
| d) | Additional Derivative Instrument Information: |
The volume of derivative activity was minimal during the year ended December 31, 2011.
The Effect of Derivative Instruments on the Statement of Operations for the year ended December 31, 2011:
| | | Risk Exposure Category | |
| | | Interest Rate
Contracts | | | Foreign
Exchange
Contracts | | | Credit
Contracts | | | Equity
Contracts | | | Commodity
Contracts | | | Other
Contracts | | | Total | |
| Realized Gain (Loss) on Derivatives Recognized as a Result of Operations: |
| Net realized gain on written options | | $ | — | | | $ | — | | | $ | 1,325 | | | $ | — | | | $ | — | | | $ | — | | | $ | 1,325 | |
| Net realized gain on swap contracts | | | — | | | | — | | | | 94 | | | | — | | | | — | | | | — | | | | 94 | |
| Net realized loss on foreign currency contracts | | | — | | | | (245 | ) | | | — | | | | — | | | | — | | | | — | | | | (245 | ) |
| Total | | $ | — | | | $ | (245 | ) | | $ | 1,419 | | | $ | — | | | $ | — | | | $ | — | | | $ | 1,174 | |
| | | | | | | | | | | | | | | | | | | | | | | | | | | | | |
| Net Change in Unrealized Appreciation (Depreciation) on Derivatives Recognized as a Result of Operations: |
| Net change in unrealized appreciation of swap contracts | | $ | — | | | $ | — | | | $ | 66 | | | $ | — | | | $ | — | | | $ | — | | | $ | 66 | |
| Net change in unrealized appreciation of foreign currency contracts | | | — | | | | 245 | | | | — | | | | — | | | | — | | | | — | | | | 245 | |
| Total | | $ | — | | | $ | 245 | | | $ | 66 | | | $ | — | | | $ | — | | | $ | — | | | $ | 311 | |
| a) | Credit and Counterparty Risks – Credit risk depends largely on the perceived financial health of bond issuers. In general, the credit rating is inversely related to the credit risk of the issuer. Higher rated bonds generally are deemed to have less |
credit risk, while lower or unrated bonds are deemed to have higher risk of default. The share price, yield and total return of a fund that holds securities with higher credit risk may be more volatile than those of a fund that holds bonds with lower credit risk. Similar to credit risk, the Fund may be exposed to counterparty risk, or the risk that an institution or other entity with which the Fund has unsettled or open transactions will default.
| b) | Market Risks – The Fund’s investments in derivatives and other financial instruments expose the Fund to various risks including, but not limited to, interest rate, prepayment, extension, foreign currency, and equity risks. Interest rate risk is the risk that fixed income securities will decline in value because of changes in interest rates. As nominal interest rates rise, the value of certain fixed income securities held by the Fund is likely to decrease. A nominal interest rate can be described as the sum of a real interest rate and an expected inflation rate. Fixed income securities with longer durations tend to be more sensitive to changes in interest rates, usually making them more volatile than securities with shorter durations. Duration is useful primarily as a measure of the sensitivity of a fixed income security’s market price to interest rate (i.e., yield) movements. Senior floating rate interests and securities subject to prepayment and extension risk generally offer less potential for gains when interest rates decline. In addition, securities are subject to extension risk. Rising interest rates may cause prepayments to occur at a slower than expected rate, thereby effectively lengthening the maturity of the security and making the security more sensitive to interest rate changes. Prepayment and extension risk are major risks of mortgage-backed securities, senior floating rate interests, and certain asset-backed securities. For certain asset-backed securities, the actual maturity may be less than the stated maturity shown in the Schedule of Investments, if applicable. As a result, the timing of income recognition relating to these securities may vary based upon the actual maturity. If a Fund invests directly in foreign currencies or in securities that trade in, and receive revenues in, foreign currencies, or in derivatives that provide exposure to foreign currencies, it will be subject to the risk that those currencies will decline in value relative to the base currency of the Fund, or, in the case of hedging positions, that the Fund’s base currency will decline in value relative to the currency being hedged. Currency rates in foreign countries may fluctuate significantly over short periods of time for a number of reasons, including changes in interest rates, intervention (or the failure to intervene) by U.S. or foreign governments, central banks or supranational entities, such as the International Monetary Fund, or by the imposition of currency controls or other political developments in the United States or abroad. As a result, the Fund’s investments in foreign currency denominated securities may reduce the returns of the Fund. The market values of equity securities, such as common stocks and preferred stocks, or equity related investments, such as futures and options, may decline due to general market conditions which are not specifically related to a particular company, such as real or perceived adverse economic conditions, changes in the general outlook for corporate earnings, changes in interest or currency rates or adverse investor sentiment generally. The market value of equity securities may also decline due to factors which affect a particular industry or industries, such as labor shortages or increased production costs and competitive conditions within an industry. Equity securities and equity related investments generally have greater market price volatility than fixed income securities. |
| a) | Federal Income Taxes – For federal income tax purposes, the Fund intends to continue to qualify as a RIC under Subchapter M of the Internal Revenue Code (“IRC”) by distributing substantially all of its taxable net investment income and net realized capital gains to its shareholders and otherwise complying with the requirements of RICs. The Fund has distributed substantially all of its income and capital gains in prior years, if applicable, and intends to distribute substantially all of its income and capital gains prior to the next fiscal year-end. Accordingly, no provision for federal income or excise taxes has been made in the accompanying financial statements. Distributions from short-term capital gains are treated as ordinary income distributions for federal income tax purposes. |
| b) | Net Investment Income (Loss), Net Realized Gains (Losses) – Net investment income (loss) and net realized gains (losses) may differ for financial statement and tax purposes primarily because of losses deferred due to wash sale adjustments, foreign currency gains and losses, adjustments related to PFICs, REITs, RICs, certain derivatives and partnerships. The character of distributions made during the year from net investment income or net realized gains may differ from their ultimate characterization for federal income tax purposes. Also, due to the timing of dividend |
| Hartford High Yield HLS Fund |
| Notes to Financial Statements – (continued) |
| December 31, 2011 |
| (000’s Omitted) |
distributions, the fiscal year in which amounts are distributed may differ from the year that the income or realized gains (losses) were recorded by the Fund.
| c) | Distributions and Components of Distributable Earnings – The tax character of distributions paid by the Fund for the periods indicated is as follows (as adjusted for dividends payable): |
| | | For the Year Ended
December 31, 2011 | | | For the Year Ended
December 31, 2010 | |
| Ordinary Income | | $ | 63,579 | | | $ | 5,000 | |
As of December 31, 2011, the Fund’s components of distributable earnings (deficit) on a tax basis were as follows:
| | | Amount | |
| Undistributed Ordinary Income | | $ | 57,180 | |
| Accumulated Capital and Other Losses* | | | (44,157 | ) |
| Unrealized Depreciation† | | | (9,787 | ) |
| Total Accumulated Earnings | | $ | 3,236 | |
| * | The Fund has capital loss carryforwards that are identified in the Capital Loss Carryforward note that follows. |
| † | The difference between book-basis and tax-basis unrealized appreciation (depreciation) may be attributable to the losses deferred due to wash sale adjustments, foreign currency gains and losses, adjustments related to PFICs, REITs, RICs, certain derivatives and partnerships. |
| d) | Reclassification of Capital Accounts – The Fund may record reclassifications in its capital accounts. These reclassifications have no impact on the total net assets of the Fund. The reclassifications are a result of permanent differences between U.S. GAAP and tax accounting for such items as foreign currency, PFICs, expiration or utilization of capital loss carryforwards or net operating losses. Adjustments are made to reflect the impact these items have on current and future distributions to shareholders. Therefore, the source of the Fund’s distributions may be shown in the accompanying Statement of Changes in Net Assets as from undistributed net investment income, from accumulated net realized gains on investments or from capital depending on the type of book and tax differences that exist. For the year ended December 31, 2011, the Fund recorded reclassifications to increase (decrease) the accounts listed below: |
| | | Amount | |
| Undistributed Net Investment Income | | $ | (343 | ) |
| Accumulated Net Realized Gain (Loss) | | | 343 | |
| e) | Capital Loss Carryforward – On December 22, 2010, the Regulated Investment Company Modernization Act of 2010 (the “Act”) was enacted, which made changes to the capital loss carryforward rules. The changes are effective for taxable years beginning after the date of enactment. Under the Act, funds are permitted to carry forward capital losses for an unlimited period. However, any losses incurred during those future taxable years will be required to be utilized prior to the losses incurred in pre-enactment taxable years, which carry an expiration date. As a result of this ordering rule, pre-enactment capital loss carryforwards may be more likely to expire unused. Additionally, post-enactment capital loss carryforwards will retain their character as either short-term or long-term capital losses rather than being considered all short-term as permitted under prior regulation. |
At December 31, 2011 (tax-year-end), the Fund had capital loss carryforwards for U.S. federal income tax purposes as follows:
| Year of Expiration | | Amount | |
| 2017 | | $ | 44,157 | |
| Total | | $ | 44,157 | |
As of December 31, 2011, the Fund utilized $23,678 of prior year capital loss carryforwards.
| f) | Accounting for Uncertainty in Income Taxes – The Fund has adopted financial reporting rules that require the Fund to analyze all open tax years, as defined by the statute of limitations, for all major jurisdictions. Generally, tax authorities can examine all tax returns filed for the last three years. The Fund does not have an examination in progress. |
The Fund has reviewed all open tax years and major jurisdictions and concluded that these financial reporting rules had no effect on the Fund’s financial position or results of operations. There is no tax liability resulting from unrecognized tax benefits relating to uncertain income tax positions taken or expected to be taken on the tax return for the fiscal year ended December 31, 2011. The Fund is also not aware of any tax positions for which it is reasonably possible that the total amounts of unrecognized tax benefits will significantly change in the next twelve months.
| a) | Investment Management Agreement – HL Investment Advisors, LLC (“HL Advisors”), an indirect wholly owned subsidiary of The Hartford Financial Services Group, Inc. (“The Hartford”), serves as investment manager to the Fund pursuant to an Investment Management Agreement with the Company. As investment manager, HL Advisors has overall investment supervisory responsibility for the Fund. In addition, HL Advisors provides administrative personnel, services, equipment, facilities and office space for proper operation of the Fund. HL Advisors has contracted with Hartford Investment Management Company (“Hartford Investment Management”) under a sub-advisory agreement for the provision of day-to-day investment management services to the Fund in accordance with the Fund’s investment objective and policies. The Fund pays a fee to HL Advisors, a portion of which may be used to compensate Hartford Investment Management. |
The schedule below reflects the rates of compensation paid to HL Advisors for investment management services rendered as of December 31, 2011; the rates are accrued daily and paid monthly.
| Average Daily Net Assets | | Annual Fee | |
| On first $500 million | | | 0.7000 | % |
| On next $500 million | | | 0.6750 | % |
| On next $4 billion | | | 0.6250 | % |
| On next $5 billion | | | 0.6050 | % |
| Over $10 billion | | | 0.5950 | % |
Effective March 1, 2012, HL Advisors will be paid compensation for investment management services according to the following schedule:
| Average Daily Net Assets | | Annual Fee | |
| On first $500 million | | | 0.7000 | % |
| On next $500 million | | | 0.6750 | % |
| On next $1.5 billion | | | 0.6250 | % |
| On next $2.5 billion | | | 0.6150 | % |
| On next $5 billion | | | 0.6050 | % |
| Over $10 billion | | | 0.5950 | % |
| Hartford High Yield HLS Fund |
| Notes to Financial Statements – (continued) |
| December 31, 2011 |
| (000’s Omitted) |
| b) | Accounting Services Agreement – Pursuant to the Fund Accounting Agreement between HLIC and the Company, on behalf of the Fund, HLIC provides accounting services to the Fund and receives monthly compensation based on the Fund’s average daily net assets at the rates set forth below. The Fund’s accounting services fees are accrued daily and paid monthly. |
| Average Daily Net Assets | | Annual Fee | |
| On first $5 billion | | | 0.018 | % |
| On next $5 billion | | | 0.016 | % |
| Over $10 billion | | | 0.014 | % |
Effective January 1, 2012, the accounting services fees based on the Fund’s average daily net assets were increased. The new accounting services fees schedule is as follows:
| Average Daily Net Assets | | Annual Fee | |
| On first $5 billion | | | 0.020 | % |
| On next $5 billion | | | 0.018 | % |
| Over $10 billion | | | 0.016 | % |
| c) | Operating Expenses – Allocable expenses incurred by the Company are allocated to each Fund and allocated to classes within a Fund in proportion to the average daily net assets of the Fund and each class, except where allocation of certain expenses is more fairly made directly to the Fund or to specific classes within a Fund. |
| d) | Fees Paid Indirectly – The Fund’s custodian bank has agreed to reduce its fees when the Fund maintains cash on deposit in a non-interest-bearing custody account. For the year ended December 31, 2011, these amounts, if any, are included in the Statement of Operations. |
The ratio of expenses to average net assets in the accompanying financial highlights excludes the reduction in expenses related to fees paid indirectly. The annualized expense ratio for the period listed below reflecting the reduction for fees paid indirectly is as follows:
| | | Year Ended
December 31, 2011 | |
| Class IA | | | 0.74 | % |
| Class IB | | | 0.99 | |
| e) | Distribution Plan for Class IB shares – The Company, on behalf of the Fund, has adopted a Distribution Plan pursuant to Rule 12b-1 of the 1940 Act to compensate the Distributor, Hartford Securities Distribution Company, Inc. (a wholly owned, ultimate subsidiary of The Hartford), from assets attributable to the Class IB shares for services rendered and expenses borne in connection with activities primarily intended to result in the sale of the Class IB shares, subject to the review and approval of the Company’s Board of Directors. |
The Distribution Plan provides that the Fund may pay annually up to 0.25% of the average daily net assets of the Fund attributable to its Class IB shares for activities primarily intended to result in the sale of Class IB shares. The Board has the authority to suspend or reduce these payments at any point in time. Under the terms of the Distribution Plan and the principal underwriting agreement, the Fund is authorized to make payments monthly to the Distributor that may be used to pay or compensate entities providing distribution and shareholder servicing with respect to the Class IB shares for such entities’ fees or expenses incurred or paid in that regard. These fees are accrued daily and paid monthly.
| f) | Other Related Party Transactions – Certain officers of the Fund are directors and/or officers of HL Advisors and/or The Hartford or its subsidiaries. For the year ended December 31, 2011, a portion of the Fund’s chief compliance officer’s salary was paid by all the investment companies in the Hartford fund complex. The portion allocated to the Fund was in the amount of $1. Hartford Administrative Services Company (“HASCO”), an indirect wholly owned subsidiary of The Hartford, provides transfer agent services to the Fund. HASCO was compensated on a per account basis for providing such services. The amount paid to HASCO can be found in the Statement of Operations. These fees are accrued daily and paid monthly. |
| g) | Payment from Affiliate – In July of 2007, The Hartford entered into a settlement with the Attorneys General of the states of New York, Connecticut and Illinois relating to market timing and the company's individual variable annuity contracts in which certain payments would be made directly to the variable annuity contract holders. The distribution plan provided that unclaimed money from the settlement would be distributed to certain HLS Funds that are investment options through a Hartford individual variable annuity contract. The unclaimed money was distributed to the Fund on September 18, 2009. |
The total return in the accompanying financial highlights includes a payment from an affiliate. Had the payment from the affiliate been excluded, the impact and total return for the period listed below would have been as follows:
| | | For the Year Ended December 31, 2009 | |
| | | Class IA | | | Class IB | |
| Impact from Payment from Affiliate for Attorneys General Settlement | | | 0.03% | | | | 0.03% | |
| Total Return Excluding Payment from Affiliate | | | 50.41 | | | | 50.04 | |
| 8. | Investment Transactions: |
For the year ended December 31, 2011, the Fund's aggregate purchases and sales of investment securities (excluding short-term investments) were as follows:
| | | Amount | |
| Cost of Purchases Excluding U.S. Government Obligations | | $ | 642,708 | |
| Sales Proceeds Excluding U.S. Government Obligations | | | 694,457 | |
| Cost of Purchases for U.S. Government Obligations | | | 118,555 | |
| Sales Proceeds for U.S. Government Obligations | | | 80,850 | |
The Fund is one of several Hartford funds that participate in a $500 million committed revolving line of credit facility. The facility is to be used for temporary or emergency purposes. Under the arrangement, the funds are required to own securities having a market value in excess of 300% of the total bank borrowings. The interest rate on borrowings varies depending on the nature of the loan. The facility also requires a fee to be paid based on the amount of the commitment. This commitment fee is allocated to all of the funds participating in the line of credit based on the average net assets of the funds. During the year ended December 31, 2011, the Fund did not have any borrowings under this facility.
| 10. | Industry Classifications: |
Other than the industry classifications “Other Investment Pools and Funds” and “Exchange Traded Funds,” equity industry classifications used in this report are the Global Industry Classification Standard, which was developed by and is the exclusive property and service mark of MSCI, Inc. and Standard & Poor’s.
| Hartford High Yield HLS Fund |
| Notes to Financial Statements – (continued) |
| December 31, 2011 |
| (000’s Omitted) |
Under the Company’s organizational documents, the Company shall indemnify its officers and directors to the full extent required or permitted under Maryland General Corporation Law and the federal securities laws. In addition, the Company, on behalf of the Fund, may enter into contracts that contain a variety of indemnifications. The Company’s maximum exposure under these arrangements is unknown. However, as of the date of these financial statements, the Company has not had prior claims or losses pursuant to these contracts and expects the risk of loss to be remote.
At its meeting held on February 1, 2012, the Board of Directors of the Company approved a change of sub-adviser for the Fund, a series of the Company, from Hartford Investment Management to Wellington Management Company, LLP. As part of this approval the Company’s Board of Directors approved a new sub-advisory agreement between HL Advisors and Wellington Management Company, LLP. The change in the Fund’s sub-adviser and implementation of the new sub-advisory agreement are expected to occur on March 5, 2012.
[This page is intentionally left blank]
| Hartford High Yield HLS Fund |
| Financial Highlights |
| - Selected Per-Share Data (A) - |
| Class | | Net Asset Value at Beginning of Period | | | Net Investment Income (Loss) | | | Payments from (to) Affiliate | | | Net Realized and Unrealized Gain (Loss) on Investments | | | Total from Investment Operations | | | Dividends from Net Investment Income | | | Distributions from Realized Capital Gains | | | Distributions from Capital | | | Total Distributions | | | Net Increase (Decrease) in Net Asset Value | | | Net Asset Value at End of Period | |
| |
| For the Year Ended December 31, 2011 (E) |
| IA | | $ | 9.15 | | | $ | 0.71 | | | $ | — | | | $ | (0.31 | ) | | $ | 0.40 | | | $ | (0.85 | ) | | $ | — | | | $ | — | | | $ | (0.85 | ) | | $ | (0.45 | ) | | $ | 8.70 | |
| IB | | | 9.04 | | | | 0.67 | | | | — | | | | (0.30 | ) | | | 0.37 | | | | (0.82 | ) | | | — | | | | — | | | | (0.82 | ) | | | (0.45 | ) | | | 8.59 | |
| | | |
| For the Year Ended December 31, 2010 (E) | | |
| IA | | | 7.94 | | | | 0.75 | | | | — | | | | 0.52 | | | | 1.27 | | | | (0.06 | ) | | | — | | | | — | | | | (0.06 | ) | | | 1.21 | | | | 9.15 | |
| IB | | | 7.86 | | | | 0.72 | | | | — | | | | 0.52 | | | | 1.24 | | | | (0.06 | ) | | | — | | | | — | | | | (0.06 | ) | | | 1.18 | | | | 9.04 | |
| | | |
| For the Year Ended December 31, 2009 (E) | | |
| IA | | | 5.73 | | | | 0.73 | | | | — | | | | 2.16 | | | | 2.89 | | | | (0.68 | ) | | | — | | | | — | | | | (0.68 | ) | | | 2.21 | | | | 7.94 | |
| IB | | | 5.68 | | | | 0.70 | | | | — | | | | 2.14 | | | | 2.84 | | | | (0.66 | ) | | | — | | | | — | | | | (0.66 | ) | | | 2.18 | | | | 7.86 | |
| | | |
| For the Year Ended December 31, 2008 | | |
| IA | | | 8.87 | | | | 0.83 | | | | — | | | | (3.12 | ) | | | (2.29 | ) | | | (0.85 | ) | | | — | | | | — | | | | (0.85 | ) | | | (3.14 | ) | | | 5.73 | |
| IB | | | 8.78 | | | | 0.83 | | | | — | | | | (3.11 | ) | | | (2.28 | ) | | | (0.82 | ) | | | — | | | | — | | | | (0.82 | ) | | | (3.10 | ) | | | 5.68 | |
| | | |
| For the Year Ended December 31, 2007 (E) | | |
| IA | | | 9.35 | | | | 0.71 | | | | — | | | | (0.45 | ) | | | 0.26 | | | | (0.74 | ) | | | — | | | | — | | | | (0.74 | ) | | | (0.48 | ) | | | 8.87 | |
| IB | | | 9.27 | | | | 0.68 | | | | — | | | | (0.45 | ) | | | 0.23 | | | | (0.72 | ) | | | — | | | | — | | | | (0.72 | ) | | | (0.49 | ) | | | 8.78 | |
| (A) | Information presented relates to a share outstanding throughout the indicated period. |
| (B) | The figures do not include sales charges or other fees which may be applied at the variable life insurance, variable annuity or qualified retirement plan product level. Any such additional sales charges or other fees would lower the Fund's performance. |
| (C) | Ratios do not reflect reductions for fees paid indirectly. Please see Fees Paid Indirectly in the Notes to Financial Statements. |
| (D) | Portfolio turnover rate is calculated on the basis of the Fund as a whole without distinguishing between the classes of shares issued. |
| (E) | Per share amounts have been calculated using the average shares method. |
| (F) | Total return without the inclusion of the Payment from (to) Affiliate can be found in Expenses in the accompanying Notes to Financial Statements. |
| - Ratios and Supplemental Data - |
| Total Return(B) | | | Net Assets at End of Period | | | Ratio of Expenses to Average Net
Assets Before Waivers(C) | | | Ratio of Expenses to Average Net
Assets After Waivers(C) | | | Ratio of Net Investment Income
(Loss) to Average Net Assets | | | Portfolio Turnover
Rate(D) | |
| | | | | | | | | | | | | | | | | | | | | | | |
| | | | | | | | | | | | | | | | | | | | | | | |
| | 4.69 | % | | $ | 548,608 | | | | 0.74 | % | | | 0.74 | % | | | 7.68 | % | | | 88 | % |
| | 4.44 | | | | 160,060 | | | | 0.99 | | | | 0.99 | | | | 7.43 | | | | — | |
| | | | | | | | | | | | | | | | | | | | | | | |
| | | | | | | | | | | | | | | | | | | | | | | |
| | 16.15 | | | | 602,493 | | | | 0.75 | | | | 0.75 | | | | 8.80 | | | | 139 | |
| | 15.86 | | | | 186,357 | | | | 1.00 | | | | 1.00 | | | | 8.57 | | | | — | |
| | | | | | | | | | | | | | | | | | | | | | | |
| | | | | | | | | | | | | | | | | | | | | | | |
| | 50.46 | (F) | | | 527,000 | | | | 0.75 | | | | 0.75 | | | | 10.32 | | | | 173 | |
| | 50.08 | (F) | | | 188,832 | | | | 1.00 | | | | 1.00 | | | | 10.08 | | | | — | |
| | | | | | | | | | | | | | | | | | | | | | | |
| | | | | | | | | | | | | | | | | | | | | | | |
| | (25.23 | ) | | | 293,839 | | | | 0.74 | | | | 0.74 | | | | 9.05 | | | | 101 | |
| | (25.42 | ) | | | 124,701 | | | | 0.99 | | | | 0.99 | | | | 8.76 | | | | — | |
| | | | | | | | | | | | | | | | | | | | | | | |
| | | | | | | | | | | | | | | | | | | | | | | |
| | 2.79 | | | | 460,243 | | | | 0.77 | | | | 0.72 | | | | 7.47 | | | | 148 | |
| | 2.53 | | | | 222,712 | | | | 1.02 | | | | 0.97 | | | | 7.20 | | | | — | |
| Report of Independent Registered Public Accounting Firm |
| The Board of Directors and Shareholders of |
| Hartford Series Fund, Inc. |
We have audited the accompanying statement of assets and liabilities, including the schedule of investments, of Hartford High Yield HLS Fund (one of the portfolios constituting Hartford Series Fund, Inc. (the Funds)) as of December 31, 2011, and the related statement of operations for the year then ended, the statements of changes in net assets for each of the two years in the period then ended, and the financial highlights for each of the five years in the period then ended. These financial statements and financial highlights are the responsibility of the Funds’ management. Our responsibility is to express an opinion on these financial statements and financial highlights based on our audits.
We conducted our audits in accordance with the standards of the Public Company Accounting Oversight Board (United States). Those standards require that we plan and perform the audit to obtain reasonable assurance about whether the financial statements and financial highlights are free of material misstatement. We were not engaged to perform an audit of the Funds’ internal control over financial reporting. Our audits included consideration of internal control over financial reporting as a basis for designing audit procedures that are appropriate in the circumstances, but not for the purpose of expressing an opinion on the effectiveness of the Funds’ internal control over financial reporting. Accordingly, we express no such opinion. An audit also includes examining, on a test basis, evidence supporting the amounts and disclosures in the financial statements and financial highlights, assessing the accounting principles used and significant estimates made by management, and evaluating the overall financial statement presentation. Our procedures included confirmation of securities owned as of December 31, 2011, by correspondence with the custodian, agent banks and brokers or by other appropriate auditing procedures where replies from agent banks and brokers were not received. We believe that our audits provide a reasonable basis for our opinion.
In our opinion, the financial statements and financial highlights referred to above present fairly, in all material respects, the financial position of Hartford High Yield HLS Fund of Hartford Series Fund, Inc. at December 31, 2011, the results of its operations for the year then ended, the changes in its net assets for each of the two years in the period then ended, and the financial highlights for each of the five years in the period then ended, in conformity with U.S. generally accepted accounting principles.
Minneapolis, MN
February 13, 2012
| Hartford High Yield HLS Fund |
| Directors and Officers (Unaudited) |
The Board of Directors of the Company appoints officers who are responsible for the day-to-day operations of the Fund and who execute policies formulated by the Directors. Each director serves until his or her death, resignation, or retirement or until the next annual meeting of shareholders is held or until his or her successor is elected and qualifies.
Directors and officers who are employed by or who have a financial interest in The Hartford are considered “interested” persons of the Fund pursuant to the 1940 Act. Each officer and two of the Company’s directors, as noted in the chart below, are “interested” persons of the Fund. Each director serves as a director for The Hartford Mutual Funds, Inc., The Hartford Mutual Funds II, Inc., Hartford Series Fund, Inc., Hartford HLS Series Fund II, Inc., and as a trustee for The Hartford Alternative Strategies Fund, which, as of December 31, 2011, collectively consist of 91 funds. Correspondence may be sent to directors and officers c/o Hartford Mutual Funds, P.O. Box 2999, Hartford, Connecticut 06104-2999, except that correspondence to Ms. Fagely may be sent to 500 Bielenberg Drive, Woodbury, Minnesota 55125.
The table below sets forth, for each director and officer, his or her name, year of birth, current position with the Company and date first elected or appointed to Hartford Series Fund, Inc. (“HSF”), and Hartford HLS Series Fund II, Inc. (“HSF2”), principal occupation, and, for directors, other directorships held. The Fund’s statement of additional information contains further information on the directors and is available free of charge by calling 1-800-862-6668 or writing to Hartford HLS Funds, c/o Individual Annuity Services, P.O. Box 5085, Hartford, CT 06102-5085.
Information on the aggregate remuneration paid to the directors of the Company can be found in the Statement of Operations herein. The Fund pays to The Hartford a portion of the chief compliance officer’s compensation, but does not pay salaries or compensation to any of their other officers or directors who are employed by The Hartford.
Non-Interested Directors
Lynn S. Birdsong (1946) Director since 2003, Co-Chairman of the Investment Committee
Mr. Birdsong is a private investor. Mr. Birdsong currently serves as a Director of the Sovereign High Yield Investment Company (April 2010 to current). Mr. Birdsong currently serves as an Independent Director of Nomura Partners Funds, Inc. (formerly, The Japan Fund) (March 2003 to current). From 2003 to March 2005, Mr. Birdsong was an independent director of the Atlantic Whitehall Funds. From 1979 to 2002, Mr. Birdsong was a managing director of Zurich Scudder Investments, an investment management firm. During his employment with Scudder, Mr. Birdsong was an Interested Director of The Japan Fund. Since 1981, Mr. Birdsong has been a partner in Birdsong Company, an advertising specialty firm.
Robert M. Gavin, Jr. (1940) Director since 2002 (HSF) and 1986 (HSF2), Chairman of the Board since 2004
Dr. Gavin is an educational consultant. Prior to September 1, 2001, he was President of Cranbrook Education Community and prior to July 1996, he was President of Macalester College, St. Paul, Minnesota.
Duane E. Hill (1945) Director since 2001 (HSF) and 2002 (HSF2), Chairman of the Nominating Committee
Mr. Hill is Partner of TSG Ventures L.P., a private equity investment company. Mr. Hill is a former partner of TSG Capital Group, a private equity investment firm that served as sponsor and lead investor in leveraged buyouts of middle market companies.
Sandra S. Jaffee (1941) Director since 2005
Ms. Jaffee served as Chairman (2008 to 2009) and Chief Executive Officer of Fortent (formerly Searchspace Group), a leading provider of compliance/regulatory technology to financial institutions from August 2005 to August 2009. From August 2004 to August 2005, Ms. Jaffee served as an Entrepreneur in Residence with Warburg Pincus, a private equity firm. From September 1995 to July 2004, Ms. Jaffee served as Executive Vice President at Citigroup, where she was President and Chief Executive Officer of Citibank’s Global Securities Services (1995 to 2003). Ms. Jaffe currently serves as a member of the Board of Directors of Broadridge Financial Solutions as well as a Trustee of Muhlenberg College.
William P. Johnston (1944) Director since 2005, Chairman of the Compliance Committee
In June 2006, Mr. Johnston was appointed as Senior Advisor to The Carlyle Group, a global private equity investment firm. In August 2007, Mr. Johnston was elected to the Board of Directors of LifeCare Holdings, Inc. In February 2008, Mr. Johnston was elected to the Board of Directors of HCR-ManorCare, Inc. In May 2006, Mr. Johnston was elected to the Supervisory Board of Fresenius Medical Care AG & Co. KGaA, after its acquisition of Renal Care Group, Inc. in March 2006. Mr. Johnston joined Renal Care Group in November 2002 as a member of the Board of Directors and served as Chairman of the Board from March 2003 through March 2006. Mr. Johnston served as a Director of MultiPlan, Inc. from July 2006 through August 2010. From September 1987 to December 2002, Mr. Johnston was with Equitable Securities Corporation (and its successors, SunTrust Equitable Securities and SunTrust Robinson Humphrey) serving in various investment banking and managerial positions, including Managing Director and Head of Investment Banking, Chief Executive Officer and Vice Chairman.
| Hartford High Yield HLS Fund |
| Directors and Officers (Unaudited) – (continued) |
Phillip O. Peterson (1944) Director since 2002 (HSF) and 2000 (HSF2), Chairman of the Audit Committee
Mr. Peterson is a mutual fund industry consultant. He was a partner of KPMG LLP (an accounting firm) until July 1999. Mr. Peterson joined William Blair Funds in February 2007 as a member of the Board of Trustees. From January 2004 to April 2005, Mr. Peterson served as Independent President of the Strong Mutual Funds.
Lemma W. Senbet (1946) Director since 2005
Dr. Senbet is the William E. Mayer Chair Professor of Finance and Director, Center for Financial Policy, at the University of Maryland, Robert H. Smith School of Business. He was chair of the Finance Department from 1998 to 2006. Previously he was a chaired professor of finance at the University of Wisconsin-Madison. Also, he was director of the Fortis Funds from March 2000 to July 2002. Dr. Senbet served the finance profession in various capacities, including as director of the American Finance Association and President of the Western Finance Association. In 2006, Dr. Senbet was inducted Fellow of Financial Management Association International for his career-long distinguished scholarship and professional service.
Interested Directors and Officers
David N. Levenson (1966) Director since 2010
Mr. Levenson currently serves as President of The Hartford’s Wealth Management business. He was appointed to this role in July 2010. Previously, Mr. Levenson served as Executive Vice President of Legacy Holdings for The Hartford from June 2009 to July 2010. From 2006 to 2009, Mr. Levenson was with Hartford Life Insurance K.K. where he served as President and Chief Executive Officer from 2007 to 2009. He served as Managing Director of Hartford Investment Management Company from 2005 to 2006. Additionally, Mr. Levenson serves as Executive Vice President of The Hartford and as President, Director and Chief Executive Officer of Hartford Life Insurance Company (“HLIC”) and Hartford Life, Inc. (“HL Inc.”).
Lowndes A. Smith (1939) Director since 1996 (HSF) and 2002 (HSF2), Co-Chairman of the Investment Committee
Mr. Smith served as Vice Chairman of The Hartford from February 1997 to January 2002, as President and Chief Executive Officer of HL Inc. from February 1997 to January 2002, and as President and Chief Operating Officer of The Hartford Life Insurance Companies from January 1989 to January 2002. Mr. Smith serves as a Director of White Mountains Insurance Group, Ltd., One Beacon Insurance and Symetra Financial and as a Managing Director of Whittington Gray Associates.
Other Officers
James E. Davey (1964) President and Chief Executive Officer since 2010
Mr. Davey serves as Executive Vice President of HLIC. Additionally, Mr. Davey serves as President, Chief Executive Officer and Manager of Hartford Investment Financial Services, Inc. (“HIFSCO”) and President, Chief Executive Officer and Manager of HL Advisors. Mr. Davey joined The Hartford in 2002.
Michael R. Dressen (1963) AML Compliance Officer since 2011
Mr. Dressen currently serves as Assistant Vice President of HLIC. He also serves as Chief Compliance Officer and AML Compliance Officer of Hartford Administrative Services Company (“HASCO”) and as Assistant Secretary and Compliance Officer of HIFSCO. Mr Dressen joined The Hartford in 2005 from State Farm Insurance Companies where he held various positions related to mutual funds, variable products, and property casualty insurance.
Tamara L. Fagely (1958) Vice President, Treasurer and Controller since 2002 (HSF) and 1993 (HSF2)
Ms. Fagely has been a Vice President of HASCO since 1998 and Chief Financial Officer since 2006. Currently Ms. Fagely is a Vice President of HLIC. She served as Assistant Vice President of HLIC from December 2001 through March 2005. In addition, Ms. Fagely is Controller and Chief Financial Officer of HIFSCO.
Dr. Robert J. Froehlich (1953) Senior Managing Director since 2009
Dr. Froehlich joined The Hartford as Senior Managing Director in September 2009. Prior to joining The Hartford, Dr. Froehlich served as Vice Chairman of Deutsche Asset Management from 1997-2009.
Edward P. Macdonald (1967) Vice President, Secretary and Chief Legal Officer since 2005
Mr. Macdonald serves as Vice President of HLIC and Chief Legal Officer of Mutual Funds and Vice President of HIFSCO. He also serves as Vice President and Secretary of HASCO, and Chief Legal Officer, Secretary and Vice President of HL Advisors. Mr. Macdonald joined The Hartford in 2005.
Vernon J. Meyer (1964) Vice President since 2006
Mr. Meyer serves as Senior Vice President of HLIC. He also serves as Senior Vice President of HIFSCO and HL Advisors. Mr. Meyer joined The Hartford in 2004.
Colleen B. Pernerewski (1969) Vice President and Chief Compliance Officer since 2010
Ms. Pernerewski serves as Vice President and Chief Investment Advisor Compliance Officer of HIFSCO and as Vice President and Chief Compliance Officer of HL Advisors. Ms. Pernerewski joined The Hartford in 2005 from Travelers Life and Annuity where she served as Counsel (2004-2005). Prior to Travelers Life and Annuity, Ms. Pernerewski held the position of Counsel at The Hartford (1998-2004).
Elizabeth L. Schroeder (1966) Vice President since 2010
Ms. Schroeder currently serves as Assistant Vice President of HLIC. Ms. Schroeder joined HLIC in 1991. She is also an Assistant Vice President of HASCO, HIFSCO and HL Advisors.
Martin Swanson (1962) Vice President since 2010
Mr. Swanson is a Vice President of HLIC. Mr. Swanson also serves as Vice President/Marketing for HIFSCO. Prior to joining HLIC in 1998, Mr. Swanson was a Vice President at PaineWebber, Inc.
Jane Wolak (1961) Vice President since 2009
Ms. Wolak currently serves as Senior Vice President of HLIC. Ms. Wolak joined HLIC as Vice President, Retail Product Services in May 2007. She is also Vice President of HASCO. Previously, Ms. Wolak was with Sun Life Financial where she held the position of Vice President, Service Center Operations from 2001-2007.
HOW TO OBTAIN A COPY OF THE FUND’S PROXY VOTING POLICIES AND VOTING RECORDS (UNAUDITED)
A description of the policies and procedures that the Fund uses to determine how to vote proxies relating to portfolio securities and a record of how the Fund voted any proxies for the twelve-month period ended June 30, 2011 are available (1) without charge, upon request, by calling 800-862-6668 and (2) on the SEC’s website at http://www.sec.gov.
QUARTERLY PORTFOLIO HOLDINGS INFORMATION (UNAUDITED)
The Fund files a complete schedule of portfolio holdings with the SEC for the first and third quarters of each fiscal year on Form N-Q. The Fund’s Forms are available (1) without charge, upon request, by calling 800-862-6668 and (2) on the SEC’s website at http://www.sec.gov. The Form N-Q may be reviewed and copied at the SEC’s Public Reference Room in Washington, DC. Information on the operation of the Public Reference Room may be obtained by calling 1-800-SEC-0330.
| Hartford High Yield HLS Fund |
| Expense Example (Unaudited) |
Your Fund's Expenses
As a shareholder of the Fund, you incur two types of costs: (1) transaction costs and (2) ongoing costs including investment management fees, distribution fees, and other fund expenses. This example is intended to help you understand your ongoing costs (in dollars) of investing in the Fund and to compare these costs with the ongoing costs of investing in other mutual funds. The example is based on an investment of $1,000 invested at the beginning of the period and held for the period of June 30, 2011 through December 31, 2011.
Actual Expenses
The first set of columns of the table below provides information about actual account values and actual expenses. You may use the information in this column, together with the amount you invested, to estimate the expenses that you paid over the period. Simply divide your account value by $1,000 (for example, an $8,600 account value divided by $1,000 = 8.6), then multiply the result by the number in the line under the heading entitled “Expenses Paid During Period” to estimate the expenses you paid on your account during this period.
Hypothetical Example for Comparison Purposes
The second set of columns of the table below provides information about hypothetical account values and hypothetical expenses based on the Fund’s actual expense ratio and an assumed rate of return of 5% per year before expenses, which is not the Fund’s actual return. The hypothetical account values and expenses may not be used to estimate the actual ending account balance or expenses you paid for the period. You may use this information to compare the ongoing costs of investing in the Fund and other funds. To do so, compare this 5% hypothetical example with the 5% hypothetical examples that appear in the shareholder reports of the other funds.
Please note that the expenses shown in the table are meant to highlight your ongoing costs only and do not reflect any transactional costs, such as sales charges (loads) and CDSC. Therefore, the second set of columns of the table is useful in comparing ongoing costs only, and will not help you determine the relative total costs of owning different funds. In addition, if these transactional costs were included, your costs would be higher. Expenses are equal to the Fund's annualized expense ratios multiplied by average account value over the period, multiplied by 184/365 (to reflect the one-half year period).
| | | Actual return | | | Hypothetical (5% return before expenses) | | | | | | |
| | | Beginning Account Value June 30, 2011 | | Ending Account Value December 31, 2011 | | Expenses paid during the period June 30, 2011 through December 31, 2011 | | | Beginning Account Value June 30, 2011 | | Ending Account Value December 31, 2011 | | Expenses paid during the period June 30, 2011 through December 31, 2011 | | Annualized expense ratio | | Days in the current 1/2 year | | Days in the full year |
| Class IA | | $1,000.00 | | $992.81 | | $3.72 | | | $1,000.00 | | $1,021.48 | | $3.77 | | 0.74% | | 184 | | 365 |
| Class IB | | $1,000.00 | | $991.58 | | $4.97 | | | $1,000.00 | | $1,020.21 | | $5.04 | | 0.99% | | 184 | | 365 |
| Hartford High Yield HLS Fund |
| Approval of Investment Management and Investment Sub-Advisory Agreements (Unaudited) |
Section 15(c) of the Investment Company Act of 1940, as amended (the “1940 Act”), requires that each mutual fund’s board of directors, including a majority of those directors who are not “interested persons” of the mutual fund, as defined in the 1940 Act (the “Independent Directors”), annually review and consider the continuation of the mutual fund’s investment advisory and sub-advisory agreements. At its meeting held on August 2-3, 2011, the Board of Directors (the “Board”) of Hartford Series Fund, Inc., including each of the Independent Directors, unanimously voted to approve the continuation of the investment management agreement for Hartford High Yield HLS Fund (the “Fund”) with HL Investment Advisors, LLC (“HL Advisors”) and the continuation of the investment sub-advisory agreement between HL Advisors and the Fund’s sub-adviser, Hartford Investment Management Company (the “Sub-adviser,” and together with HL Advisors, the “Advisers”) (collectively, the “Agreements”).
In the months preceding the August 2-3, 2011 meeting, the Board requested, received, and reviewed written responses from the Advisers to questions posed to them on behalf of the Independent Directors and supporting materials relating to those questions and responses. The Board considered information furnished to the Board at its meetings throughout the year, as well as information specifically prepared in connection with the annual approval of the Agreements at the Board’s meetings held on June 21-22, 2011 and August 2-3, 2011. Information provided to the Board at its meetings throughout the year included, among other things, reports on Fund performance, legal and compliance matters, sales and marketing activity, shareholder services, and the other services provided to the Fund by the Advisers and their affiliates. In addition, the Board received in-person presentations by Fund officers and representatives of HL Advisors at the Board’s meetings on June 21-22, 2011 and August 2-3, 2011 concerning the Agreements.
The Independent Directors, advised by independent legal counsel, engaged two service providers to assist them with evaluating the Agreements with respect to the Fund. Lipper Inc. (“Lipper”), an independent provider of investment company data, was retained to provide the Board with reports on how the Fund’s contractual management fees, actual management fees, other non-management fees, overall expense ratios and investment performance compared to those of mutual funds with similar investment objectives. The Independent Directors also engaged an independent financial services consulting firm (the “Consultant”) to assist them in evaluating the Fund’s management fees, sub-advisory fees, other non-management fees, overall expense ratios and investment performance. In addition, the Consultant reviewed the profitability calculations utilized by HL Advisors in connection with the continuation of the investment management agreement.
In determining to continue the Agreements for the Fund, the members of the Board reviewed and evaluated information and factors they believed to be relevant and appropriate in light of the information that the Board deemed necessary and appropriate through the exercise of their reasonable business judgment. While individual members of the Board may have weighed certain factors differently, the Board’s determination to continue the Agreements was based on a comprehensive consideration of all information provided to the Board throughout the year and specifically with respect to the continuation of the Agreements. A more detailed discussion of the factors the Board considered with respect to its approval of the Agreements is provided below.
Nature, Extent, And Quality Of Services Provided by the Advisers
The Board requested and considered information concerning the nature, extent, and quality of the services provided to the Fund by the Advisers. The Board considered, among other things, the terms of the Agreements and the range of services provided by the Advisers. The Board considered the Advisers’ professional personnel who provide services to the Fund, including each Adviser’s ability and experience in attracting and retaining qualified personnel to service the Fund. The Board considered each Adviser’s reputation and overall financial strength, as well as its willingness to consider and implement organizational and operational changes designed to improve services to the Fund. In addition, the Board considered the quality of each Adviser’s communications with the Board and responsiveness to Board inquiries.
The Board also requested and evaluated information concerning each Adviser’s regulatory and compliance environment. In this regard, the Board requested and reviewed information on each Adviser’s compliance policies and procedures, compliance history, and a report from the Fund’s Chief Compliance Officer on each Adviser’s compliance with applicable laws and regulations, including responses to regulatory developments and compliance issues raised by regulators. The Board also noted the Advisers’ support of the Fund’s compliance control structure, particularly the resources devoted by the Advisers in support of the Fund’s obligations pursuant to Rule 38a-1 under the 1940 Act.
| Hartford High Yield HLS Fund |
| Approval of Investment Management and Investment Sub-Advisory Agreements (Unaudited) – (continued) |
With respect to HL Advisors, the Board noted that under the Agreements, HL Advisors is responsible for the management of the Fund, including overseeing fund operations and service providers, as well as investment advisory services in connection with selecting, monitoring and supervising the Sub-adviser. The Board considered HL Advisors’ ongoing monitoring of people, process and performance, including its quarterly reviews of each of the Hartford HLS Funds, semi-annual meetings with the leaders of each Fund’s portfolio management team, and oversight of the Funds’ 49 portfolio managers. The Board recognized that HL Advisors has demonstrated a record of making changes to the management and/or strategies of the Funds when warranted. The Board considered HL Advisors’ oversight of the Sub-adviser’s investment approach and results, process for monitoring best execution of portfolio trades by the Sub-adviser, and approach to risk management with respect to the Fund and the service providers to the Fund. The Board also considered HL Advisors’ oversight of compliance with the Fund’s objective and policies as well as with applicable laws and regulations, noting that regulatory and other developments had over time led to an increase in the scope of HL Advisors’ services in this regard. In addition, the Board considered HL Advisors’ ongoing commitment to review and rationalize the Hartford fund family’s product line-up and the expenses that HL Advisors had incurred in connection with fund combinations in recent years. The Board considered that HL Advisors or its affiliates are responsible for providing the Fund’s officers. The Board also noted that Hartford Life Insurance Company (“HLIC”) provides administrative services to the Fund. The Board considered its experiences with HL Advisors and HLIC with respect to each of these services.
With respect to the Sub-adviser, who provides day-to-day portfolio management services, the Board considered the quality of the Fund’s portfolio managers, the Sub-adviser’s other investment personnel, its investment philosophy and process, investment research capabilities and resources, performance record, trade execution capabilities and experience. The Board considered the experience of the Fund’s portfolio managers, the number of accounts managed by the portfolio managers, and the Sub-adviser’s method for compensating the portfolio managers.
Based on these considerations, the Board concluded that it was satisfied with the nature, extent and quality of the services provided to the Fund by HL Advisors and the Sub-adviser.
Performance of the Fund and the Advisers
The Board considered the investment performance of the Fund. In this regard, the Board reviewed the performance of the Fund over different time periods presented in the materials and evaluated HL Advisors’ analysis of the Fund’s performance for these time periods. The Board considered information and materials provided to the Board by the Advisers concerning Fund performance, as well as information from Lipper comparing the investment performance of the Fund to an appropriate benchmark and universe of peer funds. The Board noted that the performance of the Fund was within expectations.
The Board considered the detailed investment analytics reports provided by The Hartford’s Investment Advisory Group throughout the year. These reports include, among other things, information on the Fund’s gross and net returns, the Fund’s investment performance relative to an appropriate benchmark and peer group, various statistics concerning the Fund’s portfolio, and a narrative summary of various factors affecting Fund performance. The Board considered the Advisers’ cooperation with the Investment Committee, which assists the Board in evaluating the performance of the Fund at periodic meetings throughout the year. The Board also considered the analysis provided by the Consultant relating to the Fund’s performance track record.
In light of all the considerations noted above, the Board concluded that it had continued confidence in HL Advisors’ and the Sub-adviser’s overall capabilities to manage the Fund.
Costs of the Services and Profitability of the Advisers
The Board reviewed information regarding HL Advisors’ cost to provide investment management and related services to the Fund and HL Advisors’ profitability, both overall and for the Fund, on a pre-tax basis without regard to distribution expenses. The Board also requested and reviewed information about the profitability to HL Advisors and its affiliates from all services provided to the Fund and all aspects of their relationship with the Fund. The Board noted that the fees payable to the Sub-adviser are equal to its estimated costs in providing sub-advisory services. Accordingly, the costs and profitability for the Sub-adviser and HL Advisors were considered in the aggregate.
The Board considered the Consultant’s review of the profitability calculations utilized by HL Advisors in connection with the continuation of the investment management agreement. In this regard, the Consultant reported that The Hartford’s process for calculating and reporting Fund profitability is reasonable, sound and well within common industry practice.
Based on these considerations, the Board concluded that the profits anticipated to be realized by the Advisers and their affiliates from their relationships with the Fund would not be excessive.
Comparison of Fees and Services Provided by the Advisers
The Board considered comparative information with respect to the management fees to be paid by the Fund to HL Advisors and the total expense ratios of the Fund. The Board also considered comparative information with respect to the sub-advisory fees to be paid by HL Advisors to the Sub-adviser, to the extent applicable. In this regard, the Board requested and reviewed information from HL Advisors and the Sub-adviser relating to the management and sub-advisory fees and total operating expenses for the Fund. The Board considered that the management fee for the Fund includes the fee paid to HLIC for providing certain administrative services to the Fund. The Board also reviewed information from Lipper comparing the Fund’s contractual management fees, actual management fees and overall expense ratios relative to a group of funds selected by Lipper, in consultation with the Consultant, and a broader universe of funds selected by Lipper.
While the Board recognized that comparisons between the Fund and peer funds are imprecise, given the differing service levels and characteristics of mutual funds and the different business models and cost structures of the Advisers, the comparative information provided by Lipper assisted the Board in evaluating the reasonableness of the Fund’s management and sub-advisory fees and total operating expenses. In addition, the Board considered the analysis and recommendations of the Consultant relating to the Fund’s management and sub-advisory fees and total operating expenses.
Based on these considerations, the Board concluded that the Fund’s fees and total operating expenses, in conjunction with the information about quality of services, profitability, economies of scale, and other matters discussed, were reasonable in light of the services provided.
Economies of Scale
The Board requested and considered information regarding the Advisers’ realization of economies of scale with respect to the Fund and whether the fee levels reflect these economies of scale for the benefit of the Fund’s investors. With respect to HL Advisors, the Board considered representations from HL Advisors that it is difficult to anticipate whether and to what extent economies may be realized by HL Advisors as assets grow over time. The Board reviewed the breakpoints in the management fee schedule for the Fund, which reduces fee rates as Fund assets grow over time. The Board recognized that a fund with assets beyond the last breakpoint level will continue to benefit from economies of scale because additional assets are charged the lowest breakpoint fee resulting in lower overall effective management fee rates. The Board also recognized that a fee schedule that reaches a lower breakpoint quickly provides shareholders with the benefit of anticipated or potential economies of scale.
The Board reviewed and evaluated materials from Lipper showing how management fee schedules of peer funds reflect economies of scale for the benefit of investors as a peer fund’s assets hypothetically increase over time. Based on information provided by HL Advisors, Lipper, and the Consultant, the Board recognized that there is no uniform methodology for establishing breakpoints or uniform pattern in asset levels that trigger breakpoints or the amounts of breakpoints triggered.
After considering all of the information available to it, the Board concluded that it was satisfied with the extent to which economies of scale would be shared for the benefit of the Fund’s shareholders based on currently available information and the effective advisory fees and expense ratios for the Fund at its current and reasonably anticipated asset levels. The Board noted, however, that it would continue to monitor future growth in Fund assets and the appropriateness of additional breakpoints.
| Hartford High Yield HLS Fund |
| Approval of Investment Management and Investment Sub-Advisory Agreements (Unaudited) – (continued) |
Other Benefits
The Board considered other benefits to the Advisers and their affiliates from their relationships with the Fund, including the role of the Fund in supporting the variable life insurance and variable annuity products offered by The Hartford. The Board reviewed information noting that HLIC, an affiliate of HL Advisors, receives fees for providing certain administrative services to the Fund, and that HLIC also receives fees for fund accounting and related services from the Fund, and the Board considered information on expected profits to HLIC or its affiliates for such services. The Board also considered that Hartford Administrative Services Company (“HASCO”), the Fund’s transfer agent and an affiliate of HL Advisors, receives transfer agency compensation from the Fund, and the Board reviewed information on the expected profitability of the Fund’s transfer agency function to HASCO. The Board considered information provided by HASCO indicating that the transfer agent fees charged by HASCO to the Fund were fair and reasonable based on publicly available information.
The Board also considered that Hartford Securities Distribution Company, Inc., as principal underwriter of the Fund, receives 12b-1 fees from the Fund. The Board also noted that certain affiliates of HL Advisors distribute shares of the Fund and receive compensation in that connection.
The Board considered the benefits, if any, to the Sub-adviser from any use of the Fund’s brokerage commissions to obtain soft dollar research.
The Board considered the benefits to shareholders of being part of the Hartford family of funds. The Board considered HL Advisors’ efforts to provide investors in the family with a broad range of investment styles and asset classes.
* * * *
Based upon its review of these various factors, among others, the Board concluded that it is in the best interests of the Fund and its shareholders for the Board to approve the Agreements for an additional year. In reaching this decision, the Board did not assign relative weights to the factors discussed above or deem any one or group of them to be controlling in and of themselves. In connection with their deliberations, the Independent Directors met separately in executive session on several occasions, with independent legal counsel, to review the relevant materials and consider their responsibilities under relevant laws and regulations.
The Hartford
P.O. Box 5085
Hartford, CT 06102-5085
Hartford Series Fund, Inc. is underwritten and distributed by Hartford Securities Distribution Company, Inc.
"The Hartford" is The Hartford Financial Services Group, Inc. and its subsidiaries.
Hartford Series Fund, Inc. inception dates range from 1977 to date. Hartford Series Fund, Inc. is not a subsidiary of The Hartford but is underwritten, distributed by and advised by subsidiaries of The Hartford. Investments in Hartford Series Fund, Inc. are not guaranteed by The Hartford or any other entity.
You should carefully consider investment objectives, risks, and charges and expenses of Hartford HLS Funds before investing. This and other information can be found in the Fund’s prospectus or summary prospectus, which can be obtained by calling 800-862-6668. Please read them carefully before you invest or send money.
HLSAR-HY11 2-12 109078 Printed in U.S.A ©2011 The Hartford, Hartford, CT 06115 | |
A MESSAGE FROM THE PRESIDENT
Dear Fellow Shareholders:
I want to take this opportunity to say thank you for investing in Hartford HLS Funds.
This has been a tumultuous year. In the beginning of 2011, we witnessed tension-fueled political uprisings in the already-volatile Middle East and North Africa region. We also watched as Japan dealt with a series of crises including a massive earthquake and subsequent tsunami. Yet, U.S. economic conditions continued to improve, with gains in consumer confidence and retail sales. During the first half of 2011, domestic, international, and world indices (as measured by the S&P 500, MSCI EAFE and MSCI World) were all up more than 5% through June, 30 2011.
The economic recovery, however, lost momentum in the second half of 2011. The employment and housing markets both remain extremely challenged. Investors continue to be concerned about the implications of the European sovereign debt crisis, as well as our own high levels of domestic debt. Fears that the European sovereign debt crisis could continue to drag down the global economy have weighed heavily on stocks.
Ongoing apprehension regarding the U.S. debt ceiling during the summer and the resulting downgrade of the U.S. sovereign credit rating by Standard & Poor’s also contributed to weaker investor confidence.
There are, however, some reasons to remain confident. Corporations have record levels of cash on their balance sheets—corporate cash has doubled in the past 10 years. In addition, U.S. gross domestic product expanded at a 2.5 percent annual rate in the third quarter according to the Commerce Department, as consumers and businesses set aside fears about the recovery and stepped up spending. Corporate earnings have also remained positive, with a majority of companies beating expectations each quarter this year. This momentum will hopefully continue into next year.
As we head into 2012, in light of the continued market volatility, now would be a good time to schedule a meeting with your financial advisor to examine your current investment strategy and determine whether you are on the right track.
| • | Does your fixed-income portfolio complement your equity portfolio? |
| • | Are you receiving diversified sources of income? |
| • | Is your portfolio still in line with your risk tolerance and investment time horizon? |
Talk to your advisor to see what changes you should make to address these concerns and opportunities.
Thank you again for investing with Hartford HLS Funds.
James Davey
President
Hartford HLS Funds
Hartford Index HLS Fund
Table of Contents
This report is prepared for the general information of contract owners and qualified retirement plan participants. It is not an offer of contracts or of qualified retirement plans. It should not be used in connection with any offer, except in conjunction with the appropriate product prospectus which contains all pertinent information including the applicable sales, administrative and other charges.
The views expressed in the Fund’s Manager Discussion under ‘‘Why did the Fund perform this way?’’ and ‘‘What is the outlook?’’ are views of the Fund’s sub-adviser and portfolio management team through the end of the period and are subject to change based on market and other conditions.
Hartford Index HLS Fund inception 05/01/1987
(sub-advised by Hartford Investment Management Company)
Investment objective – Seeks to provide investment results which approximate the price and yield performance of publicly traded common stocks in the aggregate.

The chart above shows the growth of a $10,000 investment in Class IA. Growth results in classes other than Class IA will vary from what is seen above due to differences in the expenses charged to those share classes.
| Average Annual Total Returns (as of 12/31/11) |
| | 1 Year | 5 Year | 10 Year |
| Index IA | 1.81% | -0.51% | 2.58% |
| Index IB | 1.60% | -0.75% | 2.33% |
| S&P 500 Index | 2.09% | -0.25% | 2.92% |
| | | | |
PAST PERFORMANCE IS NOT INDICATIVE OF FUTURE RESULTS.
| Total returns presented above were calculated using the Fund's net asset value available to shareholders for sale or redemption of Fund shares on December 31, 2011, which may exclude investment transactions as of this date. |
| |
S&P 500 Index is a market capitalization-weighted price index composed of 500 widely held common stocks.
You cannot invest directly in an index.
The chart represents a hypothetical investment in the Fund. Performance data represents past performance and current performance could be higher or lower.
Performance information may reflect historical or current expense waivers/reimbursements from the investment adviser, without which performance would have been lower. For information on current expense waivers/reimbursements, please see the prospectus.
The value of the Fund will fluctuate so that when redeemed, it may be worth more or less than the original investment. The chart and table do not reflect the deductions of taxes, sales charges or other fees which may be applied at the variable life insurance, variable annuity or qualified retirement plan product level. Any such additional sales charges or other fees or expenses would lower the contract’s or plan’s performance.
Hartford Index HLS Fund
Manager Discussion (Unaudited)
December 31, 2011
| Portfolio Manager | | | |
| Deane Gyllenhaal | | | |
| Vice President | | | |
| | | | |
How did the Fund perform?
The Class IA shares of the Hartford Index HLS Fund returned 1.81% for the twelve-month period ended December 31, 2011, underperforming its benchmark, the S&P 500 Index, which returned 2.09%, and outperforming the Lipper S&P 500 Index VP-UF Funds category, a group of funds with investment strategies similar to those of the Fund, which returned 1.71%.
Why did the Fund perform this way?
By design, the Fund is managed to mimic the performance of the S&P 500 Index. Due to this approach, the Fund is expected to perform in line with the Index. However, we do not purchase the stock of our parent, The Hartford Financial Services Group, Inc. (HIG). This exposure to HIG is reallocated across the Life/Health, Property/Casualty and Multi-line Insurance industries. The performance of the Fund marginally differed from the benchmark over the period, primarily due to trading in futures contracts, minimal cash exposure, and lack of exposure to HIG.
Most of the sectors, as defined by the Global Industry Classification Standard (GICS), within the index had positive returns during 2011. Utilities rose the most, up 20% for the twelve month period. Consumer Staples added 14% and Health Care gained 13%. Heavily weighted Financials declined the most, down 17%, causing a drag on the overall index. Materials was also down 10%.
On a stock level, the best index performers for the year included Cabot Oil & Gas gaining 100.9%, then El Paso Corp. which returned 93.5%, and Intuitive Surgical rounded out the top three up 79.6%. On the negative side, the bottom two performers were First Solar which dropped 74.1%, and Monster Worldwide, which fell 66.4%.
What is the outlook?
Although U.S. economic data has improved and U.S. recession risks seemed to have eased, the European debt crisis seems unabated, if not spreading. It is possible we are seeing the beginnings of a decoupling of U.S. macro concerns from Europe. Much of the macro economic data, while improved, is still – on the whole – weak and we believe remains a significant barrier to growth. Investor sentiment is another significant barrier to long term fundamental growth. We believe investors are still minding geopolitical risks, and assessing whether either macroeconomic events or fundamentals are the drivers of market returns.
The Fund will continue to be fully invested in the S&P 500 Index, with a focus on risk control and efficient trading. Performance of the Fund is expected to mirror the return of the Index.
| Diversification by Industry |
| as of December 31, 2011 |
| Industry (Sector) | | Percentage of Net Assets | |
| Automobiles & Components (Consumer Discretionary) | | | 0.7 | % |
| Banks (Financials) | | | 2.7 | |
| Capital Goods (Industrials) | | | 8.1 | |
| Commercial & Professional Services (Industrials) | | | 0.5 | |
| Consumer Durables & Apparel (Consumer Discretionary) | | | 1.0 | |
| Consumer Services (Consumer Discretionary) | | | 2.1 | |
| Diversified Financials (Financials) | | | 5.2 | |
| Energy (Energy) | | | 12.1 | |
| Food & Staples Retailing (Consumer Staples) | | | 2.4 | |
| Food, Beverage & Tobacco (Consumer Staples) | | | 6.5 | |
| Health Care Equipment & Services (Health Care) | | | 3.9 | |
| Household & Personal Products (Consumer Staples) | | | 2.5 | |
| Insurance (Financials) | | | 3.5 | |
| Materials (Materials) | | | 3.5 | |
| Media (Consumer Discretionary) | | | 3.1 | |
| Pharmaceuticals, Biotechnology & Life Sciences (Health Care) | | | 7.8 | |
| Real Estate (Financials) | | | 2.0 | |
| Retailing (Consumer Discretionary) | | | 3.7 | |
| Semiconductors & Semiconductor Equipment (Information Technology) | | | 2.3 | |
| Software & Services (Information Technology) | | | 9.3 | |
| Technology Hardware & Equipment (Information Technology) | | | 7.2 | |
| Telecommunication Services (Services) | | | 2.9 | |
| Transportation (Industrials) | | | 1.9 | |
| Utilities (Utilities) | | | 3.8 | |
| Short-Term Investments | | | 1.3 | |
| Other Assets and Liabilities | | | 0.0 | |
| Total | | | 100.0 | % |
|
Hartford Index HLS Fund
Schedule of Investments
December 31, 2011
(000’s Omitted)
| Shares or Principal Amount | | Market Value ╪ | |
COMMON STOCKS - 98.7% | |
| | | | | Automobiles & Components - 0.7% | | | | |
| | 9 | | | BorgWarner, Inc. ● | | $ | 548 | |
| | 298 | | | Ford Motor Co. w/ Rights ● | | | 3,210 | |
| | 19 | | | Goodyear Tire & Rubber Co. ● | | | 272 | |
| | 18 | | | Harley-Davidson, Inc. | | | 711 | |
| | 53 | | | Johnson Controls, Inc. | | | 1,668 | |
| | | | | | | | 6,409 | |
| | | | | Banks - 2.7% | | | | |
| | 55 | | | BB&T Corp. | | | 1,379 | |
| | 16 | | | Comerica, Inc. | | | 403 | |
| | 72 | | | Fifth Third Bancorp | | | 919 | |
| | 21 | | | First Horizon National Corp. | | | 165 | |
| | 41 | | | Hudson City Bancorp, Inc. | | | 259 | |
| | 68 | | | Huntington Bancshares, Inc. | | | 372 | |
| | 75 | | | Keycorp | | | 575 | |
| | 10 | | | M&T Bank Corp. | | | 751 | |
| | 28 | | | People's United Financial, Inc. | | | 364 | |
| | 41 | | | PNC Financial Services Group, Inc. | | | 2,382 | |
| | 99 | | | Regions Financial Corp. | | | 425 | |
| | 42 | | | SunTrust Banks, Inc. | | | 747 | |
| | 150 | | | US Bancorp | | | 4,053 | |
| | 414 | | | Wells Fargo & Co. | | | 11,408 | |
| | 14 | | | Zion Bancorp | | | 236 | |
| | | | | | | | 24,438 | |
| | | | | Capital Goods - 8.1% | | | | |
| | 55 | | | 3M Co. | | | 4,500 | |
| | 58 | | | Boeing Co. | | | 4,283 | |
| | 51 | | | Caterpillar, Inc. | | | 4,600 | |
| | 12 | | | Cooper Industries plc Class A | | | 671 | |
| | 15 | | | Cummins, Inc. | | | 1,336 | |
| | 45 | | | Danaher Corp. | | | 2,106 | |
| | 33 | | | Deere & Co. | | | 2,514 | |
| | 15 | | | Dover Corp. | | | 844 | |
| | 26 | | | Eaton Corp. | | | 1,144 | |
| | 58 | | | Emerson Electric Co. | | | 2,692 | |
| | 23 | | | Fastenal Co. | | | 1,013 | |
| | 4 | | | Flowserve Corp. | | | 435 | |
| | 13 | | | Fluor Corp. | | | 670 | |
| | 28 | | | General Dynamics Corp. | | | 1,857 | |
| | 829 | | | General Electric Co. | | | 14,843 | |
| | 10 | | | Goodrich Corp. | | | 1,221 | |
| | 61 | | | Honeywell International, Inc. | | | 3,300 | |
| | 38 | | | Illinois Tool Works, Inc. | | | 1,772 | |
| | 25 | | | Ingersoll-Rand plc | | | 748 | |
| | 10 | | | Jacobs Engineering Group, Inc. ● | | | 410 | |
| | 8 | | | Joy Global, Inc. | | | 621 | |
| | 8 | | | L-3 Communications Holdings, Inc. | | | 525 | |
| | 21 | | | Lockheed Martin Corp. | | | 1,683 | |
| | 28 | | | Masco Corp. | | | 293 | |
| | 21 | | | Northrop Grumman Corp. | | | 1,202 | |
| | 28 | | | PACCAR, Inc. | | | 1,052 | |
| | 9 | | | Pall Corp. | | | 515 | |
| | 12 | | | Parker-Hannifin Corp. | | | 906 | |
| | 11 | | | Precision Castparts Corp. | | | 1,873 | |
| | 16 | | | Quanta Services, Inc. ● | | | 355 | |
| | 27 | | | Raytheon Co. | | | 1,316 | |
| | 11 | | | Rockwell Automation, Inc. | | | 819 | |
| | 12 | | | Rockwell Collins, Inc. | | | 660 | |
| | 8 | | | Roper Industries, Inc. | | | 656 | |
| | 5 | | | Snap-On, Inc. | | | 231 | |
| | 13 | | | Stanley Black & Decker, Inc. | | | 896 | |
| | 22 | | | Textron, Inc. | | | 403 | |
| | 36 | | | Tyco International Ltd. | | | 1,694 | |
| | 71 | | | United Technologies Corp. | | | 5,203 | |
| | 5 | | | W.W. Grainger, Inc. | | | 884 | |
| | 15 | | | Xylem, Inc. | | | 373 | |
| | | | | | | | 73,119 | |
| | | | | Commercial & Professional Services - 0.5% | | | | |
| | 8 | | | Avery Dennison Corp. | | | 237 | |
| | 9 | | | Cintas Corp. | | | 303 | |
| | 4 | | | Dun & Bradstreet Corp. | | | 286 | |
| | 9 | | | Equifax, Inc. ● | | | 367 | |
| | 15 | | | Iron Mountain, Inc. | | | 450 | |
| | 16 | | | Pitney Bowes, Inc. | | | 291 | |
| | 15 | | | R.R. Donnelley & Sons Co. | | | 213 | |
| | 25 | | | Republic Services, Inc. | | | 680 | |
| | 11 | | | Robert Half International, Inc. | | | 319 | |
| | 7 | | | Stericycle, Inc. ● | | | 519 | |
| | 36 | | | Waste Management, Inc. | | | 1,182 | |
| | | | | | | | 4,847 | |
| | | | | Consumer Durables & Apparel - 1.0% | | | | |
| | 23 | | | Coach, Inc. | | | 1,399 | |
| | 22 | | | D.R. Horton, Inc. | | | 275 | |
| | 6 | | | Harman International Industries, Inc. | | | 210 | |
| | 9 | | | Hasbro, Inc. | | | 291 | |
| | 11 | | | Leggett & Platt, Inc. | | | 251 | |
| | 13 | | | Lennar Corp. | | | 249 | |
| | 27 | | | Mattel, Inc. | | | 738 | |
| | 23 | | | Newell Rubbermaid, Inc. | | | 366 | |
| | 29 | | | NIKE, Inc. Class B | | | 2,808 | |
| | 26 | | | Pulte Group, Inc. ● | | | 166 | |
| | 5 | | | Ralph Lauren Corp. | | | 704 | |
| | 7 | | | V.F. Corp. | | | 870 | |
| | 6 | | | Whirlpool Corp. | | | 285 | |
| | | | | | | | 8,612 | |
| | | | | Consumer Services - 2.1% | | | | |
| | 9 | | | Apollo Group, Inc. Class A ● | | | 492 | |
| | 36 | | | Carnival Corp. | | | 1,160 | |
| | 2 | | | Chipotle Mexican Grill, Inc. ● | | | 829 | |
| | 10 | | | Darden Restaurants, Inc. | | | 469 | |
| | 5 | | | DeVry, Inc. | | | 183 | |
| | 23 | | | H & R Block, Inc. | | | 376 | |
| | 23 | | | International Game Technology | | | 401 | |
| | 21 | | | Marriott International, Inc. Class A | | | 613 | |
| | 80 | | | McDonald's Corp. | | | 8,062 | |
| | 59 | | | Starbucks Corp. | | | 2,692 | |
| | 15 | | | Starwood Hotels & Resorts | | | 725 | |
| | 12 | | | Wyndham Worldwide Corp. | | | 452 | |
| | 6 | | | Wynn Resorts Ltd. | | | 682 | |
| | 36 | | | Yum! Brands, Inc. | | | 2,133 | |
| | | | | | | | 19,269 | |
| | | | | Diversified Financials - 5.2% | | | | |
| | 79 | | | American Express Co. | | | 3,741 | |
| | 18 | | | Ameriprise Financial, Inc. | | | 883 | |
| | 796 | | | Bank of America Corp. | | | 4,424 | |
| | 95 | | | Bank of New York Mellon Corp. | | | 1,896 | |
| | 8 | | | BlackRock, Inc. | | | 1,410 | |
| | 36 | | | Capital One Financial Corp. | | | 1,527 | |
| | 85 | | | Charles Schwab Corp. | | | 954 | |
The accompanying notes are an integral part of these financial statements.
| Shares or Principal Amount | | Market Value ╪ | |
COMMON STOCKS - 98.7% - (continued) | |
| | | | | Diversified Financials - 5.2% - (continued) | | | | |
| | 230 | | | Citigroup, Inc. | | $ | 6,038 | |
| | 5 | | | CME Group, Inc. | | | 1,281 | |
| | 43 | | | Discover Financial Services, Inc. | | | 1,036 | |
| | 20 | | | E*Trade Financial Corp. ● | | | 158 | |
| | 7 | | | Federated Investors, Inc. | | | 110 | |
| | 11 | | | Franklin Resources, Inc. | | | 1,101 | |
| | 39 | | | Goldman Sachs Group, Inc. | | | 3,493 | |
| | 6 | | | IntercontinentalExchange, Inc. ● | | | 684 | |
| | 35 | | | Invesco Ltd. | | | 712 | |
| | 298 | | | JP Morgan Chase & Co. | | | 9,918 | |
| | 10 | | | Legg Mason, Inc. | | | 235 | |
| | 16 | | | Leucadia National Corp. | | | 353 | |
| | 15 | | | Moody's Corp. | | | 518 | |
| | 117 | | | Morgan Stanley | | | 1,763 | |
| | 10 | | | Nasdaq OMX Group, Inc. ● | | | 244 | |
| | 19 | | | Northern Trust Corp. | | | 750 | |
| | 21 | | | NYSE Euronext | | | 536 | |
| | 40 | | | SLM Corp. | | | 535 | |
| | 39 | | | State Street Corp. | | | 1,559 | |
| | 20 | | | T. Rowe Price Group, Inc. | | | 1,129 | |
| | | | | | | | 46,988 | |
| | | | | Energy - 12.1% | | | | |
| | 17 | | | Alpha Natural Resources, Inc. ● | | | 352 | |
| | 39 | | | Anadarko Petroleum Corp. | | | 2,982 | |
| | 30 | | | Apache Corp. | | | 2,730 | |
| | 34 | | | Baker Hughes, Inc. | | | 1,666 | |
| | 8 | | | Cabot Oil & Gas Corp. | | | 625 | |
| | 19 | | | Cameron International Corp. ● | | | 947 | |
| | 52 | | | Chesapeake Energy Corp. | | | 1,153 | |
| | 156 | | | Chevron Corp. | | | 16,634 | |
| | 104 | | | ConocoPhillips Holding Co. | | | 7,598 | |
| | 18 | | | Consol Energy, Inc. | | | 653 | |
| | 31 | | | Denbury Resources, Inc. ● | | | 470 | |
| | 32 | | | Devon Energy Corp. | | | 1,967 | |
| | 5 | | | Diamond Offshore Drilling, Inc. | | | 300 | |
| | 61 | | | El Paso Corp. | | | 1,609 | |
| | 21 | | | EOG Resources, Inc. | | | 2,082 | |
| | 12 | | | EQT Corp. | | | 643 | |
| | 376 | | | Exxon Mobil Corp. | | | 31,894 | |
| | 19 | | | FMC Technologies, Inc. ● | | | 975 | |
| | 72 | | | Halliburton Co. | | | 2,494 | |
| | 8 | | | Helmerich & Payne, Inc. | | | 492 | |
| | 23 | | | Hess Corp. | | | 1,329 | |
| | 55 | | | Marathon Oil Corp. | | | 1,616 | |
| | 28 | | | Marathon Petroleum Corp. | | | 931 | |
| | 15 | | | Murphy Oil Corp. | | | 846 | |
| | 23 | | | Nabors Industries Ltd. ● | | | 391 | |
| | 33 | | | National Oilwell Varco, Inc. | | | 2,259 | |
| | 10 | | | Newfield Exploration Co. ● | | | 392 | |
| | 20 | | | Noble Corp. | | | 598 | |
| | 14 | | | Noble Energy, Inc. | | | 1,304 | |
| | 64 | | | Occidental Petroleum Corp. | | | 5,970 | |
| | 21 | | | Peabody Energy Corp. | | | 705 | |
| | 10 | | | Pioneer Natural Resources Co. | | | 860 | |
| | 14 | | | QEP Resources, Inc. | | | 408 | |
| | 12 | | | Range Resources Corp. | | | 761 | |
| | 10 | | | Rowan Companies, Inc. ● | | | 297 | |
| | 105 | | | Schlumberger Ltd. | | | 7,200 | |
| | 27 | | | Southwestern Energy Co. ● | | | 871 | |
| | 51 | | | Spectra Energy Corp. | | | 1,569 | |
| | 8 | | | Sunoco, Inc. | | | 345 | |
| | 11 | | | Tesoro Corp. ● | | | 262 | |
| | 44 | | | Valero Energy Corp. | | | 925 | |
| | 46 | | | Williams Cos., Inc. | | | 1,529 | |
| | | | | | | | 109,634 | |
| | | | | Food & Staples Retailing - 2.4% | | | | |
| | 34 | | | Costco Wholesale Corp. | | | 2,832 | |
| | 102 | | | CVS Caremark Corp. | | | 4,167 | |
| | 47 | | | Kroger Co. | | | 1,136 | |
| | 27 | | | Safeway, Inc. | | | 561 | |
| | 17 | | | Supervalu, Inc. | | | 134 | |
| | 46 | | | Sysco Corp. | | | 1,358 | |
| | 70 | | | Walgreen Co. | | | 2,309 | |
| | 137 | | | Wal-Mart Stores, Inc. | | | 8,193 | |
| | 13 | | | Whole Foods Market, Inc. | | | 874 | |
| | | | | | | | 21,564 | |
| | | | | Food, Beverage & Tobacco - 6.5% | | | | |
| | 161 | | | Altria Group, Inc. | | | 4,788 | |
| | 52 | | | Archer Daniels Midland Co. | | | 1,501 | |
| | 12 | | | Beam, Inc. | | | 624 | |
| | 8 | | | Brown-Forman Corp. | | | 639 | |
| | 14 | | | Campbell Soup Co. | | | 469 | |
| | 178 | | | Coca-Cola Co. | | | 12,474 | |
| | 25 | | | Coca-Cola Enterprises, Inc. | | | 632 | |
| | 33 | | | ConAgra Foods, Inc. | | | 859 | |
| | 14 | | | Constellation Brands, Inc. Class A ● | | | 283 | |
| | 14 | | | Dean Foods Co. ● | | | 161 | |
| | 17 | | | Dr. Pepper Snapple Group | | | 664 | |
| | 51 | | | General Mills, Inc. | | | 2,043 | |
| | 25 | | | H.J. Heinz Co. | | | 1,358 | |
| | 12 | | | Hershey Co. | | | 741 | |
| | 11 | | | Hormel Foods Corp. | | | 317 | |
| | 9 | | | J.M. Smucker Co. | | | 697 | |
| | 19 | | | Kellogg Co. | | | 985 | |
| | 139 | | | Kraft Foods, Inc. | | | 5,180 | |
| | 11 | | | Lorillard, Inc. | | | 1,212 | |
| | 10 | | | McCormick & Co., Inc. | | | 527 | |
| | 16 | | | Mead Johnson Nutrition Co. | | | 1,099 | |
| | 12 | | | Molson Coors Brewing Co. | | | 536 | |
| | 123 | | | PepsiCo, Inc. | | | 8,146 | |
| | 136 | | | Philip Morris International, Inc. | | | 10,704 | |
| | 27 | | | Reynolds American, Inc. | | | 1,100 | |
| | 46 | | | Sara Lee Corp. | | | 877 | |
| | 23 | | | Tyson Foods, Inc. Class A | | | 473 | |
| | | | | | | | 59,089 | |
| | | | | Health Care Equipment & Services - 3.9% | | | | |
| | 28 | | | Aetna, Inc. | | | 1,201 | |
| | 20 | | | Amerisource Bergen Corp. | | | 755 | |
| | 7 | | | Bard (C.R.), Inc. | | | 576 | |
| | 44 | | | Baxter International, Inc. | | | 2,189 | |
| | 17 | | | Becton, Dickinson & Co. | | | 1,260 | |
| | 116 | | | Boston Scientific Corp. ● | | | 621 | |
| | 27 | | | Cardinal Health, Inc. | | | 1,103 | |
| | 18 | | | CareFusion Corp. ● | | | 448 | |
| | 11 | | | Cerner Corp. ● | | | 702 | |
| | 22 | | | CIGNA Corp. | | | 940 | |
| | 11 | | | Coventry Health Care, Inc. ● | | | 343 | |
| | 38 | | | Covidien plc | | | 1,703 | |
| | 7 | | | DaVita, Inc. ● | | | 555 | |
The accompanying notes are an integral part of these financial statements.
Hartford Index HLS Fund
Schedule of Investments – (continued)
December 31, 2011
(000’s Omitted)
| Shares or Principal Amount | | Market Value ╪ | |
COMMON STOCKS - 98.7% - (continued) | |
| | | | | Health Care Equipment & Services - 3.9% - (continued) | | | | |
| | 11 | | | Dentsply International, Inc. | | $ | 389 | |
| | 9 | | | Edwards Lifesciences Corp. ● | | | 636 | |
| | 38 | | | Express Scripts, Inc. ● | | | 1,705 | |
| | 13 | | | Humana, Inc. | | | 1,126 | |
| | 3 | | | Intuitive Surgical, Inc. ● | | | 1,431 | |
| | 8 | | | Laboratory Corp. of America Holdings ● | | | 669 | |
| | 19 | | | McKesson Corp. | | | 1,504 | |
| | 30 | | | Medco Health Solutions, Inc. ● | | | 1,697 | |
| | 83 | | | Medtronic, Inc. | | | 3,169 | |
| | 7 | | | Patterson Cos., Inc. | | | 202 | |
| | 12 | | | Quest Diagnostics, Inc. | | | 718 | |
| | 25 | | | St. Jude Medical, Inc. | | | 858 | |
| | 26 | | | Stryker Corp. | | | 1,270 | |
| | 34 | | | Tenet Healthcare Corp. ● | | | 174 | |
| | 84 | | | UnitedHealth Group, Inc. | | | 4,239 | |
| | 9 | | | Varian Medical Systems, Inc. ● | | | 596 | |
| | 27 | | | Wellpoint, Inc. | | | 1,807 | |
| | 14 | | | Zimmer Holdings, Inc. ● | | | 749 | |
| | | | | | | | 35,335 | |
| | | | | Household & Personal Products - 2.5% | | | | |
| | 34 | | | Avon Products, Inc. | | | 590 | |
| | 10 | | | Clorox Co. | | | 689 | |
| | 38 | | | Colgate-Palmolive Co. | | | 3,507 | |
| | 9 | | | Estee Lauder Co., Inc. | | | 983 | |
| | 31 | | | Kimberly-Clark Corp. | | | 2,278 | |
| | 216 | | | Procter & Gamble Co. | | | 14,411 | |
| | | | | | | | 22,458 | |
| | | | | Insurance - 3.5% | | | | |
| | 27 | | | ACE Ltd. | | | 1,876 | |
| | 38 | | | Aflac, Inc. | | | 1,649 | |
| | 40 | | | Allstate Corp. | | | 1,102 | |
| | 35 | | | American International Group, Inc. ● | | | 805 | |
| | 25 | | | AON Corp. | | | 1,188 | |
| | 7 | | | Assurant, Inc. | | | 299 | |
| | 140 | | | Berkshire Hathaway, Inc. Class B ● | | | 10,663 | |
| | 22 | | | Chubb Corp. | | | 1,527 | |
| | 13 | | | Cincinnati Financial Corp. | | | 391 | |
| | 39 | | | Genworth Financial, Inc. ● | | | 255 | |
| | 25 | | | Lincoln National Corp. | | | 478 | |
| | 24 | | | Loews Corp. | | | 914 | |
| | 42 | | | Marsh & McLennan Cos., Inc. | | | 1,336 | |
| | 86 | | | MetLife, Inc. | | | 2,692 | |
| | 25 | | | Principal Financial Group, Inc. | | | 613 | |
| | 49 | | | Progressive Corp. | | | 957 | |
| | 39 | | | Prudential Financial, Inc. | | | 1,930 | |
| | 8 | | | Torchmark Corp. | | | 360 | |
| | 33 | | | Travelers Cos., Inc. | | | 1,940 | |
| | 24 | | | Unum Group | | | 502 | |
| | 26 | | | XL Group plc | | | 504 | |
| | | | | | | | 31,981 | |
| | | | | Materials - 3.5% | | | | |
| | 16 | | | Air Products and Chemicals, Inc. | | | 1,404 | |
| | 5 | | | Airgas, Inc. | | | 421 | |
| | 84 | | | Alcoa, Inc. | | | 723 | |
| | 8 | | | Allegheny Technologies, Inc. | | | 399 | |
| | 13 | | | Ball Corp. | | | 454 | |
| | 8 | | | Bemis Co., Inc. | | | 244 | |
| | 5 | | | CF Industries Holdings, Inc. | | | 741 | |
| | 11 | | | Cliff's Natural Resources, Inc. | | | 702 | |
| | 93 | | | Dow Chemical Co. | | | 2,667 | |
| | 73 | | | E.I. DuPont de Nemours & Co. | | | 3,321 | |
| | 11 | | | Eastman Chemical Co. | | | 421 | |
| | 24 | | | Ecolab, Inc. | | | 1,360 | |
| | 6 | | | FMC Corp. | | | 474 | |
| | 74 | | | Freeport-McMoRan Copper & Gold, Inc. | | | 2,739 | |
| | 6 | | | International Flavors & Fragrances, Inc. | | | 333 | |
| | 34 | | | International Paper Co. | | | 1,015 | |
| | 13 | | | MeadWestvaco Corp. | | | 402 | |
| | 42 | | | Monsanto Co. | | | 2,948 | |
| | 23 | | | Mosaic Co. | | | 1,180 | |
| | 39 | | | Newmont Mining Corp. | | | 2,334 | |
| | 25 | | | Nucor Corp. | | | 982 | |
| | 13 | | | Owens-Illinois, Inc. ● | | | 249 | |
| | 12 | | | PPG Industries, Inc. | | | 1,016 | |
| | 24 | | | Praxair, Inc. | | | 2,518 | |
| | 15 | | | Sealed Air Corp. | | | 259 | |
| | 7 | | | Sherwin-Williams Co. | | | 605 | |
| | 9 | | | Sigma-Aldrich Corp. | | | 591 | |
| | 6 | | | Titanium Metals Corp. | | | 96 | |
| | 11 | | | United States Steel Corp. | | | 298 | |
| | 10 | | | Vulcan Materials Co. | | | 398 | |
| | | | | | | | 31,294 | |
| | | | | Media - 3.1% | | | | |
| | 17 | | | Cablevision Systems Corp. | | | 247 | |
| | 51 | | | CBS Corp. Class B | | | 1,394 | |
| | 214 | | | Comcast Corp. Class A | | | 5,071 | |
| | 55 | | | DirecTV Class A ● | | | 2,369 | |
| | 21 | | | Discovery Communications, Inc. ● | | | 850 | |
| | 19 | | | Gannett Co., Inc. | | | 251 | |
| | 36 | | | Interpublic Group of Cos., Inc. | | | 352 | |
| | 23 | | | McGraw-Hill Cos., Inc. | | | 1,036 | |
| | 172 | | | News Corp. Class A | | | 3,070 | |
| | 22 | | | Omnicom Group, Inc. | | | 966 | |
| | 8 | | | Scripps Networks Interactive Class A | | | 322 | |
| | 25 | | | Time Warner Cable, Inc. | | | 1,591 | |
| | 79 | | | Time Warner, Inc. | | | 2,840 | |
| | 43 | | | Viacom, Inc. Class B | | | 1,968 | |
| | 141 | | | Walt Disney Co. | | | 5,288 | |
| | – | | | Washington Post Co. Class B | | | 126 | |
| | | | | | | | 27,741 | |
| | | | | Pharmaceuticals, Biotechnology & Life Sciences - 7.8% | | | | |
| | 122 | | | Abbott Laboratories | | | 6,876 | |
| | 27 | | | Agilent Technologies, Inc. ● | | | 951 | |
| | 24 | | | Allergan, Inc. | | | 2,103 | |
| | 62 | | | Amgen, Inc. | | | 4,000 | |
| | 19 | | | Biogen Idec, Inc. ● | | | 2,103 | |
| | 133 | | | Bristol-Myers Squibb Co. | | | 4,689 | |
| | 35 | | | Celgene Corp. ● | | | 2,353 | |
| | 80 | | | Eli Lilly & Co. | | | 3,325 | |
| | 21 | | | Forest Laboratories, Inc. ● | | | 635 | |
| | 59 | | | Gilead Sciences, Inc. ● | | | 2,414 | |
| | 13 | | | Hospira, Inc. ● | | | 392 | |
| | 214 | | | Johnson & Johnson | | | 14,057 | |
| | 14 | | | Life Technologies Corp. ● | | | 545 | |
| | 239 | | | Merck & Co., Inc. | | | 9,021 | |
| | 33 | | | Mylan, Inc. ● | | | 718 | |
| | 9 | | | PerkinElmer, Inc. | | | 178 | |
| | 7 | | | Perrigo Co. | | | 710 | |
| | 603 | | | Pfizer, Inc. | | | 13,059 | |
| | 30 | | | Thermo Fisher Scientific, Inc. ● | | | 1,336 | |
The accompanying notes are an integral part of these financial statements.
| Shares or Principal Amount | | Market Value ╪ | |
COMMON STOCKS - 98.7% - (continued) | |
| | | | | Pharmaceuticals, Biotechnology & Life Sciences - 7.8% - (continued) | | | | |
| | 7 | | | Waters Corp. ● | | $ | 523 | |
| | 10 | | | Watson Pharmaceuticals, Inc. ● | | | 602 | |
| | | | | | | | 70,590 | |
| | | | | Real Estate - 2.0% | | | | |
| | 31 | | | American Tower Corp. Class A | | | 1,853 | |
| | 9 | | | Apartment Investment & Management Co. | | | 217 | |
| | 7 | | | Avalonbay Communities, Inc. | | | 970 | |
| | 12 | | | Boston Properties, Inc. | | | 1,154 | |
| | 25 | | | CBRE Group, Inc. ● | | | 387 | |
| | 23 | | | Equity Residential Properties Trust | | | 1,326 | |
| | 32 | | | HCP, Inc. | | | 1,327 | |
| | 15 | | | Health Care, Inc. | | | 811 | |
| | 55 | | | Host Hotels & Resorts, Inc. | | | 818 | |
| | 32 | | | Kimco Realty Corp. | | | 518 | |
| | 13 | | | Plum Creek Timber Co., Inc. | | | 464 | |
| | 36 | | | ProLogis, Inc. | | | 1,030 | |
| | 11 | | | Public Storage | | | 1,500 | |
| | 23 | | | Simon Property Group, Inc. | | | 2,973 | |
| | 23 | | | Ventas, Inc. | | | 1,246 | |
| | 14 | | | Vornado Realty Trust | | | 1,114 | |
| | 42 | | | Weyerhaeuser Co. | | | 786 | |
| | | | | | | | 18,494 | |
| | | | | Retailing - 3.7% | | | | |
| | 7 | | | Abercrombie & Fitch Co. Class A | | | 328 | |
| | 29 | | | Amazon.com, Inc. ● | | | 4,945 | |
| | 4 | | | AutoNation, Inc. ● | | | 139 | |
| | 2 | | | AutoZone, Inc. ● | | | 712 | |
| | 19 | | | Bed Bath & Beyond, Inc. ● | | | 1,094 | |
| | 23 | | | Best Buy Co., Inc. | | | 539 | |
| | 5 | | | Big Lots, Inc. ● | | | 194 | |
| | 18 | | | CarMax, Inc. ● | | | 543 | |
| | 9 | | | Dollar Tree, Inc. ● | | | 773 | |
| | 7 | | | Expedia, Inc. | | | 216 | |
| | 9 | | | Family Dollar Stores, Inc. | | | 531 | |
| | 11 | | | GameStop Corp. Class A ● | | | 262 | |
| | 27 | | | Gap, Inc. | | | 506 | |
| | 12 | | | Genuine Parts Co. | | | 750 | |
| | 121 | | | Home Depot, Inc. | | | 5,086 | |
| | 11 | | | J.C. Penney Co., Inc. | | | 396 | |
| | 20 | | | Kohl's Corp. | | | 982 | |
| | 19 | | | Limited Brands, Inc. | | | 780 | |
| | 98 | | | Lowe's Co., Inc. | | | 2,496 | |
| | 33 | | | Macy's, Inc. | | | 1,062 | |
| | 4 | | | Netflix, Inc. ● | | | 299 | |
| | 13 | | | Nordstrom, Inc. | | | 630 | |
| | 10 | | | O'Reilly Automotive, Inc. ● | | | 804 | |
| | 4 | | | Priceline.com, Inc. ● | | | 1,842 | |
| | 19 | | | Ross Stores, Inc. | | | 915 | |
| | 3 | | | Sears Holdings Corp. ● | | | 95 | |
| | 55 | | | Staples, Inc. | | | 763 | |
| | 53 | | | Target Corp. | | | 2,700 | |
| | 10 | | | Tiffany & Co. | | | 662 | |
| | 30 | | | TJX Cos., Inc. | | | 1,914 | |
| | 7 | | | TripAdvisor, Inc. ● | | | 188 | |
| | 9 | | | Urban Outfitters, Inc. ● | | | 241 | |
| | | | | | | | 33,387 | |
| | | | | Semiconductors & Semiconductor Equipment - 2.3% | | | | |
| | 46 | | | Advanced Micro Devices, Inc. ● | | | 248 | |
| | 25 | | | Altera Corp. | | | 934 | |
| | 23 | | | Analog Devices, Inc. | | | 836 | |
| | 102 | | | Applied Materials, Inc. | | | 1,097 | |
| | 38 | | | Broadcom Corp. Class A | | | 1,119 | |
| | 5 | | | First Solar, Inc. ● | | | 155 | |
| | 400 | | | Intel Corp. | | | 9,693 | |
| | 13 | | | KLA-Tencor Corp. | | | 633 | |
| | 18 | | | Linear Technology Corp. | | | 536 | |
| | 44 | | | LSI Corp. ● | | | 263 | |
| | 15 | | | Microchip Technology, Inc. | | | 550 | |
| | 77 | | | Micron Technology, Inc. ● | | | 487 | |
| | 5 | | | Novellus Systems, Inc. ● | | | 217 | |
| | 48 | | | NVIDIA Corp. ● | | | 664 | |
| | 14 | | | Teradyne, Inc. ● | | | 197 | |
| | 90 | | | Texas Instruments, Inc. | | | 2,612 | |
| | 21 | | | Xilinx, Inc. | | | 661 | |
| | | | | | | | 20,902 | |
| | | | | Software & Services - 9.3% | | | | |
| | 50 | | | Accenture plc | | | 2,677 | |
| | 39 | | | Adobe Systems, Inc. ● | | | 1,088 | |
| | 14 | | | Akamai Technologies, Inc. ● | | | 456 | |
| | 18 | | | Autodesk, Inc. ● | | | 540 | |
| | 38 | | | Automatic Data Processing, Inc. | | | 2,072 | |
| | 13 | | | BMC Software, Inc. ● | | | 439 | |
| | 29 | | | CA, Inc. | | | 587 | |
| | 15 | | | Citrix Systems, Inc. ● | | | 887 | |
| | 24 | | | Cognizant Technology Solutions Corp. ● | | | 1,526 | |
| | 12 | | | Computer Sciences Corp. | | | 287 | |
| | 90 | | | eBay, Inc. ● | | | 2,736 | |
| | 26 | | | Electronic Arts, Inc. ● | | | 537 | |
| | 19 | | | Fidelity National Information Services, Inc. | | | 507 | |
| | 11 | | | Fiserv, Inc. ● | | | 649 | |
| | 20 | | | Google, Inc. ● | | | 12,821 | |
| | 93 | | | IBM Corp. | | | 17,012 | |
| | 23 | | | Intuit, Inc. | | | 1,229 | |
| | 8 | | | Mastercard, Inc. | | | 3,133 | |
| | 588 | | | Microsoft Corp. | | | 15,258 | |
| | 309 | | | Oracle Corp. | | | 7,924 | |
| | 25 | | | Paychex, Inc. | | | 763 | |
| | 15 | | | Red Hat, Inc. ● | | | 624 | |
| | 22 | | | SAIC, Inc. ● | | | 266 | |
| | 11 | | | Salesforce.com, Inc. ● | | | 1,084 | |
| | 58 | | | Symantec Corp. ● | | | 906 | |
| | 13 | | | Teradata Corp. ● | | | 636 | |
| | 13 | | | Total System Services, Inc. | | | 249 | |
| | 12 | | | VeriSign, Inc. | | | 446 | |
| | 40 | | | Visa, Inc. | | | 4,053 | |
| | 49 | | | Western Union Co. | | | 888 | |
| | 97 | | | Yahoo!, Inc. ● | | | 1,570 | |
| | | | | | | | 83,850 | |
| | | | | Technology Hardware & Equipment - 7.2% | | | | |
| | 13 | | | Amphenol Corp. Class A | | | 593 | |
| | 73 | | | Apple, Inc. ● | | | 29,548 | |
| | 422 | | | Cisco Systems, Inc. | | | 7,630 | |
| | 123 | | | Corning, Inc. | | | 1,602 | |
| | 120 | | | Dell, Inc. ● | | | 1,754 | |
| | 160 | | | EMC Corp. ● | | | 3,451 | |
| | 6 | | | F5 Networks, Inc. ● | | | 663 | |
| | 12 | | | FLIR Systems, Inc. | | | 306 | |
The accompanying notes are an integral part of these financial statements.
Hartford Index HLS Fund
Schedule of Investments – (continued)
December 31, 2011
(000’s Omitted)
| Shares or Principal Amount | | Market Value ╪ | |
COMMON STOCKS - 98.7% - (continued) | |
| | | | | Technology Hardware & Equipment - 7.2% - (continued) | | | | |
| | 9 | | | Harris Corp. | | $ | 329 | |
| | 156 | | | Hewlett-Packard Co. | | | 4,017 | |
| | 14 | | | Jabil Circuit, Inc. | | | 282 | |
| | 18 | | | JDS Uniphase Corp. ● | | | 188 | |
| | 41 | | | Juniper Networks, Inc. ● | | | 843 | |
| | 6 | | | Lexmark International, Inc. ADR | | | 186 | |
| | 11 | | | Molex, Inc. | | | 258 | |
| | 21 | | | Motorola Mobility Holdings, Inc. ● | | | 802 | |
| | 23 | | | Motorola Solutions, Inc. | | | 1,043 | |
| | 28 | | | NetApp, Inc. ● | | | 1,023 | |
| | 132 | | | Qualcomm, Inc. | | | 7,220 | |
| | 19 | | | SanDisk Corp. ● | | | 927 | |
| | 33 | | | TE Connectivity Ltd. | | | 1,026 | |
| | 18 | | | Western Digital Corp. ● | | | 568 | |
| | 109 | | | Xerox Corp. | | | 867 | |
| | | | | | | | 65,126 | |
| | | | | Telecommunication Services - 2.9% | | | | |
| | 465 | | | AT&T, Inc. | | | 14,069 | |
| | 48 | | | CenturyLink, Inc. | | | 1,803 | |
| | 78 | | | Frontier Communications Corp. | | | 402 | |
| | 23 | | | MetroPCS Communications, Inc. ● | | | 199 | |
| | 235 | | | Sprint Nextel Corp. ● | | | 550 | |
| | 222 | | | Verizon Communications, Inc. | | | 8,918 | |
| | 46 | | | Windstream Corp. | | | 537 | |
| | | | | | | | 26,478 | |
| | | | | Transportation - 1.9% | | | | |
| | 13 | | | C.H. Robinson Worldwide, Inc. | | | 898 | |
| | 82 | | | CSX Corp. | | | 1,737 | |
| | 17 | | | Expeditors International of Washington, Inc. | | | 681 | |
| | 25 | | | FedEx Corp. | | | 2,083 | |
| | 26 | | | Norfolk Southern Corp. | | | 1,925 | |
| | 4 | | | Ryder System, Inc. | | | 212 | |
| | 61 | | | Southwest Airlines Co. | | | 523 | |
| | 38 | | | Union Pacific Corp. | | | 4,013 | |
| | 76 | | | United Parcel Service, Inc. Class B | | | 5,543 | |
| | | | | | | | 17,615 | |
| | | | | Utilities - 3.8% | | | | |
| | 51 | | | AES Corp. ● | | | 599 | |
| | 9 | | | AGL Resources, Inc. | | | 387 | |
| | 19 | | | Ameren Corp. | | | 630 | |
| | 38 | | | American Electric Power Co., Inc. | | | 1,568 | |
| | 33 | | | CenterPoint Energy, Inc. | | | 672 | |
| | 20 | | | CMS Energy Corp. | | | 436 | |
| | 23 | | | Consolidated Edison, Inc. | | | 1,427 | |
| | 16 | | | Constellation Energy Group, Inc. | | | 626 | |
| | 45 | | | Dominion Resources, Inc. | | | 2,372 | |
| | 13 | | | DTE Energy Co. | | | 724 | |
| | 105 | | | Duke Energy Corp. | | | 2,303 | |
| | 26 | | | Edison International | | | 1,058 | |
| | 14 | | | Entergy Corp. | | | 1,011 | |
| | 52 | | | Exelon Corp. | | | 2,258 | |
| | 33 | | | FirstEnergy Corp. | | | 1,454 | |
| | 6 | | | Integrys Energy Group, Inc. | | | 329 | |
| | 33 | | | NextEra Energy, Inc. | | | 2,018 | |
| | 22 | | | NiSource, Inc. | | | 524 | |
| | 14 | | | Northeast Utilities | | | 502 | |
| | 18 | | | NRG Energy, Inc. ● | | | 328 | |
| | 8 | | | Oneok, Inc. | | | 701 | |
| | 18 | | | Pepco Holdings, Inc. | | | 361 | |
| | 32 | | | PG&E Corp. | | | 1,312 | |
| | 9 | | | Pinnacle West Capital Corp. | | | 415 | |
| | 45 | | | PPL Corp. | | | 1,335 | |
| | 23 | | | Progress Energy, Inc. | | | 1,297 | |
| | 40 | | | Public Service Enterprise Group, Inc. | | | 1,311 | |
| | 9 | | | SCANA Corp. | | | 407 | |
| | 19 | | | Sempra Energy | | | 1,035 | |
| | 68 | | | Southern Co. | | | 3,133 | |
| | 17 | | | TECO Energy, Inc. | | | 324 | |
| | 18 | | | Wisconsin Energy Corp. | | | 634 | |
| | 38 | | | Xcel Energy, Inc. | | | 1,053 | |
| | | | | | | | 34,544 | |
| | | | | Total common stocks | | | | |
| | | | | (cost $803,253) | | $ | 893,764 | |
| | | | | | | | | |
| | | | | Total long-term investments
(cost $803,253) | | $ | 893,764 | |
| | | | | | | | | |
| SHORT-TERM INVESTMENTS - 1.3% | |
| | | | | Repurchase Agreements - 1.3% | | | | |
| | | | | Deutsche Bank Securities TriParty Joint
Repurchase Agreement (maturing on
01/03/2012 in the amount of $924,
collateralized by U.S. Treasury Note 1.38%,
2018, value of $942) | | | | |
| $ | 924 | | | 0.01%, 12/30/2011 | | $ | 924 | |
| | | | | RBC Capital Markets Corp. TriParty Joint
Repurchase Agreement (maturing on
01/03/2012 in the amount of $7,170,
collateralized by U.S. Treasury Note 0.38%
- 1.50%, 2013 - 2016, value of $7,314) | | | | |
| | 7,170 | | | 0.01%, 12/30/2011 | | | 7,170 | |
| | | | | RBS Greenwich Capital Markets TriParty Joint
Repurchase Agreement (maturing on
01/03/2012 in the amount of $2,427,
collateralized by U.S. Treasury Note 1.88%
- 2.00%, 2015 - 2016, value of $2,475) | | | | |
| | 2,427 | | | 0.02%, 12/30/2011 | | | 2,427 | |
| | | | | UBS Securities, Inc. TriParty Joint Repurchase
Agreement (maturing on 01/03/2012 in the
amount of $841, collateralized by U.S.
Treasury Note 3.63%, 2021, value of $858) | | | | |
| | 841 | | | 0.01%, 12/30/2011 | | | 841 | |
| | | | | | | | 11,362 | |
| | | | | U.S. Treasury Bills - 0.0% | | | | |
| | 1,000 | | | 0.01%, 2/2/2012 □○ | | $ | 1,000 | |
| | | | | | | | | |
| | | | | Total short-term investments | | | | |
| | | | | (cost $12,362) | | $ | 12,362 | |
| | | | | | | | | |
| Total investments | | | | | | | | |
| (cost $815,615) ▲ | | | 100.0 | % | | $ | 906,126 | |
| Other assets and liabilities | | | – | % | | | (392 | ) |
| Total net assets | | | 100.0 | % | | $ | 905,734 | |
| | | | | | | | | |
The accompanying notes are an integral part of these financial statements.
| Note: | Percentage of investments as shown is the ratio of the total market value to total net assets. |
| |
| ▲ | At December 31, 2011, the cost of securities for federal income tax purposes was $849,302 and the aggregate gross unrealized appreciation and depreciation based on that cost were: |
| | Unrealized Appreciation | | $ | 252,562 | |
| | Unrealized Depreciation | | | (195,738 | ) |
| | Net Unrealized Appreciation | | $ | 56,824 | |
| ● | Non-income producing. |
| | |
| ○ | The interest rate disclosed for these securities represents the effective yield on the date of the acquisition. |
| | |
| □ | This security, or a portion of this security, is pledged as initial margin deposit for open futures contracts held at December 31, 2011 as listed in the table below: |
| | Description | | Number of Contracts* | | | Position | | | Expiration Date | | | Market Value ╪ | | | Notional Amount | | | Unrealized Appreciation/ (Depreciation) | |
| | S&P 500 Index | | | 43 | | | | Long | | | | 03/15/2012 | | | $ | 13,465 | | | $ | 13,454 | | | $ | 11 | |
| * The number of contracts does not omit 000's. |
Cash of $80 was pledged as initial margin deposit and collateral for open futures contracts at December 31, 2011. |
| ╪ | See Significant Accounting Policies of accompanying Notes to Financial Statements regarding valuation of securities. |
| |
The accompanying notes are an integral part of these financial statements.
Hartford Index HLS Fund
Investment Valuation Hierarchy Level Summary
December 31, 2011
(000’s Omitted)
| | | Total | | | Level 1 ♦ | | | Level 2 ♦ | | | Level 3 | |
| Assets: | | | | | | | | | | | | | | | | |
| Common Stocks ‡ | | $ | 893,764 | | | $ | 893,764 | | | $ | – | | | $ | – | |
| Short-Term Investments | | | 12,362 | | | | – | | | | 12,362 | | | | – | |
| Total | | $ | 906,126 | | | $ | 893,764 | | | $ | 12,362 | | | $ | – | |
| Futures * | | | 11 | | | | 11 | | | | – | | | | – | |
| Total | | $ | 11 | | | $ | 11 | | | $ | – | | | $ | – | |
| ♦ | For the year ended December 31, 2011, there were no significant transfers between Level 1 and Level 2. |
| ‡ | The Fund has all or primarily all of the equity securities categorized in a particular level. Refer to the Schedule of Investments for further industry breakout. |
| * | Derivative instruments not reflected in the Schedule of Investments are valued at the unrealized appreciation/depreciation on the investments. |
The accompanying notes are an integral part of these financial statements.
Hartford Index HLS Fund
Statement of Assets and Liabilities
December 31, 2011
(000’s Omitted)
| Assets: | | | | |
| Investments in securities, at market value (cost $815,615) | | $ | 906,126 | |
| Cash | | | 87 | * |
| Receivables: | | | | |
| Investment securities sold | | | 142 | |
| Fund shares sold | | | 193 | |
| Dividends and interest | | | 1,347 | |
| Variation margin | | | 2 | |
| Total assets | | | 907,897 | |
| Liabilities: | | | | |
| Payables: | | | | |
| Fund shares redeemed | | | 1,973 | |
| Variation margin | | | 54 | |
| Investment management fees | | | 60 | |
| Distribution fees | | | 13 | |
| Accrued expenses | | | 63 | |
| Total liabilities | | | 2,163 | |
| Net assets | | $ | 905,734 | |
| Summary of Net Assets: | | | | |
| Capital stock and paid-in-capital | | $ | 869,707 | |
| Undistributed net investment income | | | 1,451 | |
| Accumulated net realized loss | | | (55,946 | ) |
| Unrealized appreciation of investments | | | 90,522 | |
| Net assets | | $ | 905,734 | |
| Shares authorized | | | 4,000,000 | |
| Par value | | $ | 0.001 | |
| Class IA: Net asset value per share | | $ | 26.20 | |
| Shares outstanding | | | 25,697 | |
| Net assets | | $ | 673,275 | |
| Class IB: Net asset value per share | | $ | 26.09 | |
| Shares outstanding | | | 8,909 | |
| Net assets | | $ | 232,459 | |
* Cash of $80 was pledged as initial margin deposit and collateral for open futures contracts at December 31, 2011.
The accompanying notes are an integral part of these financial statements.
Hartford Index HLS Fund
Statement of Operations
For the Year Ended December 31, 2011
(000’s Omitted)
| Investment Income: | | | | |
| Dividends | | $ | 20,235 | |
| Interest | | | 6 | |
| Total investment income, net | | | 20,241 | |
| | | | | |
| Expenses: | | | | |
| Investment management fees | | | 2,920 | |
| Distribution fees - Class IB | | | 568 | |
| Custodian fees | | | 26 | |
| Accounting services fees | | | 97 | |
| Board of Directors' fees | | | 23 | |
| Audit fees | | | 16 | |
| Other expenses | | | 139 | |
| Total expenses | | | 3,789 | |
| Net investment income | | | 16,452 | |
| | | | | |
| Net Realized Loss on Investments and Other Financial Instruments: | | | (789000 | ) |
| Net realized loss on investments | | | (1,395 | ) |
| Net realized gain on futures | | | 606 | |
| Net Realized Loss on Investments and Other Financial Instruments | | | (789 | ) |
| | | | | |
| Net Changes in Unrealized Appreciation of Investments and Other Financial Instruments: | | | 4,269 | |
| Net unrealized appreciation of investments | | | 4,502 | |
| Net unrealized depreciation of futures | | | (233 | ) |
| Net Changes in Unrealized Appreciation of Investments and Other Financial Instruments | | | 4,269 | |
| Net Gain on Investments and Other Financial Instruments | | | 3,480 | |
| Net Increase in Net Assets Resulting from Operations | | $ | 19,932 | |
| | | | | |
The accompanying notes are an integral part of these financial statements.
Hartford Index HLS Fund
Statement of Changes in Net Assets
(000’s Omitted)
| | | For the
Year Ended
December 31, 2011 | | | For the
Year Ended
December 31, 2010 | |
| Operations: | | | | | | | | |
| Net investment income | | $ | 16,452 | | | $ | 16,123 | |
| Net realized gain (loss) on investments and other financial instruments | | | (789 | ) | | | 2,457 | |
| Net unrealized appreciation of investments and other financial instruments | | | 4,269 | | | | 114,628 | |
| Net Increase In Net Assets Resulting From Operations | | | 19,932 | | | | 133,208 | |
| Distributions to Shareholders: | | | | | | | | |
| From net investment income | | | | | | | | |
| Class IA | | | (11,907 | ) | | | (13,079 | ) |
| Class IB | | | (3,567 | ) | | | (2,921 | ) |
| Total distributions | | | (15,474 | ) | | | (16,000 | ) |
| Capital Share Transactions: | | | | | | | | |
| Class IA | | | | | | | | |
| Sold | | | 49,488 | | | | 74,931 | |
| Issued on reinvestment of distributions | | | 11,907 | | | | 13,079 | |
| Redeemed | | | (202,307 | ) | | | (184,062 | ) |
| Total capital share transactions | | | (140,912 | ) | | | (96,052 | ) |
| Class IB | | | | | | | | |
| Sold | | | 103,660 | | | | 86,663 | |
| Issued on reinvestment of distributions | | | 3,567 | | | | 2,921 | |
| Redeemed | | | (83,928 | ) | | | (69,647 | ) |
| Total capital share transactions | | | 23,299 | | | | 19,937 | |
| Net decrease from capital share transactions | | | (117,613 | ) | | | (76,115 | ) |
| Net Increase (Decrease) In Net Assets | | | (113,155 | ) | | | 41,093 | |
| Net Assets: | | | | | | | | |
| Beginning of period | | | 1,018,889 | | | | 977,796 | |
| End of period | | $ | 905,734 | | | $ | 1,018,889 | |
| Undistributed (distribution in excess of) | | | | | | | | |
| net investment income | | $ | 1,451 | | | $ | 784 | |
| Shares: | | | | | | | | |
| Class IA | | | | | | | | |
| Sold | | | 1,855 | | | | 3,164 | |
| Issued on reinvestment of distributions | | | 458 | | | | 509 | |
| Redeemed | | | (7,518 | ) | | | (7,732 | ) |
| Total share activity | | | (5,205 | ) | | | (4,059 | ) |
| Class IB | | | | | | | | |
| Sold | | | 3,893 | | | | 3,670 | |
| Issued on reinvestment of distributions | | | 138 | | | | 114 | |
| Redeemed | | | (3,145 | ) | | | (2,948 | ) |
| Total share activity | | | 886 | | | | 836 | |
| | | | | | | | | |
The accompanying notes are an integral part of these financial statements.
Hartford Index HLS Fund
Notes to Financial Statements
December 31, 2011
(000’s Omitted)
Hartford Index HLS Fund (the “Fund”) serves as an underlying investment option for certain variable annuity and variable life insurance separate accounts of Hartford Life Insurance Company (“HLIC”) and its affiliates and certain qualified retirement plans. The Fund may also serve as an underlying investment option for certain variable annuity and variable life separate accounts of other insurance companies. Owners of variable annuity contracts and policyholders of variable life insurance contracts may choose the funds permitted in the variable insurance contract prospectus. In addition, participants in certain qualified retirement plans may choose the Fund if permitted by their plans.
Hartford Series Fund, Inc. (the “Company”) is an open-end registered management investment company comprised of thirty portfolios. Financial Statements for the Fund, a series of the Company, are included in this report.
The Company is organized under the laws of the State of Maryland and is registered with the Securities and Exchange Commission (“SEC”) under the Investment Company Act of 1940, as amended (“1940 Act”). The Fund is a diversified open-end management investment company.
The Fund is divided into Class IA and Class IB shares. Each class is offered at the per share net asset value (“NAV”) without a sales charge and is subject to the same expenses, except that the Class IB shares are subject to distribution and service fees charged pursuant to a Distribution Plan adopted in accordance with Rule 12b-1 under the 1940 Act.
| 2. | Significant Accounting Policies: |
The following is a summary of significant accounting policies of the Fund in the preparation of its financial statements, which are in accordance with the United States Generally Accepted Accounting Principles (“U.S. GAAP”). The preparation of financial statements in accordance with U.S. GAAP may require management to make estimates and assumptions that affect the reported amounts of assets and liabilities and disclosure of contingent assets and liabilities at the date of the financial statements and the reported amounts of increases and decreases in net assets from operations during the reporting period. Actual results could differ from those estimates.
| a) | Determination of Net Asset Value – The NAV of each class of the Fund’s shares is determined as of the close of regular trading (normally 4:00 p.m. Eastern Time) (the “NYSE Close”) on each day that the New York Stock Exchange (the “Exchange”) is open (“Valuation Date”). Information that becomes known to the Fund after the NAV has been calculated on a particular day will not generally be used to retroactively adjust the NAV determined earlier that day. |
| b) | Investment Valuation and Fair Value Measurements – For purposes of calculating the NAV, portfolio securities and other assets held by the Fund's portfolio for which market quotes are readily available are valued at market value. Market value is generally determined on the basis of last reported sales prices or official close price. If no sales are reported, market value is based on quotes obtained from a quotation reporting system, established market makers, or independent pricing services. If market prices are not readily available or are deemed unreliable, the Fund will use the fair value of the security as determined in good faith under policies and procedures established by and under the supervision of the Company's Board of Directors. Market quotes are considered not readily available where there is an absence of current or reliable market-based data (e.g., trade information or broker quotes), including where events occur after the close of the relevant market, but prior to the NYSE Close that materially affect the values of the Fund's portfolio securities or assets. In addition, market quotes are considered not readily available when, due to extraordinary circumstances, the exchanges or markets on which the securities trade do not open for trading for the entire day and no other market prices are available. There can be no assurance that the Fund could obtain the fair market value assigned to a security if the Fund were to sell the security at approximately the time at which the Fund determines its NAV. |
Short-term investments maturing in 60 days or less are generally valued at amortized cost, if their original term to maturity was 60 days or less, or by amortizing their value on the 61st day prior to maturity, if the original term to maturity exceeded 60 days.
Exchange traded options, futures and options on futures are valued at the settlement price determined by the relevant exchange as of the NYSE Close. If such instruments do not trade on an exchange, values may be supplied by an independent pricing service using a formula or other objective method that may take into consideration the style, direction, expiration, strike price, notional value and volatility or other adjustments.
Financial instruments for which prices are not available from an independent pricing service may be valued using market quotations obtained from one or more dealers that make markets in the respective financial instrument in accordance with procedures established by the Company’s Board of Directors.
U.S. GAAP defines fair value as the price that the Fund would receive to sell an asset or pay to transfer a liability in an orderly transaction between market participants. The U.S. GAAP fair value measurement standards require disclosure of a fair value hierarchy for each major category of assets and liabilities. Various inputs are used in determining the fair value of the Fund’s investments. These inputs are summarized into three broad hierarchy levels. This hierarchy is based on whether the valuation inputs are observable or unobservable. These levels are:
| · | Level 1 – Quoted prices in active markets for identical securities. Level 1 may include exchange traded instruments, such as domestic equities, some foreign equities, options, futures, mutual funds, exchange traded funds, rights and warrants. |
| · | Level 2 – Observable inputs other than Level 1 prices, such as quoted prices for similar securities; quoted prices in markets that are not active; or other inputs that are observable or can be corroborated by observable market data. Level 2 may include debt securities that are traded less frequently than exchange traded instruments and which are valued using independent pricing services; foreign equities, that are principally traded on certain foreign markets and are adjusted daily pursuant to a fair value pricing service in order to reflect an adjustment for the factors occurring after the close of certain foreign markets but before the NYSE Close; and short-term securities, which are valued at amortized cost. |
| · | Level 3 – Significant unobservable inputs that are supported by limited or no market activity. Level 3 may include financial instruments whose values are determined using broker quotes or require significant management judgment or estimation. These unobservable valuation inputs may include estimates for current yields, maturity/duration, prepayment speed, and broker quotes for comparable securities along with other assumptions relating to credit quality, collateral value, complexity of the security structure, general market conditions and liquidity. This category may include securities where trading has been halted or there are certain restrictions on trading. While these securities are priced using unobservable inputs, the valuation of these securities reflects the best available data and management believes the prices are a reasonable representation of exit price. |
Valuation levels are not necessarily indicative of the risk associated with investing in such securities. Individual securities within any of the above mentioned asset classes may be assigned a different hierarchical level than those presented above, as individual circumstances dictate.
During the year ended December 31, 2011, the Fund held no Level 3 securities; therefore, no reconciliation of Level 3 securities is presented.
For additional information, refer to the Investment Valuation Hierarchy Level Summary which follows the Schedule of Investments.
For purposes of reporting transfers between different hierarchy levels, both transfers in and out of each level, as applicable, are shown as if they occurred at the beginning of the period.
Hartford Index HLS Fund
Notes to Financial Statements – (continued)
December 31, 2011
(000’s Omitted)
| c) | Security Transactions and Investment Income – Security transactions are recorded as of the trade date (the date the order to buy or sell is executed) for financial reporting purposes. Securities purchased or sold on a when-issued or delayed-delivery basis may be settled a month or more after the trade date. Realized gains and losses are determined on the basis of identified cost. |
Dividend income is accrued as of the ex-dividend date, except certain dividends from foreign securities where the ex-dividend date may have passed are recorded as soon as the Fund is informed of the dividend. Interest income, including amortization of premium and accretion of discounts, is accrued on a daily basis.
| d) | Joint Trading Account – The Fund may invest cash balances into a joint trading account that may be invested in one or more repurchase agreements. |
| e) | Fund Share Valuation and Dividend Distributions to Shareholders – Orders for the Fund’s shares are executed in accordance with the investment instructions of the contract holders and plan participants. The NAV of the Fund’s shares is determined as of the close of business on each business day of the Exchange. The NAV is determined separately for each class of shares of the Fund by dividing the Fund’s net assets attributable to that class by the number of shares of the class outstanding. Each class of shares offered by the Fund has equal rights as to assets and voting privileges (except that shareholders of a class have exclusive voting rights regarding any matter relating solely to that class of shares). Income and non-class specific expenses are allocated daily to each class on the basis of the relative net assets of the class. Realized and unrealized capital gains and losses are allocated daily based on the relative net assets of each class of shares of the Fund. |
Orders for the purchase of the Fund’s shares received prior to the close of the Exchange on any day the Exchange is open for business are priced at the NAV determined as of the close of the Exchange. Orders received after the close of the Exchange, or on a day on which the Exchange and/or the Fund is not open for business, are priced at the next determined NAV.
Dividends are declared pursuant to a policy adopted by the Company’s Board of Directors based upon the investment performance of the Fund. The policy of the Fund is to pay dividends from net investment income and realized capital gains, if any, at least once a year.
Distributions from net investment income, net realized capital gains and capital are determined in accordance with federal income tax regulations, which may differ from U.S. GAAP with respect to character and timing. These differences may include but are not limited to losses deferred due to wash sale adjustments, foreign currency gains and losses, adjustments related to Passive Foreign Investment Companies (“PFICs”), Real Estate Investment Trusts (“REITs”), Regulated Investment Companies (“RICs”), certain derivatives and partnerships. Permanent book and federal income tax basis differences relating to shareholder distributions will result in reclassifications to certain of the Fund’s capital accounts (see Federal Income Taxes: Reclassification of Capital Accounts note).
| 3. | Securities and Other Investments: |
| a) | Repurchase Agreements – A repurchase agreement is an agreement by which a counterparty agrees to sell a security and agrees to repurchase the security sold at a mutually agreed upon time and price. At the time the Fund enters into a repurchase agreement, the value of the underlying collateral security(ies), including accrued interest, will be equal to or exceed the value of the repurchase agreement. Repurchase agreements expose the Fund to counterparty risk. To minimize counterparty risk, the securities that serve to collateralize the repurchase agreement are held by the Fund's custodian in book entry or physical form in the custodial account of the Fund or in a third party custodial account. Repurchase agreements are valued at cost plus accrued interest. The Fund, as shown on the Schedule of Investments, had outstanding repurchase agreements as of December 31, 2011. |
| b) | Securities Purchased on a When-Issued or Delayed-Delivery Basis – Delivery and payment for securities that have been purchased by the Fund on a forward commitment, or when-issued or delayed-delivery basis, take place beyond the customary settlement period. A fund may dispose of or renegotiate a delayed-delivery transaction after it is entered into, and may sell delayed-delivery securities before they are delivered, which may result in a realized gain or loss. During this period, such securities are subject to market fluctuations, and the Fund identifies securities segregated in its records with value at least equal to the amount of the commitment. As of December 31, 2011, the Fund had no outstanding when-issued or delayed delivery securities. |
| 4. | Financial Derivative Instruments: |
The following disclosures contain information on how and why the Fund uses derivative instruments, the credit-risk-related contingent features in certain derivative instruments, and how derivative instruments affect the Fund’s financial position and results of operations. The location and fair value amounts of these instruments on the Statement of Assets and Liabilities and the realized gains and losses and changes in unrealized gains and losses on the Statement of Operations, each categorized by type of derivative contract, are included in the following Additional Derivative Instrument Information footnote. The derivative instruments outstanding as of period-end are disclosed in the notes to the Schedule of Investments and the amounts of realized gains and losses and changes in unrealized gains and losses on derivative instruments during the period are disclosed in the Statement of Operations.
| a) | Futures Contracts – The Fund may enter into futures contracts. A futures contract is an agreement between two parties to buy or sell an asset at a set price on a future date. The Fund uses futures contracts to manage or obtain exposure to the securities markets, commodities, or movements in interest rates and currency values. The primary risks associated with the use of futures contracts are the imperfect correlation between the change in market value of the securities held by the Fund and the prices of futures contracts and the possibility of an illiquid market. Upon entering into a futures contract, the Fund is required to deposit with a futures commission merchant (“FCM”) an amount of cash or U.S. Government or Agency Obligations in accordance with the initial margin requirements of the broker or exchange. Futures contracts are marked to market daily at the most recent settlement price reported by an exchange on which, over time, they are traded most extensively, and an appropriate payable or receivable for the change in value (“variation margin”) is recorded by the Fund. Gains or losses are recognized but not considered realized until the contracts expire or are closed. Futures contracts involve, to varying degrees, risk of loss in excess of the variation margin disclosed on the Statement of Assets and Liabilities; however, this risk is reduced through the use of an FCM. The Fund, as shown on the Schedule of Investments, had outstanding futures contracts as of December 31, 2011. |
| b) | Additional Derivative Instrument Information: |
Fair Values of Derivative Instruments on the Statement of Assets and Liabilities as of December 31, 2011:
| | | Risk Exposure Category | |
| | | Interest Rate Contracts | | | Foreign Exchange Contracts | | | Credit
Contracts | | | Equity
Contracts | | | Commodity Contracts | | | Other
Contracts | | | Total | |
| Assets: | | | | | | | | | | | | | | | | | | | | | | | | | | | | |
| Variation margin receivable * | | $ | — | | | $ | — | | | $ | — | | | $ | 2 | | | $ | — | | | $ | — | | | $ | 2 | |
| Total | | $ | — | | | $ | — | | | $ | — | | | $ | 2 | | | $ | — | | | $ | — | | | $ | 2 | |
| | | | | | | | | | | | | | | | | | | | | | | | | | | | | |
| Liabilities: | | | | | | | | | | | | | | | | | | | | | | | | | | | | |
| Variation margin payable * | | $ | — | | | $ | — | | | $ | — | | | $ | 54 | | | $ | — | | | $ | — | | | $ | 54 | |
| Total | | $ | — | | | $ | — | | | $ | — | | | $ | 54 | | | $ | — | | | $ | — | | | $ | 54 | |
| | | | | | | | | | | | | | | | | | | | | | | | | | | | True | |
| * Only current day's variation margin is reported within the Statement of Assets and Liabilities. The variation margin is included in the open futures cumulative appreciation (depreciation) of $11 as reported in the Schedule of Investments. |
Hartford Index HLS Fund
Notes to Financial Statements – (continued)
December 31, 2011
(000’s Omitted)
| The volume of derivatives that is presented in the Schedule of Investments is consistent with the derivative activity during the year ended December 31, 2011. |
| | | | | | | | |
| The Effect of Derivative Instruments on the Statement of Operations for the year ended December 31, 2011: |
| | | Risk Exposure Category | |
| | | Interest
Rate
Contracts | | | Foreign
Exchange Contracts | | | Credit
Contracts | | | Equity
Contracts | | | Commodity Contracts | | | Other
Contracts | | | Total | |
| Realized Gain (Loss) on Derivatives Recognized as a Result of Operations: |
| Net realized gain on futures | | $ | — | | | $ | — | | | $ | — | | | $ | 606 | | | $ | — | | | $ | — | | | $ | 606 | |
| Total | | $ | — | | | $ | — | | | $ | — | | | $ | 606 | | | $ | — | | | $ | — | | | $ | 606 | |
| | | | | | | | | | | | | | | | | | | | | | | | | | | | | |
| Net Change in Unrealized Appreciation (Depreciation) on Derivatives Recognized as a Result of Operations: |
Net change in unrealized
depreciation of futures | | $ | — | | | $ | — | | | $ | — | | | $ | (233 | ) | | $ | — | | | $ | — | | | $ | (233 | ) |
| Total | | $ | — | | | $ | — | | | $ | — | | | $ | (233 | ) | | $ | — | | | $ | — | | | $ | (233 | ) |
| | | | | | | | | | | | | | | | | | | | | | | | | | | | | |
| a) | Counterparty Risk – The Fund may be exposed to counterparty risk, or the risk that an institution or other entity with which the Fund has unsettled or open transactions will default. |
| b) | Market Risks – The market values of equity securities, such as common stocks and preferred stocks, or equity related investments, such as futures and options, may decline due to general market conditions which are not specifically related to a particular company, such as real or perceived adverse economic conditions, changes in the general outlook for corporate earnings, changes in interest or currency rates or adverse investor sentiment generally. The market value of equity securities may also decline due to factors which affect a particular industry or industries, such as labor shortages or increased production costs and competitive conditions within an industry. Equity securities and equity related investments generally have greater market price volatility than fixed income securities. |
| a) | Federal Income Taxes – For federal income tax purposes, the Fund intends to continue to qualify as a RIC under Subchapter M of the Internal Revenue Code (“IRC”) by distributing substantially all of its taxable net investment income and net realized capital gains to its shareholders and otherwise complying with the requirements of RICs. The Fund has distributed substantially all of its income and capital gains in prior years, if applicable, and intends to distribute substantially all of its income and capital gains prior to the next fiscal year-end. Accordingly, no provision for federal income or excise taxes has been made in the accompanying financial statements. Distributions from short-term capital gains are treated as ordinary income distributions for federal income tax purposes. |
| b) | Net Investment Income (Loss), Net Realized Gains (Losses) – Net investment income (loss) and net realized gains (losses) may differ for financial statement and tax purposes primarily because of losses deferred due to wash sale adjustments, foreign currency gains and losses, adjustments related to PFICs, REITs, RICs, certain derivatives and partnerships. The character of distributions made during the year from net investment income or net realized gains may differ from their ultimate characterization for federal income tax purposes. Also, due to the timing of dividend distributions, the fiscal year in which amounts are distributed may differ from the year that the income or realized gains (losses) were recorded by the Fund. |
| c) | Distributions and Components of Distributable Earnings – The tax character of distributions paid by the Fund for the periods indicated is as follows (as adjusted for dividends payable): |
| | | For the Year Ended
December 31, 2011 | | | For the Year Ended
December 31, 2010 | |
| Ordinary Income | | $ | 15,474 | | | $ | 16,000 | |
As of December 31, 2011, the Fund’s components of distributable earnings (deficit) on a tax basis were as follows:
| | | Amount | |
| Undistributed Ordinary Income | | $ | 1,451 | |
| Accumulated Capital and Other Losses* | | | (22,247 | ) |
| Unrealized Appreciation† | | | 56,823 | |
| Total Accumulated Earnings | | $ | 36,027 | |
| | * | The Fund has capital loss carryforwards that are identified in the Capital Loss Carryforward note that follows. |
| | † | The difference between book-basis and tax-basis unrealized appreciation (depreciation) may be attributable to the losses deferred due to wash sale adjustments, foreign currency gains and losses, adjustments related to PFICs, REITs, RICs, certain derivatives and partnerships. |
| d) | Reclassification of Capital Accounts – The Fund may record reclassifications in its capital accounts. These reclassifications have no impact on the total net assets of the Fund. The reclassifications are a result of permanent differences between U.S. GAAP and tax accounting for such items as foreign currency, PFICs, expiration or utilization of capital loss carryforwards or net operating losses. Adjustments are made to reflect the impact these items have on current and future distributions to shareholders. Therefore, the source of the Fund’s distributions may be shown in the accompanying Statement of Changes in Net Assets as from undistributed net investment income, from accumulated net realized gains on investments or from capital depending on the type of book and tax differences that exist. For the year ended December 31, 2011, the Fund recorded reclassifications to increase (decrease) the accounts listed below: |
| | | Amount | |
| Undistributed Net Investment Income | | $ | (311 | ) |
| Accumulated Net Realized Gain (Loss) | | | 311 | |
| e) | Capital Loss Carryforward – On December 22, 2010, the Regulated Investment Company Modernization Act of 2010 (the “Act”) was enacted, which made changes to the capital loss carryforward rules. The changes are effective for taxable years beginning after the date of enactment. Under the Act, funds are permitted to carry forward capital losses for an unlimited period. However, any losses incurred during those future taxable years will be required to be utilized prior to the losses incurred in pre-enactment taxable years, which carry an expiration date. As a result of this ordering rule, pre-enactment capital loss carryforwards may be more likely to expire unused. Additionally, post-enactment capital loss carryforwards will retain their character as either short-term or long-term capital losses rather than being considered all short-term as permitted under prior regulation. |
Hartford Index HLS Fund
Notes to Financial Statements – (continued)
December 31, 2011
(000’s Omitted)
At December 31, 2011 (tax-year-end), the Fund had capital loss carryforwards for U.S. federal income tax purposes as follows:
| Year of Expiration | | Amount | |
| 2017 | | $ | 22,247 | |
| Total | | $ | 22,247 | |
| | | | | |
| As of December 31, 2011, the Fund utilized $1,269 of prior year capital loss carryforwards. |
| | | | | |
| f) | Accounting for Uncertainty in Income Taxes – The Fund has adopted financial reporting rules that require the Fund to analyze all open tax years, as defined by the statute of limitations, for all major jurisdictions. Generally, tax authorities can examine all tax returns filed for the last three years. The Fund does not have an examination in progress. |
The Fund has reviewed all open tax years and major jurisdictions and concluded that these financial reporting rules had no effect on the Fund’s financial position or results of operations. There is no tax liability resulting from unrecognized tax benefits relating to uncertain income tax positions taken or expected to be taken on the tax return for the fiscal year ended December 31, 2011. The Fund is also not aware of any tax positions for which it is reasonably possible that the total amounts of unrecognized tax benefits will significantly change in the next twelve months.
7. Expenses:
| a) | Investment Management Agreement – HL Investment Advisors, LLC (“HL Advisors”), an indirect wholly owned subsidiary of The Hartford Financial Services Group, Inc. (“The Hartford”), serves as investment manager to the Fund pursuant to an Investment Management Agreement with the Company. As investment manager, HL Advisors has overall investment supervisory responsibility for the Fund. In addition, HL Advisors provides administrative personnel, services, equipment, facilities and office space for proper operation of the Fund. HL Advisors has contracted with Hartford Investment Management Company (“Hartford Investment Management”) under a sub-advisory agreement for the provision of day-to-day investment management services to the Fund in accordance with the Fund’s investment objective and policies. The Fund pays a fee to HL Advisors, a portion of which may be used to compensate Hartford Investment Management. |
The schedule below reflects the rates of compensation paid to HL Advisors for investment management services rendered as of December 31, 2011; the rates are accrued daily and paid monthly.
| Average Daily Net Assets | Annual Fee |
| On first $2 billion | 0.3000% |
| On next $3 billion | 0.2000% |
| On next $5 billion | 0.1800% |
| Over $10 billion | 0.1700% |
| b) | Accounting Services Agreement – Pursuant to the Fund Accounting Agreement between HLIC and the Company, on behalf of the Fund, HLIC provides accounting services to the Fund and receives monthly compensation based on the Fund’s average daily net assets at the rates set forth below. The Fund’s accounting services fees are accrued daily and paid monthly. |
| Average Daily Net Assets | Annual Fee |
| All Assets | 0.010% |
| c) | Operating Expenses – Allocable expenses incurred by the Company are allocated to each Fund and allocated to classes within a Fund in proportion to the average daily net assets of the Fund and each class, except where allocation of certain expenses is more fairly made directly to the Fund or to specific classes within a Fund. |
| d) | Distribution Plan for Class IB shares – The Company, on behalf of the Fund, has adopted a Distribution Plan pursuant to Rule 12b-1 of the 1940 Act to compensate the Distributor, Hartford Securities Distribution Company, Inc. (a wholly owned, ultimate subsidiary of The Hartford), from assets attributable to the Class IB shares for services rendered and expenses borne in connection with activities primarily intended to result in the sale of the Class IB shares, subject to the review and approval of the Company’s Board of Directors. |
The Distribution Plan provides that the Fund may pay annually up to 0.25% of the average daily net assets of the Fund attributable to its Class IB shares for activities primarily intended to result in the sale of Class IB shares. The Board has the authority to suspend or reduce these payments at any point in time. Under the terms of the Distribution Plan and the principal underwriting agreement, the Fund is authorized to make payments monthly to the Distributor that may be used to pay or compensate entities providing distribution and shareholder servicing with respect to the Class IB shares for such entities’ fees or expenses incurred or paid in that regard. These fees are accrued daily and paid monthly.
| e) | Other Related Party Transactions – Certain officers of the Fund are directors and/or officers of HL Advisors and/or The Hartford or its subsidiaries. For the year ended December 31, 2011, a portion of the Fund’s chief compliance officer’s salary was paid by all the investment companies in the Hartford fund complex. The portion allocated to the Funds was in the amount of $1. These fees are accrued daily and paid monthly. |
| 8. | Investment Transactions: |
For the year ended December 31, 2011, the Fund's aggregate purchases and sales of investment securities (excluding short-term investments) were as follows:
| | | Amount | |
| Cost of Purchases Excluding U.S. Government Obligations | | $ | 33,353 | |
| Sales Proceeds Excluding U.S. Government Obligations | | | 149,747 | |
The Fund is one of several Hartford funds that participate in a $500 million committed revolving line of credit facility. The facility is to be used for temporary or emergency purposes. Under the arrangement, the funds are required to own securities having a market value in excess of 300% of the total bank borrowings. The interest rate on borrowings varies depending on the nature of the loan. The facility also requires a fee to be paid based on the amount of the commitment. This commitment fee is allocated to all of the funds participating in the line of credit based on the average net assets of the funds. During the year ended December 31, 2011, the Fund did not have any borrowings under this facility.
| 10. | Industry Classifications: |
Other than the industry classifications “Other Investment Pools and Funds” and “Exchange Traded Funds,” equity industry classifications used in this report are the Global Industry Classification Standard, which was developed by and is the exclusive property and service mark of MSCI, Inc. and Standard & Poor’s.
Under the Company’s organizational documents, the Company shall indemnify its officers and directors to the full extent required or permitted under Maryland General Corporation Law and the federal securities laws. In addition, the Company, on behalf of the Fund, may enter into contracts that contain a variety of indemnifications. The Company’s maximum exposure under these arrangements is unknown. However, as of the date of these financial statements, the Company has not had prior claims or losses pursuant to these contracts and expects the risk of loss to be remote.
Hartford Index HLS Fund
Financial Highlights
- Selected Per-Share Data (A) -
Class | Net Asset Value at Beginning of Period | Net Investment Income (Loss) | Payments from (to) Affiliate | Net Realized and Unrealized Gain (Loss) on Investments | Total from Investment Operations | Dividends from Net Investment Income | Distributions from Realized Capital Gains | Distributions from Capital | Total Distributions | Net Increase (Decrease) in Net Asset Value | Net Asset Value at End of Period |
| For the Year Ended December 31, 2011 |
| IA | $ 26.20 | $ 0.52 | $ – | $ (0.05) | $ 0.47 | $ (0.47) | $ – | $ – | $ (0.47) | $ – | $ 26.20 |
| IB | 26.08 | 0.39 | – | 0.03 | 0.42 | (0.41) | – | – | (0.41) | 0.01 | 26.09 |
| For the Year Ended December 31, 2010 |
| IA | 23.22 | 0.44 | – | 2.97 | 3.41 | (0.43) | – | – | (0.43) | 2.98 | 26.20 |
| IB | 23.12 | 0.34 | – | 2.99 | 3.33 | (0.37) | – | – | (0.37) | 2.96 | 26.08 |
| For the Year Ended December 31, 2009 |
| IA | 18.75 | 0.42 | – | 4.48 | 4.90 | (0.42) | (0.01) | – | (0.43) | 4.47 | 23.22 |
| IB | 18.69 | 0.35 | – | 4.46 | 4.81 | (0.37) | (0.01) | – | (0.38) | 4.43 | 23.12 |
| For the Year Ended December 31, 2008 |
| IA | 31.54 | 0.59 | – | (12.16) | (11.57) | (0.58) | (0.64) | – | (1.22) | (12.79) | 18.75 |
| IB | 31.40 | 0.51 | – | (12.07) | (11.56) | (0.51) | (0.64) | – | (1.15) | (12.71) | 18.69 |
| For the Year Ended December 31, 2007 |
| IA | 32.36 | 0.59 | – | 1.07 | 1.66 | (0.57) | (1.91) | – | (2.48) | (0.82) | 31.54 |
| IB | 32.22 | 0.48 | – | 1.09 | 1.57 | (0.48) | (1.91) | – | (2.39) | (0.82) | 31.40 |
| | | | | | | | | | | | |
| (A) | Information presented relates to a share outstanding throughout the indicated period. |
| (B) | The figures do not include sales charges or other fees which may be applied at the variable life insurance, variable annuity or qualified retirement plan product level. Any such additional sales charges or other fees would lower the Fund's performance. |
| (C) | Portfolio turnover rate is calculated on the basis of the Fund as a whole without distinguishing between the classes of shares issued. |
- Ratios and Supplemental Data -
Total Return(B) | | Net Assets at End of Period | | | Ratio of Expenses to Average Net Assets Before Waivers | | | Ratio of Expenses to Average Net Assets After Waivers | | | Ratio of Net Investment Income (Loss) to Average Net Assets | | | Portfolio Turnover Rate(C) | |
| |
| 1.81 | % | $ | 673,275 | | | | 0.33 | % | | | 0.33 | % | | | 1.74 | % | | | 3 | % |
| 1.60 | | | 232,459 | | | | 0.58 | | | | 0.58 | | | | 1.51 | | | | – | |
| | | | | | | | | | | | | | | | | | | | | |
| 14.73 | | | 809,629 | | | | 0.34 | | | | 0.34 | | | | 1.73 | | | | 4 | |
| 14.45 | | | 209,260 | | | | 0.59 | | | | 0.59 | | | | 1.48 | | | | – | |
| | | | | | | | | | | | | | | | | | | | | |
| 26.15 | | | 811,634 | | | | 0.35 | | | | 0.35 | | | | 2.00 | | | | 6 | |
| 25.81 | | | 166,162 | | | | 0.60 | | | | 0.60 | | | | 1.75 | | | | – | |
| | | | | | | | | | | | | | | | | | | | | |
| (37.11 | ) | | 718,081 | | | | 0.32 | | | | 0.32 | | | | 2.02 | | | | 4 | |
| (37.27 | ) | | 138,014 | | | | 0.57 | | | | 0.57 | | | | 1.77 | | | | – | |
| | | | | | | | | | | | | | | | | | | | | |
| 5.20 | | | 1,390,827 | | | | 0.33 | | | | 0.33 | | | | 1.61 | | | | 4 | |
| 4.94 | | | 271,967 | | | | 0.58 | | | | 0.58 | | | | 1.36 | | | | – | |
| | | | | | | | | | | | | | | | | | | | | |
Report of Independent Registered Accounting Firm
The Board of Directors and Shareholders of
Hartford Series Fund, Inc.
We have audited the accompanying statement of assets and liabilities, including the schedule of investments, of Hartford Index HLS Fund (one of the portfolios constituting Hartford Series Fund, Inc. (the Funds)) as of December 31, 2011, and the related statement of operations for the year then ended, the statements of changes in net assets for each of the two years in the period then ended, and the financial highlights for each of the five years in the period then ended. These financial statements and financial highlights are the responsibility of the Funds’ management. Our responsibility is to express an opinion on these financial statements and financial highlights based on our audits.
We conducted our audits in accordance with the standards of the Public Company Accounting Oversight Board (United States). Those standards require that we plan and perform the audit to obtain reasonable assurance about whether the financial statements and financial highlights are free of material misstatement. We were not engaged to perform an audit of the Funds’ internal control over financial reporting. Our audits included consideration of internal control over financial reporting as a basis for designing audit procedures that are appropriate in the circumstances, but not for the purpose of expressing an opinion on the effectiveness of the Funds’ internal control over financial reporting. Accordingly, we express no such opinion. An audit also includes examining, on a test basis, evidence supporting the amounts and disclosures in the financial statements and financial highlights, assessing the accounting principles used and significant estimates made by management, and evaluating the overall financial statement presentation. Our procedures included confirmation of securities owned as of December 31, 2011, by correspondence with the custodian and brokers or by other appropriate auditing procedures where replies from brokers were not received. We believe that our audits provide a reasonable basis for our opinion.
In our opinion, the financial statements and financial highlights referred to above present fairly, in all material respects, the financial position of Hartford Index HLS Fund of Hartford Series Fund, Inc. at December 31, 2011, the results of its operations for the year then ended, the changes in its net assets for each of the two years in the period then ended, and the financial highlights for each of the five years in the period then ended, in conformity with U.S. generally accepted accounting principles.
|
Minneapolis, MN
February 13, 2012 |
Hartford Index HLS Fund
Directors and Officers (Unaudited)
The Board of Directors of the Company appoints officers who are responsible for the day-to-day operations of the Fund and who execute policies formulated by the Directors. Each director serves until his or her death, resignation, or retirement or until the next annual meeting of shareholders is held or until his or her successor is elected and qualifies.
Directors and officers who are employed by or who have a financial interest in The Hartford are considered “interested” persons of the Fund pursuant to the 1940 Act. Each officer and two of the Company’s directors, as noted in the chart below, are “interested” persons of the Fund. Each director serves as a director for The Hartford Mutual Funds, Inc., The Hartford Mutual Funds II, Inc., Hartford Series Fund, Inc., Hartford HLS Series Fund II, Inc., and as a trustee for The Hartford Alternative Strategies Fund, which, as of December 31, 2011, collectively consist of 91 funds. Correspondence may be sent to directors and officers c/o Hartford Mutual Funds, P.O. Box 2999, Hartford, Connecticut 06104-2999, except that correspondence to Ms. Fagely may be sent to 500 Bielenberg Drive, Woodbury, Minnesota 55125.
The table below sets forth, for each director and officer, his or her name, year of birth, current position with the Company and date first elected or appointed to Hartford Series Fund, Inc. (“HSF”), and Hartford HLS Series Fund II, Inc. (“HSF2”), principal occupation, and, for directors, other directorships held. The Fund’s statement of additional information contains further information on the directors and is available free of charge by calling 1-800-862-6668 or writing to Hartford HLS Funds, c/o Individual Annuity Services, P.O. Box 5085, Hartford, CT 06102-5085.
Information on the aggregate remuneration paid to the directors of the Company can be found in the Statement of Operations herein. The Fund pays to The Hartford a portion of the chief compliance officer’s compensation, but does not pay salaries or compensation to any of their other officers or directors who are employed by The Hartford.
Non-Interested Directors
Lynn S. Birdsong (1946) Director since 2003, Co-Chairman of the Investment Committee
Mr. Birdsong is a private investor. Mr. Birdsong currently serves as a Director of the Sovereign High Yield Investment Company (April 2010 to current). Mr. Birdsong currently serves as an Independent Director of Nomura Partners Funds, Inc. (formerly, The Japan Fund) (March 2003 to current). From 2003 to March 2005, Mr. Birdsong was an independent director of the Atlantic Whitehall Funds. From 1979 to 2002, Mr. Birdsong was a managing director of Zurich Scudder Investments, an investment management firm. During his employment with Scudder, Mr. Birdsong was an Interested Director of The Japan Fund. Since 1981, Mr. Birdsong has been a partner in Birdsong Company, an advertising specialty firm.
Robert M. Gavin, Jr. (1940) Director since 2002 (HSF) and 1986 (HSF2), Chairman of the Board since 2004
Dr. Gavin is an educational consultant. Prior to September 1, 2001, he was President of Cranbrook Education Community and prior to July 1996, he was President of Macalester College, St. Paul, Minnesota.
Duane E. Hill (1945) Director since 2001 (HSF) and 2002 (HSF2), Chairman of the Nominating Committee
Mr. Hill is Partner of TSG Ventures L.P., a private equity investment company. Mr. Hill is a former partner of TSG Capital Group, a private equity investment firm that served as sponsor and lead investor in leveraged buyouts of middle market companies.
Sandra S. Jaffee (1941) Director since 2005
Ms. Jaffee served as Chairman (2008 to 2009) and Chief Executive Officer of Fortent (formerly Searchspace Group), a leading provider of compliance/regulatory technology to financial institutions from August 2005 to August 2009. From August 2004 to August 2005, Ms. Jaffee served as an Entrepreneur in Residence with Warburg Pincus, a private equity firm. From September 1995 to July 2004, Ms. Jaffee served as Executive Vice President at Citigroup, where she was President and Chief Executive Officer of Citibank’s Global Securities Services (1995 to 2003). Ms. Jaffe currently serves as a member of the Board of Directors of Broadridge Financial Solutions as well as a Trustee of Muhlenberg College.
William P. Johnston (1944) Director since 2005, Chairman of the Compliance Committee
In June 2006, Mr. Johnston was appointed as Senior Advisor to The Carlyle Group, a global private equity investment firm. In August 2007, Mr. Johnston was elected to the Board of Directors of LifeCare Holdings, Inc. In February 2008, Mr. Johnston was elected to the Board of Directors of HCR-ManorCare, Inc. In May 2006, Mr. Johnston was elected to the Supervisory Board of Fresenius Medical Care AG & Co. KGaA, after its acquisition of Renal Care Group, Inc. in March 2006. Mr. Johnston joined Renal Care Group in November 2002 as a member of the Board of Directors and served as Chairman of the Board from March 2003 through March 2006. Mr. Johnston served as a Director of MultiPlan, Inc. from July 2006 through August 2010. From September 1987 to December 2002, Mr. Johnston was with Equitable Securities Corporation (and its successors, SunTrust Equitable Securities and SunTrust Robinson Humphrey) serving in various investment banking and managerial positions, including Managing Director and Head of Investment Banking, Chief Executive Officer and Vice Chairman.
Hartford Index HLS Fund
Directors and Officers (Unaudited) – (continued)
Phillip O. Peterson (1944) Director since 2002 (HSF) and 2000 (HSF2), Chairman of the Audit Committee
Mr. Peterson is a mutual fund industry consultant. He was a partner of KPMG LLP (an accounting firm) until July 1999. Mr. Peterson joined William Blair Funds in February 2007 as a member of the Board of Trustees. From January 2004 to April 2005, Mr. Peterson served as Independent President of the Strong Mutual Funds.
Lemma W. Senbet (1946) Director since 2005
Dr. Senbet is the William E. Mayer Chair Professor of Finance and Director, Center for Financial Policy, at the University of Maryland, Robert H. Smith School of Business. He was chair of the Finance Department from 1998 to 2006. Previously he was a chaired professor of finance at the University of Wisconsin-Madison. Also, he was director of the Fortis Funds from March 2000 to July 2002. Dr. Senbet served the finance profession in various capacities, including as director of the American Finance Association and President of the Western Finance Association. In 2006, Dr. Senbet was inducted Fellow of Financial Management Association International for his career-long distinguished scholarship and professional service.
Interested Directors and Officers
David N. Levenson (1966) Director since 2010
Mr. Levenson currently serves as President of The Hartford’s Wealth Management business. He was appointed to this role in July 2010. Previously, Mr. Levenson served as Executive Vice President of Legacy Holdings for The Hartford from June 2009 to July 2010. From 2006 to 2009, Mr. Levenson was with Hartford Life Insurance K.K. where he served as President and Chief Executive Officer from 2007 to 2009. He served as Managing Director of Hartford Investment Management Company from 2005 to 2006. Additionally, Mr. Levenson serves as Executive Vice President of The Hartford and as President, Director and Chief Executive Officer of Hartford Life Insurance Company (“HLIC”) and Hartford Life, Inc. (“HL Inc.”).
Lowndes A. Smith (1939) Director since 1996 (HSF) and 2002 (HSF2), Co-Chairman of the Investment Committee
Mr. Smith served as Vice Chairman of The Hartford from February 1997 to January 2002, as President and Chief Executive Officer of HL Inc. from February 1997 to January 2002, and as President and Chief Operating Officer of The Hartford Life Insurance Companies from January 1989 to January 2002. Mr. Smith serves as a Director of White Mountains Insurance Group, Ltd., One Beacon Insurance and Symetra Financial and as a Managing Director of Whittington Gray Associates.
Other Officers
James E. Davey (1964) President and Chief Executive Officer since 2010
Mr. Davey serves as Executive Vice President of HLIC. Additionally, Mr. Davey serves as President, Chief Executive Officer and Manager of Hartford Investment Financial Services, Inc. (“HIFSCO”) and President, Chief Executive Officer and Manager of HL Advisors. Mr. Davey joined The Hartford in 2002.
Michael R. Dressen (1963) AML Compliance Officer since 2011
Mr. Dressen currently serves as Assistant Vice President of HLIC. He also serves as Chief Compliance Officer and AML Compliance Officer of Hartford Administrative Services Company (“HASCO”) and as Assistant Secretary and Compliance Officer of HIFSCO. Mr Dressen joined The Hartford in 2005 from State Farm Insurance Companies where he held various positions related to mutual funds, variable products, and property casualty insurance.
Tamara L. Fagely (1958) Vice President, Treasurer and Controller since 2002 (HSF) and 1993 (HSF2)
Ms. Fagely has been a Vice President of HASCO since 1998 and Chief Financial Officer since 2006. Currently Ms. Fagely is a Vice President of HLIC. She served as Assistant Vice President of HLIC from December 2001 through March 2005. In addition, Ms. Fagely is Controller and Chief Financial Officer of HIFSCO.
Dr. Robert J. Froehlich (1953) Senior Managing Director since 2009
Dr. Froehlich joined The Hartford as Senior Managing Director in September 2009. Prior to joining The Hartford, Dr. Froehlich served as Vice Chairman of Deutsche Asset Management from 1997-2009.
Edward P. Macdonald (1967) Vice President, Secretary and Chief Legal Officer since 2005
Mr. Macdonald serves as Vice President of HLIC and Chief Legal Officer of Mutual Funds and Vice President of HIFSCO. He also serves as Vice President and Secretary of HASCO, and Chief Legal Officer, Secretary and Vice President of HL Advisors. Mr. Macdonald joined The Hartford in 2005.
Vernon J. Meyer (1964) Vice President since 2006
Mr. Meyer serves as Senior Vice President of HLIC. He also serves as Senior Vice President of HIFSCO and HL Advisors. Mr. Meyer joined The Hartford in 2004.
Colleen B. Pernerewski (1969) Vice President and Chief Compliance Officer since 2010
Ms. Pernerewski serves as Vice President and Chief Investment Advisor Compliance Officer of HIFSCO and as Vice President and Chief Compliance Officer of HL Advisors. Ms. Pernerewski joined The Hartford in 2005 from Travelers Life and Annuity where she served as Counsel (2004-2005). Prior to Travelers Life and Annuity, Ms. Pernerewski held the position of Counsel at The Hartford (1998-2004).
Elizabeth L. Schroeder (1966) Vice President since 2010
Ms. Schroeder currently serves as Assistant Vice President of HLIC. Ms. Schroeder joined HLIC in 1991. She is also an Assistant Vice President of HASCO, HIFSCO and HL Advisors.
Martin Swanson (1962) Vice President since 2010
Mr. Swanson is a Vice President of HLIC. Mr. Swanson also serves as Vice President/Marketing for HIFSCO. Prior to joining HLIC in 1998, Mr. Swanson was a Vice President at PaineWebber, Inc.
Jane Wolak (1961) Vice President since 2009
Ms. Wolak currently serves as Senior Vice President of HLIC. Ms. Wolak joined HLIC as Vice President, Retail Product Services in May 2007. She is also Vice President of HASCO. Previously, Ms. Wolak was with Sun Life Financial where she held the position of Vice President, Service Center Operations from 2001-2007.
HOW TO OBTAIN A COPY OF THE FUND’S PROXY VOTING POLICIES AND VOTING RECORDS (UNAUDITED)
A description of the policies and procedures that the Fund uses to determine how to vote proxies relating to portfolio securities and a record of how the Fund voted any proxies for the twelve-month period ended June 30, 2011 are available (1) without charge, upon request, by calling 800-862-6668 and (2) on the SEC’s website at http://www.sec.gov.
QUARTERLY PORTFOLIO HOLDINGS INFORMATION (UNAUDITED)
The Fund files a complete schedule of portfolio holdings with the SEC for the first and third quarters of each fiscal year on Form N-Q. The Fund’s Forms are available (1) without charge, upon request, by calling 800-862-6668 and (2) on the SEC’s website at http://www.sec.gov. The Form N-Q may be reviewed and copied at the SEC’s Public Reference Room in Washington, DC. Information on the operation of the Public Reference Room may be obtained by calling 1-800-SEC-0330.
Hartford Index HLS Fund
Expense Example (Unaudited)
Your Fund's Expenses
As a shareholder of the Fund, you incur two types of costs: (1) transaction costs and (2) ongoing costs including investment management fees, distribution fees, and other fund expenses. This example is intended to help you understand your ongoing costs (in dollars) of investing in the Fund and to compare these costs with the ongoing costs of investing in other mutual funds. The example is based on an investment of $1,000 invested at the beginning of the period and held for the period of June 30, 2011 through December 31, 2011.
Actual Expenses
The first set of columns of the table below provides information about actual account values and actual expenses. You may use the information in this column, together with the amount you invested, to estimate the expenses that you paid over the period. Simply divide your account value by $1,000 (for example, an $8,600 account value divided by $1,000 = 8.6), then multiply the result by the number in the line under the heading entitled “Expenses Paid During Period” to estimate the expenses you paid on your account during this period.
Hypothetical Example for Comparison Purposes
The second set of columns of the table below provides information about hypothetical account values and hypothetical expenses based on the Fund’s actual expense ratio and an assumed rate of return of 5% per year before expenses, which is not the Fund’s actual return. The hypothetical account values and expenses may not be used to estimate the actual ending account balance or expenses you paid for the period. You may use this information to compare the ongoing costs of investing in the Fund and other funds. To do so, compare this 5% hypothetical example with the 5% hypothetical examples that appear in the shareholder reports of the other funds.
Please note that the expenses shown in the table are meant to highlight your ongoing costs only and do not reflect any transactional costs, such as sales charges (loads) and CDSC. Therefore, the second set of columns of the table is useful in comparing ongoing costs only, and will not help you determine the relative total costs of owning different funds. In addition, if these transactional costs were included, your costs would be higher. Expenses are equal to the Fund's annualized expense ratios multiplied by average account value over the period, multiplied by 184/365 (to reflect the one-half year period).
| | Actual Return | Hypothetical (5% return before expenses) | | | |
| | Beginning
Account Value
June 30, 2011 | Ending Account Value
December 31, 2011 | Expenses paid during the period
June 30, 2011
through
December 31, 2011 | Beginning
Account Value
June 30, 2011 | Ending Account Value
December 31, 2011 | Expenses paid during the period
June 30, 2011
through
December 31, 2011 | Annualized expense ratio | Days in the current 1/2 year | Days in the full year |
| Class IA | $1,000.00 | $961.70 | $1.63 | $1,000.00 | $1,023.54 | $1.68 | 0.33% | 184 | 365 |
| Class IB | $1,000.00 | $960.91 | $2.87 | $1,000.00 | $1,022.28 | $2.96 | 0.58% | 184 | 365 |
| | | | | | | | | | |
Hartford Index HLS Fund
Approval of Investment Management and Investment Sub-Advisory Agreements (Unaudited)
Section 15(c) of the Investment Company Act of 1940, as amended (the “1940 Act”), requires that each mutual fund’s board of directors, including a majority of those directors who are not “interested persons” of the mutual fund, as defined in the 1940 Act (the “Independent Directors”), annually review and consider the continuation of the mutual fund’s investment advisory and sub-advisory agreements. At its meeting held on August 2-3, 2011, the Board of Directors (the “Board”) of Hartford Series Fund, Inc., including each of the Independent Directors, unanimously voted to approve the continuation of the investment management agreement for Hartford Index HLS Fund (the “Fund”) with HL Investment Advisors, LLC (“HL Advisors”) and the continuation of the investment sub-advisory agreement between HL Advisors and the Fund’s sub-adviser, Hartford Investment Management Company (the “Sub-adviser,” and together with HL Advisors, the “Advisers”) (collectively, the “Agreements”).
In the months preceding the August 2-3, 2011 meeting, the Board requested, received, and reviewed written responses from the Advisers to questions posed to them on behalf of the Independent Directors and supporting materials relating to those questions and responses. The Board considered information furnished to the Board at its meetings throughout the year, as well as information specifically prepared in connection with the annual approval of the Agreements at the Board’s meetings held on June 21-22, 2011 and August 2-3, 2011. Information provided to the Board at its meetings throughout the year included, among other things, reports on Fund performance, legal and compliance matters, sales and marketing activity, shareholder services, and the other services provided to the Fund by the Advisers and their affiliates. In addition, the Board received in-person presentations by Fund officers and representatives of HL Advisors at the Board’s meetings on June 21-22, 2011 and August 2-3, 2011 concerning the Agreements.
The Independent Directors, advised by independent legal counsel, engaged two service providers to assist them with evaluating the Agreements with respect to the Fund. Lipper Inc. (“Lipper”), an independent provider of investment company data, was retained to provide the Board with reports on how the Fund’s contractual management fees, actual management fees, other non-management fees, overall expense ratios and investment performance compared to those of mutual funds with similar investment objectives. The Independent Directors also engaged an independent financial services consulting firm (the “Consultant”) to assist them in evaluating the Fund’s management fees, sub-advisory fees, other non-management fees, overall expense ratios and investment performance. In addition, the Consultant reviewed the profitability calculations utilized by HL Advisors in connection with the continuation of the investment management agreement.
In determining to continue the Agreements for the Fund, the members of the Board reviewed and evaluated information and factors they believed to be relevant and appropriate in light of the information that the Board deemed necessary and appropriate through the exercise of their reasonable business judgment. While individual members of the Board may have weighed certain factors differently, the Board’s determination to continue the Agreements was based on a comprehensive consideration of all information provided to the Board throughout the year and specifically with respect to the continuation of the Agreements. A more detailed discussion of the factors the Board considered with respect to its approval of the Agreements is provided below.
Nature, Extent, And Quality Of Services Provided by the Advisers
The Board requested and considered information concerning the nature, extent, and quality of the services provided to the Fund by the Advisers. The Board considered, among other things, the terms of the Agreements and the range of services provided by the Advisers. The Board considered the Advisers’ professional personnel who provide services to the Fund, including each Adviser’s ability and experience in attracting and retaining qualified personnel to service the Fund. The Board considered each Adviser’s reputation and overall financial strength, as well as its willingness to consider and implement organizational and operational changes designed to improve services to the Fund. In addition, the Board considered the quality of each Adviser’s communications with the Board and responsiveness to Board inquiries.
The Board also requested and evaluated information concerning each Adviser’s regulatory and compliance environment. In this regard, the Board requested and reviewed information on each Adviser’s compliance policies and procedures, compliance history, and a report from the Fund’s Chief Compliance Officer on each Adviser’s compliance with applicable laws and regulations, including responses to regulatory developments and compliance issues raised by regulators. The Board also noted the Advisers’ support of the Fund’s compliance control structure, particularly the resources devoted by the Advisers in support of the Fund’s obligations pursuant to Rule 38a-1 under the 1940 Act.
Hartford Index HLS Fund
Approval of Investment Management and Investment Sub-Advisory Agreements (Unaudited) – (continued)
With respect to HL Advisors, the Board noted that under the Agreements, HL Advisors is responsible for the management of the Fund, including overseeing fund operations and service providers, as well as investment advisory services in connection with selecting, monitoring and supervising the Sub-adviser. The Board considered HL Advisors’ ongoing monitoring of people, process and performance, including its quarterly reviews of each of the Hartford HLS Funds, semi-annual meetings with the leaders of each Fund’s portfolio management team, and oversight of the Funds’ 49 portfolio managers. The Board recognized that HL Advisors has demonstrated a record of making changes to the management and/or strategies of the Funds when warranted. The Board considered HL Advisors’ oversight of the Sub-adviser’s investment approach and results, process for monitoring best execution of portfolio trades by the Sub-adviser, and approach to risk management with respect to the Fund and the service providers to the Fund. The Board also considered HL Advisors’ oversight of compliance with the Fund’s objective and policies as well as with applicable laws and regulations, noting that regulatory and other developments had over time led to an increase in the scope of HL Advisors’ services in this regard. In addition, the Board considered HL Advisors’ ongoing commitment to review and rationalize the Hartford fund family’s product line-up and the expenses that HL Advisors had incurred in connection with fund combinations in recent years. The Board considered that HL Advisors or its affiliates are responsible for providing the Fund’s officers. The Board also noted that Hartford Life Insurance Company (“HLIC”) provides administrative services to the Fund. The Board considered its experiences with HL Advisors and HLIC with respect to each of these services.
With respect to the Sub-adviser, who provides day-to-day portfolio management services, the Board considered the quality of the Fund’s portfolio manager, the Sub-adviser’s other investment personnel, its investment philosophy and process, investment research capabilities and resources, performance record, trade execution capabilities and experience. The Board considered the experience of the Fund’s portfolio manager, the number of accounts managed by the portfolio manager, and the Sub-adviser’s method for compensating the portfolio manager.
Based on these considerations, the Board concluded that it was satisfied with the nature, extent and quality of the services provided to the Fund by HL Advisors and the Sub-adviser.
Performance of the Fund and the Advisers
The Board considered the investment performance of the Fund. In this regard, the Board reviewed the performance of the Fund over different time periods presented in the materials and evaluated HL Advisors’ analysis of the Fund’s performance for these time periods, noting that the Fund is managed to approximate the performance of the S&P 500 Index. The Board considered information and materials provided to the Board by the Advisers concerning Fund performance, as well as information from Lipper comparing the investment performance of the Fund to an appropriate benchmark and universe of peer funds. The Board noted that the performance of the Fund was within expectations.
The Board considered the detailed investment analytics reports provided by The Hartford’s Investment Advisory Group throughout the year. These reports include, among other things, information on the Fund’s gross and net returns, the Fund’s investment performance relative to an appropriate benchmark and peer group, various statistics concerning the Fund’s portfolio, and a narrative summary of various factors affecting Fund performance. The Board considered the Advisers’ cooperation with the Investment Committee, which assists the Board in evaluating the performance of the Fund at periodic meetings throughout the year. The Board also considered the analysis provided by the Consultant relating to the Fund’s performance track record.
In light of all the considerations noted above, the Board concluded that it had continued confidence in HL Advisors’ and the Sub-adviser’s overall capabilities to manage the Fund.
Costs of the Services and Profitability of the Advisers
The Board reviewed information regarding HL Advisors’ cost to provide investment management and related services to the Fund and HL Advisors’ profitability, both overall and for the Fund, on a pre-tax basis without regard to distribution expenses. The Board also requested and reviewed information about the profitability to HL Advisors and its affiliates from all services provided to the Fund and all aspects of their relationship with the Fund. The Board noted that the fees payable to the Sub-adviser are equal to its estimated costs in providing sub-advisory services. Accordingly, the costs and profitability for the Sub-adviser and HL Advisors were considered in the aggregate.
The Board considered the Consultant’s review of the profitability calculations utilized by HL Advisors in connection with the continuation of the investment management agreement. In this regard, the Consultant reported that The Hartford’s process for calculating and reporting Fund profitability is reasonable, sound and well within common industry practice.
Based on these considerations, the Board concluded that the profits anticipated to be realized by the Advisers and their affiliates from their relationships with the Fund would not be excessive.
Comparison of Fees and Services Provided by the Advisers
The Board considered comparative information with respect to the management fees to be paid by the Fund to HL Advisors and the total expense ratios of the Fund. The Board also considered comparative information with respect to the sub-advisory fees to be paid by HL Advisors to the Sub-adviser, to the extent applicable. In this regard, the Board requested and reviewed information from HL Advisors and the Sub-adviser relating to the management and sub-advisory fees and total operating expenses for the Fund. The Board considered that the management fee for the Fund includes the fee paid to HLIC for providing certain administrative services to the Fund. The Board also reviewed information from Lipper comparing the Fund’s contractual management fees, actual management fees and overall expense ratios relative to a group of funds selected by Lipper, in consultation with the Consultant, and a broader universe of funds selected by Lipper.
While the Board recognized that comparisons between the Fund and peer funds are imprecise, given the differing service levels and characteristics of mutual funds and the different business models and cost structures of the Advisers, the comparative information provided by Lipper assisted the Board in evaluating the reasonableness of the Fund’s management and sub-advisory fees and total operating expenses. In addition, the Board considered the analysis and recommendations of the Consultant relating to the Fund’s management and sub-advisory fees and total operating expenses.
Based on these considerations, the Board concluded that the Fund’s fees and total operating expenses, in conjunction with the information about quality of services, profitability, economies of scale, and other matters discussed, were reasonable in light of the services provided.
Economies of Scale
The Board requested and considered information regarding the Advisers’ realization of economies of scale with respect to the Fund and whether the fee levels reflect these economies of scale for the benefit of the Fund’s investors. With respect to HL Advisors, the Board considered representations from HL Advisors that it is difficult to anticipate whether and to what extent economies may be realized by HL Advisors as assets grow over time. The Board reviewed the breakpoints in the management fee schedule for the Fund, which reduces fee rates as Fund assets grow over time. The Board recognized that a fund with assets beyond the last breakpoint level will continue to benefit from economies of scale because additional assets are charged the lowest breakpoint fee resulting in lower overall effective management fee rates. The Board also recognized that a fee schedule that reaches a lower breakpoint quickly provides shareholders with the benefit of anticipated or potential economies of scale.
The Board reviewed and evaluated materials from Lipper showing how management fee schedules of peer funds reflect economies of scale for the benefit of investors as a peer fund’s assets hypothetically increase over time. Based on information provided by HL Advisors, Lipper, and the Consultant, the Board recognized that there is no uniform methodology for establishing breakpoints or uniform pattern in asset levels that trigger breakpoints or the amounts of breakpoints triggered.
After considering all of the information available to it, the Board concluded that it was satisfied with the extent to which economies of scale would be shared for the benefit of the Fund’s shareholders based on currently available information and the effective advisory fees and expense ratios for the Fund at its current and reasonably anticipated asset levels. The Board noted, however, that it would continue to monitor future growth in Fund assets and the appropriateness of additional breakpoints.
Hartford Index HLS Fund
Approval of Investment Management and Investment Sub-Advisory Agreements (Unaudited) – (continued)
Other Benefits
The Board considered other benefits to the Advisers and their affiliates from their relationships with the Fund, including the role of the Fund in supporting the variable life insurance and variable annuity products offered by The Hartford. The Board reviewed information noting that HLIC, an affiliate of HL Advisors, receives fees for providing certain administrative services to the Fund, and that HLIC also receives fees for fund accounting and related services from the Fund, and the Board considered information on expected profits to HLIC or its affiliates for such services. The Board also considered that Hartford Administrative Services Company (“HASCO”), the Fund’s transfer agent and an affiliate of HL Advisors, receives transfer agency compensation from the Fund, and the Board reviewed information on the expected profitability of the Fund’s transfer agency function to HASCO. The Board considered information provided by HASCO indicating that the transfer agent fees charged by HASCO to the Fund were fair and reasonable based on publicly available information.
The Board also considered that Hartford Securities Distribution Company, Inc., as principal underwriter of the Fund, receives 12b-1 fees from the Fund. The Board also noted that certain affiliates of HL Advisors distribute shares of the Fund and receive compensation in that connection.
The Board considered the benefits, if any, to the Sub-adviser from any use of the Fund’s brokerage commissions to obtain soft dollar research.
The Board considered the benefits to shareholders of being part of the Hartford family of funds. The Board considered HL Advisors’ efforts to provide investors in the family with a broad range of investment styles and asset classes.
* * * *
Based upon its review of these various factors, among others, the Board concluded that it is in the best interests of the Fund and its shareholders for the Board to approve the Agreements for an additional year. In reaching this decision, the Board did not assign relative weights to the factors discussed above or deem any one or group of them to be controlling in and of themselves. In connection with their deliberations, the Independent Directors met separately in executive session on several occasions, with independent legal counsel, to review the relevant materials and consider their responsibilities under relevant laws and regulations.
The Hartford
P.O. Box 5085
Hartford, CT 06102-5085
Hartford Series Fund, Inc. is underwritten and distributed by Hartford Securities Distribution Company, Inc.
"The Hartford" is The Hartford Financial Services Group, Inc. and its subsidiaries.
Hartford Series Fund, Inc. inception dates range from 1977 to date. Hartford Series Fund, Inc. is not a subsidiary of The Hartford but is underwritten, distributed by and advised by subsidiaries of The Hartford. Investments in Hartford Series Fund, Inc. are not guaranteed by The Hartford or any other entity.
You should carefully consider investment objectives, risks, and charges and expenses of Hartford HLS Funds before investing. This and other information can be found in the Fund’s prospectus or summary prospectus, which can be obtained by calling 800-862-6668. Please read them carefully before you invest or send money.
HLSAR-IX11 2-12 109078 Printed in U.S.A ©2011 The Hartford, Hartford, CT 06115 | |
A MESSAGE FROM THE PRESIDENT
Dear Fellow Shareholders:
I want to take this opportunity to say thank you for investing in Hartford HLS Funds.
This has been a tumultuous year. In the beginning of 2011, we witnessed tension-fueled political uprisings in the already-volatile Middle East and North Africa region. We also watched as Japan dealt with a series of crises including a massive earthquake and subsequent tsunami. Yet, U.S. economic conditions continued to improve, with gains in consumer confidence and retail sales. During the first half of 2011, domestic, international, and world indices (as measured by the S&P 500, MSCI EAFE and MSCI World) were all up more than 5% through June, 30 2011.
The economic recovery, however, lost momentum in the second half of 2011. The employment and housing markets both remain extremely challenged. Investors continue to be concerned about the implications of the European sovereign debt crisis, as well as our own high levels of domestic debt. Fears that the European sovereign debt crisis could continue to drag down the global economy have weighed heavily on stocks.
Ongoing apprehension regarding the U.S. debt ceiling during the summer and the resulting downgrade of the U.S. sovereign credit rating by Standard & Poor’s also contributed to weaker investor confidence.
There are, however, some reasons to remain confident. Corporations have record levels of cash on their balance sheets—corporate cash has doubled in the past 10 years. In addition, U.S. gross domestic product expanded at a 2.5 percent annual rate in the third quarter according to the Commerce Department, as consumers and businesses set aside fears about the recovery and stepped up spending. Corporate earnings have also remained positive, with a majority of companies beating expectations each quarter this year. This momentum will hopefully continue into next year.
As we head into 2012, in light of the continued market volatility, now would be a good time to schedule a meeting with your financial advisor to examine your current investment strategy and determine whether you are on the right track.
| • | Does your fixed-income portfolio complement your equity portfolio? |
| • | Are you receiving diversified sources of income? |
| • | Is your portfolio still in line with your risk tolerance and investment time horizon? |
Talk to your advisor to see what changes you should make to address these concerns and opportunities.
Thank you again for investing with Hartford HLS Funds.
James Davey
President
Hartford HLS Funds
Hartford International Opportunities HLS Fund
Table of Contents
This report is prepared for the general information of contract owners and qualified retirement plan participants. It is not an offer of contracts or of qualified retirement plans. It should not be used in connection with any offer, except in conjunction with the appropriate product prospectus which contains all pertinent information including the applicable sales, administrative and other charges.
The views expressed in the Fund’s Manager Discussion under ‘‘Why did the Fund perform this way?’’ and ‘‘What is the outlook?’’ are views of the Fund’s sub-adviser and portfolio management team through the end of the period and are subject to change based on market and other conditions.
Hartford International Opportunities HLS Fund inception 07/02/1990
| (sub-advised by Wellington Management Company, LLP) | Investment objective – Seeks long-term growth of |
| | capital. |
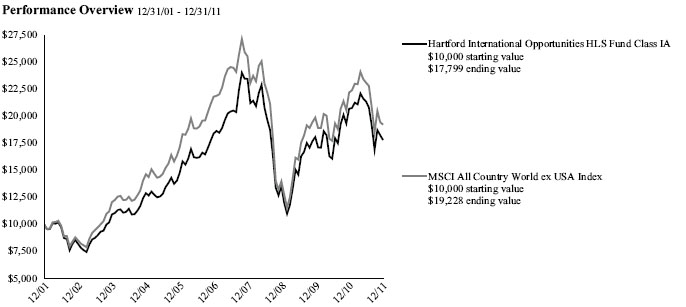
The chart above shows the growth of a $10,000 investment in Class IA. Growth results in classes other than Class IA will vary from what is seen above due to differences in the expenses charged to those share classes.
Average Annual Total Returns (as of 12/31/11)
| | 1 Year | 5 Year | 10 Year |
| International Opportunities IA | -13.97% | -0.66% | 5.93% |
| International Opportunities IB | -14.19% | -0.91% | 5.67% |
| MSCI All Country World ex USA Index | -13.33% | -2.48% | 6.76% |
PAST PERFORMANCE IS NOT INDICATIVE OF FUTURE RESULTS.
Total returns presented above were calculated using the Fund's net asset value available to shareholders for sale or redemption of Fund shares on December 31, 2011, which may exclude investment transactions as of this date.
MSCI All Country World ex USA Index is a broad-based, unmanaged, market capitalization weighted, total return index that measures the performance of both developed and emerging stock markets, excluding the U.S. The index is calculated to exclude companies and share classes which cannot be freely purchased by foreigners.
You cannot invest directly in an index.
The chart represents a hypothetical investment in the Fund. Performance data represents past performance and current performance could be higher or lower.
Performance information may reflect historical or current expense waivers/reimbursements from the investment adviser, without which performance would have been lower. For information on current expense waivers/reimbursements, please see the prospectus.
The value of the Fund will fluctuate so that when redeemed, it may be worth more or less than the original investment. The chart and table do not reflect the deductions of taxes, sales charges or other fees which may be applied at the variable life insurance, variable annuity or qualified retirement plan product level. Any such additional sales charges or other fees or expenses would lower the contract’s or plan’s performance.
Hartford International Opportunities HLS Fund
Manager Discussion (Unaudited)
December 31, 2011
| Portfolio Managers | | |
| Nicolas M. Choumenkovitch | Tara Connolly Stilwell, CFA | |
| Senior Vice President | Vice President | |
| | | |
How did the Fund perform?
The Class IA shares of the Hartford International Opportunities HLS Fund returned -13.97% for the twelve-month period ended December 31, 2011, underperforming its benchmark, the MSCI All Country World ex-US Index, which returned -13.33% for the same period. The Fund also underperformed the -13.42% return of the average fund in the Lipper International Growth Funds VP-UF peer group, a group of funds with investment strategies similar to those of the Fund.
Why did the Fund perform this way?
The one-year period ended December 31, 2011 was yet another extremely volatile period for equity markets. Global equities started the year on a strong note and continued to march higher in the first quarter of 2011, driven by investors’ enthusiasm for additional government debt purchases by the U.S. Federal Reserve, the extension of tax cuts in the U.S., strong earnings growth, and generally improving economic data. This enthusiasm reversed later in the period, however, as concerns surfaced that the global economy could slip back into a recession, resulting in a rapid decline in equity markets. Fears about sovereign debt and solvency in the eurozone, slowing economic expansion in China, and uncertainty about the sustainability of corporate earnings growth combined to produce an extremely volatile stock market, and return correlations among stocks spiked as investors shed risk and fled to safety. Markets ended the year on a positive note in the final month of the period with encouraging employment and manufacturing data in the U.S.
The Fund’s underperformance versus its benchmark was primarily due to weak stock selection, particularly within Materials, Consumer Discretionary, and Energy. This was partially offset by stronger selection in Utilities, Information Technology, and Consumer Staples. Allocation among sectors, a result of the bottom-up stock selection process (i.e. stock by stock fundamental research), was modestly additive to relative returns, due in part to underweight (i.e. the Fund’s sector position was less than the benchmark position) positions in Materials and Financials.
The largest detractors from benchmark relative returns were PDG Realty (Consumer Discretionary), Rio Tinto (Materials), and Royal Dutch Shell (Energy). Shares of Brazilian real estate company PDG Realty declined during the period due to questions surrounding the sale of special purpose vehicles (SPVs) as well as concerns over increasing land acquisition costs. Shares of international mining company Rio Tinto declined due to slowing growth and its effect on the firm’s iron ore production growth. Shares of Royal Dutch Shell rose sharply in a broad-based rally in Energy stocks during the fourth quarter. Not owning the stock detracted from relative returns. Other notable detractors from absolute (i.e. total return) performance included France-based producer of seamless steel tube products Vallourec (Industrials).
Top contributors to relative performance during the period included Imperial Tobacco (Consumer Staples), National Grid (Utilities), and Rolls-Royce (Industrials). Shares of international tobacco company Imperial Tobacco climbed during the period as a result of posting strong revenue growth in emerging markets. Shares of National Grid, the international electricity and gas company, benefited in part from regulatory concessions by the Office of the Gas and Electricity Markets (Ofgem) in the U.K. Shares of Rolls-Royce, a U.K.-based world-leading provider of power systems and services for use on land, at sea, and in air, rose as the company gained market share in wide body airplanes in Asia, where travel is expected to increase. Vodafone (Telecommunication Services) and BG Group (Energy) also contributed positively to absolute performance.
What is the outlook?
At a macro level, we expect the developed world to remain in a low growth environment and interest rates to stay low. Against a backdrop of higher volatility, we strive to maintain a well-balanced portfolio with investments that represent diverse economic drivers that are not necessarily reliant on broader GDP growth. We continue to be positioned generally for a stronger U.S. dollar and a better U.S. economy over time. Given how far Europe has fallen, we were able to find some attractively valued stock-specific opportunities there, but we have been selective. We expect market volatility to continue in Europe, thus we have been focusing on export-oriented companies or stocks with defensive characteristics.
As is consistent with the investment approach, we continue to look for opportunities at a company-by-company level, focusing on those companies which we believe can deliver
Hartford International Opportunities HLS Fund
Manager Discussion (Unaudited) – (continued)
December 31, 2011
improvements in return on investment capital (ROIC) or sustain ROIC for longer than the market anticipates.
At the end of the period, we were most overweight Industrials and Health Care, and most underweight Materials and Financials, relative to the benchmark. On a regional basis, we ended the period with an overweight to select European countries, including the U.K., France, and Germany. We were underweight in select Asia Pacific countries , including Australia, Japan, and South Korea.
Diversification by Industry
as of December 31, 2011
| Industry (Sector) | | Percentage of
Net Assets | |
| Automobiles & Components (Consumer Discretionary) | | | 3.3 | % |
| Banks (Financials) | | | 5.2 | |
| Capital Goods (Industrials) | | | 9.3 | |
| Commercial & Professional Services (Industrials) | | | 1.8 | |
| Consumer Durables & Apparel (Consumer Discretionary) | | | 1.3 | |
| Consumer Services (Consumer Discretionary) | | | 2.1 | |
| Diversified Financials (Financials) | | | 3.3 | |
| Energy (Energy) | | | 10.5 | |
| Food & Staples Retailing (Consumer Staples) | | | 1.7 | |
| Food, Beverage & Tobacco (Consumer Staples) | | | 7.9 | |
| Health Care Equipment & Services (Health Care) | | | 1.7 | |
| Household & Personal Products (Consumer Staples) | | | 2.2 | |
| Insurance (Financials) | | | 5.3 | |
| Materials (Materials) | | | 6.7 | |
| Pharmaceuticals, Biotechnology & Life Sciences (Health Care) | | | 7.7 | |
| Real Estate (Financials) | | | 4.2 | |
| Retailing (Consumer Discretionary) | | | 1.5 | |
| Semiconductors & Semiconductor Equipment (Information Technology) | | | 6.0 | |
| Software & Services (Information Technology) | | | 1.0 | |
| Technology Hardware & Equipment (Information Technology) | | | 1.0 | |
| Telecommunication Services (Services) | | | 3.6 | |
| Transportation (Industrials) | | | 4.0 | |
| Utilities (Utilities) | | | 4.7 | |
| Short-Term Investments | | | 3.5 | |
| Other Assets and Liabilities | | | 0.5 | |
| Total | | | 100.0 | % |
Diversification by Country
as of December 31, 2011
| | | Percentage of | |
| Country | | Net Assets | |
| Australia | | | 0.2 | % |
| Belgium | | | 1.2 | |
| Brazil | | | 5.4 | |
| Canada | | | 3.0 | |
| Chile | | | 0.6 | |
| China | | | 1.5 | |
| Denmark | | | 0.3 | |
| Finland | | | 0.9 | |
| France | | | 13.2 | |
| Germany | | | 6.4 | |
| Hong Kong | | | 3.6 | |
| India | | | 0.6 | |
| Ireland | | | 2.1 | |
| Israel | | | 1.2 | |
| Italy | | | 1.5 | |
| Japan | | | 9.7 | |
| Jersey | | | 0.4 | |
| Malaysia | | | 0.4 | |
| Netherlands | | | 2.5 | |
| Norway | | | 0.8 | |
| Russia | | | 1.1 | |
| South Korea | | | 1.8 | |
| Sweden | | | 2.0 | |
| Switzerland | | | 10.3 | |
| Taiwan | | | 3.0 | |
| United Kingdom | | | 21.3 | |
| United States | | | 1.0 | |
| Short-Term Investments | | | 3.5 | |
| Other Assets and Liabilities | | | 0.5 | |
| Total | | | 100.0 | % |
|
Hartford International Opportunities HLS Fund
Schedule of Investments
December 31, 2011
(000’s Omitted)
| Shares or Principal Amount | | Market Value ╪ | |
| COMMON STOCKS - 96.0% | | | | |
| | | | | Australia - 0.2% | | | | |
| | 1,063 | | | Aquarius Platinum Ltd. | | $ | 2,584 | |
| | | | | | | | | |
| | | | | Belgium - 1.2% | | | | |
| | 432 | | | Umicore | | | 17,762 | |
| | | | | | | | | |
| | | | | Brazil - 5.4% | | | | |
| | 193 | | | Banco do Estado do Rio Grande do Sul S.A. | | | 2,065 | |
| | 365 | | | Banco Santander Brasil S.A. | | | 2,968 | |
| | 1,619 | | | CCR S.A. | | | 10,608 | |
| | 244 | | | Cetip S.A. - Balcao Organizado | | | 3,526 | |
| | 1,211 | | | Itau Unibanco Banco Multiplo S.A. ADR | | | 22,480 | |
| | 1,379 | | | JSL S.A. | | | 6,906 | |
| | 297 | | | Localiza Rent a Car S.A. | | | 4,074 | |
| | 3,947 | | | PDG Realty S.A. | | | 12,485 | |
| | 574 | | | Petroleo Brasileiro S.A. ADR | | | 14,261 | |
| | 305 | | | Raia Drogasil S.A. | | | 2,123 | |
| | | | | | | | 81,496 | |
| | | | | Canada - 3.0% | | | | |
| | 296 | | | Canadian Natural Resources Ltd. | | | 11,101 | |
| | 488 | | | Kinross Gold Corp. | | | 5,567 | |
| | 253 | | | Potash Corp. of Saskatchewan, Inc. | | | 10,456 | |
| | 1,414 | | | Talisman Energy, Inc. | | | 18,011 | |
| | | | | | | | 45,135 | |
| | | | | Chile - 0.6% | | | | |
| | 520 | | | Enersis S.A. ADR | | | 9,175 | |
| | | | | | | | | |
| | | | | China - 1.5% | | | | |
| | 5,324 | | | China Pacific Insurance | | | 15,106 | |
| | 1,207 | | | CITIC Securities Co., Ltd. ● | | | 1,985 | |
| | 2,664 | | | Dongfeng Motor Group Co., Ltd. | | | 4,549 | |
| | 1,296 | | | Shandong Weigao Group Medical Polymer Co., Ltd. | | | 1,164 | |
| | | | | | | | 22,804 | |
| | | | | Denmark - 0.3% | | | | |
| | 280 | | | DSV A/S | | | 5,011 | |
| | | | | | | | | |
| | | | | Finland - 0.9% | | | | |
| | 100 | | | Kone Oyj Class B | | | 5,190 | |
| | 253 | | | Nokian Rendaat Oyj | | | 8,116 | |
| | | | | | | | 13,306 | |
| | | | | France - 13.2% | | | | |
| | 312 | | | Accor S.A. | | | 7,865 | |
| | 346 | | | Cie Generale d'Optique Essilor International S.A. | | | 24,368 | |
| | 571 | | | Groupe Danone | | | 35,834 | |
| | 220 | | | Michelin (C.G.D.E.) Class B | | | 12,973 | |
| | 332 | | | Pernod-Ricard | | | 30,696 | |
| | 597 | | | Safran S.A. | | | 17,853 | |
| | 513 | | | Schneider Electric S.A. | | | 26,808 | |
| | 181 | | | Technip S.A. | | | 16,999 | |
| | 157 | | | Unibail-Rodamco SE | | | 28,028 | |
| | | | | | | | 201,424 | |
| | | | | Germany - 6.4% | | | | |
| | 144 | | | Allianz SE | | | 13,754 | |
| | 357 | | | Beiersdorf AG | | | 20,222 | |
| | 382 | | | Continental AG | | | 23,748 | |
| | 3,238 | | | Infineon Technologies AG | | | 24,316 | |
| | 291 | | | SAP AG | | | 15,390 | |
| | | | | | | | 97,430 | |
| | | | | Hong Kong - 3.6% | | | | |
| | 9,425 | | | AIA Group Ltd. | | | 29,338 | |
| | 1,994 | | | ENN Energy Holdings Ltd. | | | 6,384 | |
| | 1,368 | | | Hengan International Group Co., Ltd. | | | 12,754 | |
| | 3,474 | | | Shangri-La Asia Ltd. | | | 5,984 | |
| | | | | | | | 54,460 | |
| | | | | India - 0.6% | | | | |
| | 1,375 | | | Bharti Televentures | | | 8,884 | |
| | | | | | | | | |
| | | | | Ireland - 2.1% | | | | |
| | 909 | | | CRH plc | | | 18,033 | |
| | 1,064 | | | Elan Corp. plc ADR ● | | | 14,615 | |
| | | | | | | | 32,648 | |
| | | | | Israel - 1.2% | | | | |
| | 459 | | | Teva Pharmaceutical Industries Ltd. ADR | | | 18,545 | |
| | | | | | | | | |
| | | | | Italy - 1.5% | | | | |
| | 1,861 | | | Intesa Sanpaolo | | | 3,099 | |
| | 4,318 | | | Snam S.p.A. | | | 19,019 | |
| | | | | | | | 22,118 | |
| | | | | Japan - 9.7% | | | | |
| | 216 | | | Acom Co., Ltd. | | | 3,847 | |
| | 376 | | | Daiichi Sankyo Co., Ltd. | | | 7,445 | |
| | 204 | | | Daito Trust Construction Co., Ltd. | | | 17,502 | |
| | 179 | | | East Japan Railway Co. | | | 11,428 | |
| | 341 | | | Eisai Co., Ltd. | | | 14,121 | |
| | 68 | | | Fanuc Corp. | | | 10,296 | |
| | 125 | | | Fast Retailing Co., Ltd. | | | 22,720 | |
| | 2 | | | Inpex Corp. | | | 9,986 | |
| | 926 | | | JS Group Corp. | | | 17,740 | |
| | 3,209 | | | Mitsubishi UFJ Financial Group, Inc. | | | 13,586 | |
| | 1,272 | | | Mitsui Fudosan Co., Ltd. | | | 18,548 | |
| | | | | | | | 147,219 | |
| | | | | Jersey - 0.4% | | | | |
| | 1,045 | | | Glencore International plc | | | 6,381 | |
| | | | | | | | | |
| | | | | Malaysia - 0.4% | | | | |
| | 4,658 | | | AirAsia Berhad | | | 5,534 | |
| | | | | | | | | |
| | | | | Netherlands - 2.5% | | | | |
| | 209 | | | ASML Holding N.V. ADR | | | 8,747 | |
| | 2,817 | | | ING Groep N.V. ● | | | 20,143 | |
| | 242 | | | Unilever N.V. CVA | | | 8,333 | |
| | | | | | | | 37,223 | |
| | | | | Norway - 0.8% | | | | |
| | 760 | | | Telenor ASA | | | 12,433 | |
| | | | | | | | | |
| | | | | Russia - 1.1% | | | | |
| | 1,346 | | | Sberbank ● | | | 13,381 | |
| | 142 | | | X5 Retail Group N.V. ●§ | | | 3,235 | |
| | | | | | | | 16,616 | |
| | | | | South Korea - 1.8% | | | | |
| | 30 | | | Samsung Electronics Co., Ltd. | | | 27,404 | |
| | | | | | | | | |
| | | | | Sweden - 2.0% | | | | |
| | 718 | | | Assa Abloy Ab | | | 17,947 | |
| | 567 | | | Skf Ab B Shares | | | 11,955 | |
| | | | | | | | 29,902 | |
The accompanying notes are an integral part of these financial statements.
Hartford International Opportunities HLS Fund
Schedule of Investments – (continued)
December 31, 2011
(000’s Omitted)
| Shares or Principal Amount | | Market Value ╪ | |
| COMMON STOCKS - 96.0% - (continued) | | | | |
| | | | | Switzerland - 10.3% | | | | |
| | 301 | | | Adecco S.A. | | $ | 12,530 | |
| | 121 | | | CIE Financiere Richemont S.A. | | | 6,063 | |
| | 26 | | | Givaudan | | | 24,660 | |
| | 157 | | | Kuehne & Nagel International AG | | | 17,602 | |
| | 233 | | | Roche Holding AG | | | 39,373 | |
| | 9 | | | SGS S.A. | | | 14,846 | |
| | 434 | | | Swiss Re Ltd. | | | 22,052 | |
| | 1,697 | | | UBS AG | | | 20,131 | |
| | | | | | | | 157,257 | |
| | | | | Taiwan - 3.0% | | | | |
| | 4,292 | | | Synnex Technology International Corp. | | | 10,351 | |
| | 12,245 | | | Taiwan Semiconductor Manufacturing Co., Ltd. | | | 30,595 | |
| | 4,690 | | | WPG Holdings Co., Ltd. | | | 5,400 | |
| | | | | | | | 46,346 | |
| | | | | United Kingdom - 21.3% | | | | |
| | 505 | | | AstraZeneca plc | | | 23,314 | |
| | 3,467 | | | Barclays Bank plc ADR | | | 9,495 | |
| | 1,656 | | | BG Group plc | | | 35,378 | |
| | 4,500 | | | BP plc | | | 32,054 | |
| | 423 | | | British American Tobacco plc | | | 20,086 | |
| | 463 | | | ENSCO International plc | | | 21,733 | |
| | 663 | | | Imperial Tobacco Group plc | | | 25,088 | |
| | 276 | | | Intercontinental Hotels Group | | | 4,965 | |
| | 3,807 | | | National Grid plc | | | 36,795 | |
| | 349 | | | Rio Tinto plc | | | 17,070 | |
| | 2,891 | | | Rolls-Royce Holdings plc | | | 33,469 | |
| | 540 | | | Standard Chartered plc | | | 11,820 | |
| | 3,192 | | | Tesco plc | | | 19,973 | |
| | 11,914 | | | Vodafone Group plc | | | 33,217 | |
| | | | | | | | 324,457 | |
| | | | | United States - 1.0% | | | | |
| | 419 | | | Carnival Corp. | | | 13,683 | |
| | 45 | | | Michael Kors Holdings Ltd. ● | | | 1,237 | |
| | | | | | | | 14,920 | |
| | | | | Total common stocks | | | | |
| | | | | (cost $1,530,269) | | $ | 1,458,474 | |
| | | | | | | | | |
| | | | | Total long-term investments
(cost $1,530,269) | | $ | 1,458,474 | |
| | | | | | | | | |
| SHORT-TERM INVESTMENTS - 3.5% | | | | |
| | | | | Repurchase Agreements - 3.5% | | | | |
| | | | | Bank of America Merrill Lynch TriParty Joint
Repurchase Agreement (maturing on
01/03/2012 in the amount of $20,524,
collateralized by GNMA 4.50%, 2041,
value of $20,934) | | | | |
| $ | 20,524 | | | 0.04%, 12/30/2011 | | $ | 20,524 | |
| | | | | Barclays Capital TriParty Joint Repurchase
Agreement (maturing on 01/03/2012 in the
amount of $1,705, collateralized by U.S.
Treasury Bond 5.38%, 2031, value of
$1,739) | | | | |
| | 1,705 | | | 0.01%, 12/30/2011 | | | 1,705 | |
| | | | | Deutsche Bank Securities TriParty Joint
Repurchase Agreement (maturing on
01/03/2012 in the amount of $22,766,
collateralized by GNMA 3.50% - 7.00%,
2035 - 2046, value of $23,221) | | | | |
| 22,765 | | | 0.06%, 12/30/2011 | | | 22,765 | |
| | | | | UBS Securities, Inc. Joint Repurchase
Agreement (maturing on 01/03/2012 in the
amount of $173, collateralized by U.S.
Treasury Note 2.75%, 2016, value of $177) | | | | |
| | 173 | | | 0.01%, 12/30/2011 | | | 173 | |
| | | | | UBS Securities, Inc. TriParty Joint
Repurchase Agreement (maturing on
01/03/2012 in the amount of $8,809,
collateralized by FNMA 3.00% - 6.50%,
2021 - 2041, value of $8,986) | | | | |
| | 8,809 | | | 0.04%, 12/30/2011 | | | 8,809 | |
| | | | | | | | 53,976 | |
| | Total short-term investments | | | | | | | | |
| | (cost $53,976) | | | | | | $ | 53,976 | |
| | | | | | | | | | |
| | Total investments | | | | | | | | |
| | (cost $1,584,245) ▲ | | | 99.5 | % | | $ | 1,512,450 | |
| | Other assets and liabilities | | | 0.5 | % | | | 8,174 | |
| | Total net assets | | | 100.0 | % | | $ | 1,520,624 | |
The accompanying notes are an integral part of these financial statements.
| Note: | Percentage of investments as shown is the ratio of the total market value to total net assets. Market value of long-term investments in foreign securities represents 95.0% of total net assets at December 31, 2011.
Prices of foreign equities that are principally traded on certain foreign markets may be adjusted daily pursuant to a fair value pricing service approved by the Board of Directors in order to reflect an adjustment for factors occurring after the close of certain foreign markets but before the close of the New York Stock Exchange. |
| ▲ | At December 31, 2011, the cost of securities for federal income tax purposes was $1,602,704 and the aggregate gross unrealized appreciation and depreciation based on that cost were: |
| Unrealized Appreciation | $ | 49,993 | |
| | Unrealized Depreciation | | (140,247 | ) |
| | Net Unrealized Depreciation | $ | (90,254 | ) |
| ● | Non-income producing.
|
| § | These securities were sold to the Fund under Regulation S, rules governing offers and sales made outside the United States without registration under the Securities Act of 1933. The Fund may only be able to resell these securities in the United States if an exemption from registration under the federal and state securities laws is available, or the Fund may only be able to sell these securities outside of the United States (such as on a foreign exchange) to a non-U.S. person. Unless otherwise indicated, these holdings are determined to be liquid. At December 31, 2011, the aggregate value of these securities was $3,235, which represents 0.2% of total net assets. |
Foreign Currency Contracts Outstanding at December 31, 2011
| Description | | Counterparty | | Buy / Sell | | Market Value ╪ | | | Contract Amount | | | Delivery Date | | | Unrealized Appreciation/ (Depreciation) | |
| British Pound | | JP Morgan Securities | | Sell | | $ | 2,240 | | | $ | 2,233 | | | | 01/03/2012 | | | $ | (7 | ) |
| Euro | | JP Morgan Securities | | Sell | | | 797 | | | | 796 | | | | 01/03/2012 | | | | (1 | ) |
| | | | | | | | | | | | | | | | | | $ | (8 | ) |
| ╪ | See Significant Accounting Policies of accompanying Notes to Financial Statements regarding valuation of securities. |
Currency Concentration of Securities at December 31, 2011
| | | Percentage of | |
| Description | | Net Assets | |
| Brazilian Real | | | 2.8 | % |
| British Pound | | | 21.7 | |
| Canadian Dollar | | | 2.3 | |
| Danish Krone | | | 0.3 | |
| Euro | | | 25.1 | |
| Hong Kong Dollar | | | 5.1 | |
| Indian Rupee | | | 0.6 | |
| Japanese Yen | | | 9.7 | |
| Malaysian Ringgit | | | 0.4 | |
| Norwegian Krone | | | 0.8 | |
| Republic of Korea Won | | | 1.8 | |
| Swedish Krona | | | 2.0 | |
| Swiss Franc | | | 10.3 | |
| Taiwanese Dollar | | | 3.0 | |
| United States Dollar | | | 13.6 | |
| Other Assets and Liabilities | | | 0.5 | |
| Total | | | 100.0 | % |
The accompanying notes are an integral part of these financial statements.
Hartford International Opportunities HLS Fund
Investment Valuation Hierarchy Level Summary
December 31, 2011
(000’s Omitted)
| | | Total | | | Level 1 ♦ | | | Level 2 ♦ | | | Level 3 | |
| Assets: | | | | | | | | | | | | | | | | |
| Common Stocks | | | | | | | | | | | | | | | | |
| Australia | | $ | 2,584 | | | $ | – | | | $ | 2,584 | | | $ | – | |
| Belgium | | | 17,762 | | | | – | | | | 17,762 | | | | – | |
| Brazil | | | 81,496 | | | | 81,496 | | | | – | | | | – | |
| Canada | | | 45,135 | | | | 45,135 | | | | – | | | | – | |
| Chile | | | 9,175 | | | | 9,175 | | | | – | | | | – | |
| China | | | 22,804 | | | | 1,985 | | | | 20,819 | | | | – | |
| Denmark | | | 5,011 | | | | – | | | | 5,011 | | | | – | |
| Finland | | | 13,306 | | | | – | | | | 13,306 | | | | – | |
| France | | | 201,424 | | | | – | | | | 201,424 | | | | – | |
| Germany | | | 97,430 | | | | – | | | | 97,430 | | | | – | |
| Hong Kong | | | 54,460 | | | | – | | | | 54,460 | | | | – | |
| India | | | 8,884 | | | | – | | | | 8,884 | | | | – | |
| Ireland | | | 32,648 | | | | 14,615 | | | | 18,033 | | | | – | |
| Israel | | | 18,545 | | | | 18,545 | | | | – | | | | – | |
| Italy | | | 22,118 | | | | – | | | | 22,118 | | | | – | |
| Japan | | | 147,219 | | | | – | | | | 147,219 | | | | – | |
| Jersey | | | 6,381 | | | | – | | | | 6,381 | | | | – | |
| Malaysia | | | 5,534 | | | | – | | | | 5,534 | | | | – | |
| Netherlands | | | 37,223 | | | | 8,747 | | | | 28,476 | | | | – | |
| Norway | | | 12,433 | | | | – | | | | 12,433 | | | | – | |
| Russia | | | 16,616 | | | | 16,616 | | | | – | | | | – | |
| South Korea | | | 27,404 | | | | – | | | | 27,404 | | | | – | |
| Sweden | | | 29,902 | | | | – | | | | 29,902 | | | | – | |
| Switzerland | | | 157,257 | | | | – | | | | 157,257 | | | | – | |
| Taiwan | | | 46,346 | | | | – | | | | 46,346 | | | | – | |
| United Kingdom | | | 324,457 | | | | 21,733 | | | | 302,724 | | | | – | |
| United States | | | 14,920 | | | | 14,920 | | | | – | | | | – | |
| Total | | | 1,458,474 | | | | 232,967 | | | | 1,225,507 | | | | – | |
| Short-Term Investments | | | 53,976 | | | | – | | | | 53,976 | | | | – | |
| Total | | $ | 1,512,450 | | | $ | 232,967 | | | $ | 1,279,483 | | | $ | – | |
| Liabilities: | | | | | | | | | | | | | | | | |
| Foreign Currency Contracts* | | | 8 | | | | – | | | | 8 | | | | – | |
| Total | | $ | 8 | | | $ | – | | | $ | 8 | | | $ | – | |
| ♦ | For the year ended December 31, 2011, there were no significant transfers between Level 1 and Level 2. |
| * | Derivative instruments not reflected in the Schedule of Investments are valued at the unrealized appreciation/depreciation on the investments. |
The accompanying notes are an integral part of these financial statements.
Hartford International Opportunities HLS Fund
Statement of Assets and Liabilities
December 31, 2011
(000’s Omitted)
| Assets: | | | | |
| Investments in securities, at market value (cost $1,584,245) | | $ | 1,512,450 | |
| Cash | | | 1 | |
| Receivables: | | | | |
| Investment securities sold | | | 5,113 | |
| Fund shares sold | | | 847 | |
| Dividends and interest | | | 3,811 | |
| Total assets | | | 1,522,222 | |
| Liabilities: | | | | |
| Unrealized depreciation on foreign currency contracts | | | 8 | |
| Bank overdraft - foreign cash | | | 2 | |
| Payables: | | | | |
| Fund shares redeemed | | | 1,204 | |
| Investment management fees | | | 227 | |
| Distribution fees | | | 13 | |
| Accrued expenses | | | 144 | |
| Total liabilities | | | 1,598 | |
| Net assets | | $ | 1,520,624 | |
| Summary of Net Assets: | | | | |
| Capital stock and paid-in-capital | | $ | 2,304,613 | |
| Undistributed net investment income | | | 28,134 | |
| Accumulated net realized loss | | | (740,270 | ) |
| Unrealized depreciation of investments and the translations of assets and liabilities denominated in foreign currency | | | (71,853 | ) |
| Net assets | | $ | 1,520,624 | |
| Shares authorized | | | 2,625,000 | |
| Par value | | $ | 0.001 | |
| Class IA: Net asset value per share | | $ | 10.72 | |
| Shares outstanding | | | 120,194 | |
| Net assets | | $ | 1,287,917 | |
| Class IB: Net asset value per share | | $ | 10.82 | |
| Shares outstanding | | | 21,508 | |
| Net assets | | $ | 232,707 | |
The accompanying notes are an integral part of these financial statements.
Hartford International Opportunities HLS Fund
Statement of Operations
For the Year Ended December 31, 2011
(000’s Omitted)
| Investment Income: | | | | |
| Dividends | | $ | 48,719 | |
| Interest | | | 37 | |
| Less: Foreign tax withheld | | | (5,096 | ) |
| Total investment income, net | | | 43,660 | |
| | | | | |
| Expenses: | | | | |
| Investment management fees | | | 12,340 | |
| Transfer agent fees | | | 5 | |
| Distribution fees - Class IB | | | 712 | |
| Custodian fees | | | 170 | |
| Accounting services fees | | | 293 | |
| Board of Directors' fees | | | 45 | |
| Audit fees | | | 24 | |
| Other expenses | | | 443 | |
| Total expenses (before fees paid indirectly) | | | 14,032 | |
| Commission recapture | | | (54 | ) |
| Total fees paid indirectly | | | (54 | ) |
| Total expenses, net | | | 13,978 | |
| Net investment income | | | 29,682 | |
| | | | | |
| Net Realized Gain on Investments and Foreign Currency Transactions: | | | 5344000 | |
| Net realized gain on investments | | | 5,838 | |
| Net realized loss on foreign currency contracts | | | (611 | ) |
| Net realized gain on other foreign currency transactions | | | 117 | |
| Net Realized Gain on Investments and Foreign Currency Transactions | | | 5,344 | |
| | | | | |
| Net Changes in Unrealized Depreciation of Investments and Foreign Currency Transactions: | | | (293,187 | ) |
| Net unrealized depreciation of investments | | | (292,406 | ) |
| Net unrealized depreciation of foreign currency contracts | | | (634 | ) |
| Net unrealized depreciation on translation of other assets and liabilities in foreign currencies | | | (147 | ) |
| Net Changes in Unrealized Depreciation of Investments and Foreign Currency Transactions | | | (293,187 | ) |
| Net Loss on Investments and Foreign Currency Transactions | | | (287,843 | ) |
| Net Decrease in Net Assets Resulting from Operations | | $ | (258,161 | ) |
The accompanying notes are an integral part of these financial statements.
Hartford International Opportunities HLS Fund
Statement of Changes in Net Assets
(000’s Omitted)
| | | For the
Year Ended
December 31, 2011 | | | For the
Year Ended
December 31, 2010 | |
| Operations: | | | | | | | | |
| Net investment income | | $ | 29,682 | | | $ | 20,497 | |
| Net realized gain on investments and foreign currency transactions | | | 5,344 | | | | 270,674 | |
| Net unrealized depreciation of investments and foreign currency transactions | | | (293,187 | ) | | | (56,880 | ) |
| Net Increase (Decrease) In Net Assets Resulting From Operations | | | (258,161 | ) | | | 234,291 | |
| Distributions to Shareholders: | | | | | | | | |
| From net investment income | | | | | | | | |
| Class IA | | | (686 | ) | | | (19,308 | ) |
| Class IB | | | (122 | ) | | | (2,992 | ) |
| Total distributions | | | (808 | ) | | | (22,300 | ) |
| Capital Share Transactions: | | | | | | | | |
| Class IA | | | | | | | | |
| Sold | | | 151,842 | | | | 114,911 | |
| Issued in merger | | | — | | | | 453,865 | |
| Issued on reinvestment of distributions | | | 686 | | | | 19,308 | |
| Redeemed | | | (351,186 | ) | | | (309,369 | ) |
| Total capital share transactions | | | (198,658 | ) | | | 278,715 | |
| Class IB | | | | | | | | |
| Sold | | | 34,174 | | | | 33,853 | |
| Issued in merger | | | — | | | | 142,673 | |
| Issued on reinvestment of distributions | | | 122 | | | | 2,992 | |
| Redeemed | | | (90,473 | ) | | | (100,545 | ) |
| Total capital share transactions | | | (56,177 | ) | | | 78,973 | |
| Net increase (decrease) from capital share transactions | | | (254,835 | ) | | | 357,688 | |
| Proceeds from regulatory settlements | | | — | | | | 688 | |
| Net Increase (Decrease) In Net Assets | | | (513,804 | ) | | | 570,367 | |
| Net Assets: | | | | | | | | |
| Beginning of period | | | 2,034,428 | | | | 1,464,061 | |
| End of period | | $ | 1,520,624 | | | $ | 2,034,428 | |
| Undistributed (distribution in excess of) | | | | | | | | |
| net investment income | | $ | 28,134 | | | $ | 430 | |
| Shares: | | | | | | | | |
| Class IA | | | | | | | | |
| Sold | | | 12,594 | | | | 10,237 | |
| Issued in merger | | | — | | | | 39,574 | |
| Issued on reinvestment of distributions | | | 62 | | | | 1,611 | |
| Redeemed | | | (29,342 | ) | | | (27,787 | ) |
| Total share activity | | | (16,686 | ) | | | 23,635 | |
| Class IB | | | | | | | | |
| Sold | | | 2,865 | | | | 2,977 | |
| Issued in merger | | | — | | | | 12,297 | |
| Issued on reinvestment of distributions | | | 11 | | | | 248 | |
| Redeemed | | | (7,424 | ) | | | (8,918 | ) |
| Total share activity | | | (4,548 | ) | | | 6,604 | |
The accompanying notes are an integral part of these financial statements.
Hartford International Opportunities HLS Fund
Notes to Financial Statements
December 31, 2011
(000’s Omitted)
Hartford International Opportunities HLS Fund (the “Fund”) serves as an underlying investment option for certain variable annuity and variable life insurance separate accounts of Hartford Life Insurance Company (“HLIC”) and its affiliates and certain qualified retirement plans. The Fund may also serve as an underlying investment option for certain variable annuity and variable life separate accounts of other insurance companies. Owners of variable annuity contracts and policyholders of variable life insurance contracts may choose the funds permitted in the variable insurance contract prospectus. In addition, participants in certain qualified retirement plans may choose the Fund if permitted by their plans.
Hartford Series Fund, Inc. (the “Company”) is an open-end registered management investment company comprised of thirty portfolios. Financial Statements for the Fund, a series of the Company, are included in this report.
The Company is organized under the laws of the State of Maryland and is registered with the Securities and Exchange Commission (“SEC”) under the Investment Company Act of 1940, as amended (“1940 Act”). The Fund is a diversified open-end management investment company.
The Fund is divided into Class IA and Class IB shares. Each class is offered at the per share net asset value (“NAV”) without a sales charge and is subject to the same expenses, except that the Class IB shares are subject to distribution and service fees charged pursuant to a Distribution Plan adopted in accordance with Rule 12b-1 under the 1940 Act.
| 2. | Significant Accounting Policies: |
The following is a summary of significant accounting policies of the Fund in the preparation of its financial statements, which are in accordance with the United States Generally Accepted Accounting Principles (“U.S. GAAP”). The preparation of financial statements in accordance with U.S. GAAP may require management to make estimates and assumptions that affect the reported amounts of assets and liabilities and disclosure of contingent assets and liabilities at the date of the financial statements and the reported amounts of increases and decreases in net assets from operations during the reporting period. Actual results could differ from those estimates.
| a) | Determination of Net Asset Value – The NAV of each class of the Fund’s shares is determined as of the close of regular trading (normally 4:00 p.m. Eastern Time) (the “NYSE Close”) on each day that the New York Stock Exchange (the “Exchange”) is open (“Valuation Date”). Information that becomes known to the Fund after the NAV has been calculated on a particular day will not generally be used to retroactively adjust the NAV determined earlier that day. |
| b) | Investment Valuation and Fair Value Measurements – For purposes of calculating the NAV, portfolio securities and other assets held by the Fund's portfolio for which market quotes are readily available are valued at market value. Market value is generally determined on the basis of last reported sales prices or official close price. If no sales are reported, market value is based on quotes obtained from a quotation reporting system, established market makers, or independent pricing services. If market prices are not readily available or are deemed unreliable, the Fund will use the fair value of the security as determined in good faith under policies and procedures established by and under the supervision of the Company’s Board of Directors. Market quotes are considered not readily available where there is an absence of current or reliable market-based data (e.g., trade information or broker quotes), including where events occur after the close of the relevant market, but prior to the NYSE Close that materially affect the values of the Fund’s portfolio securities or assets. In addition, market quotes are considered not readily available when, due to extraordinary circumstances, the exchanges or markets on which the securities trade do not open for trading for the entire day and no other market prices are available. In addition, prices of foreign equities that are principally traded on certain foreign markets are adjusted daily pursuant to a fair value pricing service approved by the Board of Directors in order to reflect an adjustment for the factors occurring after the close of certain foreign markets but before the NYSE Close. Securities that are primarily traded on foreign markets may trade on days that are not business days of the Fund. The value of the foreign securities in which the Fund invests may change on days when a shareholder will not be able to purchase or redeem shares of the |
Fund. Fair value pricing is subjective in nature and the use of fair value pricing by the Fund may cause the NAV of its shares to differ significantly from the NAV that would have been calculated using market prices at the close of the exchange on which a portfolio security is primarily traded. There can be no assurance that the Fund could obtain the fair market value assigned to a security if the Fund were to sell the security at approximately the time at which the Fund determines its NAV.
Investments valued in currencies other than U.S. dollars are converted to U.S. dollars using exchange rates obtained from independent pricing services for calculation of the NAV. As a result, the NAV of the Fund’s shares may be affected by changes in the value of currencies in relation to the U.S. dollar. The value of securities traded in markets outside the United States or denominated in currencies other than the U.S. dollar may be affected significantly on a day that the NYSE is closed and the market value may change on days when an investor is not able to purchase, redeem or exchange shares of the Fund.
Foreign currency contracts represent agreements to exchange currencies on specific future dates at predetermined rates. Foreign currency contracts are valued using foreign currency exchange rates and forward rates as provided by an independent pricing service on the Valuation Date.
Financial instruments for which prices are not available from an independent pricing service may be valued using market quotations obtained from one or more dealers that make markets in the respective financial instrument in accordance with procedures established by the Company’s Board of Directors.
U.S. GAAP defines fair value as the price that the Fund would receive to sell an asset or pay to transfer a liability in an orderly transaction between market participants. The U.S. GAAP fair value measurement standards require disclosure of a fair value hierarchy for each major category of assets and liabilities. Various inputs are used in determining the fair value of the Fund’s investments. These inputs are summarized into three broad hierarchy levels. This hierarchy is based on whether the valuation inputs are observable or unobservable. These levels are:
| · | Level 1 – Quoted prices in active markets for identical securities. Level 1 may include exchange traded instruments, such as domestic equities, some foreign equities, options, futures, mutual funds, exchange traded funds, rights and warrants. |
| · | Level 2 – Observable inputs other than Level 1 prices, such as quoted prices for similar securities; quoted prices in markets that are not active; or other inputs that are observable or can be corroborated by observable market data. Level 2 may include debt securities that are traded less frequently than exchange traded instruments and which are valued using independent pricing services; foreign equities, that are principally traded on certain foreign markets and are adjusted daily pursuant to a fair value pricing service in order to reflect an adjustment for the factors occurring after the close of certain foreign markets but before the NYSE Close; and short-term securities, which are valued at amortized cost. |
| · | Level 3 – Significant unobservable inputs that are supported by limited or no market activity. Level 3 may include financial instruments whose values are determined using broker quotes or require significant management judgment or estimation. These unobservable valuation inputs may include estimates for current yields, maturity/duration, prepayment speed, and broker quotes for comparable securities along with other assumptions relating to credit quality, collateral value, complexity of the security structure, general market conditions and liquidity. This category may include securities where trading has been halted or there are certain restrictions on trading. While these securities are priced using unobservable inputs, the valuation of these securities reflects the best available data and management believes the prices are a reasonable representation of exit price. |
Hartford International Opportunities HLS Fund
Notes to Financial Statements – (continued)
December 31, 2011
(000’s Omitted)
Valuation levels are not necessarily indicative of the risk associated with investing in such securities. Individual securities within any of the above mentioned asset classes may be assigned a different hierarchical level than those presented above, as individual circumstances dictate.
During the year ended December 31, 2011, the Fund held no Level 3 securities; therefore, no reconciliation of Level 3 securities is presented.
For additional information, refer to the Investment Valuation Hierarchy Level Summary which follows the Schedule of Investments.
For purposes of reporting transfers between different hierarchy levels, both transfers in and out of each level, as applicable, are shown as if they occurred at the beginning of the period.
| c) | Security Transactions and Investment Income – Security transactions are recorded as of the trade date (the date the order to buy or sell is executed) for financial reporting purposes. Securities purchased or sold on a when-issued or delayed-delivery basis may be settled a month or more after the trade date. Realized gains and losses are determined on the basis of identified cost. |
Dividend income is accrued as of the ex-dividend date, except certain dividends from foreign securities where the ex-dividend date may have passed are recorded as soon as the Fund is informed of the dividend. Interest income, including amortization of premium and accretion of discounts, is accrued on a daily basis.
| d) | Foreign Currency Transactions – Assets and liabilities denominated in currencies other than U.S. dollars are translated into U.S. dollars at the exchange rates in effect on the valuation date. Purchases and sales of investment securities, income, and expenses are translated into U.S. dollars at the exchange rates on the dates of such transactions. |
The Fund does not isolate that portion of portfolio security valuation resulting from fluctuations in the foreign currency exchange rates from the fluctuations arising from changes in the market prices of securities held. Exchange rate fluctuations are included with the net realized and unrealized gain or loss on investments in the accompanying financial statements.
Net realized foreign exchange gains or losses arise from sales of foreign currencies and the difference between asset and liability amounts initially stated in foreign currencies and the U.S. dollar value of the amounts actually received or paid. Net unrealized foreign exchange gains or losses arise from changes in the value of other assets and liabilities at the end of the reporting period, resulting from changes in the exchange rates.
| e) | Joint Trading Account – The Fund may invest cash balances into a joint trading account that may be invested in one or more repurchase agreements. |
| f) | Fund Share Valuation and Dividend Distributions to Shareholders – Orders for the Fund’s shares are executed in accordance with the investment instructions of the contract holders and plan participants. The NAV of the Fund’s shares is determined as of the close of business on each business day of the Exchange. The NAV is determined separately for each class of shares of the Fund by dividing the Fund’s net assets attributable to that class by the number of shares of the class outstanding. Each class of shares offered by the Fund has equal rights as to assets and voting privileges (except that shareholders of a class have exclusive voting rights regarding any matter relating solely to that class of shares). Income and non-class specific expenses are allocated daily to each class on the basis of the relative net assets of the class. Realized and unrealized capital gains and losses are allocated daily based on the relative net assets of each class of shares of the Fund. |
Orders for the purchase of the Fund’s shares received prior to the close of the Exchange on any day the Exchange is open for business are priced at the NAV determined as of the close of the Exchange. Orders received after the close of the Exchange, or on a day on which the Exchange and/or the Fund is not open for business, are priced at the next determined NAV.
Dividends are declared pursuant to a policy adopted by the Company’s Board of Directors based upon the investment performance of the Fund. The policy of the Fund is to pay dividends from net investment income and realized capital gains, if any, at least once a year.
Distributions from net investment income, net realized capital gains and capital are determined in accordance with federal income tax regulations, which may differ from U.S. GAAP with respect to character and timing. These differences may include but are not limited to losses deferred due to wash sale adjustments, foreign currency gains and losses, adjustments related to Passive Foreign Investment Companies (“PFICs”), Real Estate Investment Trusts (“REITs”), Regulated Investment Companies (“RICs”), certain derivatives and partnerships. Permanent book and federal income tax basis differences relating to shareholder distributions will result in reclassifications to certain of the Fund’s capital accounts (see Federal Income Taxes: Reclassification of Capital Accounts note).
| 3. | Securities and Other Investments: |
| a) | Repurchase Agreements – A repurchase agreement is an agreement by which a counterparty agrees to sell a security and agrees to repurchase the security sold at a mutually agreed upon time and price. At the time the Fund enters into a repurchase agreement, the value of the underlying collateral security(ies), including accrued interest, will be equal to or exceed the value of the repurchase agreement. Repurchase agreements expose the Fund to counterparty risk. To minimize counterparty risk, the securities that serve to collateralize the repurchase agreement are held by the Fund's custodian in book entry or physical form in the custodial account of the Fund or in a third party custodial account. Repurchase agreements are valued at cost plus accrued interest. The Fund, as shown on the Schedule of Investments, had outstanding repurchase agreements as of December 31, 2011. |
| b) | Illiquid and Restricted Securities – The Fund is permitted to invest up to 15% of its net assets in illiquid securities. Illiquid securities are those that may not be sold or disposed of in the ordinary course of business within seven days, at approximately the price used to determine the Fund’s NAV. The Fund may not be able to sell illiquid securities or other investments when its sub-adviser considers it desirable to do so or may have to sell such securities or investments at a price that is lower than the price that could be obtained if the securities or investments were more liquid. A sale of illiquid securities or other investments may require more time and may result in higher dealer discounts and other selling expenses than does the sale of those that are liquid. Illiquid securities and investments also may be more difficult to value due to the unavailability of reliable market quotations for such securities or investments, and an investment in them may have an adverse impact on the Fund’s NAV. The Fund may also purchase certain restricted securities that can only be resold to certain qualified investors and may be determined to be liquid pursuant to policies and guidelines established by the Company’s Board of Directors. The Fund, as shown on the Schedule of Investments, had illiquid and/or restricted securities as of December 31, 2011. |
| c) | Securities Purchased on a When-Issued or Delayed-Delivery Basis – Delivery and payment for securities that have been purchased by the Fund on a forward commitment, or when-issued or delayed-delivery basis, take place beyond the customary settlement period. A fund may dispose of or renegotiate a delayed-delivery transaction after it is entered into, and may sell delayed-delivery securities before they are delivered, which may result in a realized gain or loss. During this period, such securities are subject to market fluctuations, and the Fund identifies securities segregated in its records with value at least equal to the amount of the commitment. As of December 31, 2011, the Fund had no outstanding when-issued or delayed delivery securities. |
Hartford International Opportunities HLS Fund
Notes to Financial Statements – (continued)
December 31, 2011
(000’s Omitted)
| 4. | Financial Derivative Instruments: |
The following disclosures contain information on how and why the Fund uses derivative instruments, the credit-risk-related contingent features in certain derivative instruments, and how derivative instruments affect the Fund’s financial position and results of operations. The location and fair value amounts of these instruments on the Statement of Assets and Liabilities and the realized gains and losses and changes in unrealized gains and losses on the Statement of Operations, each categorized by type of derivative contract, are included in the following Additional Derivative Instrument Information footnote. The derivative instruments outstanding as of period-end are disclosed in the notes to the Schedule of Investments and the amounts of realized gains and losses and changes in unrealized gains and losses on derivative instruments during the period are disclosed in the Statement of Operations.
| a) | Foreign Currency Contracts – The Fund may enter into foreign currency contracts that obligate the Fund to purchase or sell currencies at specified future dates. Foreign currency contracts are used to hedge the currency exposure associated with some or all of the Fund's securities and/or as part of an investment strategy. Foreign currency contracts are marked to market daily and the change in value is recorded by the Fund as an unrealized gain or loss. The Fund will record a realized gain or loss when the foreign currency contract is settled. |
Foreign currency contracts involve elements of market risk in excess of the amounts reflected in the Statement of Assets and Liabilities. In addition, risks may arise upon entering into these contracts from the potential inability of the counterparties to meet the terms of the contracts and from unanticipated movements in the value of the foreign currencies relative to the U.S. dollar. The Fund had outstanding foreign currency contracts as shown on the Schedule of Investments as of December 31, 2011.
| b) | Additional Derivative Instrument Information: |
| Fair Values of Derivative Instruments on the Statement of Assets and Liabilities as of December 31, 2011: | | | | | | | |
| | | | | | | | | | | | | | | | | | | | | | | | | | | | | |
| | Risk Exposure Category | |
| | | Interest
Rate
Contracts | | | Foreign
Exchange
Contracts | | | Credit
Contracts | | | Equity
Contracts | | | Commodity
Contracts | | | Other
Contracts | | | Total | |
| | | | | | | | | | | | | | | | | | | | | | | | | | | | | |
| Liabilities: | | | | | | | | | | | | | | | | | | | | | | | | | | | | |
Unrealized depreciation
on foreign currency
contracts | | $ | — | | | $ | 8 | | | $ | — | | | $ | — | | | $ | — | | | $ | — | | | $ | 8 | |
| Total | | $ | — | | | $ | 8 | | | $ | — | | | $ | — | | | $ | — | | | $ | — | | | $ | 8 | |
| | | | | | | | | | | | | | | | | | | | | | | | | | | | | |
| The volume of derivatives that is presented in the Schedule of Investments is consistent with the derivative activity during the year ended December 31, 2011 | |
| | | | | | | | | | | | | | | | | | | | | | | | | | | | | |
| The Effect of Derivative Instruments on the Statement of Operations for the year ended December 31, 2011: | | | | | |
| | | | | | | | | | | | | | | | | | | | | | | | | | | | | |
| | | Risk Exposure Category | |
| | | Interest
Rate
Contracts | | | Foreign
Exchange
Contracts | | | Credit
Contracts | | | Equity
Contracts | | | Commodity
Contracts | | | Other
Contracts | | | Total | |
| Realized Gain (Loss) on Derivatives Recognized as a Result of Operations: | | | | | | | | |
Net realized loss on
foreign currency
contracts | | $ | — | | | $ | (611 | ) | | $ | — | | | $ | — | | | $ | — | | | $ | — | | | $ | (611 | ) |
| Total | | $ | — | | | $ | (611 | ) | | $ | — | | | $ | — | | | $ | — | | | $ | — | | | $ | (611 | ) |
| | | | | | | | | | | | | | | | | | | | | | | | | | | | | |
| Net Change in Unrealized Appreciation (Depreciation) on Derivatives Recognized as a Result of Operations: | | | | | | | | |
Net change in unrealized
depreciation of foreign
currency contracts | | $ | — | | | $ | (634 | ) | | $ | — | | | $ | — | | | $ | — | | | $ | — | | | $ | (634 | ) |
| Total | | $ | — | | | $ | (634 | ) | | $ | — | | | $ | — | | | $ | — | | | $ | — | | | $ | (634 | ) |
| | | | | | | | | | | | | | | | | | | | | | | | | | | | | |
| a) | Counterparty Risk – The Fund may be exposed to counterparty risk, or the risk that an institution or other entity with which the Fund has unsettled or open transactions will default. |
| b) | Market Risks – If the Fund invests directly in foreign currencies or in securities that trade in, and receive revenues in, foreign currencies, or in derivatives that provide exposure to foreign currencies, it will be subject to the risk that those currencies will decline in value relative to the base currency of the Fund, or, in the case of hedging positions, that the Fund’s base currency will decline in value relative to the currency being hedged. Currency rates in foreign countries may fluctuate significantly over short periods of time for a number of reasons, including changes in interest rates, intervention (or the failure to intervene) by U.S. or foreign governments, central banks or supranational entities, such as the International Monetary Fund, or by the imposition of currency controls or other political developments in the United States or abroad. As a result, the Fund’s investments in foreign currency denominated securities may reduce the returns of the Fund. The market values of equity securities, such as common stocks and preferred stocks, or equity related investments, such as futures and options, may decline due to general market conditions which are not specifically related to a particular company, such as real or perceived adverse economic conditions, changes in the general outlook for corporate earnings, changes in interest or currency rates or adverse investor sentiment generally. The market value of equity securities may also decline due to factors which affect a particular industry or industries, such as labor shortages or increased production costs and competitive conditions within an industry. Equity securities and equity related investments generally have greater market price volatility than fixed income securities. |
| a) | Federal Income Taxes – For federal income tax purposes, the Fund intends to continue to qualify as a RIC under Subchapter M of the Internal Revenue Code (“IRC”) by distributing substantially all of its taxable net investment income and net realized capital gains to its shareholders and otherwise complying with the requirements of RICs. The Fund has distributed substantially all of its income and capital gains in prior years, if applicable, and intends to distribute substantially all of its income and capital gains prior to the next fiscal year-end. Accordingly, no provision for federal income or excise taxes has been made in the accompanying financial statements. Distributions from short-term capital gains are treated as ordinary income distributions for federal income tax purposes. |
| b) | Net Investment Income (Loss), Net Realized Gains (Losses) – Net investment income (loss) and net realized gains (losses) may differ for financial statement and tax purposes primarily because of losses deferred due to wash sale adjustments, foreign currency gains and losses, adjustments related to PFICs, REITs, RICs, certain derivatives and partnerships. The character of distributions made during the year from net investment income or net realized gains may differ from their ultimate characterization for federal income tax purposes. Also, due to the timing of dividend distributions, the fiscal year in which amounts are distributed may differ from the year that the income or realized gains (losses) were recorded by the Fund. |
| c) | Distributions and Components of Distributable Earnings – The tax character of distributions paid by the Fund for the periods indicated is as follows (as adjusted for dividends payable): |
| | | For the Year Ended
December 31, 2011 | | | For the Year Ended
December 31, 2010 | |
| Ordinary Income | | $ | 808 | | | $ | 22,300 | |
Hartford International Opportunities HLS Fund
Notes to Financial Statements – (continued)
December 31, 2011
(000’s Omitted)
As of December 31, 2011, the Fund’s components of distributable earnings (deficit) on a tax basis were as follows:
| | | Amount | |
| Undistributed Ordinary Income | | $ | 28,134 | |
| Accumulated Capital and Other Losses* | | | (721,811 | ) |
| Unrealized Depreciation† | | | (90,312 | ) |
| Total Accumulated Deficit | | $ | (783,989 | ) |
| | * | The Fund has capital loss carryforwards that are identified in the Capital Loss Carryforward note that follows. |
| | † | The difference between book-basis and tax-basis unrealized appreciation (depreciation) may be attributable to the losses deferred due to wash sale adjustments, foreign currency gains and losses, adjustments related to PFICs, REITs, RICs, certain derivatives and partnerships. |
| d) | Reclassification of Capital Accounts – The Fund may record reclassifications in its capital accounts. These reclassifications have no impact on the total net assets of the Fund. The reclassifications are a result of permanent differences between U.S. GAAP and tax accounting for such items as foreign currency, PFICs, expiration or utilization of capital loss carryforwards or net operating losses. Adjustments are made to reflect the impact these items have on current and future distributions to shareholders. Therefore, the source of the Fund’s distributions may be shown in the accompanying Statement of Changes in Net Assets as from undistributed net investment income, from accumulated net realized gains on investments or from capital depending on the type of book and tax differences that exist. For the year ended December 31, 2011, the Fund recorded reclassifications to increase (decrease) the accounts listed below: |
| | | Amount | |
| Undistributed Net Investment Income | | $ | (1,170 | ) |
| Accumulated Net Realized Gain (Loss) | | | 1,170 | |
| e) | Capital Loss Carryforward – On December 22, 2010, the Regulated Investment Company Modernization Act of 2010 (the “Act”) was enacted, which made changes to the capital loss carryforward rules. The changes are effective for taxable years beginning after the date of enactment. Under the Act, funds are permitted to carry forward capital losses for an unlimited period. However, any losses incurred during those future taxable years will be required to be utilized prior to the losses incurred in pre-enactment taxable years, which carry an expiration date. As a result of this ordering rule, pre-enactment capital loss carryforwards may be more likely to expire unused. Additionally, post-enactment capital loss carryforwards will retain their character as either short-term or long-term capital losses rather than being considered all short-term as permitted under prior regulation. |
At December 31, 2011 (tax-year-end), the Fund had capital loss carryforwards for U.S. federal income tax purposes of approximately:
| Year of Expiration | | Amount | |
| 2015 | | $ | 37,085 | |
| 2016 | | | 397,126 | |
| 2017 | | | 287,600 | |
| Total | | $ | 721,811 | |
As of December 31, 2011, the Fund utilized $9,925 of prior year capital loss carryforwards.
| f) | Accounting for Uncertainty in Income Taxes – The Fund has adopted financial reporting rules that require the Fund to analyze all open tax years, as defined by the statute of limitations, for all major jurisdictions. Generally, tax authorities can examine all tax returns filed for the last three years. The Fund does not have an examination in progress. |
The Fund has reviewed all open tax years and major jurisdictions and concluded that these financial reporting rules had no effect on the Fund’s financial position or results of operations. There is no tax liability resulting from unrecognized tax benefits relating to uncertain income tax positions taken or expected to be taken on the tax return for the fiscal year ended December 31, 2011. The Fund is also not aware of any tax positions for which it is reasonably possible that the total amounts of unrecognized tax benefits will significantly change in the next twelve months.
| a) | Investment Management Agreement – HL Investment Advisors, LLC (“HL Advisors”), an indirect wholly owned subsidiary of The Hartford Financial Services Group, Inc. (“The Hartford”), serves as investment manager to the Fund pursuant to an Investment Management Agreement with the Company. As investment manager, HL Advisors has overall investment supervisory responsibility for the Fund. In addition, HL Advisors provides administrative personnel, services, equipment, facilities and office space for proper operation of the Fund. HL Advisors has contracted with Wellington Management Company, LLP (“Wellington Management”) under a sub-advisory agreement for the provision of day-to-day investment management services to the Fund in accordance with the Fund’s investment objective and policies. The Fund pays a fee to HL Advisors, a portion of which may be used to compensate Wellington Management. |
The schedule below reflects the rates of compensation paid to HL Advisors for investment management services rendered as of December 31, 2011; the rates are accrued daily and paid monthly.
| Average Daily Net Assets | Annual Fee |
| On first $250 million | 0.7750% |
| On next $250 million | 0.7250% |
| On next $500 million | 0.6750% |
| On next $4 billion | 0.6250% |
| On next $5 billion | 0.6225% |
| Over $10 billion | 0.6200% |
Effective March 1, 2012, HL Advisors will be paid compensation for investment management services according to the following schedule:
| Average Daily Net Assets | Annual Fee |
| On first $250 million | 0.7750% |
| On next $250 million | 0.7250% |
| On next $500 million | 0.6750% |
| On next $1.5 billion | 0.6250% |
| On next $2.5 billion | 0.6200% |
| On next $5 billion | 0.6150% |
| Over $10 billion | 0.6100% |
Hartford International Opportunities HLS Fund
Notes to Financial Statements – (continued)
December 31, 2011
(000’s Omitted)
| b) | Accounting Services Agreement – Pursuant to the Fund Accounting Agreement between HLIC and the Company, on behalf of the Fund, HLIC provides accounting services to the Fund and receives monthly compensation based on the Fund’s average daily net assets at the rates set forth below. The Fund’s accounting services fees are accrued daily and paid monthly. |
| Average Daily Net Assets | Annual Fee |
| On first $5 billion | 0.016% |
| On next $5 billion | 0.014% |
| Over $10 billion | 0.012% |
| c) | Operating Expenses – Allocable expenses incurred by the Company are allocated to each Fund and allocated to classes within a Fund in proportion to the average daily net assets of the Fund and each class, except where allocation of certain expenses is more fairly made directly to the Fund or to specific classes within a Fund. |
| d) | Fees Paid Indirectly – The Company, on behalf of the Fund, has entered into agreements with State Street Global Markets, LLC and Russell Implementation Services, Inc. to partially recapture non-discounted trade commissions. Such rebates are used to pay a portion of the Fund’s expenses. In addition, the Fund’s custodian bank has also agreed to reduce its fees when the Fund maintains cash on deposit in a non-interest-bearing custody account. For the year ended December 31, 2011, these amounts, if any, are included in the Statement of Operations. |
The ratio of expenses to average net assets in the accompanying financial highlights excludes the reduction in expenses related to fees paid indirectly. The annualized expense ratio for the period listed below reflecting the reduction for fees paid indirectly is as follows:
| | | Year Ended December 31, 2011 | |
| Class IA | | | 0.72 | % |
| Class IB | | | 0.97 | |
| | | | | |
| e) | Distribution Plan for Class IB shares – The Company, on behalf of the Fund, has adopted a Distribution Plan pursuant to Rule 12b-1 of the 1940 Act to compensate the Distributor, Hartford Securities Distribution Company, Inc. (a wholly owned, ultimate subsidiary of The Hartford), from assets attributable to the Class IB shares for services rendered and expenses borne in connection with activities primarily intended to result in the sale of the Class IB shares, subject to the review and approval of the Company’s Board of Directors. |
The Distribution Plan provides that the Fund may pay annually up to 0.25% of the average daily net assets of the Fund attributable to its Class IB shares for activities primarily intended to result in the sale of Class IB shares. The Board has the authority to suspend or reduce these payments at any point in time. Under the terms of the Distribution Plan and the principal underwriting agreement, the Fund is authorized to make payments monthly to the Distributor that may be used to pay or compensate entities providing distribution and shareholder servicing with respect to the Class IB shares for such entities’ fees or expenses incurred or paid in that regard. These fees are accrued daily and paid monthly.
| f) | Other Related Party Transactions – Certain officers of the Fund are directors and/or officers of HL Advisors and/or The Hartford or its subsidiaries. For the year ended December 31, 2011, a portion of the Fund’s chief compliance officer’s salary was paid by all the investment companies in the Hartford fund complex. The portion allocated to the Fund was in the amount of $2. Hartford Administrative Services Company (“HASCO”), an indirect wholly owned subsidiary of The Hartford, provides transfer agent services to the Fund. HASCO was compensated on a per account basis for providing such services. The amount paid to HASCO can be found in the Statement of Operations. These fees are accrued daily and paid monthly. |
| g) | Payment from Affiliate – In July of 2007, The Hartford entered into a settlement with the Attorneys General of the states of New York, Connecticut and Illinois relating to market timing and the company's individual variable annuity contracts in which certain payments would be made directly to the variable annuity contract holders. The distribution plan provided that unclaimed money from the settlement would be distributed to certain HLS Funds that are investment options through a Hartford individual variable annuity contract. The unclaimed money was distributed to the Fund on September 18, 2009. |
The total return in the accompanying financial highlights includes a payment from an affiliate. Had the payment from the affiliate been excluded, the impact and total return for the period listed below would have been as follows:
| | | For the Year Ended December 31, 2009 | |
| | | | Class IA | | | | Class IB | |
| Impact from Payment from Affiliate for Attorneys General Settlement | | | 0.23 | % | | | 0.23 | % |
| Total Return Excluding Payment from Affiliate | | | 33.15 | | | | 32.83 | |
| 8. | Investment Transactions: |
For the year ended December 31, 2011, the Fund's aggregate purchases and sales of investment securities (excluding short-term investments) were as follows:
| | | Amount | |
| Cost of Purchases Excluding U.S. Government Obligations | | $ | 2,009,033 | |
| Sales Proceeds Excluding U.S. Government Obligations | | | 2,280,103 | |
The Fund is one of several Hartford funds that participate in a $500 million committed revolving line of credit facility. The facility is to be used for temporary or emergency purposes. Under the arrangement, the funds are required to own securities having a market value in excess of 300% of the total bank borrowings. The interest rate on borrowings varies depending on the nature of the loan. The facility also requires a fee to be paid based on the amount of the commitment. This commitment fee is allocated to all of the funds participating in the line of credit based on the average net assets of the funds. During the year ended December 31, 2011, the Fund did not have any borrowings under this facility.
Reorganization of Hartford International Growth HLS Fund and Hartford International Small Company HLS Fund into Hartford International Opportunities HLS Fund: At a meeting held on August 5, 2009, the Board of Directors of the Company approved the Forms of Agreement and Plans of Reorganization (“Reorganization Agreements”) that provided for the reorganization of each of two series of the Company, Hartford International Growth HLS Fund (“Target Fund #1”) and Hartford International Small Company HLS Fund (“Target Fund #2), into another series of the Company, Hartford International Opportunities HLS Fund (“Acquiring Fund”) (“Reorganizations”). The reorganizations did not require shareholder approval by the shareholders of the Target Funds or the Acquiring Fund.
Pursuant to the Reorganization Agreements, on April 16, 2010, (merger date), each holder of Class IA and Class IB shares of the Target Funds became the owner of full and fractional shares of the corresponding class in the Aquiring Fund having an equal aggregate value.
Hartford International Opportunities HLS Fund
Notes to Financial Statements – (continued)
December 31, 2011
(000’s Omitted)
The merger was accomplished by tax free exchange as detailed below:
| | | Net assets of Target Fund #1 on Merger Date | | Net assets of Target Fund #2 on Merger Date | | Acquiring Fund shares issued to the Target Funds' shareholders | | Net assets of Acquiring Fund immediately before merger | | Net assets of Acquiring Fund immediately after merger | | Target Fund #1 shares exchanged | | Target Fund #2 shares exchanged | |
| | | | | | | | | | | | | | | | | | | | | | | |
| Class IA | | $ | 289,334 | | $ | 164,531 | | | 39,574 | | $ | 1,276,569 | | $ | 1,730,434 | | | 37,523 | | $ | 14,231 | |
| Class IB | | | 97,957 | | | 44,716 | | | 12,297 | | | 216,979 | | | 359,652 | | | 12,771 | | | 3,902 | |
| Total | | $ | 387,291 | | $ | 209,247 | | | 51,871 | | $ | 1,493,548 | | $ | 2,090,086 | | | 50,294 | | $ | 18,133 | |
| 11. | Industry Classifications: |
Other than the industry classifications “Other Investment Pools and Funds” and “Exchange Traded Funds,” equity industry classifications used in this report are the Global Industry Classification Standard, which was developed by and is the exclusive property and service mark of MSCI, Inc. and Standard & Poor’s.
| 12. | Proceeds from Regulatory Settlement: |
During the year ended December 31, 2010, as a result of a settlement of an administrative proceeding brought by the SEC against an unaffiliated third party relating to market timing and/or late trading of mutual funds, the Fund received $688, which represented the Fund’s portion of the proceeds from the settlement (the Fund was not a party to the proceeding). The proceeds received by the Fund were recorded as an increase to additional paid-in-capital. The payment did not have a material impact on the Fund’s NAV.
Under the Company’s organizational documents, the Company shall indemnify its officers and directors to the full extent required or permitted under Maryland General Corporation Law and the federal securities laws. In addition, the Company, on behalf of the Fund, may enter into contracts that contain a variety of indemnifications. The Company’s maximum exposure under these arrangements is unknown. However, as of the date of these financial statements, the Company has not had prior claims or losses pursuant to these contracts and expects the risk of loss to be remote.
[This page is intentionally left blank]
Hartford International Opportunities HLS Fund
Financial Highlights
- Selected Per-Share Data (A) -
Class | | Net Asset Value at Beginning of Period | | | Net Investment Income (Loss) | | | Payments from (to) Affiliate | | | Net Realized and Unrealized Gain (Loss) on Investments | | | Total from Investment Operations | | | Dividends from Net Investment Income | | | Distributions from Realized Capital Gains | | | Distributions from Capital | | | Total Distributions | | | Net Increase (Decrease) in Net Asset Value | | | Net Asset Value at End of Period | |
| For the Year Ended December 31, 2011 |
| IA | | $ | 12.46 | | | $ | 0.21 | | | $ | – | | | $ | (1.94 | ) | | $ | (1.73 | ) | | $ | (0.01 | ) | | $ | – | | | $ | – | | | $ | (0.01 | ) | | $ | (1.74 | ) | | $ | 10.72 | |
| IB | | | 12.61 | | | | 0.19 | | | | – | | | | (1.97 | ) | | | (1.78 | ) | | | (0.01 | ) | | | – | | | | – | | | | (0.01 | ) | | | (1.79 | ) | | | 10.82 | |
| For the Year Ended December 31, 2010(E) |
| IA | | | 11.01 | | | | 0.13 | | | | – | | | | 1.46 | | | | 1.59 | | | | (0.14 | ) | | | – | | | | – | | | | (0.14 | ) | | | 1.45 | | | | 12.46 | |
| IB | | | 11.15 | | | | 0.11 | | | | – | | | | 1.46 | | | | 1.57 | | | | (0.11 | ) | | | – | | | | – | | | | (0.11 | ) | | | 1.46 | | | | 12.61 | |
| For the Year Ended December 31, 2009 |
| IA | | | 8.40 | | | | 0.16 | | | | 0.03 | | | | 2.61 | | | | 2.80 | | | | (0.19 | ) | | | – | | | | – | | | | (0.19 | ) | | | 2.61 | | | | 11.01 | |
| IB | | | 8.51 | | | | 0.14 | | | | 0.03 | | | | 2.64 | | | | 2.81 | | | | (0.17 | ) | | | – | | | | – | | | | (0.17 | ) | | | 2.64 | | | | 11.15 | |
| For the Year Ended December 31, 2008 |
| IA | | | 15.62 | | | | 0.28 | | | | – | | | | (6.68 | ) | | | (6.40 | ) | | | (0.28 | ) | | | (0.54 | ) | | | – | | | | (0.82 | ) | | | (7.22 | ) | | | 8.40 | |
| IB | | | 15.78 | | | | 0.27 | | | | – | | | | (6.76 | ) | | | (6.49 | ) | | | (0.24 | ) | | | (0.54 | ) | | | – | | | | (0.78 | ) | | | (7.27 | ) | | | 8.51 | |
| For the Year Ended December 31, 2007 |
| IA | | | 15.23 | | | | 0.18 | | | | – | | | | 3.77 | | | | 3.95 | | | | (0.19 | ) | | | (3.37 | ) | | | – | | | | (3.56 | ) | | | 0.39 | | | | 15.62 | |
| IB | | | 15.36 | | | | 0.16 | | | | – | | | | 3.78 | | | | 3.94 | | | | (0.15 | ) | | | (3.37 | ) | | | – | | | | (3.52 | ) | | | 0.42 | | | | 15.78 | |
| | | | | | | | | | | | | | | | | | | | | | | | | | | | | | | | | | | | | | | | | | | | | |
| (A) | Information presented relates to a share outstanding throughout the indicated period. |
| (B) | The figures do not include sales charges or other fees which may be applied at the variable life insurance, variable annuity or qualified retirement plan product level. Any such additional sales charges or other fees would lower the Fund's performance. |
| (C) | Ratios do not reflect reductions for fees paid indirectly. Please see Fees Paid Indirectly in the Notes to Financial Statements. |
| (D) | Portfolio turnover rate is calculated on the basis of the Fund as a whole without distinguishing between the classes of shares issued. |
| (E) | Per share amounts have been calculated using the average shares method. |
| (F) | During the year ended December 31, 2010, the Fund incurred $456.2 million in sales associated with the transition of assets from Hartford International Growth HLS Fund and Hartford International Small Company HLS Fund, which merged into the Fund on April 16, 2010. These sales were excluded from the portfolio turnover calculation. |
| (G) | Total return without the inclusion of the Payment from (to) Affiliate can be found in Expenses in the accompanying Notes to Financial Statements. |
- Ratios and Supplemental Data -
| Total Return(B) | | Net Assets at End of Period | | | Ratio of Expenses to Average Net Assets Before Waivers(C) | | | Ratio of Expenses to Average Net Assets After Waivers(C) | | | Ratio of Net Investment Income (Loss) to Average Net Assets | | | Portfolio Turnover Rate(D) | |
| |
| (13.97 | )% | $ | 1,287,917 | | | | 0.73 | % | | | 0.73 | % | | | 1.66 | % | | | 111 | % |
| (14.19 | ) | | 232,707 | | | | 0.98 | | | | 0.98 | | | | 1.41 | | | | – | |
| - |
| 14.49 | | | 1,705,757 | | | | 0.74 | | | | 0.74 | | | | 1.19 | | | | 128 | (F) |
| 14.20 | | | 328,671 | | | | 0.99 | | | | 0.99 | | | | 0.94 | | | | – | |
| - |
| 33.46 | (G) | | 1,247,179 | | | | 0.76 | | | | 0.76 | | | | 1.68 | | | | 152 | |
| 33.13 | (G) | | 216,882 | | | | 1.01 | | | | 1.01 | | | | 1.43 | | | | – | |
| - |
| (42.25 | ) | | 1,046,234 | | | | 0.71 | | | | 0.71 | | | | 2.21 | | | | 158 | |
| (42.39 | ) | | 189,221 | | | | 0.96 | | | | 0.96 | | | | 1.96 | | | | – | |
| - |
| 27.43 | | | 2,027,078 | | | | 0.71 | | | | 0.71 | | | | 1.13 | | | | 135 | |
| 27.11 | | | 417,144 | | | | 0.96 | | | | 0.96 | | | | 0.89 | | | | – | |
Report of Independent Registered Public Accounting Firm
The Board of Directors and Shareholders of
Hartford Series Fund, Inc.
We have audited the accompanying statement of assets and liabilities, including the schedule of investments, of Hartford International Opportunities HLS Fund (one of the portfolios constituting Hartford Series Fund, Inc. (the Funds)) as of December 31, 2011, and the related statement of operations for the year then ended, the statements of changes in net assets for each of the two years in the period then ended, and the financial highlights for each of the five years in the period then ended. These financial statements and financial highlights are the responsibility of the Funds’ management. Our responsibility is to express an opinion on these financial statements and financial highlights based on our audits.
We conducted our audits in accordance with the standards of the Public Company Accounting Oversight Board (United States). Those standards require that we plan and perform the audit to obtain reasonable assurance about whether the financial statements and financial highlights are free of material misstatement. We were not engaged to perform an audit of the Funds’ internal control over financial reporting. Our audits included consideration of internal control over financial reporting as a basis for designing audit procedures that are appropriate in the circumstances, but not for the purpose of expressing an opinion on the effectiveness of the Funds’ internal control over financial reporting. Accordingly, we express no such opinion. An audit also includes examining, on a test basis, evidence supporting the amounts and disclosures in the financial statements and financial highlights, assessing the accounting principles used and significant estimates made by management, and evaluating the overall financial statement presentation. Our procedures included confirmation of securities owned as of December 31, 2011, by correspondence with the custodian and brokers or by other appropriate auditing procedures where replies from brokers were not received. We believe that our audits provide a reasonable basis for our opinion.
In our opinion, the financial statements and financial highlights referred to above present fairly, in all material respects, the financial position of Hartford International Opportunities HLS Fund of Hartford Series Fund, Inc. at December 31, 2011, the results of its operations for the year then ended, the changes in its net assets for each of the two years in the period then ended, and the financial highlights for each of the five years in the period then ended, in conformity with U.S. generally accepted accounting principles.
Minneapolis, MN
February 13, 2012
Hartford International Opportunities HLS Fund
Directors and Officers (Unaudited)
The Board of Directors of the Company appoints officers who are responsible for the day-to-day operations of the Fund and who execute policies formulated by the Directors. Each director serves until his or her death, resignation, or retirement or until the next annual meeting of shareholders is held or until his or her successor is elected and qualifies.
Directors and officers who are employed by or who have a financial interest in The Hartford are considered “interested” persons of the Fund pursuant to the 1940 Act. Each officer and two of the Company’s directors, as noted in the chart below, are “interested” persons of the Fund. Each director serves as a director for The Hartford Mutual Funds, Inc., The Hartford Mutual Funds II, Inc., Hartford Series Fund, Inc., Hartford HLS Series Fund II, Inc., and as a trustee for The Hartford Alternative Strategies Fund, which, as of December 31, 2011, collectively consist of 91 funds. Correspondence may be sent to directors and officers c/o Hartford Mutual Funds, P.O. Box 2999, Hartford, Connecticut 06104-2999, except that correspondence to Ms. Fagely may be sent to 500 Bielenberg Drive, Woodbury, Minnesota 55125.
The table below sets forth, for each director and officer, his or her name, year of birth, current position with the Company and date first elected or appointed to Hartford Series Fund, Inc. (“HSF”), and Hartford HLS Series Fund II, Inc. (“HSF2”), principal occupation, and, for directors, other directorships held. The Fund’s statement of additional information contains further information on the directors and is available free of charge by calling 1-800-862-6668 or writing to Hartford HLS Funds, c/o Individual Annuity Services, P.O. Box 5085, Hartford, CT 06102-5085.
Information on the aggregate remuneration paid to the directors of the Company can be found in the Statement of Operations herein. The Fund pays to The Hartford a portion of the chief compliance officer’s compensation, but does not pay salaries or compensation to any of their other officers or directors who are employed by The Hartford.
Non-Interested Directors
Lynn S. Birdsong (1946) Director since 2003, Co-Chairman of the Investment Committee
Mr. Birdsong is a private investor. Mr. Birdsong currently serves as a Director of the Sovereign High Yield Investment Company (April 2010 to current). Mr. Birdsong currently serves as an Independent Director of Nomura Partners Funds, Inc. (formerly, The Japan Fund) (March 2003 to current). From 2003 to March 2005, Mr. Birdsong was an independent director of the Atlantic Whitehall Funds. From 1979 to 2002, Mr. Birdsong was a managing director of Zurich Scudder Investments, an investment management firm. During his employment with Scudder, Mr. Birdsong was an Interested Director of The Japan Fund. Since 1981, Mr. Birdsong has been a partner in Birdsong Company, an advertising specialty firm.
Robert M. Gavin, Jr. (1940) Director since 2002 (HSF) and 1986 (HSF2), Chairman of the Board since 2004
Dr. Gavin is an educational consultant. Prior to September 1, 2001, he was President of Cranbrook Education Community and prior to July 1996, he was President of Macalester College, St. Paul, Minnesota.
Duane E. Hill (1945) Director since 2001 (HSF) and 2002 (HSF2), Chairman of the Nominating Committee
Mr. Hill is Partner of TSG Ventures L.P., a private equity investment company. Mr. Hill is a former partner of TSG Capital Group, a private equity investment firm that served as sponsor and lead investor in leveraged buyouts of middle market companies.
Sandra S. Jaffee (1941) Director since 2005
Ms. Jaffee served as Chairman (2008 to 2009) and Chief Executive Officer of Fortent (formerly Searchspace Group), a leading provider of compliance/regulatory technology to financial institutions from August 2005 to August 2009. From August 2004 to August 2005, Ms. Jaffee served as an Entrepreneur in Residence with Warburg Pincus, a private equity firm. From September 1995 to July 2004, Ms. Jaffee served as Executive Vice President at Citigroup, where she was President and Chief Executive Officer of Citibank’s Global Securities Services (1995 to 2003). Ms. Jaffe currently serves as a member of the Board of Directors of Broadridge Financial Solutions as well as a Trustee of Muhlenberg College.
William P. Johnston (1944) Director since 2005, Chairman of the Compliance Committee
In June 2006, Mr. Johnston was appointed as Senior Advisor to The Carlyle Group, a global private equity investment firm. In August 2007, Mr. Johnston was elected to the Board of Directors of LifeCare Holdings, Inc. In February 2008, Mr. Johnston was elected to the Board of Directors of HCR-ManorCare, Inc. In May 2006, Mr. Johnston was elected to the Supervisory Board of Fresenius Medical Care AG & Co. KGaA, after its acquisition of Renal Care Group, Inc. in March 2006. Mr. Johnston joined Renal Care Group in November 2002 as a member of the Board of Directors and served as Chairman of the Board from March 2003 through March 2006. Mr. Johnston served as a Director of MultiPlan, Inc. from July 2006 through August 2010. From September 1987 to December 2002, Mr. Johnston was with Equitable Securities Corporation (and its successors, SunTrust Equitable Securities and SunTrust Robinson Humphrey) serving in various investment banking and managerial positions, including Managing Director and Head of Investment Banking, Chief Executive Officer and Vice Chairman.
Hartford International Opportunities HLS Fund
Directors and Officers (Unaudited) – (continued)
Phillip O. Peterson (1944) Director since 2002 (HSF) and 2000 (HSF2), Chairman of the Audit Committee
Mr. Peterson is a mutual fund industry consultant. He was a partner of KPMG LLP (an accounting firm) until July 1999. Mr. Peterson joined William Blair Funds in February 2007 as a member of the Board of Trustees. From January 2004 to April 2005, Mr. Peterson served as Independent President of the Strong Mutual Funds.
Lemma W. Senbet (1946) Director since 2005
Dr. Senbet is the William E. Mayer Chair Professor of Finance and Director, Center for Financial Policy, at the University of Maryland, Robert H. Smith School of Business. He was chair of the Finance Department from 1998 to 2006. Previously he was a chaired professor of finance at the University of Wisconsin-Madison. Also, he was director of the Fortis Funds from March 2000 to July 2002. Dr. Senbet served the finance profession in various capacities, including as director of the American Finance Association and President of the Western Finance Association. In 2006, Dr. Senbet was inducted Fellow of Financial Management Association International for his career-long distinguished scholarship and professional service.
Interested Directors and Officers
David N. Levenson (1966) Director since 2010
Mr. Levenson currently serves as President of The Hartford’s Wealth Management business. He was appointed to this role in July 2010. Previously, Mr. Levenson served as Executive Vice President of Legacy Holdings for The Hartford from June 2009 to July 2010. From 2006 to 2009, Mr. Levenson was with Hartford Life Insurance K.K. where he served as President and Chief Executive Officer from 2007 to 2009. He served as Managing Director of Hartford Investment Management Company from 2005 to 2006. Additionally, Mr. Levenson serves as Executive Vice President of The Hartford and as President, Director and Chief Executive Officer of Hartford Life Insurance Company (“HLIC”) and Hartford Life, Inc. (“HL Inc.”).
Lowndes A. Smith (1939) Director since 1996 (HSF) and 2002 (HSF2), Co-Chairman of the Investment Committee
Mr. Smith served as Vice Chairman of The Hartford from February 1997 to January 2002, as President and Chief Executive Officer of HL Inc. from February 1997 to January 2002, and as President and Chief Operating Officer of The Hartford Life Insurance Companies from January 1989 to January 2002. Mr. Smith serves as a Director of White Mountains Insurance Group, Ltd., One Beacon Insurance and Symetra Financial and as a Managing Director of Whittington Gray Associates.
Other Officers
James E. Davey (1964) President and Chief Executive Officer since 2010
Mr. Davey serves as Executive Vice President of HLIC. Additionally, Mr. Davey serves as President, Chief Executive Officer and Manager of Hartford Investment Financial Services, Inc. (“HIFSCO”) and President, Chief Executive Officer and Manager of HL Advisors. Mr. Davey joined The Hartford in 2002.
Michael R. Dressen (1963) AML Compliance Officer since 2011
Mr. Dressen currently serves as Assistant Vice President of HLIC. He also serves as Chief Compliance Officer and AML Compliance Officer of Hartford Administrative Services Company (“HASCO”) and as Assistant Secretary and Compliance Officer of HIFSCO. Mr Dressen joined The Hartford in 2005 from State Farm Insurance Companies where he held various positions related to mutual funds, variable products, and property casualty insurance.
Tamara L. Fagely (1958) Vice President, Treasurer and Controller since 2002 (HSF) and 1993 (HSF2)
Ms. Fagely has been a Vice President of HASCO since 1998 and Chief Financial Officer since 2006. Currently Ms. Fagely is a Vice President of HLIC. She served as Assistant Vice President of HLIC from December 2001 through March 2005. In addition, Ms. Fagely is Controller and Chief Financial Officer of HIFSCO.
Dr. Robert J. Froehlich (1953) Senior Managing Director since 2009
Dr. Froehlich joined The Hartford as Senior Managing Director in September 2009. Prior to joining The Hartford, Dr. Froehlich served as Vice Chairman of Deutsche Asset Management from 1997-2009.
Edward P. Macdonald (1967) Vice President, Secretary and Chief Legal Officer since 2005
Mr. Macdonald serves as Vice President of HLIC and Chief Legal Officer of Mutual Funds and Vice President of HIFSCO. He also serves as Vice President and Secretary of HASCO, and Chief Legal Officer, Secretary and Vice President of HL Advisors. Mr. Macdonald joined The Hartford in 2005.
Vernon J. Meyer (1964) Vice President since 2006
Mr. Meyer serves as Senior Vice President of HLIC. He also serves as Senior Vice President of HIFSCO and HL Advisors. Mr. Meyer joined The Hartford in 2004.
Colleen B. Pernerewski (1969) Vice President and Chief Compliance Officer since 2010
Ms. Pernerewski serves as Vice President and Chief Investment Advisor Compliance Officer of HIFSCO and as Vice President and Chief Compliance Officer of HL Advisors. Ms. Pernerewski joined The Hartford in 2005 from Travelers Life and Annuity where she served as Counsel (2004-2005). Prior to Travelers Life and Annuity, Ms. Pernerewski held the position of Counsel at The Hartford (1998-2004).
Elizabeth L. Schroeder (1966) Vice President since 2010
Ms. Schroeder currently serves as Assistant Vice President of HLIC. Ms. Schroeder joined HLIC in 1991. She is also an Assistant Vice President of HASCO, HIFSCO and HL Advisors.
Martin Swanson (1962) Vice President since 2010
Mr. Swanson is a Vice President of HLIC. Mr. Swanson also serves as Vice President/Marketing for HIFSCO. Prior to joining HLIC in 1998, Mr. Swanson was a Vice President at PaineWebber, Inc.
Jane Wolak (1961) Vice President since 2009
Ms. Wolak currently serves as Senior Vice President of HLIC. Ms. Wolak joined HLIC as Vice President, Retail Product Services in May 2007. She is also Vice President of HASCO. Previously, Ms. Wolak was with Sun Life Financial where she held the position of Vice President, Service Center Operations from 2001-2007.
HOW TO OBTAIN A COPY OF THE FUND’S PROXY VOTING POLICIES AND VOTING RECORDS (UNAUDITED)
A description of the policies and procedures that the Fund uses to determine how to vote proxies relating to portfolio securities and a record of how the Fund voted any proxies for the twelve-month period ended June 30, 2011 are available (1) without charge, upon request, by calling 800-862-6668 and (2) on the SEC’s website at http://www.sec.gov.
QUARTERLY PORTFOLIO HOLDINGS INFORMATION (UNAUDITED)
The Fund files a complete schedule of portfolio holdings with the SEC for the first and third quarters of each fiscal year on Form N-Q. The Fund’s Forms are available (1) without charge, upon request, by calling 800-862-6668 and (2) on the SEC’s website at http://www.sec.gov. The Form N-Q may be reviewed and copied at the SEC’s Public Reference Room in Washington, DC. Information on the operation of the Public Reference Room may be obtained by calling 1-800-SEC-0330.
Hartford International Opportunities HLS Fund
Expense Example (Unaudited)
Your Fund's Expenses
As a shareholder of the Fund, you incur two types of costs: (1) transaction costs and (2) ongoing costs including investment management fees, distribution fees, and other fund expenses. This example is intended to help you understand your ongoing costs (in dollars) of investing in the Fund and to compare these costs with the ongoing costs of investing in other mutual funds. The example is based on an investment of $1,000 invested at the beginning of the period and held for the period of June 30, 2011 through December 31, 2011.
Actual Expenses
The first set of columns of the table below provides information about actual account values and actual expenses. You may use the information in this column, together with the amount you invested, to estimate the expenses that you paid over the period. Simply divide your account value by $1,000 (for example, an $8,600 account value divided by $1,000 = 8.6), then multiply the result by the number in the line under the heading entitled “Expenses Paid During Period” to estimate the expenses you paid on your account during this period.
Hypothetical Example for Comparison Purposes
The second set of columns of the table below provides information about hypothetical account values and hypothetical expenses based on the Fund’s actual expense ratio and an assumed rate of return of 5% per year before expenses, which is not the Fund’s actual return. The hypothetical account values and expenses may not be used to estimate the actual ending account balance or expenses you paid for the period. You may use this information to compare the ongoing costs of investing in the Fund and other funds. To do so, compare this 5% hypothetical example with the 5% hypothetical examples that appear in the shareholder reports of the other funds.
Please note that the expenses shown in the table are meant to highlight your ongoing costs only and do not reflect any transactional costs, such as sales charges (loads) and CDSC. Therefore, the second set of columns of the table is useful in comparing ongoing costs only, and will not help you determine the relative total costs of owning different funds. In addition, if these transactional costs were included, your costs would be higher. Expenses are equal to the Fund's annualized expense ratios multiplied by average account value over the period, multiplied by 184/365 (to reflect the one-half year period).
| | Actual return | | | Hypothetical (5% return before expenses) | | | | | | | | |
| | Beginning
Account Value
June 30, 2011 | | Ending Account Value
December 31, 2011 | | Expenses paid during the period
June 30, 2011
through
December 31, 2011 | | | Beginning
Account Value
June 30, 2011 | | Ending Account Value
December 31, 2011 | | Expenses paid during the period
June 30, 2011
through
December 31, 2011 | | Annualized expense ratio | | | Days in the current 1/2 year | | Days in the full year | |
| Class IA | $ | 1,000.00 | | $ | 833.78 | | $ | 3.37 | | | $ | 1,000.00 | | $ | 1,021.53 | | $ | 3.72 | | | 0.73 | % | | | 184 | | | 365 | |
| Class IB | $ | 1,000.00 | | $ | 832.74 | | $ | 4.53 | | | $ | 1,000.00 | | $ | 1,020.27 | | $ | 4.99 | | | 0.98 | % | | | 184 | | | 365 | |
Hartford International Opportunities HLS Fund
Approval of Investment Management and Investment Sub-Advisory Agreements (Unaudited)
Section 15(c) of the Investment Company Act of 1940, as amended (the “1940 Act”), requires that each mutual fund’s board of directors, including a majority of those directors who are not “interested persons” of the mutual fund, as defined in the 1940 Act (the “Independent Directors”), annually review and consider the continuation of the mutual fund’s investment advisory and sub-advisory agreements. At its meeting held on August 2-3, 2011, the Board of Directors (the “Board”) of Hartford Series Fund, Inc., including each of the Independent Directors, unanimously voted to approve the continuation of the investment management agreement for Hartford International Opportunities HLS Fund (the “Fund”) with HL Investment Advisors, LLC (“HL Advisors”) and the continuation of the investment sub-advisory agreement between HL Advisors and the Fund’s sub-adviser, Wellington Management Company, LLP (the “Sub-adviser,” and together with HL Advisors, the “Advisers”) (collectively, the “Agreements”).
In the months preceding the August 2-3, 2011 meeting, the Board requested, received, and reviewed written responses from the Advisers to questions posed to them on behalf of the Independent Directors and supporting materials relating to those questions and responses. The Board considered information furnished to the Board at its meetings throughout the year, as well as information specifically prepared in connection with the annual approval of the Agreements at the Board’s meetings held on June 21-22, 2011 and August 2-3, 2011. Information provided to the Board at its meetings throughout the year included, among other things, reports on Fund performance, legal and compliance matters, sales and marketing activity, shareholder services, and the other services provided to the Fund by the Advisers and their affiliates. In addition, the Board received in-person presentations by Fund officers and representatives of HL Advisors at the Board’s meetings on June 21-22, 2011 and August 2-3, 2011 concerning the Agreements.
The Independent Directors, advised by independent legal counsel, engaged two service providers to assist them with evaluating the Agreements with respect to the Fund. Lipper Inc. (“Lipper”), an independent provider of investment company data, was retained to provide the Board with reports on how the Fund’s contractual management fees, actual management fees, other non-management fees, overall expense ratios and investment performance compared to those of mutual funds with similar investment objectives. The Independent Directors also engaged an independent financial services consulting firm (the “Consultant”) to assist them in evaluating the Fund’s management fees, sub-advisory fees, other non-management fees, overall expense ratios and investment performance. In addition, the Consultant reviewed the profitability calculations utilized by HL Advisors in connection with the continuation of the investment management agreement.
In determining to continue the Agreements for the Fund, the members of the Board reviewed and evaluated information and factors they believed to be relevant and appropriate in light of the information that the Board deemed necessary and appropriate through the exercise of their reasonable business judgment. While individual members of the Board may have weighed certain factors differently, the Board’s determination to continue the Agreements was based on a comprehensive consideration of all information provided to the Board throughout the year and specifically with respect to the continuation of the Agreements. A more detailed discussion of the factors the Board considered with respect to its approval of the Agreements is provided below.
Nature, Extent, And Quality Of Services Provided by the Advisers
The Board requested and considered information concerning the nature, extent, and quality of the services provided to the Fund by the Advisers. The Board considered, among other things, the terms of the Agreements and the range of services provided by the Advisers. The Board considered the Advisers’ professional personnel who provide services to the Fund, including each Adviser’s ability and experience in attracting and retaining qualified personnel to service the Fund. The Board considered each Adviser’s reputation and overall financial strength, as well as its willingness to consider and implement organizational and operational changes designed to improve services to the Fund. In addition, the Board considered the quality of each Adviser’s communications with the Board and responsiveness to Board inquiries.
The Board also requested and evaluated information concerning each Adviser’s regulatory and compliance environment. In this regard, the Board requested and reviewed information on each Adviser’s compliance policies and procedures, compliance history, and a report from the Fund’s Chief Compliance Officer on each Adviser’s compliance with applicable laws and regulations, including responses to regulatory developments and compliance issues raised by regulators. The Board also noted the Advisers’
Hartford International Opportunities HLS Fund
Approval of Investment Management and Investment Sub-Advisory Agreements (Unaudited) – (continued)
support of the Fund’s compliance control structure, particularly the resources devoted by the Advisers in support of the Fund’s obligations pursuant to Rule 38a-1 under the 1940 Act.
With respect to HL Advisors, the Board noted that under the Agreements, HL Advisors is responsible for the management of the Fund, including overseeing fund operations and service providers, as well as investment advisory services in connection with selecting, monitoring and supervising the Sub-adviser. The Board considered HL Advisors’ ongoing monitoring of people, process and performance, including its quarterly reviews of each of the Hartford HLS Funds, semi-annual meetings with the leaders of each Fund’s portfolio management team, and oversight of the Funds’ 49 portfolio managers. The Board recognized that HL Advisors has demonstrated a record of making changes to the management and/or strategies of the Funds when warranted. The Board considered HL Advisors’ oversight of the Sub-adviser’s investment approach and results, process for monitoring best execution of portfolio trades by the Sub-adviser, and approach to risk management with respect to the Fund and the service providers to the Fund. The Board also considered HL Advisors’ oversight of compliance with the Fund’s objective and policies as well as with applicable laws and regulations, noting that regulatory and other developments had over time led to an increase in the scope of HL Advisors’ services in this regard. In addition, the Board considered HL Advisors’ ongoing commitment to review and rationalize the Hartford fund family’s product line-up and the expenses that HL Advisors had incurred in connection with fund combinations in recent years. The Board considered that HL Advisors or its affiliates are responsible for providing the Fund’s officers. The Board also noted that Hartford Life Insurance Company (“HLIC”) provides administrative services to the Fund. The Board considered its experiences with HL Advisors and HLIC with respect to each of these services.
With respect to the Sub-adviser, who provides day-to-day portfolio management services, the Board considered the quality of the Fund’s portfolio managers, the Sub-adviser’s other investment personnel, its investment philosophy and process, investment research capabilities and resources, performance record, trade execution capabilities and experience. The Board considered the experience of the Fund’s portfolio managers, the number of accounts managed by the portfolio managers, and the Sub-adviser’s method for compensating the portfolio managers.
Based on these considerations, the Board concluded that it was satisfied with the nature, extent and quality of the services provided to the Fund by HL Advisors and the Sub-adviser.
Performance of the Fund and the Advisers
The Board considered the investment performance of the Fund. In this regard, the Board reviewed the performance of the Fund over different time periods presented in the materials and evaluated HL Advisors’ analysis of the Fund’s performance for these time periods. The Board considered information and materials provided to the Board by the Advisers concerning Fund performance, as well as information from Lipper comparing the investment performance of the Fund to an appropriate benchmark and universe of peer funds. The Board noted that although the Fund has had some recent short-term challenges, the overall performance of the Fund was within expectations.
The Board considered the detailed investment analytics reports provided by The Hartford’s Investment Advisory Group throughout the year. These reports include, among other things, information on the Fund’s gross and net returns, the Fund’s investment performance relative to an appropriate benchmark and peer group, various statistics concerning the Fund’s portfolio, and a narrative summary of various factors affecting Fund performance. The Board considered the Advisers’ cooperation with the Investment Committee, which assists the Board in evaluating the performance of the Fund at periodic meetings throughout the year. The Board also considered the analysis provided by the Consultant relating to the Fund’s performance track record.
In light of all the considerations noted above, the Board concluded that it had continued confidence in HL Advisors’ and the Sub-adviser’s overall capabilities to manage the Fund.
Costs of the Services and Profitability of the Advisers
The Board reviewed information regarding HL Advisors’ cost to provide investment management and related services to the Fund and HL Advisors’ profitability, both overall and for the Fund, on a pre-tax basis without regard to distribution expenses. The
Board also requested and reviewed information about the profitability to HL Advisors and its affiliates from all services provided to the Fund and all aspects of their relationship with the Fund. The Board also requested and received information relating to the operations and profitability of the Sub-adviser.
The Board considered the Consultant’s review of the profitability calculations utilized by HL Advisors in connection with the continuation of the investment management agreement. In this regard, the Consultant reported that The Hartford’s process for calculating and reporting Fund profitability is reasonable, sound and well within common industry practice.
Based on these considerations, the Board concluded that the profits anticipated to be realized by the Advisers and their affiliates from their relationships with the Fund would not be excessive.
Comparison of Fees and Services Provided by the Advisers
The Board considered comparative information with respect to the management fees to be paid by the Fund to HL Advisors and the total expense ratios of the Fund. The Board also considered comparative information with respect to the sub-advisory fees to be paid by HL Advisors to the Sub-adviser, to the extent applicable. In this regard, the Board requested and reviewed information from HL Advisors and the Sub-adviser relating to the management and sub-advisory fees, including the sub-advisory fee schedule for the Fund, and total operating expenses for the Fund. The Board considered that the management fee for the Fund includes the fee paid to HLIC for providing certain administrative services to the Fund. The Board also reviewed information from Lipper comparing the Fund’s contractual management fees, actual management fees and overall expense ratios relative to a group of funds selected by Lipper, in consultation with the Consultant, and a broader universe of funds selected by Lipper.
While the Board recognized that comparisons between the Fund and peer funds are imprecise, given the differing service levels and characteristics of mutual funds and the different business models and cost structures of the Advisers, the comparative information provided by Lipper assisted the Board in evaluating the reasonableness of the Fund’s management and sub-advisory fees and total operating expenses. In addition, the Board considered the analysis and recommendations of the Consultant relating to the Fund’s management and sub-advisory fees and total operating expenses.
Based on these considerations, the Board concluded that the Fund’s fees and total operating expenses, in conjunction with the information about quality of services, profitability, economies of scale, and other matters discussed, were reasonable in light of the services provided.
Economies of Scale
The Board requested and considered information regarding the Advisers’ realization of economies of scale with respect to the Fund and whether the fee levels reflect these economies of scale for the benefit of the Fund’s investors. With respect to HL Advisors, the Board considered representations from HL Advisors that it is difficult to anticipate whether and to what extent economies may be realized by HL Advisors as assets grow over time. The Board reviewed the breakpoints in the management fee schedule for the Fund, which reduces fee rates as Fund assets grow over time. The Board recognized that a fund with assets beyond the last breakpoint level will continue to benefit from economies of scale because additional assets are charged the lowest breakpoint fee resulting in lower overall effective management fee rates. The Board also recognized that a fee schedule that reaches a lower breakpoint quickly provides shareholders with the benefit of anticipated or potential economies of scale.
The Board reviewed and evaluated materials from Lipper showing how management fee schedules of peer funds reflect economies of scale for the benefit of investors as a peer fund’s assets hypothetically increase over time. Based on information provided by HL Advisors, Lipper, and the Consultant, the Board recognized that there is no uniform methodology for establishing breakpoints or uniform pattern in asset levels that trigger breakpoints or the amounts of breakpoints triggered.
After considering all of the information available to it, the Board concluded that it was satisfied with the extent to which economies of scale would be shared for the benefit of the Fund’s shareholders based on currently available information and the
Hartford International Opportunities HLS Fund
Approval of Investment Management and Investment Sub-Advisory Agreements (Unaudited) – (continued)
effective advisory fees and expense ratios for the Fund at its current and reasonably anticipated asset levels. The Board noted, however, that it would continue to monitor future growth in Fund assets and the appropriateness of additional breakpoints.
Other Benefits
The Board considered other benefits to the Advisers and their affiliates from their relationships with the Fund, including the role of the Fund in supporting the variable life insurance and variable annuity products offered by The Hartford. The Board reviewed information noting that HLIC, an affiliate of HL Advisors, receives fees for providing certain administrative services to the Fund, and that HLIC also receives fees for fund accounting and related services from the Fund, and the Board considered information on expected profits to HLIC or its affiliates for such services. The Board also considered that Hartford Administrative Services Company (“HASCO”), the Fund’s transfer agent and an affiliate of HL Advisors, receives transfer agency compensation from the Fund, and the Board reviewed information on the expected profitability of the Fund’s transfer agency function to HASCO. The Board considered information provided by HASCO indicating that the transfer agent fees charged by HASCO to the Fund were fair and reasonable based on publicly available information.
The Board also considered that Hartford Securities Distribution Company, Inc., as principal underwriter of the Fund, receives 12b-1 fees from the Fund. The Board also noted that certain affiliates of HL Advisors distribute shares of the Fund and receive compensation in that connection.
The Board considered benefits to the Sub-adviser from its use of the Fund’s brokerage commissions to obtain soft dollar research, and representations from HL Advisors and the Sub-adviser that the Sub-adviser would not make any revenue-sharing payments or any other type of distribution payments to HL Advisors or its affiliates.
The Board considered the benefits to shareholders of being part of the Hartford family of funds. The Board considered HL Advisors’ efforts to provide investors in the family with a broad range of investment styles and asset classes.
* * * *
Based upon its review of these various factors, among others, the Board concluded that it is in the best interests of the Fund and its shareholders for the Board to approve the Agreements for an additional year. In reaching this decision, the Board did not assign relative weights to the factors discussed above or deem any one or group of them to be controlling in and of themselves. In connection with their deliberations, the Independent Directors met separately in executive session on several occasions, with independent legal counsel, to review the relevant materials and consider their responsibilities under relevant laws and regulations.
The Hartford
P.O. Box 5085
Hartford, CT 06102-5085
Hartford Series Fund, Inc. is underwritten and distributed by Hartford Securities Distribution Company, Inc.
"The Hartford" is The Hartford Financial Services Group, Inc. and its subsidiaries.
Hartford Series Fund, Inc. inception dates range from 1977 to date. Hartford Series Fund, Inc. is not a subsidiary of The Hartford but is underwritten, distributed by and advised by subsidiaries of The Hartford. Investments in Hartford Series Fund, Inc. are not guaranteed by The Hartford or any other entity.
You should carefully consider investment objectives, risks, and charges and expenses of Hartford HLS Funds before investing. This and other information can be found in the Fund’s prospectus or summary prospectus, which can be obtained by calling 800-862-6668. Please read them carefully before you invest or send money.
HLSAR-IO11 2-12 109078 Printed in U.S.A ©2011 The Hartford, Hartford, CT 06115 | |

A MESSAGE FROM THE PRESIDENT
Dear Fellow Shareholders:
I want to take this opportunity to say thank you for investing in Hartford HLS Funds.
This has been a tumultuous year. In the beginning of 2011, we witnessed tension-fueled political uprisings in the already-volatile Middle East and North Africa region. We also watched as Japan dealt with a series of crises including a massive earthquake and subsequent tsunami. Yet, U.S. economic conditions continued to improve, with gains in consumer confidence and retail sales. During the first half of 2011, domestic, international, and world indices (as measured by the S&P 500, MSCI EAFE and MSCI World) were all up more than 5% through June, 30 2011.
The economic recovery, however, lost momentum in the second half of 2011. The employment and housing markets both remain extremely challenged. Investors continue to be concerned about the implications of the European sovereign debt crisis, as well as our own high levels of domestic debt. Fears that the European sovereign debt crisis could continue to drag down the global economy have weighed heavily on stocks.
Ongoing apprehension regarding the U.S. debt ceiling during the summer and the resulting downgrade of the U.S. sovereign credit rating by Standard & Poor’s also contributed to weaker investor confidence.
There are, however, some reasons to remain confident. Corporations have record levels of cash on their balance sheets—corporate cash has doubled in the past 10 years. In addition, U.S. gross domestic product expanded at a 2.5 percent annual rate in the third quarter according to the Commerce Department, as consumers and businesses set aside fears about the recovery and stepped up spending. Corporate earnings have also remained positive, with a majority of companies beating expectations each quarter this year. This momentum will hopefully continue into next year.
As we head into 2012, in light of the continued market volatility, now would be a good time to schedule a meeting with your financial advisor to examine your current investment strategy and determine whether you are on the right track.
| • | Does your fixed-income portfolio complement your equity portfolio? |
| • | Are you receiving diversified sources of income? |
| • | Is your portfolio still in line with your risk tolerance and investment time horizon? |
Talk to your advisor to see what changes you should make to address these concerns and opportunities.
Thank you again for investing with Hartford HLS Funds.
James Davey
President
Hartford HLS Funds
Hartford MidCap HLS Fund
Table of Contents
This report is prepared for the general information of contract owners and qualified retirement plan participants. It is not an offer of contracts or of qualified retirement plans. It should not be used in connection with any offer, except in conjunction with the appropriate product prospectus which contains all pertinent information including the applicable sales, administrative and other charges.
The views expressed in the Fund’s Manager Discussion under ‘‘Why did the Fund perform this way?’’ and ‘‘What is the outlook?’’ are views of the Fund’s sub-adviser and portfolio management team through the end of the period and are subject to change based on market and other conditions.
Hartford MidCap HLS Fund* inception 07/14/1997
(sub-advised by Wellington Management Company, LLP)
Investment objective – Seeks long-term growth of capital.

The chart above shows the growth of a $10,000 investment in Class IA. Growth results in classes other than Class IA will vary from what is seen above due to differences in the expenses charged to those share classes.
| Average Annual Total Returns (as of 12/31/11) |
| |
| | 1 Year | 5 Year | 10 Year |
| MidCap IA | -7.92% | 2.11% | 7.13% |
| MidCap IB | -8.16% | 1.85% | 6.87% |
| S&P MidCap 400 Index | -1.73% | 3.32% | 7.04% |
| | | | |
PAST PERFORMANCE IS NOT INDICATIVE OF FUTURE RESULTS.
| Total returns presented above were calculated using the Fund's net asset value available to shareholders for sale or redemption of Fund shares on December 31, 2011, which may exclude investment transactions as of this date. |
S&P MidCap 400 Index is an unmanaged index of common stocks of companies chosen by S&P designed to represent price movements in the mid-cap U.S. equity market.
You cannot invest directly in an index.
The chart represents a hypothetical investment in the Fund. Performance data represents past performance and current performance could be higher or lower.
Performance information may reflect historical or current expense waivers/reimbursements from the investment adviser, without which performance would have been lower. For information on current expense waivers/reimbursements, please see the prospectus.
The value of the Fund will fluctuate so that when redeemed, it may be worth more or less than the original investment. The chart and table do not reflect the deductions of taxes, sales charges or other fees which may be applied at the variable life insurance, variable annuity or qualified retirement plan product level. Any such additional sales charges or other fees or expenses would lower the contract’s or plan’s performance.
* The Fund has restrictions on the purchase of shares. A description of the restrictions can be found in the prospectus.
Hartford MidCap HLS Fund
Manager Discussion (Unaudited)
December 31, 2011
| Portfolio Managers | | |
| Philip W. Ruedi, CFA | Mark A. Whitaker, CFA | |
| Senior Vice President | Vice President | |
| | | |
How did the Fund perform?
The Class IA shares of the Hartford MidCap HLS Fund returned -7.92% for the twelve-month period ended December 31, 2011, underperforming its benchmark, the S&P MidCap 400 Index, which returned -1.73% for the same period. The Fund also underperformed the -3.86% return of the average fund in the Lipper Mid-Cap Core VP-UF Funds peer group, a group of funds with investment strategies similar to those of the Fund.
Why did the Fund perform this way?
The twelve-month period ended December 31, 2011 was yet another extremely volatile period for equity markets. Global equities started the year on a strong note and continued to march higher in the first quarter of 2011, driven by investors’ enthusiasm for additional government debt purchases by the U.S. Federal Reserve, the extension of tax cuts in the U.S., strong corporate earnings growth, and generally improving economic data. This enthusiasm reversed later in the period, however, as concerns surfaced that the global economy could slip back into recession, resulting in a rapid decline in equity markets. Fears about sovereign debt and solvency in the eurozone, slowing economic expansion in China, and uncertainty about the sustainability of corporate earnings growth combined to produce an extremely volatile stock market, and return correlations among stocks spiked as investors shed risk and fled to safety. Markets ended the year on a positive note in the final month of the period with encouraging employment and manufacturing data in the U.S.
Mid cap stocks (-2%) and small cap stocks (-4%) underperformed large cap stocks (+2%) during the period, as measured by the S&P MidCap 400, Russell 2000, and S&P 500 Indices, respectively. Growth stocks (-1.6%) outpaced Value stocks (-3.4%) during the period, as measured by the Russell 2500 Growth and Russell 2500 Value Indices. Within the S&P MidCap 400 Index, five out of ten sectors posted double-digit positive returns. The Consumer Staples (+22%), Utilities (+17%), and Consumer Discretionary (+2%) sectors performed best while the Information Technology (-12%), Energy (-10%), and Telecommunication Services (-10%) sectors lagged the benchmark.
Underperformance versus the benchmark was driven by weak security selection in the Industrials, Financials, and Energy sectors, which more than offset strong stock selection in the Information Technology and Telecommunication Services sectors. Sector allocation, which is driven by our bottom-up stock selection process (i.e. stock by stock fundamental research), also detracted during the period as a result of our underweight position (i.e. the Fund’s sector position was less than the benchmark position) in Consumer Staples and an overweight (i.e. the Fund’s sector position was greater than the benchmark position) to Information Technology.
Top detractors from benchmark-relative performance included Alpha Natural Resources (Energy), Netflix (Consumer Discretionary), and PACCAR (Industrials). Shares of Alpha Natural Resources, a U.S.-based coal producer, declined after reduced shipment guidance raised investor concerns about a slowdown in demand from China. Internet-based subscription service for television and movies provider Netflix’s shares declined after the firm announced a pricing change that angered many members. Shares of PACCAR, a worldwide manufacturer of light, medium, and heavy-duty trucks and after-market parts, declined due to concerns about the company’s exposure to the weak European economy. Digital media technology company Rovi (Information Technology) was among the top absolute (i.e. total return) performance detractors during the period.
Top relative contributors included Regeneron Pharmaceuticals (Health Care), Tempur-Pedic International (Consumer Discretionary), and Cree (Information Technology). Shares of biopharmaceutical company Regeneron rose as expectations for the success of Eylea, a drug for macular degeneration treatment, have increased. The company also has a compelling antibody platform that should position it well in drug discovery. Shares of Tempur-Pedic International benefited from strong earnings results as a result of effective cost-cutting measures and improved marketing efforts. Shares of Cree, an innovator of LED lighting, fell from lower LED demand as TV inventory corrections and overcapacity in China have weighed on revenues. Not owning Cree benefitted the fund. Among top contributors to absolute performance were Verisign (Information Technology) and Vertex Pharmaceuticals (Health Care).
What is the outlook?
After bottoming in early 2009, risk assets have rebounded strongly while global economies continue to show signs of stabilizing as unprecedented fiscal and monetary stimulus work their way through the system. Despite some signs of continued weakness, we believe that global growth remains
Hartford MidCap HLS Fund
Manager Discussion (Unaudited) – (continued)
December 31, 2011
positive. The U.S. recovery continues at a sluggish pace but the trends remain positive. While we remain mindful of additional factors that may impact the pace of the recovery in the U.S., including sovereign debt issues in Europe, the impact of any resulting fiscal restraint on growth, increased government regulation, and continued pressure on housing, we believe that the U.S. economy appears likely to continue to expand.
Our efforts are focused on picking stocks based on a bottom-up review of their fundamentals. As a result of these individual stock decisions, we ended the period with our most significant overweight positions relative to the benchmark in the Health Care, Information Technology, and Energy sectors. Our largest underweights relative to the benchmark were in Financials, Consumer Discretionary, and Materials.
| Diversification by Industry |
| as of December 31, 2011 |
| Industry (Sector) | | Percentage of
Net Assets | |
| Automobiles & Components (Consumer Discretionary) | | | 1.6 | % |
| Banks (Financials) | | | 6.2 | |
| Capital Goods (Industrials) | | | 9.0 | |
| Commercial & Professional Services (Industrials) | | | 3.8 | |
| Consumer Durables & Apparel (Consumer Discretionary) | | | 3.6 | |
| Diversified Financials (Financials) | | | 5.5 | |
| Energy (Energy) | | | 9.9 | |
| Food & Staples Retailing (Consumer Staples) | | | 0.5 | |
| Food, Beverage & Tobacco (Consumer Staples) | | | 1.5 | |
| Health Care Equipment & Services (Health Care) | | | 7.8 | |
| Insurance (Financials) | | | 1.7 | |
| Materials (Materials) | | | 4.3 | |
| Media (Consumer Discretionary) | | | 1.9 | |
| Pharmaceuticals, Biotechnology & Life Sciences (Health Care) | | | 10.0 | |
| Real Estate (Financials) | | | 2.3 | |
| Retailing (Consumer Discretionary) | | | 2.7 | |
| Semiconductors & Semiconductor Equipment (Information Technology) | | | 5.7 | |
| Software & Services (Information Technology) | | | 10.1 | |
| Technology Hardware & Equipment (Information Technology) | | | 3.1 | |
| Transportation (Industrials) | | | 4.3 | |
| Utilities (Utilities) | | | 3.6 | |
| Short-Term Investments | | | 0.8 | |
| Other Assets and Liabilities | | | 0.1 | |
| Total | | | 100.0 | % |
|
Hartford MidCap HLS Fund
Schedule of Investments
December 31, 2011
(000’s Omitted)
| Shares or Principal Amount | | Market Value ╪ | |
COMMON STOCKS - 99.1% | |
| | | | | Automobiles & Components - 1.6% | | | | |
| | 542 | | | Harley-Davidson, Inc. | | $ | 21,080 | |
| | | | | | | | | |
| | | | | Banks - 6.2% | | | | |
| | 141 | | | Cullen/Frost Bankers, Inc. | | | 7,438 | |
| | 363 | | | East West Bancorp, Inc. | | | 7,159 | |
| | 979 | | | First Niagara Financial Group, Inc. | | | 8,447 | |
| | 461 | | | First Republic Bank ● | | | 14,110 | |
| | 2,108 | | | Huntington Bancshares, Inc. | | | 11,575 | |
| | 317 | | | M&T Bank Corp. | | | 24,237 | |
| | 105 | | | Signature Bank ● | | | 6,319 | |
| | | | | | | | 79,285 | |
| | | | | Capital Goods - 9.0% | | | | |
| | 316 | | | AMETEK, Inc. | | | 13,297 | |
| | 269 | | | Carlisle Cos., Inc. | | | 11,928 | |
| | 298 | | | IDEX Corp. | | | 11,040 | |
| | 305 | | | Jacobs Engineering Group, Inc. ● | | | 12,396 | |
| | 576 | | | Lennox International, Inc. | | | 19,456 | |
| | 230 | | | MSC Industrial Direct Co., Inc. | | | 16,450 | |
| | 547 | | | PACCAR, Inc. | | | 20,487 | |
| | 176 | | | Pall Corp. | | | 10,077 | |
| | | | | | | | 115,131 | |
| | | | | Commercial & Professional Services - 3.8% | | | | |
| | 203 | | | Equifax, Inc. ● | | | 7,858 | |
| | 532 | | | Manpower, Inc. | | | 19,026 | |
| | 787 | | | Robert Half International, Inc. | | | 22,407 | |
| | | | | | | | 49,291 | |
| | | | | Consumer Durables & Apparel - 3.6% | | | | |
| | 514 | | | Hasbro, Inc. | | | 16,377 | |
| | 125 | | | Michael Kors Holdings Ltd. ● | | | 3,411 | |
| | 29 | | | NVR, Inc. ● | | | 19,986 | |
| | 122 | | | Tempur-Pedic International, Inc. ● | | | 6,414 | |
| | | | | | | | 46,188 | |
| | | | | Diversified Financials - 5.5% | | | | |
| | 446 | | | Cetip S.A. - Balcao Organizado | | | 6,438 | |
| | 231 | | | Greenhill & Co., Inc. | | | 8,393 | |
| | 899 | | | Invesco Ltd. | | | 18,058 | |
| | 175 | | | LPL Investment Holdings, Inc. ● | | | 5,356 | |
| | 1,092 | | | SEI Investments Co. | | | 18,944 | |
| | 225 | | | T. Rowe Price Group, Inc. | | | 12,839 | |
| | | | | | | | 70,028 | |
| | | | | Energy - 9.9% | | | | |
| | 244 | | | Alpha Natural Resources, Inc. ● | | | 4,990 | |
| | 445 | | | Atwood Oceanics, Inc. ● | | | 17,696 | |
| | 663 | | | Cobalt International Energy ● | | | 10,283 | |
| | 349 | | | Consol Energy, Inc. | | | 12,812 | |
| | 592 | | | Denbury Resources, Inc. ● | | | 8,935 | |
| | 435 | | | ENSCO International plc | | | 20,429 | |
| | 849 | | | McDermott International, Inc. ● | | | 9,771 | |
| | 549 | | | Newfield Exploration Co. ● | | | 20,704 | |
| | 239 | | | Pioneer Natural Resources Co. | | | 21,387 | |
| | | | | | | | 127,007 | |
| | | | | Food & Staples Retailing - 0.5% | | | | |
| | 100 | | | Whole Foods Market, Inc. | | | 6,925 | |
| | | | | | | | | |
| | | | | Food, Beverage & Tobacco - 1.5% | | | | |
| | 431 | | | Molson Coors Brewing Co. | | | 18,776 | |
| | | | | | | | | |
| | | | | Health Care Equipment & Services - 7.8% | | | | |
| | 474 | | | Amerisource Bergen Corp. | | | 17,615 | |
| | 342 | | | Cardinal Health, Inc. | | | 13,901 | |
| | 410 | | | Coventry Health Care, Inc. ● | | | 12,443 | |
| | 143 | | | Gen-Probe, Inc. ● | | | 8,429 | |
| | 224 | | | Health Net, Inc. ● | | | 6,803 | |
| | 692 | | | Lincare Holdings, Inc. | | | 17,800 | |
| | 305 | | | Patterson Cos., Inc. | | | 8,994 | |
| | 353 | | | Resmed, Inc. ● | | | 8,967 | |
| | 82 | | | SXC Health Solutions Corp. ● | | | 4,620 | |
| | | | | | | | 99,572 | |
| | | | | Insurance - 1.7% | | | | |
| | 553 | | | Unum Group | | | 11,643 | |
| | 294 | | | W.R. Berkley Corp. | | | 10,112 | |
| | | | | | | | 21,755 | |
| | | | | Materials - 4.3% | | | | |
| | 264 | | | Carpenter Technology Corp. | | | 13,592 | |
| | 14 | | | CF Industries Holdings, Inc. | | | 1,986 | |
| | 174 | | | FMC Corp. | | | 14,957 | |
| | 127 | | | Sherwin-Williams Co. | | | 11,342 | |
| | 221 | | | Silgan Holdings, Inc. | | | 8,532 | |
| | 83 | | | Walter Energy, Inc. | | | 5,007 | |
| | | | | | | | 55,416 | |
| | | | | Media - 1.9% | | | | |
| | 89 | | | AMC Networks, Inc. ● | | | 3,338 | |
| | 751 | | | DreamWorks Animation SKG, Inc. ● | | | 12,459 | |
| | 197 | | | Liberty Global, Inc. ● | | | 8,088 | |
| | | | | | | | 23,885 | |
| | | | | Pharmaceuticals, Biotechnology & Life Sciences - 10.0% | | | | |
| | 506 | | | Alkermes plc ● | | | 8,783 | |
| | 1,077 | | | Amylin Pharmaceuticals, Inc. ● | | | 12,257 | |
| | 724 | | | Incyte Corp. ● | | | 10,864 | |
| | 294 | | | Ironwood Pharmaceuticals, Inc. ● | | | 3,523 | |
| | 364 | | | Life Technologies Corp. ● | | | 14,147 | |
| | 1,090 | | | Mylan, Inc. ● | | | 23,393 | |
| | 138 | | | Regeneron Pharmaceuticals, Inc. ● | | | 7,653 | |
| | 541 | | | Seattle Genetics, Inc. ● | | | 9,044 | |
| | 237 | | | Waters Corp. ● | | | 17,531 | |
| | 354 | | | Watson Pharmaceuticals, Inc. ● | | | 21,355 | |
| | | | | | | | 128,550 | |
| | | | | Real Estate - 2.3% | | | | |
| | 142 | | | Alexandria Real Estate Equities, Inc. | | | 9,759 | |
| | 324 | | | American Tower Corp. Class A | | | 19,448 | |
| | | | | | | | 29,207 | |
| | | | | Retailing - 2.7% | | | | |
| | 231 | | | Advance Automotive Parts, Inc. | | | 16,094 | |
| | 407 | | | CarMax, Inc. ● | | | 12,410 | |
| | 135 | | | Joseph A. Bank Clothiers, Inc. ● | | | 6,567 | |
| | | | | | | | 35,071 | |
| | | | | Semiconductors & Semiconductor Equipment - 5.7% | | | | |
| | 287 | | | Analog Devices, Inc. | | | 10,265 | |
| | 677 | | | Maxim Integrated Products, Inc. | | | 17,626 | |
| | 1,145 | | | NVIDIA Corp. ● | | | 15,870 | |
| | 1,193 | | | Skyworks Solutions, Inc. ● | | | 19,345 | |
| | 305 | | | Xilinx, Inc. | | | 9,785 | |
| | | | | | | | 72,891 | |
| | | | | Software & Services - 10.1% | | | | |
| | 239 | | | Citrix Systems, Inc. ● | | | 14,530 | |
| | 139 | | | Factset Research Systems, Inc. | | | 12,115 | |
| | 255 | | | Gartner, Inc. Class A ● | | | 8,853 | |
| | 1,705 | | | Genpact Ltd. ● | | | 25,495 | |
The accompanying notes are an integral part of these financial statements.
Hartford MidCap HLS Fund
Schedule of Investments – (continued)
December 31, 2011
(000’s Omitted)
| Shares or Principal Amount | | | Market Value ╪ | |
| COMMON STOCKS - 99.1% - (continued) | | | | |
| | | | | Software & Services - 10.1% - (continued) | | | | |
| | 32 | | | Red Hat, Inc. ● | | $ | 1,310 | |
| | 659 | | | Rovi Corp. ● | | | 16,202 | |
| | 777 | | | VeriSign, Inc. | | | 27,744 | |
| | 1,245 | | | Western Union Co. | | | 22,725 | |
| | | | | | | | 128,974 | |
| | | | | Technology Hardware & Equipment - 3.1% | | | | |
| | 516 | | | ADTRAN, Inc. | | | 15,560 | |
| | 58 | | | F5 Networks, Inc. ● | | | 6,115 | |
| | 400 | | | National Instruments Corp. | | | 10,374 | |
| | 509 | | | Polycom, Inc. ● | | | 8,289 | |
| | | | | | | | 40,338 | |
| | | | | Transportation - 4.3% | | | | |
| | 248 | | | C.H. Robinson Worldwide, Inc. | | | 17,320 | |
| | 285 | | | Expeditors International of Washington, Inc. | | | 11,678 | |
| | 372 | | | J.B. Hunt Transport Services, Inc. | | | 16,757 | |
| | 139 | | | Kansas City Southern ● | | | 9,424 | |
| | | | | | | | 55,179 | |
| | | | | Utilities - 3.6% | | | | |
| | 190 | | | Northeast Utilities | | | 6,862 | |
| | 489 | | | NRG Energy, Inc. ● | | | 8,858 | |
| | 651 | | | UGI Corp. | | | 19,142 | |
| | 332 | | | Wisconsin Energy Corp. | | | 11,613 | |
| | | | | | | | 46,475 | |
| | | | | Total common stocks | | | | |
| | | | | (cost $1,223,346) | | $ | 1,271,024 | |
| | | | | | | | | |
| | | | | Total long-term investments
(cost $1,223,346) | | $ | 1,271,024 | |
| | | | | | | | | |
| SHORT-TERM INVESTMENTS - 0.8% | | | | |
| Repurchase Agreements - 0.8% | | | | |
| | | | | Bank of America Merrill Lynch TriParty Joint
Repurchase Agreement (maturing on
01/03/2012 in the amount of $4,019,
collateralized by GNMA 4.50%, 2041,
value of $4,099) | | | | |
| $ | 4,019 | | | 0.04%, 12/30/2011 | | $ | 4,019 | |
| | | | | Barclays Capital TriParty Joint Repurchase
Agreement (maturing on 01/03/2012 in the
amount of $334, collateralized by U.S.
Treasury Bond 5.38%, 2031, value of
$341) | | | | |
| | 334 | | | 0.01%, 12/30/2011 | | | 334 | |
| | | | | Deutsche Bank Securities TriParty Joint
Repurchase Agreement (maturing on
01/03/2012 in the amount of $4,458,
collateralized by GNMA 3.50% - 7.00%,
2035 - 2046, value of $4,547) | | | | |
| | 4,457 | | | 0.06%, 12/30/2011 | | | 4,457 | |
| | | | | UBS Securities, Inc. Joint Repurchase
Agreement (maturing on 01/03/2012 in the
amount of $34, collateralized by U.S.
Treasury Note 2.75%, 2016, value of $35) | | | | |
| | 34 | | | 0.01%, 12/30/2011 | | | 34 | |
| | | | UBS Securities, Inc. TriParty Joint
Repurchase Agreement (maturing on
01/03/2012 in the amount of $1,725,
collateralized by FNMA 3.00% - 6.50%,
2021 - 2041, value of $1,759) | | | |
| 1,725 | | | 0.04%, 12/30/2011 | | $ | 1,725 | |
| | | | | | | | 10,569 | |
| | | | | Total short-term investments | | | | |
| | | | | (cost $10,569) | | $ | 10,569 | |
| | | | | | | | | |
| Total investments | | | | | | | | |
| (cost $1,233,915) ▲ | | | 99.9 | % | | $ | 1,281,593 | |
| Other assets and liabilities | | | 0.1 | % | | | 852 | |
| Total net assets | | | 100.0 | % | | $ | 1,282,445 | |
The accompanying notes are an integral part of these financial statements.
Note: | Percentage of investments as shown is the ratio of the total market value to total net assets. Market value of long-term investments in foreign securities represents 2.8% of total net assets at December 31, 2011. |
| | |
| | Prices of foreign equities that are principally traded on certain foreign markets may be adjusted daily pursuant to a fair value pricing service approved by the Board of Directors in order to reflect an adjustment for factors occurring after the close of certain foreign markets but before the close of the New York Stock Exchange. |
| |
| ▲ | At December 31, 2011, the cost of securities for federal income tax purposes was $1,256,402 and the aggregate gross unrealized appreciation and depreciation based on that cost were: |
| | Unrealized Appreciation | | $ | 134,812 | |
| | Unrealized Depreciation | | | (109,621 | ) |
| | Net Unrealized Appreciation | | $ | 25,191 | |
| ╪ | See Significant Accounting Policies of accompanying Notes to Financial Statements regarding valuation of securities. |
| |
The accompanying notes are an integral part of these financial statements.
Hartford MidCap HLS Fund
Investment Valuation Hierarchy Level Summary
December 31, 2011
(000’s Omitted)
| | | Total | | | Level 1 ♦ | | | Level 2 ♦ | | | Level 3 | |
| Assets: | | | | | | | | | | | | | | | | |
| Common Stocks ‡ | | $ | 1,271,024 | | | $ | 1,271,024 | | | $ | — | | | $ | — | |
| Short-Term Investments | | | 10,569 | | | | — | | | | 10,569 | | | | — | |
| Total | | $ | 1,281,593 | | | $ | 1,271,024 | | | $ | 10,569 | | | $ | — | |
| ♦ | For the year ended December 31, 2011, there were no significant transfers between Level 1 and Level 2. |
| ‡ | The Fund has all or primarily all of the equity securities categorized in a particular level. Refer to the Schedule of Investments for further industry breakout. |
The accompanying notes are an integral part of these financial statements.
Hartford MidCap HLS Fund
Statement of Assets and Liabilities
December 31, 2011
(000’s Omitted)
| Assets: | | | | |
| Investments in securities, at market value (cost $1,233,915) | | $ | 1,281,593 | |
| Cash | | | — | |
| Receivables: | | | | |
| Investment securities sold | | | 171 | |
| Fund shares sold | | | 1,067 | |
| Dividends and interest | | | 1,205 | |
| Total assets | | | 1,284,036 | |
| Liabilities: | | | | |
| Payables: | | | | |
| Fund shares redeemed | | | 1,325 | |
| Investment management fees | | | 196 | |
| Distribution fees | | | 4 | |
| Accrued expenses | | | 66 | |
| Total liabilities | | | 1,591 | |
| Net assets | | $ | 1,282,445 | |
| Summary of Net Assets: | | | | |
| Capital stock and paid-in-capital | | $ | 1,316,720 | |
| Undistributed net investment income | | | 896 | |
| Accumulated net realized loss | | | (82,849 | ) |
| Unrealized appreciation of investments and the translations of assets and liabilities denominated in foreign currency | | | 47,678 | |
| Net assets | | $ | 1,282,445 | |
| Shares authorized | | | 2,400,000 | |
| Par value | | $ | 0.001 | |
| Class IA: Net asset value per share | | $ | 23.77 | |
| Shares outstanding | | | 51,009 | |
| Net assets | | $ | 1,212,257 | |
| Class IB: Net asset value per share | | $ | 23.59 | |
| Shares outstanding | | | 2,975 | |
| Net assets | | $ | 70,188 | |
The accompanying notes are an integral part of these financial statements.
Hartford MidCap HLS Fund
Statement of Operations
For the Year Ended December 31, 2011
(000’s Omitted)
| Investment Income: | | | | |
| Dividends | | $ | 19,821 | |
| Interest | | | 17 | |
| Less: Foreign tax withheld | | | (12 | ) |
| Total investment income, net | | | 19,826 | |
| | | | | |
| Expenses: | | | | |
| Investment management fees | | | 11,384 | |
| Transfer agent fees | | | 5 | |
| Distribution fees - Class IB | | | 242 | |
| Custodian fees | | | 12 | |
| Accounting services fees | | | 202 | |
| Board of Directors' fees | | | 40 | |
| Audit fees | | | 19 | |
| Other expenses | | | 224 | |
| Total expenses (before fees paid indirectly) | | | 12,128 | |
| Commission recapture | | | (65 | ) |
| Total fees paid indirectly | | | (65 | ) |
| Total expenses, net | | | 12,063 | |
| Net investment income | | | 7,763 | |
| | | | | |
| Net Realized Gain on Investments, Other Financial Instruments and Foreign Currency Transactions: | | | | |
| Net realized gain on investments | | | 233,318 | |
| Net realized gain on futures | | | 3,567 | |
| Net realized gain on foreign currency contracts | | | 29 | |
| Net realized loss on other foreign currency transactions | | | (30 | ) |
| Net Realized Gain on Investments, Other Financial Instruments and Foreign Currency Transactions | | | 236,884 | |
| | | | | |
| Net Changes in Unrealized Depreciation of Investments and Foreign Currency Transactions: | | | | |
| Net unrealized depreciation of investments | | | (382,149 | ) |
| Net unrealized appreciation on translation of other assets and liabilities in foreign currencies | | | — | |
| Net Changes in Unrealized Depreciation of Investments and Foreign Currency Transactions | | | (382,149 | ) |
| Net Loss on Investments, Other Financial Instruments and Foreign Currency Transactions | | | (145,265 | ) |
| Net Decrease in Net Assets Resulting from Operations | | $ | (137,502 | ) |
The accompanying notes are an integral part of these financial statements.
Hartford MidCap HLS Fund
Statement of Changes in Net Assets
(000’s Omitted)
| | | For the
Year Ended
December 31, 2011 | | | For the
Year Ended
December 31, 2010 | |
| Operations: | | | | | | | | |
| Net investment income | | $ | 7,763 | | | $ | 7,034 | |
| Net realized gain on investments, other financial instruments and foreign currency transactions | | | 236,884 | | | | 165,120 | |
| Net unrealized appreciation (depreciation) of investments | | | (382,149 | ) | | | 197,571 | |
| Net Increase (Decrease) In Net Assets Resulting From Operations | | | (137,502 | ) | | | 369,725 | |
| Distributions to Shareholders: | | | | | | | | |
| From net investment income | | | | | | | | |
| Class IA | | | (10,115 | ) | | | (3,951 | ) |
| Class IB | | | (147 | ) | | | (69 | ) |
| Total distributions | | | (10,262 | ) | | | (4,020 | ) |
| Capital Share Transactions: | | | | | | | | |
| Class IA | | | | | | | | |
| Sold | | | 178,223 | | | | 180,263 | |
| Issued on reinvestment of distributions | | | 10,115 | | | | 3,951 | |
| Redeemed | | | (554,640 | ) | | | (288,847 | ) |
| Total capital share transactions | | | (366,302 | ) | | | (104,633 | ) |
| Class IB | | | | | | | | |
| Sold | | | 16,499 | | | | 21,429 | |
| Issued on reinvestment of distributions | | | 147 | | | | 69 | |
| Redeemed | | | (66,782 | ) | | | (99,980 | ) |
| Total capital share transactions | | | (50,136 | ) | | | (78,482 | ) |
| Net decrease from capital share transactions | | | (416,438 | ) | | | (183,115 | ) |
| Net Increase (Decrease) In Net Assets | | | (564,202 | ) | | | 182,590 | |
| Net Assets: | | | | | | | | |
| Beginning of period | | | 1,846,647 | | | | 1,664,057 | |
| End of period | | $ | 1,282,445 | | | $ | 1,846,647 | |
| Undistributed (distribution in excess of) | | | | | | | | |
| net investment income | | $ | 896 | | | $ | 3,742 | |
| Shares: | | | | | | | | |
| Class IA | | | | | | | | |
| Sold | | | 6,643 | | | | 7,950 | |
| Issued on reinvestment of distributions | | | 433 | | | | 161 | |
| Redeemed | | | (22,270 | ) | | | (12,489 | ) |
| Total share activity | | | (15,194 | ) | | | (4,378 | ) |
| Class IB | | | | | | | | |
| Sold | | | 621 | | | | 953 | |
| Issued on reinvestment of distributions | | | 6 | | | | 3 | |
| Redeemed | | | (2,487 | ) | | | (4,402 | ) |
| Total share activity | | | (1,860 | ) | | | (3,446 | ) |
The accompanying notes are an integral part of these financial statements.
Hartford MidCap HLS Fund
Notes to Financial Statements
December 31, 2011
(000’s Omitted)
Hartford MidCap HLS Fund (the “Fund”) serves as an underlying investment option for certain variable annuity and variable life insurance separate accounts of Hartford Life Insurance Company (“HLIC”) and its affiliates and certain qualified retirement plans. The Fund may also serve as an underlying investment option for certain variable annuity and variable life separate accounts of other insurance companies. Owners of variable annuity contracts and policyholders of variable life insurance contracts may choose the funds permitted in the variable insurance contract prospectus. In addition, participants in certain qualified retirement plans may choose the Fund if permitted by their plans.
Hartford Series Fund, Inc. (the “Company”) is an open-end registered management investment company comprised of thirty portfolios. Financial Statements for the Fund, a series of the Company, are included in this report.
The Company is organized under the laws of the State of Maryland and is registered with the Securities and Exchange Commission (“SEC”) under the Investment Company Act of 1940, as amended (“1940 Act”). The Fund is a diversified open-end management investment company.
The Fund is divided into Class IA and Class IB shares. Each class is offered at the per share net asset value (“NAV”) without a sales charge and is subject to the same expenses, except that the Class IB shares are subject to distribution and service fees charged pursuant to a Distribution Plan adopted in accordance with Rule 12b-1 under the 1940 Act.
| 2. | Significant Accounting Policies: |
The following is a summary of significant accounting policies of the Fund in the preparation of its financial statements, which are in accordance with the United States Generally Accepted Accounting Principles (“U.S. GAAP”). The preparation of financial statements in accordance with U.S. GAAP may require management to make estimates and assumptions that affect the reported amounts of assets and liabilities and disclosure of contingent assets and liabilities at the date of the financial statements and the reported amounts of increases and decreases in net assets from operations during the reporting period. Actual results could differ from those estimates.
| a) | Determination of Net Asset Value – The NAV of each class of the Fund’s shares is determined as of the close of regular trading (normally 4:00 p.m. Eastern Time) (the “NYSE Close”) on each day that the New York Stock Exchange (the “Exchange”) is open (“Valuation Date”). Information that becomes known to the Fund after the NAV has been calculated on a particular day will not generally be used to retroactively adjust the NAV determined earlier that day. |
| b) | Investment Valuation and Fair Value Measurements – For purposes of calculating the NAV, portfolio securities and other assets held by the Fund's portfolio for which market quotes are readily available are valued at market value. Market value is generally determined on the basis of last reported sales prices or official close price. If no sales are reported, market value is based on quotes obtained from a quotation reporting system, established market makers, or independent pricing services. If market prices are not readily available or are deemed unreliable, the Fund will use the fair value of the security as determined in good faith under policies and procedures established by and under the supervision of the Company’s Board of Directors. Market quotes are considered not readily available where there is an absence of current or reliable market-based data (e.g., trade information or broker quotes), including where events occur after the close of the relevant market, but prior to the NYSE Close that materially affect the values of the Fund’s portfolio securities or assets. In addition, market quotes are considered not readily available when, due to extraordinary circumstances, the exchanges or markets on which the securities trade do not open for trading for the entire day and no other market prices are available. In addition, prices of foreign equities that are principally traded on certain foreign markets are adjusted daily pursuant to a fair value pricing service approved by the Board of Directors in order to reflect an adjustment for the factors occurring after the close of certain foreign markets but before the NYSE Close. Securities that are primarily traded on foreign markets may trade on days that are not business days of the Fund. The value of the foreign securities in |
which the Fund invests may change on days when a shareholder will not be able to purchase or redeem shares of the Fund. Fair value pricing is subjective in nature and the use of fair value pricing by the Fund may cause the NAV of its shares to differ significantly from the NAV that would have been calculated using market prices at the close of the exchange on which a portfolio security is primarily traded. There can be no assurance that the Fund could obtain the fair market value assigned to a security if the Fund were to sell the security at approximately the time at which the Fund determines its NAV.
Exchange traded options, futures and options on futures are valued at the settlement price determined by the relevant exchange as of the NYSE Close. If such instruments do not trade on an exchange, values may be supplied by an independent pricing service using a formula or other objective method that may take into consideration the style, direction, expiration, strike price, notional value and volatility or other adjustments.
Investments valued in currencies other than U.S. dollars are converted to U.S. dollars using exchange rates obtained from independent pricing services for calculation of the NAV. As a result, the NAV of the Fund’s shares may be affected by changes in the value of currencies in relation to the U.S. dollar. The value of securities traded in markets outside the United States or denominated in currencies other than the U.S. dollar may be affected significantly on a day that the NYSE is closed and the market value may change on days when an investor is not able to purchase, redeem or exchange shares of the Fund.
Foreign currency contracts represent agreements to exchange currencies on specific future dates at predetermined rates. Foreign currency contracts are valued using foreign currency exchange rates and forward rates as provided by an independent pricing service on the Valuation Date.
Financial instruments for which prices are not available from an independent pricing service may be valued using market quotations obtained from one or more dealers that make markets in the respective financial instrument in accordance with procedures established by the Company’s Board of Directors.
U.S. GAAP defines fair value as the price that the Fund would receive to sell an asset or pay to transfer a liability in an orderly transaction between market participants. The U.S. GAAP fair value measurement standards require disclosure of a fair value hierarchy for each major category of assets and liabilities. Various inputs are used in determining the fair value of the Fund’s investments. These inputs are summarized into three broad hierarchy levels. This hierarchy is based on whether the valuation inputs are observable or unobservable. These levels are:
| · | Level 1 – Quoted prices in active markets for identical securities. Level 1 may include exchange traded instruments, such as domestic equities, some foreign equities, options, futures, mutual funds, exchange traded funds, rights and warrants. |
| · | Level 2 – Observable inputs other than Level 1 prices, such as quoted prices for similar securities; quoted prices in markets that are not active; or other inputs that are observable or can be corroborated by observable market data. Level 2 may include debt securities that are traded less frequently than exchange traded instruments and which are valued using independent pricing services; foreign equities, that are principally traded on certain foreign markets and are adjusted daily pursuant to a fair value pricing service in order to reflect an adjustment for the factors occurring after the close of certain foreign markets but before the NYSE Close; and short-term securities, which are valued at amortized cost. |
| · | Level 3 – Significant unobservable inputs that are supported by limited or no market activity. Level 3 may include financial instruments whose values are determined using broker quotes or require significant management judgment or estimation. These unobservable valuation inputs may include estimates for current yields, maturity/duration, prepayment speed, and broker quotes for comparable securities along with other assumptions relating to credit quality, collateral value, complexity of the security structure, general market conditions and liquidity. This category may include securities where trading has been halted or there are certain restrictions on trading. While these securities are priced using unobservable inputs, the valuation of these |
Hartford MidCap HLS Fund
Notes to Financial Statements – (continued)
December 31, 2011
(000’s Omitted)
securities reflects the best available data and management believes the prices are a reasonable representation of exit price.
Valuation levels are not necessarily indicative of the risk associated with investing in such securities. Individual securities within any of the above mentioned asset classes may be assigned a different hierarchical level than those presented above, as individual circumstances dictate.
During the year ended December 31, 2011, the Fund held no Level 3 securities; therefore, no reconciliation of Level 3 securities is presented.
For additional information, refer to the Investment Valuation Hierarchy Level Summary which follows the Schedule of Investments.
For purposes of reporting transfers between different hierarchy levels, both transfers in and out of each level, as applicable, are shown as if they occurred at the beginning of the period.
| c) | Security Transactions and Investment Income – Security transactions are recorded as of the trade date (the date the order to buy or sell is executed) for financial reporting purposes. Securities purchased or sold on a when-issued or delayed-delivery basis may be settled a month or more after the trade date. Realized gains and losses are determined on the basis of identified cost. |
Dividend income is accrued as of the ex-dividend date, except certain dividends from foreign securities where the ex-dividend date may have passed are recorded as soon as the Fund is informed of the dividend. Interest income, including amortization of premium and accretion of discounts, is accrued on a daily basis.
| d) | Foreign Currency Transactions – Assets and liabilities denominated in currencies other than U.S. dollars are translated into U.S. dollars at the exchange rates in effect on the valuation date. Purchases and sales of investment securities, income, and expenses are translated into U.S. dollars at the exchange rates on the dates of such transactions. |
The Fund does not isolate that portion of portfolio security valuation resulting from fluctuations in the foreign currency exchange rates from the fluctuations arising from changes in the market prices of securities held. Exchange rate fluctuations are included with the net realized and unrealized gain or loss on investments in the accompanying financial statements.
Net realized foreign exchange gains or losses arise from sales of foreign currencies and the difference between asset and liability amounts initially stated in foreign currencies and the U.S. dollar value of the amounts actually received or paid. Net unrealized foreign exchange gains or losses arise from changes in the value of other assets and liabilities at the end of the reporting period, resulting from changes in the exchange rates.
| e) | Joint Trading Account – The Fund may invest cash balances into a joint trading account that may be invested in one or more repurchase agreements. |
| f) | Fund Share Valuation and Dividend Distributions to Shareholders – Orders for the Fund’s shares are executed in accordance with the investment instructions of the contract holders and plan participants. The NAV of the Fund’s shares is determined as of the close of business on each business day of the Exchange. The NAV is determined separately for each class of shares of the Fund by dividing the Fund’s net assets attributable to that class by the number of shares of the class outstanding. Each class of shares offered by the Fund has equal rights as to assets and voting privileges (except that shareholders of a class have exclusive voting rights regarding any matter relating solely to that class of shares). Income and non-class specific expenses are allocated daily to each class on the basis of the relative net assets of the class. Realized and unrealized capital gains and losses are allocated daily based on the relative net assets of each class of shares of the Fund. |
Orders for the purchase of the Fund’s shares received prior to the close of the Exchange on any day the Exchange is open for business are priced at the NAV determined as of the close of the Exchange. Orders received after the close of the Exchange, or on a day on which the Exchange and/or the Fund is not open for business, are priced at the next determined NAV.
Dividends are declared pursuant to a policy adopted by the Company’s Board of Directors based upon the investment performance of the Fund. The policy of the Fund is to pay dividends from net investment income and realized capital gains, if any, at least once a year.
Distributions from net investment income, net realized capital gains and capital are determined in accordance with federal income tax regulations, which may differ from U.S. GAAP with respect to character and timing. These differences may include but are not limited to losses deferred due to wash sale adjustments, foreign currency gains and losses, adjustments related to Passive Foreign Investment Companies (“PFICs”), Real Estate Investment Trusts (“REITs”), Regulated Investment Companies (“RICs”), certain derivatives and partnerships. Permanent book and federal income tax basis differences relating to shareholder distributions will result in reclassifications to certain of the Fund’s capital accounts (see Federal Income Taxes: Reclassification of Capital Accounts note).
| 3. | Securities and Other Investments: |
| a) | Repurchase Agreements – A repurchase agreement is an agreement by which a counterparty agrees to sell a security and agrees to repurchase the security sold at a mutually agreed upon time and price. At the time the Fund enters into a repurchase agreement, the value of the underlying collateral security(ies), including accrued interest, will be equal to or exceed the value of the repurchase agreement. Repurchase agreements expose the Fund to counterparty risk. To minimize counterparty risk, the securities that serve to collateralize the repurchase agreement are held by the Fund's custodian in book entry or physical form in the custodial account of the Fund or in a third party custodial account. Repurchase agreements are valued at cost plus accrued interest. The Fund, as shown on the Schedule of Investments, had outstanding repurchase agreements as of December 31, 2011. |
| b) | Illiquid and Restricted Securities – The Fund is permitted to invest up to 15% of its net assets in illiquid securities. Illiquid securities are those that may not be sold or disposed of in the ordinary course of business within seven days, at approximately the price used to determine the Fund’s NAV. The Fund may not be able to sell illiquid securities or other investments when its sub-adviser considers it desirable to do so or may have to sell such securities or investments at a price that is lower than the price that could be obtained if the securities or investments were more liquid. A sale of illiquid securities or other investments may require more time and may result in higher dealer discounts and other selling expenses than does the sale of those that are liquid. Illiquid securities and investments also may be more difficult to value due to the unavailability of reliable market quotations for such securities or investments, and an investment in them may have an adverse impact on the Fund’s NAV. The Fund may also purchase certain restricted securities that can only be resold to certain qualified investors and may be determined to be liquid pursuant to policies and guidelines established by the Company’s Board of Directors. The Fund had no illiquid or restricted securities as of December 31, 2011. |
| b) | Securities Purchased on a When-Issued or Delayed-Delivery Basis – Delivery and payment for securities that have been purchased by the Fund on a forward commitment, or when-issued or delayed-delivery basis, take place beyond the customary settlement period. A fund may dispose of or renegotiate a delayed-delivery transaction after it is entered into, and may sell delayed-delivery securities before they are delivered, which may result in a realized gain or loss. During this period, such securities are subject to market fluctuations, and the Fund identifies securities segregated in its records with value at least equal to the amount of the commitment. As of December 31, 2011, the Fund had no outstanding when-issued or delayed delivery securities. |
Hartford MidCap HLS Fund
Notes to Financial Statements – (continued)
December 31, 2011
(000’s Omitted)
| 4. | Financial Derivative Instruments: |
The following disclosures contain information on how and why the Fund uses derivative instruments, the credit-risk-related contingent features in certain derivative instruments, and how derivative instruments affect the Fund’s financial position and results of operations. The location and fair value amounts of these instruments on the Statement of Assets and Liabilities and the realized gains and losses and changes in unrealized gains and losses on the Statement of Operations, each categorized by type of derivative contract, are included in the following Additional Derivative Instrument Information footnote. The derivative instruments outstanding as of period-end are disclosed in the notes to the Schedule of Investments and the amounts of realized gains and losses and changes in unrealized gains and losses on derivative instruments during the period are disclosed in the Statement of Operations.
| a) | Foreign Currency Contracts – The Fund may enter into foreign currency contracts that obligate the Fund to purchase or sell currencies at specified future dates. Foreign currency contracts are used to hedge the currency exposure associated with some or all of the Fund's securities and/or as part of an investment strategy. Foreign currency contracts are marked to market daily and the change in value is recorded by the Fund as an unrealized gain or loss. The Fund will record a realized gain or loss when the foreign currency contract is settled. |
Foreign currency contracts involve elements of market risk in excess of the amounts reflected in the Statement of Assets and Liabilities. In addition, risks may arise upon entering into these contracts from the potential inability of the counterparties to meet the terms of the contracts and from unanticipated movements in the value of the foreign currencies relative to the U.S. dollar. The Fund had no outstanding foreign currency contracts as of December 31, 2011.
| b) | Futures Contracts – The Fund may enter into futures contracts. A futures contract is an agreement between two parties to buy or sell an asset at a set price on a future date. The Fund uses futures contracts to manage or obtain exposure to the securities markets, commodities, or movements in interest rates and currency values. The primary risks associated with the use of futures contracts are the imperfect correlation between the change in market value of the securities held by the Fund and the prices of futures contracts and the possibility of an illiquid market. Upon entering into a futures contract, the Fund is required to deposit with a futures commission merchant (“FCM”) an amount of cash or U.S. Government or Agency Obligations in accordance with the initial margin requirements of the broker or exchange. Futures contracts are marked to market daily at the most recent settlement price reported by an exchange on which, over time, they are traded most extensively, and an appropriate payable or receivable for the change in value (“variation margin”) is recorded by the Fund. Gains or losses are recognized but not considered realized until the contracts expire or are closed. Futures contracts involve, to varying degrees, risk of loss in excess of the variation margin disclosed on the Statement of Assets and Liabilities; however, this risk is reduced through the use of an FCM. As of December 31, 2011, the Fund had no outstanding futures contracts. |
| b) | Additional Derivative Instrument Information: |
The volume of derivative activity was minimal during the year ended December 31, 2011.
| The Effect of Derivative Instruments on the Statement of Operations for the year ended December 31, 2011: |
| | | | Risk Exposure Category | |
| | | | Interest Rate Contracts | | | Foreign Exchange Contracts | | | Credit
Contracts | | | Equity
Contracts | | | Commodity
Contracts | | | Other
Contracts | | | Total | |
| | Realized Gain (Loss) on Derivatives Recognized as a Result of Operations: |
| | Net realized gain on futures | | $ | — | | | $ | — | | | $ | — | | | $ | 3,567 | | | $ | — | | | $ | — | | | $ | 3,567 | |
| | Net realized gain on foreign currency contracts | | | — | | | | 29 | | | | — | | | | — | | | | — | | | | — | | | | 29 | |
| | Total | | $ | — | | | $ | 29 | | | $ | — | | | $ | 3,567 | | | $ | — | | | $ | — | | | $ | 3,596 | |
| a) | Counterparty Risk – The Fund may be exposed to counterparty risk, or the risk that an institution or other entity with which the Fund has unsettled or open transactions will default. |
| b) | Market Risks – If the Fund invests directly in foreign currencies or in securities that trade in, and receive revenues in, foreign currencies, or in derivatives that provide exposure to foreign currencies, it will be subject to the risk that those currencies will decline in value relative to the base currency of the Fund, or, in the case of hedging positions, that the Fund’s base currency will decline in value relative to the currency being hedged. Currency rates in foreign countries may fluctuate significantly over short periods of time for a number of reasons, including changes in interest rates, intervention (or the failure to intervene) by U.S. or foreign governments, central banks or supranational entities, such as the International Monetary Fund, or by the imposition of currency controls or other political developments in the United States or abroad. As a result, the Fund’s investments in foreign currency denominated securities may reduce the returns of the Fund. The market values of equity securities, such as common stocks and preferred stocks, or equity related investments, such as futures and options, may decline due to general market conditions which are not specifically related to a particular company, such as real or perceived adverse economic conditions, changes in the general outlook for corporate earnings, changes in interest or currency rates or adverse investor sentiment generally. The market value of equity securities may also decline due to factors which affect a particular industry or industries, such as labor shortages or increased production costs and competitive conditions within an industry. Equity securities and equity related investments generally have greater market price volatility than fixed income securities. |
| a) | Federal Income Taxes – For federal income tax purposes, the Fund intends to continue to qualify as a RIC under Subchapter M of the Internal Revenue Code (“IRC”) by distributing substantially all of its taxable net investment income and net realized capital gains to its shareholders and otherwise complying with the requirements of RICs. The Fund has distributed substantially all of its income and capital gains in prior years, if applicable, and intends to distribute substantially all of its income and capital gains prior to the next fiscal year-end. Accordingly, no provision for federal income or excise taxes has been made in the accompanying financial statements. Distributions from short-term capital gains are treated as ordinary income distributions for federal income tax purposes. |
| b) | Net Investment Income (Loss), Net Realized Gains (Losses) – Net investment income (loss) and net realized gains (losses) may differ for financial statement and tax purposes primarily because of losses deferred due to wash sale adjustments, foreign currency gains and losses, adjustments related to PFICs, REITs, RICs, certain derivatives and partnerships. The character of distributions made during the year from net investment income or net realized gains may differ from their ultimate characterization for federal income tax purposes. Also, due to the timing of dividend distributions, the fiscal year in which amounts are distributed may differ from the year that the income or realized gains (losses) were recorded by the Fund. |
| c) | Distributions and Components of Distributable Earnings – The tax character of distributions paid by the Fund for the periods indicated is as follows (as adjusted for dividends payable): |
| | | For the Year Ended
December 31, 2011 | | | For the Year Ended
December 31, 2010 | |
| Ordinary Income | | $ | 10,262 | | | $ | 4,020 | |
| | | | | | | | | |
Hartford MidCap HLS Fund
Notes to Financial Statements – (continued)
December 31, 2011
(000’s Omitted)
As of December 31, 2011, the Fund’s components of distributable earnings (deficit) on a tax basis were as follows:
| | | Amount | |
| Undistributed Ordinary Income | | $ | 896 | |
| Accumulated Capital and Other Losses* | | | (60,362 | ) |
| Unrealized Appreciation† | | | 25,191 | |
| Total Accumulated Deficit | | $ | (34,275 | ) |
| | | | | |
| | * | The Fund has capital loss carryforwards that are identified in the Capital Loss Carryforward note that follows. |
| | † | The difference between book-basis and tax-basis unrealized appreciation (depreciation) may be attributable to the losses deferred due to wash sale adjustments, foreign currency gains and losses, adjustments related to PFICs, REITs, RICs, certain derivatives and partnerships. |
| d) | Reclassification of Capital Accounts – The Fund may record reclassifications in its capital accounts. These reclassifications have no impact on the total net assets of the Fund. The reclassifications are a result of permanent differences between U.S. GAAP and tax accounting for such items as foreign currency, PFICs, expiration or utilization of capital loss carryforwards or net operating losses. Adjustments are made to reflect the impact these items have on current and future distributions to shareholders. Therefore, the source of the Fund’s distributions may be shown in the accompanying Statement of Changes in Net Assets as from undistributed net investment income, from accumulated net realized gains on investments or from capital depending on the type of book and tax differences that exist. For the year ended December 31, 2011, the Fund recorded reclassifications to increase (decrease) the accounts listed below: |
| | | Amount | |
| Undistributed Net Investment Income | | $ | (347 | ) |
| Accumulated Net Realized Gain (Loss) | | | 347 | |
| | | | | |
| e) | Capital Loss Carryforward – On December 22, 2010, the Regulated Investment Company Modernization Act of 2010 (the “Act”) was enacted, which made changes to the capital loss carryforward rules. The changes are effective for taxable years beginning after the date of enactment. Under the Act, funds are permitted to carry forward capital losses for an unlimited period. However, any losses incurred during those future taxable years will be required to be utilized prior to the losses incurred in pre-enactment taxable years, which carry an expiration date. As a result of this ordering rule, pre-enactment capital loss carryforwards may be more likely to expire unused. Additionally, post-enactment capital loss carryforwards will retain their character as either short-term or long-term capital losses rather than being considered all short-term as permitted under prior regulation. |
At December 31, 2011 (tax-year-end), the Fund had capital loss carryforwards for U.S. federal income tax purposes as follows:
| Year of Expiration | | Amount | |
| 2017 | | $ | 60,362 | |
| Total | | $ | 60,362 | |
| | | | | |
| As of December 31, 2011, the Fund utilized $250,501 of prior year capital loss carryforwards. |
| f) | Accounting for Uncertainty in Income Taxes – The Fund has adopted financial reporting rules that require the Fund to analyze all open tax years, as defined by the statute of limitations, for all major jurisdictions. Generally, tax authorities can examine all tax returns filed for the last three years. The Fund does not have an examination in progress. |
The Fund has reviewed all open tax years and major jurisdictions and concluded that these financial reporting rules had no effect on the Fund’s financial position or results of operations. There is no tax liability resulting from unrecognized tax benefits relating to uncertain income tax positions taken or expected to be taken on the tax return for the fiscal year ended December 31, 2011. The Fund is also not aware of any tax positions for which it is reasonably possible that the total amounts of unrecognized tax benefits will significantly change in the next twelve months.
| a) | Investment Management Agreement – HL Investment Advisors, LLC (“HL Advisors”), an indirect wholly owned subsidiary of The Hartford Financial Services Group, Inc. (“The Hartford”), serves as investment manager to the Fund pursuant to an Investment Management Agreement with the Company. As investment manager, HL Advisors has overall investment supervisory responsibility for the Fund. In addition, HL Advisors provides administrative personnel, services, equipment, facilities and office space for proper operation of the Fund. HL Advisors has contracted with Wellington Management Company, LLP (“Wellington Management”) under a sub-advisory agreement for the provision of day-to-day investment management services to the Fund in accordance with the Fund’s investment objective and policies. The Fund pays a fee to HL Advisors, a portion of which may be used to compensate Wellington Management. |
The schedule below reflects the rates of compensation paid to HL Advisors for investment management services rendered as of December 31, 2011; the rates are accrued daily and paid monthly.
| Average Daily Net Assets | Annual Fee |
| On first $250 million | 0.7750% |
| On next $250 million | 0.7250% |
| On next $500 million | 0.6750% |
| On next $4 billion | 0.6250% |
| On next $5 billion | 0.6225% |
| Over $10 billion | 0.6200% |
| b) | Accounting Services Agreement – Pursuant to the Fund Accounting Agreement between HLIC and the Company, on behalf of the Fund, HLIC provides accounting services to the Fund and receives monthly compensation based on the Fund’s average daily net assets at the rates set forth below. The Fund’s accounting services fees are accrued daily and paid monthly. |
| Average Daily Net Assets | Annual Fee |
| On first $5 billion | 0.012% |
| Over $5 billion | 0.010% |
Effective January 1, 2012, the accounting services fees based on the Fund’s average daily net assets were decreased. The new accounting services fees schedule is as follows:
| Average Daily Net Assets | Annual Fee |
| All assets | 0.010% |
| c) | Operating Expenses – Allocable expenses incurred by the Company are allocated to each Fund and allocated to classes within a Fund in proportion to the average daily net assets of the Fund and each class, except where allocation of certain expenses is more fairly made directly to the Fund or to specific classes within a Fund. |
| d) | Fees Paid Indirectly – The Company, on behalf of the Fund, has entered into agreements with State Street Global Markets, LLC and Russell Implementation Services, Inc. to partially recapture non-discounted trade commissions. Such rebates are used to pay a portion of the Fund’s expenses. In addition, the Fund’s custodian bank has also agreed to reduce |
Hartford MidCap HLS Fund
Notes to Financial Statements – (continued)
December 31, 2011
(000’s Omitted)
its fees when the Fund maintains cash on deposit in a non-interest-bearing custody account. For the year ended December 31, 2011, these amounts, if any, are included in the Statement of Operations.
The ratio of expenses to average net assets in the accompanying financial highlights excludes the reduction in expenses related to fees paid indirectly. The annualized expense ratio for the period listed below reflecting the reduction for fees paid indirectly is as follows:
| | | Year Ended December 31, 2011 | |
| Class IA | | | 0.70 | % |
| Class IB | | | 0.95 | |
| | | | | |
| e) | Distribution Plan for Class IB shares – The Company, on behalf of the Fund, has adopted a Distribution Plan pursuant to Rule 12b-1 of the 1940 Act to compensate the Distributor, Hartford Securities Distribution Company, Inc. (a wholly owned, ultimate subsidiary of The Hartford), from assets attributable to the Class IB shares for services rendered and expenses borne in connection with activities primarily intended to result in the sale of the Class IB shares, subject to the review and approval of the Company’s Board of Directors. |
The Distribution Plan provides that the Fund may pay annually up to 0.25% of the average daily net assets of the Fund attributable to its Class IB shares for activities primarily intended to result in the sale of Class IB shares. The Board has the authority to suspend or reduce these payments at any point in time. Under the terms of the Distribution Plan and the principal underwriting agreement, the Fund is authorized to make payments monthly to the Distributor that may be used to pay or compensate entities providing distribution and shareholder servicing with respect to the Class IB shares for such entities’ fees or expenses incurred or paid in that regard. These fees are accrued daily and paid monthly.
| f) | Other Related Party Transactions – Certain officers of the Fund are directors and/or officers of HL Advisors and/or The Hartford or its subsidiaries. For the year ended December 31, 2011, a portion of the Fund’s chief compliance officer’s salary was paid by all the investment companies in the Hartford fund complex. The portion allocated to the Fund was in the amount of $2. Hartford Administrative Services Company (“HASCO”), an indirect wholly owned subsidiary of The Hartford, provides transfer agent services to the Fund. HASCO was compensated on a per account basis for providing such services. The amount paid to HASCO can be found in the Statement of Operations. These fees are accrued daily and paid monthly. |
| g) | Payment from Affiliate – In July of 2007, The Hartford entered into a settlement with the Attorneys General of the states of New York, Connecticut and Illinois relating to market timing and the company's individual variable annuity contracts in which certain payments would be made directly to the variable annuity contract holders. The distribution plan provided that unclaimed money from the settlement would be distributed to certain HLS Funds that are investment options through a Hartford individual variable annuity contract. The unclaimed money was distributed to the Fund on September 18, 2009. |
The total return in the accompanying financial highlights includes a payment from an affiliate. Had the payment from the affiliate been excluded, the impact and total return for the period listed below would have been as follows:
| | | For the Year Ended December 31, 2009 | |
| | | | Class IA | | | | Class IB | |
| Impact from Payment from Affiliate for Attorneys General Settlement | | | 0.03 | % | | | 0.03 | % |
| Total Return Excluding Payment from Affiliate | | | 30.92 | | | | 30.59 | |
| 8. | Investment Transactions: |
For the year ended December 31, 2011, the Fund's aggregate purchases and sales of investment securities (excluding short-term investments) were as follows:
| | | Amount | |
| Cost of Purchases Excluding U.S. Government Obligations | | $ | 1,140,718 | |
| Sales Proceeds Excluding U.S. Government Obligations | | | 1,559,323 | |
The Fund is one of several Hartford funds that participate in a $500 million committed revolving line of credit facility. The facility is to be used for temporary or emergency purposes. Under the arrangement, the funds are required to own securities having a market value in excess of 300% of the total bank borrowings. The interest rate on borrowings varies depending on the nature of the loan. The facility also requires a fee to be paid based on the amount of the commitment. This commitment fee is allocated to all of the funds participating in the line of credit based on the average net assets of the funds. During the year ended December 31, 2011, the Fund did not have any borrowings under this facility.
| 10. | Industry Classifications: |
Other than the industry classifications “Other Investment Pools and Funds” and “Exchange Traded Funds,” equity industry classifications used in this report are the Global Industry Classification Standard, which was developed by and is the exclusive property and service mark of MSCI, Inc. and Standard & Poor’s.
Under the Company’s organizational documents, the Company shall indemnify its officers and directors to the full extent required or permitted under Maryland General Corporation Law and the federal securities laws. In addition, the Company, on behalf of the Fund, may enter into contracts that contain a variety of indemnifications. The Company’s maximum exposure under these arrangements is unknown. However, as of the date of these financial statements, the Company has not had prior claims or losses pursuant to these contracts and expects the risk of loss to be remote.
Hartford MidCap HLS Fund
Financial Highlights
- Selected Per-Share Data (A) -
Class | Net Asset Value at
Beginning of Period | Net Investment Income (Loss) | Payments from (to) Affiliate | Net Realized and Unrealized Gain (Loss) on Investments | Total from Investment Operations | Dividends from Net Investment Income | Distributions from Realized Capital Gains | Distributions from Capital | Total Distributions | Net Increase (Decrease) in Net Asset Value | Net Asset Value at End of Period |
| For the Year Ended December 31, 2011 |
| IA | $ 26.01 | $ 0.15 | $ – | $ (2.20) | $ (2.05) | $ (0.19) | $ – | $ – | $ (0.19) | $ (2.24) | $ 23.77 |
| IB | 25.74 | 0.07 | – | (2.17) | (2.10) | (0.05) | – | – | (0.05) | (2.15) | 23.59 |
| For the Year Ended December 31, 2010 |
| IA | 21.12 | 0.10 | – | 4.85 | 4.95 | (0.06) | – | – | (0.06) | 4.89 | 26.01 |
| IB | 20.92 | 0.04 | – | 4.79 | 4.83 | (0.01) | – | – | (0.01) | 4.82 | 25.74 |
| For the Year Ended December 31, 2009 |
| IA | 16.21 | 0.11 | 0.01 | 4.89 | 5.01 | (0.10) | – | – | (0.10) | 4.91 | 21.12 |
| IB | 16.06 | 0.04 | 0.01 | 4.86 | 4.91 | (0.05) | – | – | (0.05) | 4.86 | 20.92 |
| For the Year Ended December 31, 2008 |
| IA | 26.34 | 0.12 | – | (9.03) | (8.91) | (0.12) | (1.10) | – | (1.22) | (10.13) | 16.21 |
| IB | 26.08 | 0.06 | – | (8.92) | (8.86) | (0.06) | (1.10) | – | (1.16) | (10.02) | 16.06 |
| For the Year Ended December 31, 2007(F) |
| IA | 26.99 | 0.06 | – | 3.99 | 4.05 | (0.15) | (4.55) | – | (4.70) | (0.65) | 26.34 |
| IB | 26.76 | (0.01) | – | 3.95 | 3.94 | (0.07) | (4.55) | – | (4.62) | (0.68) | 26.08 |
| | | | | | | | | | | | |
| (A) | Information presented relates to a share outstanding throughout the indicated period. |
| (B) | The figures do not include sales charges or other fees which may be applied at the variable life insurance, variable annuity or qualified retirement plan product level. Any such additional sales charges or other fees would lower the Fund's performance. |
| (C) | Ratios do not reflect reductions for fees paid indirectly. Please see Fees Paid Indirectly in the Notes to Financial Statements. |
| (D) | Portfolio turnover rate is calculated on the basis of the Fund as a whole without distinguishing between the classes of shares issued. |
| (E) | Total return without the inclusion of the Payment from (to) Affiliate can be found in Expenses in the accompanying Notes to Financial Statements. |
| (F) | Per share amounts have been calculated using the average shares method. |
- Ratios and Supplemental Data -
Total Return(B) | | Net Assets at End of Period | | | Ratio of Expenses to Average
Net Assets Before Waivers(C) | | | Ratio of Expenses to
Average Net Assets After
Waivers(C) | | | Ratio of Net Investment Income (Loss) to Average Net Assets | | | Portfolio Turnover Rate(D) | |
| |
| (7.92 | )% | $ | 1,212,257 | | | | 0.71 | % | | | 0.71 | % | | | 0.48 | % | | | 69 | % |
| (8.16 | ) | | 70,188 | | | | 0.96 | | | | 0.96 | | | | 0.18 | | | | – | |
|
| 23.45 | | | 1,722,182 | | | | 0.70 | | | | 0.70 | | | | 0.44 | | | | 52 | |
| 23.15 | | | 124,465 | | | | 0.95 | | | | 0.95 | | | | 0.12 | | | | – | |
|
| 30.96 | (E) | | 1,490,852 | | | | 0.72 | | | | 0.72 | | | | 0.48 | | | | 82 | |
| 30.62 | (E) | | 173,205 | | | | 0.97 | | | | 0.97 | | | | 0.23 | | | | – | |
|
| (35.32 | ) | | 1,552,741 | | | | 0.69 | | | | 0.69 | | | | 0.51 | | | | 92 | |
| (35.49 | ) | | 169,328 | | | | 0.94 | | | | 0.94 | | | | 0.26 | | | | – | |
|
| 15.30 | | | 2,716,285 | | | | 0.69 | | | | 0.69 | | | | 0.22 | | | | 79 | |
| 15.01 | | | 302,151 | | | | 0.94 | | | | 0.94 | | | | (0.03 | ) | | | – | |
| | | | | | | | | | | | | | | | | | | | | |
Report of Independent Registered Public Accounting Firm
The Board of Directors and Shareholders of
Hartford Series Fund, Inc.
We have audited the accompanying statement of assets and liabilities, including the schedule of investments, of Hartford MidCap HLS Fund (one of the portfolios constituting Hartford Series Fund, Inc. (the Funds)) as of December 31, 2011, and the related statement of operations for the year then ended, the statements of changes in net assets for each of the two years in the period then ended, and the financial highlights for each of the five years in the period then ended. These financial statements and financial highlights are the responsibility of the Funds’ management. Our responsibility is to express an opinion on these financial statements and financial highlights based on our audits.
We conducted our audits in accordance with the standards of the Public Company Accounting Oversight Board (United States). Those standards require that we plan and perform the audit to obtain reasonable assurance about whether the financial statements and financial highlights are free of material misstatement. We were not engaged to perform an audit of the Funds’ internal control over financial reporting. Our audits included consideration of internal control over financial reporting as a basis for designing audit procedures that are appropriate in the circumstances, but not for the purpose of expressing an opinion on the effectiveness of the Funds’ internal control over financial reporting. Accordingly, we express no such opinion. An audit also includes examining, on a test basis, evidence supporting the amounts and disclosures in the financial statements and financial highlights, assessing the accounting principles used and significant estimates made by management, and evaluating the overall financial statement presentation. Our procedures included confirmation of securities owned as of December 31, 2011, by correspondence with the custodian and brokers or by other appropriate auditing procedures where replies from brokers were not received. We believe that our audits provide a reasonable basis for our opinion.
In our opinion, the financial statements and financial highlights referred to above present fairly, in all material respects, the financial position of Hartford MidCap HLS Fund of Hartford Series Fund, Inc. at December 31, 2011, the results of its operations for the year then ended, the changes in its net assets for each of the two years in the period then ended, and the financial highlights for each of the five years in the period then ended, in conformity with U.S. generally accepted accounting principles.
Minneapolis, MN
February 13, 2012
Hartford MidCap HLS Fund
Directors and Officers (Unaudited)
The Board of Directors of the Company appoints officers who are responsible for the day-to-day operations of the Fund and who execute policies formulated by the Directors. Each director serves until his or her death, resignation, or retirement or until the next annual meeting of shareholders is held or until his or her successor is elected and qualifies.
Directors and officers who are employed by or who have a financial interest in The Hartford are considered “interested” persons of the Fund pursuant to the 1940 Act. Each officer and two of the Company’s directors, as noted in the chart below, are “interested” persons of the Fund. Each director serves as a director for The Hartford Mutual Funds, Inc., The Hartford Mutual Funds II, Inc., Hartford Series Fund, Inc., Hartford HLS Series Fund II, Inc., and as a trustee for The Hartford Alternative Strategies Fund, which, as of December 31, 2011, collectively consist of 91 funds. Correspondence may be sent to directors and officers c/o Hartford Mutual Funds, P.O. Box 2999, Hartford, Connecticut 06104-2999, except that correspondence to Ms. Fagely may be sent to 500 Bielenberg Drive, Woodbury, Minnesota 55125.
The table below sets forth, for each director and officer, his or her name, year of birth, current position with the Company and date first elected or appointed to Hartford Series Fund, Inc. (“HSF”), and Hartford HLS Series Fund II, Inc. (“HSF2”), principal occupation, and, for directors, other directorships held. The Fund’s statement of additional information contains further information on the directors and is available free of charge by calling 1-800-862-6668 or writing to Hartford HLS Funds, c/o Individual Annuity Services, P.O. Box 5085, Hartford, CT 06102-5085.
Information on the aggregate remuneration paid to the directors of the Company can be found in the Statement of Operations herein. The Fund pays to The Hartford a portion of the chief compliance officer’s compensation, but does not pay salaries or compensation to any of their other officers or directors who are employed by The Hartford.
Non-Interested Directors
Lynn S. Birdsong (1946) Director since 2003, Co-Chairman of the Investment Committee
Mr. Birdsong is a private investor. Mr. Birdsong currently serves as a Director of the Sovereign High Yield Investment Company (April 2010 to current). Mr. Birdsong currently serves as an Independent Director of Nomura Partners Funds, Inc. (formerly, The Japan Fund) (March 2003 to current). From 2003 to March 2005, Mr. Birdsong was an independent director of the Atlantic Whitehall Funds. From 1979 to 2002, Mr. Birdsong was a managing director of Zurich Scudder Investments, an investment management firm. During his employment with Scudder, Mr. Birdsong was an Interested Director of The Japan Fund. Since 1981, Mr. Birdsong has been a partner in Birdsong Company, an advertising specialty firm.
Robert M. Gavin, Jr. (1940) Director since 2002 (HSF) and 1986 (HSF2), Chairman of the Board since 2004
Dr. Gavin is an educational consultant. Prior to September 1, 2001, he was President of Cranbrook Education Community and prior to July 1996, he was President of Macalester College, St. Paul, Minnesota.
Duane E. Hill (1945) Director since 2001 (HSF) and 2002 (HSF2), Chairman of the Nominating Committee
Mr. Hill is Partner of TSG Ventures L.P., a private equity investment company. Mr. Hill is a former partner of TSG Capital Group, a private equity investment firm that served as sponsor and lead investor in leveraged buyouts of middle market companies.
Sandra S. Jaffee (1941) Director since 2005
Ms. Jaffee served as Chairman (2008 to 2009) and Chief Executive Officer of Fortent (formerly Searchspace Group), a leading provider of compliance/regulatory technology to financial institutions from August 2005 to August 2009. From August 2004 to August 2005, Ms. Jaffee served as an Entrepreneur in Residence with Warburg Pincus, a private equity firm. From September 1995 to July 2004, Ms. Jaffee served as Executive Vice President at Citigroup, where she was President and Chief Executive Officer of Citibank’s Global Securities Services (1995 to 2003). Ms. Jaffe currently serves as a member of the Board of Directors of Broadridge Financial Solutions as well as a Trustee of Muhlenberg College.
William P. Johnston (1944) Director since 2005, Chairman of the Compliance Committee
In June 2006, Mr. Johnston was appointed as Senior Advisor to The Carlyle Group, a global private equity investment firm. In August 2007, Mr. Johnston was elected to the Board of Directors of LifeCare Holdings, Inc. In February 2008, Mr. Johnston was elected to the Board of Directors of HCR-ManorCare, Inc. In May 2006, Mr. Johnston was elected to the Supervisory Board of Fresenius Medical Care AG & Co. KGaA, after its acquisition of Renal Care Group, Inc. in March 2006. Mr. Johnston joined Renal Care Group in November 2002 as a member of the Board of Directors and served as Chairman of the Board from March 2003 through March 2006. Mr. Johnston served as a Director of MultiPlan, Inc. from July 2006 through August 2010. From September 1987 to December 2002, Mr. Johnston was with Equitable Securities Corporation (and its successors, SunTrust Equitable Securities and SunTrust Robinson Humphrey) serving in various investment banking and managerial positions, including Managing Director and Head of Investment Banking, Chief Executive Officer and Vice Chairman.
Hartford MidCap HLS Fund
Directors and Officers (Unaudited) – (continued)
Phillip O. Peterson (1944) Director since 2002 (HSF) and 2000 (HSF2), Chairman of the Audit Committee
Mr. Peterson is a mutual fund industry consultant. He was a partner of KPMG LLP (an accounting firm) until July 1999. Mr. Peterson joined William Blair Funds in February 2007 as a member of the Board of Trustees. From January 2004 to April 2005, Mr. Peterson served as Independent President of the Strong Mutual Funds.
Lemma W. Senbet (1946) Director since 2005
Dr. Senbet is the William E. Mayer Chair Professor of Finance and Director, Center for Financial Policy, at the University of Maryland, Robert H. Smith School of Business. He was chair of the Finance Department from 1998 to 2006. Previously he was a chaired professor of finance at the University of Wisconsin-Madison. Also, he was director of the Fortis Funds from March 2000 to July 2002. Dr. Senbet served the finance profession in various capacities, including as director of the American Finance Association and President of the Western Finance Association. In 2006, Dr. Senbet was inducted Fellow of Financial Management Association International for his career-long distinguished scholarship and professional service.
Interested Directors and Officers
David N. Levenson (1966) Director since 2010
Mr. Levenson currently serves as President of The Hartford’s Wealth Management business. He was appointed to this role in July 2010. Previously, Mr. Levenson served as Executive Vice President of Legacy Holdings for The Hartford from June 2009 to July 2010. From 2006 to 2009, Mr. Levenson was with Hartford Life Insurance K.K. where he served as President and Chief Executive Officer from 2007 to 2009. He served as Managing Director of Hartford Investment Management Company from 2005 to 2006. Additionally, Mr. Levenson serves as Executive Vice President of The Hartford and as President, Director and Chief Executive Officer of Hartford Life Insurance Company (“HLIC”) and Hartford Life, Inc. (“HL Inc.”).
Lowndes A. Smith (1939) Director since 1996 (HSF) and 2002 (HSF2), Co-Chairman of the Investment Committee
Mr. Smith served as Vice Chairman of The Hartford from February 1997 to January 2002, as President and Chief Executive Officer of HL Inc. from February 1997 to January 2002, and as President and Chief Operating Officer of The Hartford Life Insurance Companies from January 1989 to January 2002. Mr. Smith serves as a Director of White Mountains Insurance Group, Ltd., One Beacon Insurance and Symetra Financial and as a Managing Director of Whittington Gray Associates.
Other Officers
James E. Davey (1964) President and Chief Executive Officer since 2010
Mr. Davey serves as Executive Vice President of HLIC. Additionally, Mr. Davey serves as President, Chief Executive Officer and Manager of Hartford Investment Financial Services, Inc. (“HIFSCO”) and President, Chief Executive Officer and Manager of HL Advisors. Mr. Davey joined The Hartford in 2002.
Michael R. Dressen (1963) AML Compliance Officer since 2011
Mr. Dressen currently serves as Assistant Vice President of HLIC. He also serves as Chief Compliance Officer and AML Compliance Officer of Hartford Administrative Services Company (“HASCO”) and as Assistant Secretary and Compliance Officer of HIFSCO. Mr Dressen joined The Hartford in 2005 from State Farm Insurance Companies where he held various positions related to mutual funds, variable products, and property casualty insurance.
Tamara L. Fagely (1958) Vice President, Treasurer and Controller since 2002 (HSF) and 1993 (HSF2)
Ms. Fagely has been a Vice President of HASCO since 1998 and Chief Financial Officer since 2006. Currently Ms. Fagely is a Vice President of HLIC. She served as Assistant Vice President of HLIC from December 2001 through March 2005. In addition, Ms. Fagely is Controller and Chief Financial Officer of HIFSCO.
Dr. Robert J. Froehlich (1953) Senior Managing Director since 2009
Dr. Froehlich joined The Hartford as Senior Managing Director in September 2009. Prior to joining The Hartford, Dr. Froehlich served as Vice Chairman of Deutsche Asset Management from 1997-2009.
Edward P. Macdonald (1967) Vice President, Secretary and Chief Legal Officer since 2005
Mr. Macdonald serves as Vice President of HLIC and Chief Legal Officer of Mutual Funds and Vice President of HIFSCO. He also serves as Vice President and Secretary of HASCO, and Chief Legal Officer, Secretary and Vice President of HL Advisors. Mr. Macdonald joined The Hartford in 2005.
Vernon J. Meyer (1964) Vice President since 2006
Mr. Meyer serves as Senior Vice President of HLIC. He also serves as Senior Vice President of HIFSCO and HL Advisors. Mr. Meyer joined The Hartford in 2004.
Colleen B. Pernerewski (1969) Vice President and Chief Compliance Officer since 2010
Ms. Pernerewski serves as Vice President and Chief Investment Advisor Compliance Officer of HIFSCO and as Vice President and Chief Compliance Officer of HL Advisors. Ms. Pernerewski joined The Hartford in 2005 from Travelers Life and Annuity where she served as Counsel (2004-2005). Prior to Travelers Life and Annuity, Ms. Pernerewski held the position of Counsel at The Hartford (1998-2004).
Elizabeth L. Schroeder (1966) Vice President since 2010
Ms. Schroeder currently serves as Assistant Vice President of HLIC. Ms. Schroeder joined HLIC in 1991. She is also an Assistant Vice President of HASCO, HIFSCO and HL Advisors.
Martin Swanson (1962) Vice President since 2010
Mr. Swanson is a Vice President of HLIC. Mr. Swanson also serves as Vice President/Marketing for HIFSCO. Prior to joining HLIC in 1998, Mr. Swanson was a Vice President at PaineWebber, Inc.
Jane Wolak (1961) Vice President since 2009
Ms. Wolak currently serves as Senior Vice President of HLIC. Ms. Wolak joined HLIC as Vice President, Retail Product Services in May 2007. She is also Vice President of HASCO. Previously, Ms. Wolak was with Sun Life Financial where she held the position of Vice President, Service Center Operations from 2001-2007.
HOW TO OBTAIN A COPY OF THE FUND’S PROXY VOTING POLICIES AND VOTING RECORDS (UNAUDITED)
A description of the policies and procedures that the Fund uses to determine how to vote proxies relating to portfolio securities and a record of how the Fund voted any proxies for the twelve-month period ended June 30, 2011 are available (1) without charge, upon request, by calling 800-862-6668 and (2) on the SEC’s website at http://www.sec.gov.
QUARTERLY PORTFOLIO HOLDINGS INFORMATION (UNAUDITED)
The Fund files a complete schedule of portfolio holdings with the SEC for the first and third quarters of each fiscal year on Form N-Q. The Fund’s Forms are available (1) without charge, upon request, by calling 800-862-6668 and (2) on the SEC’s website at http://www.sec.gov. The Form N-Q may be reviewed and copied at the SEC’s Public Reference Room in Washington, DC. Information on the operation of the Public Reference Room may be obtained by calling 1-800-SEC-0330.
Hartford MidCap HLS Fund
Expense Example (Unaudited)
Your Fund's Expenses
As a shareholder of the Fund, you incur two types of costs: (1) transaction costs and (2) ongoing costs including investment management fees, distribution fees, and other fund expenses. This example is intended to help you understand your ongoing costs (in dollars) of investing in the Fund and to compare these costs with the ongoing costs of investing in other mutual funds. The example is based on an investment of $1,000 invested at the beginning of the period and held for the period of June 30, 2011 through December 31, 2011.
Actual Expenses
The first set of columns of the table below provides information about actual account values and actual expenses. You may use the information in this column, together with the amount you invested, to estimate the expenses that you paid over the period. Simply divide your account value by $1,000 (for example, an $8,600 account value divided by $1,000 = 8.6), then multiply the result by the number in the line under the heading entitled “Expenses Paid During Period” to estimate the expenses you paid on your account during this period.
Hypothetical Example for Comparison Purposes
The second set of columns of the table below provides information about hypothetical account values and hypothetical expenses based on the Fund’s actual expense ratio and an assumed rate of return of 5% per year before expenses, which is not the Fund’s actual return. The hypothetical account values and expenses may not be used to estimate the actual ending account balance or expenses you paid for the period. You may use this information to compare the ongoing costs of investing in the Fund and other funds. To do so, compare this 5% hypothetical example with the 5% hypothetical examples that appear in the shareholder reports of the other funds.
Please note that the expenses shown in the table are meant to highlight your ongoing costs only and do not reflect any transactional costs, such as sales charges (loads) and CDSC. Therefore, the second set of columns of the table is useful in comparing ongoing costs only, and will not help you determine the relative total costs of owning different funds. In addition, if these transactional costs were included, your costs would be higher. Expenses are equal to the Fund's annualized expense ratios multiplied by average account value over the period, multiplied by 184/365 (to reflect the one-half year period).
| | Actual return | Hypothetical (5% return before expenses) | | | |
| | Beginning
Account Value
June 30, 2011 | Ending Account Value
December 31, 2011 | Expenses paid during the period
June 30, 2011
through
December 31, 2011 | Beginning
Account Value
June 30, 2011 | Ending Account Value
December 31, 2011 | Expenses paid during the period
June 30, 2011
through
December 31, 2011 | Annualized expense ratio | Days in the current 1/2 year | Days in the full year |
| Class IA | $1,000.00 | $861.05 | $3.38 | $1,000.00 | $1,021.58 | $3.67 | 0.72% | 184 | 365 |
| Class IB | $1,000.00 | $859.92 | $4.55 | $1,000.00 | $1,020.32 | $4.94 | 0.97% | 184 | 365 |
Hartford MidCap HLS Fund
Approval of Investment Management and Investment Sub-Advisory Agreements (Unaudited)
Section 15(c) of the Investment Company Act of 1940, as amended (the “1940 Act”), requires that each mutual fund’s board of directors, including a majority of those directors who are not “interested persons” of the mutual fund, as defined in the 1940 Act (the “Independent Directors”), annually review and consider the continuation of the mutual fund’s investment advisory and sub-advisory agreements. At its meeting held on August 2-3, 2011, the Board of Directors (the “Board”) of Hartford Series Fund, Inc., including each of the Independent Directors, unanimously voted to approve the continuation of the investment management agreement for Hartford MidCap HLS Fund (the “Fund”) with HL Investment Advisors, LLC (“HL Advisors”) and the continuation of the investment sub-advisory agreement between HL Advisors and the Fund’s sub-adviser, Wellington Management Company, LLP (the “Sub-adviser,” and together with HL Advisors, the “Advisers”) (collectively, the “Agreements”).
In the months preceding the August 2-3, 2011 meeting, the Board requested, received, and reviewed written responses from the Advisers to questions posed to them on behalf of the Independent Directors and supporting materials relating to those questions and responses. The Board considered information furnished to the Board at its meetings throughout the year, as well as information specifically prepared in connection with the annual approval of the Agreements at the Board’s meetings held on June 21-22, 2011 and August 2-3, 2011. Information provided to the Board at its meetings throughout the year included, among other things, reports on Fund performance, legal and compliance matters, sales and marketing activity, shareholder services, and the other services provided to the Fund by the Advisers and their affiliates. In addition, the Board received in-person presentations by Fund officers and representatives of HL Advisors at the Board’s meetings on June 21-22, 2011 and August 2-3, 2011 concerning the Agreements.
The Independent Directors, advised by independent legal counsel, engaged two service providers to assist them with evaluating the Agreements with respect to the Fund. Lipper Inc. (“Lipper”), an independent provider of investment company data, was retained to provide the Board with reports on how the Fund’s contractual management fees, actual management fees, other non-management fees, overall expense ratios and investment performance compared to those of mutual funds with similar investment objectives. The Independent Directors also engaged an independent financial services consulting firm (the “Consultant”) to assist them in evaluating the Fund’s management fees, sub-advisory fees, other non-management fees, overall expense ratios and investment performance. In addition, the Consultant reviewed the profitability calculations utilized by HL Advisors in connection with the continuation of the investment management agreement.
In determining to continue the Agreements for the Fund, the members of the Board reviewed and evaluated information and factors they believed to be relevant and appropriate in light of the information that the Board deemed necessary and appropriate through the exercise of their reasonable business judgment. While individual members of the Board may have weighed certain factors differently, the Board’s determination to continue the Agreements was based on a comprehensive consideration of all information provided to the Board throughout the year and specifically with respect to the continuation of the Agreements. A more detailed discussion of the factors the Board considered with respect to its approval of the Agreements is provided below.
Nature, Extent, And Quality Of Services Provided by the Advisers
The Board requested and considered information concerning the nature, extent, and quality of the services provided to the Fund by the Advisers. The Board considered, among other things, the terms of the Agreements and the range of services provided by the Advisers. The Board considered the Advisers’ professional personnel who provide services to the Fund, including each Adviser’s ability and experience in attracting and retaining qualified personnel to service the Fund. The Board considered each Adviser’s reputation and overall financial strength, as well as its willingness to consider and implement organizational and operational changes designed to improve services to the Fund. In addition, the Board considered the quality of each Adviser’s communications with the Board and responsiveness to Board inquiries.
The Board also requested and evaluated information concerning each Adviser’s regulatory and compliance environment. In this regard, the Board requested and reviewed information on each Adviser’s compliance policies and procedures, compliance history, and a report from the Fund’s Chief Compliance Officer on each Adviser’s compliance with applicable laws and regulations, including responses to regulatory developments and compliance issues raised by regulators. The Board also noted the Advisers’ support of the Fund’s compliance control structure, particularly the resources devoted by the Advisers in support of the Fund’s obligations pursuant to Rule 38a-1 under the 1940 Act.
Hartford MidCap HLS Fund
Approval of Investment Management and Investment Sub-Advisory Agreements (Unaudited) – (continued)
With respect to HL Advisors, the Board noted that under the Agreements, HL Advisors is responsible for the management of the Fund, including overseeing fund operations and service providers, as well as investment advisory services in connection with selecting, monitoring and supervising the Sub-adviser. The Board considered HL Advisors’ ongoing monitoring of people, process and performance, including its quarterly reviews of each of the Hartford HLS Funds, semi-annual meetings with the leaders of each Fund’s portfolio management team, and oversight of the Funds’ 49 portfolio managers. The Board recognized that HL Advisors has demonstrated a record of making changes to the management and/or strategies of the Funds when warranted. The Board considered HL Advisors’ oversight of the Sub-adviser’s investment approach and results, process for monitoring best execution of portfolio trades by the Sub-adviser, and approach to risk management with respect to the Fund and the service providers to the Fund. The Board also considered HL Advisors’ oversight of compliance with the Fund’s objective and policies as well as with applicable laws and regulations, noting that regulatory and other developments had over time led to an increase in the scope of HL Advisors’ services in this regard. In addition, the Board considered HL Advisors’ ongoing commitment to review and rationalize the Hartford fund family’s product line-up and the expenses that HL Advisors had incurred in connection with fund combinations in recent years. The Board considered that HL Advisors or its affiliates are responsible for providing the Fund’s officers. The Board also noted that Hartford Life Insurance Company (“HLIC”) provides administrative services to the Fund. The Board considered its experiences with HL Advisors and HLIC with respect to each of these services.
With respect to the Sub-adviser, who provides day-to-day portfolio management services, the Board considered the quality of the Fund’s portfolio managers, the Sub-adviser’s other investment personnel, its investment philosophy and process, investment research capabilities and resources, performance record, trade execution capabilities and experience. The Board considered the experience of the Fund’s portfolio managers, the number of accounts managed by the portfolio managers, and the Sub-adviser’s method for compensating the portfolio managers.
Based on these considerations, the Board concluded that it was satisfied with the nature, extent and quality of the services provided to the Fund by HL Advisors and the Sub-adviser.
Performance of the Fund and the Advisers
The Board considered the investment performance of the Fund. In this regard, the Board reviewed the performance of the Fund over different time periods presented in the materials and evaluated HL Advisors’ analysis of the Fund’s performance for these time periods. The Board considered information and materials provided to the Board by the Advisers concerning Fund performance, as well as information from Lipper comparing the investment performance of the Fund to an appropriate benchmark and universe of peer funds. The Board noted that the performance of the Fund was within expectations.
The Board considered the detailed investment analytics reports provided by The Hartford’s Investment Advisory Group throughout the year. These reports include, among other things, information on the Fund’s gross and net returns, the Fund’s investment performance relative to an appropriate benchmark and peer group, various statistics concerning the Fund’s portfolio, and a narrative summary of various factors affecting Fund performance. The Board considered the Advisers’ cooperation with the Investment Committee, which assists the Board in evaluating the performance of the Fund at periodic meetings throughout the year. The Board also considered the analysis provided by the Consultant relating to the Fund’s performance track record.
In light of all the considerations noted above, the Board concluded that it had continued confidence in HL Advisors’ and the Sub-adviser’s overall capabilities to manage the Fund.
Costs of the Services and Profitability of the Advisers
The Board reviewed information regarding HL Advisors’ cost to provide investment management and related services to the Fund and HL Advisors’ profitability, both overall and for the Fund, on a pre-tax basis without regard to distribution expenses. The Board also requested and reviewed information about the profitability to HL Advisors and its affiliates from all services provided to the Fund and all aspects of their relationship with the Fund. The Board also requested and received information relating to the operations and profitability of the Sub-adviser.
The Board considered the Consultant’s review of the profitability calculations utilized by HL Advisors in connection with the continuation of the investment management agreement. In this regard, the Consultant reported that The Hartford’s process for calculating and reporting Fund profitability is reasonable, sound and well within common industry practice.
Based on these considerations, the Board concluded that the profits anticipated to be realized by the Advisers and their affiliates from their relationships with the Fund would not be excessive.
Comparison of Fees and Services Provided by the Advisers
The Board considered comparative information with respect to the management fees to be paid by the Fund to HL Advisors and the total expense ratios of the Fund. The Board also considered comparative information with respect to the sub-advisory fees to be paid by HL Advisors to the Sub-adviser, to the extent applicable. In this regard, the Board requested and reviewed information from HL Advisors and the Sub-adviser relating to the management and sub-advisory fees, including the sub-advisory fee schedule for the Fund, and total operating expenses for the Fund. The Board considered that the management fee for the Fund includes the fee paid to HLIC for providing certain administrative services to the Fund. The Board also reviewed information from Lipper comparing the Fund’s contractual management fees, actual management fees and overall expense ratios relative to a group of funds selected by Lipper, in consultation with the Consultant, and a broader universe of funds selected by Lipper.
While the Board recognized that comparisons between the Fund and peer funds are imprecise, given the differing service levels and characteristics of mutual funds and the different business models and cost structures of the Advisers, the comparative information provided by Lipper assisted the Board in evaluating the reasonableness of the Fund’s management and sub-advisory fees and total operating expenses. In addition, the Board considered the analysis and recommendations of the Consultant relating to the Fund’s management and sub-advisory fees and total operating expenses.
Based on these considerations, the Board concluded that the Fund’s fees and total operating expenses, in conjunction with the information about quality of services, profitability, economies of scale, and other matters discussed, were reasonable in light of the services provided.
Economies of Scale
The Board requested and considered information regarding the Advisers’ realization of economies of scale with respect to the Fund and whether the fee levels reflect these economies of scale for the benefit of the Fund’s investors. With respect to HL Advisors, the Board considered representations from HL Advisors that it is difficult to anticipate whether and to what extent economies may be realized by HL Advisors as assets grow over time. The Board reviewed the breakpoints in the management fee schedule for the Fund, which reduces fee rates as Fund assets grow over time. The Board recognized that a fund with assets beyond the last breakpoint level will continue to benefit from economies of scale because additional assets are charged the lowest breakpoint fee resulting in lower overall effective management fee rates. The Board also recognized that a fee schedule that reaches a lower breakpoint quickly provides shareholders with the benefit of anticipated or potential economies of scale.
The Board reviewed and evaluated materials from Lipper showing how management fee schedules of peer funds reflect economies of scale for the benefit of investors as a peer fund’s assets hypothetically increase over time. Based on information provided by HL Advisors, Lipper, and the Consultant, the Board recognized that there is no uniform methodology for establishing breakpoints or uniform pattern in asset levels that trigger breakpoints or the amounts of breakpoints triggered.
After considering all of the information available to it, the Board concluded that it was satisfied with the extent to which economies of scale would be shared for the benefit of the Fund’s shareholders based on currently available information and the effective advisory fees and expense ratios for the Fund at its current and reasonably anticipated asset levels. The Board noted, however, that it would continue to monitor future growth in Fund assets and the appropriateness of additional breakpoints.
Hartford MidCap HLS Fund
Approval of Investment Management and Investment Sub-Advisory Agreements (Unaudited) – (continued)
Other Benefits
The Board considered other benefits to the Advisers and their affiliates from their relationships with the Fund, including the role of the Fund in supporting the variable life insurance and variable annuity products offered by The Hartford. The Board reviewed information noting that HLIC, an affiliate of HL Advisors, receives fees for providing certain administrative services to the Fund, and that HLIC also receives fees for fund accounting and related services from the Fund, and the Board considered information on expected profits to HLIC or its affiliates for such services. The Board also considered that Hartford Administrative Services Company (“HASCO”), the Fund’s transfer agent and an affiliate of HL Advisors, receives transfer agency compensation from the Fund, and the Board reviewed information on the expected profitability of the Fund’s transfer agency function to HASCO. The Board considered information provided by HASCO indicating that the transfer agent fees charged by HASCO to the Fund were fair and reasonable based on publicly available information.
The Board also considered that Hartford Securities Distribution Company, Inc., as principal underwriter of the Fund, receives 12b-1 fees from the Fund. The Board also noted that certain affiliates of HL Advisors distribute shares of the Fund and receive compensation in that connection.
The Board considered benefits to the Sub-adviser from its use of the Fund’s brokerage commissions to obtain soft dollar research, and representations from HL Advisors and the Sub-adviser that the Sub-adviser would not make any revenue-sharing payments or any other type of distribution payments to HL Advisors or its affiliates.
The Board considered the benefits to shareholders of being part of the Hartford family of funds. The Board considered HL Advisors’ efforts to provide investors in the family with a broad range of investment styles and asset classes.
* * * *
Based upon its review of these various factors, among others, the Board concluded that it is in the best interests of the Fund and its shareholders for the Board to approve the Agreements for an additional year. In reaching this decision, the Board did not assign relative weights to the factors discussed above or deem any one or group of them to be controlling in and of themselves. In connection with their deliberations, the Independent Directors met separately in executive session on several occasions, with independent legal counsel, to review the relevant materials and consider their responsibilities under relevant laws and regulations.
The Hartford
P.O. Box 5085
Hartford, CT 06102-5085
Hartford Series Fund, Inc. is underwritten and distributed by Hartford Securities Distribution Company, Inc.
"The Hartford" is The Hartford Financial Services Group, Inc. and its subsidiaries.
Hartford Series Fund, Inc. inception dates range from 1977 to date. Hartford Series Fund, Inc. is not a subsidiary of The Hartford but is underwritten, distributed by and advised by subsidiaries of The Hartford. Investments in Hartford Series Fund, Inc. are not guaranteed by The Hartford or any other entity.
You should carefully consider investment objectives, risks, and charges and expenses of Hartford HLS Funds before investing. This and other information can be found in the Fund’s prospectus or summary prospectus, which can be obtained by calling 800-862-6668. Please read them carefully before you invest or send money.
HLSAR-MC11 2-12 109078 Printed in U.S.A ©2011 The Hartford, Hartford, CT 06115 | |

A MESSAGE FROM THE PRESIDENT
Dear Fellow Shareholders:
I want to take this opportunity to say thank you for investing in Hartford HLS Funds.
This has been a tumultuous year. In the beginning of 2011, we witnessed tension-fueled political uprisings in the already-volatile Middle East and North Africa region. We also watched as Japan dealt with a series of crises including a massive earthquake and subsequent tsunami. Yet, U.S. economic conditions continued to improve, with gains in consumer confidence and retail sales. During the first half of 2011, domestic, international, and world indices (as measured by the S&P 500, MSCI EAFE and MSCI World) were all up more than 5% through June, 30 2011.
The economic recovery, however, lost momentum in the second half of 2011. The employment and housing markets both remain extremely challenged. Investors continue to be concerned about the implications of the European sovereign debt crisis, as well as our own high levels of domestic debt. Fears that the European sovereign debt crisis could continue to drag down the global economy have weighed heavily on stocks.
Ongoing apprehension regarding the U.S. debt ceiling during the summer and the resulting downgrade of the U.S. sovereign credit rating by Standard & Poor’s also contributed to weaker investor confidence.
There are, however, some reasons to remain confident. Corporations have record levels of cash on their balance sheets—corporate cash has doubled in the past 10 years. In addition, U.S. gross domestic product expanded at a 2.5 percent annual rate in the third quarter according to the Commerce Department, as consumers and businesses set aside fears about the recovery and stepped up spending. Corporate earnings have also remained positive, with a majority of companies beating expectations each quarter this year. This momentum will hopefully continue into next year.
As we head into 2012, in light of the continued market volatility, now would be a good time to schedule a meeting with your financial advisor to examine your current investment strategy and determine whether you are on the right track.
| • | Does your fixed-income portfolio complement your equity portfolio? |
| • | Are you receiving diversified sources of income? |
| • | Is your portfolio still in line with your risk tolerance and investment time horizon? |
Talk to your advisor to see what changes you should make to address these concerns and opportunities.
Thank you again for investing with Hartford HLS Funds.
James Davey
President
Hartford HLS Funds
Hartford MidCap Value HLS Fund
Table of Contents
This report is prepared for the general information of contract owners and qualified retirement plan participants. It is not an offer of contracts or of qualified retirement plans. It should not be used in connection with any offer, except in conjunction with the appropriate product prospectus which contains all pertinent information including the applicable sales, administrative and other charges.
The views expressed in the Fund’s Manager Discussion under ‘‘Why did the Fund perform this way?’’ and ‘‘What is the outlook?’’ are views of the Fund’s sub-adviser and portfolio management team through the end of the period and are subject to change based on market and other conditions.
Hartford MidCap Value HLS Fund* inception 04/30/2001
(sub-advised by Wellington Management Company, LLP)
Investment objective – Seeks long-term capital appreciation.

The chart above shows the growth of a $10,000 investment in Class IA. Growth results in classes other than Class IA will vary from what is seen above due to differences in the expenses charged to those share classes.
Average Annual Total Returns (as of 12/31/11) (1) (2)
| | 1 Year | 5 Year | 10 Year |
| MidCap Value IA | -8.56% | 0.07% | 6.55% |
| MidCap Value IB | -8.79% | -0.18% | 6.29% |
| Russell 2500 Value Index | -3.36% | -0.58% | 7.16% |
| Russell MidCap Value Index | -1.38% | 0.04% | 7.67% |
PAST PERFORMANCE IS NOT INDICATIVE OF FUTURE RESULTS.
Total returns presented above were calculated using the Fund's net asset value available to shareholders for sale or redemption of Fund shares on December 31, 2011, which may exclude investment transactions as of this date.
Russell 2500 Value Index is an unmanaged index measuring the performance of those Russell 2500 Index companies with lower price-to-book ratios and lower forecasted growth values. (The Russell 2500 Index is an unmanaged index that measures the performance of the 2,500 smallest U.S. companies based on total market capitalization.)
Russell MidCap Value Index measures the performance of the mid-cap value segment of the U.S. equity universe. It includes those Russell Midcap Index companies with lower price-to-book ratios and lower forecasted growth values.
The Fund has added an additional benchmark, the Russell MidCap Value Index. The Fund’s investment manager believes that the Russell MidCap Value index, along with the Fund’s current benchmark Russell 2500 Value Index, comprises the universe of securities in which the Fund primarily invests.
You cannot invest directly in an index.
The chart represents a hypothetical investment in the Fund. Performance data represents past performance and current performance could be higher or lower.
Performance information may reflect historical or current expense waivers/reimbursements from the investment adviser, without which performance would have been lower. For information on current expense waivers/reimbursements, please see the prospectus.
The value of the Fund will fluctuate so that when redeemed, it may be worth more or less than the original investment. The chart and table do not reflect the deductions of taxes, sales charges or other fees which may be applied at the variable life insurance, variable annuity or qualified retirement plan product level. Any such additional sales charges or other fees or expenses would lower the contract’s or plan’s performance.
| * | The Fund has restrictions on the purchase of shares. A description of the restrictions can be found in the prospectus. |
Hartford MidCap Value HLS Fund
Manager Discussion (Unaudited)
December 31, 2011
| Portfolio Manager | | |
| James N. Mordy | | |
| Senior Vice President | | |
| | | |
How did the Fund perform?
The Class IA shares of the Hartford MidCap Value HLS Fund returned -8.56% for the twelve-month period ended December 31, 2011, underperforming its benchmarks, the Russell 2500 Value Index, which returned -3.36% and the Russell MidCap Value Index, which returned -1.38% for the same period. The Fund also underperformed the -4.49% return of the average fund in the Lipper Mid-Cap Value VP-UF Fund peer group, a group of funds with investment strategies similar to those of the Fund.
Why did the Fund perform this way?
The twelve-month period ended December 31, 2011 was yet another extremely volatile period for equity markets. Global equities started the year on a strong note and continued to march higher in the first quarter of 2011, driven by investors’ enthusiasm for additional government debt purchases by the U.S. Federal Reserve, the extension of tax cuts in the U.S., strong earnings growth, and generally improving economic data. This enthusiasm reversed later in the period, however, as concerns surfaced that the global economy could slip back into recession, resulting in a rapid decline in equity markets. Fears about sovereign debt and solvency in the eurozone, slowing economic expansion in China, and uncertainty about the sustainability of corporate earnings growth combined to produce an extremely volatile stock market, and return correlations among stocks spiked as investors shed risk and fled to safety. Markets ended the year on a positive note in the final month of the period with encouraging employment and manufacturing data in the U.S.
During this period, small-cap (-4%) and mid-cap stocks (-2%) underperformed larger-cap stocks (+2%), as represented by the Russell 2000, S&P MidCap 400, and S&P 500 indices, respectively. Growth (-1.6%) outperformed Value (-3.4%), during the period, as measured by Russell 2500 Growth and Russell 2500 Value, respectively. Within the Russell 2500 Value Index, four of ten sectors rose, led by Utilities (+21%), Consumer Staples (+8%), and Health Care (+3%).
The Fund’s relative underperformance versus the index was primarily driven by weak stock selection within Financials, Materials, and Consumer Staples, which more than offset positive stock selection within Consumer Discretionary and Information Technology. Overall sector allocation, a result of bottom-up security selection (i.e. stock by stock fundamental research), also detracted from relative returns, particularly due to our underweight position (i.e. the Fund’s sector position was less than the benchmark position) in Utilities.
The largest detractors from benchmark-relative and absolute returns included Sino-Forest (Materials), PHH (Financials), and Popular (Financials). Shares of Sino-Forest, a commercial forest plantation operator in China, fell amidst allegations of fraud related to the lease agreements of the company’s tree plantations. Shares of mortgage and fleet management services provider PHH declined as management elected to downsize a debt deal, which prompted a ratings downgrade and CEO replacement. Shares of Popular, a diversified, publicly owned bank holding company, underperformed as its credit performance was more mixed than most regional banks, which showed credit improvement.
The largest contributors to benchmark-relative and absolute (i.e. total return) performance included Buck Holdings-Dollar General (Consumer Discretionary), Varian Semiconductor Equipment (Information Technology), and Ross Stores (Consumer Discretionary). Shares of Buck Holdings-Dollar General, a discount retailer, continue to outperform in a trade-down economy. As the world’s top designer and manufacturer of ion implantation equipment and systems, Varian Semiconductor Equipment’s shares rose as it was acquired by Applied Materials. Shares of Ross Stores, the operator of off-price retail apparel and home accessories stores, rose as the company continues to provide the rare combination of strong management, consistent operational results, and good square footage growth.
What is the outlook?
Our macro view has not changed significantly in recent months. We believe that the U.S. economy has decent momentum including a pick-up in jobs growth, but fiscal restraint should keep a lid on things. Globally, we face headwinds from a likely European recession and a heavy slate of upcoming sovereign debt maturities. Reduced inflationary pressures will likely give policy makers in China and other Emerging Market countries some flexibility to stimulate demand, and will help consumers at the margin.
With respect to portfolio positioning, we were net buyers of Consumer Staples and Materials over the year, while we were net sellers in the Industrials and Consumer Discretionary sectors. We are currently slightly underweight the more cyclical sectors of the Russell 2500 Value Index. This
Hartford MidCap Value HLS Fund
Manager Discussion (Unaudited) – (continued)
December 31, 2011
underweight is concentrated in the Financials (due mainly to the REITs), Consumer Discretionary, and Information Technology sectors. Our largest sector overweight (i.e. the Fund’s sector position was greater than the benchmark position) at the end of the period was Materials.
| Diversification by Industry |
| as of December 31, 2011 |
| Industry (Sector) | | Percentage of Net Assets | |
| Banks (Financials) | | | 9.7 | % |
| Capital Goods (Industrials) | | | 13.7 | |
| Consumer Durables & Apparel (Consumer Discretionary) | | | 5.2 | |
| Consumer Services (Consumer Discretionary) | | | 0.4 | |
| Diversified Financials (Financials) | | | 3.9 | |
| Energy (Energy) | | | 6.3 | |
| Food, Beverage & Tobacco (Consumer Staples) | | | 5.8 | |
| Health Care Equipment & Services (Health Care) | | | 4.1 | |
| Insurance (Financials) | | | 8.3 | |
| Materials (Materials) | | | 10.1 | |
| Media (Consumer Discretionary) | | | 0.7 | |
| Pharmaceuticals, Biotechnology & Life Sciences (Health Care) | | | 3.3 | |
| Real Estate (Financials) | | | 5.3 | |
| Retailing (Consumer Discretionary) | | | 5.2 | |
| Semiconductors & Semiconductor Equipment (Information Technology) | | | 3.6 | |
| Software & Services (Information Technology) | | | 1.0 | |
| Technology Hardware & Equipment (Information Technology) | | | 3.0 | |
| Transportation (Industrials) | | | 1.6 | |
| Utilities (Utilities) | | | 7.6 | |
| Short-Term Investments | | | 1.2 | |
| Other Assets and Liabilities | | | 0.0 | |
| Total | | | 100.0 | % |
Hartford MidCap Value HLS Fund
Schedule of Investments
December 31, 2011
(000’s Omitted)
| Shares or Principal Amount | | Market Value ╪ | |
COMMON STOCKS - 98.8% | |
| | | | | Banks - 9.7% | | | | |
| | 199 | | | Bankunited, Inc. | | $ | 4,370 | |
| | 320 | | | Beneficial Mutual Bancorp, Inc. ● | | | 2,676 | |
| | 180 | | | Comerica, Inc. | | | 4,654 | |
| | 476 | | | Fifth Third Bancorp | | | 6,056 | |
| | 224 | | | First Midwest Bancorp, Inc. | | | 2,269 | |
| | 815 | | | Huntington Bancshares, Inc. | | | 4,476 | |
| | 59 | | | M&T Bank Corp. | | | 4,466 | |
| | 2,366 | | | Popular, Inc. ● | | | 3,289 | |
| | 669 | | | Regions Financial Corp. | | | 2,878 | |
| | 452 | | | TCF Financial Corp. | | | 4,665 | |
| | 334 | | | Umpqua Holdings Corp. | | | 4,133 | |
| | | | | | | | 43,932 | |
| | | | | Capital Goods - 13.7% | | | | |
| | 93 | | | AGCO Corp. ● | | | 3,996 | |
| | 57 | | | AMETEK, Inc. | | | 2,402 | |
| | 342 | | | Barnes Group, Inc. | | | 8,239 | |
| | 110 | | | Dover Corp. | | | 6,357 | |
| | 89 | | | Esterline Technologies Corp. ● | | | 4,980 | |
| | 116 | | | Hubbell, Inc. Class B | | | 7,783 | |
| | 198 | | | Pentair, Inc. | | | 6,588 | |
| | 123 | | | Teledyne Technologies, Inc. ● | | | 6,752 | |
| | 76 | | | Terex Corp. ● | | | 1,028 | |
| | 173 | | | Thomas ? Betts Corp. ● | | | 9,440 | |
| | 150 | | | URS Corp. ● | | | 5,279 | |
| | | | | | | | 62,844 | |
| | | | | Consumer Durables & Apparel - 5.2% | | | | |
| | 301 | | | Lennar Corp. | | | 5,921 | |
| | 244 | | | Mattel, Inc. | | | 6,782 | |
| | 2,206 | | | Samsonite International S.A. ● | | | 3,451 | |
| | 387 | | | Toll Brothers, Inc. ● | | | 7,894 | |
| | | | | | | | 24,048 | |
| | | | | Consumer Services - 0.4% | | | | |
| | 52 | | | DeVry, Inc. | | | 1,981 | |
| | | | | | | | | |
| | | | | Diversified Financials - 3.9% | | | | |
| | 194 | | | E*Trade Financial Corp. ● | | | 1,546 | |
| | 240 | | | Invesco Ltd. | | | 4,821 | |
| | 69 | | | LPL Investment Holdings, Inc. ● | | | 2,110 | |
| | 514 | | | PHH Corp. ● | | | 5,503 | |
| | 181 | | | Solar Capital Ltd. | | | 3,995 | |
| | 452 | | | Solar Cayman Ltd. ⌂■●† | | | 41 | |
| | | | | | | | 18,016 | |
| | | | | Energy - 6.3% | | | | |
| | 373 | | | Cobalt International Energy ● | | | 5,786 | |
| | 65 | | | Consol Energy, Inc. | | | 2,393 | |
| | 94 | | | ENSCO International plc | | | 4,420 | |
| | 97 | | | Japan Petroleum Exploration Co., Ltd. | | | 3,777 | |
| | 463 | | | Lone Pine Resources, Inc. ● | | | 3,243 | |
| | 109 | | | Newfield Exploration Co. ● | | | 4,101 | |
| | 107 | | | Tidewater, Inc. | | | 5,280 | |
| | | | | | | | 29,000 | |
| | | | | Food, Beverage & Tobacco - 5.8% | | | | |
| | 3,202 | | | China Agri-Industries Holdings | | | 2,429 | |
| | 63 | | | Corn Products International, Inc. | | | 3,334 | |
| | 270 | | | Cosan Ltd. | | | 2,960 | |
| | 388 | | | Maple Leaf Foods, Inc. w/ Rights | | | 4,125 | |
| | 175 | | | Molson Coors Brewing Co. | | | 7,615 | |
| | 292 | | | Tyson Foods, Inc. Class A | | | 6,035 | |
| | | | | | | | 26,498 | |
| | | | | Health Care Equipment & Services - 4.1% | | | | |
| | 81 | | | Amerisource Bergen Corp. | | | 3,016 | |
| | 321 | | | Brookdale Senior Living, Inc. ● | | | 5,582 | |
| | 165 | | | CIGNA Corp. | | | 6,943 | |
| | 309 | | | Vanguard Health Systems, Inc. ● | | | 3,156 | |
| | | | | | | | 18,697 | |
| | | | | Insurance - 8.3% | | | | |
| | 95 | | | Everest Re Group Ltd. | | | 8,022 | |
| | 160 | | | Platinum Underwriters Holdings Ltd. | | | 5,463 | |
| | 218 | | | Principal Financial Group, Inc. | | | 5,368 | |
| | 183 | | | Reinsurance Group of America, Inc. | | | 9,573 | |
| | 449 | | | Unum Group | | | 9,464 | |
| | | | | | | | 37,890 | |
| | | | | Materials - 10.1% | | | | |
| | 45 | | | CF Industries Holdings, Inc. | | | 6,553 | |
| | 92 | | | FMC Corp. | | | 7,950 | |
| | 86 | | | Greif, Inc. | | | 3,917 | |
| | 1,064 | | | Incitec Pivot Ltd. | | | 3,377 | |
| | 409 | | | Louisiana-Pacific Corp. ● | | | 3,299 | |
| | 280 | | | Methanex Corp. ADR | | | 6,385 | |
| | 235 | | | Owens-Illinois, Inc. ● | | | 4,549 | |
| | 751 | | | Rexam plc | | | 4,110 | |
| | 132 | | | Sino Forest Corp. ⌂■●† | | | 45 | |
| | 220 | | | Sino Forest Corp. Class A ⌂●† | | | 76 | |
| | 265 | | | Steel Dynamics, Inc. | | | 3,486 | |
| | 2,410 | | | Yingde Gases | | | 2,450 | |
| | | | | | | | 46,197 | |
| | | | | Media - 0.7% | | | | |
| | 148 | | | Virgin Media, Inc. | | | 3,158 | |
| | | | | | | | | |
| | | | | Pharmaceuticals, Biotechnology & Life Sciences - 3.3% | | | | |
| | 599 | | | Almirall S.A. | | | 4,105 | |
| | 305 | | | Impax Laboratories, Inc. ● | | | 6,150 | |
| | 121 | | | UCB S.A. | | | 5,060 | |
| | | | | | | | 15,315 | |
| | | | | Real Estate - 5.3% | | | | |
| | 164 | | | American Assets Trust, Inc. | | | 3,362 | |
| | 938 | | | BR Properties S.A. | | | 9,304 | |
| | 263 | | | Forest City Enterprises, Inc. Class A ● | | | 3,110 | |
| | 102 | | | Iguatemi Emp de Shopping | | | 1,899 | |
| | 354 | | | Weyerhaeuser Co. | | | 6,613 | |
| | | | | | | | 24,288 | |
| | | | | Retailing - 5.2% | | | | |
| | 138 | | | Ann, Inc. ● | | | 3,425 | |
| | 5,788 | | | Buck Holdings L.P. ⌂●† | | | 12,954 | |
| | 156 | | | Ross Stores, Inc. | | | 7,419 | |
| | | | | | | | 23,798 | |
| | | | | Semiconductors & Semiconductor Equipment - 3.6% | | | | |
| | 226 | | | Avago Technologies Ltd. | | | 6,511 | |
| | 125 | | | Linear Technology Corp. | | | 3,747 | |
| | 370 | | | Microsemi Corp. ● | | | 6,201 | |
| | | | | | | | 16,459 | |
| | | | | Software & Services - 1.0% | | | | |
| | 260 | | | Booz Allen Hamilton Holding Corp. ● | | | 4,492 | |
| | | | | | | | | |
| | | | | Technology Hardware & Equipment - 3.0% | | | | |
| | 326 | | | Arrow Electronics, Inc. ● | | | 12,184 | |
| | 253 | | | Flextronics International Ltd. ● | | | 1,430 | |
| | | | | | | | 13,614 | |
The accompanying notes are an integral part of these financial statements.
Hartford MidCap Value HLS Fund
Schedule of Investments – (continued)
December 31, 2011
(000’s Omitted)
| Shares or Principal Amount | | Market Value ╪ | |
COMMON STOCKS - 98.8% - (continued) | |
| | | | | Transportation - 1.6% | | | | |
| | 362 | | | Delta Air Lines, Inc. ● | | $ | 2,930 | |
| | 527 | | | Swift Transportation Co. ● | | | 4,343 | |
| | | | | | | | 7,273 | |
| | | | | Utilities - 7.6% | | | | |
| | 622 | | | N.V. Energy, Inc. | | | 10,167 | |
| | 213 | | | Northeast Utilities | | | 7,679 | |
| | 182 | | | UGI Corp. | | | 5,348 | |
| | 248 | | | Westar Energy, Inc. | | | 7,146 | |
| | 128 | | | Wisconsin Energy Corp. | | | 4,468 | |
| | | | | | | | 34,808 | |
| | | | | Total common stocks | | | | |
| | | | | (cost $435,151) | | $ | 452,308 | |
| | | | | | | | | |
| | | | | Total long-term investments
(cost $435,151) | | $ | 452,308 | |
| SHORT-TERM INVESTMENTS - 1.2% | | | | |
| Repurchase Agreements - 1.2% | | | | |
| | | | | Bank of America Merrill Lynch TriParty Joint
Repurchase Agreement (maturing on
01/03/2012 in the amount of $2,136,
collateralized by GNMA 4.50%, 2041,
value of $2,178) | | | | |
| $ | 2,136 | | | 0.04%, 12/30/2011 | | $ | 2,136 | |
| | | | | Barclays Capital TriParty Joint Repurchase
Agreement (maturing on 01/03/2012 in the
amount of $177, collateralized by U.S.
Treasury Bond 5.38%, 2031, value of $181) | | | | |
| | 177 | | | 0.01%, 12/30/2011 | | | 177 | |
| | | | | Deutsche Bank Securities TriParty Joint
Repurchase Agreement (maturing on
01/03/2012 in the amount of $2,369,
collateralized by GNMA 3.50% - 7.00%,
2035 - 2046, value of $2,416) | | | | |
| | 2,369 | | | 0.06%, 12/30/2011 | | | 2,369 | |
| | | | | UBS Securities, Inc. Joint Repurchase
Agreement (maturing on 01/03/2012 in the
amount of $18, collateralized by U.S.
Treasury Note 2.75%, 2016, value of $18) | | | | |
| | 18 | | | 0.01%, 12/30/2011 | | | 18 | |
| | | | | UBS Securities, Inc. TriParty Joint Repurchase
Agreement (maturing on 01/03/2012 in the
amount of $917, collateralized by FNMA
3.00% - 6.50%, 2021 - 2041, value of
$935) | | | | |
| | 917 | | | 0.04%, 12/30/2011 | | | 917 | |
| | | | | | | | 5,617 | |
| | Total short-term investments | | | | | | | | |
| | (cost $5,617) | | | | | | $ | 5,617 | |
| | | | | | | | | | |
| | Total investments | | | | | | | | |
| | (cost $440,768) ▲ | | | 100.0 | % | | $ | 457,925 | |
| | Other assets and liabilities | | | 0.0 | % | | | 221 | |
| | Total net assets | | | 100.0 | % | | $ | 458,146 | |
The accompanying notes are an integral part of these financial statements.
| Note: | Percentage of investments as shown is the ratio of the total market value to total net assets. Market value of long-term investments in foreign securities represents 13.4% of total net assets at December 31, 2011. |
| | |
| | Prices of foreign equities that are principally traded on certain foreign markets may be adjusted daily pursuant to a fair value pricing service approved by the Board of Directors in order to reflect an adjustment for factors occurring after the close of certain foreign markets but before the close of the New York Stock Exchange. |
| ▲ | At December 31, 2011, the cost of securities for federal income tax purposes was $449,075 and the aggregate gross unrealized appreciation and depreciation based on that cost were: |
| | Unrealized Appreciation | | $ | 62,326 | |
| | Unrealized Depreciation | | | (53,476 | ) |
| | Net Unrealized Appreciation | | $ | 8,850 | |
| † | These securities were valued in good faith at fair value as determined under policies and procedures established by and under the supervision of the Company's Board of Directors. At December 31, 2011, the aggregate value of these securities was $13,116, which represents 2.9% of total net assets. This amount excludes securities that are principally traded in certain foreign markets and whose prices are adjusted pursuant to a third party pricing service methodology approved by the Board of Directors. |
| ■ | Securities issued within terms of a private placement memorandum, exempt from registration under Rule 144A under the Securities Act of 1933, as amended, and may be sold only to qualified institutional buyers. Unless otherwise indicated, these issues are determined to be liquid. At December 31, 2011, the aggregate value of these securities was $86, which rounds to zero percent of total net assets. |
| ⌂ | The following securities are considered illiquid. Illiquid securities are often purchased in private placement transactions, are often not registered under the Securities Act of 1933 and may have contractual restrictions on resale. A security may also be considered illiquid if the security lacks a readily available market or if its valuation has not changed for a certain period of time. |
| | Period Acquired | | Shares/ Par | | | Security | | | Cost Basis | |
| | 06/2007 | | | 5,788 | | | | Buck Holdings L.P. | | | $ | 3,420 | |
| | 12/2009 | | | 132 | | | | Sino Forest Corp. - 144A | | | | 2,093 | |
| | 12/2009 - 06/2011 | | | 220 | | | | Sino Forest Corp. Class A | | | | 3,807 | |
| | 03/2007 | | | 452 | | | | Solar Cayman Ltd. - 144A | | | | 133 | |
| | At December 31, 2011, the aggregate value of these securities was $13,116, which represents 2.9% of total net assets. |
Foreign Currency Contracts Outstanding at December 31, 2011
| Description | | Counterparty | | | Buy / Sell | | | Market Value ╪ | | | Contract Amount | | | Delivery Date | | | Unrealized Appreciation/ (Depreciation) | |
| Australian Dollar | | | JP Morgan Securities | | | Sell | | | $ | 8 | | | $ | 8 | | | 1/3/2012 | | | $ | – | |
| British Pound | | | JP Morgan Securities | | | Sell | | | | 10 | | | | 10 | | | 1/3/2012 | | | | – | |
| | | | | | | | | | | | | | | | | | | | | | | $ | – | |
| ╪ | See Significant Accounting Policies of accompanying Notes to Financial Statements regarding valuation of securities. |
The accompanying notes are an integral part of these financial statements.
Hartford MidCap Value HLS Fund
Investment Valuation Hierarchy Level Summary
December 31, 2011
(000’s Omitted)
| | | Total | | | Level 1 ♦ | | | Level 2 ♦ | | | Level 3 | |
| Assets: | | | | | | | | | | | | | | | | |
| Common Stocks ‡ | | $ | 452,308 | | | $ | 410,433 | | | $ | 28,759 | | | $ | 13,116 | |
| Short-Term Investments | | | 5,617 | | | | – | | | | 5,617 | | | | – | |
| Total | | $ | 457,925 | | | $ | 410,433 | | | $ | 34,376 | | | $ | 13,116 | |
| Liabilities: | | | | | | | | | | | | | | | | |
| Foreign Currency Contracts * | | | — | | | | — | | | | — | | | | — | |
| Total | | $ | — | | | $ | — | | | $ | — | | | $ | — | |
| ♦ | For the year ended December 31, 2011, there were no significant transfers between Level 1 and Level 2. |
| ‡ | The Fund has all or primarily all of the equity securities categorized in a particular level. Refer to the Schedule of Investments for further industry breakout. |
| * | Derivative instruments not reflected in the Schedule of Investments are valued at the unrealized appreciation/depreciation on the investments. |
Following is a reconciliation of Level 3 assets for which significant unobservable inputs were used to determine fair value:
| | | Balance as of December 31, 2010 | | | Realized Gain (Loss) | | | Change in Unrealized Appreciation (Depreciation) | | | Net Amortization | | | Purchases | | | Sales | | | Transfers
Into
Level 3 * | | | Transfers Out of Level 3 * | | | Balance as of December 31, 2011 | |
| Assets: | | | | | | | | | | | | | | | | | | | | | | | | | | | | | | | | | | | | |
| Common Stocks | | $ | 13,180 | | | $ | 3,229 | | | $ | (7,026 | )† | | $ | — | | | $ | 822 | | | $ | (4,559 | ) | | $ | 7,470 | | | $ | — | | | $ | 13,116 | |
| Total | | $ | 13,180 | | | $ | 3,229 | | | $ | (7,026 | ) | | $ | — | | | $ | 822 | | | $ | (4,559 | ) | | $ | 7,470 | | | $ | — | | | $ | 13,116 | |
| * | Securities are transferred into and out of Level 3 for a variety of reasons including, but not limited to: |
| 1) | Securities where trading has been halted (transfer into Level 3) or securities where trading has resumed (transfer out of Level 3). |
| 2) | Broker quoted securities (transfer into Level 3) or quoted prices in active markets (transfer out of Level 3). |
| 3) | Securities that have certain restrictions on trading (transfer into Level 3) or securities where trading restrictions have expired (transfer out of Level 3). |
| † | Change in unrealized appreciation (depreciation) in the current period relating to assets still held at December 31, 2011 was $(7,026). |
The accompanying notes are an integral part of these financial statements.
Hartford MidCap Value HLS Fund
Statement of Assets and Liabilities
December 31, 2011
(000’s Omitted)
| Assets: | | | | |
| Investments in securities, at market value (cost $440,768) | | $ | 457,925 | |
| Cash | | | 42 | |
| Receivables: | | | | |
| Investment securities sold | | | 18 | |
| Fund shares sold | | | 98 | |
| Dividends and interest | | | 449 | |
| Total assets | | | 458,532 | |
| Liabilities: | | | | |
| Unrealized depreciation on foreign currency contracts | | | — | |
| Bank overdraft - foreign cash | | | — | |
| Payables: | | | | |
| Fund shares redeemed | | | 256 | |
| Investment management fees | | | 81 | |
| Distribution fees | | | 6 | |
| Accrued expenses | | | 43 | |
| Total liabilities | | | 386 | |
| Net assets | | $ | 458,146 | |
| Summary of Net Assets: | | | | |
| Capital stock and paid-in-capital | | $ | 505,658 | |
| Undistributed net investment income | | | 3,414 | |
| Accumulated net realized loss | | | (68,082 | ) |
| Unrealized appreciation of investments and the translations of assets and liabilities denominated in foreign currency | | | 17,156 | |
| Net assets | | $ | 458,146 | |
| Shares authorized | | | 1,200,000 | |
| Par value | | $ | 0.001 | |
| Class IA: Net asset value per share | | $ | 9.44 | |
| Shares outstanding | | | 36,192 | |
| Net assets | | $ | 341,583 | |
| Class IB: Net asset value per share | | $ | 9.38 | |
| Shares outstanding | | | 12,426 | |
| Net assets | | $ | 116,563 | |
The accompanying notes are an integral part of these financial statements.
Hartford MidCap Value HLS Fund
Statement of Operations
For the Year Ended December 31, 2011
(000’s Omitted)
| Investment Income: | | | |
| Dividends | $ | 7,817 | |
| Interest | | 6 | |
| Less: Foreign tax withheld | | (145 | ) |
| Total investment income, net | | 7,678 | |
| | | | |
| Expenses: | | | |
| Investment management fees | | 4,339 | |
| Transfer agent fees | | 2 | |
| Distribution fees - Class IB | | 353 | |
| Custodian fees | | 20 | |
| Accounting services fees | | 55 | |
| Board of Directors' fees | | 13 | |
| Audit fees | | 14 | |
| Other expenses | | 125 | |
| Total expenses (before fees paid indirectly) | | 4,921 | |
| Commission recapture | | (15 | ) |
| Custodian fee offset | | — | |
| Total fees paid indirectly | | (15 | ) |
| Total expenses, net | | 4,906 | |
| Net investment income | | 2,772 | |
| | | | |
| Net Realized Gain on Investments and Foreign Currency Transactions: | | | |
| Net realized gain on investments | | 74,856 | |
| Net realized gain on foreign currency contracts | | 40 | |
| Net realized loss on other foreign currency transactions | | (18 | ) |
| Net Realized Gain on Investments and Foreign Currency Transactions | | 74,878 | |
| | | | |
| Net Changes in Unrealized Depreciation of Investments and Foreign Currency Transactions: | | | |
| Net unrealized depreciation of investments | | (123,014 | ) |
| Net unrealized appreciation of foreign currency contracts | | — | |
| Net unrealized depreciation on translation of other assets and liabilities in foreign currencies | | (2 | ) |
| Net Changes in Unrealized Depreciation of Investments and Foreign Currency Transactions | | (123,016 | ) |
| Net Loss on Investments and Foreign Currency Transactions | | (48,138 | ) |
| Net Decrease in Net Assets Resulting from Operations | $ | (45,366 | ) |
The accompanying notes are an integral part of these financial statements.
Hartford MidCap Value HLS Fund
Statement of Changes in Net Assets
(000’s Omitted)
| | For the
Year Ended
December 31, 2011 | | For the
Year Ended
December 31, 2010 | |
| Operations: | | | | | | |
| Net investment income | $ | 2,772 | | $ | 2,566 | |
| Net realized gain on investments and foreign currency transactions | | 74,878 | | | 50,326 | |
| Net unrealized appreciation (depreciation) of investments and foreign currency transactions | | (123,016 | ) | | 71,976 | |
| Net Increase (Decrease) In Net Assets Resulting From Operations | | (45,366 | ) | | 124,868 | |
| Distributions to Shareholders: | | | | | | |
| From net investment income | | | | | | |
| Class IA | | (40 | ) | | (2,489 | ) |
| Class IB | | (14 | ) | | (531 | ) |
| Total distributions | | (54 | ) | | (3,020 | ) |
| Capital Share Transactions: | | | | | | |
| Class IA | | | | | | |
| Sold | | 30,432 | | | 30,002 | |
| Issued in merger | | — | | | 82,281 | |
| Issued on reinvestment of distributions | | 40 | | | 2,489 | |
| Redeemed | | (117,488 | ) | | (90,281 | ) |
| Total capital share transactions | | (87,016 | ) | | 24,491 | |
| Class IB | | | | | | |
| Sold | | 11,942 | | | 11,740 | |
| Issued in merger | | — | | | 14,050 | |
| Issued on reinvestment of distributions | | 14 | | | 531 | |
| Redeemed | | (47,153 | ) | | (41,543 | ) |
| Total capital share transactions | | (35,197 | ) | | (15,222 | ) |
| Net increase (decrease) from capital share transactions | | (122,213 | ) | | 9,269 | |
| Net Increase (Decrease) In Net Assets | | (167,633 | ) | | 131,117 | |
| Net Assets: | | | | | | |
| Beginning of period | | 625,779 | | | 494,662 | |
| End of period | $ | 458,146 | | $ | 625,779 | |
| Undistributed (distribution in excess of) | | | | | | |
| net investment income | $ | 3,414 | | $ | 331 | |
| Shares: | | | | | | |
| Class IA | | | | | | |
| Sold | | 2,960 | | | 3,223 | |
| Issued in merger | | — | | | 9,542 | |
| Issued on reinvestment of distributions | | 4 | | | 264 | |
| Redeemed | | (11,556 | ) | | (10,118 | ) |
| Total share activity | | (8,592 | ) | | 2,911 | |
| Class IB | | | | | | |
| Sold | | 1,173 | | | 1,277 | |
| Issued in merger | | — | | | 1,637 | |
| Issued on reinvestment of distributions | | 1 | | | 59 | |
| Redeemed | | (4,645 | ) | | (4,656 | ) |
| Total share activity | | (3,471 | ) | | (1,683 | ) |
The accompanying notes are an integral part of these financial statements.
Hartford MidCap Value HLS Fund
Notes to Financial Statements
December 31, 2011
(000’s Omitted)
Hartford MidCap Value HLS Fund (the “Fund”) serves as an underlying investment option for certain variable annuity and variable life insurance separate accounts of Hartford Life Insurance Company (“HLIC”) and its affiliates and certain qualified retirement plans. The Fund may also serve as an underlying investment option for certain variable annuity and variable life separate accounts of other insurance companies. Owners of variable annuity contracts and policyholders of variable life insurance contracts may choose the funds permitted in the variable insurance contract prospectus. In addition, participants in certain qualified retirement plans may choose the Fund if permitted by their plans.
Hartford Series Fund, Inc. (the “Company”) is an open-end registered management investment company comprised of thirty portfolios. Financial Statements for the Fund, a series of the Company, are included in this report.
The Company is organized under the laws of the State of Maryland and is registered with the Securities and Exchange Commission (“SEC”) under the Investment Company Act of 1940, as amended (“1940 Act”). The Fund is a diversified open-end management investment company.
The Fund is divided into Class IA and Class IB shares. Each class is offered at the per share net asset value (“NAV”) without a sales charge and is subject to the same expenses, except that the Class IB shares are subject to distribution and service fees charged pursuant to a Distribution Plan adopted in accordance with Rule 12b-1 under the 1940 Act.
| 2. | Significant Accounting Policies: |
The following is a summary of significant accounting policies of the Fund in the preparation of its financial statements, which are in accordance with the United States Generally Accepted Accounting Principles (“U.S. GAAP”). The preparation of financial statements in accordance with U.S. GAAP may require management to make estimates and assumptions that affect the reported amounts of assets and liabilities and disclosure of contingent assets and liabilities at the date of the financial statements and the reported amounts of increases and decreases in net assets from operations during the reporting period. Actual results could differ from those estimates.
| a) | Determination of Net Asset Value – The NAV of each class of the Fund’s shares is determined as of the close of regular trading (normally 4:00 p.m. Eastern Time) (the “NYSE Close”) on each day that the New York Stock Exchange (the “Exchange”) is open (“Valuation Date”). Information that becomes known to the Fund after the NAV has been calculated on a particular day will not generally be used to retroactively adjust the NAV determined earlier that day. |
| b) | Investment Valuation and Fair Value Measurements – For purposes of calculating the NAV, portfolio securities and other assets held by the Fund's portfolio for which market quotes are readily available are valued at market value. Market value is generally determined on the basis of last reported sales prices or official close price. If no sales are reported, market value is based on quotes obtained from a quotation reporting system, established market makers, or independent pricing services. If market prices are not readily available or are deemed unreliable, the Fund will use the fair value of the security as determined in good faith under policies and procedures established by and under the supervision of the Company’s Board of Directors. Market quotes are considered not readily available where there is an absence of current or reliable market-based data (e.g., trade information or broker quotes), including where events occur after the close of the relevant market, but prior to the NYSE Close that materially affect the values of the Fund’s portfolio securities or assets. In addition, market quotes are considered not readily available when, due to extraordinary circumstances, the exchanges or markets on which the securities trade do not open for trading for the entire day and no other market prices are available. In addition, prices of foreign equities that are principally traded on certain foreign markets are adjusted daily pursuant to a fair value pricing service approved by the Board of Directors in order to reflect an adjustment for the factors occurring after the close of certain foreign markets but before the NYSE Close. Securities that are primarily traded on foreign markets may trade on days that are not business days of the Fund. The value of the foreign securities in which the Fund invests may change on days when a shareholder will not be able to purchase or redeem shares of the |
Fund. Fair value pricing is subjective in nature and the use of fair value pricing by the Fund may cause the NAV of its shares to differ significantly from the NAV that would have been calculated using market prices at the close of the exchange on which a portfolio security is primarily traded. There can be no assurance that the Fund could obtain the fair market value assigned to a security if the Fund were to sell the security at approximately the time at which the Fund determines its NAV.
Investments valued in currencies other than U.S. dollars are converted to U.S. dollars using exchange rates obtained from independent pricing services for calculation of the NAV. As a result, the NAV of the Fund’s shares may be affected by changes in the value of currencies in relation to the U.S. dollar. The value of securities traded in markets outside the United States or denominated in currencies other than the U.S. dollar may be affected significantly on a day that the NYSE is closed and the market value may change on days when an investor is not able to purchase, redeem or exchange shares of the Fund.
Foreign currency contracts represent agreements to exchange currencies on specific future dates at predetermined rates. Foreign currency contracts are valued using foreign currency exchange rates and forward rates as provided by an independent pricing service on the Valuation Date.
Financial instruments for which prices are not available from an independent pricing service may be valued using market quotations obtained from one or more dealers that make markets in the respective financial instrument in accordance with procedures established by the Company’s Board of Directors.
U.S. GAAP defines fair value as the price that the Fund would receive to sell an asset or pay to transfer a liability in an orderly transaction between market participants. The U.S. GAAP fair value measurement standards require disclosure of a fair value hierarchy for each major category of assets and liabilities. Various inputs are used in determining the fair value of the Fund’s investments. These inputs are summarized into three broad hierarchy levels. This hierarchy is based on whether the valuation inputs are observable or unobservable. These levels are:
| · | Level 1 – Quoted prices in active markets for identical securities. Level 1 may include exchange traded instruments such as domestic equities, some foreign equities, options, futures, mutual funds, exchange traded funds, rights and warrants. |
| · | Level 2 – Observable inputs other than Level 1 prices, such as quoted prices for similar securities; quoted prices in markets that are not active; or other inputs that are observable or can be corroborated by observable market data. Level 2 may include debt securities that are traded less frequently than exchange traded instruments and which are valued using independent pricing services; foreign equities, that are principally traded on certain foreign markets and are adjusted daily pursuant to a fair value pricing service in order to reflect an adjustment for the factors occurring after the close of certain foreign markets but before the NYSE Close; and short-term securities, which are valued at amortized cost. |
| · | Level 3 – Significant unobservable inputs that are supported by limited or no market activity. Level 3 may include financial instruments whose values are determined using broker quotes or require significant management judgment or estimation. These unobservable valuation inputs may include estimates for current yields, maturity/duration, prepayment speed, and broker quotes for comparable securities along with other assumptions relating to credit quality, collateral value, complexity of the security structure, general market conditions and liquidity. This category may include securities where trading has been halted or there are certain restrictions on trading. While these securities are priced using unobservable inputs, the valuation of these securities reflects the best available data and management believes the prices are a reasonable representation of exit price. |
Valuation levels are not necessarily indicative of the risk associated with investing in such securities. Individual securities within any of the above mentioned asset classes may be assigned a different hierarchical level than those presented above, as individual circumstances dictate.
Hartford MidCap Value HLS Fund
Notes to Financial Statements – (continued)
December 31, 2011
(000’s Omitted)
For additional information, refer to the Investment Valuation Hierarchy Level Summary and the Level 3 roll-forward reconciliation which follow the Schedule of Investments.
For purposes of reporting transfers between different hierarchy levels, both transfers in and out of each level, as applicable, are shown as if they occurred at the beginning of the period.
| c) | Security Transactions and Investment Income – Security transactions are recorded as of the trade date (the date the order to buy or sell is executed) for financial reporting purposes. Securities purchased or sold on a when-issued or delayed-delivery basis may be settled a month or more after the trade date. Realized gains and losses are determined on the basis of identified cost. |
Dividend income is accrued as of the ex-dividend date, except certain dividends from foreign securities where the ex-dividend date may have passed are recorded as soon as the Fund is informed of the dividend. Interest income, including amortization of premium and accretion of discounts, is accrued on a daily basis.
| d) | Foreign Currency Transactions – Assets and liabilities denominated in currencies other than U.S. dollars are translated into U.S. dollars at the exchange rates in effect on the valuation date. Purchases and sales of investment securities, income, and expenses are translated into U.S. dollars at the exchange rates on the dates of such transactions. |
The Fund does not isolate that portion of portfolio security valuation resulting from fluctuations in the foreign currency exchange rates from the fluctuations arising from changes in the market prices of securities held. Exchange rate fluctuations are included with the net realized and unrealized gain or loss on investments in the accompanying financial statements.
Net realized foreign exchange gains or losses arise from sales of foreign currencies and the difference between asset and liability amounts initially stated in foreign currencies and the U.S. dollar value of the amounts actually received or paid. Net unrealized foreign exchange gains or losses arise from changes in the value of other assets and liabilities at the end of the reporting period, resulting from changes in the exchange rates.
| e) | Joint Trading Account – The Fund may invest cash balances into a joint trading account that may be invested in one or more repurchase agreements. |
| f) | Fund Share Valuation and Dividend Distributions to Shareholders – Orders for the Fund’s shares are executed in accordance with the investment instructions of the contract holders and plan participants. The NAV of the Fund’s shares is determined as of the close of business on each business day of the Exchange. The NAV is determined separately for each class of shares of the Fund by dividing the Fund’s net assets attributable to that class by the number of shares of the class outstanding. Each class of shares offered by the Fund has equal rights as to assets and voting privileges (except that shareholders of a class have exclusive voting rights regarding any matter relating solely to that class of shares). Income and non-class specific expenses are allocated daily to each class on the basis of the relative net assets of the class. Realized and unrealized capital gains and losses are allocated daily based on the relative net assets of each class of shares of the Fund. |
Orders for the purchase of the Fund’s shares received prior to the close of the Exchange on any day the Exchange is open for business are priced at the NAV determined as of the close of the Exchange. Orders received after the close of the Exchange, or on a day on which the Exchange and/or the Fund is not open for business, are priced at the next determined NAV.
Dividends are declared pursuant to a policy adopted by the Company’s Board of Directors based upon the investment performance of the Fund. The policy of the Fund is to pay dividends from net investment income and realized capital gains, if any, at least once a year.
Distributions from net investment income, net realized capital gains and capital are determined in accordance with federal income tax regulations, which may differ from U.S. GAAP with respect to character and timing. These differences may include but are not limited to losses deferred due to wash sale adjustments, foreign currency gains and losses, adjustments related to Passive Foreign Investment Companies (“PFICs”), Real Estate Investment Trusts (“REITs”), Regulated Investment Companies (“RICs”), certain derivatives and partnerships. Permanent book and federal income tax basis differences relating to shareholder distributions will result in reclassifications to certain of the Fund’s capital accounts (see Federal Income Taxes: Reclassification of Capital Accounts note).
| 3. | Securities and Other Investments: |
| a) | Repurchase Agreements – A repurchase agreement is an agreement by which a counterparty agrees to sell a security and agrees to repurchase the security sold at a mutually agreed upon time and price. At the time the Fund enters into a repurchase agreement, the value of the underlying collateral security(ies), including accrued interest, will be equal to or exceed the value of the repurchase agreement. Repurchase agreements expose the Fund to counterparty risk. To minimize counterparty risk, the securities that serve to collateralize the repurchase agreement are held by the Fund's custodian in book entry or physical form in the custodial account of the Fund or in a third party custodial account. Repurchase agreements are valued at cost plus accrued interest. The Fund, as shown on the Schedule of Investments, had outstanding repurchase agreements as of December 31, 2011. |
| b) | Illiquid and Restricted Securities – The Fund is permitted to invest up to 15% of its net assets in illiquid securities. Illiquid securities are those that may not be sold or disposed of in the ordinary course of business within seven days, at approximately the price used to determine the Fund’s NAV. The Fund may not be able to sell illiquid securities or other investments when its sub-adviser considers it desirable to do so or may have to sell such securities or investments at a price that is lower than the price that could be obtained if the securities or investments were more liquid. A sale of illiquid securities or other investments may require more time and may result in higher dealer discounts and other selling expenses than does the sale of those that are liquid. Illiquid securities and investments also may be more difficult to value due to the unavailability of reliable market quotations for such securities or investments, and an investment in them may have an adverse impact on the Fund’s NAV. The Fund may also purchase certain restricted securities that can only be resold to certain qualified investors and may be determined to be liquid pursuant to policies and guidelines established by the Company’s Board of Directors. The Fund, as shown on the Schedule of Investments, had illiquid and/or restricted securities as of December 31, 2011. |
| c) | Securities Purchased on a When-Issued or Delayed-Delivery Basis – Delivery and payment for securities that have been purchased by the Fund on a forward commitment, or when-issued or delayed-delivery basis, take place beyond the customary settlement period. A fund may dispose of or renegotiate a delayed-delivery transaction after it is entered into, and may sell delayed-delivery securities before they are delivered, which may result in a realized gain or loss. During this period, such securities are subject to market fluctuations, and the Fund identifies securities segregated in its records with value at least equal to the amount of the commitment. As of December 31, 2011, the Fund had no outstanding when-issued or delayed delivery securities. |
| 4. | Financial Derivative Instruments: |
The following disclosures contain information on how and why the Fund uses derivative instruments, the credit-risk-related contingent features in certain derivative instruments, and how derivative instruments affect the Fund’s financial position and results of operations. The location and fair value amounts of these instruments on the Statement of Assets and Liabilities and the realized gains and losses and changes in unrealized gains and losses on the Statement of Operations, each categorized by type of derivative contract, are included in the following Additional Derivative Instrument Information footnote. The derivative instruments outstanding as of period-end are disclosed in the notes to the Schedule of Investments and the amounts of realized gains and losses and changes in unrealized gains and losses on derivative instruments during the period are disclosed in the Statement of Operations.
Hartford MidCap Value HLS Fund
Notes to Financial Statements – (continued)
December 31, 2011
(000’s Omitted)
| a) | Foreign Currency Contracts – The Fund may enter into foreign currency contracts that obligate the Fund to purchase or sell currencies at specified future dates. Foreign currency contracts are used to hedge the currency exposure associated with some or all of the Fund's securities and/or as part of an investment strategy. Foreign currency contracts are marked to market daily and the change in value is recorded by the Fund as an unrealized gain or loss. The Fund will record a realized gain or loss when the foreign currency contract is settled. |
Foreign currency contracts involve elements of market risk in excess of the amounts reflected in the Statement of Assets and Liabilities. In addition, risks may arise upon entering into these contracts from the potential inability of the counterparties to meet the terms of the contracts and from unanticipated movements in the value of the foreign currencies relative to the U.S. dollar. The Fund had outstanding foreign currency contracts as shown on the Schedule of Investments as of December 31, 2011.
| b) | Additional Derivative Instrument Information: |
| Fair Values of Derivative Instruments on the Statement of Assets and Liabilities as of December 31, 2011: |
| | | Risk Exposure Category | |
| | | Interest Rate Contracts | | | Foreign Exchange Contracts | | | Credit Contracts | | | Equity Contracts | | | Commodity Contracts | | | Other Contracts | | | Total | |
| Liabilities: | | | | | | | | | | | | | | | | | | | | | |
| Unrealized depreciation on foreign currency contracts | $ | — | | $ | — | | $ | — | | $ | — | | $ | — | | $ | — | | $ | — | |
| Total | $ | — | | $ | — | | $ | — | | $ | — | | $ | — | | $ | — | | $ | — | |
The volume of derivative activity was minimal during the year ended December 31, 2011
The Effect of Derivative Instruments on the Statement of Operations for the year ended December 31, 2011:
| | Risk Exposure Category | |
| | Interest
Rate Contracts | | Foreign Exchange Contracts | | Credit Contracts | | Equity Contracts | | Commodity Contracts | | Other Contracts | | Total | |
| Realized Gain (Loss) on Derivatives Recognized as a Result of Operations: |
| Net realized gain on foreign currency contracts | $ | — | | $ | 40 | | $ | — | | $ | — | | $ | — | | $ | — | | $ | 40 | |
| Total | $ | — | | $ | 40 | | $ | — | | $ | — | | $ | — | | $ | — | | $ | 40 | |
| a) | Counterparty Risk – The Fund may be exposed to counterparty risk, or the risk that an institution or other entity with which the Fund has unsettled or open transactions will default. |
| b) | Market Risks – If the Fund invests directly in foreign currencies or in securities that trade in, and receive revenues in, foreign currencies, or in derivatives that provide exposure to foreign currencies, it will be subject to the risk that those currencies will decline in value relative to the base currency of the Fund, or, in the case of hedging positions, that the Fund’s base currency will decline in value relative to the currency being hedged. Currency rates in foreign countries may fluctuate significantly over short periods of time for a number of reasons, including changes in interest rates, intervention (or the failure to intervene) by U.S. or foreign governments, central banks or supranational entities, such as the International Monetary Fund, or by the imposition of currency controls or other political developments in the United States or abroad. As a result, the Fund’s investments in foreign currency denominated securities may reduce the returns of the Fund. The market values of equity securities, such as common stocks and preferred stocks, or equity related investments, such as futures and options, may decline due to general market conditions which are not specifically related to a particular company, such as real or perceived adverse economic conditions, changes in the general outlook for corporate earnings, changes in interest or currency rates or adverse investor sentiment generally. The market value of |
equity securities may also decline due to factors which affect a particular industry or industries, such as labor shortages or increased production costs and competitive conditions within an industry. Equity securities and equity related investments generally have greater market price volatility than fixed income securities.
| a) | Federal Income Taxes – For federal income tax purposes, the Fund intends to continue to qualify as a RIC under Subchapter M of the Internal Revenue Code (“IRC”) by distributing substantially all of its taxable net investment income and net realized capital gains to its shareholders and otherwise complying with the requirements of RICs. The Fund has distributed substantially all of its income and capital gains in prior years, if applicable, and intends to distribute substantially all of its income and capital gains prior to the next fiscal year-end. Accordingly, no provision for federal income or excise taxes has been made in the accompanying financial statements. Distributions from short-term capital gains are treated as ordinary income distributions for federal income tax purposes. |
| b) | Net Investment Income (Loss), Net Realized Gains (Losses) – Net investment income (loss) and net realized gains (losses) may differ for financial statement and tax purposes primarily because of losses deferred due to wash sale adjustments, foreign currency gains and losses, adjustments related to PFICs, REITs, RICs, certain derivatives and partnerships. The character of distributions made during the year from net investment income or net realized gains may differ from their ultimate characterization for federal income tax purposes. Also, due to the timing of dividend distributions, the fiscal year in which amounts are distributed may differ from the year that the income or realized gains (losses) were recorded by the Fund. |
| c) | Distributions and Components of Distributable Earnings – The tax character of distributions paid by the Fund for the periods indicated is as follows (as adjusted for dividends payable): |
| | | For the Year Ended
December 31, 2011 | | | For the Year Ended
December 31, 2010 | |
| Ordinary Income | | $ | 54 | | | $ | 3,020 | |
As of December 31, 2011, the Fund’s components of distributable earnings (deficit) on a tax basis were as follows:
| | | Amount | |
| Undistributed Ordinary Income | | $ | 5,097 | |
| Accumulated Capital and Other Losses* | | | (61,458 | ) |
| Unrealized Appreciation† | | | 8,849 | |
| Total Accumulated Deficit | | $ | (47,512 | ) |
| | * | The Fund has capital loss carryforwards that are identified in the Capital Loss Carryforward note that follows. |
| | † | The difference between book-basis and tax-basis unrealized appreciation (depreciation) may be attributable to the losses deferred due to wash sale adjustments, foreign currency gains and losses, adjustments related to PFICs, REITs, RICs, certain derivatives and partnerships. |
| d) | Reclassification of Capital Accounts – The Fund may record reclassifications in its capital accounts. These reclassifications have no impact on the total net assets of the Fund. The reclassifications are a result of permanent differences between U.S. GAAP and tax accounting for such items as foreign currency, PFICs, expiration or utilization of capital loss carryforwards or net operating losses. Adjustments are made to reflect the impact these items have on current and future distributions to shareholders. Therefore, the source of the Fund’s distributions may be shown in the accompanying Statement of Changes in Net Assets as from undistributed net investment income, from accumulated net realized gains on investments or from capital depending on the type of book and tax differences that exist. For the year ended December 31, 2011, the Fund recorded reclassifications to increase (decrease) the accounts listed below: |
Hartford MidCap Value HLS Fund
Notes to Financial Statements – (continued)
December 31, 2011
(000’s Omitted)
| d) | Reclassification of Capital Accounts – The Fund may record reclassifications in its capital accounts. These reclassifications have no impact on the total net assets of the Fund. The reclassifications are a result of permanent differences between U.S. GAAP and tax accounting for such items as foreign currency, PFICs, expiration or utilization of capital loss carryforwards or net operating losses. Adjustments are made to reflect the impact these items have on current and future distributions to shareholders. Therefore, the source of the Fund’s distributions may be shown in the accompanying Statement of Changes in Net Assets as from undistributed net investment income, from accumulated net realized gains on investments or from capital depending on the type of book and tax differences that exist. For the year ended December 31, 2011, the Fund recorded reclassifications to increase (decrease) the accounts listed below: |
| | | Amount | |
| Undistributed Net Investment Income | | $ | 365 | |
| Accumulated Net Realized Gain (Loss) | | | (365 | ) |
| e) | Capital Loss Carryforward – On December 22, 2010, the Regulated Investment Company Modernization Act of 2010 (the “Act”) was enacted, which made changes to the capital loss carryforward rules. The changes are effective for taxable years beginning after the date of enactment. Under the Act, funds are permitted to carry forward capital losses for an unlimited period. However, any losses incurred during those future taxable years will be required to be utilized prior to the losses incurred in pre-enactment taxable years, which carry an expiration date. As a result of this ordering rule, pre-enactment capital loss carryforwards may be more likely to expire unused. Additionally, post-enactment capital loss carryforwards will retain their character as either short-term or long-term capital losses rather than being considered all short-term as permitted under prior regulation. |
At December 31, 2011 (tax-year-end), the Fund had capital loss carryforwards for U.S. federal income tax purposes as follows:
| Year of Expiration | | | Amount | |
| 2016 | | $ | 8,562 | |
| 2017 | | | 52,896 | |
| Total | | $ | 61,458 | |
As a result of current or past mergers in the Fund, certain provisions in the Internal Revenue Code may limit the future utilization of capital losses. As of December 31, 2011, the Fund utilized $68,839 of prior year capital loss carryforwards
| f) | Accounting for Uncertainty in Income Taxes – The Fund has adopted financial reporting rules that require the Fund to analyze all open tax years, as defined by the statute of limitations, for all major jurisdictions. Generally, tax authorities can examine all tax returns filed for the last three years. The Fund does not have an examination in progress. |
The Fund has reviewed all open tax years and major jurisdictions and concluded that these financial reporting rules had no effect on the Fund’s financial position or results of operations. There is no tax liability resulting from unrecognized tax benefits relating to uncertain income tax positions taken or expected to be taken on the tax return for the fiscal year ended December 31, 2011. The Fund is also not aware of any tax positions for which it is reasonably possible that the total amounts of unrecognized tax benefits will significantly change in the next twelve months.
| a) | Investment Management Agreement – HL Investment Advisors, LLC (“HL Advisors”), an indirect wholly owned subsidiary of The Hartford Financial Services Group, Inc. (“The Hartford”), serves as investment manager to the Fund pursuant to an Investment Management Agreement with the Company. As investment manager, HL Advisors has overall investment supervisory responsibility for the Fund. In addition, HL Advisors provides administrative personnel, services, equipment, facilities and office space for proper operation of the Fund. HL Advisors has contracted with Wellington Management Company, LLP (“Wellington Management”) under a sub-advisory agreement for the provision of day-to-day investment management services to the Fund in accordance with the Fund’s investment objective and policies. The Fund pays a fee to HL Advisors, a portion of which may be used to compensate Wellington Management. |
The schedule below reflects the rates of compensation paid to HL Advisors for investment management services rendered as of December 31, 2011; the rates are accrued daily and paid monthly.
| Average Daily Net Assets | Annual Fee |
| On first $250 million | 0.8250% |
| On next $250 million | 0.7750% |
| On next $500 million | 0.7250% |
| On next $4 billion | 0.6750% |
| On next $5 billion | 0.6725% |
| Over $10 billion | 0.6700% |
Effective March 1, 2012, HL Advisors will be paid compensation for investment management services according to the following schedule:
| Average Daily Net Assets | Annual Fee |
| On first $500 million | 0.8000% |
| On next $500 million | 0.7250% |
| On next $1.5 billion | 0.6750% |
| On next $2.5 billion | 0.6700% |
| On next $5 billion | 0.6650% |
| Over $10 billion | 0.6600% |
| b) | Accounting Services Agreement – Pursuant to the Fund Accounting Agreement between HLIC and the Company, on behalf of the Fund, HLIC provides accounting services to the Fund and receives monthly compensation based on the Fund’s average daily net assets at the rates set forth below. The Fund’s accounting services fees are accrued daily and paid monthly. |
| Average Daily Net Assets | Annual Fee |
| All Assets | 0.010% |
| c) | Operating Expenses – Allocable expenses incurred by the Company are allocated to each Fund and allocated to classes within a Fund in proportion to the average daily net assets of the Fund and each class, except where allocation of certain expenses is more fairly made directly to the Fund or to specific classes within a Fund. |
| d) | Fees Paid Indirectly – The Company, on behalf of the Fund, has entered into agreements with State Street Global Markets, LLC and Russell Implementation Services, Inc. to partially recapture non-discounted trade commissions. Such rebates are used to pay a portion of the Fund’s expenses. In addition, the Fund’s custodian bank has also agreed to reduce its fees when the Fund maintains cash on deposit in a non-interest-bearing custody account. For the year ended December 31, 2011, these amounts, if any, are included in the Statement of Operations. |
The ratio of expenses to average net assets in the accompanying financial highlights excludes the reduction in expenses related to fees paid indirectly. The annualized expense ratio for the period listed below reflecting the reduction for fees paid indirectly is as follows:
| | | Year Ended
December 31, 2011 | |
| Class IA | | 0.83% | |
| Class IB | | 1.08 | |
Hartford MidCap Value HLS Fund
Notes to Financial Statements – (continued)
December 31, 2011
(000’s Omitted)
| e) | Distribution Plan for Class IB shares – The Company, on behalf of the Fund, has adopted a Distribution Plan pursuant to Rule 12b-1 of the 1940 Act to compensate the Distributor, Hartford Securities Distribution Company, Inc. (a wholly owned, ultimate subsidiary of The Hartford), from assets attributable to the Class IB shares for services rendered and expenses borne in connection with activities primarily intended to result in the sale of the Class IB shares, subject to the review and approval of the Company’s Board of Directors. |
The Distribution Plan provides that the Fund may pay annually up to 0.25% of the average daily net assets of the Fund attributable to its Class IB shares for activities primarily intended to result in the sale of Class IB shares. The Board has the authority to suspend or reduce these payments at any point in time. Under the terms of the Distribution Plan and the principal underwriting agreement, the Fund is authorized to make payments monthly to the Distributor that may be used to pay or compensate entities providing distribution and shareholder servicing with respect to the Class IB shares for such entities’ fees or expenses incurred or paid in that regard. These fees are accrued daily and paid monthly.
| f) | Other Related Party Transactions – Certain officers of the Fund are directors and/or officers of HL Advisors and/or The Hartford or its subsidiaries. For the year ended December 31, 2011, a portion of the Fund’s chief compliance officer’s salary was paid by all the investment companies in the Hartford fund complex. The portion allocated to the Fund was in the amount of $1. Hartford Administrative Services Company (“HASCO”), an indirect wholly owned subsidiary of The Hartford, provides transfer agent services to the Fund. HASCO was compensated on a per account basis for providing such services. The amount paid to HASCO can be found in the Statement of Operations. These fees are accrued daily and paid monthly. |
| g) | Payment from Affiliate – In July of 2007, The Hartford entered into a settlement with the Attorneys General of the states of New York, Connecticut and Illinois relating to market timing and the company's individual variable annuity contracts in which certain payments would be made directly to the variable annuity contract holders. The distribution plan provided that unclaimed money from the settlement would be distributed to certain HLS Funds that are investment options through a Hartford individual variable annuity contract. The unclaimed money was distributed to the Fund on September 18, 2009. |
The total return in the accompanying financial highlights includes a payment from an affiliate. Had the payment from the affiliate been excluded, the impact and total return for the period listed below would have been as follows:
| | For the Year Ended December 31, 2009 |
| | Class IA | | Class IB |
| Impact from Payment from Affiliate for Attorneys General Settlement | 0.01% | | 0.01% |
| Total Return Excluding Payment from Affiliate | 44.18 | | 43.82 |
| 8. | Investment Transactions: |
For the year ended December 31, 2011, the Fund's aggregate purchases and sales of investment securities (excluding short-term investments) were as follows:
| | | Amount | |
| Cost of Purchases Excluding U.S. Government Obligations | | $ | 237,145 | |
| Sales Proceeds Excluding U.S. Government Obligations | | | 353,993 | |
The Fund is one of several Hartford funds that participate in a $500 million committed revolving line of credit facility. The facility is to be used for temporary or emergency purposes. Under the arrangement, the funds are required to own securities having a market value in excess of 300% of the total bank borrowings. The interest rate on borrowings varies depending on the nature of the loan. The facility also requires a fee to be paid based on the amount of the commitment. This commitment fee is allocated to all of the funds participating in the line of credit based on the average net assets of the funds. During the year ended December 31, 2011, the Fund did not have any borrowings under this facility.
| 10. | Industry Classifications: |
Other than the industry classifications “Other Investment Pools and Funds” and “Exchange Traded Funds,” equity industry classifications used in this report are the Global Industry Classification Standard, which was developed by and is the exclusive property and service mark of MSCI, Inc. and Standard & Poor’s.
Under the Company’s organizational documents, the Company shall indemnify its officers and directors to the full extent required or permitted under Maryland General Corporation Law and the federal securities laws. In addition, the Company, on behalf of the Fund, may enter into contracts that contain a variety of indemnifications. The Company’s maximum exposure under these arrangements is unknown. However, as of the date of these financial statements, the Company has not had prior claims or losses pursuant to these contracts and expects the risk of loss to be remote.
Hartford MidCap Value HLS Fund
Financial Highlights
- Selected Per-Share Data (A) -
| Class | | Net Asset Value at Beginning of Period | | | Net Investment Income (Loss) | | | Payments from (to) Affiliate | | | Net Realized and Unrealized Gain (Loss) on Investments | | | Total from Investment Operations | | | Dividends from Net Investment Income | | | Distributions from Realized Capital Gains | | | Distributions from Capital | | | Total Distributions | | | Net Increase (Decrease) in Net Asset Value | | | Net Asset Value at End of Period | |
| For the Year Ended December 31, 2011 |
| IA | | $ | 10.32 | | | $ | 0.07 | | | $ | – | | | $ | (0.95 | ) | | $ | (0.88 | ) | | $ | – | | | $ | – | | | $ | – | | | $ | – | | | $ | (0.88 | ) | | $ | 9.44 | |
| IB | | | 10.29 | | | | 0.04 | | | | – | | | | (0.95 | ) | | | (0.91 | ) | | | – | | | | – | | | | – | | | | – | | | | (0.91 | ) | | | 9.38 | |
| For the Year Ended December 31, 2010(E) |
| IA | | | 8.33 | | | | 0.05 | | | | – | | | | 2.00 | | | | 2.05 | | | | (0.06 | ) | | | – | | | | – | | | | (0.06 | ) | | | 1.99 | | | | 10.32 | |
| IB | | | 8.30 | | | | 0.03 | | | | – | | | | 1.99 | | | | 2.02 | | | | (0.03 | ) | | | – | | | | – | | | | (0.03 | ) | | | 1.99 | | | | 10.29 | |
| For the Year Ended December 31, 2009 |
| IA | | | 5.82 | | | | 0.07 | | | | – | | | | 2.50 | | | | 2.57 | | | | (0.06 | ) | | | – | | | | – | | | | (0.06 | ) | | | 2.51 | | | | 8.33 | |
| IB | | | 5.80 | | | | 0.05 | | | | – | | | | 2.49 | | | | 2.54 | | | | (0.04 | ) | | | – | | | | – | | | | (0.04 | ) | | | 2.50 | | | | 8.30 | |
| For the Year Ended December 31, 2008 |
| IA | | | 12.34 | | | | 0.07 | | | | – | | | | (4.35 | ) | | | (4.28 | ) | | | (0.06 | ) | | | (2.18 | ) | | | – | | | | (2.24 | ) | | | (6.52 | ) | | | 5.82 | |
| IB | | | 12.30 | | | | 0.05 | | | | – | | | | (4.33 | ) | | | (4.28 | ) | | | (0.04 | ) | | | (2.18 | ) | | | – | | | | (2.22 | ) | | | (6.50 | ) | | | 5.80 | |
| For the Year Ended December 31, 2007 |
| IA | | | 14.18 | | | | 0.08 | | | | – | | | | 0.51 | | | | 0.59 | | | | (0.07 | ) | | | (2.36 | ) | | | – | | | | (2.43 | ) | | | (1.84 | ) | | | 12.34 | |
| IB | | | 14.13 | | | | 0.04 | | | | – | | | | 0.53 | | | | 0.57 | | | | (0.04 | ) | | | (2.36 | ) | | | – | | | | (2.40 | ) | | | (1.83 | ) | | | 12.30 | |
| (A) | Information presented relates to a share outstanding throughout the indicated period. |
| (B) | The figures do not include sales charges or other fees which may be applied at the variable life insurance, variable annuity or qualified retirement plan product level. Any such additional sales charges or other fees would lower the Fund's performance. |
| (C) | Ratios do not reflect reductions for fees paid indirectly. Please see Fees Paid Indirectly in the Notes to Financial Statements. |
| (D) | Portfolio turnover rate is calculated on the basis of the Fund as a whole without distinguishing between the classes of shares issued. |
| (E) | Per share amounts have been calculated using the average shares method. |
| (F) | During the year ended December 31, 2010, the Fund incurred $89.7 million in purchases associated with the transition of assets from Hartford SmallCap Value HLS Fund, which merged into the Fund on July 30, 2010. These purchases were excluded from the portfolio turnover calculation. |
| (G) | Total return without the inclusion of the Payment from (to) Affiliate can be found in Expenses in the accompanying Notes to Financial Statements. |
- Ratios and Supplemental Data -
Total Return(B) | | Net Assets at End of Period | | | Ratio of Expenses to Average Net Assets Before Waivers(C) | | | Ratio of Expenses to Average Net Assets After Waivers(C) | | | Ratio of Net Investment Income (Loss) to Average Net Assets | | | Portfolio Turnover Rate(D) | |
| |
| (8.56 | )% | $ | 341,583 | | | | 0.83 | % | | | 0.83 | % | | | 0.57 | % | | | 43 | % |
| (8.79 | ) | | 116,563 | | | | 1.08 | | | | 1.08 | | | | 0.32 | | | | – | |
| | | | | | | | | | | | | | | | | | | | | |
| 24.67 | | | 462,281 | | | | 0.85 | | | | 0.85 | | | | 0.57 | | | | 57 | (F) |
| 24.36 | | | 163,498 | | | | 1.10 | | | | 1.10 | | | | 0.30 | | | | – | |
| | | | | | | | | | | | | | | | | | | | | |
| 44.19 | (G) | | 348,742 | | | | 0.86 | | | | 0.86 | | | | 0.87 | | | | 50 | |
| 43.83 | (G) | | 145,920 | | | | 1.11 | | | | 1.11 | | | | 0.62 | | | | – | |
| | | | | | | | | | | | | | | | | | | | | |
| (40.21 | ) | | 301,896 | | | | 0.81 | | | | 0.81 | | | | 0.82 | | | | 51 | |
| (40.36 | ) | | 128,483 | | | | 1.06 | | | | 1.06 | | | | 0.57 | | | | – | |
| | | | | | | | | | | | | | | | | | | | | |
| 2.13 | | | 615,430 | | | | 0.79 | | | | 0.79 | | | | 0.53 | | | | 50 | |
| 1.87 | | | 300,502 | | | | 1.04 | | | | 1.04 | | | | 0.28 | | | | – | |
Report of Independent Registered Public Accounting Firm
The Board of Directors and Shareholders of
Hartford Series Fund, Inc.
We have audited the accompanying statement of assets and liabilities, including the schedule of investments, of Hartford MidCap Value HLS Fund (one of the portfolios constituting Hartford Series Fund, Inc. (the Funds)) as of December 31, 2011, and the related statement of operations for the year then ended, the statements of changes in net assets for each of the two years in the period then ended, and the financial highlights for each of the five years in the period then ended. These financial statements and financial highlights are the responsibility of the Funds’ management. Our responsibility is to express an opinion on these financial statements and financial highlights based on our audits.
We conducted our audits in accordance with the standards of the Public Company Accounting Oversight Board (United States). Those standards require that we plan and perform the audit to obtain reasonable assurance about whether the financial statements and financial highlights are free of material misstatement. We were not engaged to perform an audit of the Funds’ internal control over financial reporting. Our audits included consideration of internal control over financial reporting as a basis for designing audit procedures that are appropriate in the circumstances, but not for the purpose of expressing an opinion on the effectiveness of the Funds’ internal control over financial reporting. Accordingly, we express no such opinion. An audit also includes examining, on a test basis, evidence supporting the amounts and disclosures in the financial statements and financial highlights, assessing the accounting principles used and significant estimates made by management, and evaluating the overall financial statement presentation. Our procedures included confirmation of securities owned as of December 31, 2011, by correspondence with the custodian and brokers or by other appropriate auditing procedures where replies from brokers were not received. We believe that our audits provide a reasonable basis for our opinion.
In our opinion, the financial statements and financial highlights referred to above present fairly, in all material respects, the financial position of Hartford MidCap Value HLS Fund of Hartford Series Fund, Inc. at December 31, 2011, the results of its operations for the year then ended, the changes in its net assets for each of the two years in the period then ended, and the financial highlights for each of the five years in the period then ended, in conformity with U.S. generally accepted accounting principles.
| | |
Minneapolis, MN
February 13, 2012 | |
Hartford MidCap Value HLS Fund
Directors and Officers (Unaudited)
The Board of Directors of the Company appoints officers who are responsible for the day-to-day operations of the Fund and who execute policies formulated by the Directors. Each director serves until his or her death, resignation, or retirement or until the next annual meeting of shareholders is held or until his or her successor is elected and qualifies.
Directors and officers who are employed by or who have a financial interest in The Hartford are considered “interested” persons of the Fund pursuant to the 1940 Act. Each officer and two of the Company’s directors, as noted in the chart below, are “interested” persons of the Fund. Each director serves as a director for The Hartford Mutual Funds, Inc., The Hartford Mutual Funds II, Inc., Hartford Series Fund, Inc., Hartford HLS Series Fund II, Inc., and as a trustee for The Hartford Alternative Strategies Fund, which, as of December 31, 2011, collectively consist of 91 funds. Correspondence may be sent to directors and officers c/o Hartford Mutual Funds, P.O. Box 2999, Hartford, Connecticut 06104-2999, except that correspondence to Ms. Fagely may be sent to 500 Bielenberg Drive, Woodbury, Minnesota 55125.
The table below sets forth, for each director and officer, his or her name, year of birth, current position with the Company and date first elected or appointed to Hartford Series Fund, Inc. (“HSF”), and Hartford HLS Series Fund II, Inc. (“HSF2”), principal occupation, and, for directors, other directorships held. The Fund’s statement of additional information contains further information on the directors and is available free of charge by calling 1-800-862-6668 or writing to Hartford HLS Funds, c/o Individual Annuity Services, P.O. Box 5085, Hartford, CT 06102-5085.
Information on the aggregate remuneration paid to the directors of the Company can be found in the Statement of Operations herein. The Fund pays to The Hartford a portion of the chief compliance officer’s compensation, but does not pay salaries or compensation to any of their other officers or directors who are employed by The Hartford.
Non-Interested Directors
Lynn S. Birdsong (1946) Director since 2003, Co-Chairman of the Investment Committee
Mr. Birdsong is a private investor. Mr. Birdsong currently serves as a Director of the Sovereign High Yield Investment Company (April 2010 to current). Mr. Birdsong currently serves as an Independent Director of Nomura Partners Funds, Inc. (formerly, The Japan Fund) (March 2003 to current). From 2003 to March 2005, Mr. Birdsong was an independent director of the Atlantic Whitehall Funds. From 1979 to 2002, Mr. Birdsong was a managing director of Zurich Scudder Investments, an investment management firm. During his employment with Scudder, Mr. Birdsong was an Interested Director of The Japan Fund. Since 1981, Mr. Birdsong has been a partner in Birdsong Company, an advertising specialty firm.
Robert M. Gavin, Jr. (1940) Director since 2002 (HSF) and 1986 (HSF2), Chairman of the Board since 2004
Dr. Gavin is an educational consultant. Prior to September 1, 2001, he was President of Cranbrook Education Community and prior to July 1996, he was President of Macalester College, St. Paul, Minnesota.
Duane E. Hill (1945) Director since 2001 (HSF) and 2002 (HSF2), Chairman of the Nominating Committee
Mr. Hill is Partner of TSG Ventures L.P., a private equity investment company. Mr. Hill is a former partner of TSG Capital Group, a private equity investment firm that served as sponsor and lead investor in leveraged buyouts of middle market companies.
Sandra S. Jaffee (1941) Director since 2005
Ms. Jaffee served as Chairman (2008 to 2009) and Chief Executive Officer of Fortent (formerly Searchspace Group), a leading provider of compliance/regulatory technology to financial institutions from August 2005 to August 2009. From August 2004 to August 2005, Ms. Jaffee served as an Entrepreneur in Residence with Warburg Pincus, a private equity firm. From September 1995 to July 2004, Ms. Jaffee served as Executive Vice President at Citigroup, where she was President and Chief Executive Officer of Citibank’s Global Securities Services (1995 to 2003). Ms. Jaffe currently serves as a member of the Board of Directors of Broadridge Financial Solutions as well as a Trustee of Muhlenberg College.
William P. Johnston (1944) Director since 2005, Chairman of the Compliance Committee
In June 2006, Mr. Johnston was appointed as Senior Advisor to The Carlyle Group, a global private equity investment firm. In August 2007, Mr. Johnston was elected to the Board of Directors of LifeCare Holdings, Inc. In February 2008, Mr. Johnston was elected to the Board of Directors of HCR-ManorCare, Inc. In May 2006, Mr. Johnston was elected to the Supervisory Board of Fresenius Medical Care AG & Co. KGaA, after its acquisition of Renal Care Group, Inc. in March 2006. Mr. Johnston joined Renal Care Group in November 2002 as a member of the Board of Directors and served as Chairman of the Board from March 2003 through March 2006. Mr. Johnston served as a Director of MultiPlan, Inc. from July 2006 through August 2010. From September 1987 to December 2002, Mr. Johnston was with Equitable Securities Corporation (and its successors, SunTrust Equitable Securities and SunTrust Robinson Humphrey) serving in various investment banking and managerial positions, including Managing Director and Head of Investment Banking, Chief Executive Officer and Vice Chairman.
Hartford MidCap Value HLS Fund
Directors and Officers (Unaudited) – (continued)
Phillip O. Peterson (1944) Director since 2002 (HSF) and 2000 (HSF2), Chairman of the Audit Committee
Mr. Peterson is a mutual fund industry consultant. He was a partner of KPMG LLP (an accounting firm) until July 1999. Mr. Peterson joined William Blair Funds in February 2007 as a member of the Board of Trustees. From January 2004 to April 2005, Mr. Peterson served as Independent President of the Strong Mutual Funds.
Lemma W. Senbet (1946) Director since 2005
Dr. Senbet is the William E. Mayer Chair Professor of Finance and Director, Center for Financial Policy, at the University of Maryland, Robert H. Smith School of Business. He was chair of the Finance Department from 1998 to 2006. Previously he was a chaired professor of finance at the University of Wisconsin-Madison. Also, he was director of the Fortis Funds from March 2000 to July 2002. Dr. Senbet served the finance profession in various capacities, including as director of the American Finance Association and President of the Western Finance Association. In 2006, Dr. Senbet was inducted Fellow of Financial Management Association International for his career-long distinguished scholarship and professional service.
Interested Directors and Officers
David N. Levenson (1966) Director since 2010
Mr. Levenson currently serves as President of The Hartford’s Wealth Management business. He was appointed to this role in July 2010. Previously, Mr. Levenson served as Executive Vice President of Legacy Holdings for The Hartford from June 2009 to July 2010. From 2006 to 2009, Mr. Levenson was with Hartford Life Insurance K.K. where he served as President and Chief Executive Officer from 2007 to 2009. He served as Managing Director of Hartford Investment Management Company from 2005 to 2006. Additionally, Mr. Levenson serves as Executive Vice President of The Hartford and as President, Director and Chief Executive Officer of Hartford Life Insurance Company (“HLIC”) and Hartford Life, Inc. (“HL Inc.”).
Lowndes A. Smith (1939) Director since 1996 (HSF) and 2002 (HSF2), Co-Chairman of the Investment Committee
Mr. Smith served as Vice Chairman of The Hartford from February 1997 to January 2002, as President and Chief Executive Officer of HL Inc. from February 1997 to January 2002, and as President and Chief Operating Officer of The Hartford Life Insurance Companies from January 1989 to January 2002. Mr. Smith serves as a Director of White Mountains Insurance Group, Ltd., One Beacon Insurance and Symetra Financial and as a Managing Director of Whittington Gray Associates.
Other Officers
James E. Davey (1964) President and Chief Executive Officer since 2010
Mr. Davey serves as Executive Vice President of HLIC. Additionally, Mr. Davey serves as President, Chief Executive Officer and Manager of Hartford Investment Financial Services, Inc. (“HIFSCO”) and President, Chief Executive Officer and Manager of HL Advisors. Mr. Davey joined The Hartford in 2002.
Michael R. Dressen (1963) AML Compliance Officer since 2011
Mr. Dressen currently serves as Assistant Vice President of HLIC. He also serves as Chief Compliance Officer and AML Compliance Officer of Hartford Administrative Services Company (“HASCO”) and as Assistant Secretary and Compliance Officer of HIFSCO. Mr Dressen joined The Hartford in 2005 from State Farm Insurance Companies where he held various positions related to mutual funds, variable products, and property casualty insurance.
Tamara L. Fagely (1958) Vice President, Treasurer and Controller since 2002 (HSF) and 1993 (HSF2)
Ms. Fagely has been a Vice President of HASCO since 1998 and Chief Financial Officer since 2006. Currently Ms. Fagely is a Vice President of HLIC. She served as Assistant Vice President of HLIC from December 2001 through March 2005. In addition, Ms. Fagely is Controller and Chief Financial Officer of HIFSCO.
Dr. Robert J. Froehlich (1953) Senior Managing Director since 2009
Dr. Froehlich joined The Hartford as Senior Managing Director in September 2009. Prior to joining The Hartford, Dr. Froehlich served as Vice Chairman of Deutsche Asset Management from 1997-2009.
Edward P. Macdonald (1967) Vice President, Secretary and Chief Legal Officer since 2005
Mr. Macdonald serves as Vice President of HLIC and Chief Legal Officer of Mutual Funds and Vice President of HIFSCO. He also serves as Vice President and Secretary of HASCO, and Chief Legal Officer, Secretary and Vice President of HL Advisors. Mr. Macdonald joined The Hartford in 2005.
Vernon J. Meyer (1964) Vice President since 2006
Mr. Meyer serves as Senior Vice President of HLIC. He also serves as Senior Vice President of HIFSCO and HL Advisors. Mr. Meyer joined The Hartford in 2004.
Colleen B. Pernerewski (1969) Vice President and Chief Compliance Officer since 2010
Ms. Pernerewski serves as Vice President and Chief Investment Advisor Compliance Officer of HIFSCO and as Vice President and Chief Compliance Officer of HL Advisors. Ms. Pernerewski joined The Hartford in 2005 from Travelers Life and Annuity where she served as Counsel (2004-2005). Prior to Travelers Life and Annuity, Ms. Pernerewski held the position of Counsel at The Hartford (1998-2004).
Elizabeth L. Schroeder (1966) Vice President since 2010
Ms. Schroeder currently serves as Assistant Vice President of HLIC. Ms. Schroeder joined HLIC in 1991. She is also an Assistant Vice President of HASCO, HIFSCO and HL Advisors.
Martin Swanson (1962) Vice President since 2010
Mr. Swanson is a Vice President of HLIC. Mr. Swanson also serves as Vice President/Marketing for HIFSCO. Prior to joining HLIC in 1998, Mr. Swanson was a Vice President at PaineWebber, Inc.
Jane Wolak (1961) Vice President since 2009
Ms. Wolak currently serves as Senior Vice President of HLIC. Ms. Wolak joined HLIC as Vice President, Retail Product Services in May 2007. She is also Vice President of HASCO. Previously, Ms. Wolak was with Sun Life Financial where she held the position of Vice President, Service Center Operations from 2001-2007.
HOW TO OBTAIN A COPY OF THE FUND’S PROXY VOTING POLICIES AND VOTING RECORDS (UNAUDITED)
A description of the policies and procedures that the Fund uses to determine how to vote proxies relating to portfolio securities and a record of how the Fund voted any proxies for the twelve-month period ended June 30, 2011 are available (1) without charge, upon request, by calling 800-862-6668 and (2) on the SEC’s website at http://www.sec.gov.
QUARTERLY PORTFOLIO HOLDINGS INFORMATION (UNAUDITED)
The Fund files a complete schedule of portfolio holdings with the SEC for the first and third quarters of each fiscal year on Form N-Q. The Fund’s Forms are available (1) without charge, upon request, by calling 800-862-6668 and (2) on the SEC’s website at http://www.sec.gov. The Form N-Q may be reviewed and copied at the SEC’s Public Reference Room in Washington, DC. Information on the operation of the Public Reference Room may be obtained by calling 1-800-SEC-0330.
Hartford MidCap Value HLS Fund
Expense Example (Unaudited)
Your Fund's Expenses
As a shareholder of the Fund, you incur two types of costs: (1) transaction costs and (2) ongoing costs including investment management fees, distribution fees, and other fund expenses. This example is intended to help you understand your ongoing costs (in dollars) of investing in the Fund and to compare these costs with the ongoing costs of investing in other mutual funds. The example is based on an investment of $1,000 invested at the beginning of the period and held for the period of June 30, 2011 through December 31, 2011.
Actual Expenses
The first set of columns of the table below provides information about actual account values and actual expenses. You may use the information in this column, together with the amount you invested, to estimate the expenses that you paid over the period. Simply divide your account value by $1,000 (for example, an $8,600 account value divided by $1,000 = 8.6), then multiply the result by the number in the line under the heading entitled “Expenses Paid During Period” to estimate the expenses you paid on your account during this period.
Hypothetical Example for Comparison Purposes
The second set of columns of the table below provides information about hypothetical account values and hypothetical expenses based on the Fund’s actual expense ratio and an assumed rate of return of 5% per year before expenses, which is not the Fund’s actual return. The hypothetical account values and expenses may not be used to estimate the actual ending account balance or expenses you paid for the period. You may use this information to compare the ongoing costs of investing in the Fund and other funds. To do so, compare this 5% hypothetical example with the 5% hypothetical examples that appear in the shareholder reports of the other funds.
Please note that the expenses shown in the table are meant to highlight your ongoing costs only and do not reflect any transactional costs, such as sales charges (loads) and CDSC. Therefore, the second set of columns of the table is useful in comparing ongoing costs only, and will not help you determine the relative total costs of owning different funds. In addition, if these transactional costs were included, your costs would be higher. Expenses are equal to the Fund's annualized expense ratios multiplied by average account value over the period, multiplied by 184/365 (to reflect the one-half year period).
| | Actual return | | | Hypothetical (5% return before expenses) | | | | | | | |
| | Beginning
Account Value
June 30, 2011 | | Ending Account Value
December 31, 2011 | | Expenses paid during the period
June 30, 2011
through
December 31, 2011 | | | Beginning
Account Value
June 30, 2011 | | Ending Account Value
December 31, 2011 | | Expenses paid during the period
June 30, 2011
through
December 31, 2011 | | Annualized expense ratio | | Days in the current 1/2 year | | Days in the full year | |
| Class IA | $ | 1,000.00 | | $ | 879.06 | | $ | 3.93 | | | $ | 1,000.00 | | $ | 1,021.02 | | $ | 4.23 | | | 0.83 | % | | 184 | | | 365 | |
| Class IB | $ | 1,000.00 | | $ | 877.95 | | $ | 5.11 | | | $ | 1,000.00 | | $ | 1,019.76 | | $ | 5.50 | | | 1.08 | % | | 184 | | | 365 | |
Hartford MidCap Value HLS Fund
Approval of Investment Management and Investment Sub-Advisory Agreements (Unaudited)
Section 15(c) of the Investment Company Act of 1940, as amended (the “1940 Act”), requires that each mutual fund’s board of directors, including a majority of those directors who are not “interested persons” of the mutual fund, as defined in the 1940 Act (the “Independent Directors”), annually review and consider the continuation of the mutual fund’s investment advisory and sub-advisory agreements. At its meeting held on August 2-3, 2011, the Board of Directors (the “Board”) of Hartford Series Fund, Inc., including each of the Independent Directors, unanimously voted to approve the continuation of the investment management agreement for Hartford MidCap Value HLS Fund (the “Fund”) with HL Investment Advisors, LLC (“HL Advisors”) and the continuation of the investment sub-advisory agreement between HL Advisors and the Fund’s sub-adviser, Wellington Management Company, LLP (the “Sub-adviser,” and together with HL Advisors, the “Advisers”) (collectively, the “Agreements”).
In the months preceding the August 2-3, 2011 meeting, the Board requested, received, and reviewed written responses from the Advisers to questions posed to them on behalf of the Independent Directors and supporting materials relating to those questions and responses. The Board considered information furnished to the Board at its meetings throughout the year, as well as information specifically prepared in connection with the annual approval of the Agreements at the Board’s meetings held on June 21-22, 2011 and August 2-3, 2011. Information provided to the Board at its meetings throughout the year included, among other things, reports on Fund performance, legal and compliance matters, sales and marketing activity, shareholder services, and the other services provided to the Fund by the Advisers and their affiliates. In addition, the Board received in-person presentations by Fund officers and representatives of HL Advisors at the Board’s meetings on June 21-22, 2011 and August 2-3, 2011 concerning the Agreements.
The Independent Directors, advised by independent legal counsel, engaged two service providers to assist them with evaluating the Agreements with respect to the Fund. Lipper Inc. (“Lipper”), an independent provider of investment company data, was retained to provide the Board with reports on how the Fund’s contractual management fees, actual management fees, other non-management fees, overall expense ratios and investment performance compared to those of mutual funds with similar investment objectives. The Independent Directors also engaged an independent financial services consulting firm (the “Consultant”) to assist them in evaluating the Fund’s management fees, sub-advisory fees, other non-management fees, overall expense ratios and investment performance. In addition, the Consultant reviewed the profitability calculations utilized by HL Advisors in connection with the continuation of the investment management agreement.
In determining to continue the Agreements for the Fund, the members of the Board reviewed and evaluated information and factors they believed to be relevant and appropriate in light of the information that the Board deemed necessary and appropriate through the exercise of their reasonable business judgment. While individual members of the Board may have weighed certain factors differently, the Board’s determination to continue the Agreements was based on a comprehensive consideration of all information provided to the Board throughout the year and specifically with respect to the continuation of the Agreements. A more detailed discussion of the factors the Board considered with respect to its approval of the Agreements is provided below.
Nature, Extent, And Quality Of Services Provided by the Advisers
The Board requested and considered information concerning the nature, extent, and quality of the services provided to the Fund by the Advisers. The Board considered, among other things, the terms of the Agreements and the range of services provided by the Advisers. The Board considered the Advisers’ professional personnel who provide services to the Fund, including each Adviser’s ability and experience in attracting and retaining qualified personnel to service the Fund. The Board considered each Adviser’s reputation and overall financial strength, as well as its willingness to consider and implement organizational and operational changes designed to improve services to the Fund. In addition, the Board considered the quality of each Adviser’s communications with the Board and responsiveness to Board inquiries.
The Board also requested and evaluated information concerning each Adviser’s regulatory and compliance environment. In this regard, the Board requested and reviewed information on each Adviser’s compliance policies and procedures, compliance history, and a report from the Fund’s Chief Compliance Officer on each Adviser’s compliance with applicable laws and regulations, including responses to regulatory developments and compliance issues raised by regulators. The Board also noted the Advisers’ support of the Fund’s compliance control structure, particularly the resources devoted by the Advisers in support of the Fund’s obligations pursuant to Rule 38a-1 under the 1940 Act.
Hartford MidCap Value HLS Fund
Approval of Investment Management and Investment Sub-Advisory Agreements (Unaudited) – (continued)
With respect to HL Advisors, the Board noted that under the Agreements, HL Advisors is responsible for the management of the Fund, including overseeing fund operations and service providers, as well as investment advisory services in connection with selecting, monitoring and supervising the Sub-adviser. The Board considered HL Advisors’ ongoing monitoring of people, process and performance, including its quarterly reviews of each of the Hartford HLS Funds, semi-annual meetings with the leaders of each Fund’s portfolio management team, and oversight of the Funds’ 49 portfolio managers. The Board recognized that HL Advisors has demonstrated a record of making changes to the management and/or strategies of the Funds when warranted. The Board considered HL Advisors’ oversight of the Sub-adviser’s investment approach and results, process for monitoring best execution of portfolio trades by the Sub-adviser, and approach to risk management with respect to the Fund and the service providers to the Fund. The Board also considered HL Advisors’ oversight of compliance with the Fund’s objective and policies as well as with applicable laws and regulations, noting that regulatory and other developments had over time led to an increase in the scope of HL Advisors’ services in this regard. In addition, the Board considered HL Advisors’ ongoing commitment to review and rationalize the Hartford fund family’s product line-up and the expenses that HL Advisors had incurred in connection with fund combinations in recent years. The Board considered that HL Advisors or its affiliates are responsible for providing the Fund’s officers. The Board also noted that Hartford Life Insurance Company (“HLIC”) provides administrative services to the Fund. The Board considered its experiences with HL Advisors and HLIC with respect to each of these services.
With respect to the Sub-adviser, who provides day-to-day portfolio management services, the Board considered the quality of the Fund’s portfolio manager, the Sub-adviser’s other investment personnel, its investment philosophy and process, investment research capabilities and resources, performance record, trade execution capabilities and experience. The Board considered the experience of the Fund’s portfolio manager, the number of accounts managed by the portfolio manager, and the Sub-adviser’s method for compensating the portfolio manager.
Based on these considerations, the Board concluded that it was satisfied with the nature, extent and quality of the services provided to the Fund by HL Advisors and the Sub-adviser.
Performance of the Fund and the Advisers
The Board considered the investment performance of the Fund. In this regard, the Board reviewed the performance of the Fund over different time periods presented in the materials and evaluated HL Advisors’ analysis of the Fund’s performance for these time periods. The Board considered information and materials provided to the Board by the Advisers concerning Fund performance, as well as information from Lipper comparing the investment performance of the Fund to an appropriate benchmark and universe of peer funds. The Board noted that the performance of the Fund was within expectations.
The Board considered the detailed investment analytics reports provided by The Hartford’s Investment Advisory Group throughout the year. These reports include, among other things, information on the Fund’s gross and net returns, the Fund’s investment performance relative to an appropriate benchmark and peer group, various statistics concerning the Fund’s portfolio, and a narrative summary of various factors affecting Fund performance. The Board considered the Advisers’ cooperation with the Investment Committee, which assists the Board in evaluating the performance of the Fund at periodic meetings throughout the year. The Board also considered the analysis provided by the Consultant relating to the Fund’s performance track record.
In light of all the considerations noted above, the Board concluded that it had continued confidence in HL Advisors’ and the Sub-adviser’s overall capabilities to manage the Fund.
Costs of the Services and Profitability of the Advisers
The Board reviewed information regarding HL Advisors’ cost to provide investment management and related services to the Fund and HL Advisors’ profitability, both overall and for the Fund, on a pre-tax basis without regard to distribution expenses. The Board also requested and reviewed information about the profitability to HL Advisors and its affiliates from all services provided to the Fund and all aspects of their relationship with the Fund. The Board also requested and received information relating to the operations and profitability of the Sub-adviser.
The Board considered the Consultant’s review of the profitability calculations utilized by HL Advisors in connection with the continuation of the investment management agreement. In this regard, the Consultant reported that The Hartford’s process for calculating and reporting Fund profitability is reasonable, sound and well within common industry practice.
Based on these considerations, the Board concluded that the profits anticipated to be realized by the Advisers and their affiliates from their relationships with the Fund would not be excessive.
Comparison of Fees and Services Provided by the Advisers
The Board considered comparative information with respect to the management fees to be paid by the Fund to HL Advisors and the total expense ratios of the Fund. The Board also considered comparative information with respect to the sub-advisory fees to be paid by HL Advisors to the Sub-adviser, to the extent applicable. In this regard, the Board requested and reviewed information from HL Advisors and the Sub-adviser relating to the management and sub-advisory fees, including the sub-advisory fee schedule for the Fund, and total operating expenses for the Fund. The Board considered that the management fee for the Fund includes the fee paid to HLIC for providing certain administrative services to the Fund. The Board also reviewed information from Lipper comparing the Fund’s contractual management fees, actual management fees and overall expense ratios relative to a group of funds selected by Lipper, in consultation with the Consultant, and a broader universe of funds selected by Lipper. The Board considered that HL Advisors was proposing to amend the investment sub-advisory agreement between HL Advisors and the Sub-Adviser to increase the sub-advisory fee paid to the Sub-Adviser on behalf of the Fund. The Board also considered that shareholders would not pay any increased management fees or expenses as a result of the proposal as HL Advisors, and not the Fund, would pay the increased fee.
While the Board recognized that comparisons between the Fund and peer funds are imprecise, given the differing service levels and characteristics of mutual funds and the different business models and cost structures of the Advisers, the comparative information provided by Lipper assisted the Board in evaluating the reasonableness of the Fund’s management and sub-advisory fees and total operating expenses. In addition, the Board considered the analysis and recommendations of the Consultant relating to the Fund’s management and sub-advisory fees and total operating expenses.
Based on these considerations, the Board concluded that the Fund’s fees and total operating expenses, in conjunction with the information about quality of services, profitability, economies of scale, and other matters discussed, were reasonable in light of the services provided.
Economies of Scale
The Board requested and considered information regarding the Advisers’ realization of economies of scale with respect to the Fund and whether the fee levels reflect these economies of scale for the benefit of the Fund’s investors. With respect to HL Advisors, the Board considered representations from HL Advisors that it is difficult to anticipate whether and to what extent economies may be realized by HL Advisors as assets grow over time. The Board reviewed the breakpoints in the management fee schedule for the Fund, which reduces fee rates as Fund assets grow over time. The Board recognized that a fund with assets beyond the last breakpoint level will continue to benefit from economies of scale because additional assets are charged the lowest breakpoint fee resulting in lower overall effective management fee rates. The Board also recognized that a fee schedule that reaches a lower breakpoint quickly provides shareholders with the benefit of anticipated or potential economies of scale.
The Board reviewed and evaluated materials from Lipper showing how management fee schedules of peer funds reflect economies of scale for the benefit of investors as a peer fund’s assets hypothetically increase over time. Based on information provided by HL Advisors, Lipper, and the Consultant, the Board recognized that there is no uniform methodology for establishing breakpoints or uniform pattern in asset levels that trigger breakpoints or the amounts of breakpoints triggered.
After considering all of the information available to it, the Board concluded that it was satisfied with the extent to which economies of scale would be shared for the benefit of the Fund’s shareholders based on currently available information and the effective advisory fees and expense ratios for the Fund at its current and reasonably anticipated asset levels. The Board noted, however, that it would continue to monitor future growth in Fund assets and the appropriateness of additional breakpoints.
Hartford MidCap Value HLS Fund
Approval of Investment Management and Investment Sub-Advisory Agreements (Unaudited) – (continued)
Other Benefits
The Board considered other benefits to the Advisers and their affiliates from their relationships with the Fund, including the role of the Fund in supporting the variable life insurance and variable annuity products offered by The Hartford. The Board reviewed information noting that HLIC, an affiliate of HL Advisors, receives fees for providing certain administrative services to the Fund, and that HLIC also receives fees for fund accounting and related services from the Fund, and the Board considered information on expected profits to HLIC or its affiliates for such services. The Board also considered that Hartford Administrative Services Company (“HASCO”), the Fund’s transfer agent and an affiliate of HL Advisors, receives transfer agency compensation from the Fund, and the Board reviewed information on the expected profitability of the Fund’s transfer agency function to HASCO. The Board considered information provided by HASCO indicating that the transfer agent fees charged by HASCO to the Fund were fair and reasonable based on publicly available information.
The Board also considered that Hartford Securities Distribution Company, Inc., as principal underwriter of the Fund, receives 12b-1 fees from the Fund. The Board also noted that certain affiliates of HL Advisors distribute shares of the Fund and receive compensation in that connection.
The Board considered benefits to the Sub-adviser from its use of the Fund’s brokerage commissions to obtain soft dollar research, and representations from HL Advisors and the Sub-adviser that the Sub-adviser would not make any revenue-sharing payments or any other type of distribution payments to HL Advisors or its affiliates.
The Board considered the benefits to shareholders of being part of the Hartford family of funds. The Board considered HL Advisors’ efforts to provide investors in the family with a broad range of investment styles and asset classes.
* * * *
Based upon its review of these various factors, among others, the Board concluded that it is in the best interests of the Fund and its shareholders for the Board to approve the Agreements for an additional year. In reaching this decision, the Board did not assign relative weights to the factors discussed above or deem any one or group of them to be controlling in and of themselves. In connection with their deliberations, the Independent Directors met separately in executive session on several occasions, with independent legal counsel, to review the relevant materials and consider their responsibilities under relevant laws and regulations.
The Hartford
P.O. Box 5085
Hartford, CT 06102-5085
Hartford Series Fund, Inc. is underwritten and distributed by Hartford Securities Distribution Company, Inc.
"The Hartford" is The Hartford Financial Services Group, Inc. and its subsidiaries.
Hartford Series Fund, Inc. inception dates range from 1977 to date. Hartford Series Fund, Inc. is not a subsidiary of The Hartford but is underwritten, distributed by and advised by subsidiaries of The Hartford. Investments in Hartford Series Fund, Inc. are not guaranteed by The Hartford or any other entity.
You should carefully consider investment objectives, risks, and charges and expenses of Hartford HLS Funds before investing. This and other information can be found in the Fund’s prospectus or summary prospectus, which can be obtained by calling 800-862-6668. Please read them carefully before you invest or send money.
HLSAR-MCV11 2-12 109078 Printed in U.S.A ©2011 The Hartford, Hartford, CT 06115 | |
A MESSAGE FROM THE PRESIDENT
Dear Fellow Shareholders:
I want to take this opportunity to say thank you for investing in Hartford HLS Funds.
This has been a tumultuous year. In the beginning of 2011, we witnessed tension-fueled political uprisings in the already-volatile Middle East and North Africa region. We also watched as Japan dealt with a series of crises including a massive earthquake and subsequent tsunami. Yet, U.S. economic conditions continued to improve, with gains in consumer confidence and retail sales. During the first half of 2011, domestic, international, and world indices (as measured by the S&P 500, MSCI EAFE and MSCI World) were all up more than 5% through June, 30 2011.
The economic recovery, however, lost momentum in the second half of 2011. The employment and housing markets both remain extremely challenged. Investors continue to be concerned about the implications of the European sovereign debt crisis, as well as our own high levels of domestic debt. Fears that the European sovereign debt crisis could continue to drag down the global economy have weighed heavily on stocks.
Ongoing apprehension regarding the U.S. debt ceiling during the summer and the resulting downgrade of the U.S. sovereign credit rating by Standard & Poor’s also contributed to weaker investor confidence.
There are, however, some reasons to remain confident. Corporations have record levels of cash on their balance sheets—corporate cash has doubled in the past 10 years. In addition, U.S. gross domestic product expanded at a 2.5 percent annual rate in the third quarter according to the Commerce Department, as consumers and businesses set aside fears about the recovery and stepped up spending. Corporate earnings have also remained positive, with a majority of companies beating expectations each quarter this year. This momentum will hopefully continue into next year.
As we head into 2012, in light of the continued market volatility, now would be a good time to schedule a meeting with your financial advisor to examine your current investment strategy and determine whether you are on the right track.
| • | Does your fixed-income portfolio complement your equity portfolio? |
| • | Are you receiving diversified sources of income? |
| • | Is your portfolio still in line with your risk tolerance and investment time horizon? |
Talk to your advisor to see what changes you should make to address these concerns and opportunities.
Thank you again for investing with Hartford HLS Funds.
James Davey
President
Hartford HLS Funds
Hartford Money Market HLS Fund
Table of Contents
This report is prepared for the general information of contract owners and qualified retirement plan participants. It is not an offer of contracts or of qualified retirement plans. It should not be used in connection with any offer, except in conjunction with the appropriate product prospectus which contains all pertinent information including the applicable sales, administrative and other charges.
Hartford Money Market HLS Fund
Schedule of Investments
December 31, 2011
(000’s Omitted)
| Shares or Principal Amount | | Market Value ╪ | |
| CERTIFICATES OF DEPOSIT - 6.0% | | | | |
| | Finance and Insurance - 6.0% | | | | |
| | | | | Commercial Banking - 2.0% | | | | |
| | | | | Bank of Nova Scotia Houston | | | | |
| $ | 12,250 | | | 0.26%, 03/05/2012 | | $ | 12,250 | |
| | 12,250 | | | 0.28%, 04/05/2012 | | | 12,250 | |
| | 21,200 | | | 0.59%, 01/06/2012 Δ | | | 21,201 | |
| | | | | | | | 45,701 |
| | | | | Depository Credit - Banking - 4.0% | | | | |
| | | | | Royal Bank of Canada New York | | | | |
| | 16,000 | | | 0.33%, 02/14/2012 Δ | | | 16,000 | |
| | 41,000 | | | 1.18%, 06/18/2012 Δ | | | 41,124 | |
| | | | | Toronto-Dominion Bank New York | | | | |
| | 24,500 | | | 0.21%, 02/10/2012 | | | 24,500 | |
| | 12,000 | | | 0.36%, 01/12/2012 Δ | | | 12,000 | |
| | | | | | | | 93,624 | |
| | | | | Total certificates of deposit | | | | |
| | | | | (cost $139,325) | | $ | 139,325 | |
| | | | | | | | | |
| COMMERCIAL PAPER - 40.4% | | | | |
| | Beverage and Tobacco Product Manufacturing - 3.9% | | | | |
| | | | | Beverage Manufacturing - 3.9% | | | | |
| | | | | Coca Cola Co. | | | | |
| $ | 29,750 | | | 0.16%, 03/09/2012 | | $ | 29,741 | |
| | | | | Pepsico, Inc. | | | | |
| | 62,000 | | | 0.06%, 01/10/2012 - 01/24/2012 ■ | | | 61,999 | |
| | | | | | | | 91,740 | |
| | Chemical Manufacturing - 4.7% | | | | |
| | | | | Basic Chemical Manufacturing - 4.7% | | | | |
| | | | | E.I. DuPont De Nemours & Co. | | | | |
| | 23,750 | | | 0.05%, 01/10/2012 ■ | | | 23,750 | |
| | 13,750 | | | 0.06%, 01/05/2012 ■ | | | 13,750 | |
| | 12,250 | | | 0.14%, 03/20/2012 ■ | | | 12,246 | |
| | | | | Export Development Canada | | | | |
| | 60,750 | | | 0.03%, 01/09/2012 - 02/09/2012 | | | 60,748 | |
| | | | | | | | 110,494 | |
| | Computer and Electrical Products Manufacturing - 2.6% | | | | |
| | | | | Computer and Peripheral Equipment Manufacturing - 2.6% | | | | |
| | | | | International Business Machines Co. | | | | |
| | 36,250 | | | 0.05%, 01/27/2012 - 01/30/2012 ■ | | | 36,249 | |
| | 24,500 | | | 0.06%, 01/20/2012 ■ | | | 24,499 | |
| | | | | | | | 60,748 | |
| | Finance and Insurance - 19.2% | | | | |
| | | | | Commercial Banking - 6.8% | | | | |
| | | | | Old Line Funding LLC | | | | |
| | 24,500 | | | 0.22%, 02/22/2012 ■ | | | 24,492 | |
| | 21,500 | | | 0.23%, 01/19/2012 - 02/01/2012 ■ | | | 21,497 | |
| | | | | State Street Corp. | | | | |
| | 62,250 | | | 0.25%, 02/13/2012 - 03/26/2012 | | | 62,221 | |
| | | | | U.S. Bank | | | | |
| | 26,250 | | | 0.19%, 01/19/2012 | | | 26,248 | |
| | 24,500 | | | 0.25%, 03/16/2012 | | | 24,487 | |
| | | | | | | | 158,945 | |
| | | | | Depository Credit - Banking - 1.0% | | | | |
| | | | | Toronto-Dominion Holdings USA | | | | |
| | 24,250 | | | 0.11%, 03/08/2012 ■ | | | 24,245 | |
| | | | | | | | | |
| | | | | International Trade Financing (Foreign Banks) - 1.1% | | | | |
| | | | | Kreditanstalt fuer Wiederaufbau | | | | |
| 26,250 | | | 0.18%, 01/19/2012 ■ | | | 26,248 | |
| | | | | | | | | |
| | | | | Nondepository Credit Banking - 9.4% | | | | |
| | | | | Caterpillar Financial Services Corp. | | | | |
| | 48,000 | | | 0.06%, 01/05/2012 | | | 47,999 | |
| | 12,000 | | | 0.08%, 02/08/2012 | | | 11,999 | |
| | | | | General Electric Capital Corp. | | | | |
| | 13,000 | | | 0.16%, 01/19/2012 | | | 12,999 | |
| | 13,000 | | | 0.25%, 02/08/2012 | | | 12,997 | |
| | 19,000 | | | 0.27%, 02/29/2012 | | | 18,992 | |
| | 14,750 | | | 0.28%, 03/15/2012 | | | 14,741 | |
| | | | | John Deere Credit, Inc. | | | | |
| | 18,250 | | | 0.08%, 01/18/2012 | | | 18,249 | |
| | 45,000 | | | 0.09%, 01/05/2012 - 01/11/2012 | | | 44,999 | |
| | | | | Toyota Motor Credit Corp. | | | | |
| | 12,000 | | | 0.11%, 02/17/2012 | | | 11,998 | |
| | 12,250 | | | 0.21%, 02/13/2012 | | | 12,247 | |
| | 13,000 | | | 0.26%, 01/24/2012 | | | 12,998 | |
| | | | | | | | 220,218 | |
| | | | | Securities and Commodity Contracts and Brokerage - 0.9% | | | | |
| | | | | JP Morgan Chase Funding, Inc. | | | | |
| | 21,375 | | | 0.01%, 01/03/2012 | | | 21,375 | |
| | | | | | | |
| | | | | | | | 451,031 | |
| | Health Care and Social Assistance - 2.7% | | | | |
| | | | | Pharmaceutical & Medicine Manufacturing - 2.7% | | | | |
| | | | | Johnson & Johnson | | | | |
| | 24,750 | | | 0.07%, 01/26/2012 ■ | | | 24,749 | |
| | 13,250 | | | 0.08%, 01/17/2012 ■ | | | 13,249 | |
| | 24,750 | | | 0.09%, 03/05/2012 | | | 24,746 | |
| | | | | | | | 62,744 | |
| | Retail Trade - 2.4% | | | | |
| | | | | Other General Merchandise Stores - 2.4% | | | | |
| | | | | Wal-Mart Stores, Inc. | | | | |
| | 14,750 | | | 0.03%, 01/04/2012 ■ | | | 14,750 | |
| | 23,750 | | | 0.04%, 01/30/2012 | | | 23,749 | |
| | 18,500 | | | 0.06%, 01/12/2012 | | | 18,500 | |
| | | | | | | | 56,999 | |
| | Soap, Cleaning Compound, and Toiletries Manufacturing - 4.9% | | | | |
| | | | | Soap, Cleaning Compound, and Toiletries Manufacturing - 4.9% | | | | |
| | | | | Colgate-Palmolive Co. | | | | |
| | 58,500 | | | 0.02%, 01/09/2012 - 01/12/2012 | | | 58,500 | |
| | | | | Procter & Gamble Co. | | | | |
| | 6,000 | | | 0.07%, 03/21/2012 ■ | | | 5,999 | |
| | 24,500 | | | 0.08%, 02/14/2012 - 03/19/2012 | | | 24,496 | |
| | 26,250 | | | 0.09%, 01/20/2012 ■ | | | 26,249 | |
| | | | | | | | 115,244 | |
| | | | | Total commercial paper | | | | |
| | | | | (cost $949,000) | | $ | 949,000 | |
The accompanying notes are an integral part of these financial statements.
| Shares or Principal Amount | | Market Value ╪ |
| CORPORATE NOTES - 6.6% |
| | | | | Beverage and Tobacco Product Manufacturing - 1.3% |
| | | | | | | | | Beverage Manufacturing - 1.3% | | |
| | | | | | | | | Coca-Cola Co. |
| | | | | $ | 29,800 | | | 0.51%, 05/15/2012 Δ | $ | 29,810 |
| | | | | | | | | |
| | | | | Finance and Insurance - 5.3% |
| | | | | | | | | Insurance Carriers - 1.3% |
| | | | | | | | | Met Life Global Funding I | | |
| | | | | | 12,000 | | | 0.51%, 07/06/2012 ■ Δ | | 12,000 |
| | | | | | 18,450 | | | 0.89%, 04/10/2012 ■ Δ | | 18,471 |
| | | | | | | | | | | 30,471 |
| | | | | | | | | International Trade Financing (Foreign Banks) - 2.9% | | |
| | | | | | | | | International Bank for Reconstruction & Development |
| | | | | | 24,250 | | | 0.05%, 02/01/2012 | | 24,249 |
| | | | | | 18,250 | | | 0.06%, 02/22/2012 | | 18,248 |
| | | | | | 26,000 | | | 0.08%, 02/02/2012 | | 25,998 |
| | | | | | | | | | | 68,495 |
| | | | | | | | | Securities and Commodity Contracts and Brokerage - 1.1% | | |
| | | | | | | | | JP Morgan Chase & Co. |
| | | | | | 15,750 | | | 0.43%, 01/18/2013 Δ | | 15,750 |
| | | | | | 10,324 | | | 0.58%, 02/22/2012 Δ | | 10,330 |
| | | | | | | | | | | 26,080 |
| | | | | | | | | | | 125,046 |
| | | | | | | | | Total corporate notes | | |
| | | | | | | | | (cost $154,856) | $ | 154,856 |
| | | | | | | | | | | |
| FOREIGN GOVERNMENT OBLIGATIONS - 11.4% |
| | | | | | | | | Canada - 11.4% | | |
| | | | | | | | | British Columbia (Province of) |
| | | | | $ | 18,250 | | | 0.08%, 02/02/2012 | $ | 18,249 |
| | | | | | 13,150 | | | 0.09%, 02/16/2012 | | 13,148 |
| | | | | | 31,000 | | | 0.12%, 06/15/2012 - 07/05/2012 | | 30,982 |
| | | | | | | | | Manitoba (Province of) |
| | | | | | 63,250 | | | 0.34%, 02/15/2012 | | 63,618 |
| | | | | | | | | Ontario (Province of) |
| | | | | | 36,000 | | | 0.09%, 03/13/2012 - 04/05/2012 | | 35,992 |
| | | | | | 35,500 | | | 0.36%, 01/20/2012 | | 35,544 |
| | | | | | | | | Quebec (Province of) | | |
| | | | | | 22,625 | | | 0.09%, 03/06/2012 - 03/22/2012 ■ | | 22,620 |
| | | | | | 28,250 | | | 0.10%, 02/24/2012 - 03/14/2012 ■ | | 28,245 |
| | | | | | 20,000 | | | 0.11%, 01/17/2012 ■ | | 19,999 |
| | | | | | | | | | | 268,397 |
| | | | | | | | | Total foreign government obligations |
| | | | | | | | | (cost $268,397) | $ | 268,397 |
| | | | | | | | | |
| OTHER POOLS AND FUNDS - 0.0% |
| | | | | | – | | | JP Morgan U.S. Government Money Market Fund | $ | – |
| | | | | | 100 | | | Wells Fargo Advantage Government Money Market Fund | | 100 |
| | | | | | | | | |
| | | | | | | | | Total other pools and funds | | |
| | | | | | | | | (cost $100) | | $100 |
| | | | | | | | | | | |
| REPURCHASE AGREEMENTS - 16.3% |
| | | | | | | | | Deutsche Bank Securities TriParty Joint
Repurchase Agreement (maturing on
01/03/2012 in the amount of $31,144,
collateralized by U.S. Treasury Note
1.38%, 2018, value of $31,766) | | |
| | | | | $ | 31,144 | | | 0.01% dated 12/30/2011 | $ | 31,144 |
| | | | | | | | | RBC Capital Markets Corp. TriParty Joint
Repurchase Agreement (maturing on
01/03/2012 in the amount of $241,709,
collateralized by U.S. Treasury Note
0.38% - 1.50%, 2013 - 2016, value of
$246,543) | | |
| | | | | | 241,709 | | | 0.01% dated 12/30/2011 | | 241,709 |
| | | | | | | | | RBS Greenwich Capital Markets TriParty Joint
Repurchase Agreement (maturing on
01/03/2012 in the amount of $81,809,
collateralized by U.S. Treasury Note
1.88% - 2.00%, 2015 - 2016, value of
$83,446) | | |
| | | | | | 81,809 | | | 0.02% dated 12/30/2011 | | 81,809 |
| | | | | | | | | UBS Securities, Inc. TriParty Joint
Repurchase Agreement (maturing on
01/03/2012 in the amount of $28,343,
collateralized by U.S. Treasury Note
3.63%, 2021, value of $28,910) | | |
| | | | | | 28,343 | | | 0.01% dated 12/30/2011 | | 28,343 |
| | | | | | 383005 | | | | | |
| | | | | | | | | Total repurchase agreements |
| | | | | | | | | (cost $383,005) | $ | 383,005 |
| | | | | | | | | |
| U.S. GOVERNMENT AGENCIES - 6.9% |
| | | | | | | | | Federal Home Loan Mortgage Corp. - 4.8% |
| | | | | $ | 28,000 | | | 0.06%, 01/09/2012 | $ | 27,999 |
| | | | | | 26,500 | | | 0.07%, 01/23/2012 | | 26,499 |
| | | | | | 41,250 | | | 0.10%, 01/17/2012 | | 41,248 |
| | | | | | 16,000 | | | 0.11%, 01/30/2012 | | 15,999 |
| | | | | | | | | | | 111,745 |
| | | | | | | | | |
| | | | | | | | | Federal National Mortgage Association - 2.1% | | | |
| | | | | | 25,000 | | | 0.04%, 02/01/2012 | | 24,999 |
| | | | | | 25,500 | | | 0.10%, 01/18/2012 | | 25,499 |
| | | | | | | | | | | 50,498 |
| | | | | | | | | | | |
| | | | | | | | | Total U.S. government agencies |
| | | | | | | | | (cost $162,243) | $ | 162,243 |
| | | | | | | | | |
| U.S. GOVERNMENT SECURITIES - 12.4% |
| | | | | | | | | Other Direct Federal Obligations - 5.2% |
| | | | | | | | | Federal Home Loan Bank | | |
| | | | | $ | 39,000 | | | 0.05%, 01/13/2012 | $ | 38,999 |
| | | | | | 50,750 | | | 0.07%, 01/25/2012 | | 50,748 |
| | | | | | 31,750 | | | 0.09%, 01/18/2012 | | 31,749 |
| | | | | | | | | | | 121,496 |
The accompanying notes are an integral part of these financial statements.
Hartford Money Market HLS Fund
Schedule of Investments – (continued)
December 31, 2011
(000’s Omitted)
| Shares or Principal Amount | | | | | Market Value ╪ |
| U.S. GOVERNMENT SECURITIES - 12.4% - (continued) | | | | | |
| | | | | U.S. Treasury Bills - 7.2% | | | | |
| $ | 78,000 | | | 0.07%, 01/31/2012 | | | | | | $ | 78,053 |
| | 39,250 | | | 0.13%, 02/29/2012 | | | | | | 39,541 |
| | 50,250 | | | 0.16%, 02/15/2012 | | | | | | 50,546 |
| | | | |
| | | | | | 168,140 |
| | | | | Total U.S. government securities | | | | | | |
| | | | | (cost $289,636) | | | | | | $ | 289,636 |
| | | | |
| | | | | | |
| | | | | Total investments | | | | |
| | | | | (cost $2,346,562) ▲ | | | 100.0 | % | | $ | 2,346,562 |
| | | | | Other assets and liabilities | | | – | % | | 398 |
| | | | | Total net assets | | | 100.0 | % | | $ | 2,346,960 |
| Note: | Percentage of investments as shown is the ratio of the total market value to total net assets. The rates presented in this Schedule of Investments are yields, unless otherwise noted. ��Market value of investments in U.S. dollar denominated securities of foreign issuers represents 21.1% of total net assets at December 31, 2011. |
| ▲ | Also represents cost for tax purposes.
|
| Δ | Variable rate securities; the rate reported is the coupon rate in effect at December 31, 2011.
|
| ■ | Securities issued within terms of a private placement memorandum, exempt from registration under Rule 144A under the Securities Act of 1933, as amended, and may be sold only to qualified institutional buyers. Unless otherwise indicated, these holdings are determined to be liquid. At December 31, 2011, the aggregate value of these securities was $455,306, which represents 19.4% of total net assets. |
| ╪ | See Significant Accounting Policies of accompanying Notes to Financial Statements regarding valuation of securities. |
The accompanying notes are an integral part of these financial statements.
Hartford Money Market HLS Fund
Investment Valuation Hierarchy Level Summary
December 31, 2011
(000’s Omitted)
| | | Total | | | Level 1 ♦ | | | Level 2 ♦ | | | Level 3 | |
| Assets: | | | | | | | | | | | | | | | | |
| Certificates of Deposit | | $ | 139,325 | | | $ | – | | | $ | 139,325 | | | $ | – | |
| Commercial Paper | | | 949,000 | | | | – | | | | 949,000 | | | | – | |
| Corporate Notes | | | 154,856 | | | | – | | | | 154,856 | | | | – | |
| Foreign Government Obligations | | | 268,397 | | | | – | | | | 268,397 | | | | – | |
| Other Pools and Funds | | | 100 | | | | 100 | | | | – | | | | – | |
| Repurchase Agreements | | | 383,005 | | | | – | | | | 383,005 | | | | – | |
| U.S. Government Agencies | | | 162,243 | | | | – | | | | 162,243 | | | | – | |
| U.S. Government Securities | | | 289,636 | | | | – | | | | 289,636 | | | | – | |
| Total | | $ | 2,346,562 | | | $ | 100 | | | $ | 2,346,462 | | | $ | – | |
| ♦ | For the year ended December 31, 2011, there were no significant transfers between Level 1 and Level 2. |
The accompanying notes are an integral part of these financial statements.
Hartford Money Market HLS Fund
Statement of Assets and Liabilities
December 31, 2011
(000’s Omitted)
| Assets: | | | | |
| Investments in securities, at market value (cost $2,346,562) | | $ | 2,346,562 | |
| Receivables: | | | | |
| Fund shares sold | | | 2,147 | |
| Dividends and interest | | | 3,592 | |
| Other assets | | | 135 | |
| Total assets | | | 2,352,436 | |
| Liabilities: | | | | |
| Payables: | | | | |
| Fund shares redeemed | | | 5,184 | |
| Investment management fees | | | 207 | |
| Accrued expenses | | | 85 | |
| Total liabilities | | | 5,476 | |
| Net assets | | $ | 2,346,960 | |
| Summary of Net Assets: | | | | |
| Capital stock and paid-in-capital | | $ | 2,346,960 | |
| Net assets | | $ | 2,346,960 | |
| Shares authorized | | | 14,000,000 | |
| Par value | | $ | 0.001 | |
| Class IA: Net asset value per share | | $ | 1.00 | |
| Shares outstanding | | | 1,970,312 | |
| Net assets | | $ | 1,970,312 | |
| Class IB: Net asset value per share | | $ | 1.00 | |
| Shares outstanding | | | 376,648 | |
| Net assets | | $ | 376,648 | |
The accompanying notes are an integral part of these financial statements.
Hartford Money Market HLS Fund
Statement of Operations
For the Year Ended December 31, 2011
(000’s Omitted)
| Investment Income: | | | | |
| Dividends | | $ | — | |
| Interest | | | 3,974 | |
| Total investment income, net | | | 3,974 | |
| | | | | |
| Expenses: | | | | |
| Investment management fees | | | 9,847 | |
| Transfer agent fees | | | 2 | |
| Custodian fees | | | 5 | |
| Accounting services fees | | | 246 | |
| Board of Directors' fees | | | 53 | |
| Audit fees | | | 10 | |
| Other expenses | | | 127 | |
| Total expenses (before waivers) | | | 10,290 | |
| Expense waivers | | | (6,316 | ) |
| Custodian fee offset | | | — | |
| Total waivers | | | (6,316 | ) |
| Total expenses, net | | | 3,974 | |
| Net investment income | | | — | |
| | | | | |
| Net Realized Gain on Investments: | | | | |
| Net realized gain on investments | | | — | |
| Net Realized Gain on Investments | | | — | |
| Net Gain on Investments | | | — | |
| Net Increase in Net Assets Resulting from Operations | | $ | — | |
The accompanying notes are an integral part of these financial statements.
Hartford Money Market HLS Fund
Statement of Changes in Net Assets
(000’s Omitted)
| | | For the
Year Ended
December 31, 2011 | | | For the
Year Ended
December 31, 2010 | |
| Operations: | | | | | | | | |
| Net realized gain on investments | | | — | | | | 4 | |
| Payment from affiliate | | | — | | | | 9,496 | |
| Net Increase In Net Assets Resulting From Operations | | | — | | | | 9,500 | |
| Capital Share Transactions: | | | | | | | | |
| Class IA | | | | | | | | |
| Sold | | | 1,775,191 | | | | 1,278,776 | |
| Redeemed | | | (1,890,893 | ) | | | (2,020,865 | ) |
| Total capital share transactions | | | (115,702 | ) | | | (742,089 | ) |
| Class IB | | | | | | | | |
| Sold | | | 267,452 | | | | 222,037 | |
| Redeemed | | | (310,323 | ) | | | (352,170 | ) |
| Total capital share transactions | | | (42,871 | ) | | | (130,133 | ) |
| Net decrease from capital share transactions | | | (158,573 | ) | | | (872,222 | ) |
| Net Decrease In Net Assets | | | (158,573 | ) | | | (862,722 | ) |
| Net Assets: | | | | | | | | |
| Beginning of period | | | 2,505,533 | | | | 3,368,255 | |
| End of period | | $ | 2,346,960 | | | $ | 2,505,533 | |
| Undistributed (distribution in excess of) | | | | | | | | |
| net investment income | | $ | — | | | $ | — | |
| Shares: | | | | | | | | |
| Class IA | | | | | | | | |
| Sold | | | 1,775,191 | | | | 1,278,814 | |
| Redeemed | | | (1,890,893 | ) | | | (2,020,865 | ) |
| Total share activity | | | (115,702 | ) | | | (742,051 | ) |
| Class IB | | | | | | | | |
| Sold | | | 267,452 | | | | 222,045 | |
| Redeemed | | | (310,323 | ) | | | (352,170 | ) |
| Total share activity | | | (42,871 | ) | | | (130,125 | ) |
The accompanying notes are an integral part of these financial statements.
Hartford Money Market HLS Fund
Notes to Financial Statements
December 31, 2011
(000’s Omitted)
Hartford Money Market HLS Fund (the “Fund”) serves as an underlying investment option for certain variable annuity and variable life insurance separate accounts of Hartford Life Insurance Company (“HLIC”) and its affiliates and certain qualified retirement plans. The Fund may also serve as an underlying investment option for certain variable annuity and variable life separate accounts of other insurance companies. Owners of variable annuity contracts and policyholders of variable life insurance contracts may choose the funds permitted in the variable insurance contract prospectus. In addition, participants in certain qualified retirement plans may choose the Fund if permitted by their plans.
Hartford Series Fund, Inc. (the “Company”) is an open-end registered management investment company comprised of thirty portfolios. Financial Statements for the Fund, a series of the Company, are included in this report.
The Company is organized under the laws of the State of Maryland and is registered with the Securities and Exchange Commission (“SEC”) under the Investment Company Act of 1940, as amended (“1940 Act”). The Fund is a diversified open-end management investment company.
The Fund is divided into Class IA and Class IB shares. Each class is offered at the per share net asset value (“NAV”) without a sales charge and is subject to the same expenses, except that the Class IB shares are subject to distribution and service fees charged pursuant to a Distribution Plan adopted in accordance with Rule 12b-1 under the 1940 Act.
| 2. | Significant Accounting Policies: |
The following is a summary of significant accounting policies of the Fund in the preparation of its financial statements, which are in accordance with the United States Generally Accepted Accounting Principles (“U.S. GAAP”). The preparation of financial statements in accordance with U.S. GAAP may require management to make estimates and assumptions that affect the reported amounts of assets and liabilities and disclosure of contingent assets and liabilities at the date of the financial statements and the reported amounts of increases and decreases in net assets from operations during the reporting period. Actual results could differ from those estimates.
| a) | Determination of Net Asset Value – The NAV of each class of the Fund’s shares is determined as of the close of regular trading (normally 4:00 p.m. Eastern Time) (the “NYSE Close”) on each day that the New York Stock Exchange (the “Exchange”) is open (“Valuation Date”). Information that becomes known to the Fund after the NAV has been calculated on a particular day will not generally be used to retroactively adjust the NAV determined earlier that day. |
| b) | Investment Valuation – The Fund’s investments are valued at amortized cost, which approximates market value. Investments in open-end mutual funds are valued at the respective NAV of each open-end mutual fund as determined on the Valuation Date. |
U.S. GAAP defines fair value as the price that the Fund would receive to sell an asset or pay to transfer a liability in an orderly transaction between market participants. The U.S. GAAP fair value measurement standards require disclosure of a fair value hierarchy for each major category of assets and liabilities. Various inputs are used in determining the fair value of the Fund’s investments. These inputs are summarized into three broad hierarchy levels. This hierarchy is based on whether the valuation inputs are observable or unobservable. These levels are:
| · | Level 1 – Quoted prices in active markets for identical securities. Level 1 may include exchange traded instruments, such as domestic equities, some foreign equities, options, futures, mutual funds, exchange traded funds, rights and warrants. |
| · | Level 2 – Observable inputs other than Level 1 prices, such as quoted prices for similar securities; quoted prices in markets that are not active; or other inputs that are observable or can be corroborated by observable market |
Hartford Money Market HLS Fund
Notes to Financial Statements – (continued)
December 31, 2011
(000’s Omitted)
data. Level 2 may include debt securities that are traded less frequently than exchange traded instruments and which are valued using independent pricing services; foreign equities, that are principally traded on certain foreign markets and are adjusted daily pursuant to a fair value pricing service in order to reflect an adjustment for the factors occurring after the close of certain foreign markets but before the NYSE Close; and short-term securities, which are valued at amortized cost.
| · | Level 3 – Significant unobservable inputs that are supported by limited or no market activity. Level 3 may include financial instruments whose values are determined using broker quotes or require significant management judgment or estimation. These unobservable valuation inputs may include estimates for current yields, maturity/duration, prepayment speed, and broker quotes for comparable securities along with other assumptions relating to credit quality, collateral value, complexity of the security structure, general market conditions and liquidity. This category may include securities where trading has been halted or there are certain restrictions on trading. While these securities are priced using unobservable inputs, the valuation of these securities reflects the best available data and management believes the prices are a reasonable representation of exit price. |
Valuation levels are not necessarily indicative of the risk associated with investing in such securities. Individual securities within any of the above mentioned asset classes may be assigned a different hierarchical level than those presented above, as individual circumstances dictate.
During the year ended December 31, 2011, the Fund held no Level 3 securities; therefore, no reconciliation of Level 3 securities is presented.
For additional information, refer to the Investment Valuation Hierarchy Level Summary which follows the Schedule of Investments.
For purposes of reporting transfers between different hierarchy levels, both transfers in and out of each level, as applicable, are shown as if they occurred at the beginning of the period.
| c) | Security Transactions and Investment Income – Security transactions are recorded as of the trade date (the date the order to buy or sell is executed) for financial reporting purposes. Realized gains and losses are determined on the basis of identified cost. |
Interest income, including amortization of premium and accretion of discounts, is accrued on a daily basis.
| d) | Joint Trading Account – The Fund may invest cash balances into a joint trading account that may be invested in one or more repurchase agreements. |
| e) | Fund Share Valuation and Dividend Distributions to Shareholders – Orders for the Fund’s shares are executed in accordance with the investment instructions of the contract holders and plan participants. The NAV of the Fund’s shares is determined as of the close of business on each business day of the Exchange. The NAV is determined separately for each class of shares of the Fund by dividing the Fund’s net assets attributable to that class by the number of shares of the class outstanding. Each class of shares offered by the Fund has equal rights as to assets and voting privileges (except that shareholders of a class have exclusive voting rights regarding any matter relating solely to that class of shares). Income and non-class specific expenses are allocated daily to each class on the basis of the relative net assets of the class. Realized and unrealized capital gains and losses are allocated daily based on the relative net assets of each class of shares of the Fund. |
Orders for the purchase of the Fund’s shares received prior to the close of the Exchange on any day the Exchange is open for business are priced at the NAV determined as of the close of the Exchange. Orders received after the close of the Exchange, or on a day on which the Exchange and/or the Fund is not open for business, are priced at the next determined NAV.
Dividends are declared pursuant to a policy adopted by the Company’s Board of Directors based upon the investment performance of the Fund. Normally, dividends from net investment income are declared daily and paid monthly. Dividends from realized capital gains, if any, are paid at least once a year.
Distributions from net investment income, net realized capital gains and capital are determined in accordance with federal income tax regulations, which may differ from U.S. GAAP with respect to character and timing. These differences may include but are not limited to losses deferred due to wash sale adjustments and short-term capital gain adjustments. Permanent book and federal income tax basis differences relating to shareholder distributions will result in reclassifications to certain of the Fund’s capital accounts (see Federal Income Taxes: Reclassification of Capital Accounts note).
| 3. | Securities and Other Investments: |
| a) | Repurchase Agreements – A repurchase agreement is an agreement by which a counterparty agrees to sell a security and agrees to repurchase the security sold at a mutually agreed upon time and price. At the time the Fund enters into a repurchase agreement, the value of the underlying collateral security(ies), including accrued interest, will be equal to or exceed the value of the repurchase agreement. Repurchase agreements expose the Fund to counterparty risk. To minimize counterparty risk, the securities that serve to collateralize the repurchase agreement are held by the Fund's custodian in book entry or physical form in the custodial account of the Fund or in a third party custodial account. Repurchase agreements are valued at cost plus accrued interest. The Fund, as shown on the Schedule of Investments, had outstanding repurchase agreements as of December 31, 2011. |
| b) | Illiquid and Restricted Securities – The Fund is permitted to invest up to 15% of its net assets in illiquid securities. Illiquid securities are those that may not be sold or disposed of in the ordinary course of business within seven days, at approximately the price used to determine the Fund’s NAV. The Fund may not be able to sell illiquid securities or other investments when its sub-adviser considers it desirable to do so or may have to sell such securities or investments at a price that is lower than the price that could be obtained if the securities or investments were more liquid. A sale of illiquid securities or other investments may require more time and may result in higher dealer discounts and other selling expenses than does the sale of those that are liquid. Illiquid securities and investments also may be more difficult to value due to the unavailability of reliable market quotations for such securities or investments, and an investment in them may have an adverse impact on the Fund’s NAV. The Fund may also purchase certain restricted securities that can only be resold to certain qualified investors and may be determined to be liquid pursuant to policies and guidelines established by the Company’s Board of Directors. The Fund, as shown on the Schedule of Investments, had illiquid and/or restricted securities as of December 31, 2011. |
| c) | Securities Purchased on a When-Issued or Delayed-Delivery Basis – Delivery and payment for securities that have been purchased by the Fund on a forward commitment, or when-issued or delayed-delivery basis, take place beyond the customary settlement period. A fund may dispose of or renegotiate a delayed-delivery transaction after it is entered into, and may sell delayed-delivery securities before they are delivered, which may result in a realized gain or loss. During this period, such securities are subject to market fluctuations, and the Fund identifies securities segregated in its records with value at least equal to the amount of the commitment. As of December 31, 2011, the Fund had no outstanding when-issued or delayed delivery securities. |
Hartford Money Market HLS Fund
Notes to Financial Statements – (continued)
December 31, 2011
(000’s Omitted)
| a) | Credit and Counterparty Risks – Credit risk depends largely on the perceived financial health of bond issuers. In general, the credit rating is inversely related to the credit risk of the issuer. Higher rated bonds generally are deemed to have less credit risk, while lower or unrated bonds are deemed to have higher risk of default. The share price, yield and total return of a fund that holds securities with higher credit risk may be more volatile than those of a fund that holds bonds with lower credit risk. Similar to credit risk, the Fund may be exposed to counterparty risk, or the risk that an institution or other entity with which the Fund has unsettled or open transactions will default. |
| b) | Market Risks – The Fund’s investments expose the Fund to various risks including, but not limited to, interest rate, prepayment and extension risks. Interest rate risk is the risk that fixed income securities will decline in value because of changes in interest rates. As nominal interest rates rise, the value of certain fixed income securities held by the Fund is likely to decrease. A nominal interest rate can be described as the sum of a real interest rate and an expected inflation rate. |
| a) | Federal Income Taxes – For federal income tax purposes, the Fund intends to continue to qualify as a RIC under Subchapter M of the Internal Revenue Code (“IRC”) by distributing substantially all of its taxable net investment income and net realized capital gains to its shareholders and otherwise complying with the requirements of RICs. The Fund has distributed substantially all of its income and capital gains in prior years, if applicable, and intends to distribute substantially all of its income and capital gains prior to the next fiscal year-end. Accordingly, no provision for federal income or excise taxes has been made in the accompanying financial statements. Distributions from short-term capital gains are treated as ordinary income distributions for federal income tax purposes. |
| b) | Net Investment Income (Loss), Net Realized Gains (Losses) – Net investment income (loss) and net realized gains (losses) may differ for financial statement and tax purposes primarily because of losses deferred due to wash sale adjustments, foreign currency gains and losses, adjustments related to PFICs, REITs, RICs, certain derivatives and partnerships. The character of distributions made during the year from net investment income or net realized gains may differ from their ultimate characterization for federal income tax purposes. Also, due to the timing of dividend distributions, the fiscal year in which amounts are distributed may differ from the year that the income or realized gains (losses) were recorded by the Fund. |
| c) | Reclassification of Capital Accounts – The Fund may record reclassifications in its capital accounts. These reclassifications have no impact on the total net assets of the Fund. The reclassifications are a result of permanent differences between U.S. GAAP and tax accounting for such items as foreign currency, PFICs, expiration or utilization of capital loss carryforwards or net operating losses. Adjustments are made to reflect the impact these items have on current and future distributions to shareholders. Therefore, the source of the Fund’s distributions may be shown in the accompanying Statement of Changes in Net Assets as from undistributed net investment income, from accumulated net realized gains on investments or from capital depending on the type of book and tax differences that exist. For the year ended December 31, 2011, the Fund had no reclassifications. |
| d) | Capital Loss Carryforward – On December 22, 2010, the Regulated Investment Company Modernization Act of 2010 (the “Act”) was enacted, which made changes to the capital loss carryforward rules. The changes are effective for taxable years beginning after the date of enactment. Under the Act, funds are permitted to carry forward capital losses for an unlimited period. However, any losses incurred during those future taxable years will be required to be utilized prior to the losses incurred in pre-enactment taxable years, which carry an expiration date. As a result of this ordering rule, pre-enactment capital loss carryforwards may be more likely to expire unused. Additionally, post-enactment capital loss carryforwards will retain their character as either short-term or long-term capital losses rather than being considered all short-term as permitted under prior regulation. |
The Fund had no capital loss carryforward for U.S. federal income tax purposes as of December 31, 2011.
| e) | Accounting for Uncertainty in Income Taxes – The Fund has adopted financial reporting rules that require the Fund to analyze all open tax years, as defined by the statute of limitations, for all major jurisdictions. Generally, tax authorities can examine all tax returns filed for the last three years. The Fund does not have an examination in progress. |
The Fund has reviewed all open tax years and major jurisdictions and concluded that these financial reporting rules had no effect on the Fund’s financial position or results of operations. There is no tax liability resulting from unrecognized tax benefits relating to uncertain income tax positions taken or expected to be taken on the tax return for the fiscal year ended December 31, 2011. The Fund is also not aware of any tax positions for which it is reasonably possible that the total amounts of unrecognized tax benefits will significantly change in the next twelve months.
| a) | Investment Management Agreement – HL Investment Advisors, LLC (“HL Advisors”), an indirect wholly owned subsidiary of The Hartford Financial Services Group, Inc. (“The Hartford”), serves as investment manager to the Fund pursuant to an Investment Management Agreement with the Company. As investment manager, HL Advisors has overall investment supervisory responsibility for the Fund. In addition, HL Advisors provides administrative personnel, services, equipment, facilities and office space for proper operation of the Fund. HL Advisors has contracted with Hartford Investment Management Company (“Hartford Investment Management”) under a sub-advisory agreement for the provision of day-to-day investment management services to the Fund in accordance with the Fund’s investment objective and policies. The Fund pays a fee to HL Advisors, a portion of which may be used to compensate Hartford Investment Management. |
The schedule below reflects the rates of compensation paid to HL Advisors for investment management services rendered as of December 31, 2011; the rates are accrued daily and paid monthly.
| Average Daily Net Assets | Annual Fee |
| On first $5 billion | 0.4000% |
| On next $5 billion | 0.3800% |
| Over $10 billion | 0.3700% |
| b) | Accounting Services Agreement – Pursuant to the Fund Accounting Agreement between HLIC and the Company, on behalf of the Fund, HLIC provides accounting services to the Fund and receives monthly compensation based on the Fund’s average daily net assets at the rates set forth below. The Fund’s accounting services fees are accrued daily and paid monthly. |
| Average Daily Net Assets | Annual Fee |
| All Assets | 0.010% |
| c) | Operating Expenses – Allocable expenses incurred by the Company are allocated to each Fund and allocated to classes within a Fund in proportion to the average daily net assets of the Fund and each class, except where allocation of certain expenses is more fairly made directly to the Fund or to specific classes within a Fund. |
| d) | Fees Paid Indirectly – The Fund’s custodian bank has agreed to reduce its fees when the Fund maintains cash on deposit in a non-interest-bearing custody account. For the year ended December 31, 2011, these amounts, if any, are included in the Statement of Operations. |
Hartford Money Market HLS Fund
Notes to Financial Statements – (continued)
December 31, 2011
(000’s Omitted)
The ratio of expenses to average net assets in the accompanying financial highlights excludes the reduction in expenses related to fees paid indirectly. The annualized expense ratio for the period listed below reflecting the reduction for fees paid indirectly is as follows:
| | | Year Ended December 31, 2011 | |
| Class IA | | | 0.16 | % |
| Class IB | | | 0.16 | |
| e) | Distribution Plan for Class IB shares – The Company, on behalf of the Fund, has adopted a Distribution Plan pursuant to Rule 12b-1 of the 1940 Act to compensate the Distributor, Hartford Securities Distribution Company, Inc. (a wholly owned, ultimate subsidiary of The Hartford), from assets attributable to the Class IB shares for services rendered and expenses borne in connection with activities primarily intended to result in the sale of the Class IB shares, subject to the review and approval of the Company’s Board of Directors. |
The Distribution Plan provides that the Fund may pay annually up to 0.25% of the average daily net assets of the Fund attributable to its Class IB shares for activities primarily intended to result in the sale of Class IB shares. The Board has the authority to suspend or reduce these payments at any point in time. Under the terms of the Distribution Plan and the principal underwriting agreement, the Fund is authorized to make payments monthly to the Distributor that may be used to pay or compensate entities providing distribution and shareholder servicing with respect to the Class IB shares for such entities’ fees or expenses incurred or paid in that regard. These fees are accrued daily and paid monthly.
At a meeting held on February 4, 2009, the Board of Directors approved the temporary reduction of distribution and service fees under the Fund’s Distribution Plan of the Company to zero for Class IB for a period of six months, effective March 1, 2009. Effective September 1, 2009, the Board of Directors approved a six month extension of this reduction of distribution and service fees under the Fund’s Distribution Plan. The Board of Directors then continued to approve these six month extentions of the reduction of distribution and service fees to zero for class IB through February 29, 2012. Effective February 2, 2012, the Board of Directors approved a six-month extension of the reduction of distribution and service fees under the Fund’s Distribution Plan. The Fund’s actions will result in a corresponding temporary reduction of 12b-1 payments of amounts paid to financial intermediaries by the Fund’s distributor to zero for Class IB during this time period. The Board of Directors’ action can be changed at any time. The Hartford may be required to pay, out of its own resources, the equivalent of the 12b-1 fees to financial intermediaries notwithstanding the reduction of 12b-1 fees.
| f) | Other Related Party Transactions – Certain officers of the Fund are directors and/or officers of HL Advisors and/or The Hartford or its subsidiaries. For the year ended December 31, 2011, a portion of the Fund’s chief compliance officer’s salary was paid by all the investment companies in the Hartford fund complex. The portion allocated to the Fund was in the amount of $3. Hartford Administrative Services Company (“HASCO”), an indirect wholly owned subsidiary of The Hartford, provides transfer agent services to the Fund. HASCO was compensated on a per account basis for providing such services. The amount paid to HASCO can be found in the Statement of Operations. These fees are accrued daily and paid monthly. |
On September 16, 2010, due to the realized losses incurred by the Fund, HL Advisers paid $9,496 to the Fund to provide support to the Fund’s $1.00 NAV. The payments had no impact on the Fund’s total return. These amounts are shown as an increase from payment from affiliate on the Statement of Changes in Net Assets.
| 7. | Investment Transactions: |
For the year ended December 31, 2011, the costs of purchases and sales of securities (including U.S. Government Obligations) for the Fund were $103,412,910 and $103,571,935, respectively.
Under the Company’s organizational documents, the Company shall indemnify its officers and directors to the full extent required or permitted under Maryland General Corporation Law and the federal securities laws. In addition, the Company, on behalf of the Fund, may enter into contracts that contain a variety of indemnifications. The Company’s maximum exposure under these arrangements is unknown. However, as of the date of these financial statements, the Company has not had prior claims or losses pursuant to these contracts and expects the risk of loss to be remote.
Hartford Money Market HLS Fund
Financial Highlights
- Selected Per-Share Data (A) -
Class | | Net Asset Value at Beginning of Period | | | Net Investment Income (Loss) | | | Payments from (to) Affiliate | | | Net Realized and Unrealized Gain (Loss) on Investments | | | Total from Investment Operations | | | Dividends from Net Investment Income | | | Distributions from Realized Capital Gains | | | Distributions from Capital | | | Total Distributions | | | Net Increase (Decrease) in Net Asset Value | | | Net Asset Value at End of Period | |
| For the Year Ended December 31, 2011 |
| IA | | $ | 1.00 | | | $ | – | | | $ | – | | | $ | – | | | $ | – | | | $ | – | | | $ | – | | | $ | – | | | $ | – | | | $ | – | | | $ | 1.00 | |
| IB | | | 1.00 | | | | – | | | | – | | | | – | | | | – | | | | – | | | | – | | | | – | | | | – | | | | – | | | | 1.00 | |
| For the Year Ended December 31, 2010 | | | | | | | | | | | | | | | | | | | | | | | | | | | | | | | | | |
| IA | | | 1.00 | | | | – | | | | – | | | | – | | | | – | | | | – | | | | – | | | | – | | | | – | | | | – | | | | 1.00 | |
| IB | | | 1.00 | | | | – | | | | – | | | | – | | | | – | | | | – | | | | – | | | | – | | | | – | | | | – | | | | 1.00 | |
| For the Year Ended December 31, 2009 | | | | | | | | | | | | | | | | | | | | | | | | | | | | | | | | | |
| IA | | | 1.00 | | | | – | | | | – | | | | – | | | | – | | | | – | | | | – | | | | – | | | | – | | | | – | | | | 1.00 | |
| IB | | | 1.00 | | | | – | | | | – | | | | – | | | | – | | | | – | | | | – | | | | – | | | | – | | | | – | | | | 1.00 | |
| For the Year Ended December 31, 2008 | | | | | | | | | | | | | | | | | | | | | | | | | | | | | | | | | |
| IA | | | 1.00 | | | | 0.02 | | | | – | | | | – | | | | 0.02 | | | | (0.02 | ) | | | – | | | | – | | | | (0.02 | ) | | | – | | | | 1.00 | |
| IB | | | 1.00 | | | | 0.02 | | | | – | | | | – | | | | 0.02 | | | | (0.02 | ) | | | – | | | | – | | | | (0.02 | ) | | | – | | | | 1.00 | |
| For the Year Ended December 31, 2007 | | | | | | | | | | | | | | | | | | | | | | | | | | | | | | | |
| IA | | | 1.00 | | | | 0.05 | | | | – | | | | – | | | | 0.05 | | | | (0.05 | ) | | | – | | | | – | | | | (0.05 | ) | | | – | | | | 1.00 | |
| IB | | | 1.00 | | | | 0.05 | | | | – | | | | – | | | | 0.05 | | | | (0.05 | ) | | | – | | | | – | | | | (0.05 | ) | | | – | | | | 1.00 | |
| (A) | Information presented relates to a share outstanding throughout the indicated period.
|
| (B) | The figures do not include sales charges or other fees which may be applied at the variable life insurance, variable annuity or qualified retirement plan product level. Any such additional sales charges or other fees would lower the Fund's performance.
|
| (C) | Ratios do not reflect reductions for fees paid indirectly. Please see Fees Paid Indirectly in the Notes to Financial Statements.
|
| (D) | Portfolio turnover rate is calculated on the basis of the Fund as a whole without distinguishing between the classes of shares issued. |
- Ratios and Supplemental Data -
| Total Return(B) | | Net Assets at End of Period | | | Ratio of Expenses to Average Net Assets Before Waivers(C) | | | Ratio of Expenses to Average Net Assets After Waivers(C) | | | Ratio of Net Investment Income (Loss) to Average Net Assets | | | Portfolio Turnover Rate(D) | |
|
| – | % | $ | 1,970,312 | | | | 0.42 | % | | | 0.16 | % | | | – | % | | | N/A | |
| – | | | 376,648 | | | | 0.42 | | | | 0.16 | | | | – | | | | – | |
| | | | | | | | | | | | �� | | | | | | | | |
| – | | | 2,086,014 | | | | 0.43 | | | | 0.22 | | | | – | | | | N/A | |
| – | | | 419,519 | | | | 0.43 | | | | 0.22 | | | | – | | | | – | |
| | | | | | | | | | | | | | | | | | | | | |
| 0.06 | | | 2,820,121 | | | | 0.48 | | | | 0.32 | | | | 0.02 | | | | N/A | |
| 0.05 | | | 548,134 | | | | 0.53 | | | | 0.34 | | | | 0.00 | | | | – | |
| | | | | | | | | | | | | | | | | | | | | |
| 2.15 | | | 4,427,230 | | | | 0.47 | | | | 0.42 | | | | 2.01 | | | | N/A | |
| 1.89 | | | 774,432 | | | | 0.72 | | | | 0.67 | | | | 1.80 | | | | – | |
| | | | | | | | | | | | | | | | | | | | | |
| 4.95 | | | 2,224,124 | | | | 0.47 | | | | 0.42 | | | | 4.83 | | | | N/A | |
| 4.69 | | | 452,976 | | | | 0.72 | | | | 0.67 | | | | 4.58 | | | | – | |
Report of Independent Registered Public Accounting Firm
The Board of Directors and Shareholders of
Hartford Series Fund, Inc.
We have audited the accompanying statement of assets and liabilities, including the schedule of investments, of Hartford Money Market HLS Fund (one of the portfolios constituting Hartford Series Fund, Inc. (the Funds)) as of December 31, 2011, and the related statement of operations for the year then ended, the statements of changes in net assets for each of the two years in the period then ended, and the financial highlights for each of the five years in the period then ended. These financial statements and financial highlights are the responsibility of the Funds’ management. Our responsibility is to express an opinion on these financial statements and financial highlights based on our audits.
We conducted our audits in accordance with the standards of the Public Company Accounting Oversight Board (United States). Those standards require that we plan and perform the audit to obtain reasonable assurance about whether the financial statements and financial highlights are free of material misstatement. We were not engaged to perform an audit of the Funds’ internal control over financial reporting. Our audits included consideration of internal control over financial reporting as a basis for designing audit procedures that are appropriate in the circumstances, but not for the purpose of expressing an opinion on the effectiveness of the Funds’ internal control over financial reporting. Accordingly, we express no such opinion. An audit also includes examining, on a test basis, evidence supporting the amounts and disclosures in the financial statements and financial highlights, assessing the accounting principles used and significant estimates made by management, and evaluating the overall financial statement presentation. Our procedures included confirmation of securities owned as of December 31, 2011, by correspondence with the custodian and brokers or by other appropriate auditing procedures where replies from brokers were not received. We believe that our audits provide a reasonable basis for our opinion.
In our opinion, the financial statements and financial highlights referred to above present fairly, in all material respects, the financial position of Hartford Money Market HLS Fund of Hartford Series Fund, Inc. at December 31, 2011, the results of its operations for the year then ended, the changes in its net assets for each of the two years in the period then ended, and the financial highlights for each of the five years in the period then ended, in conformity with U.S. generally accepted accounting principles.
Minneapolis, MN
February 13, 2012
Hartford Money Market HLS Fund
Directors and Officers (Unaudited)
The Board of Directors of the Company appoints officers who are responsible for the day-to-day operations of the Fund and who execute policies formulated by the Directors. Each director serves until his or her death, resignation, or retirement or until the next annual meeting of shareholders is held or until his or her successor is elected and qualifies.
Directors and officers who are employed by or who have a financial interest in The Hartford are considered “interested” persons of the Fund pursuant to the 1940 Act. Each officer and two of the Company’s directors, as noted in the chart below, are “interested” persons of the Fund. Each director serves as a director for The Hartford Mutual Funds, Inc., The Hartford Mutual Funds II, Inc., Hartford Series Fund, Inc., Hartford HLS Series Fund II, Inc., and as a trustee for The Hartford Alternative Strategies Fund, which, as of December 31, 2011, collectively consist of 91 funds. Correspondence may be sent to directors and officers c/o Hartford Mutual Funds, P.O. Box 2999, Hartford, Connecticut 06104-2999, except that correspondence to Ms. Fagely may be sent to 500 Bielenberg Drive, Woodbury, Minnesota 55125.
The table below sets forth, for each director and officer, his or her name, year of birth, current position with the Company and date first elected or appointed to Hartford Series Fund, Inc. (“HSF”), and Hartford HLS Series Fund II, Inc. (“HSF2”), principal occupation, and, for directors, other directorships held. The Fund’s statement of additional information contains further information on the directors and is available free of charge by calling 1-800-862-6668 or writing to Hartford HLS Funds, c/o Individual Annuity Services, P.O. Box 5085, Hartford, CT 06102-5085.
Information on the aggregate remuneration paid to the directors of the Company can be found in the Statement of Operations herein. The Fund pays to The Hartford a portion of the chief compliance officer’s compensation, but does not pay salaries or compensation to any of their other officers or directors who are employed by The Hartford.
Non-Interested Directors
Lynn S. Birdsong (1946) Director since 2003, Co-Chairman of the Investment Committee
Mr. Birdsong is a private investor. Mr. Birdsong currently serves as a Director of the Sovereign High Yield Investment Company (April 2010 to current). Mr. Birdsong currently serves as an Independent Director of Nomura Partners Funds, Inc. (formerly, The Japan Fund) (March 2003 to current). From 2003 to March 2005, Mr. Birdsong was an independent director of the Atlantic Whitehall Funds. From 1979 to 2002, Mr. Birdsong was a managing director of Zurich Scudder Investments, an investment management firm. During his employment with Scudder, Mr. Birdsong was an Interested Director of The Japan Fund. Since 1981, Mr. Birdsong has been a partner in Birdsong Company, an advertising specialty firm.
Robert M. Gavin, Jr. (1940) Director since 2002 (HSF) and 1986 (HSF2), Chairman of the Board since 2004
Dr. Gavin is an educational consultant. Prior to September 1, 2001, he was President of Cranbrook Education Community and prior to July 1996, he was President of Macalester College, St. Paul, Minnesota.
Duane E. Hill (1945) Director since 2001 (HSF) and 2002 (HSF2), Chairman of the Nominating Committee
Mr. Hill is Partner of TSG Ventures L.P., a private equity investment company. Mr. Hill is a former partner of TSG Capital Group, a private equity investment firm that served as sponsor and lead investor in leveraged buyouts of middle market companies.
Sandra S. Jaffee (1941) Director since 2005
Ms. Jaffee served as Chairman (2008 to 2009) and Chief Executive Officer of Fortent (formerly Searchspace Group), a leading provider of compliance/regulatory technology to financial institutions from August 2005 to August 2009. From August 2004 to August 2005, Ms. Jaffee served as an Entrepreneur in Residence with Warburg Pincus, a private equity firm. From September 1995 to July 2004, Ms. Jaffee served as Executive Vice President at Citigroup, where she was President and Chief Executive Officer of Citibank’s Global Securities Services (1995 to 2003). Ms. Jaffe currently serves as a member of the Board of Directors of Broadridge Financial Solutions as well as a Trustee of Muhlenberg College.
William P. Johnston (1944) Director since 2005, Chairman of the Compliance Committee
In June 2006, Mr. Johnston was appointed as Senior Advisor to The Carlyle Group, a global private equity investment firm. In August 2007, Mr. Johnston was elected to the Board of Directors of LifeCare Holdings, Inc. In February 2008, Mr. Johnston was elected to the Board of Directors of HCR-ManorCare, Inc. In May 2006, Mr. Johnston was elected to the Supervisory Board of Fresenius Medical Care AG & Co. KGaA, after its acquisition of Renal Care Group, Inc. in March 2006. Mr. Johnston joined Renal Care Group in November 2002 as a member of the Board of Directors and served as Chairman of the Board from March 2003 through March 2006. Mr. Johnston served as a Director of MultiPlan, Inc. from July 2006 through August 2010. From September 1987 to December 2002, Mr. Johnston was with Equitable Securities Corporation (and its successors, SunTrust Equitable Securities and SunTrust Robinson Humphrey) serving in various investment banking and managerial positions, including Managing Director and Head of Investment Banking, Chief Executive Officer and Vice Chairman.
Hartford Money Market HLS Fund
Directors and Officers (Unaudited) – (continued)
Phillip O. Peterson (1944) Director since 2002 (HSF) and 2000 (HSF2), Chairman of the Audit Committee
Mr. Peterson is a mutual fund industry consultant. He was a partner of KPMG LLP (an accounting firm) until July 1999. Mr. Peterson joined William Blair Funds in February 2007 as a member of the Board of Trustees. From January 2004 to April 2005, Mr. Peterson served as Independent President of the Strong Mutual Funds.
Lemma W. Senbet (1946) Director since 2005
Dr. Senbet is the William E. Mayer Chair Professor of Finance and Director, Center for Financial Policy, at the University of Maryland, Robert H. Smith School of Business. He was chair of the Finance Department from 1998 to 2006. Previously he was a chaired professor of finance at the University of Wisconsin-Madison. Also, he was director of the Fortis Funds from March 2000 to July 2002. Dr. Senbet served the finance profession in various capacities, including as director of the American Finance Association and President of the Western Finance Association. In 2006, Dr. Senbet was inducted Fellow of Financial Management Association International for his career-long distinguished scholarship and professional service.
Interested Directors and Officers
David N. Levenson (1966) Director since 2010
Mr. Levenson currently serves as President of The Hartford’s Wealth Management business. He was appointed to this role in July 2010. Previously, Mr. Levenson served as Executive Vice President of Legacy Holdings for The Hartford from June 2009 to July 2010. From 2006 to 2009, Mr. Levenson was with Hartford Life Insurance K.K. where he served as President and Chief Executive Officer from 2007 to 2009. He served as Managing Director of Hartford Investment Management Company from 2005 to 2006. Additionally, Mr. Levenson serves as Executive Vice President of The Hartford and as President, Director and Chief Executive Officer of Hartford Life Insurance Company (“HLIC”) and Hartford Life, Inc. (“HL Inc.”).
Lowndes A. Smith (1939) Director since 1996 (HSF) and 2002 (HSF2), Co-Chairman of the Investment Committee
Mr. Smith served as Vice Chairman of The Hartford from February 1997 to January 2002, as President and Chief Executive Officer of HL Inc. from February 1997 to January 2002, and as President and Chief Operating Officer of The Hartford Life Insurance Companies from January 1989 to January 2002. Mr. Smith serves as a Director of White Mountains Insurance Group, Ltd., One Beacon Insurance and Symetra Financial and as a Managing Director of Whittington Gray Associates.
Other Officers
James E. Davey (1964) President and Chief Executive Officer since 2010
Mr. Davey serves as Executive Vice President of HLIC. Additionally, Mr. Davey serves as President, Chief Executive Officer and Manager of Hartford Investment Financial Services, Inc. (“HIFSCO”) and President, Chief Executive Officer and Manager of HL Advisors. Mr. Davey joined The Hartford in 2002.
Michael R. Dressen (1963) AML Compliance Officer since 2011
Mr. Dressen currently serves as Assistant Vice President of HLIC. He also serves as Chief Compliance Officer and AML Compliance Officer of Hartford Administrative Services Company (“HASCO”) and as Assistant Secretary and Compliance Officer of HIFSCO. Mr Dressen joined The Hartford in 2005 from State Farm Insurance Companies where he held various positions related to mutual funds, variable products, and property casualty insurance.
Tamara L. Fagely (1958) Vice President, Treasurer and Controller since 2002 (HSF) and 1993 (HSF2)
Ms. Fagely has been a Vice President of HASCO since 1998 and Chief Financial Officer since 2006. Currently Ms. Fagely is a Vice President of HLIC. She served as Assistant Vice President of HLIC from December 2001 through March 2005. In addition, Ms. Fagely is Controller and Chief Financial Officer of HIFSCO.
Dr. Robert J. Froehlich (1953) Senior Managing Director since 2009
Dr. Froehlich joined The Hartford as Senior Managing Director in September 2009. Prior to joining The Hartford, Dr. Froehlich served as Vice Chairman of Deutsche Asset Management from 1997-2009.
Edward P. Macdonald (1967) Vice President, Secretary and Chief Legal Officer since 2005
Mr. Macdonald serves as Vice President of HLIC and Chief Legal Officer of Mutual Funds and Vice President of HIFSCO. He also serves as Vice President and Secretary of HASCO, and Chief Legal Officer, Secretary and Vice President of HL Advisors. Mr. Macdonald joined The Hartford in 2005.
Vernon J. Meyer (1964) Vice President since 2006
Mr. Meyer serves as Senior Vice President of HLIC. He also serves as Senior Vice President of HIFSCO and HL Advisors. Mr. Meyer joined The Hartford in 2004.
Colleen B. Pernerewski (1969) Vice President and Chief Compliance Officer since 2010
Ms. Pernerewski serves as Vice President and Chief Investment Advisor Compliance Officer of HIFSCO and as Vice President and Chief Compliance Officer of HL Advisors. Ms. Pernerewski joined The Hartford in 2005 from Travelers Life and Annuity where she served as Counsel (2004-2005). Prior to Travelers Life and Annuity, Ms. Pernerewski held the position of Counsel at The Hartford (1998-2004).
Elizabeth L. Schroeder (1966) Vice President since 2010
Ms. Schroeder currently serves as Assistant Vice President of HLIC. Ms. Schroeder joined HLIC in 1991. She is also an Assistant Vice President of HASCO, HIFSCO and HL Advisors.
Martin Swanson (1962) Vice President since 2010
Mr. Swanson is a Vice President of HLIC. Mr. Swanson also serves as Vice President/Marketing for HIFSCO. Prior to joining HLIC in 1998, Mr. Swanson was a Vice President at PaineWebber, Inc.
Jane Wolak (1961) Vice President since 2009
Ms. Wolak currently serves as Senior Vice President of HLIC. Ms. Wolak joined HLIC as Vice President, Retail Product Services in May 2007. She is also Vice President of HASCO. Previously, Ms. Wolak was with Sun Life Financial where she held the position of Vice President, Service Center Operations from 2001-2007.
HOW TO OBTAIN A COPY OF THE FUND’S PROXY VOTING POLICIES AND VOTING RECORDS (UNAUDITED)
A description of the policies and procedures that the Fund uses to determine how to vote proxies relating to portfolio securities and a record of how the Fund voted any proxies for the twelve-month period ended June 30, 2011 are available (1) without charge, upon request, by calling 800-862-6668 and (2) on the SEC’s website at http://www.sec.gov.
QUARTERLY PORTFOLIO HOLDINGS INFORMATION (UNAUDITED)
The Fund files a complete schedule of portfolio holdings with the SEC for the first and third quarters of each fiscal year on Form N-Q. The Fund’s Forms are available (1) without charge, upon request, by calling 800-862-6668 and (2) on the SEC’s website at http://www.sec.gov. The Form N-Q may be reviewed and copied at the SEC’s Public Reference Room in Washington, DC. Information on the operation of the Public Reference Room may be obtained by calling 1-800-SEC-0330.
Hartford Money Market HLS Fund
Expense Example (Unaudited)
Your Fund's Expenses
As a shareholder of the Fund, you incur two types of costs: (1) transaction costs and (2) ongoing costs including investment management fees, distribution fees, and other fund expenses. This example is intended to help you understand your ongoing costs (in dollars) of investing in the Fund and to compare these costs with the ongoing costs of investing in other mutual funds. The example is based on an investment of $1,000 invested at the beginning of the period and held for the period of June 30, 2011 through December 31, 2011.
Actual Expenses
The first set of columns of the table below provides information about actual account values and actual expenses. You may use the information in this column, together with the amount you invested, to estimate the expenses that you paid over the period. Simply divide your account value by $1,000 (for example, an $8,600 account value divided by $1,000 = 8.6), then multiply the result by the number in the line under the heading entitled “Expenses Paid During Period” to estimate the expenses you paid on your account during this period.
Hypothetical Example for Comparison Purposes
The second set of columns of the table below provides information about hypothetical account values and hypothetical expenses based on the Fund’s actual expense ratio and an assumed rate of return of 5% per year before expenses, which is not the Fund’s actual return. The hypothetical account values and expenses may not be used to estimate the actual ending account balance or expenses you paid for the period. You may use this information to compare the ongoing costs of investing in the Fund and other funds. To do so, compare this 5% hypothetical example with the 5% hypothetical examples that appear in the shareholder reports of the other funds.
Please note that the expenses shown in the table are meant to highlight your ongoing costs only and do not reflect any transactional costs, such as sales charges (loads) and CDSC. Therefore, the second set of columns of the table is useful in comparing ongoing costs only, and will not help you determine the relative total costs of owning different funds. In addition, if these transactional costs were included, your costs would be higher. Expenses are equal to the Fund's annualized expense ratios multiplied by average account value over the period, multiplied by 184/365 (to reflect the one-half year period).
| | | Actual return | | | Hypothetical (5% return before expenses) | | | | | | | | |
| | | Beginning
Account Value
June 30, 2011 | | Ending Account Value
December 31, 2011 | | Expenses paid during the period
June 30, 2011
through
December 31, 2011 | | | Beginning
Account Value
June 30, 2011 | | Ending Account Value
December 31, 2011 | | Expenses paid during the period
June 30, 2011
through
December 31, 2011 | | Annualized expense ratio | | | Days in the current 1/2 year | | Days in the full year | |
| Class IA | | $ | 1,000.00 | | $ | 1,000.00 | | $ | 0.60 | | | $ | 1,000.00 | | $ | 1,024.60 | | $ | 0.61 | | | 0.12 | % | | | 184 | | | 365 | |
| Class IB | | $ | 1,000.00 | | $ | 1,000.00 | | $ | 0.60 | | | $ | 1,000.00 | | $ | 1,024.60 | | $ | 0.61 | | | 0.12 | % | | | 184 | | | 365 | |
Hartford Money Market HLS Fund
Approval of Investment Management and Investment Sub-Advisory Agreements (Unaudited)
Section 15(c) of the Investment Company Act of 1940, as amended (the “1940 Act”), requires that each mutual fund’s board of directors, including a majority of those directors who are not “interested persons” of the mutual fund, as defined in the 1940 Act (the “Independent Directors”), annually review and consider the continuation of the mutual fund’s investment advisory and sub-advisory agreements. At its meeting held on August 2-3, 2011, the Board of Directors (the “Board”) of Hartford Series Fund, Inc., including each of the Independent Directors, unanimously voted to approve the continuation of the investment management agreement for Hartford Money Market HLS Fund (the “Fund”) with HL Investment Advisors, LLC (“HL Advisors”) and the continuation of the investment sub-advisory agreement between HL Advisors and the Fund’s sub-adviser, Hartford Investment Management Company (the “Sub-adviser,” and together with HL Advisors, the “Advisers”) (collectively, the “Agreements”).
In the months preceding the August 2-3, 2011 meeting, the Board requested, received, and reviewed written responses from the Advisers to questions posed to them on behalf of the Independent Directors and supporting materials relating to those questions and responses. The Board considered information furnished to the Board at its meetings throughout the year, as well as information specifically prepared in connection with the annual approval of the Agreements at the Board’s meetings held on June 21-22, 2011 and August 2-3, 2011. Information provided to the Board at its meetings throughout the year included, among other things, reports on Fund performance, legal and compliance matters, sales and marketing activity, shareholder services, and the other services provided to the Fund by the Advisers and their affiliates. In addition, the Board received in-person presentations by Fund officers and representatives of HL Advisors at the Board’s meetings on June 21-22, 2011 and August 2-3, 2011 concerning the Agreements.
The Independent Directors, advised by independent legal counsel, engaged two service providers to assist them with evaluating the Agreements with respect to the Fund. Lipper Inc. (“Lipper”), an independent provider of investment company data, was retained to provide the Board with reports on how the Fund’s contractual management fees, actual management fees, other non-management fees, overall expense ratios and investment performance compared to those of mutual funds with similar investment objectives. The Independent Directors also engaged an independent financial services consulting firm (the “Consultant”) to assist them in evaluating the Fund’s management fees, sub-advisory fees, other non-management fees, overall expense ratios and investment performance. In addition, the Consultant reviewed the profitability calculations utilized by HL Advisors in connection with the continuation of the investment management agreement.
In determining to continue the Agreements for the Fund, the members of the Board reviewed and evaluated information and factors they believed to be relevant and appropriate in light of the information that the Board deemed necessary and appropriate through the exercise of their reasonable business judgment. While individual members of the Board may have weighed certain factors differently, the Board’s determination to continue the Agreements was based on a comprehensive consideration of all information provided to the Board throughout the year and specifically with respect to the continuation of the Agreements. A more detailed discussion of the factors the Board considered with respect to its approval of the Agreements is provided below.
Nature, Extent, And Quality Of Services Provided by the Advisers
The Board requested and considered information concerning the nature, extent, and quality of the services provided to the Fund by the Advisers. The Board considered, among other things, the terms of the Agreements and the range of services provided by the Advisers. The Board considered the Advisers’ professional personnel who provide services to the Fund, including each Adviser’s ability and experience in attracting and retaining qualified personnel to service the Fund. The Board considered each Adviser’s reputation and overall financial strength, as well as its willingness to consider and implement organizational and operational changes designed to improve services to the Fund. In addition, the Board considered the quality of each Adviser’s communications with the Board and responsiveness to Board inquiries.
The Board also requested and evaluated information concerning each Adviser’s regulatory and compliance environment. In this regard, the Board requested and reviewed information on each Adviser’s compliance policies and procedures, compliance history, and a report from the Fund’s Chief Compliance Officer on each Adviser’s compliance with applicable laws and regulations, including responses to regulatory developments and compliance issues raised by regulators. The Board also noted the Advisers’ support of the Fund’s compliance control structure, particularly the resources devoted by the Advisers in support of the Fund’s obligations pursuant to Rule 38a-1 under the 1940 Act.
Hartford Money Market HLS Fund
Approval of Investment Management and Investment Sub-Advisory Agreements (Unaudited) – (continued)
With respect to HL Advisors, the Board noted that under the Agreements, HL Advisors is responsible for the management of the Fund, including overseeing fund operations and service providers, as well as investment advisory services in connection with selecting, monitoring and supervising the Sub-adviser. The Board considered HL Advisors’ ongoing monitoring of people, process and performance, including its quarterly reviews of each of the Hartford HLS Funds, semi-annual meetings with the leaders of each Fund’s portfolio management team, and oversight of the Funds’ 49 portfolio managers. The Board recognized that HL Advisors has demonstrated a record of making changes to the management and/or strategies of the Funds when warranted. The Board considered HL Advisors’ oversight of the Sub-adviser’s investment approach and results, process for monitoring best execution of portfolio trades by the Sub-adviser, and approach to risk management with respect to the Fund and the service providers to the Fund. The Board also considered HL Advisors’ oversight of compliance with the Fund’s objective and policies as well as with applicable laws and regulations, noting that regulatory and other developments had over time led to an increase in the scope of HL Advisors’ services in this regard. In addition, the Board considered HL Advisors’ ongoing commitment to review and rationalize the Hartford fund family’s product line-up and the expenses that HL Advisors had incurred in connection with fund combinations in recent years. The Board considered that HL Advisors or its affiliates are responsible for providing the Fund’s officers. The Board also noted that Hartford Life Insurance Company (“HLIC”) provides administrative services to the Fund. The Board considered its experiences with HL Advisors and HLIC with respect to each of these services.
With respect to the Sub-adviser, who provides day-to-day portfolio management services, the Board considered the quality of the Fund’s portfolio managers, the Sub-adviser’s other investment personnel, its investment philosophy and process, investment research capabilities and resources, performance record, trade execution capabilities and experience. The Board considered the experience of the Fund’s portfolio managers, the number of accounts managed by the portfolio managers, and the Sub-adviser’s method for compensating the portfolio managers.
Based on these considerations, the Board concluded that it was satisfied with the nature, extent and quality of the services provided to the Fund by HL Advisors and the Sub-adviser.
Performance of the Fund and the Advisers
The Board considered the investment performance of the Fund. In this regard, the Board reviewed the performance of the Fund over different time periods presented in the materials and evaluated HL Advisors’ analysis of the Fund’s performance for these time periods. The Board considered information and materials provided to the Board by the Advisers concerning Fund performance, as well as information from Lipper comparing the investment performance of the Fund to an appropriate benchmark and universe of peer funds. The Board noted that the performance of the Fund was within expectations given the Fund’s focus on liquidity and preservation of capital. The Board also considered the effect of capital support arrangements and fee waivers on the peer comparisons.
The Board considered the detailed investment analytics reports provided by The Hartford’s Investment Advisory Group throughout the year. These reports include, among other things, information on the Fund’s gross and net returns, the Fund’s investment performance relative to an appropriate benchmark and peer group, various statistics concerning the Fund’s portfolio, and a narrative summary of various factors affecting Fund performance. The Board considered the Advisers’ cooperation with the Investment Committee, which assists the Board in evaluating the performance of the Fund at periodic meetings throughout the year. The Board also considered the analysis provided by the Consultant relating to the Fund’s performance track record.
In light of all the considerations noted above, the Board concluded that it had continued confidence in HL Advisors’ and the Sub-adviser’s overall capabilities to manage the Fund.
Costs of the Services and Profitability of the Advisers
The Board reviewed information regarding HL Advisors’ cost to provide investment management and related services to the Fund and HL Advisors’ profitability, both overall and for the Fund, on a pre-tax basis without regard to distribution expenses. The Board also requested and reviewed information about the profitability to HL Advisors and its affiliates from all services provided to the Fund and all aspects of their relationship with the Fund. The Board noted that the fees payable to the Sub-adviser are equal
to its estimated costs in providing sub-advisory services. Accordingly, the costs and profitability for the Sub-adviser and HL Advisors were considered in the aggregate.
The Board considered the Consultant’s review of the profitability calculations utilized by HL Advisors in connection with the continuation of the investment management agreement. In this regard, the Consultant reported that The Hartford’s process for calculating and reporting Fund profitability is reasonable, sound and well within common industry practice.
Based on these considerations, the Board concluded that the profits anticipated to be realized by the Advisers and their affiliates from their relationships with the Fund would not be excessive.
Comparison of Fees and Services Provided by the Advisers
The Board considered comparative information with respect to the management fees to be paid by the Fund to HL Advisors and the total expense ratios of the Fund. The Board also considered comparative information with respect to the sub-advisory fees to be paid by HL Advisors to the Sub-adviser, to the extent applicable. In this regard, the Board requested and reviewed information from HL Advisors and the Sub-adviser relating to the management and sub-advisory fees and total operating expenses for the Fund. The Board considered that the management fee for the Fund includes the fee paid to HLIC for providing certain administrative services to the Fund. The Board also reviewed information from Lipper comparing the Fund’s contractual management fees, actual management fees and overall expense ratios relative to a group of funds selected by Lipper, in consultation with the Consultant, and a broader universe of funds selected by Lipper. The Board also considered that it had approved a temporary reduction of the distribution and service fees for the Fund’s Class IB shares through February 29, 2012.
While the Board recognized that comparisons between the Fund and peer funds are imprecise, given the differing service levels and characteristics of mutual funds and the different business models and cost structures of the Advisers, the comparative information provided by Lipper assisted the Board in evaluating the reasonableness of the Fund’s management and sub-advisory fees and total operating expenses. In addition, the Board considered the analysis and recommendations of the Consultant relating to the Fund’s management and sub-advisory fees and total operating expenses.
Based on these considerations, the Board concluded that the Fund’s fees and total operating expenses, in conjunction with the information about quality of services, profitability, economies of scale, and other matters discussed, were reasonable in light of the services provided.
Economies of Scale
The Board requested and considered information regarding the Advisers’ realization of economies of scale with respect to the Fund and whether the fee levels reflect these economies of scale for the benefit of the Fund’s investors. With respect to HL Advisors, the Board considered representations from HL Advisors that it is difficult to anticipate whether and to what extent economies may be realized by HL Advisors as assets grow over time. The Board reviewed the breakpoints in the management fee schedule for the Fund, which reduces fee rates as Fund assets grow over time. The Board recognized that a fund with assets beyond the last breakpoint level will continue to benefit from economies of scale because additional assets are charged the lowest breakpoint fee resulting in lower overall effective management fee rates. The Board also recognized that a fee schedule that reaches a lower breakpoint quickly provides shareholders with the benefit of anticipated or potential economies of scale.
The Board reviewed and evaluated materials from Lipper showing how management fee schedules of peer funds reflect economies of scale for the benefit of investors as a peer fund’s assets hypothetically increase over time. Based on information provided by HL Advisors, Lipper, and the Consultant, the Board recognized that there is no uniform methodology for establishing breakpoints or uniform pattern in asset levels that trigger breakpoints or the amounts of breakpoints triggered.
After considering all of the information available to it, the Board concluded that it was satisfied with the extent to which economies of scale would be shared for the benefit of the Fund’s shareholders based on currently available information and the effective advisory fees and expense ratios for the Fund at its current and reasonably anticipated asset levels. The Board noted, however, that it would continue to monitor future growth in Fund assets and the appropriateness of additional breakpoints.
Hartford Money Market HLS Fund
Approval of Investment Management and Investment Sub-Advisory Agreements (Unaudited) – (continued)
Other Benefits
The Board considered other benefits to the Advisers and their affiliates from their relationships with the Fund, including the role of the Fund in supporting the variable life insurance and variable annuity products offered by The Hartford. The Board reviewed information noting that HLIC, an affiliate of HL Advisors, receives fees for providing certain administrative services to the Fund, and that HLIC also receives fees for fund accounting and related services from the Fund, and the Board considered information on expected profits to HLIC or its affiliates for such services. The Board also considered that Hartford Administrative Services Company (“HASCO”), the Fund’s transfer agent and an affiliate of HL Advisors, receives transfer agency compensation from the Fund, and the Board reviewed information on the expected profitability of the Fund’s transfer agency function to HASCO. The Board considered information provided by HASCO indicating that the transfer agent fees charged by HASCO to the Fund were fair and reasonable based on publicly available information.
The Board also considered that Hartford Securities Distribution Company, Inc., as principal underwriter of the Fund, receives 12b-1 fees from the Fund. The Board also noted that certain affiliates of HL Advisors distribute shares of the Fund and receive compensation in that connection.
The Board considered the benefits, if any, to the Sub-adviser from any use of the Fund’s brokerage commissions to obtain soft dollar research.
The Board considered the benefits to shareholders of being part of the Hartford family of funds. The Board considered HL Advisors’ efforts to provide investors in the family with a broad range of investment styles and asset classes.
* * * *
Based upon its review of these various factors, among others, the Board concluded that it is in the best interests of the Fund and its shareholders for the Board to approve the Agreements for an additional year. In reaching this decision, the Board did not assign relative weights to the factors discussed above or deem any one or group of them to be controlling in and of themselves. In connection with their deliberations, the Independent Directors met separately in executive session on several occasions, with independent legal counsel, to review the relevant materials and consider their responsibilities under relevant laws and regulations.
The Hartford
P.O. Box 5085
Hartford, CT 06102-5085
Hartford Series Fund, Inc. is underwritten and distributed by Hartford Securities Distribution Company, Inc.
"The Hartford" is The Hartford Financial Services Group, Inc. and its subsidiaries.
Hartford Series Fund, Inc. inception dates range from 1977 to date. Hartford Series Fund, Inc. is not a subsidiary of The Hartford but is underwritten, distributed by and advised by subsidiaries of The Hartford. Investments in Hartford Series Fund, Inc. are not guaranteed by The Hartford or any other entity.
You should carefully consider investment objectives, risks, and charges and expenses of Hartford HLS Funds before investing. This and other information can be found in the Fund’s prospectus or summary prospectus, which can be obtained by calling 800-862-6668. Please read them carefully before you invest or send money.
HLSAR-MM11 2-12 109078 Printed in U.S.A ©2011 The Hartford, Hartford, CT 06115 | |
A MESSAGE FROM THE PRESIDENT
Dear Fellow Shareholders:
I want to take this opportunity to say thank you for investing in Hartford HLS Funds.
This has been a tumultuous year. In the beginning of 2011, we witnessed tension-fueled political uprisings in the already-volatile Middle East and North Africa region. We also watched as Japan dealt with a series of crises including a massive earthquake and subsequent tsunami. Yet, U.S. economic conditions continued to improve, with gains in consumer confidence and retail sales. During the first half of 2011, domestic, international, and world indices (as measured by the S&P 500, MSCI EAFE and MSCI World) were all up more than 5% through June, 30 2011.
The economic recovery, however, lost momentum in the second half of 2011. The employment and housing markets both remain extremely challenged. Investors continue to be concerned about the implications of the European sovereign debt crisis, as well as our own high levels of domestic debt. Fears that the European sovereign debt crisis could continue to drag down the global economy have weighed heavily on stocks.
Ongoing apprehension regarding the U.S. debt ceiling during the summer and the resulting downgrade of the U.S. sovereign credit rating by Standard & Poor’s also contributed to weaker investor confidence.
There are, however, some reasons to remain confident. Corporations have record levels of cash on their balance sheets—corporate cash has doubled in the past 10 years. In addition, U.S. gross domestic product expanded at a 2.5 percent annual rate in the third quarter according to the Commerce Department, as consumers and businesses set aside fears about the recovery and stepped up spending. Corporate earnings have also remained positive, with a majority of companies beating expectations each quarter this year. This momentum will hopefully continue into next year.
As we head into 2012, in light of the continued market volatility, now would be a good time to schedule a meeting with your financial advisor to examine your current investment strategy and determine whether you are on the right track.
| • | Does your fixed-income portfolio complement your equity portfolio? |
| • | Are you receiving diversified sources of income? |
| • | Is your portfolio still in line with your risk tolerance and investment time horizon? |
Talk to your advisor to see what changes you should make to address these concerns and opportunities.
Thank you again for investing with Hartford HLS Funds.
James Davey
President
Hartford HLS Funds
Hartford Portfolio Diversifier HLS Fund
Table of Contents
This report is prepared for the general information of contract owners and qualified retirement plan participants. It is not an offer of contracts or of qualified retirement plans. It should not be used in connection with any offer, except in conjunction with the appropriate product prospectus which contains all pertinent information including the applicable sales, administrative and other charges.
The views expressed in the Fund’s Manager Discussion under ‘‘Why did the Fund perform this way?’’ and ‘‘What is the outlook?’’ are views of the Fund’s sub-adviser and portfolio management team through the end of the period and are subject to change based on market and other conditions.
Hartford Portfolio Diversifier HLS Fund inception 06/06/2011
(sub-advised by Hartford Investment Management Company)
Investment objective – Seeks to produce investment performance that mitigates against significant declines in the aggregate value of investment allocations to equity mutual funds under certain variable annuity contracts issued by Hartford Life Insurance Company and its affiliates, while also preserving the potential for modest appreciation in the Fund’s net asset value when markets are appreciating.

The chart above shows the growth of a $10,000 investment in Class IB.
| Cumulative Returns (as of 12/31/11) (1) |
| | Since
Inception |
| Portfolio Diversifier IB | 2.38% |
| Barclays Capital U.S. Aggregate Bond Index | 4.52% |
| S&P 500 Index | -0.99% |
| | |
PAST PERFORMANCE IS NOT INDICATIVE OF FUTURE RESULTS.
| Total returns presented above were calculated using the Fund's net asset value available to shareholders for sale or redemption of Fund shares on December 31, 2011, which may exclude investment transactions as of this date. |
Barclays Capital U.S. Aggregate Bond Index is an unmanaged index and is composed of securities from the Barclays Capital Government/Credit Bond Index, Mortgage-Backed Securities Index, Asset-Backed Securities Index and Commercial Mortgage-Backed Securities Index.
S&P 500 Index is a market capitalization-weighted price index composed of 500 widely held common stocks.
You cannot invest directly in an index.
The chart represents a hypothetical investment in the Fund. Performance data represents past performance and current performance could be higher or lower.
Performance information may reflect historical or current expense waivers/reimbursements from the investment adviser, without which performance would have been lower. For information on current expense waivers/reimbursements, please see the prospectus.
The value of the Fund will fluctuate so that when redeemed, it may be worth more or less than the original investment. The chart and table do not reflect the deductions of taxes, sales charges or other fees which may be applied at the variable annuity level. Any such additional sales charges or other fees or expenses would lower the contract’s performance.
Hartford Portfolio Diversifier HLS Fund
Manager Discussion (Unaudited)
December 31, 2011
| Portfolio Managers | | |
| Paul Bukowski, CFA | James Ong, CFA | |
| Senior Vice President and Head of Quantitative Equities | Vice President | |
| | | |
How did the Fund perform?
The Class IB shares of the Hartford Portfolio Diversifier HLS Fund returned 2.38% for the period from inception (June 6, 2011) to December 31, 2011 compared to the returns of the Barclays U.S. Aggregate Bond Index which returned 4.52% and the S&P 500 Index which returned -0.99% for the same period.
Why did the Fund perform this way?
The Fund performed in line with expectations. The Fund invests in securities which we expect to increase in value as the S&P declines (protection) and securities which replicate the Barclays Capital U.S. Aggregate Bond and S&P 500 Indices.
As the S&P 500 faltered during August and September, the Fund’s protection securities rose in value, only to give up some gains by the end of the year as the S&P 500 rose (October was one of the strongest months for equity market returns in the last 20 years). The Fund’s Barclays Capital U.S. Aggregate Bond position also added value as this index outperformed the S&P 500.
What is the outlook?
During the last several months, U.S. economic data has improved and U.S. recession risks seemed to have eased. However, the European debt crisis seems unabated, if not spreading, for example to France. It is possible we are seeing the beginnings of a decoupling of U.S. macroeconomic concerns from Europe. Additionally, earnings growth was solid during the fourth quarter and the trend looks to continue despite analyst downward revisions. That is the good news.
The bad news is that given the globalization of our economy, we view any decoupling of the U.S. economy from European troubles as short-lived or, at the very least, we expect the European debt crisis to act as a material governor on the ability of the U.S. economy to grow. We believe macroeconomic data, while improved, is still – on the whole - weak and remains a significant barrier to growth. Investor sentiment is another significant barrier to long term fundamental growth. Underneath the markets robust returns in October was a high volume of short covering, but little participation by long term institutional investors and trading volume throughout the fourth quarter was tepid compared to normal levels. In this environment, we believe investors will place marginally higher demand for quality, stable and consistent earnings.
| Diversification by Security Type |
| as of December 31, 2011 |
| Category | | Percentage of
Net Assets | |
| Equity Securities | | | | |
| Common Stocks | | | 18.7 | % |
| Exchange Traded Funds | | | 1.2 | |
| Put Options Purchased | | | 26.3 | |
| Total | | | 46.2 | % |
| Fixed Income Securities | | | | |
| Asset & Commercial Mortgage Backed Securities | | | 0.7 | % |
| Corporate Bonds | | | 8.9 | |
| Foreign Government Obligations | | | 0.7 | |
| Municipal Bonds | | | 0.2 | |
| U.S. Government Agencies | | | 13.8 | |
| U.S. Government Securities | | | 14.8 | |
| Total | | | 39.1 | % |
| Short-Term Investments | | | 29.0 | % |
| Other Assets and Liabilities | | | (14.3 | ) |
| Total | | | 100.0 | % |
|
Hartford Portfolio Diversifier HLS Fund
Manager Discussion (Unaudited) – (continued)
December 31, 2011
| Diversification by Industry |
| as of December 31, 2011 |
| |
| Industry (Sector) | | | Percentage of
Net Assets | |
| Equity Securities | | | | |
| Automobiles & Components (Consumer Discretionary) | | | 0.1 | % |
| Banks (Financials) | | | 0.5 | |
| Capital Goods (Industrials) | | | 1.5 | |
| Commercial & Professional Services (Industrials) | | | 0.1 | |
| Consumer Durables & Apparel (Consumer Discretionary) | | | 0.2 | |
| Consumer Services (Consumer Discretionary) | | | 0.4 | |
| Diversified Financials (Financials) | | | 1.0 | |
| Energy (Energy) | | | 2.3 | |
| Food & Staples Retailing (Consumer Staples) | | | 0.4 | |
| Food, Beverage & Tobacco (Consumer Staples) | | | 1.2 | |
| Health Care Equipment & Services (Health Care) | | | 0.7 | |
| Household & Personal Products (Consumer Staples) | | | 0.5 | |
| Insurance (Financials) | | | 0.7 | |
| Materials (Materials) | | | 0.7 | |
| Media (Consumer Discretionary) | | | 0.6 | |
| Other Investment Pools and Funds (Financials) | | | 1.2 | |
| Pharmaceuticals, Biotechnology & Life Sciences (Health Care) | | | 1.5 | |
| Real Estate (Financials) | | | 0.4 | |
| Retailing (Consumer Discretionary) | | | 0.7 | |
| Semiconductors & Semiconductor Equipment (Information Technology) | | | 0.4 | |
| Software & Services (Information Technology) | | | 1.8 | |
| Technology Hardware & Equipment (Information Technology) | | | 1.4 | |
| Telecommunication Services (Services) | | | 0.5 | |
| Transportation (Industrials) | | | 0.4 | |
| Utilities (Utilities) | | | 0.7 | |
| Total | | | 19.9 | % |
| Fixed Income Securities | | | | |
| Administrative Waste Management and Remediation (Services) | | | 0.0 | % |
| Airport Revenues (Airport Revenues) | | | 0.0 | |
| Arts, Entertainment and Recreation (Services) | | | 0.4 | |
| Beverage and Tobacco Product Manufacturing (Consumer Staples) | | | 0.3 | |
| Chemical Manufacturing (Basic Materials) | | | 0.1 | |
| Computer and Electronic Product Manufacturing (Technology) | | | 0.3 | |
| Couriers and Messengers (Services) | | | 0.1 | |
| Electrical Equipment and Appliance Manufacturing (Technology) | | | 0.0 | |
| Finance and Insurance (Finance) | | | 4.4 | |
| Food Manufacturing (Consumer Staples) | | | 0.2 | |
| Food Services (Consumer Cyclical) | | | 0.0 | |
| General Obligations (General Obligations) | | | 0.1 | |
| Health Care and Social Assistance (Health Care) | | | 0.6 | |
| Higher Education (Univ., Dorms, etc.) (Higher Education (Univ., Dorms, etc.)) | | | 0.0 | |
| Information (Technology) | | | 0.7 | |
| Machinery Manufacturing (Capital Goods) | | | 0.1 | |
| Mining (Basic Materials) | | | 0.2 | |
| Miscellaneous Manufacturing (Capital Goods) | | | 0.2 | |
| Motor Vehicle & Parts Manufacturing (Consumer Cyclical) | | | 0.0 | |
| Paper Manufacturing (Basic Materials) | | | 0.1 | |
| Petroleum and Coal Products Manufacturing (Energy) | | | 0.7 | |
| Pipeline Transportation (Utilities) | | | 0.1 | |
| Primary Metal Manufacturing (Basic Materials) | | | 0.1 | |
| Professional, Scientific and Technical Services (Services) | | | 0.0 | |
| Public Administration (Services) | | | 0.0 | |
| Rail Transportation (Transportation) | | | 0.1 | |
| Retail Trade (Consumer Cyclical) | | | 0.3 | |
| Soap, Cleaning Compound and Toilet Manufacturing (Consumer Staples) | | | 0.1 | |
| Transportation (Transportation) | | | 0.1 | |
| Utilities (Utilities) | | | 0.5 | |
| Total | | | 9.8 | % |
| Foreign Government Obligations | | | 0.7 | % |
| Put Options Purchased | | | 26.3 | |
| U.S. Government Agencies | | | 13.8 | |
| U.S. Government Securities | | | 14.8 | |
| Short-Term Investments | | | 29.0 | |
| Other Assets and Liabilities | | | (14.3 | ) |
| Total | | | 100.0 | % |
|
| Distribution by Credit Quality |
| as of December 31, 2011 |
| |
| Credit Rating * | | | Percentage of
Net Assets | |
| Aaa / AAA | | | 1.6 | % |
| Aa / AA | | | 1.0 | |
| A | | | 4.3 | |
| Baa / BBB | | | 3.5 | |
| Ba / BB | | | 0.1 | |
| Unrated | | | 0.0 | |
| U.S. Government Agencies and Securities | | | 30.8 | |
| Non Debt Securities and Other Short-Term Instruments | | | 73.0 | |
| Other Assets & Liabilities | | | (14.3 | ) |
| Total | | | 100.0 | % |
| * | Does not apply to the Fund itself. Based upon Moody’s and S&P long-term credit ratings for the Fund’s holdings as of the date noted. If Moody's and S&P assign different ratings to a holding, the lower rating is used. "Unrated" includes fixed-income securities (other than cash-like short-term instruments and U.S. Government securities) for which Moody’s and S&P have not issued long-term credit ratings. |
Hartford Portfolio Diversifier HLS Fund
Schedule of Investments
December 31, 2011
(000’s Omitted)
| Shares or Principal Amount | | Market Value ╪ | |
COMMON STOCKS - 18.7% | |
| | | | | Automobiles & Components - 0.1% | | | | |
| | – | | | BorgWarner, Inc. ● | | $ | 12 | |
| | 7 | | | Ford Motor Co. w/ Rights ● | | | 72 | |
| | – | | | Goodyear Tire & Rubber Co. ● | | | 6 | |
| | – | | | Harley-Davidson, Inc. | | | 16 | |
| | 1 | | | Johnson Controls, Inc. | | | 37 | |
| | | | | | | | 143 | |
| | | | | Banks - 0.5% | | | | |
| | 1 | | | BB&T Corp. | | | 31 | |
| | – | | | Comerica, Inc. | | | 9 | |
| | 2 | | | Fifth Third Bancorp | | | 21 | |
| | – | | | First Horizon National Corp. | | | 4 | |
| | 1 | | | Hudson City Bancorp, Inc. | | | 6 | |
| | 2 | | | Huntington Bancshares, Inc. | | | 8 | |
| | 2 | | | Keycorp | | | 13 | |
| | – | | | M&T Bank Corp. | | | 17 | |
| | 1 | | | People's United Financial, Inc. | | | 8 | |
| | 1 | | | PNC Financial Services Group, Inc. | | | 53 | |
| | 2 | | | Regions Financial Corp. | | | 9 | |
| | 1 | | | SunTrust Banks, Inc. | | | 17 | |
| | 3 | | | US Bancorp | | | 90 | |
| | 9 | | | Wells Fargo & Co. | | | 255 | |
| | – | | | Zion Bancorp | | | 5 | |
| | | | | | | | 546 | |
| | | | | Capital Goods - 1.5% | | | | |
| | 1 | | | 3M Co. | | | 100 | |
| | 1 | | | Boeing Co. | | | 96 | |
| | 1 | | | Caterpillar, Inc. | | | 103 | |
| | – | | | Cooper Industries plc Class A | | | 15 | |
| | – | | | Cummins, Inc. | | | 30 | |
| | 1 | | | Danaher Corp. | | | 47 | |
| | 1 | | | Deere & Co. | | | 56 | |
| | – | | | Dover Corp. | | | 19 | |
| | 1 | | | Eaton Corp. | | | 25 | |
| | 1 | | | Emerson Electric Co. | | | 60 | |
| | 1 | | | Fastenal Co. | | | 23 | |
| | – | | | Flowserve Corp. | | | 10 | |
| | – | | | Fluor Corp. | | | 15 | |
| | 1 | | | General Dynamics Corp. | | | 41 | |
| | 19 | | | General Electric Co. | | | 331 | |
| | – | | | Goodrich Corp. | | | 27 | |
| | 1 | | | Honeywell International, Inc. | | | 74 | |
| | 1 | | | Illinois Tool Works, Inc. | | | 39 | |
| | 1 | | | Ingersoll-Rand plc | | | 17 | |
| | – | | | Jacobs Engineering Group, Inc. ● | | | 9 | |
| | – | | | Joy Global, Inc. | | | 14 | |
| | – | | | L-3 Communications Holdings, Inc. | | | 12 | |
| | – | | | Lockheed Martin Corp. | | | 38 | |
| | 1 | | | Masco Corp. | | | 7 | |
| | – | | | Northrop Grumman Corp. | | | 27 | |
| | 1 | | | PACCAR, Inc. | | | 23 | |
| | – | | | Pall Corp. | | | 11 | |
| | – | | | Parker-Hannifin Corp. | | | 20 | |
| | – | | | Precision Castparts Corp. | | | 42 | |
| | – | | | Quanta Services, Inc. ● | | | 8 | |
| | 1 | | | Raytheon Co. | | | 29 | |
| | – | | | Rockwell Automation, Inc. | | | 18 | |
| | – | | | Rockwell Collins, Inc. | | | 15 | |
| | – | | | Roper Industries, Inc. | | | 15 | |
| | – | | | Snap-On, Inc. | | | 5 | |
| | – | | | Stanley Black & Decker, Inc. | | | 20 | |
| | – | | | Textron, Inc. | | | 9 | |
| | 1 | | | Tyco International Ltd. | | | 38 | |
| | 2 | | | United Technologies Corp. | | | 116 | |
| | – | | | W.W. Grainger, Inc. | | | 20 | |
| | – | | | Xylem, Inc. | | | 8 | |
| | | | | | | | 1,632 | |
| | | | | Commercial & Professional Services - 0.1% | | | | |
| | – | | | Avery Dennison Corp. | | | 5 | |
| | – | | | Cintas Corp. | | | 7 | |
| | – | | | Dun & Bradstreet Corp. | | | 6 | |
| | – | | | Equifax, Inc. ● | | | 8 | |
| | – | | | Iron Mountain, Inc. | | | 10 | |
| | – | | | Pitney Bowes, Inc. | | | 7 | |
| | – | | | R.R. Donnelley & Sons Co. | | | 5 | |
| | 1 | | | Republic Services, Inc. | | | 15 | |
| | – | | | Robert Half International, Inc. | | | 7 | |
| | – | | | Stericycle, Inc. ● | | | 12 | |
| | 1 | | | Waste Management, Inc. | | | 26 | |
| | | | | | | | 108 | |
| | | | | Consumer Durables & Apparel - 0.2% | | | | |
| | 1 | | | Coach, Inc. | | | 31 | |
| | – | | | D.R. Horton, Inc. | | | 6 | |
| | – | | | Harman International Industries, Inc. | | | 5 | |
| | – | | | Hasbro, Inc. | | | 6 | |
| | – | | | Leggett & Platt, Inc. | | | 6 | |
| | – | | | Lennar Corp. | | | 6 | |
| | 1 | | | Mattel, Inc. | | | 16 | |
| | 1 | | | Newell Rubbermaid, Inc. | | | 8 | |
| | 1 | | | NIKE, Inc. Class B | | | 63 | |
| | 1 | | | Pulte Group, Inc. ● | | | 4 | |
| | – | | | Ralph Lauren Corp. | | | 16 | |
| | – | | | V.F. Corp. | | | 19 | |
| | – | | | Whirlpool Corp. | | | 6 | |
| | | | | | | | 192 | |
| | | | | Consumer Services - 0.4% | | | | |
| | – | | | Apollo Group, Inc. Class A ● | | | 11 | |
| | 1 | | | Carnival Corp. | | | 26 | |
| | – | | | Chipotle Mexican Grill, Inc. ● | | | 19 | |
| | – | | | Darden Restaurants, Inc. | | | 10 | |
| | – | | | DeVry, Inc. | | | 4 | |
| | 1 | | | H & R Block, Inc. | | | 8 | |
| | 1 | | | International Game Technology | | | 9 | |
| | – | | | Marriott International, Inc. Class A | | | 14 | |
| | 2 | | | McDonald's Corp. | | | 180 | |
| | 1 | | | Starbucks Corp. | | | 60 | |
| | – | | | Starwood Hotels & Resorts | | | 16 | |
| | – | | | Wyndham Worldwide Corp. | | | 10 | |
| | – | | | Wynn Resorts Ltd. | | | 15 | |
| | 1 | | | Yum! Brands, Inc. | | | 48 | |
| | | | | | | | 430 | |
| | | | | Diversified Financials - 1.0% | | | | |
| | 2 | | | American Express Co. | | | 84 | |
| | – | | | Ameriprise Financial, Inc. | | | 20 | |
| | 18 | | | Bank of America Corp. | | | 99 | |
| | 2 | | | Bank of New York Mellon Corp. | | | 42 | |
| | – | | | BlackRock, Inc. | | | 31 | |
| | 1 | | | Capital One Financial Corp. | | | 34 | |
| | 2 | | | Charles Schwab Corp. | | | 21 | |
The accompanying notes are an integral part of these financial statements.
Hartford Portfolio Diversifier HLS Fund
Schedule of Investments – (continued)
December 31, 2011
(000’s Omitted)
| Shares or Principal Amount | | Market Value ╪ | |
COMMON STOCKS - 18.7% - (continued) | |
| | | | | Diversified Financials - 1.0% - (continued) | | | | |
| | 5 | | | Citigroup, Inc. | | $ | 135 | |
| | – | | | CME Group, Inc. | | | 28 | |
| | 1 | | | Discover Financial Services, Inc. | | | 23 | |
| | – | | | E*Trade Financial Corp. ● | | | 4 | |
| | – | | | Federated Investors, Inc. | | | 2 | |
| | – | | | Franklin Resources, Inc. | | | 25 | |
| | 1 | | | Goldman Sachs Group, Inc. | | | 78 | |
| | – | | | IntercontinentalExchange, Inc. ● | | | 15 | |
| | 1 | | | Invesco Ltd. | | | 16 | |
| | 7 | | | JP Morgan Chase & Co. | | | 221 | |
| | – | | | Legg Mason, Inc. | | | 5 | |
| | – | | | Leucadia National Corp. | | | 8 | |
| | – | | | Moody's Corp. | | | 12 | |
| | 3 | | | Morgan Stanley | | | 39 | |
| | – | | | Nasdaq OMX Group, Inc. ● | | | 5 | |
| | – | | | Northern Trust Corp. | | | 17 | |
| | – | | | NYSE Euronext | | | 12 | |
| | 1 | | | SLM Corp. | | | 12 | |
| | 1 | | | State Street Corp. | | | 35 | |
| | – | | | T. Rowe Price Group, Inc. | | | 25 | |
| | | | | | | | 1,048 | |
| | | | | Energy - 2.3% | | | | |
| | – | | | Alpha Natural Resources, Inc. ● | | | 8 | |
| | 1 | | | Anadarko Petroleum Corp. | | | 67 | |
| | 1 | | | Apache Corp. | | | 61 | |
| | 1 | | | Baker Hughes, Inc. | | | 37 | |
| | – | | | Cabot Oil & Gas Corp. | | | 14 | |
| | – | | | Cameron International Corp. ● | | | 21 | |
| | 1 | | | Chesapeake Energy Corp. | | | 26 | |
| | 3 | | | Chevron Corp. | | | 371 | |
| | 2 | | | ConocoPhillips Holding Co. | | | 169 | |
| | – | | | Consol Energy, Inc. | | | 15 | |
| | 1 | | | Denbury Resources, Inc. ● | | | 10 | |
| | 1 | | | Devon Energy Corp. | | | 44 | |
| | – | | | Diamond Offshore Drilling, Inc. | | | 7 | |
| | 1 | | | El Paso Corp. | | | 36 | |
| | – | | | EOG Resources, Inc. | | | 46 | |
| | – | | | EQT Corp. | | | 14 | |
| | 8 | | | Exxon Mobil Corp. | | | 712 | |
| | – | | | FMC Technologies, Inc. ● | | | 22 | |
| | 2 | | | Halliburton Co. | | | 56 | |
| | – | | | Helmerich & Payne, Inc. | | | 11 | |
| | 1 | | | Hess Corp. | | | 30 | |
| | 1 | | | Marathon Oil Corp. | | | 36 | |
| | 1 | | | Marathon Petroleum Corp. | | | 21 | |
| | – | | | Murphy Oil Corp. | | | 19 | |
| | 1 | | | Nabors Industries Ltd. ● | | | 9 | |
| | 1 | | | National Oilwell Varco, Inc. | | | 50 | |
| | – | | | Newfield Exploration Co. ● | | | 9 | |
| | – | | | Noble Corp. | | | 13 | |
| | – | | | Noble Energy, Inc. | | | 29 | |
| | 1 | | | Occidental Petroleum Corp. | | | 133 | |
| | – | | | Peabody Energy Corp. | | | 16 | |
| | – | | | Pioneer Natural Resources Co. | | | 19 | |
| | – | | | QEP Resources, Inc. | | | 9 | |
| | – | | | Range Resources Corp. | | | 17 | |
| | – | | | Rowan Companies, Inc. ● | | | 7 | |
| | 2 | | | Schlumberger Ltd. | | | 161 | |
| | 1 | | | Southwestern Energy Co. ● | | | 19 | |
| | 1 | | | Spectra Energy Corp. | | | 35 | |
| | – | | | Sunoco, Inc. | | | 8 | |
| | – | | | Tesoro Corp. ● | | | 6 | |
| | 1 | | | Valero Energy Corp. | | | 21 | |
| | 1 | | | Williams Cos., Inc. | | | 34 | |
| | | | | | | | 2,448 | |
| | | | | Food & Staples Retailing - 0.4% | | | | |
| | 1 | | | Costco Wholesale Corp. | | | 63 | |
| | 2 | | | CVS Caremark Corp. | | | 93 | |
| | 1 | | | Kroger Co. | | | 25 | |
| | 1 | | | Safeway, Inc. | | | 13 | |
| | – | | | Supervalu, Inc. | | | 3 | |
| | 1 | | | Sysco Corp. | | | 30 | |
| | 2 | | | Walgreen Co. | | | 52 | |
| | 3 | | | Wal-Mart Stores, Inc. | | | 183 | |
| | – | | | Whole Foods Market, Inc. | | | 19 | |
| | | | | | | | 481 | |
| | | | | Food, Beverage & Tobacco - 1.2% | | | | |
| | 4 | | | Altria Group, Inc. | | | 107 | |
| | 1 | | | Archer Daniels Midland Co. | | | 33 | |
| | – | | | Beam, Inc. | | | 14 | |
| | – | | | Brown-Forman Corp. | | | 14 | |
| | – | | | Campbell Soup Co. | | | 10 | |
| | 4 | | | Coca-Cola Co. | | | 278 | |
| | 1 | | | Coca-Cola Enterprises, Inc. | | | 14 | |
| | 1 | | | ConAgra Foods, Inc. | | | 19 | |
| | – | | | Constellation Brands, Inc. Class A ● | | | 6 | |
| | – | | | Dean Foods Co. ● | | | 4 | |
| | – | | | Dr. Pepper Snapple Group | | | 15 | |
| | 1 | | | General Mills, Inc. | | | 46 | |
| | 1 | | | H.J. Heinz Co. | | | 30 | |
| | – | | | Hershey Co. | | | 17 | |
| | – | | | Hormel Foods Corp. | | | 7 | |
| | – | | | J.M. Smucker Co. | | | 15 | |
| | – | | | Kellogg Co. | | | 22 | |
| | 3 | | | Kraft Foods, Inc. | | | 116 | |
| | – | | | Lorillard, Inc. | | | 27 | |
| | – | | | McCormick & Co., Inc. | | | 12 | |
| | – | | | Mead Johnson Nutrition Co. | | | 24 | |
| | – | | | Molson Coors Brewing Co. | | | 12 | |
| | 3 | | | PepsiCo, Inc. | | | 182 | |
| | 3 | | | Philip Morris International, Inc. | | | 239 | |
| | 1 | | | Reynolds American, Inc. | | | 25 | |
| | 1 | | | Sara Lee Corp. | | | 20 | |
| | 1 | | | Tyson Foods, Inc. Class A | | | 11 | |
| | | | | | | | 1,319 | |
| | | | | Health Care Equipment & Services - 0.7% | | | | |
| | 1 | | | Aetna, Inc. | | | 27 | |
| | – | | | Amerisource Bergen Corp. | | | 17 | |
| | – | | | Bard (C.R.), Inc. | | | 13 | |
| | 1 | | | Baxter International, Inc. | | | 49 | |
| | – | | | Becton, Dickinson & Co. | | | 28 | |
| | 3 | | | Boston Scientific Corp. ● | | | 14 | |
| | 1 | | | Cardinal Health, Inc. | | | 25 | |
| | – | | | CareFusion Corp. ● | | | 10 | |
| | – | | | Cerner Corp. ● | | | 16 | |
| | 1 | | | CIGNA Corp. | | | 21 | |
| | – | | | Coventry Health Care, Inc. ● | | | 8 | |
| | 1 | | | Covidien plc | | | 38 | |
The accompanying notes are an integral part of these financial statements.
| Shares or Principal Amount | | Market Value ╪ | |
COMMON STOCKS - 18.7% - (continued) | |
| | | | | Health Care Equipment & Services - 0.7% - (continued) | | | | |
| | – | | | Da Vita, Inc. ● | | $ | 12 | |
| | – | | | Dentsply International, Inc. | | | 9 | |
| | – | | | Edwards Lifesciences Corp. ● | | | 14 | |
| | 1 | | | Express Scripts, Inc. ● | | | 38 | |
| | – | | | Humana, Inc. | | | 25 | |
| | – | | | Intuitive Surgical, Inc. ● | | | 31 | |
| | – | | | Laboratory Corp. of America Holdings ● | | | 15 | |
| | – | | | McKesson Corp. | | | 33 | |
| | 1 | | | Medco Health Solutions, Inc. ● | | | 38 | |
| | 2 | | | Medtronic, Inc. | | | 71 | |
| | – | | | Patterson Cos., Inc. | | | 4 | |
| | – | | | Quest Diagnostics, Inc. | | | 16 | |
| | 1 | | | St. Jude Medical, Inc. | | | 19 | |
| | 1 | | | Stryker Corp. | | | 28 | |
| | 1 | | | Tenet Healthcare Corp. ● | | | 4 | |
| | 2 | | | UnitedHealth Group, Inc. | | | 95 | |
| | – | | | Varian Medical Systems, Inc. ● | | | 13 | |
| | 1 | | | Wellpoint, Inc. | | | 40 | |
| | – | | | Zimmer Holdings, Inc. ● | | | 17 | |
| | | | | | | | 788 | |
| | | | | Household & Personal Products - 0.5% | | | | |
| | 1 | | | Avon Products, Inc. | | | 13 | |
| | – | | | Clorox Co. | | | 16 | |
| | 1 | | | Colgate-Palmolive Co. | | | 78 | |
| | – | | | Estee Lauder Co., Inc. | | | 22 | |
| | 1 | | | Kimberly-Clark Corp. | | | 51 | |
| | 5 | | | Procter & Gamble Co. | | | 322 | |
| | | | | | | | 502 | |
| | | | | Insurance - 0.7% | | | | |
| | 1 | | | ACE Ltd. | | | 42 | |
| | 1 | | | Aflac, Inc. | | | 37 | |
| | 1 | | | Allstate Corp. | | | 25 | |
| | 1 | | | American International Group, Inc. ● | | | 18 | |
| | 1 | | | AON Corp. | | | 26 | |
| | – | | | Assurant, Inc. | | | 7 | |
| | 3 | | | Berkshire Hathaway, Inc. Class B ● | | | 238 | |
| | – | | | Chubb Corp. | | | 34 | |
| | – | | | Cincinnati Financial Corp. | | | 9 | |
| | 1 | | | Genworth Financial, Inc. ● | | | 6 | |
| | 1 | | | Lincoln National Corp. | | | 11 | |
| | 1 | | | Loews Corp. | | | 20 | |
| | 1 | | | Marsh & McLennan Cos., Inc. | | | 30 | |
| | 2 | | | MetLife, Inc. | | | 60 | |
| | 1 | | | Principal Financial Group, Inc. | | | 14 | |
| | 1 | | | Progressive Corp. | | | 21 | |
| | 1 | | | Prudential Financial, Inc. | | | 43 | |
| | – | | | Torchmark Corp. | | | 8 | |
| | 1 | | | Travelers Cos., Inc. | | | 43 | |
| | 1 | | | Unum Group | | | 11 | |
| | 1 | | | XL Group plc | | | 11 | |
| | | | | | | | 714 | |
| | | | | Materials - 0.7% | | | | |
| | – | | | Air Products and Chemicals, Inc. | | | 31 | |
| | – | | | Airgas, Inc. | | | 9 | |
| | 2 | | | Alcoa, Inc. | | | 16 | |
| | – | | | Allegheny Technologies, Inc. | | | 9 | |
| | – | | | Ball Corp. | | | 10 | |
| | – | | | Bemis Co., Inc. | | | 5 | |
| | – | | | CF Industries Holdings, Inc. | | | 17 | |
| | – | | | Cliff's Natural Resources, Inc. | | | 16 | |
| | 2 | | | Dow Chemical Co. | | | 60 | |
| | 2 | | | E.I. DuPont de Nemours & Co. | | | 74 | |
| | – | | | Eastman Chemical Co. | | | 9 | |
| | 1 | | | Ecolab, Inc. | | | 30 | |
| | – | | | FMC Corp. | | | 11 | |
| | 2 | | | Freeport-McMoRan Copper & Gold, Inc. | | | 61 | |
| | – | | | International Flavors & Fragrances, Inc. | | | 7 | |
| | 1 | | | International Paper Co. | | | 23 | |
| | – | | | MeadWestvaco Corp. | | | 9 | |
| | 1 | | | Monsanto Co. | | | 66 | |
| | 1 | | | Mosaic Co. | | | 26 | |
| | 1 | | | Newmont Mining Corp. | | | 52 | |
| | 1 | | | Nucor Corp. | | | 22 | |
| | – | | | Owens-Illinois, Inc. ● | | | 6 | |
| | – | | | PPG Industries, Inc. | | | 23 | |
| | 1 | | | Praxair, Inc. | | | 56 | |
| | – | | | Sealed Air Corp. | | | 6 | |
| | – | | | Sherwin-Williams Co. | | | 13 | |
| | – | | | Sigma-Aldrich Corp. | | | 13 | |
| | – | | | Titanium Metals Corp. | | | 2 | |
| | – | | | United States Steel Corp. | | | 7 | |
| | – | | | Vulcan Materials Co. | | | 9 | |
| | | | | | | | 698 | |
| | | | | Media - 0.6% | | | | |
| | – | | | Cablevision Systems Corp. | | | 5 | |
| | 1 | | | CBS Corp. Class B | | | 31 | |
| | 5 | | | Comcast Corp. Class A | | | 113 | |
| | 1 | | | DirecTV Class A ● | | | 53 | |
| | – | | | Discovery Communications, Inc. ● | | | 19 | |
| | – | | | Gannett Co., Inc. | | | 6 | |
| | 1 | | | Interpublic Group of Cos., Inc. | | | 8 | |
| | 1 | | | McGraw-Hill Cos., Inc. | | | 23 | |
| | 4 | | | News Corp. Class A | | | 69 | |
| | – | | | Omnicom Group, Inc. | | | 22 | |
| | – | | | Scripps Networks Interactive Class A | | | 7 | |
| | 1 | | | Time Warner Cable, Inc. | | | 36 | |
| | 2 | | | Time Warner, Inc. | | | 63 | |
| | 1 | | | Viacom, Inc. Class B | | | 44 | |
| | 3 | | | Walt Disney Co. | | | 118 | |
| | – | | | Washington Post Co. Class B | | | 3 | |
| | | | | | | | 620 | |
| | | | | Pharmaceuticals, Biotechnology & Life Sciences - 1.5% | | | | |
| | 3 | | | Abbott Laboratories | | | 153 | |
| | 1 | | | Agilent Technologies, Inc. ● | | | 21 | |
| | 1 | | | Allergan, Inc. | | | 47 | |
| | 1 | | | Amgen, Inc. | | | 89 | |
| | – | | | Biogen Idec, Inc. ● | | | 47 | |
| | 3 | | | Bristol-Myers Squibb Co. | | | 105 | |
| | 1 | | | Celgene Corp. ● | | | 53 | |
| | 2 | | | Eli Lilly & Co. | | | 74 | |
| | – | | | Forest Laboratories, Inc. ● | | | 14 | |
| | 1 | | | Gilead Sciences, Inc. ● | | | 54 | |
| | – | | | Hospira, Inc. ● | | | 9 | |
| | 5 | | | Johnson & Johnson | | | 314 | |
| | – | | | Life Technologies Corp. ● | | | 12 | |
| | 5 | | | Merck & Co., Inc. | | | 201 | |
The accompanying notes are an integral part of these financial statements.
Hartford Portfolio Diversifier HLS Fund
Schedule of Investments – (continued)
December 31, 2011
(000’s Omitted)
| Shares or Principal Amount | | Market Value ╪ | |
COMMON STOCKS - 18.7% - (continued) | |
| | | | | Pharmaceuticals, Biotechnology & Life Sciences - 1.5% - (continued) | | | | |
| | 1 | | | Mylan, Inc. ● | | $ | 16 | |
| | – | | | PerkinElmer, Inc. | | | 4 | |
| | – | | | Perrigo Co. | | | 16 | |
| | 13 | | | Pfizer, Inc. | | | 292 | |
| | 1 | | | Thermo Fisher Scientific, Inc. ● | | | 30 | |
| | – | | | Waters Corp. ● | | | 12 | |
| | – | | | Watson Pharmaceuticals, Inc. ● | | | 13 | |
| | | | | | | | 1,576 | |
| | | | | Real Estate - 0.4% | | | | |
| | 1 | | | American Tower Corp. Class A | | | 41 | |
| | – | | | Apartment Investment & Management Co. | | | 5 | |
| | – | | | Avalonbay Communities, Inc. | | | 22 | |
| | – | | | Boston Properties, Inc. | | | 26 | |
| | 1 | | | CBRE Group, Inc. ● | | | 9 | |
| | 1 | | | Equity Residential Properties Trust | | | 30 | |
| | 1 | | | HCP, Inc. | | | 30 | |
| | – | | | Health Care, Inc. | | | 18 | |
| | 1 | | | Host Hotels & Resorts, Inc. | | | 18 | |
| | 1 | | | Kimco Realty Corp. | | | 12 | |
| | – | | | Plum Creek Timber Co., Inc. | | | 10 | |
| | 1 | | | ProLogis, Inc. | | | 23 | |
| | – | | | Public Storage | | | 33 | |
| | 1 | | | Simon Property Group, Inc. | | | 66 | |
| | 1 | | | Ventas, Inc. | | | 28 | |
| | – | | | Vornado Realty Trust | | | 25 | |
| | 1 | | | Weyerhaeuser Co. | | | 17 | |
| | | | | | | | 413 | |
| | | | | Retailing - 0.7% | | | | |
| | – | | | Abercrombie & Fitch Co. Class A | | | 7 | |
| | 1 | | | Amazon.com, Inc. ● | | | 111 | |
| | – | | | AutoNation, Inc. ● | | | 3 | |
| | – | | | AutoZone, Inc. ● | | | 16 | |
| | – | | | Bed Bath & Beyond, Inc. ● | | | 24 | |
| | 1 | | | Best Buy Co., Inc. | | | 12 | |
| | – | | | Big Lots, Inc. ● | | | 4 | |
| | – | | | CarMax, Inc. ● | | | 12 | |
| | – | | | Dollar Tree, Inc. ● | | | 17 | |
| | – | | | Expedia, Inc. | | | 5 | |
| | – | | | Family Dollar Stores, Inc. | | | 12 | |
| | – | | | GameStop Corp. Class A ● | | | 6 | |
| | 1 | | | Gap, Inc. | | | 11 | |
| | – | | | Genuine Parts Co. | | | 17 | |
| | 3 | | | Home Depot, Inc. | | | 114 | |
| | – | | | J.C. Penney Co., Inc. | | | 9 | |
| | – | | | Kohl's Corp. | | | 22 | |
| | – | | | Limited Brands, Inc. | | | 17 | |
| | 2 | | | Lowe's Co., Inc. | | | 56 | |
| | 1 | | | Macy's, Inc. | | | 24 | |
| | – | | | Netflix, Inc. ● | | | 7 | |
| | – | | | Nordstrom, Inc. | | | 14 | |
| | – | | | O'Reilly Automotive, Inc. ● | | | 18 | |
| | – | | | Priceline.com, Inc. ● | | | 41 | |
| | – | | | Ross Stores, Inc. | | | 19 | |
| | – | | | Sears Holdings Corp. ● | | | 2 | |
| | 1 | | | Staples, Inc. | | | 17 | |
| | 1 | | | Target Corp. | | | 60 | |
| | – | | | Tiffany & Co. | | | 15 | |
| | 1 | | | TJX Cos., Inc. | | | 43 | |
| | – | | | TripAdvisor, Inc. ● | | | 4 | |
| | – | | | Urban Outfitters, Inc. ● | | | 5 | |
| | | | | | | | 744 | |
| | | | | Semiconductors & Semiconductor Equipment - 0.4% | | | | |
| | 1 | | | Advanced Micro Devices, Inc. ● | | | 6 | |
| | 1 | | | Altera Corp. | | | 21 | |
| | 1 | | | Analog Devices, Inc. | | | 19 | |
| | 2 | | | Applied Materials, Inc. | | | 25 | |
| | 1 | | | Broadcom Corp. Class A | | | 25 | |
| | – | | | First Solar, Inc. ● | | | 3 | |
| | 9 | | | Intel Corp. | | | 216 | |
| | – | | | KLA-Tencor Corp. | | | 14 | |
| | – | | | Linear Technology Corp. | | | 12 | |
| | 1 | | | LSI Corp. ● | | | 6 | |
| | – | | | Microchip Technology, Inc. | | | 12 | |
| | 2 | | | Micron Technology, Inc. ● | | | 11 | |
| | – | | | Novellus Systems, Inc. ● | | | 5 | |
| | 1 | | | NVIDIA Corp. ● | | | 15 | |
| | – | | | Teradyne, Inc. ● | | | 4 | |
| | 2 | | | Texas Instruments, Inc. | | | 58 | |
| | – | | | Xilinx, Inc. | | | 15 | |
| | | | | | | | 467 | |
| | | | | Software & Services - 1.8% | | | | |
| | 1 | | | Accenture plc | | | 60 | |
| | 1 | | | Adobe Systems, Inc. ● | | | 24 | |
| | – | | | Akamai Technologies, Inc. ● | | | 10 | |
| | – | | | Autodesk, Inc. ● | | | 12 | |
| | 1 | | | Automatic Data Processing, Inc. | | | 46 | |
| | – | | | BMC Software, Inc. ● | | | 10 | |
| | 1 | | | CA, Inc. | | | 13 | |
| | – | | | Citrix Systems, Inc. ● | | | 20 | |
| | 1 | | | Cognizant Technology Solutions Corp. ● | | | 34 | |
| | – | | | Computer Sciences Corp. | | | 6 | |
| | 2 | | | eBay, Inc. ● | | | 61 | |
| | 1 | | | Electronic Arts, Inc. ● | | | 12 | |
| | – | | | Fidelity National Information Services, Inc. | | | 11 | |
| | – | | | Fiserv, Inc. ● | | | 15 | |
| | – | | | Google, Inc. ● | | | 286 | |
| | 2 | | | IBM Corp. | | | 380 | |
| | 1 | | | Intuit, Inc. | | | 27 | |
| | – | | | Mastercard, Inc. | | | 70 | |
| | 13 | | | Microsoft Corp. | | | 341 | |
| | 7 | | | Oracle Corp. | | | 177 | |
| | 1 | | | Paychex, Inc. | | | 17 | |
| | – | | | Red Hat, Inc. ● | | | 14 | |
| | – | | | SAIC, Inc. ● | | | 6 | |
| | – | | | Salesforce.com, Inc. ● | | | 24 | |
| | 1 | | | Symantec Corp. ● | | | 20 | |
| | – | | | Teradata Corp. ● | | | 14 | |
| | – | | | Total System Services, Inc. | | | 6 | |
| | – | | | VeriSign, Inc. | | | 10 | |
| | 1 | | | Visa, Inc. | | | 91 | |
| | 1 | | | Western Union Co. | | | 20 | |
| | 2 | | | Yahoo!, Inc. ● | | | 35 | |
| | | | | | | | 1,872 | |
| | | | | Technology Hardware & Equipment - 1.4% | | | | |
| | – | | | Amphenol Corp. Class A | | | 13 | |
| | 2 | | | Apple, Inc. ● | | | 660 | |
| | 9 | | | Cisco Systems, Inc. | | | 170 | |
The accompanying notes are an integral part of these financial statements.
| Shares or Principal Amount | | Market Value ╪ | |
COMMON STOCKS - 18.7% - (continued) | |
| | | | | Technology Hardware & Equipment - 1.4% - (continued) | | | | |
| | 3 | | | Corning, Inc. | | $ | 36 | |
| | 3 | | | Dell, Inc. ● | | | 39 | |
| | 4 | | | EMC Corp. ● | | | 77 | |
| | – | | | F5 Networks, Inc. ● | | | 15 | |
| | – | | | FLIR Systems, Inc. | | | 7 | |
| | – | | | Harris Corp. | | | 7 | |
| | 3 | | | Hewlett-Packard Co. | | | 90 | |
| | – | | | Jabil Circuit, Inc. | | | 6 | |
| | – | | | JDS Uniphase Corp. ● | | | 4 | |
| | 1 | | | Juniper Networks, Inc. ● | | | 19 | |
| | – | | | Lexmark International, Inc. ADR | | | 4 | |
| | – | | | Molex, Inc. | | | 6 | |
| | – | | | Motorola Mobility Holdings, Inc. ● | | | 18 | |
| | 1 | | | Motorola Solutions, Inc. | | | 23 | |
| | 1 | | | NetApp, Inc. ● | | | 23 | |
| | 3 | | | Qualcomm, Inc. | | | 161 | |
| | – | | | SanDisk Corp. ● | | | 21 | |
| | 1 | | | TE Connectivity Ltd. | | | 23 | |
| | – | | | Western Digital Corp. ● | | | 13 | |
| | 2 | | | Xerox Corp. | | | 19 | |
| | | | | | | | 1,454 | |
| | | | | Telecommunication Services - 0.5% | | | | |
| | 10 | | | AT&T, Inc. | | | 314 | |
| | 1 | | | CenturyLink, Inc. | | | 40 | |
| | 2 | | | Frontier Communications Corp. | | | 9 | |
| | 1 | | | MetroPCS Communications, Inc. ● | | | 5 | |
| | 5 | | | Sprint Nextel Corp. ● | | | 12 | |
| | 5 | | | Verizon Communications, Inc. | | | 199 | |
| | 1 | | | Windstream Corp. | | | 12 | |
| | | | | | | | 591 | |
| | | | | Transportation - 0.4% | | | | |
| | – | | | C.H. Robinson Worldwide, Inc. | | | 20 | |
| | 2 | | | CSX Corp. | | | 39 | |
| | – | | | Expeditors International of Washington, Inc. | | | 15 | |
| | 1 | | | FedEx Corp. | | | 46 | |
| | 1 | | | Norfolk Southern Corp. | | | 43 | |
| | – | | | Ryder System, Inc. | | | 5 | |
| | 1 | | | Southwest Airlines Co. | | | 11 | |
| | 1 | | | Union Pacific Corp. | | | 90 | |
| | 2 | | | United Parcel Service, Inc. Class B | | | 124 | |
| | | | | | | | 393 | |
| | | | | Utilities - 0.7% | | | | |
| | 1 | | | AES Corp. ● | | | 13 | |
| | – | | | AGL Resources, Inc. | | | 9 | |
| | – | | | Ameren Corp. | | | 14 | |
| | 1 | | | American Electric Power Co., Inc. | | | 35 | |
| | 1 | | | CenterPoint Energy, Inc. | | | 15 | |
| | – | | | CMS Energy Corp. | | | 10 | |
| | 1 | | | Consolidated Edison, Inc. | | | 32 | |
| | – | | | Constellation Energy Group, Inc. | | | 14 | |
| | 1 | | | Dominion Resources, Inc. | | | 53 | |
| | – | | | DTE Energy Co. | | | 16 | |
| | 2 | | | Duke Energy Corp. | | | 51 | |
| | 1 | | | Edison International | | | 24 | |
| | – | | | Entergy Corp. | | | 23 | |
| | 1 | | | Exelon Corp. | | | 50 | |
| | 1 | | | FirstEnergy Corp. | | | 33 | |
| | – | | | Integrys Energy Group, Inc. | | | 7 | |
| | 1 | | | NextEra Energy, Inc. | | | 45 | |
| | – | | | NiSource, Inc. | | | 12 | |
| | – | | | Northeast Utilities | | | 11 | |
| | – | | | NRG Energy, Inc. ● | | | 7 | |
| | – | | | Oneok, Inc. | | | 16 | |
| | – | | | Pepco Holdings, Inc. | | | 8 | |
| | 1 | | | PG&E Corp. | | | 29 | |
| | – | | | Pinnacle West Capital Corp. | | | 9 | |
| | 1 | | | PPL Corp. | | | 30 | |
| | 1 | | | Progress Energy, Inc. | | | 29 | |
| | 1 | | | Public Service Enterprise Group, Inc. | | | 29 | |
| | – | | | SCANA Corp. | | | 9 | |
| | – | | | Sempra Energy | | | 23 | |
| | 2 | | | Southern Co. | | | 70 | |
| | – | | | TECO Energy, Inc. | | | 7 | |
| | – | | | Wisconsin Energy Corp. | | | 14 | |
| | 1 | | | Xcel Energy, Inc. | | | 24 | |
| | | | | | | | 771 | |
| | | | | Total common stocks | | | | |
| | | | | (cost $19,690) | | $ | 19,950 | |
| | | | | | | | | |
| EXCHANGE TRADED FUNDS - 1.2% | | | | |
| | | | | Other Investment Pools and Funds - 1.2% | | | | |
| | 22 | | | Vanguard S&P 500 ETF | | $ | 1,253 | |
| | | | | | | | | |
| | | | | Total exchange traded funds | | | | |
| | | | | (cost $1,245) | | $ | 1,253 | |
| | | | | | | | | |
| ASSET & COMMERCIAL MORTGAGE BACKED SECURITIES - 0.7% | | | | |
| | | | | Finance and Insurance - 0.7% | | | | |
| | | | | Banc of America Commercial Mortgage, Inc. | | | | |
| $ | 25 | | | 5.41%, 09/10/2047 | | $ | 27 | |
| | 15 | | | 5.92%, 05/10/2045 Δ | | | 17 | |
| | | | | Citibank Credit Card Issuance Trust | | | | |
| | 70 | | | 4.85%, 03/10/2017 Ø | | | 78 | |
| | | | | Citigroup/Deutsche Bank Commercial Mortgage Trust | | | | |
| | 25 | | | 5.32%, 12/11/2049 | | | 27 | |
| | 35 | | | 5.40%, 07/15/2044 Δ | | | 39 | |
| | 25 | | | 5.62%, 10/15/2048 | | | 27 | |
| | | | | Commercial Mortgage Pass-Through Certificates | | | | |
| | 20 | | | 5.31%, 12/10/2046 | | | 22 | |
| | 15 | | | 6.01%, 12/10/2049 Δ | | | 17 | |
| | | | | Credit Suisse Mortgage Capital Certificates | | | | |
| | 30 | | | 5.47%, 09/15/2039 | | | 32 | |
| | | | | Goldman Sachs Mortgage Securities Corp. II | | | | |
| | 35 | | | 4.75%, 07/10/2039 | | | 37 | |
| | 15 | | | 5.40%, 08/10/2038 | | | 16 | |
| | 25 | | | 5.56%, 11/10/2039 | | | 27 | |
| | | | | Goldman Sachs Mortgage Securities Corp. II Class A4 | | | | |
| | 45 | | | 5.98%, 08/10/2045 Δ | | | 49 | |
| | | | | Greenwich Capital Commercial Funding Corp. | | | | |
| | 35 | | | 5.44%, 03/10/2039 Δ | | | 38 | |
The accompanying notes are an integral part of these financial statements.
Hartford Portfolio Diversifier HLS Fund
Schedule of Investments – (continued)
December 31, 2011
(000’s Omitted)
| Shares or Principal Amount | | Market Value ╪ | |
ASSET & COMMERCIAL MORTGAGE BACKED SECURITIES - 0.7% - (continued) | |
| | | | | Finance and Insurance - 0.7% - (continued) | | | | |
| | | | | JP Morgan Chase Commercial Mortgage Securities Corp. | | | | |
| $ | 25 | | | 5.34%, 05/15/2047 | | $ | 27 | |
| | 20 | | | 5.42%, 01/15/2049 | | | 22 | |
| | 35 | | | 5.44%, 06/12/2047 Δ | | | 38 | |
| | 20 | | | 5.93%, 02/12/2049 Δ | | | 22 | |
| | | | | LB-UBS Commercial Mortgage Trust | | | | |
| | 20 | | | 5.43%, 02/15/2040 | | | 21 | |
| | 20 | | | 5.87%, 09/15/2045 | | | 22 | |
| | | | | Morgan Stanley Capital I | | | | |
| | 25 | | | 5.69%, 04/15/2049 Δ | | | 26 | |
| | | | | Wachovia Bank Commercial Mortgage Trust | | | | |
| | 25 | | | 5.31%, 11/15/2048 | | | 27 | |
| | 25 | | | 5.34%, 12/15/2043 | | | 26 | |
| | 25 | | | 5.44%, 12/15/2044 Δ | | | 27 | |
| | 25 | | | 5.93%, 06/15/2049 Δ | | | 26 | |
| | | | | | | | 737 | |
| | | | | | | | | |
| | | | | Total asset & commercial mortgage backed securities | | | | |
| | | | | (cost $733) | | $ | 737 | |
| | | | | | | | | |
| CORPORATE BONDS - 8.9% | | | | |
| | | | | Administrative Waste Management and Remediation - 0.0% | | | | |
| | | | | Republic Services, Inc. | | | | |
| $ | 20 | | | 5.00%, 03/01/2020 | | $ | 22 | |
| | | | | | | | | |
| | | | | Arts, Entertainment and Recreation - 0.4% | | | | |
| | | | | CBS Corp. | | | | |
| | 10 | | | 7.88%, 07/30/2030 | | | 13 | |
| | | | | Comcast Corp. | | | | |
| | 90 | | | 5.15%, 03/01/2020 | | | 102 | |
| | | | | DirecTV Holdings LLC | | | | |
| | 30 | | | 3.50%, 03/01/2016 | | | 31 | |
| | 20 | | | 5.00%, 03/01/2021 | | | 21 | |
| | | | | Discovery Communications, Inc. | | | | |
| | 15 | | | 5.05%, 06/01/2020 | | | 16 | |
| | | | | NBC Universal Media LLC | | | | |
| | 30 | | | 4.38%, 04/01/2021 | | | 32 | |
| | | | | News America, Inc. | | | | |
| | 35 | | | 6.40%, 12/15/2035 | | | 38 | |
| | | | | Time Warner Cable, Inc. | | | | |
| | 15 | | | 4.00%, 09/01/2021 | | | 15 | |
| | | | | Time Warner, Inc. | | | | |
| | 80 | | | 4.88%, 03/15/2020 | | | 87 | |
| | 65 | | | 6.75%, 07/01/2018 | | | 77 | |
| | | | | Viacom, Inc. | | | | |
| | 10 | | | 6.88%, 04/30/2036 | | | 13 | |
| | | | | Walt Disney Co. | | | | |
| | 25 | | | 5.63%, 09/15/2016 | | | 30 | |
| | | | | | | | 475 | |
| | | | | Beverage and Tobacco Product Manufacturing - 0.3% | | | | |
| | | | | Altria Group, Inc. | | | | |
| | 30 | | | 4.75%, 05/05/2021 | | | 33 | |
| | 25 | | | 9.70%, 11/10/2018 | | | 34 | |
| | | | | Anheuser-Busch InBev N.V | | | | |
| | 60 | | | 5.38%, 01/15/2020 | | | 70 | |
| | | | | Coca-Cola Co. | | | | |
| | 30 | | | 3.15%, 11/15/2020 | | | 32 | |
| | | | | Diageo Capital plc | | | | |
| | 30 | | | 5.50%, 09/30/2016 | | | 35 | |
| | | | | PepsiCo, Inc. | | | | |
| | 55 | | | 3.13%, 11/01/2020 | | | 57 | |
| | | | | Philip Morris International, Inc. | | | | |
| | 25 | | | 4.50%, 03/26/2020 | | | 28 | |
| | | | | | | | 289 | |
| | | | | Chemical Manufacturing - 0.1% | | | | |
| | | | | Dow Chemical Co. | | | | |
| | 45 | | | 8.55%, 05/15/2019 | | | 59 | |
| | | | | E.I. DuPont de Nemours & Co. | | | | |
| | 40 | | | 3.63%, 01/15/2021 | | | 44 | |
| | | | | Potash Corp. of Saskatchewan, Inc. | | | | |
| | 10 | | | 6.50%, 05/15/2019 | | | 12 | |
| | | | | Praxair, Inc. | | | | |
| | 25 | | | 5.38%, 11/01/2016 | | | 29 | |
| | | | | | | | 144 | |
| | | | | Computer and Electronic Product Manufacturing - 0.3% | | | | |
| | | | | Cingular Wireless LLC | | | | |
| | 10 | | | 7.13%, 12/15/2031 | | | 13 | |
| | | | | Cisco Systems, Inc. | | | | |
| | 25 | | | 4.45%, 01/15/2020 | | | 28 | |
| | 70 | | | 5.50%, 02/22/2016 Ø | | | 82 | |
| | | | | Hewlett-Packard Co. | | | | |
| | 15 | | | 4.30%, 06/01/2021 | | | 15 | |
| | 25 | | | 5.50%, 03/01/2018 | | | 28 | |
| | | | | Intel Corp. | | | | |
| | 15 | | | 3.30%, 10/01/2021 | | | 16 | |
| | | | | Lockheed Martin Corp. | | | | |
| | 25 | | | 4.25%, 11/15/2019 | | | 27 | |
| | | | | Raytheon Co. | | | | |
| | 25 | | | 3.13%, 10/15/2020 | | | 25 | |
| | | | | Texas Instruments, Inc. | | | | |
| | 25 | | | 2.38%, 05/16/2016 | | | 26 | |
| | | | | Thermo Fisher Scientific, Inc. | | | | |
| | 25 | | | 2.25%, 08/15/2016 | | | 25 | |
| | | | | | | | 285 | |
| | | | | Couriers and Messengers - 0.1% | | | | |
| | | | | United Parcel Service, Inc. | | | | |
| | 15 | | | 3.13%, 01/15/2021 | | | 16 | |
| | 45 | | | 3.88%, 04/01/2014 | | | 48 | |
| | | | | | | | 64 | |
| | | | | Electrical Equipment and Appliance Manufacturing - 0.0% | | | | |
| | | | | Emerson Electric Co. | | | | |
| | 10 | | | 4.88%, 10/15/2019 | | | 12 | |
| | | | | General Electric Co. | | | | |
| | 25 | | | 5.25%, 12/06/2017 | | | 29 | |
| | | | | Koninklijke Philips Electronics N.V | | | | |
| | 8 | | | 6.88%, 03/11/2038 | | | 10 | |
| | | | | | | | 51 | |
| | | | | Finance and Insurance - 3.7% | | | | |
| | | | | Aetna, Inc. | | | | |
| | 20 | | | 3.95%, 09/01/2020 | | | 21 | |
The accompanying notes are an integral part of these financial statements.
| Shares or Principal Amount | | Market Value ╪ | |
| CORPORATE BONDS - 8.9% - (continued) | |
| | | | | Finance and Insurance - 3.7% - (continued) | | | | |
| | | | | Allstate Corp. | | | | |
| $ | 35 | | | 5.00%, 08/15/2014 | | $ | 38 | |
| | 7 | | | 5.95%, 04/01/2036 | | | 8 | |
| | | | | American Express Credit Corp. | | | | |
| | 75 | | | 2.75%, 09/15/2015 | | | 75 | |
| | | | | American International Group, Inc. | | | | |
| | 40 | | | 6.40%, 12/15/2020 | | | 40 | |
| | | | | Asian Development Bank | | | | |
| | 40 | | | 2.50%, 03/15/2016 | | | 42 | |
| | | | | Bank of America Corp. | | | | |
| | 20 | | | 5.00%, 05/13/2021 | | | 18 | |
| | 160 | | | 5.65%, 05/01/2018 Ø | | | 153 | |
| | | | | Bank of New York Mellon Corp. | | | | |
| | 25 | | | 2.30%, 07/28/2016 | | | 25 | |
| | | | | Bank of Nova Scotia | | | | |
| | 15 | | | 4.38%, 01/13/2021 | | | 16 | |
| | | | | Barclays Bank plc | | | | |
| | 100 | | | 5.20%, 07/10/2014 | | | 103 | |
| | | | | BB&T Corp. | | | | |
| | 30 | | | 3.20%, 03/15/2016 | | | 31 | |
| | | | | Berkshire Hathaway Finance Corp. | | | | |
| | 50 | | | 5.40%, 05/15/2018 | | | 58 | |
| | | | | Blackrock, Inc. | | | | |
| | 25 | | | 5.00%, 12/10/2019 Ø | | | 27 | |
| | | | | Boston Properties L.P. | | | | |
| | 15 | | | 5.88%, 10/15/2019 | | | 17 | |
| | | | | BP Capital Markets plc | | | | |
| | 40 | | | 2.25%, 11/01/2016 | | | 40 | |
| | | | | Capital One Financial Corp. | | | | |
| | 50 | | | 6.15%, 09/01/2016 | | | 52 | |
| | | | | Caterpillar Financial Services Corp. | | | | |
| | 70 | | | 6.13%, 02/17/2014 | | | 77 | |
| | | | | Chubb Corp. | | | | |
| | 20 | | | 5.75%, 05/15/2018 | | | 23 | |
| | | | | Cigna Corp. | | | | |
| | 10 | | | 5.38%, 02/15/2042 | | | 10 | |
| | | | | Citigroup, Inc. | | | | |
| | 75 | | | 5.00%, 09/15/2014 Ø | | | 74 | |
| | 115 | | | 5.38%, 08/09/2020 | | | 118 | |
| | | | | Credit Suisse New York | | | | |
| | 75 | | | 6.00%, 02/15/2018 Ø | | | 74 | |
| | | | | Deutsche Bank AG | | | | |
| | 40 | | | 3.25%, 01/11/2016 | | | 41 | |
| | | | | European Bank for Reconstruction & Development | | | | |
| | 30 | | | 2.50%, 03/15/2016 | | | 32 | |
| | | | | European Investment Bank | | | | |
| | 50 | | | 2.88%, 09/15/2020 | | | 50 | |
| | 200 | | | 3.13%, 06/04/2014 Ø | | | 209 | |
| | | | | Fifth Third Bank | | | | |
| | 35 | | | 3.63%, 01/25/2016 | | | 36 | |
| | | | | General Electric Capital Corp. | | | | |
| | 145 | | | 4.38%, 09/16/2020 Ø | | | 148 | |
| | 40 | | | 5.30%, 02/11/2021 | | | 43 | |
| | | | | Goldman Sachs Group, Inc. | | | | |
| | 140 | | | 5.38%, 03/15/2020 Ø | | | 138 | |
| | 10 | | | 6.25%, 02/01/2041 | | | 10 | |
| | | | | HCP, Inc. | | | | |
| | 25 | | | 6.70%, 01/30/2018 | | | 28 | |
| | | | | Health Care REIT, Inc. | | | | |
| | 20 | | | 5.25%, 01/15/2022 | | | 20 | |
| | | | | HSBC Finance Corp. | | | | |
| | 50 | | | 4.75%, 07/15/2013 | | | 51 | |
| | | | | HSBC Holdings plc | | | | |
| | 50 | | | 5.10%, 04/05/2021 | | | 53 | |
| | | | | Inter-American Development Bank | | | | |
| | 75 | | | 2.25%, 07/15/2015 Ø | | | 79 | |
| | | | | International Bank for Reconstruction & Development | | | | |
| | 150 | | | 1.13%, 08/25/2014 Ø | | | 152 | |
| | | | | John Deere Capital Corp. | | | | |
| | 35 | | | 2.80%, 09/18/2017 | | | 37 | |
| | | | | JP Morgan Chase & Co. | | | | |
| | 30 | | | 4.95%, 03/25/2020 | | | 32 | |
| | 75 | | | 5.13%, 09/15/2014 | | | 79 | |
| | 30 | | | 6.00%, 01/15/2018 | | | 34 | |
| | 130 | | | 6.30%, 04/23/2019 Ø | | | 147 | |
| | | | | Kreditanstalt fuer Wiederaufbau | | | | |
| | 285 | | | 1.25%, 10/26/2015 Ø | | | 286 | |
| | | | | Landwirtschaftliche Rentenbank | | | | |
| | 65 | | | 3.13%, 07/15/2015 | | | 69 | |
| | | | | Lincoln National Corp. | | | | |
| | 25 | | | 8.75%, 07/01/2019 | | | 30 | |
| | | | | MetLife, Inc. | | | | |
| | 50 | | | 7.72%, 02/15/2019 | | | 63 | |
| | | | | Morgan Stanley | | | | |
| | 50 | | | 4.75%, 04/01/2014 Ø | | | 49 | |
| | 100 | | | 5.45%, 01/09/2017 Ø | | | 97 | |
| | 40 | | | 5.50%, 07/28/2021 | | | 37 | |
| | | | | National Rural Utilities Cooperative Finance Corp. | | | | |
| | 30 | | | 5.45%, 04/10/2017 | | | 34 | |
| | | | | Oesterreichische Kontrollbank AG | | | | |
| | 35 | | | 4.88%, 02/16/2016 | | | 39 | |
| | | | | PNC Funding Corp. | | | | |
| | 35 | | | 5.13%, 02/08/2020 | | | 40 | |
| | | | | Prudential Financial, Inc. | | | | |
| | 50 | | | 2.75%, 01/14/2013 | | | 50 | |
| | 40 | | | 5.38%, 06/21/2020 | | | 43 | |
| | | | | Royal Bank of Canada | | | | |
| | 35 | | | 2.30%, 07/20/2016 | | | 36 | |
| | | | | Royal Bank of Scotland plc | | | | |
| | 75 | | | 3.95%, 09/21/2015 | | | 70 | |
| | | | | Simon Property Group L.P. | | | | |
| | 50 | | | 5.65%, 02/01/2020 | | | 57 | |
| | | | | SLM Corp. | | | | |
| | 30 | | | 6.25%, 01/25/2016 | | | 29 | |
| | | | | Toyota Motor Credit Corp. | | | | |
| | 40 | | | 3.20%, 06/17/2015 | | | 42 | |
| | | | | Travelers Cos., Inc. | | | | |
| | 35 | | | 3.90%, 11/01/2020 | | | 37 | |
| | | | | U.S. Bancorp | | | | |
| | 60 | | | 2.45%, 07/27/2015 | | | 61 | |
| | | | | UnitedHealth Group, Inc. | | | | |
| | 25 | | | 6.88%, 02/15/2038 | | | 34 | |
| | | | | Wellpoint, Inc. | | | | |
| | 25 | | | 5.25%, 01/15/2016 | | | 28 | |
| | 10 | | | 5.80%, 08/15/2040 | | | 12 | |
| | | | | | | | | |
The accompanying notes are an integral part of these financial statements.
Hartford Portfolio Diversifier HLS Fund
Schedule of Investments – (continued)
December 31, 2011
(000’s Omitted)
| Shares or Principal Amount | | Market Value ╪ | |
| CORPORATE BONDS - 8.9% - (continued) | |
| | | | | Finance and Insurance - 3.7% - (continued) | | | | |
| | | | | Wells Fargo & Co. | | | | |
| $ | 90 | | | 4.60%, 04/01/2021 | | $ | 99 | |
| | | | | Westpac Banking Corp. | | | | |
| | 40 | | | 3.00%, 12/09/2015 | | | 40 | |
| | | | | | | | 3,941 | |
| | | | | Food Manufacturing - 0.2% | | | | |
| | | | | Archer Daniels Midland Co. | | | | |
| | 25 | | | 5.45%, 03/15/2018 | | | 29 | |
| | | | | General Mills, Inc. | | | | |
| | 20 | | | 5.65%, 02/15/2019 | | | 24 | |
| | | | | Kellogg Co. | | | | |
| | 15 | | | 4.00%, 12/15/2020 | | | 16 | |
| | | | | Kraft Foods, Inc. | | | | |
| | 70 | | | 5.38%, 02/10/2020 | | | 81 | |
| | | | | Unilever Capital Corp. | | | | |
| | 10 | | | 5.90%, 11/15/2032 | | | 13 | |
| | | | | | | | 163 | |
| | | | | Food Services - 0.0% | | | | |
| | | | | McDonald's Corp. | | | | |
| | 25 | | | 5.35%, 03/01/2018 | | | 30 | |
| | | | | Yum! Brands, Inc. | | | | |
| | 7 | | | 6.88%, 11/15/2037 | | | 9 | |
| | | | | | | | 39 | |
| | | | | Health Care and Social Assistance - 0.6% | | | | |
| | | | | Abbott Laboratories | | | | |
| | 50 | | | 5.13%, 04/01/2019 | | | 58 | |
| | | | | Amgen, Inc. | | | | |
| | 25 | | | 5.75%, 03/15/2040 | | | 27 | |
| | | | | Aristotle Holding, Inc. | | | | |
| | 10 | | | 4.75%, 11/15/2021 ■ | | | 11 | |
| | | | | AstraZeneca plc | | | | |
| | 30 | | | 5.90%, 09/15/2017 | | | 36 | |
| | | | | Baxter International, Inc. | | | | |
| | 30 | | | 4.50%, 08/15/2019 | | | 34 | |
| | | | | Boston Scientific Corp. | | | | |
| | 15 | | | 6.00%, 01/15/2020 | | | 17 | |
| | | | | Bristol-Myers Squibb Co. | | | | |
| | 20 | | | 5.45%, 05/01/2018 | | | 24 | |
| | | | | Covidien International | | | | |
| | 25 | | | 6.00%, 10/15/2017 | | | 30 | |
| | | | | CVS Caremark Corp. | | | | |
| | 20 | | | 6.13%, 09/15/2039 | | | 24 | |
| | | | | Eli Lilly & Co. | | | | |
| | 20 | | | 5.20%, 03/15/2017 | | | 23 | |
| | | | | Gilead Sciences, Inc. | | | | |
| | 20 | | | 4.40%, 12/01/2021 | | | 21 | |
| | | | | Glaxosmithkline Capital, Inc. | | | | |
| | 40 | | | 5.65%, 05/15/2018 | | | 48 | |
| | | | | Johnson & Johnson | | | | |
| | 35 | | | 2.15%, 05/15/2016 | | | 37 | |
| | 10 | | | 5.85%, 07/15/2038 | | | 13 | |
| | | | | McKesson Corp | | | | |
| | 10 | | | 4.75%, 03/01/2021 | | | 11 | |
| | | | | Medtronic, Inc. | | | | |
| | 25 | | | 4.45%, 03/15/2020 | | | 28 | |
| | | | | Merck & Co., Inc. | | | | |
| | 40 | | | 3.88%, 01/15/2021 | | | 45 | |
| | | | | Novartis Securities Investment Ltd. | | | | |
| | 25 | | | 5.13%, 02/10/2019 | | | 30 | |
| | | | | Pfizer, Inc. | | | | |
| | 65 | | | 6.20%, 03/15/2019 | | | 80 | |
| | | | | Quest Diagnostics, Inc. | | | | |
| | 15 | | | 4.70%, 04/01/2021 | | | 16 | |
| | | | | Teva Pharmaceutical Finance IV B.V | | | | |
| | 20 | | | 3.65%, 11/10/2021 | | | 21 | |
| | | | | | | | 634 | |
| | | | | Information - 0.7% | | | | |
| | | | | America Movil S.A. de C.V | | | | |
| | 45 | | | 5.63%, 11/15/2017 | | | 52 | |
| | | | | AT&T, Inc. | | | | |
| | 35 | | | 5.35%, 09/01/2040 | | | 40 | |
| | 95 | | | 5.80%, 02/15/2019 | | | 112 | |
| | 10 | | | 6.40%, 05/15/2038 | | | 12 | |
| | | | | British Telecommunications plc | | | | |
| | 8 | | | 9.62%, 12/15/2030 Δ | | | 11 | |
| | | | | Cellco Partnership - Verizon Wireless Capital | | | | |
| | 50 | | | 5.55%, 02/01/2014 | | | 54 | |
| | 25 | | | 8.50%, 11/15/2018 | | | 34 | |
| | | | | Deutsche Telekom International Finance B.V | | | | |
| | 15 | | | 8.75%, 06/15/2030 | | | 21 | |
| | | | | Embarq Corp. | | | | |
| | 40 | | | 7.08%, 06/01/2016 | | | 43 | |
| | | | | France Telecom S.A | | | | |
| | 20 | | | 5.38%, 07/08/2019 | | | 22 | |
| | | | | Google, Inc. | | | | |
| | 20 | | | 2.13%, 05/19/2016 Ø | | | 21 | |
| | | | | Microsoft Corp. | | | | |
| | 60 | | | 1.63%, 09/25/2015 Ø | | | 62 | |
| | 7 | | | 5.20%, 06/01/2039 | | | 8 | |
| | | | | Oracle Corp. | | | | |
| | 10 | | | 5.38%, 07/15/2040 | | | 12 | |
| | 60 | | | 5.75%, 04/15/2018 | | | 73 | |
| | | | | Telefonica Emisiones SAU | | | | |
| | 35 | | | 5.46%, 02/16/2021 | | | 34 | |
| | | | | Verizon Communications, Inc. | | | | |
| | 25 | | | 6.00%, 04/01/2041 | | | 31 | |
| | 75 | | | 6.35%, 04/01/2019 | | | 91 | |
| | | | | Vodafone Group plc | | | | |
| | 40 | | | 5.45%, 06/10/2019 | | | 47 | |
| | | | | | | | 780 | |
| | | | | Machinery Manufacturing - 0.1% | | | | |
| | | | | Baker Hughes, Inc. | | | | |
| | 8 | | | 5.13%, 09/15/2040 | | | 9 | |
| | | | | Caterpillar, Inc. | | | | |
| | 35 | | | 3.90%, 05/27/2021 | | | 38 | |
| | | | | Xerox Corp. | | | | |
| | 20 | | | 6.35%, 05/15/2018 | | | 23 | |
| | | | | | | | 70 | |
| | | | | Mining - 0.2% | | | | |
| | | | | Barrick Gold Corp. | | | | |
| | 35 | | | 6.95%, 04/01/2019 | | | 43 | |
| | | | | BHP Billiton Finance USA Ltd. | | | | |
| | 15 | | | 6.50%, 04/01/2019 | | | 18 | |
| | | | | Newmont Mining Corp. | | | | |
| | 8 | | | 6.25%, 10/01/2039 | | | 9 | |
| | | | | Rio Tinto Finance USA Ltd. | | | | |
| | 15 | | | 3.75%, 09/20/2021 | | | 16 | |
| | 40 | | | 6.50%, 07/15/2018 | | | 48 | |
The accompanying notes are an integral part of these financial statements.
| Shares or Principal Amount | | Market Value ╪ | |
| CORPORATE BONDS - 8.9% - (continued) | |
| | | | | Mining - 0.2% - (continued) | | | | |
| | | | | Teck Resources Ltd. | | | | |
| $ | 20 | | | 4.50%, 01/15/2021 | | $ | 21 | |
| | | | | Vale Overseas Ltd. | | | | |
| | 25 | | | 6.88%, 11/10/2039 | | | 29 | |
| | | | | | | | 184 | |
| | | | | Miscellaneous Manufacturing - 0.2% | | | | |
| | | | | 3M Co. | | | | |
| | 25 | | | 1.38%, 09/29/2016 | | | 25 | |
| | | | | Boeing Co. | | | | |
| | 40 | | | 4.88%, 02/15/2020 Ø | | | 47 | |
| | | | | Honeywell International, Inc. | | | | |
| | 25 | | | 4.25%, 03/01/2021 | | | 28 | |
| | | | | Northrop Grumman Corp. | | | | |
| | 20 | | | 5.05%, 08/01/2019 | | | 22 | |
| | | | | Tyco International Ltd. | | | | |
| | 20 | | | 8.50%, 01/15/2019 | | | 26 | |
| | | | | United Technologies Corp. | | | | |
| | 40 | | | 4.50%, 04/15/2020 | | | 45 | |
| | | | | | | | 193 | |
| | | | | Motor Vehicle & Parts Manufacturing - 0.0% | | | | |
| | | | | Johnson Controls, Inc. | | | | |
| | 15 | | | 5.00%, 03/30/2020 | | | 17 | |
| | | | | | | | | |
| | | | | Paper Manufacturing - 0.1% | | | | |
| | | | | International Paper Co. | | | | |
| | 25 | | | 7.50%, 08/15/2021 | | | 31 | |
| | | | | Kimberly-Clark Corp. | | | | |
| | 25 | | | 6.13%, 08/01/2017 | | | 30 | |
| | | | | | | | 61 | |
| | | | | Petroleum and Coal Products Manufacturing - 0.7% | | | | |
| | | | | Anadarko Petroleum Corp. | | | | |
| | 40 | | | 5.95%, 09/15/2016 | | | 45 | |
| | | | | Apache Corp. | | | | |
| | 25 | | | 5.10%, 09/01/2040 | | | 29 | |
| | | | | Canadian Natural Resources Ltd. | | | | |
| | 30 | | | 5.70%, 05/15/2017 | | | 35 | |
| | | | | ConocoPhillips | | | | |
| | 35 | | | 6.50%, 02/01/2039 | | | 48 | |
| | | | | Devon Financing Corp. | | | | |
| | 10 | | | 7.88%, 09/30/2031 | | | 14 | |
| | | | | EnCana Corp. | | | | |
| | 25 | | | 6.50%, 02/01/2038 | | | 30 | |
| | | | | Ensco plc | | | | |
| | 25 | | | 4.70%, 03/15/2021 | | | 26 | |
| | | | | Hess Corp. | | | | |
| | 13 | | | 5.60%, 02/15/2041 | | | 15 | |
| | | | | Marathon Petroleum Corp. | | | | |
| | 15 | | | 5.13%, 03/01/2021 | | | 16 | |
| | | | | Nabors Industries, Inc. | | | | |
| | 20 | | | 5.00%, 09/15/2020 | | | 20 | |
| | | | | Nexen, Inc. | | | | |
| | 10 | | | 7.50%, 07/30/2039 | | | 12 | |
| | | | | Occidental Petroleum Corp. | | | | |
| | 15 | | | 4.10%, 02/01/2021 | | | 17 | |
| | | | | Pemex Project Funding Master Trust | | | | |
| | 50 | | | 5.75%, 03/01/2018 | | | 55 | |
| | | | | Petrobras International Finance Co. | | | | |
| | 50 | | | 5.38%, 01/27/2021 Ø | | | 53 | |
| | | | | Petroleos Mexicanos | | | | |
| | 10 | | | 6.50%, 06/02/2041 ■ | | | 11 | |
| | | | | Sempra Energy | | | | |
| | 35 | | | 6.50%, 06/01/2016 | | | 41 | |
| | | | | Shell International Finance B.V | | | | |
| | 50 | | | 4.30%, 09/22/2019 | | | 58 | |
| | | | | Statoilhydro ASA | | | | |
| | 30 | | | 5.25%, 04/15/2019 | | | 35 | |
| | | | | Suncor Energy, Inc. | | | | |
| | 25 | | | 6.50%, 06/15/2038 | | | 31 | |
| | | | | Transocean, Inc. | | | | |
| | 25 | | | 6.50%, 11/15/2020 | | | 26 | |
| | | | | TXU Electric Delivery Co. | | | | |
| | 15 | | | 7.00%, 09/01/2022 | | | 19 | |
| | | | | Valero Energy Corp. | | | | |
| | 25 | | | 6.13%, 02/01/2020 | | | 28 | |
| | | | | Weatherford International Ltd. | | | | |
| | 30 | | | 5.13%, 09/15/2020 | | | 31 | |
| | | | | Williams Partners L.P. | | | | |
| | 25 | | | 5.25%, 03/15/2020 | | | 28 | |
| | | | | | | | 723 | |
| | | | | Pipeline Transportation - 0.1% | | | | |
| | | | | Enterprise Products Operating LLC | | | | |
| | 45 | | | 5.20%, 09/01/2020 | | | 50 | |
| | | | | Kinder Morgan Energy Partners L.P. | | | | |
| | 25 | | | 6.38%, 03/01/2041 | | | 28 | |
| | | | | Oneok Partners L.P. | | | | |
| | 10 | | | 6.65%, 10/01/2036 | | | 12 | |
| | | | | Plains All American Pipeline L.P. | | | | |
| | 10 | | | 6.65%, 01/15/2037 | | | 12 | |
| | | | | TransCanada Pipelines Ltd. | | | | |
| | 50 | | | 3.80%, 10/01/2020 | | | 54 | |
| | | | | | | | 156 | |
| | | | | Primary Metal Manufacturing - 0.1% | | | | |
| | | | | Alcoa, Inc. | | | | |
| | 25 | | | 6.15%, 08/15/2020 | | | 26 | |
| | | | | ArcelorMittal | | | | |
| | 35 | | | 5.50%, 03/01/2021 | | | 32 | |
| | | | | | | | 58 | |
| | | | | Professional, Scientific and Technical Services - 0.0% | | | | |
| | | | | IBM Corp. | | | | |
| | 25 | | | 5.60%, 11/30/2039 | | | 32 | |
| | | | | | | | | |
| | | | | Public Administration - 0.0% | | | | |
| | | | | Waste Management, Inc. | | | | |
| | 25 | | | 4.75%, 06/30/2020 | | | 27 | |
| | | | | | | | | |
| | | | | Rail Transportation - 0.1% | | | | |
| | | | | Burlington Northern Santa Fe Corp. | | | | |
| | 25 | | | 4.70%, 10/01/2019 | | | 28 | |
| | | | | Canadian National Railway Co. | | | | |
| | 15 | | | 2.85%, 12/15/2021 | | | 15 | |
| | | | | Canadian Pacific Railway Co. | | | | |
| | 8 | | | 7.13%, 10/15/2031 | | | 10 | |
| | | | | CSX Corp. | | | | |
| | 25 | | | 3.70%, 10/30/2020 | | | 25 | |
The accompanying notes are an integral part of these financial statements.
Hartford Portfolio Diversifier HLS Fund
Schedule of Investments – (continued)
December 31, 2011
(000’s Omitted)
| Shares or Principal Amount | | Market Value ╪ | |
| CORPORATE BONDS - 8.9% - (continued) | |
| | | | | Rail Transportation - 0.1% - (continued) | | | | |
| | | | | Norfolk Southern Corp. | | | | |
| $ | 27 | | | 4.84%, 10/01/2041 ■ | | $ | 29 | |
| | | | | Union Pacific Corp. | | | | |
| | 14 | | | 6.63%, 02/01/2029 | | | 18 | |
| | | | | | | | 125 | |
| | | | | Retail Trade - 0.3% | | | | |
| | | | | Energy Transfer Partners | | | | |
| | 40 | | | 9.00%, 04/15/2019 | | | 48 | |
| | | | | Federated Retail Holdings, Inc. | | | | |
| | 30 | | | 5.90%, 12/01/2016 | | | 34 | |
| | | | | Home Depot, Inc. | | | | |
| | 50 | | | 4.40%, 04/01/2021 | | | 56 | |
| | | | | Kroger Co. | | | | |
| | 40 | | | 3.90%, 10/01/2015 | | | 43 | |
| | | | | Lowe's Co., Inc. | | | | |
| | 10 | | | 6.65%, 09/15/2037 | | | 13 | |
| | | | | Target Corp. | | | | |
| | 40 | | | 3.88%, 07/15/2020 | | | 44 | |
| | | | | Wal-Mart Stores, Inc. | | | | |
| | 95 | | | 3.25%, 10/25/2020 | | | 102 | |
| | 10 | | | 4.25%, 04/15/2021 | | | 11 | |
| | 10 | | | 5.63%, 04/15/2041 | | | 13 | |
| | | | | | | | 364 | |
| | | | | Soap, Cleaning Compound and Toilet Manufacturing - 0.1% | | | | |
| | | | | Procter & Gamble Co. | | | | |
| | 50 | | | 4.70%, 02/15/2019 | | | 59 | |
| | | | | | | | | |
| | | | | Utilities - 0.5% | | | | |
| | | | | Consolidated Edison Co. of NY | | | | |
| | 20 | | | 6.65%, 04/01/2019 | | | 25 | |
| | | | | Dominion Resources, Inc. | | | | |
| | 50 | | | 4.45%, 03/15/2021 | | | 56 | |
| | | | | Duke Energy Corp. | | | | |
| | 25 | | | 5.30%, 02/15/2040 | | | 30 | |
| | | | | Exelon Generation Co. LLC | | | | |
| | 30 | | | 4.00%, 10/01/2020 | | | 31 | |
| | | | | FirstEnergy Solutions Co. | | | | |
| | 20 | | | 6.05%, 08/15/2021 | | | 22 | |
| | | | | Florida Power & Light Co. | | | | |
| | 25 | | | 5.69%, 03/01/2040 | | | 32 | |
| | | | | Georgia Power Co. | | | | |
| | 25 | | | 4.75%, 09/01/2040 | | | 28 | |
| | | | | Hydro Quebec | | | | |
| | 30 | | | 8.40%, 01/15/2022 | | | 44 | |
| | | | | Kentucky Utilities | | | | |
| | 20 | | | 5.13%, 11/01/2040 | | | 24 | |
| | | | | MidAmerican Energy Holdings Co. | | | | |
| | 30 | | | 6.13%, 04/01/2036 | | | 36 | |
| | | | | Nevada Power Co. | | | | |
| | 10 | | | 6.75%, 07/01/2037 | | | 14 | |
| | | | | Ohio Power Co. | | | | |
| | 35 | | | 5.38%, 10/01/2021 | | | 40 | |
| | | | | Pacific Gas & Electric Co. | | | | |
| | 25 | | | 6.05%, 03/01/2034 | | | 31 | |
| | | | | Progress Energy, Inc. | | | | |
| | 25 | | | 4.40%, 01/15/2021 | | | 28 | |
| | | | | PSEG Power LLC | | | | |
| | 25 | | | 5.13%, 04/15/2020 | | | 28 | |
| | | | | Southern California Edison Co. | | | | |
| | 25 | | | 4.50%, 09/01/2040 | | | 27 | |
| | | | | Xcel Energy, Inc. | | | | |
| | 35 | | | 4.70%, 05/15/2020 | | | 39 | |
| | | | | | | | 535 | |
| | | | | Total corporate bonds | | | | |
| | | | | (cost $9,336) | | $ | 9,491 | |
| | | | | | | | | |
| FOREIGN GOVERNMENT OBLIGATIONS - 0.7% | | | | |
| | | | | Brazil - 0.2% | | | | |
| | | | | Brazil (Republic of) | | | | |
| $ | 125 | | | 5.88%, 01/15/2019 Ø | | $ | 148 | |
| | 8 | | | 7.13%, 01/20/2037 | | | 11 | |
| | | | | | | $ | 159 | |
| | | | | Canada - 0.3% | | | | |
| | | | | British Columbia (Province of) | | | | |
| | 60 | | | 2.10%, 05/18/2016 | | | 62 | |
| | | | | Canada (Government of) | | | | |
| | 40 | | | 2.38%, 09/10/2014 | | | 42 | |
| | | | | Manitoba (Province of) | | | | |
| | 75 | | | 2.63%, 07/15/2015 | | | 79 | |
| | | | | Ontario (Province of) | | | | |
| | 85 | | | 4.40%, 04/14/2020 | | | 97 | |
| | | | | Quebec (Province of) | | | | |
| | 60 | | | 3.50%, 07/29/2020 | | | 64 | |
| | | | | | | | 344 | |
| | | | | Colombia - 0.0% | | | | |
| | | | | Colombia (Republic of) | | | | |
| | 25 | | | 8.13%, 05/21/2024 | | | 35 | |
| | | | | | | | | |
| | | | | Italy - 0.0% | | | | |
| | | | | Italy (Republic of) | | | | |
| | 25 | | | 5.38%, 06/15/2033 | | | 21 | |
| | | | | | | | | |
| | | | | Mexico - 0.1% | | | | |
| | | | | United Mexican States | | | | |
| | 100 | | | 5.13%, 01/15/2020 | | | 114 | |
| | 10 | | | 6.05%, 01/11/2040 | | | 12 | |
| | | | | | | | 126 | |
| | | | | Panama - 0.0% | | | | |
| | | | | Panama (Republic of) | | | | |
| | 10 | | | 6.70%, 01/26/2036 | | | 13 | |
| | | | | | | | | |
| | | | | Peru - 0.1% | | | | |
| | | | | Peru (Republic of) | | | | |
| | 10 | | | 5.63%, 11/18/2050 | | | 11 | |
| | 30 | | | 7.13%, 03/30/2019 | | | 38 | |
| | | | | | | | 49 | |
| | | | | Poland - 0.0% | | | | |
| | | | | Poland (Republic of) | | | | |
| | 20 | | | 5.00%, 03/23/2022 | | | 20 | |
| | | | | | | | | |
| | | | | Total foreign government obligations | | | | |
| | | | | (cost $743) | | $ | 767 | |
| | | | | | | | | |
| MUNICIPAL BONDS - 0.2% | | | | |
| | | | | Airport Revenues - 0.0% | | | | |
| | | | | Clark County Nevada Airport Rev, | | | | |
| $ | 5 | | | 6.82%, 07/01/2045 | | $ | 6 | |
The accompanying notes are an integral part of these financial statements.
| Shares or Principal Amount | | Market Value ╪ | |
MUNICIPAL BONDS - 0.2% - (continued) | |
| | | | | Airport Revenues - 0.0% - (continued) | | | | |
| | | | | New York and New Jersey PA, | | | | |
| $ | 15 | | | 4.93%, 10/01/2051 | | $ | 16 | |
| | | | | | | | 22 | |
| | | | | General Obligations - 0.1% | | | | |
| | | | | California State Build America Bonds, | | | | |
| | 40 | | | 7.60%, 11/01/2040 | | | 50 | |
| | | | | Mississippi State, | | | | |
| | 25 | | | 5.25%, 11/01/2034 | | | 28 | |
| | | | | State of Illinois, Taxable Pension, | | | | |
| | 40 | | | 5.10%, 06/01/2033 | | | 36 | |
| | | | | | | | 114 | |
| | | | | Higher Education (Univ., Dorms, etc.) - 0.0% | | | | |
| | | | | University of Texas Fin Dept, | | | | |
| | 25 | | | 4.79%, 08/15/2046 | | | 29 | |
| | | | | | | | | |
| | | | | Transportation - 0.1% | | | | |
| | | | | Bay Area Toll Auth, CA, Toll Bridge Rev, | | | | |
| | 15 | | | 6.26%, 04/01/2049 Ø | | | 20 | |
| | | | | Metropolitan Transportation Auth Rev, | | | | |
| | 20 | | | 5.87%, 11/15/2039 | | | 22 | |
| | | | | New Jersey State Turnpike Auth, Taxable, | | | | |
| | 15 | | | 7.41%, 01/01/2040 Ø | | | 21 | |
| | | | | | | | 63 | |
| | | | | Total municipal bonds | | | | |
| | | | | (cost $215) | | $ | 228 | |
| | | | | | | | | |
| U.S. GOVERNMENT AGENCIES - 13.8% | | | | |
| | | | | Federal Home Loan Mortgage Corporation - 4.2% | | | | |
| $ | 200 | | | 1.63%, 04/15/2013 | | $ | 203 | |
| | 170 | | | 2.50%, 01/07/2014 | | | 177 | |
| | 130 | | | 2.88%, 02/09/2015 | | | 139 | |
| | 273 | | | 3.50%, 04/01/2026 - 01/15/2041 ☼ | | | 285 | |
| | 95 | | | 3.75%, 03/27/2019 | | | 109 | |
| | 620 | | | 4.00%, 06/01/2024 - 08/01/2041 ☼ | | | 651 | |
| | 1,009 | | | 4.50%, 03/01/2015 - 10/01/2040 ☼Ø | | | 1,069 | |
| | 730 | | | 5.00%, 05/01/2023 - 08/01/2041 | | | 787 | |
| | 110 | | | 5.13%, 10/18/2016 | | | 130 | |
| | 577 | | | 5.50%, 05/01/2038 - 01/15/2040 ☼ | | | 627 | |
| | 202 | | | 6.00%, 06/01/2036 | | | 222 | |
| | 10 | | | 6.25%, 07/15/2032 | | | 15 | |
| | | | | | | | 4,414 | |
| | | | | Federal National Mortgage Association - 6.7% | | | | |
| | 70 | | | 0.50%, 10/30/2012 | | | 70 | |
| | 70 | | | 1.00%, 09/23/2013 | | | 71 | |
| | 110 | | | 1.63%, 10/26/2015 | | | 113 | |
| | 200 | | | 2.63%, 11/20/2014 | | | 212 | |
| | 180 | | | 2.75%, 03/13/2014 | | | 189 | |
| | 418 | | | 3.50%, 09/01/2025 - 11/01/2041 ☼ | | | 434 | |
| | 1,219 | | | 4.00%, 09/01/2025 - 09/01/2041 ☼ | | | 1,283 | |
| | 1,551 | | | 4.50%, 05/01/2025 - 05/01/2041 ☼ | | | 1,652 | |
| | 110 | | | 4.63%, 10/15/2013 | | | 118 | |
| | 1,288 | | | 5.00%, 05/01/2028 - 07/01/2036 | | | 1,391 | |
| | 796 | | | 5.50%, 01/01/2038 - 05/01/2040 | | | 869 | |
| | 25 | | | 5.63%, 07/15/2037 | | | 34 | |
| | 373 | | | 6.00%, 07/01/2037 | | | 412 | |
| | 240 | | | 6.50%, 06/01/2039 | | | 271 | |
| | 38 | | | 6.63%, 11/15/2030 | | | 56 | |
| | | | | | | | 7,175 | |
| | | | | Government National Mortgage Association - 2.9% | | | | |
| | 123 | | | 3.50%, 01/15/2027 - 12/20/2041 ☼ | | | 129 | |
| | 546 | | | 4.00%, 08/15/2026 - 12/20/2041 ☼ | | | 586 | |
| | 1,042 | | | 4.50%, 09/15/2039 - 07/20/2041 Ø | | | 1,141 | |
| | 596 | | | 5.00%, 09/15/2039 - 03/20/2041 | | | 660 | |
| | 308 | | | 5.50%, 07/15/2038 | | | 346 | |
| | 215 | | | 6.00%, 01/15/2040 - 08/20/2041 ☼ | | | 244 | |
| | | | | | | | 3,106 | |
| | | | | Total U.S. government agencies | | | | |
| | | | | (cost $14,531) | | $ | 14,695 | |
| | | | | | | | | |
| U.S. GOVERNMENT SECURITIES - 14.8% | | | | |
| | Other Direct Federal Obligations - 0.6% | | | | |
| | | | | Federal Farm Credit Bank - 0.1% | | | | |
| $ | 20 | | | 3.88%, 10/07/2013 | | $ | 22 | |
| | 40 | | | 4.88%, 01/17/2017 | | | 47 | |
| | | | | | | | 69 | |
| | | | | Federal Home Loan Bank - 0.5% | | | | |
| | 200 | | | 1.88%, 06/21/2013 | | | 204 | |
| | 100 | | | 4.50%, 09/16/2013 | | | 107 | |
| | 130 | | | 4.75%, 12/16/2016 | | | 153 | |
| | 40 | | | 5.00%, 11/17/2017 | | | 48 | |
| | | | | | | | 512 | |
| | | | | Tennessee Valley Authority - 0.0% | | | | |
| | 40 | | | 6.75%, 11/01/2025 | | | 57 | |
| | | | | | | | 638 | |
| | U.S. Treasury Securities - 14.2% | | | | |
| | | | | U.S. Treasury Bonds - 2.9% | | | | |
| | 172 | | | 3.13%, 11/15/2041 | | | 180 | |
| | 305 | | | 3.75%, 08/15/2041 Ø | | | 359 | |
| | 938 | | | 4.25%, 11/15/2040 Ø | | | 1,196 | |
| | 936 | | | 5.38%, 02/15/2031 ‡ | | | 1,334 | |
| | | | | | | | 3,069 | |
| | | | | U.S. Treasury Notes - 11.3% | | | | |
| | 4,780 | | | 1.00%, 07/15/2013 - 08/31/2016 Ø | | | 4,836 | |
| | 810 | | | 1.25%, 08/31/2015 Ø | | | 831 | |
| | 880 | | | 1.38%, 02/15/2013 Ø | | | 892 | |
| | 726 | | | 1.75%, 05/31/2016 Ø | | | 759 | |
| | 878 | | | 1.88%, 09/30/2017 Ø | | | 918 | |
| | 405 | | | 2.13%, 08/15/2021 Ø | | | 415 | |
| | 2,975 | | | 2.38%, 08/31/2014 Ø | | | 3,134 | |
| | 215 | | | 3.13%, 05/15/2021 Ø | | | 240 | |
| | | | | | | | 12,025 | |
| | | | | | | | 15,094 | |
| | | | | Total U.S. government securities | | | | |
| | | | | (cost $15,185) | | $ | 15,732 | |
The accompanying notes are an integral part of these financial statements.
Hartford Portfolio Diversifier HLS Fund
Schedule of Investments – (continued)
December 31, 2011
(000’s Omitted)
| Contracts | | | Market Value ╪ | |
PUT OPTIONS PURCHASED - 26.3% | |
| | Equity Contracts - 26.3% | | | | |
| | | | | S&P 500 | | | | |
| | 97 | | | Expiration: 06/06/2016, Exercise Price: $1,170.00 | | $ | 25,308 | |
| | 33 | | | Expiration: 09/26/2012, Exercise Price: $1,175.00 | | | 2,766 | |
| | | | | Total put options purchased | | | | |
| | | | | (cost $26,784) | | $ | 28,074 | |
| | | | | | | | | |
| | | | | Total long-term investments | | | | |
| | | | | (cost $88,462) | | $ | 90,927 | |
| Shares or Principal Amount | | Market Value ╪ | |
| SHORT-TERM INVESTMENTS - 29.0% | | | | |
| | Investment Pools and Funds - 0.2% | | | | |
| | 215 | | | JP Morgan U.S. Government Money Market Fund | | $ | 215 | |
| | | | | | | | | |
| | | | | Repurchase Agreements - 26.6% | | | | |
| | | | | Deutsche Bank Securities TriParty Joint
Repurchase Agreement (maturing on
01/03/2012 in the amount of $2,304,
collateralized by U.S. Treasury Note
1.38%, 2018, value of $2,350) | | | | |
| $ | 2,304 | | | 0.01%, 12/30/2011 | | $ | 2,304 | |
| | | | | RBC Capital Markets Corp. TriParty Joint
Repurchase Agreement (maturing on
01/03/2012 in the amount of $17,880,
collateralized by U.S. Treasury Note 0.38%
- 1.50%, 2013 - 2016, value of $18,238) | | | | |
| | 17,880 | | | 0.01%, 12/30/2011 | | | 17,880 | |
| | | | | RBS Greenwich Capital Markets TriParty
Joint Repurchase Agreement (maturing on
01/03/2012 in the amount of $6,052,
collateralized by U.S. Treasury Note 1.88%
- 2.00%, 2015 - 2016, value of $6,173) | | | | |
| | 6,052 | | | 0.02%, 12/30/2011 | | | 6,052 | |
| | | | | UBS Securities, Inc. TriParty Joint
Repurchase Agreement (maturing on
01/03/2012 in the amount of $2,097,
collateralized by U.S. Treasury Note
3.63%, 2021, value of $2,139) | | | | |
| | 2,096 | | | 0.01%, 12/30/2011 | | | 2,096 | |
| | | | | | | | 28,332 | |
| | U.S. Treasury Bills - 2.2% | | | | |
| | 2,370 | | | 0.01%, 2/2/2012 □○ | | | 2,370 | |
| | | | | | | | | |
| | | | | Total short-term investments | | | | |
| | | | | (cost $30,917) | | $ | 30,917 | |
| | | | | Total investments | | | | | | | | |
| | | | | (cost $119,379) ▲ | | | 114.3 | % | | $ | 121,844 | |
| | | | | Other assets and liabilities | | | (14.3 | )% | | | (15,263 | ) |
| | | | | Total net assets | | | 100.0 | % | | $ | 106,581 | |
The accompanying notes are an integral part of these financial statements.
| Note: | Percentage of investments as shown is the ratio of the total market value to total net assets. Market value of long-term investments in foreign securities represents 2.6% of total net assets at December 31, 2011. |
| |
| ▲ | At December 31, 2011, the cost of securities for federal income tax purposes was $120,968 and the aggregate gross unrealized appreciation and depreciation based on that cost were: |
| | |
| Unrealized Appreciation | | $ | 5,069 | |
| Unrealized Depreciation | | | (4,193 | ) |
| Net Unrealized Appreciation | | $ | 876 | |
| | | | | |
| ● | Non-income producing.
|
| Δ | Variable rate securities; the rate reported is the coupon rate in effect at December 31, 2011.
|
| ○ | The interest rate disclosed for these securities represents the effective yield on the date of the acquisition.
|
| ■ | Securities issued within terms of a private placement memorandum, exempt from registration under Rule 144A under the Securities Act of 1933, as amended, and may be sold only to qualified institutional buyers. Unless otherwise indicated, these issues are determined to be liquid. At December 31, 2011, the aggregate value of these securities was $51, which rounds to zero percent of total net assets. |
| | |
| ☼ | This security, or a portion of this security, was purchased on a when-issued, delayed delivery or delayed draw basis. The cost of these securities was $1,026 at December 31, 2011.
|
| ‡ | This security, or a portion of this security, has been segregated to cover funding requirements on investment transactions settling in the future.
|
| □ | This security, or a portion of this security, is pledged as initial margin deposit for open futures contracts held at December 31, 2011 as listed in the table below:
|
|
| Description | | Number of
Contracts* | | | Position | | | Expiration
Date | | | Market Value ╪ | | | Notional
Amount | | | Unrealized
Appreciation/
(Depreciation) | |
| S&P 500 E-Mini | | | 643 | | | | Short | | | | 03/16/2012 | | | $ | 40,271 | | | $ | 40,319 | | | $ | 48 | |
| * | The number of contracts does not omit 000's. |
| | Cash of $190 was pledged as initial margin deposit and collateral for open futures contracts at December 31, 2011. |
| |
| Ø | This security, or a portion of this security, collateralized the written put options in the table below: |
| | | | | | | | | | | | | | | | | | | | | Unrealized | |
| | | Option | | | Exercise | | | Expiration | | | Number of | | | Market | | | Premiums | | | Appreciation | |
| Description | | Type | | | Price/ Rate | | | Date | | | Contracts* | | | Value | | | Received | | | (Depreciation) | |
| S&P 500 | | | Equity | | | $ | 910.00 | | | | 06/06/2016 | | | | 78,004 | | | $ | 12,223 | | | $ | 10,009 | | | $ | (2,214 | ) |
| S&P 500 | | | Equity | | | $ | 910.00 | | | | 06/06/2016 | | | | 19,251 | | | | 3,016 | | | | 3,209 | | | | 193 | |
| | | | | | | | | | | | | | | | | | | $ | 15,239 | | | $ | 13,218 | | | $ | (2,021 | ) |
| * | The number of contracts does not omit 000's. |
| | In addition, securities valued at $13,380, held on behalf of the Fund at the custody bank, were received from the broker as collateral in connection with option contracts |
| | | |
| | PA | - Port Authority |
| ╪ | See Significant Accounting Policies of accompanying Notes to Financial Statements regarding valuation of securities. |
| |
The accompanying notes are an integral part of these financial statements.
Hartford Portfolio Diversifier HLS Fund
Investment Valuation Hierarchy Level Summary
December 31, 2011
(000’s Omitted)
| | | Total | | | | Level 1 ♦ | | | | Level 2 ♦ | | | | Level 3 ♦ | |
| Assets: | | | | | | | | | | | | | | | | |
| Asset & Commercial Mortgage Backed Securities | | $ | 737 | | | $ | – | | | $ | 737 | | | $ | – | |
| Common Stocks ‡ | | | 19,950 | | | | 19,950 | | | | – | | | | – | |
| Corporate Bonds | | | 9,491 | | | | – | | | | 9,491 | | | | – | |
| Exchange Traded Funds | | | 1,253 | | | | 1,253 | | | | – | | | | – | |
| Foreign Government Obligations | | | 767 | | | | – | | | | 767 | | | | – | |
| Municipal Bonds | | | 228 | | | | – | | | | 228 | | | | – | |
| Put Options Purchased | | | 28,074 | | | | – | | | | 28,074 | | | | – | |
| U.S. Government Agencies | | | 14,695 | | | | – | | | | 14,641 | | | | 54 | |
| U.S. Government Securities | | | 15,732 | | | | 180 | | | | 15,552 | | | | – | |
| Short-Term Investments | | | 30,917 | | | | 215 | | | | 30,702 | | | | – | |
| Total | | $ | 121,844 | | | $ | 21,598 | | | $ | 100,192 | | | $ | 54 | |
| Futures * | | | 48 | | | | 48 | | | | – | | | | – | |
| Written Options * | | | 193 | | | | – | | | | 193 | | | | – | |
| Total | | $ | 241 | | | $ | 48 | | | $ | 193 | | | $ | – | |
| Liabilities: | | | | | | | | | | | | | | | | |
| Written Options * | | | 2,214 | | | | – | | | | 2,214 | | | | – | |
| Total | | $ | 2,214 | | | $ | – | | | $ | 2,214 | | | $ | – | |
| ♦ | For the year ended December 31, 2011, there were no significant transfers between Level 1 and Level 2. |
| ‡ | The Fund has all or primarily all of the equity securities categorized in a particular level. Refer to the Schedule of Investments for further industry breakout. |
| * | Derivative instruments not reflected in the Schedule of Investments are valued at the unrealized appreciation/depreciation on the investments. |
| | |
| Following is a reconciliation of Level 3 assets for which significant unobservable inputs were used to determine fair value: |
| |
| | | Balance
as of June
6, 2011 | | | Realized
Gain
(Loss) | | | Change in
Unrealized Appreciation (Depreciation) | | | Net
Amortization | | | Purchases | | | Sales | | | Transfers
Into
Level 3 | | | Transfers
Out of
Level 3 | | | Balance as
of
December
31, 2011 | |
| Assets: | | | | | | | | | | | | | | | | | | | | | | | | | | | | | | | | | | | | |
| U.S. Government Agencies | | $ | — | | | $ | — | | | $ | — | | | $ | — | | | $ | 54 | | | $ | — | | | $ | — | | | $ | — | | | $ | 54 | |
| Total | | $ | — | | | $ | — | | | $ | — | | | $ | — | | | $ | 54 | | | $ | — | | | $ | — | | | $ | — | | | $ | 54 | |
| | | | | | | | | | | | | | | | | | | | | | | | | | | | | | | | | | | | | |
The accompanying notes are an integral part of these financial statements.
Hartford Portfolio Diversifier HLS Fund
Statement of Assets and Liabilities
December 31, 2011
(000’s Omitted)
| Assets: | | | | |
| Investments in securities, at market value (cost $119,379) | | $ | 121,844 | |
| Cash | | | 383 | * |
| Receivables: | | | | |
| Investment securities sold | | | 42 | |
| Fund shares sold | | | 1,106 | |
| Dividends and interest | | | 314 | |
| Variation margin | | | 154 | |
| Other assets | | | 17 | |
| Total assets | | | 123,860 | |
| Liabilities: | | | | |
| Payables: | | | | |
| Investment securities purchased | | | 2,008 | |
| Fund shares redeemed | | | — | |
| Investment management fees | | | 13 | |
| Distribution fees | | | 6 | |
| Accrued expenses | | | 13 | |
| Written options (proceeds $13,218) | | | 15,239 | |
| Total liabilities | | | 17,279 | |
| Net assets | | $ | 106,581 | |
| Summary of Net Assets: | | | | |
| Capital stock and paid-in-capital | | $ | 106,079 | |
| Undistributed net investment income | | | — | |
| Accumulated net realized gain | | | 10 | |
| Unrealized appreciation of investments | | | 492 | |
| Net assets | | $ | 106,581 | |
| Shares authorized | | | 1,000,000 | |
| Par value | | $ | 0.001 | |
| Class IB: Net asset value per share | | $ | 10.18 | |
| Shares outstanding | | | 10,465 | |
| Net assets | | $ | 106,581 | |
* Cash of $190 was pledged as initial margin deposit and collateral for open futures contracts at December 31, 2011.
The accompanying notes are an integral part of these financial statements.
Hartford Portfolio Diversifier HLS Fund
Statement of Operations
For the Period June 6, 2011, (commencement of operations) through December 31, 2011
(000’s Omitted)
| Investment Income: | | | | |
| Dividends | | $ | 202 | |
| Interest | | | 405 | |
| Total investment income, net | | | 607 | |
| | | | | |
| Expenses: | | | | |
| Investment management fees | | | 255 | |
| Distribution fees - Class IB | | | 106 | |
| Custodian fees | | | 15 | |
| Accounting services fees | | | 8 | |
| Board of Directors' fees | | | 1 | |
| Audit fees | | | 5 | |
| Other expenses | | | 5 | |
| Total expenses (before waivers and fees paid indirectly) | | | 395 | |
| Expense waivers | | | (33 | ) |
| Custodian fee offset | | | — | |
| Total waivers and fees paid indirectly | | | (33 | ) |
| Total expenses, net | | | 362 | |
| Net investment income | | | 245 | |
| | | | | |
| Net Realized Gain on Investments and Other Financial Instruments: | | | | |
| Net realized gain on investments | | | 935 | |
| Net realized loss on futures | | | (663 | ) |
| Net Realized Gain on Investments and Other Financial Instruments | | | 272 | |
| | | | | |
| Net Changes in Unrealized Appreciation of Investments and Other Financial Instruments: | | | | |
| Net unrealized appreciation of investments | | | 2,465 | |
| Net unrealized appreciation of futures | | | 48 | |
| Net unrealized depreciation of written options | | | (2,021 | ) |
| Net Changes in Unrealized Appreciation of Investments and Other Financial Instruments | | | 492 | |
| Net Gain on Investments and Other Financial Instruments | | | 764 | |
| Net Increase in Net Assets Resulting from Operations | | $ | 1,009 | |
The accompanying notes are an integral part of these financial statements.
Hartford Portfolio Diversifier HLS Fund
Statement of Changes in Net Assets
(000’s Omitted)
| | | For the Period
June 6, 2011* through
December 31, 2011 | |
| Operations: | | | | |
| Net investment income | | $ | 245 | |
| Net realized gain on investments and other financial instruments | | | 272 | |
| Net unrealized appreciation of investments and other financial instruments | | | 492 | |
| Net Increase In Net Assets Resulting From Operations | | | 1,009 | |
| Distributions to Shareholders: | | | | |
| From net investment income | | | | |
| Class IB | | | (352 | ) |
| Total from net investment income | | | (352 | ) |
| From net realized gain on investments | | | 191 | |
| Class IB | | | (191 | ) |
| Total from net realized gain on investments | | | (191 | ) |
| Total distributions | | | (543 | ) |
| Capital Share Transactions: | | | | |
| Class IB | | | | |
| Sold | | | 106,671 | |
| Issued on reinvestment of distributions | | | 543 | |
| Redeemed | | | (1,099 | ) |
| Total capital share transactions | | | 106,115 | |
| Net increase from capital share transactions | | | 106,115 | |
| Net Increase In Net Assets | | | 106,581 | |
| Net Assets: | | | | |
| Beginning of period | | | — | |
| End of period | | $ | 106,581 | |
| Undistributed (distribution in excess of) | | | | |
| net investment income | | $ | — | |
| Shares: | | | | |
| Class IB | | | | |
| Sold | | | 10,517 | |
| Issued on reinvestment of distributions | | | 53 | |
| Redeemed | | | (105 | ) |
| Total share activity | | | 10,465 | |
* Commencement of operations.
The accompanying notes are an integral part of these financial statements.
Hartford Portfolio Diversifier HLS Fund
Notes to Financial Statements
December 31, 2011
(000’s Omitted)
Hartford Portfolio Diversifier HLS Fund (the “Fund”) serves as an underlying investment option for certain variable annuity separate accounts of Hartford Life Insurance Company (“HLIC”) and its affiliates. The Fund’s shares are available only to separate accounts of HLIC and its affiliates as a required investment option for variable annuity contracts whose holders have elected a guaranteed benefit rider subject to an allocation requiring investment in the Fund.
Hartford Series Fund, Inc. (the “Company”) is an open-end registered management investment company comprised of thirty portfolios. Financial Statements for the Fund, a series of the Company, are included in this report.
The Company is organized under the laws of the State of Maryland and is registered with the Securities and Exchange Commission (“SEC”) under the Investment Company Act of 1940, as amended (“1940 Act”). The Fund is a diversified open-end management investment company.
Class IB shares of the Fund are offered at the per share net asset value (“NAV”) without a sales charge and are subject to distribution and service fees charged pursuant to a Distribution Plan adopted in accordance with Rule 12b-1 under the 1940 Act.
| 2. | Significant Accounting Policies: |
The following is a summary of significant accounting policies of the Fund in the preparation of its financial statements, which are in accordance with the United States Generally Accepted Accounting Principles (“U.S. GAAP”). The preparation of financial statements in accordance with U.S. GAAP may require management to make estimates and assumptions that affect the reported amounts of assets and liabilities and disclosure of contingent assets and liabilities at the date of the financial statements and the reported amounts of increases and decreases in net assets from operations during the reporting period. Actual results could differ from those estimates.
| a) | Determination of Net Asset Value – The NAV of the Fund’s shares is determined as of the close of regular trading (normally 4:00 p.m. Eastern Time) (the “NYSE Close”) on each day that the New York Stock Exchange (the “Exchange”) is open (“Valuation Date”). Information that becomes known to the Fund after the NAV has been calculated on a particular day will not generally be used to retroactively adjust the NAV determined earlier that day. |
| b) | Investment Valuation and Fair Value Measurements – For purposes of calculating the NAV, portfolio securities and other assets held by the Fund's portfolio for which market quotes are readily available are valued at market value. Market value is generally determined on the basis of last reported sales prices or official close price. If no sales are reported, market value is based on quotes obtained from a quotation reporting system, established market makers, or independent pricing services. If market prices are not readily available or are deemed unreliable, the Fund will use the fair value of the security as determined in good faith under policies and procedures established by and under the supervision of the Company’s Board of Directors. Market quotes are considered not readily available where there is an absence of current or reliable market-based data (e.g., trade information or broker quotes), including where events occur after the close of the relevant market, but prior to the NYSE Close that materially affect the values of the Fund’s portfolio securities or assets. In addition, market quotes are considered not readily available when, due to extraordinary circumstances, the exchanges or markets on which the securities trade do not open for trading for the entire day and no other market prices are available. In addition, prices of foreign equities that are principally traded on certain foreign markets are adjusted daily pursuant to a fair value pricing service approved by the Board of Directors in order to reflect an adjustment for the factors occurring after the close of certain foreign markets but before the NYSE Close. Securities that are primarily traded on foreign markets may trade on days that are not business days of the Fund. The value of the foreign securities in which the Fund invests may change on days when a shareholder will not be able to purchase or redeem shares of the Fund. Fair value pricing is subjective in nature and the use of fair value pricing by the Fund may cause the NAV of its |
shares to differ significantly from the NAV that would have been calculated using market prices at the close of the exchange on which a portfolio security is primarily traded. There can be no assurance that the Fund could obtain the fair market value assigned to a security if the Fund were to sell the security at approximately the time at which the Fund determines its NAV.
Fixed income securities (other than short term obligations) and non-exchange traded derivatives held by the Fund are normally valued on the basis of quotes obtained from brokers and dealers or independent pricing services in accordance with procedures established by the Company’s Board of Directors. Prices obtained from independent pricing services use information provided by market makers or estimates of market values obtained from yield data relating to investments or securities with similar characteristics. Generally, the Fund may use fair valuation in regard to fixed income securities when the Fund holds defaulted or distressed securities or securities in a company in which a reorganization is pending. Short-term investments maturing in 60 days or less are generally valued at amortized cost, if their original term to maturity was 60 days or less, or by amortizing their value on the 61st day prior to maturity, if the original term to maturity exceeded 60 days.
Exchange traded options, futures and options on futures are valued at the settlement price determined by the relevant exchange as of the NYSE Close. If such instruments do not trade on an exchange, values may be supplied by an independent pricing service using a formula or other objective method that may take into consideration the style, direction, expiration, strike price, notional value and volatility or other adjustments.
Investments in open-end mutual funds are valued at the respective NAV of each open-end mutual fund on the Valuation Date.
Financial instruments for which prices are not available from an independent pricing service may be valued using market quotations obtained from one or more dealers that make markets in the respective financial instrument in accordance with procedures established by the Company’s Board of Directors.
U.S. GAAP defines fair value as the price that the Fund would receive to sell an asset or pay to transfer a liability in an orderly transaction between market participants. The U.S. GAAP fair value measurement standards require disclosure of a fair value hierarchy for each major category of assets and liabilities. Various inputs are used in determining the fair value of the Fund’s investments. These inputs are summarized into three broad hierarchy levels. This hierarchy is based on whether the valuation inputs are observable or unobservable. These levels are:
| · | Level 1 – Quoted prices in active markets for identical securities. Level 1 may include exchange traded instruments such as domestic equities, some foreign equities, options, futures, mutual funds, exchange traded funds, rights and warrants. |
| · | Level 2 – Observable inputs other than Level 1 prices, such as quoted prices for similar securities; quoted prices in markets that are not active; or other inputs that are observable or can be corroborated by observable market data. Level 2 may include debt securities that are traded less frequently than exchange traded instruments and which are valued using independent pricing services; foreign equities, that are principally traded on certain foreign markets and are adjusted daily pursuant to a fair value pricing service in order to reflect an adjustment for the factors occurring after the close of certain foreign markets but before the NYSE Close; and short-term securities, which are valued at amortized cost. |
| · | Level 3 – Significant unobservable inputs that are supported by limited or no market activity. Level 3 may include financial instruments whose values are determined using broker quotes or require significant management judgment or estimation. These unobservable valuation inputs may include estimates for current yields, maturity/duration, prepayment speed, and broker quotes for comparable securities along with other assumptions relating to credit quality, collateral value, complexity of the security structure, general market conditions and liquidity. This category may include securities where trading has been halted or there are certain restrictions on trading. While these securities are priced using unobservable inputs, the valuation of these |
Hartford Portfolio Diversifier HLS Fund
Notes to Financial Statements – (continued)
December 31, 2011
(000’s Omitted)
securities reflects the best available data and management believes the prices are a reasonable representation of exit price.
Valuation levels are not necessarily indicative of the risk associated with investing in such securities. Individual securities within any of the above mentioned asset classes may be assigned a different hierarchical level than those presented above, as individual circumstances dictate.
For additional information, refer to the Investment Valuation Hierarchy Level Summary and the Level 3 roll-forward reconciliation which follow the Schedule of Investments.
For purposes of reporting transfers between different hierarchy levels, both transfers in and out of each level, as applicable, are shown as if they occurred at the beginning of the period.
| c) | Security Transactions and Investment Income – Security transactions are recorded as of the trade date (the date the order to buy or sell is executed) for financial reporting purposes. Securities purchased or sold on a when-issued or delayed-delivery basis may be settled a month or more after the trade date. Realized gains and losses are determined on the basis of identified cost. |
Dividend income is recorded on the ex-dividend date, except certain dividends from foreign securities where the ex-dividend date may have passed are recorded as soon as the Fund is informed of the dividend. Interest income, including amortization of premium and accretion of discounts, is accrued on a daily basis. Paydown gains and losses on mortgage-related and other asset-backed securities are included in interest income in the Statement of Operations.
| d) | Joint Trading Account – The Fund may invest cash balances into a joint trading account that may be invested in one or more repurchase agreements. |
| e) | Fund Share Valuation and Dividend Distributions to Shareholders – Orders for the Fund’s shares are executed in accordance with the investment instructions of the contract holders. The NAV of the Fund’s shares is determined as of the close of business on each business day of the Exchange. The NAV is determined by dividing the Fund’s net assets by the number of shares outstanding. |
Orders for the purchase of the Fund’s shares received prior to the close of the Exchange on any day the Exchange is open for business are priced at the NAV determined as of the close of the Exchange. Orders received after the close of the Exchange, or on a day on which the Exchange and/or the Fund is not open for business, are priced at the next determined NAV.
Dividends are declared pursuant to a policy adopted by the Company’s Board of Directors based upon the investment performance of the Fund. The policy of the Fund is to pay dividends from net investment income and realized capital gains, if any, at least once a year.
Distributions from net investment income, net realized capital gains and capital are determined in accordance with federal income tax regulations, which may differ from U.S. GAAP with respect to character and timing. These differences may include but are not limited to losses deferred due to wash sale adjustments, foreign currency gains and losses, adjustments related to Passive Foreign Investment Companies (“PFICs”), Real Estate Investment Trusts (“REITs”), Regulated Investment Companies (“RICs”), certain derivatives and partnerships. Permanent book and federal income tax basis differences relating to shareholder distributions will result in reclassifications to certain of the Fund’s capital accounts (see Federal Income Taxes: Reclassification of Capital Accounts note).
| 3. | Securities and Other Investments: |
| a) | Repurchase Agreements – A repurchase agreement is an agreement by which a counterparty agrees to sell a security and agrees to repurchase the security sold at a mutually agreed upon time and price. At the time the Fund enters into a repurchase agreement, the value of the underlying collateral security(ies), including accrued interest, will be equal to or exceed the value of the repurchase agreement. Repurchase agreements expose the Fund to counterparty risk. To minimize counterparty risk, the securities that serve to collateralize the repurchase agreement are held by the Fund's custodian in book entry or physical form in the custodial account of the Fund or in a third party custodial account. Repurchase agreements are valued at cost plus accrued interest. The Fund, as shown on the Schedule of Investments, had outstanding repurchase agreements as of December 31, 2011. |
| b) | Illiquid and Restricted Securities – The Fund is permitted to invest up to 15% of its net assets in illiquid securities. Illiquid securities are those that may not be sold or disposed of in the ordinary course of business within seven days, at approximately the price used to determine the Fund’s NAV. The Fund may not be able to sell illiquid securities or other investments when its sub-adviser considers it desirable to do so or may have to sell such securities or investments at a price that is lower than the price that could be obtained if the securities or investments were more liquid. A sale of illiquid securities or other investments may require more time and may result in higher dealer discounts and other selling expenses than does the sale of those that are liquid. Illiquid securities and investments also may be more difficult to value due to the unavailability of reliable market quotations for such securities or investments, and an investment in them may have an adverse impact on the Fund’s NAV. The Fund may also purchase certain restricted securities that can only be resold to certain qualified investors and may be determined to be liquid pursuant to policies and guidelines established by the Company’s Board of Directors. The Fund, as shown on the Schedule of Investments, had illiquid and/or restricted securities as of December 31, 2011. |
| c) | Securities Purchased on a When-Issued or Delayed-Delivery Basis – Delivery and payment for securities that have been purchased by the Fund on a forward commitment, or when-issued or delayed-delivery basis, take place beyond the customary settlement period. A fund may dispose of or renegotiate a delayed-delivery transaction after it is entered into, and may sell delayed-delivery securities before they are delivered, which may result in a realized gain or loss. During this period, such securities are subject to market fluctuations, and the Fund identifies securities segregated in its records with value at least equal to the amount of the commitment. The Fund, as shown on the Schedule of Investments, had when-issued or delayed delivery securities as of December 31, 2011. |
| d) | Mortgage Related and Other Asset Backed Securities – The Fund may invest in mortgage related and other asset backed securities. These securities include mortgage pass-through securities, collateralized mortgage obligations, commercial mortgage backed securities, stripped mortgage backed securities, asset backed securities, collateralized debt obligations and other securities that directly or indirectly represent a participation in, or are secured by and payable from, mortgage loans on real property. Mortgage related securities are created from pools of residential or commercial mortgage loans, including mortgage loans made by savings and loan institutions, mortgage bankers, commercial banks and others. Asset backed securities are created from many types of assets, including auto loans, credit card receivables, home equity loans, and student loans. These securities provide a monthly payment which consists of both interest and principal payments. Interest payments may be determined by fixed or adjustable rates. The rate of pre-payments on underlying mortgages will affect the price and volatility of a mortgage related security, and may have the effect of shortening or extending the effective duration of the security relative to what was anticipated at the time of purchase. The timely payment of principal and interest of certain mortgage related securities is guaranteed by the full faith and credit of the United States Government. Pools created and guaranteed by non-governmental issuers, including government-sponsored corporations, may be supported by various forms of insurance or guarantees, but there can be no assurance that the private insurers or guarantors can meet their obligations under the insurance policies or guarantee arrangements. The Fund, as shown on the Schedule of Investments, had mortgage related and other asset backed securities as of December 31, 2011. |
Hartford Portfolio Diversifier HLS Fund
Notes to Financial Statements – (continued)
December 31, 2011
(000’s Omitted)
| 4. | Financial Derivative Instruments: |
The following disclosures contain information on how and why the Fund uses derivative instruments, the credit-risk-related contingent features in certain derivative instruments, and how derivative instruments affect the Fund’s financial position and results of operations. The location and fair value amounts of these instruments on the Statement of Assets and Liabilities and the realized gains and losses and changes in unrealized gains and losses on the Statement of Operations, each categorized by type of derivative contract, are included in the following Additional Derivative Instrument Information footnote. The derivative instruments outstanding as of period-end are disclosed in the notes to the Schedule of Investments and the amounts of realized gains and losses and changes in unrealized gains and losses on derivative instruments during the period are disclosed in the Statement of Operations.
| a) | Futures Contracts – The Fund may enter into futures contracts. A futures contract is an agreement between two parties to buy or sell an asset at a set price on a future date. The Fund uses futures contracts to manage or obtain exposure to the securities markets, commodities, or movements in interest rates. The primary risks associated with the use of futures contracts are the imperfect correlation between the change in market value of the securities held by the Fund and the prices of futures contracts and the possibility of an illiquid market. Upon entering into a futures contract, the Fund is required to deposit with a futures commission merchant (“FCM”) an amount of cash or U.S. Government or Agency Obligations in accordance with the initial margin requirements of the broker or exchange. Futures contracts are marked to market daily at the most recent settlement price reported by an exchange on which, over time, they are traded most extensively, and an appropriate payable or receivable for the change in value (“variation margin”) is recorded by the Fund. Gains or losses are recognized but not considered realized until the contracts expire or are closed. Futures contracts involve, to varying degrees, risk of loss in excess of the variation margin disclosed on the Statement of Assets and Liabilities; however, this risk is reduced through the use of an FCM. The Fund, as shown on the Schedule of Investments, had outstanding futures contracts as of December 31, 2011. |
| b) | Options Contracts – An option contract is a contract sold by one party to another party that offers the buyer the right, but not the obligation, to buy (call) or sell (put) a security or other financial asset at an agreed-upon price during a specific period of time or on a specific date. The Fund may write (sell) covered call and put options on futures, swaps (“swaptions”), securities or commodities. “Covered” means that so long as the Fund is obligated as the writer of an option, it will own either the underlying securities or currency or an option to purchase the same underlying securities or currency having an expiration date of the covered option and an exercise price equal to or less than the exercise price of the covered option, or will pledge cash or other liquid securities having a value equal to or greater than the fluctuating market value of the option security or currency. Writing put options increases the Fund’s exposure to the underlying instrument. Writing call options decreases the Fund’s exposure to the underlying instrument. Premiums received from writing options that expire are treated as realized gains. Premiums received from writing options that are exercised or closed are added to the proceeds or offset against amounts paid on the underlying futures, swap or security to determine the realized gain or loss. The Fund as a writer of an option has no control over whether the underlying instrument may be sold (call) or purchased (put) and as a result bears the market risk of an unfavorable change in the price of the instrument underlying the written option. There is the risk the Fund may not be able to enter into a closing transaction because of an illiquid market. The Fund may also purchase put and call options. Purchasing call options increases the Fund’s exposure to the underlying instrument. Purchasing put options decreases the Fund’s exposure to the underlying instrument. The Fund pays a premium, which is included on the Fund’s Statement of Assets and Liabilities as an investment and is subsequently marked to market to reflect the current value of the option. Premiums paid for purchasing options that expire are treated as realized losses. Certain options may be purchased with premiums to be determined on a future date. The premiums for these options are based upon implied volatility parameters at specified terms. The risk associated with purchasing put and call options is generally limited to the premium paid. Premiums paid for purchasing options that are exercised or closed are added to the amounts paid or offset against the proceeds on the underlying investment transaction to determine the realized gain or loss. Entering into over-the-counter options also exposes the Fund to counterparty risk. Counterparty risk is the possibility that the counterparty to the agreements may default on its obligation to perform or disagree as to the meaning of the contractual terms in the agreements. The Fund, as shown on the Schedule of |
Investments, had outstanding purchased options contracts as of December 31, 2011. Transactions involving written options contracts during the year ended December 31, 2011, are summarized below:
| | | Options Contract Activity During the
Period June 6, 2011 (commencement of
operations) through December 31, 2011 | |
| Put Options Written During the Period | | Number of Contracts* | | | Premium Amounts | |
| Beginning of the period | | | — | | | $ | — | |
| Written | | | 97,255 | | | | 13,218 | |
| Expired | | | — | | | | — | |
| Closed | | | — | | | | — | |
| Exercised | | | — | | | | — | |
| End of period | | | 97,255 | | | $ | 13,218 | |
| | | | | | | | | |
| * The number of contracts does not omit 000's. |
| | | | | | | | | |
| c) | Additional Derivative Instrument Information: |
| | | |
| | | Fair Values of Derivative Instruments on the Statement of Assets and Liabilities as of December 31, 2011: |
| | | Risk Exposure Category |
| | | Interest Rate
Contracts | | | Foreign
Exchange
Contracts | | | Credit
Contracts | | | Equity Contracts | | | Commodity Contracts | | | Other
Contracts | | | Total | |
| Assets: | | | | | | | | | | | | | | | | | | | | | | | | | | | | |
| Investments in securities, at value (purchased options), market value | | $ | — | | | $ | — | | | $ | — | | | $ | 28,074 | | | $ | — | | | $ | — | | | $ | 28,074 | |
| Variation margin receivable * | | | — | | | | — | | | | — | | | | 154 | | | | — | | | | — | | | | 154 | |
| Total | | $ | — | | | $ | — | | | $ | — | | | $ | 28,228 | | | $ | — | | | $ | — | | | $ | 28,228 | |
| | | | | | | | | | | | | | | | | | | | | | | | | | | | | |
| Liabilities: |
| Written options, market value | | $ | — | | | $ | — | | | $ | — | | | $ | 15,239 | | | $ | — | | | $ | — | | | $ | 15,239 | |
| Total | | $ | — | | | $ | — | | | $ | — | | | $ | 15,239 | | | $ | — | | | $ | — | | | $ | 15,239 | |
| | | | | | | | | | | | | | | | | | | | | | | | | | | | True | |
* Only current day's variation margin is reported within the Statement of Assets and Liabilities. The variation margin is included in the open futures
cumulative appreciation (depreciation) of $48 as reported in the Schedule of Investments |
| | | | | | | | | | | | | | | | | | | | | | | | | | | | | |
| The volume of derivatives that is presented in the Schedule of Investments is consistent with the derivative activity during the period June 6, 2011 through December 31, 2011 |
| | | | | | | | | | | | | | | | | | | | | | | | | | | | | |
Hartford Portfolio Diversifier HLS Fund
Notes to Financial Statements – (continued)
December 31, 2011
(000’s Omitted)
| The Effect of Derivative Instruments on the Statement of Operations for the period June 6, 2011, (commencement of operations) through December 31, 2011: |
| | | Risk Exposure Category | |
| | | Interest Rate Contracts | | | Foreign
Exchange
Contracts | | | Credit
Contracts | | | Equity
Contracts | | | Commodity Contracts | | | Other
Contracts | | | Total | |
| Realized Gain (Loss) on Derivatives Recognized as a Result of Operations: |
| Net realized gain on investments in purchased options | | $ | — | | | $ | — | | | $ | — | | | $ | 1,001 | | | $ | — | | | $ | — | | | $ | 1,001 | |
| Net realized loss on futures | | | — | | | | — | | | | — | | | | (663 | ) | | | — | | | | — | | | | (663 | ) |
| Total | | $ | — | | | $ | — | | | $ | — | | | $ | 338 | | | $ | — | | | $ | — | | | $ | 338 | |
| | | | | | | | | | | | | | | | | | | | | | | | | | | | | |
| Net Change in Unrealized Appreciation (Depreciation) on Derivatives Recognized as a Result of Operations: |
| Net change in unrealized appreciation of investments in purchased options | | $ | — | | | $ | — | | | $ | — | | | $ | 1,290 | | | $ | — | | | $ | — | | | $ | 1,290 | |
| Net change in unrealized appreciation of futures | | | — | | | | — | | | | — | | | | 48 | | | | — | | | | — | | | | 48 | |
| Net change in unrealized depreciation of written options | | | — | | | | — | | | | — | | | | (2,021 | ) | | | — | | | | — | | | | (2,021 | ) |
| Total | | $ | — | | | $ | — | | | $ | — | | | $ | (683 | ) | | $ | — | | | $ | — | | | $ | (683 | ) |
| a) | Credit and Counterparty Risks – Credit risk depends largely on the perceived financial health of bond issuers. In general, the credit rating is inversely related to the credit risk of the issuer. Higher rated bonds generally are deemed to have less credit risk, while lower or unrated bonds are deemed to have higher risk of default. The share price, yield and total return of a fund that holds securities with higher credit risk may be more volatile than those of a fund that holds bonds with lower credit risk. Similar to credit risk, the Fund may be exposed to counterparty risk, or the risk that an institution or other entity with which the Fund has unsettled or open transactions will default. |
| b) | Market Risks – The Fund’s investments in derivatives and other financial instruments expose the Fund to various risks including, but not limited to, interest rate, prepayment, extension, and equity risks. Interest rate risk is the risk that fixed income securities will decline in value because of changes in interest rates. As nominal interest rates rise, the values of certain fixed income securities held by the Fund are likely to decrease. A nominal interest rate can be described as the sum of a real interest rate and an expected inflation rate. Fixed income securities with longer durations tend to be more sensitive to changes in interest rates, usually making them more volatile than securities with shorter durations. Duration is useful primarily as a measure of the sensitivity of a fixed income security’s market price to interest rate (i.e., yield) movements. In addition, securities are subject to extension risk. Rising interest rates may cause prepayments to occur at a slower than expected rate, thereby effectively lengthening the maturity of the security and making the security more sensitive to interest rate changes. Prepayment and extension risk are major risks of mortgage-backed securities and certain asset-backed securities. For certain asset-backed securities, the actual maturity may be less than the stated maturity shown in the Schedule of Investments, if applicable. As a result, the timing of income recognition relating to these securities may vary based upon the actual maturity. The market values of equity securities, such as common stocks and preferred stocks, or equity related investments, such as futures and options, may decline due to general market conditions which are not specifically related to a particular company, such as real or perceived adverse economic conditions, changes in the general outlook for corporate earnings, changes in interest or currency rates or adverse investor sentiment generally. The market value of equity securities may also decline due to factors which affect a particular industry or industries, such as labor shortages or increased production costs and competitive conditions within an industry. Equity securities and equity related investments generally have greater market price volatility than fixed income securities. |
| a) | Federal Income Taxes – For federal income tax purposes, the Fund intends to continue to qualify as a RIC under Subchapter M of the Internal Revenue Code (“IRC”) by distributing substantially all of its taxable net investment income and net realized capital gains to its shareholders and otherwise complying with the requirements of RICs. The Fund has distributed substantially all of its income and capital gains in prior years, if applicable, and intends to distribute substantially all of its income and capital gains prior to the next fiscal year-end. Accordingly, no provision for federal income or excise taxes has been made in the accompanying financial statements. Distributions from short-term capital gains are treated as ordinary income distributions for federal income tax purposes. |
| b) | Net Investment Income (Loss), Net Realized Gains (Losses) – Net investment income (loss) and net realized gains (losses) may differ for financial statement and tax purposes primarily because of losses deferred due to wash sale adjustments, foreign currency gains and losses, adjustments related to PFICs, REITs, RICs, certain derivatives and partnerships. The character of distributions made during the year from net investment income or net realized gains may differ from their ultimate characterization for federal income tax purposes. Also, due to the timing of dividend distributions, the fiscal year in which amounts are distributed may differ from the year that the income or realized gains (losses) were recorded by the Fund. |
| c) | Distributions and Components of Distributable Earnings – The tax character of distributions paid by the Fund for the periods indicated is as follows (as adjusted for dividends payable): |
| | | For the Period June 6,
2011 (Commencement
of Operations) through December 31, 2011 | |
| Ordinary Income | | $ | 486 | |
| Long-Term Capital Gains* | | | 57 | |
| | * | The Fund designates these distributions as long-term capital dividends pursuant to IRC Sec. 852(b)(3)(C). |
As of December 31, 2011, the Fund’s components of distributable earnings (deficit) on a tax basis were as follows:
| | | Amount | |
| Accumulated Capital and Other Losses | | $ | (374 | ) |
| Unrealized Appreciation* | | | 876 | |
| Total Accumulated Earnings | | $ | 502 | |
| | * | The differences between book-basis and tax-basis unrealized appreciation (depreciation) may be attributable to the losses deferred due to wash sale adjustments, foreign currency gains and losses, adjustments related to PFICs, REITs, RICs, certain derivatives and partnerships. |
Hartford Portfolio Diversifier HLS Fund
Notes to Financial Statements – (continued)
December 31, 2011
(000’s Omitted)
��
| d) | Reclassification of Capital Accounts – The Fund may record reclassifications in its capital accounts. These reclassifications have no impact on the total net assets of the Fund. The reclassifications are a result of permanent differences between U.S. GAAP and tax accounting for such items as foreign currency, PFICs, expiration or utilization of capital loss carryforwards or net operating losses. Adjustments are made to reflect the impact these items have on current and future distributions to shareholders. Therefore, the source of the Fund’s distributions may be shown in the accompanying Statement of Changes in Net Assets as from undistributed net investment income, from accumulated net realized gains on investments or from capital depending on the type of book and tax differences that exist. For the year ended December 31, 2011, the Fund recorded reclassifications to increase (decrease) the accounts listed below: |
| | | Amount | |
| Undistributed Net Investment Income | | $ | 107 | |
| Accumulated Net Realized Gain (Loss) | | | (71 | ) |
| Capital Stock and Paid-in-Capital | | | (36 | ) |
| e) | Capital Loss Carryforward – On December 22, 2010, the Regulated Investment Company Modernization Act of 2010 (the “Act”) was enacted, which made changes to the capital loss carryforward rules. The changes are effective for taxable years beginning after the date of enactment. Under the Act, funds are permitted to carry forward capital losses for an unlimited period. Additionally, capital loss carryforwards retain their character as either short-term or long-term capital losses rather than being considered all short-term as permitted under prior regulation. |
The Fund had no capital loss carryforward for U.S. federal income tax purposes as of December 31, 2011.
| As of December 31, 2011, the Fund elected to defer the following post-October losses: |
| | | Amount | |
| Ordinary Income | | $ | 374 | |
| f) | Accounting for Uncertainty in Income Taxes – The Fund has adopted financial reporting rules that require the Fund to analyze all open tax years, as defined by the statute of limitations, for all major jurisdictions. Generally, tax authorities can examine all tax returns filed for the last three years. The Fund does not have an examination in progress. |
The Fund has reviewed all open tax years and major jurisdictions and concluded that these financial reporting rules had no effect on the Fund’s financial position or results of operations. There is no tax liability resulting from unrecognized tax benefits relating to uncertain income tax positions taken or expected to be taken on the tax return for the fiscal year ended December 31, 2011. The Fund is also not aware of any tax positions for which it is reasonably possible that the total amounts of unrecognized tax benefits will significantly change in the next twelve months.
| a) | Investment Management Agreement – HL Investment Advisors, LLC (“HL Advisors”), an indirect wholly owned subsidiary of The Hartford Financial Services Group, Inc. (“The Hartford”), serves as investment manager to the Fund pursuant to an Investment Management Agreement with the Company. As investment manager, HL Advisors has overall investment supervisory responsibility for the Fund. In addition, HL Advisors provides administrative personnel, services, equipment, facilities and office space for proper operation of the Fund. HL Advisors has contracted with Hartford Investment Management Company (“Hartford Investment Management”) under a sub-advisory agreement for the provision of day-to-day investment management services to the Fund in accordance with the Fund’s investment objective and policies. The Fund pays a fee to HL Advisors, a portion of which may be used to compensate Hartford Investment Management. |
The schedule below reflects the rates of compensation paid to HL Advisors for investment management services rendered as of December 31, 2011; the rates are accrued daily and paid monthly.
| Average Daily Net Assets | Annual Fee |
| On first $500 million | 0.60% |
| On next $500 million | 0.55% |
| On next $4 billion | 0.50% |
| On next $5 billion | 0.48% |
| Over $10 billion | 0.47% |
| b) | Accounting Services Agreement – Pursuant to the Fund Accounting Agreement between HLIC and the Company, on behalf of the Fund, HLIC provides accounting services to the Fund and receives monthly compensation based on the Fund’s average daily net assets at the rates set forth below. The Fund’s accounting services fees are accrued daily and paid monthly. |
| Average Daily Net Assets | Annual Fee |
| On first $5 billion | 0.018% |
| On next $5 billion | 0.016% |
| Over $10 billion | 0.014% |
| c) | Operating Expenses – Allocable expenses incurred by the Company are allocated to each Fund in proportion to the average daily net assets of the Fund, except where allocation of certain expenses is more fairly made directly to the Fund. HL Advisors has contractually agreed to reimburse expenses (exclusive of taxes, interest expense, brokerage commissions, acquired fund fees and expenses and extraordinary expenses) to the extent necessary to maintain total annual operating expenses for the Class IB shares of the Fund at the annual rate of 0.85% of the Fund’s average daily net assets. This contractual arrangement will remain in effect until April 30, 2013, and shall renew automatically for one-year terms unless HL Advisors provides written notice of termination prior to the start date of the next term or upon approval of the Board of Directors of the Company. |
| d) | Fees Paid Indirectly – The Fund’s custodian bank, State Street Bank and Trust Co., has agreed to reduce its fees when the Fund maintains cash on deposit in a non-interest-bearing custody account. For the year ended December 31, 2011, these amounts are included in the Statement of Operations. |
The ratio of expenses to average net assets in the accompanying financial highlights excludes the reduction in expenses related to fees paid indirectly. The annualized expense ratio for the period listed below reflecting the reduction for fees paid indirectly is as follows:
| | Period Ended
December 31, 2011 |
Class IB | 0.85% |
| | |
| e) | Distribution Plan for Class IB shares – The Company, on behalf of the Fund, has adopted a Distribution Plan pursuant to Rule 12b-1 of the 1940 Act to compensate the Distributor, Hartford Securities Distribution Company, Inc. (a wholly owned, ultimate subsidiary of The Hartford), from assets attributable to the Class IB shares for services rendered and expenses borne in connection with activities primarily intended to result in the sale of the Class IB shares, subject to the review and approval of the Company’s Board of Directors. |
The Distribution Plan provides that the Fund may pay annually up to 0.25% of the average daily net assets of the Fund attributable to its Class IB shares for activities primarily intended to result in the sale of Class IB shares. The Board has the authority to suspend or reduce these payments at any point in time. Under the terms of the Distribution Plan and the principal underwriting agreement, the Fund is authorized to make payments monthly to the Distributor that may be used
Hartford Portfolio Diversifier HLS Fund
Notes to Financial Statements – (continued)
December 31, 2011
(000’s Omitted)
to pay or compensate entities providing distribution and shareholder servicing with respect to the Class IB shares for such entities’ fees or expenses incurred or paid in that regard. These fees are accrued daily and paid monthly.
| f) | Other Related Party Transactions – Certain officers of the Fund are directors and/or officers of HL Advisors and/or The Hartford or its subsidiaries. For the year ended December 31, 2011, a portion of the Fund’s chief compliance officer’s salary was paid by all the investment companies in the Hartford fund complex. The portion allocated to the Fund rounds to zero. These fees are accrued daily and paid monthly. |
As of December 31, 2011, affiliates of The Hartford had ownership of shares in the Fund as follows:
| 9. | Investment Transactions: |
For the period June 6, 2011, (commencement of operations) through December 31, 2011, the cost of purchases and proceeds from sales of investment securities (excluding short-term investments) were as follows:
| | | Amount | |
| Cost of Purchases Excluding U.S. Government Obligations | | $ | 95,087 | |
| Sales Proceeds Excluding U.S. Government Obligations | | | 22,091 | |
| Cost of Purchases for U.S. Government Obligations | | | 20,441 | |
| Sales Proceeds for U.S. Government Obligations | | | 5,910 | |
| 10. | Industry Classifications: |
Other than the industry classifications “Other Investment Pools and Funds” and “Exchange Traded Funds,” equity industry classifications used in this report are the Global Industry Classification Standard, which was developed by and is the exclusive property and service mark of MSCI, Inc. and Standard & Poor’s.
Under the Company’s organizational documents, the Company shall indemnify its officers and directors to the full extent required or permitted under Maryland General Corporation Law and the federal securities laws. In addition, the Company, on behalf of the Fund, may enter into contracts that contain a variety of indemnifications. The Company’s maximum exposure under these arrangements is unknown. However, as of the date of these financial statements, the Company has not had prior claims or losses pursuant to these contracts and expects the risk of loss to be remote.
[This page is intentionally left blank]
Hartford Portfolio Diversifier HLS Fund
Financial Highlights
- Selected Per-Share Date (A) -
Class | Net Asset Value at
Beginning of Period | Net Investment Income (Loss) | Payments from (to) Affiliate | Net Realized and Unrealized Gain (Loss) on Investments | Total from Investment Operations | Dividends from Net Investment Income | Distributions from Realized Capital Gains | Distributions from Capital | Total Distributions | Net Increase (Decrease) in Net Asset Value | Net Asset Value at End of Period |
| From June 6, 2011 (commencement of operations) through December 31, 2011 (D) |
| IB(E) | $ 10 .00 | $ 0 .04 | $ – | $ 0 .19 | $ 0 .23 | $ (0 .03) | $ (0 .02) | $ – | $ (0 .05) | $ 0 .18 | $ 10 .18 |
| (A) | Information presented relates to a share outstanding throughout the indicated period. |
| (B) | The figures do not include sales charges or other fees which may be applied at the variable annuity product level. Any such additional sales charges or other fees would lower the Fund's performance. |
| (C) | Ratios do not reflect reductions for fees paid indirectly. Please see Fees Paid Indirectly in the Notes to Financial Statements. |
| (D) | Per share amounts have been calculated using the average shares method. |
| (E) | Commenced operations on June 6, 2011. |
| (F) | Not annualized. |
| (G) | Annualized. |
- Ratios and Supplemental Data -
Total Return(B) | Net Assets at End of Period | Ratio of Expenses to Average Net Assets Before Waivers(C) | Ratio of Expenses to Average Net Assets After Waivers(C) | Ratio of Net Investment Income (Loss) to Average Net Assets | Portfolio Turnover Rate |
| |
| 2.38%(F) | $106,581 | 0.93%(G) | 0.85%(G) | 0.58%(G) | 43 % |
Report of Independent Registered Public Accounting Firm
The Board of Directors and Shareholders of
Hartford Series Fund,Inc.
We have audited the accompanying statement of assets and liabilities, including the schedule of investments, of Hartford Portfolio Diversifier HLS Fund (one of the portfolios constituting Hartford Series Fund, Inc. (the Funds)) as of December 31, 2011, and the related statement of operations, the statement of changes in net assets, and the financial highlights for the period June 6, 2011 (commencement of operations) to December 31, 2011. These financial statements and financial highlights are the responsibility of the Funds’ management. Our responsibility is to express an opinion on these financial statements and financial highlights based on our audit.
We conducted our audit in accordance with the standards of the Public Company Accounting Oversight Board (United States). Those standards require that we plan and perform the audit to obtain reasonable assurance about whether the financial statements and financial highlights are free of material misstatement. We were not engaged to perform an audit of the Funds’ internal control over financial reporting. Our audit included consideration of internal control over financial reporting as a basis for designing audit procedures that are appropriate in the circumstances, but not for the purpose of expressing an opinion on the effectiveness of the Funds’ internal control over financial reporting. Accordingly, we express no such opinion. An audit also includes examining, on a test basis, evidence supporting the amounts and disclosures in the financial statements and financial highlights, assessing the accounting principles used and significant estimates made by management, and evaluating the overall financial statement presentation. Our procedures included confirmation of securities owned as of December 31, 2011, by correspondence with the custodian and brokers or by other appropriate auditing procedures where replies from brokers were not received. We believe that our audit provides a reasonable basis for our opinion.
In our opinion, the financial statements and financial highlights referred to above present fairly, in all material respects, the financial position of Hartford Portfolio Diversifier HLS Fund of Hartford Series Fund, Inc. at December 31, 2011, the results of its operations, the changes in its net assets, and the financial highlights for the period June 6, 2011 (commencement of operations) to December 31, 2011, in conformity with U.S. generally accepted accounting principles.
| | |
|---|
Minneapolis, MN
February 13, 2012 | |
Hartford Portfolio Diversifier HLS Fund
Directors and Officers (Unaudited)
The Board of Directors of the Company appoints officers who are responsible for the day-to-day operations of the Fund and who execute policies formulated by the Directors. Each director serves until his or her death, resignation, or retirement or until the next annual meeting of shareholders is held or until his or her successor is elected and qualifies.
Directors and officers who are employed by or who have a financial interest in The Hartford are considered “interested” persons of the Fund pursuant to the 1940 Act. Each officer and two of the Company’s directors, as noted in the chart below, are “interested” persons of the Fund. Each director serves as a director for The Hartford Mutual Funds, Inc., The Hartford Mutual Funds II, Inc., Hartford Series Fund, Inc., Hartford HLS Series Fund II, Inc., and as a trustee for The Hartford Alternative Strategies Fund, which, as of December 31, 2011, collectively consist of 91 funds. Correspondence may be sent to directors and officers c/o Hartford Mutual Funds, P.O. Box 2999, Hartford, Connecticut 06104-2999, except that correspondence to Ms. Fagely may be sent to 500 Bielenberg Drive, Woodbury, Minnesota 55125.
The table below sets forth, for each director and officer, his or her name, year of birth, current position with the Company and date first elected or appointed to Hartford Series Fund, Inc. (“HSF”), and Hartford HLS Series Fund II, Inc. (“HSF2”), principal occupation, and, for directors, other directorships held. The Fund’s statement of additional information contains further information on the directors and is available free of charge by calling 1-800-862-6668 or writing to Hartford HLS Funds, c/o Individual Annuity Services, P.O. Box 5085, Hartford, CT 06102-5085.
Information on the aggregate remuneration paid to the directors of the Company can be found in the Statement of Operations herein. The Fund pays to The Hartford a portion of the chief compliance officer’s compensation, but does not pay salaries or compensation to any of their other officers or directors who are employed by The Hartford.
Non-Interested Directors
Lynn S. Birdsong (1946) Director since 2003, Co-Chairman of the Investment Committee
Mr. Birdsong is a private investor. Mr. Birdsong currently serves as a Director of the Sovereign High Yield Investment Company (April 2010 to current). Mr. Birdsong currently serves as an Independent Director of Nomura Partners Funds, Inc. (formerly, The Japan Fund) (March 2003 to current). From 2003 to March 2005, Mr. Birdsong was an independent director of the Atlantic Whitehall Funds. From 1979 to 2002, Mr. Birdsong was a managing director of Zurich Scudder Investments, an investment management firm. During his employment with Scudder, Mr. Birdsong was an Interested Director of The Japan Fund. Since 1981, Mr. Birdsong has been a partner in Birdsong Company, an advertising specialty firm.
Robert M. Gavin, Jr. (1940) Director since 2002 (HSF) and 1986 (HSF2), Chairman of the Board since 2004
Dr. Gavin is an educational consultant. Prior to September 1, 2001, he was President of Cranbrook Education Community and prior to July 1996, he was President of Macalester College, St. Paul, Minnesota.
Duane E. Hill (1945) Director since 2001 (HSF) and 2002 (HSF2), Chairman of the Nominating Committee
Mr. Hill is Partner of TSG Ventures L.P., a private equity investment company. Mr. Hill is a former partner of TSG Capital Group, a private equity investment firm that served as sponsor and lead investor in leveraged buyouts of middle market companies.
Sandra S. Jaffee (1941) Director since 2005
Ms. Jaffee served as Chairman (2008 to 2009) and Chief Executive Officer of Fortent (formerly Searchspace Group), a leading provider of compliance/regulatory technology to financial institutions from August 2005 to August 2009. From August 2004 to August 2005, Ms. Jaffee served as an Entrepreneur in Residence with Warburg Pincus, a private equity firm. From September 1995 to July 2004, Ms. Jaffee served as Executive Vice President at Citigroup, where she was President and Chief Executive Officer of Citibank’s Global Securities Services (1995 to 2003). Ms. Jaffe currently serves as a member of the Board of Directors of Broadridge Financial Solutions as well as a Trustee of Muhlenberg College.
William P. Johnston (1944) Director since 2005, Chairman of the Compliance Committee
In June 2006, Mr. Johnston was appointed as Senior Advisor to The Carlyle Group, a global private equity investment firm. In August 2007, Mr. Johnston was elected to the Board of Directors of LifeCare Holdings, Inc. In February 2008, Mr. Johnston was elected to the Board of Directors of HCR-ManorCare, Inc. In May 2006, Mr. Johnston was elected to the Supervisory Board of Fresenius Medical Care AG & Co. KGaA, after its acquisition of Renal Care Group, Inc. in March 2006. Mr. Johnston joined Renal Care Group in November 2002 as a member of the Board of Directors and served as Chairman of the Board from March 2003 through March 2006. Mr. Johnston served as a Director of MultiPlan, Inc. from July 2006 through August 2010. From September 1987 to December 2002, Mr. Johnston was with Equitable Securities Corporation (and its successors, SunTrust Equitable Securities and SunTrust Robinson Humphrey) serving in various investment banking and managerial positions, including Managing Director and Head of Investment Banking, Chief Executive Officer and Vice Chairman.
Hartford Portfolio Diversifier HLS Fund
Directors and Officers (Unaudited) – (continued)
Phillip O. Peterson (1944) Director since 2002 (HSF) and 2000 (HSF2), Chairman of the Audit Committee
Mr. Peterson is a mutual fund industry consultant. He was a partner of KPMG LLP (an accounting firm) until July 1999. Mr. Peterson joined William Blair Funds in February 2007 as a member of the Board of Trustees. From January 2004 to April 2005, Mr. Peterson served as Independent President of the Strong Mutual Funds.
Lemma W. Senbet (1946) Director since 2005
Dr. Senbet is the William E. Mayer Chair Professor of Finance and Director, Center for Financial Policy, at the University of Maryland, Robert H. Smith School of Business. He was chair of the Finance Department from 1998 to 2006. Previously he was a chaired professor of finance at the University of Wisconsin-Madison. Also, he was director of the Fortis Funds from March 2000 to July 2002. Dr. Senbet served the finance profession in various capacities, including as director of the American Finance Association and President of the Western Finance Association. In 2006, Dr. Senbet was inducted Fellow of Financial Management Association International for his career-long distinguished scholarship and professional service.
Interested Directors and Officers
David N. Levenson (1966) Director since 2010
Mr. Levenson currently serves as President of The Hartford’s Wealth Management business. He was appointed to this role in July 2010. Previously, Mr. Levenson served as Executive Vice President of Legacy Holdings for The Hartford from June 2009 to July 2010. From 2006 to 2009, Mr. Levenson was with Hartford Life Insurance K.K. where he served as President and Chief Executive Officer from 2007 to 2009. He served as Managing Director of Hartford Investment Management Company from 2005 to 2006. Additionally, Mr. Levenson serves as Executive Vice President of The Hartford and as President, Director and Chief Executive Officer of Hartford Life Insurance Company (“HLIC”) and Hartford Life, Inc. (“HL Inc.”).
Lowndes A. Smith (1939) Director since 1996 (HSF) and 2002 (HSF2), Co-Chairman of the Investment Committee
Mr. Smith served as Vice Chairman of The Hartford from February 1997 to January 2002, as President and Chief Executive Officer of HL Inc. from February 1997 to January 2002, and as President and Chief Operating Officer of The Hartford Life Insurance Companies from January 1989 to January 2002. Mr. Smith serves as a Director of White Mountains Insurance Group, Ltd., One Beacon Insurance and Symetra Financial and as a Managing Director of Whittington Gray Associates.
Other Officers
James E. Davey (1964) President and Chief Executive Officer since 2010
Mr. Davey serves as Executive Vice President of HLIC. Additionally, Mr. Davey serves as President, Chief Executive Officer and Manager of Hartford Investment Financial Services, Inc. (“HIFSCO”) and President, Chief Executive Officer and Manager of HL Advisors. Mr. Davey joined The Hartford in 2002.
Michael R. Dressen (1963) AML Compliance Officer since 2011
Mr. Dressen currently serves as Assistant Vice President of HLIC. He also serves as Chief Compliance Officer and AML Compliance Officer of Hartford Administrative Services Company (“HASCO”) and as Assistant Secretary and Compliance Officer of HIFSCO. Mr Dressen joined The Hartford in 2005 from State Farm Insurance Companies where he held various positions related to mutual funds, variable products, and property casualty insurance.
Tamara L. Fagely (1958) Vice President, Treasurer and Controller since 2002 (HSF) and 1993 (HSF2)
Ms. Fagely has been a Vice President of HASCO since 1998 and Chief Financial Officer since 2006. Currently Ms. Fagely is a Vice President of HLIC. She served as Assistant Vice President of HLIC from December 2001 through March 2005. In addition, Ms. Fagely is Controller and Chief Financial Officer of HIFSCO.
Dr. Robert J. Froehlich (1953) Senior Managing Director since 2009
Dr. Froehlich joined The Hartford as Senior Managing Director in September 2009. Prior to joining The Hartford, Dr. Froehlich served as Vice Chairman of Deutsche Asset Management from 1997-2009.
Edward P. Macdonald (1967) Vice President, Secretary and Chief Legal Officer since 2005
Mr. Macdonald serves as Vice President of HLIC and Chief Legal Officer of Mutual Funds and Vice President of HIFSCO. He also serves as Vice President and Secretary of HASCO, and Chief Legal Officer, Secretary and Vice President of HL Advisors. Mr. Macdonald joined The Hartford in 2005.
Vernon J. Meyer (1964) Vice President since 2006
Mr. Meyer serves as Senior Vice President of HLIC. He also serves as Senior Vice President of HIFSCO and HL Advisors. Mr. Meyer joined The Hartford in 2004.
Colleen B. Pernerewski (1969) Vice President and Chief Compliance Officer since 2010
Ms. Pernerewski serves as Vice President and Chief Investment Advisor Compliance Officer of HIFSCO and as Vice President and Chief Compliance Officer of HL Advisors. Ms. Pernerewski joined The Hartford in 2005 from Travelers Life and Annuity where she served as Counsel (2004-2005). Prior to Travelers Life and Annuity, Ms. Pernerewski held the position of Counsel at The Hartford (1998-2004).
Elizabeth L. Schroeder (1966) Vice President since 2010
Ms. Schroeder currently serves as Assistant Vice President of HLIC. Ms. Schroeder joined HLIC in 1991. She is also an Assistant Vice President of HASCO, HIFSCO and HL Advisors.
Martin Swanson (1962) Vice President since 2010
Mr. Swanson is a Vice President of HLIC. Mr. Swanson also serves as Vice President/Marketing for HIFSCO. Prior to joining HLIC in 1998, Mr. Swanson was a Vice President at PaineWebber, Inc.
Jane Wolak (1961) Vice President since 2009
Ms. Wolak currently serves as Senior Vice President of HLIC. Ms. Wolak joined HLIC as Vice President, Retail Product Services in May 2007. She is also Vice President of HASCO. Previously, Ms. Wolak was with Sun Life Financial where she held the position of Vice President, Service Center Operations from 2001-2007.
HOW TO OBTAIN A COPY OF THE FUND’S PROXY VOTING POLICIES AND VOTING RECORDS (UNAUDITED)
A description of the policies and procedures that the Fund uses to determine how to vote proxies relating to portfolio securities and a record of how the Fund voted any proxies for the twelve-month period ended June 30, 2011 are available (1) without charge, upon request, by calling 800-862-6668 and (2) on the SEC’s website at http://www.sec.gov.
QUARTERLY PORTFOLIO HOLDINGS INFORMATION (UNAUDITED)
The Fund files a complete schedule of portfolio holdings with the SEC for the first and third quarters of each fiscal year on Form N-Q. The Fund’s Forms are available (1) without charge, upon request, by calling 800-862-6668 and (2) on the SEC’s website at http://www.sec.gov. The Form N-Q may be reviewed and copied at the SEC’s Public Reference Room in Washington, DC. Information on the operation of the Public Reference Room may be obtained by calling 1-800-SEC-0330.
Hartford Portfolio Diversifier HLS Fund
Expense Example (Unaudited)
Your Fund's Expenses
As a shareholder of the Fund, you incur two types of costs: (1) transaction costs and (2) ongoing costs including investment management fees, distribution fees, and other fund expenses. This example is intended to help you understand your ongoing costs (in dollars) of investing in the Fund and to compare these costs with the ongoing costs of investing in other mutual funds. The example is based on an investment of $1,000 invested at the beginning of the period and held for the period of June 30, 2011 through December 31, 2011.
Actual Expenses
The first set of columns of the table below provides information about actual account values and actual expenses. You may use the information in this column, together with the amount you invested, to estimate the expenses that you paid over the period. Simply divide your account value by $1,000 (for example, an $8,600 account value divided by $1,000 = 8.6), then multiply the result by the number in the line under the heading entitled “Expenses Paid During Period” to estimate the expenses you paid on your account during this period.
Hypothetical Example for Comparison Purposes
The second set of columns of the table below provides information about hypothetical account values and hypothetical expenses based on the Fund’s actual expense ratio and an assumed rate of return of 5% per year before expenses, which is not the Fund’s actual return. The hypothetical account values and expenses may not be used to estimate the actual ending account balance or expenses you paid for the period. You may use this information to compare the ongoing costs of investing in the Fund and other funds. To do so, compare this 5% hypothetical example with the 5% hypothetical examples that appear in the shareholder reports of the other funds.
Please note that the expenses shown in the table are meant to highlight your ongoing costs only and do not reflect any transactional costs, such as sales charges (loads) and CDSC. Therefore, the second set of columns of the table is useful in comparing ongoing costs only, and will not help you determine the relative total costs of owning different funds. In addition, if these transactional costs were included, your costs would be higher. Expenses are equal to the Fund's annualized expense ratios multiplied by average account value over the period, multiplied by 184/365 (to reflect the one-half year period).
| | Actual return | Hypothetical (5% return before expenses) | | | |
| | Beginning
Account Value
June 30, 2011 | Ending Account Value
December 31, 2011 | Expenses paid during the period
June 30, 2011
through
December 31, 2011 | Beginning
Account Value
June 30, 2011 | Ending Account Value
December 31, 2011 | Expenses paid during the period
June 30, 2011
through
December 31, 2011 | Annualized expense ratio | Days in the current 1/2 year | Days in the full year |
| Class IB | $1,000.00 | $1,045.25 | $4.38 | $1,000.00 | $1,020.92 | $4.33 | 0.85% | 184 | 365 |
| | | | | | | | | | |
The Hartford
P.O. Box 5085
Hartford, CT 06102-5085
Hartford Series Fund, Inc. is underwritten and distributed by Hartford Securities Distribution Company, Inc.
"The Hartford" is The Hartford Financial Services Group, Inc. and its subsidiaries.
Hartford Series Fund, Inc. inception dates range from 1977 to date. Hartford Series Fund, Inc. is not a subsidiary of The Hartford but is underwritten, distributed by and advised by subsidiaries of The Hartford. Investments in Hartford Series Fund, Inc. are not guaranteed by The Hartford or any other entity.
You should carefully consider investment objectives, risks, and charges and expenses of Hartford HLS Funds before investing. This and other information can be found in the Fund’s prospectus or summary prospectus, which can be obtained by calling 800-862-6668. Please read them carefully before you invest or send money.
HLSAR-PD11 2-12 109078 Printed in U.S.A ©2011 The Hartford, Hartford, CT 06115 | |
A MESSAGE FROM THE PRESIDENT
Dear Fellow Shareholders:
I want to take this opportunity to say thank you for investing in Hartford HLS Funds.
This has been a tumultuous year. In the beginning of 2011, we witnessed tension-fueled political uprisings in the already-volatile Middle East and North Africa region. We also watched as Japan dealt with a series of crises including a massive earthquake and subsequent tsunami. Yet, U.S. economic conditions continued to improve, with gains in consumer confidence and retail sales. During the first half of 2011, domestic, international, and world indices (as measured by the S&P 500, MSCI EAFE and MSCI World) were all up more than 5% through June, 30 2011.
The economic recovery, however, lost momentum in the second half of 2011. The employment and housing markets both remain extremely challenged. Investors continue to be concerned about the implications of the European sovereign debt crisis, as well as our own high levels of domestic debt. Fears that the European sovereign debt crisis could continue to drag down the global economy have weighed heavily on stocks.
Ongoing apprehension regarding the U.S. debt ceiling during the summer and the resulting downgrade of the U.S. sovereign credit rating by Standard & Poor’s also contributed to weaker investor confidence.
There are, however, some reasons to remain confident. Corporations have record levels of cash on their balance sheets—corporate cash has doubled in the past 10 years. In addition, U.S. gross domestic product expanded at a 2.5 percent annual rate in the third quarter according to the Commerce Department, as consumers and businesses set aside fears about the recovery and stepped up spending. Corporate earnings have also remained positive, with a majority of companies beating expectations each quarter this year. This momentum will hopefully continue into next year.
As we head into 2012, in light of the continued market volatility, now would be a good time to schedule a meeting with your financial advisor to examine your current investment strategy and determine whether you are on the right track.
| • | Does your fixed-income portfolio complement your equity portfolio? |
| • | Are you receiving diversified sources of income? |
| • | Is your portfolio still in line with your risk tolerance and investment time horizon? |
Talk to your advisor to see what changes you should make to address these concerns and opportunities.
Thank you again for investing with Hartford HLS Funds.
James Davey
President
Hartford HLS Funds
Hartford Small Company HLS Fund
Table of Contents
This report is prepared for the general information of contract owners and qualified retirement plan participants. It is not an offer of contracts or of qualified retirement plans. It should not be used in connection with any offer, except in conjunction with the appropriate product prospectus which contains all pertinent information including the applicable sales, administrative and other charges.
The views expressed in the Fund’s Manager Discussion under ‘‘Why did the Fund perform this way?’’ and ‘‘What is the outlook?’’ are views of the Fund’s sub-adviser and portfolio management team through the end of the period and are subject to change based on market and other conditions.
Hartford Small Company HLS Fund inception 08/09/1996
| (sub-advised by Wellington Management Company, LLP) | Investment objective – Seeks growth of capital. |

Average Annual Total Returns (as of 12/31/11)
| | 1 Year | 5 Year | 10 Year |
| Small Company IA | -3.36% | 1.02% | 5.92% |
| Small Company IB | -3.62% | 0.78% | 5.66% |
| Russell 2000 Growth Index | -2.91% | 2.09% | 4.48% |
PAST PERFORMANCE IS NOT INDICATIVE OF FUTURE RESULTS.
Total returns presented above were calculated using the Fund's net asset value available to shareholders for sale or redemption of Fund shares on December 31, 2011, which may exclude investment transactions as of this date.
Russell 2000 Growth Index is an unmanaged index of those Russell 2000 Index growth companies with higher price-to-book ratios and higher forecasted growth values. (The Russell 2000 Index is a broad-based unmanaged index comprised of 2,000 of the smallest U.S.-domiciled company common stocks (on the basis of capitalization) that are traded in the United States on the New York Stock Exchange, American Stock Exchange and Nasdaq.)
You cannot invest directly in an index.
The chart represents a hypothetical investment in the Fund. Performance data represents past performance and current performance could be higher or lower.
Performance information may reflect historical or current expense waivers/reimbursements from the investment adviser, without which performance would have been lower. For information on current expense waivers/reimbursements, please see the prospectus.
The value of the Fund will fluctuate so that when redeemed, it may be worth more or less than the original investment. The chart and table do not reflect the deductions of taxes, sales charges or other fees which may be applied at the variable life insurance, variable annuity or qualified retirement plan product level. Any such additional sales charges or other fees or expenses would lower the contract’s or plan’s performance.
Hartford Small Company HLS Fund
Manager Discussion (Unaudited)
December 31, 2011
| Portfolio Managers | | |
| Steven C. Angeli, CFA | Stephen C. Mortimer | Jamie A. Rome, CFA |
| Senior Vice President | Senior Vice President | Senior Vice President |
| | | |
| Mario E. Abularach, CFA | Mammen Chally, CFA | |
| Vice President and Equity Research Analyst | Vice President | |
| | | |
How did the Fund perform?
The Class IA shares of the Hartford Small Company HLS Fund returned -3.36% for the twelve-month period ended December 31, 2011, underperforming its benchmark, the Russell 2000 Growth Index which returned -2.91% for the same period. The Fund also underperformed the -2.82% return of the average fund in the Lipper Small Cap Growth VP-UF Funds peer group, a group of funds with investment strategies similar to those of the Fund.
Why did the Fund perform this way?
The twelve-month period ended December 31, 2011 was yet another extremely volatile period for equity markets. Global equities started the year on a strong note and continued to march higher in the first quarter of 2011, driven by investors’ enthusiasm for additional government debt purchases by the U.S. Federal Reserve, the extension of tax cuts in the U.S., strong earnings growth, and generally improving economic data. This enthusiasm reversed later in the period, however, as concerns surfaced that the global economy could slip back into recession, resulting in a rapid decline in equity markets. Fears about sovereign debt and solvency in the eurozone, slowing economic expansion in China, and uncertainty about the sustainability of corporate earnings growth combined to produce an extremely volatile stock market, and return correlations among stocks spiked as investors shed risk and fled to safety. Markets ended the year on a positive note in the final month of the period with encouraging employment and manufacturing data in the U.S.
In this environment, small-cap and mid-cap stocks underperformed the large-cap stocks over the twelve-month period, as measured by the Russell 2000 (-4%), S&P MidCap 400 (-2%) and S&P 500 (+2%) indices, respectively. Seven out of ten sectors within the Russell 2000 Growth Index posted negative returns during the period. Materials (-16%), Energy (-6%), and Consumer Discretionary (-5%) posted the largest losses while Consumer Staples (+13%) posted the largest gain.
The Fund underperformed its benchmark during the period due to weak stock selection in the Industrials and Information Technology sectors. This was partially offset by strong stock selection in the Health Care sector. Sector allocation, which is the residual result of bottom-up stock selection (i.e. stock by stock fundamental research), was neutral during the period. In particular, an underweight (i.e. the Fund’s sector position was less than the benchmark position) to Materials was additive to relative performance and underweights to Energy and Financials detracted from relative performance.
Stocks that detracted the most from benchmark-relative and absolute (i.e. total return) performance returns during the period were Shutterfly (Consumer Discretionary), Meritor (Industrials), and James River Coal (Energy). Shares of Shutterfly, a web-based photo publication service company, declined due to lower earnings expectations that resulted from price pressure. The firm was also impacted by an ill-timed third quarter market test of the Tiny Prints product line that resulted in significant lost revenues. Drivetrain mobility and braking solutions provider Meritor saw share price weakness, despite beating consensus estimates during the fourth quarter, primarily due to lowered European earnings guidance and continued net operating losses from their U.S. sales. Thermal and coal producer James River Coal saw its share price decline due to lower production, higher costs, and macroeconomic concerns.
Top contributors to relative performance during the period included Green Mountain Coffee (Consumer Staples), Ulta Salon Cosmetics (Consumer Discretionary), and WellCare Health Plan (Health Care). The share price of Green Mountain Coffee, the leading provider of single-cup brewers and portion packs for coffee and other beverages, rose sharply during the period. The company enjoys a dominant position in the market with its Keurig single-cup coffee maker and announced new relationships with Starbucks and Dunkin Donuts. Specialty cosmetics, skin, and hair care retailer, Ulta Salon Cosmetics’ shares performed well as the beauty industry remained healthy and the firm benefitted from market share gains and margin expansion from fixed store cost leverage. WellCare Health Plan, a U.S.-based HMO providing services to government-sponsored health care programs, topped earnings and guidance expectations as lower medical costs helped improve margins. Pharmasset (Health Care) was among the top contributors to absolute performance.
Hartford Small Company HLS Fund
Manager Discussion (Unaudited) – (continued)
December 31, 2011
What is the outlook?
Macro concerns were once again top of mind in 2011 leading to a market that was driven by investors' search for safety. Looking forward, we believe that our security selection process, with its focus on fundamentals, can highlight securities that offer a compelling combination of strong fundamentals and attractive valuations. While we continue to evaluate companies' future earnings and cash flows under a variety of scenarios, we are relatively constructive on the macro backdrop that we believe will unfold this year.
During the fourth quarter the most notable shift in the Fund’s positioning was an increase in our Consumer Discretionary overweight (i.e. the Fund’s sector position was greater than the benchmark position) relative to the benchmark. We reduced our exposure in Industrials and Consumer Staples. As always, sector weights, as well as other characteristics of the Fund, are an outcome of the decisions made on a bottom-up, stock-by-stock basis. At the end of the period, we were most overweight the Consumer Discretionary and Information Technology sectors, and were most underweight the Industrials and Consumer Staples sectors.
Diversification by Industry
as of December 31, 2011
| Industry (Sector) | | Percentage of
Net Assets | |
| Automobiles & Components (Consumer Discretionary) | | | 1.8 | % |
| Banks (Financials) | | | 3.3 | |
| Capital Goods (Industrials) | | | 9.7 | |
| Commercial & Professional Services (Industrials) | | | 2.0 | |
| Consumer Durables & Apparel (Consumer Discretionary) | | | 5.0 | |
| Consumer Services (Consumer Discretionary) | | | 2.1 | |
| Diversified Financials (Financials) | | | 2.1 | |
| Energy (Energy) | | | 7.8 | |
| Food, Beverage & Tobacco (Consumer Staples) | | | 1.5 | |
| Health Care Equipment & Services (Health Care) | | | 10.2 | |
| Household & Personal Products (Consumer Staples) | | | 1.5 | |
| Insurance (Financials) | | | 0.5 | |
| Materials (Materials) | | | 3.0 | |
| Media (Consumer Discretionary) | | | 0.9 | |
| Other Investment Pools and Funds (Financials) | | | 0.2 | |
| Pharmaceuticals, Biotechnology & Life Sciences (Health Care) | | | 8.6 | |
| Real Estate (Financials) | | | 1.4 | |
| Retailing (Consumer Discretionary) | | | 8.0 | |
| Semiconductors & Semiconductor Equipment (Information Technology) | | | 3.8 | |
| Software & Services (Information Technology) | | | 15.3 | |
| Technology Hardware & Equipment (Information Technology) | | | 5.7 | |
| Telecommunication Services (Services) | | | 0.3 | |
| Transportation (Industrials) | | | 2.9 | |
| Utilities (Utilities) | | | 0.6 | |
| Short-Term Investments | | | 1.5 | |
| Other Assets and Liabilities | | | 0.3 | |
| Total | | | 100.0 | % |
Hartford Small Company HLS Fund
Schedule of Investments
December 31, 2011
(000’s Omitted)
| Shares or Principal Amount | | Market Value ╪ | |
| COMMON STOCKS - 97.9% | | | | |
| | | | | Automobiles & Components - 1.8% | | | | |
| | 143 | | | Amerigon, Inc. ● | | $ | 2,043 | |
| | 644 | | | Dana Holding Corp. ● | | | 7,828 | |
| | 351 | | | Tenneco Automotive, Inc. ● | | | 10,450 | |
| | 55 | | | Tesla Motors, Inc. ● | | | 1,572 | |
| | | | | | | | 21,893 | |
| | | | | Banks - 3.3% | | | | |
| | 276 | | | Boston Private Financial Holdings, Inc. | | | 2,190 | |
| | 275 | | | East West Bancorp, Inc. | | | 5,431 | |
| | 109 | | | First Midwest Bancorp, Inc. | | | 1,100 | |
| | 224 | | | Flushing Financial Corp. | | | 2,834 | |
| | 67 | | | Hudson Valley Holding Corp. | | | 1,430 | |
| | 99 | | | Northwest Bancshares, Inc. | | | 1,236 | |
| | 178 | | | Ocwen Financial Corp. ● | | | 2,582 | |
| | 300 | | | Pinnacle Financial Partners, Inc. ● | | | 4,851 | |
| | 198 | | | Signature Bank ● | | | 11,886 | |
| | 184 | | | Umpqua Holdings Corp. | | | 2,277 | |
| | 644 | | | Western Alliance Bancorp ● | | | 4,013 | |
| | 43 | | | Wintrust Financial Corp. | | | 1,203 | |
| | | | | | | | 41,033 | |
| | | | | Capital Goods - 9.7% | | | | |
| | 61 | | | A.O. Smith Corp. | | | 2,459 | |
| | 56 | | | Aaon, Inc. | | | 1,143 | |
| | 53 | | | Acuity Brands, Inc. | | | 2,817 | |
| | 25 | | | AGCO Corp. ● | | | 1,057 | |
| | 155 | | | Altra Holdings, Inc. ● | | | 2,910 | |
| | 116 | | | Applied Industrial Technologies, Inc. | | | 4,076 | |
| | 53 | | | AZZ, Inc. | | | 2,409 | |
| | 35 | | | Carlisle Cos., Inc. | | | 1,529 | |
| | 89 | | | Ceradyne, Inc. ● | | | 2,388 | |
| | 75 | | | Chart Industries, Inc. ● | | | 4,050 | |
| | 119 | | | Colfax Corp. ● | | | 3,388 | |
| | 115 | | | Commercial Vehicles Group, Inc. ● | | | 1,041 | |
| | 31 | | | Crane Co. | | | 1,451 | |
| | 484 | | | DigitalGlobe, Inc. ● | | | 8,288 | |
| | 52 | | | EMCOR Group, Inc. | | | 1,392 | |
| | 114 | | | Esterline Technologies Corp. ● | | | 6,374 | |
| | 60 | | | Franklin Electric Co., Inc. | | | 2,622 | |
| | 119 | | | GrafTech International Ltd. ● | | | 1,621 | |
| | 246 | | | Kratos Defense & Security ● | | | 1,466 | |
| | 45 | | | Lennox International, Inc. | | | 1,522 | |
| | 23 | | | Lindsay Corp. | | | 1,265 | |
| | 790 | | | Meritor, Inc. ● | | | 4,205 | |
| | 64 | | | Michael Baker Corp. ● | | | 1,257 | |
| | 36 | | | Middleby Corp. ● | | | 3,357 | |
| | 229 | | | Moog, Inc. Class A ● | | | 10,058 | |
| | 84 | | | Nordson Corp. | | | 3,479 | |
| | 283 | | | Owens Corning, Inc. ● | | | 8,114 | |
| | 59 | | | Polypore International, Inc. ● | | | 2,595 | |
| | 70 | | | Sun Hydraulics Corp. | | | 1,646 | |
| | 48 | | | TAL International Group, Inc. | | | 1,385 | |
| | 120 | | | Teledyne Technologies, Inc. ● | | | 6,587 | |
| | 54 | | | Textainer Group Holdings Ltd. | | | 1,570 | |
| | 31 | | | TransDigm Group, Inc. ● | | | 2,954 | |
| | 193 | | | Trex Co., Inc. ● | | | 4,431 | |
| | 137 | | | Trimas Corp. ● | | | 2,463 | |
| | 328 | | | United Rentals, Inc. ● | | | 9,701 | |
| | 213 | | | Wabash National Corp. ● | | | 1,670 | |
| | | | | | | | 120,740 | |
| | | | | Commercial & Professional Services - 2.0% | | | | |
| | 12 | | | Advisory Board Co. ● | | | 885 | |
| | 269 | | | Corrections Corp. of America ● | | | 5,474 | |
| | 82 | | | Deluxe Corp. | | | 1,869 | |
| | 75 | | | Exponent, Inc. ● | | | 3,429 | |
| | 165 | | | Geo Group, Inc. ● | | | 2,765 | |
| | 592 | | | Sykes Enterprises, Inc. ● | | | 9,276 | |
| | 43 | | | United Stationers, Inc. | | | 1,411 | |
| | | | | | | | 25,109 | |
| | | | | Consumer Durables & Apparel - 4.9% | | | | |
| | 608 | | | Brunswick Corp. | | | 10,977 | |
| | 83 | | | Columbia Sportswear Co. | | | 3,846 | |
| | 103 | | | Deckers Outdoor Corp. ● | | | 7,797 | |
| | 333 | | | Hanesbrands, Inc. ● | | | 7,286 | |
| | 9 | | | NVR, Inc. ● | | | 6,114 | |
| | 46 | | | Polaris Industries, Inc. | | | 2,547 | |
| | 656 | | | Pulte Group, Inc. ● | | | 4,143 | |
| | 99 | | | Skechers USA, Inc. Class A ● | | | 1,194 | |
| | 196 | | | Steven Madden Ltd. ● | | | 6,761 | |
| | 163 | | | Tempur-Pedic International, Inc. ● | | | 8,551 | |
| | 50 | | | Warnaco Group, Inc. ● | | | 2,485 | |
| | | | | | | | 61,701 | |
| | | | | Consumer Services - 2.1% | | | | |
| | 58 | | | American Public Education, Inc. ● | | | 2,493 | |
| | 17 | | | Buffalo Wild Wings, Inc. ● | | | 1,175 | |
| | 376 | | | Cheesecake Factory, Inc. ● | | | 11,032 | |
| | 194 | | | Estacio Participacoes S.A. | | | 1,875 | |
| | 54 | | | Gaylord Entertainment Co. w/ Rights ● | | | 1,308 | |
| | 71 | | | Regis Corp. | | | 1,182 | |
| | 28 | | | Steiner Leisure Ltd. ● | | | 1,271 | |
| | 88 | | | Weight Watchers International, Inc. | | | 4,825 | |
| | 112 | | | Whistler Blackcomb Holdings, Inc. | | | 1,174 | |
| | | | | | | | 26,335 | |
| | | | | Diversified Financials - 2.1% | | | | |
| | 223 | | | BGC Partners, Inc. | | | 1,323 | |
| | 123 | | | Compass Diversified Holdings | | | 1,523 | |
| | 213 | | | DFC Global Corp. ● | | | 3,840 | |
| | 131 | | | Fifth Street Finance Corp. | | | 1,250 | |
| | 230 | | | Gain Capital Holdings, Inc. | | | 1,541 | |
| | 414 | | | Justice Holdings Ltd. ● | | | 5,528 | |
| | 469 | | | Knight Capital Group, Inc. ● | | | 5,542 | |
| | 250 | | | Manning & Napier, Inc. ● | | | 3,125 | |
| | 211 | | | Netspend Holdings, Inc. ● | | | 1,710 | |
| | 168 | | | Uranium Participation Corp. ● | | | 927 | |
| | | | | | | | 26,309 | |
| | | | | Energy - 7.8% | | | | |
| | 2,328 | | | Alberta Oilsands, Inc. ● | | | 423 | |
| | 43 | | | Approach Resources, Inc. ● | | | 1,273 | |
| | 202 | | | Atwood Oceanics, Inc. ● | | | 8,036 | |
| | 104 | | | Berry Petroleum Co. | | | 4,386 | |
| | 353 | | | BPZ Resources, Inc. ● | | | 1,004 | |
| | 152 | | | C&J Energy Services, Inc. ● | | | 3,181 | |
| | 243 | | | Carrizo Oil & Gas, Inc. ● | | | 6,397 | |
| | 17 | | | Clayton Williams Energy, Inc. ● | | | 1,282 | |
| | 56 | | | Complete Production Services, Inc. ● | | | 1,873 | |
| | 124 | | | CVR Energy, Inc. ● | | | 2,319 | |
| | 306 | | | Gulfmark Offshore, Inc. ● | | | 12,836 | |
| | 283 | | | Hornbeck Offshore Services, Inc. ● | | | 8,792 | |
| | 936 | | | ION Geophysical Corp. ● | | | 5,740 | |
| | 59 | | | James River Coal Co. ● | | | 410 | |
The accompanying notes are an integral part of these financial statements.
Hartford Small Company HLS Fund
Schedule of Investments – (continued)
December 31, 2011
(000’s Omitted)
| Shares or Principal Amount | | Market Value ╪ | |
| COMMON STOCKS - 97.9% - (continued) | | | | |
| | | | | Energy - 7.8% - (continued) | | | | |
| | 257 | | | Karoon Gas Australia Ltd. ● | | $ | 1,182 | |
| | 61 | | | Northern Oil and Gas, Inc. ● | | | 1,463 | |
| | 3,035 | | | Oilsands Quest, Inc. ⌂●† | | | 435 | |
| | 97 | | | Petroleum Development Corp. ● | | | 3,421 | |
| | 335 | | | Rosetta Resources, Inc. ● | | | 14,586 | |
| | 42 | | | Swift Energy Co. ● | | | 1,242 | |
| | 166 | | | Tidewater, Inc. | | | 8,185 | |
| | 280 | | | Vaalco Energy, Inc. ● | | | 1,691 | |
| | 139 | | | Whiting Petroleum Corp. ● | | | 6,511 | |
| | | | | | | | 96,668 | |
| | | | | Food, Beverage & Tobacco - 1.5% | | | | |
| | 20 | | | Boston Beer Co., Inc. Class A ● | | | 2,209 | |
| | 94 | | | Cosan S.A. Industria E Comercio | | | 1,358 | |
| | 276 | | | Darling International, Inc. ● | | | 3,662 | |
| | 203 | | | Diamond Foods, Inc. | | | 6,538 | |
| | 164 | | | GrainCorp Ltd. | | | 1,309 | |
| | 63 | | | Green Mountain Coffee Roasters, Inc. ● | | | 2,816 | |
| | 121 | | | Viterra, Inc. | | | 1,272 | |
| | | | | | | | 19,164 | |
| | | | | Health Care Equipment & Services - 10.2% | | | | |
| | 391 | | | Abiomed, Inc. ● | | | 7,223 | |
| | 418 | | | Allscripts Healthcare Solutions, Inc. ● | | | 7,912 | |
| | 45 | | | AmSurg Corp. ● | | | 1,174 | |
| | 184 | | | Angiodynamics, Inc. ● | | | 2,718 | |
| | 5 | | | Atrion Corp. | | | 1,081 | |
| | 148 | | | Catalyst Health Solutions ● | | | 7,671 | |
| | 54 | | | Corvel Corp. ● | | | 2,792 | |
| | 89 | | | Cyberonics, Inc. ● | | | 2,970 | |
| | 236 | | | Dexcom, Inc. ● | | | 2,195 | |
| | 46 | | | Ensign Group, Inc. | | | 1,120 | |
| | 182 | | | Gen-Probe, Inc. ● | | | 10,749 | |
| | 57 | | | Greatbatch, Inc. ● | | | 1,262 | |
| | 61 | | | Hanger Orthopedic Group, Inc. ● | | | 1,136 | |
| | 191 | | | Health Net, Inc. ● | | | 5,799 | |
| | 81 | | | HealthSouth Corp. ● | | | 1,432 | |
| | 18 | | | Healthspring, Inc. ● | | | 966 | |
| | 132 | | | Heartware International, Inc. ● | | | 9,077 | |
| | 33 | | | ICU Medical, Inc. ● | | | 1,476 | |
| | 286 | | | Insulet Corp. ● | | | 5,387 | |
| | 71 | | | LHC Group, Inc. ● | | | 912 | |
| | 104 | | | Masimo Corp. ● | | | 1,934 | |
| | 18 | | | MEDNAX, Inc. ● | | | 1,325 | |
| | 74 | | | Merge Healthcare, Inc. ● | | | 359 | |
| | 132 | | | NuVasive, Inc. ● | | | 1,662 | |
| | 128 | | | Owens & Minor, Inc. | | | 3,566 | |
| | 249 | | | SXC Health Solutions Corp. ● | | | 14,056 | |
| | 90 | | | U.S. Physical Therapy, Inc. | | | 1,767 | |
| | 166 | | | Volcano Corp. ● | | | 3,954 | |
| | 201 | | | Wellcare Health Plans, Inc. ● | | | 10,575 | |
| | 206 | | | Zoll Medical Corp. ● | | | 13,005 | |
| | | | | | | | 127,255 | |
| | | | | Household & Personal Products - 1.5% | | | | |
| | 321 | | | Elizabeth Arden, Inc. ● | | | 11,886 | |
| | 135 | | | Nu Skin Enterprises, Inc. Class A | | | 6,569 | |
| | | | | | | | 18,455 | |
| | | | | Insurance - 0.5% | | | | |
| | 36 | | | Allied World Assurance Holdings Ltd. | | | 2,284 | |
| | 114 | | | Amerisafe, Inc. ● | | | 2,660 | |
| | 39 | | | Platinum Underwriters Holdings Ltd. | | | 1,344 | |
| | | | | | | | 6,288 | |
| | | | | Materials - 3.0% | | | | |
| | 30 | | | Allied Nevada Gold Corp. ● | | | 914 | |
| | 24 | | | AptarGroup, Inc. | | | 1,242 | |
| | 2,015 | | | Aurcana Corp. ● | | | 1,404 | |
| | 235 | | | Detour Gold Corp. ● | | | 5,794 | |
| | 108 | | | Georgia Gulf Corp. ● | | | 2,095 | |
| | 82 | | | Kraton Performance Polymers ● | | | 1,663 | |
| | 381 | | | Methanex Corp. ADR | | | 8,685 | |
| | 33 | | | Molycorp, Inc. ● | | | 794 | |
| | 92 | | | New Gold, Inc. ● | | | 930 | |
| | 137 | | | Olin Corp. | | | 2,693 | |
| | 952 | | | Romarco Minerals, Inc. ● | | | 1,009 | |
| | 141 | | | Silgan Holdings, Inc. | | | 5,444 | |
| | 138 | | | Stillwater Mining Co. ● | | | 1,447 | |
| | 46 | | | TPC Group, Inc. ● | | | 1,078 | |
| | 34 | | | Universal Stainless & Alloy Products ● | | | 1,274 | |
| | 104 | | | Winpak Ltd. | | | 1,224 | |
| | | | | | | | 37,690 | |
| | | | | Media - 0.9% | | | | |
| | 283 | | | AMC Networks, Inc. ● | | | 10,652 | |
| | | | | | | | | |
| | | | | Pharmaceuticals, Biotechnology & Life Sciences - 8.6% | | | | |
| | 236 | | | Alkermes plc ● | | | 4,089 | |
| | 284 | | | Ardea Biosciences, Inc. ● | | | 4,776 | |
| | 732 | | | Arena Pharmaceuticals, Inc. ● | | | 1,368 | |
| | 100 | | | Aveo Pharmaceuticals, Inc. ● | | | 1,718 | |
| | 166 | | | Bruker Corp. ● | | | 2,057 | |
| | 303 | | | Cadence Pharmaceuticals, Inc. ● | | | 1,196 | |
| | 117 | | | Cubist Pharmaceuticals, Inc. ● | | | 4,650 | |
| | 770 | | | Exelixis, Inc. ● | | | 3,648 | |
| | 556 | | | Immunogen, Inc. ● | | | 6,444 | |
| | 625 | | | Incyte Corp. ● | | | 9,376 | |
| | 619 | | | Ironwood Pharmaceuticals, Inc. ● | | | 7,412 | |
| | 297 | | | Medicines Co. ● | | | 5,529 | |
| | 68 | | | Momenta Pharmaceuticals, Inc. ● | | | 1,183 | |
| | 394 | | | NPS Pharmaceuticals, Inc. ● | | | 2,594 | |
| | 278 | | | Onyx Pharmaceuticals, Inc. ● | | | 12,239 | |
| | 145 | | | Optimer Pharmaceuticals, Inc. ● | | | 1,776 | |
| | 439 | | | PAREXEL International Corp. ● | | | 9,108 | |
| | 452 | | | Rigel Pharmaceuticals, Inc. ● | | | 3,569 | |
| | 313 | | | Salix Pharmaceuticals Ltd. ● | | | 14,975 | |
| | 493 | | | Seattle Genetics, Inc. ● | | | 8,239 | |
| | 36 | | | United Therapeutics Corp. ● | | | 1,701 | |
| | | | | | | | 107,647 | |
| | | | | Real Estate - 1.4% | | | | |
| | 144 | | | Anworth Mortgage Asset Corp. | | | 904 | |
| | 82 | | | Capstead Mortgage Corp. | | | 1,025 | |
| | 106 | | | Colonial Properties Trust | | | 2,207 | |
| | 371 | | | Coresite Realty Corp. | | | 6,604 | |
| | 39 | | | Hatteras Financial Corp. | | | 1,023 | |
| | 116 | | | Medical Properties Trust, Inc. | | | 1,148 | |
| | 376 | | | MFA Mortgage Investments, Inc. | | | 2,526 | |
| | 104 | | | Summit Hotel Properties, Inc. | | | 985 | |
| | 110 | | | Whitestone REIT | | | 1,305 | |
| | | | | | | | 17,727 | |
| | | | | Retailing - 8.0% | | | | |
| | 5,016 | | | Allstar Co. ⌂† | | | 5,195 | |
The accompanying notes are an integral part of these financial statements.
| Shares or Principal Amount | | Market Value ╪ | |
| COMMON STOCKS - 97.9% - (continued) | | | | |
| | | | | Retailing - 8.0% - (continued) | | | | |
| | 48 | | | Ascena Retail Group, Inc. ● | | $ | 1,414 | |
| | 60 | | | Cato Corp. | | | 1,440 | |
| | 191 | | | Children's Place Retail Stores, Inc. ● | | | 10,129 | |
| | 99 | | | Core-Mark Holding Co., Inc. | | | 3,902 | |
| | 1,149 | | | Debenhams plc | | | 1,043 | |
| | 245 | | | DSW, Inc. | | | 10,816 | |
| | 445 | | | Express, Inc. ● | | | 8,883 | |
| | 566 | | | GNC Holdings, Inc. ● | | | 16,382 | |
| | 41 | | | Guess?, Inc. | | | 1,220 | |
| | 164 | | | Hot Topic, Inc. | | | 1,083 | |
| | 77 | | | Mattress Firm Holding Corp. ● | | | 1,781 | |
| | 116 | | | PetMed Express, Inc. | | | 1,203 | |
| | 213 | | | Rent-A-Center, Inc. | | | 7,886 | |
| | 413 | | | rue21, Inc. ● | | | 8,910 | |
| | 507 | | | Shutterfly, Inc. ● | | | 11,532 | |
| | 102 | | | Teavana Holdings, Inc. ● | | | 1,912 | |
| | 17 | | | Ulta Salon, Cosmetics & Fragrances, Inc. ● | | | 1,109 | |
| | 107 | | | Vitamin Shoppe, Inc. ● | | | 4,280 | |
| | | | | | | | 100,120 | |
| | | | | Semiconductors & Semiconductor Equipment - 3.8% | | | | |
| | 116 | | | Applied Micro Circuits Corp. ● | | | 778 | |
| | 120 | | | Cavium, Inc. ● | | | 3,413 | |
| | 108 | | | Cymer, Inc. ● | | | 5,386 | |
| | 393 | | | Cypress Semiconductor Corp. | | | 6,636 | |
| | 321 | | | GT Advanced Technologies, Inc. ● | | | 2,326 | |
| | 302 | | | Integrated Device Technology, Inc. ● | | | 1,647 | |
| | 816 | | | Lattice Semiconductor Corp. ● | | | 4,845 | |
| | 83 | | | Microsemi Corp. ● | | | 1,390 | |
| | 455 | | | Mindspeed Technologies, Inc. ● | | | 2,085 | |
| | 144 | | | Nanometrics, Inc. ● | | | 2,657 | |
| | 160 | | | ON Semiconductor Corp. ● | | | 1,235 | |
| | 210 | | | PMC - Sierra, Inc. ● | | | 1,155 | |
| | 264 | | | Silicon Image, Inc. ● | | | 1,242 | |
| | 596 | | | Skyworks Solutions, Inc. ● | | | 9,671 | |
| | 103 | | | Ultratech Stepper, Inc. ● | | | 2,538 | |
| | | | | | | | 47,004 | |
| | | | | Software & Services - 15.3% | | | | |
| | 103 | | | Ancestry.com, Inc. ● | | | 2,372 | |
| | 190 | | | Ariba, Inc. ● | | | 5,342 | |
| | 221 | | | Broadsoft, Inc. ● | | | 6,682 | |
| | 1,618 | | | Cadence Design Systems, Inc. ● | | | 16,829 | |
| | 77 | | | Commvault Systems, Inc. w/ Rights ● | | | 3,297 | |
| | 194 | | | Concur Technologies, Inc. ● | | | 9,832 | |
| | 156 | | | Constant Contact, Inc. ● | | | 3,618 | |
| | 145 | | | DealerTrack Holdings, Inc. ● | | | 3,943 | |
| | 221 | | | Dice Holdings, Inc. ● | | | 1,830 | |
| | 81 | | | Fortinet, Inc. ● | | | 1,775 | |
| | 193 | | | Higher One Holdings, Inc. ● | | | 3,564 | |
| | 315 | | | IAC/Interactive Corp. | | | 13,399 | |
| | 163 | | | j2 Global, Inc. | | | 4,575 | |
| | 155 | | | JDA Software Group, Inc. ● | | | 5,020 | |
| | 192 | | | Jive Software, Inc. ● | | | 3,077 | |
| | 86 | | | Keynote Systems, Inc. | | | 1,762 | |
| | 147 | | | Kit Digital, Inc. ● | | | 1,244 | |
| | 836 | | | LivePerson, Inc. ● | | | 10,494 | |
| | 12 | | | Mercadolibre, Inc. | | | 973 | |
| | 85 | | | MicroStrategy, Inc. ● | | | 9,190 | |
| | 60 | | | Nuance Communications, Inc. ● | | | 1,505 | |
| | 83 | | | Opnet Technologies, Inc. | | | 3,060 | |
| | 399 | | | Parametric Technology Corp. ● | | | 7,280 | |
| | 108 | | | Pegasystems, Inc. | | | 3,174 | |
| | 61 | | | Progress Software Corp. ● | | | 1,185 | |
| | 114 | | | QLIK Technologies, Inc. ● | | | 2,764 | |
| | 153 | | | Quest Software, Inc. ● | | | 2,841 | |
| | 113 | | | RealPage, Inc. ● | | | 2,860 | |
| | 1,415 | | | Sapient Corp. | | | 17,833 | |
| | 140 | | | Solarwinds, Inc. ● | | | 3,910 | |
| | 45 | | | Solera Holdings, Inc. | | | 2,001 | |
| | 70 | | | Sourcefire, Inc. w/ Rights ● | | | 2,263 | |
| | 164 | | | Syntel, Inc. | | | 7,650 | |
| | 52 | | | Tibco Software, Inc. ● | | | 1,251 | |
| | 280 | | | VeriFone Systems, Inc. ● | | | 9,948 | |
| | 207 | | | Wright Express Corp. ● | | | 11,227 | |
| | 169 | | | XO Group, Inc. ● | | | 1,408 | |
| | | | | | | | 190,978 | |
| | | | | Technology Hardware & Equipment - 5.7% | | | | |
| | 116 | | | Arris Group, Inc. ● | | | 1,259 | |
| | 480 | | | Aruba Networks, Inc. ● | | | 8,884 | |
| | 177 | | | Coherent, Inc. ● | | | 9,247 | |
| | 17 | | | Comverse Technology, Inc. ● | | | 119 | |
| | 162 | | | Emulex Corp. ● | | | 1,108 | |
| | 410 | | | Fabrinet ● | | | 5,615 | |
| | 458 | | | Finisar Corp. ● | | | 7,673 | |
| | 55 | | | Interdigital, Inc. | | | 2,393 | |
| | 87 | | | InvenSense, Inc. ● | | | 868 | |
| | 847 | | | Jabil Circuit, Inc. | | | 16,653 | |
| | 379 | | | Mitel Networks Corp. ● | | | 1,206 | |
| | 44 | | | Netgear, Inc. ● | | | 1,480 | |
| | 165 | | | Oplink Communications, Inc. ● | | | 2,719 | |
| | 54 | | | Park Electrochemical Corp. | | | 1,371 | |
| | 87 | | | Plantronics, Inc. | | | 3,098 | |
| | 40 | | | Polycom, Inc. ● | | | 652 | |
| | 173 | | | Universal Display Corp. ● | | | 6,347 | |
| | | | | | | | 70,692 | |
| | | | | Telecommunication Services - 0.3% | | | | |
| | 30 | | | AboveNet, Inc. ● | | | 1,958 | |
| | 146 | | | Leap Wireless International, Inc. w/ Rights ● | | | 1,352 | |
| | | | | | | | 3,310 | |
| | | | | Transportation - 2.9% | | | | |
| | 248 | | | Avis Budget Group, Inc. ● | | | 2,656 | |
| | 185 | | | J.B. Hunt Transport Services, Inc. | | | 8,318 | |
| | 579 | | | JetBlue Airways Corp. ● | | | 3,011 | |
| | 21 | | | Kirby Corp. ● | | | 1,363 | |
| | 384 | | | Localiza Rent a Car S.A. | | | 5,267 | |
| | 66 | | | Marten Transport Ltd. | | | 1,180 | |
| | 173 | | | Old Dominion Freight Line, Inc. ● | | | 6,993 | |
| | 674 | | | US Airways Group, Inc. ● | | | 3,415 | |
| | 151 | | | Werner Enterprises, Inc. | | | 3,650 | |
| | 40 | | | Zipcar, Inc. ● | | | 533 | |
| | | | | | | | 36,386 | |
| | | | | Utilities - 0.6% | | | | |
| | 54 | | | Portland General Electric Co. | | | 1,368 | |
| | 114 | | | UniSource Energy Corp. | | | 4,205 | |
| | 49 | | | Westar Energy, Inc. | | | 1,399 | |
| | | | | | | | 6,972 | |
| | | | | Total common stocks | | | | |
| | | | | (cost $1,192,250) | | $ | 1,220,128 | |
| | | | | | | | | |
The accompanying notes are an integral part of these financial statements.
Hartford Small Company HLS Fund
Schedule of Investments – (continued)
December 31, 2011
(000’s Omitted)
| Shares or Principal Amount | | Market Value ╪ | |
| PREFERRED STOCKS - 0.1% | | | | |
| | | | | Consumer Durables & Apparel - 0.1% | | | | |
| | 15 | | | Callaway Golf Co., 7.50% ۞ | | $ | 1,432 | |
| | | | | | | | | |
| | | | | Total preferred stocks | | | | |
| | | | | (cost $1,698) | | $ | 1,432 | |
| | | | | | | | | |
| EXCHANGE TRADED FUNDS - 0.2% | | | | |
| | | | | Other Investment Pools and Funds - 0.2% | | | | |
| | 35 | | | iShares Russell 2000 Growth Index Fund | | $ | 2,958 | |
| | | | | | | | | |
| | | | | Total exchange traded funds | | | | |
| | | | | (cost $2,849) | | $ | 2,958 | |
| | | | | | | | | |
| | | | | Total long-term investments
(cost $1,196,797) | | $ | 1,224,518 | |
| | | | | | | | | |
| SHORT-TERM INVESTMENTS - 1.5% | | | | |
| | Repurchase Agreements - 1.5% | | | | |
| | | | | Bank of America Merrill Lynch TriParty Joint
Repurchase Agreement (maturing on
01/03/2012 in the amount of $6,942,
collateralized by GNMA 4.50%, 2041,
value of $7,081) | | | | |
| $ | 6,942 | | | 0.04%, 12/30/2011 | | $ | 6,942 | |
| | | | | Barclays Capital TriParty Joint Repurchase
Agreement (maturing on 01/03/2012 in the
amount of $577, collateralized by U.S.
Treasury Bond 5.38%, 2031, value of
$588) | | | | |
| | 577 | | | 0.01%, 12/30/2011 | | | 577 | |
| | | | | Deutsche Bank Securities TriParty Joint
Repurchase Agreement (maturing on
01/03/2012 in the amount of $7,700,
collateralized by GNMA 3.50% - 7.00%,
2035 - 2046, value of $7,854) | | | | |
| | 7,700 | | | 0.06%, 12/30/2011 | | | 7,700 | |
| | | | | UBS Securities, Inc. Joint Repurchase
Agreement (maturing on 01/03/2012 in the
amount of $58, collateralized by U.S.
Treasury Note 2.75%, 2016, value of $60) | | | | |
| | 58 | | | 0.01%, 12/30/2011 | | | 58 | |
| | | | | UBS Securities, Inc. TriParty Joint
Repurchase Agreement (maturing on
01/03/2012 in the amount of $2,980,
collateralized by FNMA 3.00% - 6.50%,
2021 - 2041, value of $3,039) | | | | |
| | 2,980 | | | 0.04%, 12/30/2011 | | | 2,980 | |
| | | | | | | | 18,257 | |
| | | | | Total short-term investments | | | | |
| | | | | (cost $18,257) | | $ | 18,257 | |
| | Total investments | | | | | | | | |
| | (cost $1,215,054) ▲ | | | 99.7 | % | | $ | 1,242,775 | |
| | Other assets and liabilities | | | 0.3 | % | | | 4,078 | |
| | Total net assets | | | 100.0 | % | | $ | 1,246,853 | |
The accompanying notes are an integral part of these financial statements.
| Note: | Percentage of investments as shown is the ratio of the total market value to total net assets. Market value of long-term investments in foreign securities represents 3.6% of total net assets at December 31, 2011. |
| | |
| | Prices of foreign equities that are principally traded on certain foreign markets may be adjusted daily pursuant to a fair value pricing service approved by the Board of Directors in order to reflect an adjustment for factors occurring after the close of certain foreign markets but before the close of the New York Stock Exchange. |
| ▲ | At December 31, 2011, the cost of securities for federal income tax purposes was $1,228,277 and the aggregate gross unrealized appreciation and depreciation based on that cost were: |
| Unrealized Appreciation | | $ | 129,094 | |
| Unrealized Depreciation | | | (114,596 | ) |
| Net Unrealized Appreciation | | $ | 14,498 | |
| † | These securities were valued in good faith at fair value as determined under policies and procedures established by and under the supervision of the Company's Board of Directors. At December 31, 2011, the aggregate value of these securities was $5,630, which represents 0.5% of total net assets. This amount excludes securities that are principally traded in certain foreign markets and whose prices are adjusted pursuant to a third party pricing service methodology approved by the Board of Directors. |
| | |
| ● | Non-income producing.
|
| ⌂ | The following securities are considered illiquid. Illiquid securities are often purchased in private placement transactions, are often not registered under the Securities Act of 1933 and may have contractual restrictions on resale. A security may also be considered illiquid if the security lacks a readily available market or if its valuation has not changed for a certain period of time. |
| | Period Acquired | | Shares/ Par | | Security | | Cost Basis | |
| | 08/2011 | | 5,016 | | Allstar Co. | | $ | 5,107 | |
| | 10/2010 - 05/2011 | | 3,035 | | Oilsands Quest, Inc. | | | 1,362 | |
At December 31, 2011, the aggregate value of these securities was $5,630, which represents 0.5% of total net assets.
| ╪ | See Significant Accounting Policies of accompanying Notes to Financial Statements regarding valuation of securities. |
The accompanying notes are an integral part of these financial statements.
Hartford Small Company HLS Fund
Investment Valuation Hierarchy Level Summary
December 31, 2011
(000’s Omitted)
| | | Total | | | Level 1 ♦ | | | Level 2 ♦ | | | Level 3 | |
| Assets: | | | | | | | | | | | | | | | | |
| Common Stocks ‡ | | $ | 1,220,128 | | | $ | 1,210,964 | | | $ | 3,534 | | | $ | 5,630 | |
| Exchange Traded Funds | | | 2,958 | | | | 2,958 | | | | – | | | | – | |
| Preferred Stocks | | | 1,432 | | | | 1,432 | | | | – | | | | – | |
| Short-Term Investments | | | 18,257 | | | | – | | | | 18,257 | | | | – | |
| Total | | $ | 1,242,775 | | | $ | 1,215,354 | | | $ | 21,791 | | | $ | 5,630 | |
| ♦ | For the year ended December 31, 2011, there were no significant transfers between Level 1 and Level 2. |
| ‡ | The Fund has all or primarily all of the equity securities categorized in a particular level. Refer to the Schedule of Investments for further industry breakout. |
Following is a reconciliation of Level 3 assets for which significant unobservable inputs were used to determine fair value:
| | Balance as of December 31, 2010 | | Realized Gain (Loss) | | Change in Unrealized Appreciation (Depreciation) | | | Net Amortization | | Purchases | | Sales | | Transfers
Into
Level 3 * | | Transfers Out of Level 3 * | | Balance as of December 31, 2011 |
| Assets: | | | | | | | | | | | | | | | | | | | | | | | | | | | |
| Common Stocks | $ | 1,690 | | $ | (60 | ) | $ | (758 | )† | | $ | — | | $ | 5,429 | | $ | (124 | ) | $ | 1,143 | | $ | (1,690 | ) | $ | 5,630 |
| Total | $ | 1,690 | | $ | (60 | ) | $ | (758 | ) | | $ | — | | $ | 5,429 | | $ | (124 | ) | $ | 1,143 | | $ | (1,690 | ) | $ | 5,630 |
| * | Securities are transferred into and out of Level 3 for a variety of reasons including, but not limited to:
1) Securities where trading has been halted (transfer into Level 3) or securities where trading has resumed (transfer out of Level 3).
2) Broker quoted securities (transfer into Level 3) or quoted prices in active markets (transfer out of Level 3).
3) Securities that have certain restrictions on trading (transfer into Level 3) or securities where trading restrictions have expired (transfer out of Level 3). |
| † | Change in unrealized appreciation (depreciation) in the current period relating to assets still held at December 31, 2011 was $(758). |
The accompanying notes are an integral part of these financial statements.
Hartford Small Company HLS Fund
Statement of Assets and Liabilities
December 31, 2011
(000’s Omitted)
| Assets: | | | | |
| Investments in securities, at market value (cost $1,215,054) | | $ | 1,242,775 | |
| Cash | | | 57 | |
| Receivables: | | | | |
| Investment securities sold | | | 9,771 | |
| Fund shares sold | | | 839 | |
| Dividends and interest | | | 528 | |
| Other assets | | | — | |
| Total assets | | | 1,253,970 | |
| Liabilities: | | | | |
| Bank overdraft - foreign cash | | | — | |
| Payables: | | | | |
| Investment securities purchased | | | 6,328 | |
| Fund shares redeemed | | | 513 | |
| Investment management fees | | | 189 | |
| Distribution fees | | | 9 | |
| Accrued expenses | | | 78 | |
| Total liabilities | | | 7,117 | |
| Net assets | | $ | 1,246,853 | |
| Summary of Net Assets: | | | | |
| Capital stock and paid-in-capital | | $ | 1,233,567 | |
| Distributions in excess of net investment loss | | | (67 | ) |
| Accumulated net realized loss | | | (14,370 | ) |
| Unrealized appreciation of investments and the translations of assets and liabilities denominated in foreign currency | | | 27,723 | |
| Net assets | | $ | 1,246,853 | |
| Shares authorized | | | 1,500,000 | |
| Par value | | $ | 0.001 | |
| Class IA: Net asset value per share | | $ | 17.07 | |
| Shares outstanding | | | 63,910 | |
| Net assets | | $ | 1,090,883 | |
| Class IB: Net asset value per share | | $ | 16.56 | |
| Shares outstanding | | | 9,418 | |
| Net assets | | $ | 155,970 | |
The accompanying notes are an integral part of these financial statements.
Hartford Small Company HLS Fund
Statement of Operations
For the Year Ended December 31, 2011
(000’s Omitted)
| Investment Income: | | | | |
| Dividends | | $ | 8,215 | |
| Interest | | | 29 | |
| Less: Foreign tax withheld | | | (104 | ) |
| Total investment income, net | | | 8,140 | |
| | | | | |
| Expenses: | | | | |
| Investment management fees | | | 9,525 | |
| Transfer agent fees | | | 6 | |
| Distribution fees - Class IB | | | 514 | |
| Custodian fees | | | 34 | |
| Accounting services fees | | | 168 | |
| Board of Directors' fees | | | 33 | |
| Audit fees | | | 19 | |
| Other expenses | | | 217 | |
| Total expenses (before fees paid indirectly) | | | 10,516 | |
| Commission recapture | | | (65 | ) |
| Custodian fee offset | | | — | |
| Total fees paid indirectly | | | (65 | ) |
| Total expenses, net | | | 10,451 | |
| Net investment loss | | | (2,311 | ) |
| | | | | |
| Net Realized Gain on Investments and Foreign Currency Transactions: | | | | |
| Net realized gain on investments | | | 196,590 | |
| Net realized loss on foreign currency contracts | | | (169 | ) |
| Net realized gain on other foreign currency transactions | | | 33 | |
| Net Realized Gain on Investments and Foreign Currency Transactions | | | 196,454 | |
| | | | | |
| Net Changes in Unrealized Depreciation of Investments and Foreign Currency Transactions: | | | | |
| Net unrealized depreciation of investments | | | (237,257 | ) |
| Net unrealized appreciation of foreign currency contracts | | | 54 | |
| Net unrealized appreciation on translation of other assets and liabilities in foreign currencies | | | 1 | |
| Net Changes in Unrealized Depreciation of Investments and Foreign Currency Transactions | | | (237,202 | ) |
| Net Loss on Investments and Foreign Currency Transactions | | | (40,748 | ) |
| Net Decrease in Net Assets Resulting from Operations | | $ | (43,059 | ) |
The accompanying notes are an integral part of these financial statements.
Hartford Small Company HLS Fund
Statement of Changes in Net Assets
(000’s Omitted)
| | | For the
Year Ended
December 31, 2011 | | | For the
Year Ended
December 31, 2010 | |
| Operations: | | | | | | | | |
| Net investment loss | | $ | (2,311 | ) | | $ | (1,521 | ) |
| Net realized gain on investments and foreign currency transactions | | | 196,454 | | | | 197,288 | |
| Net unrealized appreciation (depreciation) of investments and foreign currency transactions | | | (237,202 | ) | | | 82,021 | |
| Net Increase (Decrease) In Net Assets Resulting From Operations | | | (43,059 | ) | | | 277,788 | |
| Capital Share Transactions: | | | | | | | | |
| Class IA | | | | | | | | |
| Sold | | | 242,954 | | | | 139,355 | |
| Redeemed | | | (294,153 | ) | | | (221,319 | ) |
| Total capital share transactions | | | (51,199 | ) | | | (81,964 | ) |
| Class IB | | | | | | | | |
| Sold | | | 44,274 | | | | 33,442 | |
| Redeemed | | | (95,489 | ) | | | (71,448 | ) |
| Total capital share transactions | | | (51,215 | ) | | | (38,006 | ) |
| Net decrease from capital share transactions | | | (102,414 | ) | | | (119,970 | ) |
| Net Increase (Decrease) In Net Assets | | | (145,473 | ) | | | 157,818 | |
| Net Assets: | | | | | | | | |
| Beginning of period | | | 1,392,326 | | | | 1,234,508 | |
| End of period | | $ | 1,246,853 | | | $ | 1,392,326 | |
| Undistributed (distribution in excess of) | | | | | | | | |
| net investment income | | $ | (67 | ) | | $ | (552 | ) |
| Shares: | | | | | | | | |
| Class IA | | | | | | | | |
| Sold | | | 13,058 | | | | 9,164 | |
| Redeemed | | | (15,958 | ) | | | (14,470 | ) |
| Total share activity | | | (2,900 | ) | | | (5,306 | ) |
| Class IB | | | | | | | | |
| Sold | | | 2,422 | | | | 2,221 | |
| Redeemed | | | (5,358 | ) | | | (4,882 | ) |
| Total share activity | | | (2,936 | ) | | | (2,661 | ) |
The accompanying notes are an integral part of these financial statements.
Hartford Small Company HLS Fund
Notes to Financial Statements
December 31, 2011
(000’s Omitted)
Hartford Small Company HLS Fund (the “Fund”) serves as an underlying investment option for certain variable annuity and variable life insurance separate accounts of Hartford Life Insurance Company (“HLIC”) and its affiliates and certain qualified retirement plans. The Fund may also serve as an underlying investment option for certain variable annuity and variable life separate accounts of other insurance companies. Owners of variable annuity contracts and policyholders of variable life insurance contracts may choose the funds permitted in the variable insurance contract prospectus. In addition, participants in certain qualified retirement plans may choose the Fund if permitted by their plans.
Hartford Series Fund, Inc. (the “Company”) is an open-end registered management investment company comprised of thirty portfolios. Financial Statements for the Fund, a series of the Company, are included in this report.
The Company is organized under the laws of the State of Maryland and is registered with the Securities and Exchange Commission (“SEC”) under the Investment Company Act of 1940, as amended (“1940 Act”). The Fund is a diversified open-end management investment company.
The Fund is divided into Class IA and Class IB shares. Each class is offered at the per share net asset value (“NAV”) without a sales charge and is subject to the same expenses, except that the Class IB shares are subject to distribution and service fees charged pursuant to a Distribution Plan adopted in accordance with Rule 12b-1 under the 1940 Act.
| 2. | Significant Accounting Policies: |
The following is a summary of significant accounting policies of the Fund in the preparation of its financial statements, which are in accordance with the United States Generally Accepted Accounting Principles (“U.S. GAAP”). The preparation of financial statements in accordance with U.S. GAAP may require management to make estimates and assumptions that affect the reported amounts of assets and liabilities and disclosure of contingent assets and liabilities at the date of the financial statements and the reported amounts of increases and decreases in net assets from operations during the reporting period. Actual results could differ from those estimates.
| a) | Determination of Net Asset Value – The NAV of each class of the Fund’s shares is determined as of the close of regular trading (normally 4:00 p.m. Eastern Time) (the “NYSE Close”) on each day that the New York Stock Exchange (the “Exchange”) is open (“Valuation Date”). Information that becomes known to the Fund after the NAV has been calculated on a particular day will not generally be used to retroactively adjust the NAV determined earlier that day. |
| b) | Investment Valuation and Fair Value Measurements – For purposes of calculating the NAV, portfolio securities and other assets held by the Fund's portfolio for which market quotes are readily available are valued at market value. Market value is generally determined on the basis of last reported sales prices or official close price. If no sales are reported, market value is based on quotes obtained from a quotation reporting system, established market makers, or independent pricing services. If market prices are not readily available or are deemed unreliable, the Fund will use the fair value of the security as determined in good faith under policies and procedures established by and under the supervision of the Company’s Board of Directors. Market quotes are considered not readily available where there is an absence of current or reliable market-based data (e.g., trade information or broker quotes), including where events occur after the close of the relevant market, but prior to the NYSE Close that materially affect the values of the Fund’s portfolio securities or assets. In addition, market quotes are considered not readily available when, due to extraordinary circumstances, the exchanges or markets on which the securities trade do not open for trading for the entire day and no other market prices are available. In addition, prices of foreign equities that are principally traded on certain foreign markets are adjusted daily pursuant to a fair value pricing service approved by the Board of Directors in order to reflect an adjustment for the factors occurring after the close of certain foreign markets but before the NYSE Close. Securities that are primarily traded on foreign markets may trade on days that are not business days of the Fund. The value of the foreign securities in |
which the Fund invests may change on days when a shareholder will not be able to purchase or redeem shares of the Fund. Fair value pricing is subjective in nature and the use of fair value pricing by the Fund may cause the NAV of its shares to differ significantly from the NAV that would have been calculated using market prices at the close of the exchange on which a portfolio security is primarily traded. There can be no assurance that the Fund could obtain the fair market value assigned to a security if the Fund were to sell the security at approximately the time at which the Fund determines its NAV.
Investments valued in currencies other than U.S. dollars are converted to U.S. dollars using exchange rates obtained from independent pricing services for calculation of the NAV. As a result, the NAV of the Fund’s shares may be affected by changes in the value of currencies in relation to the U.S. dollar. The value of securities traded in markets outside the United States or denominated in currencies other than the U.S. dollar may be affected significantly on a day that the NYSE is closed and the market value may change on days when an investor is not able to purchase, redeem or exchange shares of the Fund.
Foreign currency contracts represent agreements to exchange currencies on specific future dates at predetermined rates. Foreign currency contracts are valued using foreign currency exchange rates and forward rates as provided by an independent pricing service on the Valuation Date.
Investments in open-end mutual funds are valued at the respective NAV of each open-end mutual fund on the Valuation Date.
Financial instruments for which prices are not available from an independent pricing service may be valued using market quotations obtained from one or more dealers that make markets in the respective financial instrument in accordance with procedures established by the Company’s Board of Directors.
U.S. GAAP defines fair value as the price that the Fund would receive to sell an asset or pay to transfer a liability in an orderly transaction between market participants. The U.S. GAAP fair value measurement standards require disclosure of a fair value hierarchy for each major category of assets and liabilities. Various inputs are used in determining the fair value of the Fund’s investments. These inputs are summarized into three broad hierarchy levels. This hierarchy is based on whether the valuation inputs are observable or unobservable. These levels are:
| · | Level 1 – Quoted prices in active markets for identical securities. Level 1 may include exchange traded instruments such as domestic equities, some foreign equities, options, futures, mutual funds, exchange traded funds, rights and warrants. |
| · | Level 2 – Observable inputs other than Level 1 prices, such as quoted prices for similar securities; quoted prices in markets that are not active; or other inputs that are observable or can be corroborated by observable market data. Level 2 may include debt securities that are traded less frequently than exchange traded instruments and which are valued using independent pricing services; foreign equities, that are principally traded on certain foreign markets and are adjusted daily pursuant to a fair value pricing service in order to reflect an adjustment for the factors occurring after the close of certain foreign markets but before the NYSE Close; and short-term securities, which are valued at amortized cost. |
| · | Level 3 – Significant unobservable inputs that are supported by limited or no market activity. Level 3 may include financial instruments whose values are determined using broker quotes or require significant management judgment or estimation. These unobservable valuation inputs may include estimates for current yields, maturity/duration, prepayment speed, and broker quotes for comparable securities along with other assumptions relating to credit quality, collateral value, complexity of the security structure, general market conditions and liquidity. This category may include securities where trading has been halted or there are certain restrictions on trading. While these securities are priced using unobservable inputs, the valuation of these securities reflects the best available data and management believes the prices are a reasonable representation of exit price. |
Hartford Small Company HLS Fund
Notes to Financial Statements – (continued)
December 31, 2011
(000’s Omitted)
Valuation levels are not necessarily indicative of the risk associated with investing in such securities. Individual securities within any of the above mentioned asset classes may be assigned a different hierarchical level than those presented above, as individual circumstances dictate.
For additional information, refer to the Investment Valuation Hierarchy Level Summary and the Level 3 roll-forward reconciliation which follow the Schedule of Investments.
For purposes of reporting transfers between different hierarchy levels, both transfers in and out of each level, as applicable, are shown as if they occurred at the beginning of the period.
| c) | Security Transactions and Investment Income – Security transactions are recorded as of the trade date (the date the order to buy or sell is executed) for financial reporting purposes. Securities purchased or sold on a when-issued or delayed-delivery basis may be settled a month or more after the trade date. Realized gains and losses are determined on the basis of identified cost. |
Dividend income is accrued as of the ex-dividend date, except certain dividends from foreign securities where the ex-dividend date may have passed are recorded as soon as the Fund is informed of the dividend. Interest income, including amortization of premium and accretion of discounts, is accrued on a daily basis.
| d) | Foreign Currency Transactions – Assets and liabilities denominated in currencies other than U.S. dollars are translated into U.S. dollars at the exchange rates in effect on the valuation date. Purchases and sales of investment securities, income, and expenses are translated into U.S. dollars at the exchange rates on the dates of such transactions. |
The Fund does not isolate that portion of portfolio security valuation resulting from fluctuations in the foreign currency exchange rates from the fluctuations arising from changes in the market prices of securities held. Exchange rate fluctuations are included with the net realized and unrealized gain or loss on investments in the accompanying financial statements.
Net realized foreign exchange gains or losses arise from sales of foreign currencies and the difference between asset and liability amounts initially stated in foreign currencies and the U.S. dollar value of the amounts actually received or paid. Net unrealized foreign exchange gains or losses arise from changes in the value of other assets and liabilities at the end of the reporting period, resulting from changes in the exchange rates.
| e) | Joint Trading Account – The Fund may invest cash balances into a joint trading account that may be invested in one or more repurchase agreements. |
| f) | Fund Share Valuation and Dividend Distributions to Shareholders – Orders for the Fund’s shares are executed in accordance with the investment instructions of the contract holders and plan participants. The NAV of the Fund’s shares is determined as of the close of business on each business day of the Exchange. The NAV is determined separately for each class of shares of the Fund by dividing the Fund’s net assets attributable to that class by the number of shares of the class outstanding. Each class of shares offered by the Fund has equal rights as to assets and voting privileges (except that shareholders of a class have exclusive voting rights regarding any matter relating solely to that class of shares). Income and non-class specific expenses are allocated daily to each class on the basis of the relative net assets of the class. Realized and unrealized capital gains and losses are allocated daily based on the relative net assets of each class of shares of the Fund. |
Orders for the purchase of the Fund’s shares received prior to the close of the Exchange on any day the Exchange is open for business are priced at the NAV determined as of the close of the Exchange. Orders received after the close of the Exchange, or on a day on which the Exchange and/or the Fund is not open for business, are priced at the next determined NAV.
Dividends are declared pursuant to a policy adopted by the Company’s Board of Directors based upon the investment performance of the Fund. The policy of the Fund is to pay dividends from net investment income and realized capital gains, if any, at least once a year.
Distributions from net investment income, net realized capital gains and capital are determined in accordance with federal income tax regulations, which may differ from U.S. GAAP with respect to character and timing. These differences may include but are not limited to losses deferred due to wash sale adjustments, foreign currency gains and losses, adjustments related to Passive Foreign Investment Companies (“PFICs”), Real Estate Investment Trusts (“REITs”), Regulated Investment Companies (“RICs”), certain derivatives and partnerships. Permanent book and federal income tax basis differences relating to shareholder distributions will result in reclassifications to certain of the Fund’s capital accounts (see Federal Income Taxes: Reclassification of Capital Accounts note).
| 3. | Securities and Other Investments: |
| a) | Repurchase Agreements – A repurchase agreement is an agreement by which a counterparty agrees to sell a security and agrees to repurchase the security sold at a mutually agreed upon time and price. At the time the Fund enters into a repurchase agreement, the value of the underlying collateral security(ies), including accrued interest, will be equal to or exceed the value of the repurchase agreement. Repurchase agreements expose the Fund to counterparty risk. To minimize counterparty risk, the securities that serve to collateralize the repurchase agreement are held by the Fund's custodian in book entry or physical form in the custodial account of the Fund or in a third party custodial account. Repurchase agreements are valued at cost plus accrued interest. The Fund, as shown on the Schedule of Investments, had outstanding repurchase agreements as of December 31, 2011. |
| b) | Illiquid and Restricted Securities – The Fund is permitted to invest up to 15% of its net assets in illiquid securities. Illiquid securities are those that may not be sold or disposed of in the ordinary course of business within seven days, at approximately the price used to determine the Fund’s NAV. The Fund may not be able to sell illiquid securities or other investments when its sub-adviser considers it desirable to do so or may have to sell such securities or investments at a price that is lower than the price that could be obtained if the securities or investments were more liquid. A sale of illiquid securities or other investments may require more time and may result in higher dealer discounts and other selling expenses than does the sale of those that are liquid. Illiquid securities and investments also may be more difficult to value due to the unavailability of reliable market quotations for such securities or investments, and an investment in them may have an adverse impact on the Fund’s NAV. The Fund may also purchase certain restricted securities that can only be resold to certain qualified investors and may be determined to be liquid pursuant to policies and guidelines established by the Company’s Board of Directors. The Fund, as shown on the Schedule of Investments, had illiquid and/or restricted securities as of December 31, 2011. |
| c) | Securities Purchased on a When-Issued or Delayed-Delivery Basis – Delivery and payment for securities that have been purchased by the Fund on a forward commitment, or when-issued or delayed-delivery basis, take place beyond the customary settlement period. A fund may dispose of or renegotiate a delayed-delivery transaction after it is entered into, and may sell delayed-delivery securities before they are delivered, which may result in a realized gain or loss. During this period, such securities are subject to market fluctuations, and the Fund identifies securities segregated in its records with value at least equal to the amount of the commitment. As of December 31, 2011, the Fund had no outstanding when-issued or delayed delivery securities. |
| 4. | Financial Derivative Instruments: |
The following disclosures contain information on how and why the Fund uses derivative instruments, the credit-risk-related contingent features in certain derivative instruments, and how derivative instruments affect the Fund’s financial position and results of operations. The location and fair value amounts of these instruments on the Statement of Assets and Liabilities and the realized gains and losses and changes in unrealized gains and losses on the Statement of
Hartford Small Company HLS Fund
Notes to Financial Statements – (continued)
December 31, 2011
(000’s Omitted)
Operations, each categorized by type of derivative contract, are included in the following Additional Derivative Instrument Information footnote. The derivative instruments outstanding as of period-end are disclosed in the notes to the Schedule of Investments and the amounts of realized gains and losses and changes in unrealized gains and losses on derivative instruments during the period are disclosed in the Statement of Operations.
| a) | Foreign Currency Contracts – The Fund may enter into foreign currency contracts that obligate the Fund to purchase or sell currencies at specified future dates. Foreign currency contracts are used to hedge the currency exposure associated with some or all of the Fund's securities and/or as part of an investment strategy. Foreign currency contracts are marked to market daily and the change in value is recorded by the Fund as an unrealized gain or loss. The Fund will record a realized gain or loss when the foreign currency contract is settled. |
Foreign currency contracts involve elements of market risk in excess of the amounts reflected in the Statement of Assets and Liabilities. In addition, risks may arise upon entering into these contracts from the potential inability of the counterparties to meet the terms of the contracts and from unanticipated movements in the value of the foreign currencies relative to the U.S. dollar. The Fund had no outstanding foreign currency contracts as of December 31, 2011.
| b) | Additional Derivative Instrument Information: |
| | | | | | | | |
| The volume of derivative activity was minimal during the year ended December 31, 2011. |
| | | | | | | | |
| The Effect of Derivative Instruments on the Statement of Operations for the year ended December 31, 2011: |
| | | Risk Exposure Category | |
| | | Interest Rate Contracts | | | Foreign Exchange Contracts | | | Credit
Contracts | | | Equity
Contracts | | | Commodity
Contracts | | | Other
Contracts | | | Total | |
| | | | | | | | | | | | | | | | | | | | | | | | | | | | | |
| Realized Gain (Loss) on Derivatives Recognized as a Result of Operations: | | | | | | | | | | | | | | |
| Net realized loss on foreign currency contracts | | $ | — | | | $ | (169 | ) | | $ | — | | | $ | — | | | $ | — | | | $ | — | | | $ | (169 | ) |
| Total | | $ | — | | | $ | (169 | ) | | $ | — | | | $ | — | | | $ | — | | | $ | — | | | $ | (169 | ) |
| | | | | | | | | | | | | | | | | | | | | | | | | | | | | |
| Net Change in Unrealized Appreciation (Depreciation) on Derivatives Recognized as a Result of Operations: | | | | | | | | | |
Net change in unrealized appreciation of
foreign currency contracts | | $ | — | | | $ | 54 | | | $ | — | | | $ | — | | | $ | — | | | $ | — | | | $ | 54 | |
| Total | | $ | — | | | $ | 54 | | | $ | — | | | $ | — | | | $ | — | | | $ | — | | | $ | 54 | |
| a) | Counterparty Risk – The Fund may be exposed to counterparty risk, or the risk that an institution or other entity with which the Fund has unsettled or open transactions will default. |
| b) | Market Risks – If the Fund invests directly in foreign currencies or in securities that trade in, and receive revenues in, foreign currencies, or in derivatives that provide exposure to foreign currencies, it will be subject to the risk that those currencies will decline in value relative to the base currency of the Fund, or, in the case of hedging positions, that the Fund’s base currency will decline in value relative to the currency being hedged. Currency rates in foreign countries may fluctuate significantly over short periods of time for a number of reasons, including changes in interest rates, intervention (or the failure to intervene) by U.S. or foreign governments, central banks or supranational entities, such as the International Monetary Fund, or by the imposition of currency controls or other political developments in the United States or abroad. As a result, the Fund’s investments in foreign currency denominated securities may reduce the returns of the Fund. The market values of equity securities, such as common stocks and preferred stocks, or equity related investments, such as futures and options, may decline due to general market conditions which are not specifically related to a particular company, such as real or perceived adverse economic conditions, changes in the general outlook for |
corporate earnings, changes in interest or currency rates or adverse investor sentiment generally. The market value of equity securities may also decline due to factors which affect a particular industry or industries, such as labor shortages or increased production costs and competitive conditions within an industry. Equity securities and equity related investments generally have greater market price volatility than fixed income securities.
| a) | Federal Income Taxes – For federal income tax purposes, the Fund intends to continue to qualify as a RIC under Subchapter M of the Internal Revenue Code (“IRC”) by distributing substantially all of its taxable net investment income and net realized capital gains to its shareholders and otherwise complying with the requirements of RICs. The Fund has distributed substantially all of its income and capital gains in prior years, if applicable, and intends to distribute substantially all of its income and capital gains prior to the next fiscal year-end. Accordingly, no provision for federal income or excise taxes has been made in the accompanying financial statements. Distributions from short-term capital gains are treated as ordinary income distributions for federal income tax purposes. |
| b) | Net Investment Income (Loss), Net Realized Gains (Losses) – Net investment income (loss) and net realized gains (losses) may differ for financial statement and tax purposes primarily because of losses deferred due to wash sale adjustments, foreign currency gains and losses, adjustments related to PFICs, REITs, RICs, certain derivatives and partnerships. The character of distributions made during the year from net investment income or net realized gains may differ from their ultimate characterization for federal income tax purposes. Also, due to the timing of dividend distributions, the fiscal year in which amounts are distributed may differ from the year that the income or realized gains (losses) were recorded by the Fund. |
| c) | Components of Distributable Earnings – The Fund’s components of distributable earnings (deficit) on a tax basis at December 31, 2011, are as follows: |
| | | Amount | |
| Accumulated Capital and Other Losses* | | $ | (1,214 | ) |
| Unrealized Appreciation† | | | 14,500 | |
| Total Accumulated Earnings | | $ | 13,286 | |
| | * | The Fund has capital loss carryforwards that are identified in the Capital Loss Carryforward note that follows. |
| | † | The difference between book-basis and tax-basis unrealized appreciation (depreciation) may be attributable to the losses deferred due to wash sale adjustments, foreign currency gains and losses, adjustments related to PFICs, REITs, RICs, certain derivatives and partnerships. |
| d) | Reclassification of Capital Accounts – The Fund may record reclassifications in its capital accounts. These reclassifications have no impact on the total net assets of the Fund. The reclassifications are a result of permanent differences between U.S. GAAP and tax accounting for such items as foreign currency, PFICs, expiration or utilization of capital loss carryforwards or net operating losses. Adjustments are made to reflect the impact these items have on current and future distributions to shareholders. Therefore, the source of the Fund’s distributions may be shown in the accompanying Statement of Changes in Net Assets as from undistributed net investment income, from accumulated net realized gains on investments or from capital depending on the type of book and tax differences that exist. For the year ended December 31, 2011, the Fund recorded reclassifications to increase (decrease) the accounts listed below: |
| | | Amount | |
| Undistributed Net Investment Income | | $ | 2,796 | |
| Accumulated Net Realized Gain (Loss) | | | 272 | |
| Capital Stock and Paid-in-Capital | | | (3,068 | ) |
Hartford Small Company HLS Fund
Notes to Financial Statements – (continued)
December 31, 2011
(000’s Omitted)
| e) | Capital Loss Carryforward – On December 22, 2010, the Regulated Investment Company Modernization Act of 2010 (the “Act”) was enacted, which made changes to the capital loss carryforward rules. The changes are effective for taxable years beginning after the date of enactment. Under the Act, funds are permitted to carry forward capital losses for an unlimited period. However, any losses incurred during those future taxable years will be required to be utilized prior to the losses incurred in pre-enactment taxable years, which carry an expiration date. As a result of this ordering rule, pre-enactment capital loss carryforwards may be more likely to expire unused. Additionally, post-enactment capital loss carryforwards will retain their character as either short-term or long-term capital losses rather than being considered all short-term as permitted under prior regulation. |
At December 31, 2011 (tax-year-end), the Fund had capital loss carryforwards for U.S. federal income tax purposes as follows:
| Year of Expiration | | Amount | |
| 2017 | | $ | 1,214 | |
| Total | | $ | 1,214 | |
| As of December 31, 2011, the Fund utilized $203,709 of prior year capital loss carryforwards |
| f) | Accounting for Uncertainty in Income Taxes – The Fund has adopted financial reporting rules that require the Fund to analyze all open tax years, as defined by the statute of limitations, for all major jurisdictions. Generally, tax authorities can examine all tax returns filed for the last three years. The Fund does not have an examination in progress. |
The Fund has reviewed all open tax years and major jurisdictions and concluded that these financial reporting rules had no effect on the Fund’s financial position or results of operations. There is no tax liability resulting from unrecognized tax benefits relating to uncertain income tax positions taken or expected to be taken on the tax return for the fiscal year ended December 31, 2011. The Fund is also not aware of any tax positions for which it is reasonably possible that the total amounts of unrecognized tax benefits will significantly change in the next twelve months.
| a) | Investment Management Agreement – HL Investment Advisors, LLC (“HL Advisors”), an indirect wholly owned subsidiary of The Hartford Financial Services Group, Inc. (“The Hartford”), serves as investment manager to the Fund pursuant to an Investment Management Agreement with the Company. As investment manager, HL Advisors has overall investment supervisory responsibility for the Fund. In addition, HL Advisors provides administrative personnel, services, equipment, facilities and office space for proper operation of the Fund. HL Advisors has contracted with Wellington Management Company, LLP (“Wellington Management”) under a sub-advisory agreement for the provision of day-to-day investment management services to the Fund in accordance with the Fund’s investment objective and policies. The Fund pays a fee to HL Advisors, a portion of which may be used to compensate Wellington Management. |
The schedule below reflects the rates of compensation paid to HL Advisors for investment management services rendered as of December 31, 2011; the rates are accrued daily and paid monthly.
| Average Daily Net Assets | Annual Fee |
| On first $250 million | 0.7750% |
| On next $250 million | 0.7250% |
| On next $500 million | 0.6750% |
| On next $500 million | 0.6000% |
| On next $3.5 billion | 0.5500% |
| On next $5 billion | 0.5300% |
| Over $10 billion | 0.5200% |
| b) | Accounting Services Agreement – Pursuant to the Fund Accounting Agreement between HLIC and the Company, on behalf of the Fund, HLIC provides accounting services to the Fund and receives monthly compensation based on the Fund’s average daily net assets at the rates set forth below. The Fund’s accounting services fees are accrued daily and paid monthly. |
| Average Daily Net Assets | Annual Fee |
| On first $5 billion | 0.012% |
| Over $5 billion | 0.010% |
| c) | Operating Expenses – Allocable expenses incurred by the Company are allocated to each Fund and allocated to classes within a Fund in proportion to the average daily net assets of the Fund and each class, except where allocation of certain expenses is more fairly made directly to the Fund or to specific classes within a Fund. |
| d) | Fees Paid Indirectly – The Company, on behalf of the Fund, has entered into agreements with State Street Global Markets, LLC and Russell Implementation Services, Inc. to partially recapture non-discounted trade commissions. Such rebates are used to pay a portion of the Fund’s expenses. In addition, the Fund’s custodian bank has also agreed to reduce its fees when the Fund maintains cash on deposit in a non-interest-bearing custody account. For the year ended December 31, 2011, these amounts, if any, are included in the Statement of Operations. |
The ratio of expenses to average net assets in the accompanying financial highlights excludes the reduction in expenses related to fees paid indirectly. The annualized expense ratio for the period listed below reflecting the reduction for fees paid indirectly is as follows:
| | | Year Ended December 31, 2011 | |
| Class IA | | | 0.71 | % |
| Class IB | | | 0.96 | |
| e) | Distribution Plan for Class IB shares – The Company, on behalf of the Fund, has adopted a Distribution Plan pursuant to Rule 12b-1 of the 1940 Act to compensate the Distributor, Hartford Securities Distribution Company, Inc. (a wholly owned, ultimate subsidiary of The Hartford), from assets attributable to the Class IB shares for services rendered and expenses borne in connection with activities primarily intended to result in the sale of the Class IB shares, subject to the review and approval of the Company’s Board of Directors. |
The Distribution Plan provides that the Fund may pay annually up to 0.25% of the average daily net assets of the Fund attributable to its Class IB shares for activities primarily intended to result in the sale of Class IB shares. The Board has the authority to suspend or reduce these payments at any point in time. Under the terms of the Distribution Plan and the principal underwriting agreement, the Fund is authorized to make payments monthly to the Distributor that may be used to pay or compensate entities providing distribution and shareholder servicing with respect to the Class IB shares for such entities’ fees or expenses incurred or paid in that regard. These fees are accrued daily and paid monthly.
| f) | Other Related Party Transactions – Certain officers of the Fund are directors and/or officers of HL Advisors and/or The Hartford or its subsidiaries. For the year ended December 31, 2011, a portion of the Fund’s chief compliance officer’s salary was paid by all the investment companies in the Hartford fund complex. The portion allocated to the Fund was in the amount of $2. Hartford Administrative Services Company (“HASCO”), an indirect wholly owned subsidiary of The Hartford, provides transfer agent services to the Fund. HASCO was compensated on a per account basis for providing such services. The amount paid to HASCO can be found in the Statement of Operations. These fees are accrued daily and paid monthly. |
Hartford Small Company HLS Fund
Notes to Financial Statements – (continued)
December 31, 2011
(000’s Omitted)
| g) | Payments from Affiliates – In July of 2007, The Hartford entered into a settlement with the Attorneys General of the states of New York, Connecticut and Illinois relating to market timing and the company's individual variable annuity contracts in which certain payments would be made directly to the variable annuity contract holders. The distribution plan provided that unclaimed money from the settlement would be distributed to certain HLS Funds that are investment options through a Hartford individual variable annuity contract. The unclaimed money was distributed to the Fund on September 18, 2009. |
On June 8, 2007, the Fund was reimbursed for incorrect IPO allocations to the Fund.
On May 2, 2007, the Fund had trading reimbursements relating to the change in portfolio managers of the Fund.
The total return in the accompanying financial highlights includes payments from affiliates. Had the payments from the affiliates been excluded, the impact and total return for the periods listed below would have been as follows:
| | | For the Year Ended December 31, 2009 | |
| | | | Class IA | | | | Class IB | |
| Impact from Payment from Affiliate for Attorneys General Settlement | | | 0.08 | % | | | 0.09 | % |
| Total Return Excluding Payment from Affiliate | | | 29.18 | | | | 28.90 | |
| | | For the Year Ended December 31, 2007 | |
| | | | Class IA | | | | Class IB | |
| Impact from Payment from Affiliate for Trading Reimbursements | | | 0.16 | % | | | 0.16 | % |
| Impact from Payment from Affiliate for Incorrect IPO Allocations | | | 0.03 | | | | 0.03 | |
| Total Return Excluding Payments from Affiliates | | | 14.01 | | | | 13.73 | |
| 8. | Investment Transactions: |
For the year ended December 31, 2011, the Fund's aggregate purchases and sales of investment securities (excluding short-term investments) were as follows:
| | | Amount | |
| Cost of Purchases Excluding U.S. Government Obligations | | $ | 1,372,071 | |
| Sales Proceeds Excluding U.S. Government Obligations | | | 1,470,113 | |
The Fund is one of several Hartford funds that participate in a $500 million committed revolving line of credit facility. The facility is to be used for temporary or emergency purposes. Under the arrangement, the funds are required to own securities having a market value in excess of 300% of the total bank borrowings. The interest rate on borrowings varies depending on the nature of the loan. The facility also requires a fee to be paid based on the amount of the commitment. This commitment fee is allocated to all of the funds participating in the line of credit based on the average net assets of the funds. During the year ended December 31, 2011, the Fund did not have any borrowings under this facility.
| 10. | Industry Classifications: |
Other than the industry classifications “Other Investment Pools and Funds” and “Exchange Traded Funds,” equity industry classifications used in this report are the Global Industry Classification Standard, which was developed by and is the exclusive property and service mark of MSCI, Inc. and Standard & Poor’s.
Under the Company’s organizational documents, the Company shall indemnify its officers and directors to the full extent required or permitted under Maryland General Corporation Law and the federal securities laws. In addition, the Company, on behalf of the Fund, may enter into contracts that contain a variety of indemnifications. The Company’s maximum exposure under these arrangements is unknown. However, as of the date of these financial statements, the Company has not had prior claims or losses pursuant to these contracts and expects the risk of loss to be remote.
Hartford Small Company HLS Fund
Financial Highlights
- Selected Per-Share Data (A) -
Class | | Net Asset Value at Beginning of Period | | | Net Investment Income (Loss) | | | Payments from (to) Affiliate | | | Net Realized and Unrealized Gain (Loss) on Investments | | | Total from Investment Operations | | | Dividends from Net Investment Income | | | Distributions from Realized Capital Gains | | | Distributions from Capital | | | Total Distributions | | | Net Increase (Decrease) in Net Asset Value | | | Net Asset Value at End of Period | |
| For the Year Ended December 31, 2011 |
| IA | | $ | 17.66 | | | $ | (0.02 | ) | | $ | – | | | $ | (0.57 | ) | | $ | (0.59 | ) | | $ | – | | | $ | – | | | $ | – | | | $ | – | | | $ | (0.59 | ) | | $ | 17.07 | |
| IB | | | 17.18 | | | | (0.09 | ) | | | – | | | | (0.53 | ) | | | (0.62 | ) | | | – | | | | – | | | | – | | | | – | | | | (0.62 | ) | | | 16.56 | |
| For the Year Ended December 31, 2010 |
| IA | | | 14.23 | | | | (0.01 | ) | | | – | | | | 3.44 | | | | 3.43 | | | | – | | | | – | | | | – | | | | – | | | | 3.43 | | | | 17.66 | |
| IB | | | 13.88 | | | | (0.06 | ) | | | – | | | | 3.36 | | | | 3.30 | | | | – | | | | – | | | | – | | | | – | | | | 3.30 | | | | 17.18 | |
| For the Year Ended December 31, 2009 |
| IA | | | 11.01 | | | | (0.01 | ) | | | 0.01 | | | | 3.22 | | | | 3.22 | | | | – | | | | – | | | | – | | | | – | | | | 3.22 | | | | 14.23 | |
| IB | | | 10.76 | | | | (0.04 | ) | | | 0.01 | | | | 3.15 | | | | 3.12 | | | | – | | | | – | | | | – | | | | – | | | | 3.12 | | | | 13.88 | |
| For the Year Ended December 31, 2008 |
| IA | | | 18.62 | | | | 0.02 | | | | – | | | | (7.56 | ) | | | (7.54 | ) | | | (0.02 | ) | | | (0.05 | ) | | | – | | | | (0.07 | ) | | | (7.61 | ) | | | 11.01 | |
| IB | | | 18.20 | | | | (0.01 | ) | | | – | | | | (7.38 | ) | | | (7.39 | ) | | | – | | | | (0.05 | ) | | | – | | | | (0.05 | ) | | | (7.44 | ) | | | 10.76 | |
| For the Year Ended December 31, 2007(F) |
| IA | | | 19.07 | | | | – | | | | 0.04 | | | | 2.57 | | | | 2.61 | | | | (0.05 | ) | | | (3.01 | ) | | | – | | | | (3.06 | ) | | | (0.45 | ) | | | 18.62 | |
| IB | | | 18.71 | | | | (0.05 | ) | | | 0.04 | | | | 2.51 | | | | 2.50 | | | | – | | | | (3.01 | ) | | | – | | | | (3.01 | ) | | | (0.51 | ) | | | 18.20 | |
| (A) | Information presented relates to a share outstanding throughout the indicated period. |
| (B) | The figures do not include sales charges or other fees which may be applied at the variable life insurance, variable annuity or qualified retirement plan product level. Any such additional sales charges or other fees would lower the Fund's performance. |
| (C) | Ratios do not reflect reductions for fees paid indirectly. Please see Fees Paid Indirectly in the Notes to Financial Statements. |
| (D) | Portfolio turnover rate is calculated on the basis of the Fund as a whole without distinguishing between the classes of shares issued. |
| (E) | Total return without the inclusion of the Payment from (to) Affiliate can be found in Expenses in the accompanying Notes to Financial Statements. |
| (F) | Per share amounts have been calculated using the average shares method. |
| (G) | During the year ended December 31, 2007, Hartford Small Company HLS Fund received a $12.6 million in-kind subscription of securities from a shareholder in exchange for shares of this fund. This payment-in-kind was excluded from the portfolio turnover rate calculation. |
| Total Return(B) | | Net Assets at End of Period | | | Ratio of Expenses to Average Net Assets Before Waivers(C) | | | Ratio of Expenses to Average Net Assets After Waivers(C) | | | Ratio of Net Investment Income (Loss) to Average Net Assets | | | Portfolio Turnover Rate(D) | |
|
| (3.36) | % | $ | 1,090,883 | | | | 0.71 | % | | | 0.71 | % | | | (0.13 | )% | | | 99 | % |
| (3.62) | | | 155,970 | | | | 0.96 | | | | 0.96 | | | | (0.38 | ) | | | – | |
|
| 24.13 | | | 1,180,045 | | | | 0.73 | | | | 0.73 | | | | (0.08 | ) | | | 171 | |
| 23.83 | | | 212,281 | | | | 0.98 | | | | 0.98 | | | | (0.33 | ) | | | – | |
|
| 29.29 | (E) | | 1,026,150 | | | | 0.75 | | | | 0.75 | | | | (0.07 | ) | | | 184 | |
| 29.01 | (E) | | 208,358 | | | | 1.00 | | | | 1.00 | | | | (0.32 | ) | | | – | |
|
| (40.60 | ) | | 793,078 | | | | 0.71 | | | | 0.71 | | | | 0.16 | | | | 194 | |
| (40.73 | ) | | 179,411 | | | | 0.96 | | | | 0.96 | | | | (0.09 | ) | | | – | |
|
| 14.23 | (E) | | 1,292,444 | | | | 0.70 | | | | 0.70 | | | | (0.02 | ) | | | 167 | (G) |
| 13.94 | (E) | | 312,775 | | | | 0.95 | | | | 0.95 | | | | (0.27 | ) | | | – | |
| | | | | | | | | | | | | | | | | | | | | |
Report of Independent Registered Public Accounting Firm
The Board of Directors and Shareholders of
Hartford Series Fund, Inc.
We have audited the accompanying statement of assets and liabilities, including the schedule of investments, of Hartford Small Company HLS Fund (one of the portfolios constituting Hartford Series Fund, Inc. (the Funds)) as of December 31, 2011, and the related statement of operations for the year then ended, the statements of changes in net assets for each of the two years in the period then ended, and the financial highlights for each of the five years in the period then ended. These financial statements and financial highlights are the responsibility of the Funds’ management. Our responsibility is to express an opinion on these financial statements and financial highlights based on our audits.
We conducted our audits in accordance with the standards of the Public Company Accounting Oversight Board (United States). Those standards require that we plan and perform the audit to obtain reasonable assurance about whether the financial statements and financial highlights are free of material misstatement. We were not engaged to perform an audit of the Funds’ internal control over financial reporting. Our audits included consideration of internal control over financial reporting as a basis for designing audit procedures that are appropriate in the circumstances, but not for the purpose of expressing an opinion on the effectiveness of the Funds’ internal control over financial reporting. Accordingly, we express no such opinion. An audit also includes examining, on a test basis, evidence supporting the amounts and disclosures in the financial statements and financial highlights, assessing the accounting principles used and significant estimates made by management, and evaluating the overall financial statement presentation. Our procedures included confirmation of securities owned as of December 31, 2011, by correspondence with the custodian and brokers or by other appropriate auditing procedures where replies from brokers were not received. We believe that our audits provide a reasonable basis for our opinion.
In our opinion, the financial statements and financial highlights referred to above present fairly, in all material respects, the financial position of Hartford Small Company HLS Fund of Hartford Series Fund, Inc. at December 31, 2011, the results of its operations for the year then ended, the changes in its net assets for each of the two years in the period then ended, and the financial highlights for each of the five years in the period then ended, in conformity with U.S. generally accepted accounting principles.
Minneapolis, MN
February 13, 2012
Hartford Small Company HLS Fund
Directors and Officers (Unaudited)
The Board of Directors of the Company appoints officers who are responsible for the day-to-day operations of the Fund and who execute policies formulated by the Directors. Each director serves until his or her death, resignation, or retirement or until the next annual meeting of shareholders is held or until his or her successor is elected and qualifies.
Directors and officers who are employed by or who have a financial interest in The Hartford are considered “interested” persons of the Fund pursuant to the 1940 Act. Each officer and two of the Company’s directors, as noted in the chart below, are “interested” persons of the Fund. Each director serves as a director for The Hartford Mutual Funds, Inc., The Hartford Mutual Funds II, Inc., Hartford Series Fund, Inc., Hartford HLS Series Fund II, Inc., and as a trustee for The Hartford Alternative Strategies Fund, which, as of December 31, 2011, collectively consist of 91 funds. Correspondence may be sent to directors and officers c/o Hartford Mutual Funds, P.O. Box 2999, Hartford, Connecticut 06104-2999, except that correspondence to Ms. Fagely may be sent to 500 Bielenberg Drive, Woodbury, Minnesota 55125.
The table below sets forth, for each director and officer, his or her name, year of birth, current position with the Company and date first elected or appointed to Hartford Series Fund, Inc. (“HSF”), and Hartford HLS Series Fund II, Inc. (“HSF2”), principal occupation, and, for directors, other directorships held. The Fund’s statement of additional information contains further information on the directors and is available free of charge by calling 1-800-862-6668 or writing to Hartford HLS Funds, c/o Individual Annuity Services, P.O. Box 5085, Hartford, CT 06102-5085.
Information on the aggregate remuneration paid to the directors of the Company can be found in the Statement of Operations herein. The Fund pays to The Hartford a portion of the chief compliance officer’s compensation, but does not pay salaries or compensation to any of their other officers or directors who are employed by The Hartford.
Non-Interested Directors
Lynn S. Birdsong (1946) Director since 2003, Co-Chairman of the Investment Committee
Mr. Birdsong is a private investor. Mr. Birdsong currently serves as a Director of the Sovereign High Yield Investment Company (April 2010 to current). Mr. Birdsong currently serves as an Independent Director of Nomura Partners Funds, Inc. (formerly, The Japan Fund) (March 2003 to current). From 2003 to March 2005, Mr. Birdsong was an independent director of the Atlantic Whitehall Funds. From 1979 to 2002, Mr. Birdsong was a managing director of Zurich Scudder Investments, an investment management firm. During his employment with Scudder, Mr. Birdsong was an Interested Director of The Japan Fund. Since 1981, Mr. Birdsong has been a partner in Birdsong Company, an advertising specialty firm.
Robert M. Gavin, Jr. (1940) Director since 2002 (HSF) and 1986 (HSF2), Chairman of the Board since 2004
Dr. Gavin is an educational consultant. Prior to September 1, 2001, he was President of Cranbrook Education Community and prior to July 1996, he was President of Macalester College, St. Paul, Minnesota.
Duane E. Hill (1945) Director since 2001 (HSF) and 2002 (HSF2), Chairman of the Nominating Committee
Mr. Hill is Partner of TSG Ventures L.P., a private equity investment company. Mr. Hill is a former partner of TSG Capital Group, a private equity investment firm that served as sponsor and lead investor in leveraged buyouts of middle market companies.
Sandra S. Jaffee (1941) Director since 2005
Ms. Jaffee served as Chairman (2008 to 2009) and Chief Executive Officer of Fortent (formerly Searchspace Group), a leading provider of compliance/regulatory technology to financial institutions from August 2005 to August 2009. From August 2004 to August 2005, Ms. Jaffee served as an Entrepreneur in Residence with Warburg Pincus, a private equity firm. From September 1995 to July 2004, Ms. Jaffee served as Executive Vice President at Citigroup, where she was President and Chief Executive Officer of Citibank’s Global Securities Services (1995 to 2003). Ms. Jaffe currently serves as a member of the Board of Directors of Broadridge Financial Solutions as well as a Trustee of Muhlenberg College.
William P. Johnston (1944) Director since 2005, Chairman of the Compliance Committee
In June 2006, Mr. Johnston was appointed as Senior Advisor to The Carlyle Group, a global private equity investment firm. In August 2007, Mr. Johnston was elected to the Board of Directors of LifeCare Holdings, Inc. In February 2008, Mr. Johnston was elected to the Board of Directors of HCR-ManorCare, Inc. In May 2006, Mr. Johnston was elected to the Supervisory Board of Fresenius Medical Care AG & Co. KGaA, after its acquisition of Renal Care Group, Inc. in March 2006. Mr. Johnston joined Renal Care Group in November 2002 as a member of the Board of Directors and served as Chairman of the Board from March 2003 through March 2006. Mr. Johnston served as a Director of MultiPlan, Inc. from July 2006 through August 2010. From September 1987 to December 2002, Mr. Johnston was with Equitable Securities Corporation (and its successors, SunTrust Equitable Securities and SunTrust Robinson Humphrey) serving in various investment banking and managerial positions, including Managing Director and Head of Investment Banking, Chief Executive Officer and Vice Chairman.
Hartford Small Company HLS Fund
Directors and Officers (Unaudited) – (continued)
Phillip O. Peterson (1944) Director since 2002 (HSF) and 2000 (HSF2), Chairman of the Audit Committee
Mr. Peterson is a mutual fund industry consultant. He was a partner of KPMG LLP (an accounting firm) until July 1999. Mr. Peterson joined William Blair Funds in February 2007 as a member of the Board of Trustees. From January 2004 to April 2005, Mr. Peterson served as Independent President of the Strong Mutual Funds.
Lemma W. Senbet (1946) Director since 2005
Dr. Senbet is the William E. Mayer Chair Professor of Finance and Director, Center for Financial Policy, at the University of Maryland, Robert H. Smith School of Business. He was chair of the Finance Department from 1998 to 2006. Previously he was a chaired professor of finance at the University of Wisconsin-Madison. Also, he was director of the Fortis Funds from March 2000 to July 2002. Dr. Senbet served the finance profession in various capacities, including as director of the American Finance Association and President of the Western Finance Association. In 2006, Dr. Senbet was inducted Fellow of Financial Management Association International for his career-long distinguished scholarship and professional service.
Interested Directors and Officers
David N. Levenson (1966) Director since 2010
Mr. Levenson currently serves as President of The Hartford’s Wealth Management business. He was appointed to this role in July 2010. Previously, Mr. Levenson served as Executive Vice President of Legacy Holdings for The Hartford from June 2009 to July 2010. From 2006 to 2009, Mr. Levenson was with Hartford Life Insurance K.K. where he served as President and Chief Executive Officer from 2007 to 2009. He served as Managing Director of Hartford Investment Management Company from 2005 to 2006. Additionally, Mr. Levenson serves as Executive Vice President of The Hartford and as President, Director and Chief Executive Officer of Hartford Life Insurance Company (“HLIC”) and Hartford Life, Inc. (“HL Inc.”).
Lowndes A. Smith (1939) Director since 1996 (HSF) and 2002 (HSF2), Co-Chairman of the Investment Committee
Mr. Smith served as Vice Chairman of The Hartford from February 1997 to January 2002, as President and Chief Executive Officer of HL Inc. from February 1997 to January 2002, and as President and Chief Operating Officer of The Hartford Life Insurance Companies from January 1989 to January 2002. Mr. Smith serves as a Director of White Mountains Insurance Group, Ltd., One Beacon Insurance and Symetra Financial and as a Managing Director of Whittington Gray Associates.
Other Officers
James E. Davey (1964) President and Chief Executive Officer since 2010
Mr. Davey serves as Executive Vice President of HLIC. Additionally, Mr. Davey serves as President, Chief Executive Officer and Manager of Hartford Investment Financial Services, Inc. (“HIFSCO”) and President, Chief Executive Officer and Manager of HL Advisors. Mr. Davey joined The Hartford in 2002.
Michael R. Dressen (1963) AML Compliance Officer since 2011
Mr. Dressen currently serves as Assistant Vice President of HLIC. He also serves as Chief Compliance Officer and AML Compliance Officer of Hartford Administrative Services Company (“HASCO”) and as Assistant Secretary and Compliance Officer of HIFSCO. Mr Dressen joined The Hartford in 2005 from State Farm Insurance Companies where he held various positions related to mutual funds, variable products, and property casualty insurance.
Tamara L. Fagely (1958) Vice President, Treasurer and Controller since 2002 (HSF) and 1993 (HSF2)
Ms. Fagely has been a Vice President of HASCO since 1998 and Chief Financial Officer since 2006. Currently Ms. Fagely is a Vice President of HLIC. She served as Assistant Vice President of HLIC from December 2001 through March 2005. In addition, Ms. Fagely is Controller and Chief Financial Officer of HIFSCO.
Dr. Robert J. Froehlich (1953) Senior Managing Director since 2009
Dr. Froehlich joined The Hartford as Senior Managing Director in September 2009. Prior to joining The Hartford, Dr. Froehlich served as Vice Chairman of Deutsche Asset Management from 1997-2009.
Edward P. Macdonald (1967) Vice President, Secretary and Chief Legal Officer since 2005
Mr. Macdonald serves as Vice President of HLIC and Chief Legal Officer of Mutual Funds and Vice President of HIFSCO. He also serves as Vice President and Secretary of HASCO, and Chief Legal Officer, Secretary and Vice President of HL Advisors. Mr. Macdonald joined The Hartford in 2005.
Vernon J. Meyer (1964) Vice President since 2006
Mr. Meyer serves as Senior Vice President of HLIC. He also serves as Senior Vice President of HIFSCO and HL Advisors. Mr. Meyer joined The Hartford in 2004.
Colleen B. Pernerewski (1969) Vice President and Chief Compliance Officer since 2010
Ms. Pernerewski serves as Vice President and Chief Investment Advisor Compliance Officer of HIFSCO and as Vice President and Chief Compliance Officer of HL Advisors. Ms. Pernerewski joined The Hartford in 2005 from Travelers Life and Annuity where she served as Counsel (2004-2005). Prior to Travelers Life and Annuity, Ms. Pernerewski held the position of Counsel at The Hartford (1998-2004).
Elizabeth L. Schroeder (1966) Vice President since 2010
Ms. Schroeder currently serves as Assistant Vice President of HLIC. Ms. Schroeder joined HLIC in 1991. She is also an Assistant Vice President of HASCO, HIFSCO and HL Advisors.
Martin Swanson (1962) Vice President since 2010
Mr. Swanson is a Vice President of HLIC. Mr. Swanson also serves as Vice President/Marketing for HIFSCO. Prior to joining HLIC in 1998, Mr. Swanson was a Vice President at PaineWebber, Inc.
Jane Wolak (1961) Vice President since 2009
Ms. Wolak currently serves as Senior Vice President of HLIC. Ms. Wolak joined HLIC as Vice President, Retail Product Services in May 2007. She is also Vice President of HASCO. Previously, Ms. Wolak was with Sun Life Financial where she held the position of Vice President, Service Center Operations from 2001-2007.
HOW TO OBTAIN A COPY OF THE FUND’S PROXY VOTING POLICIES AND VOTING RECORDS (UNAUDITED)
A description of the policies and procedures that the Fund uses to determine how to vote proxies relating to portfolio securities and a record of how the Fund voted any proxies for the twelve-month period ended June 30, 2011 are available (1) without charge, upon request, by calling 800-862-6668 and (2) on the SEC’s website at http://www.sec.gov.
QUARTERLY PORTFOLIO HOLDINGS INFORMATION (UNAUDITED)
The Fund files a complete schedule of portfolio holdings with the SEC for the first and third quarters of each fiscal year on Form N-Q. The Fund’s Forms are available (1) without charge, upon request, by calling 800-862-6668 and (2) on the SEC’s website at http://www.sec.gov. The Form N-Q may be reviewed and copied at the SEC’s Public Reference Room in Washington, DC. Information on the operation of the Public Reference Room may be obtained by calling 1-800-SEC-0330.
Hartford Small Company HLS Fund
Expense Example (Unaudited)
Your Fund's Expenses
As a shareholder of the Fund, you incur two types of costs: (1) transaction costs and (2) ongoing costs including investment management fees, distribution fees, and other fund expenses. This example is intended to help you understand your ongoing costs (in dollars) of investing in the Fund and to compare these costs with the ongoing costs of investing in other mutual funds. The example is based on an investment of $1,000 invested at the beginning of the period and held for the period of June 30, 2011 through December 31, 2011.
Actual Expenses
The first set of columns of the table below provides information about actual account values and actual expenses. You may use the information in this column, together with the amount you invested, to estimate the expenses that you paid over the period. Simply divide your account value by $1,000 (for example, an $8,600 account value divided by $1,000 = 8.6), then multiply the result by the number in the line under the heading entitled “Expenses Paid During Period” to estimate the expenses you paid on your account during this period.
Hypothetical Example for Comparison Purposes
The second set of columns of the table below provides information about hypothetical account values and hypothetical expenses based on the Fund’s actual expense ratio and an assumed rate of return of 5% per year before expenses, which is not the Fund’s actual return. The hypothetical account values and expenses may not be used to estimate the actual ending account balance or expenses you paid for the period. You may use this information to compare the ongoing costs of investing in the Fund and other funds. To do so, compare this 5% hypothetical example with the 5% hypothetical examples that appear in the shareholder reports of the other funds.
Please note that the expenses shown in the table are meant to highlight your ongoing costs only and do not reflect any transactional costs, such as sales charges (loads) and CDSC. Therefore, the second set of columns of the table is useful in comparing ongoing costs only, and will not help you determine the relative total costs of owning different funds. In addition, if these transactional costs were included, your costs would be higher. Expenses are equal to the Fund's annualized expense ratios multiplied by average account value over the period, multiplied by 184/365 (to reflect the one-half year period).
| | | Actual return | | | Hypothetical (5% return before expenses) | | | | | | | | | | |
| | | Beginning
Account Value
June 30, 2011 | | | Ending Account Value
December 31, 2011 | | | Expenses paid during the period
June 30, 2011
through
December 31, 2011 | | | Beginning
Account Value
June 30, 2011 | | | Ending Account Value
December 31, 2011 | | | Expenses paid during the period
June 30, 2011
through
December 31, 2011 | | | Annualized expense ratio | | | Days in the current 1/2 year | | | Days in the full year | |
| Class IA | | $ | 1,000.00 | | | $ | 855.55 | | | $ | 3.37 | | | $ | 1,000.00 | | | $ | 1,021.58 | | | $ | 3.67 | | | | 0.72 | % | | | 184 | | | | 365 | |
| Class IB | | $ | 1,000.00 | | | $ | 854.44 | | | $ | 4.53 | | | $ | 1,000.00 | | | $ | 1,020.32 | | | $ | 4.94 | | | | 0.97 | % | | | 184 | | | | 365 | |
Hartford Small Company HLS Fund
Approval of Investment Management and Investment Sub-Advisory Agreements (Unaudited)
Section 15(c) of the Investment Company Act of 1940, as amended (the “1940 Act”), requires that each mutual fund’s board of directors, including a majority of those directors who are not “interested persons” of the mutual fund, as defined in the 1940 Act (the “Independent Directors”), annually review and consider the continuation of the mutual fund’s investment advisory and sub-advisory agreements. At its meeting held on August 2-3, 2011, the Board of Directors (the “Board”) of Hartford Series Fund, Inc., including each of the Independent Directors, unanimously voted to approve the continuation of the investment management agreement for Hartford Small Company HLS Fund (the “Fund”) with HL Investment Advisors, LLC (“HL Advisors”) and the continuation of the investment sub-advisory agreement between HL Advisors and the Fund’s sub-adviser, Wellington Management Company, LLP (the “Sub-adviser,” and together with HL Advisors, the “Advisers”) (collectively, the “Agreements”).
In the months preceding the August 2-3, 2011 meeting, the Board requested, received, and reviewed written responses from the Advisers to questions posed to them on behalf of the Independent Directors and supporting materials relating to those questions and responses. The Board considered information furnished to the Board at its meetings throughout the year, as well as information specifically prepared in connection with the annual approval of the Agreements at the Board’s meetings held on June 21-22, 2011 and August 2-3, 2011. Information provided to the Board at its meetings throughout the year included, among other things, reports on Fund performance, legal and compliance matters, sales and marketing activity, shareholder services, and the other services provided to the Fund by the Advisers and their affiliates. In addition, the Board received in-person presentations by Fund officers and representatives of HL Advisors at the Board’s meetings on June 21-22, 2011 and August 2-3, 2011 concerning the Agreements.
The Independent Directors, advised by independent legal counsel, engaged two service providers to assist them with evaluating the Agreements with respect to the Fund. Lipper Inc. (“Lipper”), an independent provider of investment company data, was retained to provide the Board with reports on how the Fund’s contractual management fees, actual management fees, other non-management fees, overall expense ratios and investment performance compared to those of mutual funds with similar investment objectives. The Independent Directors also engaged an independent financial services consulting firm (the “Consultant”) to assist them in evaluating the Fund’s management fees, sub-advisory fees, other non-management fees, overall expense ratios and investment performance. In addition, the Consultant reviewed the profitability calculations utilized by HL Advisors in connection with the continuation of the investment management agreement.
In determining to continue the Agreements for the Fund, the members of the Board reviewed and evaluated information and factors they believed to be relevant and appropriate in light of the information that the Board deemed necessary and appropriate through the exercise of their reasonable business judgment. While individual members of the Board may have weighed certain factors differently, the Board’s determination to continue the Agreements was based on a comprehensive consideration of all information provided to the Board throughout the year and specifically with respect to the continuation of the Agreements. A more detailed discussion of the factors the Board considered with respect to its approval of the Agreements is provided below.
Nature, Extent, And Quality Of Services Provided by the Advisers
The Board requested and considered information concerning the nature, extent, and quality of the services provided to the Fund by the Advisers. The Board considered, among other things, the terms of the Agreements and the range of services provided by the Advisers. The Board considered the Advisers’ professional personnel who provide services to the Fund, including each Adviser’s ability and experience in attracting and retaining qualified personnel to service the Fund. The Board considered each Adviser’s reputation and overall financial strength, as well as its willingness to consider and implement organizational and operational changes designed to improve services to the Fund. In addition, the Board considered the quality of each Adviser’s communications with the Board and responsiveness to Board inquiries.
The Board also requested and evaluated information concerning each Adviser’s regulatory and compliance environment. In this regard, the Board requested and reviewed information on each Adviser’s compliance policies and procedures, compliance history, and a report from the Fund’s Chief Compliance Officer on each Adviser’s compliance with applicable laws and regulations, including responses to regulatory developments and compliance issues raised by regulators. The Board also noted the Advisers’ support of the Fund’s compliance control structure, particularly the resources devoted by the Advisers in support of the Fund’s obligations pursuant to Rule 38a-1 under the 1940 Act.
Hartford Small Company HLS Fund
Approval of Investment Management and Investment Sub-Advisory Agreements (Unaudited) – (continued)
With respect to HL Advisors, the Board noted that under the Agreements, HL Advisors is responsible for the management of the Fund, including overseeing fund operations and service providers, as well as investment advisory services in connection with selecting, monitoring and supervising the Sub-adviser. The Board considered HL Advisors’ ongoing monitoring of people, process and performance, including its quarterly reviews of each of the Hartford HLS Funds, semi-annual meetings with the leaders of each Fund’s portfolio management team, and oversight of the Funds’ 49 portfolio managers. The Board recognized that HL Advisors has demonstrated a record of making changes to the management and/or strategies of the Funds when warranted. The Board considered HL Advisors’ oversight of the Sub-adviser’s investment approach and results, process for monitoring best execution of portfolio trades by the Sub-adviser, and approach to risk management with respect to the Fund and the service providers to the Fund. The Board also considered HL Advisors’ oversight of compliance with the Fund’s objective and policies as well as with applicable laws and regulations, noting that regulatory and other developments had over time led to an increase in the scope of HL Advisors’ services in this regard. In addition, the Board considered HL Advisors’ ongoing commitment to review and rationalize the Hartford fund family’s product line-up and the expenses that HL Advisors had incurred in connection with fund combinations in recent years. The Board considered that HL Advisors or its affiliates are responsible for providing the Fund’s officers. The Board also noted that Hartford Life Insurance Company (“HLIC”) provides administrative services to the Fund. The Board considered its experiences with HL Advisors and HLIC with respect to each of these services.
With respect to the Sub-adviser, who provides day-to-day portfolio management services, the Board considered the quality of the Fund’s portfolio managers, the Sub-adviser’s other investment personnel, its investment philosophy and process, investment research capabilities and resources, performance record, trade execution capabilities and experience. The Board considered the experience of the Fund’s portfolio managers, the number of accounts managed by the portfolio managers, and the Sub-adviser’s method for compensating the portfolio managers.
Based on these considerations, the Board concluded that it was satisfied with the nature, extent and quality of the services provided to the Fund by HL Advisors and the Sub-adviser.
Performance of the Fund and the Advisers
The Board considered the investment performance of the Fund. In this regard, the Board reviewed the performance of the Fund over different time periods presented in the materials and evaluated HL Advisors’ analysis of the Fund’s performance for these time periods. The Board considered information and materials provided to the Board by the Advisers concerning Fund performance, as well as information from Lipper comparing the investment performance of the Fund to an appropriate benchmark and universe of peer funds. The Board noted that the performance of the Fund was within expectations.
The Board considered the detailed investment analytics reports provided by The Hartford’s Investment Advisory Group throughout the year. These reports include, among other things, information on the Fund’s gross and net returns, the Fund’s investment performance relative to an appropriate benchmark and peer group, various statistics concerning the Fund’s portfolio, and a narrative summary of various factors affecting Fund performance. The Board considered the Advisers’ cooperation with the Investment Committee, which assists the Board in evaluating the performance of the Fund at periodic meetings throughout the year. The Board also considered the analysis provided by the Consultant relating to the Fund’s performance track record.
In light of all the considerations noted above, the Board concluded that it had continued confidence in HL Advisors’ and the Sub-adviser’s overall capabilities to manage the Fund.
Costs of the Services and Profitability of the Advisers
The Board reviewed information regarding HL Advisors’ cost to provide investment management and related services to the Fund and HL Advisors’ profitability, both overall and for the Fund, on a pre-tax basis without regard to distribution expenses. The Board also requested and reviewed information about the profitability to HL Advisors and its affiliates from all services provided to the Fund and all aspects of their relationship with the Fund. The Board also requested and received information relating to the operations and profitability of the Sub-adviser.
The Board considered the Consultant’s review of the profitability calculations utilized by HL Advisors in connection with the continuation of the investment management agreement. In this regard, the Consultant reported that The Hartford’s process for calculating and reporting Fund profitability is reasonable, sound and well within common industry practice.
Based on these considerations, the Board concluded that the profits anticipated to be realized by the Advisers and their affiliates from their relationships with the Fund would not be excessive.
Comparison of Fees and Services Provided by the Advisers
The Board considered comparative information with respect to the management fees to be paid by the Fund to HL Advisors and the total expense ratios of the Fund. The Board also considered comparative information with respect to the sub-advisory fees to be paid by HL Advisors to the Sub-adviser, to the extent applicable. In this regard, the Board requested and reviewed information from HL Advisors and the Sub-adviser relating to the management and sub-advisory fees, including the sub-advisory fee schedule for the Fund, and total operating expenses for the Fund. The Board considered that the management fee for the Fund includes the fee paid to HLIC for providing certain administrative services to the Fund. The Board also reviewed information from Lipper comparing the Fund’s contractual management fees, actual management fees and overall expense ratios relative to a group of funds selected by Lipper, in consultation with the Consultant, and a broader universe of funds selected by Lipper.
While the Board recognized that comparisons between the Fund and peer funds are imprecise, given the differing service levels and characteristics of mutual funds and the different business models and cost structures of the Advisers, the comparative information provided by Lipper assisted the Board in evaluating the reasonableness of the Fund’s management and sub-advisory fees and total operating expenses. In addition, the Board considered the analysis and recommendations of the Consultant relating to the Fund’s management and sub-advisory fees and total operating expenses.
Based on these considerations, the Board concluded that the Fund’s fees and total operating expenses, in conjunction with the information about quality of services, profitability, economies of scale, and other matters discussed, were reasonable in light of the services provided.
Economies of Scale
The Board requested and considered information regarding the Advisers’ realization of economies of scale with respect to the Fund and whether the fee levels reflect these economies of scale for the benefit of the Fund’s investors. With respect to HL Advisors, the Board considered representations from HL Advisors that it is difficult to anticipate whether and to what extent economies may be realized by HL Advisors as assets grow over time. The Board reviewed the breakpoints in the management fee schedule for the Fund, which reduces fee rates as Fund assets grow over time. The Board recognized that a fund with assets beyond the last breakpoint level will continue to benefit from economies of scale because additional assets are charged the lowest breakpoint fee resulting in lower overall effective management fee rates. The Board also recognized that a fee schedule that reaches a lower breakpoint quickly provides shareholders with the benefit of anticipated or potential economies of scale.
The Board reviewed and evaluated materials from Lipper showing how management fee schedules of peer funds reflect economies of scale for the benefit of investors as a peer fund’s assets hypothetically increase over time. Based on information provided by HL Advisors, Lipper, and the Consultant, the Board recognized that there is no uniform methodology for establishing breakpoints or uniform pattern in asset levels that trigger breakpoints or the amounts of breakpoints triggered.
After considering all of the information available to it, the Board concluded that it was satisfied with the extent to which economies of scale would be shared for the benefit of the Fund’s shareholders based on currently available information and the effective advisory fees and expense ratios for the Fund at its current and reasonably anticipated asset levels. The Board noted, however, that it would continue to monitor future growth in Fund assets and the appropriateness of additional breakpoints.
Hartford Small Company HLS Fund
Approval of Investment Management and Investment Sub-Advisory Agreements (Unaudited) – (continued)
Other Benefits
The Board considered other benefits to the Advisers and their affiliates from their relationships with the Fund, including the role of the Fund in supporting the variable life insurance and variable annuity products offered by The Hartford. The Board reviewed information noting that HLIC, an affiliate of HL Advisors, receives fees for providing certain administrative services to the Fund, and that HLIC also receives fees for fund accounting and related services from the Fund, and the Board considered information on expected profits to HLIC or its affiliates for such services. The Board also considered that Hartford Administrative Services Company (“HASCO”), the Fund’s transfer agent and an affiliate of HL Advisors, receives transfer agency compensation from the Fund, and the Board reviewed information on the expected profitability of the Fund’s transfer agency function to HASCO. The Board considered information provided by HASCO indicating that the transfer agent fees charged by HASCO to the Fund were fair and reasonable based on publicly available information.
The Board also considered that Hartford Securities Distribution Company, Inc., as principal underwriter of the Fund, receives 12b-1 fees from the Fund. The Board also noted that certain affiliates of HL Advisors distribute shares of the Fund and receive compensation in that connection.
The Board considered benefits to the Sub-adviser from its use of the Fund’s brokerage commissions to obtain soft dollar research, and representations from HL Advisors and the Sub-adviser that the Sub-adviser would not make any revenue-sharing payments or any other type of distribution payments to HL Advisors or its affiliates.
The Board considered the benefits to shareholders of being part of the Hartford family of funds. The Board considered HL Advisors’ efforts to provide investors in the family with a broad range of investment styles and asset classes.
* * * *
Based upon its review of these various factors, among others, the Board concluded that it is in the best interests of the Fund and its shareholders for the Board to approve the Agreements for an additional year. In reaching this decision, the Board did not assign relative weights to the factors discussed above or deem any one or group of them to be controlling in and of themselves. In connection with their deliberations, the Independent Directors met separately in executive session on several occasions, with independent legal counsel, to review the relevant materials and consider their responsibilities under relevant laws and regulations.
The Hartford
P.O. Box 5085
Hartford, CT 06102-5085
Hartford Series Fund, Inc. is underwritten and distributed by Hartford Securities Distribution Company, Inc.
"The Hartford" is The Hartford Financial Services Group, Inc. and its subsidiaries.
Hartford Series Fund, Inc. inception dates range from 1977 to date. Hartford Series Fund, Inc. is not a subsidiary of The Hartford but is underwritten, distributed by and advised by subsidiaries of The Hartford. Investments in Hartford Series Fund, Inc. are not guaranteed by The Hartford or any other entity.
You should carefully consider investment objectives, risks, and charges and expenses of Hartford HLS Funds before investing. This and other information can be found in the Fund’s prospectus or summary prospectus, which can be obtained by calling 800-862-6668. Please read them carefully before you invest or send money.
HLSAR-SC11 2-12 109078 Printed in U.S.A ©2011 The Hartford, Hartford, CT 06115 | |

A MESSAGE FROM THE PRESIDENT
Dear Fellow Shareholders:
I want to take this opportunity to say thank you for investing in Hartford HLS Funds.
This has been a tumultuous year. In the beginning of 2011, we witnessed tension-fueled political uprisings in the already-volatile Middle East and North Africa region. We also watched as Japan dealt with a series of crises including a massive earthquake and subsequent tsunami. Yet, U.S. economic conditions continued to improve, with gains in consumer confidence and retail sales. During the first half of 2011, domestic, international, and world indices (as measured by the S&P 500, MSCI EAFE and MSCI World) were all up more than 5% through June, 30 2011.
The economic recovery, however, lost momentum in the second half of 2011. The employment and housing markets both remain extremely challenged. Investors continue to be concerned about the implications of the European sovereign debt crisis, as well as our own high levels of domestic debt. Fears that the European sovereign debt crisis could continue to drag down the global economy have weighed heavily on stocks.
Ongoing apprehension regarding the U.S. debt ceiling during the summer and the resulting downgrade of the U.S. sovereign credit rating by Standard & Poor’s also contributed to weaker investor confidence.
There are, however, some reasons to remain confident. Corporations have record levels of cash on their balance sheets—corporate cash has doubled in the past 10 years. In addition, U.S. gross domestic product expanded at a 2.5 percent annual rate in the third quarter according to the Commerce Department, as consumers and businesses set aside fears about the recovery and stepped up spending. Corporate earnings have also remained positive, with a majority of companies beating expectations each quarter this year. This momentum will hopefully continue into next year.
As we head into 2012, in light of the continued market volatility, now would be a good time to schedule a meeting with your financial advisor to examine your current investment strategy and determine whether you are on the right track.
| • | Does your fixed-income portfolio complement your equity portfolio? |
| • | Are you receiving diversified sources of income? |
| • | Is your portfolio still in line with your risk tolerance and investment time horizon? |
Talk to your advisor to see what changes you should make to address these concerns and opportunities.
Thank you again for investing with Hartford HLS Funds.
James Davey
President
Hartford HLS Funds
Hartford Stock HLS Fund
Table of Contents
This report is prepared for the general information of contract owners and qualified retirement plan participants. It is not an offer of contracts or of qualified retirement plans. It should not be used in connection with any offer, except in conjunction with the appropriate product prospectus which contains all pertinent information including the applicable sales, administrative and other charges.
The views expressed in the Fund’s Manager Discussion under ‘‘Why did the Fund perform this way?’’ and ‘‘What is the outlook?’’ are views of the Fund’s sub-adviser and portfolio management team through the end of the period and are subject to change based on market and other conditions.
Hartford Stock HLS Fund inception 08/31/1977
(sub-advised by Wellington Management Company, LLP)
Investment objective – Seeks long-term growth of capital.
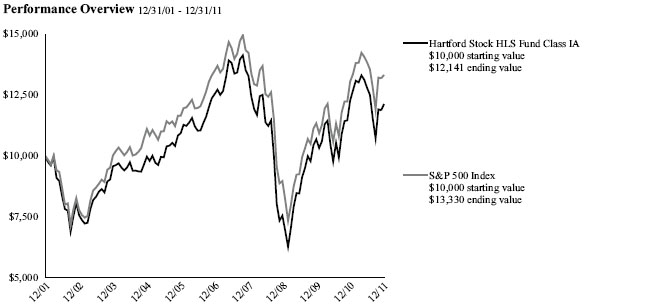
The chart above shows the growth of a $10,000 investment in Class IA. Growth results in classes other than Class IA will vary from what is seen above due to differences in the expenses charged to those share classes.
| Average Annual Total Returns (as of 12/31/11) |
| |
| | 1 Year | 5 Year | 10 Year |
| Stock IA | -1.09% | -0.65% | 1.96% |
| Stock IB | -1.34% | -0.90% | 1.71% |
| S&P 500 Index | 2.09% | -0.25% | 2.92% |
| | | | |
PAST PERFORMANCE IS NOT INDICATIVE OF FUTURE RESULTS.
| Total returns presented above were calculated using the Fund's net asset value available to shareholders for sale or redemption of Fund shares on December 31, 2011, which may exclude investment transactions as of this date. |
S&P 500 Index is a market capitalization-weighted price index composed of 500 widely held common stocks.
You cannot invest directly in an index.
The chart represents a hypothetical investment in the Fund. Performance data represents past performance and current performance could be higher or lower.
Performance information may reflect historical or current expense waivers/reimbursements from the investment adviser, without which performance would have been lower. For information on current expense waivers/reimbursements, please see the prospectus.
The value of the Fund will fluctuate so that when redeemed, it may be worth more or less than the original investment. The chart and table do not reflect the deductions of taxes, sales charges or other fees which may be applied at the variable life insurance, variable annuity or qualified retirement plan product level. Any such additional sales charges or other fees or expenses would lower the contract’s or plan’s performance.
Hartford Stock HLS Fund
Manager Discussion (Unaudited)
December 31, 2011
| Portfolio Managers | | |
| Steven T. Irons, CFA | Peter I. Higgins, CFA | |
| Senior Vice President | Senior Vice President | |
| | | |
How did the Fund perform?
The Class IA shares of the Hartford Stock HLS Fund returned -1.09% for the twelve-month period ended December 31, 2011, underperforming its benchmark, the S&P 500 Index, which returned 2.09% for the same period. The Fund also underperformed the -1.01% return of the average fund in the Lipper Large Cap Core VP-UF Funds peer group, a group of funds with investment strategies similar to those of the Fund.
Why did the Fund perform this way?
The twelve-month period ended December 31, 2011 was yet another extremely volatile period for equity markets. Global equities started the year on a strong note and continued to march higher in the first quarter of 2011, driven by investors’ enthusiasm for additional government debt purchases by the U.S. Federal Reserve, the extension of tax cuts in the U.S., strong earnings growth, and generally improving economic data. This enthusiasm reversed later in the period, however, as concerns surfaced that the global economy could slip back into recession, resulting in a rapid decline in equity markets. Fears about sovereign debt and solvency in the eurozone, slowing economic expansion in China and the U.S., and uncertainty about the sustainability of corporate earnings growth combined to produce an extremely volatile stock market, and return correlations among stocks spiked as investors shed risk and fled to safety. Markets ended the year on a positive note in the final month of the period with encouraging employment and manufacturing data in the U.S.
Overall equity market performance was mixed for the period across all market capitalizations: large-cap equities (+2%) outperformed mid-caps (-2%) and small-caps (-4%) equities as represented by the S&P 500, S&P 400 MidCap, and Russell 2000 indices, respectively. During the twelve-month period seven of ten sectors rose within the S&P 500 Index, led by Utilities (+20%), Consumer Staples (+14%), and Health Care (+13%). Financials (-17%) and Materials (-10%) lagged on both an absolute and a relative basis.
The Fund’s underperformance versus the benchmark was driven by weak security selection in Industrials, Energy, and Consumer Discretionary, as well as underweight exposure (i.e. the Fund’s sector position was less than the benchmark position) to the Consumer Staples and Utilities sectors. This was modestly offset by stronger selection in Materials and Telecommunication Services, as well as an overweight (i.e. the Fund’s sector position was greater than the benchmark position) exposure to Health Care. Note that sector positioning is a result of bottom-up security selection (i.e. stock by stock fundamental research).
Stocks that detracted the most from benchmark-relative (i.e. performance of the Fund as measured against the benchmark) returns during the period were Hewlett-Packard (Information Technology), PACCAR (Industrials), and IBM (Information Technology). Hewlett-Packard, a global technology company, reduced earnings guidance for 2012 due to macroeconomic headwinds and the impact of floods in Thailand on disk drive production. Shares of PACCAR, a manufacturer of light, medium, and heavy-duty trucks and after-market parts, fell due to concerns about the company’s exposure to the weak European economy. Global services and software provider IBM reported positive quarterly results driving its stock price higher; not owning it detracted from our relative returns. Our holdings in financial services companies Bank of America and Goldman Sachs also detracted from returns on an absolute (i.e. total return) basis.
Top contributors to relative performance during the period were Buck Holdings-Dollar General (Consumer Discretionary), Google (Information Technology), and Kansas City Southern (Industrials). Buck Holdings-Dollar General, a discount retailer, saw its shares rise as store customer traffic increased in this trade-down economy. Shares of Google, a leading provider of online search, internet content services, and web-based software applications, performed strongly after reporting above-consensus third quarter earnings. Freight rail transportation provider Kansas City Southern reported better-than-expected second quarter earnings driven by revenue increases from higher carload volumes. Exxon Mobil (Energy), Pfizer (Health Care), and Apple (Information Technology) also contributed positively to the Fund’s returns on an absolute basis.
What is the outlook?
We are constructive on our outlook for 2012 but recognize there are many factors at play, both positive and negative. Certain depressed sectors, such as housing, will likely start to see some traction which should help employment trends. However, many of our exporters may see headwinds as a
Hartford Stock HLS Fund
Manager Discussion (Unaudited) – (continued)
December 31, 2011
result of the strengthening in the U.S. dollar over the past several months. We believe the government needs to continue to improve its fiscal position and will likely constrain growth. Given this environment, we expect to see continued modest economic growth as the most likely scenario. With respect to equity markets, current expectations for the S&P 500 (ex-financials) are for low-single digit sales growth and mid-single digit earnings growth, a significant deceleration from the double digit pace seen in 2011. These expectations are in-line with our economic view and we expect modest upside to the market from these levels.
We continue to focus our efforts on stock-by-stock fundamental research to construct a diversified large-cap core portfolio. We screen for companies on specific valuation, return on capital, and earnings characteristics, and we focus on understanding how returns on capital are being created, employing a disciplined valuation methodology for both purchases and sales. At the end of the period, our bottom-up investment approach resulted in overweight exposures in Information Technology, Health Care, and Financials, as we found a number of attractive investment opportunities in these sectors. The Fund’s largest underweights relative to the S&P 500 Index were in Consumer Staples, Telecommunication Services, and Utilities.
| Diversification by Industry |
| as of December 31, 2011 |
| Industry (Sector) | | Percentage of
Net Assets | |
| Automobiles & Components (Consumer Discretionary) | | | 2.6 | % |
| Banks (Financials) | | | 6.8 | |
| Capital Goods (Industrials) | | | 6.3 | |
| Consumer Services (Consumer Discretionary) | | | 0.9 | |
| Diversified Financials (Financials) | | | 7.5 | |
| Energy (Energy) | | | 10.8 | |
| Food & Staples Retailing (Consumer Staples) | | | 1.6 | |
| Food, Beverage & Tobacco (Consumer Staples) | | | 5.9 | |
| Health Care Equipment & Services (Health Care) | | | 3.1 | |
| Household & Personal Products (Consumer Staples) | | | 1.1 | |
| Insurance (Financials) | | | 1.0 | |
| Materials (Materials) | | | 1.7 | |
| Media (Consumer Discretionary) | | | 2.7 | |
| Pharmaceuticals, Biotechnology & Life Sciences (Health Care) | | | 12.9 | |
| Real Estate (Financials) | | | 0.6 | |
| Retailing (Consumer Discretionary) | | | 6.0 | |
| Semiconductors & Semiconductor Equipment (Information Technology) | | | 2.5 | |
| Software & Services (Information Technology) | | | 9.6 | |
| Technology Hardware & Equipment (Information Technology) | | | 11.0 | |
| Telecommunication Services (Services) | | | 0.6 | |
| Transportation (Industrials) | | | 2.6 | |
| Utilities (Utilities) | | | 1.5 | |
| Short-Term Investments | | | 0.2 | |
| Other Assets and Liabilities | | | 0.5 | |
| Total | | | 100.0 | % |
|
Hartford Stock HLS Fund
Schedule of Investments
December 31, 2011
(000’s Omitted)
| Shares or Principal Amount | | Market Value ╪ | |
COMMON STOCKS - 99.3% | |
| | | | | Automobiles & Components - 2.6% | | | | |
| | 1,650 | | | Ford Motor Co. w/ Rights ● | | $ | 17,755 | |
| | 764 | | | Harley-Davidson, Inc. | | | 29,705 | |
| | | | | | | | 47,460 | |
| | | | | Banks - 6.8% | | | | |
| | 815 | | | BB&T Corp. | | | 20,511 | |
| | 3,237 | | | Mitsubishi UFJ Financial Group, Inc. | | | 13,702 | |
| | 268 | | | PNC Financial Services Group, Inc. | | | 15,450 | |
| | 1,114 | | | US Bancorp | | | 30,123 | |
| | 1,665 | | | Wells Fargo & Co. | | | 45,896 | |
| | | | | | | | 125,682 | |
| | | | | Capital Goods - 6.3% | | | | |
| | 338 | | | 3M Co. | | | 27,617 | |
| | 280 | | | Boeing Co. | | | 20,553 | |
| | 468 | | | Ingersoll-Rand plc | | | 14,254 | |
| | 696 | | | PACCAR, Inc. | | | 26,064 | |
| | 226 | | | Rockwell Collins, Inc. | | | 12,530 | |
| | 217 | | | Stanley Black & Decker, Inc. | | | 14,689 | |
| | | | | | | | 115,707 | |
| | | | | Consumer Services - 0.9% | | | | |
| | 427 | | | DeVry, Inc. | | | 16,438 | |
| | | | | | | | | |
| | | | | Diversified Financials - 7.5% | | | | |
| | 81 | | | BlackRock, Inc. | | | 14,420 | |
| | 682 | | | Citigroup, Inc. | | | 17,951 | |
| | 150 | | | Goldman Sachs Group, Inc. | | | 13,592 | |
| | 1,027 | | | Invesco Ltd. | | | 20,622 | |
| | 1,362 | | | JP Morgan Chase & Co. | | | 45,283 | |
| | 247 | | | SEI Investments Co. | | | 4,285 | |
| | 404 | | | T. Rowe Price Group, Inc. | | | 23,029 | |
| | | | | | | | 139,182 | |
| | | | | Energy - 10.8% | | | | |
| | 328 | | | Anadarko Petroleum Corp. | | | 25,021 | |
| | 687 | | | Chesapeake Energy Corp. | | | 15,302 | |
| | 1,020 | | | Exxon Mobil Corp. | | | 86,489 | |
| | 260 | | | Occidental Petroleum Corp. | | | 24,343 | |
| | 317 | | | Petroleo Brasileiro S.A. ADR | | | 7,885 | |
| | 1,292 | | | Petroleum Geo-Services ● | | | 14,085 | |
| | 378 | | | Statoilhydro ASA ADR | | | 9,671 | |
| | 342 | | | Suncor Energy, Inc. | | | 9,854 | |
| | 213 | | | Ultra Petroleum Corp. ● | | | 6,314 | |
| | | | | | | | 198,964 | |
| | | | | Food & Staples Retailing - 1.6% | | | | |
| | 509 | | | CVS Caremark Corp. | | | 20,774 | |
| | 270 | | | Sysco Corp. | | | 7,910 | |
| | | | | | | | 28,684 | |
| | | | | Food, Beverage & Tobacco - 5.9% | | | | |
| | 642 | | | General Mills, Inc. | | | 25,943 | |
| | 647 | | | Kraft Foods, Inc. | | | 24,157 | |
| | 697 | | | PepsiCo, Inc. | | | 46,246 | |
| | 387 | | | Unilever N.V. NY Shares ADR | | | 13,308 | |
| | | | | | | | 109,654 | |
| | | | | Health Care Equipment & Services - 3.1% | | | | |
| | 147 | | | Edwards Lifesciences Corp. ● | | | 10,357 | |
| | 662 | | | Medtronic, Inc. | | | 25,337 | |
| | 415 | | | UnitedHealth Group, Inc. | | | 21,017 | |
| | | | | | | | 56,711 | |
| | | | | Household & Personal Products - 1.1% | | | | |
| | 317 | | | Procter & Gamble Co. | | | 21,140 | |
| | | | | | | | | |
| | | | | Insurance - 1.0% | | | | |
| | 227 | | | Marsh & McLennan Cos., Inc. | | | 7,184 | |
| | 501 | | | Unum Group | | | 10,552 | |
| | | | | | | | 17,736 | |
| | | | | Materials - 1.7% | | | | |
| | 302 | | | Dow Chemical Co. | | | 8,688 | |
| | 159 | | | Monsanto Co. | | | 11,127 | |
| | 275 | | | Nucor Corp. | | | 10,866 | |
| | | | | | | | 30,681 | |
| | | | | Media - 2.7% | | | | |
| | 937 | | | Comcast Corp. Class A | | | 22,223 | |
| | 725 | | | Walt Disney Co. | | | 27,195 | |
| | | | | | | | 49,418 | |
| | | | | Pharmaceuticals, Biotechnology & Life Sciences - 12.9% | | | | |
| | 441 | | | Agilent Technologies, Inc. ● | | | 15,401 | |
| | 539 | | | Amgen, Inc. | | | 34,596 | |
| | 462 | | | Celgene Corp. ● | | | 31,231 | |
| | 1,079 | | | Daiichi Sankyo Co., Ltd. | | | 21,374 | |
| | 113 | | | Gilead Sciences, Inc. ● | | | 4,621 | |
| | 1,225 | | | Merck & Co., Inc. | | | 46,182 | |
| | 1,893 | | | Pfizer, Inc. | | | 40,971 | |
| | 67 | | | Roche Holding AG | | | 11,309 | |
| | 930 | | | Shionogi & Co., Ltd. | | | 11,931 | |
| | 510 | | | UCB S.A. | | | 21,379 | |
| | | | | | | | 238,995 | |
| | | | | Real Estate - 0.6% | | | | |
| | 626 | | | Weyerhaeuser Co. | | | 11,678 | |
| | | | | | | | | |
| | | | | Retailing - 6.0% | | | | |
| | 9,440 | | | Allstar Co. ⌂† | | | 9,776 | |
| | 67 | | | Amazon.com, Inc. ● | | | 11,615 | |
| | 10,986 | | | Buck Holdings L.P. ⌂●† | | | 24,586 | |
| | 230 | | | Kohl's Corp. | | | 11,346 | |
| | 1,538 | | | Lowe's Co., Inc. | | | 39,023 | |
| | 290 | | | Nordstrom, Inc. | | | 14,436 | |
| | | | | | | | 110,782 | |
| | | | | Semiconductors & Semiconductor Equipment - 2.5% | | | | |
| | 744 | | | Maxim Integrated Products, Inc. | | | 19,363 | |
| | 352 | | | Taiwan Semiconductor Manufacturing Co., Ltd. ADR | | | 4,538 | |
| | 316 | | | Texas Instruments, Inc. | | | 9,205 | |
| | 423 | | | Xilinx, Inc. | | | 13,545 | |
| | | | | | | | 46,651 | |
| | | | | Software & Services - 9.6% | | | | |
| | 259 | | | Accenture plc | | | 13,808 | |
| | 389 | | | Automatic Data Processing, Inc. | | | 21,015 | |
| | 605 | | | eBay, Inc. ● | | | 18,362 | |
| | 95 | | | Google, Inc. ● | | | 61,364 | |
| | 358 | | | Lender Processing Services | | | 5,389 | |
| | 865 | | | Microsoft Corp. | | | 22,450 | |
| | 1,945 | | | Western Union Co. | | | 35,511 | |
| | | | | | | | 177,899 | |
| | | | | Technology Hardware & Equipment - 11.0% | | | | |
| | 146 | | | Apple, Inc. ● | | | 58,927 | |
| | 2,382 | | | Cisco Systems, Inc. | | | 43,058 | |
| | 923 | | | EMC Corp. ● | | | 19,871 | |
| | 1,000 | | | Hewlett-Packard Co. | | | 25,760 | |
| | 739 | | | Juniper Networks, Inc. ● | | | 15,083 | |
| | 186 | | | NetApp, Inc. ● | | | 6,746 | |
The accompanying notes are an integral part of these financial statements.
Hartford Stock HLS Fund
Schedule of Investments – (continued)
December 31, 2011
(000’s Omitted)
| Shares or Principal Amount | | Market Value ╪ | |
| COMMON STOCKS - 99.3% - (continued) | | | | |
| | | | | Technology Hardware & Equipment - 11.0% - (continued) | | | | |
| | 609 | | | Qualcomm, Inc. | | $ | 33,323 | |
| | | | | | | | 202,768 | |
| | | | | Telecommunication Services - 0.6% | | | | |
| | 408 | | | Vodafone Group plc ADR | | | 11,433 | |
| | | | | | | | | |
| | | | | Transportation - 2.6% | | | | |
| | 184 | | | Con-way, Inc. | | | 5,373 | |
| | 190 | | | FedEx Corp. | | | 15,900 | |
| | 158 | | | Kansas City Southern ● | | | 10,766 | |
| | 216 | | | United Parcel Service, Inc. Class B | | | 15,831 | |
| | | | | | | | 47,870 | |
| | | | | Utilities - 1.5% | | | | |
| | 447 | | | NextEra Energy, Inc. | | | 27,238 | |
| | | | | | | | | |
| | | | | Total common stocks | | | | |
| | | | | (cost $1,702,672) | | $ | 1,832,771 | |
| | | | | | | | | |
| | | | | Total long-term investments
(cost $1,702,672) | | $ | 1,832,771 | |
| | | | | | | | | |
| SHORT-TERM INVESTMENTS - 0.2% | | | | |
| Repurchase Agreements - 0.2% | | | | |
| | | | | Bank of America Merrill Lynch TriParty Joint
Repurchase Agreement (maturing on
01/03/2012 in the amount of $1,379,
collateralized by GNMA 4.50%, 2041,
value of $1,407) | | | | |
| $ | 1,379 | | | 0.04%, 12/30/2011 | | $ | 1,379 | |
| | | | | Barclays Capital TriParty Joint Repurchase
Agreement (maturing on 01/03/2012 in the
amount of $115, collateralized by U.S.
Treasury Bond 5.38%, 2031, value of
$117) | | | | |
| | 114 | | | 0.01%, 12/30/2011 | | | 114 | |
| | | | | Deutsche Bank Securities TriParty Joint
Repurchase Agreement (maturing on
01/03/2012 in the amount of $1,530,
collateralized by GNMA 3.50% - 7.00%,
2035 - 2046, value of $1,560) | | | | |
| | 1,530 | | | 0.06%, 12/30/2011 | | | 1,530 | |
| | | | | UBS Securities, Inc. Joint Repurchase
Agreement (maturing on 01/03/2012 in the
amount of $12, collateralized by U.S.
Treasury Note 2.75%, 2016, value of $12) | | | | |
| | 12 | | | 0.01%, 12/30/2011 | | | 12 | |
| | | | | UBS Securities, Inc. TriParty Joint
Repurchase Agreement (maturing on
01/03/2012 in the amount of $592,
collateralized by FNMA 3.00% - 6.50%,
2021 - 2041, value of $604) | | | | |
| | 592 | | | 0.04%, 12/30/2011 | | | 592 | |
| | | | | | | | 3,627 | |
| | | | | Total short-term investments | | | | |
| | | | | (cost $3,627) | | $ | 3,627 | |
| | | | | | | | | |
| Total investments | | | | | | | | |
| (cost $1,706,299) ▲ | | | 99.5 | % | | $ | 1,836,398 | |
| Other assets and liabilities | | | 0.5 | % | | | 9,767 | |
| Total net assets | | | 100.0 | % | | $ | 1,846,165 | |
The accompanying notes are an integral part of these financial statements.
| Note: | Percentage of investments as shown is the ratio of the total market value to total net assets. Market value of long-term investments in foreign securities represents 8.2% of total net assets at December 31, 2011. |
| | |
| | Prices of foreign equities that are principally traded on certain foreign markets may be adjusted daily pursuant to a fair value pricing service approved by the Board of Directors in order to reflect an adjustment for factors occurring after the close of certain foreign markets but before the close of the New York Stock Exchange. |
| |
| ▲ | At December 31, 2011, the cost of securities for federal income tax purposes was $1,723,853 and the aggregate gross unrealized appreciation and depreciation based on that cost were: |
| Unrealized Appreciation | | $ | 244,577 | |
| Unrealized Depreciation | | | (132,032 | ) |
| Net Unrealized Appreciation | | $ | 112,545 | |
| † | These securities were valued in good faith at fair value as determined under policies and procedures established by and under the supervision of the Company's Board of Directors. At December 31, 2011, the aggregate value of these securities was $34,362, which represents 1.9% of total net assets. This amount excludes securities that are principally traded in certain foreign markets and whose prices are adjusted pursuant to a third party pricing service methodology approved by the Board of Directors. |
| | |
| ● | Non-income producing.
|
| | |
| ⌂ | The following securities are considered illiquid. Illiquid securities are often purchased in private placement transactions, are often not registered under the Securities Act of 1933 and may have contractual restrictions on resale. A security may also be considered illiquid if the security lacks a readily available market or if its valuation has not changed for a certain period of time. |
| | Period Acquired | | Shares/ Par | Security | Cost Basis |
| | 08/2011 | | 9,440 | Allstar Co. | $ 9,610 |
| | 06/2007 | | 10,986 | Buck Holdings L.P. | 6,484 |
At December 31, 2011, the aggregate value of these securities was $34,362, which represents 1.9% of total net assets.
| Foreign Currency Contracts Outstanding at December 31, 2011 |
Description | Counterparty | Buy / Sell | Market
Value ╪ | Contract
Amount | Delivery Date | Unrealized
Appreciation/
(Depreciation) |
| Japanese Yen | Goldman Sachs | Sell | $ 30,613 | $ 30,732 | 01/23/2012 | $ 119 |
| ╪ | See Significant Accounting Policies of accompanying Notes to Financial Statements regarding valuation of securities. |
| |
The accompanying notes are an integral part of these financial statements.
Hartford Stock HLS Fund
Investment Valuation Hierarchy Level Summary
December 31, 2011
(000’s Omitted)
| | | Total | | | Level 1 ♦ | | | Level 2 ♦ | | | Level 3 | |
| Assets: | | | | | | | | | | | | | | | | |
| Common Stocks ‡ | | $ | 1,832,771 | | | $ | 1,704,629 | | | $ | 93,780 | | | $ | 34,362 | |
| Short-Term Investments | | | 3,627 | | | | — | | | | 3,627 | | | | — | |
| Total | | $ | 1,836,398 | | | $ | 1,704,629 | | | $ | 97,407 | | | $ | 34,362 | |
| Foreign Currency Contracts * | | | 119 | | | | — | | | | 119 | | | | — | |
| Total | | $ | 119 | | | $ | — | | | $ | 119 | | | $ | – | |
| ♦ | For the year ended December 31, 2011, there were no significant transfers between Level 1 and Level 2. |
| ‡ | The Fund has all or primarily all of the equity securities categorized in a particular level. Refer to the Schedule of Investments for further industry breakout. |
| * | Derivative instruments not reflected in the Schedule of Investments are valued at the unrealized appreciation/depreciation on the investments.
|
| Following is a reconciliation of Level 3 assets for which significant unobservable inputs were used to determine fair value: |
| |
| | | Balance as of December 31, 2010 | | | Realized Gain (Loss) | | | Change in Unrealized Appreciation (Depreciation) | | | Net Amortization | | | Purchases | | | Sales | | | Transfers
Into
Level 3 | | | Transfers Out of Level 3 | | | Balance as of December 31, 2011 | |
| Assets: | | | | | | | | | | | | | | | | | | | | | | | | | | | | | | | | | | | | |
| Common Stocks | | $ | 24,675 | | | $ | 6,038 | | | $ | 2,015 | * | | $ | — | | | $ | 9,610 | | | $ | (7,976 | ) | | $ | — | | | $ | — | | | $ | 34,362 | |
| Total | | $ | 24,675 | | | $ | 6,038 | | | $ | 2,015 | | | $ | — | | | $ | 9,610 | | | $ | (7,976 | ) | | $ | — | | | $ | — | | | $ | 34,362 | |
| * | Change in unrealized appreciation (depreciation) in the current period relating to assets still held at December 31, 2011 was $2,015. |
The accompanying notes are an integral part of these financial statements.
Hartford Stock HLS Fund
Statement of Assets and Liabilities
December 31, 2011
(000’s Omitted)
| Assets: | | | | |
| Investments in securities, at market value (cost $1,706,299) | | $ | 1,836,398 | |
| Cash | | | — | |
| Unrealized appreciation on foreign currency contracts | | | 119 | |
| Receivables: | | | | |
| Investment securities sold | | | 7,404 | |
| Fund shares sold | | | 115 | |
| Dividends and interest | | | 3,705 | |
| Total assets | | | 1,847,741 | |
| Liabilities: | | | | |
| Payables: | | | | |
| Fund shares redeemed | | | 1,269 | |
| Investment management fees | | | 192 | |
| Distribution fees | | | 13 | |
| Accrued expenses | | | 102 | |
| Total liabilities | | | 1,576 | |
| Net assets | | $ | 1,846,165 | |
| Summary of Net Assets: | | | | |
| Capital stock and paid-in-capital | | $ | 2,674,976 | |
| Undistributed net investment income | | | 2,536 | |
| Accumulated net realized loss | | | (961,561 | ) |
| Unrealized appreciation of investments and the translations of assets and liabilities denominated in foreign currency | | | 130,214 | |
| Net assets | | $ | 1,846,165 | |
| Shares authorized | | | 4,000,000 | |
| Par value | | $ | 0.001 | |
| Class IA: Net asset value per share | | $ | 39.95 | |
| Shares outstanding | | | 40,422 | |
| Net assets | | $ | 1,614,788 | |
| Class IB: Net asset value per share | | $ | 39.92 | |
| Shares outstanding | | | 5,796 | |
| Net assets | | $ | 231,377 | |
| | | | | |
The accompanying notes are an integral part of these financial statements.
Hartford Stock HLS Fund
Statement of Operations
For the Year Ended December 31, 2011
(000’s Omitted)
| Investment Income: | | | | |
| Dividends | | $ | 39,228 | |
| Interest | | | 19 | |
| Less: Foreign tax withheld | | | (729 | ) |
| Total investment income, net | | | 38,518 | |
| | | | | |
| Expenses: | | | | |
| Investment management fees | | | 9,719 | |
| Distribution fees - Class IB | | | 660 | |
| Custodian fees | | | 11 | |
| Accounting services fees | | | 206 | |
| Board of Directors' fees | | | 46 | |
| Audit fees | | | 16 | |
| Other expenses | | | 336 | |
| Total expenses (before fees paid indirectly) | | | 10,994 | |
| Commission recapture | | | (21 | ) |
| Custodian fee offset | | | — | |
| Total fees paid indirectly | | | (21 | ) |
| Total expenses, net | | | 10,973 | |
| Net investment income | | | 27,545 | |
| | | | | |
| Net Realized Gain on Investments and Foreign Currency Transactions: | | | | |
| Net realized gain on investments | | | 137,518 | |
| Net realized loss on foreign currency contracts | | | (1,974 | ) |
| Net realized gain on other foreign currency transactions | | | 198 | |
| Net Realized Gain on Investments and Foreign Currency Transactions | | | 135,742 | |
| | | | | |
| Net Changes in Unrealized Depreciation of Investments and Foreign Currency Transactions: | | | | |
| Net unrealized depreciation of investments | | | (181,721 | ) |
| Net unrealized depreciation of foreign currency contracts | | | (296 | ) |
| Net unrealized depreciation on translation of other assets and liabilities in foreign currencies | | | (15 | ) |
| Net Changes in Unrealized Depreciation of Investments and Foreign Currency Transactions | | | (182,032 | ) |
| Net Loss on Investments and Foreign Currency Transactions | | | (46,290 | ) |
| Net Decrease in Net Assets Resulting from Operations | | $ | (18,745 | ) |
| | | | | |
The accompanying notes are an integral part of these financial statements.
Hartford Stock HLS Fund
Statement of Changes in Net Assets
(000’s Omitted)
| | | For the
Year Ended
December 31,
2011 | | | For the
Year Ended
December 31,
2010 | |
| Operations: | | | | | | | | |
| Net investment income | | $ | 27,545 | | | $ | 23,525 | |
| Net realized gain on investments and foreign currency transactions | | | 135,742 | | | | 186,374 | |
| Net unrealized appreciation (depreciation) of investments and foreign currency transactions | | | (182,032 | ) | | | 93,630 | |
| Net Increase (Decrease) In Net Assets Resulting From Operations | | | (18,745 | ) | | | 303,529 | |
| Distributions to Shareholders: | | | | | | | | |
| From net investment income | | | | | | | | |
| Class IA | | | (23,255 | ) | | | (21,729 | ) |
| Class IB | | | (2,687 | ) | | | (2,570 | ) |
| Total distributions | | | (25,942 | ) | | | (24,299 | ) |
| Capital Share Transactions: | | | | | | | | |
| Class IA | | | | | | | | |
| Sold | | | 35,432 | | | | 42,056 | |
| Issued on reinvestment of distributions | | | 23,255 | | | | 21,729 | |
| Redeemed | | | (385,103 | ) | | | (380,269 | ) |
| Total capital share transactions | | | (326,416 | ) | | | (316,484 | ) |
| Class IB | | | | | | | | |
| Sold | | | 16,524 | | | | 19,460 | |
| Issued on reinvestment of distributions | | | 2,687 | | | | 2,570 | |
| Redeemed | | | (82,724 | ) | | | (87,497 | ) |
| Total capital share transactions | | | (63,513 | ) | | | (65,467 | ) |
| Net decrease from capital share transactions | | | (389,929 | ) | | | (381,951 | ) |
| Net Decrease In Net Assets | | | (434,616 | ) | | | (102,721 | ) |
| Net Assets: | | | | | | | | |
| Beginning of period | | | 2,280,781 | | | | 2,383,502 | |
| End of period | | $ | 1,846,165 | | | $ | 2,280,781 | |
| Undistributed (distribution in excess of) | | | | | | | | |
| net investment income | | $ | 2,536 | | | $ | 655 | |
| Shares: | | | | | | | | |
| Class IA | | | | | | | | |
| Sold | | | 862 | | | | 1,143 | |
| Issued on reinvestment of distributions | | | 588 | | | | 544 | |
| Redeemed | | | (9,352 | ) | | | (10,290 | ) |
| Total share activity | | | (7,902 | ) | | | (8,603 | ) |
| Class IB | | | | | | | | |
| Sold | | | 398 | | | | 535 | |
| Issued on reinvestment of distributions | | | 68 | | | | 65 | |
| Redeemed | | | (2,005 | ) | | | (2,368 | ) |
| Total share activity | | | (1,539 | ) | | | (1,768 | ) |
| | | | | | | | | |
The accompanying notes are an integral part of these financial statements.
Hartford Stock HLS Fund
Notes to Financial Statements
December 31, 2011
(000’s Omitted)
Hartford Stock HLS Fund (the “Fund”) serves as an underlying investment option for certain variable annuity and variable life insurance separate accounts of Hartford Life Insurance Company (“HLIC”) and its affiliates and certain qualified retirement plans. The Fund may also serve as an underlying investment option for certain variable annuity and variable life separate accounts of other insurance companies. Owners of variable annuity contracts and policyholders of variable life insurance contracts may choose the funds permitted in the variable insurance contract prospectus. In addition, participants in certain qualified retirement plans may choose the Fund if permitted by their plans.
Hartford Series Fund, Inc. (the “Company”) is an open-end registered management investment company comprised of thirty portfolios. Financial Statements for the Fund, a series of the Company, are included in this report.
The Company is organized under the laws of the State of Maryland and is registered with the Securities and Exchange Commission (“SEC”) under the Investment Company Act of 1940, as amended (“1940 Act”). The Fund is a diversified open-end management investment company.
The Fund is divided into Class IA and Class IB shares. Each class is offered at the per share net asset value (“NAV”) without a sales charge and is subject to the same expenses, except that the Class IB shares are subject to distribution and service fees charged pursuant to a Distribution Plan adopted in accordance with Rule 12b-1 under the 1940 Act.
| 2. | Significant Accounting Policies: |
The following is a summary of significant accounting policies of the Fund in the preparation of its financial statements, which are in accordance with the United States Generally Accepted Accounting Principles (“U.S. GAAP”). The preparation of financial statements in accordance with U.S. GAAP may require management to make estimates and assumptions that affect the reported amounts of assets and liabilities and disclosure of contingent assets and liabilities at the date of the financial statements and the reported amounts of increases and decreases in net assets from operations during the reporting period. Actual results could differ from those estimates.
| a) | Determination of Net Asset Value – The NAV of each class of the Fund’s shares is determined as of the close of regular trading (normally 4:00 p.m. Eastern Time) (the “NYSE Close”) on each day that the New York Stock Exchange (the “Exchange”) is open (“Valuation Date”). Information that becomes known to the Fund after the NAV has been calculated on a particular day will not generally be used to retroactively adjust the NAV determined earlier that day. |
| b) | Investment Valuation and Fair Value Measurements – For purposes of calculating the NAV, portfolio securities and other assets held by the Fund's portfolio for which market quotes are readily available are valued at market value. Market value is generally determined on the basis of last reported sales prices or official close price. If no sales are reported, market value is based on quotes obtained from a quotation reporting system, established market makers, or independent pricing services. If market prices are not readily available or are deemed unreliable, the Fund will use the fair value of the security as determined in good faith under policies and procedures established by and under the supervision of the Company’s Board of Directors. Market quotes are considered not readily available where there is an absence of current or reliable market-based data (e.g., trade information or broker quotes), including where events occur after the close of the relevant market, but prior to the NYSE Close that materially affect the values of the Fund’s portfolio securities or assets. In addition, market quotes are considered not readily available when, due to extraordinary circumstances, the exchanges or markets on which the securities trade do not open for trading for the entire day and no other market prices are available. In addition, prices of foreign equities that are principally traded on certain foreign markets are adjusted daily pursuant to a fair value pricing service approved by the Board of Directors in order to reflect an adjustment for the factors occurring after the close of certain foreign markets but before the NYSE Close. Securities that are primarily traded on foreign markets may trade on days that are not business days of the Fund. The value of the foreign securities in |
which the Fund invests may change on days when a shareholder will not be able to purchase or redeem shares of the Fund. Fair value pricing is subjective in nature and the use of fair value pricing by the Fund may cause the NAV of its shares to differ significantly from the NAV that would have been calculated using market prices at the close of the exchange on which a portfolio security is primarily traded. There can be no assurance that the Fund could obtain the fair market value assigned to a security if the Fund were to sell the security at approximately the time at which the Fund determines its NAV.
Investments valued in currencies other than U.S. dollars are converted to U.S. dollars using exchange rates obtained from independent pricing services for calculation of the NAV. As a result, the NAV of the Fund’s shares may be affected by changes in the value of currencies in relation to the U.S. dollar. The value of securities traded in markets outside the United States or denominated in currencies other than the U.S. dollar may be affected significantly on a day that the NYSE is closed and the market value may change on days when an investor is not able to purchase, redeem or exchange shares of the Fund.
Foreign currency contracts represent agreements to exchange currencies on specific future dates at predetermined rates. Foreign currency contracts are valued using foreign currency exchange rates and forward rates as provided by an independent pricing service on the Valuation Date.
Financial instruments for which prices are not available from an independent pricing service may be valued using market quotations obtained from one or more dealers that make markets in the respective financial instrument in accordance with procedures established by the Company’s Board of Directors.
U.S. GAAP defines fair value as the price that the Fund would receive to sell an asset or pay to transfer a liability in an orderly transaction between market participants. The U.S. GAAP fair value measurement standards require disclosure of a fair value hierarchy for each major category of assets and liabilities. Various inputs are used in determining the fair value of the Fund’s investments. These inputs are summarized into three broad hierarchy levels. This hierarchy is based on whether the valuation inputs are observable or unobservable. These levels are:
| · | Level 1 – Quoted prices in active markets for identical securities. Level 1 may include exchange traded instruments such as domestic equities, some foreign equities, options, futures, mutual funds, exchange traded funds, rights and warrants. |
| · | Level 2 – Observable inputs other than Level 1 prices, such as quoted prices for similar securities; quoted prices in markets that are not active; or other inputs that are observable or can be corroborated by observable market data. Level 2 may include debt securities that are traded less frequently than exchange traded instruments and which are valued using independent pricing services; foreign equities, that are principally traded on certain foreign markets and are adjusted daily pursuant to a fair value pricing service in order to reflect an adjustment for the factors occurring after the close of certain foreign markets but before the NYSE Close; and short-term securities, which are valued at amortized cost. |
| · | Level 3 – Significant unobservable inputs that are supported by limited or no market activity. Level 3 may include financial instruments whose values are determined using broker quotes or require significant management judgment or estimation. These unobservable valuation inputs may include estimates for current yields, maturity/duration, prepayment speed, and broker quotes for comparable securities along with other assumptions relating to credit quality, collateral value, complexity of the security structure, general market conditions and liquidity. This category may include securities where trading has been halted or there are certain restrictions on trading. While these securities are priced using unobservable inputs, the valuation of these securities reflects the best available data and management believes the prices are a reasonable representation of exit price. |
Valuation levels are not necessarily indicative of the risk associated with investing in such securities. Individual securities within any of the above mentioned asset classes may be assigned a different hierarchical level than those presented above, as individual circumstances dictate.
Hartford Stock HLS Fund
Notes to Financial Statements – (continued)
December 31, 2011
(000’s Omitted)
For additional information, refer to the Investment Valuation Hierarchy Level Summary and the Level 3 roll-forward reconciliation which follow the Schedule of Investments.
For purposes of reporting transfers between different hierarchy levels, both transfers in and out of each level, as applicable, are shown as if they occurred at the beginning of the period.
| c) | Security Transactions and Investment Income – Security transactions are recorded as of the trade date (the date the order to buy or sell is executed) for financial reporting purposes. Securities purchased or sold on a when-issued or delayed-delivery basis may be settled a month or more after the trade date. Realized gains and losses are determined on the basis of identified cost. |
Dividend income is accrued as of the ex-dividend date, except certain dividends from foreign securities where the ex-dividend date may have passed are recorded as soon as the Fund is informed of the dividend. Interest income, including amortization of premium and accretion of discounts, is accrued on a daily basis.
| d) | Foreign Currency Transactions – Assets and liabilities denominated in currencies other than U.S. dollars are translated into U.S. dollars at the exchange rates in effect on the valuation date. Purchases and sales of investment securities, income, and expenses are translated into U.S. dollars at the exchange rates on the dates of such transactions. |
The Fund does not isolate that portion of portfolio security valuation resulting from fluctuations in the foreign currency exchange rates from the fluctuations arising from changes in the market prices of securities held. Exchange rate fluctuations are included with the net realized and unrealized gain or loss on investments in the accompanying financial statements.
Net realized foreign exchange gains or losses arise from sales of foreign currencies and the difference between asset and liability amounts initially stated in foreign currencies and the U.S. dollar value of the amounts actually received or paid. Net unrealized foreign exchange gains or losses arise from changes in the value of other assets and liabilities at the end of the reporting period, resulting from changes in the exchange rates.
| e) | Joint Trading Account – The Fund may invest cash balances into a joint trading account that may be invested in one or more repurchase agreements. |
| f) | Fund Share Valuation and Dividend Distributions to Shareholders – Orders for the Fund’s shares are executed in accordance with the investment instructions of the contract holders and plan participants. The NAV of the Fund’s shares is determined as of the close of business on each business day of the Exchange. The NAV is determined separately for each class of shares of the Fund by dividing the Fund’s net assets attributable to that class by the number of shares of the class outstanding. Each class of shares offered by the Fund has equal rights as to assets and voting privileges (except that shareholders of a class have exclusive voting rights regarding any matter relating solely to that class of shares). Income and non-class specific expenses are allocated daily to each class on the basis of the relative net assets of the class. Realized and unrealized capital gains and losses are allocated daily based on the relative net assets of each class of shares of the Fund. |
Orders for the purchase of the Fund’s shares received prior to the close of the Exchange on any day the Exchange is open for business are priced at the NAV determined as of the close of the Exchange. Orders received after the close of the Exchange, or on a day on which the Exchange and/or the Fund is not open for business, are priced at the next determined NAV.
Dividends are declared pursuant to a policy adopted by the Company’s Board of Directors based upon the investment performance of the Fund. The policy of the Fund is to pay dividends from net investment income and realized capital gains, if any, at least once a year.
Distributions from net investment income, net realized capital gains and capital are determined in accordance with federal income tax regulations, which may differ from U.S. GAAP with respect to character and timing. These differences may include but are not limited to losses deferred due to wash sale adjustments, foreign currency gains and losses, adjustments related to Passive Foreign Investment Companies (“PFICs”), Real Estate Investment Trusts (“REITs”), Regulated Investment Companies (“RICs”), certain derivatives and partnerships. Permanent book and federal income tax basis differences relating to shareholder distributions will result in reclassifications to certain of the Fund’s capital accounts (see Federal Income Taxes: Reclassification of Capital Accounts note).
| 3. | Securities and Other Investments: |
| a) | Repurchase Agreements – A repurchase agreement is an agreement by which a counterparty agrees to sell a security and agrees to repurchase the security sold at a mutually agreed upon time and price. At the time the Fund enters into a repurchase agreement, the value of the underlying collateral security(ies), including accrued interest, will be equal to or exceed the value of the repurchase agreement. Repurchase agreements expose the Fund to counterparty risk. To minimize counterparty risk, the securities that serve to collateralize the repurchase agreement are held by the Fund's custodian in book entry or physical form in the custodial account of the Fund or in a third party custodial account. Repurchase agreements are valued at cost plus accrued interest. The Fund, as shown on the Schedule of Investments, had outstanding repurchase agreements as of December 31, 2011. |
| b) | Illiquid and Restricted Securities – The Fund is permitted to invest up to 15% of its net assets in illiquid securities. Illiquid securities are those that may not be sold or disposed of in the ordinary course of business within seven days, at approximately the price used to determine the Fund’s NAV. The Fund may not be able to sell illiquid securities or other investments when its sub-adviser considers it desirable to do so or may have to sell such securities or investments at a price that is lower than the price that could be obtained if the securities or investments were more liquid. A sale of illiquid securities or other investments may require more time and may result in higher dealer discounts and other selling expenses than does the sale of those that are liquid. Illiquid securities and investments also may be more difficult to value due to the unavailability of reliable market quotations for such securities or investments, and an investment in them may have an adverse impact on the Fund’s NAV. The Fund may also purchase certain restricted securities that can only be resold to certain qualified investors and may be determined to be liquid pursuant to policies and guidelines established by the Company’s Board of Directors. The Fund, as shown on the Schedule of Investments, had illiquid and/or restricted securities as of December 31, 2011. |
| c) | Securities Purchased on a When-Issued or Delayed-Delivery Basis – Delivery and payment for securities that have been purchased by the Fund on a forward commitment, or when-issued or delayed-delivery basis, take place beyond the customary settlement period. A fund may dispose of or renegotiate a delayed-delivery transaction after it is entered into, and may sell delayed-delivery securities before they are delivered, which may result in a realized gain or loss. During this period, such securities are subject to market fluctuations, and the Fund identifies securities segregated in its records with value at least equal to the amount of the commitment. As of December 31, 2011, the Fund had no outstanding when-issued or delayed delivery securities. |
| 4. | Financial Derivative Instruments: |
The following disclosures contain information on how and why the Fund uses derivative instruments, the credit-risk-related contingent features in certain derivative instruments, and how derivative instruments affect the Fund’s financial position and results of operations. The location and fair value amounts of these instruments on the Statement of Assets and Liabilities and the realized gains and losses and changes in unrealized gains and losses on the Statement of Operations, each categorized by type of derivative contract, are included in the following Additional Derivative Instrument Information footnote. The derivative instruments outstanding as of period-end are disclosed in the notes to the Schedule of Investments and the amounts of realized gains and losses and changes in unrealized gains and losses on derivative instruments during the period are disclosed in the Statement of Operations.
Hartford Stock HLS Fund
Notes to Financial Statements – (continued)
December 31, 2011
(000’s Omitted)
| a) | Foreign Currency Contracts – The Fund may enter into foreign currency contracts that obligate the Fund to purchase or sell currencies at specified future dates. Foreign currency contracts are used to hedge the currency exposure associated with some or all of the Fund's securities and/or as part of an investment strategy. Foreign currency contracts are marked to market daily and the change in value is recorded by the Fund as an unrealized gain or loss. The Fund will record a realized gain or loss when the foreign currency contract is settled. |
Foreign currency contracts involve elements of market risk in excess of the amounts reflected in the Statement of Assets and Liabilities. In addition, risks may arise upon entering into these contracts from the potential inability of the counterparties to meet the terms of the contracts and from unanticipated movements in the value of the foreign currencies relative to the U.S. dollar. The Fund had outstanding foreign currency contracts as shown on the Schedule of Investments as of December 31, 2011.
| b) | Additional Derivative Instrument Information: |
Fair Values of Derivative Instruments on the Statement of Assets and Liabilities as of December 31, 2011:
| | | Risk Exposure Category | |
| | | Interest Rate
Contracts | | | Foreign
Exchange
Contracts | | | Credit
Contracts | | | Equity
Contracts | | | Commodity
Contracts | | | Other
Contracts | | | Total | |
| Assets: | | | | | | | | | | | | | | | | | | | | | | | | | | | | |
| Unrealized appreciation on foreign currency contracts | | $ | — | | | $ | 119 | | | $ | — | | | $ | — | | | $ | — | | | $ | — | | | $ | 119 | |
| Total | | $ | — | | | $ | 119 | | | $ | — | | | $ | — | | | $ | — | | | $ | — | | | $ | 119 | |
| | | | | | | | |
| The volume of derivatives that is presented in the Schedule of Investments is consistent with the derivative activity during the year ended December 31, 2011. |
| | | | | | | | |
| The Effect of Derivative Instruments on the Statement of Operations for the year ended December 31, 2011: |
| | | Risk Exposure Category | |
| | | Interest Rate
Contracts | | | Foreign
Exchange
Contracts | | | Credit
Contracts | | | Equity
Contracts | | | Commodity
Contracts | | | Other
Contracts | | | Total | |
| Realized Gain (Loss) on Derivatives Recognized as a Result of Operations: |
| Net realized loss on foreign currency contracts | | $ | — | | | $ | (1,974 | ) | | $ | — | | | $ | — | | | $ | — | | | $ | — | | | $ | (1,974 | ) |
| Total | | $ | — | | | $ | (1,974 | ) | | $ | — | | | $ | — | | | $ | — | | | $ | — | | | $ | (1,974 | ) |
| | | | | | | | | | | | | | | | | | | | | | | | | | | | | |
| Net Change in Unrealized Appreciation (Depreciation) on Derivatives Recognized as a Result of Operations: |
| Net change in unrealized depreciation of foreign currency contracts | | $ | — | | | $ | (296 | ) | | $ | — | | | $ | — | | | $ | — | | | $ | — | | | $ | (296 | ) |
| Total | | $ | — | | | $ | (296 | ) | | $ | — | | | $ | — | | | $ | — | | | $ | — | | | $ | (296 | ) |
| a) | Counterparty Risk – The Fund may be exposed to counterparty risk, or the risk that an institution or other entity with which the Fund has unsettled or open transactions will default. |
| b) | Market Risks – If the Fund invests directly in foreign currencies or in securities that trade in, and receive revenues in, foreign currencies, or in derivatives that provide exposure to foreign currencies, it will be subject to the risk that those currencies will decline in value relative to the base currency of the Fund, or, in the case of hedging positions, that the Fund’s base currency will decline in value relative to the currency being hedged. Currency rates in foreign countries may fluctuate significantly over short periods of time for a number of reasons, including changes in interest rates, intervention |
(or the failure to intervene) by U.S. or foreign governments, central banks or supranational entities, such as the International Monetary Fund, or by the imposition of currency controls or other political developments in the United States or abroad. As a result, the Fund’s investments in foreign currency denominated securities may reduce the returns of the Fund. The market values of equity securities, such as common stocks and preferred stocks, or equity related investments, such as futures and options, may decline due to general market conditions which are not specifically related to a particular company, such as real or perceived adverse economic conditions, changes in the general outlook for corporate earnings, changes in interest or currency rates or adverse investor sentiment generally. The market value of equity securities may also decline due to factors which affect a particular industry or industries, such as labor shortages or increased production costs and competitive conditions within an industry. Equity securities and equity related investments generally have greater market price volatility than fixed income securities.
| a) | Federal Income Taxes – For federal income tax purposes, the Fund intends to continue to qualify as a RIC under Subchapter M of the Internal Revenue Code (“IRC”) by distributing substantially all of its taxable net investment income and net realized capital gains to its shareholders and otherwise complying with the requirements of RICs. The Fund has distributed substantially all of its income and capital gains in prior years, if applicable, and intends to distribute substantially all of its income and capital gains prior to the next fiscal year-end. Accordingly, no provision for federal income or excise taxes has been made in the accompanying financial statements. Distributions from short-term capital gains are treated as ordinary income distributions for federal income tax purposes. |
| b) | Net Investment Income (Loss), Net Realized Gains (Losses) – Net investment income (loss) and net realized gains (losses) may differ for financial statement and tax purposes primarily because of losses deferred due to wash sale adjustments, foreign currency gains and losses, adjustments related to PFICs, REITs, RICs, certain derivatives and partnerships. The character of distributions made during the year from net investment income or net realized gains may differ from their ultimate characterization for federal income tax purposes. Also, due to the timing of dividend distributions, the fiscal year in which amounts are distributed may differ from the year that the income or realized gains (losses) were recorded by the Fund. |
| c) | Distributions and Components of Distributable Earnings – The tax character of distributions paid by the Fund for the periods indicated is as follows (as adjusted for dividends payable): |
| | | For the Year Ended
December 31, 2011 | | | For the Year Ended
December 31, 2010 | |
| Ordinary Income | | $ | 25,942 | | | $ | 24,299 | |
| | | | | | | | | |
As of December 31, 2011, the Fund’s components of distributable earnings (deficit) on a tax basis were as follows:
| | | Amount | |
| Undistributed Ordinary Income | | $ | 2,536 | |
| Accumulated Capital and Other Losses* | | | (943,888 | ) |
| Unrealized Appreciation† | | | 112,541 | |
| Total Accumulated Deficit | | $ | (828,811 | ) |
| | * | The Fund has capital loss carryforwards that are identified in the Capital Loss Carryforward note that follows. |
| | † | The difference between book-basis and tax-basis unrealized appreciation (depreciation) may be attributable to the losses deferred due to wash sale adjustments, foreign currency gains and losses, adjustments related to PFICs, REITs, RICs, certain derivatives and partnerships. |
Hartford Stock HLS Fund
Notes to Financial Statements – (continued)
December 31, 2011
(000’s Omitted)
| d) | Reclassification of Capital Accounts – The Fund may record reclassifications in its capital accounts. These reclassifications have no impact on the total net assets of the Fund. The reclassifications are a result of permanent differences between U.S. GAAP and tax accounting for such items as foreign currency, PFICs, expiration or utilization of capital loss carryforwards or net operating losses. Adjustments are made to reflect the impact these items have on current and future distributions to shareholders. Therefore, the source of the Fund’s distributions may be shown in the accompanying Statement of Changes in Net Assets as from undistributed net investment income, from accumulated net realized gains on investments or from capital depending on the type of book and tax differences that exist. For the year ended December 31, 2011, the Fund recorded reclassifications to increase (decrease) the accounts listed below: |
| | | Amount | |
| Undistributed Net Investment Income | | $ | 278 | |
| Accumulated Net Realized Gain (Loss) | | | (278 | ) |
| | | | | |
| e) | Capital Loss Carryforward – On December 22, 2010, the Regulated Investment Company Modernization Act of 2010 (the “Act”) was enacted, which made changes to the capital loss carryforward rules. The changes are effective for taxable years beginning after the date of enactment. Under the Act, funds are permitted to carry forward capital losses for an unlimited period. However, any losses incurred during those future taxable years will be required to be utilized prior to the losses incurred in pre-enactment taxable years, which carry an expiration date. As a result of this ordering rule, pre-enactment capital loss carryforwards may be more likely to expire unused. Additionally, post-enactment capital loss carryforwards will retain their character as either short-term or long-term capital losses rather than being considered all short-term as permitted under prior regulation. |
At December 31, 2011 (tax-year-end), the Fund had capital loss carryforwards for U.S. federal income tax purposes as follows:
| Year of Expiration | | Amount | |
| 2016 | | $ | 205,611 | |
| 2017 | | | 738,277 | |
| Total | | $ | 943,888 | |
| | | | | |
| As of December 31, 2011, the Fund utilized $106,064 of prior year capital loss carryforwards |
| f) | Accounting for Uncertainty in Income Taxes – The Fund has adopted financial reporting rules that require the Fund to analyze all open tax years, as defined by the statute of limitations, for all major jurisdictions. Generally, tax authorities can examine all tax returns filed for the last three years. The Fund does not have an examination in progress. |
The Fund has reviewed all open tax years and major jurisdictions and concluded that these financial reporting rules had no effect on the Fund’s financial position or results of operations. There is no tax liability resulting from unrecognized tax benefits relating to uncertain income tax positions taken or expected to be taken on the tax return for the fiscal year ended December 31, 2011. The Fund is also not aware of any tax positions for which it is reasonably possible that the total amounts of unrecognized tax benefits will significantly change in the next twelve months.
| a) | Investment Management Agreement – HL Investment Advisors, LLC (“HL Advisors”), an indirect wholly owned subsidiary of The Hartford Financial Services Group, Inc. (“The Hartford”), serves as investment manager to the Fund pursuant to an Investment Management Agreement with the Company. As investment manager, HL Advisors has overall investment supervisory responsibility for the Fund. In addition, HL Advisors provides administrative personnel, services, equipment, facilities and office space for proper operation of the Fund. HL Advisors has contracted with Wellington Management Company, LLP (“Wellington Management”) under a sub-advisory agreement for the provision of day-to- |
day investment management services to the Fund in accordance with the Fund’s investment objective and policies. The Fund pays a fee to HL Advisors, a portion of which may be used to compensate Wellington Management.
The schedule below reflects the rates of compensation paid to HL Advisors for investment management services rendered as of December 31, 2011; the rates are accrued daily and paid monthly.
| Average Daily Net Assets | Annual Fee |
| On first $250 million | 0.5250% |
| On next $250 million | 0.5000% |
| On next $500 million | 0.4750% |
| On next $4 billion | 0.4500% |
| On next $5 billion | 0.4475% |
| Over $10 billion | 0.4450% |
| b) | Accounting Services Agreement – Pursuant to the Fund Accounting Agreement between HLIC and the Company, on behalf of the Fund, HLIC provides accounting services to the Fund and receives monthly compensation based on the Fund’s average daily net assets at the rates set forth below. The Fund’s accounting services fees are accrued daily and paid monthly. |
| Average Daily Net Assets | Annual Fee |
| All Assets | 0.10% |
| c) | Operating Expenses – Allocable expenses incurred by the Company are allocated to each Fund and allocated to classes within a Fund in proportion to the average daily net assets of the Fund and each class, except where allocation of certain expenses is more fairly made directly to the Fund or to specific classes within a Fund. |
| d) | Fees Paid Indirectly – The Company, on behalf of the Fund, has entered into agreements with State Street Global Markets, LLC and Russell Implementation Services, Inc. to partially recapture non-discounted trade commissions. Such rebates are used to pay a portion of the Fund’s expenses. In addition, the Fund’s custodian bank has also agreed to reduce its fees when the Fund maintains cash on deposit in a non-interest-bearing custody account. For the year ended December 31, 2011, these amounts, if any, are included in the Statement of Operations. |
The ratio of expenses to average net assets in the accompanying financial highlights excludes the reduction in expenses related to fees paid indirectly. The annualized expense ratio for the period listed below reflecting the reduction for fees paid indirectly is as follows:
| | | Year Ended
December 31, 2011 | |
| Class IA | | | 0.50 | % |
| Class IB | | | 0.75 | |
| | | | | |
| e) | Distribution Plan for Class IB shares – The Company, on behalf of the Fund, has adopted a Distribution Plan pursuant to Rule 12b-1 of the 1940 Act to compensate the Distributor, Hartford Securities Distribution Company, Inc. (a wholly owned, ultimate subsidiary of The Hartford), from assets attributable to the Class IB shares for services rendered and expenses borne in connection with activities primarily intended to result in the sale of the Class IB shares, subject to the review and approval of the Company’s Board of Directors. |
The Distribution Plan provides that the Fund may pay annually up to 0.25% of the average daily net assets of the Fund attributable to its Class IB shares for activities primarily intended to result in the sale of Class IB shares. The Board has the authority to suspend or reduce these payments at any point in time. Under the terms of the Distribution Plan and the
Hartford Stock HLS Fund
Notes to Financial Statements – (continued)
December 31, 2011
(000’s Omitted)
principal underwriting agreement, the Fund is authorized to make payments monthly to the Distributor that may be used to pay or compensate entities providing distribution and shareholder servicing with respect to the Class IB shares for such entities’ fees or expenses incurred or paid in that regard. These fees are accrued daily and paid monthly.
| f) | Other Related Party Transactions – Certain officers of the Fund are directors and/or officers of HL Advisors and/or The Hartford or its subsidiaries. For the year ended December 31, 2011, a portion of the Fund’s chief compliance officer’s salary was paid by all the investment companies in the Hartford fund complex. The portion allocated to the Fund was in the amount of $3. These fees are accrued daily and paid monthly. |
| g) | Payment from Affiliate – In July of 2007, The Hartford entered into a settlement with the Attorneys General of the states of New York, Connecticut and Illinois relating to market timing and the company's individual variable annuity contracts in which certain payments would be made directly to the variable annuity contract holders. The distribution plan provided that unclaimed money from the settlement would be distributed to certain HLS Funds that are investment options through a Hartford individual variable annuity contract. The unclaimed money was distributed to the Fund on September 18, 2009. |
The total return in the accompanying financial highlights includes a payment from an affiliate. Had the payment from the affiliate been excluded, the impact and total return for the period listed below would have been as follows:
| | | For the Year Ended December 31, 2009 | |
| | | | Class IA | | | | Class IB | |
| Impact from Payment from Affiliate for Attorneys General Settlement | | | — % | | | | — % | |
| Total Return Excluding Payment from Affiliate | | | 41.53 | | | | 41.18 | |
| 8. | Investment Transactions: |
For the year ended December 31, 2011, the Fund's aggregate purchases and sales of investment securities (excluding short-term investments) were as follows:
| | | Amount | |
| Cost of Purchases Excluding U.S. Government Obligations | | $ | 887,046 | |
| Sales Proceeds Excluding U.S. Government Obligations | | | 1,269,876 | |
The Fund is one of several Hartford funds that participate in a $500 million committed revolving line of credit facility. The facility is to be used for temporary or emergency purposes. Under the arrangement, the funds are required to own securities having a market value in excess of 300% of the total bank borrowings. The interest rate on borrowings varies depending on the nature of the loan. The facility also requires a fee to be paid based on the amount of the commitment. This commitment fee is allocated to all of the funds participating in the line of credit based on the average net assets of the funds. During the year ended December 31, 2011, the Fund did not have any borrowings under this facility.
| 10. | Industry Classifications: |
Other than the industry classifications “Other Investment Pools and Funds” and “Exchange Traded Funds,” equity industry classifications used in this report are the Global Industry Classification Standard, which was developed by and is the exclusive property and service mark of MSCI, Inc. and Standard & Poor’s.
Under the Company’s organizational documents, the Company shall indemnify its officers and directors to the full extent required or permitted under Maryland General Corporation Law and the federal securities laws. In addition, the Company, on behalf of the Fund, may enter into contracts that contain a variety of indemnifications. The Company’s maximum exposure under these arrangements is unknown. However, as of the date of these financial statements, the Company has not had prior claims or losses pursuant to these contracts and expects the risk of loss to be remote.
Hartford Stock HLS Fund
Financial Highlights
- Selected Per-Share Data (A) -
Class | Net Asset Value at
Beginning of Period | Net Investment Income (Loss) | Payments from (to) Affiliate | Net Realized and Unrealized Gain (Loss) on Investments | Total from Investment Operations | Dividends from Net Investment Income | Distributions from Realized Capital Gains | Distributions from Capital | Total Distributions | Net Increase (Decrease) in Net Asset Value | Net Asset Value at End of Period |
| For the Year Ended December 31, 2011 |
| IA | $ 40.98 | $ 0.62 | $ – | $ (1.07) | $ (0.45) | $ (0.58) | $ – | $ – | $ (0.58) | $ (1.03) | $ 39.95 |
| IB | 40.94 | 0.51 | – | (1.06) | (0.55) | (0.47) | – | – | (0.47) | (1.02) | 39.92 |
| For the Year Ended December 31, 2010 |
| IA | 36.10 | 0.44 | – | 4.89 | 5.33 | (0.45) | – | – | (0.45) | 4.88 | 40.98 |
| IB | 36.06 | 0.35 | – | 4.88 | 5.23 | (0.35) | – | – | (0.35) | 4.88 | 40.94 |
| For the Year Ended December 31, 2009 |
| IA | 25.86 | 0.48 | – | 10.25 | 10.73 | (0.49) | – | – | (0.49) | 10.24 | 36.10 |
| IB | 25.84 | 0.39 | – | 10.24 | 10.63 | (0.41) | – | – | (0.41) | 10.22 | 36.06 |
| For the Year Ended December 31, 2008 |
| IA | 47.11 | 0.59 | – | (20.79) | (20.20) | (0.81) | (0.24) | – | (1.05) | (21.25) | 25.86 |
| IB | 47.00 | 0.50 | – | (20.72) | (20.22) | (0.70) | (0.24) | – | (0.94) | (21.16) | 25.84 |
| For the Year Ended December 31, 2007 |
| IA | 52.57 | 0.60 | – | 2.43 | 3.03 | (0.57) | (7.92) | – | (8.49) | (5.46) | 47.11 |
| IB | 52.45 | 0.45 | – | 2.44 | 2.89 | (0.42) | (7.92) | – | (8.34) | (5.45) | 47.00 |
| | | | | | | | | | | | |
| (A) | Information presented relates to a share outstanding throughout the indicated period. |
| (B) | The figures do not include sales charges or other fees which may be applied at the variable life insurance, variable annuity or qualified retirement plan product level. Any such additional sales charges or other fees would lower the Fund's performance. |
| (C) | Ratios do not reflect reductions for fees paid indirectly. Please see Fees Paid Indirectly in the Notes to Financial Statements. |
| (D) | Portfolio turnover rate is calculated on the basis of the Fund as a whole without distinguishing between the classes of shares issued. |
| (E) | Total return without the inclusion of the Payment from (to) Affiliate can be found in Expenses in the accompanying Notes to Financial Statements. |
- Ratios and Supplemental Data -
Total Return(B) | | Net Assets at End of Period | | | Ratio of Expenses to Average Net
Assets Before Waivers(C) | | | Ratio of Expenses to Average
Net Assets After Waivers(C) | | | Ratio of Net Investment
Income (Loss) to
Average Net Assets | | | Portfolio Turnover Rate(D) | |
| |
| (1.09 | )% | $ | 1,614,788 | | | | 0.50 | % | | | 0.50 | % | | | 1.37 | % | | | 43 | % |
| (1.34 | ) | | 231,377 | | | | 0.75 | | | | 0.75 | | | | 1.11 | | | | – | |
|
| 14.80 | | | 1,980,502 | | | | 0.50 | | | | 0.50 | | | | 1.09 | | | | 77 | |
| 14.51 | | | 300,279 | | | | 0.75 | | | | 0.75 | | | | 0.84 | | | | – | |
|
| 41.54 | (E) | | 2,055,227 | | | | 0.51 | | | | 0.51 | | | | 1.43 | | | | 84 | |
| 41.18 | (E) | | 328,275 | | | | 0.76 | | | | 0.76 | | | | 1.19 | | | | – | |
|
| (43.13 | ) | | 1,810,864 | | | | 0.49 | | | | 0.49 | | | | 1.38 | | | | 89 | |
| (43.27 | ) | | 287,794 | | | | 0.74 | | | | 0.74 | | | | 1.13 | | | | – | |
|
| 5.90 | | | 3,909,045 | | | | 0.49 | | | | 0.49 | | | | 1.01 | | | | 96 | |
| 5.64 | | | 652,838 | | | | 0.74 | | | | 0.74 | | | | 0.76 | | | | – | |
| | | | | | | | | | | | | | | | | | | | | |
Report of Independent Registered Public Accounting Firm
The Board of Directors and Shareholders of
Hartford Series Fund, Inc.
We have audited the accompanying statement of assets and liabilities, including the schedule of investments, of Hartford Stock HLS Fund (one of the portfolios constituting Hartford Series Fund, Inc. (the Funds)) as of December 31, 2011, and the related statement of operations for the year then ended, the statements of changes in net assets for each of the two years in the period then ended, and the financial highlights for each of the five years in the period then ended. These financial statements and financial highlights are the responsibility of the Funds’ management. Our responsibility is to express an opinion on these financial statements and financial highlights based on our audits.
We conducted our audits in accordance with the standards of the Public Company Accounting Oversight Board (United States). Those standards require that we plan and perform the audit to obtain reasonable assurance about whether the financial statements and financial highlights are free of material misstatement. We were not engaged to perform an audit of the Funds’ internal control over financial reporting. Our audits included consideration of internal control over financial reporting as a basis for designing audit procedures that are appropriate in the circumstances, but not for the purpose of expressing an opinion on the effectiveness of the Funds’ internal control over financial reporting. Accordingly, we express no such opinion. An audit also includes examining, on a test basis, evidence supporting the amounts and disclosures in the financial statements and financial highlights, assessing the accounting principles used and significant estimates made by management, and evaluating the overall financial statement presentation. Our procedures included confirmation of securities owned as of December 31, 2011, by correspondence with the custodian and brokers or by other appropriate auditing procedures where replies from brokers were not received. We believe that our audits provide a reasonable basis for our opinion.
In our opinion, the financial statements and financial highlights referred to above present fairly, in all material respects, the financial position of Hartford Stock HLS Fund of Hartford Series Fund, Inc. at December 31, 2011, the results of its operations for the year then ended, the changes in its net assets for each of the two years in the period then ended, and the financial highlights for each of the five years in the period then ended, in conformity with U.S. generally accepted accounting principles.
Minneapolis, MN
February 13, 2012
Hartford Stock HLS Fund
Directors and Officers (Unaudited)
The Board of Directors of the Company appoints officers who are responsible for the day-to-day operations of the Fund and who execute policies formulated by the Directors. Each director serves until his or her death, resignation, or retirement or until the next annual meeting of shareholders is held or until his or her successor is elected and qualifies.
Directors and officers who are employed by or who have a financial interest in The Hartford are considered “interested” persons of the Fund pursuant to the 1940 Act. Each officer and two of the Company’s directors, as noted in the chart below, are “interested” persons of the Fund. Each director serves as a director for The Hartford Mutual Funds, Inc., The Hartford Mutual Funds II, Inc., Hartford Series Fund, Inc., Hartford HLS Series Fund II, Inc., and as a trustee for The Hartford Alternative Strategies Fund, which, as of December 31, 2011, collectively consist of 91 funds. Correspondence may be sent to directors and officers c/o Hartford Mutual Funds, P.O. Box 2999, Hartford, Connecticut 06104-2999, except that correspondence to Ms. Fagely may be sent to 500 Bielenberg Drive, Woodbury, Minnesota 55125.
The table below sets forth, for each director and officer, his or her name, year of birth, current position with the Company and date first elected or appointed to Hartford Series Fund, Inc. (“HSF”), and Hartford HLS Series Fund II, Inc. (“HSF2”), principal occupation, and, for directors, other directorships held. The Fund’s statement of additional information contains further information on the directors and is available free of charge by calling 1-800-862-6668 or writing to Hartford HLS Funds, c/o Individual Annuity Services, P.O. Box 5085, Hartford, CT 06102-5085.
Information on the aggregate remuneration paid to the directors of the Company can be found in the Statement of Operations herein. The Fund pays to The Hartford a portion of the chief compliance officer’s compensation, but does not pay salaries or compensation to any of their other officers or directors who are employed by The Hartford.
Non-Interested Directors
Lynn S. Birdsong (1946) Director since 2003, Co-Chairman of the Investment Committee
Mr. Birdsong is a private investor. Mr. Birdsong currently serves as a Director of the Sovereign High Yield Investment Company (April 2010 to current). Mr. Birdsong currently serves as an Independent Director of Nomura Partners Funds, Inc. (formerly, The Japan Fund) (March 2003 to current). From 2003 to March 2005, Mr. Birdsong was an independent director of the Atlantic Whitehall Funds. From 1979 to 2002, Mr. Birdsong was a managing director of Zurich Scudder Investments, an investment management firm. During his employment with Scudder, Mr. Birdsong was an Interested Director of The Japan Fund. Since 1981, Mr. Birdsong has been a partner in Birdsong Company, an advertising specialty firm.
Robert M. Gavin, Jr. (1940) Director since 2002 (HSF) and 1986 (HSF2), Chairman of the Board since 2004
Dr. Gavin is an educational consultant. Prior to September 1, 2001, he was President of Cranbrook Education Community and prior to July 1996, he was President of Macalester College, St. Paul, Minnesota.
Duane E. Hill (1945) Director since 2001 (HSF) and 2002 (HSF2), Chairman of the Nominating Committee
Mr. Hill is Partner of TSG Ventures L.P., a private equity investment company. Mr. Hill is a former partner of TSG Capital Group, a private equity investment firm that served as sponsor and lead investor in leveraged buyouts of middle market companies.
Sandra S. Jaffee (1941) Director since 2005
Ms. Jaffee served as Chairman (2008 to 2009) and Chief Executive Officer of Fortent (formerly Searchspace Group), a leading provider of compliance/regulatory technology to financial institutions from August 2005 to August 2009. From August 2004 to August 2005, Ms. Jaffee served as an Entrepreneur in Residence with Warburg Pincus, a private equity firm. From September 1995 to July 2004, Ms. Jaffee served as Executive Vice President at Citigroup, where she was President and Chief Executive Officer of Citibank’s Global Securities Services (1995 to 2003). Ms. Jaffe currently serves as a member of the Board of Directors of Broadridge Financial Solutions as well as a Trustee of Muhlenberg College.
William P. Johnston (1944) Director since 2005, Chairman of the Compliance Committee
In June 2006, Mr. Johnston was appointed as Senior Advisor to The Carlyle Group, a global private equity investment firm. In August 2007, Mr. Johnston was elected to the Board of Directors of LifeCare Holdings, Inc. In February 2008, Mr. Johnston was elected to the Board of Directors of HCR-ManorCare, Inc. In May 2006, Mr. Johnston was elected to the Supervisory Board of Fresenius Medical Care AG & Co. KGaA, after its acquisition of Renal Care Group, Inc. in March 2006. Mr. Johnston joined Renal Care Group in November 2002 as a member of the Board of Directors and served as Chairman of the Board from March 2003 through March 2006. Mr. Johnston served as a Director of MultiPlan, Inc. from July 2006 through August 2010. From September 1987 to December 2002, Mr. Johnston was with Equitable Securities Corporation (and its successors, SunTrust Equitable Securities and SunTrust Robinson Humphrey) serving in various investment banking and managerial positions, including Managing Director and Head of Investment Banking, Chief Executive Officer and Vice Chairman.
Hartford Stock HLS Fund
Directors and Officers (Unaudited) – (continued)
Phillip O. Peterson (1944) Director since 2002 (HSF) and 2000 (HSF2), Chairman of the Audit Committee
Mr. Peterson is a mutual fund industry consultant. He was a partner of KPMG LLP (an accounting firm) until July 1999. Mr. Peterson joined William Blair Funds in February 2007 as a member of the Board of Trustees. From January 2004 to April 2005, Mr. Peterson served as Independent President of the Strong Mutual Funds.
Lemma W. Senbet (1946) Director since 2005
Dr. Senbet is the William E. Mayer Chair Professor of Finance and Director, Center for Financial Policy, at the University of Maryland, Robert H. Smith School of Business. He was chair of the Finance Department from 1998 to 2006. Previously he was a chaired professor of finance at the University of Wisconsin-Madison. Also, he was director of the Fortis Funds from March 2000 to July 2002. Dr. Senbet served the finance profession in various capacities, including as director of the American Finance Association and President of the Western Finance Association. In 2006, Dr. Senbet was inducted Fellow of Financial Management Association International for his career-long distinguished scholarship and professional service.
Interested Directors and Officers
David N. Levenson (1966) Director since 2010
Mr. Levenson currently serves as President of The Hartford’s Wealth Management business. He was appointed to this role in July 2010. Previously, Mr. Levenson served as Executive Vice President of Legacy Holdings for The Hartford from June 2009 to July 2010. From 2006 to 2009, Mr. Levenson was with Hartford Life Insurance K.K. where he served as President and Chief Executive Officer from 2007 to 2009. He served as Managing Director of Hartford Investment Management Company from 2005 to 2006. Additionally, Mr. Levenson serves as Executive Vice President of The Hartford and as President, Director and Chief Executive Officer of Hartford Life Insurance Company (“HLIC”) and Hartford Life, Inc. (“HL Inc.”).
Lowndes A. Smith (1939) Director since 1996 (HSF) and 2002 (HSF2), Co-Chairman of the Investment Committee
Mr. Smith served as Vice Chairman of The Hartford from February 1997 to January 2002, as President and Chief Executive Officer of HL Inc. from February 1997 to January 2002, and as President and Chief Operating Officer of The Hartford Life Insurance Companies from January 1989 to January 2002. Mr. Smith serves as a Director of White Mountains Insurance Group, Ltd., One Beacon Insurance and Symetra Financial and as a Managing Director of Whittington Gray Associates.
Other Officers
James E. Davey (1964) President and Chief Executive Officer since 2010
Mr. Davey serves as Executive Vice President of HLIC. Additionally, Mr. Davey serves as President, Chief Executive Officer and Manager of Hartford Investment Financial Services, Inc. (“HIFSCO”) and President, Chief Executive Officer and Manager of HL Advisors. Mr. Davey joined The Hartford in 2002.
Michael R. Dressen (1963) AML Compliance Officer since 2011
Mr. Dressen currently serves as Assistant Vice President of HLIC. He also serves as Chief Compliance Officer and AML Compliance Officer of Hartford Administrative Services Company (“HASCO”) and as Assistant Secretary and Compliance Officer of HIFSCO. Mr Dressen joined The Hartford in 2005 from State Farm Insurance Companies where he held various positions related to mutual funds, variable products, and property casualty insurance.
Tamara L. Fagely (1958) Vice President, Treasurer and Controller since 2002 (HSF) and 1993 (HSF2)
Ms. Fagely has been a Vice President of HASCO since 1998 and Chief Financial Officer since 2006. Currently Ms. Fagely is a Vice President of HLIC. She served as Assistant Vice President of HLIC from December 2001 through March 2005. In addition, Ms. Fagely is Controller and Chief Financial Officer of HIFSCO.
Dr. Robert J. Froehlich (1953) Senior Managing Director since 2009
Dr. Froehlich joined The Hartford as Senior Managing Director in September 2009. Prior to joining The Hartford, Dr. Froehlich served as Vice Chairman of Deutsche Asset Management from 1997-2009.
Edward P. Macdonald (1967) Vice President, Secretary and Chief Legal Officer since 2005
Mr. Macdonald serves as Vice President of HLIC and Chief Legal Officer of Mutual Funds and Vice President of HIFSCO. He also serves as Vice President and Secretary of HASCO, and Chief Legal Officer, Secretary and Vice President of HL Advisors. Mr. Macdonald joined The Hartford in 2005.
Vernon J. Meyer (1964) Vice President since 2006
Mr. Meyer serves as Senior Vice President of HLIC. He also serves as Senior Vice President of HIFSCO and HL Advisors. Mr. Meyer joined The Hartford in 2004.
Colleen B. Pernerewski (1969) Vice President and Chief Compliance Officer since 2010
Ms. Pernerewski serves as Vice President and Chief Investment Advisor Compliance Officer of HIFSCO and as Vice President and Chief Compliance Officer of HL Advisors. Ms. Pernerewski joined The Hartford in 2005 from Travelers Life and Annuity where she served as Counsel (2004-2005). Prior to Travelers Life and Annuity, Ms. Pernerewski held the position of Counsel at The Hartford (1998-2004).
Elizabeth L. Schroeder (1966) Vice President since 2010
Ms. Schroeder currently serves as Assistant Vice President of HLIC. Ms. Schroeder joined HLIC in 1991. She is also an Assistant Vice President of HASCO, HIFSCO and HL Advisors.
Martin Swanson (1962) Vice President since 2010
Mr. Swanson is a Vice President of HLIC. Mr. Swanson also serves as Vice President/Marketing for HIFSCO. Prior to joining HLIC in 1998, Mr. Swanson was a Vice President at PaineWebber, Inc.
Jane Wolak (1961) Vice President since 2009
Ms. Wolak currently serves as Senior Vice President of HLIC. Ms. Wolak joined HLIC as Vice President, Retail Product Services in May 2007. She is also Vice President of HASCO. Previously, Ms. Wolak was with Sun Life Financial where she held the position of Vice President, Service Center Operations from 2001-2007.
HOW TO OBTAIN A COPY OF THE FUND’S PROXY VOTING POLICIES AND VOTING RECORDS (UNAUDITED)
A description of the policies and procedures that the Fund uses to determine how to vote proxies relating to portfolio securities and a record of how the Fund voted any proxies for the twelve-month period ended June 30, 2011 are available (1) without charge, upon request, by calling 800-862-6668 and (2) on the SEC’s website at http://www.sec.gov.
QUARTERLY PORTFOLIO HOLDINGS INFORMATION (UNAUDITED)
The Fund files a complete schedule of portfolio holdings with the SEC for the first and third quarters of each fiscal year on Form N-Q. The Fund’s Forms are available (1) without charge, upon request, by calling 800-862-6668 and (2) on the SEC’s website at http://www.sec.gov. The Form N-Q may be reviewed and copied at the SEC’s Public Reference Room in Washington, DC. Information on the operation of the Public Reference Room may be obtained by calling 1-800-SEC-0330.
Hartford Stock HLS Fund
Expense Example (Unaudited)
Your Fund's Expenses
As a shareholder of the Fund, you incur two types of costs: (1) transaction costs and (2) ongoing costs including investment management fees, distribution fees, and other fund expenses. This example is intended to help you understand your ongoing costs (in dollars) of investing in the Fund and to compare these costs with the ongoing costs of investing in other mutual funds. The example is based on an investment of $1,000 invested at the beginning of the period and held for the period of June 30, 2011 through December 31, 2011.
Actual Expenses
The first set of columns of the table below provides information about actual account values and actual expenses. You may use the information in this column, together with the amount you invested, to estimate the expenses that you paid over the period. Simply divide your account value by $1,000 (for example, an $8,600 account value divided by $1,000 = 8.6), then multiply the result by the number in the line under the heading entitled “Expenses Paid During Period” to estimate the expenses you paid on your account during this period.
Hypothetical Example for Comparison Purposes
The second set of columns of the table below provides information about hypothetical account values and hypothetical expenses based on the Fund’s actual expense ratio and an assumed rate of return of 5% per year before expenses, which is not the Fund’s actual return. The hypothetical account values and expenses may not be used to estimate the actual ending account balance or expenses you paid for the period. You may use this information to compare the ongoing costs of investing in the Fund and other funds. To do so, compare this 5% hypothetical example with the 5% hypothetical examples that appear in the shareholder reports of the other funds.
Please note that the expenses shown in the table are meant to highlight your ongoing costs only and do not reflect any transactional costs, such as sales charges (loads) and CDSC. Therefore, the second set of columns of the table is useful in comparing ongoing costs only, and will not help you determine the relative total costs of owning different funds. In addition, if these transactional costs were included, your costs would be higher. Expenses are equal to the Fund's annualized expense ratios multiplied by average account value over the period, multiplied by 184/365 (to reflect the one-half year period).
| | Actual return | Hypothetical (5% return before expenses) | | | |
| | Beginning
Account Value
June 30, 2011 | Ending Account Value
December 31, 2011 | Expenses paid during the period
June 30, 2011
through
December 31, 2011 | Beginning
Account Value
June 30, 2011 | Ending Account Value
December 31, 2011 | Expenses paid during the period
June 30, 2011
through
December 31, 2011 | Annualized expense ratio | Days in the current 1/2 year | Days in the full year |
| Class IA | $1,000.00 | $948.62 | $2.46 | $1,000.00 | $1,022.68 | $2.55 | 0.50% | 184 | 365 |
| Class IB | $1,000.00 | $947.41 | $3.68 | $1,000.00 | $1,021.42 | $3.82 | 0.75% | 184 | 365 |
Hartford Stock HLS Fund
Approval of Investment Management and Investment Sub-Advisory Agreements (Unaudited)
Section 15(c) of the Investment Company Act of 1940, as amended (the “1940 Act”), requires that each mutual fund’s board of directors, including a majority of those directors who are not “interested persons” of the mutual fund, as defined in the 1940 Act (the “Independent Directors”), annually review and consider the continuation of the mutual fund’s investment advisory and sub-advisory agreements. At its meeting held on August 2-3, 2011, the Board of Directors (the “Board”) of Hartford Series Fund, Inc., including each of the Independent Directors, unanimously voted to approve the continuation of the investment management agreement for Hartford Stock HLS Fund (the “Fund”) with HL Investment Advisors, LLC (“HL Advisors”) and the continuation of the investment sub-advisory agreement between HL Advisors and the Fund’s sub-adviser, Wellington Management Company, LLP (the “Sub-adviser,” and together with HL Advisors, the “Advisers”) (collectively, the “Agreements”).
In the months preceding the August 2-3, 2011 meeting, the Board requested, received, and reviewed written responses from the Advisers to questions posed to them on behalf of the Independent Directors and supporting materials relating to those questions and responses. The Board considered information furnished to the Board at its meetings throughout the year, as well as information specifically prepared in connection with the annual approval of the Agreements at the Board’s meetings held on June 21-22, 2011 and August 2-3, 2011. Information provided to the Board at its meetings throughout the year included, among other things, reports on Fund performance, legal and compliance matters, sales and marketing activity, shareholder services, and the other services provided to the Fund by the Advisers and their affiliates. In addition, the Board received in-person presentations by Fund officers and representatives of HL Advisors at the Board’s meetings on June 21-22, 2011 and August 2-3, 2011 concerning the Agreements.
The Independent Directors, advised by independent legal counsel, engaged two service providers to assist them with evaluating the Agreements with respect to the Fund. Lipper Inc. (“Lipper”), an independent provider of investment company data, was retained to provide the Board with reports on how the Fund’s contractual management fees, actual management fees, other non-management fees, overall expense ratios and investment performance compared to those of mutual funds with similar investment objectives. The Independent Directors also engaged an independent financial services consulting firm (the “Consultant”) to assist them in evaluating the Fund’s management fees, sub-advisory fees, other non-management fees, overall expense ratios and investment performance. In addition, the Consultant reviewed the profitability calculations utilized by HL Advisors in connection with the continuation of the investment management agreement.
In determining to continue the Agreements for the Fund, the members of the Board reviewed and evaluated information and factors they believed to be relevant and appropriate in light of the information that the Board deemed necessary and appropriate through the exercise of their reasonable business judgment. While individual members of the Board may have weighed certain factors differently, the Board’s determination to continue the Agreements was based on a comprehensive consideration of all information provided to the Board throughout the year and specifically with respect to the continuation of the Agreements. A more detailed discussion of the factors the Board considered with respect to its approval of the Agreements is provided below.
Nature, Extent, And Quality Of Services Provided by the Advisers
The Board requested and considered information concerning the nature, extent, and quality of the services provided to the Fund by the Advisers. The Board considered, among other things, the terms of the Agreements and the range of services provided by the Advisers. The Board considered the Advisers’ professional personnel who provide services to the Fund, including each Adviser’s ability and experience in attracting and retaining qualified personnel to service the Fund. The Board considered each Adviser’s reputation and overall financial strength, as well as its willingness to consider and implement organizational and operational changes designed to improve services to the Fund. In addition, the Board considered the quality of each Adviser’s communications with the Board and responsiveness to Board inquiries.
The Board also requested and evaluated information concerning each Adviser’s regulatory and compliance environment. In this regard, the Board requested and reviewed information on each Adviser’s compliance policies and procedures, compliance history, and a report from the Fund’s Chief Compliance Officer on each Adviser’s compliance with applicable laws and regulations, including responses to regulatory developments and compliance issues raised by regulators. The Board also noted the Advisers’ support of the Fund’s compliance control structure, particularly the resources devoted by the Advisers in support of the Fund’s obligations pursuant to Rule 38a-1 under the 1940 Act.
With respect to HL Advisors, the Board noted that under the Agreements, HL Advisors is responsible for the management of the Fund, including overseeing fund operations and service providers, as well as investment advisory services in connection with
Hartford Stock HLS Fund
Approval of Investment Management and Investment Sub-Advisory Agreements (Unaudited) – (continued)
selecting, monitoring and supervising the Sub-adviser. The Board considered HL Advisors’ ongoing monitoring of people, process and performance, including its quarterly reviews of each of the Hartford HLS Funds, semi-annual meetings with the leaders of each Fund’s portfolio management team, and oversight of the Funds’ 49 portfolio managers. The Board recognized that HL Advisors has demonstrated a record of making changes to the management and/or strategies of the Funds when warranted. The Board considered HL Advisors’ oversight of the Sub-adviser’s investment approach and results, process for monitoring best execution of portfolio trades by the Sub-adviser, and approach to risk management with respect to the Fund and the service providers to the Fund. The Board also considered HL Advisors’ oversight of compliance with the Fund’s objective and policies as well as with applicable laws and regulations, noting that regulatory and other developments had over time led to an increase in the scope of HL Advisors’ services in this regard. In addition, the Board considered HL Advisors’ ongoing commitment to review and rationalize the Hartford fund family’s product line-up and the expenses that HL Advisors had incurred in connection with fund combinations in recent years. The Board considered that HL Advisors or its affiliates are responsible for providing the Fund’s officers. The Board also noted that Hartford Life Insurance Company (“HLIC”) provides administrative services to the Fund. The Board considered its experiences with HL Advisors and HLIC with respect to each of these services.
With respect to the Sub-adviser, who provides day-to-day portfolio management services, the Board considered the quality of the Fund’s portfolio managers, the Sub-adviser’s other investment personnel, its investment philosophy and process, investment research capabilities and resources, performance record, trade execution capabilities and experience. The Board considered the experience of the Fund’s portfolio managers, the number of accounts managed by the portfolio managers, and the Sub-adviser’s method for compensating the portfolio managers.
Based on these considerations, the Board concluded that it was satisfied with the nature, extent and quality of the services provided to the Fund by HL Advisors and the Sub-adviser.
Performance of the Fund and the Advisers
The Board considered the investment performance of the Fund. In this regard, the Board reviewed the performance of the Fund over different time periods presented in the materials and evaluated HL Advisors’ analysis of the Fund’s performance for these time periods. The Board considered information and materials provided to the Board by the Advisers concerning Fund performance, as well as information from Lipper comparing the investment performance of the Fund to an appropriate benchmark and universe of peer funds. The Board noted that the performance of the Fund was within expectations.
The Board considered the detailed investment analytics reports provided by The Hartford’s Investment Advisory Group throughout the year. These reports include, among other things, information on the Fund’s gross and net returns, the Fund’s investment performance relative to an appropriate benchmark and peer group, various statistics concerning the Fund’s portfolio, and a narrative summary of various factors affecting Fund performance. The Board considered the Advisers’ cooperation with the Investment Committee, which assists the Board in evaluating the performance of the Fund at periodic meetings throughout the year. The Board also considered the analysis provided by the Consultant relating to the Fund’s performance track record.
In light of all the considerations noted above, the Board concluded that it had continued confidence in HL Advisors’ and the Sub-adviser’s overall capabilities to manage the Fund.
Costs of the Services and Profitability of the Advisers
The Board reviewed information regarding HL Advisors’ cost to provide investment management and related services to the Fund and HL Advisors’ profitability, both overall and for the Fund, on a pre-tax basis without regard to distribution expenses. The Board also requested and reviewed information about the profitability to HL Advisors and its affiliates from all services provided to the Fund and all aspects of their relationship with the Fund. The Board also requested and received information relating to the operations and profitability of the Sub-adviser.
The Board considered the Consultant’s review of the profitability calculations utilized by HL Advisors in connection with the continuation of the investment management agreement. In this regard, the Consultant reported that The Hartford’s process for calculating and reporting Fund profitability is reasonable, sound and well within common industry practice.
Based on these considerations, the Board concluded that the profits anticipated to be realized by the Advisers and their affiliates from their relationships with the Fund would not be excessive.
Comparison of Fees and Services Provided by the Advisers
The Board considered comparative information with respect to the management fees to be paid by the Fund to HL Advisors and the total expense ratios of the Fund. The Board also considered comparative information with respect to the sub-advisory fees to be paid by HL Advisors to the Sub-adviser, to the extent applicable. In this regard, the Board requested and reviewed information from HL Advisors and the Sub-adviser relating to the management and sub-advisory fees, including the sub-advisory fee schedule for the Fund, and total operating expenses for the Fund. The Board considered that the management fee for the Fund includes the fee paid to HLIC for providing certain administrative services to the Fund. The Board also reviewed information from Lipper comparing the Fund’s contractual management fees, actual management fees and overall expense ratios relative to a group of funds selected by Lipper, in consultation with the Consultant, and a broader universe of funds selected by Lipper.
While the Board recognized that comparisons between the Fund and peer funds are imprecise, given the differing service levels and characteristics of mutual funds and the different business models and cost structures of the Advisers, the comparative information provided by Lipper assisted the Board in evaluating the reasonableness of the Fund’s management and sub-advisory fees and total operating expenses. In addition, the Board considered the analysis and recommendations of the Consultant relating to the Fund’s management and sub-advisory fees and total operating expenses.
Based on these considerations, the Board concluded that the Fund’s fees and total operating expenses, in conjunction with the information about quality of services, profitability, economies of scale, and other matters discussed, were reasonable in light of the services provided.
Economies of Scale
The Board requested and considered information regarding the Advisers’ realization of economies of scale with respect to the Fund and whether the fee levels reflect these economies of scale for the benefit of the Fund’s investors. With respect to HL Advisors, the Board considered representations from HL Advisors that it is difficult to anticipate whether and to what extent economies may be realized by HL Advisors as assets grow over time. The Board reviewed the breakpoints in the management fee schedule for the Fund, which reduces fee rates as Fund assets grow over time. The Board recognized that a fund with assets beyond the last breakpoint level will continue to benefit from economies of scale because additional assets are charged the lowest breakpoint fee resulting in lower overall effective management fee rates. The Board also recognized that a fee schedule that reaches a lower breakpoint quickly provides shareholders with the benefit of anticipated or potential economies of scale.
The Board reviewed and evaluated materials from Lipper showing how management fee schedules of peer funds reflect economies of scale for the benefit of investors as a peer fund’s assets hypothetically increase over time. Based on information provided by HL Advisors, Lipper, and the Consultant, the Board recognized that there is no uniform methodology for establishing breakpoints or uniform pattern in asset levels that trigger breakpoints or the amounts of breakpoints triggered.
After considering all of the information available to it, the Board concluded that it was satisfied with the extent to which economies of scale would be shared for the benefit of the Fund’s shareholders based on currently available information and the effective advisory fees and expense ratios for the Fund at its current and reasonably anticipated asset levels. The Board noted, however, that it would continue to monitor future growth in Fund assets and the appropriateness of additional breakpoints.
Other Benefits
The Board considered other benefits to the Advisers and their affiliates from their relationships with the Fund, including the role of the Fund in supporting the variable life insurance and variable annuity products offered by The Hartford. The Board reviewed information noting that HLIC, an affiliate of HL Advisors, receives fees for providing certain administrative services to the Fund, and that HLIC also receives fees for fund accounting and related services from the Fund, and the Board considered information on expected profits to HLIC or its affiliates for such services. The Board also considered that Hartford Administrative Services Company (“HASCO”), the Fund’s transfer agent and an affiliate of HL Advisors, receives transfer agency compensation from the Fund, and the Board reviewed information on the expected profitability of the Fund’s transfer agency function to HASCO. The
Hartford Stock HLS Fund
Approval of Investment Management and Investment Sub-Advisory Agreements (Unaudited) – (continued)
Board considered information provided by HASCO indicating that the transfer agent fees charged by HASCO to the Fund were fair and reasonable based on publicly available information.
The Board also considered that Hartford Securities Distribution Company, Inc., as principal underwriter of the Fund, receives 12b-1 fees from the Fund. The Board also noted that certain affiliates of HL Advisors distribute shares of the Fund and receive compensation in that connection.
The Board considered benefits to the Sub-adviser from its use of the Fund’s brokerage commissions to obtain soft dollar research, and representations from HL Advisors and the Sub-adviser that the Sub-adviser would not make any revenue-sharing payments or any other type of distribution payments to HL Advisors or its affiliates.
The Board considered the benefits to shareholders of being part of the Hartford family of funds. The Board considered HL Advisors’ efforts to provide investors in the family with a broad range of investment styles and asset classes.
* * * *
Based upon its review of these various factors, among others, the Board concluded that it is in the best interests of the Fund and its shareholders for the Board to approve the Agreements for an additional year. In reaching this decision, the Board did not assign relative weights to the factors discussed above or deem any one or group of them to be controlling in and of themselves. In connection with their deliberations, the Independent Directors met separately in executive session on several occasions, with independent legal counsel, to review the relevant materials and consider their responsibilities under relevant laws and regulations.
The Hartford
P.O. Box 5085
Hartford, CT 06102-5085
Hartford Series Fund, Inc. is underwritten and distributed by Hartford Securities Distribution Company, Inc.
"The Hartford" is The Hartford Financial Services Group, Inc. and its subsidiaries.
Hartford Series Fund, Inc. inception dates range from 1977 to date. Hartford Series Fund, Inc. is not a subsidiary of The Hartford but is underwritten, distributed by and advised by subsidiaries of The Hartford. Investments in Hartford Series Fund, Inc. are not guaranteed by The Hartford or any other entity.
You should carefully consider investment objectives, risks, and charges and expenses of Hartford HLS Funds before investing. This and other information can be found in the Fund’s prospectus or summary prospectus, which can be obtained by calling 800-862-6668. Please read them carefully before you invest or send money.
HLSAR-S11 2-12 109078 Printed in U.S.A ©2011 The Hartford, Hartford, CT 06115 | |

A MESSAGE FROM THE PRESIDENT
Dear Fellow Shareholders:
I want to take this opportunity to say thank you for investing in Hartford HLS Funds.
This has been a tumultuous year. In the beginning of 2011, we witnessed tension-fueled political uprisings in the already-volatile Middle East and North Africa region. We also watched as Japan dealt with a series of crises including a massive earthquake and subsequent tsunami. Yet, U.S. economic conditions continued to improve, with gains in consumer confidence and retail sales. During the first half of 2011, domestic, international, and world indices (as measured by the S&P 500, MSCI EAFE and MSCI World) were all up more than 5% through June, 30 2011.
The economic recovery, however, lost momentum in the second half of 2011. The employment and housing markets both remain extremely challenged. Investors continue to be concerned about the implications of the European sovereign debt crisis, as well as our own high levels of domestic debt. Fears that the European sovereign debt crisis could continue to drag down the global economy have weighed heavily on stocks.
Ongoing apprehension regarding the U.S. debt ceiling during the summer and the resulting downgrade of the U.S. sovereign credit rating by Standard & Poor’s also contributed to weaker investor confidence.
There are, however, some reasons to remain confident. Corporations have record levels of cash on their balance sheets—corporate cash has doubled in the past 10 years. In addition, U.S. gross domestic product expanded at a 2.5 percent annual rate in the third quarter according to the Commerce Department, as consumers and businesses set aside fears about the recovery and stepped up spending. Corporate earnings have also remained positive, with a majority of companies beating expectations each quarter this year. This momentum will hopefully continue into next year.
As we head into 2012, in light of the continued market volatility, now would be a good time to schedule a meeting with your financial advisor to examine your current investment strategy and determine whether you are on the right track.
| • | Does your fixed-income portfolio complement your equity portfolio? |
| • | Are you receiving diversified sources of income? |
| • | Is your portfolio still in line with your risk tolerance and investment time horizon? |
Talk to your advisor to see what changes you should make to address these concerns and opportunities.
Thank you again for investing with Hartford HLS Funds.
James Davey
President
Hartford HLS Funds
Hartford Total Return Bond HLS Fund
Table of Contents
This report is prepared for the general information of contract owners and qualified retirement plan participants. It is not an offer of contracts or of qualified retirement plans. It should not be used in connection with any offer, except in conjunction with the appropriate product prospectus which contains all pertinent information including the applicable sales, administrative and other charges.
The views expressed in the Fund’s Manager Discussion under ‘‘Why did the Fund perform this way?’’ and ‘‘What is the outlook?’’ are views of the Fund’s sub-adviser and portfolio management team through the end of the period and are subject to change based on market and other conditions.
Hartford Total Return Bond HLS Fund inception 08/31/1977
| (sub-advised by Hartford Investment Management Company) | |
Investment objective – Seeks a competitive total return, with income as a secondary objective.
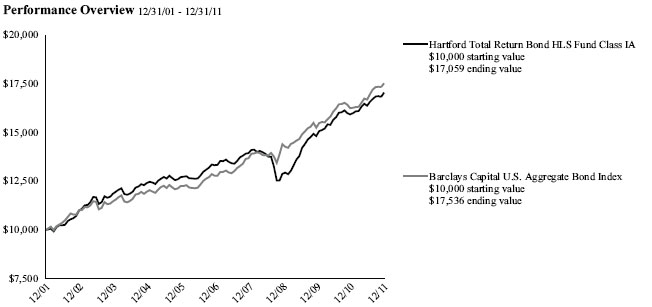
The chart above shows the growth of a $10,000 investment in Class IA. Growth results in classes other than Class IA will vary from what is seen above due to differences in the expenses charged to those share classes.
| Average Annual Total Returns (as of 12/31/11) (1) (2) |
| | 1 Year | 5 Year | 10 Year |
| Total Return Bond IA | 6.99% | 5.05% | 5.49% |
| Total Return Bond IB | 6.72% | 4.79% | 5.23% |
| Barclays Capital U.S. Aggregate Bond Index | 7.84% | 6.50% | 5.78% |
PAST PERFORMANCE IS NOT INDICATIVE OF FUTURE RESULTS.
| Total returns presented above were calculated using the Fund's net asset value available to shareholders for sale or redemption of Fund shares on December 31, 2011, which may exclude investment transactions as of this date. |
Barclays Capital U.S. Aggregate Bond Index is an unmanaged index and is composed of securities from the Barclays Capital Government/Credit Bond Index, Mortgage-Backed Securities Index, Asset-Backed Securities Index and Commercial Mortgage-Backed Securities Index.
You cannot invest directly in an index.
The chart represents a hypothetical investment in the Fund. Performance data represents past performance and current performance could be higher or lower.
Performance information may reflect historical or current expense waivers/reimbursements from the investment adviser, without which performance would have been lower. For information on current expense waivers/reimbursements, please see the prospectus.
The value of the Fund will fluctuate so that when redeemed, it may be worth more or less than the original investment. The chart and table do not reflect the deductions of taxes, sales charges or other fees which may be applied at the variable life insurance, variable annuity or qualified retirement plan product level. Any such additional sales charges or other fees or expenses would lower the contract’s or plan’s performance.
Hartford Total Return Bond HLS Fund
Manager Discussion (Unaudited)
December 31, 2011
| Portfolio Managers | | |
| Nasri Toutoungi | Joseph Portera | Christopher J. Zeppieri, CFA |
| Managing Director | Executive Vice President | Vice President |
| | | |
How did the Fund Perform?
The Class IA Shares of the Hartford Total Return Bond HLS Fund returned 6.99% for the twelve-month period ended December 31, 2011, underperforming its benchmark, the Barclays Capital U.S. Aggregate Bond Index, which returned 7.84%, and outperforming the Lipper Intermediate Investment Grade Debt VP-UF Funds category, a group of funds with investment strategies similar to those of the Fund, which returned 5.73%.
Why Did the Fund perform this way?
The market and economic environment at the end of 2010 was characterized by confidence and optimism. The Federal Reserve’s (Fed) second quantitative easing program (QE2), which supported equities and risk product in the last months of 2010 provided good momentum into the first quarter of 2011. Commercial Mortgage Backed Securities (CMBS), High yield and Investment Grade Corporate spreads tightened (i.e. short and long term interest rates moved closer together) in the first couple of months of the year. The Fund had overweights (i.e. the Fund’s sector position was greater than the benchmark) in each of these sectors to begin the year which added to relative performance.
At the end of February, the Arab Spring uprisings in Tunisia and Libya sent fuel prices higher causing many economists to revise down growth expectations. Pessimism grew a little stronger in March as the Japanese Tsunami created disruptions in production chains. Yield spreads tightened in April but this event was short-lived. Spreads began to move higher in May as economic data softened.
The Fund began to reduce credit spread risk early in the summer as the outlook for the U.S. debt ceiling and the European Sovereign credit crisis darkened. Additional insurance against a severe environment was applied with the use of single issuer and index credit default swaps. The timing of this application added to the relative return as equities and credit markets soured abruptly in August through September. Despite a downgrade to the U.S. Treasury and no firm resolution to the European crisis, spreads began to retrace their widening through the fourth quarter.
Through the year, the Fund maintained credit exposure greater than that of the benchmark which is consistent with its style. Most credit subsectors produced negative excess returns over the year. Left unchanged, the Fund would have significantly underperformed the benchmark, however, well timed asset allocation shifts and profitable duration management mitigated nearly all of the Fund’s negative returns due to its higher than benchmark risk position.
What is the outlook?
The struggle to maintain economies at reasonable growth and reasonable inflation has always challenged monetary and fiscal authorities, but we believe this balancing act has become much more difficult in the last year. U.S. monetary policy is at historic accommodative levels, yet growth and inflation expectations remain muted. Meanwhile, fiscal policy has become increasingly limited due to high debt levels which have already resulted in a U.S. Treasury rating downgrade. Although earnings and economic data have improved in the fourth quarter of 2011, we are cautious to extrapolate the data into the new year. The consumption component of Gross Domestic Product (GDP) appears vulnerable as does investor confidence amidst what could be a very volatile news headline environment. We believe that policy responses or non-responses to economic slowing and sovereign credit developments will likely have consequences of their own. Our base case is for slightly slower than consensus growth in the U.S. but the tails of both higher inflation and economic contraction remain fat.
The U.S. Treasury curve is likely to remain in a narrow range. Interest rates, at current historically low levels, are arguably more reflective of growth challenges than most risk products. We expect only a modest rally should economic or equity market conditions deteriorate. We feel inflation breakevens in five year Treasury Inflation Protected Securities (TIPS), at 1.7%, are attractive at well below Consumer Price Index (CPI) trend and should perform well in most scenarios.
Agency mortgage option adjusted spreads are attractive. We expect to remain overweight the product as a means of remaining defensive and enhancing portfolio yield in the first quarter of 2012. Interest rates and the speed of mortgage prepayments are expected to remain fairly stable and the supply and demand picture appears to favor the sector.
CMBS had a strong fourth quarter. The product has benefited from favorable supply and demand with limited new production and light dealer inventories. We will look for opportunities to reduce exposure in the sector by moving up in capital structure and quality.
Hartford Total Return Bond HLS Fund
Manager Discussion (Unaudited) – (continued)
December 31, 2011
We believe Investment Grade corporate bonds are currently priced for economic headwinds but our position remains cautious. Financials will be particularly susceptible to European sovereign debt contagion and we are carefully selecting our exposure only slightly higher than benchmark. We will look for opportunities to add to select Investment Grade corporate bonds in the new issue market and on market dips.
High Yield bonds rebounded nicely in the fourth quarter but further spread contraction appears limited. We have started the new year reducing exposure to this sector due to the vulnerability to weaker valuations due to potential negative macroeconomic events.
We believe Emerging Markets bond spreads will remain well correlated with other risk sectors but will likely experience greater widening in a more severe global slowdown due to lesser demand for natural resources and financial ties with European banks.
On November 21, 2011, the Board of Directors of the Hartford Series Fund, Inc. (the “Company”) approved a change of subadviser for the Fund, a series of the Company, from Hartford Investment Management Company to Wellington Management Company, LLP (“Wellington Management”). As part of this approval the Company’s Board of Directors approved a new sub-advisory agreement between HL Investment Advisors, LLC and Wellington Management. The change in the Fund’s subadviser and the implementation of the new sub-advisory agreement are expected to occur during the first quarter of 2012.
| Distribution by Credit Quality |
| as of December 31, 2011 |
| Credit Rating * | | Percentage of
Net Assets | |
| Aaa / AAA | | | 3.4 | |
| Aa / AA | | | 4.1 | |
| A | | | 11.0 | |
| Baa / BBB | | | 21.3 | |
| Ba / BB | | | 2.7 | |
| B | | | 2 8 | |
| Caa / CCC or Lower | | | 2.4 | |
| Unrated | | | 0.5 | |
| U.S. Government Agencies and Securities | | | 53.2 | |
| Non Debt Securities and Other Short-Term Instruments | | | 2.8 | |
| Other Assets & Liabilities | | | (4.2 | ) |
| Total | | | 100.0 | % |
| * | Does not apply to the Fund itself. Based upon Moody’s and S&P long-term credit ratings for the Fund’s holdings as of the date noted. If Moody's and S&P assign different ratings to a holding, the lower rating is used. "Unrated" includes fixed-income securities (other than cash-like short-term instruments and U.S. Government securities) for which Moody’s and S&P have not issued long-term credit ratings. |
| Diversification by Security Type |
| as of December 31, 2011 |
| Category | | Percentage of
Net Assets | |
| Asset & Commercial Mortgage Backed Securities | | | 6.6 | % |
| Call Options Purchased | | | 0.4 | |
| Corporate Bonds | | | 38.6 | |
| Foreign Government Obligations | | | 0.9 | |
| Municipal Bonds | | | 1.4 | |
| Preferred Stocks | | | 0.1 | |
| Put Options Purchased | | | 0.1 | |
| Senior Floating Rate Interests | | | 0.7 | |
| U.S. Government Agencies | | | 38.8 | |
| U.S. Government Securities | | | 13.6 | |
| Short-Term Investments | | | 3.0 | |
| Other Assets and Liabilities | | | (4.2 | ) |
| Total | | | 100.0 | % |
| Diversification by Industry |
| as of December 31, 2011 |
| Industry | | Percentage of
Net Assets | |
| Fixed Income Securities | | | | |
| Accommodation and Food Services | | | 0.2 | % |
| Administrative Waste Management and Remediation | | | 0.2 | |
| Agriculture, Forestry, Fishing and Hunting | | | 0.0 | |
| Air Transportation | | | 0.0 | |
| Apparel Manufacturing | | | 0.0 | |
| Arts, Entertainment and Recreation | | | 1.9 | |
| Beverage and Tobacco Product Manufacturing | | | 0.7 | |
| Chemical Manufacturing | | | 1.6 | |
| Computer and Electronic Product Manufacturing | | | 0.3 | |
| Construction | | | 0.4 | |
| Educational Services | | | 0.0 | |
| Electrical Equipment and Appliance Manufacturing | | | 0.3 | |
| Fabricated Metal Product Manufacturing | | | 0.0 | |
| Finance and Insurance | | | 20.8 | |
| Food Manufacturing | | | 0.5 | |
| Food Services | | | 0.1 | |
| Health Care and Social Assistance | | | 1.6 | |
| Higher Education (Univ., Dorms, etc.) | | | 0.3 | |
| Information | | | 3.5 | |
| Machinery Manufacturing | | | 0.2 | |
| Mining | | | 1.4 | |
| Miscellaneous | | | 0.3 | |
| Miscellaneous Manufacturing | | | 0.9 | |
| Motor Vehicle and Parts Manufacturing | | | 0.4 | |
| Paper Manufacturing | | | 0.1 | |
| Petroleum and Coal Products Manufacturing | | | 4.1 | |
| Pipeline Transportation | | | 0.5 | |
| Plastics and Rubber Products Manufacturing | | | 0.1 | |
| Primary Metal Manufacturing | | | 1.0 | |
| Printing and Related Support Activities | | | 0.1 | |
| Professional, Scientific and Technical Services | | | 0.5 | |
| Rail Transportation | | | 0.4 | |
| Real Estate and Rental and Leasing | | | 0.3 | |
| Retail Trade | | | 1.2 | |
| Soap, Cleaning Compound, and Toilet Manufacturing | | | 0.0 | |
| Tax Allocation | | | 0.4 | |
| Textile Product Mills | | | 0.0 | |
| Transit and Ground Passenger Transportation | | | 0.0 | |
| Utilities | | | 2.4 | |
| Utilities - Electric | | | 0.2 | |
| Utilities - Water and Sewer | | | 0.2 | |
| Water Transportation | | | 0.1 | |
| Wholesale Trade | | | 0.1 | |
| Total | | | 47.3 | % |
| Equity Securities | | | | |
| Automobiles & Components | | | 0.0 | |
| Banks | | | 0.1 | |
| Total | | | 0.1 | % |
| Call Options Purchased | | | 0.4 | |
| Foreign Government Obligations | | | 0.9 | |
| Put Options Purchased | | | 0.1 | |
| U.S. Government Agencies | | | 38.8 | |
| U.S. Government Securities | | | 13.6 | |
| Short-Term Investments | | | 3.0 | |
| Other Assets and Liabilities | | | (4.2 | ) |
| Total | | | 100.0 | % |
| | | | | |
Hartford Total Return Bond HLS Fund
Schedule of Investments
December 31, 2011
(000’s Omitted)
| Shares or Principal Amount ╬ | | Market Value ╪ |
ASSET & COMMERCIAL MORTGAGE BACKED SECURITIES - 6.6% |
| | | | | Finance and Insurance - 6.6% | | | | |
| | | | | Ally Automotive Receivables Trust | | | | |
| $ | 1,900 | | | 3.00%, 10/15/2015 ■ | | $ | 1,937 | |
| | 5,675 | | | 3.38%, 09/15/2017 ■ | | | 5,897 | |
| | 5,650 | | | 3.61%, 08/15/2016 ■ | | | 5,861 | |
| | | | | Banc of America Commercial Mortgage, Inc. | | | | |
| | 2,595 | | | 5.80%, 06/10/2049 Δ | | | 2,783 | |
| | | | | Banc of America Large Loan | | | | |
| | 7,726 | | | 5.33%, 12/16/2043 ■ | | | 7,039 | |
| | 6,370 | | | 5.80%, 06/15/2049 ■Δ | | | 6,374 | |
| | | | | Bank of America Automotive Trust | | | | |
| | 6,700 | | | 3.03%, 10/15/2016 ■ | | | 6,811 | |
| | | | | Bear Stearns Commercial Mortgage Securities, Inc. | | | | |
| | 70,075 | | | 15.00%, 11/11/2041 - 07/11/2042 ⌂► | | | 481 | |
| | | | | CFCRE Commercial Mortgage Trust | | | | |
| | 31,459 | | | 4.24%, 04/15/2044 ■► | | | 2,027 | |
| | | | | Chase Issuance Trust | | | | |
| | 6,920 | | | 5.12%, 10/15/2014 | | | 7,163 | |
| | | | | Citibank Credit Card Issuance Trust | | | | |
| | 8,955 | | | 6.30%, 06/20/2014 | | | 9,170 | |
| | | | | Citigroup Commercial Mortgage Trust | | | | |
| | 3,160 | | | 5.92%, 03/15/2049 Δ | | | 2,313 | |
| | | | | CNH Equipment Trust | | | | |
| | 6,322 | | | 2.55%, 11/17/2014 ○ | | | 6,318 | |
| | 3,075 | | | 2.97%, 05/15/2017 | | | 3,159 | |
| | | | | Commercial Mortgage Pass-Through Certificates | | | | |
| | 2,270 | | | 4.31%, 12/10/2012 ■† | | | 2,264 | |
| | 1,395 | | | 4.76%, 12/10/2012 ■† | | | 1,385 | |
| | 28,970 | | | 5.30%, 07/10/2046 ■► | | | 2,776 | |
| | 3,200 | | | 5.61%, 06/09/2028 ■ | | | 3,215 | |
| | 1,370 | | | 5.95%, 06/09/2028 ■ | | | 1,369 | |
| | 31,818 | | | 8.25%, 10/01/2020 ■► | | | 1,348 | |
| | | | | Countrywide Home Loans, Inc. | | | | |
| | 23,770 | | | 6.00%, 10/25/2037 ⌂ | | | 21,703 | |
| | | | | Credit-Based Asset Servicing and Securitization | | | | |
| | 2,172 | | | 0.56%, 05/25/2036 ■Δ | | | 1,797 | |
| | | | | Crest Clarendon Street | | | | |
| | 3,895 | | | 1.05%, 12/28/2017 ■Δ | | | 3,790 | |
| | | | | Cwcapital Cobalt | | | | |
| | 6,500 | | | 5.53%, 04/15/2047 | | | 5,385 | |
| | | | | DBUBS Mortgage Trust | | | | |
| | 5,155 | | | 4.54%, 05/12/2021 ■ | | | 5,172 | |
| | 27,235 | | | 4.89%, 01/01/2021 ■► | | | 1,561 | |
| | 32,933 | | | 6.65%, 02/01/2021 ■► | | | 507 | |
| | | | | Ford Credit Automotive Owner Trust | | | | |
| | 4,600 | | | 2.54%, 02/15/2016 | | | 4,733 | |
| | 3,680 | | | 3.21%, 07/15/2017 | | | 3,709 | |
| | 1,730 | | | 5.53%, 05/15/2016 ■ | | | 1,844 | |
| | | | | Ford Credit Floorplan Master Owner Trust | | | | |
| | 6,225 | | | 1.50%, 09/15/2015 | | | 6,235 | |
| | | | | FREMF Mortgage Trust | | | | |
| | 5,915 | | | 4.35%, 01/25/2046 ■Δ | | | 4,992 | |
| | 5,190 | | | 4.75%, 11/25/2046 ■Δ | | | 4,390 | |
| | | | | GE Business Loan Trust | | | | |
| | 7,267 | | | 1.28%, 05/15/2034 ■Δ | | | 2,574 | |
| | | | | GE Capital Credit Card Master Note Trust | | | | |
| 3,565 | | | 3.69%, 07/15/2015 | | | 3,621 | |
| | | | | GMAC Mortgage Servicer Advance Funding | | | | |
| | 12,085 | | | 3.72%, 03/15/2023 ■ | | | 12,055 | |
| | | | | Goldman Sachs Mortgage Securities Corp. II | | | | |
| | 4,347 | | | 5.56%, 11/10/2039 | | | 4,772 | |
| | 45,385 | | | 6.00%, 08/10/2020 ■► | | | 3,879 | |
| | | | | Harley-Davidson Motorcycle Trust | | | | |
| | 4,180 | | | 2.12%, 08/15/2017 | | | 4,189 | |
| | | | | Hyundai Automotive Receivables Trust | | | | |
| | 6,710 | | | 2.27%, 02/15/2017 | | | 6,860 | |
| | | | | JP Morgan Automotive Receivable Trust | | | | |
| | 1,675 | | | 12.85%, 03/15/2012 ⌂† | | | 1,412 | |
| | | | | JP Morgan Chase Commercial Mortgage Securities Corp. | | | | |
| | 366,069 | | | 0.22%, 08/12/2037 ► | | | 63 | |
| | 48,049 | | | 4.14%, 05/15/2021 ■► | | | 3,581 | |
| | 50,046 | | | 4.84%, 02/15/2021 ■► | | | 3,175 | |
| | 3,840 | | | 5.14%, 11/13/2016 ■Δ | | | 3,878 | |
| | 1,510 | | | 5.34%, 05/15/2047 | | | 1,445 | |
| | 4,380 | | | 5.42%, 01/15/2049 | | | 4,735 | |
| | 3,090 | | | 5.44%, 06/12/2047 Δ | | | 3,312 | |
| | 4,315 | | | 5.88%, 02/15/2051 Δ | | | 4,687 | |
| | 16,715 | | | 6.00%, 09/15/2020 ■► | | | 1,604 | |
| | 15,315 | | | 10.00%, 10/15/2020 ■► | | | 575 | |
| | 322,444 | | | 15.00%, 05/12/2045 ► | | | 2,618 | |
| | | | | Lehman Brothers Small Balance Commercial | | | | |
| | 2,608 | | | 5.52%, 09/25/2030 ■ | | | 2,144 | |
| | 935 | | | 5.62%, 09/25/2036 ■ | | | 875 | |
| | | | | Merrill Lynch Mortgage Trust | | | | |
| | 31,293 | | | 3.96%, 10/12/2041 ⌂■► | | | 97 | |
| | | | | Merrill Lynch/Countrywide Commercial Mortgage Trust | | | | |
| | 4,377 | | | 5.38%, 08/12/2048 | | | 4,528 | |
| | | | | Morgan Stanley Capital I | | | | |
| | 103,275 | | | 4.39%, 09/15/2047 ■► | | | 4,028 | |
| | 2,202 | | | 5.78%, 04/12/2049 Δ | | | 2,249 | |
| | | | | Morgan Stanley Dean Witter Capital I | | | | |
| | 15,286 | | | 0.00%, 08/25/2032 ⌂►†∞ | | | – | |
| | | | | Morgan Stanley Re-Remic Trust | | | | |
| | 6,970 | | | 6.46%, 07/17/2056 ■ | | | 5,855 | |
| | | | | National Credit Union Administration | | | | |
| | 5,453 | | | 1.84%, 10/07/2020 Δ | | | 5,487 | |
| | | | | Nationstar Home Equity Loan Trust | | | | |
| | 211 | | | 0.00%, 03/25/2037 ⌂■●† | | | – | |
| | | | | RBSCF Trust | | | | |
| | 7,205 | | | 5.51%, 04/16/2047 ■Δ | | | 6,888 | |
| | | | | Renaissance Home Equity Loan Trust | | | | |
| | 3,566 | | | 5.36%, 05/25/2035 | | | 1,656 | |
| | 2,676 | | | 5.58%, 11/25/2036 Δ | | | 1,507 | |
| | | | | Residential Funding Mortgage Securities, Inc. | | | | |
| | 2,089 | | | 6.00%, 07/25/2037 ⌂ | | | 1,644 | |
| | | | | Sovereign Commercial Mortgage Securities | | | | |
| | 3,815 | | | 5.97%, 07/22/2030 ■Δ | | | 3,903 | |
The accompanying notes are an integral part of these financial statements.
| Shares or Principal Amount ╬ | | Market Value ╪ |
ASSET & COMMERCIAL MORTGAGE BACKED SECURITIES - 6.6% - (continued) |
| | | | | Finance and Insurance - 6.6% - (continued) | | | | |
| | | | | Wachovia Bank Commercial Mortgage Trust | | | | |
| $ | 5,740 | | | 5.59%, 04/15/2047 | | $ | 4,604 | |
| | | | | Wamu Commercial Mortgage Securities Trust | | | | |
| | 7,170 | | | 6.31%, 03/23/2045 ■ΔΨ | | | 3,907 | |
| | | | | Wells Fargo Alternative Loan Trust | | | | |
| | 8,925 | | | 6.25%, 11/25/2037 ⌂ | | | 6,899 | |
| | | | | Wells Fargo Commercial Mortgage Trust | | | | |
| | 3,041 | | | 5.28%, 10/15/2020 ■ | | | 3,062 | |
| | | | | WF-RBS Commercial Mortgage Trust | | | | |
| | 5,505 | | | 4.90%, 06/15/2044 ■ | | | 6,090 | |
| | 2,045 | | | 5.64%, 11/15/2044 ■ | | | 2,003 | |
| | 37,074 | | | 6.02%, 11/15/2044 ■► | | | 4,415 | |
| | | | | | | | 286,384 | |
| | | | | | | | | |
| | | | | Total asset & commercial mortgage backed securities | | | | |
| | | | | (cost $299,051) | | $ | 286,384 | |
| | | | | | | | | |
| CORPORATE BONDS - 38.6% | | | | |
| | | | | Accommodation and Food Services - 0.2% | | | | |
| | | | | Marina District Finance Co., Inc. | | | | |
| $ | 1,240 | | | 9.50%, 10/15/2015 | | $ | 1,159 | |
| | | | | MGM Mirage, Inc. | | | | |
| | 4,172 | | | 11.13%, 11/15/2017 | | | 4,756 | |
| | | | | MGM Resorts International | | | | |
| | 2,188 | | | 11.38%, 03/01/2018 | | | 2,407 | |
| | | | | Wynn Las Vegas LLC | | | | |
| | 1,060 | | | 7.75%, 08/15/2020 | | | 1,177 | |
| | | | | | | | 9,499 | |
| | | | | Administrative Waste Management and Remediation - 0.2% | | | | |
| | | | | Brambles USA, Inc. | | | | |
| | 5,478 | | | 3.95%, 04/01/2015 ■ | | | 5,665 | |
| | | | | Energy Solutions, Inc. LLC | | | | |
| | 1,185 | | | 10.75%, 08/15/2018 | | | 1,110 | |
| | | | | Iron Mountain, Inc. | | | | |
| | 1,215 | | | 7.75%, 10/01/2019 | | | 1,283 | |
| | | | | TransUnion LLC | | | | |
| | 875 | | | 11.38%, 06/15/2018 | | | 1,000 | |
| | | | | | | | 9,058 | |
| | | | | Agriculture, Forestry, Fishing and Hunting - 0.0% | | | | |
| | | | | American Seafood Group LLC | | | | |
| | 945 | | | 10.75%, 05/15/2016 ■ | | | 841 | |
| | | | | | | | | |
| | | | | Air Transportation - 0.0% | | | | |
| | | | | United Air Lines, Inc. | | | | |
| | 1,150 | | | 9.88%, 08/01/2013 ■ | | | 1,176 | |
| | | | | | | | | |
| | | | | Apparel Manufacturing - 0.0% | | | | |
| | | | | Quiksilver, Inc. | | | | |
| | 1,495 | | | 6.88%, 04/15/2015 | | | 1,388 | |
| | | | | | | | | |
| | | | | Arts, Entertainment and Recreation - 1.9% | | | | |
| | | | | CCO Holdings LLC | | | | |
| | 275 | | | 7.38%, 06/01/2020 | | | 290 | |
| | | | | Cenveo, Inc. | | | | |
| | 1,600 | | | 8.88%, 02/01/2018 | | | 1,396 | |
| | | | | Cequel Communication LLC | | | | |
| | 1,031 | | | 8.63%, 11/15/2017 ■ | | | 1,093 | |
| | | | | Clubcorp Club Operations, Inc. | | | | |
| | 1,513 | | | 10.00%, 12/01/2018 | | | 1,452 | |
| | | | | Comcast Corp. | | | | |
| | 100 | | | 10.63%, 07/15/2012 | | | 104 | |
| | | | | DirecTV Holdings LLC | | | | |
| | 4,200 | | | 5.00%, 03/01/2021 | | | 4,495 | |
| | 8,570 | | | 7.63%, 05/15/2016 | | | 9,095 | |
| | | | | Downstream Development Authority | | | | |
| | 1,026 | | | 10.50%, 07/01/2019 ■ | | | 970 | |
| | | | | FireKeepers Development Authority | | | | |
| | 439 | | | 13.88%, 05/01/2015 ■ | | | 498 | |
| | | | | First Data Corp. | | | | |
| | 2,007 | | | 10.55%, 09/24/2015 Þ | | | 1,914 | |
| | | | | Globo Comunicacao e Participacoes S.A | | | | |
| | 2,660 | | | 6.25%, 07/20/2015 §♠ | | | 2,786 | |
| | | | | Knight Ridder, Inc. | | | | |
| | 5,503 | | | 6.88%, 03/15/2029 | | | 2,751 | |
| | | | | McClatchy Co. | | | | |
| | 1,639 | | | 11.50%, 02/15/2017 | | | 1,586 | |
| | | | | NAI Entertainment Holdings LLC | | | | |
| | 813 | | | 8.25%, 12/15/2017 ■ | | | 860 | |
| | | | | NBC Universal Media LLC | | | | |
| | 3,745 | | | 3.65%, 04/30/2015 | | | 3,953 | |
| | 6,700 | | | 4.38%, 04/01/2021 | | | 7,071 | |
| | 4,665 | | | 5.15%, 04/30/2020 | | | 5,194 | |
| | | | | News America, Inc. | | | | |
| | 7,955 | | | 4.50%, 02/15/2021 | | | 8,341 | |
| | | | | Time Warner Entertainment Co., L.P. | | | | |
| | 8,175 | | | 8.38%, 07/15/2033 | | | 10,715 | |
| | | | | Time Warner, Inc. | | | | |
| | 1,505 | | | 4.00%, 01/15/2022 | | | 1,552 | |
| | 7,665 | | | 6.25%, 03/29/2041 | | | 9,190 | |
| | | | | TL Acquisitions, Inc. | | | | |
| | 2,755 | | | 10.50%, 01/15/2015 ■ | | | 1,977 | |
| | | | | UPC Germany GMBH | | | | |
| | 696 | | | 8.13%, 12/01/2017 ■ | | | 735 | |
| | | | | Virgin Media Finance plc | | | | |
| | 1,080 | | | 9.50%, 08/15/2016 | | | 1,212 | |
| | | | | XM Satellite Radio, Inc. | | | | |
| | 1,830 | | | 7.63%, 11/01/2018 ■ | | | 1,922 | |
| | 2,151 | | | 13.00%, 08/01/2013 ■ | | | 2,441 | |
| | | | | | | | 83,593 | |
| | | | | Beverage and Tobacco Product Manufacturing - 0.7% | | | | |
| | | | | Altria Group, Inc. | | | | |
| | 4,440 | | | 10.20%, 02/06/2039 | | | 6,909 | |
| | | | | Anheuser-Busch Cos., Inc. | | | | |
| | 4,830 | | | 5.05%, 10/15/2016 | | | 5,501 | |
| | | | | Anheuser-Busch InBev N.V | | | | |
| | 8,890 | | | 7.75%, 01/15/2019 | | | 11,514 | |
| | | | | Coca-Cola Co. | | | | |
| | 5,720 | | | 3.30%, 09/01/2021 | | | 6,024 | |
| | | | | | | | 29,948 | |
| | | | | Chemical Manufacturing - 1.6% | | | | |
| | | | | Dow Chemical Co. | | | | |
| | 17,745 | | | 8.55%, 05/15/2019 | | | 23,216 | |
The accompanying notes are an integral part of these financial statements.
Hartford Total Return Bond HLS Fund
Schedule of Investments – (continued)
December 31, 2011
(000’s Omitted)
| Shares or Principal Amount ╬ | | Market Value ╪ | |
| CORPORATE BONDS - 38.6% - (continued) | |
| | | | | Chemical Manufacturing - 1.6% - (continued) | | | | |
| | | | | Ecolab, Inc. | | | | |
| $ | 2,290 | | | 2.38%, 12/08/2014 | | $ | 2,335 | |
| | 12,850 | | | 3.00%, 12/08/2016 | | | 13,292 | |
| | 3,980 | | | 4.35%, 12/08/2021 | | | 4,250 | |
| | 2,660 | | | 5.50%, 12/08/2041 | | | 2,948 | |
| | | | | Ferro Corp. | | | | |
| | 1,790 | | | 7.88%, 08/15/2018 | | | 1,799 | |
| | | | | Hexion Specialty Chemicals | | | | |
| | 1,595 | | | 8.88%, 02/01/2018 | | | 1,495 | |
| | | | | Incitec Pivot Finance LLC | | | | |
| | 9,460 | | | 6.00%, 12/10/2019 ■ | | | 10,336 | |
| | | | | Ineos Group Holdings plc | | | | |
| | 1,841 | | | 8.50%, 02/15/2016 ■ | | | 1,464 | |
| | | | | Yara International ASA | | | | |
| | 5,445 | | | 7.88%, 06/11/2019 ■ | | | 6,683 | |
| | | | | | | | 67,818 | |
| | | | | Computer and Electronic Product Manufacturing - 0.3% | | | | |
| | | | | Advanced Micro Devices, Inc. | | | | |
| | 1,070 | | | 8.13%, 12/15/2017 | | | 1,110 | |
| | | | | Hewlett-Packard Co. | | | | |
| | 7,860 | | | 2.35%, 03/15/2015 | | | 7,822 | |
| | | | | Magnachip Semiconductor | | | | |
| | 870 | | | 10.50%, 04/15/2018 | | | 905 | |
| | | | | Nextel Communications, Inc. | | | | |
| | 1,060 | | | 7.38%, 08/01/2015 | | | 970 | |
| | | | | Seagate HDD Cayman | | | | |
| | 1,115 | | | 7.75%, 12/15/2018 ■ | | | 1,186 | |
| | | | | Sorenson Communications | | | | |
| | 2,006 | | | 10.50%, 02/01/2015 ■ | | | 1,384 | |
| | | | | Viasystems, Inc. | | | | |
| | 1,175 | | | 12.00%, 01/15/2015 ■ | | | 1,259 | |
| | | | | | | | 14,636 | |
| | | | | Construction - 0.4% | | | | |
| | | | | CRH America, Inc. | | | | |
| | 3,590 | | | 5.30%, 10/15/2013 | | | 3,728 | |
| | | | | D.R. Horton, Inc. | | | | |
| | 1,245 | | | 6.50%, 04/15/2016 | | | 1,290 | |
| | | | | Odebrecht Finance Ltd. | | | | |
| | 9,340 | | | 7.00%, 04/21/2020 § | | | 9,994 | |
| | | | | Pulte Homes, Inc. | | | | |
| | 800 | | | 7.88%, 06/15/2032 | | | 644 | |
| | | | | Shea Homes L.P. | | | | |
| | 1,373 | | | 8.63%, 05/15/2019 ■ | | | 1,284 | |
| | | | | Urbi Desarrollos Urbanos | | | | |
| | 1,500 | | | 9.50%, 01/21/2020 § | | | 1,515 | |
| | | | | | | | 18,455 | |
| | | | | Educational Services - 0.0% | | | | |
| | | | | Laureate Education, Inc. | | | | |
| | 830 | | | 10.00%, 08/15/2015 ■ | | | 847 | |
| | | | | | | | | |
| | | | | Electrical Equipment and Appliance Manufacturing - 0.3% | | | | |
| | | | | General Electric Co. | | | | |
| | 10,740 | | | 5.00%, 02/01/2013 | | | 11,192 | |
| | | | | | | | | |
| | | | | Fabricated Metal Product Manufacturing - 0.0% | | | | |
| | | | | BWAY Holding Co. | | | | |
| | 815 | | | 10.00%, 06/15/2018 | | | 868 | |
| | | | | | | | | |
| | | | | Finance and Insurance - 13.9% | | | | |
| | | | | Aetna, Inc. | | | | |
| | 5,755 | | | 4.13%, 06/01/2021 | | | 6,007 | |
| | | | | Ally Financial, Inc. | | | | |
| | 1,255 | | | 7.50%, 09/15/2020 | | | 1,268 | |
| | 1,210 | | | 8.30%, 02/12/2015 | | | 1,277 | |
| | | | | American Express Centurion Bank | | | | |
| | 3,337 | | | 5.95%, 06/12/2017 | | | 3,750 | |
| | | | | American Express Co. | | | | |
| | 8,385 | | | 5.50%, 04/16/2013 | | | 8,764 | |
| | 8,587 | | | 5.55%, 10/17/2012 | | | 8,874 | |
| | | | | American International Group, Inc. | | | | |
| | 2,593 | | | 3.65%, 01/15/2014 | | | 2,518 | |
| | | | | Americo Life, Inc. | | | | |
| | 75 | | | 7.88%, 05/01/2013 ⌂■ | | | 76 | |
| | | | | Asciano Finance Ltd. | | | | |
| | 2,936 | | | 3.13%, 09/23/2015 ■ | | | 2,839 | |
| | 3,698 | | | 5.00%, 04/07/2018 ■ | | | 3,708 | |
| | | | | BAE Systems Holdings, Inc. | | | | |
| | 4,154 | | | 5.20%, 08/15/2015 ■ | | | 4,466 | |
| | | | | Bank of America Capital II | | | | |
| | 2,610 | | | 8.00%, 12/15/2026 | | | 2,349 | |
| | | | | Bank of America Corp. | | | | |
| | 13,800 | | | 5.65%, 05/01/2018 | | | 13,148 | |
| | 8,665 | | | 5.75%, 12/01/2017 | | | 8,184 | |
| | 20,395 | | | 6.50%, 08/01/2016 | | | 20,539 | |
| | | | | Bank of New York Institutional Capital Trust | | | | |
| | 200 | | | 7.78%, 12/01/2026 ■ | | | 203 | |
| | | | | BP Capital Markets plc | | | | |
| | 11,820 | | | 2.25%, 11/01/2016 | | | 11,895 | |
| | | | | Capital One Financial Corp. | | | | |
| | 5,224 | | | 2.13%, 07/15/2014 | | | 5,157 | |
| | 3,740 | | | 3.15%, 07/15/2016 | | | 3,756 | |
| | | | | CDP Financial, Inc. | | | | |
| | 10,860 | | | 3.00%, 11/25/2014 ■ | | | 11,293 | |
| | | | | Cigna Corp. | | | | |
| | 10,196 | | | 2.75%, 11/15/2016 | | | 10,174 | |
| | | | | CIT Group, Inc. | | | | |
| | 1,175 | | | 6.63%, 04/01/2018 ■ | | | 1,216 | |
| | 5,503 | | | 7.00%, 05/01/2017 | | | 5,503 | |
| | | | | Citigroup, Inc. | | | | |
| | 10,185 | | | 2.13%, 04/30/2012 ‡ | | | 10,253 | |
| | 33,951 | | | 4.59%, 12/15/2015 | | | 34,168 | |
| | 8,887 | | | 6.38%, 08/12/2014 | | | 9,327 | |
| | 4,839 | | | 8.50%, 05/22/2019 | | | 5,696 | |
| | | | | CNA Financial Corp. | | | | |
| | 4,492 | | | 5.75%, 08/15/2021 | | | 4,584 | |
| | | | | CNL Lifestyle Properties | | | | |
| | 1,594 | | | 7.25%, 04/15/2019 | | | 1,474 | |
| | | | | Corpoacion Andina De Fomento | | | | |
| | 10,160 | | | 3.75%, 01/15/2016 | | | 10,317 | |
| | | | | Discover Financial Services, Inc. | | | | |
| | 5,970 | | | 10.25%, 07/15/2019 | | | 7,277 | |
| | | | | Ford Motor Credit Co. | | | | |
| | 6,545 | | | 6.63%, 08/15/2017 | | | 7,125 | |
| | 1,590 | | | 12.00%, 05/15/2015 | | | 1,948 | |
| | | | | General Electric Capital Corp. | | | | |
| | 10,479 | | | 4.38%, 09/16/2020 | | | 10,708 | |
| | 10,990 | | | 5.63%, 05/01/2018 | | | 12,309 | |
The accompanying notes are an integral part of these financial statements.
| Shares or Principal Amount ╬ | | Market Value ╪ | |
| CORPORATE BONDS - 38.6% - (continued) | |
| | | | | Finance and Insurance - 13.9% - (continued) | | | | |
| | | | | GMAC LLC | | | | |
| $ | 985 | | | 8.00%, 11/01/2031 | | $ | 951 | |
| | | | | Goldman Sachs Group, Inc. | | | | |
| | 14,511 | | | 3.63%, 02/07/2016 | | | 14,021 | |
| | 2,437 | | | 6.00%, 06/15/2020 | | | 2,496 | |
| | | | | Guardian Life Insurance Co. | | | | |
| | 6,291 | | | 7.38%, 09/30/2039 ■ | | | 8,008 | |
| | | | | HCP, Inc. | | | | |
| | 5,284 | | | 3.75%, 02/01/2016 | | | 5,376 | |
| | | | | Health Care REIT, Inc. | | | | |
| | 4,802 | | | 3.63%, 03/15/2016 | | | 4,726 | |
| | | | | Hub International Holdings, Inc. | | | | |
| | 1,212 | | | 10.25%, 06/15/2015 ■ | | | 1,203 | |
| | | | | Ineos Finance plc | | | | |
| | 1,780 | | | 9.00%, 05/15/2015 ■ | | | 1,807 | |
| | | | | JP Morgan Chase & Co. | | | | |
| | 25,695 | | | 3.15%, 07/05/2016 ‡ | | | 25,815 | |
| | 12,145 | | | 4.35%, 08/15/2021 | | | 12,265 | |
| | 13,196 | | | 4.75%, 03/01/2015 ‡ | | | 14,035 | |
| | 6,375 | | | 6.00%, 01/15/2018 | | | 7,112 | |
| | | | | JP Morgan Chase Capital XXV | | | | |
| | 4,288 | | | 6.80%, 10/01/2037 | | | 4,304 | |
| | | | | Liberty Mutual Group, Inc. | | | | |
| | 1,425 | | | 10.75%, 06/15/2058 ■ | | | 1,788 | |
| | | | | Lloyds Banking Group plc | | | | |
| | 15,635 | | | 4.38%, 01/12/2015 ■ | | | 15,051 | |
| | | | | Massachusetts Mutual Life Insurance Co. | | | | |
| | 2,993 | | | 8.88%, 06/01/2039 ■ | | | 4,378 | |
| | | | | Merrill Lynch & Co., Inc. | | | | |
| | 12,775 | | | 6.05%, 05/16/2016 | | | 12,041 | |
| | | | | MetLife Global Funding I | | | | |
| | 6,515 | | | 0.80%, 03/15/2012 ■Δ | | | 6,511 | |
| | 3,400 | | | 5.13%, 06/10/2014 ■ | | | 3,661 | |
| | | | | Morgan Stanley | | | | |
| | 15,305 | | | 3.80%, 04/29/2016 | | | 14,101 | |
| | 4,302 | | | 5.75%, 10/18/2016 | | | 4,190 | |
| | 19,962 | | | 6.25%, 08/28/2017 | | | 19,536 | |
| | | | | Myriad International Holdings B.V | | | | |
| | 3,900 | | | 6.38%, 07/28/2017 ■ | | | 4,153 | |
| | | | | Nationwide Financial Services, Inc. | | | | |
| | 4,280 | | | 5.38%, 03/25/2021 ■ | | | 4,204 | |
| | | | | Nationwide Mutual Insurance Co. | | | | |
| | 6,425 | | | 9.38%, 08/15/2039 ■ | | | 7,764 | |
| | | | | New York Life Global Funding | | | | |
| | 12,295 | | | 3.00%, 05/04/2015 ■ | | | 12,877 | |
| | | | | Offshore Group Investments Ltd. | | | | |
| | 954 | | | 11.50%, 08/01/2015 | | | 1,031 | |
| | | | | Ohio National Financial Services, Inc. | | | | |
| | 6,672 | | | 6.38%, 04/30/2020 ■ | | | 7,256 | |
| | | | | Penson Worldwide, Inc. | | | | |
| | 2,211 | | | 12.50%, 05/15/2017 ■ | | | 1,327 | |
| | | | | PNC Bank NA | | | | |
| | 2,235 | | | 6.00%, 12/07/2017 | | | 2,483 | |
| | 2,924 | | | 6.88%, 04/01/2018 | | | 3,316 | |
| | | | | Progressive Corp. | | | | |
| | 4,675 | | | 3.75%, 08/23/2021 | | | 4,858 | |
| | | | | Provident Funding Associates L.P. | | | | |
| | 1,031 | | | 10.13%, 02/15/2019 ■ | | | 794 | |
| | 1,901 | | | 10.25%, 04/15/2017 ■ | | | 1,773 | |
| | | | | Prudential Financial, Inc. | | | | |
| | 8,810 | | | 3.00%, 05/12/2016 | | | 8,778 | |
| | | | | Prudential Holdings LLC | | | | |
| | 200 | | | 7.25%, 12/18/2023 ■ | | | 226 | |
| | | | | Rabobank Netherlands | | | | |
| | 4,513 | | | 11.00%, 06/30/2019 ■♠ | | | 5,280 | |
| | | | | Santander Holdings USA | | | | |
| | 3,006 | | | 4.63%, 04/19/2016 | | | 2,887 | |
| | | | | Santander U.S. Debt S.A | | | | |
| | 10,100 | | | 3.72%, 01/20/2015 ■ | | | 9,171 | |
| | | | | SLM Corp. | | | | |
| | 6,630 | | | 6.25%, 01/25/2016 | | | 6,448 | |
| | | | | Springleaf Finance Corp. | | | | |
| | 5,440 | | | 6.90%, 12/15/2017 | | | 3,917 | |
| | | | | Standard Chartered plc | | | | |
| | 3,752 | | | 3.20%, 05/12/2016 ■ | | | 3,671 | |
| | | | | State Street Bank & Trust Co. | | | | |
| | 3,935 | | | 5.25%, 10/15/2018 | | | 4,379 | |
| | | | | State Street Corp. | | | | |
| | 7,610 | | | 4.96%, 03/15/2018 | | | 7,910 | |
| | | | | Teachers Insurance & Annuity Association | | | | |
| | 6,248 | | | 6.85%, 12/16/2039 ■ | | | 8,019 | |
| | | | | Tomkins, Inc. LLC | | | | |
| | 920 | | | 9.00%, 10/01/2018 | | | 1,020 | |
| | | | | UBS AG Stamford CT | | | | |
| | 4,535 | | | 2.25%, 01/28/2014 | | | 4,413 | |
| | | | | Union Bank NA | | | | |
| | 11,235 | | | 3.00%, 06/06/2016 | | | 11,427 | |
| | | | | UPCB Finance III Ltd. | | | | |
| | 1,084 | | | 6.63%, 07/01/2020 ■ | | | 1,068 | |
| | | | | VTB Capital S.A | | | | |
| | 2,200 | | | 6.55%, 10/13/2020 ■ | | | 2,060 | |
| | | | | Wells Fargo Bank NA | | | | |
| | 8,015 | | | 0.67%, 05/16/2016 Δ | | | 7,046 | |
| | 12,775 | | | 4.75%, 02/09/2015 | | | 13,328 | |
| | | | | Xstrata Finance Canada Corp. | | | | |
| | 6,375 | | | 3.60%, 01/15/2017 ■ | | | 6,428 | |
| | 5,075 | | | 4.95%, 11/15/2021 ■ | | | 5,185 | |
| | | | | ZFS Finance USA Trust I | | | | |
| | 3,193 | | | 6.50%, 05/09/2037 ■Δ | | | 2,874 | |
| | | | | | | | 602,897 | |
| | | | | Food Manufacturing - 0.5% | | | | |
| | | | | JBS USA LLC | | | | |
| | 1,058 | | | 7.25%, 06/01/2021 ■ | | | 987 | |
| | | | | Kraft Foods, Inc. | | | | |
| | 2,420 | | | 4.13%, 02/09/2016 | | | 2,627 | |
| | | | | Sigma Alimentos S.A | | | | |
| | 5,600 | | | 5.63%, 04/14/2018 § | | | 5,712 | |
| | | | | Wrigley Jr., William Co. | | | | |
| | 10,070 | | | 3.70%, 06/30/2014 ■ | | | 10,381 | |
| | | | | | | | 19,707 | |
| | | | | Food Services - 0.1% | | | | |
| | | | | Arcos Dorados S.A | | | | |
| | 3,297 | | | 7.50%, 10/01/2019 ■ | | | 3,643 | |
| | | | | Landry's Restaurants, Inc. | | | | |
| | 1,950 | | | 11.63%, 12/01/2015 | | | 2,053 | |
| | | | | | | | 5,696 | |
| | | | | Health Care and Social Assistance - 1.6% | | | | |
| | | | | Amerigroup Corp. | | | | |
| | 1,006 | | | 7.50%, 11/15/2019 | | | 1,036 | |
The accompanying notes are an integral part of these financial statements.
Hartford Total Return Bond HLS Fund
Schedule of Investments – (continued)
December 31, 2011
(000’s Omitted)
| Shares or Principal Amount ╬ | | Market Value ╪ | |
| CORPORATE BONDS - 38.6% - (continued) | |
| | | | | Health Care and Social Assistance - 1.6% - (continued) | | | | |
| | | | | Aristotle Holding, Inc. | | | | |
| $ | 8,840 | | | 3.50%, 11/15/2016 ■ | | $ | 9,003 | |
| | | | | Aurora Diagnostic Holdings | | | | |
| | 1,121 | | | 10.75%, 01/15/2018 | | | 1,115 | |
| | | | | Biomet, Inc. | | | | |
| | 1,140 | | | 10.38%, 10/15/2017 Þ | | | 1,234 | |
| | | | | CVS Caremark Corp. | | | | |
| | 9,183 | | | 8.35%, 07/10/2031 ■ | | | 11,239 | |
| | | | | Examworks Group, Inc. | | | | |
| | 922 | | | 9.00%, 07/15/2019 ■ | | | 835 | |
| | | | | Gilead Sciences, Inc. | | | | |
| | 2,229 | | | 2.40%, 12/01/2014 | | | 2,269 | |
| | 10,146 | | | 3.05%, 12/01/2016 | | | 10,384 | |
| | 7,210 | | | 4.40%, 12/01/2021 | | | 7,633 | |
| | | | | HCA, Inc. | | | | |
| | 5,147 | | | 7.50%, 11/15/2095 | | | 3,963 | |
| | 1,140 | | | 8.50%, 04/15/2019 | | | 1,248 | |
| | | | | Health Management Associates, Inc. | | | | |
| | 794 | | | 7.38%, 01/15/2020 ■ | | | 826 | |
| | | | | LifePoint Hospitals, Inc. | | | | |
| | 1,085 | | | 6.63%, 10/01/2020 | | | 1,124 | |
| | | | | Partners Healthcare Systems | | | | |
| | 2,815 | | | 3.44%, 07/01/2021 | | | 2,839 | |
| | | | | Tenet Healthcare Corp. | | | | |
| | 1,014 | | | 6.25%, 11/01/2018 ■ | | | 1,032 | |
| | | | | Teva Pharmaceutical Finance IV B.V | | | | |
| | 5,265 | | | 3.65%, 11/10/2021 | | | 5,355 | |
| | | | | Teva Pharmaceuticals Finance | | | | |
| | 5,265 | | | 2.40%, 11/10/2016 | | | 5,355 | |
| | | | | Valeant Pharmaceuticals International | | | | |
| | 1,280 | | | 7.25%, 07/15/2022 ■ | | | 1,242 | |
| | | | | | | | 67,732 | |
| | | | | Information - 3.4% | | | | |
| | | | | AT&T, Inc. | | | | |
| | 6,455 | | | 2.40%, 08/15/2016 | | | 6,586 | |
| | 15,520 | | | 5.35%, 09/01/2040 | | | 17,458 | |
| | | | | Cellco Partnership - Verizon Wireless Capital LLC | | | | |
| | 7,280 | | | 8.50%, 11/15/2018 | | | 9,826 | |
| | | | | Charter Communications Holdings II LLC | | | | |
| | 954 | | | 13.50%, 11/30/2016 | | | 1,102 | |
| | | | | Clearwire Corp. | | | | |
| | 2,489 | | | 12.00%, 12/01/2015 ■ | | | 2,383 | |
| | | | | CSC Holdings LLC | | | | |
| | 768 | | | 6.75%, 11/15/2021 ■ | | | 808 | |
| | | | | Deutsche Telekom International Finance B.V | | | | |
| | 13,315 | | | 3.13%, 04/11/2016 ■ | | | 13,414 | |
| | | | | DISH DBS Corp. | | | | |
| | 1,980 | | | 7.88%, 09/01/2019 | | | 2,237 | |
| | | | | Evertec, Inc. | | | | |
| | 1,115 | | | 11.00%, 10/01/2018 | | | 1,137 | |
| | | | | Frontier Communications Corp. | | | | |
| | 1,055 | | | 7.88%, 01/15/2027 | | | 897 | |
| | | | | GTE Corp. | | | | |
| | 165 | | | 8.75%, 11/01/2021 | | | 231 | |
| | | | | GXS Worldwide, Inc. | | | | |
| | 1,109 | | | 9.75%, 06/15/2015 | | | 1,026 | |
| | | | | iGate Corp. | | | | |
| | 1,127 | | | 9.00%, 05/01/2016 ■ | | | 1,164 | |
| | | | | Intelsat Bermuda Ltd. | | | | |
| | 1,255 | | | 11.50%, 02/04/2017 Þ | | | 1,211 | |
| | | | | Intelsat Jackson Holdings Ltd. | | | | |
| | 2,665 | | | 8.50%, 11/01/2019 | | | 2,825 | |
| | | | | Kabel Baden Wurttemberg GMBH & Co. | | | | |
| | 1,269 | | | 7.50%, 03/15/2019 ■ | | | 1,332 | |
| | | | | Level 3 Financing, Inc. | | | | |
| | 2,359 | | | 10.00%, 02/01/2018 | | | 2,501 | |
| | | | | MTS International Funding Ltd. | | | | |
| | 2,060 | | | 8.63%, 06/22/2020 ■ | | | 2,212 | |
| | | | | Paetec Holding Corp. | | | | |
| | 698 | | | 9.88%, 12/01/2018 | | | 768 | |
| | | | | Qwest Corp. | | | | |
| | 4,835 | | | 7.20%, 11/10/2026 | | | 4,824 | |
| | 3,656 | | | 7.25%, 10/15/2035 | | | 3,646 | |
| | | | | Rogers Cable, Inc. | | | | |
| | 2,920 | | | 8.75%, 05/01/2032 | | | 3,956 | |
| | | | | Sprint Nextel Corp. | | | | |
| | 1,306 | | | 9.00%, 11/15/2018 ■ | | | 1,371 | |
| | 1,575 | | | 11.50%, 11/15/2021 ■ | | | 1,559 | |
| | | | | TCI Communications, Inc. | | | | |
| | 4,025 | | | 8.75%, 08/01/2015 | | | 4,890 | |
| | | | | Telecom Italia Capital | | | | |
| | 5,000 | | | 7.18%, 06/18/2019 | | | 4,686 | |
| | 214 | | | 7.72%, 06/04/2038 | | | 182 | |
| | | | | Telefonica Emisiones SAU | | | | |
| | 11,220 | | | 3.99%, 02/16/2016 | | | 10,788 | |
| | 5,295 | | | 4.95%, 01/15/2015 | | | 5,267 | |
| | | | | Trilogy International Partners LLC | | | | |
| | 1,979 | | | 10.25%, 08/15/2016 ■ | | | 1,811 | |
| | | | | Verizon Communications, Inc. | | | | |
| | 11,240 | | | 3.50%, 11/01/2021 | | | 11,702 | |
| | 5,315 | | | 4.75%, 11/01/2041 | | | 5,720 | |
| | | | | Verizon Maryland, Inc. | | | | |
| | 1,500 | | | 8.30%, 08/01/2031 | | | 1,851 | |
| | | | | Verizon Virginia, Inc. | | | | |
| | 13,805 | | | 4.63%, 03/15/2013 | | | 14,373 | |
| | | | | Videotron Ltee | | | | |
| | 915 | | | 9.13%, 04/15/2018 | | | 1,008 | |
| | | | | Windstream Corp. | | | | |
| | 1,625 | | | 7.50%, 04/01/2023 | | | 1,605 | |
| | | | | | | | 148,357 | |
| | | | | Machinery Manufacturing - 0.2% | | | | |
| | | | | Baker Hughes, Inc. | | | | |
| | 4,700 | | | 3.20%, 08/15/2021 ■ | | | 4,856 | |
| | | | | Case New Holland, Inc. | | | | |
| | 1,336 | | | 7.88%, 12/01/2017 | | | 1,510 | |
| | | | | Joy Global, Inc. | | | | |
| | 1,520 | | | 5.13%, 10/15/2021 | | | 1,622 | |
| | | | | | | | 7,988 | |
| | | | | Mining - 1.4% | | | | |
| | | | | Anglo American Capital plc | | | | |
| | 16,188 | | | 9.38%, 04/08/2014 - 04/08/2019 ■ | | | 18,755 | |
| | | | | Arch Coal, Inc. | | | | |
| | 705 | | | 7.25%, 06/15/2021 ■ | | | 724 | |
The accompanying notes are an integral part of these financial statements.
| Shares or Principal Amount ╬ | | Market Value ╪ | |
| CORPORATE BONDS - 38.6% - (continued) | |
| | | | | Mining - 1.4% - (continued) | | | | |
| | | | | Cliff's Natural Resources, Inc. | | | | |
| $ | 4,065 | | | 4.80%, 10/01/2020 | | $ | 4,032 | |
| | 6,135 | | | 5.90%, 03/15/2020 | | | 6,539 | |
| | | | | FMG Resources Pty Ltd. | | | | |
| | 1,299 | | | 7.00%, 11/01/2015 ■ | | | 1,312 | |
| | 691 | | | 8.25%, 11/01/2019 ■ | | | 703 | |
| | | | | Peabody Energy Corp. | | | | |
| | 1,370 | | | 6.00%, 11/15/2018 ■ | | | 1,398 | |
| | | | | Rio Tinto Finance USA Ltd. | | | | |
| | 4,965 | | | 9.00%, 05/01/2019 | | | 6,776 | |
| | | | | Southern Copper Corp. | | | | |
| | 4,200 | | | 6.75%, 04/16/2040 | | | 4,203 | |
| | | | | Taseko Mines Ltd. | | | | |
| | 974 | | | 7.75%, 04/15/2019 | | | 879 | |
| | | | | Teck Resources Ltd. | | | | |
| | 7,515 | | | 10.75%, 05/15/2019 | | | 9,168 | |
| | | | | Vale Overseas Ltd. | | | | |
| | 6,460 | | | 6.25%, 01/23/2017 | | | 7,280 | |
| | | | | | | | 61,769 | |
| | | | | Miscellaneous Manufacturing - 0.9% | | | | |
| | | | | BE Aerospace, Inc. | | | | |
| | 929 | | | 6.88%, 10/01/2020 | | | 1,013 | |
| | | | | Meccanica Holdings USA, Inc. | | | | |
| | 10,489 | | | 6.25%, 07/15/2019 - 01/15/2040 ■ | | | 7,743 | |
| | | | | Reynolds Group Issuer, Inc. | | | | |
| | 830 | | | 7.88%, 08/15/2019 ■ | | | 867 | |
| | 1,525 | | | 9.00%, 04/15/2019 ■ | | | 1,449 | |
| | | | | Textron, Inc. | | | | |
| | 5,175 | | | 4.63%, 09/21/2016 | | | 5,304 | |
| | | | | Tyco Electronics Group S.A | | | | |
| | 5,292 | | | 4.88%, 01/15/2021 | | | 5,689 | |
| | 6,787 | | | 6.55%, 10/01/2017 | | | 7,840 | |
| | | | | Tyco International Ltd. | | | | |
| | 7,791 | | | 8.50%, 01/15/2019 | | | 10,035 | |
| | | | | | | | 39,940 | |
| | | | | Motor Vehicle and Parts Manufacturing - 0.2% | | | | |
| | | | | Chrysler Group | | | | |
| | 1,525 | | | 8.25%, 06/15/2021 ■ | | | 1,388 | |
| | | | | Daimler Finance NA LLC | | | | |
| | 5,070 | | | 2.63%, 09/15/2016 ■ | | | 5,040 | |
| | | | | Ford Motor Co. | | | | |
| | 1,380 | | | 7.50%, 08/01/2026 | | | 1,466 | |
| | | | | TRW Automotive, Inc. | | | | |
| | 1,445 | | | 3.50%, 12/01/2015 | | | 1,947 | |
| | | | | | | | 9,841 | |
| | | | | Paper Manufacturing - 0.1% | | | | |
| | | | | Mercer International, Inc. | | | | |
| | 1,510 | | | 9.50%, 12/01/2017 | | | 1,544 | |
| | | | | Sappi Papier Holding, Inc. | | | | |
| | 784 | | | 6.63%, 04/15/2021 ■ | | | 672 | |
| | | | | Westvaco Corp. | | | | |
| | 1,342 | | | 8.20%, 01/15/2030 | | | 1,526 | |
| | | | | | | | 3,742 | |
| | | | | Petroleum and Coal Products Manufacturing - 4.1% | | | | |
| | | | | AGL Capital Corp. | | | | |
| | 3,155 | | | 5.88%, 03/15/2041 | | | 3,732 | |
| | | | | Alpha Natural Resources, Inc. | | | | |
| | 1,161 | | | 6.00%, 06/01/2019 | | | 1,126 | |
| | | | | Anadarko Petroleum Corp. | | | | |
| | 3,565 | | | 6.38%, 09/15/2017 | | | 4,132 | |
| | | | | Bill Barrett Corp. | | | | |
| | 424 | | | 7.63%, 10/01/2019 | | | 443 | |
| | 635 | | | 9.88%, 07/15/2016 | | | 699 | |
| | | | | Chaparral Energy, Inc. | | | | |
| | 1,225 | | | 9.88%, 10/01/2020 | | | 1,323 | |
| | | | | Chesapeake Energy Corp. | | | | |
| | 968 | | | 6.88%, 08/15/2018 | | | 1,036 | |
| | | | | Concho Resources, Inc. | | | | |
| | 1,015 | | | 7.00%, 01/15/2021 | | | 1,090 | |
| | | | | Consumers Energy Co. | | | | |
| | 4,000 | | | 5.15%, 02/15/2017 | | | 4,539 | |
| | 4,620 | | | 6.70%, 09/15/2019 | | | 5,851 | |
| | | | | Ecopetrol S.A | | | | |
| | 950 | | | 7.63%, 07/23/2019 | | | 1,145 | |
| | | | | Ensco plc | | | | |
| | 5,590 | | | 4.70%, 03/15/2021 | | | 5,821 | |
| | | | | EV Energy Partners Finance | | | | |
| | 1,055 | | | 8.00%, 04/15/2019 | | | 1,073 | |
| | | | | Gazprom International S.A | | | | |
| | 4,400 | | | 4.95%, 05/23/2016 ■ | | | 4,406 | |
| | | | | Headwaters, Inc. | | | | |
| | 975 | | | 7.63%, 04/01/2019 | | | 863 | |
| | | | | Key Energy Services, Inc. | | | | |
| | 1,414 | | | 6.75%, 03/01/2021 | | | 1,414 | |
| | | | | Marathon Petroleum Corp. | | | | |
| | 6,255 | | | 5.13%, 03/01/2021 | | | 6,534 | |
| | 9,410 | | | 6.50%, 03/01/2041 | | | 10,664 | |
| | | | | Nabors Industries, Inc. | | | | |
| | 2,755 | | | 5.00%, 09/15/2020 | | | 2,809 | |
| | 7,183 | | | 9.25%, 01/15/2019 | | | 9,035 | |
| | | | | Newfield Exploration Co. | | | | |
| | 613 | | | 5.75%, 01/30/2022 | | | 662 | |
| | | | | Noble Energy, Inc. | | | | |
| | 7,533 | | | 4.15%, 12/15/2021 | | | 7,793 | |
| | 5,670 | | | 6.00%, 03/01/2041 | | | 6,560 | |
| | | | | Pemex Project Funding Master Trust | | | | |
| | 6,205 | | | 6.63%, 06/15/2035 | | | 7,035 | |
| | | | | Petrobras International Finance Co. | | | | |
| | 4,120 | | | 3.88%, 01/27/2016 | | | 4,245 | |
| | 11,675 | | | 5.75%, 01/20/2020 | | | 12,494 | |
| | | | | Plains Exploration & Production Co. | | | | |
| | 515 | | | 6.75%, 02/01/2022 | | | 539 | |
| | | | | Regency Energy Partners L.P. | | | | |
| | 1,440 | | | 9.38%, 06/01/2016 | | | 1,584 | |
| | | | | Rosetta Resources, Inc. | | | | |
| | 1,045 | | | 9.50%, 04/15/2018 | | | 1,129 | |
| | | | | Rowan Cos., Inc. | | | | |
| | 5,548 | | | 7.88%, 08/01/2019 | | | 6,504 | |
| | | | | Sandridge Energy, Inc. | | | | |
| | 865 | | | 8.75%, 01/15/2020 | | | 893 | |
| | | | | Schlumberger Ltd. | | | | |
| | 5,745 | | | 3.30%, 09/14/2021 ■ | | | 5,902 | |
| | | | | Sempra Energy | | | | |
| | 5,218 | | | 6.50%, 06/01/2016 | | | 6,087 | |
| | 9,495 | | | 9.80%, 02/15/2019 | | | 12,823 | |
| | | | | Talisman Energy, Inc. | | | | |
| | 2,910 | | | 7.75%, 06/01/2019 | | | 3,588 | |
The accompanying notes are an integral part of these financial statements.
Hartford Total Return Bond HLS Fund
Schedule of Investments – (continued)
December 31, 2011
(000’s Omitted)
| Shares or Principal Amount ╬ | | Market Value ╪ | |
| CORPORATE BONDS - 38.6% - (continued) | |
| | | | | Petroleum and Coal Products Manufacturing - 4.1% - (continued) | | | | |
| | | | | Transocean, Inc. | | | | |
| $ | 11,630 | | | 1.50%, 12/15/2037 ۞ | | $ | 11,427 | |
| | 4,375 | | | 6.38%, 12/15/2021 | | | 4,650 | |
| | | | | Valero Energy Corp. | | | | |
| | 9,686 | | | 9.38%, 03/15/2019 | | | 12,421 | |
| | | | | Venoco, Inc. | | | | |
| | 1,005 | | | 8.88%, 02/15/2019 | | | 905 | |
| | | | | Western Refining, Inc. | | | | |
| | 897 | | | 11.25%, 06/15/2017 ■ | | | 1,020 | |
| | | | | WPX Energy, Inc. | | | | |
| | 1,360 | | | 6.00%, 01/15/2022 ■ | | | 1,392 | |
| | | | | | | | 177,388 | |
| | | | | Pipeline Transportation - 0.5% | | | | |
| | | | | Chesapeake Midstream Partners | | | | |
| | 1,275 | | | 5.88%, 04/15/2021 ■ | | | 1,275 | |
| | | | | DCP Midstream LLC | | | | |
| | 2,495 | | | 4.75%, 09/30/2021 ■ | | | 2,579 | |
| | 3,318 | | | 5.35%, 03/15/2020 ■ | | | 3,551 | |
| | | | | Dynegy Holdings, Inc. | | | | |
| | 3,920 | | | 0.00%, 06/01/2019 Ω | | | 2,568 | |
| | | | | Eagle Rock Energy Partners L.P. | | | | |
| | 1,259 | | | 8.38%, 06/01/2019 ■ | | | 1,259 | |
| | | | | El Paso Corp. | | | | |
| | 1,602 | | | 7.80%, 08/01/2031 | | | 1,846 | |
| | | | | Energy Transfer Equity L.P. | | | | |
| | 1,077 | | | 7.50%, 10/15/2020 | | | 1,177 | |
| | | | | TransCanada Pipelines Ltd. | | | | |
| | 5,616 | | | 7.25%, 08/15/2038 | | | 7,762 | |
| | | | | | | | 22,017 | |
| | | | | Plastics and Rubber Products Manufacturing - 0.1% | | | | |
| | | | | Plastipak Holdings, Inc. | | | | |
| | 1,000 | | | 10.63%, 08/15/2019 ■ | | | 1,105 | |
| | | | | Sealed Air Corp. | | | | |
| | 227 | | | 8.13%, 09/15/2019 ■ | | | 249 | |
| | 366 | | | 8.38%, 09/15/2021 ■ | | | 404 | |
| | | | | Titan International, Inc. | | | | |
| | 772 | | | 7.88%, 10/01/2017 | | | 803 | |
| | | | | | | | 2,561 | |
| | | | | Primary Metal Manufacturing - 1.0% | | | | |
| | | | | Alcoa, Inc. | | | | |
| | 12,065 | | | 6.15%, 08/15/2020 | | | 12,535 | |
| | | | | Aleris International, Inc. | | | | |
| | 930 | | | 7.63%, 02/15/2018 | | | 907 | |
| | | | | ArcelorMittal | | | | |
| | 6,025 | | | 9.00%, 02/15/2015 | | | 6,661 | |
| | 17,925 | | | 9.85%, 06/01/2019 | | | 19,937 | |
| | | | | Novelis, Inc. | | | | |
| | 946 | | | 8.38%, 12/15/2017 | | | 1,005 | |
| | | | | | | | 41,045 | |
| | | | | Printing and Related Support Activities - 0.1% | | | | |
| | | | | Harland Clarke Holdings Corp. | | | | |
| | 1,885 | | | 9.50%, 05/15/2015 | | | 1,376 | |
| | | | | Sheridan (The) Group, Inc. | | | | |
| | 1,583 | | | 12.50%, 04/15/2014 | | | 1,425 | |
| | | | | | | | 2,801 | |
| | | | | Professional, Scientific and Technical Services - 0.5% | | | | |
| | | | | Affinion Group, Inc. | | | | |
| | 10,324 | | | 11.50%, 10/15/2015 | | | 9,008 | |
| | 3,639 | | | 11.63%, 11/15/2015 | | | 3,021 | |
| | | | | Global Geophysical Services, Inc. | | | | |
| | 978 | | | 10.50%, 05/01/2017 | | | 919 | |
| | | | | IBM Corp. | | | | |
| | 7,995 | | | 1.95%, 07/22/2016 | | | 8,228 | |
| | | | | | | | 21,176 | |
| | | | | Rail Transportation - 0.4% | | | | |
| | | | | Canadian Pacific Railway Co. | | | | |
| | 5,915 | | | 4.50%, 01/15/2022 | | | 5,999 | |
| | | | | Norfolk Southern Corp. | | | | |
| | 10,230 | | | 5.75%, 04/01/2018 | | | 12,060 | |
| | | | | RailAmerica, Inc. | | | | |
| | 1,100 | | | 9.25%, 07/01/2017 | | | 1,202 | |
| | | | | | | | 19,261 | |
| | | | | Real Estate and Rental and Leasing - 0.3% | | | | |
| | | | | Ashtead Capital, Inc. | | | | |
| | 828 | | | 9.00%, 08/15/2016 ■ | | | 863 | |
| | | | | Avis Budget Car Rental LLC | | | | |
| | 1,500 | | | 9.63%, 03/15/2018 | | | 1,552 | |
| | | | | ERAC USA Finance Co. | | | | |
| | 6,130 | | | 6.38%, 10/15/2017 ■ | | | 7,084 | |
| | | | | International Lease Finance Corp. | | | | |
| | 1,597 | | | 8.88%, 09/01/2017 | | | 1,653 | |
| | | | | United Rentals North America, Inc. | | | | |
| | 1,005 | | | 8.38%, 09/15/2020 | | | 980 | |
| | | | | | | | 12,132 | |
| | | | | Retail Trade - 1.1% | | | | |
| | | | | Ahold Lease USA, Inc. | | | | |
| | 9,513 | | | 8.62%, 01/02/2025 | | | 10,988 | |
| | | | | Amerigas Partners L.P. | | | | |
| | 1,554 | | | 6.25%, 08/20/2019 | | | 1,546 | |
| | | | | Automotores Gildemeister | | | | |
| | 4,400 | | | 8.25%, 05/24/2021 ■ | | | 4,488 | |
| | | | | Building Materials Corp. | | | | |
| | 1,186 | | | 7.50%, 03/15/2020 ■ | | | 1,281 | |
| | | | | Energy Transfer Partners | | | | |
| | 8,045 | | | 4.65%, 06/01/2021 | | | 7,881 | |
| | | | | Gap, Inc. | | | | |
| | 7,675 | | | 5.95%, 04/12/2021 | | | 7,320 | |
| | | | | Harley-Davidson Financial Services, Inc. | | | | |
| | 4,800 | | | 3.88%, 03/15/2016 ■ | | | 4,972 | |
| | | | | Hillman Group, Inc. | | | | |
| | 2,188 | | | 10.88%, 06/01/2018 | | | 2,166 | |
| | | | | Jaguar Land Rover plc | | | | |
| | 1,512 | | | 8.13%, 05/15/2021 ■ | | | 1,421 | |
| | | | | Liz Claiborne, Inc. | | | | |
| | 1,415 | | | 10.50%, 04/15/2019 ■ | | | 1,514 | |
| | | | | Masonite International Co. | | | | |
| | 965 | | | 8.25%, 04/15/2021 ■ | | | 946 | |
| | | | | Sears Holdings Corp. | | | | |
| | 921 | | | 6.63%, 10/15/2018 | | | 700 | |
| | | | | Supervalu, Inc. | | | | |
| | 1,360 | | | 8.00%, 05/01/2016 | | | 1,404 | |
| | | | | Toys R Us, Inc. | | | | |
| | 1,010 | | | 7.38%, 09/01/2016 ■ | | | 1,013 | |
| | | | | | | | 47,640 | |
The accompanying notes are an integral part of these financial statements.
| Shares or Principal Amount ╬ | | Market Value ╪ | |
| CORPORATE BONDS - 38.6% - (continued) | |
| | | | | Soap, Cleaning Compound, and Toilet Manufacturing - 0.0% | | | | |
| | | | | Yankee Candle Co. | | | | |
| $ | 1,687 | | | 10.25%, 02/15/2016 | | $ | 1,476 | |
| | | | | | | | | |
| | | | | Textile Product Mills - 0.0% | | | | |
| | | | | Interface, Inc. | | | | |
| | 1,029 | | | 7.63%, 12/01/2018 | | | 1,088 | |
| | | | | | | | | |
| | | | | Transit and Ground Passenger Transportation - 0.0% | | | | |
| | | | | Emergency Medical Services Corp. | | | | |
| | 1,281 | | | 8.13%, 06/01/2019 | | | 1,278 | |
| | | | | | | | | |
| | | | | Utilities - 2.4% | | | | |
| | | | | AES Corp. | | | | |
| | 890 | | | 9.75%, 04/15/2016 | | | 1,019 | |
| | | | | AES El Salvador Trust | | | | |
| | 2,300 | | | 6.75%, 02/01/2016 § | | | 2,231 | |
| | | | | Calpine Corp. | | | | |
| | 3,284 | | | 7.88%, 01/15/2023 ■ | | | 3,530 | |
| | | | | CenterPoint Energy, Inc. | | | | |
| | 7,475 | | | 6.85%, 06/01/2015 | | | 8,482 | |
| | | | | Comision Fed De Electric | | | | |
| | 3,800 | | | 4.88%, 05/26/2021 ■ | | | 3,914 | |
| | | | | Commonwealth Edison Co. | | | | |
| | 5,836 | | | 5.80%, 03/15/2018 | | | 6,890 | |
| | | | | Dominion Resources, Inc. | | | | |
| | 3,025 | | | 1.95%, 08/15/2016 | | | 3,040 | |
| | 2,800 | | | 4.90%, 08/01/2041 | | | 3,023 | |
| | | | | E.CL S.A | | | | |
| | 2,100 | | | 5.63%, 01/15/2021 ■ | | | 2,219 | |
| | | | | Edison Mission Energy | | | | |
| | 3,430 | | | 7.00%, 05/15/2017 | | | 2,230 | |
| | | | | Empresas Public Medellin | | | | |
| | 3,910 | | | 7.63%, 07/29/2019 § | | | 4,536 | |
| | | | | Energy Future Intermediate Holding Co. LLC | | | | |
| | 1,527 | | | 10.00%, 12/01/2020 | | | 1,611 | |
| | | | | LG & E & KU Energy LLC | | | | |
| | 7,190 | | | 2.13%, 11/15/2015 | | | 7,081 | |
| | | | | MidAmerican Energy Holdings Co. | | | | |
| | 9,665 | | | 8.48%, 09/15/2028 | | | 13,981 | |
| | | | | Northeast Utilities | | | | |
| | 4,375 | | | 5.65%, 06/01/2013 | | | 4,627 | |
| | | | | NRG Energy, Inc. | | | | |
| | 2,610 | | | 8.50%, 06/15/2019 | | | 2,649 | |
| | | | | Pacific Gas & Electric Energy Recovery Funding LLC | | | | |
| | 6,208 | | | 8.25%, 10/15/2018 | | | 8,183 | |
| | | | | Progress Energy, Inc. | | | | |
| | 8,405 | | | 4.40%, 01/15/2021 | | | 9,265 | |
| | | | | PSEG Power | | | | |
| | 4,534 | | | 5.00%, 04/01/2014 | | | 4,855 | |
| | | | | Taqa Abu Dhabi National Energy | | | | |
| | 4,000 | | | 5.88%, 12/13/2021 ■ | | | 4,160 | |
| | | | | Virginia Electric & Power Co. | | | | |
| | 6,327 | | | 5.10%, 11/30/2012 | | | 6,572 | |
| | | | | | | | 104,098 | |
| | | | | Water Transportation - 0.1% | | | | |
| | | | | Seven Seas Cruises | | | | |
| | 970 | | | 9.13%, 05/15/2019 ■ | | | 991 | |
| | | | | Ship Finance International Ltd. | | | | |
| | 1,325 | | | 8.50%, 12/15/2013 | | | 1,246 | |
| | | | | | | | 2,237 | |
| | | | | Wholesale Trade - 0.1% | | | | |
| | | | | International Paper Co. | | | | |
| | 3,470 | | | 4.75%, 02/15/2022 | | | 3,688 | |
| | | | | Spectrum Brands, Inc. | | | | |
| | 685 | | | 12.00%, 08/28/2019 Þ | | | 745 | |
| | | | | U.S. Foodservice, Inc. | | | | |
| | 997 | | | 8.50%, 06/30/2019 ■ | | | 965 | |
| | | | | | | | 5,398 | |
| | | | | Total corporate bonds | | | | |
| | | | | (cost $1,613,645) | | $ | 1,678,584 | |
| | | | | | | | | |
| FOREIGN GOVERNMENT OBLIGATIONS - 0.9% | | | | |
| | | | | Brazil - 0.1% | | | | |
| | | | | Banco Nacional De Desenvolvimento | | | | |
| $ | 4,800 | | | 5.50%, 07/12/2020 ■ | | $ | 5,190 | |
| | | | | | | | | |
| | | | | Colombia - 0.1% | | | | |
| | | | | Colombia (Republic of) | | | | |
| | 2,783 | | | 4.38%, 07/12/2021 | | | 2,992 | |
| | | | | | | | | |
| | | | | El Salvador - 0.0% | | | | |
| | | | | El Salvador (Republic of) | | | | |
| | 2,465 | | | 7.65%, 06/15/2035 § | | | 2,514 | |
| | | | | | | | | |
| | | | | Norway - 0.5% | | | | |
| | | | | Norway (Kingdom of) | | | | |
| | NOK 113,355 | | | 3.75%, 05/25/2021 | | | 21,015 | |
| | | | | | | | | |
| | | | | Qatar - 0.2% | | | | |
| | | | | Qatar (State of) | | | | |
| | 3,800 | | | 3.13%, 01/20/2017 ■ | | | 3,833 | |
| | 3,600 | | | 4.50%, 01/20/2022 ■ | | | 3,708 | |
| | | | | | | | 7,541 | |
| | | | | Total foreign government obligations | | | | |
| | | | | (cost $40,019) | | $ | 39,252 | |
| | | | | | | | | |
| MUNICIPAL BONDS - 1.4% | | | | |
| | | | | Higher Education (Univ., Dorms, etc.) - 0.3% | | | | |
| | | | | Curators University, MO, System Fac Rev | | | | |
| $ | 2,270 | | | 5.79%, 11/01/2041 | | $ | 2,923 | |
| | | | | New York State Dormitory Auth Rev Non State | | | | |
| | 9,030 | | | 5.00%, 10/01/2041 | | | 10,083 | |
| | | | | | | | 13,006 | |
| | | | | Miscellaneous - 0.3% | | | | |
| | | | | Colorado Bridge Enterprise Rev Build America Bond | | | | |
| | 4,000 | | | 6.08%, 12/01/2040 | | | 4,985 | |
| | | | | Oregon School Boards Association, Taxable Pension | | | | |
| | 7,325 | | | 4.76%, 06/30/2028 | | | 7,937 | |
| | | | | | | | 12,922 | |
| | | | | Tax Allocation - 0.4% | | | | |
| | | | | California Urban IDA Taxable | | | | |
| | 275 | | | 6.10%, 05/01/2024 | | | 257 | |
The accompanying notes are an integral part of these financial statements.
Hartford Total Return Bond HLS Fund
Schedule of Investments – (continued)
December 31, 2011
(000’s Omitted)
| Shares or Principal Amount ╬ | | Market Value ╪ | |
MUNICIPAL BONDS - 1.4% - (continued) | |
| | | | | Tax Allocation - 0.4% - (continued) | | | | |
| | | | | Massachusetts School Building Auth | | | | |
| $ | 8,320 | | | 5.00%, 10/15/2041 | | $ | 9,022 | |
| | | | | Regional Transportation Dist | | | | |
| | 5,225 | | | 5.84%, 11/01/2050 | | | 6,671 | |
| | | | | | | | 15,950 | |
| | | | | Utilities - Electric - 0.2% | | | | |
| | | | | Georgia Municipal Elec Auth | | | | |
| | 10,565 | | | 6.64%, 04/01/2057 | | | 10,982 | |
| | | | | | | | | |
| | | | | Utilities - Water and Sewer - 0.2% | | | | |
| | | | | San Francisco City & County Public Utilities Commission | | | | |
| | 8,520 | | | 6.00%, 11/01/2040 | | | 9,936 | |
| | | | | | | | | |
| | | | | Total municipal bonds | | | | |
| | | | | (cost $56,283) | | $ | 62,796 | |
| | | | | | | | | |
| SENIOR FLOATING RATE INTERESTS ♦ - 0.7% | | | | |
| | | | | Air Transportation - 0.0% | | | | |
| | | | | Macquarie Aircraft Leasing Finance S.A., Second Lien Term Loan | | | | |
| $ | 1,758 | | | 4.3%, 11/29/2013 ±⌂ | | $ | 1,652 | |
| | | | | | | | | |
| | | | | Finance and Insurance - 0.3% | | | | |
| | | | | Asurion Corp., Second Lien Term Loan | | | | |
| | 1,176 | | | 9.00%, 05/24/2019 ± | | | 1,156 | |
| | | | | BNY Convergex Group LLC, 2nd Lien Eze Borrower Term Loan Committment | | | | |
| | 217 | | | 8.75%, 12/17/2017 ± | | | 207 | |
| | | | | BNY Convergex Group LLC, 2nd Lien Top Borrower Term Loan Committment | | | | |
| | 518 | | | 8.75%, 12/17/2017 ± | | | 492 | |
| | | | | Chrysler Group LLC | | | | |
| | 7,922 | | | 6.00%, 05/24/2017 ± | | | 7,480 | |
| | | | | Nuveen Investments, Inc., Second Lien Term Loan | | | | |
| | 2,645 | | | 12.50%, 07/31/2015 ± | | | 2,730 | |
| | | | | | | | 12,065 | |
| | | | | Information - 0.1% | | | | |
| | | | | WideOpenWest Finance LLC, Second Lien Term Loan | | | | |
| | 5,623 | | | 6.54%, 06/29/2015 ±Þ | | | 4,997 | |
| | | | | | | | | |
| | | | | Motor Vehicle and Parts Manufacturing - 0.2% | | | | |
| | | | | General Motors Co. | | | | |
| | 8,480 | | | 0.38%, 10/27/2015 ◊☼ | | | 7,373 | |
| | | | | | | | | |
| | | | | Retail Trade - 0.1% | | | | |
| | | | | Easton-Bell Sports, Inc. | | | | |
| | 4,906 | | | 11.50%, 12/31/2015 ±⌂Þ | | | 4,759 | |
| | | | | | | | | |
| | | | | Total senior floating rate interests | | | | |
| | | | | (cost $33,074) | | $ | 30,846 | |
| | | | | | | | | |
| U.S. GOVERNMENT AGENCIES - 38.8% | | | | |
| | | | | Federal Home Loan Mortgage Corporation - 6.2% | | | | |
| $ | 47,415 | | | 3.50%, 01/15/2041 ☼ | | $ | 48,682 | |
| | 25,217 | | | 4.00%, 08/01/2025 | | | 26,701 | |
| | 33,701 | | | 4.99%, 08/25/2018 ► | | | 3,543 | |
| | 76,861 | | | 5.00%, 10/25/2020 ► | | | 1,703 |
| | 23,794 | | | 5.50%, 08/25/2020 ► | | | 2,052 |
| | 91,751 | | | 5.50%, 10/01/2018 - 08/01/2038 | | | 99,796 |
| | 36,536 | | | 5.56%, 07/25/2021 ► | | | 4,124 |
| | 65,291 | | | 6.00%, 04/01/2017 - 05/01/2038 | | | 72,073 |
| | 7,884 | | | 6.50%, 07/01/2031 - 08/01/2038 | | | 8,839 |
| | 6 | | | 7.50%, 09/01/2029 - 11/01/2031 | | | 7 |
| | | | | | | | 267,520 |
| | | | | Federal National Mortgage Association - 17.6% | | | | |
| | 76,351 | | | 3.50%, 11/01/2026 - 03/01/2041 | | | 79,163 |
| | 80,893 | | | 4.00%, 06/01/2025 - 10/01/2041 | | | 85,849 |
| | 185,247 | | | 4.50%, 09/01/2024 - 08/01/2040 ☼ | | | 197,319 |
| | 204,979 | | | 5.00%, 02/01/2018 - 04/25/2038 | | | 221,719 |
| | 143,237 | | | 5.50%, 12/01/2013 - 05/01/2039 | | | 156,554 |
| | 21,499 | | | 6.00%, 11/01/2012 - 02/01/2037 | | | 23,908 |
| | 55 | | | 6.50%, 11/01/2014 - 07/01/2032 | | | 60 |
| | 1,791 | | | 7.00%, 02/01/2016 - 10/01/2037 | | | 2,046 |
| | 560 | | | 7.50%, 11/01/2015 - 05/01/2032 | | | 646 |
| | 2 | | | 8.00%, 04/01/2032 | | | 2 |
| | | | | | | | 767,266 |
| | | | | Government National Mortgage Association - 15.0% | | | | |
| | 77,727 | | | 4.00%, 08/20/2040 - 12/20/2040 | | | 83,316 |
| | 384,742 | | | 4.50%, 05/15/2040 - 10/20/2040 | | | 420,751 |
| | 113,096 | | | 5.00%, 06/15/2039 - 09/20/2040 | | | 125,397 |
| | 13,072 | | | 5.50%, 03/15/2033 - 10/20/2034 | | | 14,798 |
| | 8,579 | | | 6.50%, 06/15/2028 - 09/15/2032 | | | 9,946 |
| | 23 | | | 7.00%, 06/20/2030 - 08/15/2031 | | | 27 |
| | 4 | | | 8.50%, 11/15/2024 | | | 5 |
| | | | | | | | 654,240 |
| | | | | Total U.S. government agencies | | | | |
| | | | | (cost $1,624,767) | | $ | 1,689,026 |
| | | | | | | | | |
| U.S. GOVERNMENT SECURITIES - 13.6% | | | | |
| U.S. Treasury Securities - 13.6% | | | | |
| | | | | U.S. Treasury Bonds - 6.1% | | | | |
| $ | 1,309 | | | 3.75%, 08/15/2041 ‡ | | $ | 1,540 |
| | 36,792 | | | 4.38%, 05/15/2041 ‡ | | | 47,939 |
| | 114,675 | | | 4.75%, 02/15/2041 ‡ | | | 158,037 |
| | 41,369 | | | 5.38%, 02/15/2031 ╦ | | | 58,964 |
| | | | | | | | 266,480 |
| | | | | U.S. Treasury Notes - 7.5% | | | | |
| | 186,000 | | | 0.13%, 04/15/2016 ◄ | | | 198,904 |
| | 1,721 | | | 0.38%, 10/31/2012 | | | 1,724 |
| | 4,750 | | | 0.88%, 11/30/2016 Ø | | | 4,764 |
| | 119,858 | | | 1.00%, 10/31/2016 ‡Θ | | | 121,019 |
| | | | | | | | 326,411 |
| | | | | | | | 592,891 |
| | | | | Total U.S. government securities | | | | |
| | | | | (cost $557,269) | | $ | 592,891 |
| | | | | | | | | |
| | Contracts | | | | | | Market Value ╪ |
| CALL OPTIONS PURCHASED - 0.4% | | | | |
| Foreign Exchange Contracts - 0.4% | | | | |
| | | | | CHF Call/USD Put | | | | |
| | 114,700 | | | Expiration: 08/10/2012 | | $ | 14,964 |
The accompanying notes are an integral part of these financial statements.
| | Contracts | | | | | | Market Value ╪ | |
| CALL OPTIONS PURCHASED - 0.4% - (continued) | | | | |
| Foreign Exchange Contracts - 0.4% - (continued) | | | | |
| | | | | USD Call/CHF Put | | | | |
| | 137,700 | | | Expiration: 02/15/2012 | | $ | 527 | |
| | | | | USD Call/JPY Put | | | | |
| | 9,900 | | | Expiration: 10/19/2012 Ð | | | 588 | |
| | | | | | | | 16,079 | |
| | | | | Total call options purchased | | | | |
| | | | | (cost $5,008) | | $ | 16,079 | |
| | | | | | | | | |
| PUT OPTIONS PURCHASED - 0.1% | | | | |
| Foreign Exchange Contracts - 0.1% | | | | |
| | | | | EUR Put/USD Call | | | | |
| | 82,185 | | | Expiration: 04/19/2012 | | $ | 5,611 | |
| | | | | | | | | |
| Interest Rate Contracts - 0.0% | | | | |
| | | | | 90 Day EURO | | | | |
| | 1 | | | Expiration: 03/20/2012 | | | | |
| | | | | Exercise Rate: 0.99% | | | 215 | |
| | | | | | | | | |
| | | | | Total put options purchased | | | | |
| | | | | (cost $3,909) | | $ | 5,826 | |
| | | | | | | | | |
| Shares or Principal Amount ╬ | | | Market Value ╪ | |
| PREFERRED STOCKS - 0.1% | | | | |
| | | | | Automobiles & Components - 0.0% | | | | |
| | 58 | | | General Motors Co., 4.75% ۞ | | $ | 2,002 | |
| | | | | | | | | |
| | | | | Banks - 0.1% | | | | |
| | 330 | | | Federal Home Loan Mortgage Corp. | | | 438 | |
| | 2 | | | US Bancorp | | | 1,639 | |
| | | | | | | | 2,077 | |
| | | | | Total preferred stocks | | | | |
| | | | | (cost $12,513) | | $ | 4,079 | |
| | | | | | | | | |
| | | | | Total long-term investments
| | | | |
| | | | | (cost $4,245,538) | | $ | 4,405,763 | |
| | | | | | | | | |
| SHORT-TERM INVESTMENTS - 3.0% | | | |
| Commercial Paper - 2.0% | | | | |
| | | | | Beverage and Tobacco Product Manufacturing - 0.5% | | | | |
| | | | | Coca Cola Co. | | | | |
| $ | 7,000 | | | 0.08%, 2/24/2012 ○ | | $ | 6,999 | |
| | | | | Pepsico, Inc. | | | | |
| | 14,000 | | | 0.05%, 2/10/2012 ○ | | | 13,999 | |
| | | | | | | | 20,998 | |
| | | | | Chemical Manufacturing - 0.3% | | | | |
| | | | | Praxair, Inc. | | | | |
| | 14,000 | | | 0.03%, 1/5/2012 ○ | | | 14,000 | |
| | | | | | | | | |
| | | | | Foreign Governments - 0.2% | | | | |
| | | | | Ontario (Province of) | | | | |
| | 10,000 | | | 0.03%, 1/23/2012 ○ | | | 10,000 | |
| | | | | | | | | |
| | | | | Health Care and Social Assistance - 0.7% | | | | |
| | | | | Pfizer, Inc. | | | | |
| | 14,000 | | | 0.04%, 1/12/2012 ■○ | | | 14,000 | |
| | | | | Roche Holdings, Inc. | | | | |
| | 14,000 | | | 0.06%, 2/13/2012 ○ | | | 13,994 | |
| | | | | | | | 27,994 | |
| | | | | Soap, Cleaning Compound, and Toilet Manufacturing - 0.3% | | | | |
| | | | | Procter & Gamble Co. | | | | |
| 14,000 | | | 0.06%, 1/9/2012 ■○ | | | 13,999 | |
| | | | | | | | | |
| | | | | | | | 86,991 | |
| | | | | Investment Pools and Funds - 0.0% | | | | |
| | 1,390 | | | JP Morgan U.S. Government Money Market Fund | | | 1,390 | |
| | | | | | | | | |
| Repurchase Agreements - 0.2% | | | | |
| | | | | Deutsche Bank Securities TriParty Joint
Repurchase Agreement (maturing on
01/03/2012 in the amount of $682,
collateralized by U.S. Treasury Note
1.38%, 2018, value of $695) | | | | |
| | 682 | | | 0.01%, 12/30/2011 | | | 682 | |
| | | | | RBC Capital Markets Corp. TriParty Joint
Repurchase Agreement (maturing on
01/03/2012 in the amount of $5,289,
collateralized by U.S. Treasury Note
0.38% - 1.50%, 2013 - 2016, value of
$5,395) | | | | |
| | 5,289 | | | 0.01%, 12/30/2011 | | | 5,289 | |
| | | | | RBS Greenwich Capital Markets TriParty
Joint Repurchase Agreement (maturing
on 01/03/2012 in the amount of $1,790,
collateralized by U.S. Treasury Note
1.88% - 2.00%, 2015 - 2016, value of
$1,826) | | | | |
| | 1,790 | | | 0.02%, 12/30/2011 | | | 1,790 | |
| | | | | UBS Securities, Inc. TriParty Joint
Repurchase Agreement (maturing on
01/03/2012 in the amount of $620,
collateralized by U.S. Treasury Note
3.63%, 2021, value of $633) | | | | |
| | 620 | | | 0.01%, 12/30/2011 | | | 620 | |
| | | | | | | | 8,381 | |
| U.S. Treasury Bills - 0.8% | | | | |
| | 33,427 | | | 0.01%, 2/2/2012 □○ | | | 33,427 | |
| | | | | | | | | |
| | | | | Total short-term investments | | | | |
| | | | | (cost $130,194) | | $ | 130,189 | |
| | | | | | | | | |
| | | Total investments | | | | | | | | |
| | | (cost $4,375,732) ▲ | | | 104.2 | % | | $ | 4,535,952 | |
| | | Other assets and liabilities | | | (4.2 | )% | | | (184,658 | ) |
| | | Total net assets | | | 100.0 | % | | $ | 4,351,294 | |
The accompanying notes are an integral part of these financial statements.
Hartford Total Return Bond HLS Fund
Schedule of Investments
December 31, 2011
(000’s Omitted)
| Note: | Percentage of investments as shown is the ratio of the total market value to total net assets. Market value of long-term investments in foreign securities represents 10.3% of total net assets at December 31, 2011. |
| ▲ | At December 31, 2011, the cost of securities for federal income tax purposes was $4,396,678 and the aggregate gross unrealized appreciation and depreciation based on that cost were: |
| | Unrealized Appreciation | | $ | 216,514 | |
| | Unrealized Depreciation | | | (77,240 | ) |
| | Net Unrealized Appreciation | | $ | 139,274 | |
| † | These securities are valued in good faith at fair value as determined under policies and procedures established by and under the supervision of the Company's Board of Directors. At December 31, 2011, the aggregate value of these securities was $5,061, which represents 0.1% of total net assets. |
| | |
| ● | Non-income producing. For long-term debt securities, items identified are in default as to payment of interest and/or principal. |
| | |
| Ψ | The company is in bankruptcy. The investment held by the fund is current with respect to interest payments. |
| | |
| Ω | Debt security in default due to bankruptcy. |
| | |
| Δ | Variable rate securities; the rate reported is the coupon rate in effect at December 31, 2011. |
| | |
| ○ | The interest rate disclosed for these securities represents the effective yield on the date of the acquisition. |
| | |
| ► | Securities disclosed are interest-only strips. The interest rates represent effective yields based upon estimated future cash flows at December 31, 2011. |
| | |
| ◄ | U.S. Treasury inflation-protected securities (TIPS) are securities in which the principal amount is adjusted for inflation and the semiannual interest payments equal a fixed percentage of the inflation-adjusted principal amount. |
| | |
| ± | The interest rate disclosed for these securities represents the average coupon as of December 31, 2011. |
| | |
| ◊ | The interest rate disclosed for these securities represents an estimated average coupon as of December 31, 2011. |
| | |
| ♦ | Senior floating rate interests generally pay interest rates which are periodically adjusted by reference to a base short-term, floating lending rate plus a premium. These base lending rates are generally (i) the lending rate offered by one or more major European banks, such as the London Inter-Bank Offered Rate (LIBOR), (ii) the prime rate offered by one or more major United States Banks, or (iii) the bank's certificate of deposit rate. Senior floating rate interests often require prepayments from excess cash flows or permit the borrower to repay at its election. The rate at which the borrower repays cannot be predicted with accuracy. As a result, the actual remaining maturity may be substantially less than the stated maturities shown. |
| | |
| ■ | Securities issued within terms of a private placement memorandum, exempt from registration under Rule 144A under the Securities Act of 1933, as amended, and may be sold only to qualified institutional buyers. Unless otherwise indicated, these holdings are determined to be liquid. At December 31, 2011, the aggregate value of these securities was $553,285, which represents 12.7% of total net assets. |
| | |
| § | These securities were sold to the Fund under Regulation S, rules governing offers and sales made outside the United States without registration under the Securities Act of 1933. The Fund may only be able to resell these securities in the United States if an exemption from registration under the federal and state securities laws is available, or the Fund may only be able to sell these securities outside of the United States (such as on a foreign exchange) to a non-U.S. person. Unless otherwise indicated, these holdings are determined to be liquid. At December 31, 2011, the aggregate value of these securities was $29,288, which represents 0.7% of total net assets. |
| | |
| ∞ | Securities exempt from registration under Regulation D of the Securities Act of 1933. The Fund may only be able to resell these securities if they are subsequently registered or if an exemption from registration under the federal and state securities laws is available. Unless otherwise indicated, these holdings are determined to be liquid. At December 31, 2011, the aggregate value and percentage of net assets of these securities rounds to zero. |
The accompanying notes are an integral part of these financial statements.
⌂ | The following securities are considered illiquid. Illiquid securities are often purchased in private placement transactions, are often not registered under the Securities Act of 1933 and may have contractual restrictions on resale. A security may also be considered illiquid if the security lacks a readily available market or if its valuation has not changed for a certain period of time. |
| | Period Acquired | | | Shares/ Par | | | | Security | | | | Cost Basis | |
| | 04/2003 | | $ | 75 | | | | Americo Life, Inc., 7.88%, 05/01/2013 - 144A | | | $ | 74 | |
| | 10/2004 - 12/2004 | | $ | 70,075 | | | | Bear Stearns Commercial Mortgage Securities, Inc., 15.00%, 11/11/2041 - 07/11/2042 | | | | 389 | |
| | 08/2007 | | $ | 23,770 | | | | Countrywide Home Loans, Inc., 6.00%, 10/25/2037 | | | | 23,339 | |
| | 11/2010 - 11/2011 | | $ | 4,906 | | | | Easton-Bell Sports, Inc., 11.50%, 12/31/2015 | | | | 4,860 | |
| | 03/2007 | | $ | 1,675 | | | | JP Morgan Automotive Receivable Trust, 12.85%, 03/15/2012 | | | | 1,675 | |
| | 01/2011 | | $ | 1,758 | | | | Macquarie Aircraft Leasing Finance S.A., Second Lien Term Loan, 4.30%, 11/29/2013 | | | | 1,615 | |
| | 11/2004 | | $ | 31,293 | | | | Merrill Lynch Mortgage Trust, 3.96%, 10/12/2041 - 144A | | | | 63 | |
| | 10/2005 - 08/2006 | | $ | 15,286 | | | | Morgan Stanley Dean Witter Capital I, 0.00%, 08/25/2032 - Reg D | | | | 320 | |
| | 04/2007 | | $ | 211 | | | | Nationstar Home Equity Loan Trust, 0.00%, 03/25/2037 - 144A | | | | 211 | |
| | 06/2009 | | $ | 2,089 | | | | Residential Funding Mortgage Securities, Inc., 6.00%, 07/25/2037 | | | | 1,539 | |
| | 03/2008 | | $ | 8,925 | | | | Wells Fargo Alternative Loan Trust, 6.25%, 11/25/2037 | | | | 7,248 | |
| | | | | | | | | | | | | | |
| | At December 31, 2011, the aggregate value of these securities was $38,723, which represents 0.9% of total net assets | | | |
| ۞ | Convertible security. |
| | |
| ♠ | Perpetual maturity security. Maturity date shown is the first call date. |
| | |
| ╬ | All principal amounts are in U.S. dollars unless otherwise indicated. |
| | |
| | NOK ─ Norwegian Krone |
| | |
| ☼ | This security, or a portion of this security, was purchased on a when-issued, delayed delivery or delayed draw basis. The cost of these securities was $205,905 at December 31, 2011. |
| | |
| ‡ | This security, or a portion of this security, has been segregated to cover funding requirements on investment transactions settling in the future. |
| | |
| ╦ | This security, or a portion of this security, has been pledged as collateral in connection with swap contracts. In addition, securities valued at $44,749, held on behalf of the Fund at the custody bank, were received from broker as collateral in connection with swap contracts. |
| | |
| □ | This security, or a portion of this security, is pledged as initial margin deposit for open futures contracts held at December 31, 2011 as listed in the table below: |
| | Description | | Number of Contracts* | | | Position | | | Expiration Date | | | Market Value ╪ | | | Notional Amount | | | Unrealized Appreciation/ (Depreciation) | |
| | 2 Year U.S. Treasury Note | | | 1,660 | | | | Long | | | | 03/30/2012 | | | $ | 366,108 | | | $ | 365,884 | | | $ | 224 | |
| | 5 Year U.S. Treasury Note | | | 1,435 | | | | Short | | | | 03/30/2012 | | | | 176,875 | | | | 176,003 | | | | (872 | ) |
| | 10 Year U.S. Treasury Note | | | 356 | | | | Long | | | | 03/21/2012 | | | | 46,680 | | | | 46,419 | | | | 261 | |
| | 30 Year U.S. Treasury Bond | | | 377 | | | | Short | | | | 03/21/2012 | | | | 54,594 | | | | 54,280 | | | | (314 | ) |
| | | | | | | | | | | | | | | | | | | | | | | | $ | (701 | ) |
* The number of contracts does not omit 000's.
| Θ | At December 31, 2011, this security, or a portion of this security, is designated to cover written call options in the table below: |
| | Description (Counterparty) | | Option Type | | | Exercise Price/ Rate | | | Expiration Date | | | Number of Contracts* | | | Market Value ╪ | | | Premiums Received | | | Unrealized Appreciation (Depreciation) | |
| | EUR Call/USD Put (Morgan Stanley) | | | Foreign Exchange | | | | 1.50 USD | | | | 04/19/2012 | | | | 82,184,689 | | | $ | 79 | | | $ | 1,577 | | | $ | 1,498 | |
| | USD Call/CHF Put (Credit Suisse) | | | Foreign Exchange | | | | 0.82 USD | | | | 08/10/2012 | | | | 114,700,000 | | | | 14,964 | | | | 10,339 | | | | (4,625 | ) |
| | | | | | | | | | | | | | | | | | | | $ | 15,043 | | | $ | 11,916 | | | $ | (3,127 | ) |
* The number of contracts does not omit 000's.
The accompanying notes are an integral part of these financial statements.
Hartford Total Return Bond HLS Fund
Schedule of Investments– (continued)
December 31, 2011
(000’s Omitted)
Ø | This security, or a portion of this security, collateralized the written put options in the table below: |
| | Description (Counterparty) † | | Option Type | | | Exercise Price/ Rate | | | Expiration Date | | | Number of Contracts* | | | Market Value ╪ | | | Premiums Received | | | Unrealized Appreciation (Depreciation) | |
| | 90 Day EURO | | | Interest Rate | | | | 99.00 | % | | | 03/20/2012 | | | | 907 | | | $ | 74 | | | $ | 214 | | | $ | 140 | |
| | EUR Put/USD Call (Morgan Stanley) | | | Foreign Exchange | | | | 1.17 USD | | | | 04/19/2012 | | | | 82,184,689 | | | | 615 | | | | 797 | | | | 182 | |
| | | | | | | | | | | | | | | | | | | | $ | 689 | | | $ | 1,011 | | | $ | 322 | |
† Counterparty shown for instruments with direct counterparty exposure.
* The number of contracts does not omit 000's.
| Ð | This security has limitations. If the U.S. Dollar to Japanese Yen exchange rate is less than or equal to 90.00 on expiration date, the counterparty will be required to pay the Fund the equivalent of par on the number of contracts traded. |
| | |
| Þ | This security may pay interest in additional principal instead of cash. |
IDA — Industrial Development Authority Bond
| Foreign Currency Contracts Outstanding at December 31, 2011 | |
| Description | | Counterparty | | | Buy / Sell | | | Market Value ╪ | | | Contract Amount | | | Delivery Date | | | Unrealized Appreciation/ (Depreciation) | |
| Australian Dollar | | Morgan Stanley | | | Buy | | $ | 44,054 | | $ | 43,861 | | | 01/05/2012 | | $ | 193 | |
| Australian Dollar | | Morgan Stanley | | | Sell | | | 22,487 | | | 22,082 | | | 01/05/2012 | | | (405 | ) |
| Australian Dollar | | Morgan Stanley | | | Sell | | | 43,972 | | | 43,789 | | | 01/19/2012 | | | (183 | ) |
| Australian Dollar | | Wells Fargo | | | Sell | | | 21,567 | | | 21,137 | | | 01/05/2012 | | | (430 | ) |
| Norwegian Krone | | Wells Fargo | | | Sell | | | 21,731 | | | 22,542 | | | 01/13/2012 | | | 811 | |
| | | | | | | | | | | | | | | | | $ | (14 | ) |
The accompanying notes are an integral part of these financial statements.
| Credit Default Swap Contracts Outstanding at December 31, 2011 | |
| Reference Entity | | Counterparty | | Notional Amount (a) | | Buy/Sell Protection | | (Pay)/Receive Fixed Rate / Implied Credit Spread (b) | | Expiration Date | | Upfront Premiums Paid/ (Received) | | | Market Value ╪ | | | Unrealized Appreciation/ (Depreciation) | |
| Banco Santander S.A | | Barclay Investment, Inc. | | $ | 10,100 | | | Buy | | | (1.00)% / 3.41% | | 03/20/15 | | $ | 511 | | $ | 718 | | $ | 207 | |
| Bank of America Corp. | | Barclay Investment, Inc. | | | 20,395 | | | Buy | | | (1.00)% / 4.09% | | 09/20/16 | | | 2,235 | | | 2,505 | | | 270 | |
| Bank of America Corp. | | Credit Suisse | | | 7,735 | | | Buy | | | (1.00)% / 4.09% | | 09/20/16 | | | 795 | | | 950 | | | 155 | |
| Capital One Financial Corp. | | Barclay Investment, Inc. | | | 11,500 | | | Buy | | | (1.00)% / 1.40% | | 12/20/16 | | | 475 | | | 218 | | | (257 | ) |
| CDX Emerging Markets Index | | Barclay Investment, Inc. | | | 42,000 | | | Buy | | | (5.00)% | | 12/20/16 | | | (3,738 | ) | | (3,603 | ) | | 135 | |
| CDX North American High Yield Index | | Barclay Investment, Inc. | | | 41,454 | | | Buy | | | (5.00)% | | 12/20/16 | | | 3,224 | | | 2,908 | | | (316 | ) |
| CDX North American Investment Grade Index | | Morgan Stanley | | | 90,385 | | | Buy | | | (1.00)% | | 12/20/16 | | | 1,488 | | | 848 | | | (640 | ) |
| Citigroup, Inc. | | Credit Suisse | | | 5,515 | | | Buy | | | (1.00)% / 2.78% | | 09/20/16 | | | 327 | | | 417 | | | 90 | |
| Enterprise Products Operating LLC | | Credit Suisse | | | 11,000 | | | Sell | | | 1.00% / 1.74% | | 12/20/16 | | | (363 | ) | | (377 | ) | | (14 | ) |
| General Electric Capital Corp. | | Barclay Investment, Inc. | | | 23,000 | | | Sell | | | 1.00% / 2.46% | | 12/20/16 | | | (2,368 | ) | | (1,515 | ) | | 853 | |
| iTraxx Australia | | UBS Securities LLC | | | 19,070 | | | Buy | | | (1.00)% | | 06/20/16 | | | 203 | | | 584 | | | 381 | |
| iTraxx Europe | | Morgan Stanley | | | 42,710 | | | Buy | | | (1.00)% | | 12/20/16 | | | 1,718 | | | 1,416 | | | (302 | ) |
| iTraxx Europe Tranche | | Morgan Stanley | | | 85,420 | | | Buy | | | (1.00)% | | 06/20/16 | | | 792 | | | 2,577 | | | 1,785 | |
| JP Morgan Chase & Co. | | Barclay Investment, Inc. | | | 23,145 | | | Buy | | | (1.00)% / 1.36% | | 09/20/16 | | | 457 | | | 377 | | | (80 | ) |
| JP Morgan Chase & Co. | | Credit Suisse | | | 13,196 | | | Buy | | | (1.00)% / 1.13% | | 03/20/15 | | | 37 | | | 52 | | | 15 | |
| Morgan Stanley | | JP Morgan Securities | | | 5,975 | | | Buy | | | (1.00)% / 4.21% | | 09/20/16 | | | 554 | | | 758 | | | 204 | |
| Pacific Gas & Electric Co. | | Credit Suisse | | | 7,900 | | | Sell | | | 1.00% / 1.30% | | 09/20/16 | | | (65 | ) | | (108 | ) | | (43 | ) |
| | | | | | | | | | | | | | | | $ | 6,282 | | $ | 8,725 | | $ | 2,443 | |
| (a) | The maximum potential amount the Fund could be required to pay as a seller of credit protection or receive as a buyer of credit protection if a credit event occurs as defined under the terms of that particular swap agreement. |
| (b) | Implied credit spreads, represented in absolute terms, utilized in determining the market value of credit default swap agreements on corporate issues, U.S. municipal issues or sovereign issues of an emerging country as of period end serve as an indicator of the current status of the payment/performance risk and represent the likelihood or risk of default for the credit derivative. The implied credit spread of a particular referenced entity reflects the cost of buying/selling protection and may include upfront payments required to be made to enter into the agreement. Wider credit spreads represent a deterioration of the referenced entity’s credit soundness and a greater likelihood or risk of default or other credit event occurring as defined under the terms of the agreement. The percentage shown is the implied credit spread on December 31, 2011. For credit default swap agreements on indices, the quoted market prices and resulting values serve as the indicator of the current status of the payment/performance risk. |
| ╪ | See Significant Accounting Policies of accompanying Notes to Financial Statements regarding valuation of securities. |
The accompanying notes are an integral part of these financial statements.
Hartford Total Return Bond HLS Fund
Investment Valuation Hierarchy Level Summary
December 31, 2011
(000’s Omitted)
| | Total | | | Level 1 ♦ | | | Level 2 ♦ | | | Level 3 | |
| Assets: | | | | | | | | | | �� | | | | | | |
| Asset & Commercial Mortgage Backed Securities | | $ | 286,384 | | | $ | – | | | $ | 262,284 | | | $ | 24,100 | |
| Call Options Purchased | | | 16,079 | | | | – | | | | 16,079 | | | | – | |
| Corporate Bonds | | | 1,678,584 | | | | – | | | | 1,666,171 | | | | 12,413 | |
| Foreign Government Obligations | | | 39,252 | | | | – | | | | 39,252 | | | | – | |
| Municipal Bonds | | | 62,796 | | | | – | | | | 62,796 | | | | – | |
| Preferred Stocks | | | 4,079 | | | | 2,440 | | | | 1,639 | | | | – | |
| Put Options Purchased | | | 5,826 | | | | 215 | | | | 5,611 | | | | – | |
| Senior Floating Rate Interests | | | 30,846 | | | | – | | | | 30,846 | | | | – | |
| U.S. Government Agencies | | | 1,689,026 | | | | – | | | | 1,689,026 | | | | – | |
| U.S. Government Securities | | | 592,891 | | | | 203,668 | | | | 389,223 | | | | – | |
| Short-Term Investments | | | 130,189 | | | | 1,390 | | | | 128,799 | | | | – | |
| Total | | $ | 4,535,952 | | | $ | 207,713 | | | $ | 4,291,726 | | | $ | 36,513 | |
| Credit Default Swaps * | | | 4,095 | | | | – | | | | 4,095 | | | | – | |
| Foreign Currency Contracts * | | | 1,004 | | | | – | | | | 1,004 | | | | – | |
| Futures * | | | 485 | | | | 485 | | | | – | | | | – | |
| Written Options * | | | 1,820 | | | | 140 | | | | 1,680 | | | | – | |
| Total | | $ | 7,404 | | | $ | 625 | | | $ | 6,779 | | | $ | – | |
| Liabilities: | | | | | | | | | | | | | | | | |
| Credit Default Swaps * | | | 1,652 | | | | – | | | | 1,652 | | | | – | |
| Foreign Currency Contracts * | | | 1,018 | | | | – | | | | 1,018 | | | | – | |
| Futures * | | | 1,186 | | | | 1,186 | | | | – | | | | – | |
| Written Options * | | | 4,625 | | | | – | | | | 4,625 | | | | – | |
| Total | | $ | 8,481 | | | $ | 1,186 | | | $ | 7,295 | | | $ | – | |
| ♦ | For the year ended December 31, 2011, there were no significant transfers between Level 1 and Level 2. |
| * | Derivative instruments not reflected in the Schedule of Investments are valued at the unrealized appreciation/depreciation on the investments. |
| Following is a reconciliation of Level 3 assets for which significant unobservable inputs were used to determine fair value: |
| |
| | | Balance as of December 31, 2010 | | | Realized Gain (Loss) | | | Change in Unrealized Appreciation (Depreciation) | | | Net Amortization | | | Purchases | | | Sales | | | Transfers
Into
Level 3 * | | | Transfers Out of Level 3 * | | | Balance as of December 31, 2011 | |
| Assets: | | | | | | | | | | | | | | | | | | | | | | | | | | | | | | | | | | | | |
| Asset & Commercial Mortgage Backed Securities | | $ | 32,960 | | | $ | 7,927 | | | $ | (3,421 | )† | | $ | 357 | | | $ | 9,417 | | | $ | (29,766 | ) | | $ | 8,355 | | | $ | (1,729 | ) | | $ | 24,100 | |
| Corporate Bonds | | | 11,035 | | | | 3 | | | | (9 | )‡ | | | (49 | ) | | | 1,478 | | | | (45 | ) | | | — | | | | — | | | | 12,413 | |
| Total | | $ | 43,995 | | | $ | 7,930 | | | $ | (3,430 | ) | | $ | 308 | | | $ | 10,895 | | | $ | (29,811 | ) | | $ | 8,355 | | | $ | (1,729 | ) | | $ | 36,513 | |
| | | | | | | | | | | | | | | | | | | | | | | | | | | | | | | | | | | | | |
| * | Securities are transferred into and out of Level 3 for a variety of reasons including, but not limited to:
1) Securities where trading has been halted (transfer into Level 3) or securities where trading has resumed (transfer out of Level 3).
2) Broker quoted securities (transfer into Level 3) or quoted prices in active markets (transfer out of Level 3).
3) Securities that have certain restrictions on trading (transfer into Level 3) or securities where trading restrictions have expired (transfer out of Level 3). |
| † | Change in unrealized appreciation (depreciation) in the current period relating to assets still held at December 31, 2011 was $4,895. |
| ‡ | Change in unrealized appreciation (depreciation) in the current period relating to assets still held at December 31, 2011 was $(9). |
The accompanying notes are an integral part of these financial statements.
Hartford Total Return Bond HLS Fund
Statement of Assets and Liabilities
December 31, 2011
(000’s Omitted)
| Assets: | | | | |
| Investments in securities, at market value (cost $4,375,732) | | $ | 4,535,952 | |
| Cash | | | 592 | |
| Foreign currency on deposit with custodian (cost $311) | | | 299 | |
| Unrealized appreciation on foreign currency contracts | | | 1,004 | |
| Unrealized appreciation on swap contracts | | | 4,095 | |
| Receivables: | | | | |
| Investment securities sold | | | 153,133 | |
| Fund shares sold | | | 877 | |
| Dividends and interest | | | 35,532 | |
| Variation margin | | | 230 | |
| Swap premiums paid | | | 12,816 | |
| Total assets | | | 4,744,530 | |
| Liabilities: | | | | |
| Unrealized depreciation on foreign currency contracts | | | 1,018 | |
| Unrealized depreciation on swap contracts | | | 1,652 | |
| Payables: | | | | |
| Investment securities purchased | | | 360,100 | |
| Fund shares redeemed | | | 7,129 | |
| Variation margin | | | 364 | |
| Investment management fees | | | 438 | |
| Distribution fees | | | 35 | |
| Accrued expenses | | | 234 | |
| Swap premiums received | | | 6,534 | |
| Written options (proceeds $12,927) | | | 15,732 | |
| Total liabilities | | | 393,236 | |
| Net assets | | $ | 4,351,294 | |
| Summary of Net Assets: | | | | |
| Capital stock and paid-in-capital | | $ | 4,188,439 | |
| Undistributed net investment income | | | 172,212 | |
| Accumulated net realized loss | | | (167,402 | ) |
| Unrealized appreciation of investments and the translations of assets and liabilities denominated in foreign currency | | | 158,045 | |
| Net assets | | $ | 4,351,294 | |
| Shares authorized | | | 5,000,000 | |
| Par value | | $ | 0.001 | |
| Class IA: Net asset value per share | | $ | 11.63 | |
| Shares outstanding | | | 319,663 | |
| Net assets | | $ | 3,718,609 | |
| Class IB: Net asset value per share | | $ | 11.55 | |
| Shares outstanding | | | 54,783 | |
| Net assets | | $ | 632,685 | |
The accompanying notes are an integral part of these financial statements.
Hartford Total Return Bond HLS Fund
Statement of Operations
For the Year Ended December 31, 2011
(000’s Omitted)
| Investment Income: | | | | |
| Dividends | | $ | 339 | |
| Interest | | | 189,016 | |
| Total investment income, net | | | 189,355 | |
| | | | | |
| Expenses: | | | | |
| Investment management fees | | | 21,110 | |
| Transfer agent fees | | | 5 | |
| Distribution fees - Class IB | | | 1,686 | |
| Custodian fees | | | 17 | |
| Accounting services fees | | | 827 | |
| Board of Directors' fees | | | 105 | |
| Audit fees | | | 34 | |
| Other expenses | | | 632 | |
| Total expenses (before fees paid indirectly) | | | 24,416 | |
| Custodian fee offset | | | — | |
| Total fees paid indirectly | | | — | |
| Total expenses, net | | | 24,416 | |
| Net investment income | | | 164,939 | |
| | | | | |
| Net Realized Gain on Investments, Other Financial Instruments and Foreign Currency Transactions: | | | | |
| Net realized gain on investments | | | 114,117 | |
| Net realized loss on futures | | | (8,183 | ) |
| Net realized gain on written options | | | 5,858 | |
| Net realized gain on swap contracts | | | 12,683 | |
| Net realized loss on foreign currency contracts | | | (11,419 | ) |
| Net realized gain on other foreign currency transactions | | | 1,186 | |
| Net Realized Gain on Investments, Other Financial Instruments and Foreign Currency Transactions | | | 114,242 | |
| | | | | |
| Net Changes in Unrealized Appreciation of Investments, Other Financial Instruments and Foreign Currency Transactions: | | | | |
| Net unrealized appreciation of investments | | | 30,988 | |
| Net unrealized depreciation of futures | | | (2,708 | ) |
| Net unrealized depreciation of written options | | | (2,777 | ) |
| Net unrealized appreciation of swap contracts | | | 2,443 | |
| Net unrealized appreciation of foreign currency contracts | | | 1,385 | |
| Net unrealized depreciation on translation of other assets and liabilities in foreign currencies | | | (58 | ) |
| Net Changes in Unrealized Appreciation of Investments, Other Financial Instruments and Foreign Currency Transactions | | | 29,273 | |
| Net Gain on Investments, Other Financial Instruments and Foreign Currency Transactions | | | 143,515 | |
| Net Increase in Net Assets Resulting from Operations | | $ | 308,454 | |
The accompanying notes are an integral part of these financial statements.
Hartford Total Return Bond HLS Fund
Statement of Changes in Net Assets
(000’s Omitted)
| | | For the
Year Ended
December 31, 2011 | | | For the
Year Ended
December 31, 2010 | |
| Operations: | | | | | | | | |
| Net investment income | | $ | 164,939 | | | $ | 187,476 | |
| Net realized gain on investments, other financial instruments and foreign currency transactions | | | 114,242 | | | | 111,753 | |
| Net unrealized appreciation of investments, other financial instruments and foreign currency transactions | | | 29,273 | | | | 48,815 | |
| Net Increase In Net Assets Resulting From Operations | | | 308,454 | | | | 348,044 | |
| Distributions to Shareholders: | | | | | | | | |
| From net investment income | | | | | | | | |
| Class IA | | | (8,287 | ) | | | (169,465 | ) |
| Class IB | | | (1,420 | ) | | | (29,035 | ) |
| Total distributions | | | (9,707 | ) | | | (198,500 | ) |
| Capital Share Transactions: | | | | | | | | |
| Class IA | | | | | | | | |
| Sold | | | 425,018 | | | | 638,697 | |
| Issued on reinvestment of distributions | | | 8,287 | | | | 169,465 | |
| Redeemed | | | (997,652 | ) | | | (808,117 | ) |
| Total capital share transactions | | | (564,347 | ) | | | 45 | |
| Class IB | | | | | | | | |
| Sold | | | 103,223 | | | | 122,194 | |
| Issued on reinvestment of distributions | | | 1,420 | | | | 29,035 | |
| Redeemed | | | (236,649 | ) | | | (244,416 | ) |
| Total capital share transactions | | | (132,006 | ) | | | (93,187 | ) |
| Net decrease from capital share transactions | | | (696,353 | ) | | | (93,142 | ) |
| Net Increase (Decrease) In Net Assets | | | (397,606 | ) | | | 56,402 | |
| Net Assets: | | | | | | | | |
| Beginning of period | | | 4,748,900 | | | | 4,692,498 | |
| End of period | | $ | 4,351,294 | | | $ | 4,748,900 | |
| Undistributed (distribution in excess of) | | | | | | | | |
| net investment income | | $ | 172,212 | | | $ | 9,703 | |
| Shares: | | | | | | | | |
| Class IA | | | | | | | | |
| Sold | | | 38,022 | | | | 57,674 | |
| Issued on reinvestment of distributions | | | 727 | | | | 15,563 | |
| Redeemed | | | (88,636 | ) | | | (72,705 | ) |
| Total share activity | | | (49,887 | ) | | | 532 | |
| Class IB | | | | | | | | |
| Sold | | | 9,236 | | | | 11,115 | |
| Issued on reinvestment of distributions | | | 125 | | | | 2,678 | |
| Redeemed | | | (21,185 | ) | | | (22,189 | ) |
| Total share activity | | | (11,824 | ) | | | (8,396 | ) |
The accompanying notes are an integral part of these financial statements.
Hartford Total Return Bond HLS Fund
Notes to Financial Statements
December 31, 2011
(000’s Omitted)
Hartford Total Return Bond HLS Fund (the “Fund”) serves as an underlying investment option for certain variable annuity and variable life insurance separate accounts of Hartford Life Insurance Company (“HLIC”) and its affiliates and certain qualified retirement plans. The Fund may also serve as an underlying investment option for certain variable annuity and variable life separate accounts of other insurance companies. Owners of variable annuity contracts and policyholders of variable life insurance contracts may choose the funds permitted in the variable insurance contract prospectus. In addition, participants in certain qualified retirement plans may choose the Fund if permitted by their plans.
Hartford Series Fund, Inc. (the “Company”) is an open-end registered management investment company comprised of thirty portfolios. Financial Statements for the Fund, a series of the Company, are included in this report.
The Company is organized under the laws of the State of Maryland and is registered with the Securities and Exchange Commission (“SEC”) under the Investment Company Act of 1940, as amended (“1940 Act”). The Fund is a diversified open-end management investment company.
The Fund is divided into Class IA and Class IB shares. Each class is offered at the per share net asset value (“NAV”) without a sales charge and is subject to the same expenses, except that the Class IB shares are subject to distribution and service fees charged pursuant to a Distribution Plan adopted in accordance with Rule 12b-1 under the 1940 Act.
| 2. | Significant Accounting Policies: |
The following is a summary of significant accounting policies of the Fund in the preparation of its financial statements, which are in accordance with the United States Generally Accepted Accounting Principles (“U.S. GAAP”). The preparation of financial statements in accordance with U.S. GAAP may require management to make estimates and assumptions that affect the reported amounts of assets and liabilities and disclosure of contingent assets and liabilities at the date of the financial statements and the reported amounts of increases and decreases in net assets from operations during the reporting period. Actual results could differ from those estimates.
| a) | Determination of Net Asset Value – The NAV of each class of the Fund’s shares is determined as of the close of regular trading (normally 4:00 p.m. Eastern Time) (the “NYSE Close”) on each day that the New York Stock Exchange (the “Exchange”) is open (“Valuation Date”). Information that becomes known to the Fund after the NAV has been calculated on a particular day will not generally be used to retroactively adjust the NAV determined earlier that day. |
| b) | Investment Valuation and Fair Value Measurements – For purposes of calculating the NAV, portfolio securities and other assets held by the Fund's portfolio for which market quotes are readily available are valued at market value. Market value is generally determined on the basis of last reported sales prices or official close price. If no sales are reported, market value is based on quotes obtained from a quotation reporting system, established market makers, or independent pricing services. If market prices are not readily available or are deemed unreliable, the Fund will use the fair value of the security as determined in good faith under policies and procedures established by and under the supervision of the Company’s Board of Directors. Market quotes are considered not readily available where there is an absence of current or reliable market-based data (e.g., trade information or broker quotes), including where events occur after the close of the relevant market, but prior to the NYSE Close that materially affect the values of the Fund’s portfolio securities or assets. In addition, market quotes are considered not readily available when, due to extraordinary circumstances, the exchanges or markets on which the securities trade do not open for trading for the entire day and no other market prices are available. In addition, prices of foreign equities that are principally traded on certain foreign markets are adjusted daily pursuant to a fair value pricing service approved by the Board of Directors in order to reflect an adjustment for the factors occurring after the close of certain foreign markets but before the NYSE Close. Securities that are primarily traded on foreign markets may trade on days that are not business days of the Fund. The value of the foreign securities in which the Fund invests may change on days when a shareholder will not be able to purchase or redeem shares of the |
Fund. Fair value pricing is subjective in nature and the use of fair value pricing by the Fund may cause the NAV of its shares to differ significantly from the NAV that would have been calculated using market prices at the close of the exchange on which a portfolio security is primarily traded. There can be no assurance that the Fund could obtain the fair market value assigned to a security if the Fund were to sell the security at approximately the time at which the Fund determines its NAV.
Fixed income securities (other than short term obligations) and non-exchange traded derivatives held by the Fund are normally valued on the basis of quotes obtained from brokers and dealers or independent pricing services in accordance with procedures established by the Company’s Board of Directors. Prices obtained from independent pricing services use information provided by market makers or estimates of market values obtained from yield data relating to investments or securities with similar characteristics. Generally, the Fund may use fair valuation in regard to fixed income securities when the Fund holds defaulted or distressed securities or securities in a company in which a reorganization is pending. Short-term investments maturing in 60 days or less are generally valued at amortized cost, if their original term to maturity was 60 days or less, or by amortizing their value on the 61st day prior to maturity, if the original term to maturity exceeded 60 days.
Exchange traded options, futures and options on futures are valued at the settlement price determined by the relevant exchange as of the NYSE Close. If such instruments do not trade on an exchange, values may be supplied by an independent pricing service using a formula or other objective method that may take into consideration the style, direction, expiration, strike price, notional value and volatility or other adjustments.
Investments valued in currencies other than U.S. dollars are converted to U.S. dollars using exchange rates obtained from independent pricing services for calculation of the NAV. As a result, the NAV of the Fund’s shares may be affected by changes in the value of currencies in relation to the U.S. dollar. The value of securities traded in markets outside the United States or denominated in currencies other than the U.S. dollar may be affected significantly on a day that the NYSE is closed and the market value may change on days when an investor is not able to purchase, redeem or exchange shares of the Fund.
Foreign currency contracts represent agreements to exchange currencies on specific future dates at predetermined rates. Foreign currency contracts are valued using foreign currency exchange rates and forward rates as provided by an independent pricing service on the Valuation Date.
Investments in open-end mutual funds are valued at the respective NAV of each open-end mutual fund on the Valuation Date.
Financial instruments for which prices are not available from an independent pricing service may be valued using market quotations obtained from one or more dealers that make markets in the respective financial instrument in accordance with procedures established by the Company’s Board of Directors.
U.S. GAAP defines fair value as the price that the Fund would receive to sell an asset or pay to transfer a liability in an orderly transaction between market participants. The U.S. GAAP fair value measurement standards require disclosure of a fair value hierarchy for each major category of assets and liabilities. Various inputs are used in determining the fair value of the Fund’s investments. These inputs are summarized into three broad hierarchy levels. This hierarchy is based on whether the valuation inputs are observable or unobservable. These levels are:
| · | Level 1 – Quoted prices in active markets for identical securities. Level 1 may include exchange traded instruments such as domestic equities, some foreign equities, options, futures, mutual funds, exchange traded funds, rights and warrants. |
| · | Level 2 – Observable inputs other than Level 1 prices, such as quoted prices for similar securities; quoted prices in markets that are not active; or other inputs that are observable or can be corroborated by observable market |
Hartford Total Return Bond HLS Fund
Notes to Financial Statements – (continued)
December 31, 2011
(000’s Omitted)
data. Level 2 may include debt securities that are traded less frequently than exchange traded instruments and which are valued using independent pricing services; foreign equities, that are principally traded on certain foreign markets and are adjusted daily pursuant to a fair value pricing service in order to reflect an adjustment for the factors occurring after the close of certain foreign markets but before the NYSE Close; and short-term securities, which are valued at amortized cost.
| · | Level 3 – Significant unobservable inputs that are supported by limited or no market activity. Level 3 may include financial instruments whose values are determined using broker quotes or require significant management judgment or estimation. These unobservable valuation inputs may include estimates for current yields, maturity/duration, prepayment speed, and broker quotes for comparable securities along with other assumptions relating to credit quality, collateral value, complexity of the security structure, general market conditions and liquidity. This category may include securities where trading has been halted or there are certain restrictions on trading. While these securities are priced using unobservable inputs, the valuation of these securities reflects the best available data and management believes the prices are a reasonable representation of exit price. |
Valuation levels are not necessarily indicative of the risk associated with investing in such securities. Individual securities within any of the above mentioned asset classes may be assigned a different hierarchical level than those presented above, as individual circumstances dictate.
For additional information, refer to the Investment Valuation Hierarchy Level Summary and the Level 3 roll-forward reconciliation which follow the Schedule of Investments.
For purposes of reporting transfers between different hierarchy levels, both transfers in and out of each level, as applicable, are shown as if they occurred at the beginning of the period.
| c) | Security Transactions and Investment Income – Security transactions are recorded as of the trade date (the date the order to buy or sell is executed) for financial reporting purposes. Securities purchased or sold on a when-issued or delayed-delivery basis may be settled a month or more after the trade date. Realized gains and losses are determined on the basis of identified cost. |
Trade date for senior floating rate interests purchased in the primary loan market is considered the date on which the loan allocations are determined. Trade date for senior floating rate interests purchased in the secondary loan market is the date on which the transaction is entered into.
Dividend income is recorded on the ex-dividend date, except certain dividends from foreign securities where the ex-dividend date may have passed are recorded as soon as the Fund is informed of the dividend. Interest income, including amortization of premium and accretion of discounts, is accrued on a daily basis. Paydown gains and losses on mortgage-related and other asset-backed securities are included in interest income in the Statement of Operations.
| d) | Foreign Currency Transactions – Assets and liabilities denominated in currencies other than U.S. dollars are translated into U.S. dollars at the exchange rates in effect on the valuation date. Purchases and sales of investment securities, income, and expenses are translated into U.S. dollars at the exchange rates on the dates of such transactions. |
The Fund does not isolate that portion of portfolio security valuation resulting from fluctuations in the foreign currency exchange rates from the fluctuations arising from changes in the market prices of securities held. Exchange rate fluctuations are included with the net realized and unrealized gain or loss on investments in the accompanying financial statements.
Net realized foreign exchange gains or losses arise from sales of foreign currencies and the difference between asset and liability amounts initially stated in foreign currencies and the U.S. dollar value of the amounts actually received or paid.
Net unrealized foreign exchange gains or losses arise from changes in the value of other assets and liabilities at the end of the reporting period, resulting from changes in the exchange rates.
| e) | Joint Trading Account – The Fund may invest cash balances into a joint trading account that may be invested in one or more repurchase agreements. |
| f) | Fund Share Valuation and Dividend Distributions to Shareholders – Orders for the Fund’s shares are executed in accordance with the investment instructions of the contract holders and plan participants. The NAV of the Fund’s shares is determined as of the close of business on each business day of the Exchange. The NAV is determined separately for each class of shares of the Fund by dividing the Fund’s net assets attributable to that class by the number of shares of the class outstanding. Each class of shares offered by the Fund has equal rights as to assets and voting privileges (except that shareholders of a class have exclusive voting rights regarding any matter relating solely to that class of shares). Income and non-class specific expenses are allocated daily to each class on the basis of the relative net assets of the class. Realized and unrealized capital gains and losses are allocated daily based on the relative net assets of each class of shares of the Fund. |
Orders for the purchase of the Fund’s shares received prior to the close of the Exchange on any day the Exchange is open for business are priced at the NAV determined as of the close of the Exchange. Orders received after the close of the Exchange, or on a day on which the Exchange and/or the Fund is not open for business, are priced at the next determined NAV.
Dividends are declared pursuant to a policy adopted by the Company’s Board of Directors based upon the investment performance of the Fund. The policy of the Fund is to pay dividends from net investment income and realized capital gains, if any, at least once a year.
Distributions from net investment income, net realized capital gains and capital are determined in accordance with federal income tax regulations, which may differ from U.S. GAAP with respect to character and timing. These differences may include but are not limited to losses deferred due to wash sale adjustments, foreign currency gains and losses, adjustments related to Passive Foreign Investment Companies (“PFICs”), Real Estate Investment Trusts (“REITs”), Regulated Investment Companies (“RICs”), certain derivatives and partnerships. Permanent book and federal income tax basis differences relating to shareholder distributions will result in reclassifications to certain of the Fund’s capital accounts (see Federal Income Taxes: Reclassification of Capital Accounts note).
| 3. | Securities and Other Investments: |
| a) | Repurchase Agreements – A repurchase agreement is an agreement by which a counterparty agrees to sell a security and agrees to repurchase the security sold at a mutually agreed upon time and price. At the time the Fund enters into a repurchase agreement, the value of the underlying collateral security(ies), including accrued interest, will be equal to or exceed the value of the repurchase agreement. Repurchase agreements expose the Fund to counterparty risk. To minimize counterparty risk, the securities that serve to collateralize the repurchase agreement are held by the Fund's custodian in book entry or physical form in the custodial account of the Fund or in a third party custodial account. Repurchase agreements are valued at cost plus accrued interest. The Fund, as shown on the Schedule of Investments, had outstanding repurchase agreements as of December 31, 2011. |
| b) | Illiquid and Restricted Securities – The Fund is permitted to invest up to 15% of its net assets in illiquid securities. Illiquid securities are those that may not be sold or disposed of in the ordinary course of business within seven days, at approximately the price used to determine the Fund’s NAV. The Fund may not be able to sell illiquid securities or other investments when its sub-adviser considers it desirable to do so or may have to sell such securities or investments at a price that is lower than the price that could be obtained if the securities or investments were more liquid. A sale of illiquid securities or other investments may require more time and may result in higher dealer discounts and other selling |
Hartford Total Return Bond HLS Fund
Notes to Financial Statements – (continued)
December 31, 2011
(000’s Omitted)
expenses than does the sale of those that are liquid. Illiquid securities and investments also may be more difficult to value due to the unavailability of reliable market quotations for such securities or investments, and an investment in them may have an adverse impact on the Fund’s NAV. The Fund may also purchase certain restricted securities that can only be resold to certain qualified investors and may be determined to be liquid pursuant to policies and guidelines established by the Company’s Board of Directors. The Fund, as shown on the Schedule of Investments, had illiquid and/or restricted securities as of December 31, 2011.
| c) | Securities Purchased on a When-Issued or Delayed-Delivery Basis – Delivery and payment for securities that have been purchased by the Fund on a forward commitment, or when-issued or delayed-delivery basis, take place beyond the customary settlement period. A fund may dispose of or renegotiate a delayed-delivery transaction after it is entered into, and may sell delayed-delivery securities before they are delivered, which may result in a realized gain or loss. During this period, such securities are subject to market fluctuations, and the Fund identifies securities segregated in its records with value at least equal to the amount of the commitment. The Fund, as shown on the Schedule of Investments, had when-issued or delayed delivery securities as of December 31, 2011. |
In connection with the Fund’s ability to purchase securities on a when-issued or forward commitment basis, the Fund may enter into to-be announced (“TBA”) commitments. TBA commitments are forward agreements for the purchase or sale of mortgage-backed securities for a fixed price, with payment and delivery on an agreed-upon future settlement date. The specific securities to be delivered are not identified at the trade date; however, delivered securities must meet specified terms, including issuer, rate and mortgage terms. The Fund generally enters into TBA commitments with intent to take possession of or deliver the underlying mortgage-backed securities but can extend the settlement or roll the transaction. TBA commitments involve a risk of loss if the value of the security to be purchased or sold declines or increases, respectively, prior to settlement date.
The Fund may enter into “dollar rolls” in which the Fund sells securities and contracts with the same counterparty to repurchase substantially similar securities (for example, same issuer, coupon and maturity) on a specified future date at an agreed upon price. The Fund gives up the right to receive interest paid on the securities sold. The Fund would benefit to the extent of any differences between the price received for the securities and the lower forward price for the future purchase. Dollar rolls involve the risk that the market value of the securities that the Fund is required to purchase may decline below the agreed upon repurchase price of those securities. The Fund accounts for dollar roll transactions as purchases and sales and realizes gains and losses on these transactions. These transactions are excluded from the Fund’s portfolio turnover rate. The Fund had open dollar roll transactions as of December 31, 2011, in the amount of $154,195 included within investment securities purchased on the Statement of Assets and Liabilities and $(1,062) included within the net unrealized appreciation of investments within the Statement of Operations.
| d) | Senior Floating Rate Interests – The Fund, as shown on the Schedule of Investments, invests in senior floating rate interests. Senior floating rate interests hold the most senior position in the capital structure of a business entity (the “Borrower”), are typically secured by specific collateral and have a claim on the assets and/or stock of the Borrower that is senior to that held by subordinated debtholders and stockholders of the Borrower. Senior floating rate interests are typically structured and administered by a financial institution that acts as the agent of the lenders participating in the senior floating rate interest. The Fund may invest in multiple series or tranches of a senior floating rate interest, which may have varying terms and carry different associated risks. The Fund may also enter into unfunded loan commitments, which are contractual obligations for future funding. Unfunded loan commitments may include revolving credit facilities, which may obligate the Fund to supply additional cash to the borrower on demand. Unfunded loan commitments represent a future obligation in full. The Fund may receive a commitment fee based on the undrawn portion of the underlying line of credit portion of a senior floating rate interest. In certain circumstances, the Fund may receive various fees upon the restructure of a senior floating rate interest by a borrower. Fees earned/paid may be recorded as a component of income or realized gain/loss in the Statement of Operations. |
Senior floating rate interests are typically rated below-investment-grade, which suggests they are more likely to default and generally pay higher interest rates than investment-grade loans. A default could lead to non-payment of income,
which would result in a reduction of income to the Fund, and there can be no assurance that the liquidation of any collateral would satisfy the Borrower’s obligation in the event of non-payment of scheduled interest or principal payments, or that such collateral could be readily liquidated.
| e) | Inflation Indexed Bonds – The Fund may invest in inflation indexed bonds. Inflation indexed bonds are fixed income securities whose principal value is periodically adjusted to the rate of inflation. The interest rate on these bonds is generally fixed at issuance at a rate lower than typical bonds. Over the life of an inflation indexed bond, however, interest will be paid based on a principal value, which is adjusted for inflation. Any increase or decrease in the principal amount of an inflation indexed bond will be included as interest income on the Statement of Operations, even though investors do not receive the principal amount until maturity. |
| f) | Mortgage Related and Other Asset Backed Securities – The Fund may invest in mortgage related and other asset backed securities. These securities include mortgage pass-through securities, collateralized mortgage obligations, commercial mortgage backed securities, stripped mortgage backed securities, asset backed securities, collateralized debt obligations and other securities that directly or indirectly represent a participation in, or are secured by and payable from, mortgage loans on real property. Mortgage related securities are created from pools of residential or commercial mortgage loans, including mortgage loans made by savings and loan institutions, mortgage bankers, commercial banks and others. Asset backed securities are created from many types of assets, including auto loans, credit card receivables, home equity loans, and student loans. These securities provide a monthly payment which consists of both interest and principal payments. Interest payments may be determined by fixed or adjustable rates. The rate of pre-payments on underlying mortgages will affect the price and volatility of a mortgage related security, and may have the effect of shortening or extending the effective duration of the security relative to what was anticipated at the time of purchase. The timely payment of principal and interest of certain mortgage related securities is guaranteed by the full faith and credit of the United States Government. Pools created and guaranteed by non-governmental issuers, including government-sponsored corporations, may be supported by various forms of insurance or guarantees, but there can be no assurance that the private insurers or guarantors can meet their obligations under the insurance policies or guarantee arrangements. The Fund, as shown on the Schedule of Investments, had mortgage related and other asset backed securities as of December 31, 2011. |
| 4. | Financial Derivative Instruments: |
The following disclosures contain information on how and why the Fund uses derivative instruments, the credit-risk-related contingent features in certain derivative instruments, and how derivative instruments affect the Fund’s financial position and results of operations. The location and fair value amounts of these instruments on the Statement of Assets and Liabilities and the realized gains and losses and changes in unrealized gains and losses on the Statement of Operations, each categorized by type of derivative contract, are included in the following Additional Derivative Instrument Information footnote. The derivative instruments outstanding as of period-end are disclosed in the notes to the Schedule of Investments and the amounts of realized gains and losses and changes in unrealized gains and losses on derivative instruments during the period are disclosed in the Statement of Operations.
| a) | Foreign Currency Contracts – The Fund may enter into foreign currency contracts that obligate the Fund to purchase or sell currencies at specified future dates. Foreign currency contracts are used to hedge the currency exposure associated with some or all of the Fund's securities and/or as part of an investment strategy. Foreign currency contracts are marked to market daily and the change in value is recorded by the Fund as an unrealized gain or loss. The Fund will record a realized gain or loss when the foreign currency contract is settled. |
Foreign currency contracts involve elements of market risk in excess of the amounts reflected in the Statement of Assets and Liabilities. In addition, risks may arise upon entering into these contracts from the potential inability of the counterparties to meet the terms of the contracts and from unanticipated movements in the value of the foreign currencies relative to the U.S. dollar. The Fund had outstanding foreign currency contracts as shown on the Schedule of Investments as of December 31, 2011.
Hartford Total Return Bond HLS Fund
Notes to Financial Statements – (continued)
December 31, 2011
(000’s Omitted)
| b) | Futures Contracts – The Fund may enter into futures contracts. A futures contract is an agreement between two parties to buy or sell an asset at a set price on a future date. The Fund uses futures contracts to manage or obtain exposure to the securities markets, commodities, or movements in interest rates and currency values. The primary risks associated with the use of futures contracts are the imperfect correlation between the change in market value of the securities held by the Fund and the prices of futures contracts and the possibility of an illiquid market. Upon entering into a futures contract, the Fund is required to deposit with a futures commission merchant (“FCM”) an amount of cash or U.S. Government or Agency Obligations in accordance with the initial margin requirements of the broker or exchange. Futures contracts are marked to market daily at the most recent settlement price reported by an exchange on which, over time, they are traded most extensively, and an appropriate payable or receivable for the change in value (“variation margin”) is recorded by the Fund. Gains or losses are recognized but not considered realized until the contracts expire or are closed. Futures contracts involve, to varying degrees, risk of loss in excess of the variation margin disclosed on the Statement of Assets and Liabilities; however, this risk is reduced through the use of an FCM. The Fund, as shown on the Schedule of Investments, had outstanding futures contracts as of December 31, 2011. |
| c) | Options Contracts – An option contract is a contract sold by one party to another party that offers the buyer the right, but not the obligation, to buy (call) or sell (put) a security or other financial asset at an agreed-upon price during a specific period of time or on a specific date. The Fund may write (sell) covered call and put options on futures, swaps (“swaptions”), securities, commodities or currencies. “Covered” means that so long as the Fund is obligated as the writer of an option, it will own either the underlying securities or currency or an option to purchase the same underlying securities or currency having an expiration date of the covered option and an exercise price equal to or less than the exercise price of the covered option, or will pledge cash or other liquid securities having a value equal to or greater than the fluctuating market value of the option security or currency. Writing put options increases the Fund’s exposure to the underlying instrument. Writing call options decreases the Fund’s exposure to the underlying instrument. Premiums received from writing options that expire are treated as realized gains. Premiums received from writing options that are exercised or closed are added to the proceeds or offset against amounts paid on the underlying futures, swap, security or currency transaction to determine the realized gain or loss. The Fund as a writer of an option has no control over whether the underlying instrument may be sold (call) or purchased (put) and as a result bears the market risk of an unfavorable change in the price of the instrument underlying the written option. There is the risk the Fund may not be able to enter into a closing transaction because of an illiquid market. The Fund may also purchase put and call options. Purchasing call options increases the Fund’s exposure to the underlying instrument. Purchasing put options decreases the Fund’s exposure to the underlying instrument. The Fund pays a premium, which is included on the Fund’s Statement of Assets and Liabilities as an investment and is subsequently marked to market to reflect the current value of the option. Premiums paid for purchasing options that expire are treated as realized losses. Certain options may be purchased with premiums to be determined on a future date. The premiums for these options are based upon implied volatility parameters at specified terms. The risk associated with purchasing put and call options is generally limited to the premium paid. Premiums paid for purchasing options that are exercised or closed are added to the amounts paid or offset against the proceeds on the underlying investment transaction to determine the realized gain or loss. Entering into over-the-counter options also exposes the Fund to counterparty risk. Counterparty risk is the possibility that the counterparty to the agreements may default on its obligation to perform or disagree as to the meaning of the contractual terms in the agreements. The Fund, as shown on the Schedule of Investments, had outstanding purchased options contracts as of December 31, 2011. Transactions involving written options contracts during the year ended December 31, 2011, are summarized below: |
| | | | Options Contract Activity During the Year
Ended December 31, 2011 | |
| | Call Options Written During the Year | | Number of Contracts* | | | Premium Amounts | |
| | Beginning of the year | | — | | | $— | |
| | Written | | | 688,832,849 | | | | 22,088 | |
| | Expired | | | (362,393,622 | ) | | | (5,004 | ) |
| | Closed | | | (129,554,538 | ) | | | (5,168 | ) |
| | Exercised | | | — | | | | — | |
| | End of year | | | 196,884,689 | | | $ | 11,916 | |
| | | | | | | | | | |
| | Put Options Written During the Year | | Number of Contracts* | | | Premium Amounts | |
| | Beginning of the year | | | 4,409,819 | | | $ | 418 | |
| | Written | | | 1,547,057,587 | | | | 24,082 | |
| | Expired | | | (854,288,784 | ) | | | (6,593 | ) |
| | Closed | | | (614,993,026 | ) | | | (16,896 | ) |
| | Exercised | | | — | | | | — | |
| | End of year | | | 82,185,596 | | | $ | 1,011 | |
| * | The number of contracts does not omit 000's. |
| d) | Swap Agreements – The Fund may invest in swap agreements. Swap agreements are privately negotiated agreements between the Fund and a counterparty to exchange or swap investment cash flows, assets, foreign currencies or market-linked returns at specified future intervals. The Fund enters into credit default, total return, cross-currency, interest rate, inflation and other forms of swap agreements to manage its exposure to credit, currency, interest rate, commodity and inflation risk. Swap agreements are also used to gain exposure to certain markets. In connection with these agreements, securities or cash may be identified as collateral in accordance with the terms of the respective swap agreements to provide assets of value and recourse in the event of default or bankruptcy/insolvency. Swaps are valued based on custom valuations furnished by an independent pricing service. Swaps for which prices are not available from an independent pricing service are valued in accordance with procedures established by the Company’s Board of Directors, and the change in value, if any, is recorded as an unrealized gain or loss on the Statement of Assets and Liabilities. Payments received or made at the beginning of the measurement period are reflected as such on the Statement of Assets and Liabilities and represent payments made or received upon entering into the swap agreement to compensate for differences between the stated terms of the swap agreement and prevailing market conditions (credit spreads, currency exchange rates, interest rates, and other relevant factors). These upfront payments are recorded as realized gains or losses on the Statement of Operations upon termination or maturity of the swap. A liquidation payment received or made at the termination of the swap and some net periodic payments received or paid by the Fund are recorded as realized gains or losses on the Statement of Operations. Net periodic payments and some upfront payments received or paid by the Fund with regard to interest rate swaps are recorded as increases or decreases to income on the Statement of Operations. Entering into these agreements involves, to varying degrees, elements of credit, market and documentation risk in excess of the amounts recognized on the Statement of Assets and Liabilities. Such risks involve the possibility that there will be no liquid market for these agreements, that the counterparty to the agreements may default on its obligation to perform or disagree as to the meaning of contractual terms in the agreements, and that there may be unfavorable changes in interest rates. The Fund’s maximum risk of loss from counterparty credit risk is the discounted net value of the cash flows to be received from the counterparty over the contract’s remaining life, to the extent that amount is positive. The risk is mitigated by having a master netting arrangement between the Fund and the counterparty, which allows for the netting of payments made or received (although such amounts are presented on a gross basis within the Statement of Assets and Liabilities, as applicable) as well as the posting of collateral to the Fund to cover the Fund’s exposure to the counterparty. |
Credit Default Swap Agreements – The credit default swap market allows the Fund to manage its exposure to the market or certain sectors of the market, to reduce its risk exposure to defaults of corporate and sovereign issuers, or to create exposure to corporate or sovereign issuers to which it is not otherwise exposed. Certain credit default swaps involve the exchange of a fixed rate premium for protection against the loss in value of an underlying security or index in the event of a credit event, such as payment default or bankruptcy.
Hartford Total Return Bond HLS Fund
Notes to Financial Statements – (continued)
December 31, 2011
(000’s Omitted)
Under a credit default swap contract, one party acts as guarantor by receiving the fixed periodic payment in exchange for the commitment to purchase the underlying security at par if the defined credit event occurs. Upon the occurrence of a defined credit event, the difference between the value of the reference obligation and the swap’s notional amount is recorded as realized gain or loss on swap transactions in the Statement of Operations. A “buyer” of credit protection agrees to pay a counterparty to assume the credit risk of an issuer upon the occurrence of certain events. The “seller” of the protection receives periodic payments and agrees to assume the credit risk of an issuer upon the occurrence of certain events. Although specified events are contract specific, credit events are generally defined as bankruptcy, failure to pay, restructuring, obligation acceleration, obligation default, or repudiation/moratorium. A “seller’s” exposure is limited to the total notional amount of the credit default swap contract. These potential amounts would be partially offset by any recovery values of the respective referenced obligations or upfront payments received upon entering into the contract. The Fund will generally not buy protection on issuers that are not currently held by the Fund.
Implied credit spreads, represented in absolute terms, utilized in determining the market value of credit default swap contracts on corporate issues, sovereign issues of an emerging country or U.S. municipal issues as of period end are disclosed in the notes to the Schedule of Investments, as applicable, and serve as an indicator of the current status of the payment/performance risk and represent the likelihood or risk of default for the credit derivative. The implied credit spread of a particular referenced entity reflects the cost of buying/selling protection and may include upfront payments required to be made to enter into the contract. Wider credit spreads represent a deterioration of the referenced entity’s soundness and a greater likelihood or risk of default or other credit event occurring as defined under the terms of the contract. For credit default swap contracts on asset-backed securities and credit indices, the quoted market prices and resulting values serve as the indicator of the current status of the payment/performance risk. Increasing market values, in absolute terms when compared to the notional amount of the swap, represent a deterioration of the referenced equity’s credit soundness and a greater likelihood or risk of default or other credit event occurring as defined under the terms of the contract. The Fund, as shown on the Schedule of Investments, had outstanding credit default swaps as of December 31, 2011.
Interest Rate Swap Agreements – The Fund is subject to interest rate risk in the normal course of pursuing its investment objectives. Because the Fund holds fixed rate bonds, the value of these bonds may decrease if interest rates rise. To help hedge against this risk and to maintain its ability to generate income at prevailing market rates, the Fund may enter into interest rate swap agreements. In a typical interest rate swap, one party agrees to make regular payments equal to a floating interest rate, based on a specified interest rate benchmark (e.g., London Interbank Offered Rate (“LIBOR”)) or index (e.g., U.S. Consumer Price Index), multiplied by a “notional principal amount”, in return for payments equal to a fixed rate multiplied by the same amount, for a specific period of time. The net interest received or paid on interest rate swap contracts is accrued daily as interest income/expense. Interest rate swaps are marked to market daily and the change, if any, is recorded as an unrealized gain or loss in the Statement of Operations. When the interest rate swap agreement is terminated early, the Fund records a realized gain or loss equal to the difference between the current realized value and the expected cash flows.
If an interest rate swap contract provides for payments in different currencies, the parties might agree to exchange the notional principal amount as well. Interest rate swaps may also depend on other prices or rates, such as the value of an index or mortgage prepayments rates. The risks of interest rate swaps include changes in market conditions which will affect the value of the contract or the cash flows and the possible inability of the counterparty to fulfill its obligations under the agreement. The Fund’s maximum risk of loss from counterparty credit risk is the discounted net value of the cash flows to be received from the counterparty over the agreement’s remaining life, to the extent that the amount is positive. This risk may be mitigated by having a master netting arrangement between the Fund and the counterparty (although such amounts are presented on a gross basis within the Statement of Assets and Liabilities, as applicable) or by posting collateral by the counterparty to the Fund to cover the Fund’s exposure to the counterparty. As of December 31, 2011, the Fund did not hold any interest rate swap agreements.
Total Return Swap Agreements – The Fund may invest in total return swap agreements. An investment in a total return swap allows the Fund to gain or mitigate exposure to underlying referenced securities. Total return swap agreements on commodities involve commitments where cash flows are exchanged based on the price of a commodity and based on a
fixed or variable rate. One party would receive payments based on the price appreciation or depreciation of a commodity index, a portion of the index, or a single commodity in exchange for paying to or receiving from the counterparty seller an agreed-upon rate. A variable rate may be correlated to a base rate, such as the LIBOR, and is adjusted each period. Therefore, if interest rates increase over the term of the swap agreement, the party paying the rate may be required to pay a higher rate at each swap reset date.
Total return swap agreements on indices involve commitments to pay interest in exchange for a market-linked return. One party pays out the total return of a specific reference asset, which may be an equity, index, or bond, and in return receives a regular stream of payments. To the extent the total return of the security or index underlying the transaction exceeds or falls short of the offsetting interest rate obligation, the Fund will receive a payment from or make a payment to the counterparty. As of December 31, 2011, the Fund did not hold any total return swap agreements.
| e) | Additional Derivative Instrument Information: |
Fair Values of Derivative Instruments on the Statement of Assets and Liabilities as of December 31, 2011:
| | | Risk Exposure Category | |
| | | Interest Rate Contracts | | | Foreign Exchange Contracts | | | Credit Contracts | | | Equity Contracts | | | Commodity Contracts | | | Other Contracts | | | Total | |
| Assets: | | | | | | | | | | | | | | | | | | | | | | | | | | | | |
| Investments in securities, at value (purchased options), market value | | $ | 215 | | | $ | 21,690 | | | $ | — | | | $ | — | | | $ | — | | | $ | — | | | $ | 21,905 | |
| Unrealized appreciation on foreign currency contracts | | | — | | | | 1,004 | | | | — | | | | — | | | | — | | | | — | | | | 1,004 | |
| Unrealized appreciation on swap contracts | | | — | | | | — | | | | 4,095 | | | | — | | | | — | | | | — | | | | 4,095 | |
| Variation margin receivable * | | | 230 | | | | — | | | | — | | | | — | | | | — | | | | — | | | | 230 | |
| Total | | $ | 445 | | | $ | 22,694 | | | $ | 4,095 | | | $ | — | | | $ | — | | | $ | — | | | $ | 27,234 | |
| | | | | | | | | | | | | | | | | | | | | | | | | | | | | |
| Liabilities: | | | | | | | | | | | | | | | | | | | | | | | | | | | | |
| Unrealized depreciation on foreign currency contracts | | $ | — | | | $ | 1,018 | | | $ | — | | | $ | — | | | $ | — | | | $ | — | | | $ | 1,018 | |
| Unrealized depreciation on swap contracts | | | — | | | | — | | | | 1,652 | | | | — | | | | — | | | | — | | | | 1,652 | |
| Variation margin payable * | | | 364 | | | | — | | | | — | | | | — | | | | — | | | | — | | | | 364 | |
| Written options, market value | | | 74 | | | | 15,658 | | | | — | | | | — | | | | — | | | | — | | | | 15,732 | |
| Total | | $ | 438 | | | $ | 16,676 | | | $ | 1,652 | | | $ | — | | | $ | — | | | $ | — | | | $ | 18,766 | |
| | | | | | | | | | | | | | | | | | | | | | | | | | | | True | |
| * | Only current day's variation margin is reported within the Statement of Assets and Liabilities. The variation margin is included in the open futures cumulative appreciation (depreciation) of $(701) as reported in the Schedule of Investments |
The ratio of foreign currency contracts to net assets at December 31, 2011, was 3.37% compared to the twelve-month average ratio of 10.04% during the year ended December 31, 2011. The volume of other derivatives that are presented in the Schedule of Investments is consistent with the derivative activity during the year ended December 31, 2011.
Hartford Total Return Bond HLS Fund
Notes to Financial Statements – (continued)
December 31, 2011
(000’s Omitted)
The Effect of Derivative Instruments on the Statement of Operations for the year ended December 31, 2011:
| | | Risk Exposure Category | |
| | | Interest Rate Contracts | | | Foreign Exchange Contracts | | | Credit Contracts | | | Equity Contracts | | | Commodity Contracts | | | Other Contracts | | | Total | |
| Realized Gain (Loss) on Derivatives Recognized as a Result of Operations: |
| Net realized loss on investments in purchased options | | $ | (7,525 | ) | | $ | (2,385 | ) | | $ | (8,056 | ) | | $ | — | | | $ | — | | | $ | — | | | $ | (17,966 | ) |
| Net realized loss on futures | | | (8,183 | ) | | | — | | | | — | | | | — | | | | — | | | | — | | | | (8,183 | ) |
| Net realized gain (loss) on written options | | | 3,592 | | | | (7,310 | ) | | | 9,576 | | | | — | | | | — | | | | — | | | | 5,858 | |
| Net realized gain on swap contracts | | | 798 | | | | 214 | | | | 11,671 | | | | — | | | | — | | | | — | | | | 12,683 | |
| Net realized loss on foreign currency contracts | | | — | | | | (11,419 | ) | | | — | | | | — | | | | — | | | | — | | | | (11,419 | ) |
| Total | | $ | (11,318 | ) | | $ | (20,900 | ) | | $ | 13,191 | | | $ | — | | | $ | — | | | $ | — | | | $ | (19,027 | ) |
| | | | | | | | | | | | | | | | | | | | | | | | | | | | | |
| Net Change in Unrealized Appreciation (Depreciation) on Derivatives Recognized as a Result of Operations: | | | | | | | | | | | | | | | | | | | | | | | | | | | | |
| Net change in unrealized appreciation of investments in purchased options | | $ | — | | | $ | 13,361 | | | $ | — | | | $ | — | | | $ | — | | | $ | — | | | $ | 13,361 | |
| Net change in unrealized depreciation of futures | | | (2,708 | ) | | | — | | | | — | | | | — | | | | — | | | | — | | | | (2,708 | ) |
| Net change in unrealized appreciation (depreciation) of written options | | | 139 | | | | (2,916 | ) | | | — | | | | — | | | | — | | | | — | | | | (2,777 | ) |
| Net change in unrealized appreciation of swap contracts | | | — | | | | — | | | | 2,443 | | | | — | | | | — | | | | — | | | | 2,443 | |
| Net change in unrealized appreciation of foreign currency contracts | | | — | | | | 1,385 | | | | — | | | | — | | | | — | | | | — | | | | 1,385 | |
| Total | | $ | (2,569 | ) | | $ | 11,830 | | | $ | 2,443 | | | $ | — | | | $ | — | | | $ | — | | | $ | 11,704 | |
| a) | Credit and Counterparty Risks – Credit risk depends largely on the perceived financial health of bond issuers. In general, the credit rating is inversely related to the credit risk of the issuer. Higher rated bonds generally are deemed to have less credit risk, while lower or unrated bonds are deemed to have higher risk of default. The share price, yield and total return of a fund that holds securities with higher credit risk may be more volatile than those of a fund that holds bonds with lower credit risk. Similar to credit risk, the Fund may be exposed to counterparty risk, or the risk that an institution or other entity with which the Fund has unsettled or open transactions will default. |
| b) | Market Risks – The Fund’s investments in derivatives and other financial instruments expose the Fund to various risks including, but not limited to, interest rate, prepayment, extension, foreign currency, and equity risks. Interest rate risk is the risk that fixed income securities will decline in value because of changes in interest rates. As nominal interest rates rise, the value of certain fixed income securities held by the Fund is likely to decrease. A nominal interest rate can be described as the sum of a real interest rate and an expected inflation rate. Fixed income securities with longer durations tend to be more sensitive to changes in interest rates, usually making them more volatile than securities with shorter durations. Duration is useful primarily as a measure of the sensitivity of a fixed income security’s market price to interest rate (i.e., yield) movements. Senior floating rate interests and securities subject to prepayment and extension risk generally offer less potential for gains when interest rates decline. In addition, securities are subject to extension risk. Rising interest rates may cause prepayments to occur at a slower than expected rate, thereby effectively lengthening the maturity of the security and making the security more sensitive to interest rate changes. Prepayment and extension risk are major risks of mortgage-backed securities, senior floating rate interests, and certain asset-backed securities. For certain asset-backed securities, the actual maturity may be less than the stated maturity shown in the Schedule of Investments, if applicable. As a result, the timing of income recognition relating to these securities may vary based upon the actual maturity. If a Fund invests directly in foreign currencies or in securities that trade in, and receive revenues in, foreign currencies, or in derivatives that provide exposure to foreign currencies, it will be subject to the risk that those currencies will decline in value relative to the base currency of the Fund, or, in the case of hedging positions, that the Fund’s base currency will decline in value relative to the currency being hedged. Currency rates in foreign countries may fluctuate significantly over short periods of time for a number of reasons, including changes in interest rates, intervention |
(or the failure to intervene) by U.S. or foreign governments, central banks or supranational entities, such as the International Monetary Fund, or by the imposition of currency controls or other political developments in the United States or abroad. As a result, the Fund’s investments in foreign currency denominated securities may reduce the returns of the Fund. The market values of equity securities, such as common stocks and preferred stocks, or equity related investments, such as futures and options, may decline due to general market conditions which are not specifically related to a particular company, such as real or perceived adverse economic conditions, changes in the general outlook for corporate earnings, changes in interest or currency rates or adverse investor sentiment generally. The market value of equity securities may also decline due to factors which affect a particular industry or industries, such as labor shortages or increased production costs and competitive conditions within an industry. Equity securities and equity related investments generally have greater market price volatility than fixed income securities.
| a) | Federal Income Taxes – For federal income tax purposes, the Fund intends to continue to qualify as a RIC under Subchapter M of the Internal Revenue Code (“IRC”) by distributing substantially all of its taxable net investment income and net realized capital gains to its shareholders and otherwise complying with the requirements of RICs. The Fund has distributed substantially all of its income and capital gains in prior years, if applicable, and intends to distribute substantially all of its income and capital gains prior to the next fiscal year-end. Accordingly, no provision for federal income or excise taxes has been made in the accompanying financial statements. Distributions from short-term capital gains are treated as ordinary income distributions for federal income tax purposes. |
| b) | Net Investment Income (Loss), Net Realized Gains (Losses) – Net investment income (loss) and net realized gains (losses) may differ for financial statement and tax purposes primarily because of losses deferred due to wash sale adjustments, foreign currency gains and losses, adjustments related to PFICs, REITs, RICs, certain derivatives and partnerships. The character of distributions made during the year from net investment income or net realized gains may differ from their ultimate characterization for federal income tax purposes. Also, due to the timing of dividend distributions, the fiscal year in which amounts are distributed may differ from the year that the income or realized gains (losses) were recorded by the Fund. |
| c) | Distributions and Components of Distributable Earnings – The tax character of distributions paid by the Fund for the periods indicated is as follows (as adjusted for dividends payable): |
| | | For the Year Ended
December 31, 2011 | | | For the Year Ended
December 31, 2010 | |
| Ordinary Income | | $ | 9,707 | | | $ | 198,500 | |
| | | | | | | | | |
As of December 31, 2011, the Fund’s components of distributable earnings (deficit) on a tax basis were as follows:
| | | Amount | |
| Undistributed Ordinary Income | | $ | 172,216 | |
| Accumulated Capital and Other Losses* | | | (149,977 | ) |
| Unrealized Appreciation† | | | 140,619 | |
| Total Accumulated Earnings | | $ | 162,858 | |
| * | The Fund has capital loss carryforwards that are identified in the Capital Loss Carryforward note that follows. |
| † | The differences between book-basis and tax-basis unrealized appreciation (depreciation) may be attributable to the losses deferred due to wash sale adjustments, foreign currency gains and losses, adjustments related to PFICs, REITs, RICs, certain derivatives and partnerships. |
Hartford Total Return Bond HLS Fund
Notes to Financial Statements – (continued)
December 31, 2011
(000’s Omitted)
| d) | Reclassification of Capital Accounts – The Fund may record reclassifications in its capital accounts. These reclassifications have no impact on the total net assets of the Fund. The reclassifications are a result of permanent differences between U.S. GAAP and tax accounting for such items as foreign currency, PFICs, expiration or utilization of capital loss carryforwards or net operating losses. Adjustments are made to reflect the impact these items have on current and future distributions to shareholders. Therefore, the source of the Fund’s distributions may be shown in the accompanying Statement of Changes in Net Assets as from undistributed net investment income, from accumulated net realized gains on investments or from capital depending on the type of book and tax differences that exist. For the year ended December 31, 2011, the Fund recorded reclassifications to increase (decrease) the accounts listed below: |
| | | Amount | |
| Undistributed Net Investment Income | | $ | 7,277 | |
| Accumulated Net Realized Gain (Loss) | | | (7,277 | ) |
| | | | | |
| e) | Capital Loss Carryforward – On December 22, 2010, the Regulated Investment Company Modernization Act of 2010 (the “Act”) was enacted, which made changes to the capital loss carryforward rules. The changes are effective for taxable years beginning after the date of enactment. Under the Act, funds are permitted to carry forward capital losses for an unlimited period. However, any losses incurred during those future taxable years will be required to be utilized prior to the losses incurred in pre-enactment taxable years, which carry an expiration date. As a result of this ordering rule, pre-enactment capital loss carryforwards may be more likely to expire unused. Additionally, post-enactment capital loss carryforwards will retain their character as either short-term or long-term capital losses rather than being considered all short-term as permitted under prior regulation. |
At December 31, 2011 (tax-year-end), the Fund had capital loss carryforwards for U.S. federal income tax purposes as follows:
| Year of Expiration | | Amount | |
| 2017 | | $ | 149,977 | |
| Total | | $ | 149,977 | |
| | | | | |
| As of December 31, 2011, the Fund utilized $113,185 of prior year capital loss carryforwards |
| f) | Accounting for Uncertainty in Income Taxes – The Fund has adopted financial reporting rules that require the Fund to analyze all open tax years, as defined by the statute of limitations, for all major jurisdictions. Generally, tax authorities can examine all tax returns filed for the last three years. The Fund does not have an examination in progress. |
The Fund has reviewed all open tax years and major jurisdictions and concluded that these financial reporting rules had no effect on the Fund’s financial position or results of operations. There is no tax liability resulting from unrecognized tax benefits relating to uncertain income tax positions taken or expected to be taken on the tax return for the fiscal year ended December 31, 2011. The Fund is also not aware of any tax positions for which it is reasonably possible that the total amounts of unrecognized tax benefits will significantly change in the next twelve months.
| a) | Investment Management Agreement – HL Investment Advisors, LLC (“HL Advisors”), an indirect wholly owned subsidiary of The Hartford Financial Services Group, Inc. (“The Hartford”), serves as investment manager to the Fund pursuant to an Investment Management Agreement with the Company. As investment manager, HL Advisors has overall investment supervisory responsibility for the Fund. In addition, HL Advisors provides administrative personnel, services, equipment, facilities and office space for proper operation of the Fund. HL Advisors has contracted with Hartford Investment Management Company (“Hartford Investment Management”) under a sub-advisory agreement for the provision of day-to-day investment management services to the Fund in accordance with the Fund’s investment objective |
and policies. The Fund pays a fee to HL Advisors, a portion of which may be used to compensate Hartford Investment Management.
The schedule below reflects the rates of compensation paid to HL Advisors for investment management services rendered as of December 31, 2011; the rates are accrued daily and paid monthly.
| Average Daily Net Assets | Annual Fee |
| On first $250 million | 0.5250% |
| On next $250 million | 0.5000% |
| On next $500 million | 0.4750% |
| On next $4 billion | 0.4500% |
| On next $5 billion | 0.4300% |
| Over $10 billion | 0.4200% |
Effective March 1, 2012, HL Advisors will be paid compensation for investment management services according to the following schedule:
| Average Daily Net Assets | Annual Fee |
| On first $250 million | 0.5250% |
| On next $250 million | 0.5000% |
| On next $500 million | 0.4750% |
| On next $1.5 billion | 0.4500% |
| On next $2.5 billion | 0.4450% |
| On next $5 billion | 0.4300% |
| Over $10 billion | 0.4200% |
| b) | Accounting Services Agreement – Pursuant to the Fund Accounting Agreement between HLIC and the Company, on behalf of the Fund, HLIC provides accounting services to the Fund and receives monthly compensation based on the Fund’s average daily net assets at the rates set forth below. The Fund’s accounting services fees are accrued daily and paid monthly. |
| Average Daily Net Assets | Annual Fee |
| On first $5 billion | 0.018% |
| On next $5 billion | 0.016% |
| Over $10 billion | 0.014% |
Effective January 1, 2012, the accounting services fees based on the Fund’s average daily net assets were increased. The new accounting services fees schedule is as follows:
| Average Daily Net Assets | Annual Fee |
| On first $5 billion | 0.020% |
| On next $5 billion | 0.018% |
| Over $10 billion | 0.016% |
| c) | Operating Expenses – Allocable expenses incurred by the Company are allocated to each Fund and allocated to classes within a Fund in proportion to the average daily net assets of the Fund and each class, except where allocation of certain expenses is more fairly made directly to the Fund or to specific classes within a Fund. |
Hartford Total Return Bond HLS Fund
Notes to Financial Statements – (continued)
December 31, 2011
(000’s Omitted)
| d) | Fees Paid Indirectly – The Fund’s custodian bank has agreed to reduce its fees when the Fund maintains cash on deposit in a non-interest-bearing custody account. For the year ended December 31, 2011, these amounts, if any, are included in the Statement of Operations. |
The ratio of expenses to average net assets in the accompanying financial highlights excludes the reduction in expenses related to fees paid indirectly. The annualized expense ratio for the period listed below reflecting the reduction for fees paid indirectly is as follows:
| | | Year Ended
December 31, 2011 | |
| Class IA | | | 0.49 | % |
| Class IB | | | 0.74 | |
| e) | Distribution Plan for Class IB shares – The Company, on behalf of the Fund, has adopted a Distribution Plan pursuant to Rule 12b-1 of the 1940 Act to compensate the Distributor, Hartford Securities Distribution Company, Inc. (a wholly owned, ultimate subsidiary of The Hartford), from assets attributable to the Class IB shares for services rendered and expenses borne in connection with activities primarily intended to result in the sale of the Class IB shares, subject to the review and approval of the Company’s Board of Directors. |
The Distribution Plan provides that the Fund may pay annually up to 0.25% of the average daily net assets of the Fund attributable to its Class IB shares for activities primarily intended to result in the sale of Class IB shares. The Board has the authority to suspend or reduce these payments at any point in time. Under the terms of the Distribution Plan and the principal underwriting agreement, the Fund is authorized to make payments monthly to the Distributor that may be used to pay or compensate entities providing distribution and shareholder servicing with respect to the Class IB shares for such entities’ fees or expenses incurred or paid in that regard. These fees are accrued daily and paid monthly.
| f) | Other Related Party Transactions – Certain officers of the Fund are directors and/or officers of HL Advisors and/or The Hartford or its subsidiaries. For the year ended December 31, 2011, a portion of the Fund’s chief compliance officer’s salary was paid by all the investment companies in the Hartford fund complex. The portion allocated to the Fund was in the amount of $6. Hartford Administrative Services Company (“HASCO”), an indirect wholly owned subsidiary of The Hartford, provides transfer agent services to the Fund. HASCO was compensated on a per account basis for providing such services. The amount paid to HASCO can be found in the Statement of Operations. These fees are accrued daily and paid monthly. |
| 8. | Investment Transactions: |
For the year ended December 31, 2011, the Fund's aggregate purchases and sales of investment securities (excluding short-term investments) were as follows:
| | | Amount | |
| Cost of Purchases Excluding U.S. Government Obligations | | $ | 3,418,449 | |
| Sales Proceeds Excluding U.S. Government Obligations | | | 3,295,935 | |
| Cost of Purchases for U.S. Government Obligations | | | 2,414,286 | |
| Sales Proceeds for U.S. Government Obligations | | | 2,854,798 | |
The Fund is one of several Hartford funds that participate in a $500 million committed revolving line of credit facility. The facility is to be used for temporary or emergency purposes. Under the arrangement, the funds are required to own securities having a market value in excess of 300% of the total bank borrowings. The interest rate on borrowings varies depending on the nature of the loan. The facility also requires a fee to be paid based on the amount of the commitment. This commitment
fee is allocated to all of the funds participating in the line of credit based on the average net assets of the funds. During the year ended December 31, 2011, the Fund did not have any borrowings under this facility.
| 10. | Industry Classifications: |
Other than the industry classifications “Other Investment Pools and Funds” and “Exchange Traded Funds,” equity industry classifications used in this report are the Global Industry Classification Standard, which was developed by and is the exclusive property and service mark of MSCI, Inc. and Standard & Poor’s.
Under the Company’s organizational documents, the Company shall indemnify its officers and directors to the full extent required or permitted under Maryland General Corporation Law and the federal securities laws. In addition, the Company, on behalf of the Fund, may enter into contracts that contain a variety of indemnifications. The Company’s maximum exposure under these arrangements is unknown. However, as of the date of these financial statements, the Company has not had prior claims or losses pursuant to these contracts and expects the risk of loss to be remote.
On November 21, 2011, the Board of Directors of the Company approved a change of sub-adviser for the Fund, a series of the Company, from Hartford Investment Management to Wellington Management. As part of this approval the Company’s Board of Directors approved a new sub-advisory agreement between HL Advisors and Wellington Management. The change in the Fund’s sub-adviser and implementation of the new sub-advisory agreement are expected to occur during the first quarter of 2012.
Hartford Total Return Bond HLS Fund
Financial Highlights
- Selected Per-Share Data (A) -
| Class | | Net Asset Value at Beginning of Period | | | Net Investment Income (Loss) | | | Payments from (to) Affiliate | | | Net Realized and Unrealized Gain (Loss) on Investments | | | Total from Investment Operations | | | Dividends from Net Investment Income | | | Distributions from Realized Capital Gains | | | Distributions from Capital | | | Total Distributions | | | Net Increase (Decrease) in Net Asset Value | | | Net Asset Value at End of Period | |
| For the Year Ended December 31, 2011 | | | | | | |
| IA | | $ | 10.90 | | | $ | 0.44 | | | $ | – | | | $ | 0.31 | | | $ | 0.75 | | | $ | (0.02 | ) | | | – | | | $ | – | | | $ | (0.02 | ) | | $ | 0.73 | | | $ | 11.63 | |
| IB | | | 10.84 | | | | 0.42 | | | | – | | | | 0.31 | | | | 0.73 | | | | (0.02 | ) | | | – | | | | – | | | | (0.02 | ) | | | 0.71 | | | | 11.55 | |
| For the Year Ended December 31, 2010 | | | | | | |
| IA | | | 10.58 | | | | 0.45 | | | | – | | | | 0.34 | | | | 0.79 | | | | (0.47 | ) | | | – | | | | – | | | | (0.47 | ) | | | 0.32 | | | | 10.90 | |
| IB | | | 10.53 | | | | 0.44 | | | | – | | | | 0.31 | | | | 0.75 | | | | (0.44 | ) | | | – | | | | – | | | | (0.44 | ) | | | 0.31 | | | | 10.84 | |
| For the Year Ended December 31, 2009 | | | | | | |
| IA | | | 9.54 | | | | 0.46 | | | | – | | | | 0.98 | | | | 1.44 | | | | (0.40 | ) | | | – | | | | – | | | | (0.40 | ) | | | 1.04 | | | | 10.58 | |
| IB | | | 9.50 | | | | 0.46 | | | | – | | | | 0.95 | | | | 1.41 | | | | (0.38 | ) | | | – | | | | – | | | | (0.38 | ) | | | 1.03 | | | | 10.53 | |
| For the Year Ended December 31, 2008 | | |
| IA | | | 11.15 | | | | 0.62 | | | | – | | | | (1.49 | ) | | | (0.87 | ) | | | (0.74 | ) | | | – | | | | – | | | | (0.74 | ) | | | (1.61 | ) | | | 9.54 | |
| IB | | | 11.09 | | | | 0.67 | | | | – | | | | (1.55 | ) | | | (0.88 | ) | | | (0.71 | ) | | | – | | | | – | | | | (0.71 | ) | | | (1.59 | ) | | | 9.50 | |
| For the Year Ended December 31, 2007(E) | | | | | | |
| IA | | | 11.24 | | | | 0.60 | | | | – | | | | (0.08 | ) | | | 0.52 | | | | (0.61 | ) | | | – | | | | – | | | | (0.61 | ) | | | (0.09 | ) | | | 11.15 | |
| IB | | | 11.19 | | | | 0.57 | | | | – | | | | (0.09 | ) | | | 0.48 | | | | (0.58 | ) | | | – | | | | – | | | | (0.58 | ) | | | (0.10 | ) | | | 11.09 | |
| (A) | Information presented relates to a share outstanding throughout the indicated period. |
| (B) | The figures do not include sales charges or other fees which may be applied at the variable life insurance, variable annuity or qualified retirement plan product level. Any such additional sales charges or other fees would lower the Fund's performance. |
| (C) | Ratios do not reflect reductions for fees paid indirectly. Please see Fees Paid Indirectly in the Notes to Financial Statements. |
| (D) | Portfolio turnover rate is calculated on the basis of the Fund as a whole without distinguishing between the classes of shares issued. |
| (E) | Per share amounts have been calculated using the average shares method. |
- l;- Ratios and Supplemental Data -
| Total Return(B) | | Net Assets at End of Period | | | Ratio of Expenses to Average Net Assets Before Waivers(C) | | | Ratio of Expenses to Average Net Assets After Waivers(C) | | | Ratio of Net Investment Income (Loss) to Average Net Assets | �� | | Portfolio Turnover Rate(D) | |
| |
| 6.99% | | $ | 3,718,609 | | | | 0.49 | % | | | 0.49 | % | | | 3.60 | % | | | 107 | % |
| 6.72 | | | 632,685 | | | | 0.74 | | | | 0.74 | | | | 3.35 | | | | – | |
| |
| 7.51 | | | 4,026,583 | | | | 0.50 | | | | 0.50 | | | | 3.90 | | | | 188 | |
| 7.25 | | | 722,317 | | | | 0.75 | | | | 0.75 | | | | 3.65 | | | | – | |
| |
| 15.01 | | | 3,902,957 | | | | 0.51 | | | | 0.51 | | | | 4.67 | | | | 215 | |
| 14.72 | | | 789,541 | | | | 0.76 | | | | 0.76 | | | | 4.42 | | | | – | |
| |
| (7.62) | | | 3,167,919 | | | | 0.49 | | | | 0.49 | | | | 5.54 | | | | 173 | |
| (7.85) | | | 740,580 | | | | 0.74 | | | | 0.74 | | | | 5.27 | | | | – | |
| |
| 4.67 | | | 3,458,709 | | | | 0.49 | | | | 0.49 | | | | 5.27 | | | | 223 | |
| 4.41 | | | 1,036,331 | | | | 0.74 | | | | 0.74 | | | | 5.01 | | | | – | |
| | | | | | | | | | | | | | | | | | | | | |
Report of Independent Registered Public Accounting Firm
The Board of Directors and Shareholders of
Hartford Series Fund, Inc.
We have audited the accompanying statement of assets and liabilities, including the schedule of investments, of Hartford Total Return Bond HLS Fund (one of the portfolios constituting Hartford Series Fund, Inc. (the Funds)) as of December 31, 2011, and the related statement of operations for the year then ended, the statements of changes in net assets for each of the two years in the period then ended, and the financial highlights for each of the five years in the period then ended. These financial statements and financial highlights are the responsibility of the Funds’ management. Our responsibility is to express an opinion on these financial statements and financial highlights based on our audits.
We conducted our audits in accordance with the standards of the Public Company Accounting Oversight Board (United States). Those standards require that we plan and perform the audit to obtain reasonable assurance about whether the financial statements and financial highlights are free of material misstatement. We were not engaged to perform an audit of the Funds’ internal control over financial reporting. Our audits included consideration of internal control over financial reporting as a basis for designing audit procedures that are appropriate in the circumstances, but not for the purpose of expressing an opinion on the effectiveness of the Funds’ internal control over financial reporting. Accordingly, we express no such opinion. An audit also includes examining, on a test basis, evidence supporting the amounts and disclosures in the financial statements and financial highlights, assessing the accounting principles used and significant estimates made by management, and evaluating the overall financial statement presentation. Our procedures included confirmation of securities owned as of December 31, 2011, by correspondence with the custodian, agent banks and brokers or by other appropriate auditing procedures where replies from agent banks and brokers were not received. We believe that our audits provide a reasonable basis for our opinion.
In our opinion, the financial statements and financial highlights referred to above present fairly, in all material respects, the financial position of Hartford Total Return Bond HLS Fund of Hartford Series Fund, Inc. at December 31, 2011, the results of its operations for the year then ended, the changes in its net assets for each of the two years in the period then ended, and the financial highlights for each of the five years in the period then ended, in conformity with U.S. generally accepted accounting principles.
|
Minneapolis, MN
February 13, 2012 |
Hartford Total Return Bond HLS Fund
Directors and Officers (Unaudited)
The Board of Directors of the Company appoints officers who are responsible for the day-to-day operations of the Fund and who execute policies formulated by the Directors. Each director serves until his or her death, resignation, or retirement or until the next annual meeting of shareholders is held or until his or her successor is elected and qualifies.
Directors and officers who are employed by or who have a financial interest in The Hartford are considered “interested” persons of the Fund pursuant to the 1940 Act. Each officer and two of the Company’s directors, as noted in the chart below, are “interested” persons of the Fund. Each director serves as a director for The Hartford Mutual Funds, Inc., The Hartford Mutual Funds II, Inc., Hartford Series Fund, Inc., Hartford HLS Series Fund II, Inc., and as a trustee for The Hartford Alternative Strategies Fund, which, as of December 31, 2011, collectively consist of 91 funds. Correspondence may be sent to directors and officers c/o Hartford Mutual Funds, P.O. Box 2999, Hartford, Connecticut 06104-2999, except that correspondence to Ms. Fagely may be sent to 500 Bielenberg Drive, Woodbury, Minnesota 55125.
The table below sets forth, for each director and officer, his or her name, year of birth, current position with the Company and date first elected or appointed to Hartford Series Fund, Inc. (“HSF”), and Hartford HLS Series Fund II, Inc. (“HSF2”), principal occupation, and, for directors, other directorships held. The Fund’s statement of additional information contains further information on the directors and is available free of charge by calling 1-800-862-6668 or writing to Hartford HLS Funds, c/o Individual Annuity Services, P.O. Box 5085, Hartford, CT 06102-5085.
Information on the aggregate remuneration paid to the directors of the Company can be found in the Statement of Operations herein. The Fund pays to The Hartford a portion of the chief compliance officer’s compensation, but does not pay salaries or compensation to any of their other officers or directors who are employed by The Hartford.
Non-Interested Directors
Lynn S. Birdsong (1946) Director since 2003, Co-Chairman of the Investment Committee
Mr. Birdsong is a private investor. Mr. Birdsong currently serves as a Director of the Sovereign High Yield Investment Company (April 2010 to current). Mr. Birdsong currently serves as an Independent Director of Nomura Partners Funds, Inc. (formerly, The Japan Fund) (March 2003 to current). From 2003 to March 2005, Mr. Birdsong was an independent director of the Atlantic Whitehall Funds. From 1979 to 2002, Mr. Birdsong was a managing director of Zurich Scudder Investments, an investment management firm. During his employment with Scudder, Mr. Birdsong was an Interested Director of The Japan Fund. Since 1981, Mr. Birdsong has been a partner in Birdsong Company, an advertising specialty firm.
Robert M. Gavin, Jr. (1940) Director since 2002 (HSF) and 1986 (HSF2), Chairman of the Board since 2004
Dr. Gavin is an educational consultant. Prior to September 1, 2001, he was President of Cranbrook Education Community and prior to July 1996, he was President of Macalester College, St. Paul, Minnesota.
Duane E. Hill (1945) Director since 2001 (HSF) and 2002 (HSF2), Chairman of the Nominating Committee
Mr. Hill is Partner of TSG Ventures L.P., a private equity investment company. Mr. Hill is a former partner of TSG Capital Group, a private equity investment firm that served as sponsor and lead investor in leveraged buyouts of middle market companies.
Sandra S. Jaffee (1941) Director since 2005
Ms. Jaffee served as Chairman (2008 to 2009) and Chief Executive Officer of Fortent (formerly Searchspace Group), a leading provider of compliance/regulatory technology to financial institutions from August 2005 to August 2009. From August 2004 to August 2005, Ms. Jaffee served as an Entrepreneur in Residence with Warburg Pincus, a private equity firm. From September 1995 to July 2004, Ms. Jaffee served as Executive Vice President at Citigroup, where she was President and Chief Executive Officer of Citibank’s Global Securities Services (1995 to 2003). Ms. Jaffe currently serves as a member of the Board of Directors of Broadridge Financial Solutions as well as a Trustee of Muhlenberg College.
William P. Johnston (1944) Director since 2005, Chairman of the Compliance Committee
In June 2006, Mr. Johnston was appointed as Senior Advisor to The Carlyle Group, a global private equity investment firm. In August 2007, Mr. Johnston was elected to the Board of Directors of LifeCare Holdings, Inc. In February 2008, Mr. Johnston was elected to the Board of Directors of HCR-ManorCare, Inc. In May 2006, Mr. Johnston was elected to the Supervisory Board of Fresenius Medical Care AG & Co. KGaA, after its acquisition of Renal Care Group, Inc. in March 2006. Mr. Johnston joined Renal Care Group in November 2002 as a member of the Board of Directors and served as Chairman of the Board from March 2003 through March 2006. Mr. Johnston served as a Director of MultiPlan, Inc. from July 2006 through August 2010. From September 1987 to December 2002, Mr. Johnston was with Equitable Securities Corporation (and its successors, SunTrust Equitable Securities and SunTrust Robinson Humphrey) serving in various investment banking and managerial positions, including Managing Director and Head of Investment Banking, Chief Executive Officer and Vice Chairman.
Hartford Total Return Bond HLS Fund
Directors and Officers (Unaudited) – (continued)
Phillip O. Peterson (1944) Director since 2002 (HSF) and 2000 (HSF2), Chairman of the Audit Committee
Mr. Peterson is a mutual fund industry consultant. He was a partner of KPMG LLP (an accounting firm) until July 1999. Mr. Peterson joined William Blair Funds in February 2007 as a member of the Board of Trustees. From January 2004 to April 2005, Mr. Peterson served as Independent President of the Strong Mutual Funds.
Lemma W. Senbet (1946) Director since 2005
Dr. Senbet is the William E. Mayer Chair Professor of Finance and Director, Center for Financial Policy, at the University of Maryland, Robert H. Smith School of Business. He was chair of the Finance Department from 1998 to 2006. Previously he was a chaired professor of finance at the University of Wisconsin-Madison. Also, he was director of the Fortis Funds from March 2000 to July 2002. Dr. Senbet served the finance profession in various capacities, including as director of the American Finance Association and President of the Western Finance Association. In 2006, Dr. Senbet was inducted Fellow of Financial Management Association International for his career-long distinguished scholarship and professional service.
Interested Directors and Officers
David N. Levenson (1966) Director since 2010
Mr. Levenson currently serves as President of The Hartford’s Wealth Management business. He was appointed to this role in July 2010. Previously, Mr. Levenson served as Executive Vice President of Legacy Holdings for The Hartford from June 2009 to July 2010. From 2006 to 2009, Mr. Levenson was with Hartford Life Insurance K.K. where he served as President and Chief Executive Officer from 2007 to 2009. He served as Managing Director of Hartford Investment Management Company from 2005 to 2006. Additionally, Mr. Levenson serves as Executive Vice President of The Hartford and as President, Director and Chief Executive Officer of Hartford Life Insurance Company (“HLIC”) and Hartford Life, Inc. (“HL Inc.”).
Lowndes A. Smith (1939) Director since 1996 (HSF) and 2002 (HSF2), Co-Chairman of the Investment Committee
Mr. Smith served as Vice Chairman of The Hartford from February 1997 to January 2002, as President and Chief Executive Officer of HL Inc. from February 1997 to January 2002, and as President and Chief Operating Officer of The Hartford Life Insurance Companies from January 1989 to January 2002. Mr. Smith serves as a Director of White Mountains Insurance Group, Ltd., One Beacon Insurance and Symetra Financial and as a Managing Director of Whittington Gray Associates.
Other Officers
James E. Davey (1964) President and Chief Executive Officer since 2010
Mr. Davey serves as Executive Vice President of HLIC. Additionally, Mr. Davey serves as President, Chief Executive Officer and Manager of Hartford Investment Financial Services, Inc. (“HIFSCO”) and President, Chief Executive Officer and Manager of HL Advisors. Mr. Davey joined The Hartford in 2002.
Michael R. Dressen (1963) AML Compliance Officer since 2011
Mr. Dressen currently serves as Assistant Vice President of HLIC. He also serves as Chief Compliance Officer and AML Compliance Officer of Hartford Administrative Services Company (“HASCO”) and as Assistant Secretary and Compliance Officer of HIFSCO. Mr Dressen joined The Hartford in 2005 from State Farm Insurance Companies where he held various positions related to mutual funds, variable products, and property casualty insurance.
Tamara L. Fagely (1958) Vice President, Treasurer and Controller since 2002 (HSF) and 1993 (HSF2)
Ms. Fagely has been a Vice President of HASCO since 1998 and Chief Financial Officer since 2006. Currently Ms. Fagely is a Vice President of HLIC. She served as Assistant Vice President of HLIC from December 2001 through March 2005. In addition, Ms. Fagely is Controller and Chief Financial Officer of HIFSCO.
Dr. Robert J. Froehlich (1953) Senior Managing Director since 2009
Dr. Froehlich joined The Hartford as Senior Managing Director in September 2009. Prior to joining The Hartford, Dr. Froehlich served as Vice Chairman of Deutsche Asset Management from 1997-2009.
Edward P. Macdonald (1967) Vice President, Secretary and Chief Legal Officer since 2005
Mr. Macdonald serves as Vice President of HLIC and Chief Legal Officer of Mutual Funds and Vice President of HIFSCO. He also serves as Vice President and Secretary of HASCO, and Chief Legal Officer, Secretary and Vice President of HL Advisors. Mr. Macdonald joined The Hartford in 2005.
Vernon J. Meyer (1964) Vice President since 2006
Mr. Meyer serves as Senior Vice President of HLIC. He also serves as Senior Vice President of HIFSCO and HL Advisors. Mr. Meyer joined The Hartford in 2004.
Colleen B. Pernerewski (1969) Vice President and Chief Compliance Officer since 2010
Ms. Pernerewski serves as Vice President and Chief Investment Advisor Compliance Officer of HIFSCO and as Vice President and Chief Compliance Officer of HL Advisors. Ms. Pernerewski joined The Hartford in 2005 from Travelers Life and Annuity where she served as Counsel (2004-2005). Prior to Travelers Life and Annuity, Ms. Pernerewski held the position of Counsel at The Hartford (1998-2004).
Elizabeth L. Schroeder (1966) Vice President since 2010
Ms. Schroeder currently serves as Assistant Vice President of HLIC. Ms. Schroeder joined HLIC in 1991. She is also an Assistant Vice President of HASCO, HIFSCO and HL Advisors.
Martin Swanson (1962) Vice President since 2010
Mr. Swanson is a Vice President of HLIC. Mr. Swanson also serves as Vice President/Marketing for HIFSCO. Prior to joining HLIC in 1998, Mr. Swanson was a Vice President at PaineWebber, Inc.
Jane Wolak (1961) Vice President since 2009
Ms. Wolak currently serves as Senior Vice President of HLIC. Ms. Wolak joined HLIC as Vice President, Retail Product Services in May 2007. She is also Vice President of HASCO. Previously, Ms. Wolak was with Sun Life Financial where she held the position of Vice President, Service Center Operations from 2001-2007.
HOW TO OBTAIN A COPY OF THE FUND’S PROXY VOTING POLICIES AND VOTING RECORDS (UNAUDITED)
A description of the policies and procedures that the Fund uses to determine how to vote proxies relating to portfolio securities and a record of how the Fund voted any proxies for the twelve-month period ended June 30, 2011 are available (1) without charge, upon request, by calling 800-862-6668 and (2) on the SEC’s website at http://www.sec.gov.
QUARTERLY PORTFOLIO HOLDINGS INFORMATION (UNAUDITED)
The Fund files a complete schedule of portfolio holdings with the SEC for the first and third quarters of each fiscal year on Form N-Q. The Fund’s Forms are available (1) without charge, upon request, by calling 800-862-6668 and (2) on the SEC’s website at http://www.sec.gov. The Form N-Q may be reviewed and copied at the SEC’s Public Reference Room in Washington, DC. Information on the operation of the Public Reference Room may be obtained by calling 1-800-SEC-0330.
Hartford Total Return Bond HLS Fund
Expense Example (Unaudited)
Your Fund's Expenses
As a shareholder of the Fund, you incur two types of costs: (1) transaction costs and (2) ongoing costs including investment management fees, distribution fees, and other fund expenses. This example is intended to help you understand your ongoing costs (in dollars) of investing in the Fund and to compare these costs with the ongoing costs of investing in other mutual funds. The example is based on an investment of $1,000 invested at the beginning of the period and held for the period of June 30, 2011 through December 31, 2011.
Actual Expenses
The first set of columns of the table below provides information about actual account values and actual expenses. You may use the information in this column, together with the amount you invested, to estimate the expenses that you paid over the period. Simply divide your account value by $1,000 (for example, an $8,600 account value divided by $1,000 = 8.6), then multiply the result by the number in the line under the heading entitled “Expenses Paid During Period” to estimate the expenses you paid on your account during this period.
Hypothetical Example for Comparison Purposes
The second set of columns of the table below provides information about hypothetical account values and hypothetical expenses based on the Fund’s actual expense ratio and an assumed rate of return of 5% per year before expenses, which is not the Fund’s actual return. The hypothetical account values and expenses may not be used to estimate the actual ending account balance or expenses you paid for the period. You may use this information to compare the ongoing costs of investing in the Fund and other funds. To do so, compare this 5% hypothetical example with the 5% hypothetical examples that appear in the shareholder reports of the other funds.
Please note that the expenses shown in the table are meant to highlight your ongoing costs only and do not reflect any transactional costs, such as sales charges (loads) and CDSC. Therefore, the second set of columns of the table is useful in comparing ongoing costs only, and will not help you determine the relative total costs of owning different funds. In addition, if these transactional costs were included, your costs would be higher. Expenses are equal to the Fund's annualized expense ratios multiplied by average account value over the period, multiplied by 184/365 (to reflect the one-half year period).
| | Actual return | Hypothetical (5% return before expenses) | | | |
| | Beginning
Account Value
June 30, 2011 | Ending Account Value
December 31, 2011 | Expenses paid
during the period
June 30, 2011
through
December 31, 2011 | Beginning
Account Value
June 30, 2011 | Ending Account Value
December 31, 2011 | Expenses paid during the period
June 30, 2011
through
December 31, 2011 | Annualized expense ratio | Days in the current 1/2 year | Days in the full year |
| Class IA | $1,000.00 | $1,041.19 | $2.52 | $1,000.00 | $1,022.74 | $2.50 | 0.49% | 184 | 365 |
| Class IB | $1,000.00 | $1,039.89 | $3.80 | $1,000.00 | $1,021.48 | $3.77 | 0.74% | 184 | 365 |
Hartford Total Return Bond HLS Fund
Approval of Investment Management and Investment Sub-Advisory Agreements (Unaudited)
Section 15(c) of the Investment Company Act of 1940, as amended (the “1940 Act”), requires that each mutual fund’s board of directors, including a majority of those directors who are not “interested persons” of the mutual fund, as defined in the 1940 Act (the “Independent Directors”), annually review and consider the continuation of the mutual fund’s investment advisory and sub-advisory agreements. At its meeting held on August 2-3, 2011, the Board of Directors (the “Board”) of Hartford Series Fund, Inc., including each of the Independent Directors, unanimously voted to approve the continuation of the investment management agreement for Hartford Total Return Bond HLS Fund (the “Fund”) with HL Investment Advisors, LLC (“HL Advisors”) and the continuation of the investment sub-advisory agreement between HL Advisors and the Fund’s sub-adviser, Hartford Investment Management Company (the “Sub-adviser,” and together with HL Advisors, the “Advisers”) (collectively, the “Agreements”).
In the months preceding the August 2-3, 2011 meeting, the Board requested, received, and reviewed written responses from the Advisers to questions posed to them on behalf of the Independent Directors and supporting materials relating to those questions and responses. The Board considered information furnished to the Board at its meetings throughout the year, as well as information specifically prepared in connection with the annual approval of the Agreements at the Board’s meetings held on June 21-22, 2011 and August 2-3, 2011. Information provided to the Board at its meetings throughout the year included, among other things, reports on Fund performance, legal and compliance matters, sales and marketing activity, shareholder services, and the other services provided to the Fund by the Advisers and their affiliates. In addition, the Board received in-person presentations by Fund officers and representatives of HL Advisors at the Board’s meetings on June 21-22, 2011 and August 2-3, 2011 concerning the Agreements.
The Independent Directors, advised by independent legal counsel, engaged two service providers to assist them with evaluating the Agreements with respect to the Fund. Lipper Inc. (“Lipper”), an independent provider of investment company data, was retained to provide the Board with reports on how the Fund’s contractual management fees, actual management fees, other non-management fees, overall expense ratios and investment performance compared to those of mutual funds with similar investment objectives. The Independent Directors also engaged an independent financial services consulting firm (the “Consultant”) to assist them in evaluating the Fund’s management fees, sub-advisory fees, other non-management fees, overall expense ratios and investment performance. In addition, the Consultant reviewed the profitability calculations utilized by HL Advisors in connection with the continuation of the investment management agreement.
In determining to continue the Agreements for the Fund, the members of the Board reviewed and evaluated information and factors they believed to be relevant and appropriate in light of the information that the Board deemed necessary and appropriate through the exercise of their reasonable business judgment. While individual members of the Board may have weighed certain factors differently, the Board’s determination to continue the Agreements was based on a comprehensive consideration of all information provided to the Board throughout the year and specifically with respect to the continuation of the Agreements. A more detailed discussion of the factors the Board considered with respect to its approval of the Agreements is provided below.
Nature, Extent, And Quality Of Services Provided by the Advisers
The Board requested and considered information concerning the nature, extent, and quality of the services provided to the Fund by the Advisers. The Board considered, among other things, the terms of the Agreements and the range of services provided by the Advisers. The Board considered the Advisers’ professional personnel who provide services to the Fund, including each Adviser’s ability and experience in attracting and retaining qualified personnel to service the Fund. The Board considered each Adviser’s reputation and overall financial strength, as well as its willingness to consider and implement organizational and operational changes designed to improve services to the Fund. In addition, the Board considered the quality of each Adviser’s communications with the Board and responsiveness to Board inquiries.
The Board also requested and evaluated information concerning each Adviser’s regulatory and compliance environment. In this regard, the Board requested and reviewed information on each Adviser’s compliance policies and procedures, compliance history, and a report from the Fund’s Chief Compliance Officer on each Adviser’s compliance with applicable laws and regulations, including responses to regulatory developments and compliance issues raised by regulators. The Board also noted the Advisers’ support of the Fund’s compliance control structure, particularly the resources devoted by the Advisers in support of the Fund’s obligations pursuant to Rule 38a-1 under the 1940 Act.
Hartford Total Return Bond HLS Fund
Approval of Investment Management and Investment Sub-Advisory Agreements (Unaudited)
With respect to HL Advisors, the Board noted that under the Agreements, HL Advisors is responsible for the management of the Fund, including overseeing fund operations and service providers, as well as investment advisory services in connection with selecting, monitoring and supervising the Sub-adviser. The Board considered HL Advisors’ ongoing monitoring of people, process and performance, including its quarterly reviews of each of the Hartford HLS Funds, semi-annual meetings with the leaders of each Fund’s portfolio management team, and oversight of the Funds’ 49 portfolio managers. The Board recognized that HL Advisors has demonstrated a record of making changes to the management and/or strategies of the Funds when warranted. The Board considered HL Advisors’ oversight of the Sub-adviser’s investment approach and results, process for monitoring best execution of portfolio trades by the Sub-adviser, and approach to risk management with respect to the Fund and the service providers to the Fund. The Board also considered HL Advisors’ oversight of compliance with the Fund’s objective and policies as well as with applicable laws and regulations, noting that regulatory and other developments had over time led to an increase in the scope of HL Advisors’ services in this regard. In addition, the Board considered HL Advisors’ ongoing commitment to review and rationalize the Hartford fund family’s product line-up and the expenses that HL Advisors had incurred in connection with fund combinations in recent years. The Board considered that HL Advisors or its affiliates are responsible for providing the Fund’s officers. The Board also noted that Hartford Life Insurance Company (“HLIC”) provides administrative services to the Fund. The Board considered its experiences with HL Advisors and HLIC with respect to each of these services.
With respect to the Sub-adviser, who provides day-to-day portfolio management services, the Board considered the quality of the Fund’s portfolio managers, the Sub-adviser’s other investment personnel, its investment philosophy and process, investment research capabilities and resources, performance record, trade execution capabilities and experience. The Board considered the experience of the Fund’s portfolio managers, the number of accounts managed by the portfolio managers, and the Sub-adviser’s method for compensating the portfolio managers. The Board considered the recent changes to the Fund’s portfolio management team.
Based on these considerations, the Board concluded that it was satisfied with the nature, extent and quality of the services provided to the Fund by HL Advisors and the Sub-adviser.
Performance of the Fund and the Advisers
The Board considered the investment performance of the Fund. In this regard, the Board reviewed the performance of the Fund over different time periods presented in the materials and evaluated HL Advisors’ analysis of the Fund’s performance for these time periods. The Board considered information and materials provided to the Board by the Advisers concerning Fund performance, as well as information from Lipper comparing the investment performance of the Fund to an appropriate benchmark and universe of peer funds. The Board noted that the performance of the Fund was within expectations.
The Board considered the detailed investment analytics reports provided by The Hartford’s Investment Advisory Group throughout the year. These reports include, among other things, information on the Fund’s gross and net returns, the Fund’s investment performance relative to an appropriate benchmark and peer group, various statistics concerning the Fund’s portfolio, and a narrative summary of various factors affecting Fund performance. The Board considered the Advisers’ cooperation with the Investment Committee, which assists the Board in evaluating the performance of the Fund at periodic meetings throughout the year. The Board also considered the analysis provided by the Consultant relating to the Fund’s performance track record.
In light of all the considerations noted above, the Board concluded that it had continued confidence in HL Advisors’ and the Sub-adviser’s overall capabilities to manage the Fund.
Costs of the Services and Profitability of the Advisers
The Board reviewed information regarding HL Advisors’ cost to provide investment management and related services to the Fund and HL Advisors’ profitability, both overall and for the Fund, on a pre-tax basis without regard to distribution expenses. The Board also requested and reviewed information about the profitability to HL Advisors and its affiliates from all services provided to the Fund and all aspects of their relationship with the Fund. The Board noted that the fees payable to the Sub-adviser are equal to its estimated costs in providing sub-advisory services. Accordingly, the costs and profitability for the Sub-adviser and HL Advisors were considered in the aggregate.
The Board considered the Consultant’s review of the profitability calculations utilized by HL Advisors in connection with the continuation of the investment management agreement. In this regard, the Consultant reported that The Hartford’s process for calculating and reporting Fund profitability is reasonable, sound and well within common industry practice.
Based on these considerations, the Board concluded that the profits anticipated to be realized by the Advisers and their affiliates from their relationships with the Fund would not be excessive.
Comparison of Fees and Services Provided by the Advisers
The Board considered comparative information with respect to the management fees to be paid by the Fund to HL Advisors and the total expense ratios of the Fund. The Board also considered comparative information with respect to the sub-advisory fees to be paid by HL Advisors to the Sub-adviser, to the extent applicable. In this regard, the Board requested and reviewed information from HL Advisors and the Sub-adviser relating to the management and sub-advisory fees and total operating expenses for the Fund. The Board considered that the management fee for the Fund includes the fee paid to HLIC for providing certain administrative services to the Fund. The Board also reviewed information from Lipper comparing the Fund’s contractual management fees, actual management fees and overall expense ratios relative to a group of funds selected by Lipper, in consultation with the Consultant, and a broader universe of funds selected by Lipper.
While the Board recognized that comparisons between the Fund and peer funds are imprecise, given the differing service levels and characteristics of mutual funds and the different business models and cost structures of the Advisers, the comparative information provided by Lipper assisted the Board in evaluating the reasonableness of the Fund’s management and sub-advisory fees and total operating expenses. In addition, the Board considered the analysis and recommendations of the Consultant relating to the Fund’s management and sub-advisory fees and total operating expenses.
Based on these considerations, the Board concluded that the Fund’s fees and total operating expenses, in conjunction with the information about quality of services, profitability, economies of scale, and other matters discussed, were reasonable in light of the services provided.
Economies of Scale
The Board requested and considered information regarding the Advisers’ realization of economies of scale with respect to the Fund and whether the fee levels reflect these economies of scale for the benefit of the Fund’s investors. With respect to HL Advisors, the Board considered representations from HL Advisors that it is difficult to anticipate whether and to what extent economies may be realized by HL Advisors as assets grow over time. The Board reviewed the breakpoints in the management fee schedule for the Fund, which reduces fee rates as Fund assets grow over time. The Board recognized that a fund with assets beyond the last breakpoint level will continue to benefit from economies of scale because additional assets are charged the lowest breakpoint fee resulting in lower overall effective management fee rates. The Board also recognized that a fee schedule that reaches a lower breakpoint quickly provides shareholders with the benefit of anticipated or potential economies of scale.
The Board reviewed and evaluated materials from Lipper showing how management fee schedules of peer funds reflect economies of scale for the benefit of investors as a peer fund’s assets hypothetically increase over time. Based on information provided by HL Advisors, Lipper, and the Consultant, the Board recognized that there is no uniform methodology for establishing breakpoints or uniform pattern in asset levels that trigger breakpoints or the amounts of breakpoints triggered.
After considering all of the information available to it, the Board concluded that it was satisfied with the extent to which economies of scale would be shared for the benefit of the Fund’s shareholders based on currently available information and the effective advisory fees and expense ratios for the Fund at its current and reasonably anticipated asset levels. The Board noted, however, that it would continue to monitor future growth in Fund assets and the appropriateness of additional breakpoints.
Other Benefits
The Board considered other benefits to the Advisers and their affiliates from their relationships with the Fund, including the role of the Fund in supporting the variable life insurance and variable annuity products offered by The Hartford. The Board reviewed information noting that HLIC, an affiliate of HL Advisors, receives fees for providing certain administrative services to the Fund, and that HLIC also receives fees for fund accounting and related services from the Fund, and the Board considered information on
Hartford Total Return Bond HLS Fund
Approval of Investment Management and Investment Sub-Advisory Agreements (Unaudited)
expected profits to HLIC or its affiliates for such services. The Board also considered that Hartford Administrative Services Company (“HASCO”), the Fund’s transfer agent and an affiliate of HL Advisors, receives transfer agency compensation from the Fund, and the Board reviewed information on the expected profitability of the Fund’s transfer agency function to HASCO. The Board considered information provided by HASCO indicating that the transfer agent fees charged by HASCO to the Fund were fair and reasonable based on publicly available information.
The Board also considered that Hartford Securities Distribution Company, Inc., as principal underwriter of the Fund, receives 12b-1 fees from the Fund. The Board also noted that certain affiliates of HL Advisors distribute shares of the Fund and receive compensation in that connection.
The Board considered the benefits, if any, to the Sub-adviser from any use of the Fund’s brokerage commissions to obtain soft dollar research.
The Board considered the benefits to shareholders of being part of the Hartford family of funds. The Board considered HL Advisors’ efforts to provide investors in the family with a broad range of investment styles and asset classes.
* * * *
Based upon its review of these various factors, among others, the Board concluded that it is in the best interests of the Fund and its shareholders for the Board to approve the Agreements for an additional year. In reaching this decision, the Board did not assign relative weights to the factors discussed above or deem any one or group of them to be controlling in and of themselves. In connection with their deliberations, the Independent Directors met separately in executive session on several occasions, with independent legal counsel, to review the relevant materials and consider their responsibilities under relevant laws and regulations.
Section 15(c) of the Investment Company Act of 1940, as amended (the “1940 Act”), requires that each mutual fund’s board of directors, including a majority of those directors who are not “interested persons” of the mutual fund, as defined in the 1940 Act (the “Independent Directors”), initially approve, and annually review and consider the continuation of, the mutual fund’s investment sub-advisory agreement(s). At its meeting held on November 21, 2011, the Board of Directors (the “Board”) of Hartford Series Fund, Inc., including each of the Independent Directors, unanimously voted to approve an investment sub-advisory agreement for Hartford Total Return Bond HLS Fund (the “Fund”) between HL Investment Advisors, LLC (“HL Advisors”), the Fund’s investment manager, and Wellington Management Company, LLP (“Wellington Management”) (the “Agreement”). The Agreement is expected to go into effect in the first quarter of 2012.
Prior to approving the Agreement, the Board requested, received, and reviewed written responses from HL Advisors and Wellington Management to questions posed to them on behalf of the Independent Directors and supporting materials relating to those questions and responses (the “Adviser Materials”). In addition, the Board received an in-person presentation from Fund officers and representatives of HL Advisors about the proposal to replace Hartford Investment Management Company (“Hartford Investment Management”), the Fund’s current sub-adviser, with Wellington Management. The Board’s Investment Committee also met in person with members of the proposed portfolio management team for the Fund regarding the capabilities of Wellington Management and the associated benefits to the Fund and its shareholders. In addition, the Board had previously received information with respect to Wellington Management in connection with Wellington Management’s re-approval on August 2-3, 2011 as the sub-adviser to certain other Hartford-sponsored funds.
In determining to approve the Agreement for the Fund, the members of the Board reviewed and evaluated information and factors they believed to be relevant and appropriate in light of the information that the Board deemed necessary and appropriate through the exercise of their reasonable business judgment. While individual members of the Board may have weighed certain factors differently, the Board’s determination to approve the Agreement was based on a comprehensive consideration of all information provided to the Board with respect to the approval of the Agreement. A more detailed discussion of the factors the Board considered with respect to its approval of the Agreement is provided below.
Nature, Extent, And Quality Of Services to be Provided by Wellington Management
The Board requested and considered information concerning the nature, extent, and quality of the services to be provided to the Fund by Wellington Management. The Board considered, among other things, the terms of the Agreement, the range of services to be provided, and Wellington Management’s organizational structure, systems and personnel. The Board also considered Wellington Management’s reputation and overall financial strength, and the Board’s past experience with Wellington Management as sub-adviser for other Hartford-sponsored funds. The Board considered the terms of the “preferred partnership” arrangement pursuant to which Wellington Management would serve as the preferred sub-adviser to the Hartford-sponsored funds, including the benefits of the arrangement for the Fund and other Hartford-sponsored funds.
With respect to Wellington Management’s fixed income capabilities, the Board considered that HL Advisors believes that Wellington Management is a high quality fixed income manager with greater depth and breadth relative to Hartford Investment Management and other peer advisory firms and that Wellington Management has strong investment capabilities with expertise across various investment disciplines. The Board also considered Wellington Management’s global fixed income capabilities, including the number and geographic locations of Wellington Management’s investment personnel. The Board noted that during the past ten years, Wellington Management had been committed to supporting the growth of its fixed income teams by allocating additional resources, personnel and technology to these teams, and also noted that Wellington Management is focused entirely on third-party asset management and has experience managing assets for a diverse set of clients, including fixed income mutual funds, with different objectives and guidelines. In addition, the Board considered Wellington Management’s risk management systems, noting that they are embedded within the firm’s fixed income process.
With respect to the day-to-day portfolio management services to be provided by Wellington Management, the Board considered the Investment Committee’s meeting with members of the proposed portfolio management team, and Wellington Management’s investment philosophy and process, investment research capabilities and resources, performance record, trade execution capabilities and experience. The Board also considered the experience of the proposed portfolio management team. The Board considered that HL Advisors and Wellington Management proposed certain changes to the Fund’s principal investment strategy in connection with the sub-adviser change.
Hartford Total Return Bond HLS Fund
Approval of Investment Management and Investment Sub-Advisory Agreements (Unaudited) – (continued)
The Board also considered information previously provided by HL Advisors and Wellington Management regarding Wellington Management’s compliance policies and procedures and compliance history, and received a representation from HL Advisors that the written compliance policies and procedures of Wellington Management are reasonably designed to prevent violations of the federal securities laws.
In considering this information, the Board evaluated not only the information presented to the Board and the Investment Committee in connection with its consideration of the Agreement, but also the Board’s experience through past interactions with Wellington Management. Based on these considerations, the Board concluded that it was satisfied with the nature, extent and quality of the services to be provided to the Fund by Wellington Management.
Performance of Wellington Management
The Board considered the investment performance of Wellington Management, including the performance of Wellington Management’s composite for accounts with substantially similar investment objectives, policies and principal investment strategies to one or more components of the Fund’s principal investment strategy. The Board noted that the performance of the relevant Wellington Management composite was favorable when compared to the Fund’s performance under Hartford Investment Management and to the Fund’s benchmark. HL Advisors and Wellington Management also provided additional information about the broad range of the portfolio management team’s investment experience and their investment philosophy and process.
Based on these considerations, the Board concluded that it was satisfied that Wellington Management has the capability of providing satisfactory investment performance for the Fund.
Costs of the Services and Profitability of HL Advisors and Wellington Management
The Board reviewed information regarding HL Advisors’ cost to provide investment management and related services to the Fund and the estimated profitability to HL Advisors and its affiliates from all services provided to the Fund and all aspects of their relationship with the Fund both under the sub-advisory arrangement with Hartford Investment Management and assuming implementation of the Agreement with Wellington Management. The Board also requested and received information relating to the operations and profitability of Wellington Management.
Based on these considerations, the Board concluded that the profits anticipated to be realized by HL Advisors, Wellington Management and their affiliates from their relationships with the Fund would not be excessive.
Comparison of Fees and Services
With respect to the sub-advisory fee schedule to be paid to Wellington Management by HL Advisors in respect of the Fund, the Board considered comparative fee information with respect to the sub-advisory fees to be paid by HL Advisors to Wellington Management. The Board also considered information provided by Wellington Management to the Investment Committee of the Board about the quality of services to be performed for the Fund and Wellington Management’s investment philosophy. In addition, the Board considered HL Advisors’ representation that it had negotiated Wellington Management’s fees at arm’s length.
The Board considered that, in connection with the sub-adviser change, HL Advisors was proposing to add an additional breakpoint to the Fund’s contractual management fee schedule with HL Advisors that would result in a management fee reduction at certain asset levels. The Board noted that HL Advisors, not the Fund, would pay the sub-advisory fees to Wellington Management.
Based on these considerations, the Board concluded that the Fund’s proposed sub-advisory fees, in conjunction with the information about quality of services, profitability, economies of scale, and other matters discussed, were reasonable in light of the services to be provided.
Economies of Scale
The Board considered the extent to which economies of scale would be realized as the Fund grows and whether the fee levels reflect these economies of scale for the benefit of the Fund’s shareholders. The Board reviewed the breakpoints in the management fee schedule for the Fund, which reduce fee rates as Fund assets grow over time. The Board noted HL Advisors’ proposal to add an additional breakpoint to the Fund’s management fee schedule in connection with the sub-adviser change, thereby reducing fee rates above certain asset levels.
The Board reviewed relevant information included in the Adviser Materials regarding comparative breakpoint information for other funds in the Fund’s Lipper peer group. Based on these considerations, the Board concluded that it was satisfied with the extent to which economies of scale would be shared for the benefit of the Fund’s shareholders based on currently available information and the effective advisory fees and expense ratios for the Fund at its current and reasonably anticipated asset levels. The Board noted, however, that it would review future growth in Fund assets and the appropriateness of the breakpoints as part of its future annual review of the Agreement and the investment management agreement between the Fund and HL Advisors.
Other Benefits
The Board considered other benefits to Wellington Management and its affiliates from their relationships with the Fund. The Board also considered the benefits, if any, to Wellington Management from any use of the Fund’s brokerage commissions to obtain soft dollar research, and representations from HL Advisors and Wellington Management that Wellington Management would not make any revenue-sharing payments or any other type of distribution payments to HL Advisors or its affiliates.
* * * *
Based upon its review of these various factors, among others, the Board concluded that it is in the best interests of the Fund and its shareholders for the Board to approve the Agreement. In reaching this decision, the Board did not assign relative weights to the factors discussed above or deem any one or group of them to be controlling in and of themselves. In connection with their deliberations, the Independent Directors met separately in executive session, with independent legal counsel, to review the relevant materials and consider their responsibilities under relevant laws and regulations.
The Hartford
P.O. Box 5085
Hartford, CT 06102-5085
Hartford Series Fund, Inc. is underwritten and distributed by Hartford Securities Distribution Company, Inc.
"The Hartford" is The Hartford Financial Services Group, Inc. and its subsidiaries.
Hartford Series Fund, Inc. inception dates range from 1977 to date. Hartford Series Fund, Inc. is not a subsidiary of The Hartford but is underwritten, distributed by and advised by subsidiaries of The Hartford. Investments in Hartford Series Fund, Inc. are not guaranteed by The Hartford or any other entity.
You should carefully consider investment objectives, risks, and charges and expenses of Hartford HLS Funds before investing. This and other information can be found in the Fund’s prospectus or summary prospectus, which can be obtained by calling 800-862-6668. Please read them carefully before you invest or send money.
HLSAR-TRB11 2-12 109078 Printed in U.S.A ©2011 The Hartford, Hartford, CT 06115 | |

A MESSAGE FROM THE PRESIDENT
Dear Fellow Shareholders:
I want to take this opportunity to say thank you for investing in Hartford HLS Funds.
This has been a tumultuous year. In the beginning of 2011, we witnessed tension-fueled political uprisings in the already-volatile Middle East and North Africa region. We also watched as Japan dealt with a series of crises including a massive earthquake and subsequent tsunami. Yet, U.S. economic conditions continued to improve, with gains in consumer confidence and retail sales. During the first half of 2011, domestic, international, and world indices (as measured by the S&P 500, MSCI EAFE and MSCI World) were all up more than 5% through June, 30 2011.
The economic recovery, however, lost momentum in the second half of 2011. The employment and housing markets both remain extremely challenged. Investors continue to be concerned about the implications of the European sovereign debt crisis, as well as our own high levels of domestic debt. Fears that the European sovereign debt crisis could continue to drag down the global economy have weighed heavily on stocks.
Ongoing apprehension regarding the U.S. debt ceiling during the summer and the resulting downgrade of the U.S. sovereign credit rating by Standard & Poor’s also contributed to weaker investor confidence.
There are, however, some reasons to remain confident. Corporations have record levels of cash on their balance sheets—corporate cash has doubled in the past 10 years. In addition, U.S. gross domestic product expanded at a 2.5 percent annual rate in the third quarter according to the Commerce Department, as consumers and businesses set aside fears about the recovery and stepped up spending. Corporate earnings have also remained positive, with a majority of companies beating expectations each quarter this year. This momentum will hopefully continue into next year.
As we head into 2012, in light of the continued market volatility, now would be a good time to schedule a meeting with your financial advisor to examine your current investment strategy and determine whether you are on the right track.
| • | Does your fixed-income portfolio complement your equity portfolio? |
| • | Are you receiving diversified sources of income? |
| • | Is your portfolio still in line with your risk tolerance and investment time horizon? |
Talk to your advisor to see what changes you should make to address these concerns and opportunities.
Thank you again for investing with Hartford HLS Funds.
James Davey
President
Hartford HLS Funds
Hartford Value HLS Fund
Table of Contents
This report is prepared for the general information of contract owners and qualified retirement plan participants. It is not an offer of contracts or of qualified retirement plans. It should not be used in connection with any offer, except in conjunction with the appropriate product prospectus which contains all pertinent information including the applicable sales, administrative and other charges.
The views expressed in the Fund’s Manager Discussion under ‘‘Why did the Fund perform this way?’’ and ‘‘What is the outlook?’’ are views of the Fund’s sub-adviser and portfolio management team through the end of the period and are subject to change based on market and other conditions.
Hartford Value HLS Fund inception 04/30/2001
(sub-advised by Wellington Management Company, LLP)
Investment objective – Seeks long-term total return.
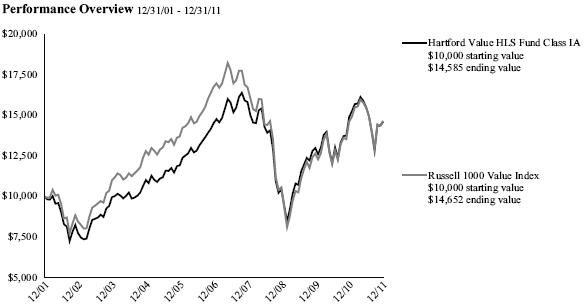
The chart above shows the growth of a $10,000 investment in Class IA. Growth results in classes other than Class IA will vary from what is seen above due to differences in the expenses charged to those share classes.
Average Annual Total Returns (as of 12/31/11)
| | 1 Year | 5 Year | 10 Year |
| Value IA | -1.96% | 0.10% | 3.85% |
| Value IB | -2.20% | -0.15% | 3.59% |
| Russell 1000 Value Index | 0.39% | -2.64% | 3.89% |
PAST PERFORMANCE IS NOT INDICATIVE OF FUTURE RESULTS.
Total returns presented above were calculated using the Fund's net asset value available to shareholders for sale or redemption of Fund shares on December 31, 2011, which may exclude investment transactions as of this date.
Russell 1000 Value Index is an unmanaged index measuring the performance of those Russell 1000 Index companies with lower price-to-book ratios and lower forecasted growth values. (The Russell 1000 Index is an unmanaged index that measures the performance of the 1,000 largest companies in the Russell 3000 Index, which measures the performance of the 3,000 largest U.S. companies, based on total market capitalizations.)
You cannot invest directly in an index.
The chart represents a hypothetical investment in the Fund. Performance data represents past performance and current performance could be higher or lower.
Performance information may reflect historical or current expense waivers/reimbursements from the investment adviser, without which performance would have been lower. For information on current expense waivers/reimbursements, please see the prospectus.
The value of the Fund will fluctuate so that when redeemed, it may be worth more or less than the original investment. The chart and table do not reflect the deductions of taxes, sales charges or other fees which may be applied at the variable life insurance, variable annuity or qualified retirement plan product level. Any such additional sales charges or other fees or expenses would lower the contract’s or plan’s performance.
Hartford Value HLS Fund
Manager Discussion (Unaudited)
December 31, 2011
| Portfolio Managers | | |
| Karen H. Grimes, CFA | W. Michael Reckmeyer, III, CFA | Ian R. Link, CFA |
| Senior Vice President | Senior Vice President | Director |
| | | |
How did the Fund perform?
The Class IA shares of the Hartford Value HLS Fund returned -1.96% for the twelve-month period ended December 31, 2011, underperforming its benchmark, the Russell 1000 Value Index, which returned 0.39% for the same period. The Fund also underperformed the -1.85% return of the average fund in the Lipper Large Cap Value VP-UF Funds peer group, a group of funds with investment strategies similar to those of the Fund.
Why did the Fund perform this way?
Equities ended the year on a strong note in the fourth quarter, resulting in modest positive returns for broad equity benchmarks for the full year. Calendar year 2011, however, was yet another volatile period for equity markets. After a good start in the first quarter, the middle two quarters were marked by material increases in both equity volatility and correlations among stocks, as investors shed risk and fled to safety during the period. In the final quarter, equity markets started to recover losses from earlier in the year, as investors’ outlook improved due to improving corporate and economic signs globally.
While accommodative economic policies supported equity markets at the start of 2011, this incremental optimism reversed course as concerns over the health of the global economy resurfaced, resulting in a rapid decline in equity markets. Fears about sovereign debt and insolvency in the eurozone, slowing economic expansion in China, and uncertainty over the sustainability of corporate earnings growth combined to produce an extremely volatile and negative stock market during much of the year. Markets ended the year on a positive note in the final quarter led by encouraging employment and manufacturing data in the U.S., and generally better-than-expected economic data.
In this environment, mid-cap (-2%) and small-cap stocks (-4%) underperformed their larger-cap (+2%) counterparts as represented by the S&P MidCap 400, Russell 2000, and S&P 500 indices, respectively. During the twelve-month period seven out of ten sectors rose within the Russell 1000 Value Index, led by Utilities (+19%), Health Care (+17%), and Consumer Staples (+14%). Financials (-17%) and Materials (-7%) lagged relative to other sectors.
The Fund’s underperformance versus its benchmark was due to weak stock selection and sector allocation. Stock selection was particularly weak in Health Care, Industrials, and Materials, offsetting strong stock selection in Financials and Energy. The Fund’s underweight (i.e. the Fund’s sector position was less than the benchmark position) to Utilities and overweight (i.e. the Fund’s sector position was greater than the benchmark position) to Materials also detracted from relative results. An underweight to Financials was additive.
Ingersoll-Rand (Industrials), Mosaic (Materials), and Cisco Systems (Information Technology) detracted most from benchmark-relative returns. Shares of industrial machinery, climate control, and security system provider Ingersoll-Rand declined as the residential segment was weak on higher copper prices and softening HVAC demand. Phosphate and potash fertilizer producer Mosaic saw its shares decline in response to the sharp sell-off in grain prices amid fears of a global recession. Shares of Cisco Systems, a leading supplier of networking equipment, were pressured by a sharp decline in gross margins, elevated competition, and weakness in the public sector segment. Top absolute (i.e. total return) performance detractors for the period also included Financials holdings Bank of America, Goldman Sachs, and JPMorgan.
Among the top contributors to benchmark-relative returns were Citigroup (Financials), Philip Morris International (Consumer Staples), and Buck Holdings-Dollar General (Consumer Discretionary). Not holding Citigroup contributed positively to relative performance. The company’s shares fell during the period as weakness continued in the securities/banking sector and the company reduced estimates on higher expenses. Philip Morris International, the largest tobacco company in the world, saw its shares outperform after the company reported better-than-expected quarterly earnings with strong results across all divisions. Buck Holdings-Dollar General, the discount retailer, continued to post solid performance in a trade-down economy. Top absolute contributors for the period also included Chevron (Energy) and Pfizer (Health Care).
What is the outlook?
Economic data in the United States improved in the fourth quarter. The U.S. unemployment rate fell to 8.6% in November, its lowest level since March 2009. Retail sales, housing, and consumer confidence data also trended positive
Hartford Value HLS Fund
Manager Discussion (Unaudited) – (continued)
December 31, 2011
in recent months. While economic growth is likely to remain tepid in 2012, this is discounted in valuations, in our view. We believe the biggest risk to U.S. markets remains a cataclysmic liquidity event in Europe that severely impacts global economic growth and confidence. We view this as a low probability event. However, U.S. markets were focused on Europe during much of 2011 – we expect this will remain a point of emphasis into 2012.
As always, we remain focused on analyzing each stock in our portfolio, and those we are considering for purchase, relative to a range of economic scenarios. We expect a continued modest economic expansion in the U.S., underpinned by falling inflation and only modest fiscal restraint. We believe the likelihood of a European recession is increasing, but we believe the U.S. can withstand this and continue its slow recovery.
While the coming environment is likely to be challenging in Europe, we believe that we are well-positioned for continuing global economic volatility. In part this is because volatility has created opportunities to gain exposure to great companies at very attractive prices. We are focused on positioning the portfolio in these attractively valued companies with improving outlooks while reducing exposure to those that do not discount a slowdown and that are not positioned for such an environment. As always, getting the earnings right will be critical and, as bottom-up investors, we have focused our attention and resources on that task.
Based on bottom-up stock decisions (i.e. stock by stock fundamental research), we ended the period most overweight the Materials, Industrials, and Consumer Discretionary sectors relative to the Russell 1000 Value Index; our largest underweights were in Utilities, Telecommunication Services, and Financials.
| Diversification by Industry |
| as of December 31, 2011 |
| Industry (Sector) | | Percentage of Net Assets | |
| Automobiles & Components (Consumer Discretionary) | | | 0.8 | % |
| Banks (Financials) | | | 7.2 | |
| Capital Goods (Industrials) | | | 10.5 | |
| Consumer Durables & Apparel (Consumer Discretionary) | | | 1.0 | |
| Diversified Financials (Financials) | | | 7.6 | |
| Energy (Energy) | | | 13.1 | |
| Food & Staples Retailing (Consumer Staples) | | | 1.9 | |
| Food, Beverage & Tobacco (Consumer Staples) | | | 6.3 | |
| Health Care Equipment & Services (Health Care) | | | 4.9 | |
| Insurance (Financials) | | | 8.2 | |
| Materials (Materials) | | | 5.9 | |
| Media (Consumer Discretionary) | | | 2.7 | |
| Pharmaceuticals, Biotechnology & Life Sciences (Health Care) | | | 8.4 | |
| Retailing (Consumer Discretionary) | | | 5.2 | |
| Semiconductors & Semiconductor Equipment (Information Technology) | | | 5.4 | |
| Software & Services (Information Technology) | | | 1.3 | |
| Technology Hardware & Equipment (Information Technology) | | | 1.9 | |
| Telecommunication Services (Services) | | | 3.1 | |
| Utilities (Utilities) | | | 4.0 | |
| Short-Term Investments | | | 0.5 | |
| Other Assets and Liabilities | | | 0.1 | |
| Total | | | 100.0 | % |
|
Hartford Value HLS Fund
Schedule of Investments
December 31, 2011
(000’s Omitted)
| Shares or Principal Amount | | Market Value ╪ | |
COMMON STOCKS - 99.4% | |
| | | | | Automobiles & Components - 0.8% | | | | |
| | 96 | | | General Motors Co. ● | | $ | 1,939 | |
| | 269 | | | Goodyear Tire & Rubber Co. ● | | | 3,808 | |
| | | | | | | | 5,747 | |
| | | | | Banks - 7.2% | | | | |
| | 256 | | | PNC Financial Services Group, Inc. | | | 14,750 | |
| | 432 | | | US Bancorp | | | 11,695 | |
| | 880 | | | Wells Fargo & Co. | | | 24,262 | |
| | | | | | | | 50,707 | |
| | | | | Capital Goods - 10.5% | | | | |
| | 75 | | | 3M Co. | | | 6,168 | |
| | 99 | | | Boeing Co. | | | 7,298 | |
| | 954 | | | General Electric Co. | | | 17,089 | |
| | 150 | | | Illinois Tool Works, Inc. | | | 7,019 | |
| | 248 | | | Ingersoll-Rand plc | | | 7,548 | |
| | 147 | | | PACCAR, Inc. | | | 5,491 | |
| | 171 | | | Stanley Black & Decker, Inc. | | | 11,549 | |
| | 245 | | | Tyco International Ltd. | | | 11,427 | |
| | | | | | | | 73,589 | |
| | | | | Consumer Durables & Apparel - 1.0% | | | | |
| | 260 | | | Mattel, Inc. | | | 7,231 | |
| | | | | | | | | |
| | | | | Diversified Financials - 7.6% | | | | |
| | 154 | | | Ameriprise Financial, Inc. | | | 7,643 | |
| | 685 | | | Bank of America Corp. | | | 3,809 | |
| | 59 | | | BlackRock, Inc. | | | 10,486 | |
| | 173 | | | Credit Suisse Group ADR | | | 4,057 | |
| | 90 | | | Goldman Sachs Group, Inc. | | | 8,117 | |
| | 588 | | | JP Morgan Chase & Co. | | | 19,537 | |
| | 230 | | | Solar Cayman Ltd. ⌂■●† | | | 21 | |
| | | | | | | | 53,670 | |
| | | | | Energy - 13.1% | | | | |
| | 66 | | | Apache Corp. | | | 5,977 | |
| | 140 | | | Baker Hughes, Inc. | | | 6,812 | |
| | 229 | | | Chevron Corp. | | | 24,351 | |
| | 52 | | | EOG Resources, Inc. | | | 5,119 | |
| | 132 | | | Exxon Mobil Corp. | | | 11,197 | |
| | 205 | | | Marathon Oil Corp. | | | 5,997 | |
| | 168 | | | Noble Corp. | | | 5,077 | |
| | 167 | | | Occidental Petroleum Corp. | | | 15,677 | |
| | 96 | | | Royal Dutch Shell plc ADR | | | 7,321 | |
| | 141 | | | Southwestern Energy Co. ● | | | 4,492 | |
| | | | | | | | 92,020 | |
| | | | | Food & Staples Retailing - 1.9% | | | | |
| | 256 | | | CVS Caremark Corp. | | | 10,431 | |
| | 98 | | | Sysco Corp. | | | 2,869 | |
| | | | | | | | 13,300 | |
| | | | | Food, Beverage & Tobacco - 6.3% | | | | |
| | 130 | | | Anheuser-Busch InBev N.V. | | | 7,956 | |
| | 123 | | | Archer Daniels Midland Co. | | | 3,531 | |
| | 158 | | | General Mills, Inc. | | | 6,392 | |
| | 195 | | | Kraft Foods, Inc. | | | 7,298 | |
| | 124 | | | PepsiCo, Inc. | | | 8,239 | |
| | 143 | | | Philip Morris International, Inc. | | | 11,226 | |
| | | | | | | | 44,642 | |
| | | | | Health Care Equipment & Services - 4.9% | | | | |
| | 125 | | | Baxter International, Inc. | | | 6,175 | |
| | 181 | | | Covidien plc • | | | 8,148 | |
| | 181 | | | HCA Holdings, Inc. ● | | | 3,986 | |
| | 228 | | | UnitedHealth Group, Inc. | | | 11,579 | |
| | 81 | | | Zimmer Holdings, Inc. ● | | | 4,351 | |
| | | | | | | | 34,239 | |
| | | | | Insurance - 8.2% | | | | |
| | 229 | | | ACE Ltd. | | | 16,044 | |
| | 153 | | | Chubb Corp. | | | 10,573 | |
| | 383 | | | Marsh & McLennan Cos., Inc. | | | 12,096 | |
| | 207 | | | Principal Financial Group, Inc. | | | 5,097 | |
| | 108 | | | Swiss Re Ltd. | | | 5,489 | |
| | 394 | | | Unum Group | | | 8,309 | |
| | | | | | | | 57,608 | |
| | | | | Materials - 5.9% | | | | |
| | 37 | | | CF Industries Holdings, Inc. | | | 5,322 | |
| | 288 | | | Dow Chemical Co. | | | 8,292 | |
| | 145 | | | E.I. DuPont de Nemours & Co. | | | 6,619 | |
| | 129 | | | Mosaic Co. | | | 6,527 | |
| | 91 | | | Nucor Corp. | | | 3,616 | |
| | 568 | | | Rexam plc | | | 3,107 | |
| | 59 | | | Rexam plc ADR | | | 1,618 | |
| | 485 | | | Steel Dynamics, Inc. | | | 6,376 | |
| | | | | | | | 41,477 | |
| | | | | Media - 2.7% | | | | |
| | 141 | | | CBS Corp. Class B | | | 3,832 | |
| | 639 | | | Comcast Corp. Class A | | | 15,161 | |
| | | | | | | | 18,993 | |
| | | | | Pharmaceuticals, Biotechnology & Life Sciences - 8.4% | | | | |
| | 100 | | | Abbott Laboratories | | | 5,643 | |
| | 136 | | | Amgen, Inc. | | | 8,704 | |
| | 113 | | | Johnson & Johnson | | | 7,406 | |
| | 353 | | | Merck & Co., Inc. | | | 13,311 | |
| | 746 | | | Pfizer, Inc. | | | 16,140 | |
| | 191 | | | Teva Pharmaceutical Industries Ltd. ADR | | | 7,726 | |
| | | | | | | | 58,930 | |
| | | | | Retailing - 5.2% | | | | |
| | 3,040 | | | Buck Holdings L.P. ⌂●† | | | 6,804 | |
| | 213 | | | Home Depot, Inc. | | | 8,942 | |
| | 125 | | | Kohl's Corp. | | | 6,187 | |
| | 178 | | | Lowe's Co., Inc. | | | 4,515 | |
| | 124 | | | Nordstrom, Inc. | | | 6,180 | |
| | 261 | | | Staples, Inc. | | | 3,627 | |
| | | | | | | | 36,255 | |
| | | | | Semiconductors & Semiconductor Equipment - 5.4% | | | | |
| | 216 | | | Analog Devices, Inc. | | | 7,723 | |
| | 644 | | | Intel Corp. | | | 15,620 | |
| | 255 | | | Maxim Integrated Products, Inc. | | | 6,629 | |
| | 254 | | | Xilinx, Inc. | | | 8,150 | |
| | | | | | | | 38,122 | |
| | | | | Software & Services - 1.3% | | | | |
| | 354 | | | Microsoft Corp. | | | 9,197 | |
| | | | | | | | | |
| | | | | Technology Hardware & Equipment - 1.9% | | | | |
| | 499 | | | Cisco Systems, Inc. | | | 9,026 | |
| | 180 | | | Hewlett-Packard Co. | | | 4,628 | |
| | | | | | | | 13,654 | |
| | | | | Telecommunication Services - 3.1% | | | | |
| | 715 | | | AT&T, Inc. | | | 21,624 | |
| | | | | | | | | |
| | | | | Utilities - 4.0% | | | | |
| | 168 | | | Edison International | | | 6,935 | |
| | 98 | | | Entergy Corp. | | | 7,181 | |
The accompanying notes are an integral part of these financial statements.
Hartford Value HLS Fund
Schedule of Investments – (continued)
December 31, 2011
(000’s Omitted)
| Shares or Principal Amount | | | Market Value ╪ | |
| COMMON STOCKS - 99.4% - (continued) | | | | |
| | | | | Utilities - 4.0% - (continued) | | | | |
| | 61 | | | NextEra Energy, Inc. | | $ | 3,712 | |
| | 204 | | | Northeast Utilities | | | 7,343 | |
| | 91 | | | PPL Corp. | | | 2,684 | |
| | | | | | | | 27,855 | |
| | | | | Total common stocks | | | | |
| | | | | (cost $644,471) | | $ | 698,860 | |
| | | | | | | | | |
| | | | | Total long-term investments
(cost $644,471) | | $ | 698,860 | |
| | | | | | | | | |
| | SHORT-TERM INVESTMENTS - 0.5% | | | | |
| | Repurchase Agreements - 0.5% | | | | |
| | | | | Bank of America Merrill Lynch TriParty Joint
Repurchase Agreement (maturing on
01/03/2012 in the amount of $1,262,
collateralized by GNMA 4.50%, 2041,
value of $1,288) | | | | |
| $ | 1,262 | | | 0.04%, 12/30/2011 | | $ | 1,262 | |
| | | | | Barclays Capital TriParty Joint Repurchase
Agreement (maturing on 01/03/2012 in the
amount of $105, collateralized by U.S.
Treasury Bond 5.38%, 2031, value of $107) | | | | |
| | 105 | | | 0.01%, 12/30/2011 | | | 105 | |
| | | | | Deutsche Bank Securities TriParty Joint
Repurchase Agreement (maturing on
01/03/2012 in the amount of $1,400,
collateralized by GNMA 3.50% - 7.00%,
2035 - 2046, value of $1,428) | | | | |
| | 1,400 | | | 0.06%, 12/30/2011 | | | 1,400 | |
| | | | | UBS Securities, Inc. Joint Repurchase
Agreement (maturing on 01/03/2012 in the
amount of $11, collateralized by U.S.
Treasury Note 2.75%, 2016, value of $11) | | | | |
| | 11 | | | 0.01%, 12/30/2011 | | | 11 | |
| | | | | UBS Securities, Inc. TriParty Joint Repurchase
Agreement (maturing on 01/03/2012 in the
amount of $542, collateralized by FNMA
3.00% - 6.50%, 2021 - 2041, value of $553) | | | | |
| | 542 | | | 0.04%, 12/30/2011 | | | 542 | |
| | | | | | | | 3,320 | |
| | | | | Total short-term investments | | | | |
| | | | | (cost $3,320) | | $ | 3,320 | |
| | | | | | | | | |
| | Total investments | | | | | | | | |
| | (cost $647,791) ▲ | | | 99.9 | % | | $ | 702,180 | |
| | Other assets and liabilities | | | 0.1 | % | | | 584 | |
| | Total net assets | | | 100.0 | % | | $ | 702,764 | |
| Note: | Percentage of investments as shown is the ratio of the total market value to total net assets. Market value of long-term investments in foreign securities represents 5.3% of total net assets at December 31, 2011. |
| | |
| | Prices of foreign equities that are principally traded on certain foreign markets may be adjusted daily pursuant to a fair value pricing service approved by the Board of Directors in order to reflect an adjustment for factors occurring after the close of certain foreign markets but before the close of the New York Stock Exchange. |
The accompanying notes are an integral part of these financial statements.
| ▲ | At December 31, 2011, the cost of securities for federal income tax purposes was $655,158 and the aggregate gross unrealized appreciation and depreciation based on that cost were: |
| | Unrealized Appreciation | | | 100,411 | |
| | Unrealized Depreciation | | | (53,389 | ) |
| | Net Unrealized Appreciation | | | 47,022 | |
| † | These securities were valued in good faith at fair value as determined under policies and procedures established by and under the supervision of the Company's Board of Directors. At December 31, 2011, the aggregate value of these securities was $6,825, which represents 1.0% of total net assets. This amount excludes securities that are principally traded in certain foreign markets and whose prices are adjusted pursuant to a third party pricing service methodology approved by the Board of Directors. |
| ■ | Securities issued within terms of a private placement memorandum, exempt from registration under Rule 144A under the Securities Act of 1933, as amended, and may be sold only to qualified institutional buyers. Unless otherwise indicated, these issues are determined to be liquid. At December 31, 2011, the aggregate value of these securities was $21, which rounds to zero percent of total net assets. |
| ⌂ | The following securities are considered illiquid. Illiquid securities are often purchased in private placement transactions, are often not registered under the Securities Act of 1933 and may have contractual restrictions on resale. A security may also be considered illiquid if the security lacks a readily available market or if its valuation has not changed for a certain period of time. |
| | Period Acquired | | Shares/ Par | | Security | | Cost Basis |
| | 06/2007 | | 3,040 | | Buck Holdings L.P. | | $ 1,800 |
| | 03/2007 | | 230 | | Solar Cayman Ltd. - 144A | | 67 |
At December 31, 2011, the aggregate value of these securities was $6,825, which represents 1.0% of total net assets.
| ╪ | See Significant Accounting Policies of accompanying Notes to Financial Statements regarding valuation of securities. |
The accompanying notes are an integral part of these financial statements.
Hartford Value HLS Fund
Investment Valuation Hierarchy Level Summary
December 31, 2011
(000’s Omitted)
| | | Total | | | Level 1 ♦ | | | Level 2 ♦ | | | Level 3 | |
| Assets: | | | | | | | | | | | | | | | | |
| Common Stocks ‡ | | $ | 698,860 | | | $ | 683,439 | | | $ | 8,596 | | | $ | 6,825 | |
| Short-Term Investments | | | 3,320 | | | | – | | | | 3,320 | | | | – | |
| Total | | $ | 702,180 | | | $ | 683,439 | | | $ | 11,916 | | | $ | 6,825 | |
| ♦ | For the year ended December 31, 2011, there were no significant transfers between Level 1 and Level 2. |
| ‡ | The Fund has all or primarily all of the equity securities categorized in a particular level. Refer to the Schedule of Investments for further industry breakout. |
Following is a reconciliation of Level 3 assets for which significant unobservable inputs were used to determine fair value:
| | | Balance as of December 31, 2010 | | | Realized Gain (Loss) | | | Change in Unrealized Appreciation (Depreciation) | | | Net Amortization | | | Purchases | | | Sales | | | Transfers
Into
Level 3 | | | Transfers Out of Level 3 | | | Balance as of December 31, 2011 | |
| Assets: | | | | | | | | | | | | | | | | | | | | | | | | | | | | | | | | | | | | |
| Common Stocks | | $ | 6,920 | | | $ | 1,671 | | | $ | 542 | * | | $ | — | | | $ | — | | | $ | (2,308 | ) | | $ | — | | | $ | — | | | $ | 6,825 | |
| Total | | $ | 6,920 | | | $ | 1,671 | | | $ | 542 | | | $ | — | | | $ | — | | | $ | (2,308 | ) | | $ | — | | | $ | — | | | $ | 6,825 | |
| * | Change in unrealized appreciation (depreciation) in the current period relating to assets still held at December 31, 2011 was $542. |
The accompanying notes are an integral part of these financial statements.
Hartford Value HLS Fund
Statement of Assets and Liabilities
December 31, 2011
(000’s Omitted)
| Assets: | | | | |
| Investments in securities, at market value (cost $647,791) | | $ | 702,180 | |
| Cash | | | 1 | |
| Receivables: | | | | |
| Fund shares sold | | | 81 | |
| Dividends and interest | | | 1,294 | |
| Total assets | | | 703,556 | |
| Liabilities: | | | | |
| Payables: | | | | |
| Fund shares redeemed | | | 623 | |
| Investment management fees | | | 113 | |
| Distribution fees | | | 6 | |
| Accrued expenses | | | 50 | |
| Total liabilities | | | 792 | |
| Net assets | | $ | 702,764 | |
| Summary of Net Assets: | | | | |
| Capital stock and paid-in-capital | | $ | 824,947 | |
| Undistributed net investment income | | | 796 | |
| Accumulated net realized loss | | | (177,368 | ) |
| Unrealized appreciation of investments | | | 54,389 | |
| Net assets | | $ | 702,764 | |
| Shares authorized | | | 800,000 | |
| Par value | | $ | 0.001 | |
| Class IA: Net asset value per share | | $ | 10.37 | |
| Shares outstanding | | | 57,021 | |
| Net assets | | $ | 591,278 | |
| Class IB: Net asset value per share | | $ | 10.36 | |
| Shares outstanding | | | 10,762 | |
| Net assets | | $ | 111,486 | |
The accompanying notes are an integral part of these financial statements.
Hartford Value HLS Fund
Statement of Operations
For the Year Ended December 31, 2011
(000’s Omitted)
| Investment Income: | | | | |
| Dividends | | $ | 19,166 | |
| Interest | | | 4 | |
| Less: Foreign tax withheld | | | (75 | ) |
| Total investment income, net | | | 19,095 | |
| | | | | |
| Expenses: | | | | |
| Investment management fees | | | 5,738 | |
| Transfer agent fees | | | — | |
| Distribution fees - Class IB | | | 327 | |
| Custodian fees | | | 8 | |
| Accounting services fees | | | 79 | |
| Board of Directors' fees | | | 19 | |
| Audit fees | | | 19 | |
| Other expenses | | | 116 | |
| Total expenses (before fees paid indirectly) | | | 6,306 | |
| Commission recapture | | | (7 | ) |
| Custodian fee offset | | | — | |
| Total fees paid indirectly | | | (7 | ) |
| Total expenses, net | | | 6,299 | |
| Net investment income | | | 12,796 | |
| | | | | |
| Net Realized Gain on Investments and Foreign Currency Transactions: | | | | |
| Net realized gain on investments | | | 29,884 | |
| Net realized gain on foreign currency contracts | | | 115 | |
| Net realized loss on other foreign currency transactions | | | (108 | ) |
| Net Realized Gain on Investments and Foreign Currency Transactions | | | 29,891 | |
| | | | | |
| Net Changes in Unrealized Depreciation of Investments: | | | | |
| Net unrealized depreciation of investments | | | (55,980 | ) |
| Net Changes in Unrealized Depreciation of Investments | | | (55,980 | ) |
| Net Loss on Investments and Foreign Currency Transactions | | | (26,089 | ) |
| Net Decrease in Net Assets Resulting from Operations | | $ | (13,293 | ) |
The accompanying notes are an integral part of these financial statements.
Hartford Value HLS Fund
Statement of Changes in Net Assets
(000’s Omitted)
| | | For the
Year Ended
December 31, 2011 | | | For the
Year Ended
December 31, 2010 | |
| Operations: | | | | | | | | |
| Net investment income | | $ | 12,796 | | | $ | 9,863 | |
| Net realized gain on investments and foreign currency transactions | | | 29,891 | | | | 49,485 | |
| Net unrealized appreciation (depreciation) of investments | | | (55,980 | ) | | | 25,336 | |
| Net Increase (Decrease) In Net Assets Resulting From Operations | | | (13,293 | ) | | | 84,684 | |
| Distributions to Shareholders: | | | | | | | | |
| From net investment income | | | | | | | | |
| Class IA | | | (10,698 | ) | | | (8,406 | ) |
| Class IB | | | (1,700 | ) | | | (1,444 | ) |
| Total distributions | | | (12,398 | ) | | | (9,850 | ) |
| Capital Share Transactions: | | | | | | | | |
| Class IA | | | | | | | | |
| Sold | | | 31,406 | | | | 58,470 | |
| Issued in merger | | | — | | | | 531,323 | |
| Issued on reinvestment of distributions | | | 10,698 | | | | 8,406 | |
| Redeemed | | | (170,093 | ) | | | (163,665 | ) |
| Total capital share transactions | | | (127,989 | ) | | | 434,534 | |
| Class IB | | | | | | | | |
| Sold | | | 12,495 | | | | 23,470 | |
| Issued in merger | | | — | | | | 97,765 | |
| Issued on reinvestment of distributions | | | 1,700 | | | | 1,444 | |
| Redeemed | | | (53,712 | ) | | | (43,998 | ) |
| Total capital share transactions | | | (39,517 | ) | | | 78,681 | |
| Net increase (decrease) from capital share transactions | | | (167,506 | ) | | | 513,215 | |
| Net Increase (Decrease) In Net Assets | | | (193,197 | ) | | | 588,049 | |
| Net Assets: | | | | | | | | |
| Beginning of period | | | 895,961 | | | | 307,912 | |
| End of period | | $ | 702,764 | | | $ | 895,961 | |
| Undistributed (distribution in excess of) | | | | | | | | |
| net investment income | | $ | 796 | | | $ | 735 | |
| Shares: | | | | | | | | |
| Class IA | | | | | | | | |
| Sold | | | 2,933 | | | | 5,916 | |
| Issued in merger | | | — | | | | 52,973 | |
| Issued on reinvestment of distributions | | | 1,040 | | | | 813 | |
| Redeemed | | | (15,762 | ) | | | (16,659 | ) |
| Total share activity | | | (11,789 | ) | | | 43,043 | |
| Class IB | | | | | | | | |
| Sold | | | 1,155 | | | | 2,336 | |
| Issued in merger | | | — | | | | 9,763 | |
| Issued on reinvestment of distributions | | | 166 | | | | 141 | |
| Redeemed | | | (4,943 | ) | | | (4,491 | ) |
| Total share activity | | | (3,622 | ) | | | 7,749 | |
The accompanying notes are an integral part of these financial statements.
Hartford Value HLS Fund
Notes to Financial Statements
December 31, 2011
(000’s Omitted)
Hartford Value HLS Fund (the “Fund”) serves as an underlying investment option for certain variable annuity and variable life insurance separate accounts of Hartford Life Insurance Company (“HLIC”) and its affiliates and certain qualified retirement plans. The Fund may also serve as an underlying investment option for certain variable annuity and variable life separate accounts of other insurance companies. Owners of variable annuity contracts and policyholders of variable life insurance contracts may choose the funds permitted in the variable insurance contract prospectus. In addition, participants in certain qualified retirement plans may choose the Fund if permitted by their plans.
Hartford Series Fund, Inc. (the “Company”) is an open-end registered management investment company comprised of thirty portfolios. Financial Statements for the Fund, a series of the Company, are included in this report.
The Company is organized under the laws of the State of Maryland and is registered with the Securities and Exchange Commission (“SEC”) under the Investment Company Act of 1940, as amended (“1940 Act”). The Fund is a diversified open-end management investment company.
The Fund is divided into Class IA and Class IB shares. Each class is offered at the per share net asset value (“NAV”) without a sales charge and is subject to the same expenses, except that the Class IB shares are subject to distribution and service fees charged pursuant to a Distribution Plan adopted in accordance with Rule 12b-1 under the 1940 Act.
| 2. | Significant Accounting Policies: |
The following is a summary of significant accounting policies of the Fund in the preparation of its financial statements, which are in accordance with the United States Generally Accepted Accounting Principles (“U.S. GAAP”). The preparation of financial statements in accordance with U.S. GAAP may require management to make estimates and assumptions that affect the reported amounts of assets and liabilities and disclosure of contingent assets and liabilities at the date of the financial statements and the reported amounts of increases and decreases in net assets from operations during the reporting period. Actual results could differ from those estimates.
| a) | Determination of Net Asset Value – The NAV of each class of the Fund’s shares is determined as of the close of regular trading (normally 4:00 p.m. Eastern Time) (the “NYSE Close”) on each day that the New York Stock Exchange (the “Exchange”) is open (“Valuation Date”). Information that becomes known to the Fund after the NAV has been calculated on a particular day will not generally be used to retroactively adjust the NAV determined earlier that day. |
| b) | Investment Valuation and Fair Value Measurements – For purposes of calculating the NAV, portfolio securities and other assets held by the Fund's portfolio for which market quotes are readily available are valued at market value. Market value is generally determined on the basis of last reported sales prices or official close price. If no sales are reported, market value is based on quotes obtained from a quotation reporting system, established market makers, or independent pricing services. If market prices are not readily available or are deemed unreliable, the Fund will use the fair value of the security as determined in good faith under policies and procedures established by and under the supervision of the Company’s Board of Directors. Market quotes are considered not readily available where there is an absence of current or reliable market-based data (e.g., trade information or broker quotes), including where events occur after the close of the relevant market, but prior to the NYSE Close that materially affect the values of the Fund’s portfolio securities or assets. In addition, market quotes are considered not readily available when, due to extraordinary circumstances, the exchanges or markets on which the securities trade do not open for trading for the entire day and no other market prices are available. In addition, prices of foreign equities that are principally traded on certain foreign markets are adjusted daily pursuant to a fair value pricing service approved by the Board of Directors in order to reflect an adjustment for the factors occurring after the close of certain foreign markets but before the NYSE Close. Securities that are primarily traded on foreign markets may trade on days that are not business days of the Fund. The value of the foreign securities in which the Fund invests may change on days when a shareholder will not be able to purchase or redeem shares of the Fund. Fair value pricing is subjective in nature and the use of fair value pricing by the Fund may cause the NAV of its |
shares to differ significantly from the NAV that would have been calculated using market prices at the close of the exchange on which a portfolio security is primarily traded. There can be no assurance that the Fund could obtain the fair market value assigned to a security if the Fund were to sell the security at approximately the time at which the Fund determines its NAV.
Investments valued in currencies other than U.S. dollars are converted to U.S. dollars using exchange rates obtained from independent pricing services for calculation of the NAV. As a result, the NAV of the Fund’s shares may be affected by changes in the value of currencies in relation to the U.S. dollar. The value of securities traded in markets outside the United States or denominated in currencies other than the U.S. dollar may be affected significantly on a day that the NYSE is closed and the market value may change on days when an investor is not able to purchase, redeem or exchange shares of the Fund.
Foreign currency contracts represent agreements to exchange currencies on specific future dates at predetermined rates. Foreign currency contracts are valued using foreign currency exchange rates and forward rates as provided by an independent pricing service on the Valuation Date.
Financial instruments for which prices are not available from an independent pricing service may be valued using market quotations obtained from one or more dealers that make markets in the respective financial instrument in accordance with procedures established by the Company’s Board of Directors.
U.S. GAAP defines fair value as the price that the Fund would receive to sell an asset or pay to transfer a liability in an orderly transaction between market participants. The U.S. GAAP fair value measurement standards require disclosure of a fair value hierarchy for each major category of assets and liabilities. Various inputs are used in determining the fair value of the Fund’s investments. These inputs are summarized into three broad hierarchy levels. This hierarchy is based on whether the valuation inputs are observable or unobservable. These levels are:
| · | Level 1 – Quoted prices in active markets for identical securities. Level 1 may include exchange traded instruments such as domestic equities, some foreign equities, options, futures, mutual funds, exchange traded funds, rights and warrants. |
| · | Level 2 – Observable inputs other than Level 1 prices, such as quoted prices for similar securities; quoted prices in markets that are not active; or other inputs that are observable or can be corroborated by observable market data. Level 2 may include debt securities that are traded less frequently than exchange traded instruments and which are valued using independent pricing services; foreign equities, that are principally traded on certain foreign markets and are adjusted daily pursuant to a fair value pricing service in order to reflect an adjustment for the factors occurring after the close of certain foreign markets but before the NYSE Close; and short-term securities, which are valued at amortized cost. |
| · | Level 3 – Significant unobservable inputs that are supported by limited or no market activity. Level 3 may include financial instruments whose values are determined using broker quotes or require significant management judgment or estimation. These unobservable valuation inputs may include estimates for current yields, maturity/duration, prepayment speed, and broker quotes for comparable securities along with other assumptions relating to credit quality, collateral value, complexity of the security structure, general market conditions and liquidity. This category may include securities where trading has been halted or there are certain restrictions on trading. While these securities are priced using unobservable inputs, the valuation of these securities reflects the best available data and management believes the prices are a reasonable representation of exit price. |
Valuation levels are not necessarily indicative of the risk associated with investing in such securities. Individual securities within any of the above mentioned asset classes may be assigned a different hierarchical level than those presented above, as individual circumstances dictate.
Hartford Value HLS Fund
Notes to Financial Statements – (continued)
December 31, 2011
(000’s Omitted)
For additional information, refer to the Investment Valuation Hierarchy Level Summary and the Level 3 roll-forward reconciliation which follow the Schedule of Investments.
For purposes of reporting transfers between different hierarchy levels, both transfers in and out of each level, as applicable, are shown as if they occurred at the beginning of the period.
| c) | Security Transactions and Investment Income – Security transactions are recorded as of the trade date (the date the order to buy or sell is executed) for financial reporting purposes. Securities purchased or sold on a when-issued or delayed-delivery basis may be settled a month or more after the trade date. Realized gains and losses are determined on the basis of identified cost. |
Dividend income is accrued as of the ex-dividend date, except certain dividends from foreign securities where the ex-dividend date may have passed are recorded as soon as the Fund is informed of the dividend. Interest income, including amortization of premium and accretion of discounts, is accrued on a daily basis.
| d) | Foreign Currency Transactions – Assets and liabilities denominated in currencies other than U.S. dollars are translated into U.S. dollars at the exchange rates in effect on the valuation date. Purchases and sales of investment securities, income, and expenses are translated into U.S. dollars at the exchange rates on the dates of such transactions. |
The Fund does not isolate that portion of portfolio security valuation resulting from fluctuations in the foreign currency exchange rates from the fluctuations arising from changes in the market prices of securities held. Exchange rate fluctuations are included with the net realized and unrealized gain or loss on investments in the accompanying financial statements.
Net realized foreign exchange gains or losses arise from sales of foreign currencies and the difference between asset and liability amounts initially stated in foreign currencies and the U.S. dollar value of the amounts actually received or paid. Net unrealized foreign exchange gains or losses arise from changes in the value of other assets and liabilities at the end of the reporting period, resulting from changes in the exchange rates.
| e) | Joint Trading Account – The Fund may invest cash balances into a joint trading account that may be invested in one or more repurchase agreements. |
| f) | Fund Share Valuation and Dividend Distributions to Shareholders – Orders for the Fund’s shares are executed in accordance with the investment instructions of the contract holders and plan participants. The NAV of the Fund’s shares is determined as of the close of business on each business day of the Exchange. The NAV is determined separately for each class of shares of the Fund by dividing the Fund’s net assets attributable to that class by the number of shares of the class outstanding. Each class of shares offered by the Fund has equal rights as to assets and voting privileges (except that shareholders of a class have exclusive voting rights regarding any matter relating solely to that class of shares). Income and non-class specific expenses are allocated daily to each class on the basis of the relative net assets of the class. Realized and unrealized capital gains and losses are allocated daily based on the relative net assets of each class of shares of the Fund. |
Orders for the purchase of the Fund’s shares received prior to the close of the Exchange on any day the Exchange is open for business are priced at the NAV determined as of the close of the Exchange. Orders received after the close of the Exchange, or on a day on which the Exchange and/or the Fund is not open for business, are priced at the next determined NAV.
Dividends are declared pursuant to a policy adopted by the Company’s Board of Directors based upon the investment performance of the Fund. The policy of the Fund is to pay dividends from net investment income and realized capital gains, if any, at least once a year.
Distributions from net investment income, net realized capital gains and capital are determined in accordance with federal income tax regulations, which may differ from U.S. GAAP with respect to character and timing. These differences may include but are not limited to losses deferred due to wash sale adjustments, foreign currency gains and losses, adjustments related to Passive Foreign Investment Companies (“PFICs”), Real Estate Investment Trusts (“REITs”), Regulated Investment Companies (“RICs”), certain derivatives and partnerships. Permanent book and federal income tax basis differences relating to shareholder distributions will result in reclassifications to certain of the Fund’s capital accounts (see Federal Income Taxes: Reclassification of Capital Accounts note).
| 3. | Securities and Other Investments: |
| a) | Repurchase Agreements – A repurchase agreement is an agreement by which a counterparty agrees to sell a security and agrees to repurchase the security sold at a mutually agreed upon time and price. At the time the Fund enters into a repurchase agreement, the value of the underlying collateral security(ies), including accrued interest, will be equal to or exceed the value of the repurchase agreement. Repurchase agreements expose the Fund to counterparty risk. To minimize counterparty risk, the securities that serve to collateralize the repurchase agreement are held by the Fund's custodian in book entry or physical form in the custodial account of the Fund or in a third party custodial account. Repurchase agreements are valued at cost plus accrued interest. The Fund, as shown on the Schedule of Investments, had outstanding repurchase agreements as of December 31, 2011. |
| b) | Illiquid and Restricted Securities – The Fund is permitted to invest up to 15% of its net assets in illiquid securities. Illiquid securities are those that may not be sold or disposed of in the ordinary course of business within seven days, at approximately the price used to determine the Fund’s NAV. The Fund may not be able to sell illiquid securities or other investments when its sub-adviser considers it desirable to do so or may have to sell such securities or investments at a price that is lower than the price that could be obtained if the securities or investments were more liquid. A sale of illiquid securities or other investments may require more time and may result in higher dealer discounts and other selling expenses than does the sale of those that are liquid. Illiquid securities and investments also may be more difficult to value due to the unavailability of reliable market quotations for such securities or investments, and an investment in them may have an adverse impact on the Fund’s NAV. The Fund may also purchase certain restricted securities that can only be resold to certain qualified investors and may be determined to be liquid pursuant to policies and guidelines established by the Company’s Board of Directors. The Fund, as shown on the Schedule of Investments, had illiquid and/or restricted securities as of December 31, 2011. |
| c) | Securities Purchased on a When-Issued or Delayed-Delivery Basis – Delivery and payment for securities that have been purchased by the Fund on a forward commitment, or when-issued or delayed-delivery basis, take place beyond the customary settlement period. A fund may dispose of or renegotiate a delayed-delivery transaction after it is entered into, and may sell delayed-delivery securities before they are delivered, which may result in a realized gain or loss. During this period, such securities are subject to market fluctuations, and the Fund identifies securities segregated in its records with value at least equal to the amount of the commitment. As of December 31, 2011, the Fund had no outstanding when-issued or delayed delivery securities. |
| 4. | Financial Derivative Instruments: |
The following disclosures contain information on how and why the Fund uses derivative instruments, the credit-risk-related contingent features in certain derivative instruments, and how derivative instruments affect the Fund’s financial position and results of operations. The location and fair value amounts of these instruments on the Statement of Assets and Liabilities and the realized gains and losses and changes in unrealized gains and losses on the Statement of Operations, each categorized by type of derivative contract, are included in the following Additional Derivative Instrument Information footnote. The derivative instruments outstanding as of period-end are disclosed in the notes to the Schedule of Investments and the amounts of realized gains and losses and changes in unrealized gains and losses on derivative instruments during the period are disclosed in the Statement of Operations.
Hartford Value HLS Fund
Notes to Financial Statements – (continued)
December 31, 2011
(000’s Omitted)
| a) | Foreign Currency Contracts – The Fund may enter into foreign currency contracts that obligate the Fund to purchase or sell currencies at specified future dates. Foreign currency contracts are used to hedge the currency exposure associated with some or all of the Fund's securities and/or as part of an investment strategy. Foreign currency contracts are marked to market daily and the change in value is recorded by the Fund as an unrealized gain or loss. The Fund will record a realized gain or loss when the foreign currency contract is settled. |
Foreign currency contracts involve elements of market risk in excess of the amounts reflected in the Statement of Assets and Liabilities. In addition, risks may arise upon entering into these contracts from the potential inability of the counterparties to meet the terms of the contracts and from unanticipated movements in the value of the foreign currencies relative to the U.S. dollar. The Fund had no outstanding foreign currency contracts as of December 31, 2011.
| b) | Additional Derivative Instrument Information: |
The volume of derivative activity was minimal during the year ended December 31, 2011.
The Effect of Derivative Instruments on the Statement of Operations for the year ended December 31, 2011:
| | Risk Exposure Category | |
| | Interest
Rate Contracts | | Foreign Exchange Contracts | | Credit
Contracts | | Equity
Contracts | | Commodity Contracts | | Other
Contracts | | Total | |
| Realized Gain (Loss) on Derivatives Recognized as a Result of Operations: |
| Net realized gain on foreign currency contracts | $ | — | | $ | 115 | | $ | — | | $ | — | | $ | — | | $ | — | | $ | 115 | |
| Total | $ | — | | $ | 115 | | $ | — | | $ | — | | $ | — | | $ | — | | $ | 115 | |
| a) | Counterparty Risk – The Fund may be exposed to counterparty risk, or the risk that an institution or other entity with which the Fund has unsettled or open transactions will default. |
| b) | Market Risks – If the Fund invests directly in foreign currencies or in securities that trade in, and receive revenues in, foreign currencies, or in derivatives that provide exposure to foreign currencies, it will be subject to the risk that those currencies will decline in value relative to the base currency of the Fund, or, in the case of hedging positions, that the Fund’s base currency will decline in value relative to the currency being hedged. Currency rates in foreign countries may fluctuate significantly over short periods of time for a number of reasons, including changes in interest rates, intervention (or the failure to intervene) by U.S. or foreign governments, central banks or supranational entities, such as the International Monetary Fund, or by the imposition of currency controls or other political developments in the United States or abroad. As a result, the Fund’s investments in foreign currency denominated securities may reduce the returns of the Fund. The market values of equity securities, such as common stocks and preferred stocks, or equity related investments, such as futures and options, may decline due to general market conditions which are not specifically related to a particular company, such as real or perceived adverse economic conditions, changes in the general outlook for corporate earnings, changes in interest or currency rates or adverse investor sentiment generally. The market value of equity securities may also decline due to factors which affect a particular industry or industries, such as labor shortages or increased production costs and competitive conditions within an industry. Equity securities and equity related investments generally have greater market price volatility than fixed income securities. |
| a) | Federal Income Taxes – For federal income tax purposes, the Fund intends to continue to qualify as a RIC under Subchapter M of the Internal Revenue Code (“IRC”) by distributing substantially all of its taxable net investment income and net realized capital gains to its shareholders and otherwise complying with the requirements of RICs. The Fund has distributed substantially all of its income and capital gains in prior years, if applicable, and intends to distribute substantially all of its income and capital gains prior to the next fiscal year-end. Accordingly, no provision for federal |
income or excise taxes has been made in the accompanying financial statements. Distributions from short-term capital gains are treated as ordinary income distributions for federal income tax purposes.
| b) | Net Investment Income (Loss), Net Realized Gains (Losses) – Net investment income (loss) and net realized gains (losses) may differ for financial statement and tax purposes primarily because of losses deferred due to wash sale adjustments, foreign currency gains and losses, adjustments related to PFICs, REITs, RICs, certain derivatives and partnerships. The character of distributions made during the year from net investment income or net realized gains may differ from their ultimate characterization for federal income tax purposes. Also, due to the timing of dividend distributions, the fiscal year in which amounts are distributed may differ from the year that the income or realized gains (losses) were recorded by the Fund. |
| c) | Distributions and Components of Distributable Earnings – The tax character of distributions paid by the Fund for the periods indicated is as follows (as adjusted for dividends payable): |
| | | For the Year Ended
December 31, 2011 | | | For the Year Ended
December 31, 2010 | |
| Ordinary Income | | $ | 12,398 | | | $ | 9,850 | |
As of December 31, 2011, the Fund’s components of distributable earnings (deficit) on a tax basis were as follows:
| | | Amount | |
| Undistributed Ordinary Income | | $ | 796 | |
| Accumulated Capital and Other Losses* | | | (170,001 | ) |
| Unrealized Appreciation† | | | 47,022 | |
| Total Accumulated Deficit | | $ | (122,183 | ) |
| | * | The Fund has capital loss carryforwards that are identified in the Capital Loss Carryforward note that follows. |
| | † | The difference between book-basis and tax-basis unrealized appreciation (depreciation) may be attributable to the losses deferred due to wash sale adjustments, foreign currency gains and losses, adjustments related to PFICs, REITs, RICs, certain derivatives and partnerships. |
| d) | Reclassification of Capital Accounts – The Fund may record reclassifications in its capital accounts. These reclassifications have no impact on the total net assets of the Fund. The reclassifications are a result of permanent differences between U.S. GAAP and tax accounting for such items as foreign currency, PFICs, expiration or utilization of capital loss carryforwards or net operating losses. Adjustments are made to reflect the impact these items have on current and future distributions to shareholders. Therefore, the source of the Fund’s distributions may be shown in the accompanying Statement of Changes in Net Assets as from undistributed net investment income, from accumulated net realized gains on investments or from capital depending on the type of book and tax differences that exist. For the year ended December 31, 2011, the Fund recorded reclassifications to increase (decrease) the accounts listed below: |
| | | Amount | |
| Undistributed Net Investment Income | $ | (337 | ) |
| Accumulated Net Realized Gain (Loss) | | 337 | |
| e) | Capital Loss Carryforward – On December 22, 2010, the Regulated Investment Company Modernization Act of 2010 (the “Act”) was enacted, which made changes to the capital loss carryforward rules. The changes are effective for taxable years beginning after the date of enactment. Under the Act, funds are permitted to carry forward capital losses for an unlimited period. However, any losses incurred during those future taxable years will be required to be utilized prior to the losses incurred in pre-enactment taxable years, which carry an expiration date. As a result of this ordering rule, pre-enactment capital loss carryforwards may be more likely to expire unused. Additionally, post-enactment capital loss |
Hartford Value HLS Fund
Notes to Financial Statements – (continued)
December 31, 2011
(000’s Omitted)
carryforwards will retain their character as either short-term or long-term capital losses rather than being considered all short-term as permitted under prior regulation.
At December 31, 2011 (tax-year-end), the Fund had capital loss carryforwards for U.S. federal income tax purposes as follows:
| Year of Expiration | | Amount | |
| 2015 | $ | 19,072 | |
| 2016 | | 106,920 | |
| 2017 | | 44,009 | |
| Total | $ | 170,001 | |
As of December 31, 2011, the Fund utilized $29,729 of prior year capital loss carryforwards
| f) | Accounting for Uncertainty in Income Taxes – The Fund has adopted financial reporting rules that require the Fund to analyze all open tax years, as defined by the statute of limitations, for all major jurisdictions. Generally, tax authorities can examine all tax returns filed for the last three years. The Fund does not have an examination in progress. |
The Fund has reviewed all open tax years and major jurisdictions and concluded that these financial reporting rules had no effect on the Fund’s financial position or results of operations. There is no tax liability resulting from unrecognized tax benefits relating to uncertain income tax positions taken or expected to be taken on the tax return for the fiscal year ended December 31, 2011. The Fund is also not aware of any tax positions for which it is reasonably possible that the total amounts of unrecognized tax benefits will significantly change in the next twelve months.
| a) | Investment Management Agreement – HL Investment Advisors, LLC (“HL Advisors”), an indirect wholly owned subsidiary of The Hartford Financial Services Group, Inc. (“The Hartford”), serves as investment manager to the Fund pursuant to an Investment Management Agreement with the Company. As investment manager, HL Advisors has overall investment supervisory responsibility for the Fund. In addition, HL Advisors provides administrative personnel, services, equipment, facilities and office space for proper operation of the Fund. HL Advisors has contracted with Wellington Management Company, LLP (“Wellington Management”) under a sub-advisory agreement for the provision of day-to-day investment management services to the Fund in accordance with the Fund’s investment objective and policies. The Fund pays a fee to HL Advisors, a portion of which may be used to compensate Wellington Management. |
The schedule below reflects the rates of compensation paid to HL Advisors for investment management services rendered as of December 31, 2011; the rates are accrued daily and paid monthly.
| Average Daily Net Assets | Annual Fee | |
| On first $250 million | 0.7750% | |
| On next $250 million | 0.7250% | |
| On next $500 million | 0.6750% | |
| On next $4 billion | 0.6250% | |
| On next $5 billion | 0.6225% | |
| Over $10 billion | 0.6200% | |
Effective March 1, 2012, HL Advisors will be paid compensation for investment management services according to the following schedule:
| Average Daily Net Assets | Annual Fee | |
| On first $250 million | 0.7750% | |
| On next $250 million | 0.7250% | |
| On next $500 million | 0.6750% | |
| On next $1.5 billion | 0.6250% | |
| On next $2.5 billion | 0.6200% | |
| On next $5 billion | 0.6150% | |
| Over $10 billion | 0.6100% | |
| b) | Accounting Services Agreement – Pursuant to the Fund Accounting Agreement between HLIC and the Company, on behalf of the Fund, HLIC provides accounting services to the Fund and receives monthly compensation based on the Fund’s average daily net assets at the rates set forth below. The Fund’s accounting services fees are accrued daily and paid monthly. |
| Average Daily Net Assets | Annual Fee | |
| All Assets | 0.010% | |
| c) | Operating Expenses – Allocable expenses incurred by the Company are allocated to each Fund and allocated to classes within a Fund in proportion to the average daily net assets of the Fund and each class, except where allocation of certain expenses is more fairly made directly to the Fund or to specific classes within a Fund. |
| d) | Fees Paid Indirectly – The Company, on behalf of the Fund, has entered into agreements with State Street Global Markets, LLC and Russell Implementation Services, Inc. to partially recapture non-discounted trade commissions. Such rebates are used to pay a portion of the Fund’s expenses. In addition, the Fund’s custodian bank has also agreed to reduce its fees when the Fund maintains cash on deposit in a non-interest-bearing custody account. For the year ended December 31, 2011, these amounts, if any, are included in the Statement of Operations. |
The ratio of expenses to average net assets in the accompanying financial highlights excludes the reduction in expenses related to fees paid indirectly. The annualized expense ratio for the period listed below reflecting the reduction for fees paid indirectly is as follows:
| | Year Ended
December 31, 2011 | |
| Class IA | | 0.75 | % |
| Class IB | | 1.00 | |
| e) | Distribution Plan for Class IB shares – The Company, on behalf of the Fund, has adopted a Distribution Plan pursuant to Rule 12b-1 of the 1940 Act to compensate the Distributor, Hartford Securities Distribution Company, Inc. (a wholly owned, ultimate subsidiary of The Hartford), from assets attributable to the Class IB shares for services rendered and expenses borne in connection with activities primarily intended to result in the sale of the Class IB shares, subject to the review and approval of the Company’s Board of Directors. |
The Distribution Plan provides that the Fund may pay annually up to 0.25% of the average daily net assets of the Fund attributable to its Class IB shares for activities primarily intended to result in the sale of Class IB shares. The Board has the authority to suspend or reduce these payments at any point in time. Under the terms of the Distribution Plan and the principal underwriting agreement, the Fund is authorized to make payments monthly to the Distributor that may be used to pay or compensate entities providing distribution and shareholder servicing with respect to the Class IB shares for such entities’ fees or expenses incurred or paid in that regard. These fees are accrued daily and paid monthly.
Hartford Value HLS Fund
Notes to Financial Statements – (continued)
December 31, 2011
(000’s Omitted)
| f) | Other Related Party Transactions – Certain officers of the Fund are directors and/or officers of HL Advisors and/or The Hartford or its subsidiaries. For the year ended December 31, 2011, a portion of the Fund’s chief compliance officer’s salary was paid by all the investment companies in the Hartford fund complex. The portion allocated to the Fund was in the amount of $1. Hartford Administrative Services Company (“HASCO”), an indirect wholly owned subsidiary of The Hartford, provides transfer agent services to the Fund. HASCO was compensated on a per account basis for providing such services. The amount paid to HASCO can be found in the Statement of Operations. These fees are accrued daily and paid monthly. |
| g) | Payment from Affiliate – In July of 2007, The Hartford entered into a settlement with the Attorneys General of the states of New York, Connecticut and Illinois relating to market timing and the company's individual variable annuity contracts in which certain payments would be made directly to the variable annuity contract holders. The distribution plan provided that unclaimed money from the settlement would be distributed to certain HLS Funds that are investment options through a Hartford individual variable annuity contract. The unclaimed money was distributed to the Fund on September 18, 2009. |
The total return in the accompanying financial highlights includes a payment from an affiliate. Had the payment from the affiliate been excluded, the impact and total return for the period listed below would have been as follows:
| | | For the Year Ended December 31, 2009 | |
| | | | Class IA | | | | Class IB | |
| Impact from Payment from Affiliate for Attorneys General Settlement | | | — | % | | | — | % |
| Total Return Excluding Payment from Affiliate | | | 24.37 | | | | 24.05 | |
| 8. | Investment Transactions: |
For the year ended December 31, 2011, the Fund's aggregate purchases and sales of investment securities (excluding short-term investments) were as follows:
| | | Amount | |
| Cost of Purchases Excluding U.S. Government Obligations | | $ | 124,027 | |
| Sales Proceeds Excluding U.S. Government Obligations | | | 288,267 | |
The Fund is one of several Hartford funds that participate in a $500 million committed revolving line of credit facility. The facility is to be used for temporary or emergency purposes. Under the arrangement, the funds are required to own securities having a market value in excess of 300% of the total bank borrowings. The interest rate on borrowings varies depending on the nature of the loan. The facility also requires a fee to be paid based on the amount of the commitment. This commitment fee is allocated to all of the funds participating in the line of credit based on the average net assets of the funds. During the year ended December 31, 2011, the Fund did not have any borrowings under this facility.
Reorganization of Hartford Equity Income HLS Fund and Hartford Value Opportunities HLS Fund into Hartford Value HLS Fund: At a meeting held on August 5, 2009, the Board of Directors of the Company approved a Form of Agreement and Plan of Reorganization that provided for the reorganization of a series of the Company, Hartford Equity Income HLS Fund (“Target Fund #1”) into another series of the Company, Hartford Value HLS Fund (“Acquiring Fund”). The reorganization did not require shareholder approval by the shareholders of Target Fund #1 or the Aquiring Fund. At a separate meeting held on August 5, 2009, the Board of Directors of Hartford HLS Series Fund II, Inc. approved a Form of Agreement and Plan of Reorganization that provided for the reorganization of a series of Hartford HLS Series Fund II, Inc., Hartford Value Opportunities HLS Fund (Target Fund #2) into a series of the Company, Acquiring Fund. The reorganization of Hartford Value Opportunities HLS Fund was subject to a shareholder vote which occurred at a special meeting of Target Fund #2 shareholders on January 26, 2010 and the reorganization of Target Fund #2 into the Aquiring Fund was approved.
Pursuant to the reorganization agreements, on March 19, 2010 (merger date), each holder of Class IA and Class IB shares of Target Fund #1 and Target Fund #2 became the owner of full and fractional shares of the corresponding class in the Aquiring Fund having an equal aggregate value.
This merger was accomplished by tax free exchange as detailed below:
Assuming the acquisition had been completed on January 1, 2010, the beginning of the annual reporting period of the Funds, the Aquiring Fund pro forma results of operations for the annual period ended December 31, 2010, are as follows:
| | | Net assets of Target Fund #1 on Merger Date | | | Net assets of Target Fund #2 on Merger Date | | | Net assets of Acquiring Fund immediately before merger | | | Net assets of Acquiring Fund immediately after merger | | | Target Fund #1 shares exchanged | | | Target Fund #2 shares exchanged | | | Acquiring Fund shares issued to the Target Funds' shareholders | |
| | | | | | | | | | | | | | | | | | | | | | |
| Class IA | | $ | 261,089 | | | $ | 270,234 | | | $ | 250,350 | | | $ | 781,673 | | | | 24,063 | | | $ | 20,105 | | | | 52,973 | |
| Class IB | | | 37,783 | | | | 59,982 | | | | 63,311 | | | | 161,076 | | | | 3,480 | | | | 4,480 | | | | 9,763 | |
| Total | | $ | 298,872 | | | $ | 330,216 | | | $ | 313,661 | | | $ | 942,749 | | | | 27,543 | | | $ | 24,585 | | | | 62,736 | |
| 11. | Industry Classifications: |
Other than the industry classifications “Other Investment Pools and Funds” and “Exchange Traded Funds,” equity industry classifications used in this report are the Global Industry Classification Standard, which was developed by and is the exclusive property and service mark of MSCI, Inc. and Standard & Poor’s.
Under the Company’s organizational documents, the Company shall indemnify its officers and directors to the full extent required or permitted under Maryland General Corporation Law and the federal securities laws. In addition, the Company, on behalf of the Fund, may enter into contracts that contain a variety of indemnifications. The Company’s maximum exposure under these arrangements is unknown. However, as of the date of these financial statements, the Company has not had prior claims or losses pursuant to these contracts and expects the risk of loss to be remote.
Hartford Value HLS Fund
Financial Highlights
- Selected Per-Share Data (A) -
Class | | Net Asset Value at Beginning of Period | | | Net Investment Income (Loss) | | | Payments from (to) Affiliate | | | Net Realized and Unrealized Gain (Loss) on Investments | | | Total from Investment Operations | | | Dividends from Net Investment Income | | | Distributions from Realized Capital Gains | | | Distributions from Capital | | | Total Distributions | | | Net Increase (Decrease) in Net Asset Value | | | Net Asset Value at End of Period | |
| For the Year Ended December 31, 2011 |
| IA | | $ | 10.77 | | | $ | 0.20 | | | $ | – | | | $ | (0.41 | ) | | $ | (0.21 | ) | | $ | (0.19 | ) | | $ | – | | | $ | – | | | $ | (0.19 | ) | | $ | (0.40 | ) | | $ | 10.37 | |
| IB | | | 10.76 | | | | 0.17 | | | | – | | | | (0.41 | ) | | | (0.24 | ) | | | (0.16 | ) | | | – | | | | – | | | | (0.16 | ) | | | (0.40 | ) | | | 10.36 | |
| For the Year Ended December 31, 2010(E) |
| IA | | | 9.50 | | | | 0.13 | | | | – | | | | 1.26 | | | | 1.39 | | | | (0.12 | ) | | | – | | | | – | | | | (0.12 | ) | | | 1.27 | | | | 10.77 | |
| IB | | | 9.50 | | | | 0.11 | | | | – | | | | 1.25 | | | | 1.36 | | | | (0.10 | ) | | | – | | | | – | | | | (0.10 | ) | | | 1.26 | | | | 10.76 | |
| For the Year Ended December 31, 2009 |
| IA | | | 7.77 | | | | 0.14 | | | | – | | | | 1.75 | | | | 1.89 | | | | (0.16 | ) | | | – | | | | – | | | | (0.16 | ) | | | 1.73 | | | | 9.50 | |
| IB | | | 7.77 | | | | 0.13 | | | | – | | | | 1.74 | | | | 1.87 | | | | (0.14 | ) | | | – | | | | – | | | | (0.14 | ) | | | 1.73 | | | | 9.50 | |
| For the Year Ended December 31, 2008 |
| IA | | | 12.83 | | | | 0.20 | | | | – | | | | (4.36 | ) | | | (4.16 | ) | | | (0.20 | ) | | | (0.70 | ) | | | – | | | | (0.90 | ) | | | (5.06 | ) | | | 7.77 | |
| IB | | | 12.81 | | | | 0.20 | | | | – | | | | (4.37 | ) | | | (4.17 | ) | | | (0.17 | ) | | | (0.70 | ) | | | – | | | | (0.87 | ) | | | (5.04 | ) | | | 7.77 | |
| For the Year Ended December 31, 2007 |
| IA | | | 13.06 | | | | 0.17 | | | | – | | | | 1.02 | | | | 1.19 | | | | (0.17 | ) | | | (1.25 | ) | | | – | | | | (1.42 | ) | | | (0.23 | ) | | | 12.83 | |
| IB | | | 13.03 | | | | 0.16 | | | | – | | | | 1.00 | | | | 1.16 | | | | (0.13 | ) | | | (1.25 | ) | | | – | | | | (1.38 | ) | | | (0.22 | ) | | | 12.81 | |
| (A) | Information presented relates to a share outstanding throughout the indicated period. |
| (B) | The figures do not include sales charges or other fees which may be applied at the variable life insurance, variable annuity or qualified retirement plan product level. Any such additional sales charges or other fees would lower the Fund's performance. |
| (C) | Ratios do not reflect reductions for fees paid indirectly. Please see Fees Paid Indirectly in the Notes to Financial Statements. |
| (D) | Portfolio turnover rate is calculated on the basis of the Fund as a whole without distinguishing between the classes of shares issued. |
| (E) | Per share amounts have been calculated using the average shares method. |
| (F) | During the year ended December 31, 2010, the Fund incurred $269.8 million in sales associated with the transition of assets from Hartford Equity Income HLS Fund and Hartford Value Opportunities HLS Fund, which merged into the Fund on March 19, 2010. These sales were excluded from the portfolio turnover calculation. |
| (G) | Total return without the inclusion of the Payment from (to) Affiliate can be found in Expenses in the accompanying Notes to Financial Statements. |
- Ratios and Supplemental Data -
| Total Return(B) | | Net Assets at End of Period | | | Ratio of Expenses to Average Net Assets Before Waivers(C) | | | Ratio of Expenses to Average Net Assets After Waivers(C) | | | Ratio of Net Investment Income (Loss) to Average Net Assets | | | Portfolio Turnover Rate(D) | |
| |
| (1.96 | )% | $ | 591,278 | | | | 0.75 | % | | | 0.75 | % | | | 1.65 | % | | | 16 | % |
| (2.20 | ) | | 111,486 | | | | 1.00 | | | | 1.00 | | | | 1.40 | | | | – | |
| | | | | | | | | | | | | | | | | | | | | |
| 14.67 | | | 741,230 | | | | 0.78 | | | | 0.78 | | | | 1.36 | | | | 47 | (F) |
| 14.38 | | | 154,731 | | | | 1.03 | | | | 1.03 | | | | 1.11 | | | | – | |
| | | | | | | | | | | | | | | | | | | | | |
| 24.37 | (G) | | 244,909 | | | | 0.87 | | | | 0.87 | | | | 1.65 | | | | 50 | |
| 24.06 | (G) | | 63,003 | | | | 1.12 | | | | 1.12 | | | | 1.40 | | | | – | |
| | | | | | | | | | | | | | | | | | | | | |
| (34.03 | ) | | 217,460 | | | | 0.84 | | | | 0.84 | | | | 1.87 | | | | 57 | |
| (34.20 | ) | | 63,338 | | | | 1.09 | | | | 1.09 | | | | 1.62 | | | | – | |
| | | | | | | | | | | | | | | | | | | | | |
| 8.98 | | | 327,689 | | | | 0.84 | | | | 0.84 | | | | 1.42 | | | | 35 | |
| 8.70 | | | 131,651 | | | | 1.09 | | | | 1.09 | | | | 1.14 | | | | – | |
Report of Independent Registered Public Accounting Firm
The Board of Directors and Shareholders of
Hartford Series Fund, Inc.
We have audited the accompanying statement of assets and liabilities, including the schedule of investments, of Hartford Value HLS Fund (one of the portfolios constituting Hartford Series Fund, Inc. (the Funds)) as of December 31, 2011, and the related statement of operations for the year then ended, the statements of changes in net assets for each of the two years in the period then ended, and the financial highlights for each of the five years in the period then ended. These financial statements and financial highlights are the responsibility of the Funds’ management. Our responsibility is to express an opinion on these financial statements and financial highlights based on our audits.
We conducted our audits in accordance with the standards of the Public Company Accounting Oversight Board (United States). Those standards require that we plan and perform the audit to obtain reasonable assurance about whether the financial statements and financial highlights are free of material misstatement. We were not engaged to perform an audit of the Funds’ internal control over financial reporting. Our audits included consideration of internal control over financial reporting as a basis for designing audit procedures that are appropriate in the circumstances, but not for the purpose of expressing an opinion on the effectiveness of the Funds’ internal control over financial reporting. Accordingly, we express no such opinion. An audit also includes examining, on a test basis, evidence supporting the amounts and disclosures in the financial statements and financial highlights, assessing the accounting principles used and significant estimates made by management, and evaluating the overall financial statement presentation. Our procedures included confirmation of securities owned as of December 31, 2011, by correspondence with the custodian and brokers or by other appropriate auditing procedures where replies from brokers were not received. We believe that our audits provide a reasonable basis for our opinion.
In our opinion, the financial statements and financial highlights referred to above present fairly, in all material respects, the financial position of Hartford Value HLS Fund of Hartford Series Fund, Inc. at December 31, 2011, the results of its operations for the year then ended, the changes in its net assets for each of the two years in the period then ended, and the financial highlights for each of the five years in the period then ended, in conformity with U.S. generally accepted accounting principles.
Minneapolis, MN
February 13, 2012
Hartford Value HLS Fund
Directors and Officers (Unaudited)
The Board of Directors of the Company appoints officers who are responsible for the day-to-day operations of the Fund and who execute policies formulated by the Directors. Each director serves until his or her death, resignation, or retirement or until the next annual meeting of shareholders is held or until his or her successor is elected and qualifies.
Directors and officers who are employed by or who have a financial interest in The Hartford are considered “interested” persons of the Fund pursuant to the 1940 Act. Each officer and two of the Company’s directors, as noted in the chart below, are “interested” persons of the Fund. Each director serves as a director for The Hartford Mutual Funds, Inc., The Hartford Mutual Funds II, Inc., Hartford Series Fund, Inc., Hartford HLS Series Fund II, Inc., and as a trustee for The Hartford Alternative Strategies Fund, which, as of December 31, 2011, collectively consist of 91 funds. Correspondence may be sent to directors and officers c/o Hartford Mutual Funds, P.O. Box 2999, Hartford, Connecticut 06104-2999, except that correspondence to Ms. Fagely may be sent to 500 Bielenberg Drive, Woodbury, Minnesota 55125.
The table below sets forth, for each director and officer, his or her name, year of birth, current position with the Company and date first elected or appointed to Hartford Series Fund, Inc. (“HSF”), and Hartford HLS Series Fund II, Inc. (“HSF2”), principal occupation, and, for directors, other directorships held. The Fund’s statement of additional information contains further information on the directors and is available free of charge by calling 1-800-862-6668 or writing to Hartford HLS Funds, c/o Individual Annuity Services, P.O. Box 5085, Hartford, CT 06102-5085.
Information on the aggregate remuneration paid to the directors of the Company can be found in the Statement of Operations herein. The Fund pays to The Hartford a portion of the chief compliance officer’s compensation, but does not pay salaries or compensation to any of their other officers or directors who are employed by The Hartford.
Non-Interested Directors
Lynn S. Birdsong (1946) Director since 2003, Co-Chairman of the Investment Committee
Mr. Birdsong is a private investor. Mr. Birdsong currently serves as a Director of the Sovereign High Yield Investment Company (April 2010 to current). Mr. Birdsong currently serves as an Independent Director of Nomura Partners Funds, Inc. (formerly, The Japan Fund) (March 2003 to current). From 2003 to March 2005, Mr. Birdsong was an independent director of the Atlantic Whitehall Funds. From 1979 to 2002, Mr. Birdsong was a managing director of Zurich Scudder Investments, an investment management firm. During his employment with Scudder, Mr. Birdsong was an Interested Director of The Japan Fund. Since 1981, Mr. Birdsong has been a partner in Birdsong Company, an advertising specialty firm.
Robert M. Gavin, Jr. (1940) Director since 2002 (HSF) and 1986 (HSF2), Chairman of the Board since 2004
Dr. Gavin is an educational consultant. Prior to September 1, 2001, he was President of Cranbrook Education Community and prior to July 1996, he was President of Macalester College, St. Paul, Minnesota.
Duane E. Hill (1945) Director since 2001 (HSF) and 2002 (HSF2), Chairman of the Nominating Committee
Mr. Hill is Partner of TSG Ventures L.P., a private equity investment company. Mr. Hill is a former partner of TSG Capital Group, a private equity investment firm that served as sponsor and lead investor in leveraged buyouts of middle market companies.
Sandra S. Jaffee (1941) Director since 2005
Ms. Jaffee served as Chairman (2008 to 2009) and Chief Executive Officer of Fortent (formerly Searchspace Group), a leading provider of compliance/regulatory technology to financial institutions from August 2005 to August 2009. From August 2004 to August 2005, Ms. Jaffee served as an Entrepreneur in Residence with Warburg Pincus, a private equity firm. From September 1995 to July 2004, Ms. Jaffee served as Executive Vice President at Citigroup, where she was President and Chief Executive Officer of Citibank’s Global Securities Services (1995 to 2003). Ms. Jaffe currently serves as a member of the Board of Directors of Broadridge Financial Solutions as well as a Trustee of Muhlenberg College.
William P. Johnston (1944) Director since 2005, Chairman of the Compliance Committee
In June 2006, Mr. Johnston was appointed as Senior Advisor to The Carlyle Group, a global private equity investment firm. In August 2007, Mr. Johnston was elected to the Board of Directors of LifeCare Holdings, Inc. In February 2008, Mr. Johnston was elected to the Board of Directors of HCR-ManorCare, Inc. In May 2006, Mr. Johnston was elected to the Supervisory Board of Fresenius Medical Care AG & Co. KGaA, after its acquisition of Renal Care Group, Inc. in March 2006. Mr. Johnston joined Renal Care Group in November 2002 as a member of the Board of Directors and served as Chairman of the Board from March 2003 through March 2006. Mr. Johnston served as a Director of MultiPlan, Inc. from July 2006 through August 2010. From September 1987 to December 2002, Mr. Johnston was with Equitable Securities Corporation (and its successors, SunTrust Equitable Securities and SunTrust Robinson Humphrey) serving in various investment banking and managerial positions, including Managing Director and Head of Investment Banking, Chief Executive Officer and Vice Chairman.
Hartford Value HLS Fund
Directors and Officers (Unaudited) – (continued)
Phillip O. Peterson (1944) Director since 2002 (HSF) and 2000 (HSF2), Chairman of the Audit Committee
Mr. Peterson is a mutual fund industry consultant. He was a partner of KPMG LLP (an accounting firm) until July 1999. Mr. Peterson joined William Blair Funds in February 2007 as a member of the Board of Trustees. From January 2004 to April 2005, Mr. Peterson served as Independent President of the Strong Mutual Funds.
Lemma W. Senbet (1946) Director since 2005
Dr. Senbet is the William E. Mayer Chair Professor of Finance and Director, Center for Financial Policy, at the University of Maryland, Robert H. Smith School of Business. He was chair of the Finance Department from 1998 to 2006. Previously he was a chaired professor of finance at the University of Wisconsin-Madison. Also, he was director of the Fortis Funds from March 2000 to July 2002. Dr. Senbet served the finance profession in various capacities, including as director of the American Finance Association and President of the Western Finance Association. In 2006, Dr. Senbet was inducted Fellow of Financial Management Association International for his career-long distinguished scholarship and professional service.
Interested Directors and Officers
David N. Levenson (1966) Director since 2010
Mr. Levenson currently serves as President of The Hartford’s Wealth Management business. He was appointed to this role in July 2010. Previously, Mr. Levenson served as Executive Vice President of Legacy Holdings for The Hartford from June 2009 to July 2010. From 2006 to 2009, Mr. Levenson was with Hartford Life Insurance K.K. where he served as President and Chief Executive Officer from 2007 to 2009. He served as Managing Director of Hartford Investment Management Company from 2005 to 2006. Additionally, Mr. Levenson serves as Executive Vice President of The Hartford and as President, Director and Chief Executive Officer of Hartford Life Insurance Company (“HLIC”) and Hartford Life, Inc. (“HL Inc.”).
Lowndes A. Smith (1939) Director since 1996 (HSF) and 2002 (HSF2), Co-Chairman of the Investment Committee
Mr. Smith served as Vice Chairman of The Hartford from February 1997 to January 2002, as President and Chief Executive Officer of HL Inc. from February 1997 to January 2002, and as President and Chief Operating Officer of The Hartford Life Insurance Companies from January 1989 to January 2002. Mr. Smith serves as a Director of White Mountains Insurance Group, Ltd., One Beacon Insurance and Symetra Financial and as a Managing Director of Whittington Gray Associates.
Other Officers
James E. Davey (1964) President and Chief Executive Officer since 2010
Mr. Davey serves as Executive Vice President of HLIC. Additionally, Mr. Davey serves as President, Chief Executive Officer and Manager of Hartford Investment Financial Services, Inc. (“HIFSCO”) and President, Chief Executive Officer and Manager of HL Advisors. Mr. Davey joined The Hartford in 2002.
Michael R. Dressen (1963) AML Compliance Officer since 2011
Mr. Dressen currently serves as Assistant Vice President of HLIC. He also serves as Chief Compliance Officer and AML Compliance Officer of Hartford Administrative Services Company (“HASCO”) and as Assistant Secretary and Compliance Officer of HIFSCO. Mr Dressen joined The Hartford in 2005 from State Farm Insurance Companies where he held various positions related to mutual funds, variable products, and property casualty insurance.
Tamara L. Fagely (1958) Vice President, Treasurer and Controller since 2002 (HSF) and 1993 (HSF2)
Ms. Fagely has been a Vice President of HASCO since 1998 and Chief Financial Officer since 2006. Currently Ms. Fagely is a Vice President of HLIC. She served as Assistant Vice President of HLIC from December 2001 through March 2005. In addition, Ms. Fagely is Controller and Chief Financial Officer of HIFSCO.
Dr. Robert J. Froehlich (1953) Senior Managing Director since 2009
Dr. Froehlich joined The Hartford as Senior Managing Director in September 2009. Prior to joining The Hartford, Dr. Froehlich served as Vice Chairman of Deutsche Asset Management from 1997-2009.
Edward P. Macdonald (1967) Vice President, Secretary and Chief Legal Officer since 2005
Mr. Macdonald serves as Vice President of HLIC and Chief Legal Officer of Mutual Funds and Vice President of HIFSCO. He also serves as Vice President and Secretary of HASCO, and Chief Legal Officer, Secretary and Vice President of HL Advisors. Mr. Macdonald joined The Hartford in 2005.
Vernon J. Meyer (1964) Vice President since 2006
Mr. Meyer serves as Senior Vice President of HLIC. He also serves as Senior Vice President of HIFSCO and HL Advisors. Mr. Meyer joined The Hartford in 2004.
Colleen B. Pernerewski (1969) Vice President and Chief Compliance Officer since 2010
Ms. Pernerewski serves as Vice President and Chief Investment Advisor Compliance Officer of HIFSCO and as Vice President and Chief Compliance Officer of HL Advisors. Ms. Pernerewski joined The Hartford in 2005 from Travelers Life and Annuity where she served as Counsel (2004-2005). Prior to Travelers Life and Annuity, Ms. Pernerewski held the position of Counsel at The Hartford (1998-2004).
Elizabeth L. Schroeder (1966) Vice President since 2010
Ms. Schroeder currently serves as Assistant Vice President of HLIC. Ms. Schroeder joined HLIC in 1991. She is also an Assistant Vice President of HASCO, HIFSCO and HL Advisors.
Martin Swanson (1962) Vice President since 2010
Mr. Swanson is a Vice President of HLIC. Mr. Swanson also serves as Vice President/Marketing for HIFSCO. Prior to joining HLIC in 1998, Mr. Swanson was a Vice President at PaineWebber, Inc.
Jane Wolak (1961) Vice President since 2009
Ms. Wolak currently serves as Senior Vice President of HLIC. Ms. Wolak joined HLIC as Vice President, Retail Product Services in May 2007. She is also Vice President of HASCO. Previously, Ms. Wolak was with Sun Life Financial where she held the position of Vice President, Service Center Operations from 2001-2007.
HOW TO OBTAIN A COPY OF THE FUND’S PROXY VOTING POLICIES AND VOTING RECORDS (UNAUDITED)
A description of the policies and procedures that the Fund uses to determine how to vote proxies relating to portfolio securities and a record of how the Fund voted any proxies for the twelve-month period ended June 30, 2011 are available (1) without charge, upon request, by calling 800-862-6668 and (2) on the SEC’s website at http://www.sec.gov.
QUARTERLY PORTFOLIO HOLDINGS INFORMATION (UNAUDITED)
The Fund files a complete schedule of portfolio holdings with the SEC for the first and third quarters of each fiscal year on Form N-Q. The Fund’s Forms are available (1) without charge, upon request, by calling 800-862-6668 and (2) on the SEC’s website at http://www.sec.gov. The Form N-Q may be reviewed and copied at the SEC’s Public Reference Room in Washington, DC. Information on the operation of the Public Reference Room may be obtained by calling 1-800-SEC-0330.
Hartford Value HLS Fund
Expense Example (Unaudited)
Your Fund's Expenses
As a shareholder of the Fund, you incur two types of costs: (1) transaction costs and (2) ongoing costs including investment management fees, distribution fees, and other fund expenses. This example is intended to help you understand your ongoing costs (in dollars) of investing in the Fund and to compare these costs with the ongoing costs of investing in other mutual funds. The example is based on an investment of $1,000 invested at the beginning of the period and held for the period of June 30, 2011 through December 31, 2011.
Actual Expenses
The first set of columns of the table below provides information about actual account values and actual expenses. You may use the information in this column, together with the amount you invested, to estimate the expenses that you paid over the period. Simply divide your account value by $1,000 (for example, an $8,600 account value divided by $1,000 = 8.6), then multiply the result by the number in the line under the heading entitled “Expenses Paid During Period” to estimate the expenses you paid on your account during this period.
Hypothetical Example for Comparison Purposes
The second set of columns of the table below provides information about hypothetical account values and hypothetical expenses based on the Fund’s actual expense ratio and an assumed rate of return of 5% per year before expenses, which is not the Fund’s actual return. The hypothetical account values and expenses may not be used to estimate the actual ending account balance or expenses you paid for the period. You may use this information to compare the ongoing costs of investing in the Fund and other funds. To do so, compare this 5% hypothetical example with the 5% hypothetical examples that appear in the shareholder reports of the other funds.
Please note that the expenses shown in the table are meant to highlight your ongoing costs only and do not reflect any transactional costs, such as sales charges (loads) and CDSC. Therefore, the second set of columns of the table is useful in comparing ongoing costs only, and will not help you determine the relative total costs of owning different funds. In addition, if these transactional costs were included, your costs would be higher. Expenses are equal to the Fund's annualized expense ratios multiplied by average account value over the period, multiplied by 184/365 (to reflect the one-half year period).
| | | Actual return | | | Hypothetical (5% return before expenses) | | | | | | | | | | |
| | | Beginning
Account Value
June 30, 2011 | | | Ending Account Value
December 31, 2011 | | | Expenses paid during the period
June 30, 2011
through
December 31, 2011 | | | Beginning
Account Value
June 30, 2011 | | | Ending Account Value
December 31, 2011 | | | Expenses paid during the period
June 30, 2011
through
December 31, 2011 | | | Annualized expense ratio | | | Days in the current 1/2 year | | | Days in the full year | |
| Class IA | | $ | 1,000.00 | | | $ | 941.20 | | | $ | 3.72 | | | $ | 1,000.00 | | | $ | 1,021.37 | | | $ | 3.87 | | | | 0.76 | % | | | 184 | | | | 365 | |
| Class IB | | $ | 1,000.00 | | | $ | 940.01 | | | $ | 4.94 | | | $ | 1,000.00 | | | $ | 1,020.11 | | | $ | 5.14 | | | | 1.01 | % | | | 184 | | | | 365 | |
Hartford Value HLS Fund
Approval of Investment Management and Investment Sub-Advisory Agreements (Unaudited)
Section 15(c) of the Investment Company Act of 1940, as amended (the “1940 Act”), requires that each mutual fund’s board of directors, including a majority of those directors who are not “interested persons” of the mutual fund, as defined in the 1940 Act (the “Independent Directors”), annually review and consider the continuation of the mutual fund’s investment advisory and sub-advisory agreements. At its meeting held on August 2-3, 2011, the Board of Directors (the “Board”) of Hartford Series Fund, Inc., including each of the Independent Directors, unanimously voted to approve the continuation of the investment management agreement for Hartford Value HLS Fund (the “Fund”) with HL Investment Advisors, LLC (“HL Advisors”) and the continuation of the investment sub-advisory agreement between HL Advisors and the Fund’s sub-adviser, Wellington Management Company, LLP (the “Sub-adviser,” and together with HL Advisors, the “Advisers”) (collectively, the “Agreements”).
In the months preceding the August 2-3, 2011 meeting, the Board requested, received, and reviewed written responses from the Advisers to questions posed to them on behalf of the Independent Directors and supporting materials relating to those questions and responses. The Board considered information furnished to the Board at its meetings throughout the year, as well as information specifically prepared in connection with the annual approval of the Agreements at the Board’s meetings held on June 21-22, 2011 and August 2-3, 2011. Information provided to the Board at its meetings throughout the year included, among other things, reports on Fund performance, legal and compliance matters, sales and marketing activity, shareholder services, and the other services provided to the Fund by the Advisers and their affiliates. In addition, the Board received in-person presentations by Fund officers and representatives of HL Advisors at the Board’s meetings on June 21-22, 2011 and August 2-3, 2011 concerning the Agreements.
The Independent Directors, advised by independent legal counsel, engaged two service providers to assist them with evaluating the Agreements with respect to the Fund. Lipper Inc. (“Lipper”), an independent provider of investment company data, was retained to provide the Board with reports on how the Fund’s contractual management fees, actual management fees, other non-management fees, overall expense ratios and investment performance compared to those of mutual funds with similar investment objectives. The Independent Directors also engaged an independent financial services consulting firm (the “Consultant”) to assist them in evaluating the Fund’s management fees, sub-advisory fees, other non-management fees, overall expense ratios and investment performance. In addition, the Consultant reviewed the profitability calculations utilized by HL Advisors in connection with the continuation of the investment management agreement.
In determining to continue the Agreements for the Fund, the members of the Board reviewed and evaluated information and factors they believed to be relevant and appropriate in light of the information that the Board deemed necessary and appropriate through the exercise of their reasonable business judgment. While individual members of the Board may have weighed certain factors differently, the Board’s determination to continue the Agreements was based on a comprehensive consideration of all information provided to the Board throughout the year and specifically with respect to the continuation of the Agreements. A more detailed discussion of the factors the Board considered with respect to its approval of the Agreements is provided below.
Nature, Extent, And Quality Of Services Provided by the Advisers
The Board requested and considered information concerning the nature, extent, and quality of the services provided to the Fund by the Advisers. The Board considered, among other things, the terms of the Agreements and the range of services provided by the Advisers. The Board considered the Advisers’ professional personnel who provide services to the Fund, including each Adviser’s ability and experience in attracting and retaining qualified personnel to service the Fund. The Board considered each Adviser’s reputation and overall financial strength, as well as its willingness to consider and implement organizational and operational changes designed to improve services to the Fund. In addition, the Board considered the quality of each Adviser’s communications with the Board and responsiveness to Board inquiries.
The Board also requested and evaluated information concerning each Adviser’s regulatory and compliance environment. In this regard, the Board requested and reviewed information on each Adviser’s compliance policies and procedures, compliance history, and a report from the Fund’s Chief Compliance Officer on each Adviser’s compliance with applicable laws and regulations, including responses to regulatory developments and compliance issues raised by regulators. The Board also noted the Advisers’ support of the Fund’s compliance control structure, particularly the resources devoted by the Advisers in support of the Fund’s obligations pursuant to Rule 38a-1 under the 1940 Act.
With respect to HL Advisors, the Board noted that under the Agreements, HL Advisors is responsible for the management of the Fund, including overseeing fund operations and service providers, as well as investment advisory services in connection with
Hartford Value HLS Fund
Approval of Investment Management and Investment Sub-Advisory Agreements (Unaudited) – (continued)
selecting, monitoring and supervising the Sub-adviser. The Board considered HL Advisors’ ongoing monitoring of people, process and performance, including its quarterly reviews of each of the Hartford HLS Funds, semi-annual meetings with the leaders of each Fund’s portfolio management team, and oversight of the Funds’ 49 portfolio managers. The Board recognized that HL Advisors has demonstrated a record of making changes to the management and/or strategies of the Funds when warranted. The Board considered HL Advisors’ oversight of the Sub-adviser’s investment approach and results, process for monitoring best execution of portfolio trades by the Sub-adviser, and approach to risk management with respect to the Fund and the service providers to the Fund. The Board also considered HL Advisors’ oversight of compliance with the Fund’s objective and policies as well as with applicable laws and regulations, noting that regulatory and other developments had over time led to an increase in the scope of HL Advisors’ services in this regard. In addition, the Board considered HL Advisors’ ongoing commitment to review and rationalize the Hartford fund family’s product line-up and the expenses that HL Advisors had incurred in connection with fund combinations in recent years. The Board considered that HL Advisors or its affiliates are responsible for providing the Fund’s officers. The Board also noted that Hartford Life Insurance Company (“HLIC”) provides administrative services to the Fund. The Board considered its experiences with HL Advisors and HLIC with respect to each of these services.
With respect to the Sub-adviser, who provides day-to-day portfolio management services, the Board considered the quality of the Fund’s portfolio managers, the Sub-adviser’s other investment personnel, its investment philosophy and process, investment research capabilities and resources, performance record, trade execution capabilities and experience. The Board considered the experience of the Fund’s portfolio managers, the number of accounts managed by the portfolio managers, and the Sub-adviser’s method for compensating the portfolio managers.
Based on these considerations, the Board concluded that it was satisfied with the nature, extent and quality of the services provided to the Fund by HL Advisors and the Sub-adviser.
Performance of the Fund and the Advisers
The Board considered the investment performance of the Fund. In this regard, the Board reviewed the performance of the Fund over different time periods presented in the materials and evaluated HL Advisors’ analysis of the Fund’s performance for these time periods. The Board considered information and materials provided to the Board by the Advisers concerning Fund performance, as well as information from Lipper comparing the investment performance of the Fund to an appropriate benchmark and universe of peer funds. The Board noted that the performance of the Fund was within expectations.
The Board considered the detailed investment analytics reports provided by The Hartford’s Investment Advisory Group throughout the year. These reports include, among other things, information on the Fund’s gross and net returns, the Fund’s investment performance relative to an appropriate benchmark and peer group, various statistics concerning the Fund’s portfolio, and a narrative summary of various factors affecting Fund performance. The Board considered the Advisers’ cooperation with the Investment Committee, which assists the Board in evaluating the performance of the Fund at periodic meetings throughout the year. The Board also considered the analysis provided by the Consultant relating to the Fund’s performance track record.
In light of all the considerations noted above, the Board concluded that it had continued confidence in HL Advisors’ and the Sub-adviser’s overall capabilities to manage the Fund.
Costs of the Services and Profitability of the Advisers
The Board reviewed information regarding HL Advisors’ cost to provide investment management and related services to the Fund and HL Advisors’ profitability, both overall and for the Fund, on a pre-tax basis without regard to distribution expenses. The Board also requested and reviewed information about the profitability to HL Advisors and its affiliates from all services provided to the Fund and all aspects of their relationship with the Fund. The Board also requested and received information relating to the operations and profitability of the Sub-adviser.
The Board considered the Consultant’s review of the profitability calculations utilized by HL Advisors in connection with the continuation of the investment management agreement. In this regard, the Consultant reported that The Hartford’s process for calculating and reporting Fund profitability is reasonable, sound and well within common industry practice.
Based on these considerations, the Board concluded that the profits anticipated to be realized by the Advisers and their affiliates from their relationships with the Fund would not be excessive.
Comparison of Fees and Services Provided by the Advisers
The Board considered comparative information with respect to the management fees to be paid by the Fund to HL Advisors and the total expense ratios of the Fund. The Board also considered comparative information with respect to the sub-advisory fees to be paid by HL Advisors to the Sub-adviser, to the extent applicable. In this regard, the Board requested and reviewed information from HL Advisors and the Sub-adviser relating to the management and sub-advisory fees, including the sub-advisory fee schedule for the Fund, and total operating expenses for the Fund. The Board considered that the management fee for the Fund includes the fee paid to HLIC for providing certain administrative services to the Fund. The Board also reviewed information from Lipper comparing the Fund’s contractual management fees, actual management fees and overall expense ratios relative to a group of funds selected by Lipper, in consultation with the Consultant, and a broader universe of funds selected by Lipper.
While the Board recognized that comparisons between the Fund and peer funds are imprecise, given the differing service levels and characteristics of mutual funds and the different business models and cost structures of the Advisers, the comparative information provided by Lipper assisted the Board in evaluating the reasonableness of the Fund’s management and sub-advisory fees and total operating expenses. In addition, the Board considered the analysis and recommendations of the Consultant relating to the Fund’s management and sub-advisory fees and total operating expenses.
Based on these considerations, the Board concluded that the Fund’s fees and total operating expenses, in conjunction with the information about quality of services, profitability, economies of scale, and other matters discussed, were reasonable in light of the services provided.
Economies of Scale
The Board requested and considered information regarding the Advisers’ realization of economies of scale with respect to the Fund and whether the fee levels reflect these economies of scale for the benefit of the Fund’s investors. With respect to HL Advisors, the Board considered representations from HL Advisors that it is difficult to anticipate whether and to what extent economies may be realized by HL Advisors as assets grow over time. The Board reviewed the breakpoints in the management fee schedule for the Fund, which reduces fee rates as Fund assets grow over time. The Board recognized that a fund with assets beyond the last breakpoint level will continue to benefit from economies of scale because additional assets are charged the lowest breakpoint fee resulting in lower overall effective management fee rates. The Board also recognized that a fee schedule that reaches a lower breakpoint quickly provides shareholders with the benefit of anticipated or potential economies of scale.
The Board reviewed and evaluated materials from Lipper showing how management fee schedules of peer funds reflect economies of scale for the benefit of investors as a peer fund’s assets hypothetically increase over time. Based on information provided by HL Advisors, Lipper, and the Consultant, the Board recognized that there is no uniform methodology for establishing breakpoints or uniform pattern in asset levels that trigger breakpoints or the amounts of breakpoints triggered.
After considering all of the information available to it, the Board concluded that it was satisfied with the extent to which economies of scale would be shared for the benefit of the Fund’s shareholders based on currently available information and the effective advisory fees and expense ratios for the Fund at its current and reasonably anticipated asset levels. The Board noted, however, that it would continue to monitor future growth in Fund assets and the appropriateness of additional breakpoints.
Other Benefits
The Board considered other benefits to the Advisers and their affiliates from their relationships with the Fund, including the role of the Fund in supporting the variable life insurance and variable annuity products offered by The Hartford. The Board reviewed information noting that HLIC, an affiliate of HL Advisors, receives fees for providing certain administrative services to the Fund, and that HLIC also receives fees for fund accounting and related services from the Fund, and the Board considered information on expected profits to HLIC or its affiliates for such services. The Board also considered that Hartford Administrative Services Company (“HASCO”), the Fund’s transfer agent and an affiliate of HL Advisors, receives transfer agency compensation from the
Hartford Value HLS Fund
Approval of Investment Management and Investment Sub-Advisory Agreements (Unaudited) – (continued)
Fund, and the Board reviewed information on the expected profitability of the Fund’s transfer agency function to HASCO. The Board considered information provided by HASCO indicating that the transfer agent fees charged by HASCO to the Fund were fair and reasonable based on publicly available information.
The Board also considered that Hartford Securities Distribution Company, Inc., as principal underwriter of the Fund, receives 12b-1 fees from the Fund. The Board also noted that certain affiliates of HL Advisors distribute shares of the Fund and receive compensation in that connection.
The Board considered benefits to the Sub-adviser from its use of the Fund’s brokerage commissions to obtain soft dollar research, and representations from HL Advisors and the Sub-adviser that the Sub-adviser would not make any revenue-sharing payments or any other type of distribution payments to HL Advisors or its affiliates.
The Board considered the benefits to shareholders of being part of the Hartford family of funds. The Board considered HL Advisors’ efforts to provide investors in the family with a broad range of investment styles and asset classes.
* * * *
Based upon its review of these various factors, among others, the Board concluded that it is in the best interests of the Fund and its shareholders for the Board to approve the Agreements for an additional year. In reaching this decision, the Board did not assign relative weights to the factors discussed above or deem any one or group of them to be controlling in and of themselves. In connection with their deliberations, the Independent Directors met separately in executive session on several occasions, with independent legal counsel, to review the relevant materials and consider their responsibilities under relevant laws and regulations.
The Hartford
P.O. Box 5085
Hartford, CT 06102-5085
Hartford Series Fund, Inc. is underwritten and distributed by Hartford Securities Distribution Company, Inc.
"The Hartford" is The Hartford Financial Services Group, Inc. and its subsidiaries.
Hartford Series Fund, Inc. inception dates range from 1977 to date. Hartford Series Fund, Inc. is not a subsidiary of The Hartford but is underwritten, distributed by and advised by subsidiaries of The Hartford. Investments in Hartford Series Fund, Inc. are not guaranteed by The Hartford or any other entity.
You should carefully consider investment objectives, risks, and charges and expenses of Hartford HLS Funds before investing. This and other information can be found in the Fund’s prospectus or summary prospectus, which can be obtained by calling 800-862-6668. Please read them carefully before you invest or send money.
HLSAR-V11 2-12 109078 Printed in U.S.A ©2011 The Hartford, Hartford, CT 06115 | |
Item 2. Code of Ethics.
Registrant has adopted a code of ethics that applies to Registrant’s principal executive officer, principal financial officer, and controller, which is attached as an exhibit.
Item 3. Audit Committee Financial Expert.
The Board of Directors of the Registrant has designated Phillip O. Peterson as an Audit Committee Financial Expert. Mr. Peterson is considered by the Board to be an independent director.
Item 4. Principal Accountant Fees and Services.
| (a) | Audit Fees: $475,960 for the fiscal year ended December 31, 2010; $412,850 for the fiscal year ended December 31, 2011. |
| (b) | Audit Related Fees: $72,150 for the fiscal year ended December 31, 2010; $35,515 for the fiscal year ended December 31, 2011. Audit-related services principally in connection with SEC Rule 17Ad-13 report. |
| (c) | Tax Fees: $130,802 for the fiscal year ended December 31, 2010; $85,500 for the fiscal year ended December 31, 2011. |
| (d) | All Other Fees: $0 for the fiscal year ended December 31, 2010; $0 for the fiscal year ended December 31, 2011. |
| (e) | (1) A copy of the Audit Committee’s pre-approval policies and procedures is attached as an exhibit. |
| (e) | (2) One hundred percent of the services described in items 4(b) through 4(d) were approved in accordance with the Audit Committee's Pre-Approval Policy. As a result, none of such services was approved pursuant to paragraph (c) (7) (i) (c) of Rule 2-01 of Regulation S-X. |
| (f) | None of the hours expended on the principal accountant's engagement to audit the Registrant's financial statements for the year ended October 31, 2011, were attributed to work performed by persons other than the principal accountant's full-time employees. |
| (g) | Non-Audit Fees: $1,050,371 for the fiscal year ended December 31, 2010; $1,331,880 for the fiscal year ended December 31, 2011. |
The registrant's Audit Committee of the Board of Directors has considered whether the provision of non-audit services that were rendered to the registrant's investment adviser (not including any sub-adviser whose role is primarily portfolio management and is subcontracted with or overseen by another investment adviser), and any entity controlling, controlled by, or under common control with the investment adviser that provides ongoing services to the registrant that were not pre-approved pursuant to paragraph (c)(7)(ii) of Rule 2-01 of Regulation S-X is compatible with maintaining the principal accountant's independence.
Item 5. Audit Committee of Listed Registrants.
Not applicable to this Annual filing.
Item 6. Schedule of Investments
The Schedule of Investments is included as part of the Annual report filed under Item 1 of this form.
Item 7. Disclosure of Proxy Voting Policies and Procedures for Closed-End Management Investment Companies.
Not applicable.
Item 8. Portfolio Managers of Closed-End Management Investment Companies.
Not applicable.
Item 9. Purchases of Equity Securities by Closed-End Management Investment Company and Affiliated Purchasers.
Not applicable.
Item 10. Submission of Matters to a Vote of Security Holders
There have been no material changes to the procedures by which shareholders may recommend nominees to the registrant’s board of directors since registrant last provided disclosure in response to this requirement.
Item 11. Controls and Procedures.
| (a) | Based on an evaluation of the Registrant's Disclosure Controls and Procedures as of a date within 90 days of the filing date of this report, the Disclosure Controls and Procedures are effectively designed to ensure that information required to be disclosed by the Registrant is recorded, processed, summarized and reported by the date of this report, including ensuring that information required to be disclosed in the report is accumulated and communicated to the Registrant's management, including the Registrant's officers, as appropriate, to allow timely decisions regarding required disclosure. |
| (b) | There was no change in the Registrant's internal control over financial reporting that occurred during the Registrant’s last fiscal half year that has materially affected, or is reasonably likely to materially affect, the registrant’s internal control over financial reporting. |
Item 12. Exhibits.
| 11(a) (2) | Section 302 certifications of the principal executive officer and principal financial officer of Registrant. |
| | |
| | |
| (b) | Section 906 certification. |
| | |
| 12(a)(1) | Code of Ethics |
| | |
| 12(a)(2) | Audit Committee Pre-Approved Policies and Procedures |
SIGNATURES
Pursuant to the requirements of the Securities Exchange Act of 1934 and the Investment Company Act of 1940, the registrant has duly caused this report to be signed on its behalf by the undersigned, thereunto duly authorized.
| | HARTFORD SERIES FUND, INC. |
| | |
| Date: February 10, 2012 | By: /s/ James E. Davey |
| | James E. Davey |
| | Its: President |
Pursuant to the requirements of the Securities Exchange Act of 1934 and the Investment Company Act of 1940, this report has been signed below by the following persons on behalf of the registrant and in the capacities and on the dates indicated.
| Date: February 10, 2012 | By: /s/ James E. Davey |
| | James E. Davey |
| | Its: President |
| | |
| | |
| Date: February 10, 2012 | By: /s/ Tamara L. Fagely |
| | Tamara L. Fagely |
| | Its: Vice President, Controller and Treasurer |