| | | | |
OMB APPROVAL |
| OMB Number: 3235-0570 |
| Expires: January 31, 2014 |
| Estimated average burden |
| hours per response: 20.6 |
UNITED STATES
SECURITIES AND EXCHANGE COMMISSION
Washington, D.C. 20549
FORM N-CSR
CERTIFIED SHAREHOLDER REPORT OF REGISTERED MANAGEMENT
INVESTMENT COMPANIES
Investment Company Act file number 811-01424
AIM Equity Funds (Invesco Equity Funds)
(Exact name of registrant as specified in charter)
11 Greenway Plaza, Suite 1000
Houston, Texas 77046
(Address of principal executive offices) (Zip code)
Philip A. Taylor
11 Greenway Plaza, Suite 1000
Houston, Texas 77046
(Name and address of agent for service)
Registrant’s telephone number, including area code: (713) 626-1919
Date of fiscal year end: 10/31
Date of reporting period: 10/31/12
| Item 1. | Reports to Stockholders. |
Letters to Shareholders
| | |

Philip Taylor | | Dear Shareholders: This report contains information about your Fund, including a discussion from your portfolio managers about how they managed your Fund – and why it performed as it did – during the reporting period. This report also includes your Fund’s long-term performance and a complete list of your Fund’s investments as of the close of the reporting period. I hope you find this information helpful. For much of the reporting period, investors’ attention was focused on Europe, where eurozone governments struggled to reduce debt levels, strengthen their banks and stimulate their economies. European leaders disagreed whether the wiser path to restoring the Continent’s economic well-being was more stimulus or greater austerity. In the US, economic data were mixed. Economic growth, while positive, was relatively modest. Corporate earnings, which grew strongly in recent years, showed signs of slowing. And job creation was less robust than hoped. |
| Later in this report, your Fund’s portfolio managers discuss how economic conditions and market trends affected your Fund’s performance. |
Economic conditions are always subject to sudden and unexpected change. That’s why you may find it helpful to work with a trusted, experienced financial adviser who understands your unique financial goals, needs and risk tolerances. Financial advisers can provide valuable insight and information, particularly when markets are uncertain, and they can recommend investments appropriate for specific investment goals, such as a child’s college education or your retirement. On a regular basis, a financial adviser also can determine whether your existing investments are still appropriate, given your changing needs, goals and circumstances.
Timely insight and information from many of Invesco’s investment professionals is available at our website, invesco.com/us. We offer in-depth articles, video clips and audio commentaries from many of our portfolio managers and other investment professionals on a wide range of topics of interest to investors: recent economic and market developments; retirement planning; legislative updates from Washington, DC; and general investor education. At invesco.com/us, you also can access information about your Invesco account at any time.
What we mean by Intentional Investing
Intentional InvestingSM is the science and art of investing with purpose, prudence and diligence – and it’s how Invesco’s investment professionals manage your money every day.
This highly disciplined process begins when specialized teams of investment professionals clearly define an investment objective and then establish specific investment strategies to try to achieve that objective. While our investment teams closely monitor economic and market conditions – and issues specific to individual holdings that could affect their value – they maintain a long-term investment perspective. Intentional Investing is also:
| | n | | How we manage and mitigate risk – by embedding risk controls and processes into every aspect of our business; |
| | n | | How we create products – by offering a diverse combination of investment strategies and vehicles designed to meet your needs; and |
| | n | | How we connect with you, our investors – by communicating clearly, by delivering expert insights from our portfolio managers and other investment professionals, and by providing a website full of tools and articles to help you stay informed. |
As a company, Invesco believes in putting investors first, and that’s why investment management is all we do. Our sole focus on managing your money allows your financial adviser to build a truly diversified investment portfolio of Invesco funds, whatever your investment needs and goals may be – and allows him or her to find appropriate Invesco funds when your circumstances change. Of course, neither Intentional Investing nor diversification can guarantee a profit or protect against loss.
Have a question?
If you have questions about your account, please contact an Invesco client services representative at 800 959 4246. If you have an Invesco-related question or comment, feel free to email me directly at phil@invesco.com.
All of us at Invesco look forward to serving your investment management needs for many years to come. Thank you for investing with us.
Sincerely,

Philip Taylor
Senior Managing Director, Invesco Ltd.
2 Invesco Charter Fund
| | |

Bruce Crockett | | Dear Fellow Shareholders: One of our most important responsibilities as independent Trustees of the Invesco Funds is our annual review of the funds’ advisory and sub-advisory contracts with Invesco. This annual review is required by the Investment Company Act of 1940 and focuses on the nature and quality of the services Invesco has provided as adviser to the Invesco Funds and the reasonableness of the fees that it charges for those services. In our roles as Trustees, we spend months reviewing thousands of pages of detailed information that we request from Invesco in connection with our annual review. We focus on the quality and costs of the services to be provided by Invesco and its affiliates. Some of the most important things we look at are fund performance, expenses and fees. All of the Trustees have substantial personal investments in the Invesco Funds complex. We’re fund shareholders just like you. |
We also use information from many independent sources during the review process, including materials provided by the independent Senior Officer of the Invesco Funds, who reports directly to the independent Trustees. We also meet in private sessions with independent legal counsel and review performance and fee data on the Invesco Funds prepared by Lipper Inc., an independent, third-party firm widely recognized as a leader in its field.
I’m pleased to report that the Invesco Funds Board determined in June that renewing the investment advisory agreement and the sub-advisory contracts with Invesco would serve the best interests of each fund and its shareholders. For more detailed information about our assessment and conclusions with respect to each of the Invesco Funds, visit invesco.com/us, click on the “About Us” section and go to “Legal Information.” Information on the recent investment advisory renewal process can be found by clicking the last item under “Corporate Governance.”
In much the same way we review your fund’s advisory contract each year, it’s a good idea for you to review your own investment plan with your financial adviser on a regular basis. Perhaps you need to reassess your original asset allocation because different investments may grow at varying paces, or perhaps you’re going through a significant life change. Regardless of your situation, a financial adviser can provide guidance and experience to help you reach your financial goals.
As always, please contact me at bruce@brucecrockett.com with any questions or concerns you may have. On behalf of the Board, we look forward to continuing to represent your interests and serving your needs.
Sincerely,

Bruce L. Crockett
Independent Chair
Invesco Funds Board of Trustees
3 Invesco Charter Fund
Management’s Discussion of Fund Performance
Performance summary
For the fiscal year ended October 31, 2012, Invesco Charter Fund’s returns were positive, with investments in the health care and financials sectors delivering attractive results. The Fund lagged the broad market as measured by the S&P 500 Index, as well as its style-specific benchmark, the Russell 1000 Index. The energy sector was the largest detractor from the Fund’s results versus its style-specific benchmark. The Fund’s allocation to cash also tempered results for the reporting period.
Your Fund’s long-term performance appears later in this report.
Fund vs. Indexes
Total returns, 10/31/11 to 10/31/12, at net asset value (NAV). Performance shown does not include applicable contingent deferred sales charges (CDSC) or front-end sales charges, which would have reduced performance.
| | | | |
Class A Shares | | | 8.93 | % |
Class B Shares | | | 8.16 | |
Class C Shares | | | 8.14 | |
Class R Shares | | | 8.73 | |
Class S Shares | | | 9.08 | |
Class Y Shares | | | 9.26 | |
Class R5 Shares* | | | 9.43 | |
Class R6 Shares** | | | 9.00 | |
S&P 500 Indexq (Broad Market Index) | | | 15.21 | |
Russell 1000 Indexn (Style-Specific Index) | | | 14.97 | |
Lipper Large-Cap Core Funds Index¿ (Peer Group Index) | | | 13.38 | |
Source(s): qInvesco, S&P-Dow Jones via FactSet Research Systems Inc.; ¢Invesco, Russell via FactSet Research Systems Inc.; ¿Lipper Inc.
| * | Effective September 24, 2012, Institutional Class shares were renamed Class R5 shares. |
| ** | Share class incepted during the reporting period. See page 7 for a detailed explanation of Fund performance. |
How we invest
We seek to manage your Fund with the objective of achieving long-term realized investor returns exceeding those of passive benchmarks across a full market cycle, which we would define as market trough to market trough, or peak to peak. As Fund managers, we believe investors need a reason to stick with the Fund for long periods of time in order to realize these returns, and believe the best way we can encourage this behavior is by delivering a smoother (less volatile) investor experience – especially in turbulent, down-trending markets. The portfolio we construct is intended to provide attractive participation during positive-trending
equity markets, but with a greater emphasis on comparative downside protection during more turbulent, down-trending equity markets. We position the Fund to act as a “conservative cornerstone” – a stable foundational component within a well-diversified portfolio of assets.
The Fund’s portfolio is comprised of what we call “core stocks.” A core stock encompasses elements of growth (revenues, profits, economic value) and value (both absolute and comparative measures). Along this growth-value continuum, we seek to identify and invest in areas of temporary disconnection between market perception and the view our research uncovers.
To build a portfolio of core stocks, we conduct thorough fundamental research of businesses to gain a deeper understanding of the companies’ prospects, growth potential and return on invested capital (ROIC) characteristics. The analytical process we use to identify potential investments for the Fund includes three phases: financial, business and valuation.
Financial analysis provides insights into historical ROIC (a key indicator of business quality) and historical capital allocation (a key indicator of management quality). Business analysis evaluates the competitive landscape and any structural or cyclical business opportunities or threats and allows us to identify key revenue, profit and return drivers of the company. Both the financial and business analyses serve as a basis to construct valuation models that help us appraise a company’s intrinsic worth. Our valuation analysis employs three primary techniques, including discounted cash flow, traditional valuation multiples and net asset value.
We consider selling a stock when it exceeds our target price, we have not seen a demonstrable improvement in fundamentals, or a more compelling investments opportunity exists.
Market conditions and your Fund
The fiscal year began with improving economic data in the US and a rally in equities that continued almost uninterrupted into the spring of 2012. However, the ongoing eurozone sovereign debt crisis intensified in April and May, dominating headlines and creating significant volatility in equity markets across the globe.
This negative news from overseas precipitated a slowdown in the US, where economic data began to decelerate as manufacturing, employment, consumer spending and consumer confidence weakened over the summer. While
Portfolio Composition
By sector
| | | | |
Health Care | | | 18.8 | % |
Information Technology | | | 15.1 | |
Financials | | | 10.8 | |
Industrials | | | 8.0 | |
Consumer Staples | | | 7.9 | |
Energy | | | 7.1 | |
Consumer Discretionary | | | 5.1 | |
Materials | | | 3.2 | |
Telecommunication Services | | | 1.4 | |
Utilities | | | 1.2 | |
Money Market Funds | | | | |
Plus Other Assets Less Liabilities | | | 21.4 | |
Top 10 Equity Holdings*
| | | | |
1. Progressive Corp. (The) | | | 2.3 | % |
2. Kellogg Co. | | | 2.2 | |
3. Adobe Systems Inc. | | | 2.2 | |
4. Symantec Corp. | | | 2.0 | |
5. Macy’s, Inc. | | | 2.0 | |
6. Sanofi-ADR | | | 2.0 | |
7. Microsoft Corp. | | | 1.9 | |
8. American Express Co. | | | 1.9 | |
9. Procter & Gamble Co. (The) | | | 1.9 | |
10. Berkshire Hathaway Inc.-Class A | | | 1.9 | |
Top Five Industries*
| | | | |
1. Pharmaceuticals | | | 12.4 | % |
2. Communications Equipment | | | 4.3 | |
3. Property and Casualty Insurance | | | 4.2 | |
4. Systems Software | | | 3.9 | |
5. Oil and Gas Equipment and Services | | | 3.6 | |
| | | | |
Total Net Assets | | $ | 5.3 billion | |
| |
Total Number of Holdings* | | | 70 | |
The Fund’s holdings are subject to change, and there is no assurance that the Fund will continue to hold any particular security.
*Excluding money market fund holdings.
4 Invesco Charter Fund
corporate earnings remained solid, financial markets were influenced by macroeconomic developments for much of the reporting period. As the fiscal year drew to a close, fears about the fate of the eurozone began to subside after the European Central Bank announced new measures to support eurozone economies through potentially unlimited purchases of sovereign debt, among other measures. At the same time, continued risk aversion among investors and corporations, along with tepid employment growth, prompted the US Federal Reserve (the Fed) to initiate a third round of quantitative easing by promising to remain accommodative until the labor market outlook improves materially. The Fed’s action initially bolstered equity markets, but the potential impact on employment and economic conditions remained uncertain. At the close of the reporting period, market volatility increased as many investors remained concerned about the uncertainty surrounding the presidential election and the so-called “fiscal cliff” – a variety of tax increases and spending cuts scheduled to take effect in January 2013, unless an agreement is reached between the White House and Congress.
Despite volatility for much of the reporting period, major equity market indexes delivered double-digit gains, and all 10 sectors of the S&P 500 Index had positive returns.1
The largest contributor to Fund results for the reporting period was Lowe’s, one of the largest home-improvement retailers in the US. As the US housing market slowly showed signs of recovery, the company’s earnings also rebounded. We believe the company is moving in the right direction to improve operations and merchandising, which lagged competitors in recent years. In addition, the company continues to return capital to shareholders by repurchasing shares and paying dividends.
eBay was another strong contributor during the reporting period. The online auction site is benefiting from continued strength in its payments division, Paypal, as well as a rejuvenated core marketplace segment. Over the last few years, the company has invested significantly in improving the customer experience in the traditional marketplace division. In our opinion, it now appears that those investments have begun to reap gains, as growth in product listings, transactions and profits have accelerated.
The Fund lagged its style-specific index on a relative basis for the reporting period, which was partially due to companies that we did not own in the Fund, such as Apple, but that did very well in the benchmark. Some of the largest detractors from the Fund’s results were in the energy sector, including Weatherford International and Baker Hughes. Weatherford has been dealing with a series of tax reporting issues, which included a restatement of its financial results for the second consecutive year. As a result of these issues, the company’s chief financial officer departed in March, which we believe was a positive step for the company. We believe the company is currently undervalued and, in the long term, has an opportunity to improve margins and capital efficiency.
Baker Hughes’ results were disappointing during the year due to declines in pressure pumping prices, as well as logistical supply chain problems. The company took steps to address both issues, and shares rebounded in the summer. We sold our position in the company during the reporting period.
During the fiscal year, we decreased our exposure to the more cyclical areas of the market, such as the consumer discretionary, energy and industrials sectors and increased our exposure to the more defensive consumer staples and health care sectors. At the end of the reporting period, our largest overweight position relative to the Russell 1000 Index was in the health care sector, and the largest underweight position was in the consumer discretionary sector.
Regardless of market conditions, our goal for Invesco Charter Fund remains the same: to serve as a conservative cornerstone for your investment portfolio. We seek to provide attractive upside participation with strong potential downside protection, so that over a full market cycle the Fund may deliver superior investment results with the potential for reduced risk and a smoother investor experience. As always, we would like to thank you for your continued investment in Invesco Charter Fund.
The views and opinions expressed in management’s discussion of Fund performance are those of Invesco Advisers, Inc. These views and opinions are subject to change at any time based on factors such as market and economic conditions. These views and opinions may not be relied upon as investment advice or recommendations, or as an offer for a particular security. The information is not a complete analysis of every aspect of any market, country, industry, security or the Fund. Statements of fact are from sources considered reliable, but Invesco Advisers, Inc. makes no representation or warranty as to their completeness or accuracy. Although historical performance is no guarantee of future results, these insights may help you understand our investment management philosophy.
See important Fund and, if applicable, index disclosures later in this report.
| | |
 | | Ronald Sloan Chartered Financial Analyst, portfolio manager and chief investment officer (CIO) of Invesco’s |
| domestic core investments team, is lead manager of Invesco Charter Fund. He joined Invesco in 1998. Mr. Sloan earned a BS in business administration and an MBA from the University of Missouri. |
| | |
 | | Tyler Dann II Chartered Financial Analyst, portfolio manager, is manager of Invesco Charter Fund. He joined |
| Invesco in 2004. Mr. Dann earned a BA from Princeton University. |
| | |
 | | Brian Nelson Chartered Financial Analyst, portfolio manager, is manager of Invesco Charter Fund. He joined |
| Invesco in 2004. Mr. Nelson earned a BA from the University of California, Santa Barbara. |
Your Fund’s Long-Term Performance
Results of a $10,000 Investment – Oldest Share Class(es)
Fund and index data from 10/31/02*
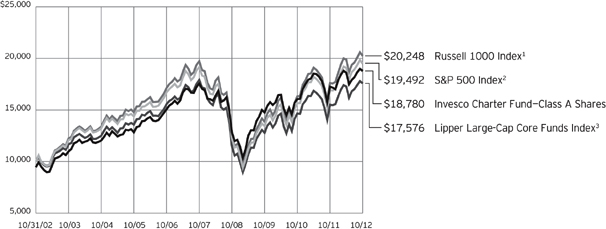
1 Source(s): Invesco, Russell via FactSet Research Systems Inc.
2 Source(s): Invesco, S&P-Dow Jones via FactSet Research Systems Inc.
3 Source: Lipper Inc.
| * | During the reporting period, Invesco changed its policy regarding growth of $10,000 charts. For funds older than 10 years, we previously showed performance since inception. Going forward, we will show performance for the most recent 10 years, since this more accurately reflects the experience of the typical shareholder. As a result, charts now may include benchmarks that did not appear previously, because the funds’ inception predated the benchmarks’ inception. Also, all charts will now be presented using a linear format. |
Past performance cannot guarantee comparable future results.
The data shown in the chart include reinvested distributions, applicable sales charges Fund expenses including management fees. Index results include reinvested dividends, but they do not reflect sales charges. Performance of the peer
group, if applicable, reflects fund expenses and management fees; performance of a market index does not. Performance shown in the chart and table(s) does not reflect deduction of taxes a shareholder would pay on Fund distributions or sale of Fund shares.
6 Invesco Charter Fund
Average Annual Total Returns
As of 10/31/12, including maximum applicable sales charges
| | | | |
Class A Shares | | | | |
Inception (11/26/68) | | | 10.55 | % |
10 Years | | | 6.51 | |
5 Years | | | 0.23 | |
1 Year | | | 2.96 | |
| |
Class B Shares | | | | |
Inception (6/26/95) | | | 6.33 | % |
10 Years | | | 6.49 | |
5 Years | | | 0.24 | |
1 Year | | | 3.16 | |
| |
Class C Shares | | | | |
Inception (8/4/97) | | | 3.28 | % |
10 Years | | | 6.33 | |
5 Years | | | 0.62 | |
1 Year | | | 7.14 | |
| |
Class R Shares | | | | |
Inception (6/3/02) | | | 5.20 | % |
10 Years | | | 6.85 | |
5 Years | | | 1.14 | |
1 Year | | | 8.73 | |
| |
Class S Shares | | | | |
10 Years | | | 7.15 | % |
5 Years | | | 1.44 | |
1 Year | | | 9.08 | |
| |
Class Y Shares | | | | |
10 Years | | | 7.22 | % |
5 Years | | | 1.59 | |
1 Year | | | 9.26 | |
| |
Class R5 Shares | | | | |
Inception (7/30/91) | | | 7.78 | % |
10 Years | | | 7.61 | |
5 Years | | | 1.82 | |
1 Year | | | 9.43 | |
| |
Class R6 Shares | | | | |
10 Years | | | 7.12 | % |
5 Years | | | 1.39 | |
1 Year | | | 9.00 | |
Class S shares incepted on September 25, 2009. Performance shown prior to that date is that of Class A shares and includes the 12b-1 fees applicable to Class A shares. Class A share performance reflects any applicable fee waivers or expense reimbursements.
Class Y shares incepted on October 3, 2008. Performance shown prior to that date is that of Class A shares and includes the 12b-1 fees applicable to Class A shares. Class A share performance reflects any applicable fee waivers or expense reimbursements.
Average Annual Total Returns
As of 9/30/12, the most recent calendar quarter-end, including maximum applicable sales charges
| | | | |
Class A Shares | | | | |
Inception (11/26/68) | | | 10.60 | % |
10 Years | | | 7.20 | |
5 Years | | | 0.81 | |
1 Year | | | 14.07 | |
| |
Class B Shares | | | | |
Inception (6/26/95) | | | 6.43 | % |
10 Years | | | 7.19 | |
5 Years | | | 0.82 | |
1 Year | | | 14.85 | |
| |
Class C Shares | | | | |
Inception (8/4/97) | | | 3.38 | % |
10 Years | | | 7.03 | |
5 Years | | | 1.20 | |
1 Year | | | 18.87 | |
| |
Class R Shares | | | | |
Inception (6/3/02) | | | 5.34 | % |
10 Years | | | 7.54 | |
5 Years | | | 1.70 | |
1 Year | | | 20.44 | |
| |
Class S Shares | | | | |
10 Years | | | 7.85 | % |
5 Years | | | 2.02 | |
1 Year | | | 20.87 | |
| |
Class Y Shares | | | | |
10 Years | | | 7.92 | % |
5 Years | | | 2.16 | |
1 Year | | | 21.04 | |
| |
Class R5 Shares | | | | |
Inception (7/30/91) | | | 7.86 | % |
10 Years | | | 8.32 | |
5 Years | | | 2.40 | |
1 Year | | | 21.28 | |
| |
Class R6 Shares | | | | |
10 Years | | | 7.82 | % |
5 Years | | | 1.96 | |
1 Year | | | 20.74 | |
Class R6 shares incepted on September 24, 2012. Performance shown prior to that date is that of Class A shares and includes the 12b-1 fees applicable to Class A shares. Class A share performance reflects any applicable fee waivers or expense reimbursements.
The performance data quoted represent past performance and cannot guarantee comparable future results; current performance may be lower or higher. Please visit invesco.com/performance for the most recent month-end performance.
Performance figures reflect reinvested distributions, changes in net asset value and the effect of the maximum sales charge unless otherwise stated. Investment return and principal value will fluctuate so that you may have a gain or loss when you sell shares.
The total annual Fund operating expense ratio set forth in the most recent Fund prospectus as of the date of this report for Class A, Class B, Class C, Class R, Class S, Class Y, Class R5 and Class R6 shares was 1.12%, 1.87%, 1.87%, 1.37%, 1.02% 0.87%, 0.75% and 0.65%, respectively. The expense ratios presented above may vary from the expense ratios presented in other sections of this report that are based on expenses incurred during the period covered by this report.
Class A share performance reflects the maximum 5.50% sales charge, and Class B and Class C share performance reflects the applicable contingent deferred sales charge (CDSC) for the period involved. The CDSC on Class B shares declines from 5% beginning at the time of purchase to 0% at the beginning of the seventh year. The CDSC on Class C shares is 1% for the first year after purchase. Class R, Class S, Class Y, Class R5 and Class R6 shares do not have a front-end sales charge or a CDSC; therefore, performance is at net asset value.
The performance of the Fund’s share classes will differ primarily due to different sales charge structures and class expenses.
Invesco Charter Fund’s investment objective is long-term growth of capital.
| n | | Unless otherwise stated, information presented in this report is as of October 31, 2012, and is based on total net assets. |
| n | | Unless otherwise noted, all data provided by Invesco. |
| n | | To access your Fund’s reports/prospectus, visit invesco.com/fundreports. |
About share classes
| n | | Class B shares may not be purchased for new or additional investments. Please see the prospectus for more information. |
| n | | Class R shares are generally available only to employee benefit plans. Please see the prospectus for more information. |
| n | | Class S shares and Class Y shares are available only to certain investors. Please see the prospectus for more information. |
| n | | Class R5 shares and Class R6 shares are primarily intended for retirement plans that meet certain standards and for institutional investors. On September 24, 2012, Institutional Class shares were renamed Class R5 shares. Please see the prospectus for more information. |
Principal risks of investing in the Fund
| n | | Cash/cash equivalents risk. Holding cash or cash equivalents may negatively affect performance. |
| n | | Derivatives risk. The performance of derivative instruments is tied to the performance of an underlying currency, security, index or other instrument. In addition to risks relating to their underlying instruments, the use of derivatives may include other, possibly greater, risks. Derivatives involve costs, may be volatile, and may involve a small initial investment relative to the risk assumed. Risks associated with the use of derivatives include counterparty, leverage, correlation, liquidity, tax, market, interest rate and management risks. Derivatives may also be more difficult to purchase, sell or value than other investments. The Fund may lose more than the cash amount invested on investments in derivatives. Investors should bear in mind that, while the Fund intends to use derivative strategies, it is not obligated to actively engage in these |
transactions, generally or in any particular kind of derivative, if the investment manager elects not to do so due to availability, cost, market conditions or other factors.
| n | | Foreign securities risk. The Fund’s foreign investments may be affected by changes in a foreign country’s exchange rates, political and social instability, changes in economic or taxation policies, difficulties when enforcing obligations, decreased liquidity, and increased volatility. Foreign companies may be subject to less regulation resulting in less publicly available information about the companies. |
| n | | Management risk. The investment techniques and risk analysis used by the Fund’s portfolio managers may not produce the desired results. |
| n | | Market risk. The prices of and the income generated by the Fund’s securities may decline in response to, among other things, investor sentiment, general economic and market conditions, regional or global instability, and currency and interest rate fluctuations. |
About indexes used in this report
| n | | The S&P 500® Index is an unmanaged index considered representative of the US stock market. |
| n | | The Russell 1000® Index is an unmanaged index considered representative of large-cap stocks. The Russell 1000 Index is a trademark/service mark of the Frank Russell Co. Russell® is a trademark of the Frank Russell Co. |
| n | | The Lipper Large-Cap Core Funds Index is an unmanaged index considered representative of large-cap core funds tracked by Lipper. |
| n | | The Fund is not managed to track the performance of any particular index, including the index(es) defined here, and consequently, the performance of the Fund may deviate significantly from the performance of the index(es). |
| n | | A direct investment cannot be made in an index. Unless otherwise indicated, index results include reinvested dividends, and they do not reflect sales charges. Performance of the peer group, if applicable, reflects fund expenses; performance of a market index does not. |
Other information
| n | | The returns shown in management’s discussion of Fund performance are based on net asset values calculated for shareholder transactions. Generally accepted accounting principles require adjustments to be made to the net assets of the Fund at period end for financial reporting purposes, and as such, the net asset values for shareholder transactions and the returns based on those net asset values may differ from the net asset values and returns reported in the Financial Highlights. |
| n | | Industry classifications used in this report are generally according to the Global Industry Classification Standard, which was developed by and is the exclusive property and a service mark of MSCI Inc. and Standard & Poor’s. |
This report must be accompanied or preceded by a currently effective Fund prospectus, which contains more complete information, including sales charges and expenses. Investors should read it carefully before investing.
|
| NOT FDIC INSURED | MAY LOSE VALUE | NO BANK GUARANTEE |
| | |
Fund Nasdaq Symbols |
| |
Class A Shares | | CHTRX |
Class B Shares | | BCHTX |
Class C Shares | | CHTCX |
Class R Shares | | CHRRX |
Class S Shares | | CHRSX |
Class Y Shares | | CHTYX |
Class R5 Shares | | CHTVX |
Class R6 Shares | | CHFTX |
8 Invesco Charter Fund
Schedule of Investments(a)
October 31, 2012
| | | | | | | | |
| | | Shares | | | Value | |
Common Stocks & Other Equity Interests–78.58% | |
Aerospace & Defense–0.73% | |
Boeing Co. (The) | | | 550,612 | | | $ | 38,785,109 | |
|
Air Freight & Logistics–1.01% | |
FedEx Corp. | | | 149,379 | | | | 13,741,374 | |
United Parcel Service, Inc.–Class B | | | 549,609 | | | | 40,258,860 | |
| | | | | | | | 54,000,234 | |
|
Application Software–2.18% | |
Adobe Systems Inc.(b) | | | 3,416,141 | | | | 116,148,794 | |
|
Asset Management & Custody Banks–1.61% | |
Northern Trust Corp. | | | 1,799,955 | | | | 86,001,850 | |
|
Biotechnology–1.02% | |
Gilead Sciences, Inc.(b) | | | 813,272 | | | | 54,619,348 | |
| | |
Brewers–1.03% | | | | | | | | |
Molson Coors Brewing Co.–Class B | | | 1,269,509 | | | | 54,766,618 | |
|
Casinos & Gaming–1.17% | |
Las Vegas Sands Corp. | | | 1,347,437 | | | | 62,574,974 | |
|
Communications Equipment–4.29% | |
Cisco Systems, Inc. | | | 4,147,757 | | | | 71,092,555 | |
F5 Networks, Inc.(b) | | | 569,348 | | | | 46,959,823 | |
QUALCOMM, Inc. | | | 1,250,878 | | | | 73,270,179 | |
Telefonaktiebolaget LM Ericsson–ADR (Sweden) | | | 4,259,564 | | | | 37,867,524 | |
| | | | | | | | 229,190,081 | |
|
Construction Materials–0.41% | |
CRH PLC (Ireland) | | | 1,173,344 | | | | 21,900,845 | |
| | |
Consumer Finance–1.93% | | | | | | | | |
American Express Co. | | | 1,836,995 | | | | 102,816,610 | |
| | |
Department Stores–1.95% | | | | | | | | |
Macy’s, Inc. | | | 2,732,891 | | | | 104,041,160 | |
| | |
Diversified Banks–1.20% | | | | | | | | |
U.S. Bancorp | | | 1,934,146 | | | | 64,232,989 | |
| | |
Electric Utilities–1.22% | | | | | | | | |
Exelon Corp. | | | 1,824,190 | | | | 65,269,518 | |
|
Electronic Manufacturing Services–1.21% | |
TE Connectivity Ltd. (Switzerland) | | | 2,008,243 | | | | 64,625,260 | |
|
Environmental & Facilities Services–1.06% | |
Waste Management, Inc. | | | 1,730,921 | | | | 56,670,354 | |
| | |
Food Retail–1.56% | | | | | | | | |
Kroger Co. (The) | | | 3,308,210 | | | | 83,433,056 | |
| | | | | | | | |
| | | Shares | | | Value | |
General Merchandise Stores–0.79% | |
Target Corp. | | | 659,920 | | | $ | 42,069,900 | |
| | |
Gold–1.32% | | | | | | | | |
Agnico-Eagle Mines Ltd. (Canada) | | | 339,322 | | | | 19,168,300 | |
Kinross Gold Corp. (Canada) | | | 3,315,731 | | | | 33,124,153 | |
Newcrest Mining Ltd. (Australia) | | | 660,998 | | | | 18,040,899 | |
| | | | | | | | 70,333,352 | |
| | |
Health Care Equipment–1.75% | | | | | | | | |
Baxter International Inc. | | | 622,560 | | | | 38,990,933 | |
Covidien PLC | | | 989,438 | | | | 54,369,618 | |
| | | | | | | | 93,360,551 | |
|
Heavy Electrical Equipment–1.12% | |
ABB Ltd. (Switzerland)(b) | | | 3,296,312 | | | | 59,556,400 | |
|
Home Improvement Retail–1.20% | |
Lowe’s Cos., Inc. | | | 1,984,645 | | | | 64,262,805 | |
| | |
Household Products–1.92% | | | | | | | | |
Procter & Gamble Co. (The) | | | 1,475,713 | | | | 102,178,368 | |
|
Industrial Conglomerates–1.82% | |
General Electric Co. | | | 4,606,764 | | | | 97,018,450 | |
| | |
Industrial Gases–1.15% | | | | | | | | |
Air Products & Chemicals, Inc. | | | 789,048 | | | | 61,174,891 | |
| | |
Industrial Machinery–0.88% | | | | | | | | |
Illinois Tool Works Inc. | | | 766,720 | | | | 47,022,938 | |
| | |
Insurance Brokers–1.21% | | | | | | | | |
Marsh & McLennan Cos., Inc. | | | 1,897,084 | | | | 64,557,769 | |
| | |
Integrated Oil & Gas–1.62% | | | | | | | | |
Exxon Mobil Corp. | | | 950,000 | | | | 86,611,500 | |
|
Internet Software & Services–1.19% | |
eBay Inc.(b) | | | 1,310,931 | | | | 63,304,858 | |
|
Investment Banking & Brokerage–0.65% | |
Charles Schwab Corp. (The) | | | 2,557,190 | | | | 34,726,640 | |
|
Life Sciences Tools & Services–2.37% | |
Agilent Technologies, Inc. | | | 1,719,629 | | | | 61,889,448 | |
Thermo Fisher Scientific, Inc. | | | 1,061,324 | | | | 64,804,443 | |
| | | | | | | | 126,693,891 | |
|
Managed Health Care–1.23% | |
Humana Inc. | | | 202,210 | | | | 15,018,137 | |
WellPoint, Inc. | | | 827,045 | | | | 50,681,317 | |
| | | | | | | | 65,699,454 | |
See accompanying Notes to Financial Statements which are an integral part of the financial statements.
9 Invesco Charter Fund
| | | | | | | | |
| | | Shares | | | Value | |
|
Office Services & Supplies–0.61% | |
Pitney Bowes Inc. | | | 2,278,000 | | | $ | 32,712,080 | |
|
Oil & Gas Equipment & Services–3.56% | |
Cameron International Corp.(b) | | | 778,986 | | | | 39,447,851 | |
National Oilwell Varco Inc. | | | 1,113,721 | | | | 82,081,238 | |
Schlumberger Ltd. | | | 192,275 | | | | 13,368,881 | |
Weatherford International Ltd.(b) | | | 4,897,161 | | | | 55,337,919 | |
| | | | | | | | 190,235,889 | |
|
Oil & Gas Exploration & Production–1.93% | |
Anadarko Petroleum Corp. | | | 447,064 | | | | 30,762,474 | |
Devon Energy Corp. | | | 430,800 | | | | 25,076,868 | |
EOG Resources, Inc. | | | 123,144 | | | | 14,345,045 | |
Pioneer Natural Resources Co. | | | 239,969 | | | | 25,352,725 | |
Talisman Energy Inc. (Canada) | | | 678,108 | | | | 7,683,866 | |
| | | | | | | | 103,220,978 | |
| | |
Packaged Foods & Meats–3.33% | | | | | | | | |
Danone S.A. (France) | | | 942,380 | | | | 58,019,994 | |
Kellogg Co. | | | 2,290,000 | | | | 119,812,800 | |
| | | | | | | | 177,832,794 | |
| | |
Paper Products–0.29% | | | | | | | | |
International Paper Co. | | | 433,705 | | | | 15,539,650 | |
| | |
Pharmaceuticals–12.44% | | | | | | | | |
Eli Lilly & Co. | | | 850,770 | | | | 41,372,945 | |
GlaxoSmithKline PLC–ADR (United Kingdom) | | | 437,032 | | | | 19,622,737 | |
Johnson & Johnson | | | 602,878 | | | | 42,695,820 | |
Merck & Co., Inc. | | | 1,947,125 | | | | 88,847,313 | |
Novartis AG–ADR (Switzerland) | | | 1,631,576 | | | | 98,645,085 | |
Pfizer Inc. | | | 3,375,648 | | | | 83,952,366 | |
Roche Holding AG (Switzerland) | | | 521,878 | | | | 100,454,043 | |
Sanofi–ADR (France) | | | 2,369,388 | | | | 103,897,664 | |
Teva Pharmaceutical Industries Ltd.–ADR (Israel) | | | 2,096,774 | | | | 84,751,605 | |
| | | | | | | | 664,239,578 | |
| | | | | | | | |
| | | Shares | | | Value | |
|
Property & Casualty Insurance–4.19% | |
Berkshire Hathaway Inc.–Class A(b) | | | 780 | | | $ | 101,013,900 | |
Progressive Corp. (The) | | | 5,490,898 | | | | 122,447,025 | |
| | | | | | | | 223,460,925 | |
| | |
Railroads–0.80% | | | | | | | | |
Union Pacific Corp. | | | 346,705 | | | | 42,655,116 | |
| | |
Semiconductors–2.28% | | | | | | | | |
Analog Devices, Inc. | | | 1,318,445 | | | | 51,564,384 | |
Taiwan Semiconductor Manufacturing Co. Ltd. (Taiwan) | | | 23,007,019 | | | | 69,856,659 | |
| | | | | | | | 121,421,043 | |
| | |
Systems Software–3.93% | | | | | | | | |
Microsoft Corp. | | | 3,636,211 | | | | 103,759,281 | |
Symantec Corp.(b) | | | 5,837,584 | | | | 106,185,653 | |
| | | | | | | | 209,944,934 | |
|
Wireless Telecommunication Services–1.42% | |
Vodafone Group PLC (United Kingdom) | | | 27,816,628 | | | | 75,523,543 | |
Total Common Stocks & Other Equity Interests (Cost $3,543,401,668) | | | | 4,194,435,097 | |
|
Money Market Funds–16.95% | |
Liquid Assets Portfolio–Institutional Class(c) | | | 452,426,624 | | | | 452,426,624 | |
Premier Portfolio–Institutional Class(c) | | | 452,426,625 | | | | 452,426,625 | |
Total Money Market Funds
(Cost $904,853,249) | | | | 904,853,249 | |
TOTAL INVESTMENTS–95.53%
(Cost $4,448,254,917) | | | | 5,099,288,346 | |
OTHER ASSETS LESS LIABILITIES–4.47% | | | | 238,481,179 | |
NET ASSETS–100.00% | | | | | | $ | 5,337,769,525 | |
Investment Abbreviations:
| | |
| ADR | | – American Depositary Receipt |
Notes to Schedule of Investments:
| (a) | Industry and/or sector classifications used in this report are generally according to the Global Industry Classification Standard, which was developed by and is the exclusive property and a service mark of MSCI Inc. and Standard & Poor’s. |
| (b) | Non-income producing security. |
| (c) | The money market fund and the Fund are affiliated by having the same investment adviser. |
See accompanying Notes to Financial Statements which are an integral part of the financial statements.
10 Invesco Charter Fund
Statement of Assets and Liabilities
October 31, 2012
| | | | |
Assets: | |
Investments, at value (Cost $3,543,401,668) | | $ | 4,194,435,097 | |
Investments in affiliated money market funds, at value and cost | | | 904,853,249 | |
Total investments, at value (Cost $4,448,254,917) | | | 5,099,288,346 | |
Foreign currencies, at value (Cost $6,050,667) | | | 6,172,427 | |
Receivable for: | | | | |
Investments sold | | | 765,688,537 | |
Fund shares sold | | | 4,984,732 | |
Dividends | | | 4,457,558 | |
Investment for trustee deferred compensation and retirement plans | | | 499,176 | |
Other assets | | | 96,627 | |
Total assets | | | 5,881,187,403 | |
|
Liabilities: | |
Payable for: | | | | |
Investments purchased | | | 526,388,953 | |
Fund shares reacquired | | | 10,989,052 | |
Accrued fees to affiliates | | | 3,567,538 | |
Accrued other operating expenses | | | 602,452 | |
Trustee deferred compensation and retirement plans | | | 1,869,883 | |
Total liabilities | | | 543,417,878 | |
Net assets applicable to shares outstanding | | $ | 5,337,769,525 | |
|
Net assets consist of: | |
Shares of beneficial interest | | $ | 4,711,525,764 | |
Undistributed net investment income | | | 52,977,869 | |
Undistributed net realized gain (loss) | | | (78,251,562 | ) |
Unrealized appreciation | | | 651,517,454 | |
| | | $ | 5,337,769,525 | |
| | | | |
Net Assets: | |
Class A | | $ | 4,025,450,629 | |
Class B | | $ | 125,314,894 | |
Class C | | $ | 247,719,212 | |
Class R | | $ | 81,502,842 | |
Class S | | $ | 21,071,608 | |
Class Y | | $ | 362,230,687 | |
Class R5 | | $ | 378,445,617 | |
Class R6 | | $ | 96,034,036 | |
|
Shares outstanding, $0.001 par value per share,
with an unlimited number of shares authorized: | |
Class A | | | 226,978,974 | |
Class B | | | 7,390,432 | |
Class C | | | 14,572,026 | |
Class R | | | 4,634,582 | |
Class S | | | 1,187,000 | |
Class Y | | | 20,337,164 | |
Class R5 | | | 20,691,811 | |
Class R6 | | | 5,249,558 | |
Class A: | | | | |
Net asset value per share | | $ | 17.73 | |
Maximum offering price per share | | | | |
(Net asset value of $17.73 ÷ 94.50%) | | $ | 18.76 | |
Class B: | | | | |
Net asset value and offering price per share | | $ | 16.96 | |
Class C: | | | | |
Net asset value and offering price per share | | $ | 17.00 | |
Class R: | | | | |
Net asset value and offering price per share | | $ | 17.59 | |
Class S: | | | | |
Net asset value and offering price per share | | $ | 17.75 | |
Class Y: | | | | |
Net asset value and offering price per share | | $ | 17.81 | |
Class R5: | | | | |
Net asset value and offering price per share | | $ | 18.29 | |
Class R6: | | | | |
Net asset value and offering price per share | | $ | 18.29 | |
See accompanying Notes to Financial Statements which are an integral part of the financial statements.
11 Invesco Charter Fund
Statement of Operations
For the year ended October 31, 2012
| | | | |
Investment income: | |
Dividends (net of foreign withholding taxes of $3,233,242) | | $ | 99,580,184 | |
Dividends from affiliated money market funds | | | 1,263,686 | |
Total investment income | | | 100,843,870 | |
| |
Expenses: | | | | |
Advisory fees | | | 32,516,132 | |
Administrative services fees | | | 660,338 | |
Custodian fees | | | 347,757 | |
Distribution fees: | | | | |
Class A | | | 10,132,676 | |
Class B | | | 1,475,844 | |
Class C | | | 2,554,595 | |
Class R | | | 381,112 | |
Class S | | | 31,790 | |
Transfer agent fees — A, B, C, R, S and Y | | | 10,454,788 | |
Transfer agent fees — R5 | | | 191,636 | |
Transfer agent fees — R6 | | | 5,234 | |
Trustees’ and officers’ fees and benefits | | | 302,240 | |
Other | | | 1,017,980 | |
Total expenses | | | 60,072,122 | |
Less: Fees waived and expense offset arrangement(s) | | | (1,311,768 | ) |
Net expenses | | | 58,760,354 | |
Net investment income | | | 42,083,516 | |
| |
Realized and unrealized gain from: | | | | |
Net realized gain from: | | | | |
Investment securities (includes net gains (losses) from securities sold to affiliates of $(385,643)) | | | 137,492,639 | |
Foreign currencies | | | 265,899 | |
| | | | 137,758,538 | |
Change in net unrealized appreciation of: | | | | |
Investment securities | | | 278,554,546 | |
Foreign currencies | | | 338,236 | |
| | | | 278,892,782 | |
Net realized and unrealized gain | | | 416,651,320 | |
Net increase in net assets resulting from operations | | $ | 458,734,836 | |
See accompanying Notes to Financial Statements which are an integral part of the financial statements.
12 Invesco Charter Fund
Statement of Changes in Net Assets
For the years ended October 31, 2012 and 2011
| | | | | | | | |
| | | 2012 | | | 2011 | |
Operations: | | | | | |
Net investment income | | $ | 42,083,516 | | | $ | 32,201,914 | |
Net realized gain | | | 137,758,538 | | | | 246,460,031 | |
Change in net unrealized appreciation | | | 278,892,782 | | | | 104,266,673 | |
Net increase in net assets resulting from operations | | | 458,734,836 | | | | 382,928,618 | |
| | |
Distributions to shareholders from net investment income: | | | | | | | | |
Class A | | | (25,075,364 | ) | | | (16,996,643 | ) |
Class R | | | (299,961 | ) | | | (119,814 | ) |
Class S | | | (149,780 | ) | | | (108,864 | ) |
Class Y | | | (1,625,174 | ) | | | (1,185,231 | ) |
Class R5 | | | (3,843,725 | ) | | | (5,169,364 | ) |
Total distributions from net investment income | | | (30,994,004 | ) | | | (23,579,916 | ) |
| | |
Share transactions-net: | | | | | | | | |
Class A | | | (307,172,847 | ) | | | (296,875,399 | ) |
Class B | | | (55,792,273 | ) | | | (55,866,676 | ) |
Class C | | | (30,249,202 | ) | | | (2,314,895 | ) |
Class R | | | 9,098,086 | | | | 5,464,706 | |
Class S | | | (1,721,333 | ) | | | (247,092 | ) |
Class Y | | | 145,476,560 | | | | 8,202,887 | |
Class R5 | | | (62,061,326 | ) | | | (202,986,610 | ) |
Class R6 | | | 97,854,903 | | | | — | |
Net increase (decrease) in net assets resulting from share transactions | | | (204,567,432 | ) | | | (544,623,079 | ) |
Net increase (decrease) in net assets | | | 223,173,400 | | | | (185,274,377 | ) |
| | |
Net assets: | | | | | | | | |
Beginning of year | | | 5,114,596,125 | | | | 5,299,870,502 | |
End of year (includes undistributed net investment income of $52,977,869 and $29,321,282 respectively) | | $ | 5,337,769,525 | | | $ | 5,114,596,125 | |
Notes to Financial Statements
October 31, 2012
NOTE 1—Significant Accounting Policies
Invesco Charter Fund (the “Fund”) is a series portfolio of AIM Equity Funds (Invesco Equity Funds) (the “Trust”). The Trust is a Delaware statutory trust registered under the Investment Company Act of 1940, as amended (the “1940 Act”), as an open-end series management investment company consisting of five separate portfolios, each authorized to issue an unlimited number of shares of beneficial interest. The assets, liabilities and operations of each portfolio are accounted for separately. Information presented in these financial statements pertains only to the Fund. Matters affecting each portfolio or class will be voted on exclusively by the shareholders of such portfolio or class.
The Fund’s investment objective is long-term growth of capital.
The Fund currently consists of eight different classes of shares: Class A, Class B, Class C, Class R, Class S, Class Y, Class R5 and Class R6. On September 24, 2012, Institutional Class shares were renamed Class R5 shares and the Fund began offering Class R6 shares. Class A shares are sold with a front-end sales charge unless certain waiver criteria are met and under certain circumstances load waived shares may be subject to contingent deferred sales charges (“CDSC”). Class C shares are sold with a CDSC. Class R, Class S, Class Y, Class R5 and Class R6 shares are sold at net asset value. Effective November 30, 2010, new or additional investments in Class B shares are no longer permitted. Existing shareholders of Class B shares may continue to reinvest dividends and capital gains distributions in Class B shares until they convert to Class A shares. Also, shareholders in Class B shares will be able to exchange those shares for Class B shares of other Invesco Funds offering such shares until they convert to Class A shares. Generally, Class B shares will automatically convert to Class A shares on or about the month-end, which is at least eight years after the date of purchase. Redemption of Class B shares prior to the conversion date will be subject to a CDSC.
The following is a summary of the significant accounting policies followed by the Fund in the preparation of its financial statements.
| A. | Security Valuations — Securities, including restricted securities, are valued according to the following policy. |
A security listed or traded on an exchange (except convertible bonds) is valued at its last sales price or official closing price as of the close of the customary trading session on the exchange where the security is principally traded, or lacking any sales or official closing price on a particular
13 Invesco Charter Fund
day, the security may be valued at the closing bid price on that day. Securities traded in the over-the-counter market are valued based on prices furnished by independent pricing services or market makers. When such securities are valued by an independent pricing service they may be considered fair valued. Futures contracts are valued at the final settlement price set by an exchange on which they are principally traded. Listed options are valued at the mean between the last bid and ask prices from the exchange on which they are principally traded. Options not listed on an exchange are valued by an independent source at the mean between the last bid and ask prices. For purposes of determining net asset value per share, futures and option contracts generally are valued 15 minutes after the close of the customary trading session of the New York Stock Exchange (“NYSE”).
Investments in open-end and closed-end registered investment companies that do not trade on an exchange are valued at the end of day net asset value per share. Investments in open-end and closed-end registered investment companies that trade on an exchange are valued at the last sales price or official closing price as of the close of the customary trading session on the exchange where the security is principally traded.
Debt obligations (including convertible bonds) and unlisted equities are fair valued using an evaluated quote provided by an independent pricing service. Evaluated quotes provided by the pricing service may be determined without exclusive reliance on quoted prices, and may reflect appropriate factors such as institution-size trading in similar groups of securities, developments related to specific securities, dividend rate, yield, quality, type of issue, coupon rate, maturity, individual trading characteristics and other market data. Debt securities are subject to interest rate and credit risks. In addition, all debt securities involve some risk of default with respect to interest and/or principal payments.
Foreign securities (including foreign exchange contracts) are converted into U.S. dollar amounts using the applicable exchange rates as of the close of the NYSE. If market quotations are available and reliable for foreign exchange traded equity securities, the securities will be valued at the market quotations. Because trading hours for certain foreign securities end before the close of the NYSE, closing market quotations may become unreliable. If between the time trading ends on a particular security and the close of the customary trading session on the NYSE, events occur that are significant and make the closing price unreliable, the Fund may fair value the security. If the event is likely to have affected the closing price of the security, the security will be valued at fair value in good faith using procedures approved by the Board of Trustees. Adjustments to closing prices to reflect fair value may also be based on a screening process of an independent pricing service to indicate the degree of certainty, based on historical data, that the closing price in the principal market where a foreign security trade is not the current value as of the close of the NYSE. Foreign securities meeting the approved degree of certainty that the price is not reflective of current value will be priced at the indication of fair value from the independent pricing service. Multiple factors may be considered by the independent pricing service in determining adjustments to reflect fair value and may include information relating to sector indices, American Depositary Receipts and domestic and foreign index futures. Foreign securities may have additional risks including exchange rate changes, potential for sharply devalued currencies and high inflation, political and economic upheaval, the relative lack of issuer information, relatively low market liquidity and the potential lack of strict financial and accounting controls and standards.
Securities for which market prices are not provided by any of the above methods may be valued based upon quotes furnished by independent sources. The last bid price may be used to value equity securities. The mean between the last bid and asked prices is used to value debt obligations, including corporate loans.
Securities for which market quotations are not readily available or are unreliable are valued at fair value as determined in good faith by or under the supervision of the Trust’s officers following procedures approved by the Board of Trustees. Issuer specific events, market trends, bid/ask quotes of brokers and information providers and other market data may be reviewed in the course of making a good faith determination of a security’s fair value.
Valuations change in response to many factors including the historical and prospective earnings of the issuer, the value of the issuer’s assets, general economic conditions, interest rates, investor perceptions and market liquidity. Because of the inherent uncertainties of valuation, the values reflected in the financial statements may materially differ from the value received upon actual sale of those investments.
| B. | Securities Transactions and Investment Income — Securities transactions are accounted for on a trade date basis. Realized gains or losses on sales are computed on the basis of specific identification of the securities sold. Interest income is recorded on the accrual basis from settlement date. Dividend income (net of withholding tax, if any) is recorded on the ex-dividend date. |
The Fund may periodically participate in litigation related to Fund investments. As such, the Fund may receive proceeds from litigation settlements. Any proceeds received are included in the Statement of Operations as realized gain (loss) for investments no longer held and as unrealized gain (loss) for investments still held.
Brokerage commissions and mark ups are considered transaction costs and are recorded as an increase to the cost basis of securities purchased and/or a reduction of proceeds on a sale of securities. Such transaction costs are included in the determination of net realized and unrealized gain (loss) from investment securities reported in the Statement of Operations and the Statement of Changes in Net Assets and the net realized and unrealized gains (losses) on securities per share in the Financial Highlights. Transaction costs are included in the calculation of the Fund’s net asset value and, accordingly, they reduce the Fund’s total returns. These transaction costs are not considered operating expenses and are not reflected in net investment income reported in the Statement of Operations and Statement of Changes in Net Assets, or the net investment income per share and ratios of expenses and net investment income reported in the Financial Highlights, nor are they limited by any expense limitation arrangements between the Fund and the investment adviser.
The Fund allocates income and realized and unrealized capital gains and losses to a class based on the relative net assets of each class.
| C. | Country Determination — For the purposes of making investment selection decisions and presentation in the Schedule of Investments, the investment adviser may determine the country in which an issuer is located and/or credit risk exposure based on various factors. These factors include the laws of the country under which the issuer is organized, where the issuer maintains a principal office, the country in which the issuer derives 50% or more of its total revenues and the country that has the primary market for the issuer’s securities, as well as other criteria. Among the other criteria that may be evaluated for making this determination are the country in which the issuer maintains 50% or more of its assets, the type of security, financial guarantees and enhancements, the nature of the collateral and the sponsor organization. Country of issuer and/or credit risk exposure has been determined to be the United States of America, unless otherwise noted. |
| D. | Distributions — Distributions from income and net realized capital gain, if any, are generally declared and paid annually and recorded on the ex-dividend date. The Fund may elect to treat a portion of the proceeds from redemptions as distributions for federal income tax purposes. |
14 Invesco Charter Fund
| E. | Federal Income Taxes — The Fund intends to comply with the requirements of Subchapter M of the Internal Revenue Code necessary to qualify as a regulated investment company and to distribute substantially all of the Fund’s taxable earnings to shareholders. As such, the Fund will not be subject to federal income taxes on otherwise taxable income (including net realized capital gain) that is distributed to shareholders. Therefore, no provision for federal income taxes is recorded in the financial statements. |
The Fund files tax returns in the U.S. Federal jurisdiction and certain other jurisdictions. Generally, the Fund is subject to examinations by such taxing authorities for up to three years after the filing of the return for the tax period.
| F. | Expenses — Fees provided for under the Rule 12b-1 plan of a particular class of the Fund are charged to the operations of such class. Transfer agency fees and expenses and other shareholder recordkeeping fees and expenses attributable to Class R5 and Class R6 are allocated to each share class based on relative net assets. Sub-accounting fees attributable to Class R5 are charged to the operations of the class. Transfer agency fees and expenses and other shareholder recordkeeping fees and expenses relating to all other classes are allocated among those classes based on relative net assets. All other expenses are allocated among the classes based on relative net assets. |
| G. | Accounting Estimates — The preparation of financial statements in conformity with accounting principles generally accepted in the United States of America (“GAAP”) requires management to make estimates and assumptions that affect the reported amounts of assets and liabilities at the date of the financial statements and the reported amounts of revenues and expenses during the reporting period including estimates and assumptions related to taxation. Actual results could differ from those estimates by a significant amount. In addition, the Fund monitors for material events or transactions that may occur or become known after the period-end date and before the date the financial statements are released to print. |
| H. | Indemnifications — Under the Trust’s organizational documents, each Trustee, officer, employee or other agent of the Trust is indemnified against certain liabilities that may arise out of the performance of their duties to the Fund. Additionally, in the normal course of business, the Fund enters into contracts, including the Fund’s servicing agreements, that contain a variety of indemnification clauses. The Fund’s maximum exposure under these arrangements is unknown as this would involve future claims that may be made against the Fund that have not yet occurred. The risk of material loss as a result of such indemnification claims is considered remote. |
| I. | Foreign Currency Translations — Foreign currency is valued at the close of the NYSE based on quotations posted by banks and major currency dealers. Portfolio securities and other assets and liabilities denominated in foreign currencies are translated into U.S. dollar amounts at date of valuation. Purchases and sales of portfolio securities (net of foreign taxes withheld on disposition) and income items denominated in foreign currencies are translated into U.S. dollar amounts on the respective dates of such transactions. The Fund does not separately account for the portion of the results of operations resulting from changes in foreign exchange rates on investments and the fluctuations arising from changes in market prices of securities held. The combined results of changes in foreign exchange rates and the fluctuation of market prices on investments (net of estimated foreign tax withholding) are included with the net realized and unrealized gain or loss from investments in the Statement of Operations. Reported net realized foreign currency gains or losses arise from (1) sales of foreign currencies, (2) currency gains or losses realized between the trade and settlement dates on securities transactions, and (3) the difference between the amounts of dividends, interest, and foreign withholding taxes recorded on the Fund’s books and the U.S. dollar equivalent of the amounts actually received or paid. Net unrealized foreign currency gains and losses arise from changes in the fair values of assets and liabilities, other than investments in securities at fiscal period end, resulting from changes in exchange rates. |
The Fund may invest in foreign securities which may be subject to foreign taxes on income, gains on investments or currency repatriation, a portion of which may be recoverable.
| J. | Foreign Currency Contracts — The Fund may enter into foreign currency contracts to manage or minimize currency or exchange rate risk. The Fund may also enter into foreign currency contracts for the purchase or sale of a security denominated in a foreign currency in order to “lock in” the U.S. dollar price of that security. A foreign currency contract is an obligation to purchase or sell a specific currency for an agreed-upon price at a future date. The use of foreign currency contracts does not eliminate fluctuations in the price of the underlying securities the Fund owns or intends to acquire but establishes a rate of exchange in advance. Fluctuations in the value of these contracts are measured by thedifference in the contract date and reporting date exchange rates and are recorded as unrealized appreciation (depreciation) until the contracts are closed. When the contracts are closed, realized gains (losses) are recorded. Realized and unrealized gains (losses) on the contracts are included in the Statement of Operations. The primary risks associated with foreign currency contracts include failure of the counterparty to meet the terms of the contract and the value of the foreign currency changing unfavorably. These risks may be in excess of the amounts reflected in the Statement of Assets and Liabilities. |
NOTE 2—Advisory Fees and Other Fees Paid to Affiliates
The Trust has entered into a master investment advisory agreement with Invesco Advisers, Inc. (the “Adviser” or “Invesco”). Under the terms of the investment advisory agreement, the Fund pays an advisory fee to the Adviser based on the annual rate of the Fund’s average daily net assets as follows:
| | | | | | |
| Average Daily Net Assets | | Rate |
First $250 million | | | 0 | .695% | | |
Next $4.05 billion | | | 0 | .615% | | |
Next $3.9 billion | | | 0 | .57% | | |
Next $1.8 billion | | | 0 | .545% | | |
Over $10 billion | | | 0 | .52% | | |
Under the terms of a master sub-advisory agreement between the Adviser and each of Invesco Asset Management Deutschland GmbH, Invesco Asset Management Limited, Invesco Asset Management (Japan) Limited, Invesco Australia Limited, Invesco Hong Kong Limited, Invesco Senior Secured Management, Inc. and Invesco Canada Ltd. (collectively, the “Affiliated Sub-Advisers”) the Adviser, not the Fund, may pay 40% of the fees paid to the Adviser to any such Affiliated Sub-Adviser(s) that provide discretionary investment management services to the Fund based on the percentage of assets allocated to such Sub-Adviser(s).
15 Invesco Charter Fund
The Adviser has contractually agreed, through at least June 30, 2013, to waive advisory fees and/or reimburse expenses of all shares to the extent necessary to limit total annual fund operating expenses after fee waiver and/or expense reimbursement (excluding certain items discussed below) of Class A, Class B, Class C, Class R, Class S, Class Y, Class R5 and Class R6 shares to 2.00%, 2.75%, 2.75%, 2.25%, 1.90%, 1.75%, 1.75% and 1.75%, respectively, of average daily net assets. In determining the Adviser’s obligation to waive advisory fees and/or reimburse expenses, the following expenses are not taken into account, and could cause the total annual fund operating expenses after fee waiver and/or expense reimbursement to exceed the numbers reflected above: (1) interest; (2) taxes; (3) dividend expense on short sales; (4) extraordinary or non-routine items, including litigation expenses; and (5) expenses that the Fund has incurred but did not actually pay because of an expense offset arrangement. Unless the Board of Trustees and Invesco mutually agree to amend or continue the fee waiver agreement, it will terminate on June 30, 2013. The Adviser did not waive fees and/or reimburse expenses during the period under this expense limitation.
Further, the Adviser has contractually agreed, through at least June 30, 2013, to waive the advisory fee payable by the Fund in an amount equal to 100% of the net advisory fees the Adviser receives from the affiliated money market funds on investments by the Fund of uninvested cash (excluding investments of cash collateral from securities lending) in such affiliated money market funds.
For the year ended October 31, 2012, the Adviser waived advisory fees of $1,290,677.
The Trust has entered into a master administrative services agreement with Invesco pursuant to which the Fund has agreed to pay Invesco for certain administrative costs incurred in providing accounting services to the Fund. For the year ended October 31, 2012, expenses incurred under the agreement are shown in the Statement of Operations as Administrative services fees.
The Trust has entered into a transfer agency and service agreement with Invesco Investment Services, Inc. (“IIS”) pursuant to which the Fund has agreed to pay IIS a fee for providing transfer agency and shareholder services to the Fund and reimburse IIS for certain expenses incurred by IIS in the course of providing such services. IIS may make payments to intermediaries that provide omnibus account services, sub-accounting services and/or networking services. All fees payable by IIS to intermediaries that provide omnibus account services or sub-accounting are charged back to the Fund, subject to certain limitations approved by the Trust’s Board of Trustees. For the year ended October 31, 2012, expenses incurred under the agreement are shown in the Statement of Operations as Transfer agent fees.
The Trust has entered into master distribution agreements with Invesco Distributors, Inc. (“IDI”) to serve as the distributor for the Class A, Class B, Class C, Class R, Class S, Class Y, Class R5 and Class R6 shares of the Fund. The Trust has adopted plans pursuant to Rule 12b-1 under the 1940 Act with respect to the Fund’s Class A, Class B, Class C, Class R and Class S shares (collectively, the “Plans”). The Fund, pursuant to the Plans, pays IDI compensation at the annual rate of 0.25% of the Fund’s average daily net assets of Class A shares, 1.00% of the average daily net assets of Class B and Class C shares, 0.50% of the average daily net assets of Class R shares and 0.15% of the average daily net assets of Class S shares. Of the Plan payments, up to 0.25% of the average daily net assets of each class of shares may be paid to furnish continuing personal shareholder services to customers who purchase and own shares of such classes. Any amounts not paid as a service fee under the Plans would constitute an asset-based sales charge. Rules of the Financial Industry Regulatory Authority (“FINRA”) impose a cap on the total sales charges, including asset-based sales charges, that may be paid by any class of shares of the Fund. For the year ended October 31, 2012, expenses incurred under the Plans are shown in the Statement of Operations as Distribution fees.
Front-end sales commissions and CDSC (collectively, the “sales charges”) are not recorded as expenses of the Fund. Front-end sales commissions are deducted from proceeds from the sales of Fund shares prior to investment in Class A shares of the Fund. CDSC are deducted from redemption proceeds prior to remittance to the shareholder. During the year ended October 31, 2012, IDI advised the Fund that IDI retained $356,934 in front-end sales commissions from the sale of Class A shares and $1,837, $149,348 and $9,014 from Class A, Class B and Class C shares, respectively, for CDSC imposed on redemptions by shareholders.
Certain officers and trustees of the Trust are officers and directors of the Adviser, IIS and/or IDI.
NOTE 3—Additional Valuation Information
GAAP defines fair value as the price that would be received to sell an asset or paid to transfer a liability in an orderly transaction between market participants at the measurement date, under current market conditions. GAAP establishes a hierarchy that prioritizes the inputs to valuation methods giving the highest priority to readily available unadjusted quoted prices in an active market for identical assets (Level 1) and the lowest priority to significant unobservable inputs (Level 3) generally when market prices are not readily available or are unreliable. Based on the valuation inputs, the securities or other investments are tiered into one of three levels. Changes in valuation methods may result in transfers in or out of an investment’s assigned level:
| | Level 1 — | Prices are determined using quoted prices in an active market for identical assets. |
| | Level 2 — | Prices are determined using other significant observable inputs. Observable inputs are inputs that other market participants may use in pricing a security. These may include quoted prices for similar securities, interest rates, prepayment speeds, credit risk, yield curves, loss severities, default rates, discount rates, volatilities and others. |
| | Level 3 — | Prices are determined using significant unobservable inputs. In situations where quoted prices or observable inputs are unavailable (for example, when there is little or no market activity for an investment at the end of the period), unobservable inputs may be used. Unobservable inputs reflect the Fund’s own assumptions about the factors market participants would use in determining fair value of the securities or instruments and would be based on the best available information. |
The following is a summary of the tiered valuation input levels, as of October 31, 2012. The level assigned to the securities valuations may not be an indication of the risk or liquidity associated with investing in those securities. Because of the inherent uncertainties of valuation, the values reflected in the financial statements may materially differ from the value received upon actual sale of those investments.
| | | | | | | | | | | | | | | | |
| | | Level 1 | | | Level 2 | | | Level 3 | | | Total | |
Equity Securities | | $ | 4,841,316,165 | | | $ | 257,972,181 | | | $ | — | | | $ | 5,099,288,346 | |
16 Invesco Charter Fund
NOTE 4—Security Transactions with Affiliated Funds
The Fund is permitted to purchase or sell securities from or to certain other Invesco Funds under specified conditions outlined in procedures adopted by the Board of Trustees of the Trust. The procedures have been designed to ensure that any purchase or sale of securities by the Fund from or to another fund or portfolio that is or could be considered an affiliate by virtue of having a common investment adviser (or affiliated investment advisers), common Trustees and/or common officers complies with Rule 17a-7 of the 1940 Act. Further, as defined under the procedures, each transaction is effected at the current market price. Pursuant to these procedures, for the year ended October 31, 2012, the Fund engaged in securities purchases of $2,538,280 and securities sales of $21,806,283, which resulted in net realized gains (losses) of $(385,643).
NOTE 5—Expense Offset Arrangement(s)
The expense offset arrangements are comprised of (1) transfer agency credits which result from balances in Demand Deposit Accounts (DDA) used by the transfer agent for clearing shareholder transactions and (2) custodian credits which result from periodic overnight cash balances at the custodian. For the year ended October 31, 2012, the Fund received credits from these arrangements, which resulted in the reduction of the Fund’s total expenses of $21,091.
NOTE 6—Trustees’ and Officers’ Fees and Benefits
“Trustees’ and Officers’ Fees and Benefits” include amounts accrued by the Fund to pay remuneration to certain Trustees and Officers of the Fund. Trustees have the option to defer compensation payable by the Fund, and “Trustees’ and Officers’ Fees and Benefits” also include amounts accrued by the Fund to fund such deferred compensation amounts. Those Trustees who defer compensation have the option to select various Invesco Funds in which their deferral accounts shall be deemed to be invested. Finally, certain current Trustees are eligible to participate in a retirement plan that provides for benefits to be paid upon retirement to Trustees over a period of time based on the number of years of service. The Fund may have certain former Trustees who also participate in a retirement plan and receive benefits under such plan. “Trustees’ and Officers’ Fees and Benefits” include amounts accrued by the Fund to fund such retirement benefits. Obligations under the deferred compensation and retirement plans represent unsecured claims against the general assets of the Fund.
During the year ended October 31, 2012, the Fund paid legal fees of $156 for services rendered by Kramer, Levin, Naftalis & Frankel LLP as counsel to the Independent Trustees. A partner of that firm is a Trustee of the Trust.
NOTE 7—Cash Balances
The Fund is permitted to temporarily carry a negative or overdrawn balance in its account with State Street Bank and Trust Company, the custodian bank. Such balances, if any at period end, are shown in the Statement of Assets and Liabilities under the payable caption Amount due custodian. To compensate the custodian bank for such overdrafts, the overdrawn Fund may either (1) leave funds as a compensating balance in the account so the custodian bank can be compensated by earning the additional interest; or (2) compensate by paying the custodian bank at a rate agreed upon by the custodian bank and Invesco, not to exceed the contractually agreed upon rate.
NOTE 8—Distributions to Shareholders and Tax Components of Net Assets
Tax Character of Distributions to Shareholders Paid During the Years Ended October 31, 2012 and 2011:
| | | | | | | | |
| | | 2012 | | | 2011 | |
Ordinary income | | $ | 30,994,004 | | | $ | 23,579,916 | |
Tax Components of Net Assets at Period-End:
| | | | |
| | | 2012 | |
Undistributed ordinary income | | $ | 54,790,277 | |
Net unrealized appreciation — investments | | | 644,756,685 | |
Net unrealized appreciation — other investments | | | 484,025 | |
Temporary book/tax differences | | | (1,812,409 | ) |
Capital loss carryforward | | | (71,974,817 | ) |
Shares of beneficial interest | | | 4,711,525,764 | |
Total net assets | | $ | 5,337,769,525 | |
The difference between book-basis and tax-basis unrealized appreciation (depreciation) is due to differences in the timing of recognition of gains and losses on investments for tax and book purposes. The Fund’s net unrealized appreciation difference is attributable primarily to wash sales.
The temporary book/tax differences are a result of timing differences between book and tax recognition of income and/or expenses. The Fund’s temporary book/tax differences are the result of the trustee deferral of compensation and retirement plan benefits.
Capital loss carryforward is calculated and reported as of a specific date. Results of transactions and other activity after that date may affect the amount of capital loss carryforward actually available for the Fund to utilize. The Regulated Investment Company Modernization Act of 2010 (the “Act”) eliminated the eight-year carryover period for capital losses that arise in taxable years beginning after its enactment date of December 22, 2010. Consequently, these capital losses can be carried forward for an unlimited period. However, capital losses with an expiration period may not be used to offset capital gains until all net capital losses without an expiration date have been utilized. Additionally, post-enactment capital loss carryovers will retain their character as either short-term or long-term capital losses instead of as short-term capital losses as under prior law. The ability to utilize capital loss carryforward in the future may be limited under the Internal Revenue Code and related regulations based on the results of future transactions.
17 Invesco Charter Fund
The Fund utilized $111,568,684 of capital loss carryforward in the current period to offset net realized capital gain for federal income tax purposes. The Fund has a capital loss carryforward as of October 31, 2012, which expires as follows:
| | | | | | | | | | | | |
| Capital Loss Carryforward* | |
| Expiration | | Short-Term | | | Long-Term | | | Total | |
October 31, 2017 | | $ | 62,709,368 | | | $ | — | | | $ | 62,709,368 | |
October 31, 2018 | | | 9,265,449 | | | | — | | | | 9,265,449 | |
| | | $ | 71,974,817 | | | $ | — | | | $ | 71,974,817 | |
| * | Capital loss carryforward as of the date listed above is reduced for limitations, if any, to the extent required by the Internal Revenue Code. To the extent that unrealized gains as of May 23, 2011, the date of reorganization of Invesco Multi-Sector Fund into the Fund and realized on securities held in each fund at such date of reorganization, the capital loss carryforward may be further limited for up to five years from the date of the reorganization. |
NOTE 9—Investment Securities
The aggregate amount of investment securities (other than short-term securities, U.S. Treasury obligations and money market funds, if any) purchased and sold by the Fund during the year ended October 31, 2012 was $1,854,295,670 and $2,391,014,770, respectively. Cost of investments on a tax basis includes the adjustments for financial reporting purposes as of the most recently completed federal income tax reporting period-end.
| | | | |
| Unrealized Appreciation (Depreciation) of Investment Securities on a Tax Basis | |
Aggregate unrealized appreciation of investment securities | | $ | 737,879,621 | |
Aggregate unrealized (depreciation) of investment securities | | | (93,122,936 | ) |
Net unrealized appreciation of investment securities | | $ | 644,756,685 | |
Cost of investments for tax purposes is $4,454,531,661.
NOTE 10—Reclassification of Permanent Differences
Primarily as a result of differing book/tax treatment of foreign currency transactions and fair funds settlement, on October 31, 2012, undistributed net investment income was increased by $12,567,075 and undistributed net realized gain (loss) was decreased by $12,567,075. This reclassification had no effect on the net assets of the Fund.
18 Invesco Charter Fund
NOTE 11—Share Information
| | | | | | | | | | | | | | | | |
| | | Summary of Share Activity | |
| | | Years ended October 31, | |
| | | 2012(a) | | | 2011 | |
| | | Shares | | | Amount | | | Shares | | | Amount | |
Sold: | | | | | | | | | | | | | | | | |
Class A | | | 18,665,820 | | | $ | 318,586,275 | | | | 18,544,083 | | | $ | 304,679,496 | |
Class B | | | 283,613 | | | | 4,607,651 | | | | 468,572 | | | | 7,320,112 | |
Class C | | | 1,570,666 | | | | 25,636,338 | | | | 1,681,192 | | | | 26,586,580 | |
Class R | | | 1,996,803 | | | | 33,628,068 | | | | 2,025,310 | | | | 32,998,196 | |
Class S | | | 132,734 | | | | 2,283,093 | | | | 158,109 | | | | 2,604,980 | |
Class Y | | | 15,184,586 | | | | 253,739,164 | | | | 4,108,343 | | | | 67,775,994 | |
Class R5 | | | 11,281,979 | | | | 198,397,989 | | | | 5,984,524 | | | | 101,345,494 | |
Class R6(b) | | | 5,274,265 | | | | 98,312,192 | | | | — | | | | — | |
| | | | |
Issued as reinvestment of dividends: | | | | | | | | | | | | | | | | |
Class A | | | 1,415,160 | | | | 22,897,282 | | | | 968,264 | | | | 15,376,037 | |
Class R | | | 18,652 | | | | 299,925 | | | | 7,587 | | | | 119,798 | |
Class S | | | 9,157 | | | | 148,151 | | | | 6,796 | | | | 107,848 | |
Class Y | | | 79,388 | | | | 1,287,666 | | | | 65,011 | | | | 1,033,677 | |
Class R5 | | | 217,414 | | | | 3,615,597 | | | | 300,029 | | | | 4,890,481 | |
| | | | |
Automatic conversion of Class B shares to Class A shares: | | | | | | | | | | | | | | | | |
Class A | | | 2,230,947 | | | | 37,964,766 | | | | 3,192,150 | | | | 53,048,338 | |
Class B | | | (2,325,996 | ) | | | (37,964,766 | ) | | | (3,323,957 | ) | | | (53,048,338 | ) |
| | | | |
Issued in connection with acquisitions:(c) | | | | | | | | | | | | | | | | |
Class A | | | — | | | | — | | | | 8,168,481 | | | | 142,299,641 | |
Class B | | | — | | | | — | | | | 1,414,896 | | | | 23,669,329 | |
Class C | | | — | | | | — | | | | 2,068,782 | | | | 34,699,917 | |
Class Y | | | — | | | | — | | | | 152,044 | | | | 2,656,493 | |
Class R5 | | | — | | | | — | | | | 70,262 | | | | 1,258,544 | |
| | | | |
Reacquired: | | | | | | | | | | | | | | | | |
Class A | | | (40,152,173 | ) | | | (686,621,170 | ) | | | (49,333,203 | ) | | | (812,278,911 | ) |
Class B | | | (1,365,436 | ) | | | (22,435,158 | ) | | | (2,131,936 | ) | | | (33,807,779 | ) |
Class C | | | (3,404,549 | ) | | | (55,885,540 | ) | | | (4,031,156 | ) | | | (63,601,392 | ) |
Class R | | | (1,468,013 | ) | | | (24,829,907 | ) | | | (1,700,231 | ) | | | (27,653,288 | ) |
Class S | | | (241,152 | ) | | | (4,152,577 | ) | | | (179,453 | ) | | | (2,959,920 | ) |
Class Y | | | (6,278,117 | ) | | | (109,550,270 | ) | | | (3,855,145 | ) | | | (63,263,277 | ) |
Class R5 | | | (14,784,957 | ) | | | (264,074,912 | ) | | | (18,630,462 | ) | | | (310,481,129 | ) |
Class R6(b) | | | (24,707 | ) | | | (457,289 | ) | | | — | | | | — | |
Net increase (decrease) in share activity | | | (11,683,916 | ) | | $ | (204,567,432 | ) | | | (33,801,108 | ) | | $ | (544,623,079 | ) |
| (a) | There are entities that are record owners of more than 5% of the outstanding shares of the Fund and in the aggregate own 29% of the outstanding shares of the Fund. IDI has an agreement with these entities to sell Fund shares. The Fund, Invesco and/or Invesco affiliates may make payments to these entities, which are considered to be related to the Fund, for providing services to the Fund, Invesco and/or Invesco affiliates including but not limited to services such as securities brokerage, distribution, third party record keeping and account servicing. The Fund has no knowledge as to whether all or any portion of the shares owned of record by these entities are also owned beneficially. |
| (b) | Commencement date of September 24, 2012. |
| (c) | As of the opening of business on May 23, 2011, the Fund acquired all the net assets of Invesco Multi-Sector Fund pursuant to a plan of reorganization approved by the Trustees of the Fund on November 10, 2010 and by the shareholders of the Invesco Multi-Sector Fund on April 14, 2011. The acquisition was accomplished by a tax-free exchange of 11,874,465 shares of the Fund for 8,680,800 shares outstanding of Invesco Multi-Sector Fund as of the close of business on May 20, 2011. Each class of the Invesco Multi-Sector Fund was exchanged for the like class of shares of the Fund based on the relative net asset value of Invesco Multi-Sector Fund to the net asset value of the Fund on the close of business, May 20, 2011. Invesco Multi-Sector Fund’s net assets at that date of $204,583,924, including $44,664,612 of unrealized appreciation, was combined with those of the Fund. The net assets of the Fund immediately before the acquisition were $5,424,709,924. The net assets of the Fund immediately following the acquisition were $5,629,293,848. |
19 Invesco Charter Fund
NOTE 12 — Financial Highlights
The following schedule presents financial highlights for a share of the Fund outstanding throughout the periods indicated.
| | | | | | | | | | | | | | | | | | | | | | | | | | | | | | | | | | | | | | | | | | | | | | | | |
| | | Net asset
value,
beginning
of period | | | Net
investment
income
(loss)(a) | | | Net gains
(losses)
on securities
(both
realized and
unrealized) | | | Total from
investment
operations | | | Dividends
from net
investment
income | | | Net asset
value, end
of period | | | Total
return(b) | | | Net assets,
end of period
(000’s omitted) | | | Ratio of
expenses
to average
net assets
with fee waivers
and/or expenses
absorbed | | | Ratio of
expenses
to average net
assets without
fee waivers
and/or expenses
absorbed | | | Ratio of net
investment
income (loss)
to average
net assets | | | Portfolio
turnover(c) | |
Class A | | | | | | | | | | | | | | | | | | | | | | | | | | | | | | | | | | | | | | | | | | | | | | | | |
Year ended 10/31/12 | | $ | 16.38 | | | $ | 0.14 | | | $ | 1.31 | | | $ | 1.45 | | | $ | (0.10 | ) | | $ | 17.73 | | | | 8.93 | % | | $ | 4,025,451 | | | | 1.10 | %(d) | | | 1.12 | %(d) | | | 0.79 | %(d) | | | 42 | % |
Year ended 10/31/11 | | | 15.30 | | | | 0.10 | | | | 1.04 | | | | 1.14 | | | | (0.06 | ) | | | 16.38 | | | | 7.50 | | | | 4,009,014 | | | | 1.10 | | | | 1.13 | | | | 0.64 | | | | 40 | |
Year ended 10/31/10 | | | 14.16 | | | | 0.07 | | | | 1.16 | (e) | | | 1.23 | | | | (0.09 | ) | | | 15.30 | | | | 8.72 | (e) | | | 4,027,296 | | | | 1.14 | | | | 1.18 | | | | 0.45 | | | | 48 | |
Year ended 10/31/09 | | | 12.46 | | | | 0.09 | | | | 1.76 | (e) | | | 1.85 | | | | (0.15 | ) | | | 14.16 | | | | 15.19 | (e) | | | 3,915,161 | | | | 1.26 | | | | 1.29 | | | | 0.76 | | | | 32 | |
Year ended 10/31/08 | | | 17.30 | | | | 0.14 | | | | (4.76 | ) | | | (4.62 | ) | | | (0.22 | ) | | | 12.46 | | | | (27.00 | ) | | | 3,454,370 | | | | 1.19 | | | | 1.23 | | | | 0.88 | | | | 38 | |
Class B | | | | | | | | | | | | | | | | | | | | | | | | | | | | | | | | | | | | | | | | | | | | | | | | |
Year ended 10/31/12 | | | 15.67 | | | | 0.01 | | | | 1.28 | | | | 1.29 | | | | — | | | | 16.96 | | | | 8.23 | | | | 125,315 | | | | 1.85 | (d) | | | 1.87 | (d) | | | 0.04 | (d) | | | 42 | |
Year ended 10/31/11 | | | 14.69 | | | | (0.02 | ) | | | 1.00 | | | | 0.98 | | | | — | | | | 15.67 | | | | 6.67 | | | | 169,243 | | | | 1.85 | | | | 1.88 | | | | (0.11 | ) | | | 40 | |
Year ended 10/31/10 | | | 13.62 | | | | (0.04 | ) | | | 1.11 | (e) | | | 1.07 | | | | — | | | | 14.69 | | | | 7.86 | (e) | | | 211,105 | | | | 1.89 | | | | 1.93 | | | | (0.30 | ) | | | 48 | |
Year ended 10/31/09 | | | 11.91 | | | | 0.00 | | | | 1.71 | (e) | | | 1.71 | | | | — | | | | 13.62 | | | | 14.36 | (e) | | | 281,911 | | | | 2.01 | | | | 2.04 | | | | 0.01 | | | | 32 | |
Year ended 10/31/08 | | | 16.50 | | | | 0.02 | | | | (4.54 | ) | | | (4.52 | ) | | | (0.07 | ) | | | 11.91 | | | | (27.51 | ) | | | 388,985 | | | | 1.94 | | | | 1.98 | | | | 0.13 | | | | 38 | |
Class C | | | | | | | | | | | | | | | | | | | | | | | | | | | | | | | | | | | | | | | | | | | | | | | | |
Year ended 10/31/12 | | | 15.71 | | | | 0.01 | | | | 1.28 | | | | 1.29 | | | | — | | | | 17.00 | | | | 8.21 | | | | 247,719 | | | | 1.85 | (d) | | | 1.87 | (d) | | | 0.04 | (d) | | | 42 | |
Year ended 10/31/11 | | | 14.73 | | | | (0.02 | ) | | | 1.00 | | | | 0.98 | | | | — | | | | 15.71 | | | | 6.65 | | | | 257,790 | | | | 1.85 | | | | 1.88 | | | | (0.11 | ) | | | 40 | |
Year ended 10/31/10 | | | 13.65 | | | | (0.04 | ) | | | 1.12 | (e) | | | 1.08 | | | | — | | | | 14.73 | | | | 7.91 | (e) | | | 245,757 | | | | 1.89 | | | | 1.93 | | | | (0.30 | ) | | | 48 | |
Year ended 10/31/09 | | | 11.94 | | | | 0.00 | | | | 1.71 | (e) | | | 1.71 | | | | — | | | | 13.65 | | | | 14.32 | (e) | | | 226,830 | | | | 2.01 | | | | 2.04 | | | | 0.01 | | | | 32 | |
Year ended 10/31/08 | | | 16.55 | | | | 0.02 | | | | (4.56 | ) | | | (4.54 | ) | | | (0.07 | ) | | | 11.94 | | | | (27.55 | ) | | | 179,759 | | | | 1.94 | | | | 1.98 | | | | 0.13 | | | | 38 | |
Class R | | | | | | | | | | | | | | | | | | | | | | | | | | | | | | | | | | | | | | | | | | | | | | | | |
Year ended 10/31/12 | | | 16.25 | | | | 0.09 | | | | 1.32 | | | | 1.41 | | | | (0.07 | ) | | | 17.59 | | | | 8.73 | | | | 81,503 | | | | 1.35 | (d) | | | 1.37 | (d) | | | 0.54 | (d) | | | 42 | |
Year ended 10/31/11 | | | 15.18 | | | | 0.06 | | | | 1.04 | | | | 1.10 | | | | (0.03 | ) | | | 16.25 | | | | 7.26 | | | | 66,405 | | | | 1.35 | | | | 1.38 | | | | 0.39 | | | | 40 | |
Year ended 10/31/10 | | | 14.07 | | | | 0.03 | | | | 1.15 | (e) | | | 1.18 | | | | (0.07 | ) | | | 15.18 | | | | 8.43 | (e) | | | 57,003 | | | | 1.39 | | | | 1.43 | | | | 0.20 | | | | 48 | |
Year ended 10/31/09 | | | 12.38 | | | | 0.07 | | | | 1.75 | (e) | | | 1.82 | | | | (0.13 | ) | | | 14.07 | | | | 14.93 | (e) | | | 25,096 | | | | 1.51 | | | | 1.54 | | | | 0.51 | | | | 32 | |
Year ended 10/31/08 | | | 17.18 | | | | 0.10 | | | | (4.73 | ) | | | (4.63 | ) | | | (0.17 | ) | | | 12.38 | | | | (27.19 | ) | | | 7,717 | | | | 1.44 | | | | 1.48 | | | | 0.63 | | | | 38 | |
Class S | | | | | | | | | | | | | | | | | | | | | | | | | | | | | | | | | | | | | | | | | | | | | | | | |
Year ended 10/31/12 | | | 16.39 | | | | 0.15 | | | | 1.33 | | | | 1.48 | | | | (0.12 | ) | | | 17.75 | | | | 9.08 | | | | 21,072 | | | | 1.00 | (d) | | | 1.02 | (d) | | | 0.89 | (d) | | | 42 | |
Year ended 10/31/11 | | | 15.31 | | | | 0.12 | | | | 1.04 | | | | 1.16 | | | | (0.08 | ) | | | 16.39 | | | | 7.62 | | | | 21,080 | | | | 1.00 | | | | 1.03 | | | | 0.74 | | | | 40 | |
Year ended 10/31/10 | | | 14.16 | | | | 0.08 | | | | 1.16 | (e) | | | 1.24 | | | | (0.09 | ) | | | 15.31 | | | | 8.80 | (e) | | | 19,916 | | | | 1.04 | | | | 1.08 | | | | 0.55 | | | | 48 | |
Year ended 10/31/09(f) | | | 14.25 | | | | 0.01 | | | | (0.10 | ) | | | (0.09 | ) | | | — | | | | 14.16 | | | | (0.63 | ) | | | 1,390 | | | | 1.09 | (g) | | | 1.12 | (g) | | | 0.93 | (g) | | | 32 | |
Class Y | | | | | | | | | | | | | | | | | | | | | | | | | | | | | | | | | | | | | | | | | | | | | | | | |
Year ended 10/31/12 | | | 16.44 | | | | 0.18 | | | | 1.33 | | | | 1.51 | | | | (0.14 | ) | | | 17.81 | | | | 9.26 | | | | 362,231 | | | | 0.85 | (d) | | | 0.87 | (d) | | | 1.04 | (d) | | | 42 | |
Year ended 10/31/11 | | | 15.36 | | | | 0.15 | | | | 1.04 | | | | 1.19 | | | | (0.11 | ) | | | 16.44 | | | | 7.78 | | | | 186,623 | | | | 0.85 | | | | 0.88 | | | | 0.89 | | | | 40 | |
Year ended 10/31/10 | | | 14.20 | | | | 0.11 | | | | 1.15 | (e) | | | 1.26 | | | | (0.10 | ) | | | 15.36 | | | | 8.93 | (e) | | | 167,170 | | | | 0.89 | | | | 0.93 | | | | 0.70 | | | | 48 | |
Year ended 10/31/09 | | | 12.46 | | | | 0.13 | | | | 1.77 | (e) | | | 1.90 | | | | (0.16 | ) | | | 14.20 | | | | 15.54 | (e) | | | 70,187 | | | | 1.01 | | | | 1.04 | | | | 1.01 | | | | 32 | |
Year ended 10/31/08(f) | | | 13.94 | | | | 0.01 | | | | (1.49 | ) | | | (1.48 | ) | | | — | | | | 12.46 | | | | (10.62 | ) | | | 9,424 | | | | 0.97 | (g) | | | 1.01 | (g) | | | 1.10 | (g) | | | 38 | |
Class R5 | | | | | | | | | | | | | | | | | | | | | | | | | | | | | | | | | | | | | | | | | | | | | | | | |
Year ended 10/31/12 | | | 16.87 | | | | 0.22 | | | | 1.36 | | | | 1.58 | | | | (0.16 | ) | | | 18.29 | | | | 9.43 | | | | 378,446 | | | | 0.68 | (d) | | | 0.70 | (d) | | | 1.21 | (d) | | | 42 | |
Year ended 10/31/11 | | | 15.77 | | | | 0.17 | | | | 1.07 | | | | 1.24 | | | | (0.14 | ) | | | 16.87 | | | | 7.92 | | | | 404,441 | | | | 0.73 | | | | 0.76 | | | | 1.01 | | | | 40 | |
Year ended 10/31/10 | | | 14.57 | | | | 0.14 | | | | 1.20 | (e) | | | 1.34 | | | | (0.14 | ) | | | 15.77 | | | | 9.20 | (e) | | | 571,624 | | | | 0.71 | | | | 0.75 | | | | 0.88 | | | | 48 | |
Year ended 10/31/09 | | | 12.83 | | | | 0.16 | | | | 1.80 | (e) | | | 1.96 | | | | (0.22 | ) | | | 14.57 | | | | 15.74 | (e) | | | 328,081 | | | | 0.75 | | | | 0.78 | | | | 1.27 | | | | 32 | |
Year ended 10/31/08 | | | 17.81 | | | | 0.20 | | | | (4.88 | ) | | | (4.68 | ) | | | (0.30 | ) | | | 12.83 | | | | (26.68 | ) | | | 202,467 | | | | 0.76 | | | | 0.80 | | | | 1.31 | | | | 38 | |
Class R6 | | | | | | | | | | | | | | | | | | | | | | | | | | | | | | | | | | | | | | | | | | | | | | | | |
Year ended 10/31/12(f) | | | 18.64 | | | | 0.02 | | | | (0.37 | ) | | | (0.35 | ) | | | — | | | | 18.29 | | | | (1.88 | ) | | | 96,034 | | | | 0.60 | (d)(g) | | | 0.63 | (d)(g) | | | 1.29 | (d)(g) | | | 42 | |
| (a) | Calculated using average shares outstanding. |
| (b) | Includes adjustments in accordance with accounting principles generally accepted in the United States of America and as such, the net asset value for financial reporting purposes and the returns based upon those net asset values may differ from the net asset value and returns for shareholder transactions. Does not include sales charges and is not annualized for periods less than one year, if applicable. |
| (c) | Portfolio turnover is calculated at the fund level and is not annualized for periods less than one year, if applicable. For the year ended October 31, 2011, the portfolio turnover calculation excludes the value of securities purchased of $158,423,180 and sold of $177,461,241 in the effort to realign the Fund’s portfolio holdings after the reorganization of Invesco Multi-Sector Fund into the Fund. |
| (d) | Ratios are based on average daily net assets (000’s) of $4,053,070, $147,584, $255,460, $76,222, $21,193, $294,496, $472,160 and $94,749, for Class A, Class B, Class C, Class R, Class S, Class Y, Class R5 and Class R6 shares, respectively. |
| (e) | Includes litigation proceeds received during the period. Had the litigation proceeds not been received Net gains on securities (both realized and unrealized) per share for the year ended October 31, 2010 would have been $1.11, $1.06, $1.07, $1.10, $1.11, $1.10 and $1.15 for Class A, Class B, Class C, Class R, Class S, Class Y and Class R5, respectively and total returns would have been lower. Net gains on securities (both realized and unrealized) per share for the year ended October 31, 2009 would have been $1.57, $1.52, $1.52, $1.56, $1.58 and $1.61 for Class A, Class B, Class C, Class R, Class Y and Class R5, respectively and total returns would have been lower. |
| (f) | Commencement date of September 25, 2009, October 3, 2008 and September 24, 2012 for Class S, Class Y and Class R6 shares, respectively. |
20 Invesco Charter Fund
Report of Independent Registered Public Accounting Firm
To the Board of Trustees of AIM Equity Funds (Invesco Equity Funds)
and Shareholders of Invesco Charter Fund:
In our opinion, the accompanying statement of assets and liabilities, including the schedule of investments, and the related statements of operations and of changes in net assets and the financial highlights present fairly, in all material respects, the financial position of Invesco Charter Fund (one of the funds constituting AIM Equity Funds (Invesco Equity Funds), hereafter referred to as the “Fund”) at October 31, 2012, the results of its operations for the year then ended, the changes in its net assets for each of the two years in the period then ended and the financial highlights for each of the five years in the period then ended, in conformity with accounting principles generally accepted in the United States of America. These financial statements and financial highlights (hereafter referred to as “financial statements”) are the responsibility of the Fund’s management; our responsibility is to express an opinion on these financial statements based on our audits. We conducted our audits of these financial statements in accordance with the standards of the Public Company Accounting Oversight Board (United States). Those standards require that we plan and perform the audit to obtain reasonable assurance about whether the financial statements are free of material misstatement. An audit includes examining, on a test basis, evidence supporting the amounts and disclosures in the financial statements, assessing the accounting principles used and significant estimates made by management, and evaluating the overall financial statement presentation. We believe that our audits, which included confirmation of securities at October 31, 2012 by correspondence with the custodian and brokers, provide a reasonable basis for our opinion.
PRICEWATERHOUSECOOPERS LLP
December 21, 2012
Houston, Texas
21 Invesco Charter Fund
Calculating your ongoing Fund expenses
Example
As a shareholder of the Fund, you incur two types of costs: (1) transaction costs, which may include sales charges (loads) on purchase payments or contingent deferred sales charges on redemptions, and redemption fees, if any; and (2) ongoing costs, including management fees, distribution and/or service (12b-1) fees, and other Fund expenses. This example is intended to help you understand your ongoing costs (in dollars) of investing in the Fund and to compare these costs with ongoing costs of investing in other mutual funds. With the exception of the actual ending account value and expenses of the Class R6 shares, the example is based on an investment of $1,000 invested at the beginning of the period and held for the entire period May 1, 2012 through October 31, 2012. The actual ending account and expenses of the Class R6 shares in the below example are based on an investment of $1,000 invested as of close of business September 24, 2012 (commencement date) and held through October 31, 2012.
Actual expenses
The table below provides information about actual account values and actual expenses. You may use the information in this table, together with the amount you invested, to estimate the expenses that you paid over the period. Simply divide your account value by $1,000 (for example, an $8,600 account value divided by $1,000 = 8.6), then multiply the result by the number in the table under the heading entitled “Actual Expenses Paid During Period” to estimate the expenses you paid on your account during this period (as of close of business September 24, 2012 through October 31, 2012 for the Class R6 shares). Because the actual ending account value and expense information in the example is not based upon a six month period for the Class R6 shares, the ending account value and expense information may not provide a meaningful comparison to mutual funds that provide such information for a full six month period.
Hypothetical example for comparison purposes
The table below also provides information about hypothetical account values and hypothetical expenses based on the Fund’s actual expense ratio and an assumed rate of return of 5% per year before expenses, which is not the Fund’s actual return.
The hypothetical account values and expenses may not be used to estimate the actual ending account balance or expenses you paid for the period. You may use this information to compare the ongoing costs of investing in the Fund and other funds. To do so, compare this 5% hypothetical example with the 5% hypothetical examples that appear in the shareholder reports of the other funds.
Please note that the expenses shown in the table are meant to highlight your ongoing costs only and do not reflect any transaction costs, such as sales charges (loads) on purchase payments, contingent deferred sales charges on redemptions, and redemption fees, if any. Therefore, the hypothetical information is useful in comparing ongoing costs only, and will not help you determine the relative total costs of owning different funds. In addition, if these transaction costs were included, your costs would have been higher.
| | | | | | | | | | | | | | | | | | | | | | | | |
| Class | | | | | ACTUAL | | | HYPOTHETICAL (5% annual return before
expenses) | | | | |
| | Beginning
Account Value
(05/01/12) | | | Ending
Account Value
(10/31/12)1 | | | Expenses
Paid During
Period2 | | | Ending
Account Value
(10/31/12) | | | Expenses
Paid During
Period3 | | | Annualized
Expense
Ratio | |
A | | $ | 1,000.00 | | | $ | 1,010.30 | | | $ | 5.36 | | | $ | 1,019.81 | | | $ | 5.38 | | | | 1.06 | % |
B | | | 1,000.00 | | | | 1,007.10 | | | | 9.13 | | | | 1,016.04 | | | | 9.17 | | | | 1.81 | |
C | | | 1,000.00 | | | | 1,006.50 | | | | 9.13 | | | | 1,016.04 | | | | 9.17 | | | | 1.81 | |
R | | | 1,000.00 | | | | 1,009.80 | | | | 6.62 | | | | 1,018.55 | | | | 6.65 | | | | 1.31 | |
S | | | 1,000.00 | | | | 1,010.80 | | | | 4.85 | | | | 1,020.31 | | | | 4.88 | | | | 0.96 | |
Y | | | 1,000.00 | | | | 1,011.90 | | | | 4.10 | | | | 1,021.06 | | | | 4.12 | | | | 0.81 | |
R5 | | | 1,000.00 | | | | 1,012.70 | | | | 3.64 | | | | 1,021.52 | | | | 3.66 | | | | 0.72 | |
R6 | | | 1,000.00 | | | | 981.20 | | | | 0.62 | | | | 1,022.12 | | | | 3.05 | | | | 0.60 | |
| 1 | The actual ending account value is based on the actual total return of the Fund for the period May 1, 2012 through October 31, 2012 (as of close of business September 24, 2012 through October 31, 2012 for the Class R6 shares), after actual expenses and will differ from the hypothetical ending account value which is based on the Fund’s expense ratio and a hypothetical annual return of 5% before expenses. |
| 2 | Actual expenses are equal to the annualized expense ratio as indicated above multiplied by the average account value over the period, multiplied by 184/366 to reflect the most recent fiscal half year. For Class R6 shares actual expenses are equal to the annualized expense ratio indicated above multiplied by the average account value over the period, multiplied by 38 (as of close of business September 24, 2012 through October 31, 2012)/366. Because the Class R6 shares have not been in existence for a full six month period, the actual ending account value and expense information shown may not provide a meaningful comparison to fund expense information of classes that show such data for a full six month period and, because the actual ending account value and expense information in the expense example covers a short time period, return and expense data may not be indicative of return and expense data for longer time periods. |
| 3 | Hypothetical expenses are equal to the annualized expense ratio indicated above multiplied by the average account value over the period, multiplied by 184/366 to reflect the most recent fiscal half year. The hypothetical ending account value and expenses may be used to compare ongoing costs of investing in the Class R6 shares of the Fund and other funds because such data is based on a full six-month period. |
22 Invesco Charter Fund
Approval of Investment Advisory and Sub-Advisory Contracts
The Board of Trustees (the Board) of AIM Equity Funds (Invesco Equity Funds) is required under the Investment Company Act of 1940, as amended, to approve annually the renewal of the Invesco Charter Fund (the Fund) investment advisory agreement with Invesco Advisers, Inc. (Invesco Advisers) and the Master Intergroup Sub-Advisory Contract for Mutual Funds (the sub-advisory contracts) with Invesco Asset Management Deutschland GmbH, Invesco Asset Management Limited, Invesco Asset Management (Japan) Limited, Invesco Australia Limited, Invesco Hong Kong Limited, Invesco Senior Secured Management, Inc. and Invesco Canada Ltd. (collectively, the Affiliated Sub-Advisers). During contract renewal meetings held on June 19-20, 2012, the Board as a whole, and the disinterested or “independent” Trustees, who comprise 80% of the Board, voting separately, approved the continuance of the Fund’s investment advisory agreement and the sub-advisory contracts for another year, effective July 1, 2012. In doing so, the Board considered the process that it follows in reviewing and approving the Fund’s investment advisory agreement and sub-advisory contracts and the information that it is provided. The Board determined that the Fund’s investment advisory agreement and the sub-advisory contracts are in the best interests of the Fund and its shareholders and the compensation to Invesco Advisers and the Affiliated Sub-Advisers under the agreements is fair and reasonable.
The Board’s Fund Evaluation Process
The Board’s Investments Committee has established three Sub-Committees, each of which is primarily responsible for overseeing the management of a number of the series portfolios of the funds advised by Invesco Advisers (the Invesco Funds). The Sub-Committees meet throughout the year to review the performance of their assigned funds, including reviewing materials prepared under the direction of the independent Senior Officer, an officer of the Invesco Funds who reports directly to the independent Trustees. Over the course of each year, the Sub-Committees meet with portfolio managers for their assigned Invesco Funds and other members of management to review the performance, investment objective(s), policies, strategies, limitations and investment risks of these funds. The Sub-Committees meet regularly and at designated contract renewal meetings each year to conduct a review of the performance, fees, expenses and other matters related to their assigned Invesco Funds. Each Sub-Committee recommends to the Investments Committee, which in turn recommends to the full Board, whether and on what terms to approve the continuance of each Invesco Fund’s investment advisory agreement and sub-advisory contracts for another year.
During the contract renewal process, the Trustees receive comparative performance and fee data regarding the Invesco Funds prepared by Invesco Advisers and an independent company, Lipper Inc. (Lipper). The Trustees also receive an independent written evaluation from the Senior Officer. The Senior
Officer’s evaluation is prepared as part of his responsibility to manage the process by which the Invesco Funds’ proposed management fees are negotiated during the annual contract renewal process to ensure they are negotiated in a manner that is at arms’ length and reasonable. The independent Trustees are assisted in their annual evaluation of the Fund’s investment advisory agreement by the Senior Officer and by independent legal counsel. In addition to meetings with Invesco Advisers and fund counsel, the independent Trustees also discuss the continuance of the investment advisory agreement and sub-advisory contracts in private sessions with the Senior Officer and independent legal counsel.
In evaluating the fairness and reasonableness of the Fund’s investment advisory agreement and sub-advisory contracts, the Board considered, among other things, the factors discussed below. The Trustees recognized that the advisory fees for the Invesco Funds include advisory fees that are the result of years of review and negotiation between the Trustees and Invesco Advisers as well as advisory fees previously approved by a different board that, at the time, was responsible for overseeing Morgan Stanley and Van Kampen funds, which have become Invesco Funds following the acquisition of the retail mutual fund business of Morgan Stanley. The Trustees’ deliberations and conclusions in a particular year may be based in part on their deliberations and conclusions regarding these same arrangements throughout the year and in prior years. One Trustee may have weighed a particular piece of information or factor differently than another Trustee.
The discussion below serves as the Senior Officer’s independent written evaluation with respect to the Fund’s investment advisory agreement as well as a discussion of the material factors and related conclusions that formed the basis for the Board’s approval of the Fund’s investment advisory agreement and sub-advisory contracts. Unless otherwise stated, this information is current as of June 20, 2012, and may not reflect consideration of factors that became known to the Board after that date, including, for example, changes to the Fund’s performance, advisory fees, expense limitations and/or fee waivers.
Factors and Conclusions and Summary of Independent Written Fee Evaluation
| A. | Nature, Extent and Quality of Services Provided by Invesco Advisers and the Affiliated Sub-Advisers |
The Board reviewed the advisory services provided to the Fund by Invesco Advisers under the Fund’s investment advisory agreement, the performance of Invesco Advisers in providing these services, and the credentials and experience of the officers and employees of Invesco Advisers who provide these services, including the Fund’s portfolio manager or managers, with whom the Sub-Committees met during the year. The Board’s review of the qualifications of Invesco Advisers to provide advisory
services included the Board’s consideration of Invesco Advisers’ performance and investment process oversight, independent credit analysis and investment risk management.
In determining whether to continue the Fund’s investment advisory agreement, the Board considered the prior relationship between Invesco Advisers and the Fund, as well as the Board’s knowledge of Invesco Advisers’ operations, and concluded that it is beneficial to maintain the current relationship, in part because of such prior relationship and knowledge. The Board also considered services that Invesco Advisers and its affiliates provide to the Invesco Funds such as various back office support functions, equity and fixed income trading operations, internal audit, distribution and legal and compliance. The Board concluded that the nature, extent and quality of the services provided to the Fund by Invesco Advisers are appropriate and satisfactory and consistent with the terms of the Fund’s investment advisory agreement.
The Board reviewed the services provided by the Affiliated Sub-Advisers under the sub-advisory contracts and the credentials and experience of the officers and employees of the Affiliated Sub-Advisers who provide these services. The Board noted that the Affiliated Sub-Advisers have offices and personnel that are located in financial centers around the world. As a result, the Affiliated Sub-Advisers can provide research and investment analysis on the markets and economies of various countries in which the Fund invests and make recommendations on securities of companies located in such countries. The Board concluded that the sub-advisory contracts benefit the Fund and its shareholders by permitting Invesco Advisers to use the resources and talents of the Affiliated Sub-Advisers in managing the Fund. The Board concluded that the nature, extent and quality of the services provided by the Affiliated Sub-Advisers are appropriate and satisfactory and consistent with the terms of the Fund’s sub-advisory contracts.
The Board considered Fund performance as a relevant factor in considering whether to approve the investment advisory agreement. The Board did not view Fund performance as a relevant factor in considering whether to approve the sub-advisory contracts for the Fund, as no Affiliated Sub-Adviser currently manages assets of the Fund.
The Board compared the Fund’s performance during the past one, three and five calendar years to the performance of funds in the Lipper performance universe and against the Lipper Large-Cap Core Funds Index. The Board noted that performance of Class A shares of the Fund was in the third quintile of the performance universe for the one year period, the fourth quintile for the three year period and the first quintile for the five year period (the first quintile being the best performing funds and the fifth quintile being the worst performing funds). The Board noted that performance of Class A shares of the Fund was below the performance of the Index for the one and
23 Invesco Charter Fund
three year periods and above the performance of the Index for the five year period. Invesco Advisers presented an analysis to the Board that included an explanation of reasons for differences in performance relative to that of the universe and index, including differences between the Fund’s investment strategies and those of peers. The Board discussed actions that Invesco Advisers had taken or was taking to address performance issues and Invesco Adviser’s resources and responsiveness to performance concerns. These explanations provided a sound basis for understanding comparative performance and monitoring and addressing it going forward, and were part of the Board’s overall conclusion about the nature, extent and quality of the services provided by Invesco Advisers. The Trustees also reviewed more recent Fund performance and this review did not change their conclusions.
| C. | Advisory and Sub-Advisory Fees and Fee Waivers |
The Board compared the Fund’s contractual advisory fee rate to the contractual advisory fee rates of funds in the Fund’s Lipper expense group at a common asset level. The Board noted that the contractual advisory fee rate for Class A shares of the Fund was above the median contractual advisory fee rate of funds in the expense group. The Board also reviewed the methodology used by Lipper in providing expense group information, which includes using audited financial data from the most recent annual report of each fund in the expense group that was publicly available as of the end of the past calendar year and including only one fund per investment adviser. The Board noted that comparative data is as of varying dates, which may affect the comparability of data during times of market volatility.
The Board also compared the Fund’s effective fee rate (the advisory fee after advisory fee waivers and before expense limitations/waivers) to the advisory fee rates of other mutual funds advised by Invesco Advisers and its affiliates with investment strategies comparable to those of the Fund. The Board noted that the Fund’s rate was the same the as the effective fee rate of the other mutual fund managed by Invesco Advisers with comparable investment strategies.
The Board also considered the fees charged by Invesco Advisers and the Affiliated Sub-Advisers to other client accounts with investment strategies comparable to those of the Fund. The Board noted that Invesco Advisers or the Affiliated Sub-Advisers may charge lower fees to large institutional clients solely for investment management services. Invesco Advisers reviewed with the Board the significantly greater scope of services it provides to the Invesco Funds relative to other client accounts. These additional services include provision of administrative services, officers and office space, oversight of service providers, preparation of annual registration statement updates and financial information and regulatory compliance under the Investment Company Act of 1940, as amended. Invesco Advisers also reviewed generally the higher frequency of shareholder purchases and redemptions in the Invesco Funds relative to the flow of assets for other client accounts. Invesco Advisers advised the Board that advance notice of redemptions is often
provided to Invesco Advisers by institutional clients. The Board did note that sub-advisory fees charged by the Affiliated Sub-Advisers to manage the Invesco Funds and to manage other client accounts tended to be more comparable, reflecting a more comparable scope of services. The Board concluded that the aggregate services provided to the Invesco Funds were sufficiently different from those provided to institutional clients, and the Board did not place significant weight on these fee comparisons.
The Board also considered the services provided by the Affiliated Sub-Advisers pursuant to the sub-advisory contracts, as well as the allocation of fees between Invesco Advisers and the Affiliated Sub-Advisers pursuant to the sub-advisory contracts. The Board noted that Invesco Advisers provides services to sub-advised Invesco Funds, including oversight of the Affiliated Sub-Advisers as well as the additional services described above other than day-to-day portfolio management. The Board also noted that the sub-advisory fees have no direct effect on the Fund or its shareholders, as they are paid by Invesco Advisers to the Affiliated Sub-Advisers.
Based upon the information and considerations described above, the Board concluded that the Fund’s advisory and sub-advisory fees are fair and reasonable.
| D. | Economies of Scale and Breakpoints |
The Board considered the extent to which there are economies of scale in the provision of advisory services to the Fund. The Board also considered whether the Fund benefits from economies of scale through contractual breakpoints in the Fund’s advisory fee schedule and were assisted in their review by a report from the Senior Officer. The Board also noted that the Fund shares directly in economies of scale through lower fees charged by third party service providers based on the combined size of the Invesco Funds and other clients advised by Invesco Advisers. The Board noted that Invesco Advisers proposes sharing economies of scale in administration expenses by lowering per class administrative fees.
| E. | Profitability and Financial Resources |
The Board reviewed information from Invesco Advisers concerning the costs of the advisory and other services that Invesco Advisers and its affiliates provide to the Fund and the profitability of Invesco Advisers and its affiliates in providing these services for the year ended December 31, 2011. The Board reviewed with Invesco Advisers the methodology used to prepare the profitability information. The Board considered the profitability of Invesco Advisers in connection with managing the Fund and the Invesco Funds. The Board noted that Invesco Advisers continues to operate at a net profit from services Invesco Advisers and its subsidiaries provide to the Invesco Funds and the Fund. The Board did not deem the level of profits realized by Invesco Advisers and its affiliates from providing services to the Fund to be excessive given the nature, quality and extent of the services provided to the Invesco Funds. The Board received and accepted information from Invesco Advisers demonstrating that Invesco Advisers and each Affiliated Sub-Adviser are financially sound and have the resources necessary to perform their obligations under the investment advisory agreement and sub-advisory contracts.
| F. | Collateral Benefits to Invesco Advisers and its Affiliates |
The Board considered various other benefits received by Invesco Advisers and its affiliates from the relationship with the Fund, including the fees received for their provision of administrative, transfer agency and distribution services to the Fund. The Board considered the performance of Invesco Advisers and its affiliates in providing these services and the organizational structure employed to provide these services. The Board also considered that these services are provided to the Fund pursuant to written contracts that are reviewed and approved on an annual basis by the Board; that the services are required for the operation of the Fund; that Invesco Advisers and its affiliates can provide services, the nature and quality of which are at least equal to those provided by others offering the same or similar services; and that the fees for such services are fair and reasonable in light of the usual and customary charges by others for services of the same nature and quality.
The Board considered the benefits realized by Invesco Advisers and the Affiliated Sub-Advisers as a result of portfolio brokerage transactions executed through “soft dollar” arrangements. The Board noted that soft dollar arrangements shift the payment obligation for research services from Invesco Advisers and the Affiliated Sub-Advisers to the Invesco Funds and therefore may reduce Invesco Advisers’ and the Affiliated Sub-Advisers’ expenses. The Board also considered periodic reports from the Chief Compliance Officer of the Invesco Funds demonstrating that these arrangements are consistent with regulatory requirements. The Board did not deem the soft dollar arrangements to be inappropriate.
The Board considered that the Fund’s uninvested cash and cash collateral from any securities lending arrangements may be invested in money market funds advised by Invesco Advisers pursuant to procedures approved by the Board. The Board noted that Invesco Advisers receives advisory fees from these affiliated money market funds attributable to such investments, although Invesco Advisers has contractually agreed to waive through varying periods the advisory fees payable by the Invesco Funds. The waiver is in an amount equal to 100% of the net advisory fee Invesco Advisers receives from the affiliated money market funds with respect to the Fund’s investment in the affiliated money market funds of uninvested cash, but not cash collateral. The Board concluded that the Fund’s investment of uninvested cash and cash collateral from any securities lending arrangements in the affiliated money market funds is in the best interests of the Fund and its shareholders.
The Board also considered use of an affiliated broker to execute certain trades for the Fund and that such trades are executed in compliance with rules under the Investment Company Act of 1940, as amended.
24 Invesco Charter Fund
Tax Information
Form 1099-DIV, Form 1042-S and other year–end tax information provide shareholders with actual calendar year amounts that should be included in their tax returns. Shareholders should consult their tax advisors.
The following distribution information is being provided as required by the Internal Revenue Code or to meet a specific state’s requirement.
The Fund designates the following amounts or, if subsequently determined to be different, the maximum amount allowable for its fiscal year ended October 31, 2012:
| | | | |
Federal and State Income Tax | |
Qualified Dividend Income* | | | 100 | % |
Corporate Dividends Received Deduction* | | | 100 | % |
| | * | The above percentages are based on ordinary income dividends paid to shareholders during the Fund’s fiscal year. |
25 Invesco Charter Fund
Trustees and Officers
The address of each trustee and officer is AIM Equity Funds (Invesco Equity Funds) (the “Trust”), 11 Greenway Plaza, Suite 1000, Houston, Texas 77046-1173. The trustees serve for the life of the Trust, subject to their earlier death, incapacitation, resignation, retirement or removal as more specifically provided in the Trust’s organizational documents. Each officer serves for a one year term or until their successors are elected and qualified. Column two below includes length of time served with predecessor entities, if any.
| | | | | | | | |
Name, Year of Birth and
Position(s) Held with the Trust | | Trustee and/
or Officer Since | | Principal Occupation(s)
During Past 5 Years | | Number of
Funds in Fund Complex
Overseen by
Trustee | | Other Directorship(s)
Held by Trustee During
Past 5 Years |
| Interested Persons | | | | | | | | |
| Martin L. Flanagan1 — 1960 Trustee | | 2007 | | Executive Director, Chief Executive Officer and President, Invesco Ltd. (ultimate parent of Invesco and a global investment management firm); Advisor to the Board, Invesco Advisers, Inc. (formerly known as Invesco Institutional (N.A.), Inc.); Trustee, The Invesco Funds; Vice Chair, Investment Company Institute; and Member of Executive Board, SMU Cox School of Business Formerly: Chairman, Invesco Advisers, Inc. (registered investment adviser); Director, Chairman, Chief Executive Officer and President, IVZ Inc. (holding company), INVESCO Group Services, Inc. (service provider) and Invesco North American Holdings, Inc. (holding company); Director, Chief Executive Officer and President, Invesco Holding Company Limited (parent of Invesco and a global investment management firm); Director, Invesco Ltd.; Chairman, Investment Company Institute and President, Co-Chief Executive Officer, Co-President, Chief Operating Officer and Chief Financial Officer, Franklin Resources, Inc. (global investment management organization) | | 123 | | None |
| Philip A. Taylor2 — 1954 Trustee, President and Principal Executive Officer | | 2006 | | Head of North American Retail and Senior Managing Director, Invesco Ltd.; Director, Co-Chairman, Co-President and Co-Chief Executive Officer, Invesco Advisers, Inc. (formerly known as Invesco Institutional (N.A.), Inc.) (registered investment adviser); Director, Chairman, Chief Executive Officer and President, Invesco Management Group, Inc. (formerly known as Invesco Aim Management Group, Inc.) (financial services holding company); Director and President, INVESCO Funds Group, Inc. (registered investment adviser and registered transfer agent); Director and Chairman, Invesco Investment Services, Inc. (formerly known as Invesco Aim Investment Services, Inc.) (registered transfer agent) and IVZ Distributors, Inc. (formerly known as INVESCO Distributors, Inc.) (registered broker dealer); Director, President and Chairman, Invesco Inc. (holding company) and Invesco Canada Holdings Inc. (holding company); Chief Executive Officer, Invesco Corporate Class Inc. (corporate mutual fund company) and Invesco Canada Fund Inc. (corporate mutual fund company); Director, Chairman and Chief Executive Officer, Invesco Canada Ltd. (formerly known as Invesco Trimark Ltd./Invesco Trimark Ltèe) (registered investment adviser and registered transfer agent); Trustee, President and Principal Executive Officer, The Invesco Funds (other than AIM Treasurer’s Series Trust (Invesco Treasurer’s Series Trust) and Short-Term Investments Trust); Trustee and Executive Vice President, The Invesco Funds (AIM Treasurer’s Series Trust (Invesco Treasurer’s Series Trust) and Short-Term Investments Trust only); Director, Invesco Investment Advisers LLC (formerly known as Van Kampen Asset Management); Director, Chief Executive Officer and President, Van Kampen Exchange Corp. Formerly: Director and Chairman, Van Kampen Investor Services Inc.; Director, Chief Executive Officer and President, 1371 Preferred Inc. (holding company); and Van Kampen Investments Inc.; Director and President, AIM GP Canada Inc. (general partner for limited partnerships); and Van Kampen Advisors, Inc.; Director and Chief Executive Officer, Invesco Trimark Dealer Inc. (registered broker dealer); Director, Invesco Distributors, Inc. (formerly known as Invesco Aim Distributors, Inc.) (registered broker dealer); Manager, Invesco PowerShares Capital Management LLC; Director, Chief Executive Officer and President, Invesco Advisers, Inc.; Director, Chairman, Chief Executive Officer and President, Invesco Aim Capital Management, Inc.; President, Invesco Trimark Dealer Inc. and Invesco Trimark Ltd./Invesco Trimark Ltèe; Director and President, AIM Trimark Corporate Class Inc. and AIM Trimark Canada Fund Inc.; Senior Managing Director, Invesco Holding Company Limited; Trustee and Executive Vice President, Tax-Free Investments Trust; Director and Chairman, Fund Management Company (former registered broker dealer); President and Principal Executive Officer, The Invesco Funds (AIM Treasurer’s Series Trust (Invesco Treasurer’s Series Trust), Short-Term Investments Trust and Tax-Free Investments Trust only); President, AIM Trimark Global Fund Inc. and AIM Trimark Canada Fund Inc. | | 123 | | None |
Wayne W. Whalen3 — 1939 Trustee | | 2010 | | Of Counsel, and prior to 2010, partner in the law firm of Skadden, Arps, Slate, Meagher & Flom LLP, legal counsel to certain funds in the Fund Complex | | 136 | | Director of the Mutual Fund Directors Forum, a nonprofit membership organization for investment directors; Chairman and Director of the Abraham Lincoln Presidential Library Foundation; and Director of the Stevenson Center for Democracy |
| 1 | Mr. Flanagan is considered an interested person of the Trust because he is an officer of the adviser to the Trust, and an officer and a director of Invesco Ltd., ultimate parent of the adviser to the Trust. |
| 2 | Mr. Taylor is considered an interested person of the Trust because he is an officer and a director of the adviser to, and a director of the principal underwriter of, the Trust. |
| 3 | Mr. Whalen is considered an “interested person” (within the meaning of Section 2(a)(19) of the 1940 Act) of certain Funds in the Invesco Fund Complex by reason of he and his firm currently providing legal services as legal counsel to such Funds in the Invesco Fund Complex. |
T-1 Invesco Charter Fund
Trustees and Officers—(continued)
| | | | | | | | |
Name, Year of Birth and
Position(s) Held with the Trust | | Trustee and/
or Officer Since | | Principal Occupation(s)
During Past 5 Years | | Number of Funds in Fund Complex Overseen by Trustee | | Other Directorship(s) Held by Trustee During
Past 5 Years |
| Independent Trustees | | | | | | | | |
Bruce L. Crockett — 1944 Trustee and Chair | | 1993 | | Chairman, Crockett Technologies Associates (technology consulting company) Formerly: Director, Captaris (unified messaging provider); Director, President and Chief Executive Officer COMSAT Corporation; and Chairman, Board of Governors of INTELSAT (international communications company) | | 123 | | ACE Limited (insurance company); and Investment Company Institute |
David C. Arch — 1945 Trustee | | 2010 | | Retired. Formerly: Chairman and Chief Executive Officer of Blistex Inc., (consumer health care products manufacturer) | | 136 | | Member of the Heartland Alliance Advisory Board, a nonprofit organization serving human needs based in Chicago. Board member of the Illinois Manufacturers’ Association. Member of the Board of Visitors, Institute for the Humanities, University of Michigan |
Frank S. Bayley — 1939 Trustee | | 2001 | | Retired Formerly: Director, Badgley Funds, Inc. (registered investment company) (2 portfolios) and Partner, law firm of Baker & McKenzie | | 123 | | Director and Chairman, C.D. Stimson Company (a real estate investment company) |
James T. Bunch — 1942 Trustee | | 2003 | | Managing Member, Grumman Hill Group LLC (family office private equity management) Formerly: Founder, Green, Manning & Bunch Ltd. (investment banking firm)(1988-2010); Executive Committee, United States Golf Association; and Director, Policy Studies, Inc. and Van Gilder Insurance Corporation | | 123 | | Chairman, Board of Governors, Western Golf Association, Chairman-elect, Evans Scholars Foundation and Director, Denver Film Society |
Rodney F. Dammeyer — 1940 Trustee | | 2010 | | Chairman of CAC, LLC, (private company offering capital investment and management advisory services) Formerly: Prior to January 2004, Director of TeleTech Holdings Inc.; Prior to 2002, Director of Arris Group, Inc.; Prior to 2001, Managing Partner at Equity Group Corporate Investments. Prior to 1995, Vice Chairman of Anixter International. Prior to 1985, experience includes Senior Vice President and Chief Financial Officer of Household International, Inc., Executive Vice President and Chief Financial Officer of Northwest Industries, Inc. and Partner of Arthur Andersen & Co. | | 136 | | Director of Quidel Corporation and Stericycle, Inc. Prior to May 2008, Trustee of The Scripps Research Institute. Prior to February 2008, Director of Ventana Medical Systems, Inc. Prior to April 2007, Director of GATX Corporation. Prior to April 2004, Director of TheraSense, Inc. |
Albert R. Dowden — 1941 Trustee | | 2000 | | Director of a number of public and private business corporations, including the Boss Group, Ltd. (private investment and management); Reich & Tang Funds (5 portfolios) (registered investment company); and Homeowners of America Holding Corporation/ Homeowners of America Insurance Company (property casualty company) Formerly: Director, Continental Energy Services, LLC (oil and gas pipeline service); Director, CompuDyne Corporation (provider of product and services to the public security market) and Director, Annuity and Life Re (Holdings), Ltd. (reinsurance company); Director, President and Chief Executive Officer, Volvo Group North America, Inc.; Senior Vice President, AB Volvo; Director of various public and private corporations; Chairman, DHJ Media, Inc.; Director Magellan Insurance Company; and Director, The Hertz Corporation, Genmar Corporation (boat manufacturer), National Media Corporation; Advisory Board of Rotary Power International (designer, manufacturer, and seller of rotary power engines); and Chairman, Cortland Trust, Inc. (registered investment company) | | 123 | | Director of Nature’s Sunshine Products, Inc. |
Jack M. Fields — 1952 Trustee | | 1997 | | Chief Executive Officer, Twenty First Century Group, Inc. (government affairs company); and Owner and Chief Executive Officer, Dos Angelos Ranch, L.P. (cattle, hunting, corporate entertainment), Discovery Global Education Fund (non-profit) and Cross Timbers Quail Research Ranch (non-profit) Formerly: Chief Executive Officer, Texana Timber LP (sustainable forestry company) and member of the U.S. House of Representatives | | 123 | | Insperity (formerly known as Administaff) |
Carl Frischling — 1937 Trustee | | 1988 | | Partner, law firm of Kramer Levin Naftalis and Frankel LLP | | 123 | | Director, Reich & Tang Funds (6 portfolios) |
Prema Mathai-Davis — 1950 Trustee | | 1998 | | Retired Formerly: Chief Executive Officer, YWCA of the U.S.A. | | 123 | | None |
Larry Soll — 1942 Trustee | | 2003 | | Retired Formerly: Chairman, Chief Executive Officer and President, Synergen Corp. (a biotechnology company) | | 123 | | None |
T-2 Invesco Charter Fund
Trustees and Officers—(continued)
| | | | | | | | |
Name, Year of Birth and
Position(s) Held with the Trust | | Trustee and/
or Officer Since | | Principal Occupation(s) During Past 5 Years | | Number of
Funds in Fund Complex Overseen by Trustee | | Other Directorship(s) Held by Trustee During Past 5 Years |
| Independent Trustees—(continued) |
Hugo F. Sonnenschein — 1940 Trustee | | 2010 | | Distinguished Service Professor and President Emeritus of the University of Chicago and the Adam Smith Distinguished Service Professor in the Department of Economics at the University of Chicago. Formerly: President of the University of Chicago | | 136 | | Trustee of the University of Rochester and a member of its investment committee. Member of the National Academy of Sciences, the American Philosophical Society and a fellow of the American Academy of Arts and Sciences |
Raymond Stickel, Jr. — 1944 Trustee | | 2005 | | Retired Formerly: Director, Mainstay VP Series Funds, Inc. (25 portfolios) and Partner, Deloitte & Touche | | 123 | | None |
| Other Officers | | | | | | | | |
Russell C. Burk — 1958 Senior Vice President and Senior Officer | | 2005 | | Senior Vice President and Senior Officer, The Invesco Funds | | N/A | | N/A |
John M. Zerr — 1962 Senior Vice President, Chief Legal Officer and Secretary | | 2006 | | Director, Senior Vice President, Secretary and General Counsel, Invesco Management Group, Inc. (formerly known as Invesco Aim Management Group, Inc.) and Van Kampen Exchange Corp.; Senior Vice President, Invesco Advisers, Inc. (formerly known as Invesco Institutional (N.A.), Inc.) (registered investment adviser); Senior Vice President and Secretary, Invesco Distributors, Inc. (formerly known as Invesco Aim Distributors, Inc.); Director, Vice President and Secretary, Invesco Investment Services, Inc. (formerly known as Invesco Aim Investment Services, Inc.) and IVZ Distributors, Inc. (formerly known as INVESCO Distributors, Inc.); Director and Vice President, INVESCO Funds Group, Inc.; Senior Vice President, Chief Legal Officer and Secretary, The Invesco Funds; Manager, Invesco PowerShares Capital Management LLC; Director, Secretary and General Counsel, Invesco Investment Advisers LLC (formerly known as Van Kampen Asset Management); Secretary and General Counsel, Invesco Capital Markets, Inc. (formerly known as Van Kampen Funds Inc.) and Chief Legal Officer, PowerShares Exchange-Traded Fund Trust, PowerShares Exchange-Traded Fund Trust II, PowerShares India Exchange-Traded Fund Trust and PowerShares Actively Managed Exchange-Traded Fund Trust Formerly: Director and Secretary, Van Kampen Advisors Inc.; Director Vice President, Secretary and General Counsel Van Kampen Investor Services Inc.; Director, Invesco Distributors, Inc. (formerly known as Invesco Aim Distributors, Inc.); Director, Senior Vice President, General Counsel and Secretary, Invesco Advisers, Inc.; and Van Kampen Investments Inc.; Director, Vice President and Secretary, Fund Management Company; Director, Senior Vice President, Secretary, General Counsel and Vice President, Invesco Aim Capital Management, Inc.; Chief Operating Officer and General Counsel, Liberty Ridge Capital, Inc. (an investment adviser); Vice President and Secretary, PBHG Funds (an investment company) and PBHG Insurance Series Fund (an investment company); Chief Operating Officer, General Counsel and Secretary, Old Mutual Investment Partners (a broker-dealer); General Counsel and Secretary, Old Mutual Fund Services (an administrator) and Old Mutual Shareholder Services (a shareholder servicing center); Executive Vice President, General Counsel and Secretary, Old Mutual Capital, Inc. (an investment adviser); and Vice President and Secretary, Old Mutual Advisors Funds (an investment company) | | N/A | | N/A |
Lisa O. Brinkley — 1959 Vice President | | 2004 | | Global Assurance Officer, Invesco Ltd. and Vice President, The Invesco Funds Formerly: Chief Compliance Officer, Invesco Distributors, Inc. (formerly known as Invesco Aim Distributors, Inc.), Invesco Investment Services, Inc.(formerly known as Invesco Aim Investment Services, Inc.) and Van Kampen Investor Services Inc.; Senior Vice President, Invesco Management Group, Inc.; Senior Vice President and Chief Compliance Officer, Invesco Advisers, Inc. and The Invesco Funds; Vice President and Chief Compliance Officer, Invesco Aim Capital Management, Inc. and Invesco Distributors, Inc.; Vice President, Invesco Investment Services, Inc. and Fund Management Company | | N/A | | N/A |
T-3 Invesco Charter Fund
Trustees and Officers—(continued)
| | | | | | | | |
Name, Year of Birth and
Position(s) Held with the Trust | | Trustee and/
or Officer Since | | Principal Occupation(s) During Past 5 Years | | Number of
Funds in Fund
Complex
Overseen by
Trustee | | Other Directorship(s)
Held by Trustee During
Past 5 Years |
| Other Officers—(continued) |
Karen Dunn Kelley — 1960 Vice President | | 2004 | | Head of Invesco’s World Wide Fixed Income and Cash Management Group; Senior Vice President, Invesco Management Group, Inc. (formerly known as Invesco Aim Management Group, Inc.) and Invesco Advisers, Inc. (formerly known as Invesco Institutional (N.A.), Inc.) (registered investment adviser); Executive Vice President, Invesco Distributors, Inc. (formerly known as Invesco Aim Distributors, Inc.); Director, Invesco Mortgage Capital Inc., INVESCO Global Asset Management Limited, Invesco Management Company Limited and INVESCO Management S.A.; Vice President, The Invesco Funds (other than AIM Treasurer’s Series Trust (Invesco Treasurer’s Series Trust) and Short-Term Investments Trust); and President and Principal Executive Officer, The Invesco Funds (AIM Treasurer’s Series Trust (Invesco Treasurer’s Series Trust) and Short-Term Investments Trust only) Formerly: Senior Vice President, Van Kampen Investments Inc.; Vice President, Invesco Advisers, Inc. (formerly known as Invesco Institutional (N.A.), Inc.); Director of Cash Management and Senior Vice President, Invesco Advisers, Inc. and Invesco Aim Capital Management, Inc.; President and Principal Executive Officer, Tax-Free Investments Trust; Director and President, Fund Management Company; Chief Cash Management Officer, Director of Cash Management, Senior Vice President, and Managing Director, Invesco Aim Capital Management, Inc.; Director of Cash Management, Senior Vice President, and Vice President, Invesco Advisers, Inc. and The Invesco Funds (AIM Treasurer’s Series Trust (Invesco Treasurer’s Series Trust), Short-Term Investments Trust and Tax-Free Investments Trust only) | | N/A | | N/A |
Sheri Morris — 1964 Vice President, Treasurer and Principal Financial Officer | | 1999 | | Vice President, Treasurer and Principal Financial Officer, The Invesco Funds; Vice President, Invesco Advisers, Inc. (formerly known as Invesco Institutional (N.A.), Inc.) (registered investment adviser); and Treasurer, PowerShares Exchange-Traded Fund Trust, PowerShares Exchange-Traded Fund Trust II, PowerShares India Exchange-Traded Fund Trust and PowerShares Actively Managed Exchange-Traded Fund Trust Formerly: Vice President, Invesco Advisers, Inc., Invesco Aim Capital Management, Inc. and Invesco Aim Private Asset Management, Inc.; Assistant Vice President and Assistant Treasurer, The Invesco Funds and Assistant Vice President, Invesco Advisers, Inc., Invesco Aim Capital Management, Inc. and Invesco Aim Private Asset Management, Inc. | | N/A | | N/A |
Yinka Akinsola — 1977 Anti-Money Laundering Compliance Officer | | 2011 | | Anti-Money Laundering Compliance Officer, Invesco Advisers, Inc. (formerly known as Invesco Institutional (N.A.), Inc.) (registered investment adviser); Invesco Distributors, Inc. (formerly known as Invesco Aim Distributors, Inc.), Invesco Investment Services, Inc. (formerly known as Invesco Aim Investment Services, Inc.), Invesco Management Group, Inc., The Invesco Funds, Invesco Van Kampen Closed-End Funds, Van Kampen Exchange Corp., Invesco Capital Markets, Inc. (formerly known as Van Kampen Funds Inc.), PowerShares Exchange-Traded Fund Trust, PowerShares Exchange-Traded Fund Trust II, PowerShares India Exchange-Traded Fund Trust, and PowerShares Actively Managed Exchange-Traded Fund Trust Formerly: Regulatory Analyst III, Financial Industry Regulatory Authority (FINRA). | | N/A | | N/A |
Todd L. Spillane — 1958 Chief Compliance Officer | | 2006 | | Senior Vice President, Invesco Management Group, Inc. (formerly known as Invesco Aim Management Group, Inc.) and Van Kampen Exchange Corp.; Senior Vice President and Chief Compliance Officer, Invesco Advisers, Inc. (registered investment adviser) (formerly known as Invesco Institutional (N.A.), Inc.); Chief Compliance Officer, The Invesco Funds; Vice President, Invesco Distributors, Inc. (formerly known as Invesco Aim Distributors, Inc.) and Invesco Investment Services, Inc. (formerly known as Invesco Aim Investment Services, Inc.) Formerly: Chief Compliance Officer, Invesco Van Kampen Closed-End Funds; Senior Vice President, Van Kampen Investments Inc.; Senior Vice President and Chief Compliance Officer, Invesco Advisers, Inc. and Invesco Aim Capital Management, Inc.; Chief Compliance Officer, INVESCO Private Capital Investments, Inc. (holding company), Invesco Private Capital, Inc. (registered investment adviser), Invesco Global Asset Management (N.A.), Inc., Invesco Senior Secured Management, Inc. (registered investment adviser) and Van Kampen Investor Services Inc., PowerShares Exchange-Traded Fund Trust, PowerShares Exchange-Traded Fund Trust II, PowerShares India Exchange-Traded Fund Trust and PowerShares Actively Managed Exchange-Traded Fund Trust; Vice President, Invesco Aim Capital Management, Inc. and Fund Management Company | | N/A | | N/A |
The Statement of Additional Information of the Trust includes additional information about the Fund’s Trustees and is available upon request, without charge, by calling 1.800.959.4246. Please refer to the Fund’s prospectus for information on the Fund’s sub-advisers.
| | | | | | |
Office of the Fund 11 Greenway Plaza, Suite 1000 Houston, TX 77046-1173 | | Investment Adviser Invesco Advisers, Inc. 1555 Peachtree Street, N.E. Atlanta, GA 30309 | | Distributor Invesco Distributors, Inc. 11 Greenway Plaza, Suite 1000 Houston, TX 77046-1173 | | Auditors PricewaterhouseCoopers LLP 1201 Louisiana Street, Suite 2900 Houston, TX 77002-5678 |
| | | |
| | | | | | |
Counsel to the Fund Stradley Ronon Stevens & Young, LLP 2005 Market Street, Suite 2600 Philadelphia, PA 19103-7018 | | Counsel to the Independent Trustees Kramer Levin Naftalis & Frankel LLP 1177 Avenue of the Americas New York, NY 10036-2714 | | Transfer Agent Invesco Investment Services, Inc. 11 Greenway Plaza, Suite 1000 Houston, TX 77046-1173 | | Custodian State Street Bank and Trust Company 225 Franklin Street Boston, MA 02110-2801 |
T-4 Invesco Charter Fund

Invesco mailing information
Send general correspondence to Invesco Investment Services, Inc., P.O. Box 219078, Kansas City, MO 64121-9078.
Invesco privacy policy
You share personal and financial information with us that is necessary for your transactions and your account records. We take very seriously the obligation to keep that information confidential and private.
Invesco collects nonpublic personal information about you from account applications or other forms you complete and from your transactions with us or our affiliates. We do not disclose information about you or our former customers to service providers or other third parties except to the extent necessary to service your account and in other limited circumstances as permitted by law. For example, we use this information to facilitate the delivery of transaction confirmations, financial reports, prospectuses and tax forms.
Even within Invesco, only people involved in the servicing of your accounts and compliance monitoring have access to your information. To ensure the highest level of confidentiality and security, Invesco maintains physical, electronic and procedural safeguards that meet or exceed federal standards. Special measures, such as data encryption and authentication, apply to your communications with us on our website. More detail is available to you at invesco.com/privacy.
Important notice regarding delivery of security holder documents
To reduce Fund expenses, only one copy of most shareholder documents may be mailed to shareholders with multiple accounts at the same address (Householding). Mailing of your shareholder documents may be householded indefinitely unless you instruct us otherwise. If you do not want the mailing of these documents to be combined with those for other members of your household, please contact Invesco Investment Services, Inc. at 800 959 4246 or contact your financial institution. We will begin sending you individual copies for each account within 30 days after receiving your request.
Fund holdings and proxy voting information
The Fund provides a complete list of its holdings four times in each fiscal year, at the quarter-ends. For the second and fourth quarters, the lists appear in the Fund’s semiannual and annual reports to shareholders. For the first and third quarters, the Fund files the lists with the Securities and Exchange Commission (SEC) on Form N-Q. The most recent list of portfolio holdings is available at invesco.com/completeqtrholdings. Shareholders can also look up the Fund’s Forms N-Q on the SEC website at sec.gov. Copies of the Fund’s Forms N-Q may be reviewed and copied at the SEC Public Reference Room in Washington, D.C. You can obtain information on the operation of the Public Reference Room, including information about duplicating fee charges, by calling 202 551 8090 or 800 732 0330, or by electronic request at the following email address: publicinfo@sec.gov. The SEC file numbers for the Fund are shown below.
A description of the policies and procedures that the Fund uses to determine how to vote proxies relating to portfolio securities is available without charge, upon request, from our Client Services department at 800 959 4246 or at invesco.com/proxyguidelines. The information is also available on the SEC website, sec.gov.
| | | | |
Information regarding how the Fund voted proxies related to its portfolio securities during the 12 months ended June 30, 2012, is available at invesco.com/proxysearch. The information is also available on the SEC website, sec.gov. Invesco Advisers, Inc. is an investment adviser; it provides investment advisory services to individual and institutional clients and does not sell securities. Invesco Distributors, Inc. is the US distributor for Invesco Ltd.’s retail mutual funds, exchange-traded funds and institutional money market funds. Both are wholly owned, indirect subsidiaries of Invesco Ltd. | | |  | |
| | | | |
| SEC file numbers: 811-01424 and 002-25469 | | CHT-AR-1 | | Invesco Distributors, Inc. |

Letters to Shareholders
| | |

Philip Taylor | | Dear Shareholders: This report contains information about your Fund, including a discussion from your portfolio managers about how they managed your Fund – and why it performed as it did – during the reporting period. This report also includes your Fund’s long-term performance and a complete list of your Fund’s investments as of the close of the reporting period. I hope you find this information helpful. For much of the reporting period, investors’ attention was focused on Europe, where eurozone governments struggled to reduce debt levels, strengthen their banks and stimulate their economies. European leaders disagreed whether the wiser path to restoring the Continent’s economic well-being was more stimulus or greater austerity. In the US, economic data were mixed. Economic growth, while positive, was relatively modest. Corporate earnings, which grew strongly in recent years, showed signs of slowing. And job creation was less |
| robust than hoped. Later in this report, your Fund’s portfolio managers discuss how economic conditions and market trends affected your Fund’s performance. |
Economic conditions are always subject to sudden and unexpected change. That’s why you may find it helpful to work with a trusted, experienced financial adviser who understands your unique financial goals, needs and risk tolerances. Financial advisers can provide valuable insight and information, particularly when markets are uncertain, and they can recommend investments appropriate for specific investment goals, such as a child’s college education or your retirement. On a regular basis, a financial adviser also can determine whether your existing investments are still appropriate, given your changing needs, goals and circumstances.
Timely insight and information from many of Invesco’s investment professionals is available at our website, invesco.com/us. We offer in-depth articles, video clips and audio commentaries from many of our portfolio managers and other investment professionals on a wide range of topics of interest to investors: recent economic and market developments; retirement planning; legislative updates from Washington, DC; and general investor education. At invesco.com/us, you also can access information about your Invesco account at any time.
What we mean by Intentional Investing
Intentional InvestingSM is the science and art of investing with purpose, prudence and diligence – and it’s how Invesco’s investment professionals manage your money every day.
This highly disciplined process begins when specialized teams of investment professionals clearly define an investment objective and then establish specific investment strategies to try to achieve that objective. While our investment teams closely monitor economic and market conditions – and issues specific to individual holdings that could affect their value – they maintain a long-term investment perspective. Intentional Investing is also:
| | n | | How we manage and mitigate risk – by embedding risk controls and processes into every aspect of our business; |
| | n | | How we create products – by offering a diverse combination of investment strategies and vehicles designed to meet your needs; and |
| | n | | How we connect with you, our investors – by communicating clearly, by delivering expert insights from our portfolio managers and other investment professionals, and by providing a website full of tools and articles to help you stay informed. |
As a company, Invesco believes in putting investors first, and that’s why investment management is all we do. Our sole focus on managing your money allows your financial adviser to build a truly diversified investment portfolio of Invesco funds, whatever your investment needs and goals may be – and allows him or her to find appropriate Invesco funds when your circumstances change. Of course, neither Intentional Investing nor diversification can guarantee a profit or protect against loss.
Have a question?
If you have questions about your account, please contact an Invesco client services representative at 800 959 4246. If you have an Invesco-related question or comment, feel free to email me directly at phil@invesco.com.
All of us at Invesco look forward to serving your investment management needs for many years to come. Thank you for investing with us.
Sincerely,

Philip Taylor
Senior Managing Director, Invesco Ltd.
2 Invesco Constellation Fund
| | |

Bruce Crockett | | Dear Fellow Shareholders: One of our most important responsibilities as independent Trustees of the Invesco Funds is our annual review of the funds’ advisory and sub-advisory contracts with Invesco. This annual review is required by the Investment Company Act of 1940 and focuses on the nature and quality of the services Invesco has provided as adviser to the Invesco Funds and the reasonableness of the fees that it charges for those services. In our roles as Trustees, we spend months reviewing thousands of pages of detailed information that we request from Invesco in connection with our annual review. We focus on the quality and costs of the services to be provided by Invesco and its affiliates. Some of the most important things we look at are fund performance, expenses and fees. All of the Trustees have substantial personal investments in the Invesco Funds complex. We’re fund shareholders just like you. |
We also use information from many independent sources during the review process, including materials provided by the independent Senior Officer of the Invesco Funds, who reports directly to the independent Trustees. We also meet in private sessions with independent legal counsel and review performance and fee data on the Invesco Funds prepared by Lipper Inc., an independent, third-party firm widely recognized as a leader in its field.
I’m pleased to report that the Invesco Funds Board determined in June that renewing the investment advisory agreement and the sub-advisory contracts with Invesco would serve the best interests of each fund and its shareholders. For more detailed information about our assessment and conclusions with respect to each of the Invesco Funds, visit invesco.com/us, click on the “About Us” section and go to “Legal Information.” Information on the recent investment advisory renewal process can be found by clicking the last item under “Corporate Governance.”
In much the same way we review your fund’s advisory contract each year, it’s a good idea for you to review your own investment plan with your financial adviser on a regular basis. Perhaps you need to reassess your original asset allocation because different investments may grow at varying paces, or perhaps you’re going through a significant life change. Regardless of your situation, a financial adviser can provide guidance and experience to help you reach your financial goals.
As always, please contact me at bruce@brucecrockett.com with any questions or concerns you may have. On behalf of the Board, we look forward to continuing to represent your interests and serving your needs.
Sincerely,

Bruce L. Crockett
Independent Chair
Invesco Funds Board of Trustees
3 Invesco Constellation Fund
Management’s Discussion of Fund Performance
Performance summary
For the fiscal year ended October 31, 2012, Invesco Constellation Fund, at net asset value (NAV), had positive returns but underperformed its style-specific benchmark, the Russell 1000 Growth Index. Underperformance was driven primarily by stock selection in several sectors.
Your Fund’s long-term performance appears later in this report.
Fund vs. Indexes
Total returns, 10/31/11 to 10/31/12, at net asset value (NAV). Performance shown does not include applicable contingent deferred sales charges (CDSC) or front-end sales charges, which would have reduced performance.
| | | | |
Class A Shares | | | 4.06 | % |
Class B Shares | | | 3.25 | |
Class C Shares | | | 3.25 | |
Class R Shares | | | 3.77 | |
Class Y Shares | | | 4.26 | |
Class R5 Shares* | | | 4.52 | |
S&P 500 Indexq (Broad Market Index) | | | 15.21 | |
Russell 1000 Growth Indexn (Style-Specific Index) | | | 13.02 | |
Lipper Multi-Cap Growth Funds Index¿ (Peer Group Index) | | | 8.97 | |
Source(s): qInvesco, S&P-Dow Jones via FactSet Research Systems Inc.;
nInvesco, Russell via FactSet Research Systems Inc.; ¿Lipper Inc.
| *Effective | September 24, 2012, Institutional Class shares were renamed Class R5 shares. |
How we invest
We believe a growth investment strategy is an essential component of a diversified portfolio.
Our investment process emphasizes rigorous bottom-up analysis of individual companies. We seek to invest in companies with strong or improving fundamentals, attractive valuations relative to growth prospects and earnings expectations that appear fair to conservative.
To narrow our investment universe, we utilize a holistic approach that emphasizes fundamental research and, to a lesser extent, includes quantitative analysis. At the end of this distillation process, we have a set of stocks to analyze in greater depth.
Our fundamental analysis focuses on identifying companies with strong drivers of growth. To accomplish this goal, we conduct rigorous bottom-up analysis in order to develop higher conviction in
each company’s prospects for growth. Through our analysis, we develop a mosaic of each company through detailed discussions with company management teams, competitors, distributors, suppliers, Wall Street analysts and customers. We also utilize a variety of valuation techniques based on the company in question, the industry in which the company operates, the stage of the business cycle and other factors that best reflect a company’s value.
Risk management plays an important role in portfolio construction, as our target portfolio attempts to maximize the relationship between risk and return. We seek to accomplish this goal by investing in companies with attractive fundamental prospects for growth, and we divide the portfolio between stable growth stocks and catalyst-driven stocks.
We consider selling a stock for any of the following reasons:
| n | | The price target set at purchase has been reached. |
| n | | There is deterioration in fundamentals. |
| n | | The catalysts for growth are no longer present or are reflected in the stock price. |
| n | | There is a more attractive investment opportunity. |
Market conditions and your Fund
The fiscal year began with improving economic data in the US and a rally in equities that continued almost uninterrupted into the spring of 2012. However, the ongoing eurozone sovereign debt crisis intensified in April and May, dominating headlines and creating significant volatility in equity markets across the globe.
This negative news from overseas precipitated a slowdown in the US, where economic data began to decelerate as manufacturing, employment, consumer spending and consumer confidence weakened over the summer. While corporate earnings remained solid, financial markets were influenced by macroeconomic developments for much of the reporting period. As the fiscal year drew to a close, fears about the fate of the eurozone began to subside after the European Central Bank announced new measures to support eurozone economies through potentially unlimited purchases of sovereign debt, among other measures. At the same time, continued risk aversion among investors and corporations, along with tepid employment growth, prompted the US Federal Reserve (the Fed) to initiate a third round of quantitative easing by promising to remain accommodative until the labor market outlook improves materially. The Fed’s action initially bolstered equity markets, but the potential impact on employment and economic conditions remained uncertain. At the close of the reporting period, market volatility increased as many investors remained concerned
Portfolio Composition
By sector
| | | | |
Information Technology | | | 30.3 | % |
Consumer Discretionary | | | 18.9 | |
Health Care | | | 12.7 | |
Industrials | | | 11.8 | |
Financials | | | 8.6 | |
Energy | | | 6.8 | |
Consumer Staples | | | 2.6 | |
Telecommunication Services | | | 2.2 | |
Materials | | | 1.9 | |
Money Market Funds Plus Other Assets Less Liabilities | | | 4.2 | |
Top 10 Equity Holdings*
| | | | |
1. Apple Inc. | | | 7.1 | % |
2. QUALCOMM, Inc. | | | 3.7 | |
3. Google Inc.-Class A | | | 3.5 | |
4. EMC Corp. | | | 3.4 | |
5. Goldman Sachs Group, Inc. (The) | | | 2.9 | |
6. DISH Network Corp.-Class A | | | 2.6 | |
7. General Electric Co. | | | 2.5 | |
8. DIRECTV | | | 2.3 | |
9. Weatherford International Ltd. | | | 2.2 | |
10. Pfizer Inc. | | | 2.2 | |
Top Five Industries*
| | | | |
1. Computer Hardware | | | 7.1 | % |
2. Internet Software & Services | | | 6.3 | |
3. Pharmaceuticals | | | 6.2 | |
4. Cable & Satellite | | | 6.0 | |
5. Oil & Gas Equipment & Services | | | 5.1 | |
| | | | |
Total Net Assets | | $ | 2.4 billion | |
| |
Total Number of Holdings* | | | 74 | |
The Fund’s holdings are subject to change, and there is no assurance that the Fund will continue to hold any particular security.
*Excluding money market fund holdings.
4 Invesco constellation Fund
about the uncertainty surrounding the presidential election and the so-called “fiscal cliff” – a variety of tax increases and spending cuts scheduled to take effect in January 2013, unless an agreement is reached between the White House and Congress.
Despite volatility for much of the reporting period, major equity market indexes delivered double-digit gains, and all 10 sectors of the S&P 500 Index had positive returns.1
The Fund at NAV had positive absolute returns but underperformed the Russell 1000 Growth Index during the reporting period. The Fund underperformed the index by the widest margins in the information technology (IT), energy, health care and materials sectors. Underperformance in each of these sectors was driven predominately by stock selection. Some of this underperformance was offset by outperformance in the telecommunication services and financials sectors, the result of beneficial stock selection.
The IT sector included the Fund’s most significant detractor and also its most significant contributor. Rovi was the largest detractor and negatively affected performance after the departure of some senior managers and after giving guidance that some legacy products were winding down more quickly than expected, while newer growth products would be delayed. We sold our position during the reporting period. Baidu was another detractor from relative performance. The search engine provider’s stock was affected by the economic slowdown in China as well as concerns regarding a new competitor. Overall stock selection in the sector was negative and outweighed the positive contributions of the Fund’s largest position and largest contributor, Apple.
Energy was one of the poorer performing and most volatile index sectors during the reporting period as natural gas prices hit remarkable lows then rebounded somewhat, and oil prices took a similar path but with different timing. The portfolio also underperformed in energy due to an emphasis on service providers, including Halliburton (no longer a Fund holding), after shale pressure pumping demand slowed and pricing came under pressure. Many of these service providers were also more volatile than the larger integrated oil companies in the index.
In the health care sector, one of the leading detractors from performance was Allscripts Healthcare Solutions, which provides clinical, financial, connectivity and information solutions to hospitals
and physicians. Allscripts announced dramatically lower business fundamentals and earnings during the reporting period, and a power struggle in the boardroom led to the departure of a number of board members. Surrounding these events the stock price was hit dramatically. We sold the position during the reporting period.
Some of the Fund’s underperformance was offset by outperformance in the telecommunication services sector driven by strong stock selection including Sprint Nextel. American Tower was also a significant contributor to the portfolio benefitting from strong secular tailwinds in data transmission and mobile phone penetration. During the reporting period, American Tower restructured its business as a real estate investment trust and therefore was reclassified into the financials sector. Also, in the financials sector, Goldman Sachs was a positive contributor to Fund performance.
As we’ve discussed, the stock market experienced volatile performance during the reporting period. We would like to caution investors against making investment decisions based on short-term performance.
We thank you for your commitment to the Invesco Constellation Fund.
1 Source: Lipper Inc.
The views and opinions expressed in management’s discussion of Fund performance are those of Invesco Advisers, Inc. These views and opinions are subject to change at any time based on factors such as market and economic conditions. These views and opinions may not be relied upon as investment advice or recommendations, or as an offer for a particular security. The information is not a complete analysis of every aspect of any market, country, industry, security or the Fund. Statements of fact are from sources considered reliable, but Invesco Advisers, Inc. makes no representation or warranty as to their completeness or accuracy. Although historical performance is no guarantee of future results, these insights may help you understand our investment management philosophy.
See important Fund and, if applicable, index disclosures later in this report.
| | |
 | | Erik Voss Chartered Financial Analyst, portfolio manager, is lead manager of Invesco Constellation Fund. He |
| joined Invesco in 2010. Mr. Voss earned a BS in mathematics and an MS in finance from the University of Wisconsin. |
| |
 | | Ido Cohen Portfolio manager, is manager of Invesco Constellation Fund. He joined Invesco in 2010. |
| Mr. Cohen earned a BS in economics from the Wharton School of the University of Pennsylvania. |
5 Invesco Constellation Fund
Your Fund’s Long-Term Performance
Results of a $10,000 Investment Oldest Share Class(es)
Fund and index data from 10/31/02*
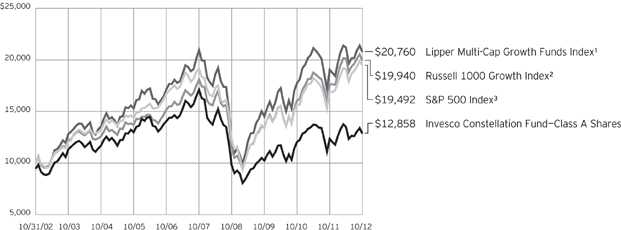
1 Source: Lipper Inc.
2 Source(s): Invesco, Russell via FactSet Research Systems Inc.
3 Source(s): Invesco, S&P-Dow Jones via FactSet Research Systems Inc.
| * | During the reporting period, Invesco changed its policy regarding growth of $10,000 charts. For funds older than 10 years, we previously showed performance since inception. Going forward, we will show performance for the most recent 10 years, since this more accurately reflects the experience of the typical shareholder. As a result, charts now may include benchmarks that did not appear previously, because the funds’ inception predated the benchmarks’ inception. Also, all charts will now be presented using a linear format. |
Past performance cannot guarantee comparable future results.
The data shown in the chart include reinvested distributions, applicable sales charges and Fund expenses including
management fees. Index results include reinvested dividends, but they do not reflect sales charges. Performance of the peer group, if applicable, reflects fund expenses and management fees;
performance of a market index does not. Performance shown in the chart and table(s) does not reflect deduction of taxes a shareholder would pay on Fund distributions or sale of Fund shares.
6 Invesco Constellation Fund
Average Annual Total Returns
As of 10/31/12, including maximum applicable sales charges
| | | | |
Class A Shares | | | | |
Inception (4/30/76) | | | 11.19 | % |
10 Years | | | 2.55 | |
5 Years | | | -6.61 | |
1 Year | | | -1.65 | |
| |
Class B Shares | | | | |
Inception (11/3/97) | | | 0.70 | % |
10 Years | | | 2.52 | |
5 Years | | | -6.64 | |
1 Year | | | -1.75 | |
| |
Class C Shares | | | | |
Inception (8/4/97) | | | 0.28 | % |
10 Years | | | 2.36 | |
5 Years | | | -6.25 | |
1 Year | | | 2.25 | |
| |
Class R Shares | | | | |
Inception (6/3/02) | | | 1.39 | % |
10 Years | | | 2.87 | |
5 Years | | | -5.79 | |
1 Year | | | 3.77 | |
| |
Class Y Shares | | | | |
10 Years | | | 3.23 | % |
5 Years | | | -5.36 | |
1 Year | | | 4.26 | |
| |
Class R5 Shares | | | | |
Inception (4/8/92) | | | 6.32 | % |
10 Years | | | 3.67 | |
5 Years | | | -5.04 | |
1 Year | | | 4.52 | |
Class Y shares incepted on October 3, 2008. Performance shown prior to that date is that of Class A shares and includes the 12b-1 fees applicable to Class A shares. Class A share performance reflects any applicable fee waivers or expense reimbursements.
The performance data quoted represent past performance and cannot guarantee comparable future results; current performance may be lower or higher. Please visit invesco.com/performance for the most recent month-end performance. Performance figures reflect reinvested distributions, changes in net asset value and the effect of the maximum sales charge unless otherwise stated. Investment return and principal value will fluctuate so that you may have a gain or loss when you sell shares.
The total annual Fund operating expense ratio set forth in the most
Average Annual Total Returns
As of 9/30/12, the most recent calendar quarter-end, including maximum applicable sales charges
| | | | |
Class A Shares | | | | |
Inception (4/30/76) | | | 11.34 | % |
10 Years | | | 3.84 | |
5 Years | | | -5.15 | |
1 Year | | | 14.16 | |
| |
Class B Shares | | | | |
Inception (11/3/97) | | | 0.97 | % |
10 Years | | | 3.82 | |
5 Years | | | -5.18 | |
1 Year | | | 14.89 | |
| |
Class C Shares | | | | |
Inception (8/4/97) | | | 0.55 | % |
10 Years | | | 3.66 | |
5 Years | | | -4.79 | |
1 Year | | | 18.90 | |
| |
Class R Shares | | | | |
Inception (6/3/02) | | | 1.80 | % |
10 Years | | | 4.17 | |
5 Years | | | -4.31 | |
1 Year | | | 20.50 | |
| |
Class Y Shares | | | | |
10 Years | | | 4.53 | % |
5 Years | | | -3.89 | |
1 Year | | | 21.04 | |
| |
Class R5 Shares | | | | |
Inception (4/8/92) | | | 6.56 | % |
10 Years | | | 4.98 | |
5 Years | | | -3.55 | |
1 Year | | | 21.37 | |
recent Fund prospectus as of the date of this report for Class A, Class B, Class C, Class R, Class Y and Class R5 shares was 1.29%, 2.04%, 2.04%, 1.54%, 1.04% and 0.75%, respectively. The expense ratios presented above may vary from the expense ratios presented in other sections of this report that are based on expenses incurred during the period covered by this report.
Class A share performance reflects the maximum 5.50% sales charge, and Class B and Class C share performance reflects the applicable contingent deferred sales charge (CDSC) for the period involved. The CDSC on Class B shares declines from 5% beginning at the time of purchase to 0% at the beginning of the seventh year. The CDSC on Class C shares is 1% for the first year after purchase. Class R, Class Y and Class R5 shares do not
have a front-end sales charge or a CDSC; therefore, performance is at net asset value.
The performance of the Fund’s share classes will differ primarily due to different sales charge structures and class expenses.
7 Invesco Constellation Fund
Invesco Constellation Fund’s investment objective is long-term growth of capital.
| n | | Unless otherwise stated, information presented in this report is as of October 31, 2012, and is based on total net assets. |
| n | | Unless otherwise noted, all data provided by Invesco. |
| n | | To access your Fund’s reports/prospectus, visit invesco.com/fundreports. |
About share classes
| n | | Class B shares may not be purchased for new or additional investments. Please see the prospectus for more information. |
| n | | Class R shares are generally available only to employee benefit plans. Please see the prospectus for more information. |
| n | | Class Y shares are available only to certain investors. Please see the prospectus for more information. |
| n | | Class R5 shares are primarily intended for retirement plans that meet certain standards and for institutional investors. On September 24, 2012, Institutional Class shares were renamed Class R5 shares. Please see the prospectus for more information. |
Principal risks of investing in the Fund
| n | | Foreign securities risk. The Fund’s foreign investments may be affected by changes in a foreign country’s exchange rates; political and social instability; changes in economic or taxation policies; difficulties when enforcing obligations; decreased liquidity; and increased volatility. Foreign companies may be subject to less regulation resulting in less publicly available information about the companies. |
| n | | Growth investing risk. Growth stocks tend to be more expensive relative to their earnings or assets compared with other types of stock. As a result they tend to be more sensitive to changes in their earnings and can be more volatile. |
| n | | Management risk. The investment techniques and risk analysis used by the Fund’s portfolio managers may not produce the desired results. |
| n | | Market risk. The prices of and the income generated by the Fund’s securities may decline in response to, among other things, investor sentiment, general economic and market conditions, regional or global instability, and currency and interest rate fluctuations. |
About indexes used in this report
| n | | The S&P 500® Index is an unmanaged index considered representative of the US stock market. |
| n | | The Russell 1000® Growth Index is an unmanaged index considered representative of large-cap growth stocks. The Russell 1000 Growth Index is a trademark/service mark of the Frank Russell Co. Russell® is a trademark of the Frank Russell Co. |
| n | | The Lipper Multi-Cap Growth Funds Index is an unmanaged index considered representative of multicap growth funds tracked by Lipper. |
| n | | The Fund is not managed to track the performance of any particular index, including the index(es) defined here, and consequently, the performance of the Fund may deviate significantly from the performance of the index(es). |
| n | | A direct investment cannot be made in an index. Unless otherwise indicated, index results include reinvested dividends, and they do not reflect sales charges. Performance of the peer group, if applicable, reflects fund expenses; performance of a market index does not. |
Other information
| n | | The returns shown in management’s discussion of Fund performance are based on net asset values calculated for shareholder transactions. Generally accepted accounting principles require adjustments to be made to the net assets of the Fund at period end for financial reporting purposes, and as such, the net asset values for shareholder transactions and the returns based on those net asset values may differ from the net asset values and returns reported in the Financial Highlights. |
| n | | Industry classifications used in this report are generally according to the Global Industry Classification Standard, which was developed by and is the exclusive property and a service mark of MSCI inc. and Standard & Poor’s. |
This report must be accompanied or preceded by a currently effective Fund prospectus, which contains more complete information, including sales charges and expenses. Investors should read it carefully before investing.
|
| NOT FDIC INSURED | MAY LOSE VALUE | NO BANK GUARANTEE |
| | |
Fund Nasdaq Symbols | | |
| |
Class A Shares | | CSTGX |
Class B Shares | | CSTBX |
Class C Shares | | CSTCX |
Class R Shares | | CSTRX |
Class Y Shares | | CSTYX |
Class R5 Shares | | CSITX |
8 Invesco Constellation Fund
Schedule of Investments(a)
October 31, 2012
| | | | | | | | |
| | | Shares | | | Value | |
Common Stocks & Other Equity Interests–95.81% | |
Aerospace & Defense–2.02% | |
Boeing Co. (The) | | | 509,056 | | | $ | 35,857,905 | |
United Technologies Corp. | | | 156,566 | | | | 12,237,198 | |
| | | | | | | | 48,095,103 | |
|
Air Freight & Logistics–1.03% | |
Expeditors International of Washington, Inc. | | | 671,927 | | | | 24,599,247 | |
| | |
Apparel Retail–1.29% | | | | | | | | |
Gap, Inc. (The) | | | 862,774 | | | | 30,818,287 | |
|
Apparel, Accessories & Luxury Goods–1.76% | |
Coach, Inc. | | | 245,563 | | | | 13,763,806 | |
Prada S.p.A. (Italy) | | | 2,090,800 | | | | 17,002,567 | |
Prada S.p.A. (Italy)(b) | | | 1,372,000 | | | | 11,157,223 | |
| | | | | | | | 41,923,596 | |
|
Application Software–3.19% | |
Autodesk, Inc.(c) | | | 319,897 | | | | 10,185,520 | |
Citrix Systems, Inc.(c) | | | 459,330 | | | | 28,391,187 | |
Salesforce.com, Inc.(c) | | | 256,416 | | | | 37,431,608 | |
| | | | | | | | 76,008,315 | |
|
Biotechnology–4.26% | |
Alexion Pharmaceuticals, Inc.(c) | | | 69,542 | | | | 6,285,206 | |
Amgen Inc. | | | 301,212 | | | | 26,068,392 | |
Biogen Idec Inc.(c) | | | 113,744 | | | | 15,721,696 | |
Celgene Corp.(c) | | | 318,229 | | | | 23,332,550 | |
Gilead Sciences, Inc.(c) | | | 449,035 | | | | 30,157,191 | |
| | | | | | | | 101,565,035 | |
|
Broadcasting–0.86% | |
CBS Corp.–Class B | | | 635,245 | | | | 20,581,938 | |
|
Cable & Satellite–6.02% | |
Comcast Corp.–Class A | | | 718,916 | | | | 26,966,539 | |
DIRECTV(c) | | | 1,059,770 | | | | 54,164,845 | |
DISH Network Corp.–Class A | | | 1,754,639 | | | | 62,517,787 | |
| | | | | | | | 143,649,171 | |
|
Casinos & Gaming–0.85% | |
Las Vegas Sands Corp. | | | 434,778 | | | | 20,191,090 | |
|
Communications Equipment–3.69% | |
QUALCOMM, Inc. | | | 1,501,233 | | | | 87,934,723 | |
|
Computer Hardware–7.07% | |
Apple Inc. | | | 283,176 | | | | 168,518,038 | |
|
Computer Storage & Peripherals–3.41% | |
EMC Corp.(c) | | | 3,328,130 | | | | 81,272,935 | |
| | | | | | | | |
| | | Shares | | | Value | |
Construction & Engineering–0.82% | |
Foster Wheeler AG (Switzerland)(c) | | | 879,386 | | | $ | 19,583,926 | |
|
Construction & Farm Machinery & Heavy Trucks–1.57% | |
Cummins Inc. | | | 400,841 | | | | 37,510,701 | |
|
Consumer Finance–1.85% | |
Capital One Financial Corp. | | | 733,145 | | | | 44,113,335 | |
|
Data Processing & Outsourced Services–1.67% | |
Visa Inc.–Class A | | | 286,245 | | | | 39,719,356 | |
|
Department Stores–0.53% | |
Macy’s, Inc. | | | 333,693 | | | | 12,703,693 | |
|
Diversified Banks–1.92% | |
Wells Fargo & Co. | | | 1,361,915 | | | | 45,882,916 | |
|
Drug Retail–0.89% | |
CVS Caremark Corp. | | | 459,728 | | | | 21,331,379 | |
|
Fertilizers & Agricultural Chemicals–1.90% | |
Monsanto Co. | | | 386,901 | | | | 33,300,569 | |
Mosaic Co. (The) | | | 229,444 | | | | 12,009,099 | |
| | | | | | | | 45,309,668 | |
|
General Merchandise Stores–1.62% | |
Dollar General Corp.(c) | | | 795,538 | | | | 38,679,058 | |
|
Health Care Equipment–0.40% | |
Intuitive Surgical, Inc.(c) | | | 17,696 | | | | 9,595,125 | |
|
Health Care Services–1.52% | |
Express Scripts Holding Co.(c) | | | 588,867 | | | | 36,238,875 | |
|
Health Care Technology–0.35% | |
Cerner Corp.(c) | | | 110,222 | | | | 8,397,814 | |
|
Home Improvement Retail–1.24% | |
Home Depot, Inc. (The) | | | 363,031 | | | | 22,282,843 | |
Lowe’s Cos., Inc. | | | 224,147 | | | | 7,257,880 | |
| | | | | | | | 29,540,723 | |
|
Hypermarkets & Super Centers–1.37% | |
Wal-Mart Stores, Inc. | | | 435,791 | | | | 32,693,041 | |
|
Industrial Conglomerates–3.52% | |
Danaher Corp. | | | 474,188 | | | | 24,529,745 | |
General Electric Co. | | | 2,827,087 | | | | 59,538,452 | |
| | | | | | | | 84,068,197 | |
|
Industrial Machinery–0.91% | |
Ingersoll-Rand PLC | | | 464,113 | | | | 21,827,234 | |
|
Integrated Oil & Gas–1.04% | |
Occidental Petroleum Corp. | | | 314,632 | | | | 24,843,343 | |
See accompanying Notes to Financial Statements which are an integral part of the financial statements.
9 Invesco Constellation Fund
| | | | | | | | |
| | | Shares | | | Value | |
Internet Retail–2.62% | |
Amazon.com, Inc.(c) | | | 121,779 | | | $ | 28,352,587 | |
Priceline.com Inc.(c) | | | 59,353 | | | | 34,054,971 | |
| | | | | | | | 62,407,558 | |
|
Internet Software & Services–6.26% | |
Baidu, Inc.–ADR (China)(c) | | | 153,404 | | | | 16,355,934 | |
eBay Inc.(c) | | | 687,862 | | | | 33,216,856 | |
Facebook Inc.–Class A(c) | | | 123,895 | | | | 2,616,043 | |
Facebook Inc.–Class B
(Acquired 04/04/12-04/05/12;
Cost $21,752,885)(b)(c) | | | 654,073 | | | | 12,432,620 | |
Google Inc.–Class A(c) | | | 124,404 | | | | 84,594,720 | |
| | | | | | | | 149,216,173 | |
|
Investment Banking & Brokerage–2.90% | |
Goldman Sachs Group, Inc. (The) | | | 564,835 | | | | 69,130,156 | |
|
IT Consulting & Other Services–1.57% | |
Cognizant Technology Solutions Corp.–Class A(c) | | | 561,381 | | | | 37,416,044 | |
|
Movies & Entertainment–0.77% | |
Walt Disney Co. (The) | | | 373,190 | | | | 18,312,433 | |
|
Oil & Gas Equipment & Services–5.12% | |
Cameron International Corp.(c) | | | 348,457 | | | | 17,645,862 | |
National Oilwell Varco Inc. | | | 200,001 | | | | 14,740,074 | |
Schlumberger Ltd. | | | 531,390 | | | | 36,947,547 | |
Weatherford International Ltd.(c) | | | 4,664,124 | | | | 52,704,601 | |
| | | | | | | | 122,038,084 | |
|
Oil & Gas Exploration & Production–0.40% | |
Anadarko Petroleum Corp. | | | 138,547 | | | | 9,533,419 | |
|
Oil & Gas Refining & Marketing–0.27% | |
Marathon Petroleum Corp. | | | 118,178 | | | | 6,491,518 | |
| | |
Packaged Foods & Meats–0.30% | | | | | | | | |
Mondelez International Inc.–Class A | | | 272,477 | | | | 7,231,540 | |
| | |
Pharmaceuticals–6.19% | | | | | | | | |
Abbott Laboratories | | | 615,287 | | | | 40,313,604 | |
Allergan, Inc. | | | 243,995 | | | | 21,940,030 | |
Johnson & Johnson | | | 475,272 | | | | 33,658,763 | |
Pfizer Inc. | | | 2,076,103 | | | | 51,632,682 | |
| | | | | | | | 147,545,079 | |
| | | | | | | | |
| | | Shares | | | Value | |
Property & Casualty Insurance–0.83% | |
ACE Ltd. | | | 252,564 | | | $ | 19,864,159 | |
| | |
Railroads–0.96% | | | | | | | | |
Union Pacific Corp. | | | 185,358 | | | | 22,804,595 | |
| | |
Restaurants–1.38% | | | | | | | | |
Chipotle Mexican Grill, Inc.(c) | | | 43,056 | | | | 10,959,043 | |
Starbucks Corp. | | | 479,813 | | | | 22,023,417 | |
| | | | | | | | 32,982,460 | |
|
Semiconductors–1.84% | |
Broadcom Corp.–Class A(c) | | | 717,477 | | | | 22,625,637 | |
Maxim Integrated Products, Inc. | | | 769,723 | | | | 21,186,626 | |
| | | | | | | | 43,812,263 | |
| | |
Specialized REIT’s–1.06% | | | | | | | | |
American Tower Corp. | | | 334,332 | | | | 25,171,856 | |
| | |
Systems Software–1.66% | | | | | | | | |
Check Point Software Technologies Ltd. (Israel)(c) | | | 293,277 | | | | 13,059,625 | |
Oracle Corp. | | | 856,957 | | | | 26,608,515 | |
| | | | | | | | 39,668,140 | |
| | |
Trucking–0.95% | | | | | | | | |
J.B. Hunt Transport Services, Inc. | | | 387,467 | | | | 22,744,313 | |
|
Wireless Telecommunication Services–2.16% | |
Sprint Nextel Corp.(c) | | | 9,280,258 | | | | 51,412,629 | |
Total Common Stocks & Other Equity Interests (Cost $1,902,813,445) | | | | 2,284,978,281 | |
|
Money Market Funds–4.66% | |
Liquid Assets Portfolio–Institutional Class(d) | | | 55,583,657 | | | | 55,583,657 | |
Premier Portfolio–Institutional Class(d) | | | 55,583,657 | | | | 55,583,657 | |
Total Money Market Funds
(Cost $111,167,314) | | | | 111,167,314 | |
TOTAL INVESTMENTS–100.47%
(Cost $2,013,980,759) | | | | 2,396,145,595 | |
OTHER ASSETS LESS LIABILITIES–(0.47)% | | | | (11,127,040 | ) |
NET ASSETS–100.00% | | | | | | $ | 2,385,018,555 | |
Investment Abbreviations:
| | |
| ADR | | – American Depositary Receipts |
| REIT | | – Real Estate Investment Trust |
Notes to Schedule of Investments:
| (a) | Industry and/or sector classifications used in this report are generally according to the Global Industry Classification Standard, which was developed by and is the exclusive property and a service mark of MSCI Inc. and Standard & Poor’s. |
| (b) | Security purchased or received in a transaction exempt from registration under the Securities Act of 1933, as amended. The security may be resold pursuant to an exemption from registration under the 1933 Act, typically to qualified institutional buyers. The aggregate value of these securities at October 31, 2012 was $23,589,843, which represented 0.99% of the Fund’s Net Assets. |
| (c) | Non-income producing security. |
| (d) | The money market fund and the Fund are affiliated by having the same investment adviser. |
See accompanying Notes to Financial Statements which are an integral part of the financial statements.
10 Invesco Constellation Fund
Statement of Assets and Liabilities
October 31, 2012
| | | | |
Assets: | | | | |
Investments, at value (Cost $1,902,813,445) | | $ | 2,284,978,281 | |
Investments in affiliated money market funds, at value and cost | | | 111,167,314 | |
Total investments, at value (Cost $2,013,980,759) | | | 2,396,145,595 | |
Foreign currencies, at value (Cost $5) | | | 5 | |
Receivable for: | | | | |
Investments sold | | | 5,932,444 | |
Fund shares sold | | | 405,788 | |
Dividends | | | 639,767 | |
Investment for trustee deferred compensation and retirement plans | | | 597,149 | |
Other assets | | | 112,325 | |
Total assets | | | 2,403,833,073 | |
| |
Liabilities: | | | | |
Payable for: | | | | |
Investments purchased | | | 9,305,940 | |
Fund shares reacquired | | | 4,834,067 | |
Accrued fees to affiliates | | | 2,236,535 | |
Accrued other operating expenses | | | 541,225 | |
Trustee deferred compensation and retirement plans | | | 1,896,751 | |
Total liabilities | | | 18,814,518 | |
Net assets applicable to shares outstanding | | $ | 2,385,018,555 | |
| |
Net assets consist of: | | | | |
Shares of beneficial interest | | $ | 2,978,332,227 | |
Undistributed net investment income (loss) | | | (8,038,367 | ) |
Undistributed net realized gain (loss) | | | (967,440,485 | ) |
Unrealized appreciation | | | 382,165,180 | |
| | | $ | 2,385,018,555 | |
| | | | |
Net Assets: | | | | |
Class A | | $ | 2,212,843,127 | |
Class B | | $ | 65,524,104 | |
Class C | | $ | 81,824,631 | |
Class R | | $ | 7,634,328 | |
Class Y | | $ | 12,245,762 | |
Class R5 | | $ | 4,946,603 | |
|
Shares outstanding, $0.001 par value per share,
with an unlimited number of shares authorized: | |
Class A | | | 94,939,647 | |
Class B | | | 3,171,798 | |
Class C | | | 3,962,353 | |
Class R | | | 333,891 | |
Class Y | | | 521,230 | |
Class R5 | | | 189,290 | |
Class A: | | | | |
Net asset value per share | | $ | 23.31 | |
Maximum offering price per share | | | | |
(Net asset value of $23.31 ¸ 94.50%) | | $ | 24.67 | |
Class B: | | | | |
Net asset value and offering price per share | | $ | 20.66 | |
Class C: | | | | |
Net asset value and offering price per share | | $ | 20.65 | |
Class R: | | | | |
Net asset value and offering price per share | | $ | 22.86 | |
Class Y: | | | | |
Net asset value and offering price per share | | $ | 23.49 | |
Class R5: | | | | |
Net asset value and offering price per share | | $ | 26.13 | |
See accompanying Notes to Financial Statements which are an integral part of the financial statements.
11 Invesco Constellation Fund
Statement of Operations
For the year ended October 31, 2012
| | | | |
Investment income: | | | | |
Dividends (net of foreign withholding taxes of $73,489) | | $ | 25,598,091 | |
Dividends from affiliated money market funds | | | 56,786 | |
Interest | | | 15,594 | |
Total investment income | | | 25,670,471 | |
| |
Expenses: | | | | |
Advisory fees | | | 16,191,237 | |
Administrative services fees | | | 522,916 | |
Custodian fees | | | 97,477 | |
Distribution fees: | | | | |
Class A | | | 5,868,470 | |
Class B | | | 815,630 | |
Class C | | | 872,006 | |
Class R | | | 40,625 | |
Transfer agent fees — A, B, C, R and Y | | | 8,684,147 | |
Transfer agent fees — R5 | | | 11,521 | |
Trustees’ and officers’ fees and benefits | | | 159,416 | |
Other | | | 827,664 | |
Total expenses | | | 34,091,109 | |
Less: Fees waived and expense offset arrangement(s) | | | (408,479 | ) |
Net expenses | | | 33,682,630 | |
Net investment income (loss) | | | (8,012,159 | ) |
| |
Realized and unrealized gain (loss) from: | | | | |
Net realized gain (loss) from: | | | | |
Investment securities (includes net gains (losses) from securities sold to affiliates of $(2,249,600)) | | | 58,137,967 | |
Foreign currencies | | | (30,111 | ) |
| | | | 58,107,856 | |
Change in net unrealized appreciation of: | | | | |
Investment securities | | | 54,697,993 | |
Foreign currencies | | | 344 | |
| | | | 54,698,337 | |
Net realized and unrealized gain | | | 112,806,193 | |
Net increase in net assets resulting from operations | | $ | 104,794,034 | |
See accompanying Notes to Financial Statements which are an integral part of the financial statements.
12 Invesco Constellation Fund
Statement of Changes in Net Assets
For the years ended October 31, 2012 and 2011
| | | | | | | | |
| | | 2012 | | | 2011 | |
Operations: | |
Net investment income (loss) | | $ | (8,012,159 | ) | | $ | (7,890,645 | ) |
Net realized gain | | | 58,107,856 | | | | 340,953,586 | |
Change in net unrealized appreciation (depreciation) | | | 54,698,337 | | | | (241,007,563 | ) |
Net increase in net assets resulting from operations | | | 104,794,034 | | | | 92,055,378 | |
| | |
Share transactions-net: | | | | | | | | |
Class A | | | (300,907,319 | ) | | | (377,299,829 | ) |
Class B | | | (34,919,025 | ) | | | (53,726,486 | ) |
Class C | | | (11,186,938 | ) | | | (12,749,263 | ) |
Class R | | | (1,255,908 | ) | | | (1,913,624 | ) |
Class Y | | | (1,550,705 | ) | | | (360,854 | ) |
Class R5 | | | (18,309,159 | ) | | | (4,350,409 | ) |
Net increase (decrease) in net assets resulting from share transactions | | | (368,129,054 | ) | | | (450,400,465 | ) |
Net increase (decrease) in net assets | | | (263,335,020 | ) | | | (358,345,087 | ) |
| | |
Net assets: | | | | | | | | |
Beginning of year | | | 2,648,353,575 | | | | 3,006,698,662 | |
End of year (includes undistributed net investment income (loss) of $(8,038,367) and $(1,762,488), respectively) | | $ | 2,385,018,555 | | | $ | 2,648,353,575 | |
Notes to Financial Statements
October 31, 2012
NOTE 1—Significant Accounting Policies
Invesco Constellation Fund (the “Fund”) is a series portfolio of AIM Equity Funds (Invesco Equity Funds) (the “Trust”). The Trust is a Delaware statutory trust registered under the Investment Company Act of 1940, as amended (the “1940 Act”), as an open-end series management investment company consisting of five separate portfolios, each authorized to issue an unlimited number of shares of beneficial interest. The assets, liabilities and operations of each portfolio are accounted for separately. Information presented in these financial statements pertains only to the Fund. Matters affecting each portfolio or class will be voted on exclusively by the shareholders of such portfolio or class.
The Fund’s investment objective is long-term growth of capital.
The Fund currently consists of six different classes of shares: Class A, Class B, Class C, Class R, Class Y and Class R5. On September 24, 2012, Institutional Class shares were renamed Class R5 shares. Class A shares are sold with a front-end sales charge unless certain waiver criteria are met and under certain circumstances load waived shares may be subject to contingent deferred sales charges (“CDSC”). Class C shares are sold with a CDSC. Class R, Class Y and Class R5 shares are sold at net asset value. Effective November 30, 2010, new or additional investments in Class B shares are no longer permitted. Existing shareholders of Class B shares may continue to reinvest dividends and capital gains distributions in Class B shares until they convert to Class A shares. Also, shareholders in Class B shares will be able to exchange those shares for Class B shares of other Invesco Funds offering such shares until they convert to Class A shares. Generally, Class B shares will automatically convert to Class A shares on or about the month-end, which is at least eight years after the date of purchase. Redemption of Class B shares prior to the conversion date will be subject to a CDSC.
The following is a summary of the significant accounting policies followed by the Fund in the preparation of its financial statements.
| A. | Security Valuations — Securities, including restricted securities, are valued according to the following policy. |
A security listed or traded on an exchange (except convertible bonds) is valued at its last sales price or official closing price as of the close of the customary trading session on the exchange where the security is principally traded, or lacking any sales or official closing price on a particular day, the security may be valued at the closing bid price on that day. Securities traded in the over-the-counter market are valued based on prices furnished by independent pricing services or market makers. When such securities are valued by an independent pricing service they may be considered fair valued. Futures contracts are valued at the final settlement price set by an exchange on which they are principally traded. Listed options are valued at the mean between the last bid and ask prices from the exchange on which they are principally traded. Options not listed on an exchange are valued by an independent source at the mean between the last bid and ask prices. For purposes of determining net asset value per share, futures and option contracts generally are valued 15 minutes after the close of the customary trading session of the New York Stock Exchange (“NYSE”).
Investments in open-end and closed-end registered investment companies that do not trade on an exchange are valued at the end of day net asset value per share. Investments in open-end and closed-end registered investment companies that trade on an exchange are valued at the last sales price or official closing price as of the close of the customary trading session on the exchange where the security is principally traded.
13 Invesco Constellation Fund
Debt obligations (including convertible bonds) and unlisted equities are fair valued using an evaluated quote provided by an independent pricing service. Evaluated quotes provided by the pricing service may be determined without exclusive reliance on quoted prices, and may reflect appropriate factors such as institution-size trading in similar groups of securities, developments related to specific securities, dividend rate, yield, quality, type of issue, coupon rate, maturity, individual trading characteristics and other market data. Debt securities are subject to interest rate and credit risks. In addition, all debt securities involve some risk of default with respect to interest and/or principal payments.
Foreign securities (including foreign exchange contracts) are converted into U.S. dollar amounts using the applicable exchange rates as of the close of the NYSE. If market quotations are available and reliable for foreign exchange traded equity securities, the securities will be valued at the market quotations. Because trading hours for certain foreign securities end before the close of the NYSE, closing market quotations may become unreliable. If between the time trading ends on a particular security and the close of the customary trading session on the NYSE, events occur that are significant and make the closing price unreliable, the Fund may fair value the security. If the event is likely to have affected the closing price of the security, the security will be valued at fair value in good faith using procedures approved by the Board of Trustees. Adjustments to closing prices to reflect fair value may also be based on a screening process of an independent pricing service to indicate the degree of certainty, based on historical data, that the closing price in the principal market where a foreign security trade is not the current value as of the close of the NYSE. Foreign securities meeting the approved degree of certainty that the price is not reflective of current value will be priced at the indication of fair value from the independent pricing service. Multiple factors may be considered by the independent pricing service in determining adjustments to reflect fair value and may include information relating to sector indices, American Depositary Receipts and domestic and foreign index futures. Foreign securities may have additional risks including exchange rate changes, potential for sharply devalued currencies and high inflation, political and economic upheaval, the relative lack of issuer information, relatively low market liquidity and the potential lack of strict financial and accounting controls and standards.
Securities for which market prices are not provided by any of the above methods may be valued based upon quotes furnished by independent sources. The last bid price may be used to value equity securities. The mean between the last bid and asked prices is used to value debt obligations, including corporate loans.
Securities for which market quotations are not readily available or are unreliable are valued at fair value as determined in good faith by or under the supervision of the Trust’s officers following procedures approved by the Board of Trustees. Issuer specific events, market trends, bid/ask quotes of brokers and information providers and other market data may be reviewed in the course of making a good faith determination of a security’s fair value.
Valuations change in response to many factors including the historical and prospective earnings of the issuer, the value of the issuer’s assets, general economic conditions, interest rates, investor perceptions and market liquidity. Because of the inherent uncertainties of valuation, the values reflected in the financial statements may materially differ from the value received upon actual sale of those investments.
| B. | Securities Transactions and Investment Income — Securities transactions are accounted for on a trade date basis. Realized gains or losses on sales are computed on the basis of specific identification of the securities sold. Interest income is recorded on the accrual basis from settlement date. Dividend income (net of withholding tax, if any) is recorded on the ex-dividend date. |
The Fund may periodically participate in litigation related to Fund investments. As such, the Fund may receive proceeds from litigation settlements. Any proceeds received are included in the Statement of Operations as realized gain (loss) for investments no longer held and as unrealized gain (loss) for investments still held.
Brokerage commissions and mark ups are considered transaction costs and are recorded as an increase to the cost basis of securities purchased and/or a reduction of proceeds on a sale of securities. Such transaction costs are included in the determination of net realized and unrealized gain (loss) from investment securities reported in the Statement of Operations and the Statement of Changes in Net Assets and the net realized and unrealized gains (losses) on securities per share in the Financial Highlights. Transaction costs are included in the calculation of the Fund’s net asset value and, accordingly, they reduce the Fund’s total returns. These transaction costs are not considered operating expenses and are not reflected in net investment income reported in the Statement of Operations and Statement of Changes in Net Assets, or the net investment income per share and ratios of expenses and net investment income reported in the Financial Highlights, nor are they limited by any expense limitation arrangements between the Fund and the investment adviser.
The Fund allocates income and realized and unrealized capital gains and losses to a class based on the relative net assets of each class.
| C. | Country Determination — For the purposes of making investment selection decisions and presentation in the Schedule of Investments, the investment adviser may determine the country in which an issuer is located and/or credit risk exposure based on various factors. These factors include the laws of the country under which the issuer is organized, where the issuer maintains a principal office, the country in which the issuer derives 50% or more of its total revenues and the country that has the primary market for the issuer’s securities, as well as other criteria. Among the other criteria that may be evaluated for making this determination are the country in which the issuer maintains 50% or more of its assets, the type of security, financial guarantees and enhancements, the nature of the collateral and the sponsor organization. Country of issuer and/or credit risk exposure has been determined to be the United States of America, unless otherwise noted. |
| D. | Distributions — Distributions from income and net realized capital gain, if any, are generally declared and paid annually and recorded on the ex-dividend date. The Fund may elect to treat a portion of the proceeds from redemptions as distributions for federal income tax purposes. |
| E. | Federal Income Taxes — The Fund intends to comply with the requirements of Subchapter M of the Internal Revenue Code necessary to qualify as a regulated investment company and to distribute substantially all of the Fund’s taxable earnings to shareholders. As such, the Fund will not be subject to federal income taxes on otherwise taxable income (including net realized capital gain) that is distributed to shareholders. Therefore, no provision for federal income taxes is recorded in the financial statements. |
The Fund files tax returns in the U.S. Federal jurisdiction and certain other jurisdictions. Generally, the Fund is subject to examinations by such taxing authorities for up to three years after the filing of the return for the tax period.
| F. | Expenses — Fees provided for under the Rule 12b-1 plan of a particular class of the Fund are charged to the operations of such class. Transfer agency fees and expenses and other shareholder recordkeeping fees and expenses attributable to Class R5 are charged to such class. Sub-accounting fees attributable to Class R5 are charged to the operations of the class. Transfer agency fees and expenses and other shareholder recordkeeping fees and expenses relating to all other classes are allocated among those classes based on relative net assets. All other expenses are allocated among the classes based on relative net assets. |
14 Invesco Constellation Fund
| G. | Accounting Estimates — The preparation of financial statements in conformity with accounting principles generally accepted in the United States of America (“GAAP”) requires management to make estimates and assumptions that affect the reported amounts of assets and liabilities at the date of the financial statements and the reported amounts of revenues and expenses during the reporting period including estimates and assumptions related to taxation. Actual results could differ from those estimates by a significant amount. In addition, the Fund monitors for material events or transactions that may occur or become known after the period-end date and before the date the financial statements are released to print. |
| H. | Indemnifications — Under the Trust’s organizational documents, each Trustee, officer, employee or other agent of the Trust is indemnified against certain liabilities that may arise out of the performance of their duties to the Fund. Additionally, in the normal course of business, the Fund enters into contracts, including the Fund’s servicing agreements, that contain a variety of indemnification clauses. The Fund’s maximum exposure under these arrangements is unknown as this would involve future claims that may be made against the Fund that have not yet occurred. The risk of material loss as a result of such indemnification claims is considered remote. |
| I. | Foreign Currency Translations — Foreign currency is valued at the close of the NYSE based on quotations posted by banks and major currency dealers. Portfolio securities and other assets and liabilities denominated in foreign currencies are translated into U.S. dollar amounts at date of valuation. Purchases and sales of portfolio securities (net of foreign taxes withheld on disposition) and income items denominated in foreign currencies are translated into U.S. dollar amounts on the respective dates of such transactions. The Fund does not separately account for the portion of the results of operations resulting from changes in foreign exchange rates on investments and the fluctuations arising from changes in market prices of securities held. The combined results of changes in foreign exchange rates and the fluctuation of market prices on investments (net of estimated foreign tax withholding) are included with the net realized and unrealized gain or loss from investments in the Statement of Operations. Reported net realized foreign currency gains or losses arise from (1) sales of foreign currencies, (2) currency gains or losses realized between the trade and settlement dates on securities transactions, and (3) the difference between the amounts of dividends, interest, and foreign withholding taxes recorded on the Fund’s books and the U.S. dollar equivalent of the amounts actually received or paid. Net unrealized foreign currency gains and losses arise from changes in the fair values of assets and liabilities, other than investments in securities at fiscal period end, resulting from changes in exchange rates. |
The Fund may invest in foreign securities which may be subject to foreign taxes on income, gains on investments or currency repatriation, a portion of which may be recoverable.
| J. | Foreign Currency Contracts — The Fund may enter into foreign currency contracts to manage or minimize currency or exchange rate risk. The Fund may also enter into foreign currency contracts for the purchase or sale of a security denominated in a foreign currency in order to “lock in” the U.S. dollar price of that security. A foreign currency contract is an obligation to purchase or sell a specific currency for an agreed-upon price at a future date. The use of foreign currency contracts does not eliminate fluctuations in the price of the underlying securities the Fund owns or intends to acquire but establishes a rate of exchange in advance. Fluctuations in the value of these contracts are measured by the difference in the contract date and reporting date exchange rates and are recorded as unrealized appreciation (depreciation) until the contracts are closed. When the contracts are closed, realized gains (losses) are recorded. Realized and unrealized gains (losses) on the contracts are included in the Statement of Operations. The primary risks associated with foreign currency contracts include failure of the counterparty to meet the terms of the contract and the value of the foreign currency changing unfavorably. These risks may be in excess of the amounts reflected in the Statement of Assets and Liabilities. |
NOTE 2—Advisory Fees and Other Fees Paid to Affiliates
The Trust has entered into a master investment advisory agreement with Invesco Advisers, Inc. (the “Adviser” or “Invesco”). Under the terms of the investment advisory agreement, the Fund pays an advisory fee to the Adviser based on the annual rate of the Fund’s average daily net assets as follows:
| | | | | | |
| Average Daily Net Assets | | Rate |
First $150 million | | | 0 | .80% | | |
Over $150 million | | | 0 | .625% | | |
Through December 31, 2012, the Adviser has contractually agreed to waive advisory fees to the extent necessary so that the advisory fees payable by the Fund (based on the Fund’s average daily net assets) do not exceed the annual rate of:
| | | | | | |
| Average Daily Net Assets | | Rate |
First $250 million | | | 0 | .695% | | |
Next $4 billion | | | 0 | .615% | | |
Next $750 million | | | 0 | .595% | | |
Next $2.5 billion | | | 0 | .57% | | |
Next $2.5 billion | | | 0 | .545% | | |
Over $10 billion | | | 0 | .52% | | |
Under the terms of a master sub-advisory agreement between the Adviser and each of Invesco Asset Management Deutschland GmbH, Invesco Asset Management Limited, Invesco Asset Management (Japan) Limited, Invesco Australia Limited, Invesco Hong Kong Limited, Invesco Senior Secured Management, Inc. and Invesco Canada Ltd. (collectively, the “Affiliated Sub-Advisers”) the Adviser, not the Fund, may pay 40% of the fees paid to the Adviser to any such Affiliated Sub-Adviser(s) that provide(s) discretionary investment management services to the Fund based on the percentage of assets allocated to such Sub-Adviser(s).
15 Invesco Constellation Fund
The Adviser has contractually agreed, through at least June 30, 2013, to waive advisory fees and/or reimburse expenses of all shares to the extent necessary to limit total annual fund operating expenses after fee waivers and/or expense reimbursements (excluding certain items discussed below) of Class A, Class B, Class C, Class R, Class Y and Class R5 shares to 2.00%, 2.75%, 2.75%, 2.25%, 1.75% and 1.75%, respectively, of average daily net assets. In determining the Adviser’s obligation to waive advisory fees and/or reimburse expenses, the following expenses are not taken into account, and could cause the total annual fund operating expenses after fee waivers and/or expense reimbursements to exceed the numbers reflected above: (1) interest; (2) taxes; (3) dividend expense on short sales; (4) extraordinary or non-routine items, including litigation expenses; and (5) expenses that the Fund has incurred but did not actually pay because of an expense offset arrangement. Unless the Board of Trustees and Invesco mutually agree to amend or continue the fee waiver agreement, it will terminate on June 30, 2013. The Adviser did not waive fees and/or reimburse expenses during the period under this expense limitation.
Further, the Adviser has contractually agreed, through at least June 30, 2013, to waive the advisory fee payable by the Fund in an amount equal to 100% of the net advisory fees the Adviser receives from the affiliated money market funds on investments by the Fund of uninvested cash (excluding investments of cash collateral from securities lending) in such affiliated money market funds.
For the year ended October 31, 2012, the Adviser waived advisory fees of $382,453.
The Trust has entered into a master administrative services agreement with Invesco pursuant to which the Fund has agreed to pay Invesco for certain administrative costs incurred in providing accounting services to the Fund. For the year ended October 31, 2012, expenses incurred under the agreement are shown in the Statement of Operations as Administrative services fees.
The Trust has entered into a transfer agency and service agreement with Invesco Investment Services, Inc. (“IIS”) pursuant to which the Fund has agreed to pay IIS a fee for providing transfer agency and shareholder services to the Fund and reimburse IIS for certain expenses incurred by IIS in the course of providing such services. IIS may make payments to intermediaries that provide omnibus account services, sub-accounting services and/or networking services. All fees payable by IIS to intermediaries that provide omnibus account services or sub-accounting are charged back to the Fund, subject to certain limitations approved by the Trust’s Board of Trustees. For the year ended October 31, 2012, expenses incurred under the agreement are shown in the Statement of Operations as Transfer agent fees.
The Trust has entered into master distribution agreements with Invesco Distributors, Inc. (“IDI”) to serve as the distributor for the Class A, Class B, Class C, Class R, Class Y and Class R5 shares of the Fund. The Trust has adopted plans pursuant to Rule 12b-1 under the 1940 Act with respect to the Fund’s Class A, Class B, Class C and Class R shares (collectively, the “Plans”). The Fund, pursuant to the Plans, pays IDI compensation at the annual rate of 0.25% of the Fund’s average daily net assets of Class A shares, 1.00% of the average daily net assets of Class B and Class C shares and 0.50% of the average daily net assets of Class R shares. Of the Plan payments, up to 0.25% of the average daily net assets of each class of shares may be paid to furnish continuing personal shareholder services to customers who purchase and own shares of such classes. Any amounts not paid as a service fee under the Plans would constitute an asset-based sales charge. Rules of the Financial Industry Regulatory Authority (“FINRA”) impose a cap on the total sales charges, including asset-based sales charges that may be paid by any class of shares of the Fund. For the year ended October 31, 2012, expenses incurred under the Plans are shown in the Statement of Operations as Distribution fees.
Front-end sales commissions and CDSC (collectively, the “sales charges”) are not recorded as expenses of the Fund. Front-end sales commissions are deducted from proceeds from the sales of Fund shares prior to investment in Class A shares of the Fund. CDSC are deducted from redemption proceeds prior to remittance to the shareholder. During the year ended October 31, 2012, IDI advised the Fund that IDI retained $153,085 in front-end sales commissions from the sale of Class A shares and $221, $120,408 and $6,612 from Class A, Class B and Class C shares, respectively, for CDSC imposed on redemptions by shareholders.
For the year ended October 31, 2012, the Fund incurred $3,980 in brokerage commissions with Invesco Capital Markets, Inc., an affiliate of the Adviser and IDI, for portfolio transactions executed on behalf of the Fund.
Certain officers and trustees of the Trust are officers and directors of the Adviser, IIS and/or IDI.
NOTE 3—Additional Valuation Information
GAAP defines fair value as the price that would be received to sell an asset or paid to transfer a liability in an orderly transaction between market participants at the measurement date, under current market conditions. GAAP establishes a hierarchy that prioritizes the inputs to valuation methods giving the highest priority to readily available unadjusted quoted prices in an active market for identical assets (Level 1) and the lowest priority to significant unobservable inputs (Level 3) generally when market prices are not readily available or are unreliable. Based on the valuation inputs, the securities or other investments are tiered into one of three levels. Changes in valuation methods may result in transfers in or out of an investment’s assigned level:
| | Level 1 — | Prices are determined using quoted prices in an active market for identical assets. |
| | Level 2 — | Prices are determined using other significant observable inputs. Observable inputs are inputs that other market participants may use in pricing a security. These may include quoted prices for similar securities, interest rates, prepayment speeds, credit risk, yield curves, loss severities, default rates, discount rates, volatilities and others. |
| | Level 3 — | Prices are determined using significant unobservable inputs. In situations where quoted prices or observable inputs are unavailable (for example, when there is little or no market activity for an investment at the end of the period), unobservable inputs may be used. Unobservable inputs reflect the Fund’s own assumptions about the factors market participants would use in determining fair value of the securities or instruments and would be based on the best available information. |
The following is a summary of the tiered valuation input levels, as of October 31, 2012. The level assigned to the securities valuations may not be an indication of the risk or liquidity associated with investing in those securities. Because of the inherent uncertainties of valuation, the values reflected in the financial statements may materially differ from the value received upon actual sale of those investments.
| | | | | | | | | | | | | | | | |
| | | Level 1 | | | Level 2 | | | Level 3 | | | Total | |
Equity Securities | | $ | 2,355,553,185 | | | $ | 40,592,410 | | | $ | — | | | $ | 2,396,145,595 | |
16 Invesco Constellation Fund
NOTE 4—Security Transactions with Affiliated Funds
The Fund is permitted to purchase or sell securities from or to certain other Invesco Funds under specified conditions outlined in procedures adopted by the Board of Trustees of the Trust. The procedures have been designed to ensure that any purchase or sale of securities by the Fund from or to another fund or portfolio that is or could be considered an affiliate by virtue of having a common investment adviser (or affiliated investment advisers), common Trustees and/or common officers complies with Rule 17a-7 of the 1940 Act. Further, as defined under the procedures, each transaction is effected at the current market price. Pursuant to these procedures, for the year ended October 31, 2012, the Fund engaged in securities purchases of $9,887,605 and securities sales of $7,600,991, which resulted in net realized gains (losses) of $(2,249,600).
NOTE 5—Expense Offset Arrangement(s)
The expense offset arrangements are comprised of (1) transfer agency credits which result from balances in Demand Deposit Accounts (DDA) used by the transfer agent for clearing shareholder transactions and (2) custodian credits which result from periodic overnight cash balances at the custodian. For the year ended October 31, 2012, the Fund received credits from these arrangements, which resulted in the reduction of the Fund’s total expenses of $26,026.
NOTE 6—Trustees’ and Officers’ Fees and Benefits
“Trustees’ and Officers’ Fees and Benefits” include amounts accrued by the Fund to pay remuneration to certain Trustees and Officers of the Fund. Trustees have the option to defer compensation payable by the Fund, and “Trustees’ and Officers’ Fees and Benefits” also include amounts accrued by the Fund to fund such deferred compensation amounts. Those Trustees who defer compensation have the option to select various Invesco Funds in which their deferral accounts shall be deemed to be invested. Finally, certain current Trustees are eligible to participate in a retirement plan that provides for benefits to be paid upon retirement to Trustees over a period of time based on the number of years of service. The Fund may have certain former Trustees who also participate in a retirement plan and receive benefits under such plan. “Trustees’ and Officers’ Fees and Benefits” include amounts accrued by the Fund to fund such retirement benefits. Obligations under the deferred compensation and retirement plans represent unsecured claims against the general assets of the Fund.
NOTE 7—Cash Balances
The Fund is permitted to temporarily carry a negative or overdrawn balance in its account with State Street Bank and Trust Company, the custodian bank. Such balances, if any at period end, are shown in the Statement of Assets and Liabilities under the payable caption Amount due custodian. To compensate the custodian bank for such overdrafts, the overdrawn Fund may either (1) leave funds as a compensating balance in the account so the custodian bank can be compensated by earning the additional interest; or (2) compensate by paying the custodian bank at a rate agreed upon by the custodian bank and Invesco, not to exceed the contractually agreed upon rate.
NOTE 8—Distributions to Shareholders and Tax Components of Net Assets
Distributions to Shareholders:
There were no ordinary income or long-term capital gain distributions paid during the years ended October 31, 2012 and 2011.
Tax Components of Net Assets at Period-End:
| | | | |
| | | 2012 | |
Net unrealized appreciation — investments | | $ | 373,705,316 | |
Net unrealized appreciation — other investments | | | 344 | |
Temporary book/tax differences | | | (1,827,997 | ) |
Late year ordinary loss deferrals | | | (6,210,370 | ) |
Capital loss carryforward | | | (958,980,965 | ) |
Shares of beneficial interest | | | 2,978,332,227 | |
Total net assets | | $ | 2,385,018,555 | |
The difference between book-basis and tax-basis unrealized appreciation is due to differences in the timing of recognition of gains and losses on investments for tax and book purposes. The Fund’s net unrealized appreciation difference is attributable primarily to wash sales.
The temporary book/tax differences are a result of timing differences between book and tax recognition of income and/or expenses. The Fund’s temporary book/tax differences are the result of the trustee deferral of compensation and retirement plan benefits.
Capital loss carryforward is calculated and reported as of a specific date. Results of transactions and other activity after that date may affect the amount of capital loss carryforward actually available for the Fund to utilize. The Regulated Investment Company Modernization Act of 2010 (the “Act”) eliminated the eight-year carryover period for capital losses that arise in taxable years beginning after its enactment date of December 22, 2010. Consequently, these capital losses can be carried forward for an unlimited period. However, capital losses with an expiration period may not be used to offset capital gains until all net capital losses without an expiration date have been utilized. Additionally, post-enactment capital loss carryovers will retain their character as either short-term or long-term capital losses instead of as short-term capital losses as under prior law. The ability to utilize capital loss carryforward in the future may be limited under the Internal Revenue Code and related regulations based on the results of future transactions.
17 Invesco Constellation Fund
The Fund utilized $55,280,917 of capital loss carryforward in the current period to offset net realized capital gain for federal income tax purposes. The Fund has a capital loss carryforward as of October 31, 2012, which expires as follows:
| | | | | | | | | | | | |
| Capital Loss Carryforward* | |
| Expiration | | Short-Term | | | Long-Term | | | Total | |
October 31, 2017 | | $ | 958,980,965 | | | $ | — | | | $ | 958,980,965 | |
| * | Capital loss carryforward as of the date listed above is reduced for limitations, if any, to the extent required by the Internal Revenue Code. |
NOTE 9—Investment Securities
The aggregate amount of investment securities (other than short-term securities, U.S. Treasury obligations and money market funds, if any) purchased and sold by the Fund during the year ended October 31, 2012 was $2,370,406,031 and $2,809,770,216, respectively. Cost of investments on a tax basis includes the adjustments for financial reporting purposes as of the most recently completed federal income tax reporting period-end.
| | | | |
| Unrealized Appreciation (Depreciation) of Investment Securities on a Tax Basis | |
Aggregate unrealized appreciation of investment securities | | $ | 448,858,579 | |
Aggregate unrealized (depreciation) of investment securities | | | (75,153,263 | ) |
Net unrealized appreciation of investment securities | | $ | 373,705,316 | |
Cost of investments for tax purposes is $2,022,440,279.
NOTE 10—Reclassification of Permanent Differences
Primarily as a result of differing book/tax treatment of net operating losses and fair fund adjustments, on October 31, 2012, undistributed net investment income (loss) was increased by $1,736,280, undistributed net realized gain (loss) was decreased by $482,245 and shares of beneficial interest was decreased by $1,254,035. This reclassification had no effect on the net assets of the Fund.
NOTE 11—Share Information
| | | | | | | | | | | | | | | | |
| | | Summary of Share Activity | |
| | | Years ended October 31, | |
| | | 2012(a) | | | 2011 | |
| | | Shares | | | Amount | | | Shares | | | Amount | |
Sold: | | | | | | | | | | | | | | | | |
Class A | | | 2,344,408 | | | $ | 54,997,698 | | | | 2,279,141 | | | $ | 52,916,559 | |
Class B | | | 73,964 | | | | 1,531,117 | | | | 170,053 | | | | 3,527,897 | |
Class C | | | 302,274 | | | | 6,312,163 | | | | 307,295 | | | | 6,415,823 | |
Class R | | | 63,074 | | | | 1,423,443 | | | | 71,299 | | | | 1,636,821 | |
Class Y | | | 150,315 | | | | 3,472,101 | | | | 188,934 | | | | 4,420,553 | |
Class R5 | | | 39,317 | | | | 1,002,816 | | | | 28,278 | | | | 699,841 | |
| | | | |
Automatic conversion of Class B shares to Class A shares: | | | | | | | | | | | | | | | | |
Class A | | | 941,927 | | | | 21,704,390 | | | | 1,397,763 | | | | 32,832,637 | |
Class B | | | (1,057,200 | ) | | | (21,704,390 | ) | | | (1,559,185 | ) | | | (32,832,637 | ) |
| | | | |
Reacquired: | | | | | | | | | | | | | | | | |
Class A | | | (16,269,173 | ) | | | (377,609,407 | ) | | | (19,852,294 | ) | | | (463,049,025 | ) |
Class B | | | (709,241 | ) | | | (14,745,752 | ) | | | (1,161,713 | ) | | | (24,421,746 | ) |
Class C | | | (847,835 | ) | | | (17,499,101 | ) | | | (917,021 | ) | | | (19,165,086 | ) |
Class R | | | (118,679 | ) | | | (2,679,351 | ) | | | (153,082 | ) | | | (3,550,445 | ) |
Class Y | | | (218,232 | ) | | | (5,022,806 | ) | | | (203,258 | ) | | | (4,781,407 | ) |
Class R5 | | | (696,397 | ) | | | (19,311,975 | ) | | | (193,330 | ) | | | (5,050,250 | ) |
Net increase (decrease) in share activity | | | (16,001,478 | ) | | $ | (368,129,054 | ) | | | (19,597,120 | ) | | $ | (450,400,465 | ) |
| (a) | There are entities that are record owners of more than 5% of the outstanding shares of the Fund and in the aggregate own 25% of the outstanding shares of the Fund. IDI has an agreement with these entities to sell Fund shares. The Fund, Invesco and/or Invesco affiliates may make payments to these entities, which are considered to be related to the Fund, for providing services to the Fund, Invesco and/or Invesco affiliates including but not limited to services such as securities brokerage, distribution, third party record keeping and account servicing. The Fund has no knowledge as to whether all or any portion of the shares owned of record by these entities are also owned beneficially. |
18 Invesco Constellation Fund
NOTE 12—Financial Highlights
The following schedule presents financial highlights for a share of the Fund outstanding throughout the periods indicated.
| | | | | | | | | | | | | | | | | | | | | | | | | | | | | | | | | | | | | | | | | | | | | | | | |
| | | Net asset
value,
beginning
of period | | | Net
investment
income
(loss)(a) | | | Net gains
(losses)
on securities
(both
realized and
unrealized) | | | Total from
investment
operations | | | Dividends
from net
investment
income | | | Net asset
value, end
of period | | | Total
return(b) | | | Net assets,
end of period
(000s omitted) | | | Ratio of
expenses
to average
net assets
with fee waivers
and/or expenses
absorbed | | | Ratio of
expenses
to average net
assets without
fee waivers
and/or expenses
absorbed | | | Ratio of net
investment
income (loss)
to average
net assets | | | Portfolio
turnover(c) | |
Class A | | | | | | | | | | | | | | | | | | | | | | | | | | | | | | | | | | | | | | | | | | | | | | | | |
Year ended 10/31/12 | | $ | 22.40 | | | $ | (0.06 | ) | | $ | 0.97 | | | $ | 0.91 | | | $ | — | | | $ | 23.31 | | | | 4.06 | % | | $ | 2,212,843 | | | | 1.27 | %(d) | | | 1.29 | %(d) | | | (0.26 | )%(d) | | | 95 | % |
Year ended 10/31/11 | | | 21.86 | | | | (0.05 | ) | | | 0.59 | | | | 0.54 | | | | — | | | | 22.40 | | | | 2.47 | | | | 2,417,873 | | | | 1.27 | | | | 1.29 | | | | (0.21 | ) | | | 126 | |
Year ended 10/31/10 | | | 18.66 | | | | (0.05 | ) | | | 3.32 | (e) | | | 3.27 | | | | (0.07 | ) | | | 21.86 | | | | 17.55 | (e) | | | 2,712,368 | | | | 1.32 | | | | 1.34 | | | | (0.26 | ) | | | 53 | |
Year ended 10/31/09 | | | 17.79 | | | | 0.08 | | | | 0.79 | (e) | | | 0.87 | | | | — | | | | 18.66 | | | | 4.89 | (e) | | | 2,684,240 | | | | 1.42 | | | | 1.44 | | | | 0.44 | | | | 90 | |
Year ended 10/31/08 | | | 31.12 | | | | (0.04 | ) | | | (13.29 | ) | | | (13.33 | ) | | | — | | | | 17.79 | | | | (42.83 | ) | | | 2,945,536 | | | | 1.25 | | | | 1.27 | | | | (0.16 | ) | | | 96 | |
Class B | | | | | | | | | | | | | | | | | | | | | | | | | | | | | | | | | | | | | | | | | | | | | | | | |
Year ended 10/31/12 | | | 20.01 | | | | (0.21 | ) | | | 0.86 | | | | 0.65 | | | | — | | | | 20.66 | | | | 3.25 | | | | 65,524 | | | | 2.02 | (d) | | | 2.04 | (d) | | | (1.01 | )(d) | | | 95 | |
Year ended 10/31/11 | | | 19.66 | | | | (0.20 | ) | | | 0.55 | | | | 0.35 | | | | — | | | | 20.01 | | | | 1.78 | | | | 97,318 | | | | 2.02 | | | | 2.04 | | | | (0.96 | ) | | | 126 | |
Year ended 10/31/10 | | | 16.85 | | | | (0.18 | ) | | | 2.99 | (e) | | | 2.81 | | | | — | | | | 19.66 | | | | 16.68 | (e) | | | 145,817 | | | | 2.07 | | | | 2.09 | | | | (1.01 | ) | | | 53 | |
Year ended 10/31/09 | | | 16.20 | | | | (0.05 | ) | | | 0.70 | (e) | | | 0.65 | | | | — | | | | 16.85 | | | | 4.01 | (e) | | | 179,737 | | | | 2.17 | | | | 2.19 | | | | (0.31 | ) | | | 90 | |
Year ended 10/31/08 | | | 28.54 | | | | (0.21 | ) | | | (12.13 | ) | | | (12.34 | ) | | | — | | | | 16.20 | | | | (43.24 | ) | | | 281,592 | | | | 2.00 | | | | 2.02 | | | | (0.91 | ) | | | 96 | |
Class C | | | | | | | | | | | | | | | | | | | | | | | | | | | | | | | | | | | | | | | | | | | | | | | | |
Year ended 10/31/12 | | | 20.00 | | | | (0.21 | ) | | | 0.86 | | | | 0.65 | | | | — | | | | 20.65 | | | | 3.25 | | | | 81,825 | | | | 2.02 | (d) | | | 2.04 | (d) | | | (1.01 | )(d) | | | 95 | |
Year ended 10/31/11 | | | 19.66 | | | | (0.20 | ) | | | 0.54 | | | | 0.34 | | | | — | | | | 20.00 | | | | 1.73 | | | | 90,152 | | | | 2.02 | | | | 2.04 | | | | (0.96 | ) | | | 126 | |
Year ended 10/31/10 | | | 16.85 | | | | (0.18 | ) | | | 2.99 | (e) | | | 2.81 | | | | — | | | | 19.66 | | | | 16.68 | (e) | | | 100,596 | | | | 2.07 | | | | 2.09 | | | | (1.01 | ) | | | 53 | |
Year ended 10/31/09 | | | 16.19 | | | | (0.05 | ) | | | 0.71 | (e) | | | 0.66 | | | | — | | | | 16.85 | | | | 4.08 | (e) | | | 101,671 | | | | 2.17 | | | | 2.19 | | | | (0.31 | ) | | | 90 | |
Year ended 10/31/08 | | | 28.52 | | | | (0.21 | ) | | | (12.12 | ) | | | (12.33 | ) | | | — | | | | 16.19 | | | | (43.23 | ) | | | 115,004 | | | | 2.00 | | | | 2.02 | | | | (0.91 | ) | | | 96 | |
Class R | | | | | | | | | | | | | | | | | | | | | | | | | | | | | | | | | | | | | | | | | | | | | | | | |
Year ended 10/31/12 | | | 22.03 | | | | (0.12 | ) | | | 0.95 | | | | 0.83 | | | | — | | | | 22.86 | | | | 3.77 | | | | 7,634 | | | | 1.52 | (d) | | | 1.54 | (d) | | | (0.51 | )(d) | | | 95 | |
Year ended 10/31/11 | | | 21.55 | | | | (0.11 | ) | | | 0.59 | | | | 0.48 | | | | — | | | | 22.03 | | | | 2.23 | | | | 8,581 | | | | 1.52 | | | | 1.54 | | | | (0.46 | ) | | | 126 | |
Year ended 10/31/10 | | | 18.40 | | | | (0.10 | ) | | | 3.27 | (e) | | | 3.17 | | | | (0.02 | ) | | | 21.55 | | | | 17.26 | (e) | | | 10,155 | | | | 1.57 | | | | 1.59 | | | | (0.51 | ) | | | 53 | |
Year ended 10/31/09 | | | 17.59 | | | | 0.03 | | | | 0.78 | (e) | | | 0.81 | | | | — | | | | 18.40 | | | | 4.60 | (e) | | | 8,987 | | | | 1.67 | | | | 1.69 | | | | 0.19 | | | | 90 | |
Year ended 10/31/08 | | | 30.84 | | | | (0.10 | ) | | | (13.15 | ) | | | (13.25 | ) | | | — | | | | 17.59 | | | | (42.96 | ) | | | 8,976 | | | | 1.50 | | | | 1.52 | | | | (0.41 | ) | | | 96 | |
Class Y | | | | | | | | | | | | | | | | | | | | | | | | | | | | | | | | | | | | | | | | | | | | | | | | |
Year ended 10/31/12 | | | 22.53 | | | | (0.00 | ) | | | 0.96 | | | | 0.96 | | | | — | | | | 23.49 | | | | 4.26 | | | | 12,246 | | | | 1.02 | (d) | | | 1.04 | (d) | | | (0.01 | )(d) | | | 95 | |
Year ended 10/31/11 | | | 21.92 | | | | 0.01 | | | | 0.60 | | | | 0.61 | | | | — | | | | 22.53 | | | | 2.78 | | | | 13,272 | | | | 1.02 | | | | 1.04 | | | | 0.04 | | | | 126 | |
Year ended 10/31/10 | | | 18.71 | | | | 0.00 | | | | 3.32 | (e) | | | 3.32 | | | | (0.11 | ) | | | 21.92 | | | | 17.83 | (e) | | | 13,229 | | | | 1.07 | | | | 1.09 | | | | (0.01 | ) | | | 53 | |
Year ended 10/31/09 | | | 17.80 | | | | 0.12 | | | | 0.79 | (e) | | | 0.91 | | | | — | | | | 18.71 | | | | 5.11 | (e) | | | 13,003 | | | | 1.17 | | | | 1.19 | | | | 0.69 | | | | 90 | |
Year ended 10/31/08(f) | | | 19.99 | | | | 0.00 | | | | (2.19 | ) | | | (2.19 | ) | | | — | | | | 17.80 | | | | (10.96 | ) | | | 5,827 | | | | 1.05 | (g) | | | 1.07 | (g) | | | 0.04 | (g) | | | 96 | |
Class R5 | | | | | | | | | | | | | | | | | | | | | | | | | | | | | | | | | | | | | | | | | | | | | | | | |
Year ended 10/31/12 | | | 25.00 | | | | 0.06 | | | | 1.07 | | | | 1.13 | | | | — | | | | 26.13 | | | | 4.52 | | | | 4,947 | | | | 0.78 | (d) | | | 0.80 | (d) | | | 0.23 | (d) | | | 95 | |
Year ended 10/31/11 | | | 24.26 | | | | 0.08 | | | | 0.66 | | | | 0.74 | | | | — | | | | 25.00 | | | | 3.05 | | | | 21,158 | | | | 0.73 | | | | 0.75 | | | | 0.33 | | | | 126 | |
Year ended 10/31/10 | | | 20.70 | | | | 0.07 | | | | 3.68 | (e) | | | 3.75 | | | | (0.19 | ) | | | 24.26 | | | | 18.22 | (e) | | | 24,534 | | | | 0.76 | | | | 0.78 | | | | 0.30 | | | | 53 | |
Year ended 10/31/09 | | | 19.61 | | | | 0.21 | | | | 0.88 | (e) | | | 1.09 | | | | — | | | | 20.70 | | | | 5.56 | (e) | | | 45,219 | | | | 0.75 | | | | 0.77 | | | | 1.11 | | | | 90 | |
Year ended 10/31/08 | | | 34.14 | | | | 0.09 | | | | (14.62 | ) | | | (14.53 | ) | | | — | | | | 19.61 | | | | (42.56 | ) | | | 52,187 | | | | 0.78 | | | | 0.80 | | | | 0.31 | | | | 96 | |
| (a) | Calculated using average shares outstanding. |
| (b) | Includes adjustments in accordance with accounting principles generally accepted in the United States of America and as such, the net asset value for financial reporting purposes and the returns based upon those net asset values may differ from the net asset value and returns for shareholder transactions. Does not include sales charges and is not annualized for periods less than one year, if applicable. |
| (c) | Portfolio turnover is calculated at the fund level and is not annualized for periods less than one year, if applicable. |
| (d) | Ratios are based on average daily net assets (000’s) of $2,347,388, $81,563, $87,201, $8,125, $12,806 and $11,516 for Class A, Class B, Class C, Class R, Class Y and Class R5 shares, respectively. |
| (e) | Includes litigation proceeds received during the period. Had the litigation proceeds not been received, net gains (losses) on securities (both realized and unrealized) per share, for the year ended October 31, 2010, would have been $2.62, $2.29, $2.29, $2.57, $2.62 and $2.98 for Class A, Class B, Class C, Class R, Class Y and Class R5 shares, respectively, and total returns would have been lower; net gains (losses) on securities (both realized and unrealized) per share, for the year ended October 31, 2009, would have been $0.61, $0.52, $0.53, $0.60, $0.61 and $0.70 for Class A, Class B, Class C, Class R, Class Y and Class R5 shares, respectively, and total returns would have been lower. |
| (f) | Commencement date of October 3, 2008. |
NOTE 13—Subsequent Event
The Board of Trustees of the Fund unanimously approved an Agreement and Plan of Reorganization (the “Agreement”) pursuant to which the Fund would transfer all of its assets and liabilities to Invesco American Franchise Fund (the “Acquiring Fund”).
The Agreement requires approval of the Fund’s shareholders and will be submitted to the shareholders for their consideration at a meeting to be held in or around April 2013. Upon closing of the reorganization, shareholders of the Fund will receive a corresponding class of shares of the Acquiring Fund in exchange for their shares of the Fund and the Fund will liquidate and cease operations.
19 Invesco Constellation Fund
Report of Independent Registered Public Accounting Firm
To the Board of Trustees of AIM Equity Funds (Invesco Equity Funds)
and Shareholders of Invesco Constellation Fund:
In our opinion, the accompanying statement of assets and liabilities, including the schedule of investments, and the related statements of operations and of changes in net assets and the financial highlights present fairly, in all material respects, the financial position of Invesco Constellation Fund (one of the funds constituting AIM Equity Funds (Invesco Equity Funds), hereafter referred to as the “Fund”) at October 31, 2012, the results of its operations for the year then ended, the changes in its net assets for each of the two years in the period then ended and the financial highlights for each of the five years in the period then ended, in conformity with accounting principles generally accepted in the United States of America. These financial statements and financial highlights (hereafter referred to as “financial statements”) are the responsibility of the Fund’s management; our responsibility is to express an opinion on these financial statements based on our audits. We conducted our audits of these financial statements in accordance with the standards of the Public Company Accounting Oversight Board (United States). Those standards require that we plan and perform the audit to obtain reasonable assurance about whether the financial statements are free of material misstatement. An audit includes examining, on a test basis, evidence supporting the amounts and disclosures in the financial statements, assessing the accounting principles used and significant estimates made by management, and evaluating the overall financial statement presentation. We believe that our audits, which included confirmation of securities at October 31, 2012 by correspondence with the custodian and brokers, provide a reasonable basis for our opinion.
PRICEWATERHOUSECOOPERS LLP
December 21, 2012
Houston, Texas
20 Invesco Constellation Fund
Calculating your ongoing Fund expenses
Example
As a shareholder of the Fund, you incur two types of costs: (1) transaction costs, which may include sales charges (loads) on purchase payments or contingent deferred sales charges on redemptions, and redemption fees, if any; and (2) ongoing costs, including management fees, distribution and/or service (12b-1) fees, and other Fund expenses. This example is intended to help you understand your ongoing costs (in dollars) of investing in the Fund and to compare these costs with ongoing costs of investing in other mutual funds. The example is based on an investment of $1,000 invested at the beginning of the period and held for the entire period May 1, 2012 through October 31, 2012.
Actual expenses
The table below provides information about actual account values and actual expenses. You may use the information in this table, together with the amount you invested, to estimate the expenses that you paid over the period. Simply divide your account value by $1,000 (for example, an $8,600 account value divided by $1,000 = 8.6), then multiply the result by the number in the table under the heading entitled “Actual Expenses Paid During Period” to estimate the expenses you paid on your account during this period.
Hypothetical example for comparison purposes
The table below also provides information about hypothetical account values and hypothetical expenses based on the Fund’s actual expense ratio and an assumed rate of return of 5% per year before expenses, which is not the Fund’s actual return.
The hypothetical account values and expenses may not be used to estimate the actual ending account balance or expenses you paid for the period. You may use this information to compare the ongoing costs of investing in the Fund and other funds. To do so, compare this 5% hypothetical example with the 5% hypothetical examples that appear in the shareholder reports of the other funds.
Please note that the expenses shown in the table are meant to highlight your ongoing costs only and do not reflect any transaction costs, such as sales charges (loads) on purchase payments, contingent deferred sales charges on redemptions, and redemption fees, if any. Therefore, the hypothetical information is useful in comparing ongoing costs only, and will not help you determine the relative total costs of owning different funds. In addition, if these transaction costs were included, your costs would have been higher.
| | | | | | | | | | | | | | | | | | | | | | | | |
| Class | | Beginning
Account Value
(05/01/12) | | | ACTUAL | | | HYPOTHETICAL
(5% annual return before
expenses) | | | Annualized
Expense
Ratio | |
| | | Ending
Account Value
(10/31/12)1 | | | Expenses
Paid During
Period2 | | | Ending
Account Value
(10/31/12) | | | Expenses
Paid During
Period2 | | |
| A | | $ | 1,000.00 | | | $ | 953.40 | | | $ | 6.19 | | | $ | 1,018.80 | | | $ | 6.39 | | | | 1.26 | % |
| B | | | 1,000.00 | | | | 949.50 | | | | 9.85 | | | | 1,015.03 | | | | 10.18 | | | | 2.01 | |
| C | | | 1,000.00 | | | | 949.40 | | | | 9.85 | | | | 1,015.03 | | | | 10.18 | | | | 2.01 | |
| R | | | 1,000.00 | | | | 951.70 | | | | 7.41 | | | | 1,017.55 | | | | 7.66 | | | | 1.51 | |
| Y | | | 1,000.00 | | | | 954.10 | | | | 4.96 | | | | 1,020.06 | | | | 5.13 | | | | 1.01 | |
| R5 | | | 1,000.00 | | | | 955.40 | | | | 4.07 | | | | 1,021.06 | | | | 4.12 | | | | 0.81 | |
| 1 | The actual ending account value is based on the actual total return of the Fund for the period May 1, 2012 through October 31, 2012, after actual expenses and will differ from the hypothetical ending account value which is based on the Fund’s expense ratio and a hypothetical annual return of 5% before expenses. |
| 2 | Expenses are equal to the Fund’s annualized expense ratio as indicated above multiplied by the average account value over the period, multiplied by 184/366 to reflect the most recent fiscal half year. |
21 Invesco Constellation Fund
Approval of Investment Advisory and Sub-Advisory Contracts
The Board of Trustees (the Board) of AIM Equity Funds (Invesco Equity Funds) is required under the Investment Company Act of 1940, as amended, to approve annually the renewal of the Invesco Constellation Fund (the Fund) investment advisory agreement with Invesco Advisers, Inc. (Invesco Advisers) and the Master Intergroup Sub-Advisory Contract for Mutual Funds (the sub-advisory contracts) with Invesco Asset Management Deutschland GmbH, Invesco Asset Management Limited, Invesco Asset Management (Japan) Limited, Invesco Australia Limited, Invesco Hong Kong Limited, Invesco Senior Secured Management, Inc. and Invesco Canada Ltd. (collectively, the Affiliated Sub-Advisers). During contract renewal meetings held on June 19-20, 2012, the Board as a whole, and the disinterested or “independent” Trustees, who comprise 80% of the Board, voting separately, approved the continuance of the Fund’s investment advisory agreement and the sub-advisory contracts for another year, effective July 1, 2012. In doing so, the Board considered the process that it follows in reviewing and approving the Fund’s investment advisory agreement and sub-advisory contracts and the information that it is provided. The Board determined that the Fund’s investment advisory agreement and the sub-advisory contracts are in the best interests of the Fund and its shareholders and the compensation to Invesco Advisers and the Affiliated Sub-Advisers under the agreements is fair and reasonable.
The Board’s Fund Evaluation Process
The Board’s Investments Committee has established three Sub-Committees, each of which is primarily responsible for overseeing the management of a number of the series portfolios of the funds advised by Invesco Advisers (the Invesco Funds). The Sub-Committees meet throughout the year to review the performance of their assigned funds, including reviewing materials prepared under the direction of the independent Senior Officer, an officer of the Invesco Funds who reports directly to the independent Trustees. Over the course of each year, the Sub-Committees meet with portfolio managers for their assigned Invesco Funds and other members of management to review the performance, investment objective(s), policies, strategies, limitations and investment risks of these funds. The Sub-Committees meet regularly and at designated contract renewal meetings each year to conduct a review of the performance, fees, expenses and other matters related to their assigned Invesco Funds. Each Sub-Committee recommends to the Investments Committee, which in turn recommends to the full Board, whether and on what terms to approve the continuance of each Invesco Fund’s investment advisory agreement and sub-advisory contracts for another year.
During the contract renewal process, the Trustees receive comparative performance and fee data regarding the Invesco Funds prepared by Invesco Advisers and an independent company, Lipper Inc. (Lipper). The Trustees also receive an independent written evaluation from the Senior Officer. The Senior Officer’s evaluation is prepared as part of his responsibility to manage the process by which the Invesco Funds’ proposed management fees are negotiated during the annual contract renewal process to ensure they are negotiated in a manner that is at arms’ length and reasonable. The independent Trustees are assisted in their annual evaluation of the Fund’s investment advisory agreement by the Senior Officer and by independent legal counsel. In addition to meetings with Invesco Advisers and fund counsel, the independent Trustees also discuss the continuance of the investment advisory agreement and sub-advisory contracts in private sessions with the Senior Officer and independent legal counsel.
In evaluating the fairness and reasonableness of the Fund’s investment advisory agreement and sub-advisory contracts, the Board considered, among other things, the factors discussed below. The Trustees recognized that the advisory fees for the Invesco Funds include advisory fees that are the result of years of review and negotiation between the Trustees and Invesco Advisers as well as advisory fees previously approved by a different board that, at the time, was responsible for overseeing Morgan Stanley and Van Kampen funds, which have become Invesco Funds following the acquisition of the retail mutual fund business of Morgan Stanley. The Trustees’ deliberations and conclusions in a particular year may be based in part on their deliberations and conclusions regarding these same arrangements throughout the year and in prior years. One Trustee may have weighed a particular piece of information or factor differently than another Trustee.
The discussion below serves as the Senior Officer’s independent written evaluation with respect to the Fund’s investment advisory agreement as well as a discussion of the material factors and related conclusions that formed the basis for the Board’s approval of the Fund’s investment advisory agreement and sub-advisory contracts. Unless otherwise stated, this information is current as of June 20, 2012, and may not reflect consideration of factors that became known to the Board after that date, including, for example, changes to the Fund’s performance, advisory fees, expense limitations and/or fee waivers.
Factors and Conclusions and Summary of Independent Written Fee Evaluation
| A. | Nature, Extent and Quality of Services Provided by Invesco Advisers and the Affiliated Sub-Advisers |
The Board reviewed the advisory services provided to the Fund by Invesco Advisers under
the Fund’s investment advisory agreement, the performance of Invesco Advisers in providing these services, and the credentials and experience of the officers and employees of Invesco Advisers who provide these services, including the Fund’s portfolio manager or managers, with whom the Sub-Committees met during the year. The Board’s review of the qualifications of Invesco Advisers to provide advisory services included the Board’s consideration of Invesco Advisers’ performance and investment process oversight, independent credit analysis and investment risk management.
In determining whether to continue the Fund’s investment advisory agreement, the Board considered the prior relationship between Invesco Advisers and the Fund, as well as the Board’s knowledge of Invesco Advisers’ operations, and concluded that it is beneficial to maintain the current relationship, in part because of such prior relationship and knowledge. The Board also considered services that Invesco Advisers and its affiliates provide to the Invesco Funds such as various back office support functions, equity and fixed income trading operations, internal audit, distribution and legal and compliance. The Board concluded that the nature, extent and quality of the services provided to the Fund by Invesco Advisers are appropriate and satisfactory and consistent with the terms of the Fund’s investment advisory agreement.
The Board reviewed the services provided by the Affiliated Sub-Advisers under the sub-advisory contracts and the credentials and experience of the officers and employees of the Affiliated Sub-Advisers who provide these services. The Board noted that the Affiliated Sub-Advisers have offices and personnel that are located in financial centers around the world. As a result, the Affiliated Sub-Advisers can provide research and investment analysis on the markets and economies of various countries in which the Fund invests and make recommendations on securities of companies located in such countries. The Board concluded that the sub-advisory contracts benefit the Fund and its shareholders by permitting Invesco Advisers to use the resources and talents of the Affiliated Sub-Advisers in managing the Fund. The Board concluded that the nature, extent and quality of the services provided by the Affiliated Sub-Advisers are appropriate and satisfactory and consistent with the terms of the Fund’s sub-advisory contracts.
The Board considered Fund performance as a relevant factor in considering whether to approve the investment advisory agreement. The Board did not view Fund performance as a relevant factor in considering whether to approve the sub-advisory contracts for the Fund, as no Affiliated Sub-Adviser currently manages assets of the Fund.
22 Invesco Constellation Fund
The Board compared the Fund’s performance during the past one, three and five calendar years to the performance of funds in the Lipper performance universe and against the Lipper Large-Cap Growth Funds Index and the Lipper Multi-Cap Growth Funds Index. The Board noted that performance of Class A shares of the Fund was in the fifth quintile of the performance universe for the one, three and five year periods (the first quintile being the best performing funds and the fifth quintile being the worst performing funds). The Board noted that performance of Class A shares of the Fund was below the performance of each Index for the one, three and five year periods. Invesco Advisers presented an analysis to the Board that included an explanation of reasons for differences in performance relative to that of the universe and index, including differences between the Fund’s investment strategies and those of peers. The Board discussed actions that Invesco Advisers had taken or was taking to address performance issues and Invesco Adviser’s resources and responsiveness to performance concerns. These explanations provided a sound basis for understanding comparative performance and monitoring and addressing it going forward, and were part of the Board’s overall conclusion about the nature, extent and quality of the services provided by Invesco Advisers. The Trustees also reviewed more recent Fund performance and this review did not change their conclusions.
| C. | Advisory and Sub-Advisory Fees and Fee Waivers |
The Board compared the Fund’s contractual advisory fee rate to the contractual advisory fee rates of funds in the Fund’s Lipper expense group at a common asset level. The Board noted that the contractual advisory fee rate for Class A shares of the Fund was below the median contractual advisory fee rate of funds in the expense group. The Board also reviewed the methodology used by Lipper in providing expense group information, which includes using audited financial data from the most recent annual report of each fund in the expense group that was publicly available as of the end of the past calendar year and including only one fund per investment adviser. The Board noted that comparative data is as of varying dates, which may affect the comparability of data during times of market volatility.
The Board also compared the Fund’s effective fee rate (the advisory fee after advisory fee waivers and before expense limitations/waivers) to the advisory fee rates of other mutual funds advised by Invesco Advisers and its affiliates with investment strategies comparable to those of the Fund. The Board noted that the Fund’s effective fee rate was the same as the effective fee rate of the other mutual fund with investment strategies comparable to those of the Fund. The Board also noted that Invesco Advisers sub-advises one mutual fund with investment strategies comparable to those of the Fund and that the sub-advisory fee rate is below the Fund’s effective fee rate.
Other than the mutual funds described above, the Board noted that Invesco Advisers
and the Affiliated Sub-Advisers do not advise other client accounts with investment strategies comparable to those of the Fund.
The Board also considered the services provided by the Affiliated Sub-Advisers pursuant to the sub-advisory contracts, as well as the allocation of fees between Invesco Advisers and the Affiliated Sub-Advisers pursuant to the sub-advisory contracts. The Board noted that Invesco Advisers provides services to sub-advised Invesco Funds, including oversight of the Affiliated Sub-Advisers as well as the additional services described above other than day-to-day portfolio management. The Board also noted that the sub-advisory fees have no direct effect on the Fund or its shareholders, as they are paid by Invesco Advisers to the Affiliated Sub-Advisers.
Based upon the information and considerations described above, the Board concluded that the Fund’s advisory and sub-advisory fees are fair and reasonable.
| D. | Economies of Scale and Breakpoints |
The Board considered the extent to which there are economies of scale in the provision of advisory services to the Fund. The Board also considered whether the Fund benefits from economies of scale through contractual breakpoints in the Fund’s advisory fee schedule and were assisted in their review by a report from the Senior Officer. The Board also noted that the Fund shares directly in economies of scale through lower fees charged by third party service providers based on the combined size of the Invesco Funds and other clients advised by Invesco Advisers. The Board noted that Invesco Advisers proposes sharing economies of scale in administration expenses by lowering per class administrative fees.
| E. | Profitability and Financial Resources |
The Board reviewed information from Invesco Advisers concerning the costs of the advisory and other services that Invesco Advisers and its affiliates provide to the Fund and the profitability of Invesco Advisers and its affiliates in providing these services for the year ended December 31, 2011. The Board reviewed with Invesco Advisers the methodology used to prepare the profitability information. The Board considered the profitability of Invesco Advisers in connection with managing the Fund and the Invesco Funds. The Board noted that Invesco Advisers continues to operate at a net profit from services Invesco Advisers and its subsidiaries provide to the Invesco Funds and the Fund. The Board did not deem the level of profits realized by Invesco Advisers and its affiliates from providing services to the Fund to be excessive given the nature, quality and extent of the services provided to the Invesco Funds. The Board received and accepted information from Invesco Advisers demonstrating that Invesco Advisers and each Affiliated Sub-Adviser are financially sound and have the resources necessary to perform their obligations under the investment advisory agreement and sub-advisory contracts.
| F. | Collateral Benefits to Invesco Advisers and its Affiliates |
The Board considered various other benefits received by Invesco Advisers and its affiliates from the relationship with the Fund, including the fees received for their provision of administrative, transfer agency and distribution services to the Fund. The Board considered the performance of Invesco Advisers and its affiliates in providing these services and the organizational structure employed to provide these services. The Board also considered that these services are provided to the Fund pursuant to written contracts that are reviewed and approved on an annual basis by the Board; that the services are required for the operation of the Fund; that Invesco Advisers and its affiliates can provide services, the nature and quality of which are at least equal to those provided by others offering the same or similar services; and that the fees for such services are fair and reasonable in light of the usual and customary charges by others for services of the same nature and quality.
The Board considered the benefits realized by Invesco Advisers and the Affiliated Sub-Advisers as a result of portfolio brokerage transactions executed through “soft dollar” arrangements. The Board noted that soft dollar arrangements shift the payment obligation for research services from Invesco Advisers and the Affiliated Sub-Advisers to the Invesco Funds and therefore may reduce Invesco Advisers’ and the Affiliated Sub-Advisers’ expenses. The Board also considered periodic reports from the Chief Compliance Officer of the Invesco Funds demonstrating that these arrangements are consistent with regulatory requirements. The Board did not deem the soft dollar arrangements to be inappropriate.
The Board considered that the Fund’s uninvested cash and cash collateral from any securities lending arrangements may be invested in money market funds advised by Invesco Advisers pursuant to procedures approved by the Board. The Board noted that Invesco Advisers receives advisory fees from these affiliated money market funds attributable to such investments, although Invesco Advisers has contractually agreed to waive through varying periods the advisory fees payable by the Invesco Funds. The waiver is in an amount equal to 100% of the net advisory fee Invesco Advisers receives from the affiliated money market funds with respect to the Fund’s investment in the affiliated money market funds of uninvested cash, but not cash collateral. The Board concluded that the Fund’s investment of uninvested cash and cash collateral from any securities lending arrangements in the affiliated money market funds is in the best interests of the Fund and its shareholders.
The Board also considered use of an affiliated broker to execute certain trades for the Fund and that such trades are executed in compliance with rules under the Investment Company Act of 1940, as amended.
23 Invesco Constellation Fund
Trustees and Officers
The address of each trustee and officer is AIM Equity Funds (Invesco Equity Funds) (the “Trust”), 11 Greenway Plaza, Suite 1000, Houston, Texas 77046-1173. The trustees serve for the life of the Trust, subject to their earlier death, incapacitation, resignation, retirement or removal as more specifically provided in the Trust’s organizational documents. Each officer serves for a one year term or until their successors are elected and qualified. Column two below includes length of time served with predecessor entities, if any.
| | | | | | | | |
Name, Year of Birth and
Position(s) Held with the Trust | | Trustee and/
or Officer Since | | Principal Occupation(s)
During Past 5 Years | | Number of
Funds in Fund Complex
Overseen by
Trustee | | Other Directorship(s)
Held by Trustee During
Past 5 Years |
| Interested Persons | | | | | | | | |
| Martin L. Flanagan1 — 1960 Trustee | | 2007 | | Executive Director, Chief Executive Officer and President, Invesco Ltd. (ultimate parent of Invesco and a global investment management firm); Advisor to the Board, Invesco Advisers, Inc. (formerly known as Invesco Institutional (N.A.), Inc.); Trustee, The Invesco Funds; Vice Chair, Investment Company Institute; and Member of Executive Board, SMU Cox School of Business Formerly: Chairman, Invesco Advisers, Inc. (registered investment adviser); Director, Chairman, Chief Executive Officer and President, IVZ Inc. (holding company), INVESCO Group Services, Inc. (service provider) and Invesco North American Holdings, Inc. (holding company); Director, Chief Executive Officer and President, Invesco Holding Company Limited (parent of Invesco and a global investment management firm); Director, Invesco Ltd.; Chairman, Investment Company Institute and President, Co-Chief Executive Officer, Co-President, Chief Operating Officer and Chief Financial Officer, Franklin Resources, Inc. (global investment management organization) | | 123 | | None |
| Philip A. Taylor2 — 1954 Trustee, President and Principal Executive Officer | | 2006 | | Head of North American Retail and Senior Managing Director, Invesco Ltd.; Director, Co-Chairman, Co-President and Co-Chief Executive Officer, Invesco Advisers, Inc. (formerly known as Invesco Institutional (N.A.), Inc.) (registered investment adviser); Director, Chairman, Chief Executive Officer and President, Invesco Management Group, Inc. (formerly known as Invesco Aim Management Group, Inc.) (financial services holding company); Director and President, INVESCO Funds Group, Inc. (registered investment adviser and registered transfer agent); Director and Chairman, Invesco Investment Services, Inc. (formerly known as Invesco Aim Investment Services, Inc.) (registered transfer agent) and IVZ Distributors, Inc. (formerly known as INVESCO Distributors, Inc.) (registered broker dealer); Director, President and Chairman, Invesco Inc. (holding company) and Invesco Canada Holdings Inc. (holding company); Chief Executive Officer, Invesco Corporate Class Inc. (corporate mutual fund company) and Invesco Canada Fund Inc. (corporate mutual fund company); Director, Chairman and Chief Executive Officer, Invesco Canada Ltd. (formerly known as Invesco Trimark Ltd./Invesco Trimark Ltèe) (registered investment adviser and registered transfer agent); Trustee, President and Principal Executive Officer, The Invesco Funds (other than AIM Treasurer’s Series Trust (Invesco Treasurer’s Series Trust) and Short-Term Investments Trust); Trustee and Executive Vice President, The Invesco Funds (AIM Treasurer’s Series Trust (Invesco Treasurer’s Series Trust) and Short-Term Investments Trust only); Director, Invesco Investment Advisers LLC (formerly known as Van Kampen Asset Management); Director, Chief Executive Officer and President, Van Kampen Exchange Corp. Formerly: Director and Chairman, Van Kampen Investor Services Inc.; Director, Chief Executive Officer and President, 1371 Preferred Inc. (holding company); and Van Kampen Investments Inc.; Director and President, AIM GP Canada Inc. (general partner for limited partnerships); and Van Kampen Advisors, Inc.; Director and Chief Executive Officer, Invesco Trimark Dealer Inc. (registered broker dealer); Director, Invesco Distributors, Inc. (formerly known as Invesco Aim Distributors, Inc.) (registered broker dealer); Manager, Invesco PowerShares Capital Management LLC; Director, Chief Executive Officer and President, Invesco Advisers, Inc.; Director, Chairman, Chief Executive Officer and President, Invesco Aim Capital Management, Inc.; President, Invesco Trimark Dealer Inc. and Invesco Trimark Ltd./Invesco Trimark Ltèe; Director and President, AIM Trimark Corporate Class Inc. and AIM Trimark Canada Fund Inc.; Senior Managing Director, Invesco Holding Company Limited; Trustee and Executive Vice President, Tax-Free Investments Trust; Director and Chairman, Fund Management Company (former registered broker dealer); President and Principal Executive Officer, The Invesco Funds (AIM Treasurer’s Series Trust (Invesco Treasurer’s Series Trust), Short-Term Investments Trust and Tax-Free Investments Trust only); President, AIM Trimark Global Fund Inc. and AIM Trimark Canada Fund Inc. | | 123 | | None |
Wayne W. Whalen3 — 1939 Trustee | | 2010 | | Of Counsel, and prior to 2010, partner in the law firm of Skadden, Arps, Slate, Meagher & Flom LLP, legal counsel to certain funds in the Fund Complex | | 136 | | Director of the Mutual Fund Directors Forum, a nonprofit membership organization for investment directors; Chairman and Director of the Abraham Lincoln Presidential Library Foundation; and Director of the Stevenson Center for Democracy |
| 1 | Mr. Flanagan is considered an interested person of the Trust because he is an officer of the adviser to the Trust, and an officer and a director of Invesco Ltd., ultimate parent of the adviser to the Trust. |
| 2 | Mr. Taylor is considered an interested person of the Trust because he is an officer and a director of the adviser to, and a director of the principal underwriter of, the Trust. |
| 3 | Mr. Whalen is considered an “interested person” (within the meaning of Section 2(a)(19) of the 1940 Act) of certain Funds in the Invesco Fund Complex by reason of he and his firm currently providing legal services as legal counsel to such Funds in the Invesco Fund Complex. |
T-1 Invesco Constellation Fund
Trustees and Officers—(continued)
| | | | | | | | |
Name, Year of Birth and
Position(s) Held with the Trust | | Trustee and/
or Officer Since | | Principal Occupation(s)
During Past 5 Years | | Number of Funds in Fund Complex Overseen by Trustee | | Other Directorship(s) Held by Trustee During
Past 5 Years |
| Independent Trustees | | | | | | | | |
Bruce L. Crockett — 1944 Trustee and Chair | | 1993 | | Chairman, Crockett Technologies Associates (technology consulting company) Formerly: Director, Captaris (unified messaging provider); Director, President and Chief Executive Officer COMSAT Corporation; and Chairman, Board of Governors of INTELSAT (international communications company) | | 123 | | ACE Limited (insurance company); and Investment Company Institute |
David C. Arch — 1945 Trustee | | 2010 | | Retired. Formerly: Chairman and Chief Executive Officer of Blistex Inc., (consumer health care products manufacturer) | | 136 | | Member of the Heartland Alliance Advisory Board, a nonprofit organization serving human needs based in Chicago. Board member of the Illinois Manufacturers’ Association. Member of the Board of Visitors, Institute for the Humanities, University of Michigan |
Frank S. Bayley — 1939 Trustee | | 2001 | | Retired Formerly: Director, Badgley Funds, Inc. (registered investment company) (2 portfolios) and Partner, law firm of Baker & McKenzie | | 123 | | Director and Chairman, C.D. Stimson Company (a real estate investment company) |
James T. Bunch — 1942 Trustee | | 2003 | | Managing Member, Grumman Hill Group LLC (family office private equity management) Formerly: Founder, Green, Manning & Bunch Ltd. (investment banking firm)(1988-2010); Executive Committee, United States Golf Association; and Director, Policy Studies, Inc. and Van Gilder Insurance Corporation | | 123 | | Chairman, Board of Governors, Western Golf Association, Chairman-elect, Evans Scholars Foundation and Director, Denver Film Society |
Rodney F. Dammeyer — 1940 Trustee | | 2010 | | Chairman of CAC, LLC, (private company offering capital investment and management advisory services) Formerly: Prior to January 2004, Director of TeleTech Holdings Inc.; Prior to 2002, Director of Arris Group, Inc.; Prior to 2001, Managing Partner at Equity Group Corporate Investments. Prior to 1995, Vice Chairman of Anixter International. Prior to 1985, experience includes Senior Vice President and Chief Financial Officer of Household International, Inc., Executive Vice President and Chief Financial Officer of Northwest Industries, Inc. and Partner of Arthur Andersen & Co. | | 136 | | Director of Quidel Corporation and Stericycle, Inc. Prior to May 2008, Trustee of The Scripps Research Institute. Prior to February 2008, Director of Ventana Medical Systems, Inc. Prior to April 2007, Director of GATX Corporation. Prior to April 2004, Director of TheraSense, Inc. |
Albert R. Dowden — 1941 Trustee | | 2000 | | Director of a number of public and private business corporations, including the Boss Group, Ltd. (private investment and management); Reich & Tang Funds (5 portfolios) (registered investment company); and Homeowners of America Holding Corporation/ Homeowners of America Insurance Company (property casualty company) Formerly: Director, Continental Energy Services, LLC (oil and gas pipeline service); Director, CompuDyne Corporation (provider of product and services to the public security market) and Director, Annuity and Life Re (Holdings), Ltd. (reinsurance company); Director, President and Chief Executive Officer, Volvo Group North America, Inc.; Senior Vice President, AB Volvo; Director of various public and private corporations; Chairman, DHJ Media, Inc.; Director Magellan Insurance Company; and Director, The Hertz Corporation, Genmar Corporation (boat manufacturer), National Media Corporation; Advisory Board of Rotary Power International (designer, manufacturer, and seller of rotary power engines); and Chairman, Cortland Trust, Inc. (registered investment company) | | 123 | | Director of Nature’s Sunshine Products, Inc. |
Jack M. Fields — 1952 Trustee | | 1997 | | Chief Executive Officer, Twenty First Century Group, Inc. (government affairs company); and Owner and Chief Executive Officer, Dos Angelos Ranch, L.P. (cattle, hunting, corporate entertainment), Discovery Global Education Fund (non-profit) and Cross Timbers Quail Research Ranch (non-profit) Formerly: Chief Executive Officer, Texana Timber LP (sustainable forestry company) and member of the U.S. House of Representatives | | 123 | | Insperity (formerly known as Administaff) |
Carl Frischling — 1937 Trustee | | 1988 | | Partner, law firm of Kramer Levin Naftalis and Frankel LLP | | 123 | | Director, Reich & Tang Funds (6 portfolios) |
Prema Mathai-Davis — 1950 Trustee | | 1998 | | Retired Formerly: Chief Executive Officer, YWCA of the U.S.A. | | 123 | | None |
Larry Soll — 1942 Trustee | | 2003 | | Retired Formerly: Chairman, Chief Executive Officer and President, Synergen Corp. (a biotechnology company) | | 123 | | None |
T-2 Invesco Constellation Fund
Trustees and Officers—(continued)
| | | | | | | | |
Name, Year of Birth and
Position(s) Held with the Trust | | Trustee and/
or Officer Since | | Principal Occupation(s) During Past 5 Years | | Number of
Funds in Fund Complex Overseen by Trustee | | Other Directorship(s) Held by Trustee During Past 5 Years |
| Independent Trustees—(continued) |
Hugo F. Sonnenschein — 1940 Trustee | | 2010 | | Distinguished Service Professor and President Emeritus of the University of Chicago and the Adam Smith Distinguished Service Professor in the Department of Economics at the University of Chicago. Formerly: President of the University of Chicago | | 136 | | Trustee of the University of Rochester and a member of its investment committee. Member of the National Academy of Sciences, the American Philosophical Society and a fellow of the American Academy of Arts and Sciences |
Raymond Stickel, Jr. — 1944 Trustee | | 2005 | | Retired Formerly: Director, Mainstay VP Series Funds, Inc. (25 portfolios) and Partner, Deloitte & Touche | | 123 | | None |
| Other Officers | | | | | | | | |
Russell C. Burk — 1958 Senior Vice President and Senior Officer | | 2005 | | Senior Vice President and Senior Officer, The Invesco Funds | | N/A | | N/A |
John M. Zerr — 1962 Senior Vice President, Chief Legal Officer and Secretary | | 2006 | | Director, Senior Vice President, Secretary and General Counsel, Invesco Management Group, Inc. (formerly known as Invesco Aim Management Group, Inc.) and Van Kampen Exchange Corp.; Senior Vice President, Invesco Advisers, Inc. (formerly known as Invesco Institutional (N.A.), Inc.) (registered investment adviser); Senior Vice President and Secretary, Invesco Distributors, Inc. (formerly known as Invesco Aim Distributors, Inc.); Director, Vice President and Secretary, Invesco Investment Services, Inc. (formerly known as Invesco Aim Investment Services, Inc.) and IVZ Distributors, Inc. (formerly known as INVESCO Distributors, Inc.); Director and Vice President, INVESCO Funds Group, Inc.; Senior Vice President, Chief Legal Officer and Secretary, The Invesco Funds; Manager, Invesco PowerShares Capital Management LLC; Director, Secretary and General Counsel, Invesco Investment Advisers LLC (formerly known as Van Kampen Asset Management); Secretary and General Counsel, Invesco Capital Markets, Inc. (formerly known as Van Kampen Funds Inc.) and Chief Legal Officer, PowerShares Exchange-Traded Fund Trust, PowerShares Exchange-Traded Fund Trust II, PowerShares India Exchange-Traded Fund Trust and PowerShares Actively Managed Exchange-Traded Fund Trust Formerly: Director and Secretary, Van Kampen Advisors Inc.; Director Vice President, Secretary and General Counsel Van Kampen Investor Services Inc.; Director, Invesco Distributors, Inc. (formerly known as Invesco Aim Distributors, Inc.); Director, Senior Vice President, General Counsel and Secretary, Invesco Advisers, Inc.; and Van Kampen Investments Inc.; Director, Vice President and Secretary, Fund Management Company; Director, Senior Vice President, Secretary, General Counsel and Vice President, Invesco Aim Capital Management, Inc.; Chief Operating Officer and General Counsel, Liberty Ridge Capital, Inc. (an investment adviser); Vice President and Secretary, PBHG Funds (an investment company) and PBHG Insurance Series Fund (an investment company); Chief Operating Officer, General Counsel and Secretary, Old Mutual Investment Partners (a broker-dealer); General Counsel and Secretary, Old Mutual Fund Services (an administrator) and Old Mutual Shareholder Services (a shareholder servicing center); Executive Vice President, General Counsel and Secretary, Old Mutual Capital, Inc. (an investment adviser); and Vice President and Secretary, Old Mutual Advisors Funds (an investment company) | | N/A | | N/A |
Lisa O. Brinkley — 1959 Vice President | | 2004 | | Global Assurance Officer, Invesco Ltd. and Vice President, The Invesco Funds Formerly: Chief Compliance Officer, Invesco Distributors, Inc. (formerly known as Invesco Aim Distributors, Inc.), Invesco Investment Services, Inc.(formerly known as Invesco Aim Investment Services, Inc.) and Van Kampen Investor Services Inc.; Senior Vice President, Invesco Management Group, Inc.; Senior Vice President and Chief Compliance Officer, Invesco Advisers, Inc. and The Invesco Funds; Vice President and Chief Compliance Officer, Invesco Aim Capital Management, Inc. and Invesco Distributors, Inc.; Vice President, Invesco Investment Services, Inc. and Fund Management Company | | N/A | | N/A |
T-3 Invesco Constellation Fund
Trustees and Officers—(continued)
| | | | | | | | |
Name, Year of Birth and
Position(s) Held with the Trust | | Trustee and/
or Officer Since | | Principal Occupation(s) During Past 5 Years | | Number of
Funds in Fund
Complex
Overseen by
Trustee | | Other Directorship(s)
Held by Trustee During
Past 5 Years |
| Other Officers—(continued) |
Karen Dunn Kelley — 1960 Vice President | | 2004 | | Head of Invesco’s World Wide Fixed Income and Cash Management Group; Senior Vice President, Invesco Management Group, Inc. (formerly known as Invesco Aim Management Group, Inc.) and Invesco Advisers, Inc. (formerly known as Invesco Institutional (N.A.), Inc.) (registered investment adviser); Executive Vice President, Invesco Distributors, Inc. (formerly known as Invesco Aim Distributors, Inc.); Director, Invesco Mortgage Capital Inc., INVESCO Global Asset Management Limited, Invesco Management Company Limited and INVESCO Management S.A.; Vice President, The Invesco Funds (other than AIM Treasurer’s Series Trust (Invesco Treasurer’s Series Trust) and Short-Term Investments Trust); and President and Principal Executive Officer, The Invesco Funds (AIM Treasurer’s Series Trust (Invesco Treasurer’s Series Trust) and Short-Term Investments Trust only) Formerly: Senior Vice President, Van Kampen Investments Inc.; Vice President, Invesco Advisers, Inc. (formerly known as Invesco Institutional (N.A.), Inc.); Director of Cash Management and Senior Vice President, Invesco Advisers, Inc. and Invesco Aim Capital Management, Inc.; President and Principal Executive Officer, Tax-Free Investments Trust; Director and President, Fund Management Company; Chief Cash Management Officer, Director of Cash Management, Senior Vice President, and Managing Director, Invesco Aim Capital Management, Inc.; Director of Cash Management, Senior Vice President, and Vice President, Invesco Advisers, Inc. and The Invesco Funds (AIM Treasurer’s Series Trust (Invesco Treasurer’s Series Trust), Short-Term Investments Trust and Tax-Free Investments Trust only) | | N/A | | N/A |
Sheri Morris — 1964 Vice President, Treasurer and Principal Financial Officer | | 1999 | | Vice President, Treasurer and Principal Financial Officer, The Invesco Funds; Vice President, Invesco Advisers, Inc. (formerly known as Invesco Institutional (N.A.), Inc.) (registered investment adviser); and Treasurer, PowerShares Exchange-Traded Fund Trust, PowerShares Exchange-Traded Fund Trust II, PowerShares India Exchange-Traded Fund Trust and PowerShares Actively Managed Exchange-Traded Fund Trust Formerly: Vice President, Invesco Advisers, Inc., Invesco Aim Capital Management, Inc. and Invesco Aim Private Asset Management, Inc.; Assistant Vice President and Assistant Treasurer, The Invesco Funds and Assistant Vice President, Invesco Advisers, Inc., Invesco Aim Capital Management, Inc. and Invesco Aim Private Asset Management, Inc. | | N/A | | N/A |
Yinka Akinsola — 1977 Anti-Money Laundering Compliance Officer | | 2011 | | Anti-Money Laundering Compliance Officer, Invesco Advisers, Inc. (formerly known as Invesco Institutional (N.A.), Inc.) (registered investment adviser); Invesco Distributors, Inc. (formerly known as Invesco Aim Distributors, Inc.), Invesco Investment Services, Inc. (formerly known as Invesco Aim Investment Services, Inc.), Invesco Management Group, Inc., The Invesco Funds, Invesco Van Kampen Closed-End Funds, Van Kampen Exchange Corp., Invesco Capital Markets, Inc. (formerly known as Van Kampen Funds Inc.), PowerShares Exchange-Traded Fund Trust, PowerShares Exchange-Traded Fund Trust II, PowerShares India Exchange-Traded Fund Trust, and PowerShares Actively Managed Exchange-Traded Fund Trust Formerly: Regulatory Analyst III, Financial Industry Regulatory Authority (FINRA). | | N/A | | N/A |
Todd L. Spillane — 1958 Chief Compliance Officer | | 2006 | | Senior Vice President, Invesco Management Group, Inc. (formerly known as Invesco Aim Management Group, Inc.) and Van Kampen Exchange Corp.; Senior Vice President and Chief Compliance Officer, Invesco Advisers, Inc. (registered investment adviser) (formerly known as Invesco Institutional (N.A.), Inc.); Chief Compliance Officer, The Invesco Funds; Vice President, Invesco Distributors, Inc. (formerly known as Invesco Aim Distributors, Inc.) and Invesco Investment Services, Inc. (formerly known as Invesco Aim Investment Services, Inc.) Formerly: Chief Compliance Officer, Invesco Van Kampen Closed-End Funds; Senior Vice President, Van Kampen Investments Inc.; Senior Vice President and Chief Compliance Officer, Invesco Advisers, Inc. and Invesco Aim Capital Management, Inc.; Chief Compliance Officer, INVESCO Private Capital Investments, Inc. (holding company), Invesco Private Capital, Inc. (registered investment adviser), Invesco Global Asset Management (N.A.), Inc., Invesco Senior Secured Management, Inc. (registered investment adviser) and Van Kampen Investor Services Inc., PowerShares Exchange-Traded Fund Trust, PowerShares Exchange-Traded Fund Trust II, PowerShares India Exchange-Traded Fund Trust and PowerShares Actively Managed Exchange-Traded Fund Trust; Vice President, Invesco Aim Capital Management, Inc. and Fund Management Company | | N/A | | N/A |
The Statement of Additional Information of the Trust includes additional information about the Fund’s Trustees and is available upon request, without charge, by calling 1.800.959.4246. Please refer to the Fund’s prospectus for information on the Fund’s sub-advisers.
| | | | | | |
Office of the Fund 11 Greenway Plaza, Suite 1000 Houston, TX 77046-1173 | | Investment Adviser Invesco Advisers, Inc. 1555 Peachtree Street, N.E. Atlanta, GA 30309 | | Distributor Invesco Distributors, Inc. 11 Greenway Plaza, Suite 1000 Houston, TX 77046-1173 | | Auditors PricewaterhouseCoopers LLP 1201 Louisiana Street, Suite 2900 Houston, TX 77002-5678 |
| | | |
| | | | | | |
Counsel to the Fund Stradley Ronon Stevens & Young, LLP 2005 Market Street, Suite 2600 Philadelphia, PA 19103-7018 | | Counsel to the Independent Trustees Kramer Levin Naftalis & Frankel LLP 1177 Avenue of the Americas New York, NY 10036-2714 | | Transfer Agent Invesco Investment Services, Inc. 11 Greenway Plaza, Suite 1000 Houston, TX 77046-1173 | | Custodian State Street Bank and Trust Company 225 Franklin Street Boston, MA 02110-2801 |
T-4 Invesco Constellation Fund

Invesco mailing information
Send general correspondence to Invesco Investment Services, Inc., P.O. Box 219078, Kansas City, MO 64121-9078.
Invesco privacy policy
You share personal and financial information with us that is necessary for your transactions and your account records. We take very seriously the obligation to keep that information confidential and private.
Invesco collects nonpublic personal information about you from account applications or other forms you complete and from your transactions with us or our affiliates. We do not disclose information about you or our former customers to service providers or other third parties except to the extent necessary to service your account and in other limited circumstances as permitted by law. For example, we use this information to facilitate the delivery of transaction confirmations, financial reports, prospectuses and tax forms.
Even within Invesco, only people involved in the servicing of your accounts and compliance monitoring have access to your information. To ensure the highest level of confidentiality and security, Invesco maintains physical, electronic and procedural safeguards that meet or exceed federal standards. Special measures, such as data encryption and authentication, apply to your communications with us on our website. More detail is available to you at invesco.com/privacy.
Important notice regarding delivery of security holder documents
To reduce Fund expenses, only one copy of most shareholder documents may be mailed to shareholders with multiple accounts at the same address (Householding). Mailing of your shareholder documents may be householded indefinitely unless you instruct us otherwise. If you do not want the mailing of these documents to be combined with those for other members of your household, please contact Invesco Investment Services, Inc. at 800 959 4246 or contact your financial institution. We will begin sending you individual copies for each account within 30 days after receiving your request.
Fund holdings and proxy voting information
The Fund provides a complete list of its holdings four times in each fiscal year, at the quarter-ends. For the second and fourth quarters, the lists appear in the Fund’s semiannual and annual reports to shareholders. For the first and third quarters, the Fund files the lists with the Securities and Exchange Commission (SEC) on Form N-Q. The most recent list of portfolio holdings is available at invesco.com/completeqtrholdings. Shareholders can also look up the Fund’s Forms N-Q on the SEC website at sec.gov. Copies of the Fund’s Forms N-Q may be reviewed and copied at the SEC Public Reference Room in Washington, D.C. You can obtain information on the operation of the Public Reference Room, including information about duplicating fee charges, by calling 202 551 8090 or 800 732 0330, or by electronic request at the following email address: publicinfo@sec.gov. The SEC file numbers for the Fund are shown below.
A description of the policies and procedures that the Fund uses to determine how to vote proxies relating to portfolio securities is available without charge, upon request, from our Client Services department at 800 959 4246 or at invesco.com/proxyguidelines. The information is also available on the SEC website, sec.gov.
| | | | |
Information regarding how the Fund voted proxies related to its portfolio securities during the 12 months ended June 30, 2012, is available at invesco.com/proxysearch. The information is also available on the SEC website, sec.gov. Invesco Advisers, Inc. is an investment adviser; it provides investment advisory services to individual and institutional clients and does not sell securities. Invesco Distributors, Inc. is the US distributor for Invesco Ltd.’s retail mutual funds, exchange-traded funds and institutional money market funds. Both are wholly owned, indirect subsidiaries of Invesco Ltd. | | |  | |
| | | | |
| SEC file numbers: 811-01424 and 002-25469 | | CST-AR-1 | | Invesco Distributors, Inc. |

Letters to Shareholders
| | |

Philip Taylor | | Dear Shareholders: This report contains information about your Fund, including a discussion from your portfolio managers about how they managed your Fund – and why it performed as it did – during the reporting period. This report also includes your Fund’s long-term performance and a complete list of your Fund’s investments as of the close of the reporting period. I hope you find this information helpful. For much of the reporting period, investors’ attention was focused on Europe, where eurozone governments struggled to reduce debt levels, strengthen their banks and stimulate their economies. European leaders disagreed whether the wiser path to restoring the Continent’s economic well-being was more stimulus or greater austerity. In the US, economic data were mixed. Economic growth, while positive, was relatively modest. Corporate earnings, which grew strongly in recent years, showed signs of slowing. And job creation was less robust than hoped. Later in this report, your Fund’s portfolio managers discuss how |
| economic conditions and market trends affected your Fund’s performance. |
Economic conditions are always subject to sudden and unexpected change. That’s why you may find it helpful to work with a trusted, experienced financial adviser who understands your unique financial goals, needs and risk tolerances. Financial advisers can provide valuable insight and information, particularly when markets are uncertain, and they can recommend investments appropriate for specific investment goals, such as a child’s college education or your retirement. On a regular basis, a financial adviser also can determine whether your existing investments are still appropriate, given your changing needs, goals and circumstances.
Timely insight and information from many of Invesco’s investment professionals is available at our website, invesco.com/us. We offer in-depth articles, video clips and audio commentaries from many of our portfolio managers and other investment professionals on a wide range of topics of interest to investors: recent economic and market developments; retirement planning; legislative updates from Washington, DC; and general investor education. At invesco.com/us, you also can access information about your Invesco account at any time.
What we mean by Intentional Investing
Intentional InvestingSM is the science and art of investing with purpose, prudence and diligence – and it’s how Invesco’s investment professionals manage your money every day.
This highly disciplined process begins when specialized teams of investment professionals clearly define an investment objective and then establish specific investment strategies to try to achieve that objective. While our investment teams closely monitor economic and market conditions – and issues specific to individual holdings that could affect their value – they maintain a long-term investment perspective. Intentional Investing is also:
| | n | | How we manage and mitigate risk – by embedding risk controls and processes into every aspect of our business; |
| | n | | How we create products – by offering a diverse combination of investment strategies and vehicles designed to meet your needs; and |
| | n | | How we connect with you, our investors – by communicating clearly, by delivering expert insights from our portfolio managers and other investment professionals, and by providing a website full of tools and articles to help you stay informed. |
As a company, Invesco believes in putting investors first, and that’s why investment management is all we do. Our sole focus on managing your money allows your financial adviser to build a truly diversified investment portfolio of Invesco funds, whatever your investment needs and goals may be – and allows him or her to find appropriate Invesco funds when your circumstances change. Of course, neither Intentional Investing nor diversification can guarantee a profit or protect against loss.
Have a question?
If you have questions about your account, please contact an Invesco client services representative at 800 959 4246. If you have an Invesco-related question or comment, feel free to email me directly at phil@invesco.com.
All of us at Invesco look forward to serving your investment management needs for many years to come. Thank you for investing with us.
Sincerely,

Philip Taylor
Senior Managing Director, Invesco Ltd.
2 Invesco Disciplined Equity Fund
| | |

Bruce Crockett | | Dear Fellow Shareholders: One of our most important responsibilities as independent Trustees of the Invesco Funds is our annual review of the funds’ advisory and sub-advisory contracts with Invesco. This annual review is required by the Investment Company Act of 1940 and focuses on the nature and quality of the services Invesco has provided as adviser to the Invesco Funds and the reasonableness of the fees that it charges for those services. In our roles as Trustees, we spend months reviewing thousands of pages of detailed information that we request from Invesco in connection with our annual review. We focus on the quality and costs of the services to be provided by Invesco and its affiliates. Some of the most important things we look at are fund performance, expenses and fees. All of the Trustees have substantial personal investments in the Invesco Funds complex. We’re fund shareholders just like you. |
We also use information from many independent sources during the review process, including materials provided by the independent Senior Officer of the Invesco Funds, who reports directly to the independent Trustees. We also meet in private sessions with independent legal counsel and review performance and fee data on the Invesco Funds prepared by Lipper Inc., an independent, third-party firm widely recognized as a leader in its field.
I’m pleased to report that the Invesco Funds Board determined in June that renewing the investment advisory agreement and the sub-advisory contracts with Invesco would serve the best interests of each fund and its shareholders. For more detailed information about our assessment and conclusions with respect to each of the Invesco Funds, visit invesco.com/us, click on the “About Us” section and go to “Legal Information.” Information on the recent investment advisory renewal process can be found by clicking the last item under “Corporate Governance.”
In much the same way we review your fund’s advisory contract each year, it’s a good idea for you to review your own investment plan with your financial adviser on a regular basis. Perhaps you need to reassess your original asset allocation because different investments may grow at varying paces, or perhaps you’re going through a significant life change. Regardless of your situation, a financial adviser can provide guidance and experience to help you reach your financial goals.
As always, please contact me at bruce@brucecrockett.com with any questions or concerns you may have. On behalf of the Board, we look forward to continuing to represent your interests and serving your needs.
Sincerely,

Bruce L. Crockett
Independent Chair
Invesco Funds Board of Trustees
3 Invesco Disciplined Equity Fund
Management’s Discussion of Fund Performance
Performance summary
Invesco Disciplined Equity Fund underperformed its broad market benchmark, the S&P 500 Index, for the fiscal year ended October 31, 2012. Stock selection in the consumer staples, industrials and energy sectors detracted from Fund performance, as did our lack of exposure to telecommunication services, the index’s strongest performing sector for the reporting period. Stock selection in the information technology (IT), health care, consumer discretionary and financials sectors made a positive contribution to relative results.
Your Fund’s long-term performance appears later in this report.
Fund vs. Indexes
Total returns, 10/31/11 to 10/31/12, at net asset value (NAV).
| | | | |
Class Y Shares | | | 14.05 | % |
S&P 500 Indexq (Broad Market Index) | | | 15.21 | |
| Source(s): qInvesco, S&P-Dow Jones via FactSet Research Inc. | | | | |
How we invest
Our investment process stems from our belief that established companies with low capital intensity and strong balance sheets, growing at reasonable rates, will have a better ability to generate cash flow throughout a market cycle. Furthermore, we believe that the ability of a company to consistently generate and effectively deploy cash flow is often overlooked by investors. Our goal is to identify these quality companies and invest in them when their cash flow attributes are underappreciated.
Our fundamental, bottom-up process seeks to identify candidates operating in attractive industries, with strong competitive positions and attractive returns on invested capital, as well as managements with a track record of generating and effectively deploying cash flow. We seek opportunities to invest in these companies when cash flow valuations allow for double-digit appreciation potential. This process results in a diversified portfolio of high-quality, high-conviction stocks. We will typically own 50 to 60 stocks with broad sector representation.
Risk management is an essential part of the process. In addition to strategy level quantitative analysis and attribution and risk decomposition, we employ a sell
discipline. We will likely sell a position when the company’s long term positioning is compromised or when a stock becomes overvalued based on cash flow valuation metrics. We will also utilize our sell discipline to manage risk, carefully assessing and constantly challenging our comfort level with the portfolio’s positioning.
Market conditions and your Fund
The fiscal year began with improving economic data in the US and a rally in equities that continued almost uninterrupted into the spring of 2012. However, the ongoing eurozone sovereign debt crisis intensified in April and May, dominating headlines and creating significant volatility in equity markets across the globe.
This negative news from overseas precipitated a slowdown in the US, where economic data began to decelerate as manufacturing, employment, consumer spending and consumer confidence weakened over the summer. While corporate earnings remained solid, financial markets were influenced by macroeconomic developments for much of the reporting period. As the fiscal year drew to a close, fears about the fate of the eurozone began
to subside after the European Central Bank announced new measures to support eurozone economies through potentially unlimited purchases of sovereign debt, among other measures. At the same time, continued risk aversion among investors and corporations, along with tepid employment growth, prompted the US Federal Reserve (the Fed) to initiate a third round of quantitative easing by promising to remain accommodative until the labor market outlook improves materially. The Fed’s action initially bolstered equity markets, but the potential impact on employment and economic conditions remained uncertain. At the close of the reporting period, market volatility increased as many investors remained concerned about the uncertainty surrounding the presidential election and the so-called “fiscal cliff” – a variety of tax increases and spending cuts scheduled to take effect in January 2013, unless an agreement is reached between the White House and Congress.
Despite volatility for much of the reporting period, major equity market indexes delivered double-digit gains, and all 10 sectors of the S&P 500 Index had positive returns.1
In a change of course, value outperformed growth across all capitalization ranges. US stocks continued to outperform foreign equity markets. The best-performing sectors within the S&P 500 Index were telecommunication services, health care, financials, consumer discretionary and consumer staples. The lagging sectors were energy, materials, utilities, IT and industrials, though all produced solid positive returns.
The Fund underperformed the S&P 500 Index for the reporting period. The Fund’s underperformance was primarily due to the industrials, energy, consumer staples and telecommunication services sectors. In industrials, earnings disappointments resulted in poor performance for Norfolk Southern and Republic Services. We sold our position in Norfolk Southern during the reporting period.
Portfolio Composition
| | | | |
By sector | | | | |
Information Technology | | | 26.4 | % |
Health Care | | | 14.3 | |
Energy | | | 11.9 | |
Consumer Discretionary | | | 10.6 | |
Financials | | | 9.9 | |
Industrials | | | 9.3 | |
Consumer Staples | | | 7.4 | |
Materials | | | 5.3 | |
Utilities | | | 1.3 | |
Money Market Funds | | | | |
Plus Other Assets Less Liabilities | | | 3.6 | |
Top 10 Equity Holdings*
| | | | |
1. Apple Inc. | | | 4.6 | % |
2. Express Scripts Holding Co. | | | 3.0 | |
3. H.J. Heinz Co. | | | 2.8 | |
4. Oracle Corp. | | | 2.7 | |
5. Williams Cos., Inc. (The) | | | 2.7 | |
6. General Electric Co. | | | 2.7 | |
7. Target Corp. | | | 2.5 | |
8. Google Inc.-Class A | | | 2.5 | |
9. Wells Fargo & Co. | | | 2.5 | |
10. Automatic Data Processing, Inc. | | | 2.4 | |
| | | | |
Total Net Assets | | $ | 320.7 million | |
| |
Total Number of Holdings* | | | 56 | |
The Fund’s holdings are subject to change, and there is no assurance that the Fund will continue to hold any particular security.
*Excluding money market fund holdings.
4 Invesco Disciplined Equity Fund
United Technologies also underperformed as earnings moderated due to a more sluggish global economy. The Fund’s overweight exposure to natural gas-related companies within the energy sector also detracted from relative results.
In the telecommunication services and consumer staples sectors, relative underperformance was primarily due to companies that we did not own in the Fund, but that did very well within the S&P 500 Index. In both of these sectors, higher yielding companies performed very well, including telecommunication services providers AT&T and Verizon (not Fund holdings), as well as tobacco companies. Fund holdings that detracted on an absolute basis were Western Union, Nike, McDonalds, Oracle and Cisco.
Offsetting these areas of relative weakness, the Fund benefited from strong stock selection in the IT, health care, consumer discretionary and financial sectors. Within the IT sector, an overweight position in the IT services industry was the most significant contributor, with Fund holdings Visa, Alliance Data, Fiserv and Fidelity National each returning more than 25 percent. Apple also contributed to the Fund’s relative performance, as did our lack of exposure to poorly performing companies Hewlett Packard and Dell.
In the health care sector, our lack of biotechnology industry exposure detracted from relative performance. Fund holdings Express Scripts,
UnitedHealth Group and Covidien each had strong stock performance due to solid fundamentals and earnings. Additionally, aiding Express Scripts’ stock price was the completed accretive acquisition of Medco Health Solutions. In the consumer discretionary sector, TJX and Comcast performed well, reflecting strong fundamentals and attractive valuations. Within the financials sector, Fund holdings BlackRock, Wells Fargo and
Bank of America delivered strong returns.
While macro events such as broad-based monetary easing positively affected the markets, other major macro issues related to deficits and economies had far less impact. With valuations remaining low, it seemed as though many of these negative issues had been discounted. Furthermore, the many corporate balance sheets flush with cash offered a strong defense in a difficult environment. In fact, many companies initiated plans to return some of this cash to shareholders through dividend increases, share buybacks and accretive acquisitions.
We continue to believe that large-cap domestic equities offer attractive value and that high-quality companies are in strong financial shape, providing an attractive backdrop for investing in this space. As we expect volatility to persist, it is essential to stick to your investment discipline and practice patience. Our strategy of identifying high quality, market-leading companies with strong and recurring cash flows and opportunistically buying and selling based on valuation has allowed us to take advantage of this market to dynamically upgrade the companies in the portfolio. As always, we would like to thank you for your continued investment in Invesco Disciplined Equity Fund.
1 Source: Lipper Inc.
The views and opinions expressed in management’s discussion of Fund performance are those of Invesco Advisers, Inc. These views and opinions are subject to change at any time based on factors such as market and economic conditions. These views and opinions may not be relied upon as investment advice or recommendations, or as an offer for a particular security. The information is not a complete analysis of every aspect of any market, country, industry, security or the Fund. Statements of fact are from sources considered reliable, but Invesco Advisers, Inc. makes no representation or warranty as to their completeness or accuracy. Although historical performance is no guarantee of future results, these insights may help you understand our investment management philosophy.
See important Fund and, if applicable, index disclosures later in this report.
| | |
 | | Patricia Bannan Chartered Financial Analyst, portfolio manager, is manager of Invesco Disciplined |
| Equity Fund. She joined Invesco in 2007. Ms. Bannan earned a BS in business administration with a concentration in economics from the Whittemore School of Business and Economics at the University of New Hampshire. |
| | |
 | | Paul McPheeters Chartered Financial Analyst, portfolio manager, is manager of Invesco Disciplined |
| Equity Fund. He joined Invesco in 1997. Mr. McPheeters earned a BS in chemical engineering from Colorado School of Mines. |
5 Invesco Disciplined Equity Fund
Your Fund’s Long-Term Performance
Results of a $10,000 Investment
Fund data from 12/1/05, index data from 11/30/05
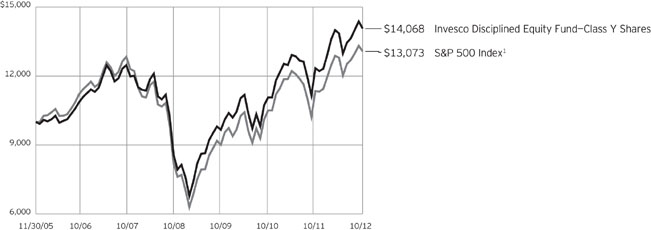
1 Source(s): Invesco, S&P-Dow Jones via FactSet Research Systems Inc.
Past performance cannot guarantee comparable future results.
The data shown in the chart include reinvested distributions and Fund expenses including management fees.
Index results include reinvested dividends. Performance of the peer group, if applicable, reflects fund expenses and management fees; performance of a market index does not. Performance
shown in the chart and table(s) does not reflect deduction of taxes a shareholder would pay on Fund distributions or sale of Fund shares.
Average Annual Total Returns
As of 10/31/12
| | | | |
Class Y Shares | | | | |
Inception (12/1/05) | | | 5.06 | % |
5 Years | | | 2.44 | |
1 Year | | | 14.05 | |
Average Annual Total Returns
As of 9/30/12, the most recent calendar quarter-end
| | | | |
Class Y Shares | | | | |
Inception (12/1/05) | | | 5.46 | % |
5 Years | | | 3.14 | |
1 Year | | | 28.83 | |
Effective September 21, 2009, Institutional Class shares of Atlantic Whitehall Equity Income Fund (the predecessor fund) were reorganized into Class Y shares of Invesco Disciplined Equity Fund. Returns shown prior to that date are those of the predecessor fund. Returns since that date are those of Class Y shares of Invesco Disciplined Equity Fund. Class Y share returns will differ from the predecessor fund because of different expenses.
The performance data quoted represent past performance and cannot guarantee comparable future results; current performance may be lower or higher. Please visit invesco.com/performance for the most recent month-end performance. Performance figures reflect reinvested
distributions, changes in net asset value and the effect of the maximum sales charge unless otherwise stated. Investment return and principal value will fluctuate so that you may have a gain or loss when you sell shares.
The total annual Fund operating expense ratio set forth in the most recent Fund prospectus as of the date of this report for Class Y shares was 0.81%. The expense ratios presented above may vary from the expense ratios presented in other sections of this report that are based on expenses incurred during the period covered by this report.
Class Y shares do not have a front-end sales charge or a CDSC; therefore, performance is at net asset value.
6 Invesco Disciplined Equity Fund
Invesco Disciplined Equity Fund’s investment objective is long-term capital appreciation and, secondarily, current income.
| n | | Unless otherwise stated, information presented in this report is as of October 31, 2012, and is based on total net assets. |
| n | | Unless otherwise noted, all data provided by Invesco. |
| n | | To access your Fund’s reports/prospectus, visit invesco.com/fundreports. |
About share classes
| n | | Class Y shares are available to only certain investors. Please see the prospectus for more information. |
Principal risks of investing in the Fund
| n | | Credit risk. The issuer of instruments in which the Fund invests may be unable to meet interest and/or principal payments, thereby causing its instruments to decrease in value and lowering the issuer’s credit rating. |
| n | | Foreign securities risk. The Fund’s foreign investments may be affected by changes in a foreign country’s exchange rates, political and social instability, changes in economic or taxation policies, difficulties when enforcing obligations, decreased liquidity, and increased volatility. Foreign companies may be subject to less regulation resulting in less publicly available information about the companies. |
| n | | Interest rate risk. Interest rate risk refers to the risk that bond prices generally fall as interest rates rise; conversely, bond prices generally rise as interest rates fall. Specific bonds differ in their sensitivity to changes in interest rates depending on their individual characteristics, including duration. |
| n | | Management risk. The investment techniques and risk analysis used by the Fund’s portfolio managers may not produce the desired results. |
| n | | Market risk. The prices of and the income generated by the Fund’s securities may decline in response to, among other things, investor sentiment, general economic and market conditions, regional or global instability, and currency and interest rate fluctuations. |
| n | | Synthetic securities risk. Fluctuations in the values of synthetic securities may not correlate perfectly with the instruments they are designed to replicate. Synthetic securities may be subject to interest rate changes, market price fluctuations, counterparty risk and liquidity risk. |
About indexes used in this report
| n | | The S&P 500® Index is an unmanaged index considered representative of the US stock market. |
| n | | The Fund is not managed to track the performance of any particular index, including the index(es) defined here, and consequently, the performance of the Fund may deviate significantly from the performance of the index(es). |
| n | | A direct investment cannot be made in an index. Unless otherwise indicated, index results include reinvested dividends, and they do not reflect sales charges. Performance of the peer group, if applicable, reflects fund expenses; performance of a market index does not. |
Other information
| n | | The returns shown in management’s discussion of Fund performance are based on net asset values calculated for shareholder transactions. Generally accepted accounting principles require adjustments to be made to the net assets of the Fund at period end for financial reporting purposes, and as such, the net asset values for shareholder transactions and the returns based on those net asset values may differ from the net asset values and returns reported in the Financial Highlights. |
| n | | Industry classifications used in this report are generally according to the Global Industry Classification Standard, which was developed by and is the exclusive property and a service mark of MSCI Inc. and Standard & Poor’s. |
This report must be accompanied or preceded by a currently effective Fund prospectus, which contains more complete information, including sales charges and expenses. Investors should read it carefully before investing.
NOT FDIC INSURED | MAY LOSE VALUE | NO BANK GUARANTEE
| | | | |
Fund Nasdaq Symbols | |
| |
Class Y Shares | | | AWEIX | |
7 Invesco Disciplined Equity Fund
Schedule of Investments(a)
October 31, 2012
| | | | | | | | |
| | | Shares | | | Value | |
Common Stocks–96.37% | |
Aerospace & Defense–2.16% | |
United Technologies Corp. | | | 88,458 | | | $ | 6,913,877 | |
|
Apparel Retail–0.90% | |
TJX Cos., Inc. (The) | | | 69,193 | | | | 2,880,505 | |
|
Apparel, Accessories & Luxury Goods–1.57% | |
VF Corp. | | | 32,273 | | | | 5,050,079 | |
|
Asset Management & Custody Banks–1.02% | |
BlackRock, Inc. | | | 17,296 | | | | 3,280,705 | |
|
Automobile Manufacturers–0.91% | |
Ford Motor Co. | | | 261,755 | | | | 2,921,186 | |
|
Cable & Satellite–1.83% | |
Comcast Corp.–Class A | | | 156,784 | | | | 5,880,968 | |
|
Communications Equipment–1.88% | |
Cisco Systems, Inc. | | | 351,516 | | | | 6,024,984 | |
|
Computer Hardware–4.61% | |
Apple Inc. | | | 24,850 | | | | 14,788,235 | |
|
Computer Storage & Peripherals–1.69% | |
EMC Corp.(b) | | | 133,430 | | | | 3,258,361 | |
NetApp, Inc.(b) | | | 79,920 | | | | 2,149,848 | |
| | | | | | | | 5,408,209 | |
|
Data Processing & Outsourced Services–8.52% | |
Alliance Data Systems Corp.(b) | | | 33,750 | | | | 4,827,938 | |
Automatic Data Processing, Inc. | | | 132,754 | | | | 7,671,854 | |
Fidelity National Information Services, Inc. | | | 91,303 | | | | 3,001,130 | |
Fiserv, Inc.(b) | | | 74,763 | | | | 5,602,739 | |
Visa Inc.–Class A | | | 27,107 | | | | 3,761,367 | |
Western Union Co. (The) | | | 193,539 | | | | 2,457,945 | |
| | | | | | | | 27,322,973 | |
|
Diversified Banks–2.94% | |
U.S. Bancorp | | | 48,000 | | | | 1,594,080 | |
Wells Fargo & Co. | | | 232,983 | | | | 7,849,197 | |
| | | | | | | | 9,443,277 | |
|
Diversified Metals & Mining–1.41% | |
Freeport–McMoRan Copper & Gold Inc. | | | 116,705 | | | | 4,537,490 | |
|
Drug Retail–3.20% | |
CVS Caremark Corp. | | | 101,741 | | | | 4,720,782 | |
Walgreen Co. | | | 157,260 | | | | 5,540,270 | |
| | | | | | | | 10,261,052 | |
|
Environmental & Facilities Services–1.75% | |
Republic Services, Inc. | | | 197,435 | | | | 5,597,282 | |
| | | | | | | | |
| | | Shares | | | Value | |
Footwear–0.80% | |
NIKE, Inc.–Class B | | | 28,026 | | | $ | 2,561,016 | |
|
General Merchandise Stores–2.46% | |
Target Corp. | | | 123,649 | | | | 7,882,624 | |
|
Health Care Equipment–3.74% | |
Covidien PLC | | | 102,715 | | | | 5,644,189 | |
Stryker Corp. | | | 120,690 | | | | 6,348,294 | |
| | | | | | | | 11,992,483 | |
|
Health Care Services–2.96% | |
Express Scripts Holding Co.(b) | | | 154,019 | | | | 9,478,329 | |
|
Industrial Conglomerates–4.59% | |
Danaher Corp. | | | 120,242 | | | | 6,220,119 | |
General Electric Co. | | | 403,149 | | | | 8,490,318 | |
| | | | | | | | 14,710,437 | |
|
Industrial Gases–2.27% | |
Praxair, Inc. | | | 68,623 | | | | 7,288,449 | |
|
Internet Software & Services–2.46% | |
Google Inc.–Class A(b) | | | 11,584 | | | | 7,877,120 | |
|
Managed Health Care–4.14% | |
Aetna Inc. | | | 132,909 | | | | 5,808,123 | |
UnitedHealth Group Inc. | | | 133,260 | | | | 7,462,560 | |
| | | | | | | | 13,270,683 | |
|
Metal & Glass Containers–1.65% | |
Crown Holdings, Inc.(b) | | | 138,420 | | | | 5,294,565 | |
|
Multi-Utilities–1.31% | |
PG&E Corp. | | | 98,627 | | | | 4,193,620 | |
|
Oil & Gas Exploration & Production–6.18% | |
Anadarko Petroleum Corp. | | | 101,984 | | | | 7,017,519 | |
Apache Corp. | | | 66,286 | | | | 5,485,167 | |
EQT Corp. | | | 48,613 | | | | 2,947,406 | |
QEP Resources Inc. | | | 151,047 | | | | 4,380,363 | |
| | | | | | | | 19,830,455 | |
|
Oil & Gas Storage & Transportation–5.68% | |
Kinder Morgan Inc. | | | 161,895 | | | | 5,619,375 | |
Spectra Energy Corp. | | | 139,911 | | | | 4,039,231 | |
Williams Cos., Inc. (The) | | | 244,086 | | | | 8,540,569 | |
| | | | | | | | 18,199,175 | |
|
Other Diversified Financial Services–4.53% | |
Bank of America Corp. | | | 420,800 | | | | 3,921,856 | |
Citigroup Inc. | | | 90,048 | | | | 3,366,895 | |
JPMorgan Chase & Co. | | | 173,741 | | | | 7,241,525 | |
| | | | | | | | 14,530,276 | |
See accompanying Notes to Financial Statements which are an integral part of the financial statements.
8 Invesco Disciplined Equity Fund
| | | | | | | | |
| | | Shares | | | Value | |
Packaged Foods & Meats–2.82% | |
H.J. Heinz Co. | | | 157,386 | | | $ | 9,051,269 | |
|
Pharmaceuticals–3.51% | |
Johnson & Johnson | | | 69,555 | | | | 4,925,885 | |
Merck & Co., Inc. | | | 138,887 | | | | 6,337,414 | |
| | | | | | | | 11,263,299 | |
|
Railroads–0.80% | |
Union Pacific Corp. | | | 20,845 | | | | 2,564,560 | |
|
Restaurants–2.08% | |
McDonald’s Corp. | | | 77,015 | | | | 6,684,902 | |
|
Soft Drinks–1.40% | |
PepsiCo, Inc. | | | 64,773 | | | | 4,484,883 | |
|
Specialized Finance–1.38% | |
CME Group Inc. | | | 78,845 | | | | 4,409,801 | |
| | | | | | | | |
| | | Shares | | | Value | |
Systems Software–7.22% | |
BMC Software, Inc.(b) | | | 88,024 | | | $ | 3,582,577 | |
Check Point Software Technologies Ltd. (Israel)(b) | | | 94,175 | | | | 4,193,612 | |
Microsoft Corp. | | | 232,153 | | | | 6,624,486 | |
Oracle Corp. | | | 282,140 | | | | 8,760,447 | |
| | | | | | | | 23,161,122 | |
Total Common Stocks
(Cost $255,270,934) | | | | 309,039,890 | |
|
Money Market Funds–3.18% | |
Liquid Assets Portfolio–Institutional Class(c) | | | 5,091,290 | | | | 5,091,290 | |
Premier Portfolio–Institutional Class(c) | | | 5,091,291 | | | | 5,091,291 | |
Total Money Market Funds
(Cost $10,182,581) | | | | 10,182,581 | |
TOTAL INVESTMENTS–99.55%
(Cost $265,453,515) | | | | 319,222,471 | |
OTHER ASSETS LESS LIABILITIES–0.45% | | | | 1,458,124 | |
NET ASSETS–100.00% | | | $ | 320,680,595 | |
Notes to Schedule of Investments:
| (a) | Industry and/or sector classifications used in this report are generally according to the Global Industry Classification Standard, which was developed by and is the exclusive property and a service mark of MSCI Inc. and Standard & Poor’s. |
| (b) | Non-income producing security. |
| (c) | The money market fund and the Fund are affiliated by having the same investment adviser. |
See accompanying Notes to Financial Statements which are an integral part of the financial statements.
9 Invesco Disciplined Equity Fund
Statement of Assets and Liabilities
October 31, 2012
| | | | |
Assets: | |
Investments, at value (Cost $255,270,934) | | $ | 309,039,890 | |
Investments in affiliated money market funds, at value and cost | | | 10,182,581 | |
Total investments, at value (Cost $265,453,515) | | | 319,222,471 | |
Receivable for: | | | | |
Investments sold | | | 1,351,376 | |
Fund shares sold | | | 204,657 | |
Dividends | | | 180,838 | |
Investment for trustee deferred compensation and retirement plans | | | 12,073 | |
Other assets | | | 12,249 | |
Total assets | | | 320,983,664 | |
|
Liabilities: | |
Payable for: | | | | |
Fund shares reacquired | | | 200,310 | |
Accrued fees to affiliates | | | 32,990 | |
Accrued other operating expenses | | | 43,547 | |
Trustee deferred compensation and retirement plans | | | 26,222 | |
Total liabilities | | | 303,069 | |
Net assets applicable to shares outstanding | | $ | 320,680,595 | |
|
Net assets consist of: | |
Shares of beneficial interest | | $ | 255,353,543 | |
Undistributed net investment income | | | 2,500,532 | |
Undistributed net realized gain | | | 9,057,564 | |
Unrealized appreciation | | | 53,768,956 | |
| | | $ | 320,680,595 | |
| | | | |
Net Assets: | |
Class Y | | $ | 320,680,595 | |
|
Shares outstanding, $0.001 par value per share,
with an unlimited number of shares authorized: | |
Class Y | | | 27,215,092 | |
Class Y: | | | | |
Net asset value and offering price per share | | $ | 11.78 | |
See accompanying Notes to Financial Statements which are an integral part of the financial statements.
10 Invesco Disciplined Equity Fund
Statement of Operations
For the year ended October 31, 2012
| | | | |
Investment income: | |
Dividends | | $ | 5,208,792 | |
Dividends from affiliated money market funds | | | 14,459 | |
Total investment income | | | 5,223,251 | |
| |
Expenses: | | | | |
Advisory fees | | | 1,952,148 | |
Administrative services fees | | | 64,869 | |
Custodian fees | | | 10,420 | |
Transfer agent fees | | | 85,489 | |
Trustees’ and officers’ fees and benefits | | | 36,497 | |
Other | | | 78,046 | |
Total expenses | | | 2,227,469 | |
Less: Fees waived | | | (14,857 | ) |
Net expenses | | | 2,212,612 | |
Net investment income | | | 3,010,639 | |
| |
Realized and unrealized gain from: | | | | |
Net realized gain from investment securities | | | 11,415,029 | |
Change in net unrealized appreciation of investment securities | | | 21,534,689 | |
Net realized and unrealized gain | | | 32,949,718 | |
Net increase in net assets resulting from operations | | $ | 35,960,357 | |
See accompanying Notes to Financial Statements which are an integral part of the financial statements.
11 Invesco Disciplined Equity Fund
Statement of Changes in Net Assets
For the years ended October 31, 2012 and 2011
| | | | | | | | |
| | | 2012 | | | 2011 | |
Operations: | | | | | |
Net investment income | | $ | 3,010,639 | | | $ | 1,885,739 | |
Net realized gain | | | 11,415,029 | | | | 11,170,432 | |
Change in net unrealized appreciation | | | 21,534,689 | | | | 9,291,231 | |
Net increase in net assets resulting from operations | | | 35,960,357 | | | | 22,347,402 | |
Distributions to shareholders from net investment income — Class Y | | | (1,953,835 | ) | | | (1,879,369 | ) |
Distributions to shareholders from net realized gains — Class Y | | | (4,146,472 | ) | | | — | |
| | |
Share transactions–net: | | | | | | | | |
Class Y | | | 63,109,023 | | | | 18,524,386 | |
Net increase in net assets | | | 92,969,073 | | | | 38,992,419 | |
| | |
Net assets: | | | | | | | | |
Beginning of year | | | 227,711,522 | | | | 188,719,103 | |
End of year (includes undistributed net investment income of $2,500,532 and $1,443,728, respectively) | | $ | 320,680,595 | | | $ | 227,711,522 | |
Notes to Financial Statements
October 31, 2012
NOTE 1—Significant Accounting Policies
Invesco Disciplined Equity Fund (the “Fund”) is a series portfolio of AIM Equity Funds (Invesco Equity Funds) (the “Trust”). The Trust is a Delaware statutory trust registered under the Investment Company Act of 1940, as amended (the “1940 Act”), as an open-end series management investment company consisting of five separate portfolios, each authorized to issue an unlimited number of shares of beneficial interest. The assets, liabilities and operations of each portfolio are accounted for separately. Information presented in these financial statements pertains only to the Fund. Matters affecting each portfolio or class will be voted on exclusively by the shareholders of such portfolio or class.
The Fund’s investment objective is long-term capital appreciation and, secondarily, current income.
The Fund currently consists of one class of shares, Class Y. Class Y shares are sold at net asset value.
The following is a summary of the significant accounting policies followed by the Fund in the preparation of its financial statements.
| A. | Security Valuations — Securities, including restricted securities, are valued according to the following policy. |
A security listed or traded on an exchange (except convertible bonds) is valued at its last sales price or official closing price as of the close of the customary trading session on the exchange where the security is principally traded, or lacking any sales or official closing price on a particular day, the security may be valued at the closing bid price on that day. Securities traded in the over-the-counter market are valued based on prices furnished by independent pricing services or market makers. When such securities are valued by an independent pricing service they may be considered fair valued. Futures contracts are valued at the final settlement price set by an exchange on which they are principally traded. Listed options are valued at the mean between the last bid and ask prices from the exchange on which they are principally traded. Options not listed on an exchange are valued by an independent source at the mean between the last bid and ask prices. For purposes of determining net asset value per share, futures and option contracts generally are valued 15 minutes after the close of the customary trading session of the New York Stock Exchange (“NYSE”).
Investments in open-end and closed-end registered investment companies that do not trade on an exchange are valued at the end of day net asset value per share. Investments in open-end and closed-end registered investment companies that trade on an exchange are valued at the last sales price or official closing price as of the close of the customary trading session on the exchange where the security is principally traded.
Debt obligations (including convertible bonds) and unlisted equities are fair valued using an evaluated quote provided by an independent pricing service. Evaluated quotes provided by the pricing service may be determined without exclusive reliance on quoted prices, and may reflect appropriate factors such as institution-size trading in similar groups of securities, developments related to specific securities, dividend rate, yield, quality, type of issue, coupon rate, maturity, individual trading characteristics and other market data. Debt securities are subject to interest rate and credit risks. In addition, all debt securities involve some risk of default with respect to interest and/or principal payments.
Foreign securities (including foreign exchange contracts) are converted into U.S. dollar amounts using the applicable exchange rates as of the close of the NYSE. If market quotations are available and reliable for foreign exchange traded equity securities, the securities will be valued at the market quotations. Because trading hours for certain foreign securities end before the close of the NYSE, closing market quotations may become unreliable. If between the time trading ends on a particular security and the close of the customary trading session on the NYSE, events occur that are significant and make the closing price unreliable, the Fund may fair value the security. If the event is likely to have affected the closing price of the security, the security will be valued at fair value in good faith using procedures approved by the Board of Trustees. Adjustments to closing prices to reflect fair value may also be based on a screening process of an independent pricing service to indicate the degree of certainty, based on historical data, that the closing price in the principal market where a foreign security trade is not the current value as of the close of the NYSE. Foreign securities meeting the approved degree of certainty that the price is not reflective of current value will be priced at the indication of fair value from the independent pricing service. Multiple factors may be considered by the independent pricing service in determining adjustments to
12 Invesco Disciplined Equity Fund
reflect fair value and may include information relating to sector indices, American Depositary Receipts and domestic and foreign index futures. Foreign securities may have additional risks including exchange rate changes, potential for sharply devalued currencies and high inflation, political and economic upheaval, the relative lack of issuer information, relatively low market liquidity and the potential lack of strict financial and accounting controls and standards.
Securities for which market prices are not provided by any of the above methods may be valued based upon quotes furnished by independent sources. The last bid price may be used to value equity securities. The mean between the last bid and asked prices is used to value debt obligations, including corporate loans.
Securities for which market quotations are not readily available or are unreliable are valued at fair value as determined in good faith by or under the supervision of the Trust’s officers following procedures approved by the Board of Trustees. Issuer specific events, market trends, bid/ask quotes of brokers and information providers and other market data may be reviewed in the course of making a good faith determination of a security’s fair value.
Valuations change in response to many factors including the historical and prospective earnings of the issuer, the value of the issuer’s assets, general economic conditions, interest rates, investor perceptions and market liquidity. Because of the inherent uncertainties of valuation, the values reflected in the financial statements may materially differ from the value received upon actual sale of those investments.
| B. | Securities Transactions and Investment Income — Securities transactions are accounted for on a trade date basis. Realized gains or losses on sales are computed on the basis of specific identification of the securities sold. Interest income is recorded on the accrual basis from settlement date. Dividend income (net of withholding tax, if any) is recorded on the ex-dividend date. |
The Fund may periodically participate in litigation related to Fund investments. As such, the Fund may receive proceeds from litigation settlements. Any proceeds received are included in the Statement of Operations as realized gain (loss) for investments no longer held and as unrealized gain (loss) for investments still held.
Brokerage commissions and mark ups are considered transaction costs and are recorded as an increase to the cost basis of securities purchased and/or a reduction of proceeds on a sale of securities. Such transaction costs are included in the determination of net realized and unrealized gain (loss) from investment securities reported in the Statement of Operations and the Statement of Changes in Net Assets and the net realized and unrealized gains (losses) on securities per share in the Financial Highlights. Transaction costs are included in the calculation of the Fund’s net asset value and, accordingly, they reduce the Fund’s total returns. These transaction costs are not considered operating expenses and are not reflected in net investment income reported in the Statement of Operations and Statement of Changes in Net Assets, or the net investment income per share and ratios of expenses and net investment income reported in the Financial Highlights, nor are they limited by any expense limitation arrangements between the Fund and the investment adviser.
| C. | Country Determination — For the purposes of making investment selection decisions and presentation in the Schedule of Investments, the investment adviser may determine the country in which an issuer is located and/or credit risk exposure based on various factors. These factors include the laws of the country under which the issuer is organized, where the issuer maintains a principal office, the country in which the issuer derives 50% or more of its total revenues and the country that has the primary market for the issuer’s securities, as well as other criteria. Among the other criteria that may be evaluated for making this determination are the country in which the issuer maintains 50% or more of its assets, the type of security, financial guarantees and enhancements, the nature of the collateral and the sponsor organization. Country of issuer and/or credit risk exposure has been determined to be the United States of America, unless otherwise noted. |
| D. | Distributions — Distributions from income and net realized capital gain, if any, are generally declared and paid annually and recorded on the ex-dividend date. The Fund may elect to treat a portion of the proceeds from redemptions as distributions for federal income tax purposes. |
| E. | Federal Income Taxes — The Fund intends to comply with the requirements of Subchapter M of the Internal Revenue Code necessary to qualify as a regulated investment company and to distribute substantially all of the Fund’s taxable earnings to shareholders. As such, the Fund will not be subject to federal income taxes on otherwise taxable income (including net realized capital gain) that is distributed to shareholders. Therefore, no provision for federal income taxes is recorded in the financial statements. |
The Fund files tax returns in the U.S. Federal jurisdiction and certain other jurisdictions. Generally, the Fund is subject to examinations by such taxing authorities for up to three years after the filing of the return for the tax period.
| F. | Accounting Estimates — The preparation of financial statements in conformity with accounting principles generally accepted in the United States of America (“GAAP”) requires management to make estimates and assumptions that affect the reported amounts of assets and liabilities at the date of the financial statements and the reported amounts of revenues and expenses during the reporting period including estimates and assumptions related to taxation. Actual results could differ from those estimates by a significant amount. In addition, the Fund monitors for material events or transactions that may occur or become known after the period-end date and before the date the financial statements are released to print. |
| G. | Indemnifications — Under the Trust’s organizational documents, each Trustee, officer, employee or other agent of the Trust is indemnified against certain liabilities that may arise out of the performance of their duties to the Fund. Additionally, in the normal course of business, the Fund enters into contracts, including the Fund’s servicing agreements, that contain a variety of indemnification clauses. The Fund’s maximum exposure under these arrangements is unknown as this would involve future claims that may be made against the Fund that have not yet occurred. The risk of material loss as a result of such indemnification claims is considered remote. |
13 Invesco Disciplined Equity Fund
NOTE 2—Advisory Fees and Other Fees Paid to Affiliates
The Trust has entered into a master investment advisory agreement with Invesco Advisers, Inc. (the “Adviser” or “Invesco”). Under the terms of the investment advisory agreement, the Fund pays an advisory fee to the Adviser based on the annual rate of the Fund’s average daily net assets as follows:
| | | | | | |
| Average Daily Net Assets | | Rate |
First $250 million | | | 0 | .695% | | |
Next $250 million | | | 0 | .67% | | |
Next $500 million | | | 0 | .645% | | |
Next $1.5 billion | | | 0 | .62% | | |
Next $2.5 billion | | | 0 | .595% | | |
Next $2.5 billion | | | 0 | .57% | | |
Next $2.5 billion | | | 0 | .545% | | |
Over $10 billion | | | 0 | .52% | | |
Under the terms of a master sub-advisory agreement between the Adviser and each of Invesco Asset Management Deutschland GmbH, Invesco Asset Management Limited, Invesco Asset Management (Japan) Limited, Invesco Australia Limited, Invesco Hong Kong Limited, Invesco Senior Secured Management, Inc. and Invesco Canada Ltd. (collectively, the “Affiliated Sub-Advisers”) the Adviser, not the Fund, may pay 40% of the fees paid to the Adviser to any such Affiliated Sub-Adviser(s) that provide discretionary investment management services to the Fund based on the percentage of assets allocated to such Sub-Adviser(s).
The Adviser has contractually agreed, through at least June 30, 2013, to waive advisory fees and/or reimburse expenses to the extent necessary to limit total annual fund operating expenses after fee waiver and/or expense reimbursement (excluding certain items discussed below) of Class Y shares to 1.75% of average daily net assets. In determining the Adviser’s obligation to waive advisory fees and/or reimburse expenses, the following expenses are not taken into account, and could cause the total annual fund operating expenses after fee waiver and/or expense reimbursement to exceed the numbers reflected above: (1) interest; (2) taxes; (3) dividend expense on short sales; (4) extraordinary or non-routine items, including litigation expenses; and (5) expenses that the Fund has incurred but did not actually pay because of an expense offset arrangement. Unless the Board of Trustees and Invesco mutually agree to amend or continue the fee waiver agreement, it will terminate on June 30, 2013. The Adviser did not waive fees and/or reimburse expenses during the period under this expense limitation.
Further, the Adviser has contractually agreed, through at least June 30, 2013, to waive the advisory fee payable by the Fund in an amount equal to 100% of the net advisory fees the Adviser receives from the affiliated money market funds on investments by the Fund of uninvested cash in such affiliated money market funds.
For the year ended October 31, 2012, the Adviser waived advisory fees of $14,857.
The Trust has entered into a master administrative services agreement with Invesco pursuant to which the Fund has agreed to pay Invesco for certain administrative costs incurred in providing accounting services to the Fund. For the year ended October 31, 2012, expenses incurred under the agreement are shown in the Statement of Operations as Administrative services fees.
The Trust has entered into a transfer agency and service agreement with Invesco Investment Services, Inc. (“IIS”) pursuant to which the Fund has agreed to pay IIS a fee for providing transfer agency and shareholder services to the Fund and reimburse IIS for certain expenses incurred by IIS in the course of providing such services. IIS may make payments to intermediaries that provide omnibus account services, sub-accounting services and/or networking services. All fees payable by IIS to intermediaries that provide omnibus account services or sub-accounting are charged back to the Fund, subject to certain limitations approved by the Trust’s Board of Trustees. For the year ended October 31, 2012, expenses incurred under the agreement are shown in the Statement of Operations as Transfer agent fees.
The Trust has entered into master distribution agreements with Invesco Distributors, Inc. (“IDI”) to serve as the distributor for the Class Y shares of the Fund. The Fund is not charged any fees pursuant with the distribution agreement with IDI.
Certain officers and trustees of the Trust are officers and directors of the Adviser, IIS and/or IDI.
NOTE 3—Additional Valuation Information
GAAP defines fair value as the price that would be received to sell an asset or paid to transfer a liability in an orderly transaction between market participants at the measurement date, under current market conditions. GAAP establishes a hierarchy that prioritizes the inputs to valuation methods giving the highest priority to readily available unadjusted quoted prices in an active market for identical assets (Level 1) and the lowest priority to significant unobservable inputs (Level 3) generally when market prices are not readily available or are unreliable. Based on the valuation inputs, the securities or other investments are tiered into one of three levels. Changes in valuation methods may result in transfers in or out of an investment’s assigned level:
| | Level 1 — | Prices are determined using quoted prices in an active market for identical assets. |
| | Level 2 — | Prices are determined using other significant observable inputs. Observable inputs are inputs that other market participants may use in pricing a security. These may include quoted prices for similar securities, interest rates, prepayment speeds, credit risk, yield curves, loss severities, default rates, discount rates, volatilities and others. |
| | Level 3 — | Prices are determined using significant unobservable inputs. In situations where quoted prices or observable inputs are unavailable (for example, when there is little or no market activity for an investment at the end of the period), unobservable inputs may be used. Unobservable inputs reflect the Fund’s own assumptions about the factors market participants would use in determining fair value of the securities or instruments and would be based on the best available information. |
14 Invesco Disciplined Equity Fund
The following is a summary of the tiered valuation input levels, as of October 31, 2012. The level assigned to the securities valuations may not be an indication of the risk or liquidity associated with investing in those securities. Because of the inherent uncertainties of valuation, the values reflected in the financial statements may materially differ from the value received upon actual sale of those investments.
| | | | | | | | | | | | | | | | |
| | | Level 1 | | | Level 2 | | | Level 3 | | | Total | |
Equity Securities | | $ | 319,222,471 | | | $ | — | | | $ | — | | | $ | 319,222,471 | |
NOTE 4—Trustees’ and Officers’ Fees and Benefits
“Trustees’ and Officers’ Fees and Benefits” include amounts accrued by the Fund to pay remuneration to certain Trustees and Officers of the Fund. Trustees have the option to defer compensation payable by the Fund, and “Trustees’ and Officers’ Fees and Benefits” also include amounts accrued by the Fund to fund such deferred compensation amounts. Those Trustees who defer compensation have the option to select various Invesco Funds in which their deferral accounts shall be deemed to be invested. Finally, certain current Trustees are eligible to participate in a retirement plan that provides for benefits to be paid upon retirement to Trustees over a period of time based on the number of years of service. The Fund may have certain former Trustees who also participate in a retirement plan and receive benefits under such plan. “Trustees’ and Officers’ Fees and Benefits” include amounts accrued by the Fund to fund such retirement benefits. Obligations under the deferred compensation and retirement plans represent unsecured claims against the general assets of the Fund.
NOTE 5—Cash Balances
The Fund is permitted to temporarily carry a negative or overdrawn balance in its account with State Street Bank and Trust Company, the custodian bank. Such balances, if any at period end, are shown in the Statement of Assets and Liabilities under the payable caption Amount due custodian. To compensate the custodian bank for such overdrafts, the overdrawn Fund may either (1) leave funds as a compensating balance in the account so the custodian bank can be compensated by earning the additional interest; or (2) compensate by paying the custodian bank at a rate agreed upon by the custodian bank and Invesco, not to exceed the contractually agreed upon rate.
NOTE 6—Distributions to Shareholders and Tax Components of Net Assets
Tax Character of Distributions to Shareholders Paid During the Years Ended October 31, 2012 and 2011:
| | | | | | | | |
| | | 2012 | | | 2011 | |
Ordinary income | | $ | 1,953,835 | | | $ | 1,879,369 | |
Long-term capital gain | | | 4,146,472 | | | | — | |
Total distributions | | $ | 6,100,307 | | | $ | 1,879,369 | |
Tax Components of Net Assets at Period-End:
| | | | |
| | | 2012 | |
Undistributed ordinary income | | $ | 2,525,364 | |
Undistributed long-term gain | | | 11,400,036 | |
Net unrealized appreciation — investments | | | 51,426,484 | |
Temporary book/tax differences | | | (24,832 | ) |
Shares of beneficial interest | | | 255,353,543 | |
Total net assets | | $ | 320,680,595 | |
The difference between book-basis and tax-basis unrealized appreciation (depreciation) is due to differences in the timing of recognition of gains and losses on investments for tax and book purposes. The Fund’s net unrealized appreciation (depreciation) difference is attributable primarily to wash sales.
The temporary book/tax differences are a result of timing differences between book and tax recognition of income and/or expenses. The Fund’s temporary book/tax differences are the result of the trustee deferral of compensation and retirement plan benefits.
Capital loss carryforward is calculated and reported as of a specific date. Results of transactions and other activity after that date may affect the amount of capital loss carryforward actually available for the Fund to utilize. The Regulated Investment Company Modernization Act of 2010 (the “Act”) eliminated the eight-year carryover period for capital losses that arise in taxable years beginning after its enactment date of December 22, 2010. Consequently, these capital losses can be carried forward for an unlimited period. However, capital losses with an expiration period may not be used to offset capital gains until all net capital losses without an expiration date have been utilized. Additionally, post-enactment capital loss carryovers will retain their character as either short-term or long-term capital losses instead of as short-term capital losses as under prior law. The ability to utilize capital loss carryforward in the future may be limited under the Internal Revenue Code and related regulations based on the results of future transactions.
The Fund does not have a capital loss carryforward as of October 31, 2012.
15 Invesco Disciplined Equity Fund
NOTE 7—Investment Securities
The aggregate amount of investment securities (other than short-term securities, U.S. Treasury obligations and money market funds, if any) purchased and sold by the Fund during the year ended October 31, 2012 was $118,309,790 and $60,612,666, respectively. Cost of investments on a tax basis includes the adjustments for financial reporting purposes as of the most recently completed federal income tax reporting period-end.
| | | | |
| Unrealized Appreciation (Depreciation) of Investment Securities on a Tax Basis | |
Aggregate unrealized appreciation of investment securities | | $ | 55,724,628 | |
Aggregate unrealized (depreciation) of investment securities | | | (4,298,144 | ) |
Net unrealized appreciation of investment securities | | $ | 51,426,484 | |
Cost of investments for tax purposes is $267,795,987.
NOTE 8—Share Information
| | | | | | | | | | | | | | | | |
| | | Summary of Share Activity | |
| | | Years ended October 31, | |
| | | 2012(a) | | | 2011 | |
| | | Shares | | | Amount | | | Shares | | | Amount | |
Sold: | | | | | | | | | | | | | | | | |
Class Y | | | 7,716,749 | | | $ | 85,730,527 | | | | 4,921,054 | | | $ | 51,082,933 | |
Issued as reinvestment of dividends: | | | | | | | | | | | | | | | | |
Class Y | | | 494,629 | | | | 5,104,575 | | | | 104,509 | | | | 1,049,274 | |
Reacquired: | | | | | | | | | | | | | | | | |
Class Y | | | (2,467,165 | ) | | | (27,726,079 | ) | | | (3,188,951 | ) | | | (33,607,821 | ) |
Net increase in share activity | | | 5,744,213 | | | $ | 63,109,023 | | | | 1,836,612 | | | $ | 18,524,386 | |
| (a) | There are entities that are record owners of more than 5% of the outstanding shares of the Fund and in the aggregate own 86% of the outstanding shares of the Fund. IDI has an agreement with these entities to sell Fund shares. The Fund, Invesco and/or Invesco affiliates may make payments to these entities, which are considered to be related to the Fund, for providing services to the Fund, Invesco and/or Invesco affiliates including but not limited to services such as securities brokerage, distribution, third party record keeping and account servicing. The Trust has no knowledge as to whether all or any portion of the shares owned of record by these entities are also owned beneficially. |
NOTE 9—Financial Highlights
The following schedule presents financial highlights for a share of the Fund outstanding throughout the periods indicated.
| | | | | | | | | | | | | | | | | | | | | | | | | | | | | | | | | | | | | | | | | | | | | | | | | | | | | | | | |
| | | Net asset
value,
beginning
of period | | | Net
investment
income | | | Net gains
(losses)
on securities
(both
realized and
unrealized) | | | Total from
investment
operations | | | Dividends
from net
investment
income | | | Distributions
from net
realized
gains | | | Total
distributions | | | Net asset
value, end
of period | | | Total
return(a) | | | Net assets,
end of period
(000s omitted) | | | Ratio of
expenses
to average
net assets
with fee waivers
and/or expenses
absorbed | | | Ratio of
expenses
to average net
assets without
fee waivers
and/or expenses
absorbed | | | Ratio of net
investment
income
to average
net assets | | | Portfolio
turnover(b) | |
Class Y(c) | |
Year ended 10/31/12 | | $ | 10.61 | | | $ | 0.12 | (d) | | $ | 1.33 | | | $ | 1.45 | | | $ | (0.09 | ) | | $ | (0.19 | ) | | $ | (0.28 | ) | | $ | 11.78 | | | | 14.05 | % | | $ | 320,681 | | | | 0.78 | %(e) | | | 0.79 | %(e) | | | 1.07 | %(e) | | | 22 | % |
Year ended 10/31/11 | | | 9.61 | | | | 0.09 | (d) | | | 1.00 | | | | 1.09 | | | | (0.09 | ) | | | — | | | | (0.09 | ) | | | 10.61 | | | | 11.44 | | | | 227,712 | | | | 0.80 | | | | 0.81 | | | | 0.89 | | | | 38 | |
Year ended 10/31/10 | | | 8.47 | | | | 0.09 | (d) | | | 1.13 | | | | 1.22 | | | | (0.08 | ) | | | (0.00 | ) | | | (0.08 | ) | | | 9.61 | | | | 14.51 | | | | 188,719 | | | | 0.74 | | | | 0.75 | | | | 0.96 | | | | 34 | |
Eleven months ended 10/31/09 | | | 7.08 | | | | 0.08 | (d) | | | 1.43 | | | | 1.51 | | | | (0.12 | ) | | | (0.00 | ) | | | (0.12 | ) | | | 8.47 | | | | 21.80 | | | | 166,898 | | | | 1.12 | (f) | | | 1.33 | (f) | | | 1.16 | (f) | | | 44 | |
Year ended 11/30/08 | | | 11.89 | | | | 0.10 | | | | (3.71 | ) | | | (3.61 | ) | | | (0.13 | ) | | | (1.07 | ) | | | (1.20 | ) | | | 7.08 | | | | (33.81 | ) | | | 171,200 | | | | 1.04 | | | | 1.04 | | | | 0.95 | | | | 45 | |
Year ended 11/30/07 | | | 11.00 | | | | 0.11 | | | | 0.80 | | | | 0.91 | | | | (0.02 | ) | | | (0.00 | ) | | | (0.02 | ) | | | 11.89 | | | | 8.14 | | | | 284,846 | | | | 1.01 | | | | 1.05 | | | | 1.08 | | | | 95 | |
| (a) | Includes adjustments in accordance with accounting principles generally accepted in the United States of America and as such, the net asset value for financial reporting purposes and the returns based upon those net asset values may differ from the net asset value and returns for shareholder transactions. Does not include sales charges and is not annualized for periods less than one year, if applicable. |
| (b) | Portfolio turnover is calculated at the fund level and is not annualized for periods less than one year, if applicable. |
| (c) | Prior to September 21, 2009, the Fund operated as Atlantic Whitehall Equity Income Fund. On such date, holders of Institutional Class received Class Y shares of the Fund. |
| (d) | Calculated using average shares outstanding. |
| (e) | Ratios are based on average daily net assets (000’s omitted) of $282,037. |
16 Invesco Disciplined Equity Fund
Report of Independent Registered Public Accounting Firm
To the Board of Trustees of AIM Equity Funds (Invesco Equity Funds)
and Shareholders of Invesco Disciplined Equity Fund:
In our opinion, the accompanying statement of assets and liabilities, including the schedule of investments, and the related statements of operations and of changes in net assets and the financial highlights present fairly, in all material respects, the financial position of Invesco Disciplined Equity Fund (one of the funds constituting AIM Equity Funds (Invesco Equity Funds), hereafter referred to as the “Fund”) at October 31, 2012, the results of its operations for the year then ended, the changes in its net assets for each of the two years in the period then ended and the financial highlights for each of the three years in the period then ended and the period December 1, 2008 to October 31, 2009, in conformity with accounting principles generally accepted in the United States of America. These financial statements and financial highlights (hereafter referred to as “financial statements”) are the responsibility of the Fund’s management; our responsibility is to express an opinion on these financial statements based on our audits. We conducted our audits of these financial statements in accordance with the standards of the Public Company Accounting Oversight Board (United States). Those standards require that we plan and perform the audit to obtain reasonable assurance about whether the financial statements are free of material misstatement. An audit includes examining, on a test basis, evidence supporting the amounts and disclosures in the financial statements, assessing the accounting principles used and significant estimates made by management, and evaluating the overall financial statement presentation. We believe that our audits, which included confirmation of securities at October 31, 2012 by correspondence with the custodian, provide a reasonable basis for our opinion. The financial highlights of the Fund for the periods ended November 30, 2008 and prior were audited by another independent registered public accounting firm whose report dated January 23, 2009 expressed an unqualified opinion on those statements.
PricewaterhouseCoopers LLP
December 21, 2012
Houston, Texas
17 Invesco Disciplined Equity Fund
Calculating your ongoing Fund expenses
Example
As a shareholder of the Fund, you incur two types of costs: (1) transaction costs, which may include sales charges (loads) on purchase payments or contingent deferred sales charges on redemptions, and redemption fees, if any; and (2) ongoing costs, including management fees, distribution and/or service (12b-1) fees, if any, and other Fund expenses. This example is intended to help you understand your ongoing costs (in dollars) of investing in the Fund and to compare these costs with ongoing costs of investing in other mutual funds. The example is based on an investment of $1,000 invested at the beginning of the period and held for the entire period May 1, 2012 through October 31, 2012.
Actual expenses
The table below provides information about actual account values and actual expenses. You may use the information in this table, together with the amount you invested, to estimate the expenses that you paid over the period. Simply divide your account value by $1,000 (for example, an $8,600 account value divided by $1,000 = 8.6), then multiply the result by the number in the table under the heading entitled “Actual Expenses Paid During Period” to estimate the expenses you paid on your account during this period.
Hypothetical example for comparison purposes
The table below also provides information about hypothetical account values and hypothetical expenses based on the Fund’s actual expense ratio and an assumed rate of return of 5% per year before expenses, which is not the Fund’s actual return.
The hypothetical account values and expenses may not be used to estimate the actual ending account balance or expenses you paid for the period. You may use this information to compare the ongoing costs of investing in the Fund and other funds. To do so, compare this 5% hypothetical example with the 5% hypothetical examples that appear in the shareholder reports of the other funds.
Please note that the expenses shown in the table are meant to highlight your ongoing costs only and do not reflect any transaction costs, such as sales charges (loads) on purchase payments, contingent deferred sales charges on redemptions, and redemption fees, if any. Therefore, the hypothetical information is useful in comparing ongoing costs only, and will not help you determine the relative total costs of owning different funds. In addition, if these transaction costs were included, your costs would have been higher.
| | | | | | | | | | | | | | | | | | | | | | | | |
| Class | | Beginning
Account Value
(05/01/12) | | | ACTUAL | | | HYPOTHETICAL
(5% annual return before
expenses) | | | Annualized
Expense
Ratio | |
| | | Ending
Account Value
(10/31/12)1 | | | Expenses
Paid During
Period2 | | | Ending
Account Value
(10/31/12) | | | Expenses
Paid During
Period2 | | |
Y | | $ | 1,000.00 | | | $ | 1,015.50 | | | $ | 4.00 | | | $ | 1,021.17 | | | $ | 4.01 | | | | 0.79 | % |
| 1 | The actual ending account value is based on the actual total return of the Fund for the period May 1, 2012 through October 31, 2012, after actual expenses and will differ from the hypothetical ending account value which is based on the Fund’s expense ratio and a hypothetical annual return of 5% before expenses. |
| 2 | Expenses are equal to the Fund’s annualized expense ratio as indicated above multiplied by the average account value over the period, multiplied by 184/366 to reflect the most recent fiscal half year. |
18 Invesco Disciplined Equity Fund
Approval of Investment Advisory and Sub-Advisory Contracts
The Board of Trustees (the Board) of AIM Equity Funds (Invesco Equity Funds) is required under the Investment Company Act of 1940, as amended, to approve annually the renewal of the Invesco Disciplined Equity Fund (the Fund) investment advisory agreement with Invesco Advisers, Inc. (Invesco Advisers) and the Master Intergroup Sub-Advisory Contract for Mutual Funds (the sub-advisory contracts) with Invesco Asset Management Deutschland GmbH, Invesco Asset Management Limited, Invesco Asset Management (Japan) Limited, Invesco Australia Limited, Invesco Hong Kong Limited, Invesco Senior Secured Management, Inc. and Invesco Canada Ltd. (collectively, the Affiliated Sub-Advisers). During contract renewal meetings held on June 19-20, 2012, the Board as a whole, and the disinterested or “independent” Trustees, who comprise 80% of the Board, voting separately, approved the continuance of the Fund’s investment advisory agreement and the sub-advisory contracts for another year, effective July 1, 2012. In doing so, the Board considered the process that it follows in reviewing and approving the Fund’s investment advisory agreement and sub-advisory contracts and the information that it is provided. The Board determined that the Fund’s investment advisory agreement and the sub-advisory contracts are in the best interests of the Fund and its shareholders and the compensation to Invesco Advisers and the Affiliated Sub-Advisers under the agreements is fair and reasonable.
The Board’s Fund Evaluation Process
The Board’s Investments Committee has established three Sub-Committees, each of which is primarily responsible for overseeing the management of a number of the series portfolios of the funds advised by Invesco Advisers (the Invesco Funds). The Sub-Committees meet throughout the year to review the performance of their assigned funds, including reviewing materials prepared under the direction of the independent Senior Officer, an officer of the Invesco Funds who reports directly to the independent Trustees. Over the course of each year, the Sub-Committees meet with portfolio managers for their assigned Invesco Funds and other members of management to review the performance, investment objective(s), policies, strategies, limitations and investment risks of these funds. The Sub-Committees meet regularly and at designated contract renewal meetings each year to conduct a review of the performance, fees, expenses, and other matters related to their assigned Invesco Funds. Each Sub-Committee recommends to the Investment Committee, which in turn recommends to the full Board, whether and on what terms to approve the continuance of each Invesco Fund’s investment advisory agreement and sub-advisory contracts for another year.
During the contract renewal process, the Trustees receive comparative performance and fee data regarding the Invesco Funds prepared by
Invesco Advisers and an independent company, Lipper Inc. (Lipper). The Trustees also receive an independent written evaluation from the Senior Officer. The Senior Officer’s evaluation is prepared as part of his responsibility to manage the process by which the Invesco Funds’ proposed management fees are negotiated during the annual contract renewal process to ensure they are negotiated in a manner that is at arms’ length and reasonable. The independent Trustees are assisted in their annual evaluation of the Fund’s investment advisory agreement by the Senior Officer and by independent legal counsel. In addition to meetings with Invesco Advisers and fund counsel, the independent Trustees also discuss the continuance of the investment advisory agreement and sub-advisory contracts in private sessions with the Senior Officer and independent legal counsel.
In evaluating the fairness and reasonableness of the Fund’s investment advisory agreement and sub-advisory contracts, the Board considered, among other things, the factors discussed below. The Trustees recognized that the advisory fees for the Invesco Funds include advisory fees that are the result of years of review and negotiation between the Trustees and Invesco Advisers as well as advisory fees previously approved by a different board that, at the time, was responsible for overseeing Morgan Stanley and Van Kampen funds, which have become Invesco Funds following the acquisition of the retail mutual fund business of Morgan Stanley. The Trustees’ deliberations and conclusions in a particular year may be based in part on their deliberations and conclusions regarding these same arrangements throughout the year and in prior years. One Trustee may have weighed a particular piece of information or factor differently than another Trustee.
The discussion below serves as the Senior Officer’s independent written evaluation with respect to the Fund’s investment advisory agreement as well as a discussion of the material factors and related conclusions that formed the basis for the Board’s approval of the Fund’s investment advisory agreement and sub-advisory contracts. Unless otherwise stated, this information is current as of June 20, 2012, and may not reflect consideration of factors that became known to the Board after that date, including, for example, changes to the Fund’s performance, advisory fees, expense limitations and/or fee waivers.
Factors and Conclusions and Summary of Independent Written Fee Evaluation
| A. | Nature, Extent and Quality of Services Provided by Invesco Advisers and the Affiliated Sub-Advisers |
The Board reviewed the advisory services provided to the Fund by Invesco Advisers under the Fund’s investment advisory agreement, the performance of Invesco Advisers in providing these services, and the credentials and experience of the officers and employees of Invesco Advisers who provide
these services, including the Fund’s portfolio manager or managers, with whom the Sub-Committees met during the year. The Board’s review of the qualifications of Invesco Advisers to provide advisory services included the Board’s consideration of Invesco Advisers’ performance and investment process oversight, independent credit analysis and investment risk management.
In determining whether to continue the Fund’s investment advisory agreement, the Board considered the prior relationship between Invesco Advisers and the Fund, as well as the Board’s knowledge of Invesco Advisers’ operations, and concluded that it is beneficial to maintain the current relationship, in part because of such prior relationship and knowledge. The Board also considered services that Invesco Advisers and its affiliates provide to the Invesco Funds such as various back office support functions, equity and fixed income trading operations, internal audit, distribution and legal and compliance. The Board concluded that the nature, extent and quality of the services provided to the Fund by Invesco Advisers are appropriate and satisfactory and consistent with the terms of the Fund’s investment advisory agreement.
The Board reviewed the services provided by the Affiliated Sub-Advisers under the sub-advisory contracts and the credentials and experience of the officers and employees of the Affiliated Sub-Advisers who provide these services. The Board noted that the Affiliated Sub-Advisers have offices and personnel that are located in financial centers around the world. As a result, the Affiliated Sub-Advisers can provide research and investment analysis on the markets and economies of various countries in which the Fund invests and make recommendations on securities of companies located in such countries. The Board concluded that the sub-advisory contracts benefit the Fund and its shareholders by permitting Invesco Advisers to use the additional resources and talents of the Affiliated Sub-Advisers in managing the Fund. The Board concluded that the nature, extent and quality of the services provided by the Affiliated Sub-Advisers are appropriate and satisfactory and consistent with the terms of the Fund’s sub-advisory contracts.
The Board considered Fund performance as a relevant factor in considering whether to approve the investment advisory agreement. The Board did not view Fund performance as a relevant factor in considering whether to approve the sub-advisory contracts for the Fund, as no Affiliated Sub-Adviser currently manages assets of the Fund.
The Board compared the Fund’s performance (including the performance of the predecessor fund that was reorganized into the Fund) during the past one, three and five calendar years to the performance of funds in the Lipper performance universe and against the Lipper Large-Cap Core Funds Index. The Board noted that performance of Class Y shares of the Fund was in the first quintile
19 Invesco Disciplined Equity Fund
of the performance universe for the one, three and five year periods (the first quintile being the best performing funds and the fifth quintile being the worst performing funds). The Board noted that performance of Class Y shares of the Fund was above the performance of the Index for the one, three and five year periods. The Trustees also reviewed more recent Fund performance and this review did not change their conclusions.
| C. | Advisory and Sub-Advisory Fees and Fee Waivers |
The Board compared the Fund’s contractual advisory fee rate to the contractual advisory fee rates of funds in the Fund’s Lipper expense group at a common asset level. The Board noted that the contractual advisory fee rate for Class Y shares of the Fund was below the median contractual advisory fee rate of funds in the expense group. The Board also reviewed the methodology used by Lipper in providing expense group information, which includes using audited financial data from the most recent annual report of each fund in the expense group that was publicly available as of the end of the past calendar year and including only one fund per investment adviser. The Board noted that comparative data is as of varying dates, which may affect the comparability of data during times of market volatility.
The Board noted that Invesco Advisers and the Affiliated Sub-Advisers do not advise other mutual funds with investment strategies comparable to those of the Fund.
The Board also considered the fees charged by Invesco Advisers and the Affiliated Sub-Advisers to other client accounts with investment strategies comparable to those of the Fund. The Board noted that Invesco Advisers or the Affiliated Sub-Advisers may charge lower fees to large institutional clients solely for investment management services. Invesco Advisers reviewed with the Board the significantly greater scope of services it provides to the Invesco Funds relative to other client accounts. These additional services include provision of administrative services, officers and office space, oversight of service providers, preparation of annual registration statement updates and financial information and regulatory compliance under the Investment Company Act of 1940, as amended. Invesco Advisers also reviewed generally the higher frequency of shareholder purchases and redemptions in the Invesco Funds relative to the flow of assets for other client accounts. Invesco Advisers advised the Board that advance notice of redemptions is often provided to Invesco Advisers by institutional clients. The Board did note that sub-advisory fees charged by the Affiliated Sub-Advisers to manage the Invesco Funds and to manage other client accounts tended to be more comparable, reflecting a more comparable scope of services. The Board concluded that the aggregate services provided to the Invesco Funds were sufficiently different from those provided to institutional clients, and the Board did not place significant weight on these fee comparisons.
The Board also considered the services provided by the Affiliated Sub-Advisers pursuant to the sub-advisory contracts, as well as the
allocation of fees between Invesco Advisers and the Affiliated Sub-Advisers pursuant to the sub-advisory contracts. The Board noted that Invesco Advisers provides services to sub-advised Invesco Funds, including oversight of the Affiliated Sub-Advisers as well as the additional services described above other than day-to-day portfolio management. The Board also noted that the sub-advisory fees have no direct effect on the Fund or its shareholders, as they are paid by Invesco Advisers to the Affiliated Sub-Advisers.
Based upon the information and considerations described above, the Board concluded that the Fund’s advisory and sub-advisory fees are fair and reasonable.
| D. | Economies of Scale and Breakpoints |
The Board considered the extent to which there are economies of scale in the provision of advisory services to the Fund. The Board also considered whether the Fund benefits from economies of scale through contractual breakpoints in the Fund’s advisory fee schedule and were assisted in their review by a report from the Senior Officer. The Board also noted that the Fund shares directly in economies of scale through lower fees charged by third party service providers based on the combined size of the Invesco Funds and other clients advised by Invesco Advisers. The Board noted that Invesco Advisers proposes sharing economies of scale in administration expenses by lowering per class administrative fees.
| E. | Profitability and Financial Resources |
The Board reviewed information from Invesco Advisers concerning the costs of the advisory and other services that Invesco Advisers and its affiliates provide to the Fund and the profitability of Invesco Advisers and its affiliates in providing these services for the year ended December 31, 2011. The Board reviewed with Invesco Advisers the methodology used to prepare the profitability information. The Board considered the profitability of Invesco Advisers in connection with managing the Fund and the Invesco Funds. The Board noted that Invesco Advisers continues to operate at a net profit from services Invesco Advisers and its subsidiaries provide to the Invesco Funds and the Fund. The Board did not deem the level of profits realized by Invesco Advisers and its affiliates from providing services to the Fund to be excessive given the nature, quality and extent of the services provided to the Invesco Funds. The Board received and accepted information from Invesco Advisers demonstrating that Invesco Advisers and each Affiliated Sub-Adviser are financially sound and have the resources necessary to perform their obligations under the investment advisory agreement and sub-advisory contracts.
| F. | Collateral Benefits to Invesco Advisers and its Affiliates |
The Board considered various other benefits received by Invesco Advisers and its affiliates from the relationship with the Fund, including the fees received for their provision of administrative, transfer agency and distribution services to the Fund. The Board considered the performance of Invesco Advisers and its affiliates in providing these services and the organizational structure employed to provide these services. The Board
also considered that these services are provided to the Fund pursuant to written contracts that are reviewed and approved on an annual basis by the Board; that the services are required for the operation of the Fund; that Invesco Advisers and its affiliates can provide services, the nature and quality of which are at least equal to those provided by others offering the same or similar services; and that the fees for such services are fair and reasonable in light of the usual and customary charges by others for services of the same nature and quality.
The Board considered the benefits realized by Invesco Advisers and the Affiliated Sub-Advisers as a result of portfolio brokerage transactions executed through “soft dollar” arrangements. The Board noted that soft dollar arrangements shift the payment obligation for research services from Invesco Advisers and the Affiliated Sub-Advisers to the Invesco Funds and therefore may reduce Invesco Advisers’ and the Affiliated Sub-Advisers’ expenses. The Board also considered periodic reports from the Chief Compliance Officer of the Invesco Funds demonstrating that these arrangements are consistent with regulatory requirements. The Board did not deem the soft dollar arrangements to be inappropriate.
The Board considered that the Fund’s uninvested cash and cash collateral from any securities lending arrangements may be invested in money market funds advised by Invesco Advisers pursuant to procedures approved by the Board. The Board noted that Invesco Advisers receives advisory fees from these affiliated money market funds attributable to such investments, although Invesco Advisers has contractually agreed to waive through varying periods the advisory fees payable by the Invesco Funds. The waiver is in an amount equal to 100% of the net advisory fee Invesco Advisers receives from the affiliated money market funds with respect to the Fund’s investment in the affiliated money market funds of uninvested cash, but not cash collateral. The Board concluded that the Fund’s investment of uninvested cash and cash collateral from any securities lending arrangements in the affiliated money market funds is in the best interests of the Fund and its shareholders.
The Board also considered use of an affiliated broker to execute certain trades for the Fund and that such trades are executed in compliance with rules under the Investment Company Act of 1940, as amended.
20 Invesco Disciplined Equity Fund
Tax Information
Form 1099-DIV, Form 1042-S and other year–end tax information provide shareholders with actual calendar year amounts that should be included in their tax returns. Shareholders should consult their tax advisors.
The following distribution information is being provided as required by the Internal Revenue Code or to meet a specific state’s requirement.
The Fund designates the following amounts or, if subsequently determined to be different, the maximum amount allowable for its fiscal year ended October 31, 2012:
| | | | |
Federal and State Income Tax | |
Long-Term Capital Gain Dividends | | $ | 4,146,472 | |
Qualified Dividend Income* | | | 100 | % |
Corporate Dividends Received Deduction* | | | 100 | % |
| | * | The above percentages are based on ordinary income dividends paid to shareholders during the Fund’s fiscal year. |
21 Invesco Disciplined Equity Fund
Trustees and Officers
The address of each trustee and officer is AIM Equity Funds (Invesco Equity Funds) (the “Trust”), 11 Greenway Plaza, Suite 1000, Houston, Texas 77046-1173. The trustees serve for the life of the Trust, subject to their earlier death, incapacitation, resignation, retirement or removal as more specifically provided in the Trust’s organizational documents. Each officer serves for a one year term or until their successors are elected and qualified. Column two below includes length of time served with predecessor entities, if any.
| | | | | | | | |
Name, Year of Birth and
Position(s) Held with the Trust | | Trustee and/
or Officer Since | | Principal Occupation(s)
During Past 5 Years | | Number of
Funds in Fund Complex
Overseen by
Trustee | | Other Directorship(s)
Held by Trustee During
Past 5 Years |
| Interested Persons | | | | | | | | |
| Martin L. Flanagan1 — 1960 Trustee | | 2007 | | Executive Director, Chief Executive Officer and President, Invesco Ltd. (ultimate parent of Invesco and a global investment management firm); Advisor to the Board, Invesco Advisers, Inc. (formerly known as Invesco Institutional (N.A.), Inc.); Trustee, The Invesco Funds; Vice Chair, Investment Company Institute; and Member of Executive Board, SMU Cox School of Business Formerly: Chairman, Invesco Advisers, Inc. (registered investment adviser); Director, Chairman, Chief Executive Officer and President, IVZ Inc. (holding company), INVESCO Group Services, Inc. (service provider) and Invesco North American Holdings, Inc. (holding company); Director, Chief Executive Officer and President, Invesco Holding Company Limited (parent of Invesco and a global investment management firm); Director, Invesco Ltd.; Chairman, Investment Company Institute and President, Co-Chief Executive Officer, Co-President, Chief Operating Officer and Chief Financial Officer, Franklin Resources, Inc. (global investment management organization) | | 123 | | None |
| Philip A. Taylor2 — 1954 Trustee, President and Principal Executive Officer | | 2006 | | Head of North American Retail and Senior Managing Director, Invesco Ltd.; Director, Co-Chairman, Co-President and Co-Chief Executive Officer, Invesco Advisers, Inc. (formerly known as Invesco Institutional (N.A.), Inc.) (registered investment adviser); Director, Chairman, Chief Executive Officer and President, Invesco Management Group, Inc. (formerly known as Invesco Aim Management Group, Inc.) (financial services holding company); Director and President, INVESCO Funds Group, Inc. (registered investment adviser and registered transfer agent); Director and Chairman, Invesco Investment Services, Inc. (formerly known as Invesco Aim Investment Services, Inc.) (registered transfer agent) and IVZ Distributors, Inc. (formerly known as INVESCO Distributors, Inc.) (registered broker dealer); Director, President and Chairman, Invesco Inc. (holding company) and Invesco Canada Holdings Inc. (holding company); Chief Executive Officer, Invesco Corporate Class Inc. (corporate mutual fund company) and Invesco Canada Fund Inc. (corporate mutual fund company); Director, Chairman and Chief Executive Officer, Invesco Canada Ltd. (formerly known as Invesco Trimark Ltd./Invesco Trimark Ltèe) (registered investment adviser and registered transfer agent); Trustee, President and Principal Executive Officer, The Invesco Funds (other than AIM Treasurer’s Series Trust (Invesco Treasurer’s Series Trust) and Short-Term Investments Trust); Trustee and Executive Vice President, The Invesco Funds (AIM Treasurer’s Series Trust (Invesco Treasurer’s Series Trust) and Short-Term Investments Trust only); Director, Invesco Investment Advisers LLC (formerly known as Van Kampen Asset Management); Director, Chief Executive Officer and President, Van Kampen Exchange Corp. Formerly: Director and Chairman, Van Kampen Investor Services Inc.; Director, Chief Executive Officer and President, 1371 Preferred Inc. (holding company); and Van Kampen Investments Inc.; Director and President, AIM GP Canada Inc. (general partner for limited partnerships); and Van Kampen Advisors, Inc.; Director and Chief Executive Officer, Invesco Trimark Dealer Inc. (registered broker dealer); Director, Invesco Distributors, Inc. (formerly known as Invesco Aim Distributors, Inc.) (registered broker dealer); Manager, Invesco PowerShares Capital Management LLC; Director, Chief Executive Officer and President, Invesco Advisers, Inc.; Director, Chairman, Chief Executive Officer and President, Invesco Aim Capital Management, Inc.; President, Invesco Trimark Dealer Inc. and Invesco Trimark Ltd./Invesco Trimark Ltèe; Director and President, AIM Trimark Corporate Class Inc. and AIM Trimark Canada Fund Inc.; Senior Managing Director, Invesco Holding Company Limited; Trustee and Executive Vice President, Tax-Free Investments Trust; Director and Chairman, Fund Management Company (former registered broker dealer); President and Principal Executive Officer, The Invesco Funds (AIM Treasurer’s Series Trust (Invesco Treasurer’s Series Trust), Short-Term Investments Trust and Tax-Free Investments Trust only); President, AIM Trimark Global Fund Inc. and AIM Trimark Canada Fund Inc. | | 123 | | None |
Wayne W. Whalen3 — 1939 Trustee | | 2010 | | Of Counsel, and prior to 2010, partner in the law firm of Skadden, Arps, Slate, Meagher & Flom LLP, legal counsel to certain funds in the Fund Complex | | 136 | | Director of the Mutual Fund Directors Forum, a nonprofit membership organization for investment directors; Chairman and Director of the Abraham Lincoln Presidential Library Foundation; and Director of the Stevenson Center for Democracy |
| 1 | Mr. Flanagan is considered an interested person of the Trust because he is an officer of the adviser to the Trust, and an officer and a director of Invesco Ltd., ultimate parent of the adviser to the Trust. |
| 2 | Mr. Taylor is considered an interested person of the Trust because he is an officer and a director of the adviser to, and a director of the principal underwriter of, the Trust. |
| 3 | Mr. Whalen is considered an “interested person” (within the meaning of Section 2(a)(19) of the 1940 Act) of certain Funds in the Invesco Fund Complex by reason of he and his firm currently providing legal services as legal counsel to such Funds in the Invesco Fund Complex. |
T-1 Invesco Disciplined Equity Fund
Trustees and Officers—(continued)
| | | | | | | | |
Name, Year of Birth and
Position(s) Held with the Trust | | Trustee and/
or Officer Since | | Principal Occupation(s)
During Past 5 Years | | Number of Funds in Fund Complex Overseen by Trustee | | Other Directorship(s) Held by Trustee During
Past 5 Years |
| Independent Trustees | | | | | | | | |
Bruce L. Crockett — 1944 Trustee and Chair | | 1993 | | Chairman, Crockett Technologies Associates (technology consulting company) Formerly: Director, Captaris (unified messaging provider); Director, President and Chief Executive Officer COMSAT Corporation; and Chairman, Board of Governors of INTELSAT (international communications company) | | 123 | | ACE Limited (insurance company); and Investment Company Institute |
David C. Arch — 1945 Trustee | | 2010 | | Retired. Formerly: Chairman and Chief Executive Officer of Blistex Inc., (consumer health care products manufacturer) | | 136 | | Member of the Heartland Alliance Advisory Board, a nonprofit organization serving human needs based in Chicago. Board member of the Illinois Manufacturers’ Association. Member of the Board of Visitors, Institute for the Humanities, University of Michigan |
Frank S. Bayley — 1939 Trustee | | 2001 | | Retired Formerly: Director, Badgley Funds, Inc. (registered investment company) (2 portfolios) and Partner, law firm of Baker & McKenzie | | 123 | | Director and Chairman, C.D. Stimson Company (a real estate investment company) |
James T. Bunch — 1942 Trustee | | 2003 | | Managing Member, Grumman Hill Group LLC (family office private equity management) Formerly: Founder, Green, Manning & Bunch Ltd. (investment banking firm)(1988-2010); Executive Committee, United States Golf Association; and Director, Policy Studies, Inc. and Van Gilder Insurance Corporation | | 123 | | Chairman, Board of Governors, Western Golf Association, Chairman-elect, Evans Scholars Foundation and Director, Denver Film Society |
Rodney F. Dammeyer — 1940 Trustee | | 2010 | | Chairman of CAC, LLC, (private company offering capital investment and management advisory services) Formerly: Prior to January 2004, Director of TeleTech Holdings Inc.; Prior to 2002, Director of Arris Group, Inc.; Prior to 2001, Managing Partner at Equity Group Corporate Investments. Prior to 1995, Vice Chairman of Anixter International. Prior to 1985, experience includes Senior Vice President and Chief Financial Officer of Household International, Inc., Executive Vice President and Chief Financial Officer of Northwest Industries, Inc. and Partner of Arthur Andersen & Co. | | 136 | | Director of Quidel Corporation and Stericycle, Inc. Prior to May 2008, Trustee of The Scripps Research Institute. Prior to February 2008, Director of Ventana Medical Systems, Inc. Prior to April 2007, Director of GATX Corporation. Prior to April 2004, Director of TheraSense, Inc. |
Albert R. Dowden — 1941 Trustee | | 2000 | | Director of a number of public and private business corporations, including the Boss Group, Ltd. (private investment and management); Reich & Tang Funds (5 portfolios) (registered investment company); and Homeowners of America Holding Corporation/ Homeowners of America Insurance Company (property casualty company) Formerly: Director, Continental Energy Services, LLC (oil and gas pipeline service); Director, CompuDyne Corporation (provider of product and services to the public security market) and Director, Annuity and Life Re (Holdings), Ltd. (reinsurance company); Director, President and Chief Executive Officer, Volvo Group North America, Inc.; Senior Vice President, AB Volvo; Director of various public and private corporations; Chairman, DHJ Media, Inc.; Director Magellan Insurance Company; and Director, The Hertz Corporation, Genmar Corporation (boat manufacturer), National Media Corporation; Advisory Board of Rotary Power International (designer, manufacturer, and seller of rotary power engines); and Chairman, Cortland Trust, Inc. (registered investment company) | | 123 | | Director of Nature’s Sunshine Products, Inc. |
Jack M. Fields — 1952 Trustee | | 1997 | | Chief Executive Officer, Twenty First Century Group, Inc. (government affairs company); and Owner and Chief Executive Officer, Dos Angelos Ranch, L.P. (cattle, hunting, corporate entertainment), Discovery Global Education Fund (non-profit) and Cross Timbers Quail Research Ranch (non-profit) Formerly: Chief Executive Officer, Texana Timber LP (sustainable forestry company) and member of the U.S. House of Representatives | | 123 | | Insperity (formerly known as Administaff) |
Carl Frischling — 1937 Trustee | | 1988 | | Partner, law firm of Kramer Levin Naftalis and Frankel LLP | | 123 | | Director, Reich & Tang Funds (6 portfolios) |
Prema Mathai-Davis — 1950 Trustee | | 1998 | | Retired Formerly: Chief Executive Officer, YWCA of the U.S.A. | | 123 | | None |
Larry Soll — 1942 Trustee | | 2003 | | Retired Formerly: Chairman, Chief Executive Officer and President, Synergen Corp. (a biotechnology company) | | 123 | | None |
T-2 Invesco Disciplined Equity Fund
Trustees and Officers—(continued)
| | | | | | | | |
Name, Year of Birth and
Position(s) Held with the Trust | | Trustee and/
or Officer Since | | Principal Occupation(s) During Past 5 Years | | Number of
Funds in Fund Complex Overseen by Trustee | | Other Directorship(s) Held by Trustee During Past 5 Years |
| Independent Trustees—(continued) |
Hugo F. Sonnenschein — 1940 Trustee | | 2010 | | Distinguished Service Professor and President Emeritus of the University of Chicago and the Adam Smith Distinguished Service Professor in the Department of Economics at the University of Chicago. Formerly: President of the University of Chicago | | 136 | | Trustee of the University of Rochester and a member of its investment committee. Member of the National Academy of Sciences, the American Philosophical Society and a fellow of the American Academy of Arts and Sciences |
Raymond Stickel, Jr. — 1944 Trustee | | 2005 | | Retired Formerly: Director, Mainstay VP Series Funds, Inc. (25 portfolios) and Partner, Deloitte & Touche | | 123 | | None |
| Other Officers | | | | | | | | |
Russell C. Burk — 1958 Senior Vice President and Senior Officer | | 2005 | | Senior Vice President and Senior Officer, The Invesco Funds | | N/A | | N/A |
John M. Zerr — 1962 Senior Vice President, Chief Legal Officer and Secretary | | 2006 | | Director, Senior Vice President, Secretary and General Counsel, Invesco Management Group, Inc. (formerly known as Invesco Aim Management Group, Inc.) and Van Kampen Exchange Corp.; Senior Vice President, Invesco Advisers, Inc. (formerly known as Invesco Institutional (N.A.), Inc.) (registered investment adviser); Senior Vice President and Secretary, Invesco Distributors, Inc. (formerly known as Invesco Aim Distributors, Inc.); Director, Vice President and Secretary, Invesco Investment Services, Inc. (formerly known as Invesco Aim Investment Services, Inc.) and IVZ Distributors, Inc. (formerly known as INVESCO Distributors, Inc.); Director and Vice President, INVESCO Funds Group, Inc.; Senior Vice President, Chief Legal Officer and Secretary, The Invesco Funds; Manager, Invesco PowerShares Capital Management LLC; Director, Secretary and General Counsel, Invesco Investment Advisers LLC (formerly known as Van Kampen Asset Management); Secretary and General Counsel, Invesco Capital Markets, Inc. (formerly known as Van Kampen Funds Inc.) and Chief Legal Officer, PowerShares Exchange-Traded Fund Trust, PowerShares Exchange-Traded Fund Trust II, PowerShares India Exchange-Traded Fund Trust and PowerShares Actively Managed Exchange-Traded Fund Trust Formerly: Director and Secretary, Van Kampen Advisors Inc.; Director Vice President, Secretary and General Counsel Van Kampen Investor Services Inc.; Director, Invesco Distributors, Inc. (formerly known as Invesco Aim Distributors, Inc.); Director, Senior Vice President, General Counsel and Secretary, Invesco Advisers, Inc.; and Van Kampen Investments Inc.; Director, Vice President and Secretary, Fund Management Company; Director, Senior Vice President, Secretary, General Counsel and Vice President, Invesco Aim Capital Management, Inc.; Chief Operating Officer and General Counsel, Liberty Ridge Capital, Inc. (an investment adviser); Vice President and Secretary, PBHG Funds (an investment company) and PBHG Insurance Series Fund (an investment company); Chief Operating Officer, General Counsel and Secretary, Old Mutual Investment Partners (a broker-dealer); General Counsel and Secretary, Old Mutual Fund Services (an administrator) and Old Mutual Shareholder Services (a shareholder servicing center); Executive Vice President, General Counsel and Secretary, Old Mutual Capital, Inc. (an investment adviser); and Vice President and Secretary, Old Mutual Advisors Funds (an investment company) | | N/A | | N/A |
Lisa O. Brinkley — 1959 Vice President | | 2004 | | Global Assurance Officer, Invesco Ltd. and Vice President, The Invesco Funds Formerly: Chief Compliance Officer, Invesco Distributors, Inc. (formerly known as Invesco Aim Distributors, Inc.), Invesco Investment Services, Inc.(formerly known as Invesco Aim Investment Services, Inc.) and Van Kampen Investor Services Inc.; Senior Vice President, Invesco Management Group, Inc.; Senior Vice President and Chief Compliance Officer, Invesco Advisers, Inc. and The Invesco Funds; Vice President and Chief Compliance Officer, Invesco Aim Capital Management, Inc. and Invesco Distributors, Inc.; Vice President, Invesco Investment Services, Inc. and Fund Management Company | | N/A | | N/A |
T-3 Invesco Disciplined Equity Fund
Trustees and Officers—(continued)
| | | | | | | | |
Name, Year of Birth and
Position(s) Held with the Trust | | Trustee and/
or Officer Since | | Principal Occupation(s) During Past 5 Years | | Number of
Funds in Fund
Complex
Overseen by
Trustee | | Other Directorship(s)
Held by Trustee During
Past 5 Years |
| Other Officers—(continued) |
Karen Dunn Kelley — 1960 Vice President | | 2004 | | Head of Invesco’s World Wide Fixed Income and Cash Management Group; Senior Vice President, Invesco Management Group, Inc. (formerly known as Invesco Aim Management Group, Inc.) and Invesco Advisers, Inc. (formerly known as Invesco Institutional (N.A.), Inc.) (registered investment adviser); Executive Vice President, Invesco Distributors, Inc. (formerly known as Invesco Aim Distributors, Inc.); Director, Invesco Mortgage Capital Inc., INVESCO Global Asset Management Limited, Invesco Management Company Limited and INVESCO Management S.A.; Vice President, The Invesco Funds (other than AIM Treasurer’s Series Trust (Invesco Treasurer’s Series Trust) and Short-Term Investments Trust); and President and Principal Executive Officer, The Invesco Funds (AIM Treasurer’s Series Trust (Invesco Treasurer’s Series Trust) and Short-Term Investments Trust only) Formerly: Senior Vice President, Van Kampen Investments Inc.; Vice President, Invesco Advisers, Inc. (formerly known as Invesco Institutional (N.A.), Inc.); Director of Cash Management and Senior Vice President, Invesco Advisers, Inc. and Invesco Aim Capital Management, Inc.; President and Principal Executive Officer, Tax-Free Investments Trust; Director and President, Fund Management Company; Chief Cash Management Officer, Director of Cash Management, Senior Vice President, and Managing Director, Invesco Aim Capital Management, Inc.; Director of Cash Management, Senior Vice President, and Vice President, Invesco Advisers, Inc. and The Invesco Funds (AIM Treasurer’s Series Trust (Invesco Treasurer’s Series Trust), Short-Term Investments Trust and Tax-Free Investments Trust only) | | N/A | | N/A |
Sheri Morris — 1964 Vice President, Treasurer and Principal Financial Officer | | 1999 | | Vice President, Treasurer and Principal Financial Officer, The Invesco Funds; Vice President, Invesco Advisers, Inc. (formerly known as Invesco Institutional (N.A.), Inc.) (registered investment adviser); and Treasurer, PowerShares Exchange-Traded Fund Trust, PowerShares Exchange-Traded Fund Trust II, PowerShares India Exchange-Traded Fund Trust and PowerShares Actively Managed Exchange-Traded Fund Trust Formerly: Vice President, Invesco Advisers, Inc., Invesco Aim Capital Management, Inc. and Invesco Aim Private Asset Management, Inc.; Assistant Vice President and Assistant Treasurer, The Invesco Funds and Assistant Vice President, Invesco Advisers, Inc., Invesco Aim Capital Management, Inc. and Invesco Aim Private Asset Management, Inc. | | N/A | | N/A |
Yinka Akinsola — 1977 Anti-Money Laundering Compliance Officer | | 2011 | | Anti-Money Laundering Compliance Officer, Invesco Advisers, Inc. (formerly known as Invesco Institutional (N.A.), Inc.) (registered investment adviser); Invesco Distributors, Inc. (formerly known as Invesco Aim Distributors, Inc.), Invesco Investment Services, Inc. (formerly known as Invesco Aim Investment Services, Inc.), Invesco Management Group, Inc., The Invesco Funds, Invesco Van Kampen Closed-End Funds, Van Kampen Exchange Corp., Invesco Capital Markets, Inc. (formerly known as Van Kampen Funds Inc.), PowerShares Exchange-Traded Fund Trust, PowerShares Exchange-Traded Fund Trust II, PowerShares India Exchange-Traded Fund Trust, and PowerShares Actively Managed Exchange-Traded Fund Trust Formerly: Regulatory Analyst III, Financial Industry Regulatory Authority (FINRA). | | N/A | | N/A |
Todd L. Spillane — 1958 Chief Compliance Officer | | 2006 | | Senior Vice President, Invesco Management Group, Inc. (formerly known as Invesco Aim Management Group, Inc.) and Van Kampen Exchange Corp.; Senior Vice President and Chief Compliance Officer, Invesco Advisers, Inc. (registered investment adviser) (formerly known as Invesco Institutional (N.A.), Inc.); Chief Compliance Officer, The Invesco Funds; Vice President, Invesco Distributors, Inc. (formerly known as Invesco Aim Distributors, Inc.) and Invesco Investment Services, Inc. (formerly known as Invesco Aim Investment Services, Inc.) Formerly: Chief Compliance Officer, Invesco Van Kampen Closed-End Funds; Senior Vice President, Van Kampen Investments Inc.; Senior Vice President and Chief Compliance Officer, Invesco Advisers, Inc. and Invesco Aim Capital Management, Inc.; Chief Compliance Officer, INVESCO Private Capital Investments, Inc. (holding company), Invesco Private Capital, Inc. (registered investment adviser), Invesco Global Asset Management (N.A.), Inc., Invesco Senior Secured Management, Inc. (registered investment adviser) and Van Kampen Investor Services Inc., PowerShares Exchange-Traded Fund Trust, PowerShares Exchange-Traded Fund Trust II, PowerShares India Exchange-Traded Fund Trust and PowerShares Actively Managed Exchange-Traded Fund Trust; Vice President, Invesco Aim Capital Management, Inc. and Fund Management Company | | N/A | | N/A |
The Statement of Additional Information of the Trust includes additional information about the Fund’s Trustees and is available upon request, without charge, by calling 1.800.959.4246. Please refer to the Fund’s prospectus for information on the Fund’s sub-advisers.
| | | | | | |
Office of the Fund 11 Greenway Plaza, Suite 1000 Houston, TX 77046-1173 | | Investment Adviser Invesco Advisers, Inc. 1555 Peachtree Street, N.E. Atlanta, GA 30309 | | Distributor Invesco Distributors, Inc. 11 Greenway Plaza, Suite 1000 Houston, TX 77046-1173 | | Auditors PricewaterhouseCoopers LLP 1201 Louisiana Street, Suite 2900 Houston, TX 77002-5678 |
| | | |
| | | | | | |
Counsel to the Fund Stradley Ronon Stevens & Young, LLP 2005 Market Street, Suite 2600 Philadelphia, PA 19103-7018 | | Counsel to the Independent Trustees Kramer Levin Naftalis & Frankel LLP 1177 Avenue of the Americas New York, NY 10036-2714 | | Transfer Agent Invesco Investment Services, Inc. 11 Greenway Plaza, Suite 1000 Houston, TX 77046-1173 | | Custodian State Street Bank and Trust Company 225 Franklin Street Boston, MA 02110-2801 |
T-4 Invesco Disciplined Equity Fund

Invesco mailing information
Send general correspondence to Invesco Investment Services, Inc., P.O. Box 219078, Kansas City, MO 64121-9078.
Invesco privacy policy
You share personal and financial information with us that is necessary for your transactions and your account records. We take very seriously the obligation to keep that information confidential and private.
Invesco collects nonpublic personal information about you from account applications or other forms you complete and from your transactions with us or our affiliates. We do not disclose information about you or our former customers to service providers or other third parties except to the extent necessary to service your account and in other limited circumstances as permitted by law. For example, we use this information to facilitate the delivery of transaction confirmations, financial reports, prospectuses and tax forms.
Even within Invesco, only people involved in the servicing of your accounts and compliance monitoring have access to your information. To ensure the highest level of confidentiality and security, Invesco maintains physical, electronic and procedural safeguards that meet or exceed federal standards. Special measures, such as data encryption and authentication, apply to your communications with us on our website. More detail is available to you at invesco.com/privacy.
Important notice regarding delivery of security holder documents
To reduce Fund expenses, only one copy of most shareholder documents may be mailed to shareholders with multiple accounts at the same address (Householding). Mailing of your shareholder documents may be householded indefinitely unless you instruct us otherwise. If you do not want the mailing of these documents to be combined with those for other members of your household, please contact Invesco Investment Services, Inc. at 800 959 4246 or contact your financial institution. We will begin sending you individual copies for each account within 30 days after receiving your request.
Fund holdings and proxy voting information
The Fund provides a complete list of its holdings four times in each fiscal year, at the quarter-ends. For the second and fourth quarters, the lists appear in the Fund’s semiannual and annual reports to shareholders. For the first and third quarters, the Fund files the lists with the Securities and Exchange Commission (SEC) on Form N-Q. The most recent list of portfolio holdings is available at invesco.com/completeqtrholdings. Shareholders can also look up the Fund’s Forms N-Q on the SEC website at sec.gov. Copies of the Fund’s Forms N-Q may be reviewed and copied at the SEC Public Reference Room in Washington, D.C. You can obtain information on the operation of the Public Reference Room, including information about duplicating fee charges, by calling 202 551 8090 or 800 732 0330, or by electronic request at the following email address: publicinfo@sec.gov. The SEC file numbers for the Fund are shown below.
A description of the policies and procedures that the Fund uses to determine how to vote proxies relating to portfolio securities is available without charge, upon request, from our Client Services department at 800 959 4246 or at invesco.com/proxyguidelines. The information is also available on the SEC website, sec.gov.
| | | | |
Information regarding how the Fund voted proxies related to its portfolio securities during the 12 months ended June 30, 2012, is available at invesco.com/proxysearch. The information is also available on the SEC website, sec.gov. Invesco Advisers, Inc. is an investment adviser; it provides investment advisory services to individual and institutional clients and does not sell securities. Invesco Distributors, Inc. is the US distributor for Invesco Ltd.’s retail mutual funds, exchange-traded funds and institutional money market funds. Both are wholly owned, indirect subsidiaries of Invesco Ltd. | | |  | |
| | | | |
| SEC file numbers: 811-01424 and 002-25469 | | DEQ-AR-1 | | Invesco Distributors, Inc. |

Letters to Shareholders
| | |

Philip Taylor | | Dear Shareholders: This report contains information about your Fund, including a discussion from your portfolio managers about how they managed your Fund – and why it performed as it did – during the reporting period. This report also includes your Fund’s long-term performance and a complete list of your Fund’s investments as of the close of the reporting period. I hope you find this information helpful. For much of the reporting period, investors’ attention was focused on Europe, where eurozone governments struggled to reduce debt levels, strengthen their banks and stimulate their economies. European leaders disagreed whether the wiser path to restoring the Continent’s economic well-being was more stimulus or greater austerity. In the US, economic data were mixed. Economic growth, while positive, was relatively modest. Corporate earnings, which grew strongly in recent years, showed signs of slowing. And job creation was less |
| robust than hoped. Later in this report, your Fund’s portfolio managers discuss how economic conditions and market trends affected your Fund’s performance. |
Economic conditions are always subject to sudden and unexpected change. That’s why you may find it helpful to work with a trusted, experienced financial adviser who understands your unique financial goals, needs and risk tolerances. Financial advisers can provide valuable insight and information, particularly when markets are uncertain, and they can recommend investments appropriate for specific investment goals, such as a child’s college education or your retirement. On a regular basis, a financial adviser also can determine whether your existing investments are still appropriate, given your changing needs, goals and circumstances.
Timely insight and information from many of Invesco’s investment professionals is available at our website, invesco.com/us. We offer in-depth articles, video clips and audio commentaries from many of our portfolio managers and other investment professionals on a wide range of topics of interest to investors: recent economic and market developments; retirement planning; legislative updates from Washington, DC; and general investor education. At invesco.com/us, you also can access information about your Invesco account at any time.
What we mean by Intentional Investing
Intentional InvestingSM is the science and art of investing with purpose, prudence and diligence – and it’s how Invesco’s investment professionals manage your money every day.
This highly disciplined process begins when specialized teams of investment professionals clearly define an investment objective and then establish specific investment strategies to try to achieve that objective. While our investment teams closely monitor economic and market conditions – and issues specific to individual holdings that could affect their value – they maintain a long-term investment perspective. Intentional Investing is also:
| | n | | How we manage and mitigate risk – by embedding risk controls and processes into every aspect of our business; |
| | n | | How we create products – by offering a diverse combination of investment strategies and vehicles designed to meet your needs; and |
| | n | | How we connect with you, our investors – by communicating clearly, by delivering expert insights from our portfolio managers and other investment professionals, and by providing a website full of tools and articles to help you stay informed. |
As a company, Invesco believes in putting investors first, and that’s why investment management is all we do. Our sole focus on managing your money allows your financial adviser to build a truly diversified investment portfolio of Invesco funds, whatever your investment needs and goals may be – and allows him or her to find appropriate Invesco funds when your circumstances change. Of course, neither Intentional Investing nor diversification can guarantee a profit or protect against loss.
Have a question?
If you have questions about your account, please contact an Invesco client services representative at 800 959 4246. If you have an Invesco-related question or comment, feel free to email me directly at phil@invesco.com.
All of us at Invesco look forward to serving your investment management needs for many years to come. Thank you for investing with us.
Sincerely,

Philip Taylor
Senior Managing Director, Invesco Ltd.
2 Invesco Diversified Dividend Fund
| | |

Bruce Crockett | | Dear Fellow Shareholders: One of our most important responsibilities as independent Trustees of the Invesco Funds is our annual review of the funds’ advisory and sub-advisory contracts with Invesco. This annual review is required by the Investment Company Act of 1940 and focuses on the nature and quality of the services Invesco has provided as adviser to the Invesco Funds and the reasonableness of the fees that it charges for those services. In our roles as Trustees, we spend months reviewing thousands of pages of detailed information that we request from Invesco in connection with our annual review. We focus on the quality and costs of the services to be provided by Invesco and its affiliates. Some of the most important things we look at are fund performance, expenses and fees. All of the Trustees have substantial personal investments in the Invesco Funds complex. We’re fund shareholders just like you. |
We also use information from many independent sources during the review process, including materials provided by the independent Senior Officer of the Invesco Funds, who reports directly to the independent Trustees. We also meet in private sessions with independent legal counsel and review performance and fee data on the Invesco Funds prepared by Lipper Inc., an independent, third-party firm widely recognized as a leader in its field.
I’m pleased to report that the Invesco Funds Board determined in June that renewing the investment advisory agreement and the sub-advisory contracts with Invesco would serve the best interests of each fund and its shareholders. For more detailed information about our assessment and conclusions with respect to each of the Invesco Funds, visit invesco.com/us, click on the “About Us” section and go to “Legal Information.” Information on the recent investment advisory renewal process can be found by clicking the last item under “Corporate Governance.”
In much the same way we review your fund’s advisory contract each year, it’s a good idea for you to review your own investment plan with your financial adviser on a regular basis. Perhaps you need to reassess your original asset allocation because different investments may grow at varying paces, or perhaps you’re going through a significant life change. Regardless of your situation, a financial adviser can provide guidance and experience to help you reach your financial goals.
As always, please contact me at bruce@brucecrockett.com with any questions or concerns you may have. On behalf of the Board, we look forward to continuing to represent your interests and serving your needs.
Sincerely,

Bruce L. Crockett
Independent Chair
Invesco Funds Board of Trustees
3 Invesco Diversified Dividend Fund
Management’s Discussion of Fund Performance
Performance summary
Equity markets delivered positive returns but were volatile during the reporting period. For the fiscal year ended October 31, 2012, Invesco Diversified Dividend Fund, at net asset value (NAV), delivered positive returns and outperformed its broad market and style-specific benchmarks, the S&P 500 Index and the Russell 1000 Value Index, respectively. The Fund’s returns were largely driven by investments in financials and consumer staples stocks. All sectors of the Fund posted gains, but select holdings in the consumer discretionary and utilities sector detracted from results during the fiscal year.
Your Fund’s long-term performance appears later in this report.
Fund vs. Indexes
Total returns, 10/31/11 to 10/31/12, at net asset value (NAV). Performance shown does not include applicable contingent deferred sales charges (CDSC) or front-end sales charges, which would have reduced performance.
| | | | |
Class A Shares | | | 17.00 | % |
Class B Shares | | | 16.12 | |
Class C Shares | | | 16.04 | |
Class R Shares | | | 16.66 | |
Class Y Shares | | | 17.26 | |
Investor Class Shares | | | 16.95 | |
Class R5 Shares* | | | 17.39 | |
Class R6 Shares** | | | 17.00 | |
S&P 500 Indexq (Broad Market Index) | | | 15.21 | |
Russell 1000 Value Indexn (Style-Specific Index)*** | | | 16.89 | |
Russell 1000 Indexn (Former Style-Specific Index) | | | 14.97 | |
Lipper Large-Cap Value Funds Index¿ (Peer Group Index)*** | | | 14.06 | |
Lipper Large-Cap Core Funds Index¿ (Former Peer Group Index) | | | 13.38 | |
Source(s): qInvesco, S&P-Dow Jones via FactSet Research Systems, Inc.;nInvesco, Russell via FactSet Research Systems Inc.; ¿Lipper Inc.
| * | | Effective September 24, 2012, Institutional Class shares were renamed Class R5 shares. |
| ** | | Share class incepted during the reporting period. See page 7 for a detailed explanation of Fund performance. |
| *** | | During the reporting period, the Fund has elected to use the Russell 1000 Value Index and the Lipper Large-Cap Value Funds Index as its style-specific index and peer group index, respectively, rather than the Russell 1000 Index and Lipper Large-Cap Core Funds Index, respectively, because these benchmarks are more consistent with and reflective of the Fund’s classic value approach. Because this is the first reporting period since we adopted the new indexes, SEC guidelines require that we compare performance to both the old and new indexes. |
How we invest
Our total return approach emphasizes long-term capital appreciation, current income and capital preservation. The Fund may serve as a foundation within a well-diversified asset allocation strategy, complementing more aggressive and cyclical investments.
We seek companies that we believe have normalized earnings power greater than that implied by their current market valuation and that return capital to shareholders via dividends and share repurchases. All stocks in the portfolio pay dividends, and the Fund pays a quarterly dividend to shareholders. We manage
risk utilizing a valuation framework, careful stock selection and a rigorous buy-and-sell discipline.
We look for dividend-paying companies with strong profitability, solid balance sheets and capital allocation policies that support sustained or increasing dividends and share repurchases. We perform extensive fundamental research, incorporating both financial statement analysis and an assessment of the potential reward relative to the downside risk to determine a fair valuation over our two- to three-year investment horizon for each stock. We believe our process may provide a good combination of dividend income, price appreciation and capital preservation.
We maintain a rigorous sell discipline and consider selling or trimming a stock when it no longer meets our investment criteria, including when:
| n | | A stock reaches its fair valuation (target price). |
| n | | A company’s fundamental business prospects deteriorate. |
| n | | A more attractive investment opportunity presents itself. |
Market conditions and your Fund
The fiscal year began with improving economic data in the US and a rally in the equity markets. However, the ongoing European debt crisis intensified in April and May, dominating headlines and creating significant volatility in equity markets across the globe.
With pressure from overseas, US economic data began to decelerate and indicators for manufacturing, employment and the consumer weakened over the summer. Despite these headwinds, corporate earnings were resilient, and the financial markets delivered strong results for the year. All sectors in the S&P 500 Index posted gains.1 The telecommunication services, health care, and consumer discretionary sectors were the
Portfolio Composition
By sector
| | | | |
Consumer Staples | | | 21.9 | % |
Financials | | | 19.4 | |
Utilities | | | 11.6 | |
Consumer Discretionary | | | 10.5 | |
Industrials | | | 9.2 | |
Health Care | | | 7.2 | |
Information Technology | | | 4.4 | |
Materials | | | 4.1 | |
Energy | | | 1.8 | |
Telecommunication Services | | | 0.9 | |
Money Market Funds | | | | |
Plus Other Assets Less Liabilities | | | 9.0 | |
Top 10 Equity Holdings*
| | | | |
1. General Mills, Inc. | | | 3.1 | % |
2. SunTrust Banks, Inc. | | | 3.0 | |
3. Heineken N.V. | | | 2.8 | |
4. Kimberly-Clark Corp. | | | 2.6 | |
5. Target Corp. | | | 2.2 | |
6. Raytheon Co. | | | 2.2 | |
7. Masco Corp. | | | 2.2 | |
8. Weyerhaeuser Co. | | | 2.1 | |
9. American Electric Power
Co., Inc. | | | 2.1 | |
10. General Dynamics Corp. | | | 2.1 | |
| | | | |
Total Net Assets | | $ | 5.3 billion | |
| |
Total Number of Holdings* | | | 72 | |
The Fund’s holdings are subject to change, and there is no assurance that the Fund will continue to hold any particular security.
* Excluding money market fund holdings.
4 Invesco Diversified Dividend Fund
leading performers, while the energy and materials sectors lagged.
The Fund’s investments in the financials sector contributed the most to our results during the fiscal year. Many of the portfolio’s bank holdings performed well, including SunTrust. The company’s operating results showed continued improvement in credit metrics and modest loan growth, particularly within residential mortgages and commercial and industrial accounts. We continue to believe the bank is attractively valued, has an underappreciated deposit franchise and maintains a solid capital position.
Another top contributor to Fund performance was building products company, Masco. Masco’s stock appreciated as a variety of housing-related indicators strengthened: pending home sales improved, expected housing starts increased and the percentage of seriously delinquent loans declined. We originally invested in Masco in the late stages of the last economic downturn when the housing market’s collapse severely impacted the company’s sales and stock price. Our long-term view was that the company could improve returns via restructuring initiatives to reduce costs and, at the same time, improve organic growth with market share gains from new product introductions. The company’s restructuring has progressed, and key businesses such as paints and plumbing have rebounded while cabinets and installation continue to lag.
Information technology and energy were the worst performing sectors in the Russell 1000 Value Index. Our underweight positions in these areas helped the Fund’s relative performance.
While most of our consumer discretionary holdings posted gains, some of our investments in this sector, including International Game Technology, detracted from results relative to the Russell 1000 Value Index. The gaming equipment manufacturer has underearned in recent years given the lackluster slot replacement cycle, exacerbated by not only the economic downturn, but also casino operators’ constrained balance sheets. Although the slot machine replacement cycle has recently improved, competitive pressures remain heightened as evidenced by pricing pressure and lower game yields.
Exelon was also among the largest detractors from Fund performance during the reporting period. The stock underperformed due to the continued weakness in power prices driven by low natural gas prices. As the largest nuclear
plant generator in the US, the company could benefit from tightening power supply due to environmental regulation. Additionally, the recent merger with Constellation Energy offers opportunities for ongoing revenue synergies and operating expense savings.
Our process focuses on investing in companies that we believe have a higher normalized earnings power than what is reflected in current valuations. Our fundamental research gives us the conviction to go against the consensus viewpoint when supported by our analysis. At this point in the earnings recovery cycle, our investment team is particularly focused on defensible businesses with operating profit margin sustainability and prudent capital allocation. Our positioning reflects this as the Fund is presently overweight consumer staples while underweight some cyclical sectors such as energy.
We actively invested in consumer staples this fiscal year, as margins remained largely stable or grew, current valuations are in line with levels seen at this point in prior cycles, and dividend growth has been a priority use of capital. In contrast, we have been underweight in more cyclical sectors, such as energy, where we believe earnings, operating leverage and margins are potentially at risk.
Financials sector fundamentals are also improving, yet low valuations have persisted due to fears of an economic slowdown, uncertainty about European sovereign debt and a lack of transparency on regulatory reform. These overhangs created an opportunity for us to increase our investments in regional banks where we believe valuations offer attractive risk/ rewards. We expect these investments to benefit from a continued recovery in loan demand and credit quality as well as growing dividend payouts.
Overall, we believe companies have done an admirable job of managing their businesses through a myriad of economic and business challenges. This is evidenced by the strong recovery in corporate profits off the most recent recession lows when compared to the modest growth in gross domestic product. Longer term, we believe global debt deleveraging remains the most pressing issue affecting economic growth. While consumers and corporations have made significant progress in improving their respective balance sheets, governments globally have been much slower to address this issue. At the close of the reporting period, the investment implication of US fiscal cliff negotiations and the health of Europe and
emerging markets were key macro concerns.
We encourage investors to recognize the private sector progress made since the downturn. Although risks and volatility remain, we believe there are pockets of value opportunities to pursue. We remain focused on a long-term total return strategy that emphasizes capital appreciation, current income and capital preservation over a full market cycle. We believe this approach has served our investors well and that our Fund may serve as a cornerstone in your portfolio.
As of December 31, 2012, we will have managed the Fund for 10 years. We are grateful for the opportunity to help investors achieve their financial goals and we thank you for your investment in Invesco Diversified Dividend Fund.
1 Source: Lipper Inc.
The views and opinions expressed in management’s discussion of Fund performance are those of Invesco Advisers, Inc. These views and opinions are subject to change at any time based on factors such as market and economic conditions. These views and opinions may not be relied upon as investment advice or recommendations, or as an offer for a particular security. The information is not a complete analysis of every aspect of any market, country, industry, security or the Fund. Statements of fact are from sources considered reliable, but Invesco Advisers, Inc. makes no representation or warranty as to their completeness or accuracy. Although historical performance is no guarantee of future results, these insights may help you understand our investment management philosophy.
See important Fund and, if applicable, index disclosures later in this report.
| | |
 | | Meggan Walsh Chartered Financial Analyst, portfolio manager, is lead manager of Invesco Diversified Dividend Fund. |
| She joined Invesco in 1991. Ms. Walsh earned a BS in finance from the University of Maryland and an MBA from Loyola University Maryland. |
| | |
 | | Jonathan Harrington Chartered Financial Analyst, portfolio manager, is manager of Invesco Diversified Dividend Fund. |
| He joined Invesco in 2001. Mr. Harrington earned a BA in history and philosophy from Dartmouth College and an MBA from Kellogg School of Management, Northwestern University. |
5 Invesco Diversified Dividend Fund
Your Fund’s Long-Term Performance
Results of a $10,000 Investment – Oldest Share Class(es) since Inception
Fund and index data from 10/31/02*
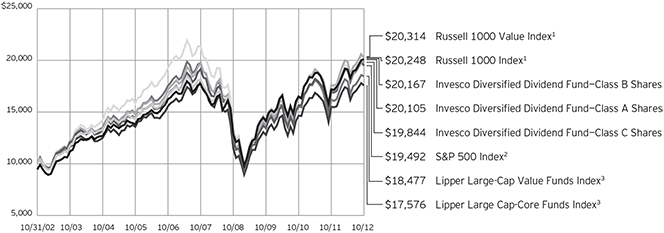
| 1 | Source(s): Invesco, Russell via FactSet Research Systems Inc. |
| 2 | Source(s): Invesco, S&P-Dow Jones via FactSet Research Systems Inc. |
| * | During the reporting period, Invesco changed its policy regarding growth of $10,000 charts. For funds older than 10 years, we previously showed performance since inception. Going forward, we will show performance for the most recent 10 years, since this more accurately reflects the experience of the typical shareholder. As a result, charts now may include benchmarks that did not appear previously, because the funds’ inception predated the benchmarks’ inception. Also, all charts will now be presented using a linear format. |
Past performance cannot guarantee comparable future results.
During the reporting period, the Fund has elected to use the Russell 1000 Value Index and the Lipper Large-Cap Value Funds Index as its style-specific index and peer group index, respectively rather than the Russell 1000 Index and Lipper Large-Cap Core Funds Index, respectively because these benchmarks are more consistent with and reflective of the Fund’s classic value approach.
Because this is the first reporting period since we adopted the new indexes, SEC guidelines require that we compare performance to both the old and new indexes.
The data shown in the chart include reinvested distributions, applicable sales charges and Fund expenses including management fees. Results for Class B shares are calculated as if a hypothetical shareholder had liquidated his entire investment in the Fund at the close of the
reporting period and paid the contingent deferred sales charges, if applicable. Index results include reinvested dividends, but they do not reflect sales charges. Performance of the peer group, if applicable, reflects fund expenses and management fees; performance of a market index does not. Performance shown in the chart and table(s) does not reflect deduction of taxes a shareholder would pay on Fund distributions or sale of Fund shares.
continued from page 8
| n | | A direct investment cannot be made in an index. Unless otherwise indicated, index results include reinvested dividends, and they do not reflect sales charges. Performance of the peer group, if applicable, reflects fund expenses; performance of a market index does not. |
Other information
| n | | The returns shown in management’s discussion of Fund performance are based on net asset values calculated for shareholder transactions. Generally accepted accounting principles require adjustments to be made to the net assets of the Fund at period end for financial reporting purposes, and as such, the net asset values for shareholder transactions and the returns |
based on those net asset values may differ from the net asset values and returns reported in the Financial Highlights.
| n | | Industry classifications used in this report are generally according to the Global Industry Classification Standard, which was developed by and is the exclusive property and a service mark of MSCI Inc. and Standard & Poor’s. |
6 Invesco Diversified Dividend Fund
Average Annual Total Returns
As of 10/31/12, including maximum applicable sales charges
| | | | |
Class A Shares | | | | |
Inception (12/31/01) | | | 5.30 | % |
10 Years | | | 7.23 | |
5 Years | | | 1.44 | |
1 Year | | | 10.59 | |
| |
Class B Shares | | | | |
Inception (12/31/01) | | | 5.33 | % |
10 Years | | | 7.27 | |
5 Years | | | 1.49 | |
1 Year | | | 11.12 | |
| |
Class C Shares | | | | |
Inception (12/31/01) | | | 5.11 | % |
10 Years | | | 7.09 | |
5 Years | | | 1.84 | |
1 Year | | | 15.04 | |
| |
Class R Shares | | | | |
10 Years | | | 7.64 | % |
5 Years | | | 2.39 | |
1 Year | | | 16.66 | |
| |
Class Y Shares | | | | |
10 Years | | | 7.97 | % |
5 Years | | | 2.83 | |
1 Year | | | 17.26 | |
| |
Investor Class Shares | | | | |
10 Years | | | 7.90 | % |
5 Years | | | 2.67 | |
1 Year | | | 16.95 | |
| |
Class R5 Shares | | | | |
10 Years | | | 8.12 | % |
5 Years | | | 2.99 | |
1 Year | | | 17.39 | |
| |
Class R6 Shares | | | | |
10 Years | | | 7.85 | % |
5 Years | | | 2.60 | |
1 Year | | | 17.00 | |
Class R shares incepted on October 25, 2005. Performance shown prior to that date is that of Class A shares, restated to reflect the higher 12b-1 fees applicable to Class R shares. Class A share performance reflects any applicable fee waivers or expense reimbursements.
Class Y shares incepted on October 3, 2008. Performance shown prior to that date is that of Class A shares and includes the 12b-1 fees applicable to Class A shares. Class A share performance reflects any applicable fee waivers or expense reimbursements.
Investor Class shares incepted on July 15, 2005. Performance shown prior to that date is that of Class A shares and includes the 12b-1 fees applicable to Class A shares. Class A
Average Annual Total Returns
As of 9/30/12, the most recent calendar quarter-end, including maximum applicable sales charges
| | | | |
Class A Shares | | | | |
Inception (12/31/01) | | | 5.30 | % |
10 Years | | | 7.75 | |
5 Years | | | 1.43 | |
1 Year | | | 19.70 | |
| |
Class B Shares | | | | |
Inception (12/31/01) | | | 5.33 | % |
10 Years | | | 7.77 | |
5 Years | | | 1.50 | |
1 Year | | | 20.83 | |
| |
Class C Shares | | | | |
Inception (12/31/01) | | | 5.12 | % |
10 Years | | | 7.61 | |
5 Years | | | 1.85 | |
1 Year | | | 24.86 | |
| |
Class R Shares | | | | |
10 Years | | | 8.16 | % |
5 Years | | | 2.38 | |
1 Year | | | 26.41 | |
| |
Class Y Shares | | | | |
10 Years | | | 8.48 | % |
5 Years | | | 2.81 | |
1 Year | | | 26.99 | |
| |
Investor Class Shares | | | | |
10 Years | | | 8.42 | % |
5 Years | | | 2.67 | |
1 Year | | | 26.77 | |
| |
Class R5 Shares | | | | |
10 Years | | | 8.64 | % |
5 Years | | | 2.98 | |
1 Year | | | 27.25 | |
| |
Class R6 Shares | | | | |
10 Years | | | 8.36 | % |
5 Years | | | 2.59 | |
1 Year | | | 26.70 | |
share performance reflects any applicable fee waivers or expense reimbursements.
Class R5 shares incepted on October 25, 2005. Performance shown prior to that date is that of Class A shares and includes the 12b-1 fees applicable to Class A shares. Class A share performance reflects any applicable fee waivers or expense reimbursements.
Class R6 shares incepted on September 24, 2012. Performance shown prior to that date is that of Class A shares and includes the 12b-1 fees applicable to Class A shares. Class A share performance reflects any applicable fee waivers or expense reimbursements.
The performance data quoted represent
past performance and cannot guarantee comparable future results; current performance may be lower or higher. Please visit invesco.com/performance for the most recent month-end performance. Performance figures reflect reinvested distributions, changes in net asset value and the effect of the maximum sales charge unless otherwise stated. Investment return and principal value will fluctuate so that you may have a gain or loss when you sell shares.
The net annual Fund operating expense ratio set forth in the most recent Fund prospectus as of the date of this report for Class A, Class B, Class C, Class R, Class Y, Investor Class, Class R5 and Class R6 shares was 0.95%, 1.70%, 1.70%, 1.20%, 0.70%, 0.88%, 0.59% and 0.55%, respectively.1 The total annual Fund operating expense ratio set forth in the most recent Fund prospectus as of the date of this report for Class A, Class B, Class C, Class R, Class Y, Investor Class, Class R5 and Class R6 shares was 0.97%, 1.72%, 1.72%, 1.22%, 0.72%, 0.90%, 0.59% and 0.55%, respectively. The expense ratios presented above may vary from the expense ratios presented in other sections of this report that are based on expenses incurred during the period covered by this report.
Class A share performance reflects the maximum 5.50% sales charge, and Class B and Class C share performance reflects the applicable contingent deferred sales charge (CDSC) for the period involved. The CDSC on Class B shares declines from 5% beginning at the time of purchase to 0% at the beginning of the seventh year. The CDSC on Class C shares is 1% for the first year after purchase. Class R, Class Y, Investor Class, Class R5 and Class R6 shares do not have a front-end sales charge or a CDSC; therefore, performance is at net asset value.
The performance of the Fund’s share classes will differ primarily due to different sales charge structures and class expenses.
Had the adviser not waived fees and/or reimbursed expenses in the past, performance would have been lower.
| 1 | Total annual Fund operating expenses after any contractual fee waivers and/or expense reimbursements by the adviser in effect through at least June 30, 2013. See current prospectus for more information. |
7 Invesco Diversified Dividend Fund
Invesco Diversified Dividend Fund’s investment objective is long-term growth of capital and, secondarily, current income.
| n | | Unless otherwise stated, information presented in this report is as of October 31, 2012, and is based on total net assets. |
| n | | Unless otherwise noted, all data provided by Invesco. |
| n | | To access your Fund’s reports/prospectus, visit invesco.com/fundreports. |
About share classes
| n | | Class B shares may not be purchased for new or additional investments. Please see the prospectus for more information. |
| n | | Class R shares are generally available only to employee benefit plans. Please see the prospectus for more information. |
| n | | Class Y shares are available only to certain investors. Please see the prospectus for more information. |
| n | | Investor Class shares are closed to new investors. Contact your financial adviser about purchasing our other share classes. Please see the prospectus for more information. |
| n | | Class R5 shares and Class R6 shares are primarily intended for retirement plans that meet certain standards and for institutional investors. On September 24, 2012, Institutional Class shares were renamed Class R5 shares. Please see the prospectus for more information. |
Principal risks of investing in the Fund
| n | | Call risk. If interest rates fall, it is possible that issuers of debt securities with high interest rates will prepay or call their securities before their maturity dates. In this event, the proceeds from the called securities would likely be reinvested by the Fund in securities bearing the new, lower interest rates, resulting in a possible decline in the Fund’s income and distributions to shareholders. |
| n | | Credit risk. The issuer of instruments in which the Fund invests may be unable to meet interest and/or principal payments, thereby causing its instruments to decrease in value and lowering the issuer’s credit rating. |
| n | | Currency/exchange rate risk. The dollar value of the Fund’s foreign investments will be affected by changes in the exchange rates between the dollar and the currencies in which those |
investments are traded.
| n | | Foreign securities risk. The Fund’s foreign investments may be affected by changes in a foreign country’s exchange rates; political and social instability; changes in economic or taxation policies; difficulties when enforcing obligations; decreased liquidity; and increased volatility. Foreign companies may be subject to less regulation resulting in less publicly available information about the companies. |
| n | | Interest rate risk. Interest rate risk refers to the risk that bond prices generally fall as interest rates rise; conversely, bond prices generally rise as interest rates fall. Specific bonds differ in their sensitivity to changes in interest rates depending on their individual characteristics, including duration. |
| n | | Large investor risk. The Fund may accept investments from funds of funds, as well as from similar investment vehicles, such as 529 Plans. From time to time, the Fund may experience large investments or redemptions due to allocations or rebalancings by these funds of funds and/or similar investment vehicles. While it is impossible to predict the overall impact of these transactions over time, there could be adverse effects on portfolio management. For example, the Fund may be required to sell securities or invest cash at times when it would not otherwise do so. These transactions could also have tax consequences if sales of securities result in gains, and could also increase transaction costs or portfolio turnover. |
| n | | Management risk. The investment techniques and risk analysis used by the Fund’s portfolio managers may not produce the desired results. |
| n | | Market risk. The prices of and the income generated by the Fund’s securities may decline in response to, among other things, investor sentiment, general economic and market |
conditions, regional or global instability, and currency and interest rate fluctuations.
| n | | Value investing style risk. The Fund emphasizes a value style of investing, which focuses on undervalued companies with characteristics for improved valuations. This style of investing is subject to the risk that the valuations never improve or that the returns on value equity securities are less than returns on other styles of investing or the overall stock market. Value stocks also may decline in price, even though in theory they are already underpriced. |
About indexes used in this report
| n | | The S&P 500® Index is an unmanaged index considered representative of the US stock market. |
| n | | The Russell 1000® Value Index is an unmanaged index considered representative of large-cap value stocks. The Russell 1000 Value Index is a trademark/service mark of the Frank Russell Co. Russell® is a trademark of the Frank Russell Co. |
| n | | The Russell 1000® Index is an unmanaged index considered representative of large-cap stocks. The Russell 1000 Index is a trademark/service mark of the Frank Russell Co. |
| n | | The Lipper Large-Cap Value Funds Index is an unmanaged index considered representative of large-cap value funds tracked by Lipper. |
| n | | The Lipper Large-Cap Core Funds Index is an unmanaged index considered representative of large-cap core funds tracked by Lipper. |
| n | | The Fund is not managed to track the performance of any particular index, including the index(es) defined here, and consequently, the performance of the Fund may deviate significantly from the performance of the index(es). |
continued on page 6
This report must be accompanied or preceded by a currently effective Fund prospectus, which contains more complete information, including sales charges and expenses. Investors should read it carefully before investing.
|
| NOT FDIC INSURED | MAY LOSE VALUE | NO BANK GUARANTEE |
Fund Nasdaq Symbols
| | | | |
Class A Shares | | | LCEAX | |
Class B Shares | | | LCEDX | |
Class C Shares | | | LCEVX | |
Class R Shares | | | DDFRX | |
Class Y Shares | | | LCEYX | |
Investor Class Shares | | | LCEIX | |
Class R5 Shares | | | DDFIX | |
Class R6 Shares | | | LCEFX | |
8 Invesco Diversified Dividend Fund
Schedule of Investments(a)
October 31, 2012
| | | | | | | | |
| | | Shares | | | Value | |
Common Stocks & Other Equity Interests–91.01% | |
Aerospace & Defense–4.28% | |
General Dynamics Corp. | | | 1,607,336 | | | $ | 109,427,435 | |
Raytheon Co. | | | 2,039,705 | | | | 115,365,715 | |
| | | | | 224,793,150 | |
|
Apparel Retail–0.55% | |
TJX Cos., Inc. (The) | | | 696,815 | | | | 29,008,408 | |
|
Apparel, Accessories & Luxury Goods–0.50% | |
Columbia Sportswear Co. | | | 467,963 | | | | 26,393,113 | |
|
Asset Management & Custody Banks–2.34% | |
Federated Investors, Inc.–Class B | | | 3,394,207 | | | | 78,881,370 | |
Legg Mason, Inc. | | | 1,735,016 | | | | 44,208,208 | |
| | | | | | | | 123,089,578 | |
|
Auto Parts & Equipment–1.36% | |
Johnson Controls, Inc. | | | 2,778,403 | | | | 71,543,877 | |
|
Brewers–2.84% | |
Heineken N.V. (Netherlands) | | | 2,426,110 | | | | 149,544,167 | |
|
Building Products–2.16% | |
Masco Corp. | | | 7,544,639 | | | | 113,848,603 | |
|
Casinos & Gaming–0.35% | |
International Game Technology | | | 1,440,377 | | | | 18,494,441 | |
|
Consumer Finance–0.94% | |
Capital One Financial Corp. | | | 818,519 | | | | 49,250,288 | |
|
Data Processing & Outsourced Services–1.82% | |
Automatic Data Processing, Inc. | | | 1,656,346 | | | | 95,720,235 | |
|
Distillers & Vintners–0.22% | |
Treasury Wine Estates (Australia) | | | 2,248,986 | | | | 11,503,182 | |
|
Drug Retail–1.76% | |
Walgreen Co. | | | 2,627,708 | | | | 92,574,153 | |
|
Electric Utilities–7.14% | |
American Electric Power Co., Inc. | | | 2,486,976 | | | | 110,521,213 | |
Duke Energy Corp. | | | 312,017 | | | | 20,496,397 | |
Entergy Corp. | | | 877,200 | | | | 63,667,176 | |
Exelon Corp. | | | 2,865,475 | | | | 102,526,696 | |
Pepco Holdings, Inc. | | | 2,367,033 | | | | 47,032,946 | |
PPL Corp. | | | 1,058,647 | | | | 31,314,778 | |
| | | | | | | | 375,559,206 | |
|
Food Distributors–1.88% | |
Sysco Corp. | | | 3,181,474 | | | | 98,848,397 | |
|
Gas Utilities–1.26% | |
AGL Resources Inc. | | | 1,623,133 | | | | 66,272,520 | |
| | | | | | | | |
| | | Shares | | | Value | |
General Merchandise Stores–2.21% | |
Target Corp. | | | 1,821,807 | | | $ | 116,140,196 | |
|
Health Care Equipment–2.84% | |
Medtronic, Inc. | | | 1,387,623 | | | | 57,697,365 | |
Stryker Corp. | | | 1,739,067 | | | | 91,474,924 | |
| | | | | | | | 149,172,289 | |
|
Hotels, Resorts & Cruise Lines–1.76% | |
Accor S.A. (France) | | | 926,720 | | | | 28,906,541 | |
Marriott International Inc. | | | 1,743,713 | | | | 63,610,650 | |
| | | | | | | | 92,517,191 | |
|
Household Products–4.50% | |
Kimberly-Clark Corp. | | | 1,620,454 | | | | 135,226,886 | |
Procter & Gamble Co. (The) | | | 1,464,418 | | | | 101,396,303 | |
| | | | | | | | 236,623,189 | |
|
Housewares & Specialties–1.19% | |
Newell Rubbermaid Inc. | | | 3,040,111 | | | | 62,747,891 | |
|
Industrial Machinery–1.88% | |
Pentair Ltd. | | | 2,346,647 | | | | 99,122,369 | |
|
Integrated Oil & Gas–1.75% | |
Exxon Mobil Corp. | | | 268,005 | | | | 24,434,016 | |
Total S.A. (France) | | | 1,346,783 | | | | 67,752,394 | |
| | | | | | | | 92,186,410 | |
|
Integrated Telecommunication Services–0.88% | |
AT&T Inc. | | | 1,331,612 | | | | 46,060,459 | |
|
Investment Banking & Brokerage–1.72% | |
Charles Schwab Corp. (The) | | | 6,668,741 | | | | 90,561,503 | |
|
Life & Health Insurance–2.69% | |
Lincoln National Corp. | | | 1,813,007 | | | | 44,944,444 | |
Prudential Financial, Inc. | | | 645,739 | | | | 36,839,410 | |
StanCorp Financial Group, Inc. | | | 1,737,690 | | | | 59,689,651 | |
| | | | | | | | 141,473,505 | |
|
Motorcycle Manufacturers–0.68% | |
Harley-Davidson, Inc. | | | 760,120 | | | | 35,543,211 | |
|
Movies & Entertainment–1.25% | |
Time Warner Inc. | | | 1,513,398 | | | | 65,757,143 | |
|
Multi-Utilities–3.24% | |
Dominion Resources, Inc. | | | 994,497 | | | | 52,489,552 | |
PG&E Corp. | | | 798,216 | | | | 33,940,144 | |
Sempra Energy | | | 1,200,060 | | | | 83,704,185 | |
| | | | | | | | 170,133,881 | |
|
Office Services & Supplies–0.92% | |
Avery Dennison Corp. | | | 1,491,138 | | | | 48,283,048 | |
See accompanying Notes to Financial Statements which are an integral part of the financial statements.
9 Invesco Diversified Dividend Fund
| | | | | | | | |
| | | Shares | | | Value | |
Packaged Foods & Meats–6.97% | |
Campbell Soup Co. | | | 2,801,966 | | | $ | 98,825,341 | |
General Mills, Inc. | | | 4,073,657 | | | | 163,272,172 | |
Kraft Foods Group, Inc.(b) | | | 670,567 | | | | 30,497,387 | |
Mead Johnson Nutrition Co. | | | 330,618 | | | | 20,385,906 | |
Mondelez International Inc.–Class A | | | 2,011,702 | | | | 53,390,571 | |
| | | | | | | | 366,371,377 | |
|
Paper Packaging–0.59% | |
Sonoco Products Co. | | | 990,817 | | | | 30,844,133 | |
|
Paper Products–1.43% | |
International Paper Co. | | | 2,101,288 | | | | 75,289,149 | |
|
Personal Products–0.94% | |
L’Oreal S.A. (France) | | | 385,523 | | | | 49,194,841 | |
|
Pharmaceuticals–4.37% | |
Bristol-Myers Squibb Co. | | | 751,448 | | | | 24,985,646 | |
Eli Lilly & Co. | | | 1,863,395 | | | | 90,616,899 | |
Johnson & Johnson | | | 1,411,746 | | | | 99,979,852 | |
Novartis AG (Switzerland) | | | 237,050 | | | | 14,287,266 | |
| | | | | | | | 229,869,663 | |
|
Property & Casualty Insurance–1.48% | |
Travelers Cos., Inc. (The) | | | 1,094,100 | | | | 77,615,454 | |
|
Regional Banks–8.39% | |
Cullen/Frost Bankers, Inc. | | | 399,781 | | | | 22,107,889 | |
Fifth Third Bancorp | | | 5,487,674 | | | | 79,735,903 | |
M&T Bank Corp. | | | 713,665 | | | | 74,292,527 | |
SunTrust Banks, Inc. | | | 5,815,361 | | | | 158,177,819 | |
Zions Bancorp. | | | 4,969,144 | | | | 106,687,522 | |
| | | | | | | | 441,001,660 | |
|
Restaurants–0.59% | |
Brinker International, Inc. | | | 1,013,229 | | | | 31,207,453 | |
| | | | | | | | |
| | | Shares | | | Value | |
Semiconductors–1.43% | |
Linear Technology Corp. | | | 128,496 | | | $ | 4,016,785 | |
Texas Instruments Inc. | | | 2,533,864 | | | | 71,176,240 | |
| | | | | | | | 75,193,025 | |
|
Soft Drinks–0.97% | |
Coca-Cola Co. (The) | | | 1,371,204 | | | | 50,981,365 | |
|
Specialized REIT’s–2.12% | |
Weyerhaeuser Co. | | | 4,018,608 | | | | 111,275,256 | |
|
Systems Software–1.15% | |
Microsoft Corp. | | | 2,112,059 | | | | 60,267,604 | |
|
Thrifts & Mortgage Finance–1.88% | |
Capitol Federal Financial Inc. | | | 35,067 | | | | 417,648 | |
Hudson City Bancorp, Inc. | | | 11,585,186 | | | | 98,300,303 | |
| | | | | | | | 98,717,951 | |
|
Tobacco–1.79% | |
Altria Group, Inc. | | | 2,089,483 | | | | 66,445,560 | |
Philip Morris International Inc. | | | 310,981 | | | | 27,540,477 | |
| | | | | | | | 93,986,037 | |
Total Common Stocks & Other Equity Interests (Cost $4,112,907,540) | | | | 4,784,580,571 | |
|
Money Market Funds–9.66% | |
Liquid Assets Portfolio–Institutional Class(c) | | | 254,005,573 | | | | 254,005,573 | |
Premier Portfolio–Institutional Class(c) | | | 254,005,573 | | | | 254,005,573 | |
Total Money Market Funds
(Cost $508,011,146) | | | | 508,011,146 | |
TOTAL INVESTMENTS–100.67% (Cost $4,620,918,686) | | | | 5,292,591,717 | |
OTHER ASSETS LESS LIABILITIES–(0.67)% | | | | (35,276,505 | ) |
NET ASSETS–100.00% | | | | | | $ | 5,257,315,212 | |
Investment Abbreviations:
| | | | |
| REIT | | — Real Estate Investment Trust | | |
Notes to Schedule of Investments:
| (a) | Industry and/or sector classifications used in this report are generally according to the Global Industry Classification Standard, which was developed by and is the exclusive property and a service mark of MSCI Inc. and Standard & Poor’s. |
| (b) | Non-income producing security. |
| (c) | The money market fund and the Fund are affiliated by having the same investment adviser. |
See accompanying Notes to Financial Statements which are an integral part of the financial statements.
10 Invesco Diversified Dividend Fund
Statement of Assets and Liabilities
October 31, 2012
| | | | |
Assets: | |
Investments, at value (Cost $4,112,907,540) | | $ | 4,784,580,571 | |
Investments in affiliated money market funds, at value and cost | | | 508,011,146 | |
Total investments, at value (Cost $4,620,918,686) | | | 5,292,591,717 | |
Cash | | | 3,007,502 | |
Foreign currencies, at value (Cost $699,487) | | | 707,998 | |
Receivable for: | | | | |
Investments sold | | | 711,267 | |
Fund shares sold | | | 17,445,759 | |
Dividends | | | 6,753,701 | |
Foreign currency contracts outstanding | | | 99,927 | |
Investment for trustee deferred compensation and retirement plans | | | 166,969 | |
Other assets | | | 88,378 | |
Total assets | | | 5,321,573,218 | |
|
Liabilities: | |
Payable for: | | | | |
Investments purchased | | | 53,351,737 | |
Fund shares reacquired | | | 6,876,357 | |
Accrued fees to affiliates | | | 3,061,186 | |
Accrued other operating expenses | | | 335,883 | |
Trustee deferred compensation and retirement plans | | | 632,843 | |
Total liabilities | | | 64,258,006 | |
Net assets applicable to shares outstanding | | $ | 5,257,315,212 | |
|
Net assets consist of: | |
Shares of beneficial interest | | $ | 4,547,992,876 | |
Undistributed net investment income | | | 7,553,285 | |
Undistributed net realized gain | | | 30,054,530 | |
Unrealized appreciation | | | 671,714,521 | |
| | | $ | 5,257,315,212 | |
| | | | |
Net Assets: | |
Class A | | $ | 2,520,209,093 | |
Class B | | $ | 35,400,543 | |
Class C | | $ | 153,466,645 | |
Class R | | $ | 37,948,062 | |
Class Y | | $ | 179,087,125 | |
Investor Class | | $ | 1,444,059,748 | |
Class R5 | | $ | 720,725,832 | |
Class R6 | | $ | 166,418,164 | |
|
Shares outstanding, $0.001 par value per share,
with an unlimited number of shares authorized: | |
Class A | | | 186,130,679 | |
Class B | | | 2,642,202 | |
Class C | | | 11,466,654 | |
Class R | | | 2,794,841 | |
Class Y | | | 13,211,104 | |
Investor Class | | | 106,722,338 | |
Class R5 | | | 53,227,445 | |
Class R6 | | | 12,288,824 | |
Class A: | | | | |
Net asset value per share | | $ | 13.54 | |
Maximum offering price per share | | | | |
(Net asset value of $13.54 ¸ 94.50%) | | $ | 14.33 | |
Class B: | | | | |
Net asset value and offering price per share | | $ | 13.40 | |
Class C: | | | | |
Net asset value and offering price per share | | $ | 13.38 | |
Class R: | | | | |
Net asset value and offering price per share | | $ | 13.58 | |
Class Y: | | | | |
Net asset value and offering price per share | | $ | 13.56 | |
Investor Class: | | | | |
Net asset value and offering price per share | | $ | 13.53 | |
Class R5: | | | | |
Net asset value and offering price per share | | $ | 13.54 | |
Class R6: | | | | |
Net asset value and offering price per share | | $ | 13.54 | |
See accompanying Notes to Financial Statements which are an integral part of the financial statements.
11 Invesco Diversified Dividend Fund
Statement of Operations
For the year ended October 31, 2012
| | | | |
Investment income: | |
Dividends (net of foreign withholding taxes of $1,322,866) | | $ | 124,476,602 | |
Dividends from affiliated money market funds | | | 597,499 | |
Interest | | | 15,285 | |
Total investment income | | | 125,089,386 | |
| |
Expenses: | | | | |
Advisory fees | | | 22,154,019 | |
Administrative services fees | | | 640,155 | |
Custodian fees | | | 99,051 | |
Distribution fees: | | | | |
Class A | | | 5,758,452 | |
Class B | | | 363,433 | |
Class C | | | 1,353,989 | |
Class R | | | 143,902 | |
Investor Class | | | 3,212,416 | |
Transfer agent fees — A, B, C, R, Y and Investor | | | 6,283,378 | |
Transfer agent fees — R5 | | | 397,204 | |
Trustees’ and officers’ fees and benefits | | | 269,570 | |
Other | | | 714,825 | |
Total expenses | | | 41,390,394 | |
Less: Fees waived and expense offset arrangement(s) | | | (608,446 | ) |
Net expenses | | | 40,781,948 | |
Net investment income | | | 84,307,438 | |
| |
Realized and unrealized gain (loss) from: | | | | |
Net realized gain from: | | | | |
Investment securities (includes net gains from securities sold to affiliates of $95,460) | | | 86,469,095 | |
Foreign currencies | | | 3,043,557 | |
Foreign currency contracts | | | 2,972,020 | |
| | | | 92,484,672 | |
Change in net unrealized appreciation (depreciation) of: | | | | |
Investment securities | | | 554,676,873 | |
Foreign currencies | | | (516,882 | ) |
Foreign currency contracts | | | 99,927 | |
| | | | 554,259,918 | |
Net realized and unrealized gain | | | 646,744,590 | |
Net increase in net assets resulting from operations | | $ | 731,052,028 | |
See accompanying Notes to Financial Statements which are an integral part of the financial statements.
12 Invesco Diversified Dividend Fund
Statement of Changes in Net Assets
For the years ended October 31, 2012 and 2011
| | | | | | | | |
| | | 2012 | | | 2011 | |
Operations: | | | | | | | | |
Net investment income | | $ | 84,307,438 | | | $ | 46,366,446 | |
Net realized gain | | | 92,484,672 | | | | 104,198,185 | |
Change in net unrealized appreciation (depreciation) | | | 554,259,918 | | | | (166,350,387 | ) |
Net increase (decrease) in net assets resulting from operations | | | 731,052,028 | | | | (15,785,756 | ) |
| | |
Distributions to shareholders from net investment income: | | | | | | | | |
Class A | | | (40,822,555 | ) | | | (16,512,966 | ) |
Class B | | | (377,286 | ) | | | (446,683 | ) |
Class C | | | (1,402,210 | ) | | | (924,157 | ) |
Class R | | | (436,894 | ) | | | (204,682 | ) |
Class Y | | | (3,068,253 | ) | | | (1,793,839 | ) |
Investor Class | | | (24,043,716 | ) | | | (23,708,603 | ) |
Class R5 | | | (13,890,176 | ) | | | (7,530,265 | ) |
Total distributions from net investment income | | | (84,041,090 | ) | | | (51,121,195 | ) |
| | |
Distributions to shareholders from net realized gains: | | | | | | | | |
Class A | | | (24,765,802 | ) | | | — | |
Class B | | | (425,577 | ) | | | — | |
Class C | | | (1,431,013 | ) | | | — | |
Class R | | | (242,314 | ) | | | — | |
Class Y | | | (1,512,055 | ) | | | — | |
Investor Class | | | (14,522,561 | ) | | | — | |
Class R5 | | | (5,429,234 | ) | | | — | |
Total distributions from net realized gains | | | (48,328,556 | ) | | | — | |
| | |
Share transactions-net: | | | | | | | | |
Class A | | | 103,451,976 | | | | 1,816,230,981 | |
Class B | | | (6,081,024 | ) | | | 3,813,410 | |
Class C | | | 16,093,826 | | | | 70,079,020 | |
Class R | | | 15,023,251 | | | | 11,604,617 | |
Class Y | | | 28,437,333 | | | | 107,001,695 | |
Investor Class | | | 19,994,923 | | | | 150,949,067 | |
Class R5 | | | 187,983,114 | | | | 187,308,657 | |
Class R6 | | | 167,260,971 | | | | — | |
Net increase in net assets resulting from share transactions | | | 532,164,370 | | | | 2,346,987,447 | |
Net increase in net assets | | | 1,130,846,752 | | | | 2,280,080,496 | |
| | |
Net assets: | | | | | | | | |
Beginning of year | | | 4,126,468,460 | | | | 1,846,387,964 | |
End of year (includes undistributed net investment income of $7,553,285 and $4,198,949, respectively) | | $ | 5,257,315,212 | | | $ | 4,126,468,460 | |
Notes to Financial Statements
October 31, 2012
NOTE 1—Significant Accounting Policies
Invesco Diversified Dividend Fund (the “Fund”) is a series portfolio of AIM Equity Funds (Invesco Equity Funds) (the “Trust”). The Trust is a Delaware statutory trust registered under the Investment Company Act of 1940, as amended (the “1940 Act”), as an open-end series management investment company consisting of five separate portfolios, each authorized to issue an unlimited number of shares of beneficial interest. The assets, liabilities and operations of each portfolio are accounted for separately. Information presented in these financial statements pertains only to the Fund. Matters affecting each portfolio or class will be voted on exclusively by the shareholders of such portfolio or class.
The Fund’s investment objective is long-term growth of capital and, secondarily, current income.
13 Invesco Diversified Dividend Fund
The Fund currently consists of eight different classes of shares: Class A, Class B, Class C, Class R, Class Y, Investor Class, Class R5 and Class R6. On September 24, 2012, Institutional Class shares were renamed Class R5 shares and the Fund began offering Class R6 shares. Investor Class shares of the Fund are offered only to certain grandfathered investors. Class A shares are sold with a front-end sales charge unless certain waiver criteria are met and under certain circumstances load waived shares may be subject to contingent deferred sales charges (“CDSC”). Class C shares are sold with a CDSC. Class R, Class Y, Investor Class, Class R5 and Class R6 shares are sold at net asset value. Effective November 30, 2010, new or additional investments in Class B shares are no longer permitted. Existing shareholders of Class B shares may continue to reinvest dividends and capital gains distributions in Class B shares until they convert to Class A shares. Also, shareholders in Class B shares will be able to exchange those shares for Class B shares of other Invesco Funds offering such shares until they convert to Class A shares. Generally, Class B shares will automatically convert to Class A shares on or about the month-end, which is at least eight years after the date of purchase. Redemption of Class B shares prior to the conversion date will be subject to a CDSC.
The following is a summary of the significant accounting policies followed by the Fund in the preparation of its financial statements.
| A. | Security Valuations — Securities, including restricted securities, are valued according to the following policy. |
A security listed or traded on an exchange (except convertible bonds) is valued at its last sales price or official closing price as of the close of the customary trading session on the exchange where the security is principally traded, or lacking any sales or official closing price on a particular day, the security may be valued at the closing bid price on that day. Securities traded in the over-the-counter market are valued based on prices furnished by independent pricing services or market makers. When such securities are valued by an independent pricing service they may be considered fair valued. Futures contracts are valued at the final settlement price set by an exchange on which they are principally traded. Listed options are valued at the mean between the last bid and ask prices from the exchange on which they are principally traded. Options not listed on an exchange are valued by an independent source at the mean between the last bid and ask prices. For purposes of determining net asset value per share, futures and option contracts generally are valued 15 minutes after the close of the customary trading session of the New York Stock Exchange (“NYSE”).
Investments in open-end and closed-end registered investment companies that do not trade on an exchange are valued at the end of day net asset value per share. Investments in open-end and closed-end registered investment companies that trade on an exchange are valued at the last sales price or official closing price as of the close of the customary trading session on the exchange where the security is principally traded.
Debt obligations (including convertible bonds) and unlisted equities are fair valued using an evaluated quote provided by an independent pricing service. Evaluated quotes provided by the pricing service may be determined without exclusive reliance on quoted prices, and may reflect appropriate factors such as institution-size trading in similar groups of securities, developments related to specific securities, dividend rate, yield, quality, type of issue, coupon rate, maturity, individual trading characteristics and other market data. Debt securities are subject to interest rate and credit risks. In addition, all debt securities involve some risk of default with respect to interest and/or principal payments.
Foreign securities (including foreign exchange contracts) are converted into U.S. dollar amounts using the applicable exchange rates as of the close of the NYSE. If market quotations are available and reliable for foreign exchange traded equity securities, the securities will be valued at the market quotations. Because trading hours for certain foreign securities end before the close of the NYSE, closing market quotations may become unreliable. If between the time trading ends on a particular security and the close of the customary trading session on the NYSE, events occur that are significant and make the closing price unreliable, the Fund may fair value the security. If the event is likely to have affected the closing price of the security, the security will be valued at fair value in good faith using procedures approved by the Board of Trustees. Adjustments to closing prices to reflect fair value may also be based on a screening process of an independent pricing service to indicate the degree of certainty, based on historical data, that the closing price in the principal market where a foreign security trade is not the current value as of the close of the NYSE. Foreign securities meeting the approved degree of certainty that the price is not reflective of current value will be priced at the indication of fair value from the independent pricing service. Multiple factors may be considered by the independent pricing service in determining adjustments to reflect fair value and may include information relating to sector indices, American Depositary Receipts and domestic and foreign index futures. Foreign securities may have additional risks including exchange rate changes, potential for sharply devalued currencies and high inflation, political and economic upheaval, the relative lack of issuer information, relatively low market liquidity and the potential lack of strict financial and accounting controls and standards.
Securities for which market prices are not provided by any of the above methods may be valued based upon quotes furnished by independent sources. The last bid price may be used to value equity securities. The mean between the last bid and asked prices is used to value debt obligations, including corporate loans.
Securities for which market quotations are not readily available or are unreliable are valued at fair value as determined in good faith by or under the supervision of the Trust’s officers following procedures approved by the Board of Trustees. Issuer specific events, market trends, bid/ask quotes of brokers and information providers and other market data may be reviewed in the course of making a good faith determination of a security’s fair value.
Valuations change in response to many factors including the historical and prospective earnings of the issuer, the value of the issuer’s assets, general economic conditions, interest rates, investor perceptions and market liquidity. Because of the inherent uncertainties of valuation, the values reflected in the financial statements may materially differ from the value received upon actual sale of those investments.
| B. | Securities Transactions and Investment Income — Securities transactions are accounted for on a trade date basis. Realized gains or losses on sales are computed on the basis of specific identification of the securities sold. Interest income is recorded on the accrual basis from settlement date. Dividend income (net of withholding tax, if any) is recorded on the ex-dividend date. |
The Fund may periodically participate in litigation related to Fund investments. As such, the Fund may receive proceeds from litigation settlements. Any proceeds received are included in the Statement of Operations as realized gain (loss) for investments no longer held and as unrealized gain (loss) for investments still held.
Brokerage commissions and mark ups are considered transaction costs and are recorded as an increase to the cost basis of securities purchased and/or a reduction of proceeds on a sale of securities. Such transaction costs are included in the determination of net realized and unrealized gain (loss) from investment securities reported in the Statement of Operations and the Statement of Changes in Net Assets and the net realized and unrealized gains (losses) on securities per share in the Financial Highlights. Transaction costs are included in the calculation of the Fund’s net asset value and, accordingly, they reduce the Fund’s total returns. These transaction costs are not considered operating expenses and
14 Invesco Diversified Dividend Fund
are not reflected in net investment income reported in the Statement of Operations and Statement of Changes in Net Assets, or the net investment income per share and ratios of expenses and net investment income reported in the Financial Highlights, nor are they limited by any expense limitation arrangements between the Fund and the investment adviser.
The Fund allocates income and realized and unrealized capital gains and losses to a class based on the relative net assets of each class.
| C. | Country Determination — For the purposes of making investment selection decisions and presentation in the Schedule of Investments, the investment adviser may determine the country in which an issuer is located and/or credit risk exposure based on various factors. These factors include the laws of the country under which the issuer is organized, where the issuer maintains a principal office, the country in which the issuer derives 50% or more of its total revenues and the country that has the primary market for the issuer’s securities, as well as other criteria. Among the other criteria that may be evaluated for making this determination are the country in which the issuer maintains 50% or more of its assets, the type of security, financial guarantees and enhancements, the nature of the collateral and the sponsor organization. Country of issuer and/or credit risk exposure has been determined to be the United States of America, unless otherwise noted. |
| D. | Distributions — Distributions from income are declared and paid quarterly and are recorded on the ex-dividend date. Distributions from net realized capital gain, if any, are generally declared and paid annually and recorded on the ex-dividend date. The Fund may elect to treat a portion of the proceeds from redemptions as distributions for federal income tax purposes. |
| E. | Federal Income Taxes — The Fund intends to comply with the requirements of Subchapter M of the Internal Revenue Code necessary to qualify as a regulated investment company and to distribute substantially all of the Fund’s taxable earnings to shareholders. As such, the Fund will not be subject to federal income taxes on otherwise taxable income (including net realized capital gain) that is distributed to shareholders. Therefore, no provision for federal income taxes is recorded in the financial statements. |
The Fund files tax returns in the U.S. Federal jurisdiction and certain other jurisdictions. Generally, the Fund is subject to examinations by such taxing authorities for up to three years after the filing of the return for the tax period.
| F. | Expenses — Fees provided for under the Rule 12b-1 plan of a particular class of the Fund are charged to the operations of such class. Transfer agency fees and expenses and other shareholder recordkeeping fees and expenses attributable to Class R5 and Class R6 are allocated to each share class based on relative net assets. Sub-accounting fees attributable to Class R5 are charged to the operations of the class. Transfer agency fees and expenses and other shareholder recordkeeping fees and expenses relating to all other classes are allocated among those classes based on relative net assets. All other expenses are allocated among the classes based on relative net assets. |
| G. | Accounting Estimates — The preparation of financial statements in conformity with accounting principles generally accepted in the United States of America (“GAAP”) requires management to make estimates and assumptions that affect the reported amounts of assets and liabilities at the date of the financial statements and the reported amounts of revenues and expenses during the reporting period including estimates and assumptions related to taxation. Actual results could differ from those estimates by a significant amount. In addition, the Fund monitors for material events or transactions that may occur or become known after the period-end date and before the date the financial statements are released to print. |
| H. | Indemnifications — Under the Trust’s organizational documents, each Trustee, officer, employee or other agent of the Trust is indemnified against certain liabilities that may arise out of the performance of their duties to the Fund. Additionally, in the normal course of business, the Fund enters into contracts, including the Fund’s servicing agreements, that contain a variety of indemnification clauses. The Fund’s maximum exposure under these arrangements is unknown as this would involve future claims that may be made against the Fund that have not yet occurred. The risk of material loss as a result of such indemnification claims is considered remote. |
| I. | Foreign Currency Translations — Foreign currency is valued at the close of the NYSE based on quotations posted by banks and major currency dealers. Portfolio securities and other assets and liabilities denominated in foreign currencies are translated into U.S. dollar amounts at date of valuation. Purchases and sales of portfolio securities (net of foreign taxes withheld on disposition) and income items denominated in foreign currencies are translated into U.S. dollar amounts on the respective dates of such transactions. The Fund does not separately account for the portion of the results of operations resulting from changes in foreign exchange rates on investments and the fluctuations arising from changes in market prices of securities held. The combined results of changes in foreign exchange rates and the fluctuation of market prices on investments (net of estimated foreign tax withholding) are included with the net realized and unrealized gain or loss from investments in the Statement of Operations. Reported net realized foreign currency gains or losses arise from (1) sales of foreign currencies, (2) currency gains or losses realized between the trade and settlement dates on securities transactions, and (3) the difference between the amounts of dividends, interest, and foreign withholding taxes recorded on the Fund’s books and the U.S. dollar equivalent of the amounts actually received or paid. Net unrealized foreign currency gains and losses arise from changes in the fair values of assets and liabilities, other than investments in securities at fiscal period end, resulting from changes in exchange rates. |
The Fund may invest in foreign securities which may be subject to foreign taxes on income, gains on investments or currency repatriation, a portion of which may be recoverable.
| J. | Foreign Currency Contracts — The Fund may enter into foreign currency contracts to manage or minimize currency or exchange rate risk. The Fund may also enter into foreign currency contracts for the purchase or sale of a security denominated in a foreign currency in order to “lock in” the U.S. dollar price of that security. A foreign currency contract is an obligation to purchase or sell a specific currency for an agreed-upon price at a future date. The use of foreign currency contracts does not eliminate fluctuations in the price of the underlying securities the Fund owns or intends to acquire but establishes a rate of exchange in advance. Fluctuations in the value of these contracts are measured by the difference in the contract date and reporting date exchange rates and are recorded as unrealized appreciation (depreciation) until the contracts are closed. When the contracts are closed, realized gains (losses) are recorded. Realized and unrealized gains (losses) on the contracts are included in the Statement of Operations. The primary risks associated with foreign currency contracts include failure of the counterparty to meet the terms of the contract and the value of the foreign currency changing unfavorably. These risks may be in excess of the amounts reflected in the Statement of Assets and Liabilities. |
15 Invesco Diversified Dividend Fund
NOTE 2—Advisory Fees and Other Fees Paid to Affiliates
The Trust has entered into a master investment advisory agreement with Invesco Advisers, Inc. (the “Adviser” or “Invesco”). Under the terms of the investment advisory agreement, the Fund pays an advisory fee to the Adviser based on the annual rate of the Fund’s average daily net assets as follows:
| | | | | | |
| Average Daily Net Assets | | Rate |
First $350 million | | | 0 | .60% | | |
Next $350 million | | | 0 | .55% | | |
Next $1.3 billion | | | 0 | .50% | | |
Next $2 billion | | | 0 | .45% | | |
Next $2 billion | | | 0 | .40% | | |
Next $2 billion | | | 0 | .375% | | |
Over $8 billion | | | 0 | .35% | | |
Under the terms of a master sub-advisory agreement between the Adviser and each of Invesco Asset Management Deutschland GmbH, Invesco Asset Management Limited, Invesco Asset Management (Japan) Limited, Invesco Australia Limited, Invesco Hong Kong Limited, Invesco Senior Secured Management, Inc. and Invesco Canada Ltd. (collectively, the “Affiliated Sub-Advisers”) the Adviser, not the Fund, may pay 40% of the fees paid to the Adviser to any such Affiliated Sub-Adviser(s) that provide discretionary investment management services to the Fund based on the percentage of assets allocated to such Sub-Adviser(s).
The Adviser has contractually agreed, through at least June 30, 2013, to waive advisory fees and/or reimburse expenses of all shares to the extent necessary to limit total annual fund operating expenses after fee waiver and/or expense reimbursement (excluding certain items discussed below) of Class A, Class B, Class C, Class R, Class Y, Investor Class, Class R5 and Class R6 shares to 0.95%, 1.70%, 1.70%, 1.20%, 0.70%, 0.95%, 0.70% and 0.70%, respectively, of average daily net assets. In determining the Adviser’s obligation to waive advisory fees and/or reimburse expenses, the following expenses are not taken into account, and could cause the total annual fund operating expenses after fee waiver and/or expense reimbursement to exceed the numbers reflected above: (1) interest; (2) taxes; (3) dividend expense on short sales; (4) extraordinary or non-routine items, including litigation expenses; and (5) expenses that the Fund has incurred but did not actually pay because of an expense offset arrangement. Unless the Board of Trustees and Invesco mutually agree to amend or continue the fee waiver agreement, it will terminate on June 30, 2013. The Adviser did not waive fees and/or reimburse expenses during the period under this expense limitation.
Further, the Adviser has contractually agreed, through at least June 30, 2013, to waive the advisory fee payable by the Fund in an amount equal to 100% of the net advisory fees the Adviser receives from the affiliated money market funds on investments by the Fund of uninvested cash in such affiliated money market funds.
For the year ended October 31, 2012, the Adviser waived advisory fees of $597,984.
The Trust has entered into a master administrative services agreement with Invesco pursuant to which the Fund has agreed to pay Invesco for certain administrative costs incurred in providing accounting services to the Fund. For the year ended October 31, 2012, expenses incurred under the agreement are shown in the Statement of Operations as Administrative services fees.
The Trust has entered into a transfer agency and service agreement with Invesco Investment Services, Inc. (“IIS”) pursuant to which the Fund has agreed to pay IIS a fee for providing transfer agency and shareholder services to the Fund and reimburse IIS for certain expenses incurred by IIS in the course of providing such services. IIS may make payments to intermediaries that provide omnibus account services, sub-accounting services and/or networking services. All fees payable by IIS to intermediaries that provide omnibus account services or sub-accounting are charged back to the Fund, subject to certain limitations approved by the Trust’s Board of Trustees. For the year ended October 31, 2012, expenses incurred under the agreement are shown in the Statement of Operations as Transfer agent fees.
The Trust has entered into master distribution agreements with Invesco Distributors, Inc. (“IDI”) to serve as the distributor for the Class A, Class B, Class C, Class R, Class Y, Investor Class, Class R5 and Class R6 shares of the Fund. The Trust has adopted plans pursuant to Rule 12b-1 under the 1940 Act with respect to the Fund’s Class A, Class B, Class C, Class R and Investor Class shares (collectively, the “Plans”). The Fund, pursuant to the Plans, pays IDI compensation at the annual rate of 0.25% of the Fund’s average daily net assets of Class A shares, 1.00% of the average daily net assets of Class B and Class C shares and 0.50% of the average daily net assets of Class R shares. The Fund, pursuant to the Investor Class Plan, reimburses IDI for its allocated share of expenses incurred pursuant to the Investor Class Plan for the period, up to a maximum annual rate of 0.25% of the average daily net assets of Investor Class shares. Of the Plan payments, up to 0.25% of the average daily net assets of each class of shares may be paid to furnish continuing personal shareholder services to customers who purchase and own shares of such classes. Any amounts not paid as a service fee under the Plans would constitute an asset-based sales charge. Rules of the Financial Industry Regulatory Authority (“FINRA”) impose a cap on the total sales charges, including asset-based sales charges, that may be paid by any class of shares of the Fund. For the year ended October 31, 2012, expenses incurred under the Plans are shown in the Statement of Operations as Distribution fees.
Front-end sales commissions and CDSC (collectively, the “sales charges”) are not recorded as expenses of the Fund. Front-end sales commissions are deducted from proceeds from the sales of Fund shares prior to investment in Class A shares of the Fund. CDSC are deducted from redemption proceeds prior to remittance to the shareholder. During the year ended October 31, 2012, IDI advised the Fund that IDI retained $618,150 in front-end sales commissions from the sale of Class A shares and $11,399, $37,499 and $12,883 from Class A, Class B and Class C shares, respectively, for CDSC imposed on redemptions by shareholders.
Certain officers and trustees of the Trust are officers and directors of the Adviser, IIS and/or IDI.
16 Invesco Diversified Dividend Fund
NOTE 3—Additional Valuation Information
GAAP defines fair value as the price that would be received to sell an asset or paid to transfer a liability in an orderly transaction between market participants at the measurement date, under current market conditions. GAAP establishes a hierarchy that prioritizes the inputs to valuation methods giving the highest priority to readily available unadjusted quoted prices in an active market for identical assets (Level 1) and the lowest priority to significant unobservable inputs (Level 3) generally when market prices are not readily available or are unreliable. Based on the valuation inputs, the securities or other investments are tiered into one of three levels. Changes in valuation methods may result in transfers in or out of an investment’s assigned level:
| | Level 1 — | Prices are determined using quoted prices in an active market for identical assets. |
| | Level 2 — | Prices are determined using other significant observable inputs. Observable inputs are inputs that other market participants may use in pricing a security. These may include quoted prices for similar securities, interest rates, prepayment speeds, credit risk, yield curves, loss severities, default rates, discount rates, volatilities and others. |
| | Level 3 — | Prices are determined using significant unobservable inputs. In situations where quoted prices or observable inputs are unavailable (for example, when there is little or no market activity for an investment at the end of the period), unobservable inputs may be used. Unobservable inputs reflect the Fund’s own assumptions about the factors market participants would use in determining fair value of the securities or instruments and would be based on the best available information. |
The following is a summary of the tiered valuation input levels, as of October 31, 2012. The level assigned to the securities valuations may not be an indication of the risk or liquidity associated with investing in those securities. Because of the inherent uncertainties of valuation, the values reflected in the financial statements may materially differ from the value received upon actual sale of those investments.
During the year ended October 31, 2012, there were transfers from Level 1 to Level 2 of $63,482,107 and from Level 2 to Level 1 of $178,450,708, due to foreign fair value adjustments.
| | | | | | | | | | | | | | | | |
| | | Level 1 | | | Level 2 | | | Level 3 | | | Total | |
Equity Securities | | $ | 5,217,606,428 | | | $ | 74,985,289 | | | $ | — | | | $ | 5,292,591,717 | |
Foreign Currency Contracts* | | | — | | | | 99,927 | | | | — | | | | 99,927 | |
Total Investments | | $ | 5,217,606,428 | | | $ | 75,085,216 | | | $ | — | | | $ | 5,292,691,644 | |
| * | Unrealized appreciation. |
NOTE 4—Derivative Investments
Value of Derivative Instruments at Period-End
The table below summarizes the value of the Fund’s derivative instruments, detailed by primary risk exposure, held as of October 31, 2012:
| | | | | | | | |
| | | Value | |
| Risk Exposure/Derivative Type | | Assets | | | Liabilities | |
Currency risk | | | | | | | | |
Foreign currency contracts(a) | | $ | 99,927 | | | $ | — | |
| (a) | Values are disclosed on the Statement of Assets and Liabilities under Foreign currency contracts outstanding. |
Effect of Derivative Instruments for the year ended October 31, 2012
The table below summarizes the gains on derivative instruments, detailed by primary risk exposure, recognized in earnings during the period:
| | | | |
| | | Location of Gain on
Statement of Operations | |
| | Foreign Currency
Contracts* | |
Realized Gain | | | | |
Currency risk | | $ | 2,972,020 | |
Change in Unrealized Appreciation | | | | |
Currency risk | | $ | 99,927 | |
Total | | $ | 3,071,947 | |
| * | The average notional value of foreign currency contracts outstanding during the period was $71,293,517. |
| | | | | | | | | | | | | | | | | | | | | | | | | | |
| Open Foreign Currency Contracts | |
| | | | | Contract to | | | Notional
Value | | | Unrealized
Appreciation | |
Settlement
Date | | Counterparty | | Deliver | | | Receive | | | |
11/30/12 | | State Street | | | EUR | | | | 103,230,482 | | | | USD | | | | 133,917,807 | | | $ | 133,817,880 | | | $ | 99,927 | |
| | |
| Currency Abbreviations: |
| EUR | | – Euro |
| USD | | – U.S. Dollar |
17 Invesco Diversified Dividend Fund
NOTE 5—Security Transactions with Affiliated Funds
The Fund is permitted to purchase or sell securities from or to certain other Invesco Funds under specified conditions outlined in procedures adopted by the Board of Trustees of the Trust. The procedures have been designed to ensure that any purchase or sale of securities by the Fund from or to another fund or portfolio that is or could be considered an affiliate by virtue of having a common investment adviser (or affiliated investment advisers), common Trustees and/or common officers complies with Rule 17a-7 of the 1940 Act. Further, as defined under the procedures, each transaction is effected at the current market price. Pursuant to these procedures, for the year ended October 31, 2012, the Fund engaged in securities purchases of $7,580,056 and securities sales of $232,231, which resulted in net realized gains of $95,460.
NOTE 6—Expense Offset Arrangement(s)
The expense offset arrangement is comprised of transfer agency credits which result from balances in Demand Deposit Accounts (DDA) used by the transfer agent for clearing shareholder transactions. For the year ended October 31, 2012, the Fund received credits from this arrangement, which resulted in the reduction of the Fund’s total expenses of $10,462.
NOTE 7—Trustees’ and Officers’ Fees and Benefits
“Trustees’ and Officers’ Fees and Benefits” include amounts accrued by the Fund to pay remuneration to certain Trustees and Officers of the Fund. Trustees have the option to defer compensation payable by the Fund, and “Trustees’ and Officers’ Fees and Benefits” also include amounts accrued by the Fund to fund such deferred compensation amounts. Those Trustees who defer compensation have the option to select various Invesco Funds in which their deferral accounts shall be deemed to be invested. Finally, certain current Trustees are eligible to participate in a retirement plan that provides for benefits to be paid upon retirement to Trustees over a period of time based on the number of years of service. The Fund may have certain former Trustees who also participate in a retirement plan and receive benefits under such plan. “Trustees’ and Officers’ Fees and Benefits” include amounts accrued by the Fund to fund such retirement benefits. Obligations under the deferred compensation and retirement plans represent unsecured claims against the general assets of the Fund.
During the year ended October 31, 2012, the Fund paid legal fees of $526 for services rendered by Kramer, Levin, Naftalis & Frankel LLP as counsel to the Independent Trustees. A partner of that firm is a Trustee of the Trust.
NOTE 8—Cash Balances
The Fund is permitted to temporarily carry a negative or overdrawn balance in its account with State Street Bank and Trust Company, the custodian bank. Such balances, if any at period end, are shown in the Statement of Assets and Liabilities under the payable caption Amount due custodian. To compensate the custodian bank for such overdrafts, the overdrawn Fund may either (1) leave funds as a compensating balance in the account so the custodian bank can be compensated by earning the additional interest; or (2) compensate by paying the custodian bank at a rate agreed upon by the custodian bank and Invesco, not to exceed the contractually agreed upon rate.
NOTE 9—Distributions to Shareholders and Tax Components of Net Assets
Tax Character of Distributions to Shareholders Paid During the Years Ended October 31, 2012 and 2011:
| | | | | | | | |
| | | 2012 | | | 2011 | |
Ordinary income | | $ | 84,041,090 | | | $ | 51,121,195 | |
Long-term capital gain | | | 48,328,556 | | | | — | |
Total distributions | | $ | 132,369,646 | | | $ | 51,121,195 | |
Tax Components of Net Assets at Period-End:
| | | | |
| | | 2012 | |
Undistributed ordinary income | | $ | 15,865,084 | |
Undistributed long-term gain | | | 73,344,715 | |
Net unrealized appreciation — investments | | | 671,402,411 | |
Net unrealized appreciation (depreciation) — other investments | | | (58,437 | ) |
Temporary book/tax differences | | | (609,248 | ) |
Capital loss carryforward | | | (50,622,189 | ) |
Shares of beneficial interest | | | 4,547,992,876 | |
Total net assets | | $ | 5,257,315,212 | |
The difference between book-basis and tax-basis unrealized appreciation (depreciation) is due to differences in the timing of recognition of gains and losses on investments for tax and book purposes. The Fund’s net unrealized appreciation (depreciation) difference is attributable primarily to wash sales and foreign currency transactions.
The temporary book/tax differences are a result of timing differences between book and tax recognition of income and/or expenses. The Fund’s temporary book/tax differences are the result of the trustee deferral of compensation and retirement plan benefits.
Capital loss carryforward is calculated and reported as of a specific date. Results of transactions and other activity after that date may affect the amount of capital loss carryforward actually available for the Fund to utilize. The Regulated Investment Company Modernization Act of 2010 (the “Act”) eliminated the eight-year carryover period for capital losses that arise in taxable years beginning after its enactment date of December 22, 2010. Consequently, these capital losses can be carried forward for an unlimited period. However, capital losses with an expiration
18 Invesco Diversified Dividend Fund
period may not be used to offset capital gains until all net capital losses without an expiration date have been utilized. Additionally, post-enactment capital loss carryovers will retain their character as either short-term or long-term capital losses instead of as short-term capital losses as under prior law. The ability to utilize capital loss carryforward in the future may be limited under the Internal Revenue Code and related regulations based on the results of future transactions. Under these limitation rules, the Fund is limited to utilizing $8,514,951 capital loss carryforward in the fiscal year ending October 31, 2013.
The Fund utilized $8,514,951 of capital loss carryforward in the current period to offset net realized capital gain for federal income tax purposes. The Fund has a capital loss carryforward as of October 31, 2012, which expires as follows:
| | | | | | | | | | | | |
| Capital Loss Carryforward* | |
| Expiration | | Short-Term | | | Long-Term | | | Total | |
October 31, 2015 | | $ | 5,659,882 | | | $ | — | | | $ | 5,659,882 | |
October 31, 2016 | | | 15,714,877 | | | | — | | | | 15,714,877 | |
October 31, 2017 | | | 28,049,390 | | | | — | | | | 28,049,390 | |
Not subject to expiration | | | 1,198,040 | | | | — | | | | 1,198,040 | |
| | | $ | 50,622,189 | | | $ | — | | | $ | 50,622,189 | |
| * | Capital loss carryforward as of the date listed above is reduced for limitations, if any, to the extent required by the Internal Revenue Code. To the extent that unrealized gains as of May 23, 2011, the date of reorganization of Invesco Financial Services Fund and Invesco Van Kampen Core Equity Fund and July 18, 2011, the date of reorganization of Invesco Dividend Growth Securities Fund into the Fund are realized on securities held in each fund at such date of reorganization, the capital loss carryforward may be further limited for up to five years from the dates of the reorganization. |
NOTE 10—Investment Securities
The aggregate amount of investment securities (other than short-term securities, U.S. Treasury obligations and money market funds, if any) purchased and sold by the Fund during the year ended October 31, 2012 was $853,563,885 and $540,119,384, respectively. Cost of investments on a tax basis includes the adjustments for financial reporting purposes as of the most recently completed federal income tax reporting period-end.
| | | | |
| Unrealized Appreciation (Depreciation) of Investment Securities on a Tax Basis | |
Aggregate unrealized appreciation of investment securities | | $ | 754,843,166 | |
Aggregate unrealized (depreciation) of investment securities | | | (83,440,755 | ) |
Net unrealized appreciation of investment securities | | $ | 671,402,411 | |
Cost of investments for tax purposes is $4,621,189,306.
NOTE 11—Reclassification of Permanent Differences
Primarily as a result of differing book/tax treatment of foreign currency transactions and excise taxes, on October 31, 2012, undistributed net investment income was increased by $3,087,988, undistributed net realized gain was decreased by $3,075,050 and shares of beneficial interest was decreased by $12,938. This reclassification had no effect on the net assets of the Fund.
19 Invesco Diversified Dividend Fund
NOTE 12—Share Information
| | | | | | | | | | | | | | | | |
| | | Summary of Share Activity | |
| | | Years ended October 31, | |
| | | 2012(a) | | | 2011 | |
| | | Shares | | | Amount | | | Shares | | | Amount | |
Sold: | | | | | | | | | | | | | | | | |
Class A | | | 31,729,504 | | | $ | 402,464,197 | | | | 66,279,742 | | | $ | 795,496,855 | |
Class B | | | 525,275 | | | | 6,520,931 | | | | 1,376,543 | | | | 16,509,821 | |
Class C | | | 3,210,568 | | | | 40,187,584 | | | | 4,304,566 | | | | 52,743,160 | |
Class R | | | 1,910,937 | | | | 24,322,427 | | | | 1,509,296 | | | | 18,519,878 | |
Class Y | | | 5,658,734 | | | | 72,079,979 | | | | 8,113,564 | | | | 101,709,880 | |
Investor Class | | | 11,420,807 | | | | 145,573,885 | | | | 13,526,306 | | | | 165,192,266 | |
Class R5 | | | 35,378,535 | | | | 444,742,491 | | | | 20,650,313 | | | | 251,144,633 | |
Class R6(b) | | | 12,412,871 | | | | 168,937,129 | | | | — | | | | — | |
Issued as reinvestment of dividends: | | | | | | | | | | | | | | | | |
Class A | | | 4,967,629 | | | | 60,932,378 | | | | 1,264,296 | | | | 14,936,984 | |
Class B | | | 63,417 | | | | 759,996 | | | | 35,319 | | | | 419,795 | |
Class C | | | 215,001 | | | | 2,580,949 | | | | 69,169 | | | | 820,797 | |
Class R | | | 53,890 | | | | 667,109 | | | | 15,979 | | | | 192,901 | |
Class Y | | | 318,305 | | | | 3,926,778 | | | | 123,916 | | | | 1,488,712 | |
Investor Class | | | 2,941,733 | | | | 36,062,527 | | | | 1,837,909 | | | | 22,064,768 | |
Class R5 | | | 1,460,022 | | | | 18,105,790 | | | | 595,700 | | | | 7,146,077 | |
Issued in connection with acquisitions:(c)(d) | | | | | | | | | | | | | | | | |
Class A | | | — | | | | — | | | | 94,252,169 | | | | 1,199,686,878 | |
Class B | | | — | | | | — | | | | 419,760 | | | | 5,436,017 | |
Class C | | | — | | | | — | | | | 2,743,934 | | | | 34,897,627 | |
Class R | | | — | | | | — | | | | 1,188 | | | | 15,574 | |
Class Y | | | — | | | | — | | | | 3,102,285 | | | | 40,176,616 | |
Investor Class | | | — | | | | — | | | | 9,786,544 | | | | 128,003,179 | |
Automatic conversion of Class B shares to Class A shares: | | | | | | | | | | | | | | | | |
Class A | | | 556,586 | | | | 7,005,178 | | | | 917,198 | | | | 11,169,766 | |
Class B | | | (561,412 | ) | | | (7,005,178 | ) | | | (926,670 | ) | | | (11,169,766 | ) |
Reacquired: | | | | | | | | | | | | | | | | |
Class A | | | (29,054,991 | ) | | | (366,949,777 | ) | | | (17,160,981 | ) | | | (205,059,502 | ) |
Class B | | | (508,862 | ) | | | (6,356,773 | ) | | | (604,541 | ) | | | (7,382,457 | ) |
Class C | | | (2,138,945 | ) | | | (26,674,707 | ) | | | (1,511,227 | ) | | | (18,382,564 | ) |
Class R | | | (780,531 | ) | | | (9,966,285 | ) | | | (573,524 | ) | | | (7,123,736 | ) |
Class Y | | | (3,769,500 | ) | | | (47,569,424 | ) | | | (3,035,288 | ) | | | (36,373,513 | ) |
Investor Class | | | (12,799,594 | ) | | | (161,641,489 | ) | | | (13,417,784 | ) | | | (164,311,146 | ) |
Class R5 | | | (20,809,253 | ) | | | (274,865,167 | ) | | | (5,854,271 | ) | | | (70,982,053 | ) |
Class R6(b) | | | (124,047 | ) | | | (1,676,158 | ) | | | — | | | | — | |
Net increase in share activity | | | 42,276,679 | | | $ | 532,164,370 | | | | 187,841,410 | | | $ | 2,346,987,447 | |
| (a) | There are entities that are record owners of more than 5% of the outstanding shares of the Fund and in the aggregate own 39% of the outstanding shares of the Fund. IDI has an agreement with these entities to sell Fund shares. The Fund, Invesco and/or Invesco affiliates may make payments to these entities, which are considered to be related to the Fund, for providing services to the Fund, Invesco and/or Invesco affiliates including but not limited to services such as securities brokerage, distribution, third party record keeping and account servicing. The Fund has no knowledge as to whether all or any portion of the shares owned of record by these entities are also owned beneficially. |
| (b) | Commencement date of September 24, 2012. |
| (c) | As of the open of business on May 23, 2011, the Fund acquired all the net assets of Invesco Financial Services Fund and Invesco Van Kampen Core Equity Fund pursuant to a plan of reorganization approved by the Trustees of the Fund on November 10, 2010 and by the shareholders of Invesco Financial Services Fund and Invesco Van Kampen Core Equity Fund on April 14, 2011. The acquisition was accomplished by a tax-free exchange of 16,822,719 shares of the Fund for 21,975,207 and 3,949,048 shares outstanding of Invesco Financial Services Fund and Invesco Van Kampen Core Equity Fund, respectively, as of the close of business on May 20, 2011 for Invesco Financial Services Fund and Invesco Van Kampen Core Equity Fund. Each class of Invesco Financial Services Fund and Invesco Van Kampen Core Equity Fund was exchanged for the like class of shares of the Fund based on the relative net asset value of Invesco Financial Services Fund and Invesco Van Kampen Core Equity Fund to the net asset value of the Fund on the close of business on May 20, 2011 for Invesco Financial Services Fund and Invesco Van Kampen Core Equity Fund. Invesco Financial Services Fund and Invesco Van Kampen Core Equity Fund net assets at that date of $187,141,787 and $32,737,235, respectively, including $(6,848,123) of unrealized appreciation (depreciation), was combined with those of the Fund. The net assets of the Fund immediately before the acquisition were $2,562,693,336. The net assets of the Fund immediately following the acquisition were $2,782,572,358. |
| (d) | As of the open of business on July 18, 2011, the Fund acquired all the net assets of Invesco Dividend Growth Securities Fund pursuant to a plan of reorganization approved by the Trustees of the Fund on November 10, 2010 and by the shareholders of Invesco Dividend Growth Securities Fund on June 30, 2011. The acquisition was accomplished by a tax-free exchange of 93,483,161 shares of the Fund for 98,075,828 shares outstanding of Invesco Dividend Growth Securities Fund, as of the close of business on July 15, 2011 for Invesco Dividend Growth Securities Fund. Each class of Invesco Dividend Growth Securities Fund was exchanged for the like class of shares of the Fund based on the relative net asset value of Invesco Dividend Growth Securities Fund to the net asset value of the Fund on the close of business on July 15, 2011 for Invesco Dividend Growth Securities Fund. Invesco Dividend Growth Securities Fund net assets at that date of $1,188,336,869 including $153,543,395 of unrealized appreciation, was combined with those of the Fund. The net assets of the Fund immediately before the acquisition were $2,823,082,080. The net assets of the Fund immediately following the acquisition were $4,011,418,949. |
20 Invesco Diversified Dividend Fund
NOTE 13—Financial Highlights
The following schedule presents financial highlights for a share of the Fund outstanding throughout the periods indicated.
| | | | | | | | | | | | | | | | | | | | | | | | | | | | | | | | | | | | | | | | | | | | | | | | | | | | | | | | |
| | | Net asset
value,
beginning
of period | | | Net
investment
income(a) | | | Net gains
(losses)
on securities
(both
realized and
unrealized) | | | Total from
investment
operations | | | Dividends
from net
investment
income | | | Distributions
from net
realized
gains | | | Total
distributions | | | Net asset
value, end
of period | | | Total
return(b) | | | Net assets,
end of period
(000s omitted) | | | Ratio of
expenses
to average
net assets
with fee waivers
and/or expenses
absorbed | | | Ratio of
expenses
to average net
assets without
fee waivers
and/or expenses
absorbed | | | Ratio of net
investment
income
to average
net assets | | | Portfolio
turnover(c) | |
Class A | | | | | | | | | | | | | | | | | | | | | | | | | | | | | | | | | | | | | | | | | | | | | | | | | | | | | | | | |
Year ended 10/31/12 | | $ | 11.92 | | | $ | 0.22 | | | $ | 1.76 | | | $ | 1.98 | | | $ | (0.22 | ) | | $ | (0.14 | ) | | $ | (0.36 | ) | | $ | 13.54 | | | | 17.00 | % | | $ | 2,520,209 | | | | 0.91 | %(d) | | | 0.92 | %(d) | | | 1.78 | %(d) | | | 12 | % |
Year ended 10/31/11 | | | 11.67 | | | | 0.19 | | | | 0.29 | | | | 0.48 | | | | (0.23 | ) | | | — | | | | (0.23 | ) | | | 11.92 | | | | 4.15 | | | | 2,121,824 | | | | 0.94 | | | | 0.97 | | | | 1.64 | | | | 20 | |
Year ended 10/31/10 | | | 10.18 | | | | 0.25 | | | | 1.43 | | | | 1.68 | | | | (0.19 | ) | | | — | | | | (0.19 | ) | | | 11.67 | | | | 16.64 | | | | 377,758 | | | | 1.01 | | | | 1.02 | | | | 2.23 | | | | 13 | |
Year ended 10/31/09 | | | 9.43 | | | | 0.19 | | | | 0.75 | | | | 0.94 | | | | (0.19 | ) | | | — | | | | (0.19 | ) | | | 10.18 | | | | 10.42 | | | | 185,274 | | | | 1.11 | | | | 1.12 | | | | 2.17 | | | | 24 | |
Year ended 10/31/08 | | | 14.27 | | | | 0.23 | | | | (3.89 | ) | | | (3.66 | ) | | | (0.24 | ) | | | (0.94 | ) | | | (1.18 | ) | | | 9.43 | | | | (27.56 | ) | | | 157,407 | | | | 1.01 | | | | 1.02 | | | | 1.93 | | | | 18 | |
Class B | | | | | | | | | | | | | | | | | | | | | | | | | | | | | | | | | | | | | | | | | | | | | | | | | | | | | | | | |
Year ended 10/31/12 | | | 11.80 | | | | 0.13 | | | | 1.74 | | | | 1.87 | | | | (0.13 | ) | | | (0.14 | ) | | | (0.27 | ) | | | 13.40 | | | | 16.12 | | | | 35,401 | | | | 1.66 | (d) | | | 1.67 | (d) | | | 1.03 | (d) | | | 12 | |
Year ended 10/31/11 | | | 11.55 | | | | 0.11 | | | | 0.28 | | | | 0.39 | | | | (0.14 | ) | | | — | | | | (0.14 | ) | | | 11.80 | | | | 3.39 | | | | 36,873 | | | | 1.69 | | | | 1.72 | | | | 0.89 | | | | 20 | |
Year ended 10/31/10 | | | 10.08 | | | | 0.16 | | | | 1.42 | | | | 1.58 | | | | (0.11 | ) | | | — | | | | (0.11 | ) | | | 11.55 | | | | 15.75 | | | | 32,600 | | | | 1.76 | | | | 1.77 | | | | 1.48 | | | | 13 | |
Year ended 10/31/09 | | | 9.34 | | | | 0.13 | | | | 0.74 | | | | 0.87 | | | | (0.13 | ) | | | — | | | | (0.13 | ) | | | 10.08 | | | | 9.58 | | | | 30,490 | | | | 1.86 | | | | 1.87 | | | | 1.42 | | | | 24 | |
Year ended 10/31/08 | | | 14.14 | | | | 0.15 | | | | (3.86 | ) | | | (3.71 | ) | | | (0.15 | ) | | | (0.94 | ) | | | (1.09 | ) | | | 9.34 | | | | (28.06 | ) | | | 36,934 | | | | 1.69 | | | | 1.76 | | | | 1.25 | | | | 18 | |
Class C | | | | | | | | | | | | | | | | | | | | | | | | | | | | | | | | | | | | | | | | | | | | | | | | | | | | | | | | |
Year ended 10/31/12 | | | 11.79 | | | | 0.13 | | | | 1.73 | | | | 1.86 | | | | (0.13 | ) | | | (0.14 | ) | | | (0.27 | ) | | | 13.38 | | | | 16.04 | | | | 153,467 | | | | 1.66 | (d) | | | 1.67 | (d) | | | 1.03 | (d) | | | 12 | |
Year ended 10/31/11 | | | 11.53 | | | | 0.11 | | | | 0.29 | | | | 0.40 | | | | (0.14 | ) | | | — | | | | (0.14 | ) | | | 11.79 | | | | 3.48 | | | | 120,031 | | | | 1.69 | | | | 1.72 | | | | 0.89 | | | | 20 | |
Year ended 10/31/10 | | | 10.07 | | | | 0.16 | | | | 1.41 | | | | 1.57 | | | | (0.11 | ) | | | — | | | | (0.11 | ) | | | 11.53 | | | | 15.66 | | | | 52,755 | | | | 1.76 | | | | 1.77 | | | | 1.48 | | | | 13 | |
Year ended 10/31/09 | | | 9.33 | | | | 0.13 | | | | 0.74 | | | | 0.87 | | | | (0.13 | ) | | | — | | | | (0.13 | ) | | | 10.07 | | | | 9.59 | | | | 36,573 | | | | 1.86 | | | | 1.87 | | | | 1.42 | | | | 24 | |
Year ended 10/31/08 | | | 14.12 | | | | 0.15 | | | | (3.85 | ) | | | (3.70 | ) | | | (0.15 | ) | | | (0.94 | ) | | | (1.09 | ) | | | 9.33 | | | | (28.02 | ) | | | 30,998 | | | | 1.69 | | | | 1.76 | | | | 1.25 | | | | 18 | |
Class R | | | | | | | | | | | | | | | | | | | | | | | | | | | | | | | | | | | | | | | | | | | | | | | | | | | | | | | | |
Year ended 10/31/12 | | | 11.96 | | | | 0.19 | | | | 1.76 | | | | 1.95 | | | | (0.19 | ) | | | (0.14 | ) | | | (0.33 | ) | | | 13.58 | | | | 16.66 | | | | 37,948 | | | | 1.16 | (d) | | | 1.17 | (d) | | | 1.53 | (d) | | | 12 | |
Year ended 10/31/11 | | | 11.70 | | | | 0.17 | | | | 0.29 | | | | 0.46 | | | | (0.20 | ) | | | — | | | | (0.20 | ) | | | 11.96 | | | | 3.97 | | | | 19,261 | | | | 1.19 | | | | 1.22 | | | | 1.39 | | | | 20 | |
Year ended 10/31/10 | | | 10.19 | | | | 0.22 | | | | 1.46 | | | | 1.68 | | | | (0.17 | ) | | | — | | | | (0.17 | ) | | | 11.70 | | | | 16.55 | | | | 7,693 | | | | 1.26 | | | | 1.27 | | | | 1.98 | | | | 13 | |
Year ended 10/31/09 | | | 9.44 | | | | 0.18 | | | | 0.74 | | | | 0.92 | | | | (0.17 | ) | | | — | | | | (0.17 | ) | | | 10.19 | | | | 10.14 | | | | 3,341 | | | | 1.36 | | | | 1.37 | | | | 1.92 | | | | 24 | |
Year ended 10/31/08 | | | 14.28 | | | | 0.20 | | | | (3.89 | ) | | | (3.69 | ) | | | (0.21 | ) | | | (0.94 | ) | | | (1.15 | ) | | | 9.44 | | | | (27.73 | ) | | | 902 | | | | 1.26 | | | | 1.27 | | | | 1.68 | | | | 18 | |
Class Y | | | | | | | | | | | | | | | | | | | | | | | | | | | | | | | | | | | | | | | | | | | | | | | | | | | | | | | | |
Year ended 10/31/12 | | | 11.94 | | | | 0.26 | | | | 1.76 | | | | 2.02 | | | | (0.26 | ) | | | (0.14 | ) | | | (0.40 | ) | | | 13.56 | | | | 17.26 | | | | 179,087 | | | | 0.66 | (d) | | | 0.67 | (d) | | | 2.03 | (d) | | | 12 | |
Year ended 10/31/11 | | | 11.68 | | | | 0.23 | | | | 0.30 | | | | 0.53 | | | | (0.27 | ) | | | — | | | | (0.27 | ) | | | 11.94 | | | | 4.50 | | | | 131,365 | | | | 0.69 | | | | 0.72 | | | | 1.89 | | | | 20 | |
Year ended 10/31/10 | | | 10.19 | | | | 0.28 | | | | 1.43 | | | | 1.71 | | | | (0.22 | ) | | | — | | | | (0.22 | ) | | | 11.68 | | | | 16.91 | | | | 31,529 | | | | 0.76 | | | | 0.77 | | | | 2.48 | | | | 13 | |
Year ended 10/31/09 | | | 9.43 | | | | 0.22 | | | | 0.76 | | | | 0.98 | | | | (0.22 | ) | | | — | | | | (0.22 | ) | | | 10.19 | | | | 10.79 | | | | 5,893 | | | | 0.86 | | | | 0.88 | | | | 2.42 | | | | 24 | |
Year ended 10/31/08(e) | | | 10.84 | | | | 0.01 | | | | (1.42 | ) | | | (1.41 | ) | | | (0.00 | ) | | | — | | | | (0.00 | ) | | | 9.43 | | | | (13.01 | ) | | | 2,213 | | | | 0.82 | (f) | | | 0.82 | (f) | | | 2.12 | (f) | | | 18 | |
Investor Class | | | | | | | | | | | | | | | | | | | | | | | | | | | | | | | | | | | | | | | | | | | | | | | | | | | | | | | | |
Year ended 10/31/12 | | | 11.92 | | | | 0.23 | | | | 1.75 | | | | 1.98 | | | | (0.23 | ) | | | (0.14 | ) | | | (0.37 | ) | | | 13.53 | | | | 16.95 | | | | 1,444,060 | | | | 0.90 | (d) | | | 0.91 | (d) | | | 1.79 | (d) | | | 12 | |
Year ended 10/31/11 | | | 11.66 | | | | 0.21 | | | | 0.29 | | | | 0.50 | | | | (0.24 | ) | | | — | | | | (0.24 | ) | | | 11.92 | | | | 4.32 | | | | 1,253,533 | | | | 0.87 | | | | 0.90 | | | | 1.71 | | | | 20 | |
Year ended 10/31/10 | | | 10.18 | | | | 0.26 | | | | 1.42 | | | | 1.68 | | | | (0.20 | ) | | | — | | | | (0.20 | ) | | | 11.66 | | | | 16.62 | | | | 1,089,663 | | | | 0.92 | | | | 0.93 | | | | 2.32 | | | | 13 | |
Year ended 10/31/09 | | | 9.42 | | | | 0.20 | | | | 0.76 | | | | 0.96 | | | | (0.20 | ) | | | — | | | | (0.20 | ) | | | 10.18 | | | | 10.63 | | | | 986,096 | | | | 1.01 | | | | 1.03 | | | | 2.27 | | | | 24 | |
Year ended 10/31/08 | | | 14.26 | | | | 0.24 | | | | (3.89 | ) | | | (3.65 | ) | | | (0.25 | ) | | | (0.94 | ) | | | (1.19 | ) | | | 9.42 | | | | (27.50 | ) | | | 963,835 | | | | 0.93 | | | | 0.94 | | | | 2.01 | | | | 18 | |
Class R5 | | | | | | | | | | | | | | | | | | | | | | | | | | | | | | | | | | | | | | | | | | | | | | | | | | | | | | | | |
Year ended 10/31/12 | | | 11.92 | | | | 0.27 | | | | 1.76 | | | | 2.03 | | | | (0.27 | ) | | | (0.14 | ) | | | (0.41 | ) | | | 13.54 | | | | 17.39 | | | | 720,726 | | | | 0.56 | (d) | | | 0.57 | (d) | | | 2.13 | (d) | | | 12 | |
Year ended 10/31/11 | | | 11.67 | | | | 0.24 | | | | 0.29 | | | | 0.53 | | | | (0.28 | ) | | | — | | | | (0.28 | ) | | | 11.92 | | | | 4.53 | | | | 443,581 | | | | 0.58 | | | | 0.59 | | | | 2.00 | | | | 20 | |
Year ended 10/31/10 | | | 10.18 | | | | 0.29 | | | | 1.43 | | | | 1.72 | | | | (0.23 | ) | | | — | | | | (0.23 | ) | | | 11.67 | | | | 17.05 | | | | 254,392 | | | | 0.64 | | | | 0.65 | | | | 2.61 | | | | 13 | |
Year ended 10/31/09 | | | 9.43 | | | | 0.23 | | | | 0.75 | | | | 0.98 | | | | (0.23 | ) | | | — | | | | (0.23 | ) | | | 10.18 | | | | 10.88 | | | | 58,842 | | | | 0.69 | | | | 0.69 | | | | 2.60 | | | | 24 | |
Year ended 10/31/08 | | | 14.26 | | | | 0.27 | | | | (3.88 | ) | | | (3.61 | ) | | | (0.28 | ) | | | (0.94 | ) | | | (1.22 | ) | | | 9.43 | | | | (27.25 | ) | | | 39,425 | | | | 0.67 | | | | 0.68 | | | | 2.27 | | | | 18 | |
Class R6 | | | | | | | | | | | | | | | | | | | | | | | | | | | | | | | | | | | | | | | | | | | | | | | | | | | | | | | | |
Year ended 10/31/12(e) | | | 13.61 | | | | 0.03 | | | | (0.10 | ) | | | (0.07 | ) | | | — | | | | — | | | | — | | | | 13.54 | | | | (0.51 | ) | | | 166,418 | | | | 0.49 | (d)(f) | | | 0.50 | (d)(f) | | | 2.20 | (d)(f) | | | 12 | |
| (a) | Calculated using average shares outstanding. |
| (b) | Includes adjustments in accordance with accounting principles generally accepted in the United States of America and as such, the net asset value for financial reporting purposes and the returns based upon those net asset values may differ from the net asset value and returns for shareholder transactions. Does not include sales charges and is not annualized for periods less than one year, if applicable. |
| (c) | Portfolio turnover is calculated at the fund level and is not annualized for periods less than one year, if applicable. For the period ending October 31, 2011, the portfolio turnover calculation excludes the value of securities purchased of $1,261,900,843 and sold of $210,298,763 in the effort to realign the Fund’s portfolio holdings after the reorganization of Invesco Dividend Growth Securities Fund, Invesco Financial Services Fund and Invesco Van Kampen Core Equity Fund into the Fund. |
| (d) | Ratios are based on average daily net assets (000’s) of $2,303,381, $36,343, $135,399, $28,780, $151,681, $1,335,317, $649,486 and $162,459 for Class A, Class B, Class C, Class R, Class Y, Investor Class, Class R5 and Class R6 shares, respectively. |
| (e) | Commencement date of October 3, 2008 and September 24, 2012 for Class Y shares and Class R6 shares, respectively. |
21 Invesco Diversified Dividend Fund
Report of Independent Registered Public Accounting Firm
To the Board of Trustees of AIM Equity Funds (Invesco Equity Funds)
and Shareholders of Invesco Diversified Dividend Fund:
In our opinion, the accompanying statement of assets and liabilities, including the schedule of investments, and the related statements of operations and of changes in net assets and the financial highlights present fairly, in all material respects, the financial position of Invesco Diversified Dividend Fund (one of the funds constituting AIM Equity Funds (Invesco Equity Funds), hereafter referred to as the “Fund”) at October 31, 2012, the results of its operations for the year then ended, the changes in its net assets for each of the two years in the period then ended and the financial highlights for each of the five years in the period then ended, in conformity with accounting principles generally accepted in the United States of America. These financial statements and financial highlights (hereafter referred to as “financial statements”) are the responsibility of the Fund’s management; our responsibility is to express an opinion on these financial statements based on our audits. We conducted our audits of these financial statements in accordance with the standards of the Public Company Accounting Oversight Board (United States). Those standards require that we plan and perform the audit to obtain reasonable assurance about whether the financial statements are free of material misstatement. An audit includes examining, on a test basis, evidence supporting the amounts and disclosures in the financial statements, assessing the accounting principles used and significant estimates made by management, and evaluating the overall financial statement presentation. We believe that our audits, which included confirmation of securities at October 31, 2012 by correspondence with the custodian and brokers, provide a reasonable basis for our opinion.
PRICEWATERHOUSECOOPERS LLP
December 21, 2012
Houston, Texas
22 Invesco Diversified Dividend Fund
Calculating your ongoing Fund expenses
Example
As a shareholder of the Fund, you incur two types of costs: (1) transaction costs, which may include sales charges (loads) on purchase payments or contingent deferred sales charges on redemptions, and redemption fees, if any; and (2) ongoing costs, including management fees, distribution and/or service (12b-1) fees, and other Fund expenses. This example is intended to help you understand your ongoing costs (in dollars) of investing in the Fund and to compare these costs with ongoing costs of investing in other mutual funds. With the exception of the actual ending account value and expenses of the Class R6 shares, the example is based on an investment of $1,000 invested at the beginning of the period and held for the entire period May 1, 2012, through October 31, 2012. The actual ending account value and expenses of the Class R6 shares in the example below are based on an investment of $1,000 invested as of close of business September 24, 2012 (commencement date) and held through October 31, 2012.
Actual expenses
The table below provides information about actual account values and actual expenses. You may use the information in this table, together with the amount you invested, to estimate the expenses that you paid over the period. Simply divide your account value by $1,000 (for example, an $8,600 account value divided by $1,000 = 8.6), then multiply the result by the number in the table under the heading entitled “Actual Expenses Paid During Period” to estimate the expenses you paid on your account during this period (as of close of business September 24, 2012 through October 31, 2012 for the Class R6 shares). Because the actual ending account value and expense information in the example is not based upon a six month period for the Class R6 shares, the ending account value and expense information may not provide a meaningful comparison to mutual funds that provide such information for a full six month period.
Hypothetical example for comparison purposes
The table below also provides information about hypothetical account values and hypothetical expenses based on the Fund’s actual expense ratio and an assumed rate of return of 5% per year before expenses, which is not the Fund’s actual return.
The hypothetical account values and expenses may not be used to estimate the actual ending account balance or expenses you paid for the period. You may use this information to compare the ongoing costs of investing in the Fund and other funds. To do so, compare this 5% hypothetical example with the 5% hypothetical examples that appear in the shareholder reports of the other funds.
Please note that the expenses shown in the table are meant to highlight your ongoing costs only and do not reflect any transaction costs, such as sales charges (loads) on purchase payments, contingent deferred sales charges on redemptions, and redemption fees, if any. Therefore, the hypothetical information is useful in comparing ongoing costs only, and will not help you determine the relative total costs of owning different funds. In addition, if these transaction costs were included, your costs would have been higher.
| | | | | | | | | | | | | | | | | | | | | | | | |
| Class | | Beginning
Account Value
(05/01/12) | | | ACTUAL | | | HYPOTHETICAL
(5% annual return before
expenses) | | | Annualized
Expense
Ratio | |
| | | Ending
Account Value
(10/31/12)1 | | | Expenses
Paid During
Period2 | | | Ending
Account Value
(10/31/12) | | | Expenses
Paid During
Period3 | | |
| A | | $ | 1,000.00 | | | $ | 1,051.10 | | | $ | 4.59 | | | $ | 1,020.66 | | | $ | 4.52 | | | | 0.89 | % |
| B | | | 1,000.00 | | | | 1,047.70 | | | | 8.44 | | | | 1,016.89 | | | | 8.31 | | | | 1.64 | |
| C | | | 1,000.00 | | | | 1,047.00 | | | | 8.44 | | | | 1,016.89 | | | | 8.31 | | | | 1.64 | |
| R | | | 1,000.00 | | | | 1,050.50 | | | | 5.88 | | | | 1,019.41 | | | | 5.79 | | | | 1.14 | |
| Y | | | 1,000.00 | | | | 1,053.10 | | | | 3.30 | | | | 1,021.92 | | | | 3.25 | | | | 0.64 | |
| Investor | | | 1,000.00 | | | | 1,051.20 | | | | 4.54 | | | | 1,020.71 | | | | 4.47 | | | | 0.88 | |
| R5 | | | 1,000.00 | | | | 1,052.60 | | | | 2.94 | | | | 1,022.27 | | | | 2.90 | | | | 0.57 | |
R6 | | | 1,000.00 | | | | 994.90 | | | | 0.51 | | | | 1,022.67 | | | | 2.49 | | | | 0.49 | |
| 1 | The actual ending account value is based on the actual total return of the Fund for the period May 1, 2012, through October 31, 2012 (as of close of business September 24, 2012, through October 31, 2012 for the Class R6 shares), after actual expenses and will differ from the hypothetical ending account value which is based on the Fund’s expense ratio and a hypothetical annual return of 5% before expenses. |
| 2 | Actual expenses are equal to the Fund’s annualized expense ratio as indicated above multiplied by the average account value over the period, multiplied by 184/366 to reflect the most recent fiscal half year. For the Class R6 shares actual expenses are equal to the annualized expense ratio indicated above multiplied by the average account value over the period, multiplied by 38 (as of close of business September 24, 2012, through October 31, 2012)/366. Because the Class R6 shares have not been in existence for a full six month period, the actual ending account value and expense information shown may not provide a meaningful comparison to fund expense information of classes that show such data for a full six month period and, because the actual ending account value and expense information in the expense example covers a short time period, return and expense data may not be indicative of return and expense data for longer time periods. |
| 3 | Hypothetical expenses are equal to the annualized expense ratio indicated above multiplied by the average account value over the period, multiplied by 184/366 to reflect a one-half year period. The hypothetical ending account value and expenses may be used to compare ongoing costs of investing in Class R6 shares of the Fund and other funds because such data is based on a full six month period. |
23 Invesco Diversified Dividend Fund
Approval of Investment Advisory and Sub-Advisory Contracts
The Board of Trustees (the Board) of AIM Equity Funds (Invesco Equity Funds) is required under the Investment Company Act of 1940, as amended, to approve annually the renewal of the Invesco Diversified Dividend Fund (the Fund) investment advisory agreement with Invesco Advisers, Inc. (Invesco Advisers) and the Master Intergroup Sub-Advisory Contract for Mutual Funds (the sub-advisory contracts) with Invesco Asset Management Deutschland GmbH, Invesco Asset Management Limited, Invesco Asset Management (Japan) Limited, Invesco Australia Limited, Invesco Hong Kong Limited, Invesco Senior Secured Management, Inc. and Invesco Canada Ltd. (collectively, the Affiliated Sub-Advisers). During contract renewal meetings held on June 19-20, 2012, the Board as a whole, and the disinterested or “independent” Trustees, who comprise 80% of the Board, voting separately, approved the continuance of the Fund’s investment advisory agreement and the sub-advisory contracts for another year, effective July 1, 2012. In doing so, the Board considered the process that it follows in reviewing and approving the Fund’s investment advisory agreement and sub-advisory contracts and the information that it is provided. The Board determined that the Fund’s investment advisory agreement and the sub-advisory contracts are in the best interests of the Fund and its shareholders and the compensation to Invesco Advisers and the Affiliated Sub-Advisers under the agreements is fair and reasonable.
The Board’s Fund Evaluation Process
The Board’s Investments Committee has established three Sub-Committees, each of which is primarily responsible for overseeing the management of a number of the series portfolios of the funds advised by Invesco Advisers (the Invesco Funds). The Sub-Committees meet throughout the year to review the performance of their assigned funds, including reviewing materials prepared under the direction of the independent Senior Officer, an officer of the Invesco Funds who reports directly to the independent Trustees. Over the course of each year, the Sub-Committees meet with portfolio managers for their assigned Invesco Funds and other members of management to review the performance, investment objective(s), policies, strategies, limitations and investment risks of these funds. The Sub-Committees meet regularly and at designated contract renewal meetings each year to conduct a review of the performance, fees, expenses and other matters related to their assigned Invesco Funds. Each Sub-Committee recommends to the Investments Committee, which in turn recommends to the full Board, whether and on what terms to approve the continuance of each Invesco Fund’s investment advisory agreement and sub-advisory contracts for another year.
During the contract renewal process, the Trustees receive comparative performance and fee data regarding the Invesco Funds prepared by Invesco Advisers and an independent company, Lipper Inc. (Lipper). The Trustees also receive an independent written evaluation from the Senior Officer. The Senior Officer’s evaluation is prepared as part of his responsibility to manage the process by which the Invesco Funds’ proposed management fees are negotiated during the annual contract renewal process to ensure they are negotiated in a manner that is at arms’ length and reasonable. The independent Trustees are assisted in their annual evaluation of the Fund’s investment advisory agreement by the Senior Officer and by independent legal counsel. In addition to meetings with Invesco Advisers and fund counsel, the independent Trustees also discuss the continuance of the investment advisory agreement and sub-advisory contracts in private sessions with the Senior Officer and independent legal counsel.
In evaluating the fairness and reasonableness of the Fund’s investment advisory agreement and sub-advisory contracts, the Board considered, among other things, the factors discussed below. The Trustees recognized that the advisory fees for the Invesco Funds include advisory fees that are the result of years of review and negotiation between the Trustees and Invesco Advisers as well as advisory fees previously approved by a different board that, at the time, was responsible for overseeing Morgan Stanley and Van Kampen funds, which have become Invesco Funds following the acquisition of the retail mutual fund business of Morgan Stanley. The Trustees’ deliberations and conclusions in a particular year may be based in part on their deliberations and conclusions regarding these same arrangements throughout the year and in prior years. One Trustee may have weighed a particular piece of information or factor differently than another Trustee.
The discussion below serves as the Senior Officer’s independent written evaluation with respect to the Fund’s investment advisory agreement as well as a discussion of the material factors and related conclusions that formed the basis for the Board’s approval of the Fund’s investment advisory agreement and sub-advisory contracts. Unless otherwise stated, this information is current as of June 20, 2012, and may not reflect consideration of factors that became known to the Board after that date, including, for example, changes to the Fund’s performance, advisory fees, expense limitations and/or fee waivers.
Factors and Conclusions and Summary of Independent Written Fee Evaluation
| A. | Nature, Extent and Quality of Services Provided by Invesco Advisers and the Affiliated Sub-Advisers |
The Board reviewed the advisory services provided to the Fund by Invesco Advisers under
the Fund’s investment advisory agreement, the performance of Invesco Advisers in providing these services, and the credentials and experience of the officers and employees of Invesco Advisers who provide these services, including the Fund’s portfolio manager or managers, with whom the Sub-Committees met during the year. The Board’s review of the qualifications of Invesco Advisers to provide advisory services included the Board’s consideration of Invesco Advisers’ performance and investment process oversight, independent credit analysis and investment risk management.
In determining whether to continue the Fund’s investment advisory agreement, the Board considered the prior relationship between Invesco Advisers and the Fund, as well as the Board’s knowledge of Invesco Advisers’ operations, and concluded that it is beneficial to maintain the current relationship, in part because of such prior relationship and knowledge. The Board also considered services that Invesco Advisers and its affiliates provide to the Invesco Funds such as various back office support functions, equity and fixed income trading operations, internal audit, distribution and legal and compliance. The Board concluded that the nature, extent and quality of the services provided to the Fund by Invesco Advisers are appropriate and satisfactory and consistent with the terms of the Fund’s investment advisory agreement.
The Board reviewed the services provided by the Affiliated Sub-Advisers under the sub-advisory contracts and the credentials and experience of the officers and employees of the Affiliated Sub-Advisers who provide these services. The Board noted that the Affiliated Sub-Advisers have offices and personnel that are located in financial centers around the world. As a result, the Affiliated Sub-Advisers can provide research and investment analysis on the markets and economies of various countries in which the Fund invests and make recommendations on securities of companies located in such countries. The Board concluded that the sub-advisory contracts benefit the Fund and its shareholders by permitting Invesco Advisers to use the resources and talents of the Affiliated Sub-Advisers in managing the Fund. The Board concluded that the nature, extent and quality of the services provided by the Affiliated Sub-Advisers are appropriate and satisfactory and consistent with the terms of the Fund’s sub-advisory contracts.
The Board considered Fund performance as a relevant factor in considering whether to approve the investment advisory agreement. The Board did not view Fund performance as a relevant factor in considering whether to approve the sub-advisory contracts for the Fund, as no Affiliated Sub-Adviser currently manages assets of the Fund.
24 Invesco Diversified Dividend Fund
The Board compared the Fund’s performance during the past one, three and five calendar years to the performance of funds in the Lipper performance universe and against the Lipper Large-Cap Value Funds Index. The Board noted that performance of Class A shares of the Fund was in the second quintile of the performance universe for the one and three year periods and the first quintile for the five year period (the first quintile being the best performing funds and the fifth quintile being the worst performing funds). The Board noted that the Fund’s performance was above the performance of the Index for the one, three and five year periods. The Trustees also reviewed more recent Fund performance and this review did not change their conclusions.
| C. | Advisory and Sub-Advisory Fees and Fee Waivers |
The Board compared the Fund’s contractual advisory fee rate to the contractual advisory fee rates of funds in the Fund’s Lipper expense group at a common asset level. The Board noted that the contractual advisory fee for Class A shares of the Fund was below the median contractual advisory fee rate of funds in the expense group. The Board also reviewed the methodology used by Lipper in providing expense group information, which includes using audited financial data from the most recent annual report of each fund in the expense group that was publicly available as of the end of the past calendar year and including only one fund per investment adviser. The Board noted that comparative data is as of varying dates, which may affect the comparability of data during times of market volatility.
The Board also compared the Fund’s effective fee rate (the advisory fee after advisory fee waivers and before expense limitations/waivers) to the advisory fee rates of other mutual funds advised by Invesco Advisers and its affiliates with investment strategies comparable to those of the Fund. The Board noted that the Fund’s rate was below the effective fee rate of one mutual fund with investment strategies comparable to those of the Fund.
Other than the mutual fund described above, the Board noted that Invesco Advisers and the Affiliated Sub-Advisers do not manage other mutual funds or client accounts in a manner substantially similar to the management of the Fund.
The Board also noted that Invesco Advisers has contractually agreed to waive fees and/or limit expenses of the Fund through at least June 30, 2013 in an amount necessary to limit total annual operating expenses to a specified percentage of average daily net assets for each class of the Fund. The Board also considered the effect this fee waiver would have on the Fund’s total estimated expenses.
The Board also considered the services provided by the Affiliated Sub-Advisers pursuant to the sub-advisory contracts, as well as the allocation of fees between Invesco Advisers and the Affiliated Sub-Advisers pursuant to the
sub-advisory contracts. The Board noted that Invesco Advisers provides services to sub-advised Invesco Funds, including oversight of the Affiliated Sub-Advisers as well as the additional services described above other than day-to-day portfolio management. The Board also noted that the sub-advisory fees have no direct effect on the Fund or its shareholders, as they are paid by Invesco Advisers to the Affiliated Sub-Advisers.
Based upon the information and considerations described above, the Board concluded that the Fund’s advisory and sub-advisory fees are fair and reasonable.
| D. | Economies of Scale and Breakpoints |
The Board considered the extent to which there are economies of scale in the provision of advisory services to the Fund. The Board also considered whether the Fund benefits from economies of scale through contractual breakpoints in the Fund’s advisory fee schedule and were assisted in their review by a report from the Senior Officer. The Board also noted that the Fund shares directly in economies of scale through lower fees charged by third party service providers based on the combined size of the Invesco Funds and other clients advised by Invesco Advisers. The Board noted that Invesco Advisers proposes sharing economies of scale in administration expenses by lowering per class administrative fees.
| E. | Profitability and Financial Resources |
The Board reviewed information from Invesco Advisers concerning the costs of the advisory and other services that Invesco Advisers and its affiliates provide to the Fund and the profitability of Invesco Advisers and its affiliates in providing these services for the year ended December 31, 2011. The Board reviewed with Invesco Advisers the methodology used to prepare the profitability information. The Board considered the profitability of Invesco Advisers in connection with managing the Fund and the Invesco Funds. The Board noted that Invesco Advisers continues to operate at a net profit from services Invesco Advisers and its subsidiaries provide to the Invesco Funds and the Fund. The Board did not deem the level of profits realized by Invesco Advisers and its affiliates from providing services to the Fund to be excessive given the nature, quality and extent of the services provided to the Invesco Funds. The Board received and accepted information from Invesco Advisers demonstrating that Invesco Advisers and each Affiliated Sub-Adviser are financially sound and have the resources necessary to perform their obligations under the investment advisory agreement and sub-advisory contracts.
| F. | Collateral Benefits to Invesco Advisers and its Affiliates |
The Board considered various other benefits received by Invesco Advisers and its affiliates from the relationship with the Fund, including the fees received for their provision of administrative, transfer agency and distribution services to the Fund. The Board considered the performance of Invesco Advisers and its
affiliates in providing these services and the organizational structure employed to provide these services. The Board also considered that these services are provided to the Fund pursuant to written contracts that are reviewed and approved on an annual basis by the Board; that the services are required for the operation of the Fund; that Invesco Advisers and its affiliates can provide services, the nature and quality of which are at least equal to those provided by others offering the same or similar services; and that the fees for such services are fair and reasonable in light of the usual and customary charges by others for services of the same nature and quality.
The Board considered the benefits realized by Invesco Advisers and the Affiliated Sub-Advisers as a result of portfolio brokerage transactions executed through “soft dollar” arrangements. The Board noted that soft dollar arrangements shift the payment obligation for research services from Invesco Advisers and the Affiliated Sub-Advisers to the Invesco Funds and therefore may reduce Invesco Advisers’ and the Affiliated Sub-Advisers’ expenses. The Board also considered periodic reports from the Chief Compliance Officer of the Invesco Funds demonstrating that these arrangements are consistent with regulatory requirements. The Board did not deem the soft dollar arrangements to be inappropriate.
The Board considered that the Fund’s uninvested cash and cash collateral from any securities lending arrangements may be invested in money market funds advised by Invesco Advisers pursuant to procedures approved by the Board. The Board noted that Invesco Advisers receives advisory fees from these affiliated money market funds attributable to such investments, although Invesco Advisers has contractually agreed to waive through varying periods the advisory fees payable by the Invesco Funds. The waiver is in an amount equal to 100% of the net advisory fee Invesco Advisers receives from the affiliated money market funds with respect to the Fund’s investment in the affiliated money market funds of uninvested cash, but not cash collateral. The Board concluded that the Fund’s investment of uninvested cash and cash collateral from any securities lending arrangements in the affiliated money market funds is in the best interests of the Fund and its shareholders.
The Board also considered use of an affiliated broker to execute certain trades for the Fund and that such trades are executed in compliance with rules under the Investment Company Act of 1940, as amended.
25 Invesco Diversified Dividend Fund
Tax Information
Form 1099-DIV, Form 1042-S and other year–end tax information provide shareholders with actual calendar year amounts that should be included in their tax returns. Shareholders should consult their tax advisors.
The following distribution information is being provided as required by the Internal Revenue Code or to meet a specific state’s requirement.
The Fund designates the following amounts or, if subsequently determined to be different, the maximum amount allowable for its fiscal year ended October 31, 2012:
| | | | |
Federal and State Income Tax | |
Long-Term Capital Gain Dividends | | $ | 48,328,556 | |
Qualified Dividend Income* | | | 100 | % |
Corporate Dividends Received Deduction* | | | 100 | % |
| | * | The above percentages are based on ordinary income dividends paid to shareholders during the Fund’s fiscal year. |
26 Invesco Diversified Dividend Fund
Trustees and Officers
The address of each trustee and officer is AIM Equity Funds (Invesco Equity Funds) (the “Trust”), 11 Greenway Plaza, Suite 1000, Houston, Texas 77046-1173. The trustees serve for the life of the Trust, subject to their earlier death, incapacitation, resignation, retirement or removal as more specifically provided in the Trust’s organizational documents. Each officer serves for a one year term or until their successors are elected and qualified. Column two below includes length of time served with predecessor entities, if any.
| | | | | | | | |
Name, Year of Birth and
Position(s) Held with the Trust | | Trustee and/
or Officer Since | | Principal Occupation(s)
During Past 5 Years | | Number of
Funds in Fund Complex
Overseen by
Trustee | | Other Directorship(s)
Held by Trustee During
Past 5 Years |
| Interested Persons | | | | | | | | |
| Martin L. Flanagan1 — 1960 Trustee | | 2007 | | Executive Director, Chief Executive Officer and President, Invesco Ltd. (ultimate parent of Invesco and a global investment management firm); Advisor to the Board, Invesco Advisers, Inc. (formerly known as Invesco Institutional (N.A.), Inc.); Trustee, The Invesco Funds; Vice Chair, Investment Company Institute; and Member of Executive Board, SMU Cox School of Business Formerly: Chairman, Invesco Advisers, Inc. (registered investment adviser); Director, Chairman, Chief Executive Officer and President, IVZ Inc. (holding company), INVESCO Group Services, Inc. (service provider) and Invesco North American Holdings, Inc. (holding company); Director, Chief Executive Officer and President, Invesco Holding Company Limited (parent of Invesco and a global investment management firm); Director, Invesco Ltd.; Chairman, Investment Company Institute and President, Co-Chief Executive Officer, Co-President, Chief Operating Officer and Chief Financial Officer, Franklin Resources, Inc. (global investment management organization) | | 123 | | None |
| Philip A. Taylor2 — 1954 Trustee, President and Principal Executive Officer | | 2006 | | Head of North American Retail and Senior Managing Director, Invesco Ltd.; Director, Co-Chairman, Co-President and Co-Chief Executive Officer, Invesco Advisers, Inc. (formerly known as Invesco Institutional (N.A.), Inc.) (registered investment adviser); Director, Chairman, Chief Executive Officer and President, Invesco Management Group, Inc. (formerly known as Invesco Aim Management Group, Inc.) (financial services holding company); Director and President, INVESCO Funds Group, Inc. (registered investment adviser and registered transfer agent); Director and Chairman, Invesco Investment Services, Inc. (formerly known as Invesco Aim Investment Services, Inc.) (registered transfer agent) and IVZ Distributors, Inc. (formerly known as INVESCO Distributors, Inc.) (registered broker dealer); Director, President and Chairman, Invesco Inc. (holding company) and Invesco Canada Holdings Inc. (holding company); Chief Executive Officer, Invesco Corporate Class Inc. (corporate mutual fund company) and Invesco Canada Fund Inc. (corporate mutual fund company); Director, Chairman and Chief Executive Officer, Invesco Canada Ltd. (formerly known as Invesco Trimark Ltd./Invesco Trimark Ltèe) (registered investment adviser and registered transfer agent); Trustee, President and Principal Executive Officer, The Invesco Funds (other than AIM Treasurer’s Series Trust (Invesco Treasurer’s Series Trust) and Short-Term Investments Trust); Trustee and Executive Vice President, The Invesco Funds (AIM Treasurer’s Series Trust (Invesco Treasurer’s Series Trust) and Short-Term Investments Trust only); Director, Invesco Investment Advisers LLC (formerly known as Van Kampen Asset Management); Director, Chief Executive Officer and President, Van Kampen Exchange Corp. Formerly: Director and Chairman, Van Kampen Investor Services Inc.; Director, Chief Executive Officer and President, 1371 Preferred Inc. (holding company); and Van Kampen Investments Inc.; Director and President, AIM GP Canada Inc. (general partner for limited partnerships); and Van Kampen Advisors, Inc.; Director and Chief Executive Officer, Invesco Trimark Dealer Inc. (registered broker dealer); Director, Invesco Distributors, Inc. (formerly known as Invesco Aim Distributors, Inc.) (registered broker dealer); Manager, Invesco PowerShares Capital Management LLC; Director, Chief Executive Officer and President, Invesco Advisers, Inc.; Director, Chairman, Chief Executive Officer and President, Invesco Aim Capital Management, Inc.; President, Invesco Trimark Dealer Inc. and Invesco Trimark Ltd./Invesco Trimark Ltèe; Director and President, AIM Trimark Corporate Class Inc. and AIM Trimark Canada Fund Inc.; Senior Managing Director, Invesco Holding Company Limited; Trustee and Executive Vice President, Tax-Free Investments Trust; Director and Chairman, Fund Management Company (former registered broker dealer); President and Principal Executive Officer, The Invesco Funds (AIM Treasurer’s Series Trust (Invesco Treasurer’s Series Trust), Short-Term Investments Trust and Tax-Free Investments Trust only); President, AIM Trimark Global Fund Inc. and AIM Trimark Canada Fund Inc. | | 123 | | None |
Wayne W. Whalen3 — 1939 Trustee | | 2010 | | Of Counsel, and prior to 2010, partner in the law firm of Skadden, Arps, Slate, Meagher & Flom LLP, legal counsel to certain funds in the Fund Complex | | 136 | | Director of the Mutual Fund Directors Forum, a nonprofit membership organization for investment directors; Chairman and Director of the Abraham Lincoln Presidential Library Foundation; and Director of the Stevenson Center for Democracy |
| 1 | Mr. Flanagan is considered an interested person of the Trust because he is an officer of the adviser to the Trust, and an officer and a director of Invesco Ltd., ultimate parent of the adviser to the Trust. |
| 2 | Mr. Taylor is considered an interested person of the Trust because he is an officer and a director of the adviser to, and a director of the principal underwriter of, the Trust. |
| 3 | Mr. Whalen is considered an “interested person” (within the meaning of Section 2(a)(19) of the 1940 Act) of certain Funds in the Invesco Fund Complex by reason of he and his firm currently providing legal services as legal counsel to such Funds in the Invesco Fund Complex. |
T-1 Invesco Diversified Dividend Fund
Trustees and Officers—(continued)
| | | | | | | | |
Name, Year of Birth and
Position(s) Held with the Trust | | Trustee and/
or Officer Since | | Principal Occupation(s)
During Past 5 Years | | Number of Funds in Fund Complex Overseen by Trustee | | Other Directorship(s) Held by Trustee During
Past 5 Years |
| Independent Trustees | | | | | | | | |
Bruce L. Crockett — 1944 Trustee and Chair | | 1993 | | Chairman, Crockett Technologies Associates (technology consulting company) Formerly: Director, Captaris (unified messaging provider); Director, President and Chief Executive Officer COMSAT Corporation; and Chairman, Board of Governors of INTELSAT (international communications company) | | 123 | | ACE Limited (insurance company); and Investment Company Institute |
David C. Arch — 1945 Trustee | | 2010 | | Retired. Formerly: Chairman and Chief Executive Officer of Blistex Inc., (consumer health care products manufacturer) | | 136 | | Member of the Heartland Alliance Advisory Board, a nonprofit organization serving human needs based in Chicago. Board member of the Illinois Manufacturers’ Association. Member of the Board of Visitors, Institute for the Humanities, University of Michigan |
Frank S. Bayley — 1939 Trustee | | 2001 | | Retired Formerly: Director, Badgley Funds, Inc. (registered investment company) (2 portfolios) and Partner, law firm of Baker & McKenzie | | 123 | | Director and Chairman, C.D. Stimson Company (a real estate investment company) |
James T. Bunch — 1942 Trustee | | 2003 | | Managing Member, Grumman Hill Group LLC (family office private equity management) Formerly: Founder, Green, Manning & Bunch Ltd. (investment banking firm)(1988-2010); Executive Committee, United States Golf Association; and Director, Policy Studies, Inc. and Van Gilder Insurance Corporation | | 123 | | Chairman, Board of Governors, Western Golf Association, Chairman-elect, Evans Scholars Foundation and Director, Denver Film Society |
Rodney F. Dammeyer — 1940 Trustee | | 2010 | | Chairman of CAC, LLC, (private company offering capital investment and management advisory services) Formerly: Prior to January 2004, Director of TeleTech Holdings Inc.; Prior to 2002, Director of Arris Group, Inc.; Prior to 2001, Managing Partner at Equity Group Corporate Investments. Prior to 1995, Vice Chairman of Anixter International. Prior to 1985, experience includes Senior Vice President and Chief Financial Officer of Household International, Inc., Executive Vice President and Chief Financial Officer of Northwest Industries, Inc. and Partner of Arthur Andersen & Co. | | 136 | | Director of Quidel Corporation and Stericycle, Inc. Prior to May 2008, Trustee of The Scripps Research Institute. Prior to February 2008, Director of Ventana Medical Systems, Inc. Prior to April 2007, Director of GATX Corporation. Prior to April 2004, Director of TheraSense, Inc. |
Albert R. Dowden — 1941 Trustee | | 2000 | | Director of a number of public and private business corporations, including the Boss Group, Ltd. (private investment and management); Reich & Tang Funds (5 portfolios) (registered investment company); and Homeowners of America Holding Corporation/ Homeowners of America Insurance Company (property casualty company) Formerly: Director, Continental Energy Services, LLC (oil and gas pipeline service); Director, CompuDyne Corporation (provider of product and services to the public security market) and Director, Annuity and Life Re (Holdings), Ltd. (reinsurance company); Director, President and Chief Executive Officer, Volvo Group North America, Inc.; Senior Vice President, AB Volvo; Director of various public and private corporations; Chairman, DHJ Media, Inc.; Director Magellan Insurance Company; and Director, The Hertz Corporation, Genmar Corporation (boat manufacturer), National Media Corporation; Advisory Board of Rotary Power International (designer, manufacturer, and seller of rotary power engines); and Chairman, Cortland Trust, Inc. (registered investment company) | | 123 | | Director of Nature’s Sunshine Products, Inc. |
Jack M. Fields — 1952 Trustee | | 1997 | | Chief Executive Officer, Twenty First Century Group, Inc. (government affairs company); and Owner and Chief Executive Officer, Dos Angelos Ranch, L.P. (cattle, hunting, corporate entertainment), Discovery Global Education Fund (non-profit) and Cross Timbers Quail Research Ranch (non-profit) Formerly: Chief Executive Officer, Texana Timber LP (sustainable forestry company) and member of the U.S. House of Representatives | | 123 | | Insperity (formerly known as Administaff) |
Carl Frischling — 1937 Trustee | | 1988 | | Partner, law firm of Kramer Levin Naftalis and Frankel LLP | | 123 | | Director, Reich & Tang Funds (6 portfolios) |
Prema Mathai-Davis — 1950 Trustee | | 1998 | | Retired Formerly: Chief Executive Officer, YWCA of the U.S.A. | | 123 | | None |
Larry Soll — 1942 Trustee | | 2003 | | Retired Formerly: Chairman, Chief Executive Officer and President, Synergen Corp. (a biotechnology company) | | 123 | | None |
T-2 Invesco Diversified Dividend Fund
Trustees and Officers—(continued)
| | | | | | | | |
Name, Year of Birth and
Position(s) Held with the Trust | | Trustee and/
or Officer Since | | Principal Occupation(s) During Past 5 Years | | Number of
Funds in Fund Complex Overseen by Trustee | | Other Directorship(s) Held by Trustee During Past 5 Years |
| Independent Trustees—(continued) |
Hugo F. Sonnenschein — 1940 Trustee | | 2010 | | Distinguished Service Professor and President Emeritus of the University of Chicago and the Adam Smith Distinguished Service Professor in the Department of Economics at the University of Chicago. Formerly: President of the University of Chicago | | 136 | | Trustee of the University of Rochester and a member of its investment committee. Member of the National Academy of Sciences, the American Philosophical Society and a fellow of the American Academy of Arts and Sciences |
Raymond Stickel, Jr. — 1944 Trustee | | 2005 | | Retired Formerly: Director, Mainstay VP Series Funds, Inc. (25 portfolios) and Partner, Deloitte & Touche | | 123 | | None |
| Other Officers | | | | | | | | |
Russell C. Burk — 1958 Senior Vice President and Senior Officer | | 2005 | | Senior Vice President and Senior Officer, The Invesco Funds | | N/A | | N/A |
John M. Zerr — 1962 Senior Vice President, Chief Legal Officer and Secretary | | 2006 | | Director, Senior Vice President, Secretary and General Counsel, Invesco Management Group, Inc. (formerly known as Invesco Aim Management Group, Inc.) and Van Kampen Exchange Corp.; Senior Vice President, Invesco Advisers, Inc. (formerly known as Invesco Institutional (N.A.), Inc.) (registered investment adviser); Senior Vice President and Secretary, Invesco Distributors, Inc. (formerly known as Invesco Aim Distributors, Inc.); Director, Vice President and Secretary, Invesco Investment Services, Inc. (formerly known as Invesco Aim Investment Services, Inc.) and IVZ Distributors, Inc. (formerly known as INVESCO Distributors, Inc.); Director and Vice President, INVESCO Funds Group, Inc.; Senior Vice President, Chief Legal Officer and Secretary, The Invesco Funds; Manager, Invesco PowerShares Capital Management LLC; Director, Secretary and General Counsel, Invesco Investment Advisers LLC (formerly known as Van Kampen Asset Management); Secretary and General Counsel, Invesco Capital Markets, Inc. (formerly known as Van Kampen Funds Inc.) and Chief Legal Officer, PowerShares Exchange-Traded Fund Trust, PowerShares Exchange-Traded Fund Trust II, PowerShares India Exchange-Traded Fund Trust and PowerShares Actively Managed Exchange-Traded Fund Trust Formerly: Director and Secretary, Van Kampen Advisors Inc.; Director Vice President, Secretary and General Counsel Van Kampen Investor Services Inc.; Director, Invesco Distributors, Inc. (formerly known as Invesco Aim Distributors, Inc.); Director, Senior Vice President, General Counsel and Secretary, Invesco Advisers, Inc.; and Van Kampen Investments Inc.; Director, Vice President and Secretary, Fund Management Company; Director, Senior Vice President, Secretary, General Counsel and Vice President, Invesco Aim Capital Management, Inc.; Chief Operating Officer and General Counsel, Liberty Ridge Capital, Inc. (an investment adviser); Vice President and Secretary, PBHG Funds (an investment company) and PBHG Insurance Series Fund (an investment company); Chief Operating Officer, General Counsel and Secretary, Old Mutual Investment Partners (a broker-dealer); General Counsel and Secretary, Old Mutual Fund Services (an administrator) and Old Mutual Shareholder Services (a shareholder servicing center); Executive Vice President, General Counsel and Secretary, Old Mutual Capital, Inc. (an investment adviser); and Vice President and Secretary, Old Mutual Advisors Funds (an investment company) | | N/A | | N/A |
Lisa O. Brinkley — 1959 Vice President | | 2004 | | Global Assurance Officer, Invesco Ltd. and Vice President, The Invesco Funds Formerly: Chief Compliance Officer, Invesco Distributors, Inc. (formerly known as Invesco Aim Distributors, Inc.), Invesco Investment Services, Inc.(formerly known as Invesco Aim Investment Services, Inc.) and Van Kampen Investor Services Inc.; Senior Vice President, Invesco Management Group, Inc.; Senior Vice President and Chief Compliance Officer, Invesco Advisers, Inc. and The Invesco Funds; Vice President and Chief Compliance Officer, Invesco Aim Capital Management, Inc. and Invesco Distributors, Inc.; Vice President, Invesco Investment Services, Inc. and Fund Management Company | | N/A | | N/A |
T-3 Invesco Diversified Dividend Fund
Trustees and Officers—(continued)
| | | | | | | | |
Name, Year of Birth and
Position(s) Held with the Trust | | Trustee and/
or Officer Since | | Principal Occupation(s) During Past 5 Years | | Number of
Funds in Fund
Complex
Overseen by
Trustee | | Other Directorship(s)
Held by Trustee During
Past 5 Years |
| Other Officers—(continued) |
Karen Dunn Kelley — 1960 Vice President | | 2004 | | Head of Invesco’s World Wide Fixed Income and Cash Management Group; Senior Vice President, Invesco Management Group, Inc. (formerly known as Invesco Aim Management Group, Inc.) and Invesco Advisers, Inc. (formerly known as Invesco Institutional (N.A.), Inc.) (registered investment adviser); Executive Vice President, Invesco Distributors, Inc. (formerly known as Invesco Aim Distributors, Inc.); Director, Invesco Mortgage Capital Inc., INVESCO Global Asset Management Limited, Invesco Management Company Limited and INVESCO Management S.A.; Vice President, The Invesco Funds (other than AIM Treasurer’s Series Trust (Invesco Treasurer’s Series Trust) and Short-Term Investments Trust); and President and Principal Executive Officer, The Invesco Funds (AIM Treasurer’s Series Trust (Invesco Treasurer’s Series Trust) and Short-Term Investments Trust only) Formerly: Senior Vice President, Van Kampen Investments Inc.; Vice President, Invesco Advisers, Inc. (formerly known as Invesco Institutional (N.A.), Inc.); Director of Cash Management and Senior Vice President, Invesco Advisers, Inc. and Invesco Aim Capital Management, Inc.; President and Principal Executive Officer, Tax-Free Investments Trust; Director and President, Fund Management Company; Chief Cash Management Officer, Director of Cash Management, Senior Vice President, and Managing Director, Invesco Aim Capital Management, Inc.; Director of Cash Management, Senior Vice President, and Vice President, Invesco Advisers, Inc. and The Invesco Funds (AIM Treasurer’s Series Trust (Invesco Treasurer’s Series Trust), Short-Term Investments Trust and Tax-Free Investments Trust only) | | N/A | | N/A |
Sheri Morris — 1964 Vice President, Treasurer and Principal Financial Officer | | 1999 | | Vice President, Treasurer and Principal Financial Officer, The Invesco Funds; Vice President, Invesco Advisers, Inc. (formerly known as Invesco Institutional (N.A.), Inc.) (registered investment adviser); and Treasurer, PowerShares Exchange-Traded Fund Trust, PowerShares Exchange-Traded Fund Trust II, PowerShares India Exchange-Traded Fund Trust and PowerShares Actively Managed Exchange-Traded Fund Trust Formerly: Vice President, Invesco Advisers, Inc., Invesco Aim Capital Management, Inc. and Invesco Aim Private Asset Management, Inc.; Assistant Vice President and Assistant Treasurer, The Invesco Funds and Assistant Vice President, Invesco Advisers, Inc., Invesco Aim Capital Management, Inc. and Invesco Aim Private Asset Management, Inc. | | N/A | | N/A |
Yinka Akinsola — 1977 Anti-Money Laundering Compliance Officer | | 2011 | | Anti-Money Laundering Compliance Officer, Invesco Advisers, Inc. (formerly known as Invesco Institutional (N.A.), Inc.) (registered investment adviser); Invesco Distributors, Inc. (formerly known as Invesco Aim Distributors, Inc.), Invesco Investment Services, Inc. (formerly known as Invesco Aim Investment Services, Inc.), Invesco Management Group, Inc., The Invesco Funds, Invesco Van Kampen Closed-End Funds, Van Kampen Exchange Corp., Invesco Capital Markets, Inc. (formerly known as Van Kampen Funds Inc.), PowerShares Exchange-Traded Fund Trust, PowerShares Exchange-Traded Fund Trust II, PowerShares India Exchange-Traded Fund Trust, and PowerShares Actively Managed Exchange-Traded Fund Trust Formerly: Regulatory Analyst III, Financial Industry Regulatory Authority (FINRA). | | N/A | | N/A |
Todd L. Spillane — 1958 Chief Compliance Officer | | 2006 | | Senior Vice President, Invesco Management Group, Inc. (formerly known as Invesco Aim Management Group, Inc.) and Van Kampen Exchange Corp.; Senior Vice President and Chief Compliance Officer, Invesco Advisers, Inc. (registered investment adviser) (formerly known as Invesco Institutional (N.A.), Inc.); Chief Compliance Officer, The Invesco Funds; Vice President, Invesco Distributors, Inc. (formerly known as Invesco Aim Distributors, Inc.) and Invesco Investment Services, Inc. (formerly known as Invesco Aim Investment Services, Inc.) Formerly: Chief Compliance Officer, Invesco Van Kampen Closed-End Funds; Senior Vice President, Van Kampen Investments Inc.; Senior Vice President and Chief Compliance Officer, Invesco Advisers, Inc. and Invesco Aim Capital Management, Inc.; Chief Compliance Officer, INVESCO Private Capital Investments, Inc. (holding company), Invesco Private Capital, Inc. (registered investment adviser), Invesco Global Asset Management (N.A.), Inc., Invesco Senior Secured Management, Inc. (registered investment adviser) and Van Kampen Investor Services Inc., PowerShares Exchange-Traded Fund Trust, PowerShares Exchange-Traded Fund Trust II, PowerShares India Exchange-Traded Fund Trust and PowerShares Actively Managed Exchange-Traded Fund Trust; Vice President, Invesco Aim Capital Management, Inc. and Fund Management Company | | N/A | | N/A |
The Statement of Additional Information of the Trust includes additional information about the Fund’s Trustees and is available upon request, without charge, by calling 1.800.959.4246. Please refer to the Fund’s prospectus for information on the Fund’s sub-advisers.
| | | | | | |
Office of the Fund 11 Greenway Plaza, Suite 1000 Houston, TX 77046-1173 | | Investment Adviser Invesco Advisers, Inc. 1555 Peachtree Street, N.E. Atlanta, GA 30309 | | Distributor Invesco Distributors, Inc. 11 Greenway Plaza, Suite 1000 Houston, TX 77046-1173 | | Auditors PricewaterhouseCoopers LLP 1201 Louisiana Street, Suite 2900 Houston, TX 77002-5678 |
| | | |
| | | | | | |
Counsel to the Fund Stradley Ronon Stevens & Young, LLP 2005 Market Street, Suite 2600 Philadelphia, PA 19103-7018 | | Counsel to the Independent Trustees Kramer Levin Naftalis & Frankel LLP 1177 Avenue of the Americas New York, NY 10036-2714 | | Transfer Agent Invesco Investment Services, Inc. 11 Greenway Plaza, Suite 1000 Houston, TX 77046-1173 | | Custodian State Street Bank and Trust Company 225 Franklin Street Boston, MA 02110-2801 |
T-4 Invesco Diversified Dividend Fund

Invesco mailing information
Send general correspondence to Invesco Investment Services, Inc., P.O. Box 219078, Kansas City, MO 64121-9078.
Invesco privacy policy
You share personal and financial information with us that is necessary for your transactions and your account records. We take very seriously the obligation to keep that information confidential and private.
Invesco collects nonpublic personal information about you from account applications or other forms you complete and from your transactions with us or our affiliates. We do not disclose information about you or our former customers to service providers or other third parties except to the extent necessary to service your account and in other limited circumstances as permitted by law. For example, we use this information to facilitate the delivery of transaction confirmations, financial reports, prospectuses and tax forms.
Even within Invesco, only people involved in the servicing of your accounts and compliance monitoring have access to your information. To ensure the highest level of confidentiality and security, Invesco maintains physical, electronic and procedural safeguards that meet or exceed federal standards. Special measures, such as data encryption and authentication, apply to your communications with us on our website. More detail is available to you at invesco.com/privacy.
Important notice regarding delivery of security holder documents
To reduce Fund expenses, only one copy of most shareholder documents may be mailed to shareholders with multiple accounts at the same address (Householding). Mailing of your shareholder documents may be householded indefinitely unless you instruct us otherwise. If you do not want the mailing of these documents to be combined with those for other members of your household, please contact Invesco Investment Services, Inc. at 800 959 4246 or contact your financial institution. We will begin sending you individual copies for each account within 30 days after receiving your request.
Fund holdings and proxy voting information
The Fund provides a complete list of its holdings four times in each fiscal year, at the quarter-ends. For the second and fourth quarters, the lists appear in the Fund’s semiannual and annual reports to shareholders. For the first and third quarters, the Fund files the lists with the Securities and Exchange Commission (SEC) on Form N-Q. The most recent list of portfolio holdings is available at invesco.com/completeqtrholdings. Shareholders can also look up the Fund’s
Forms N-Q on the SEC website at sec.gov. Copies of the Fund’s Forms N-Q may be reviewed and copied at the SEC Public Reference Room in Washington, D.C. You can obtain information on the operation of the Public Reference Room, including information about duplicating fee charges, by calling 202 551 8090 or 800 732 0330, or by electronic request at the following email address: publicinfo@sec.gov. The SEC file numbers for the Fund are shown below.
A description of the policies and procedures that the Fund uses to determine how to vote proxies relating to portfolio securities is available without charge, upon request, from our Client Services department at 800 959 4246 or at invesco.com/proxyguidelines. The information is also available on the SEC website, sec.gov.
| | |
Information regarding how the Fund voted proxies related to its portfolio securities during the 12 months ended June 30, 2012, is available at invesco.com/proxysearch. The information is also available on the SEC website, sec.gov. Invesco Advisers, Inc. is an investment adviser; it provides investment advisory services to individual and institutional clients and does not sell securities. Invesco Distributors, Inc. is the US distributor for Invesco Ltd.’s retail mutual funds, exchange-traded funds and institutional money
market funds. Both are wholly owned, indirect subsidiaries of Invesco Ltd. | |  |
| | | | |
| SEC file numbers: 811-01424 and 002-25469 | | DDI-AR-1 | | Invesco Distributors, Inc. |

Letters to Shareholders
| | |

Philip Taylor | | Dear Shareholders: This report contains information about your Fund, including a discussion from your portfolio managers about how they managed your Fund – and why it performed as it did – during the reporting period. This report also includes your Fund’s long-term performance and a complete list of your Fund’s investments as of the close of the reporting period. I hope you find this information helpful. For much of the reporting period, investors’ attention was focused on Europe, where eurozone governments struggled to reduce debt levels, strengthen their banks and stimulate their economies. European leaders disagreed whether the wiser path to restoring the Continent’s economic well-being was more stimulus or greater austerity. In the US, economic data were mixed. Economic growth, while positive, was relatively modest. Corporate earnings, which grew strongly in recent years, showed signs of slowing. And job creation was less |
| robust than hoped. Later in this report, your Fund’s portfolio managers discuss how economic conditions and market trends affected your Fund’s performance. |
Economic conditions are always subject to sudden and unexpected change. That’s why you may find it helpful to work with a trusted, experienced financial adviser who understands your unique financial goals, needs and risk tolerances. Financial advisers can provide valuable insight and information, particularly when markets are uncertain, and they can recommend investments appropriate for specific investment goals, such as a child’s college education or your retirement. On a regular basis, a financial adviser also can determine whether your existing investments are still appropriate, given your changing needs, goals and circumstances. Timely insight and information from many of Invesco’s investment professionals is available at our website, invesco.com/us. We offer in-depth articles, video clips and audio commentaries from many of our portfolio managers and other investment professionals on a wide range of topics of interest to investors: recent economic and market developments; retirement planning; legislative updates from Washington, DC; and general investor education. At invesco.com/us, you also can access information about your Invesco account at any time. |
What we mean by Intentional Investing
Intentional InvestingSM is the science and art of investing with purpose, prudence and diligence – and it’s how Invesco’s investment professionals manage your money every day.
This highly disciplined process begins when specialized teams of investment professionals clearly define an investment objective and then establish specific investment strategies to try to achieve that objective. While our investment teams closely monitor economic and market conditions – and issues specific to individual holdings that could affect their value – they maintain a long-term investment perspective. Intentional Investing is also:
| | n | | How we manage and mitigate risk – by embedding risk controls and processes into every aspect of our business; |
| | n | | How we create products – by offering a diverse combination of investment strategies and vehicles designed to meet your needs; and |
| | n | | How we connect with you, our investors – by communicating clearly, by delivering expert insights from our portfolio managers and other investment professionals, and by providing a website full of tools and articles to help you stay informed. |
As a company, Invesco believes in putting investors first, and that’s why investment management is all we do. Our sole focus on managing your money allows your financial adviser to build a truly diversified investment portfolio of Invesco funds, whatever your investment needs and goals may be – and allows him or her to find appropriate Invesco funds when your circumstances change. Of course, neither Intentional Investing nor diversification can guarantee a profit or protect against loss.
Have a question?
If you have questions about your account, please contact an Invesco client services representative at 800 959 4246. If you have an Invesco-related question or comment, feel free to email me directly at phil@invesco.com.
All of us at Invesco look forward to serving your investment management needs for many years to come. Thank you for investing with us.
Sincerely,

Philip Taylor
Senior Managing Director, Invesco Ltd.
2 Invesco Summit Fund
| | |

Bruce Crockett | | Dear Fellow Shareholders: One of our most important responsibilities as independent Trustees of the Invesco Funds is our annual review of the funds’ advisory and sub-advisory contracts with Invesco. This annual review is required by the Investment Company Act of 1940 and focuses on the nature and quality of the services Invesco has provided as adviser to the Invesco Funds and the reasonableness of the fees that it charges for those services. In our roles as Trustees, we spend months reviewing thousands of pages of detailed information that we request from Invesco in connection with our annual review. We focus on the quality and costs of the services to be provided by Invesco and its affiliates. Some of the most important things we look at are fund performance, expenses and fees. All of the Trustees have substantial personal investments in the Invesco Funds complex. We’re fund shareholders just like you. |
We also use information from many independent sources during the review process, including materials provided by the independent Senior Officer of the Invesco Funds, who reports directly to the independent Trustees. We also meet in private sessions with independent legal counsel and review performance and fee data on the Invesco Funds prepared by Lipper Inc., an independent, third-party firm widely recognized as a leader in its field.
I’m pleased to report that the Invesco Funds Board determined in June that renewing the investment advisory agreement and the sub-advisory contracts with Invesco would serve the best interests of each fund and its shareholders. For more detailed information about our assessment and conclusions with respect to each of the Invesco Funds, visit invesco.com/us, click on the “About Us” section and go to “Legal Information.” Information on the recent investment advisory renewal process can be found by clicking the last item under “Corporate Governance.”
In much the same way we review your fund’s advisory contract each year, it’s a good idea for you to review your own investment plan with your financial adviser on a regular basis. Perhaps you need to reassess your original asset allocation because different investments may grow at varying paces, or perhaps you’re going through a significant life change. Regardless of your situation, a financial adviser can provide guidance and experience to help you reach your financial goals.
As always, please contact me at bruce@brucecrockett.com with any questions or concerns you may have. On behalf of the Board, we look forward to continuing to represent your interests and serving your needs.
Sincerely,

Bruce L. Crockett
Independent Chair
Invesco Funds Board of Trustees
3 Invesco Summit Fund
Management’s Discussion of Fund Performance
Performance summary
On June 4, 2012, Erik Voss assumed the lead portfolio manager role for the Fund. He and portfolio manager Ryan Amerman comprise the Fund’s management team.
For the fiscal year ended October 31, 2012, Invesco Summit Fund had positive returns but underperformed the Fund’s style-specific benchmark, the Russell 1000 Growth Index. Underperformance was driven primarily by stock selection in several sectors.
Your Fund’s long-term performance appears later in this report.
Fund vs. Indexes
Total returns, 10/31/11 to 10/31/12, at net asset value (NAV). Performance shown does not include applicable contingent deferred sales charges (CDSC) or front-end sales charges, which would have reduced performance.
| | | | |
Class A Shares | | | 9.62 | % |
Class B Shares | | | 8.99 | |
Class C Shares | | | 8.82 | |
Class P Shares | | | 9.80 | |
Class S Shares | | | 9.82 | |
Class Y Shares | | | 10.14 | |
Class R5 Shares* | | | 10.12 | |
S&P 500 Indexq (Broad Market Index) | | | 15.21 | |
Russell 1000 Growth Indexn (Style-Specific Index) | | | 13.02 | |
Lipper Multi-Cap Growth Funds Index¿ (Peer Group Index) | | | 8.97 | |
Source(s): qInvesco, S&P-Dow Jones via FactSet Research Systems Inc.;
nInvesco, Russell via FactSet Research Systems Inc.; ¿Lipper Inc.
*Effective September 24, 2012, Institutional Class shares were renamed Class R5 shares.
How we invest
We believe a growth investment strategy is an essential component of a diversified portfolio. Our investment process seeks to identify companies exhibiting long-term, sustainable earnings and cash flow growth that is not yet reflected in investor expectations or equity valuations.
Our stock selection process uses a holistic approach that emphasizes fundamental as well as quantitative analysis, focusing on identifying industries and companies with strong fundamental drivers of high-quality growth in revenues, earnings and cash flow. To accomplish this goal, we conduct rigorous bottom-up analysis in order to develop higher conviction in each company’s prospects for growth.
Through our analysis, we develop a mosaic of each company through detailed discussions with company management teams, competitors, distributors, suppliers, Wall Street analysts and customers. We also utilize a variety of valuation techniques based on the company in question, the industry in which the company operates, the stage of the business cycle and other factors that best reflect the company’s value.
We carefully construct the portfolio with a goal to minimize unnecessary risk. We seek to accomplish this goal by diversifying portfolio holdings across sectors and market capitalizations and by holding numerous stocks in the portfolio. Our target holding period is two to three years for each stock.
We consider selling a stock for any of the following reasons:
| n | | The price target set at purchase has been reached. |
| n | | There is deterioration in fundamentals. |
| n | | The catalysts for growth are no longer present or are reflected in the stock price. |
| n | | We identify a more attractive investment opportunity. |
Market conditions and your Fund
The fiscal year began with improving economic data in the US and a rally in equities that continued almost uninterrupted into the spring of 2012. However, the ongoing eurozone sovereign debt crisis intensified in April and May, dominating headlines and creating significant volatility in equity markets across the globe.
This negative news from overseas precipitated a slowdown in the US, where economic data began to decelerate as manufacturing, employment, consumer spending and consumer confidence weakened over the summer. While corporate earnings remained solid, financial markets were influenced by macroeconomic developments for much of the reporting period. As the fiscal year drew to a close, fears about the fate of the eurozone began to subside after the European Central Bank announced new measures to support eurozone economies through potentially unlimited purchases of sovereign debt, among other measures. At the same time, continued risk aversion among investors and corporations, along with tepid employment growth, prompted the US Federal Reserve (the Fed) to initiate a third round of quantitative easing by promising to remain accommodative until the labor market outlook improves materially. The Fed’s action initially bolstered equity markets, but the potential impact on
Portfolio Composition
By sector
| | | | |
Information Technology | | | 30.6 | % |
Consumer Discretionary | | | 19.3 | |
Industrials | | | 12.4 | |
Health Care | | | 10.9 | |
Consumer Staples | | | 8.0 | |
Energy | | | 6.4 | |
Financials | | | 6.0 | |
Materials | | | 3.4 | |
| Money Market Funds Plus Other Assets Less Liabilities | | | 3.0 | |
Top 10 Equity Holdings*
| | | | |
1. Apple Inc. | | | 7.6 | % |
2. Google Inc.-Class A | | | 2.3 | |
3. EMC Corp. | | | 2.2 | |
4. PepsiCo, Inc. | | | 2.0 | |
5. Pfizer Inc. | | | 2.0 | |
6. QUALCOMM, Inc. | | | 1.9 | |
7. DIRECTV | | | 1.9 | |
8. Express Scripts Holding Co. | | | 1.5 | |
9. Scripps Networks Interactive-Class A | | | 1.5 | |
10. Occidental Petroleum Corp. | | | 1.4 | |
| | | | | | |
Total Net Assets | | $ | 1.5 billion | |
| |
Total Number of Holdings* | | | 98 | |
The Fund’s holdings are subject to change, and there is no assurance that the Fund will continue to hold any particular security.
*Excluding money market fund holdings.
4 Invesco Summit Fund
employment and economic conditions remained uncertain. At the close of the reporting period, market volatility increased as many investors remained concerned about the uncertainty surrounding the presidential election and the so-called “fiscal cliff” – a variety of tax increases and spending cuts scheduled to take effect in January 2013, unless an agreement is reached between the White House and Congress.
Despite volatility for much of the reporting period, major equity market indexes delivered double-digit gains, and all 10 sectors of the S&P 500 Index had positive returns.1
The Fund had positive absolute returns but underperformed the Russell 1000 Growth Index for the reporting period. The Fund underperformed its style-specific index by the widest margins in the information technology (IT), health care, energy and consumer staples sectors. Underperformance in each of these sectors was driven predominately by stock selection. Some of this underperformance was offset by outperformance in the consumer discretionary, industrials and financials sectors.
The IT sector included both the Fund’s most significant detractor and its most significant contributor. Rovi was the largest detractor and negatively affected performance. The company announced the departure of some senior managers, that sales of some legacy products were slowing more quickly than expected and that the introduction of newer growth products would be delayed. We sold our position during the reporting period. Facebook was another detractor from relative performance. Significant negative sentiment surrounded the stock after poor management of the company’s initial public offering earlier in the year. In addition, the company has been slow to make money from, or “monetize,” its mobile platform, which is the fastest growing area of its business. We sold our Facebook holdings during the reporting period. Overall stock selection in the IT sector was negative and outweighed the positive contribution from the Fund’s largest position and largest contributor, Apple.
In the health care sector, one of the leading detractors from performance was Allscripts, which provides clinical, financial, connectivity and information solutions to hospitals and physicians. Allscripts announced dramatically lower earnings during the reporting period, and a power struggle in the boardroom led to the departure of a number of board members. Surrounding these events, the
stock price dropped precipitously. We sold our position in Allscripts before the close of the reporting period.
Energy was one of the poorer performing and most volatile sectors during the reporting period as natural gas prices declined significantly before rebounding somewhat; oil prices took a similar path but with different timing. The Fund also underperformed in the energy sector due to an emphasis on service providers including Superior Energy Services, which saw weakness in some businesses and which announced an acquisition which increased its exposure to North America land drilling and was received poorly by the market. Exploration and production company Occidental Petroleum was another detractor from relative performance for the reporting period.
The Fund had strong stock selection and outperformed in the consumer discretionary sector. Positive contributions came from diverse businesses such as Home Depot, Comcast and luxury-brand retailer Michael Kors. Additionally, the Fund outperformed in the industrials sector. At the start of the reporting period, significant pessimism surrounded Inger-soll-Rand due to concern about US economic growth and execution issues in the company’s residential heating, ventilation and air conditioning business. As those concerns subsided and the company’s homebuilding related businesses showed strength, the stock rose significantly during the reporting period.
As we’ve discussed, the stock market was volatile during the reporting period. We thank you for your commitment to Invesco Summit Fund.
1 Source: Lipper Inc.
The views and opinions expressed in management’s discussion of Fund performance are those of Invesco Advisers, Inc. These views and opinions are subject to change at any time based on factors such as market and economic conditions. These views and opinions may not be relied upon as investment advice or recommendations, or as an offer for a particular security. The information is not a complete analysis of every aspect of any market, country, industry, security or the Fund. Statements of fact are from sources considered reliable, but Invesco Advisers, Inc. makes no representation or warranty as to their completeness or accuracy. Although historical performance is no guarantee of future results, these insights may help you understand our investment management philosophy.
See important Fund and, if applicable, index disclosures later in this report.
| | |

| | Erik Voss Chartered Financial Analyst, portfolio manager, is lead manager of Invesco Summit Fund. He joined Invesco in 2010. |
| Mr. Voss earned a BS in mathematics and an MS in finance from the University of Wisconsin. |
| |
 | | Ryan Amerman Chartered Financial Analyst, portfolio manager, is manager of Invesco Summit Fund. He joined Invesco in 1996. |
| Mr. Amerman earned a BBA from Stephen F. Austin State University and an MBA from the University of St. Thomas. |
5 Invesco Summit Fund
Your Fund’s Long-Term Performance
Results of a $10,000 Investment – Oldest Share Class(es) without Sales Charges
Fund and index data from 10/31/02*
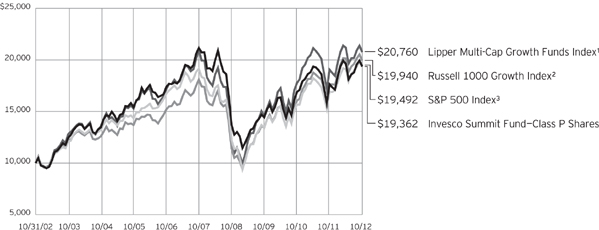
1 Source: Lipper Inc.
2 Source(s): Invesco, Russell via FactSet Research Systems Inc.
3 Source(s): Invesco, S&P-Dow Jones via FactSet Research Systems Inc.
* During the reporting period, Invesco changed its policy regarding growth of $10,000 charts. For funds older than 10 years, we previously showed performance since inception. Going forward, we will show performance for the most recent 10 years, since this more accurately reflects the experience of the typical shareholder. As a result, charts now may include benchmarks that did not appear previously, because the funds’ inception predated the benchmarks’ inception. Also, all charts will now be presented using a linear format.
Results of a $10,000 Investment – Oldest Share Class(es) with Sales Charges since Inception
Fund and index data from 10/31/05
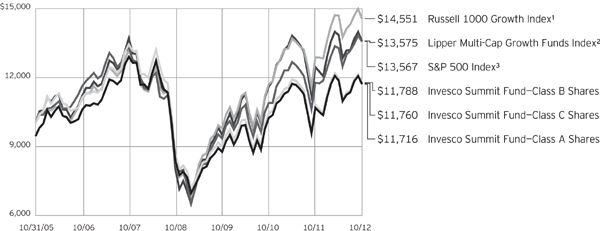
1 Source(s): Invesco, Russell via FactSet Research Systems Inc.
2 Source: Lipper Inc.
3 Source(s): Invesco, S&P-Dow Jones via FactSet Research Systems Inc.
Past performance cannot guarantee comparable future results.
The performance data shown in the first chart above is that of the Fund’s Class P shares. The data shown in this chart includes reinvested distributions and Fund expenses including management fees. Index results include reinvested dividends.
The performance data shown in the second chart is that of the Fund’s Class A, B and C shares. The data shown in this chart includes reinvested distributions, applicable sales charges and Fund expenses including management fees. Index results include reinvested dividends, but they do not reflect sales charges.
Performance of an index of funds reflects fund expenses and management fees; performance of a market index does not. Performance shown in the charts and table does not reflect deduction of taxes a shareholder would pay on Fund distributions or sale of Fund shares. The performance of the Fund’s share classes will differ primarily due to different sales charge structures and class expenses.
6 Invesco Summit Fund
Average Annual Total Returns
As of 10/31/12, including maximum applicable sales charges
| | | | |
Class A Shares | | | | |
Inception (10/31/05) | | | 2.29 | % |
5 Years | | | -3.02 | |
1 Year | | | 3.62 | |
| |
Class B Shares | | | | |
Inception (10/31/05) | | | 2.38 | % |
5 Years | | | -2.95 | |
1 Year | | | 3.99 | |
| |
Class C Shares | | | | |
Inception (10/31/05) | | | 2.34 | % |
5 Years | | | -2.64 | |
1 Year | | | 7.82 | |
| |
Class P Shares | | | | |
Inception (11/1/82) | | | 8.45 | % |
10 Years | | | 6.83 | |
5 Years | | | -1.76 | |
1 Year | | | 9.80 | |
| |
Class S Shares | | | | |
Inception | | | 3.19 | % |
5 Years | | | -1.82 | |
1 Year | | | 9.82 | |
| |
Class Y Shares | | | | |
Inception | | | 3.29 | % |
5 Years | | | -1.68 | |
1 Year | | | 10.14 | |
| |
Class R5 Shares | | | | |
Inception | | | 3.36 | % |
5 Years | | | -1.59 | |
1 Year | | | 10.12 | |
Class S shares incepted on September 25, 2009. Performance shown prior to that date is that of Class A shares and includes the 12b-1 fees applicable to Class A shares. Class A share performance reflects any applicable fee waivers or expense reimbursements.
Class Y shares incepted on October 3, 2008. Performance shown prior to that date is that of Class A shares and includes the 12b-1 fees applicable to Class A shares. Class A share performance reflects any applicable fee waivers or expense reimbursements.
Average Annual Total Returns
As of 9/30/12, the most recent calendar quarter-end, including maximum applicable sales charges
| | | | |
Class A Shares | | | | |
Inception (10/31/05) | | | 2.76 | % |
5 Years | | | -1.93 | |
1 Year | | | 19.09 | |
| |
Class B Shares | | | | |
Inception (10/31/05) | | | 2.86 | % |
5 Years | | | -1.88 | |
1 Year | | | 20.30 | |
| |
Class C Shares | | | | |
Inception (10/31/05) | | | 2.82 | % |
5 Years | | | -1.57 | |
1 Year | | | 24.02 | |
| |
Class P Shares | | | | |
Inception (11/1/82) | | | 8.58 | % |
10 Years | | | 7.58 | |
5 Years | | | -0.67 | |
1 Year | | | 26.21 | |
| |
Class S Shares | | | | |
Inception | | | 3.66 | % |
5 Years | | | -0.75 | |
1 Year | | | 26.09 | |
| |
Class Y Shares | | | | |
Inception | | | 3.76 | % |
5 Years | | | -0.61 | |
1 Year | | | 26.45 | |
| |
Class R5 Shares | | | | |
Inception | | | 3.83 | % |
5 Years | | | -0.51 | |
1 Year | | | 26.52 | |
Class R5 shares incepted on October 3, 2008. Performance shown prior to that date is that of Class A shares and includes the 12b-1 fees applicable to Class A shares. Class A share performance reflects any applicable fee waivers or expense reimbursements.
The performance data quoted represent past performance and cannot guarantee comparable future results; current performance may be lower or higher. Please visit invesco.com/performance for the most recent month-end performance.
Performance figures reflect reinvested distributions, changes in net asset value and the effect of the maximum sales charge unless otherwise stated. Investment return and principal value will fluctuate so that you may have a gain or loss when you sell shares.
The total annual Fund operating expense ratio set forth in the most recent Fund prospectus as of the date of this report for Class A, Class B, Class C, Class P, Class S, Class Y and Class R5 shares was 1.07%, 1.82%, 1.82%, 0.92%, 0.97%, 0.82% and 0.75%, respectively. The expense ratios presented above may vary from the expense ratios presented in other sections of this report that are based on expenses incurred during the period covered by this report.
Class A share performance reflects the maximum 5.50% sales charge, and Class B and Class C share performance reflects the applicable contingent deferred sales charge (CDSC) for the period involved. The CDSC on Class B shares declines from 5% beginning at the time of purchase to 0% at the beginning of the seventh year. The CDSC on Class C shares is 1% for the first year after purchase. Class P, Class S, Class Y and Class R5 shares do not have a front-end sales charge or contingent deferred sales charge (CDSC); therefore, returns shown are at net asset value.
The performance numbers shown do not reflect the creation and sales charges and other fees assessed by the AIM Summit Investors Plans, which were dissolved effective December 8, 2006.
The performance of the Fund’s share classes will differ primarily due to different sales charge structures and class expenses.
7 Invesco Summit Fund
Invesco Summit Fund’s investment objective is long-term growth of capital.
| n | | Unless otherwise stated, information presented in this report is as of October 31, 2012, and is based on total net assets. |
| n | | Unless otherwise noted, all data provided by Invesco. |
| n | | To access your Fund’s reports/prospectus, visit invesco.com/fundreports. |
About share classes
| n | | Class B shares may not be purchased for new or additional investments. Please see the prospectus for more information. |
| n | | Class P shares, Class S shares and Class Y shares are available only to certain investors. Please see the prospectus for more information. |
| n | | Class R5 shares are primarily intended for retirement plans that meet certain standards and for institutional investors. On September 24, 2012, Institutional Class shares were renamed Class R5 shares. Please see the prospectus for more information. |
Principal risks of investing in the Fund
| n | | Foreign securities risk. The Fund’s foreign investments may be affected by changes in a foreign country’s exchange rates, political and social instability, changes in economic or taxation policies, difficulties when enforcing obligations, decreased liquidity, and increased volatility. Foreign companies may be subject to less regulation resulting in less publicly available information about the companies. |
| n | | Growth investing risk. Growth stocks tend to be more expensive relative to their earnings or assets compared with other types of stock. As a result they tend to be more sensitive to changes in their earnings and can be more volatile. |
| n | | Management risk. The investment techniques and risk analysis used by the Fund’s portfolio managers may not produce the desired results. |
| n | | Market risk. The prices of and the income generated by the Fund’s securities may decline in response to, among other things, investor sentiment, general economic and market conditions, regional or global instability, and currency and interest rate fluctuations. |
About indexes used in this report
| n | | The S&P 500® Index is an unmanaged index considered representative of the US stock market. |
| n | | The Russell 1000® Growth Index is an unmanaged index considered representative of large-cap growth stocks. The Russell 1000 Growth Index is a trademark/service mark of the Frank Russell Co. Russell® is a trademark of the Frank Russell Co. |
| n | | The Lipper Multi-Cap Growth Funds Index is an unmanaged index considered representative of multi-cap growth funds tracked by Lipper. |
| n | | The Fund is not managed to track the performance of any particular index, including the index(es) defined here, and consequently, the performance of the Fund may deviate significantly from the performance of the index(es). |
| n | | A direct investment cannot be made in an index. Unless otherwise indicated, index results include reinvested dividends, and they do not reflect sales charges. Performance of the peer group, if applicable, reflects fund expenses; performance of a market index does not. |
Other information
| n | | The returns shown in management’s discussion of Fund performance are based on net asset values calculated for shareholder transactions. Generally accepted accounting principles require adjustments to be made to the net assets of the Fund at period end for financial reporting purposes, and as such, the net asset values for shareholder transactions and the returns based on those net asset values may differ from the net asset values and returns reported in the Financial Highlights. |
| n | | Industry classifications used in this report are generally according to the Global Industry Classification Standard, which was developed by and is the exclusive property and a service mark of MSCI Inc. and Standard & Poor’s. |
This report must be accompanied or preceded by a currently effective Fund prospectus, which contains more complete information, including sales charges and expenses. Investors should read it carefully before investing.
NOT FDIC INSURED | MAY LOSE VALUE | NO BANK GUARANTEE
Fund Nasdaq Symbols
| | | | |
| |
Class A Shares | | | ASMMX | |
Class B Shares | | | BSMMX | |
Class C Shares | | | CSMMX | |
Class P Shares | | | SMMIX | |
Class S Shares | | | SMMSX | |
Class Y Shares | | | ASMYX | |
Class R5 Shares | | | SMITX | |
8 Invesco Summit Fund
Schedule of Investments(a)
October 31, 2012
| | | | | | | | |
| | | Shares | | | Value | |
Common Stocks & Other Equity Interests–96.98% | |
Advertising–0.70% | | | | | | | | |
Interpublic Group of Cos., Inc. (The) | | | 1,073,395 | | | $ | 10,841,289 | |
| | |
Aerospace & Defense–2.48% | | | | | | | | |
Boeing Co. (The) | | | 245,749 | | | | 17,310,559 | |
Precision Castparts Corp. | | | 75,931 | | | | 13,141,378 | |
United Technologies Corp. | | | 101,236 | | | | 7,912,606 | |
| | | | | | | | 38,364,543 | |
| | |
Apparel Retail–1.30% | | | | | | | | |
Gap, Inc. (The) | | | 563,030 | | | | 20,111,432 | |
|
Apparel, Accessories & Luxury Goods–1.96% | |
Coach, Inc. | | | 224,251 | | | | 12,569,268 | |
Michael Kors Holdings Ltd.(b) | | | 173,140 | | | | 9,469,027 | |
Prada S.p.A. (Italy)(c) | | | 1,016,100 | | | | 8,263,013 | |
| | | | | | | | 30,301,308 | |
| | |
Application Software–1.04% | | | | | | | | |
Cadence Design Systems, Inc.(b) | | | 428,041 | | | | 5,418,999 | |
Citrix Systems, Inc.(b) | | | 173,142 | | | | 10,701,907 | |
| | | | | | | | 16,120,906 | |
|
Asset Management & Custody Banks–0.73% | |
Affiliated Managers Group, Inc.(b) | | | 89,325 | | | | 11,299,612 | |
| | |
Auto Parts & Equipment–0.52% | | | | | | | | |
Tenneco Inc.(b) | | | 264,734 | | | | 8,087,624 | |
| | |
Biotechnology–3.84% | | | | | | | | |
Acorda Therapeutics Inc.(b) | | | 433,098 | | | | 10,372,697 | |
Amgen Inc. | | | 173,564 | | | | 15,021,097 | |
Celgene Corp.(b) | | | 197,991 | | | | 14,516,700 | |
Gilead Sciences, Inc.(b) | | | 289,989 | | | | 19,475,661 | |
| | | | | | | | 59,386,155 | |
| | |
Broadcasting–2.05% | | | | | | | | |
CBS Corp.–Class B | | | 286,294 | | | | 9,275,926 | |
Scripps Networks Interactive–Class A | | | 369,439 | | | | 22,432,336 | |
| | | | | | | | 31,708,262 | |
| | |
Cable & Satellite–3.98% | | | | | | | | |
Comcast Corp.–Class A | | | 555,146 | | | | 20,823,527 | |
DIRECTV(b) | | | 580,837 | | | | 29,686,579 | |
DISH Network Corp.–Class A(d) | | | 310,548 | | | | 11,064,825 | |
| | | | | | | | 61,574,931 | |
|
Communications Equipment–2.82% | |
Cisco Systems, Inc. | | | 815,139 | | | | 13,971,482 | |
QUALCOMM, Inc. | | | 508,005 | | | | 29,756,393 | |
| | | | | | | | 43,727,875 | |
| | |
Computer Hardware–7.61% | | | | | | | | |
Apple Inc. | | | 197,871 | | | | 117,753,032 | |
| | | | | | | | |
| | | Shares | | | Value | |
Computer Storage & Peripherals–2.24% | |
EMC Corp.(b) | | | 1,422,586 | | | $ | 34,739,550 | |
| |
Construction & Engineering–1.19% | | | | | |
Fluor Corp. | | | 91,001 | | | | 5,082,406 | |
Foster Wheeler AG (Switzerland)(b) | | | 600,497 | | | | 13,373,068 | |
| | | | | | | | 18,455,474 | |
|
Construction & Farm Machinery & Heavy Trucks–1.72% | |
Cummins Inc. | | | 170,504 | | | | 15,955,764 | |
Joy Global Inc. | | | 171,168 | | | | 10,689,442 | |
| | | | | | | | 26,645,206 | |
| | |
Consumer Finance–0.81% | | | | | | | | |
Capital One Financial Corp. | | | 209,770 | | | | 12,621,861 | |
|
Data Processing & Outsourced Services–2.86% | |
Genpact Ltd. | | | 748,942 | | | | 13,188,869 | |
MasterCard, Inc.–Class A | | | 36,696 | | | | 16,914,287 | |
Visa Inc.–Class A | | | 102,490 | | | | 14,221,512 | |
| | | | | | | | 44,324,668 | |
| | |
Department Stores–1.11% | | | | | | | | |
Macy’s, Inc. | | | 452,484 | | | | 17,226,066 | |
| | |
Diversified Metals & Mining–0.27% | | | | | | | | |
Freeport-McMoRan Copper & Gold Inc. | | | 109,012 | | | | 4,238,387 | |
|
Electrical Components & Equipment–1.51% | |
AMETEK, Inc. | | | 342,976 | | | | 12,192,797 | |
Regal-Beloit Corp. | | | 172,750 | | | | 11,259,845 | |
| | | | | | | | 23,452,642 | |
| | |
Electronic Components–0.96% | | | | | | | | |
Amphenol Corp.–Class A | | | 246,621 | | | | 14,829,321 | |
|
Fertilizers & Agricultural Chemicals–1.60% | |
Monsanto Co. | | | 150,477 | | | | 12,951,555 | |
Mosaic Co. (The) | | | 225,152 | | | | 11,784,456 | |
| | | | | | | | 24,736,011 | |
| | |
Food Retail–1.40% | | | | | | | | |
Kroger Co. (The) | | | 858,868 | | | | 21,660,651 | |
| |
General Merchandise Stores–1.26% | | | | | |
Dollar General Corp.(b) | | | 400,953 | | | | 19,494,335 | |
| | |
Health Care Equipment–0.66% | | | | | | | | |
Covidien PLC | | | 185,417 | | | | 10,188,664 | |
| | |
Health Care Services–1.51% | | | | | | | | |
Express Scripts Holding Co.(b) | | | 379,232 | | | | 23,337,937 | |
|
Heavy Electrical Equipment–0.61% | |
ABB Ltd. (Switzerland)(b) | | | 525,913 | | | | 9,501,968 | |
See accompanying Notes to Financial Statements which are an integral part of the financial statements.
9 Invesco Summit Fund
| | | | | | | | |
| | | Shares | | | Value | |
Home Improvement Retail–1.10% | | | | | | | | |
Home Depot, Inc. (The) | | | 277,071 | | | $ | 17,006,618 | |
| | |
Homebuilding–0.82% | | | | | | | | |
PulteGroup Inc.(b) | | | 731,630 | | | | 12,686,464 | |
| | |
Homefurnishing Retail–0.76% | | | | | | | | |
Bed Bath & Beyond Inc.(b) | | | 203,527 | | | | 11,739,437 | |
|
Hotels, Resorts & Cruise Lines–0.62% | |
Royal Caribbean Cruises Ltd. | | | 287,307 | | | | 9,673,627 | |
| | |
Household Products–1.00% | | | | | | | | |
Procter & Gamble Co. (The) | | | 224,574 | | | | 15,549,504 | |
|
Human Resource & Employment Services–0.62% | |
Robert Half International, Inc. | | | 354,644 | | | | 9,536,377 | |
|
Hypermarkets & Super Centers–0.93% | |
Costco Wholesale Corp. | | | 64,086 | | | | 6,307,985 | |
Wal-Mart Stores, Inc. | | | 107,653 | | | | 8,076,128 | |
| | | | | | | | 14,384,113 | |
| | |
Industrial Conglomerates–0.89% | | | | | | | | |
Danaher Corp. | | | 265,155 | | | | 13,716,468 | |
| | |
Industrial Gases–0.72% | | | | | | | | |
Praxair, Inc. | | | 105,435 | | | | 11,198,251 | |
| | |
Industrial Machinery–1.09% | | | | | | | | |
Ingersoll-Rand PLC | | | 357,320 | | | | 16,804,760 | |
| | |
Integrated Oil & Gas–2.46% | | | | | | | | |
Exxon Mobil Corp. | | | 175,688 | | | | 16,017,475 | |
Occidental Petroleum Corp. | | | 279,691 | | | | 22,084,401 | |
| | | | | | | | 38,101,876 | |
| | |
Internet Retail–1.93% | | | | | | | | |
Amazon.com, Inc.(b) | | | 76,587 | | | | 17,830,985 | |
Priceline.com Inc.(b) | | | 20,949 | | | | 12,019,908 | |
| | | | | | | | 29,850,893 | |
| | |
Internet Software & Services–4.34% | | | | | | | | |
Baidu, Inc.–ADR (China)(b)(d) | | | 105,969 | | | | 11,298,415 | |
eBay Inc.(b) | | | 215,164 | | | | 10,390,270 | |
Google Inc.–Class A(b) | | | 52,321 | | | | 35,578,280 | |
VeriSign, Inc.(b) | | | 266,331 | | | | 9,872,890 | |
| | | | | | | | 67,139,855 | |
|
Investment Banking & Brokerage–0.85% | |
Goldman Sachs Group, Inc. (The) | | | 107,456 | | | | 13,151,540 | |
|
IT Consulting & Other Services–2.19% | |
Accenture PLC–Class A | | | 266,801 | | | | 17,985,055 | |
Cognizant Technology Solutions Corp.–Class A(b) | | | 237,913 | | | | 15,856,902 | |
| | | | | | | | 33,841,957 | |
| | |
Metal & Glass Containers–0.31% | | | | | | | | |
Greif Inc.–Class A | | | 115,229 | | | | 4,835,009 | |
| | | | | | | | |
| | | Shares | | | Value | |
Oil & Gas Equipment & Services–2.64% | |
Cameron International Corp.(b) | | | 357,304 | | | $ | 18,093,875 | |
Schlumberger Ltd. | | | 241,235 | | | | 16,773,069 | |
Superior Energy Services, Inc.(b) | | | 297,942 | | | | 6,057,161 | |
| | | | | | | | 40,924,105 | |
| |
Oil & Gas Exploration & Production–1.25% | | | | | |
Apache Corp. | | | 233,245 | | | | 19,301,024 | |
| |
Other Diversified Financial Services–1.40% | | | | | |
JPMorgan Chase & Co. | | | 518,383 | | | | 21,606,203 | |
| | |
Packaged Foods & Meats–1.43% | | | | | | | | |
Kraft Foods Group, Inc.(b) | | | 163,838 | | | | 7,451,352 | |
Mondelez International Inc.–Class A | | | 555,022 | | | | 14,730,284 | |
| | | | | | | | 22,181,636 | |
| | |
Pharmaceuticals–4.86% | | | | | | | | |
Abbott Laboratories | | | 292,164 | | | | 19,142,585 | |
Allergan, Inc. | | | 123,584 | | | | 11,112,673 | |
Johnson & Johnson | | | 203,186 | | | | 14,389,633 | |
Pfizer Inc. | | | 1,232,888 | | | | 30,661,925 | |
| | | | | | | | 75,306,816 | |
|
Property & Casualty Insurance–0.53% | |
ACE Ltd. | | | 104,381 | | | | 8,209,566 | |
| | |
Railroads–0.99% | | | | | | | | |
Union Pacific Corp. | | | 125,231 | | | | 15,407,170 | |
| | |
Regional Banks–1.72% | | | | | | | | |
Fifth Third Bancorp | | | 1,028,248 | | | | 14,940,443 | |
First Republic Bank | | | 340,942 | | | | 11,711,358 | |
| | | | | | | | 26,651,801 | |
| | |
Restaurants–0.36% | | | | | | | | |
Chipotle Mexican Grill, Inc.(b) | | | 21,633 | | | | 5,506,247 | |
| | |
Semiconductors–2.21% | | | | | | | | |
Broadcom Corp.–Class A(b) | | | 375,471 | | | | 11,840,478 | |
Fairchild Semiconductor International, Inc.(b) | | | 593,412 | | | | 6,978,525 | |
Maxim Integrated Products, Inc. | | | 293,763 | | | | 8,085,827 | |
Xilinx, Inc. | | | 222,617 | | | | 7,292,933 | |
| | | | | | | | 34,197,763 | |
| | |
Soft Drinks–3.25% | | | | | | | | |
Coca-Cola Co. (The) | | | 412,338 | | | | 15,330,727 | |
Monster Beverage Corp.(b) | | | 83,464 | | | | 3,728,337 | |
PepsiCo, Inc. | | | 451,164 | | | | 31,238,595 | |
| | | | | | | | 50,297,659 | |
| | |
Specialty Chemicals–0.49% | | | | | | | | |
LyondellBasell Industries N.V.–Class A | | | 143,408 | | | | 7,656,553 | |
| | |
Specialty Stores–0.79% | | | | | | | | |
Vitamin Shoppe, Inc.(b) | | | 214,143 | | | | 12,257,545 | |
See accompanying Notes to Financial Statements which are an integral part of the financial statements.
10 Invesco Summit Fund
| | | | | | | | |
| | | Shares | | | Value | |
Systems Software–3.56% | | | | | | | | |
Check Point Software Technologies Ltd. (Israel)(b) | | | 438,500 | | | $ | 19,526,405 | |
Microsoft Corp. | | | 646,851 | | | | 18,457,893 | |
Oracle Corp. | | | 551,794 | | | | 17,133,204 | |
| | | | | | | | 55,117,502 | |
|
Technology Distributors–0.82% | |
Avnet, Inc.(b) | | | 441,933 | | | | 12,661,380 | |
| | |
Trucking–1.31% | | | | | | | | |
J.B. Hunt Transport Services, Inc. | | | 345,251 | | | | 20,266,234 | |
Total Common Stocks & Other Equity Interests (Cost $1,167,102,283) | | | | 1,501,495,663 | |
|
Money Market Funds–3.33% | |
Liquid Assets Portfolio–Institutional Class(e) | | | 25,803,955 | | | | 25,803,955 | |
Premier Portfolio–Institutional Class(e) | | | 25,803,955 | | | | 25,803,955 | |
Total Money Market Funds
(Cost $51,607,910) | | | | 51,607,910 | |
TOTAL INVESTMENTS (excluding investments purchased with cash collateral from securities on loan)–100.31% (Cost $1,218,710,193) | | | | 1,553,103,573 | |
| | | | | | | | |
| | | Shares | | | Value | |
Investments Purchased with Cash Collateral from Securities on Loan | | | | | |
Money Market Funds–0.13% | |
Liquid Assets Portfolio—Institutional Class (Cost $2,038,025)(e)(f) | | | 2,038,025 | | | $ | 2,038,025 | |
TOTAL INVESTMENTS–100.44%
(Cost $1,220,748,218) | | | | 1,555,141,598 | |
OTHER ASSETS LESS LIABILITIES–(0.44)% | | | | (6,863,526 | ) |
NET ASSETS–100.00% | | | | | | $ | 1,548,278,072 | |
Investment Abbreviations:
| | |
| ADR | | – American Depositary Receipt |
Notes to Schedule of Investments:
| (a) | Industry and/or sector classifications used in this report are generally according to the Global Industry Classification Standard, which was developed by and is the exclusive property and a service mark of MSCI Inc. and Standard & Poor’s. |
| (b) | Non-income producing security. |
| (c) | Security purchased or received in a transaction exempt from registration under the Securities Act of 1933, as amended. The security may be resold pursuant to an exemption from registration under the 1933 Act, typically to qualified institutional buyers. The value of this security at October 31, 2012 represented less than 1% of the Fund’s Net Assets. |
| (d) | All or a portion of this security was out on loan at October 31, 2012. |
| (e) | The money market fund and the Fund are affiliated by having the same investment adviser. |
| (f) | The security has been segregated to satisfy the commitment to return the cash collateral received in securities lending transactions upon the borrower’s return of the securities loaned. See Note 1I. |
See accompanying Notes to Financial Statements which are an integral part of the financial statements.
11 Invesco Summit Fund
Statement of Assets and Liabilities
October 31, 2012
| | | | |
Assets: | | | | |
Investments, at value (Cost $1,167,102,283)* | | $ | 1,501,495,663 | |
Investments in affiliated money market funds, at value and cost | | | 53,645,935 | |
Total investments, at value (Cost $1,220,748,218) | | | 1,555,141,598 | |
Cash | | | 14,218 | |
Receivable for: | | | | |
Fund shares sold | | | 228,196 | |
Dividends | | | 810,527 | |
Investment for trustee deferred compensation and retirement plans | | | 110,119 | |
Other assets | | | 51,959 | |
Total assets | | | 1,556,356,617 | |
| |
Liabilities: | | | | |
Payable for: | | | | |
Investments purchased | | | 3,226,480 | |
Fund shares reacquired | | | 1,848,378 | |
Collateral upon return of securities loaned | | | 2,038,025 | |
Accrued fees to affiliates | | | 450,395 | |
Accrued other operating expenses | | | 112,904 | |
Trustee deferred compensation and retirement plans | | | 402,363 | |
Total liabilities | | | 8,078,545 | |
Net assets applicable to shares outstanding | | $ | 1,548,278,072 | |
| |
Net assets consist of: | | | | |
Shares of beneficial interest | | $ | 1,388,837,093 | |
Undistributed net investment income | | | 2,802,693 | |
Undistributed net realized gain (loss) | | | (177,755,234 | ) |
Unrealized appreciation | | | 334,393,520 | |
| | | $ | 1,548,278,072 | |
| | | | |
Net Assets: | | | | |
Class A | | $ | 22,711,802 | |
Class B | | $ | 913,227 | |
Class C | | $ | 1,577,320 | |
Class P | | $ | 1,518,577,411 | |
Class S | | $ | 3,895,516 | |
Class Y | | $ | 479,463 | |
Class R5 | | $ | 123,333 | |
|
Shares outstanding, $0.001 par value per share,
with an unlimited number of shares authorized: | |
Class A | | | 1,791,859 | |
Class B | | | 74,533 | |
Class C | | | 129,061 | |
Class P | | | 119,066,220 | |
Class S | | | 306,760 | |
Class Y | | | 37,707 | |
Class R5 | | | 9,689 | |
Class A: | | | | |
Net asset value per share | | $ | 12.67 | |
Maximum offering price per share | | | | |
(Net asset value of $12.67 ¸ 94.50%) | | $ | 13.41 | |
Class B: | | | | |
Net asset value and offering price per share | | $ | 12.25 | |
Class C: | | | | |
Net asset value and offering price per share | | $ | 12.22 | |
Class P: | | | | |
Net asset value and offering price per share | | $ | 12.75 | |
Class S: | | | | |
Net asset value and offering price per share | | $ | 12.70 | |
Class Y: | | | | |
Net asset value and offering price per share | | $ | 12.72 | |
Class R5: | | | | |
Net asset value and offering price per share | | $ | 12.73 | |
| * | At October 31, 2012, securities with an aggregate value of $1,871,338 were on loan to brokers. |
See accompanying Notes to Financial Statements which are an integral part of the financial statements.
12 Invesco Summit Fund
Statement of Operations
For the year ended October 31, 2012 and 2011
| | | | |
Investment income: | |
Dividends (net of foreign withholding taxes of $80,370) | | $ | 18,504,565 | |
Dividends from affiliated money market funds (includes securities lending income of $74,697) | | | 130,481 | |
Total investment income | | | 18,635,046 | |
| |
Expenses: | | | | |
Advisory fees | | | 10,125,170 | |
Administrative services fees | | | 406,102 | |
Custodian fees | | | 45,026 | |
Distribution fees: | | | | |
Class A | | | 55,696 | |
Class B | | | 10,330 | |
Class C | | | 20,278 | |
Class P | | | 1,555,532 | |
Class S | | | 6,219 | |
Transfer agent fees — A, B, C, P, S and Y | | | 2,314,921 | |
Transfer agent fees — R5 | | | 32 | |
Trustees’ and officers’ fees and benefits | | | 104,929 | |
Other | | | 224,640 | |
Total expenses | | | 14,868,875 | |
Less: Fees waived and expense offset arrangement(s) | | | (69,734 | ) |
Net expenses | | | 14,799,141 | |
Net investment income | | | 3,835,905 | |
| |
Realized and unrealized gain (loss) from: | | | | |
Net realized gain (loss) from: | | | | |
Investment securities (includes net gains (losses) from securities sold to affiliates of $(4,390,414)) | | | 37,098,963 | |
Foreign currencies | | | (20,253 | ) |
| | | | 37,078,710 | |
Change in net unrealized appreciation of: | | | | |
Investment securities | | | 109,094,293 | |
Foreign currencies | | | 909 | |
| | | | 109,095,202 | |
Net realized and unrealized gain | | | 146,173,912 | |
Net increase in net assets resulting from operations | | $ | 150,009,817 | |
See accompanying Notes to Financial Statements which are an integral part of the financial statements.
13 Invesco Summit Fund
Statement of Changes in Net Assets
For the years ended October 31, 2012 and 2011
| | | | | | | | |
| | | 2012 | | | 2011 | |
Operations: | | | | | | | | |
Net investment income | | $ | 3,835,905 | | | $ | 2,414,493 | |
Net realized gain | | | 37,078,710 | | | | 168,268,966 | |
Change in net unrealized appreciation (depreciation) | | | 109,095,202 | | | | (90,420,025 | ) |
Net increase in net assets resulting from operations | | | 150,009,817 | | | | 80,263,434 | |
| | |
Distributions to shareholders from net investment income: | | | | | | | | |
Class A | | | (3,510 | ) | | | (3,313 | ) |
Class P | | | (2,372,724 | ) | | | (2,510,910 | ) |
Class S | | | (5,545 | ) | | | (5,625 | ) |
Class Y | | | (3,118 | ) | | | (3,614 | ) |
Class R5 | | | (261 | ) | | | (45 | ) |
Total distributions from net investment income | | | (2,385,158 | ) | | | (2,523,507 | ) |
| | |
Share transactions–net: | | | | | | | | |
Class A | | | 2,987,140 | | | | (5,212,938 | ) |
Class B | | | (269,461 | ) | | | (443,494 | ) |
Class C | | | (381,914 | ) | | | (566,763 | ) |
Class P | | | (171,477,675 | ) | | | (194,783,601 | ) |
Class S | | | (579,936 | ) | | | (350,730 | ) |
Class Y | | | (826,901 | ) | | | (314,455 | ) |
Class R5 | | | 39,475 | | | | 60,364 | |
Net increase (decrease) in net assets resulting from share transactions | | | (170,509,272 | ) | | | (201,611,617 | ) |
Net increase (decrease) in net assets | | | (22,884,613 | ) | | | (123,871,690 | ) |
| | |
Net assets: | | | | | | | | |
Beginning of year | | | 1,571,162,685 | | | | 1,695,034,375 | |
End of year (includes undistributed net investment income of $2,802,693 and $2,041,670, respectively) | | $ | 1,548,278,072 | | | $ | 1,571,162,685 | |
Notes to Financial Statements
October 31, 2012
NOTE 1—Significant Accounting Policies
Invesco Summit Fund (the “Fund”) is a series portfolio of AIM Equity Funds (Invesco Equity Funds) (the “Trust”). The Trust is a Delaware statutory trust registered under the Investment Company Act of 1940, as amended (the “1940 Act”), as an open-end series management investment company consisting of five separate portfolios, each authorized to issue an unlimited number of shares of beneficial interest. The assets, liabilities and operations of each portfolio are accounted for separately. Information presented in these financial statements pertains only to the Fund. Matters affecting each portfolio or class will be voted on exclusively by the shareholders of such portfolio or class.
The Fund’s investment objective is long-term growth of capital.
The Fund currently consists of seven different classes of shares: Class A, Class B, Class C, Class P, Class S, Class Y and Class R5. On September 24, 2012, Institutional Class shares were renamed Class R5 shares. Class P shares are not sold to members of the general public. Only shareholders who had accounts in the AIM Summit Investors Plans I and AIM Summit Investors Plans II at the close of business on December 8, 2006, may continue to purchase Class P shares. Class A shares are sold with a front-end sales charge unless certain waiver criteria are met and under certain circumstances load waiver shares may be subject to contingent deferred sales charges (“CDSC”). Class C shares are sold with a CDSC. Class P, Class S, Class Y and Class R5 shares are sold at net asset value. Effective November 30, 2010, new or additional investments in Class B shares are no longer permitted. Existing shareholders of Class B shares may continue to reinvest dividends and capital gains distributions in Class B shares until they convert to Class A shares. Also, shareholders in Class B shares will be able to exchange those shares for Class B shares of other Invesco Funds offering such shares until they convert to Class A shares. Generally, Class B shares will automatically convert to Class A shares on or about the month-end, which is at least eight years after the date of purchase. Redemption of Class B shares prior to the conversion date will be subject to a CDSC.
The following is a summary of the significant accounting policies followed by the Fund in the preparation of its financial statements.
| A. | Security Valuations— Securities, including restricted securities, are valued according to the following policy. |
A security listed or traded on an exchange (except convertible bonds) is valued at its last sales price or official closing price as of the close of the customary trading session on the exchange where the security is principally traded, or lacking any sales or official closing price on a particular day, the security may be valued at the closing bid price on that day. Securities traded in the over-the-counter market are valued based on prices furnished by independent pricing services or market makers. When such securities are valued by an independent pricing service they may be considered fair
14 Invesco Summit Fund
valued. Futures contracts are valued at the final settlement price set by an exchange on which they are principally traded. Listed options are valued at the mean between the last bid and ask prices from the exchange on which they are principally traded. Options not listed on an exchange are valued by an independent source at the mean between the last bid and ask prices. For purposes of determining net asset value per share, futures and option contracts generally are valued 15 minutes after the close of the customary trading session of the New York Stock Exchange (“NYSE”).
Investments in open-end and closed-end registered investment companies that do not trade on an exchange are valued at the end of day net asset value per share. Investments in open-end and closed-end registered investment companies that trade on an exchange are valued at the last sales price or official closing price as of the close of the customary trading session on the exchange where the security is principally traded.
Debt obligations (including convertible bonds) and unlisted equities are fair valued using an evaluated quote provided by an independent pricing service. Evaluated quotes provided by the pricing service may be determined without exclusive reliance on quoted prices, and may reflect appropriate factors such as institution-size trading in similar groups of securities, developments related to specific securities, dividend rate, yield, quality, type of issue, coupon rate, maturity, individual trading characteristics and other market data. Debt securities are subject to interest rate and credit risks. In addition, all debt securities involve some risk of default with respect to interest and/or principal payments.
Foreign securities (including foreign exchange contracts) are converted into U.S. dollar amounts using the applicable exchange rates as of the close of the NYSE. If market quotations are available and reliable for foreign exchange traded equity securities, the securities will be valued at the market quotations. Because trading hours for certain foreign securities end before the close of the NYSE, closing market quotations may become unreliable. If between the time trading ends on a particular security and the close of the customary trading session on the NYSE, events occur that are significant and make the closing price unreliable, the Fund may fair value the security. If the event is likely to have affected the closing price of the security, the security will be valued at fair value in good faith using procedures approved by the Board of Trustees. Adjustments to closing prices to reflect fair value may also be based on a screening process of an independent pricing service to indicate the degree of certainty, based on historical data, that the closing price in the principal market where a foreign security trade is not the current value as of the close of the NYSE. Foreign securities meeting the approved degree of certainty that the price is not reflective of current value will be priced at the indication of fair value from the independent pricing service. Multiple factors may be considered by the independent pricing service in determining adjustments to reflect fair value and may include information relating to sector indices, American Depositary Receipts and domestic and foreign index futures. Foreign securities may have additional risks including exchange rate changes, potential for sharply devalued currencies and high inflation, political and economic upheaval, the relative lack of issuer information, relatively low market liquidity and the potential lack of strict financial and accounting controls and standards.
Securities for which market prices are not provided by any of the above methods may be valued based upon quotes furnished by independent sources. The last bid price may be used to value equity securities. The mean between the last bid and asked prices is used to value debt obligations, including corporate loans.
Securities for which market quotations are not readily available or are unreliable are valued at fair value as determined in good faith by or under the supervision of the Trust’s officers following procedures approved by the Board of Trustees. Issuer specific events, market trends, bid/ask quotes of brokers and information providers and other market data may be reviewed in the course of making a good faith determination of a security’s fair value.
Valuations change in response to many factors including the historical and prospective earnings of the issuer, the value of the issuer’s assets, general economic conditions, interest rates, investor perceptions and market liquidity. Because of the inherent uncertainties of valuation, the values reflected in the financial statements may materially differ from the value received upon actual sale of those investments.
| B. | Securities Transactions and Investment Income — Securities transactions are accounted for on a trade date basis. Realized gains or losses on sales are computed on the basis of specific identification of the securities sold. Interest income is recorded on the accrual basis from settlement date. Dividend income (net of withholding tax, if any) is recorded on the ex-dividend date. |
The Fund may periodically participate in litigation related to Fund investments. As such, the Fund may receive proceeds from litigation settlements. Any proceeds received are included in the Statement of Operations as realized gain (loss) for investments no longer held and as unrealized gain (loss) for investments still held.
Brokerage commissions and mark ups are considered transaction costs and are recorded as an increase to the cost basis of securities purchased and/or a reduction of proceeds on a sale of securities. Such transaction costs are included in the determination of net realized and unrealized gain (loss) from investment securities reported in the Statement of Operations and the Statement of Changes in Net Assets and the net realized and unrealized gains (losses) on securities per share in the Financial Highlights. Transaction costs are included in the calculation of the Fund’s net asset value and, accordingly, they reduce the Fund’s total returns. These transaction costs are not considered operating expenses and are not reflected in net investment income reported in the Statement of Operations and Statement of Changes in Net Assets, or the net investment income per share and ratios of expenses and net investment income reported in the Financial Highlights, nor are they limited by any expense limitation arrangements between the Fund and the investment adviser.
The Fund allocates income and realized and unrealized capital gains and losses to a class based on the relative net assets of each class.
| C. | Country Determination — For the purposes of making investment selection decisions and presentation in the Schedule of Investments, the investment adviser may determine the country in which an issuer is located and/or credit risk exposure based on various factors. These factors include the laws of the country under which the issuer is organized, where the issuer maintains a principal office, the country in which the issuer derives 50% or more of its total revenues and the country that has the primary market for the issuer’s securities, as well as other criteria. Among the other criteria that may be evaluated for making this determination are the country in which the issuer maintains 50% or more of its assets, the type of security, financial guarantees and enhancements, the nature of the collateral and the sponsor organization. Country of issuer and/or credit risk exposure has been determined to be the United States of America, unless otherwise noted. |
| D. | Distributions — Distributions from income and net realized capital gain, if any, are generally declared and paid annually and recorded on the ex-dividend date. The Fund may elect to treat a portion of the proceeds from redemptions as distributions for federal income tax purposes. |
| E. | Federal Income Taxes — The Fund intends to comply with the requirements of Subchapter M of the Internal Revenue Code necessary to qualify as a regulated investment company and to distribute substantially all of the Fund’s taxable earnings to shareholders. As such, the Fund will not be subject to federal income taxes on otherwise taxable income (including net realized capital gain) that is distributed to shareholders. Therefore, no provision for federal income taxes is recorded in the financial statements. |
15 Invesco Summit Fund
The Fund files tax returns in the U.S. Federal jurisdiction and certain other jurisdictions. Generally, the Fund is subject to examinations by such taxing authorities for up to three years after the filing of the return for the tax period.
| F. | Expenses — Fees provided for under the Rule 12b-1 plan of a particular class of the Fund are charged to the operations of such class. Transfer agency fees and expenses and other shareholder recordkeeping fees and expenses attributable to Class R5 are charged to the class. Transfer agency fees and expenses and other shareholder recordkeeping fees and expenses relating to all other classes are allocated among those classes based on relative net assets. All other expenses are allocated among the classes based on relative net assets. |
| G. | Accounting Estimates — The preparation of financial statements in conformity with accounting principles generally accepted in the United States of America (“GAAP”) requires management to make estimates and assumptions that affect the reported amounts of assets and liabilities at the date of the financial statements and the reported amounts of revenues and expenses during the reporting period including estimates and assumptions related to taxation. Actual results could differ from those estimates by a significant amount. In addition, the Fund monitors for material events or transactions that may occur or become known after the period-end date and before the date the financial statements are released to print. |
| H. | Indemnifications — Under the Trust’s organizational documents, each Trustee, officer, employee or other agent of the Trust is indemnified against certain liabilities that may arise out of the performance of their duties to the Fund. Additionally, in the normal course of business, the Fund enters into contracts, including the Fund’s servicing agreements that contain a variety of indemnification clauses. The Fund’s maximum exposure under these arrangements is unknown as this would involve future claims that may be made against the Fund that have not yet occurred. The risk of material loss as a result of such indemnification claims is considered remote. |
| I. | Securities Lending — The Fund may lend portfolio securities having a market value up to one-third of the Fund’s total assets. Such loans are secured by collateral equal to no less than the market value of the loaned securities determined daily by the securities lending provider. Such collateral will be cash or debt securities issued or guaranteed by the U.S. Government or any of its sponsored agencies. Cash collateral received in connection with these loans is invested in short-term money market instruments or affiliated money market funds and is shown as such on the Schedule of Investments. It is the Fund’s policy to obtain additional collateral from or return excess collateral to the borrower by the end of the next business day, following the valuation date of the securities loaned. Therefore, the value of the collateral held may be temporarily less than the value of the securities on loan. Lending securities entails a risk of loss to the Fund if and to the extent that the market value of the securities loaned were to increase and the borrower did not increase the collateral accordingly, and the borrower fails to return the securities. Upon the failure of the borrower to return the securities, collateral may be liquidated and the securities may be purchased on the open market to replace the loaned securities. The Fund could experience delays and costs in gaining access to the collateral. The Fund bears the risk of any deficiency in the amount of the collateral available for return to the borrower due to any loss on the collateral invested. Dividends received on cash collateral investments for securities lending transactions, which are net of compensation to counterparties, is included in Dividends from affiliated money market funds on the Statement of Operations. The aggregate value of securities out on loan is shown as a footnote on the Statement of Assets and Liabilities, if any. |
| J. | Foreign Currency Translations — Foreign currency is valued at the close of the NYSE based on quotations posted by banks and major currency dealers. Portfolio securities and other assets and liabilities denominated in foreign currencies are translated into U.S. dollar amounts at date of valuation. Purchases and sales of portfolio securities (net of foreign taxes withheld on disposition) and income items denominated in foreign currencies are translated into U.S. dollar amounts on the respective dates of such transactions. The Fund does not separately account for the portion of the results of operations resulting from changes in foreign exchange rates on investments and the fluctuations arising from changes in market prices of securities held. The combined results of changes in foreign exchange rates and the fluctuation of market prices on investments (net of estimated foreign tax withholding) are included with the net realized and unrealized gain or loss from investments in the Statement of Operations. Reported net realized foreign currency gains or losses arise from (1) sales of foreign currencies, (2) currency gains or losses realized between the trade and settlement dates on securities transactions, and (3) the difference between the amounts of dividends, interest, and foreign withholding taxes recorded on the Fund’s books and the U.S. dollar equivalent of the amounts actually received or paid. Net unrealized foreign currency gains and losses arise from changes in the fair values of assets and liabilities, other than investments in securities at fiscal period end, resulting from changes in exchange rates. |
The Fund may invest in foreign securities which may be subject to foreign taxes on income, gains on investments or currency repatriation, a portion of which may be recoverable.
| K. | Foreign Currency Contracts — The Fund may enter into foreign currency contracts to manage or minimize currency or exchange rate risk. The Fund may also enter into foreign currency contracts for the purchase or sale of a security denominated in a foreign currency in order to “lock in” the U.S. dollar price of that security. A foreign currency contract is an obligation to purchase or sell a specific currency for an agreed-upon price at a future date. The use of foreign currency contracts does not eliminate fluctuations in the price of the underlying securities the Fund owns or intends to acquire but establishes a rate of exchange in advance. Fluctuations in the value of these contracts are measured by the difference in the contract date and reporting date exchange rates and are recorded as unrealized appreciation (depreciation) until the contracts are closed. When the contracts are closed, realized gains (losses) are recorded. Realized and unrealized gains (losses) on the contracts are included in the Statement of Operations. The primary risks associated with foreign currency contracts include failure of the counterparty to meet the terms of the contract and the value of the foreign currency changing unfavorably. These risks may be in excess of the amounts reflected in the Statement of Assets and Liabilities. |
NOTE 2—Advisory Fees and Other Fees Paid to Affiliates
The Trust has entered into a master investment advisory agreement with Invesco Advisers, Inc. (the “Adviser” or “Invesco”). Under the terms of the investment advisory agreement, the Fund pays an advisory fee to the Adviser based on the annual rate of the Fund’s average daily net assets as follows:
| | | | |
| Average Daily Net Assets | | Rate | |
First $10 million | | | 1.000% | |
Next $140 million | | | 0.750% | |
Over $150 million | | | 0.625% | |
16 Invesco Summit Fund
Under the terms of a master sub-advisory agreement between the Adviser and each of Invesco Asset Management Deutschland GmbH, Invesco Asset Management Limited, Invesco Asset Management (Japan) Limited, Invesco Australia Limited, Invesco Hong Kong Limited, Invesco Senior Secured Management, Inc. and Invesco Canada Ltd. (collectively, the “Affiliated Sub-Advisers”) the Adviser, not the Fund, may pay 40% of the fees paid to the Adviser to any such Affiliated Sub-Adviser(s) that provide discretionary investment management services to the Fund based on the percentage of assets allocated to such Sub-Adviser(s).
The Adviser has contractually agreed, through at least June 30, 2013, to waive advisory fees and/or reimburse expenses to the extent necessary to limit total annual fund operating expenses after fee waiver and/or expense reimbursement (excluding certain items discussed below) of Class A, Class B, Class C, Class P, Class S, Class Y and Class R5 shares to 2.00%, 2.75%, 2.75%, 1.85%, 1.90%, 1.75% and 1.75%, respectively, of average daily net assets. In determining the Adviser’s obligation to waive advisory fees and/or reimburse expenses, the following expenses are not taken into account, and could cause the total annual fund operating expenses after fee waiver and/or expense reimbursement to exceed the numbers reflected above: (1) interest; (2) taxes; (3) dividend expense on short sales; (4) extraordinary or non-routine items, including litigation expenses; and (5) expenses that the Fund has incurred but did not actually pay because of an expense offset arrangement. Unless the Board of Trustees and Invesco mutually agree to amend or continue the fee waiver agreement, it will terminate on June 30, 2013. The Adviser did not waive fees and/or reimburse expenses during the period under this expense limitation.
Further, the Adviser has contractually agreed, through at least June 30, 2013, to waive the advisory fee payable by the Fund in an amount equal to 100% of the net advisory fees the Adviser receives from the affiliated money market funds on investments by the Fund of uninvested cash (excluding investments of cash collateral from securities lending) in such affiliated money market funds.
For the year ended October 31, 2012, the Adviser waived advisory fees of $60,600.
The Trust has entered into a master administrative services agreement with Invesco pursuant to which the Fund has agreed to pay Invesco for certain administrative costs incurred in providing accounting services to the Fund. For the year ended October 31, 2012, expenses incurred under the agreement are shown in the Statement of Operations as Administrative services fees.
The Trust has entered into a transfer agency and service agreement with Invesco Investment Services, Inc. (“IIS”) pursuant to which the Fund has agreed to pay IIS a fee for providing transfer agency and shareholder services to the Fund and reimburse IIS for certain expenses incurred by IIS in the course of providing such services. IIS may make payments to intermediaries that provide omnibus account services, sub-accounting services and/or networking services. All fees payable by IIS to intermediaries that provide omnibus account services or sub-accounting are charged back to the Fund, subject to certain limitations approved by the Trust’s Board of Trustees. For the year ended October 31, 2012, expenses incurred under the agreement are shown in the Statement of Operations as Transfer agent fees.
The Fund has entered into master distribution agreements with Invesco Distributors, Inc. (“IDI”) to serve as the distributor for the Class A, Class B, Class C, Class P, Class S, Class Y and Class R5 shares. The Fund has adopted plans pursuant to Rule 12b-1 under the 1940 Act with respect to the Fund’s Class A, Class B, Class C, Class P and Class S shares (collectively, the “Plans”). The Fund, pursuant to the Plans, pays IDI compensation at the annual rate of 0.25% of the Fund’s average daily net assets of Class A shares, 1.00% of the average daily net assets of Class B and Class C shares, 0.10% of Class P shares and 0.15% of Class S shares. Of the Plan payments, up to 0.25% of the average daily net assets of each class of shares may be paid to furnish continuing personal shareholder services to customers who purchase and own shares of such classes. Any amounts not paid as a service fee under the Plans would constitute an asset-based sales charge. Rules of the Financial Industry Regulatory Authority (“FINRA”) impose a cap on the total sales charges, including asset-based sales charges, that may be paid by any class of shares of the Fund. For the year ended October 31, 2012, expenses incurred under the Plans are shown in the Statement of Operations as Distribution fees.
Front-end sales commissions and CDSC (collectively, the “sales charges”) are not recorded as expenses of the Fund. Front-end sales commissions are deducted from proceeds from the sales of Fund shares prior to investment in Class A shares of the Fund. CDSC are deducted from redemption proceeds prior to remittance to the shareholder. During the year ended October 31, 2012, IDI advised the Fund that IDI retained $10,379 in front-end sales commissions from the sale of Class A shares and $0, $815 and $163 from Class A, Class B and Class C shares, respectively, for CDSC imposed on redemptions by shareholders.
For the year ended October 31, 2012, the Fund incurred $6,925 in brokerage commissions with Invesco Capital Markets, Inc., an affiliate of the Adviser and IDI, for portfolio transactions executed on behalf of the Fund.
Certain officers and trustees of the Trust are officers and directors of the Adviser, IIS and/or IDI.
NOTE 3—Additional Valuation Information
GAAP defines fair value as the price that would be received to sell an asset or paid to transfer a liability in an orderly transaction between market participants at the measurement date, under current market conditions. GAAP establishes a hierarchy that prioritizes the inputs to valuation methods giving the highest priority to readily available unadjusted quoted prices in an active market for identical assets (Level 1) and the lowest priority to significant unobservable inputs (Level 3) generally when market prices are not readily available or are unreliable. Based on the valuation inputs, the securities or other investments are tiered into one of three levels. Changes in valuation methods may result in transfers in or out of an investment’s assigned level:
| | Level 1 — | Prices are determined using quoted prices in an active market for identical assets. |
| | Level 2 — | Prices are determined using other significant observable inputs. Observable inputs are inputs that other market participants may use in pricing a security. These may include quoted prices for similar securities, interest rates, prepayment speeds, credit risk, yield curves, loss severities, default rates, discount rates, volatilities and others. |
| | Level 3 — | Prices are determined using significant unobservable inputs. In situations where quoted prices or observable inputs are unavailable (for example, when there is little or no market activity for an investment at the end of the period), unobservable inputs may be used. Unobservable inputs reflect the Fund’s own assumptions about the factors market participants would use in determining fair value of the securities or instruments and would be based on the best available information. |
The following is a summary of the tiered valuation input levels, as of October 31, 2012. The level assigned to the securities valuations may not be an indication of the risk or liquidity associated with investing in those securities. Because of the inherent uncertainties of valuation, the values reflected in the financial statements may materially differ from the value received upon actual sale of those investments.
| | | | | | | | | | | | | | | | |
| | | Level 1 | | | Level 2 | | | Level 3 | | | Total | |
Equity Securities | | $ | 1,537,376,617 | | | $ | 17,764,981 | | | $ | — | | | $ | 1,555,141,598 | |
17 Invesco Summit Fund
NOTE 4—Security Transactions with Affiliated Funds
The Fund is permitted to purchase or sell securities from or to certain other Invesco Funds under specified conditions outlined in procedures adopted by the Board of Trustees of the Trust. The procedures have been designed to ensure that any purchase or sale of securities by the Fund from or to another fund or portfolio that is or could be considered an affiliate by virtue of having a common investment adviser (or affiliated investment advisers), common Trustees and/or common officers complies with Rule 17a-7 of the 1940 Act. Further, as defined under the procedures, each transaction is effected at the current market price. Pursuant to these procedures, for the year ended October 31, 2012, the Fund engaged in securities sales of $1,646,940, which resulted in net realized gains (losses) of $(4,390,414).
NOTE 5—Expense Offset Arrangement(s)
The expense offset arrangement is comprised of transfer agency credits which result from balances in Demand Deposit Accounts (DDA) used by the transfer agent for clearing shareholder transactions. For the year ended October 31, 2012, the Fund received credits from this arrangement, which resulted in the reduction of the Fund’s total expenses of $9,134.
NOTE 6—Trustees’ and Officers’ Fees and Benefits
“Trustees’ and Officers’ Fees and Benefits” include amounts accrued by the Fund to pay remuneration to certain Trustees and Officers of the Fund. Trustees have the option to defer compensation payable by the Fund, and “Trustees’ and Officers’ Fees and Benefits” also include amounts accrued by the Fund to fund such deferred compensation amounts. Those Trustees who defer compensation have the option to select various Invesco Funds in which their deferral accounts shall be deemed to be invested. Finally, certain current Trustees are eligible to participate in a retirement plan that provides for benefits to be paid upon retirement to Trustees over a period of time based on the number of years of service. The Fund may have certain former Trustees who also participate in a retirement plan and receive benefits under such plan. “Trustees’ and Officers’ Fees and Benefits” include amounts accrued by the Fund to fund such retirement benefits. Obligations under the deferred compensation and retirement plans represent unsecured claims against the general assets of the Fund.
NOTE 7—Cash Balances
The Fund is permitted to temporarily carry a negative or overdrawn balance in its account with State Street Bank and Trust Company, the custodian bank. Such balances, if any at period end, are shown in the Statement of Assets and Liabilities under the payable caption Amount due custodian. To compensate the custodian bank for such overdrafts, the overdrawn Fund may either (1) leave funds as a compensating balance in the account so the custodian bank can be compensated by earning the additional interest; or (2) compensate by paying the custodian bank at a rate agreed upon by the custodian bank and Invesco, not to exceed the contractually agreed upon rate.
NOTE 8—Distributions to Shareholders and Tax Components of Net Assets
Tax Character of Distributions to Shareholders Paid During the Years Ended October 31, 2012 and 2011:
| | | | | | | | |
| | | 2012 | | | 2011 | |
Ordinary income | | $ | 2,385,158 | | | $ | 2,523,507 | |
Tax Components of Net Assets at Period-End:
| | | | |
| | | 2012 | |
Undistributed ordinary income | | $ | 3,192,378 | |
Net unrealized appreciation — investments | | | 332,763,954 | |
Net unrealized appreciation — other investments | | | 140 | |
Temporary book/tax differences | | | (389,684 | ) |
Capital loss carryforward | | | (176,125,809 | ) |
Shares of beneficial interest | | | 1,388,837,093 | |
Total net assets | | $ | 1,548,278,072 | |
The difference between book-basis and tax-basis unrealized appreciation (depreciation) is due to differences in the timing of recognition of gains and losses on investments for tax and book purposes. The Fund’s net unrealized appreciation difference is attributable primarily to wash sales.
The temporary book/tax differences are a result of timing differences between book and tax recognition of income and/or expenses. The Fund’s temporary book/tax differences are the result of the trustee deferral of compensation and retirement plan benefits.
Capital loss carryforward is calculated and reported as of a specific date. Results of transactions and other activity after that date may affect the amount of capital loss carryforward actually available for the Fund to utilize. The Regulated Investment Company Modernization Act of 2010 (the “Act”) eliminated the eight-year carryover period for capital losses that arise in taxable years beginning after its enactment date of December 22, 2010. Consequently, these capital losses can be carried forward for an unlimited period. However, capital losses with an expiration period may not be used to offset capital gains until all net capital losses without an expiration date have been utilized. Additionally, post-enactment capital loss carryovers will retain their character as either short-term or long-term capital losses instead of as short-term capital losses as under prior law. The ability to utilize capital loss carryforward in the future may be limited under the Internal Revenue Code and related regulations based on the results of future transactions.
18 Invesco Summit Fund
The Fund utilized $37,177,207 of capital loss carryforward in the current period to offset net realized capital gain for federal income tax purposes. The Fund has a capital loss carryforward as of October 31, 2012, which expires as follows:
| | | | | | | | | | | | |
| Capital Loss Carryforward* | |
| Expiration | | Short-Term | | | Long-Term | | | Total | |
October 31, 2017 | | $ | 176,125,809 | | | $ | — | | | $ | 176,125,809 | |
| * | Capital loss carryforward as of the date listed above is reduced for limitations, if any, to the extent required by the Internal Revenue Code. |
NOTE 9—Investment Securities
The aggregate amount of investment securities (other than short-term securities, U.S. Treasury obligations and money market funds, if any) purchased and sold by the Fund during the year ended October 31, 2012 was $562,556,634 and $732,243,589, respectively. Cost of investments on a tax basis includes the adjustments for financial reporting purposes as of the most recently completed federal income tax reporting period-end.
| | | | |
| Unrealized Appreciation (Depreciation) of Investment Securities on a Tax Basis | |
Aggregate unrealized appreciation of investment securities | | $ | 380,965,352 | |
Aggregate unrealized (depreciation) of investment securities | | | (48,201,398 | ) |
Net unrealized appreciation of investment securities | | $ | 332,763,954 | |
Cost of investments for tax purposes is $1,222,377,644.
NOTE 10—Reclassification of Permanent Differences
Primarily as a result of differing book/tax treatment of return of capital distributions, on October 31, 2012, undistributed net investment income was decreased by $689,724, undistributed net realized gain (loss) was increased by $171,469 and shares of beneficial interest was increased by $518,255. This reclassification had no effect on the net assets of the Fund.
NOTE 11—Share Information
| | | | | | | | | | | | | | | | |
| | | Summary of Share Activity | |
| | | Years ended October 31, | |
| | | 2012 | | | 2011 | |
| | | Shares | | | Amount | | | Shares | | | Amount | |
Sold: | | | | | | | | | | | | | | | | |
Class A | | | 1,070,831 | | | $ | 13,190,161 | | | | 508,790 | | | $ | 6,129,306 | |
Class B | | | 21,019 | | | | 244,005 | | | | 17,167 | | | | 207,420 | |
Class C | | | 176,652 | | | | 2,186,738 | | | | 24,066 | | | | 277,838 | |
Class P | | | 5,083,729 | | | | 62,566,787 | | | | 6,476,302 | | | | 76,780,988 | |
Class S | | | 18,947 | | | | 233,112 | | | | 38,623 | | | | 460,009 | |
Class Y | | | 5,076 | | | | 65,295 | | | | 9,809 | | | | 115,595 | |
Class R5 | | | 3,071 | | | | 39,253 | | | | 5,898 | | | | 63,637 | |
Issued as reinvestment of dividends: | | | | | | | | | | | | | | | | |
Class A | | | 303 | | | | 3,456 | | | | 279 | | | | 3,254 | |
Class P | | | 205,145 | | | | 2,350,958 | | | | 211,545 | | | | 2,481,425 | |
Class S | | | 484 | | | | 5,520 | | | | 481 | | | | 5,625 | |
Class Y | | | 172 | | | | 1,956 | | | | 307 | | | | 3,586 | |
Class R5 | | | 20 | | | | 222 | | | | — | | | | — | |
Automatic conversion of Class B shares to Class A shares: | | | | | | | | | | | | | | | | |
Class A | | | 12,609 | | | | 153,633 | | | | 21,541 | | | | 256,625 | |
Class B | | | (12,997 | ) | | | (153,633 | ) | | | (22,065 | ) | | | (256,625 | ) |
Reacquired: | | | | | | | | | | | | | | | | |
Class A | | | (828,991 | ) | | | (10,360,110 | ) | | | (975,621 | ) | | | (11,602,123 | ) |
Class B | | | (30,026 | ) | | | (359,833 | ) | | | (34,532 | ) | | | (394,289 | ) |
Class C | | | (222,894 | ) | | | (2,568,652 | ) | | | (73,184 | ) | | | (844,601 | ) |
Class P | | | (19,113,776 | ) | | | (236,395,420 | ) | | | (22,958,368 | ) | | | (274,046,014 | ) |
Class S | | | (64,852 | ) | | | (818,568 | ) | | | (69,011 | ) | | | (816,364 | ) |
Class Y | | | (69,922 | ) | | | (894,152 | ) | | | (35,715 | ) | | | (433,636 | ) |
Class R5 | | | — | | | | — | | | | (293 | ) | | | (3,273 | ) |
Net increase (decrease) in share activity | | | (13,745,400 | ) | | $ | (170,509,272 | ) | | | (16,853,981 | ) | | $ | (201,611,617 | ) |
19 Invesco Summit Fund
NOTE 12—Financial Highlights
The following schedule presents financial highlights for a share of the Fund outstanding throughout the periods indicated.
| | | | | | | | | | | | | | | | | | | | | | | | | | | | | | | | | | | | | | | | | | | | | | | | | | | | | | | | |
| | | Net asset
value,
beginning
of period | | | Net
investment
income
(loss)(a) | | | Net gains
(losses)
on securities
(both
realized and
unrealized) | | | Total from
investment
operations | | | Dividends
from net
investment
income | | | Distributions
from net
realized
gains | | | Total
distributions | | | Net asset
value, end
of period | | | Total
return(b) | | | Net assets,
end of period
(000’s omitted) | | | Ratio of
expenses
to average
net assets
with fee waivers
and/or expenses
absorbed | | | Ratio of
expenses
to average net
assets without
fee waivers
and/or expenses
absorbed | | | Ratio of net
investment
income (loss)
to average
net assets | | | Portfolio
turnover(c) | |
Class A | | | | | |
Year ended 10/31/12 | | $ | 11.56 | | | $ | 0.01 | | | $ | 1.10 | | | $ | 1.11 | | | $ | (0.00 | ) | | $ | — | | | $ | (0.00 | ) | | $ | 12.67 | | | | 9.62 | % | | $ | 22,712 | | | | 1.08 | %(d) | | | 1.08 | %(d) | | | 0.09 | %(d) | | | 36 | % |
Year ended 10/31/11 | | | 11.09 | | | | 0.00 | | | | 0.47 | �� | | | 0.47 | | | | (0.00 | ) | | | — | | | | (0.00 | ) | | | 11.56 | | | | 4.25 | | | | 17,763 | | | | 1.06 | | | | 1.07 | | | | 0.00 | | | | 59 | |
Year ended 10/31/10 | | | 9.55 | | | | 0.00 | | | | 1.61 | | | | 1.61 | | | | (0.07 | ) | | | — | | | | (0.07 | ) | | | 11.09 | | | | 16.89 | | | | 21,981 | | | | 1.09 | | | | 1.10 | | | | 0.00 | | | | 53 | |
Year ended 10/31/09 | | | 9.81 | | | | 0.06 | | | | 0.33 | | | | 0.39 | | | | (0.05 | ) | | | (0.60 | ) | | | (0.65 | ) | | | 9.55 | | | | 4.99 | | | | 24,855 | | | | 1.12 | | | | 1.13 | | | | 0.70 | | | | 89 | |
Year ended 10/31/08 | | | 15.42 | | | | 0.05 | | | | (5.40 | ) | | | (5.35 | ) | | | (0.06 | ) | | | (0.20 | ) | | | (0.26 | ) | | | 9.81 | | | | (35.26 | ) | | | 25,529 | | | | 1.06 | | | | 1.07 | | | | 0.34 | | | | 79 | |
Class B | | | | | |
Year ended 10/31/12 | | | 11.24 | | | | (0.08 | ) | | | 1.09 | | | | 1.01 | | | | — | | | | — | | | | — | | | | 12.25 | | | | 8.99 | | | | 913 | | | | 1.83 | (d) | | | 1.83 | (d) | | | (0.66 | )(d) | | | 36 | |
Year ended 10/31/11 | | | 10.87 | | | | (0.09 | ) | | | 0.46 | | | | 0.37 | | | | — | | | | — | | | | — | | | | 11.24 | | | | 3.40 | | | | 1,085 | | | | 1.81 | | | | 1.82 | | | | (0.75 | ) | | | 59 | |
Year ended 10/31/10 | | | 9.37 | | | | (0.08 | ) | | | 1.58 | | | | 1.50 | | | | — | | | | — | | | | — | | | | 10.87 | | | | 16.01 | | | | 1,477 | | | | 1.84 | | | | 1.85 | | | | (0.75 | ) | | | 53 | |
Year ended 10/31/09 | | | 9.64 | | | | (0.00 | ) | | | 0.33 | | | | 0.33 | | | | — | | | | (0.60 | ) | | | (0.60 | ) | | | 9.37 | | | | 4.31 | | | | 1,975 | | | | 1.87 | | | | 1.88 | | | | (0.05 | ) | | | 89 | |
Year ended 10/31/08 | | | 15.20 | | | | (0.05 | ) | | | (5.30 | ) | | | (5.35 | ) | | | (0.01 | ) | | | (0.20 | ) | | | (0.21 | ) | | | 9.64 | | | | (35.70 | ) | | | 3,256 | | | | 1.81 | | | | 1.82 | | | | (0.41 | ) | | | 79 | |
Class C | | | | | |
Year ended 10/31/12 | | | 11.23 | | | | (0.08 | ) | | | 1.07 | | | | 0.99 | | | | — | | | | — | | | | — | | | | 12.22 | | | | 8.82 | | | | 1,577 | | | | 1.83 | (d) | | | 1.83 | (d) | | | (0.66 | )(d) | | | 36 | |
Year ended 10/31/11 | | | 10.85 | | | | (0.09 | ) | | | 0.47 | | | | 0.38 | | | | — | | | | — | | | | — | | | | 11.23 | | | | 3.50 | | | | 1,968 | | | | 1.81 | | | | 1.82 | | | | (0.75 | ) | | | 59 | |
Year ended 10/31/10 | | | 9.36 | | | | (0.08 | ) | | | 1.57 | | | | 1.49 | | | | — | | | | — | | | | — | | | | 10.85 | | | | 15.92 | | | | 2,435 | | | | 1.84 | | | | 1.85 | | | | (0.75 | ) | | | 53 | |
Year ended 10/31/09 | | | 9.63 | | | | (0.00 | ) | | | 0.33 | | | | 0.33 | | | | — | | | | (0.60 | ) | | | (0.60 | ) | | | 9.36 | | | | 4.31 | | | | 3,145 | | | | 1.87 | | | | 1.88 | | | | (0.05 | ) | | | 89 | |
Year ended 10/31/08 | | | 15.20 | | | | (0.05 | ) | | | (5.31 | ) | | | (5.36 | ) | | | (0.01 | ) | | | (0.20 | ) | | | (0.21 | ) | | | 9.63 | | | | (35.77 | ) | | | 4,408 | | | | 1.81 | | | | 1.82 | | | | (0.41 | ) | | | 79 | |
Class P | | | | | |
Year ended 10/31/12 | | | 11.63 | | | | 0.03 | | | | 1.11 | | | | 1.14 | | | | (0.02 | ) | | | — | | | | (0.02 | ) | | | 12.75 | | | | 9.80 | | | | 1,518,577 | | | | 0.93 | (d) | | | 0.93 | (d) | | | 0.24 | (d) | | | 36 | |
Year ended 10/31/11 | | | 11.15 | | | | 0.02 | | | | 0.48 | | | | 0.50 | | | | (0.02 | ) | | | — | | | | (0.02 | ) | | | 11.63 | | | | 4.46 | | | | 1,545,006 | | | | 0.91 | | | | 0.92 | | | | 0.15 | | | | 59 | |
Year ended 10/31/10 | | | 9.60 | | | | 0.02 | | | | 1.60 | | | | 1.62 | | | | (0.07 | ) | | | — | | | | (0.07 | ) | | | 11.15 | | | | 16.97 | | | | 1,663,462 | | | | 0.94 | | | | 0.95 | | | | 0.15 | | | | 53 | |
Year ended 10/31/09 | | | 9.85 | | | | 0.08 | | | | 0.33 | | | | 0.41 | | | | (0.06 | ) | | | (0.60 | ) | | | (0.66 | ) | | | 9.60 | | | | 5.22 | | | | 1,572,776 | | | | 0.97 | | | | 0.98 | | | | 0.85 | | | | 89 | |
Year ended 10/31/08 | | | 15.47 | | | | 0.07 | | | | (5.42 | ) | | | (5.35 | ) | | | (0.07 | ) | | | (0.20 | ) | | | (0.27 | ) | | | 9.85 | | | | (35.17 | ) | | | 1,554,240 | | | | 0.91 | | | | 0.92 | | | | 0.49 | | | | 79 | |
Class S | | | | | |
Year ended 10/31/12 | | | 11.58 | | | | 0.02 | | | | 1.12 | | | | 1.14 | | | | (0.02 | ) | | | — | | | | (0.02 | ) | | | 12.70 | | | | 9.82 | | | | 3,896 | | | | 0.98 | (d) | | | 0.98 | (d) | | | 0.19 | (d) | | | 36 | |
Year ended 10/31/11 | | | 11.11 | | | | 0.01 | | | | 0.47 | | | | 0.48 | | | | (0.01 | ) | | | — | | | | (0.01 | ) | | | 11.58 | | | | 4.36 | | | | 4,078 | | | | 0.96 | | | | 0.97 | | | | 0.10 | | | | 59 | |
Year ended 10/31/10 | | | 9.56 | | | | 0.01 | | | | 1.61 | | | | 1.62 | | | | (0.07 | ) | | | — | | | | (0.07 | ) | | | 11.11 | | | | 16.99 | | | | 4,246 | | | | 0.99 | | | | 1.00 | | | | 0.10 | | | | 53 | |
Year ended 10/31/09(e) | | | 9.65 | | | | 0.01 | | | | (0.10 | ) | | | (0.09 | ) | | | — | | | | — | | | | — | | | | 9.56 | | | | (0.93 | ) | | | 312 | | | | 0.95 | (f) | | | 0.96 | (f) | | | 0.87 | (f) | | | 89 | |
Class Y | | | | | |
Year ended 10/31/12 | | | 11.58 | | | | 0.04 | | | | 1.13 | | | | 1.17 | | | | (0.03 | ) | | | — | | | | (0.03 | ) | | | 12.72 | | | | 10.14 | | | | 479 | | | | 0.83 | (d) | | | 0.83 | (d) | | | 0.34 | (d) | | | 36 | |
Year ended 10/31/11 | | | 11.11 | | | | 0.03 | | | | 0.47 | | | | 0.50 | | | | (0.03 | ) | | | — | | | | (0.03 | ) | | | 11.58 | | | | 4.48 | | | | 1,186 | | | | 0.81 | | | | 0.82 | | | | 0.25 | | | | 59 | |
Year ended 10/31/10 | | | 9.56 | | | | 0.03 | | | | 1.60 | | | | 1.63 | | | | (0.08 | ) | | | — | | | | (0.08 | ) | | | 11.11 | | | | 17.14 | | | | 1,422 | | | | 0.84 | | | | 0.85 | | | | 0.25 | | | | 53 | |
Year ended 10/31/09 | | | 9.81 | | | | 0.09 | | | | 0.32 | | | | 0.41 | | | | (0.06 | ) | | | (0.60 | ) | | | (0.66 | ) | | | 9.56 | | | | 5.26 | | | | 2,201 | | | | 0.87 | | | | 0.88 | | | | 0.95 | | | | 89 | |
Year ended 10/31/08(e) | | | 10.98 | | | | 0.00 | | | | (1.17 | ) | | | (1.17 | ) | | | — | | | | — | | | | — | | | | 9.81 | | | | (10.66 | ) | | | 224 | | | | 0.85 | (f) | | | 0.86 | (f) | | | 0.55 | (f) | | | 79 | |
Class R5 | | | | | |
Year ended 10/31/12 | | | 11.60 | | | | 0.06 | | | | 1.11 | | | | 1.17 | | | | (0.04 | ) | | | — | | | | (0.04 | ) | | | 12.73 | | | | 10.12 | | | | 123 | | | | 0.72 | (d) | | | 0.72 | (d) | | | 0.45 | (d) | | | 36 | |
Year ended 10/31/11 | | | 11.14 | | | | 0.04 | | | | 0.47 | | | | 0.51 | | | | (0.05 | ) | | | — | | | | (0.05 | ) | | | 11.60 | | | | 4.54 | | | | 77 | | | | 0.74 | | | | 0.75 | | | | 0.32 | | | | 59 | |
Year ended 10/31/10 | | | 9.58 | | | | 0.04 | | | | 1.62 | | | | 1.66 | | | | (0.10 | ) | | | — | | | | (0.10 | ) | | | 11.14 | | | | 17.42 | | | | 11 | | | | 0.68 | | | | 0.69 | | | | 0.41 | | | | 53 | |
Year ended 10/31/09 | | | 9.81 | | | | 0.10 | | | | 0.33 | | | | 0.43 | | | | (0.06 | ) | | | (0.60 | ) | | | (0.66 | ) | | | 9.58 | | | | 5.48 | | | | 11,358 | | | | 0.67 | | | | 0.68 | | | | 1.15 | | | | 89 | |
Year ended 10/31/08(e) | | | 10.98 | | | | 0.00 | | | | (1.17 | ) | | | (1.17 | ) | | | — | | | | — | | | | — | | | | 9.81 | | | | (10.66 | ) | | | 10,762 | | | | 0.80 | (f) | | | 0.81 | (f) | | | 0.60 | (f) | | | 79 | |
| (a) | Calculated using average shares outstanding. |
| (b) | Includes adjustments in accordance with accounting principles generally accepted in the United States of America and as such, the net asset value for financial reporting purposes and the returns based upon those net asset values may differ from the net asset value and returns for shareholder transactions. Does not include sales charges and is not annualized for periods less than one year, if applicable. |
| (c) | Portfolio turnover is calculated at the fund level and is not annualized for periods less than one year, if applicable. |
| (d) | Ratios are based on average daily net assets (000’s omitted) of $22,278, $1,033, $2,028, $1,555,532, $4,146, $904 and $107 for Class A, Class B, Class C, Class P, Class S, Class Y and Class R5 shares, respectively. |
| (e) | Commencement date of September 25, 2009 for Class S shares and October 3, 2008 for Class Y and Class R5 shares, respectively. |
20 Invesco Summit Fund
Report of Independent Registered Public Accounting Firm
To the Board of Trustees of AIM Equity Funds (Invesco Equity Funds)
and Shareholders of Invesco Summit Fund:
In our opinion, the accompanying statement of assets and liabilities, including the schedule of investments, and the related statements of operations and of changes in net assets and the financial highlights present fairly, in all material respects, the financial position of Invesco Summit Fund (one of the funds constituting AIM Equity Funds (Invesco Equity Funds), hereafter referred to as the “Fund”) at October 31, 2012, the results of its operations for the year then ended, the changes in its net assets for each of the two years in the period then ended and the financial highlights for each of the five years in the period then ended, in conformity with accounting principles generally accepted in the United States of America. These financial statements and financial highlights (hereafter referred to as “financial statements”) are the responsibility of the Fund’s management; our responsibility is to express an opinion on these financial statements based on our audits. We conducted our audits of these financial statements in accordance with the standards of the Public Company Accounting Oversight Board (United States). Those standards require that we plan and perform the audit to obtain reasonable assurance about whether the financial statements are free of material misstatement. An audit includes examining, on a test basis, evidence supporting the amounts and disclosures in the financial statements, assessing the accounting principles used and significant estimates made by management, and evaluating the overall financial statement presentation. We believe that our audits, which included confirmation of securities at October 31, 2012 by correspondence with the custodian and brokers, provide a reasonable basis for our opinion.
PRICEWATERHOUSECOOPERS LLP
December 21, 2012
Houston, Texas
21 Invesco Summit Fund
Calculating your ongoing Fund expenses
Example
As a shareholder of the Fund, you incur two types of costs: (1) transaction costs, which may include sales charges (loads) on purchase payments or contingent deferred sales charges on redemptions, and redemption fees, if any; and (2) ongoing costs, including management fees, distribution and/or service (12b-1) fees, and other Fund expenses. This example is intended to help you understand your ongoing costs (in dollars) of investing in the Fund and to compare these costs with ongoing costs of investing in other mutual funds. The example is based on an investment of $1,000 invested at the beginning of the period and held for the entire period May 1, 2012 through October 31, 2012.
Actual expenses
The table below provides information about actual account values and actual expenses. You may use the information in this table, together with the amount you invested, to estimate the expenses that you paid over the period. Simply divide your account value by $1,000 (for example, an $8,600 account value divided by $1,000 = 8.6), then multiply the result by the number in the table under the heading entitled “Actual Expenses Paid During Period” to estimate the expenses you paid on your account during this period.
Hypothetical example for comparison purposes
The table below also provides information about hypothetical account values and hypothetical expenses based on the Fund’s actual expense ratio and an assumed rate of return of 5% per year before expenses, which is not the Fund’s actual return.
The hypothetical account values and expenses may not be used to estimate the actual ending account balance or expenses you paid for the period. You may use this information to compare the ongoing costs of investing in the Fund and other funds. To do so, compare this 5% hypothetical example with the 5% hypothetical examples that appear in the shareholder reports of the other funds.
Please note that the expenses shown in the table are meant to highlight your ongoing costs only and do not reflect any transaction costs, such as sales charges (loads) on purchase payments, contingent deferred sales charges on redemptions, and redemption fees, if any. Therefore, the hypothetical information is useful in comparing ongoing costs only, and will not help you determine the relative total costs of owning different funds. In addition, if these transaction costs were included, your costs would have been higher.
| | | | | | | | | | | | | | | | | | | | | | | | |
| Class | | Beginning
Account Value
(05/01/12) | | | ACTUAL | | | HYPOTHETICAL (5% annual return before expenses) | | | Annualized
Expense
Ratio | |
| | | Ending
Account Value
(10/31/12)1 | | | Expenses
Paid During
Period 2 | | | Ending
Account Value
(10/31/12) | | | Expenses
Paid During
Period 2 | | |
| A | | $ | 1,000.00 | | | $ | 986.80 | | | $ | 5.34 | | | $ | 1,019.76 | | | $ | 5.43 | | | | 1.07 | % |
| B | | | 1,000.00 | | | | 983.10 | | | | 9.07 | | | | 1,015.99 | | | | 9.22 | | | | 1.82 | |
| C | | | 1,000.00 | | | | 983.90 | | | | 9.08 | | | | 1,015.99 | | | | 9.22 | | | | 1.82 | |
| P | | | 1,000.00 | | | | 987.60 | | | | 4.60 | | | | 1,020.51 | | | | 4.67 | | | | 0.92 | |
| S | | | 1,000.00 | | | | 987.60 | | | | 4.85 | | | | 1,020.26 | | | | 4.93 | | | | 0.97 | |
| Y | | | 1,000.00 | | | | 989.10 | | | | 4.10 | | | | 1,021.01 | | | | 4.17 | | | | 0.82 | |
| R5 | | | 1,000.00 | | | | 989.10 | | | | 3.45 | | | | 1,021.67 | | | | 3.51 | | | | 0.69 | |
| 1 | The actual ending account value is based on the actual total return of the Fund for the period May 1, 2012 through October 31, 2012, after actual expenses and will differ from the hypothetical ending account value which is based on the Fund’s expense ratio and a hypothetical annual return of 5% before expenses. |
| 2 | Expenses are equal to the Fund’s annualized expense ratio as indicated above multiplied by the average account value over the period, multiplied by 184/366 to reflect the most recent fiscal half year. |
22 Invesco Summit Fund
Approval of Investment Advisory and Sub-Advisory Contracts
The Board of Trustees (the Board) of AIM Equity Funds (Invesco Equity Funds) is required under the Investment Company Act of 1940, as amended, to approve annually the renewal of the Invesco Summit Fund (the Fund) investment advisory agreement with Invesco Advisers, Inc. (Invesco Advisers) and the Master Intergroup Sub-Advisory Contract for Mutual Funds (the sub-advisory contracts) with Invesco Asset Management Deutschland GmbH, Invesco Asset Management Limited, Invesco Asset Management (Japan) Limited, Invesco Australia Limited, Invesco Hong Kong Limited, Invesco Senior Secured Management, Inc. and Invesco Canada Ltd. (collectively, the Affiliated Sub-Advisers). During contract renewal meetings held on June 19-20, 2012, the Board as a whole, and the disinterested or “independent” Trustees, who comprise 80% of the Board, voting separately, approved the continuance of the Fund’s investment advisory agreement and the sub-advisory contracts for another year, effective July 1, 2012. In doing so, the Board considered the process that it follows in reviewing and approving the Fund’s investment advisory agreement and sub-advisory contracts and the information that it is provided. The Board determined that the Fund’s investment advisory agreement and the sub-advisory contracts are in the best interests of the Fund and its shareholders and the compensation to Invesco Advisers and the Affiliated Sub-Advisers under the agreements is fair and reasonable.
The Board’s Fund Evaluation Process
The Board’s Investments Committee has established three Sub-Committees, each of which is primarily responsible for overseeing the management of a number of the series portfolios of the funds advised by Invesco Advisers (the Invesco Funds). The Sub-Committees meet throughout the year to review the performance of their assigned funds, including reviewing materials prepared under the direction of the independent Senior Officer, an officer of the Invesco Funds who reports directly to the independent Trustees. Over the course of each year, the Sub-Committees meet with portfolio managers for their assigned Invesco Funds and other members of management to review the performance, investment objective(s), policies, strategies, limitations and investment risks of these funds. The Sub-Committees meet regularly and at designated contract renewal meetings each year to conduct a review of the performance, fees, expenses and other matters related to their assigned Invesco Funds. Each Sub-Committee recommends to the Investments Committee, which in turn recommends to the full Board, whether and on what terms to approve the continuance of each Invesco Fund’s
investment advisory agreement and sub-advisory contracts for another year.
During the contract renewal process, the Trustees receive comparative performance and fee data regarding the Invesco Funds prepared by Invesco Advisers and an independent company, Lipper Inc. (Lipper). The Trustees also receive an independent written evaluation from the Senior Officer. The Senior Officer’s evaluation is prepared as part of his responsibility to manage the process by which the Invesco Funds’ proposed management fees are negotiated during the annual contract renewal process to ensure they are negotiated in a manner that is at arms’ length and reasonable. The independent Trustees are assisted in their annual evaluation of the Fund’s investment advisory agreement by the Senior Officer and by independent legal counsel. In addition to meetings with Invesco Advisers and fund counsel, the independent Trustees also discuss the continuance of the investment advisory agreement and sub-advisory contracts in private sessions with the Senior Officer and independent legal counsel.
In evaluating the fairness and reasonableness of the Fund’s investment advisory agreement and sub-advisory contracts, the Board considered, among other things, the factors discussed below. The Trustees recognized that the advisory fees for the Invesco Funds include advisory fees that are the result of years of review and negotiation between the Trustees and Invesco Advisers as well as advisory fees previously approved by a different board that, at the time, was responsible for overseeing Morgan Stanley and Van Kampen funds, which have become Invesco Funds following the acquisition of the retail mutual fund business of Morgan Stanley. The Trustees’ deliberations and conclusions in a particular year may be based in part on their deliberations and conclusions regarding these same arrangements throughout the year and in prior years. One Trustee may have weighed a particular piece of information or factor differently than another Trustee.
The discussion below serves as the Senior Officer’s independent written evaluation with respect to the Fund’s investment advisory agreement as well as a discussion of the material factors and related conclusions that formed the basis for the Board’s approval of the Fund’s investment advisory agreement and sub-advisory contracts. Unless otherwise stated, this information is current as of June 20, 2012, and may not reflect consideration of factors that became known to the Board after that date, including, for example, changes to the Fund’s performance, advisory fees, expense limitations and/or fee waivers.
Factors and Conclusions and Summary of Independent Written Fee Evaluation
| A. | Nature, Extent and Quality of Services Provided by Invesco Advisers and the Affiliated Sub-Advisers |
The Board reviewed the advisory services provided to the Fund by Invesco Advisers under the Fund’s investment advisory agreement, the performance of Invesco Advisers in providing these services, and the credentials and experience of the officers and employees of Invesco Advisers who provide these services, including the Fund’s portfolio manager or managers, with whom the Sub-Committees met during the year. The Board’s review of the qualifications of Invesco Advisers to provide advisory services included the Board’s consideration of Invesco Advisers’ performance and investment process oversight, independent credit analysis and investment risk management.
In determining whether to continue the Fund’s investment advisory agreement, the Board considered the prior relationship between Invesco Advisers and the Fund, as well as the Board’s knowledge of Invesco Advisers’ operations, and concluded that it is beneficial to maintain the current relationship, in part because of such prior relationship and knowledge. The Board also considered services that Invesco Advisers and its affiliates provide to the Invesco Funds such as various back office support functions, equity and fixed income trading operations, internal audit, distribution and legal and compliance. The Board concluded that the nature, extent and quality of the services provided to the Fund by Invesco Advisers are appropriate and satisfactory and consistent with the terms of the Fund’s investment advisory agreement.
The Board reviewed the services provided by the Affiliated Sub-Advisers under the sub-advisory contracts and the credentials and experience of the officers and employees of the Affiliated Sub-Advisers who provide these services. The Board noted that the Affiliated Sub-Advisers have offices and personnel that are located in financial centers around the world. As a result, the Affiliated Sub-Advisers can provide research and investment analysis on the markets and economies of various countries in which the Fund invests and make recommendations on securities of companies located in such countries. The Board concluded that the sub-advisory contracts benefit the Fund and its shareholders by permitting Invesco Advisers to use the resources and talents of the Affiliated Sub-Advisers in managing the Fund. The Board concluded that the nature, extent and quality of the services provided by the Affiliated Sub-Advisers are appropriate and satisfactory and consistent with the terms of the Fund’s sub-advisory contracts.
23 Invesco Summit Fund
The Board considered Fund performance as a relevant factor in considering whether to approve the investment advisory agreement. The Board did not view Fund performance as a relevant factor in considering whether to approve the sub-advisory contracts for the Fund, as no Affiliated Sub-Adviser currently manages assets of the Fund.
The Board compared the Fund’s performance during the past one, three and five calendar years to the performance of funds in the Lipper performance universe and against the Lipper Large-Cap Growth Funds Index and the Lipper Multi-Cap Growth Funds Index. The Board noted that performance of Class A shares of the Fund was in the fourth quintile of the performance universe for the one year period and the fifth quintile for the three and five year periods (the first quintile being the best performing funds and the fifth quintile being the worst performing funds). The Board noted that performance of Class A shares of the Fund was below the performance of each Index for the one, three and five year periods. The Board noted that Invesco Advisers changed the Fund’s lead portfolio manager in March 2011, and that the Fund continues to be positioned as a conservative growth portfolio. The Trustees also reviewed more recent Fund performance and this review did not change their conclusions.
| C. | Advisory and Sub-Advisory Fees and Fee Waivers |
The Board compared the Fund’s contractual advisory fee rate to the contractual advisory fee rates of funds in the Fund’s Lipper expense group at a common asset level. The Board noted that the contractual advisory fee rate for Class A shares of the Fund was below the median contractual advisory fee rate of funds in the expense group. The Board also reviewed the methodology used by Lipper in providing expense group information, which includes using audited financial data from the most recent annual report of each fund in the expense group that was publicly available as of the end of the past calendar year and including only one fund per investment adviser. The Board noted that comparative data is as of varying dates, which may affect the comparability of data during times of market volatility.
The Board also compared the Fund’s effective fee rate (the advisory fee after advisory fee waivers and before expense limitations/waivers) to the advisory fee rates of other mutual funds advised by Invesco Advisers and its affiliates with investment strategies comparable to those of the Fund. The Board noted that the Fund’s effective fee rate was at the effective fee rate of one other mutual fund with comparable investment strategies. The Board also noted that Invesco Advisers sub-advises one mutual fund with investment strategies comparable to those of the Fund and that the sub-advisory fee rate is below the Fund’s effective fee rate.
Other than the mutual funds described above, the Board noted that Invesco Advisers
and the Affiliated Sub-Advisers do not advise other client accounts with investment strategies comparable to those of the Fund.
The Board also considered the services provided by the Affiliated Sub-Advisers pursuant to the sub-advisory contracts, as well as the allocation of fees between Invesco Advisers and the Affiliated Sub-Advisers pursuant to the sub-advisory contracts. The Board noted that Invesco Advisers provides services to sub-advised Invesco Funds, including oversight of the Affiliated Sub-Advisers as well as the additional services described above other than day-to-day portfolio management. The Board also noted that the sub-advisory fees have no direct effect on the Fund or its shareholders, as they are paid by Invesco Advisers to the Affiliated Sub-Advisers.
Based upon the information and considerations described above, the Board concluded that the Fund’s advisory and sub-advisory fees are fair and reasonable.
| D. | Economies of Scale and Breakpoints |
The Board considered the extent to which there are economies of scale in the provision of advisory services to the Fund. The Board also considered whether the Fund benefits from economies of scale through contractual breakpoints in the Fund’s advisory fee schedule and were assisted in their review by a report from the Senior Officer. The Board also noted that the Fund shares directly in economies of scale through lower fees charged by third party service providers based on the combined size of the Invesco Funds and other clients advised by Invesco Advisers. The Board noted that Invesco Advisers proposes sharing economies of scale in administration expenses by lowering per class administrative fees.
| E. | Profitability and Financial Resources |
The Board reviewed information from Invesco Advisers concerning the costs of the advisory and other services that Invesco Advisers and its affiliates provide to the Fund and the profitability of Invesco Advisers and its affiliates in providing these services for the year ended December 31, 2011. The Board reviewed with Invesco Advisers the methodology used to prepare the profitability information. The Board considered the profitability of Invesco Advisers in connection with managing the Fund and the Invesco Funds. The Board noted that Invesco Advisers continues to operate at a net profit from services Invesco Advisers and its subsidiaries provide to the Invesco Funds and the Fund. The Board did not deem the level of profits realized by Invesco Advisers and its affiliates from providing services to the Fund to be excessive given the nature, quality and extent of the services provided to the Invesco Funds. The Board received and accepted information from Invesco Advisers demonstrating that Invesco Advisers and each Affiliated Sub-Adviser are financially sound and have the resources necessary to perform their obligations under the investment advisory agreement and sub-advisory contracts.
| F. | Collateral Benefits to Invesco Advisers and its Affiliates |
The Board considered various other benefits received by Invesco Advisers and its affiliates from the relationship with the Fund, including the fees received for their provision of administrative, transfer agency and distribution services to the Fund. The Board considered the performance of Invesco Advisers and its affiliates in providing these services and the organizational structure employed to provide these services. The Board also considered that these services are provided to the Fund pursuant to written contracts that are reviewed and approved on an annual basis by the Board; that the services are required for the operation of the Fund; that Invesco Advisers and its affiliates can provide services, the nature and quality of which are at least equal to those provided by others offering the same or similar services; and that the fees for such services are fair and reasonable in light of the usual and customary charges by others for services of the same nature and quality.
The Board considered the benefits realized by Invesco Advisers and the Affiliated Sub-Advisers as a result of portfolio brokerage transactions executed through “soft dollar” arrangements. The Board noted that soft dollar arrangements shift the payment obligation for research services from Invesco Advisers and the Affiliated Sub-Advisers to the Invesco Funds and therefore may reduce Invesco Advisers’ and the Affiliated Sub-Advisers’ expenses. The Board also considered periodic reports from the Chief Compliance Officer of the Invesco Funds demonstrating that these arrangements are consistent with regulatory requirements. The Board did not deem the soft dollar arrangements to be inappropriate.
The Board considered that the Fund’s uninvested cash and cash collateral from any securities lending arrangements may be invested in money market funds advised by Invesco Advisers pursuant to procedures approved by the Board. The Board noted that Invesco Advisers receives advisory fees from these affiliated money market funds attributable to such investments, although Invesco Advisers has contractually agreed to waive through varying periods the advisory fees payable by the Invesco Funds. The waiver is in an amount equal to 100% of the net advisory fee Invesco Advisers receives from the affiliated money market funds with respect to the Fund’s investment in the affiliated money market funds of uninvested cash, but not cash collateral. The Board concluded that the Fund’s investment of uninvested cash and cash collateral from any securities lending arrangements in the affiliated money market funds is in the best interests of the Fund and its shareholders.
The Board also considered use of an affiliated broker to execute certain trades for the Fund and that such trades are executed in compliance with rules under the Investment Company Act of 1940, as amended.
24 Invesco Summit Fund
Tax Information
Form 1099-DIV, Form 1042-S and other year–end tax information provide shareholders with actual calendar year amounts that should be included in their tax returns. Shareholders should consult their tax advisors.
The following distribution information is being provided as required by the Internal Revenue Code or to meet a specific state’s requirement.
The Fund designates the following amounts or, if subsequently determined to be different, the maximum amount allowable for its fiscal year ended October 31, 2012:
| | | | |
Federal and State Income Tax | |
Qualified Dividend Income* | | | 100 | % |
Corporate Dividends Received Deduction* | | | 100 | % |
| | * | The above percentages are based on ordinary income dividends paid to shareholders during the Fund’s fiscal year. |
25 Invesco Summit Fund
Trustees and Officers
The address of each trustee and officer is AIM Equity Funds (Invesco Equity Funds) (the “Trust”), 11 Greenway Plaza, Suite 1000, Houston, Texas 77046-1173. The trustees serve for the life of the Trust, subject to their earlier death, incapacitation, resignation, retirement or removal as more specifically provided in the Trust’s organizational documents. Each officer serves for a one year term or until their successors are elected and qualified. Column two below includes length of time served with predecessor entities, if any.
| | | | | | | | |
Name, Year of Birth and
Position(s) Held with the Trust | | Trustee and/
or Officer Since | | Principal Occupation(s)
During Past 5 Years | | Number of
Funds in Fund Complex
Overseen by
Trustee | | Other Directorship(s)
Held by Trustee During
Past 5 Years |
| Interested Persons | | | | | | | | |
| Martin L. Flanagan1 — 1960 Trustee | | 2007 | | Executive Director, Chief Executive Officer and President, Invesco Ltd. (ultimate parent of Invesco and a global investment management firm); Advisor to the Board, Invesco Advisers, Inc. (formerly known as Invesco Institutional (N.A.), Inc.); Trustee, The Invesco Funds; Vice Chair, Investment Company Institute; and Member of Executive Board, SMU Cox School of Business Formerly: Chairman, Invesco Advisers, Inc. (registered investment adviser); Director, Chairman, Chief Executive Officer and President, IVZ Inc. (holding company), INVESCO Group Services, Inc. (service provider) and Invesco North American Holdings, Inc. (holding company); Director, Chief Executive Officer and President, Invesco Holding Company Limited (parent of Invesco and a global investment management firm); Director, Invesco Ltd.; Chairman, Investment Company Institute and President, Co-Chief Executive Officer, Co-President, Chief Operating Officer and Chief Financial Officer, Franklin Resources, Inc. (global investment management organization) | | 123 | | None |
| Philip A. Taylor2 — 1954 Trustee, President and Principal Executive Officer | | 2006 | | Head of North American Retail and Senior Managing Director, Invesco Ltd.; Director, Co-Chairman, Co-President and Co-Chief Executive Officer, Invesco Advisers, Inc. (formerly known as Invesco Institutional (N.A.), Inc.) (registered investment adviser); Director, Chairman, Chief Executive Officer and President, Invesco Management Group, Inc. (formerly known as Invesco Aim Management Group, Inc.) (financial services holding company); Director and President, INVESCO Funds Group, Inc. (registered investment adviser and registered transfer agent); Director and Chairman, Invesco Investment Services, Inc. (formerly known as Invesco Aim Investment Services, Inc.) (registered transfer agent) and IVZ Distributors, Inc. (formerly known as INVESCO Distributors, Inc.) (registered broker dealer); Director, President and Chairman, Invesco Inc. (holding company) and Invesco Canada Holdings Inc. (holding company); Chief Executive Officer, Invesco Corporate Class Inc. (corporate mutual fund company) and Invesco Canada Fund Inc. (corporate mutual fund company); Director, Chairman and Chief Executive Officer, Invesco Canada Ltd. (formerly known as Invesco Trimark Ltd./Invesco Trimark Ltèe) (registered investment adviser and registered transfer agent); Trustee, President and Principal Executive Officer, The Invesco Funds (other than AIM Treasurer’s Series Trust (Invesco Treasurer’s Series Trust) and Short-Term Investments Trust); Trustee and Executive Vice President, The Invesco Funds (AIM Treasurer’s Series Trust (Invesco Treasurer’s Series Trust) and Short-Term Investments Trust only); Director, Invesco Investment Advisers LLC (formerly known as Van Kampen Asset Management); Director, Chief Executive Officer and President, Van Kampen Exchange Corp. Formerly: Director and Chairman, Van Kampen Investor Services Inc.; Director, Chief Executive Officer and President, 1371 Preferred Inc. (holding company); and Van Kampen Investments Inc.; Director and President, AIM GP Canada Inc. (general partner for limited partnerships); and Van Kampen Advisors, Inc.; Director and Chief Executive Officer, Invesco Trimark Dealer Inc. (registered broker dealer); Director, Invesco Distributors, Inc. (formerly known as Invesco Aim Distributors, Inc.) (registered broker dealer); Manager, Invesco PowerShares Capital Management LLC; Director, Chief Executive Officer and President, Invesco Advisers, Inc.; Director, Chairman, Chief Executive Officer and President, Invesco Aim Capital Management, Inc.; President, Invesco Trimark Dealer Inc. and Invesco Trimark Ltd./Invesco Trimark Ltèe; Director and President, AIM Trimark Corporate Class Inc. and AIM Trimark Canada Fund Inc.; Senior Managing Director, Invesco Holding Company Limited; Trustee and Executive Vice President, Tax-Free Investments Trust; Director and Chairman, Fund Management Company (former registered broker dealer); President and Principal Executive Officer, The Invesco Funds (AIM Treasurer’s Series Trust (Invesco Treasurer’s Series Trust), Short-Term Investments Trust and Tax-Free Investments Trust only); President, AIM Trimark Global Fund Inc. and AIM Trimark Canada Fund Inc. | | 123 | | None |
Wayne W. Whalen3 — 1939 Trustee | | 2010 | | Of Counsel, and prior to 2010, partner in the law firm of Skadden, Arps, Slate, Meagher & Flom LLP, legal counsel to certain funds in the Fund Complex | | 136 | | Director of the Mutual Fund Directors Forum, a nonprofit membership organization for investment directors; Chairman and Director of the Abraham Lincoln Presidential Library Foundation; and Director of the Stevenson Center for Democracy |
| 1 | Mr. Flanagan is considered an interested person of the Trust because he is an officer of the adviser to the Trust, and an officer and a director of Invesco Ltd., ultimate parent of the adviser to the Trust. |
| 2 | Mr. Taylor is considered an interested person of the Trust because he is an officer and a director of the adviser to, and a director of the principal underwriter of, the Trust. |
| 3 | Mr. Whalen is considered an “interested person” (within the meaning of Section 2(a)(19) of the 1940 Act) of certain Funds in the Invesco Fund Complex by reason of he and his firm currently providing legal services as legal counsel to such Funds in the Invesco Fund Complex. |
T-1 Invesco Summit Fund
Trustees and Officers—(continued)
| | | | | | | | |
Name, Year of Birth and
Position(s) Held with the Trust | | Trustee and/
or Officer Since | | Principal Occupation(s)
During Past 5 Years | | Number of Funds in Fund Complex Overseen by Trustee | | Other Directorship(s) Held by Trustee During
Past 5 Years |
| Independent Trustees | | | | | | | | |
Bruce L. Crockett — 1944 Trustee and Chair | | 1993 | | Chairman, Crockett Technologies Associates (technology consulting company) Formerly: Director, Captaris (unified messaging provider); Director, President and Chief Executive Officer COMSAT Corporation; and Chairman, Board of Governors of INTELSAT (international communications company) | | 123 | | ACE Limited (insurance company); and Investment Company Institute |
David C. Arch — 1945 Trustee | | 2010 | | Retired. Formerly: Chairman and Chief Executive Officer of Blistex Inc., (consumer health care products manufacturer) | | 136 | | Member of the Heartland Alliance Advisory Board, a nonprofit organization serving human needs based in Chicago. Board member of the Illinois Manufacturers’ Association. Member of the Board of Visitors, Institute for the Humanities, University of Michigan |
Frank S. Bayley — 1939 Trustee | | 2001 | | Retired Formerly: Director, Badgley Funds, Inc. (registered investment company) (2 portfolios) and Partner, law firm of Baker & McKenzie | | 123 | | Director and Chairman, C.D. Stimson Company (a real estate investment company) |
James T. Bunch — 1942 Trustee | | 2003 | | Managing Member, Grumman Hill Group LLC (family office private equity management) Formerly: Founder, Green, Manning & Bunch Ltd. (investment banking firm)(1988-2010); Executive Committee, United States Golf Association; and Director, Policy Studies, Inc. and Van Gilder Insurance Corporation | | 123 | | Chairman, Board of Governors, Western Golf Association, Chairman-elect, Evans Scholars Foundation and Director, Denver Film Society |
Rodney F. Dammeyer — 1940 Trustee | | 2010 | | Chairman of CAC, LLC, (private company offering capital investment and management advisory services) Formerly: Prior to January 2004, Director of TeleTech Holdings Inc.; Prior to 2002, Director of Arris Group, Inc.; Prior to 2001, Managing Partner at Equity Group Corporate Investments. Prior to 1995, Vice Chairman of Anixter International. Prior to 1985, experience includes Senior Vice President and Chief Financial Officer of Household International, Inc., Executive Vice President and Chief Financial Officer of Northwest Industries, Inc. and Partner of Arthur Andersen & Co. | | 136 | | Director of Quidel Corporation and Stericycle, Inc. Prior to May 2008, Trustee of The Scripps Research Institute. Prior to February 2008, Director of Ventana Medical Systems, Inc. Prior to April 2007, Director of GATX Corporation. Prior to April 2004, Director of TheraSense, Inc. |
Albert R. Dowden — 1941 Trustee | | 2000 | | Director of a number of public and private business corporations, including the Boss Group, Ltd. (private investment and management); Reich & Tang Funds (5 portfolios) (registered investment company); and Homeowners of America Holding Corporation/ Homeowners of America Insurance Company (property casualty company) Formerly: Director, Continental Energy Services, LLC (oil and gas pipeline service); Director, CompuDyne Corporation (provider of product and services to the public security market) and Director, Annuity and Life Re (Holdings), Ltd. (reinsurance company); Director, President and Chief Executive Officer, Volvo Group North America, Inc.; Senior Vice President, AB Volvo; Director of various public and private corporations; Chairman, DHJ Media, Inc.; Director Magellan Insurance Company; and Director, The Hertz Corporation, Genmar Corporation (boat manufacturer), National Media Corporation; Advisory Board of Rotary Power International (designer, manufacturer, and seller of rotary power engines); and Chairman, Cortland Trust, Inc. (registered investment company) | | 123 | | Director of Nature’s Sunshine Products, Inc. |
Jack M. Fields — 1952 Trustee | | 1997 | | Chief Executive Officer, Twenty First Century Group, Inc. (government affairs company); and Owner and Chief Executive Officer, Dos Angelos Ranch, L.P. (cattle, hunting, corporate entertainment), Discovery Global Education Fund (non-profit) and Cross Timbers Quail Research Ranch (non-profit) Formerly: Chief Executive Officer, Texana Timber LP (sustainable forestry company) and member of the U.S. House of Representatives | | 123 | | Insperity (formerly known as Administaff) |
Carl Frischling — 1937 Trustee | | 1988 | | Partner, law firm of Kramer Levin Naftalis and Frankel LLP | | 123 | | Director, Reich & Tang Funds (6 portfolios) |
Prema Mathai-Davis — 1950 Trustee | | 1998 | | Retired Formerly: Chief Executive Officer, YWCA of the U.S.A. | | 123 | | None |
Larry Soll — 1942 Trustee | | 2003 | | Retired Formerly: Chairman, Chief Executive Officer and President, Synergen Corp. (a biotechnology company) | | 123 | | None |
T-2 Invesco Summit Fund
Trustees and Officers—(continued)
| | | | | | | | |
Name, Year of Birth and
Position(s) Held with the Trust | | Trustee and/
or Officer Since | | Principal Occupation(s) During Past 5 Years | | Number of
Funds in Fund Complex Overseen by Trustee | | Other Directorship(s) Held by Trustee During Past 5 Years |
| Independent Trustees—(continued) |
Hugo F. Sonnenschein — 1940 Trustee | | 2010 | | Distinguished Service Professor and President Emeritus of the University of Chicago and the Adam Smith Distinguished Service Professor in the Department of Economics at the University of Chicago. Formerly: President of the University of Chicago | | 136 | | Trustee of the University of Rochester and a member of its investment committee. Member of the National Academy of Sciences, the American Philosophical Society and a fellow of the American Academy of Arts and Sciences |
Raymond Stickel, Jr. — 1944 Trustee | | 2005 | | Retired Formerly: Director, Mainstay VP Series Funds, Inc. (25 portfolios) and Partner, Deloitte & Touche | | 123 | | None |
| Other Officers | | | | | | | | |
Russell C. Burk — 1958 Senior Vice President and Senior Officer | | 2005 | | Senior Vice President and Senior Officer, The Invesco Funds | | N/A | | N/A |
John M. Zerr — 1962 Senior Vice President, Chief Legal Officer and Secretary | | 2006 | | Director, Senior Vice President, Secretary and General Counsel, Invesco Management Group, Inc. (formerly known as Invesco Aim Management Group, Inc.) and Van Kampen Exchange Corp.; Senior Vice President, Invesco Advisers, Inc. (formerly known as Invesco Institutional (N.A.), Inc.) (registered investment adviser); Senior Vice President and Secretary, Invesco Distributors, Inc. (formerly known as Invesco Aim Distributors, Inc.); Director, Vice President and Secretary, Invesco Investment Services, Inc. (formerly known as Invesco Aim Investment Services, Inc.) and IVZ Distributors, Inc. (formerly known as INVESCO Distributors, Inc.); Director and Vice President, INVESCO Funds Group, Inc.; Senior Vice President, Chief Legal Officer and Secretary, The Invesco Funds; Manager, Invesco PowerShares Capital Management LLC; Director, Secretary and General Counsel, Invesco Investment Advisers LLC (formerly known as Van Kampen Asset Management); Secretary and General Counsel, Invesco Capital Markets, Inc. (formerly known as Van Kampen Funds Inc.) and Chief Legal Officer, PowerShares Exchange-Traded Fund Trust, PowerShares Exchange-Traded Fund Trust II, PowerShares India Exchange-Traded Fund Trust and PowerShares Actively Managed Exchange-Traded Fund Trust Formerly: Director and Secretary, Van Kampen Advisors Inc.; Director Vice President, Secretary and General Counsel Van Kampen Investor Services Inc.; Director, Invesco Distributors, Inc. (formerly known as Invesco Aim Distributors, Inc.); Director, Senior Vice President, General Counsel and Secretary, Invesco Advisers, Inc.; and Van Kampen Investments Inc.; Director, Vice President and Secretary, Fund Management Company; Director, Senior Vice President, Secretary, General Counsel and Vice President, Invesco Aim Capital Management, Inc.; Chief Operating Officer and General Counsel, Liberty Ridge Capital, Inc. (an investment adviser); Vice President and Secretary, PBHG Funds (an investment company) and PBHG Insurance Series Fund (an investment company); Chief Operating Officer, General Counsel and Secretary, Old Mutual Investment Partners (a broker-dealer); General Counsel and Secretary, Old Mutual Fund Services (an administrator) and Old Mutual Shareholder Services (a shareholder servicing center); Executive Vice President, General Counsel and Secretary, Old Mutual Capital, Inc. (an investment adviser); and Vice President and Secretary, Old Mutual Advisors Funds (an investment company) | | N/A | | N/A |
Lisa O. Brinkley — 1959 Vice President | | 2004 | | Global Assurance Officer, Invesco Ltd. and Vice President, The Invesco Funds Formerly: Chief Compliance Officer, Invesco Distributors, Inc. (formerly known as Invesco Aim Distributors, Inc.), Invesco Investment Services, Inc.(formerly known as Invesco Aim Investment Services, Inc.) and Van Kampen Investor Services Inc.; Senior Vice President, Invesco Management Group, Inc.; Senior Vice President and Chief Compliance Officer, Invesco Advisers, Inc. and The Invesco Funds; Vice President and Chief Compliance Officer, Invesco Aim Capital Management, Inc. and Invesco Distributors, Inc.; Vice President, Invesco Investment Services, Inc. and Fund Management Company | | N/A | | N/A |
T-3 Invesco Summit Fund
Trustees and Officers—(continued)
| | | | | | | | |
Name, Year of Birth and
Position(s) Held with the Trust | | Trustee and/
or Officer Since | | Principal Occupation(s) During Past 5 Years | | Number of
Funds in Fund
Complex
Overseen by
Trustee | | Other Directorship(s)
Held by Trustee During
Past 5 Years |
| Other Officers—(continued) |
Karen Dunn Kelley — 1960 Vice President | | 2004 | | Head of Invesco’s World Wide Fixed Income and Cash Management Group; Senior Vice President, Invesco Management Group, Inc. (formerly known as Invesco Aim Management Group, Inc.) and Invesco Advisers, Inc. (formerly known as Invesco Institutional (N.A.), Inc.) (registered investment adviser); Executive Vice President, Invesco Distributors, Inc. (formerly known as Invesco Aim Distributors, Inc.); Director, Invesco Mortgage Capital Inc., INVESCO Global Asset Management Limited, Invesco Management Company Limited and INVESCO Management S.A.; Vice President, The Invesco Funds (other than AIM Treasurer’s Series Trust (Invesco Treasurer’s Series Trust) and Short-Term Investments Trust); and President and Principal Executive Officer, The Invesco Funds (AIM Treasurer’s Series Trust (Invesco Treasurer’s Series Trust) and Short-Term Investments Trust only) Formerly: Senior Vice President, Van Kampen Investments Inc.; Vice President, Invesco Advisers, Inc. (formerly known as Invesco Institutional (N.A.), Inc.); Director of Cash Management and Senior Vice President, Invesco Advisers, Inc. and Invesco Aim Capital Management, Inc.; President and Principal Executive Officer, Tax-Free Investments Trust; Director and President, Fund Management Company; Chief Cash Management Officer, Director of Cash Management, Senior Vice President, and Managing Director, Invesco Aim Capital Management, Inc.; Director of Cash Management, Senior Vice President, and Vice President, Invesco Advisers, Inc. and The Invesco Funds (AIM Treasurer’s Series Trust (Invesco Treasurer’s Series Trust), Short-Term Investments Trust and Tax-Free Investments Trust only) | | N/A | | N/A |
Sheri Morris — 1964 Vice President, Treasurer and Principal Financial Officer | | 1999 | | Vice President, Treasurer and Principal Financial Officer, The Invesco Funds; Vice President, Invesco Advisers, Inc. (formerly known as Invesco Institutional (N.A.), Inc.) (registered investment adviser); and Treasurer, PowerShares Exchange-Traded Fund Trust, PowerShares Exchange-Traded Fund Trust II, PowerShares India Exchange-Traded Fund Trust and PowerShares Actively Managed Exchange-Traded Fund Trust Formerly: Vice President, Invesco Advisers, Inc., Invesco Aim Capital Management, Inc. and Invesco Aim Private Asset Management, Inc.; Assistant Vice President and Assistant Treasurer, The Invesco Funds and Assistant Vice President, Invesco Advisers, Inc., Invesco Aim Capital Management, Inc. and Invesco Aim Private Asset Management, Inc. | | N/A | | N/A |
Yinka Akinsola — 1977 Anti-Money Laundering Compliance Officer | | 2011 | | Anti-Money Laundering Compliance Officer, Invesco Advisers, Inc. (formerly known as Invesco Institutional (N.A.), Inc.) (registered investment adviser); Invesco Distributors, Inc. (formerly known as Invesco Aim Distributors, Inc.), Invesco Investment Services, Inc. (formerly known as Invesco Aim Investment Services, Inc.), Invesco Management Group, Inc., The Invesco Funds, Invesco Van Kampen Closed-End Funds, Van Kampen Exchange Corp., Invesco Capital Markets, Inc. (formerly known as Van Kampen Funds Inc.), PowerShares Exchange-Traded Fund Trust, PowerShares Exchange-Traded Fund Trust II, PowerShares India Exchange-Traded Fund Trust, and PowerShares Actively Managed Exchange-Traded Fund Trust Formerly: Regulatory Analyst III, Financial Industry Regulatory Authority (FINRA). | | N/A | | N/A |
Todd L. Spillane — 1958 Chief Compliance Officer | | 2006 | | Senior Vice President, Invesco Management Group, Inc. (formerly known as Invesco Aim Management Group, Inc.) and Van Kampen Exchange Corp.; Senior Vice President and Chief Compliance Officer, Invesco Advisers, Inc. (registered investment adviser) (formerly known as Invesco Institutional (N.A.), Inc.); Chief Compliance Officer, The Invesco Funds; Vice President, Invesco Distributors, Inc. (formerly known as Invesco Aim Distributors, Inc.) and Invesco Investment Services, Inc. (formerly known as Invesco Aim Investment Services, Inc.) Formerly: Chief Compliance Officer, Invesco Van Kampen Closed-End Funds; Senior Vice President, Van Kampen Investments Inc.; Senior Vice President and Chief Compliance Officer, Invesco Advisers, Inc. and Invesco Aim Capital Management, Inc.; Chief Compliance Officer, INVESCO Private Capital Investments, Inc. (holding company), Invesco Private Capital, Inc. (registered investment adviser), Invesco Global Asset Management (N.A.), Inc., Invesco Senior Secured Management, Inc. (registered investment adviser) and Van Kampen Investor Services Inc., PowerShares Exchange-Traded Fund Trust, PowerShares Exchange-Traded Fund Trust II, PowerShares India Exchange-Traded Fund Trust and PowerShares Actively Managed Exchange-Traded Fund Trust; Vice President, Invesco Aim Capital Management, Inc. and Fund Management Company | | N/A | | N/A |
The Statement of Additional Information of the Trust includes additional information about the Fund’s Trustees and is available upon request, without charge, by calling 1.800.959.4246. Please refer to the Fund’s prospectus for information on the Fund’s sub-advisers.
| | | | | | |
Office of the Fund 11 Greenway Plaza, Suite 1000 Houston, TX 77046-1173 | | Investment Adviser Invesco Advisers, Inc. 1555 Peachtree Street, N.E. Atlanta, GA 30309 | | Distributor Invesco Distributors, Inc. 11 Greenway Plaza, Suite 1000 Houston, TX 77046-1173 | | Auditors PricewaterhouseCoopers LLP 1201 Louisiana Street, Suite 2900 Houston, TX 77002-5678 |
| | | |
| | | | | | |
Counsel to the Fund Stradley Ronon Stevens & Young, LLP 2005 Market Street, Suite 2600 Philadelphia, PA 19103-7018 | | Counsel to the Independent Trustees Kramer Levin Naftalis & Frankel LLP 1177 Avenue of the Americas New York, NY 10036-2714 | | Transfer Agent Invesco Investment Services, Inc. 11 Greenway Plaza, Suite 1000 Houston, TX 77046-1173 | | Custodian State Street Bank and Trust Company 225 Franklin Street Boston, MA 02110-2801 |
T-4 Invesco Summit Fund

Invesco mailing information
Send general correspondence to Invesco Investment Services, Inc., P.O. Box 219078, Kansas City, MO 64121-9078.
Invesco privacy policy
You share personal and financial information with us that is necessary for your transactions and your account records. We take very seriously the obligation to keep that information confidential and private.
Invesco collects nonpublic personal information about you from account applications or other forms you complete and from your transactions with us or our affiliates. We do not disclose information about you or our former customers to service providers or other third parties except to the extent necessary to service your account and in other limited circumstances as permitted by law. For example, we use this information to facilitate the delivery of transaction confirmations, financial reports, prospectuses and tax forms.
Even within Invesco, only people involved in the servicing of your accounts and compliance monitoring have access to your information. To ensure the highest level of confidentiality and security, Invesco maintains physical, electronic and procedural safeguards that meet or exceed federal standards. Special measures, such as data encryption and authentication, apply to your communications with us on our website. More detail is available to you at invesco.com/privacy.
Important notice regarding delivery of security holder documents
To reduce Fund expenses, only one copy of most shareholder documents may be mailed to shareholders with multiple accounts at the same address (Householding). Mailing of your shareholder documents may be householded indefinitely unless you instruct us otherwise. If you do not want the mailing of these documents to be combined with those for other members of your household, please contact Invesco Investment Services, Inc. at 800 959 4246 or contact your financial institution. We will begin sending you individual copies for each account within 30 days after receiving your request.
Fund holdings and proxy voting information
The Fund provides a complete list of its holdings four times in each fiscal year, at the quarter-ends. For the second and fourth quarters, the lists appear in the Fund’s semiannual and annual reports to shareholders. For the first and third quarters, the Fund files the lists with the Securities and Exchange Commission (SEC) on Form N-Q. The most recent list of portfolio holdings is available at invesco.com/completeqtrholdings. Shareholders can also look up the Fund’s
Forms N-Q on the SEC website at sec.gov. Copies of the Fund’s Forms N-Q may be reviewed and copied at the SEC Public Reference Room in Washington, D.C. You can obtain information on the operation of the Public Reference Room, including information about duplicating fee charges, by calling 202 551 8090 or 800 732 0330, or by electronic request at the following email address: publicinfo@sec.gov. The SEC file numbers for the Fund are shown below.
A description of the policies and procedures that the Fund uses to determine how to vote proxies relating to portfolio securities is available without charge, upon request, from our Client Services department at 800 959 4246 or at invesco.com/proxyguidelines. The information is also available on the SEC website, sec.gov.
| | | | |
Information regarding how the Fund voted proxies related to its portfolio securities during the 12 months ended June 30, 2012, is available at invesco.com/proxysearch. The information is also available on the SEC website, sec.gov. Invesco Advisers, Inc. is an investment adviser; it provides investment advisory services to individual and institutional clients and does not sell securities. Invesco Distributors, Inc. is the US distributor for Invesco Ltd.’s retail mutual funds, exchange-traded funds and institutional money market funds. Both are wholly owned, indirect subsidiaries of Invesco Ltd. | |  |
| | | | | | |
| SEC file numbers: 811-01424 and 002-25469 | | SUM-AR-1 | | Invesco Distributors, Inc. | | |
There were no amendments to the Code of Ethics (the “Code”) that applies to the Registrant’s Principal Executive Officer (“PEO”) and Principal Financial Officer (“PFO”) during the period covered by the report. The Registrant did not grant any waivers, including implicit waivers, from any provisions of the Code to the PEO or PFO during the period covered by this report.
| ITEM 3. | AUDIT COMMITTEE FINANCIAL EXPERT. |
The Board of Trustees has determined that the Registrant has at least one audit committee financial expert serving on its Audit Committee. The Audit Committee financial expert is Raymond Stickel, Jr. Mr. Stickel is “independent” within the meaning of that term as used in Form N-CSR.
| ITEM 4. | PRINCIPAL ACCOUNTANT FEES AND SERVICES. |
Fees Billed by Principal Accountant Related to the Registrant
PWC billed the Registrant aggregate fees for services rendered to the Registrant for the last two fiscal years as follows:
| | | | | | | | | | | | | | | | |
| | | Fees Billed for
Services Rendered to
the Registrant for
fiscal year end
10/31/2012 | | | Percentage of Fees
Billed Applicable to
Non-Audit Services
Provided for fiscal
year end 10/31/2012
Pursuant to Waiver
of Pre-Approval
Requirement(1) | | | Fees Billed for
Services Rendered to
the Registrant for
fiscal year end
10/31/2011 | | | Percentage of Fees
Billed Applicable to
Non-Audit Services
Provided for fiscal
year end 10/31/2011
Pursuant to Waiver of
Pre-Approval
Requirement(1) | |
Audit Fees | | $ | 166,300 | | | | N/A | | | $ | 193,600 | | | | N/A | |
Audit-Related Fees(2) | | $ | 0 | | | | 0 | % | | $ | 12,750 | | | | 0 | % |
Tax Fees(3) | | $ | 40,500 | | | | 0 | % | | $ | 56,300 | | | | 0 | % |
All Other Fees | | $ | 0 | | | | 0 | % | | $ | 0 | | | | 0 | % |
| | | | | | | | | | | | | | | | |
Total Fees | | $ | 206,800 | | | | 0 | % | | $ | 262,650 | | | | 0 | % |
PWC billed the Registrant aggregate non-audit fees of $40,500 for the fiscal year ended October 31, 2012, and $69,050 for the fiscal year ended October 31, 2011, for non-audit services rendered to the Registrant.
| (1) | With respect to the provision of non-audit services, the pre-approval requirement is waived pursuant to a de minimis exception if (i) such services were not recognized as non-audit services by the Registrant at the time of engagement, (ii) the aggregate amount of all such services provided is no more than 5% of the aggregate audit and non-audit fees paid by the Registrant to PWC during a fiscal year; and (iii) such services are promptly brought to the attention of the Registrant’s Audit Committee and approved by the Registrant’s Audit Committee prior to the completion of the audit. |
| (2) | Audit-Related fees for the fiscal year end October 31, 2011 includes fees billed for agreed upon procedures related to fund mergers. |
| (3) | Tax fees for the fiscal year end October 31, 2012 includes fees billed for reviewing tax returns. Tax fees for the fiscal year end October 31, 2011 includes fees billed for reviewing tax returns. |
Fees Billed by PWC Related to Invesco and Invesco Affiliates
PWC billed Invesco Advisers, Inc. (“Invesco”), the Registrant’s adviser, and any entity controlling, controlled by or under common control with Invesco that provides ongoing services to the Registrant (“Invesco Affiliates”) aggregate fees for pre-approved non-audit services rendered to Invesco and Invesco Affiliates for the last two fiscal years as follows:
| | | | | | | | | | | | | | | | |
| | | Fees Billed for Non-Audit
Services Rendered to
Invesco and Invesco
Affiliates for fiscal year
end 10/31/2012 That
Were Required
to be Pre-Approved
by the Registrant’s
Audit Committee | | | Percentage of Fees
Billed Applicable to
Non-Audit Services
Provided for fiscal year
end 10/31/2012
Pursuant to Waiver of
Pre-Approval
Requirement(1) | | | Fees Billed for
Non-Audit Services
Rendered to Invesco
and Invesco Affiliates
for fiscal year end
10/31/2011 That
Were Required
to be Pre-Approved
by the Registrant’s
Audit Committee | | | Percentage of Fees
Billed Applicable to
Non-Audit Services
Provided for fiscal year
end 10/31/2011
Pursuant to Waiver of
Pre-Approval
Requirement(1) | |
Audit-Related Fees | | $ | 0 | | | | 0 | % | | $ | 0 | | | | 0 | % |
Tax Fees | | $ | 0 | | | | 0 | % | | $ | 0 | | | | 0 | % |
All Other Fees | | $ | 0 | | | | 0 | % | | $ | 0 | | | | 0 | % |
| | | | | | | | | | | | | | | | |
Total Fees(2) | | $ | 0 | | | | 0 | % | | $ | 0 | | | | 0 | % |
| (1) | With respect to the provision of non-audit services, the pre-approval requirement is waived pursuant to a de minimis exception if (i) such services were not recognized as non-audit services by the Registrant at the time of engagement, (ii) the aggregate amount of all such services provided is no more than 5% of the aggregate audit and non-audit fees paid by the Registrant, Invesco and Invesco Affiliates to PWC during a fiscal year; and (iii) such services are promptly brought to the attention of the Registrant’s Audit Committee and approved by the Registrant’s Audit Committee prior to the completion of the audit. |
| (2) | Including the fees for services not required to be pre-approved by the registrant’s audit committee, PWC billed Invesco and Invesco Affiliates aggregate non-audit fees of $0 for the fiscal year ended October 31, 2012, and $0 for the fiscal year ended October 31, 2011, for non-audit services rendered to Invesco and Invesco Affiliates. |
The Audit Committee also has considered whether the provision of non-audit services that were rendered to Invesco and Invesco Affiliates that were not required to be pre-approved pursuant to SEC regulations, if any, is compatible with maintaining PWC’s independence. To the extent that such services were provided, the Audit Committee determined that the provision of such services is compatible with PWC maintaining independence with respect to the Registrant.
PRE-APPROVAL OF AUDIT AND NON-AUDIT SERVICES
POLICIES AND PROCEDURES
As adopted by the Audit Committees of
the Invesco Funds (the “Funds”)
Last Amended May 4, 2010
Statement of Principles
Under the Sarbanes-Oxley Act of 2002 and rules adopted by the Securities and Exchange Commission (“SEC”) (“Rules”), the Audit Committees of the Funds’ (the “Audit Committees”) Board of Trustees (the “Board”) are responsible for the appointment, compensation and oversight of the work of independent accountants (an “Auditor”). As part of this responsibility and to assure that the Auditor’s independence is not impaired, the Audit Committees pre-approve the audit and non-audit services provided to the Funds by each Auditor, as well as all non-audit services provided by the Auditor to the Funds’ investment adviser and to affiliates of the adviser that provide ongoing services to the Funds (“Service Affiliates”) if the services directly impact the Funds’ operations or financial reporting. The SEC Rules also specify the types of services that an Auditor may not provide to its audit client. The following policies and procedures comply with the requirements for pre-approval and provide a mechanism by which management of the Funds may request and secure pre-approval of audit and non-audit services in an orderly manner with minimal disruption to normal business operations.
Proposed services either may be pre-approved without consideration of specific case-by-case services by the Audit Committees (“general pre-approval”) or require the specific pre-approval of the Audit Committees (“specific pre-approval”). As set forth in these policies and procedures, unless a type of service has received general pre-approval, it will require specific pre-approval by the Audit Committees. Additionally, any fees exceeding 110% of estimated pre-approved fee levels provided at the time the service was pre-approved will also require specific approval by the Audit Committees before payment is made. The Audit Committees will also consider the impact of additional fees on the Auditor’s independence when determining whether to approve any additional fees for previously pre-approved services.
The Audit Committees will annually review and generally pre-approve the services that may be provided by each Auditor without obtaining specific pre-approval from the Audit Committee generally on an annual basis. The term of any general pre-approval runs from the date of such pre-approval through September 30th of the following year, unless the Audit Committees consider a different period and state otherwise. The Audit Committees will add to or subtract from the list of general pre-approved services from time to time, based on subsequent determinations.
The purpose of these policies and procedures is to set forth the guidelines to assist the Audit Committees in fulfilling their responsibilities.
Delegation
The Audit Committees may from time to time delegate pre-approval authority to one or more of its members who are Independent Trustees. All decisions to pre-approve a service by a delegated member shall be reported to the Audit Committees at the next quarterly meeting.
Audit Services
The annual audit services engagement terms will be subject to specific pre-approval of the Audit Committees. Audit services include the annual financial statement audit and other procedures such as tax provision work that is required to be performed by the independent auditor to be able to form an opinion on the Funds’ financial statements. The Audit Committees will obtain, review and consider sufficient information concerning the proposed Auditor to make a reasonable evaluation of the Auditor’s qualifications and independence.
In addition to the annual Audit services engagement, the Audit Committees may grant either general or specific pre-approval of other audit services, which are those services that only the independent auditor reasonably can provide. Other Audit services may include services such as issuing consents for the inclusion of audited financial statements with SEC registration statements, periodic reports and other documents filed with the SEC or other documents issued in connection with securities offerings.
Non-Audit Services
The Audit Committees may provide either general or specific pre-approval of any non-audit services to the Funds and its Service Affiliates if the Audit Committees believe that the provision of the service will not impair the independence of the Auditor, is consistent with the SEC’s Rules on auditor independence, and otherwise conforms to the Audit Committees’ general principles and policies as set forth herein.
Audit-Related Services
“Audit-related services” are assurance and related services that are reasonably related to the performance of the audit or review of the Fund’s financial statements or that are traditionally performed by the independent auditor. Audit-related services include, among others, accounting consultations related to accounting, financial reporting or disclosure matters not classified as “Audit services”; assistance with understanding and implementing new accounting and financial reporting guidance from rulemaking authorities; and agreed-upon procedures related to mergers, compliance with ratings agency requirements and interfund lending activities.
Tax Services
“Tax services” include, but are not limited to, the review and signing of the Funds’ federal tax returns, the review of required distributions by the Funds and consultations regarding tax matters such as the tax treatment of new investments or the impact of new regulations. The Audit Committees will scrutinize carefully the retention of the Auditor in connection with a transaction initially recommended by the Auditor, the major business purpose of which may be tax avoidance or the tax treatment of which may not be supported in the Internal Revenue Code and related regulations. The Audit Committees will consult with the Funds’ Treasurer (or his or her designee) and may consult with outside counsel or advisors as necessary to ensure the consistency of Tax services rendered by the Auditor with the foregoing policy.
No Auditor shall represent any Fund or any Service Affiliate before a tax court, district court or federal court of claims.
Under rules adopted by the Public Company Accounting Oversight Board and approved by the SEC, in connection with seeking Audit Committees’ pre-approval of permissible Tax services, the Auditor shall:
| | 1. | Describe in writing to the Audit Committees, which writing may be in the form of the proposed engagement letter: |
| | a. | The scope of the service, the fee structure for the engagement, and any side letter or amendment to the engagement letter, or any other agreement between the Auditor and the Fund, relating to the service; and |
| | b. | Any compensation arrangement or other agreement, such as a referral agreement, a referral fee or fee-sharing arrangement, between the Auditor and any person (other than the Fund) with respect to the promoting, marketing, or recommending of a transaction covered by the service; |
| | 2. | Discuss with the Audit Committees the potential effects of the services on the independence of the Auditor; and |
| | 3. | Document the substance of its discussion with the Audit Committees. |
All Other Auditor Services
The Audit Committees may pre-approve non-audit services classified as “All other services” that are not categorically prohibited by the SEC, as listed in Exhibit 1 to this policy.
Pre-Approval Fee Levels or Established Amounts
Pre-approval of estimated fees or established amounts for services to be provided by the Auditor under general or specific pre-approval policies will be set periodically by the Audit Committees. Any proposed fees exceeding 110% of the maximum estimated pre-approved fees or established amounts for pre-approved audit and non-audit services will be reported to the Audit Committees at the quarterly Audit Committees meeting and will require specific approval by the Audit Committees before payment is made. The Audit Committees will always factor in the overall relationship of fees for audit and non-audit services in determining whether to pre-approve any such services and in determining whether to approve any additional fees exceeding 110% of the maximum pre-approved fees or established amounts for previously pre-approved services.
Procedures
Generally on an annual basis, Invesco Advisers, Inc. (“Invesco”) will submit to the Audit Committees for general pre-approval, a list of non-audit services that the Funds or Service Affiliates of the Funds may request from the Auditor. The list will describe the non-audit services in reasonable detail and will include an estimated range of fees and such other information as the Audit Committee may request.
Each request for services to be provided by the Auditor under the general pre-approval of the Audit Committees will be submitted to the Funds’ Treasurer (or his or her designee) and must include a detailed description of the services to be rendered. The Treasurer or his or her designee will ensure that such services are included within the list of services that have received the general pre-approval of the Audit Committees. The Audit Committees will be informed at the next quarterly scheduled Audit Committees meeting of any such services for which the Auditor rendered an invoice and whether such services and fees had been pre-approved and if so, by what means.
Each request to provide services that require specific approval by the Audit Committees shall be submitted to the Audit Committees jointly by the Fund’s Treasurer or his or her designee and the Auditor, and must include a joint statement that, in their view, such request is consistent with the policies and procedures and the SEC Rules.
Each request to provide tax services under either the general or specific pre-approval of the Audit Committees will describe in writing: (i) the scope of the service, the fee structure for the engagement, and any side letter or amendment to the engagement letter, or any other agreement between the Auditor and the audit client, relating to the service; and (ii) any compensation arrangement or other agreement between the Auditor and any person (other than the audit client) with respect to the promoting, marketing, or recommending of a transaction covered by the service. The Auditor will discuss with the Audit Committees the potential effects of the services on the Auditor’s independence and will document the substance of the discussion.
Non-audit services pursuant to the de minimis exception provided by the SEC Rules will be promptly brought to the attention of the Audit Committees for approval, including documentation that each of the conditions for this exception, as set forth in the SEC Rules, has been satisfied.
On at least an annual basis, the Auditor will prepare a summary of all the services provided to any entity in the investment company complex as defined in section 2-01(f)(14) of Regulation S-X in sufficient detail as to the nature of the engagement and the fees associated with those services.
The Audit Committees have designated the Funds’ Treasurer to monitor the performance of all services provided by the Auditor and to ensure such services are in compliance with these policies and procedures. The Funds’ Treasurer will report to the Audit Committees on a periodic basis as to the results of such monitoring. Both the Funds’ Treasurer and management of Invesco will immediately report to the chairman of the Audit Committees any breach of these policies and procedures that comes to the attention of the Funds’ Treasurer or senior management of Invesco.
Exhibit 1 to Pre-Approval of Audit and Non-Audit Services Policies and Procedures
Conditionally Prohibited Non-Audit Services (not prohibited if the Fund can reasonably conclude that the results of the service would not be subject to audit procedures in connection with the audit of the Fund’s financial statements)
| | • | | Bookkeeping or other services related to the accounting records or financial statements of the audit client |
| | • | | Financial information systems design and implementation |
| | • | | Appraisal or valuation services, fairness opinions, or contribution-in-kind reports |
| | • | | Internal audit outsourcing services |
Categorically Prohibited Non-Audit Services
| | • | | Broker-dealer, investment adviser, or investment banking services |
| | • | | Expert services unrelated to the audit |
| | • | | Any service or product provided for a contingent fee or a commission |
| | • | | Services related to marketing, planning, or opining in favor of the tax treatment of confidential transactions or aggressive tax position transactions, a significant purpose of which is tax avoidance |
| | • | | Tax services for persons in financial reporting oversight roles at the Fund |
| | • | | Any other service that the Public Company Oversight Board determines by regulation is impermissible. |
| ITEM 5. | AUDIT COMMITTEE OF LISTED REGISTRANTS. |
Not applicable.
| ITEM 6. | SCHEDULE OF INVESTMENTS. |
Investments in securities of unaffiliated issuers is included as part of the reports to stockholders filed under Item 1 of this Form.
| ITEM 7. | DISCLOSURE OF PROXY VOTING POLICIES AND PROCEDURES FOR CLOSED-END MANAGEMENT INVESTMENT COMPANIES. |
Not applicable.
| ITEM 8. | PORTFOLIO MANAGERS OF CLOSED-END MANAGEMENT COMPANIES. |
Not applicable.
| ITEM 9. | PURCHASES OF EQUITY SECURITIES BY CLOSED-END MANAGEMENT INVESTMENT COMPANY AND AFFILIATED PURCHASERS. |
Not applicable.
| ITEM 10. | SUBMISSION OF MATTERS TO A VOTE OF SECURITY HOLDERS. |
None
| ITEM 11. | CONTROLS AND PROCEDURES. |
| | (a) | As of November 19, 2012, an evaluation was performed under the supervision and with the participation of the officers of the Registrant, including the PEO and PFO, to assess the effectiveness of the Registrant’s disclosure controls and procedures, as that term is |
| | defined in Rule 30a-3(c) under the Investment Company Act of 1940 (the “Act”), as amended. Based on that evaluation, the Registrant’s officers, including the PEO and PFO, concluded that, as of November 19, 2012, the Registrant’s disclosure controls and procedures were reasonably designed to ensure: (1) that information required to be disclosed by the Registrant on Form N-CSR is recorded, processed, summarized and reported within the time periods specified by the rules and forms of the Securities and Exchange Commission; and (2) that material information relating to the Registrant is made known to the PEO and PFO as appropriate to allow timely decisions regarding required disclosure. |
| (b) | There have been no changes in the Registrant’s internal control over financial reporting (as defined in Rule 30a-3(d) under the Act) that occurred during the second fiscal quarter of the period covered by this report that have materially affected, or are reasonably likely to materially affect, the Registrant’s internal control over financial reporting. |
| | |
| |
| 12(a) (1) | | Code of Ethics. |
| |
| 12(a) (2) | | Certifications of principal executive officer and principal financial officer as required by Rule 30a-2(a) under the Investment Company Act of 1940. |
| |
| 12(a) (3) | | Not applicable. |
| |
| 12(b) | | Certifications of principal executive officer and principal financial officer as required by Rule 30a-2(b) under the Investment Company Act of 1940. |
SIGNATURES
Pursuant to the requirements of the Securities Exchange Act of 1934 and the Investment Company Act of 1940, the Registrant has duly caused this report to be signed on its behalf by the undersigned, thereunto duly authorized.
Registrant: AIM Equity Funds (Invesco Equity Funds)
| | |
| |
| By: | | /s/ Philip A. Taylor |
| | Philip A. Taylor |
| | Principal Executive Officer |
Date: January 7, 2013
Pursuant to the requirements of the Securities and Exchange Act of 1934 and the Investment Company Act of 1940, this report has been signed below by the following persons on behalf of the Registrant and in the capacities and on the dates indicated.
| | |
| |
| By: | | /s/ Philip A. Taylor |
| | Philip A. Taylor |
| | Principal Executive Officer |
Date: January 7, 2013
| | |
| |
| By: | | /s/ Sheri Morris |
| | Sheri Morris |
| | Principal Financial Officer |
Date: January 7, 2013
EXHIBIT INDEX
| | |
| |
| 12(a)(1) | | Code of Ethics. |
| |
| 12(a)(2) | | Certifications of principal executive officer and principal Financial officer as required by Rule 30a-2(a) under the Investment Company Act of 1940. |
| |
| 12(a)(3) | | Not applicable. |
| |
| 12(b) | | Certifications of principal executive officer and principal financial officer as required by Rule 30a-2(b) under the Investment Company Act of 1940. |